final performance report – september 1, 2017 through
TRANSCRIPT
Final Performance Report – September 1, 2017 through October 31, 2018 EPA Brownfield Cleanup Grant for Hazardous Substances Site A – Havermale Island, City of Spokane, Washington
Final Performance Report
September 1, 2017 through October 31, 2018
EPA Brownfield Cleanup Grant for Hazardous Substances
Site A – Havermale Island, City of Spokane, Washington
Cooperative Agreement No. BF-01J39501-1
Submitted by: City of Spokane
Planning and Development Services 808 W. Spokane Falls Blvd.
Spokane, WA 99201
March 28, 2019
Final Performance Report – September 1, 2017 through October 31, 2018 EPA Brownfield Cleanup Grant for Hazardous Substances Site A – Havermale Island, City of Spokane, Washington
Page 2 of 18
I. GENERAL INFORMATION
Name of Grantee: City of Spokane, Washington
Grant Type & Award Year: EPA Brownfield Community-Wide Assessment, Fiscal Year 2017
Funding Type: Hazardous Substances
Award Amount: $200,000 (Hazardous Substances)
Cooperative Agreement No.: BF-01J39501-1
Date of Award: August 15, 2017
Project Period: August 1, 2017 through October 31, 2018
Project Contacts:
Name: Teri Stripes Title: Assistant Planner Project Role: Project Manager Address: City of Spokane
Planning & Development Services 808 W. Spokane Falls Blvd. Spokane, WA 99201
Phone: 509-625-6597 Email: [email protected] Name: Brandon Perkins Name: Felicia Thomas Role: EPA Project Officer Role: EPA Grant Specialist Address: U.S. EPA Region 10
1200 Sixth Ave, Ste. 900 (ECL-122) Seattle, WA 98101
Address: U.S. EPA Region 10 1200 Sixth Ave, Ste. 900 (OMP-173) Seattle, WA 98101
Phone: 206-553-6396 Phone: 206-553-0249 Email: [email protected] Email: [email protected]
Chief Executive:
II. INTRODUCTION
This Final Performance Report provides a summary of activities completed by the City of Spokane, Washington (“the City”) during implementation of a $200,000 United States Environmental Protection Agency (EPA) Brownfields Cleanup Grant for hazardous substances awarded to the City during
Fiscal Year (FY). The grant was awarded for remediation within a distinct revitalization target
Name: David A. Condon Title: Mayor Address: Spokane City Hall
808 W. Spokane Falls Blvd. Spokane, WA 99201
Phone: 509-625-6250 Email: [email protected]
Final Performance Report – September 1, 2017 through October 31, 2018 EPA Brownfield Cleanup Grant for Hazardous Substances Site A – Havermale Island, City of Spokane, Washington
Page 3 of 18
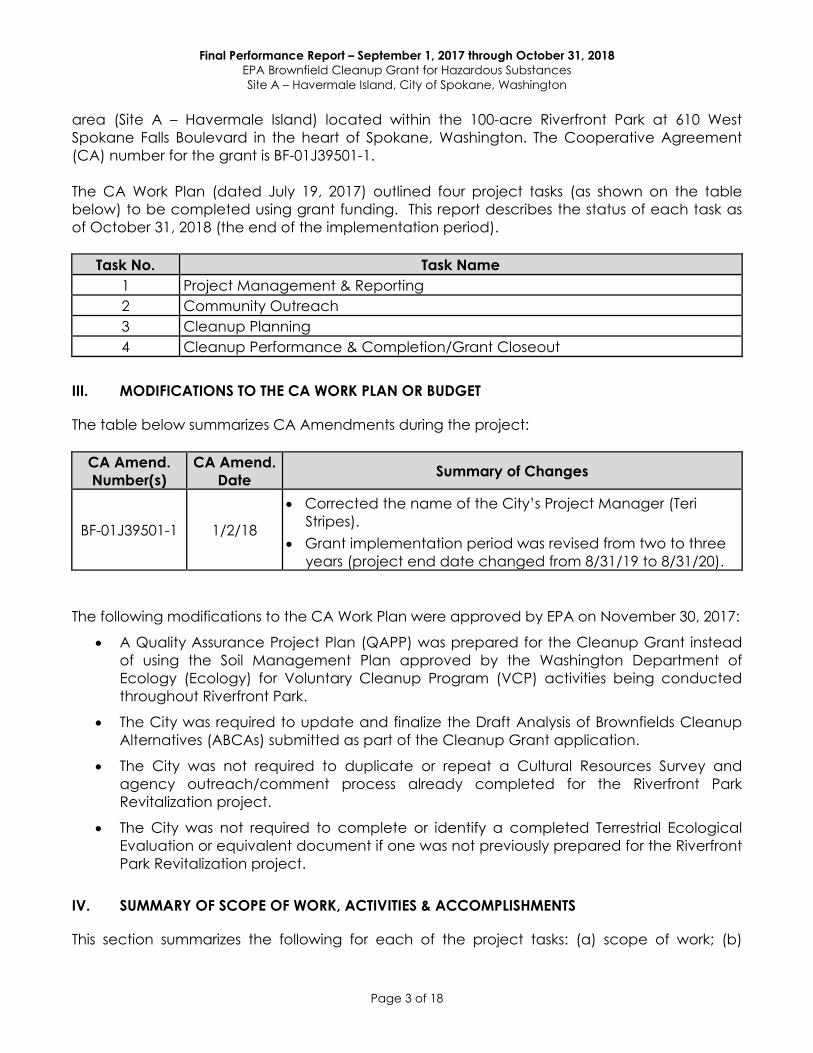
area (Site A – Havermale Island) located within the 100-acre Riverfront Park at 610 West Spokane Falls Boulevard in the heart of Spokane, Washington. The Cooperative Agreement (CA) number for the grant is BF-01J39501-1. The CA Work Plan (dated July 19, 2017) outlined four project tasks (as shown on the table below) to be completed using grant funding. This report describes the status of each task as of October 31, 2018 (the end of the implementation period).
Task No. Task Name 1 Project Management & Reporting 2 Community Outreach 3 Cleanup Planning 4 Cleanup Performance & Completion/Grant Closeout
III. MODIFICATIONS TO THE CA WORK PLAN OR BUDGET
The table below summarizes CA Amendments during the project:
CA Amend. Number(s)
CA Amend. Date Summary of Changes
BF-01J39501-1 1/2/18
• Corrected the name of the City’s Project Manager (Teri Stripes).
• Grant implementation period was revised from two to three years (project end date changed from 8/31/19 to 8/31/20).
The following modifications to the CA Work Plan were approved by EPA on November 30, 2017:
• A Quality Assurance Project Plan (QAPP) was prepared for the Cleanup Grant instead of using the Soil Management Plan approved by the Washington Department of Ecology (Ecology) for Voluntary Cleanup Program (VCP) activities being conducted throughout Riverfront Park.
• The City was required to update and finalize the Draft Analysis of Brownfields Cleanup Alternatives (ABCAs) submitted as part of the Cleanup Grant application.
• The City was not required to duplicate or repeat a Cultural Resources Survey and agency outreach/comment process already completed for the Riverfront Park Revitalization project.
• The City was not required to complete or identify a completed Terrestrial Ecological Evaluation or equivalent document if one was not previously prepared for the Riverfront Park Revitalization project.
IV. SUMMARY OF SCOPE OF WORK, ACTIVITIES & ACCOMPLISHMENTS
This section summarizes the following for each of the project tasks: (a) scope of work; (b)
Final Performance Report – September 1, 2017 through October 31, 2018 EPA Brownfield Cleanup Grant for Hazardous Substances Site A – Havermale Island, City of Spokane, Washington
Page 4 of 18
activities completed as of October 31, 2018 (the end of the implementation period); and (c) accomplishments (milestones and deliverables) completed to date.
Task 1: Project Management & Reporting 1.A. Scope of Work The scope of work for this task as detailed in the Work Plan was as follows: “Quarterly Progress Reports (QPRs) were due within 30 days of the end of each federal fiscal quarter ending December, March, June, and September (due by January 30, April 30, July 30, and October 30); Disadvantaged Business Enterprise (DBE)/Minority Business Enterprise (MBE)/Woman-Owned Business Enterprise (WBE) Reports were due by October 30 of each year if certain conditions are met – refer to Terms & Conditions for details. Ensure that on-line reporting system, the Assessment, Cleanup and Redevelopment Exchange System (ACRES) reflects current work and findings.” Outputs: QPRs, Annual DBE/MBE/WBE Reports, Annual Financial Reports, ACRES updates 1.B. Activities Completed
• Reporting and Project Management
o The City submitted four QPRs to the EPA and one annual DBE/MBE/WBE report.
o Regular communications and meetings were performed with the EPA, Stantec Consulting Services Inc. (Stantec), GeoEngineers and the Parks & Recreations Department.
o The City’s Grant Management, Accounting, Planning and Development, and Parks Departments worked together on invoice approvals, account tracking and reimbursement process for the grant.
o The City prepared a project closeout report and financial submittals to the EPA.
• Conferences
o Ms. Teri Stripes attended the Northwest Remediation Conference in Tacoma, Washington on September 20, 2018 and was one of three speakers who presented on a panel titled “Cooperative Cleanup: Fostering Public / Private Partnerships.” On September 27, 2018, a blog post discussing the presentation was published on the Center for Creative Land Recycling webpage titled “NEBC - Clear as Tacoma Glass”.
Final Performance Report – September 1, 2017 through October 31, 2018 EPA Brownfield Cleanup Grant for Hazardous Substances Site A – Havermale Island, City of Spokane, Washington
Page 5 of 18
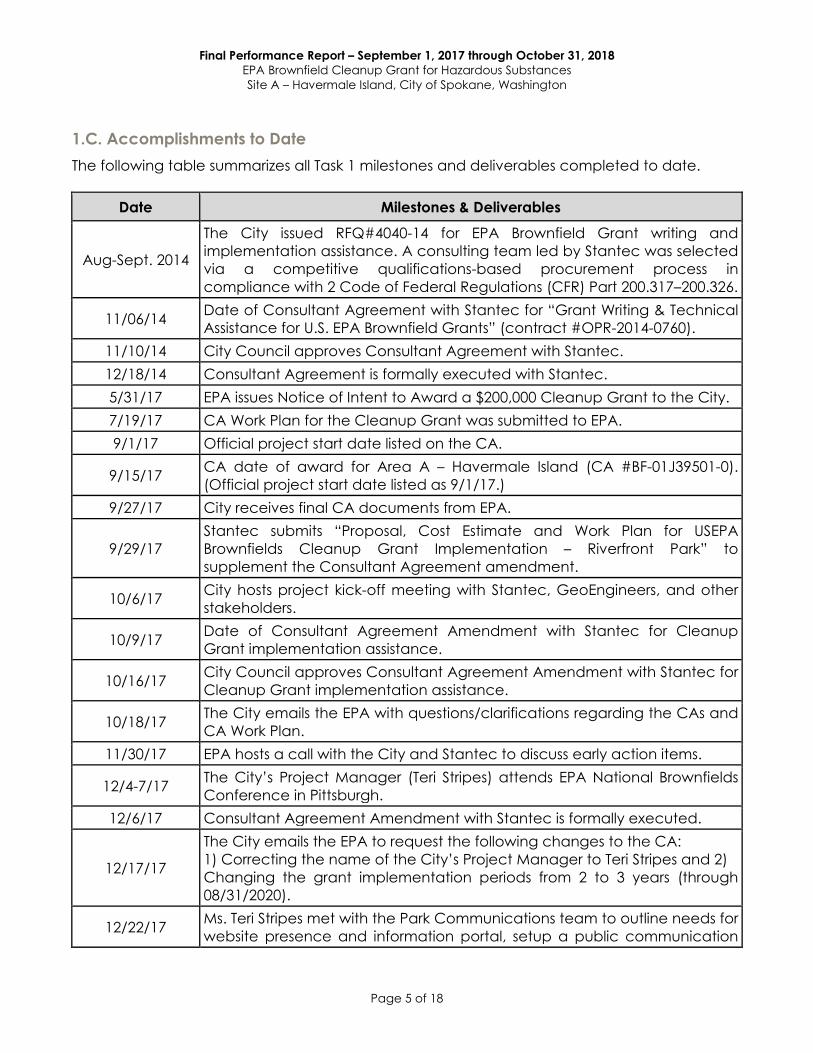
1.C. Accomplishments to Date The following table summarizes all Task 1 milestones and deliverables completed to date.
Date Milestones & Deliverables
Aug-Sept. 2014
The City issued RFQ#4040-14 for EPA Brownfield Grant writing and implementation assistance. A consulting team led by Stantec was selected via a competitive qualifications-based procurement process in compliance with 2 Code of Federal Regulations (CFR) Part 200.317–200.326.
11/06/14 Date of Consultant Agreement with Stantec for “Grant Writing & Technical Assistance for U.S. EPA Brownfield Grants” (contract #OPR-2014-0760).
11/10/14 City Council approves Consultant Agreement with Stantec. 12/18/14 Consultant Agreement is formally executed with Stantec. 5/31/17 EPA issues Notice of Intent to Award a $200,000 Cleanup Grant to the City. 7/19/17 CA Work Plan for the Cleanup Grant was submitted to EPA. 9/1/17 Official project start date listed on the CA.
9/15/17 CA date of award for Area A – Havermale Island (CA #BF-01J39501-0). (Official project start date listed as 9/1/17.)
9/27/17 City receives final CA documents from EPA.
9/29/17 Stantec submits “Proposal, Cost Estimate and Work Plan for USEPA Brownfields Cleanup Grant Implementation – Riverfront Park” to supplement the Consultant Agreement amendment.
10/6/17 City hosts project kick-off meeting with Stantec, GeoEngineers, and other stakeholders.
10/9/17 Date of Consultant Agreement Amendment with Stantec for Cleanup Grant implementation assistance.
10/16/17 City Council approves Consultant Agreement Amendment with Stantec for Cleanup Grant implementation assistance.
10/18/17 The City emails the EPA with questions/clarifications regarding the CAs and CA Work Plan.
11/30/17 EPA hosts a call with the City and Stantec to discuss early action items.
12/4-7/17 The City’s Project Manager (Teri Stripes) attends EPA National Brownfields Conference in Pittsburgh.
12/6/17 Consultant Agreement Amendment with Stantec is formally executed.
12/17/17
The City emails the EPA to request the following changes to the CA: 1) Correcting the name of the City’s Project Manager to Teri Stripes and 2) Changing the grant implementation periods from 2 to 3 years (through 08/31/2020).
12/22/17 Ms. Teri Stripes met with the Park Communications team to outline needs for website presence and information portal, setup a public communication
Final Performance Report – September 1, 2017 through October 31, 2018 EPA Brownfield Cleanup Grant for Hazardous Substances Site A – Havermale Island, City of Spokane, Washington
Page 6 of 18
Date Milestones & Deliverables email dedicated for public use and communication: [email protected]. During this meeting, a monthly standing report to the Park Board’s Riverfront Park public meeting was established.
1/2/18 EPA issues CA Amendment #1. 1/26/18 QPR #1 submitted to EPA. 4/25/18 QPR #2 submitted to EPA.
4/29 – 5/2/18 Ms. Teri Stripes attended the Oregon Brownfield Conference.
5/15/18
City’s Project Manager hosted a conference call with Deborah Burgess (EPA), Sandy Treccani (Ecology), Tina Hochwender (Washington State Department of Commerce), and Brandon Perkins (EPA) to discuss the status of the Spokane Brownfields sites, possible funding needs as well as coordination between the VVCP, redevelopment/remediation and the Cleanup Grant.
7/24/18 QPR #3 submitted to EPA. 10/30/18 QPR #4 submitted to EPA.
Task 2: Community Outreach 2.A. Scope of Work The scope of work for this task as detailed in the Work Plan was as follows: “The City utilized in-house staff to prepare and implement a Community Relations Plan as in-kind services. Several of the community-based organizations serving as project partners will assist in this effort. Area residents will have the opportunity to voice their concerns and will learn about the health risks of the Site and the cleanup methods to be employed as well as be kept informed as to the progress and status of the remediation activities. Although the City attended state and national conferences over the grant implementation period travel costs have already been budgeted in other grants being implemented by the City (FY15 Community Wide Assessment [CWA] Grant).” Outputs: Public Involvement Plan (PIP), publicly accessible electronic repository, and public meeting and stakeholder meeting schedule.
2.B. Activities Completed • Public Involvement
o Ms. Teri Stripes attended the Northwest Remediation conference in Tacoma, Washington on September 20, 2018 and was one of three speakers who presented on a panel titled “Cooperative Cleanup: Fostering Public / Private Partnerships.” On September 27, 2018, a blog post discussing the presentation was published on the Center for Creative Land Recycling webpage titled “NEBC - Clear as Tacoma Glass”.
o A Spokane Riverfront Walking Tour was conducted on September 28, 2018.
Final Performance Report – September 1, 2017 through October 31, 2018 EPA Brownfield Cleanup Grant for Hazardous Substances Site A – Havermale Island, City of Spokane, Washington
Page 7 of 18
o Additional activities as detailed on the table in Section 2.C below.
2.C. Accomplishments The following table summarizes all Task 2 milestones and deliverables completed to date.
Date Milestones & Deliverables
12/8/16 A press release soliciting public comment on the Draft ABCAs and announcing a Public Open House for Spokane’s Brownfield Cleanup Grant Applications was published in The Spokesman-Review.
12/12/16 City hosted a public open house in support of the Cleanup Grant application process.
12/21/16 Public comment period for Draft ABCAs closes.
5/31/17 “Municipality of Spokane Selected for $600,000 in Brownfields Cleanup Grants” press release published by EPA.
5/31/17 “Riverfront Park receives $600,000 in federal funding as ‘brownfield’ site” article published in The Spokesman-Review.
5/31/17 “Riverfront Park Selected for $600,000 in Brownfields Cleanup Grants” news release posted on City’s website.
6/9/17 “The EPA Awards Spokane Three Brownfields Grants” article was published on the City’s blog.
7/28/17
The City submitted the Riverfront Park Redevelopment Community Input and Outreach Plan to the EPA requesting feedback on plans to integrate implementation of the Cleanup Grant into the previously established PIP for the Riverfront Park Revitalization project.
11/30/17 The EPA approved the PIP for Riverfront Park with the addition that the City compile sign-in sheets and produce comment/feedback sheets that are made available to the public.
Dec. 2017 The City was granted approval to provide updates regarding implementation of the Cleanup Grant during regular monthly public meetings held by the Riverfront Park Committee (effective January 2018).
1/8/18 2/5/18 3/5/18
Ms. Teri Stripes provided a status update to the Riverfront Park Committee on the implementation for each of the three project areas.
4/9/18 5/7/18
6/11/18
Ms. Teri Stripes provided a status update to the Riverfront Park Committee on the implementation for each of the three project areas.
6/18/18 Garrett Jones (Parks and Recreation) provided the City Council at its public legislative session a complete update on the Riverfront Park Redevelopment, which included an update on cleanup activities at the Park.
Ongoing The City developed content for the project webpage and other outreach materials. That page is https://my.spokanecity.org/riverfrontpark/redevelopment/a-cleaner-park/
Final Performance Report – September 1, 2017 through October 31, 2018 EPA Brownfield Cleanup Grant for Hazardous Substances Site A – Havermale Island, City of Spokane, Washington
Page 8 of 18
Date Milestones & Deliverables and was updated at approximately monthly intervals with briefings. The webpage included links to the PIP, the QAPP and the ABCA.
Task 3: Cleanup Planning 3.A. Scope of Work The scope of work for Task 3 included: (a) finalizing the Draft ABCAs (b) site preparation tasks such as contractor mobilization/demobilization and implementation of soil erosion and sediment control measures and construction entrance preparation, (c) preparation of a Health & Safety Plan (HASP), and (d) preparation of a QAPP. Plans were developed in accordance with EPA and Ecology requirements. Prevailing wages under the Davis-Bacon Act rules were utilized where applicable. Outputs: QAPP, HASP, Revised ABCA
3.B. Activities Completed
• QAPP o The QAPP was completed and approved by the EPA on 6/25/18.
• ABCA o The final ABCA was completed and approved by the EPA on 5/15/18.
3.C. Accomplishments The following table summarizes all Task 3 milestones and deliverables completed to date.
Date Milestones & Deliverables 12/22/16 Draft ABCA was submitted to EPA as part of the Cleanup Grant application.
11/30/17 EPA confirmed the City does not need to repeat the Cultural Resources Survey or agency outreach/comment process that was previously completed for the Riverfront Park Revitalization project
11/30/17 EPA indicated the potential need to complete or identify a completed Terrestrial Ecology Evaluation or equivalent for the project if not previously prepared.
12/14/17 EPA provides additional information related to preparation of a QAPP specific to the Cleanup Grant.
3/30/18 Draft QAPP submitted to EPA. 4/24/18 Final ABCA submitted to the EPA. 5/15/18 Final ABCA approved by EPA. 6/25/18 QAPP approved by EPA.
Final Performance Report – September 1, 2017 through October 31, 2018 EPA Brownfield Cleanup Grant for Hazardous Substances Site A – Havermale Island, City of Spokane, Washington
Page 9 of 18
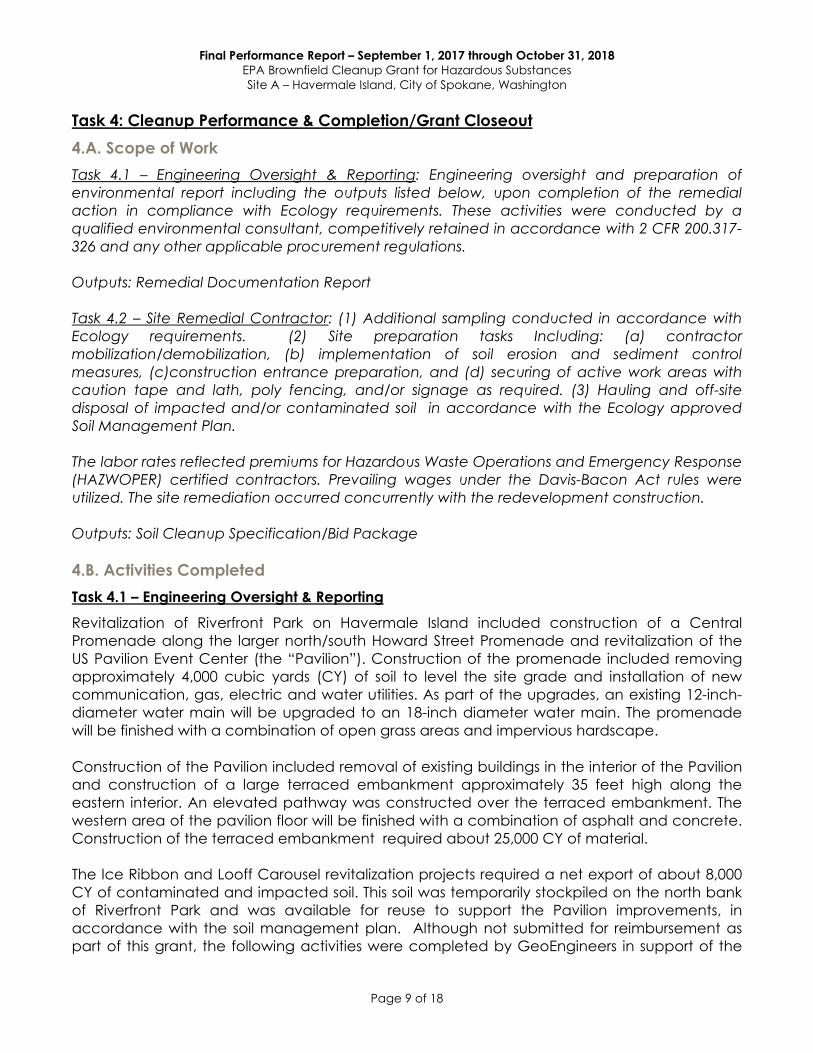
Task 4: Cleanup Performance & Completion/Grant Closeout 4.A. Scope of Work Task 4.1 – Engineering Oversight & Reporting: Engineering oversight and preparation of environmental report including the outputs listed below, upon completion of the remedial action in compliance with Ecology requirements. These activities were conducted by a qualified environmental consultant, competitively retained in accordance with 2 CFR 200.317-326 and any other applicable procurement regulations. Outputs: Remedial Documentation Report Task 4.2 – Site Remedial Contractor: (1) Additional sampling conducted in accordance with Ecology requirements. (2) Site preparation tasks Including: (a) contractor mobilization/demobilization, (b) implementation of soil erosion and sediment control measures, (c)construction entrance preparation, and (d) securing of active work areas with caution tape and lath, poly fencing, and/or signage as required. (3) Hauling and off-site disposal of impacted and/or contaminated soil in accordance with the Ecology approved Soil Management Plan. The labor rates reflected premiums for Hazardous Waste Operations and Emergency Response (HAZWOPER) certified contractors. Prevailing wages under the Davis-Bacon Act rules were utilized. The site remediation occurred concurrently with the redevelopment construction. Outputs: Soil Cleanup Specification/Bid Package 4.B. Activities Completed Task 4.1 – Engineering Oversight & Reporting Revitalization of Riverfront Park on Havermale Island included construction of a Central Promenade along the larger north/south Howard Street Promenade and revitalization of the US Pavilion Event Center (the “Pavilion”). Construction of the promenade included removing approximately 4,000 cubic yards (CY) of soil to level the site grade and installation of new communication, gas, electric and water utilities. As part of the upgrades, an existing 12-inch-diameter water main will be upgraded to an 18-inch diameter water main. The promenade will be finished with a combination of open grass areas and impervious hardscape. Construction of the Pavilion included removal of existing buildings in the interior of the Pavilion and construction of a large terraced embankment approximately 35 feet high along the eastern interior. An elevated pathway was constructed over the terraced embankment. The western area of the pavilion floor will be finished with a combination of asphalt and concrete. Construction of the terraced embankment required about 25,000 CY of material. The Ice Ribbon and Looff Carousel revitalization projects required a net export of about 8,000 CY of contaminated and impacted soil. This soil was temporarily stockpiled on the north bank of Riverfront Park and was available for reuse to support the Pavilion improvements, in accordance with the soil management plan. Although not submitted for reimbursement as part of this grant, the following activities were completed by GeoEngineers in support of the
Final Performance Report – September 1, 2017 through October 31, 2018 EPA Brownfield Cleanup Grant for Hazardous Substances Site A – Havermale Island, City of Spokane, Washington
Page 10 of 18
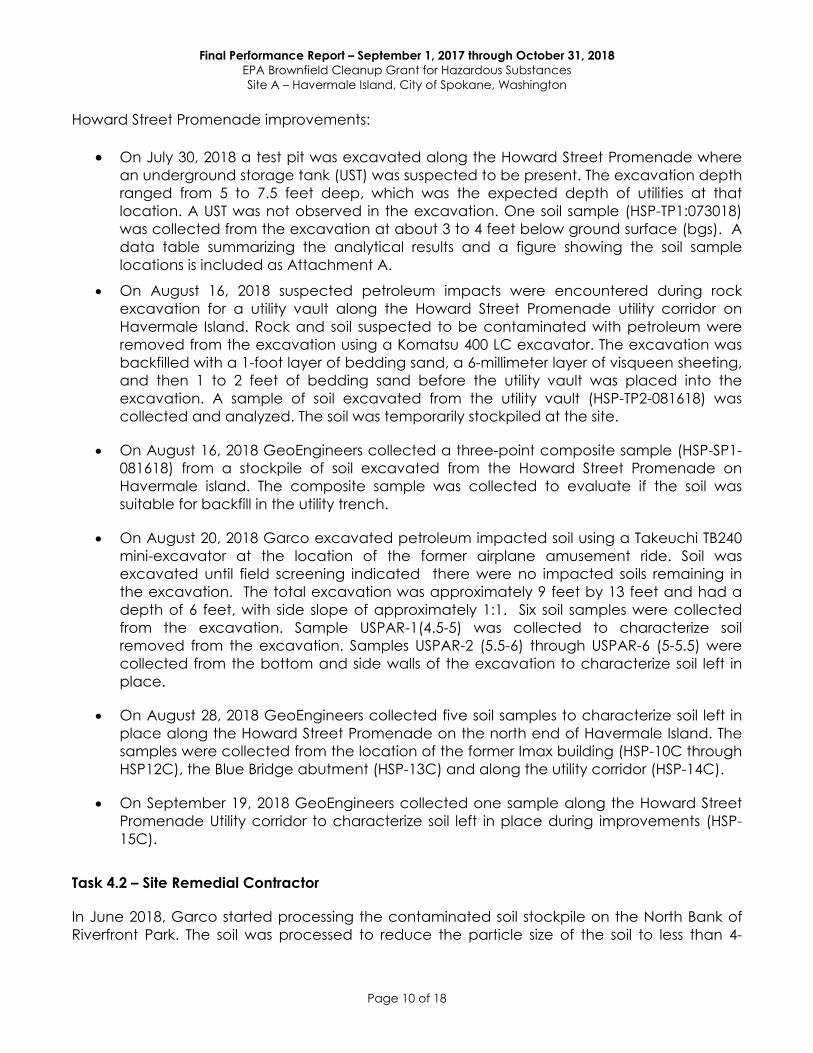
Howard Street Promenade improvements:
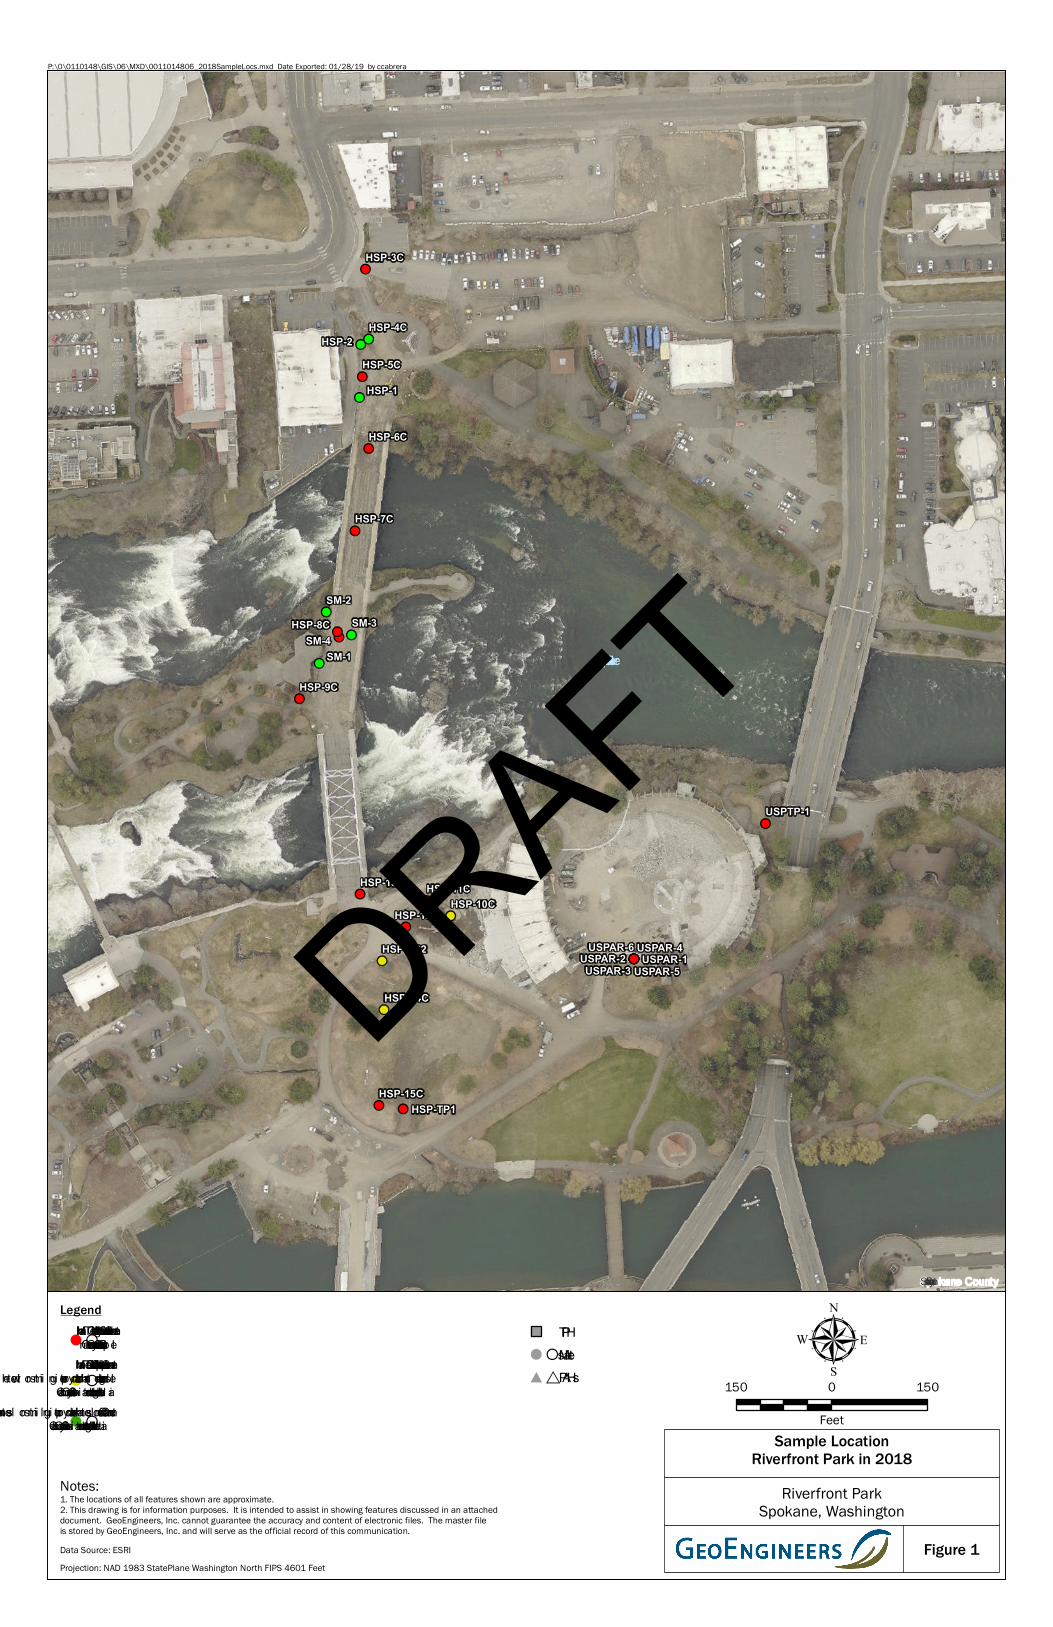
• On July 30, 2018 a test pit was excavated along the Howard Street Promenade where an underground storage tank (UST) was suspected to be present. The excavation depth ranged from 5 to 7.5 feet deep, which was the expected depth of utilities at that location. A UST was not observed in the excavation. One soil sample (HSP-TP1:073018) was collected from the excavation at about 3 to 4 feet below ground surface (bgs). A data table summarizing the analytical results and a figure showing the soil sample locations is included as Attachment A.
• On August 16, 2018 suspected petroleum impacts were encountered during rock excavation for a utility vault along the Howard Street Promenade utility corridor on Havermale Island. Rock and soil suspected to be contaminated with petroleum were removed from the excavation using a Komatsu 400 LC excavator. The excavation was backfilled with a 1-foot layer of bedding sand, a 6-millimeter layer of visqueen sheeting, and then 1 to 2 feet of bedding sand before the utility vault was placed into the excavation. A sample of soil excavated from the utility vault (HSP-TP2-081618) was collected and analyzed. The soil was temporarily stockpiled at the site.
• On August 16, 2018 GeoEngineers collected a three-point composite sample (HSP-SP1-081618) from a stockpile of soil excavated from the Howard Street Promenade on Havermale island. The composite sample was collected to evaluate if the soil was suitable for backfill in the utility trench.
• On August 20, 2018 Garco excavated petroleum impacted soil using a Takeuchi TB240 mini-excavator at the location of the former airplane amusement ride. Soil was excavated until field screening indicated there were no impacted soils remaining in the excavation. The total excavation was approximately 9 feet by 13 feet and had a depth of 6 feet, with side slope of approximately 1:1. Six soil samples were collected from the excavation. Sample USPAR-1(4.5-5) was collected to characterize soil removed from the excavation. Samples USPAR-2 (5.5-6) through USPAR-6 (5-5.5) were collected from the bottom and side walls of the excavation to characterize soil left in place.
• On August 28, 2018 GeoEngineers collected five soil samples to characterize soil left in place along the Howard Street Promenade on the north end of Havermale Island. The samples were collected from the location of the former Imax building (HSP-10C through HSP12C), the Blue Bridge abutment (HSP-13C) and along the utility corridor (HSP-14C).
• On September 19, 2018 GeoEngineers collected one sample along the Howard Street Promenade Utility corridor to characterize soil left in place during improvements (HSP-15C).
Task 4.2 – Site Remedial Contractor
In June 2018, Garco started processing the contaminated soil stockpile on the North Bank of Riverfront Park. The soil was processed to reduce the particle size of the soil to less than 4-
Final Performance Report – September 1, 2017 through October 31, 2018 EPA Brownfield Cleanup Grant for Hazardous Substances Site A – Havermale Island, City of Spokane, Washington
Page 11 of 18
inches in diameter so it could be used as fill for the embankment in the Pavilion on Havermale Island. The soil stockpile included soil from the Ice Ribbon and Looff Carousel projects in addition to soil removed along the utility corridor of the Howard Street Promenade from the North Bank, snxw meneɂ Island (formerly named Canada Island), and Havermale island. Soil imported from offsite was used to backfill the utility trench along the promenade.
AM Landshapers (AM) hauled ~20,000 CY of material from the North Bank Stockpile to Havermale Island between August 22 through September 10, 2018. Inland Asphalt trucked the materials using between 6 – 8 Super Trucks which hold up to 24 tons of material. AM used a large excavator to load the trucks and a dozer, roller and skid-steer loader to place the material. They then remobilized between September 27 and October 12, 2018 and used the material to build the GeoWall at the Pavilion with geofabric and the contaminated materials that had already been hauled to the area. The same equipment in addition to several hand compactors were used closer to the wall. Strata and GeoEngineers oversaw the compaction methodology and verified that compact requirements were met. The contaminated soils were encapsulated per the approved Soil Management Plan. Additional activities included treating the work area for dust suppression per Washington Department of Ecology standards
On September 26, 2018 Garco transported the petroleum impacted soil from the utility vault excavation and airplane ride excavation to Waste Management’s Graham Road Facility (Graham Road). Approximately 17.23 tons of petroleum impacted soil was transported from Riverfront Park and disposed at Graham Road. .
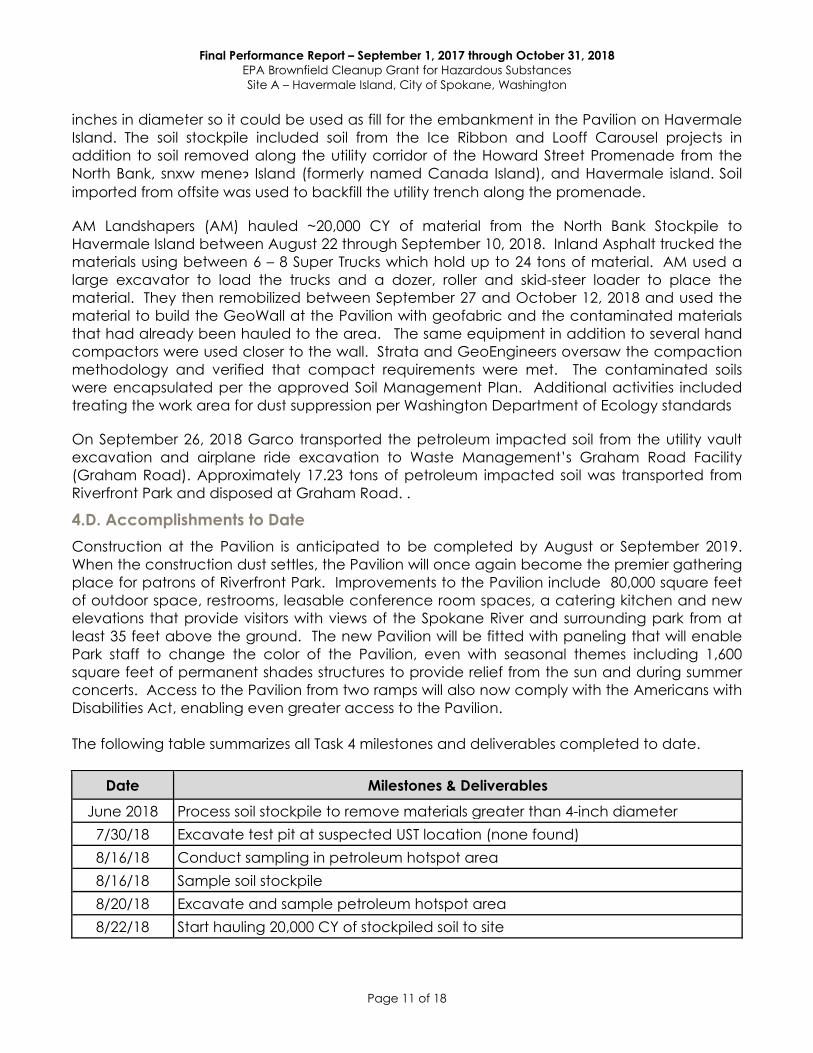
4.D. Accomplishments to Date Construction at the Pavilion is anticipated to be completed by August or September 2019. When the construction dust settles, the Pavilion will once again become the premier gathering place for patrons of Riverfront Park. Improvements to the Pavilion include 80,000 square feet of outdoor space, restrooms, leasable conference room spaces, a catering kitchen and new elevations that provide visitors with views of the Spokane River and surrounding park from at least 35 feet above the ground. The new Pavilion will be fitted with paneling that will enable Park staff to change the color of the Pavilion, even with seasonal themes including 1,600 square feet of permanent shades structures to provide relief from the sun and during summer concerts. Access to the Pavilion from two ramps will also now comply with the Americans with Disabilities Act, enabling even greater access to the Pavilion. The following table summarizes all Task 4 milestones and deliverables completed to date.
Date Milestones & Deliverables June 2018 Process soil stockpile to remove materials greater than 4-inch diameter
7/30/18 Excavate test pit at suspected UST location (none found) 8/16/18 Conduct sampling in petroleum hotspot area 8/16/18 Sample soil stockpile 8/20/18 Excavate and sample petroleum hotspot area 8/22/18 Start hauling 20,000 CY of stockpiled soil to site
Final Performance Report – September 1, 2017 through October 31, 2018 EPA Brownfield Cleanup Grant for Hazardous Substances Site A – Havermale Island, City of Spokane, Washington
Page 12 of 18
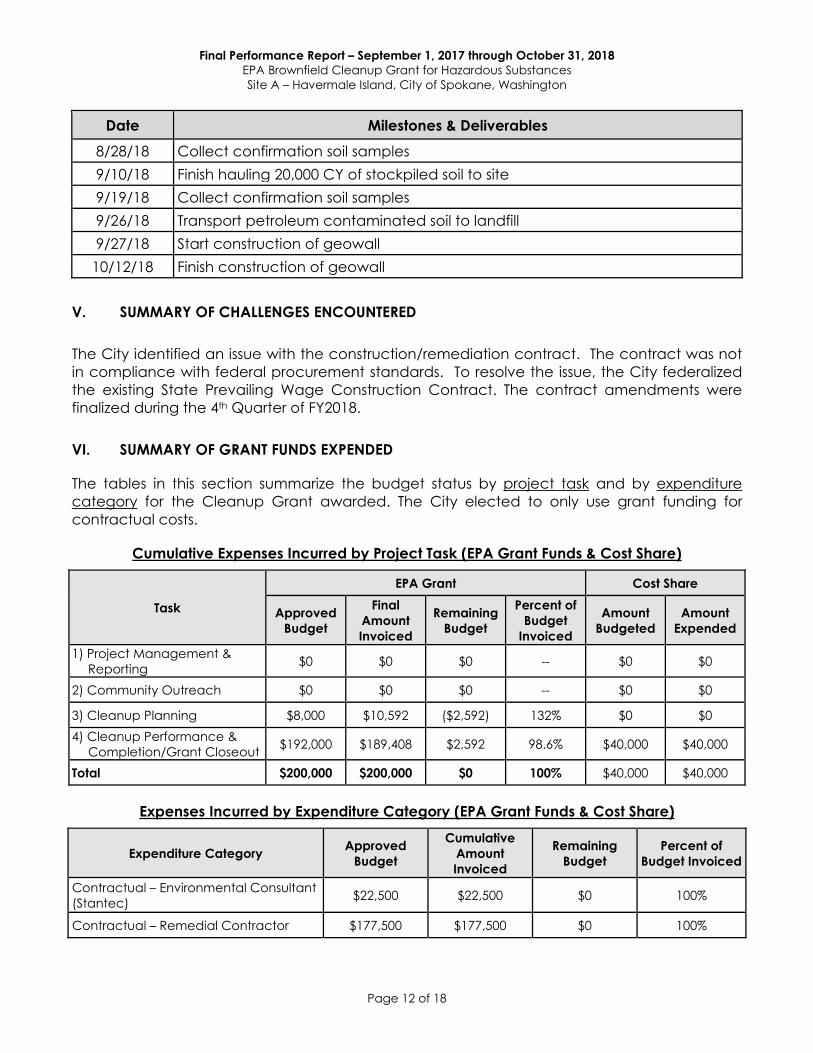
Date Milestones & Deliverables 8/28/18 Collect confirmation soil samples 9/10/18 Finish hauling 20,000 CY of stockpiled soil to site 9/19/18 Collect confirmation soil samples 9/26/18 Transport petroleum contaminated soil to landfill 9/27/18 Start construction of geowall
10/12/18 Finish construction of geowall
V. SUMMARY OF CHALLENGES ENCOUNTERED
The City identified an issue with the construction/remediation contract. The contract was not in compliance with federal procurement standards. To resolve the issue, the City federalized the existing State Prevailing Wage Construction Contract. The contract amendments were finalized during the 4th Quarter of FY2018.
VI. SUMMARY OF GRANT FUNDS EXPENDED
The tables in this section summarize the budget status by project task and by expenditure category for the Cleanup Grant awarded. The City elected to only use grant funding for contractual costs.
Cumulative Expenses Incurred by Project Task (EPA Grant Funds & Cost Share)
Task
EPA Grant Cost Share
Approved Budget
Final Amount Invoiced
Remaining Budget
Percent of Budget
Invoiced
Amount Budgeted
Amount Expended
1) Project Management & Reporting $0 $0 $0 -- $0 $0
2) Community Outreach $0 $0 $0 -- $0 $0
3) Cleanup Planning $8,000 $10,592 ($2,592) 132% $0 $0 4) Cleanup Performance &
Completion/Grant Closeout $192,000 $189,408 $2,592 98.6% $40,000 $40,000
Total $200,000 $200,000 $0 100% $40,000 $40,000
Expenses Incurred by Expenditure Category (EPA Grant Funds & Cost Share)
Expenditure Category Approved Budget
Cumulative Amount Invoiced
Remaining Budget
Percent of Budget Invoiced
Contractual – Environmental Consultant (Stantec) $22,500 $22,500 $0 100%
Contractual – Remedial Contractor $177,500 $177,500 $0 100%

Final Performance Report – September 1, 2017 through October 31, 2018 EPA Brownfield Cleanup Grant for Hazardous Substances Site A – Havermale Island, City of Spokane, Washington
Page 13 of 18
Expenditure Category Approved Budget
Cumulative Amount Invoiced
Remaining Budget
Percent of Budget Invoiced
EPA Grant Total $200,000 $200,000 $0 100%
Cost Share Total $40,000 $40,000 $0 100%
Combined Total $240,000 $240,000 $0 100%
Final Performance Report – September 1, 2017 through October 31, 2018 EPA Brownfield Cleanup Grant for Hazardous Substances Site A – Havermale Island, City of Spokane, Washington
Page 14 of 18
VII. SUMMARY OF LEVERAGED RESOURCES
In-Kind Contributions from Grantee In-kind contributions (i.e. additional remedial costs) provided by the City in support of Tasks 1-4 for the Cleanup Grant are summarized on Table 2.
Leveraged Funding The table below summarizes resources leveraged for completion of the River Park revitalization project.
Funding Source Amount Status Description
Riverfront Park Development Bond $64.3M Approved by
voters in 2014
In November 2014, 67% of voters in Spokane approved issuance of $64.3 million (M) in bonds to pay for improvements at Riverfront Park necessary to revitalize the site and to implement the Riverfront Park Master Plan. The funding included $60M to pay for Park improvements and $4.3M to pay debt service for the first five years of the 20-year payment period.
VIII. ATTACHMENTS
This report includes the following attachments:
• A – Sample Location Figure and Analytical Data Table
IX. PROJECT “SUCCESS STORY” NARRATIVE
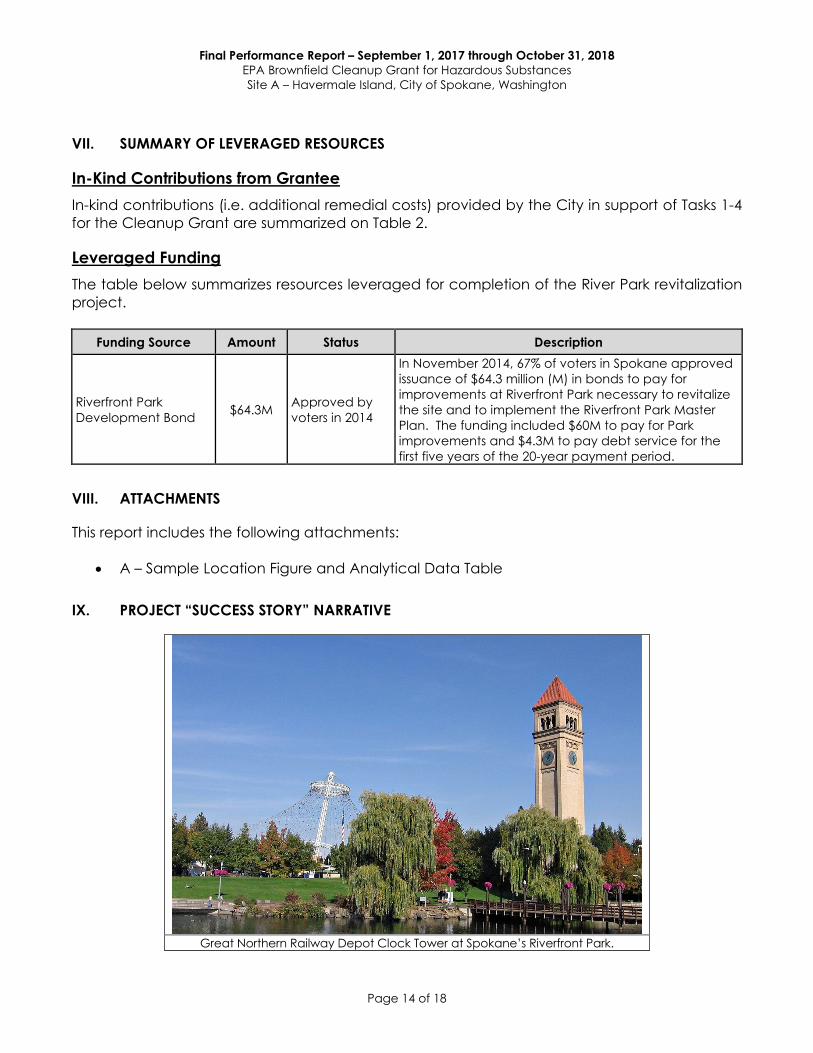
Great Northern Railway Depot Clock Tower at Spokane’s Riverfront Park.
Final Performance Report – September 1, 2017 through October 31, 2018 EPA Brownfield Cleanup Grant for Hazardous Substances Site A – Havermale Island, City of Spokane, Washington
Page 15 of 18
EPA Grant Project Overview In 2014, the City was awarded $400,000 in funding by the EPA for use in assessing vacant, underutilized, or abandoned properties for which redevelopment or reuse is complicated by known or suspected environmental liabilities (i.e., “brownfields”). The EPA brownfield funding was used to advance local efforts focused on redevelopment and reuse of priority brownfield sites throughout the City. In 2017, the City was awarded additional EPA brownfield funding (3 cleanup
grants totaling $600,000) to support revitalization of three sites within the approximately 100-acre Riverfront Park: Havermale Island (Site A), sin-hoo-men-hun (formerly Canada Island; Site B), and (c) the North Bank (Site C).
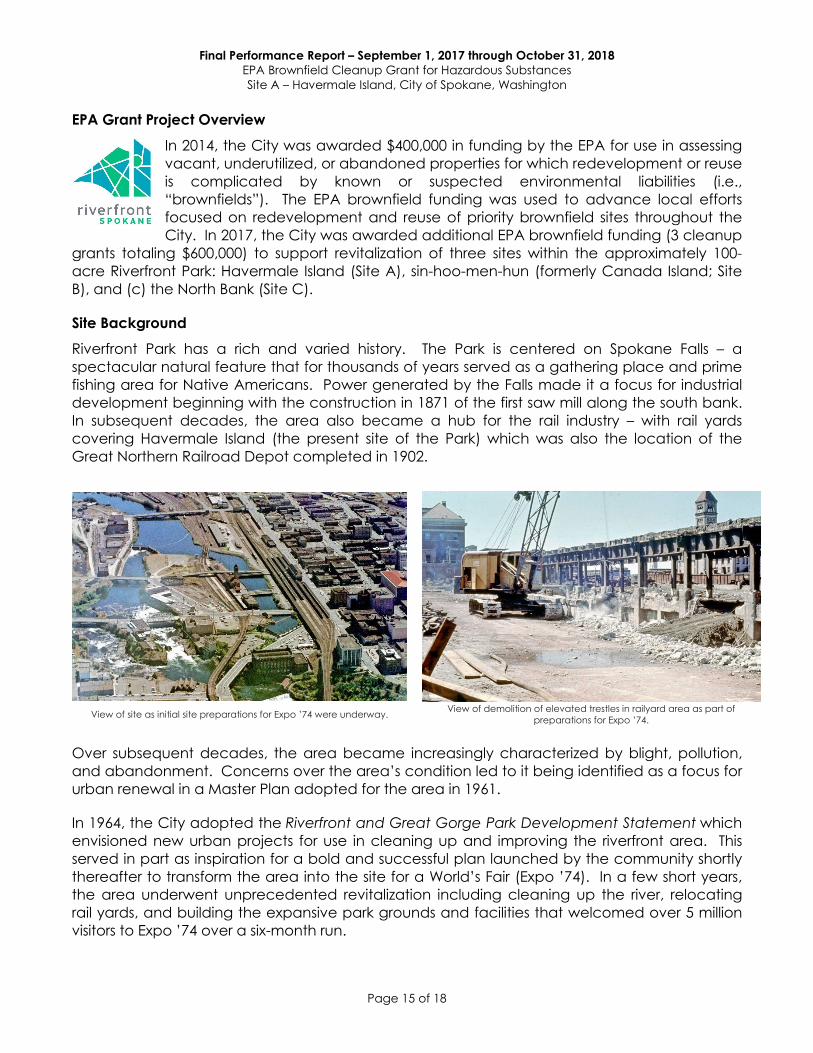
Site Background Riverfront Park has a rich and varied history. The Park is centered on Spokane Falls – a spectacular natural feature that for thousands of years served as a gathering place and prime fishing area for Native Americans. Power generated by the Falls made it a focus for industrial development beginning with the construction in 1871 of the first saw mill along the south bank. In subsequent decades, the area also became a hub for the rail industry – with rail yards covering Havermale Island (the present site of the Park) which was also the location of the Great Northern Railroad Depot completed in 1902.
View of site as initial site preparations for Expo ’74 were underway. View of demolition of elevated trestles in railyard area as part of
preparations for Expo ’74.
Over subsequent decades, the area became increasingly characterized by blight, pollution, and abandonment. Concerns over the area’s condition led to it being identified as a focus for urban renewal in a Master Plan adopted for the area in 1961.
In 1964, the City adopted the Riverfront and Great Gorge Park Development Statement which envisioned new urban projects for use in cleaning up and improving the riverfront area. This served in part as inspiration for a bold and successful plan launched by the community shortly thereafter to transform the area into the site for a World’s Fair (Expo ’74). In a few short years, the area underwent unprecedented revitalization including cleaning up the river, relocating rail yards, and building the expansive park grounds and facilities that welcomed over 5 million visitors to Expo ’74 over a six-month run.
Final Performance Report – September 1, 2017 through October 31, 2018 EPA Brownfield Cleanup Grant for Hazardous Substances Site A – Havermale Island, City of Spokane, Washington
Page 16 of 18
In the 45 years since Expo '74, economic distress and lack of investment has resulted in deteriorating conditions that have negatively impacted the area. Over 5,000 of the City's most economically distressed residents reside in adjacent neighborhoods. Poverty rates exceed fifty percent, half of households qualify for food stamps, and home ownership rates are less than twenty percent of local, state, and US averages. Although the Park was consistently ranked as one of the top tourist attractions in Spokane, it had not seen significant upgrades in the forty years since it opened.
The Riverfront Park Master Plan was established in 2014 culminating a 2.5-year planning process that included over 75 public outreach meetings. This was followed in November 2014 by the overwhelming passage by Spokane voters/residents of a referendum authorizing issuance of $64 million in bonds to fund Park improvements identified in the Master Plan.
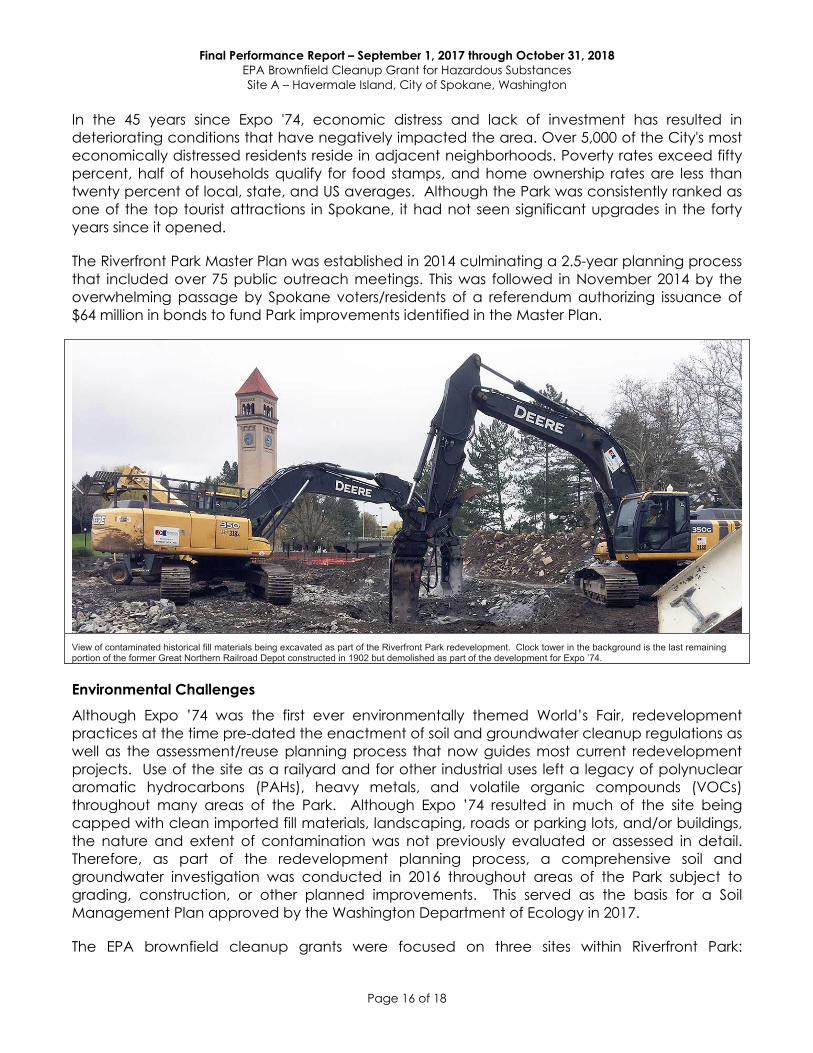
View of contaminated historical fill materials being excavated as part of the Riverfront Park redevelopment. Clock tower in the background is the last remaining portion of the former Great Northern Railroad Depot constructed in 1902 but demolished as part of the development for Expo ’74.
Environmental Challenges Although Expo ’74 was the first ever environmentally themed World’s Fair, redevelopment practices at the time pre-dated the enactment of soil and groundwater cleanup regulations as well as the assessment/reuse planning process that now guides most current redevelopment projects. Use of the site as a railyard and for other industrial uses left a legacy of polynuclear aromatic hydrocarbons (PAHs), heavy metals, and volatile organic compounds (VOCs) throughout many areas of the Park. Although Expo ’74 resulted in much of the site being capped with clean imported fill materials, landscaping, roads or parking lots, and/or buildings, the nature and extent of contamination was not previously evaluated or assessed in detail. Therefore, as part of the redevelopment planning process, a comprehensive soil and groundwater investigation was conducted in 2016 throughout areas of the Park subject to grading, construction, or other planned improvements. This served as the basis for a Soil Management Plan approved by the Washington Department of Ecology in 2017.
The EPA brownfield cleanup grants were focused on three sites within Riverfront Park:
Final Performance Report – September 1, 2017 through October 31, 2018 EPA Brownfield Cleanup Grant for Hazardous Substances Site A – Havermale Island, City of Spokane, Washington
Page 17 of 18
Havermale Island (Site A), sin-hoo-men-hun (formerly Canada Island; Site B), and (c) the North Bank (Site C). Draft ABCA documents were completed for each area in 2016 using funding from the City’s 2014 EPA brownfields assessment grant. These ABCAs were updated in 2017-18 following the award of the EPA cleanup grants.
EPA Funded Services Stantec was retained by the City to assist with implementation of the EPA assessment grant awarded in 2014 as well as the cleanup grants awarded in 2017. EPA assessment grant funding was used initially to support preparation of eligibility determination requests for the three target areas as well as preparation of the draft ABCA documents. Implementation of the three EPA cleanup grants is in progress with remedial activities underway in several areas. To date, an approved quality assurance project plan (QAPP) has been completed as well as updated ABCA documents. Remedial activities are in progress in several areas and have been completed within Site A (Havermale Island).
The total EPA funding expended for environmental assessment and cleanup at the three Riverfront Park sites is $651,283. Although the total project cost is expected to exceed $70 million, EPA funding has played a key role in helping to off-set remedial costs that were not anticipated at the time of passage of the bond issue in 2014.
Project Environmental, Social, and/or Economic Benefits The redevelopment of Riverfront Park has provided the City with a fresh opportunity to bring the park to a higher environmental standard and level of sustainability befitting a site that was the focus for the first ever “environmentally themed” World's Fair. The journey to a cleaner Park starts from the ground up, or in this case, below the ground, where help from EPA grants enabled the City to remove or safely encapsulate thousands of tons of contaminated soil associated with nearly 100 years of industrial uses that predated Expo '74.
We are growing Spokane’s economic vitality one park, one employer, one job at a time. Much of our strategic plan is built on partnerships, reinvestment and creative reuse of important neighborhood and community assets. The working relationship we have with the EPA is bringing that vision to life through the cleanup grants and past assistance in assessments, planning and technical guidance the agency has brought to the table for Spokane to further leverage the investments our citizens are making. Spokane Mayor, David Condon
Attachment A Sample Location Figure and Analytical Data Table
!!(
!!(
!!(!!(
!!(
!!(
!!(
!!(
!!(
!!(
!!(
!!(
!!(
!!(!!(
!!(
!!(
!!(
!!( !!(
!!( !!(!!(!!(!!(!!(!!(
!!(
Spokane RiverSM-1
SM-2SM-3
SM-4
HSP-1
HSP-2
HSP-3C
HSP-4C
HSP-5C
HSP-6C
HSP-7C
HSP-8C
HSP-9C
HSP-10CHSP-11C
HSP-12C
HSP-13C
HSP-14C
HSP-15CHSP-TP1
HSP-TP2USPAR-1USPAR-2
USPAR-3USPAR-4USPAR-5
USPAR-6
USPTP-1
Spokane County
Sample LocationRiverfront Park in 2018
Riverfront ParkSpokane, Washington
Figure 1
µ150 0 150
Feet
Legend
! Contaminated – Concentration greater than MTCA Method ACleanup Level for one or more COC analyzed
! Impacted – Concentration less than MTCA Method A CleanupLevels and greater than laboratory reporting limits or twice theavailable background metals concentration for each COC analyzed
! Clean – Concentration less than laboratory reporting limits or less than twicethe available background metals concentrations for each COC analyzed
" TPH! Metals# PAHs
Notes:1. The locations of all features shown are approximate.2. This drawing is for information purposes. It is intended to assist in showing features discussed in an attacheddocument. GeoEngineers, Inc. cannot guarantee the accuracy and content of electronic files. The master fileis stored by GeoEngineers, Inc. and will serve as the official record of this communication.
Projection: NAD 1983 StatePlane Washington North FIPS 4601 Feet
P:\0\0110148\GIS\06\MXD\0011014806_2018SampleLocs.mxd Date Exported: 01/28/19 by ccabrera
Data Source: ESRI
DRAFT
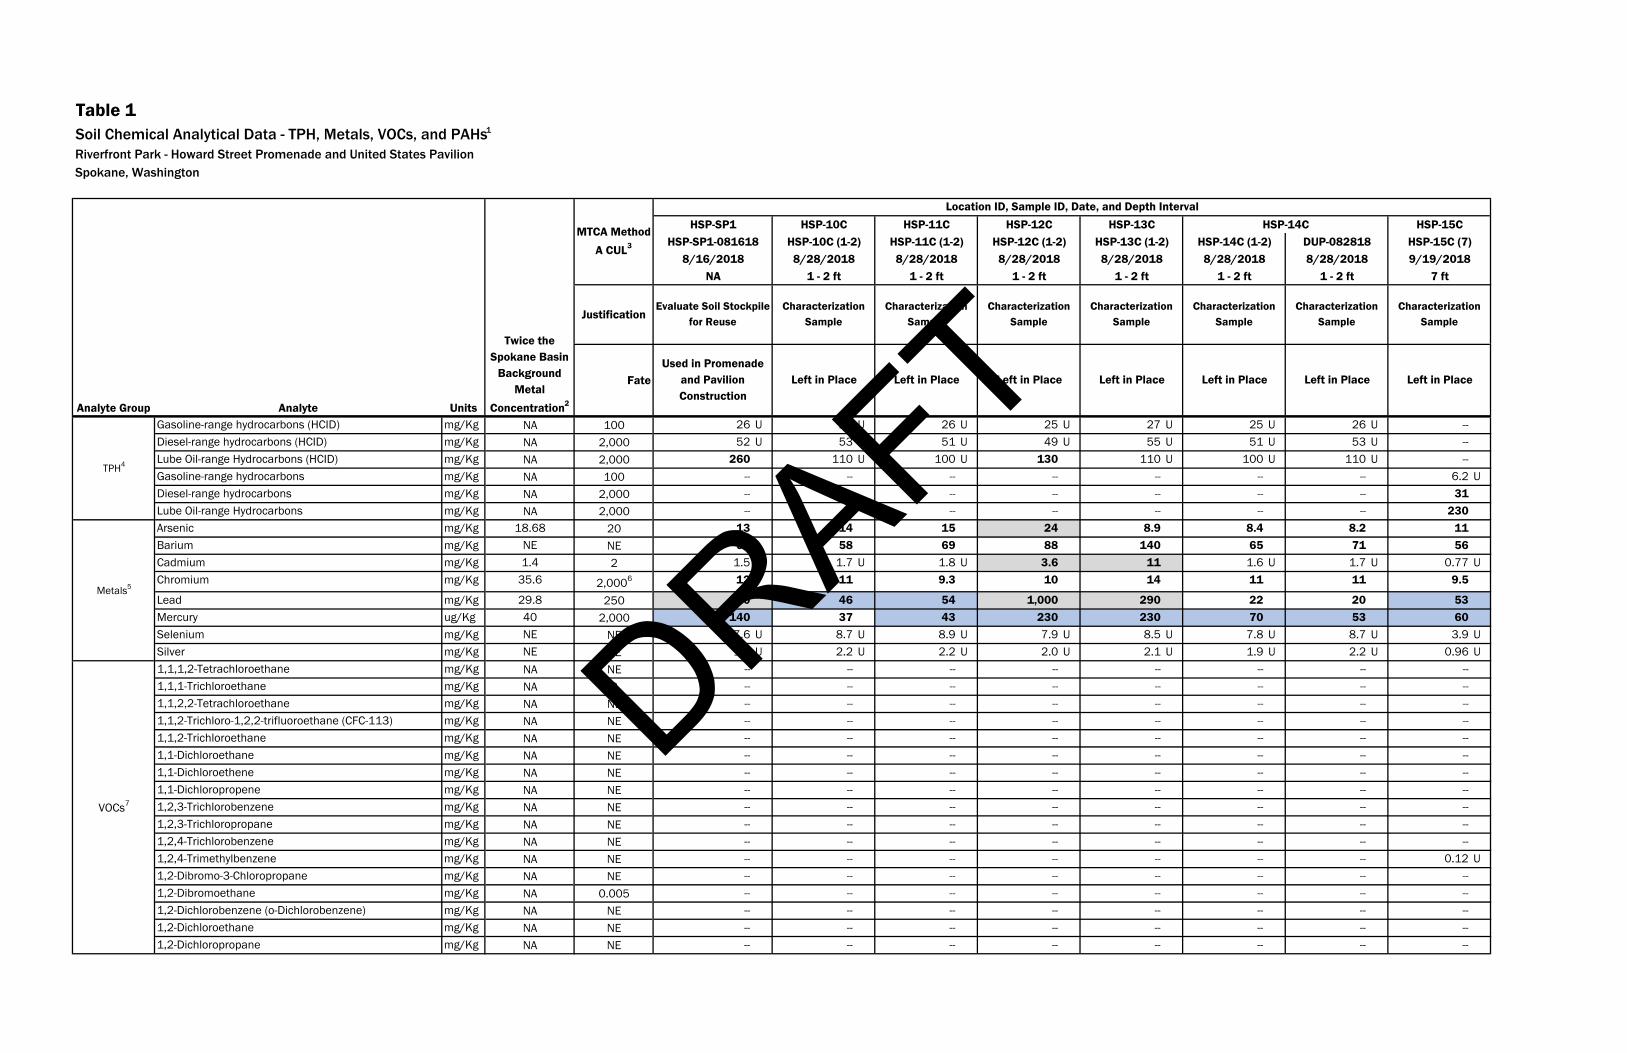
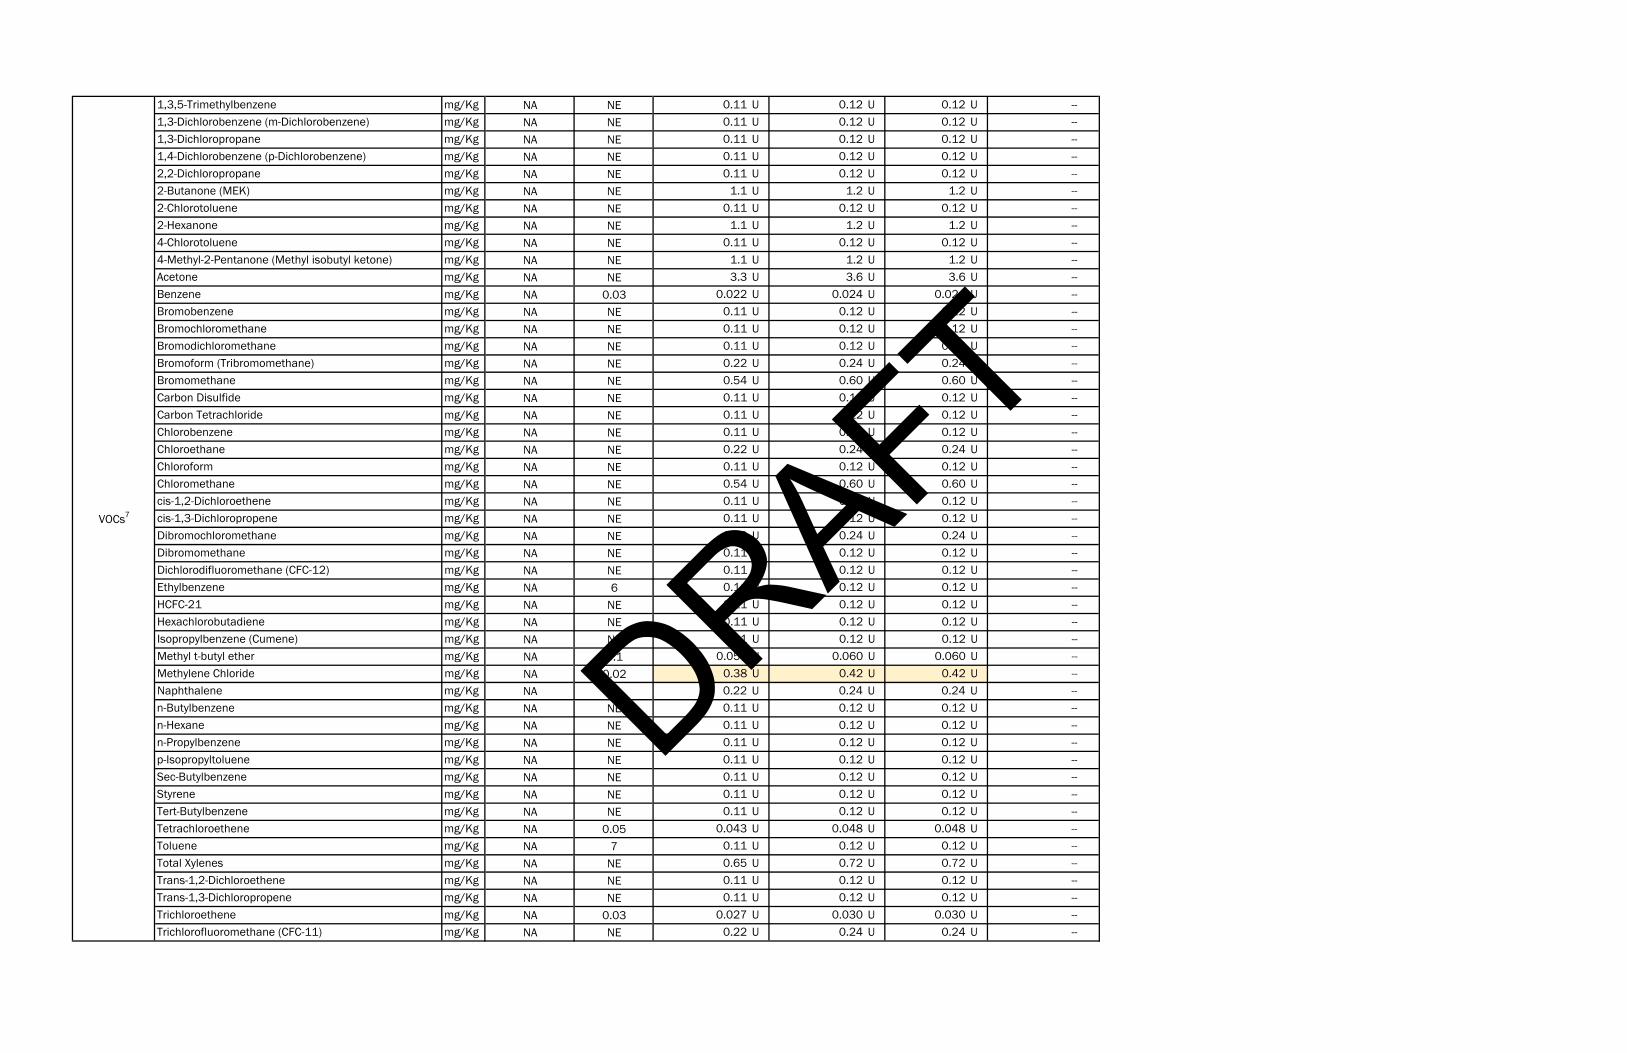
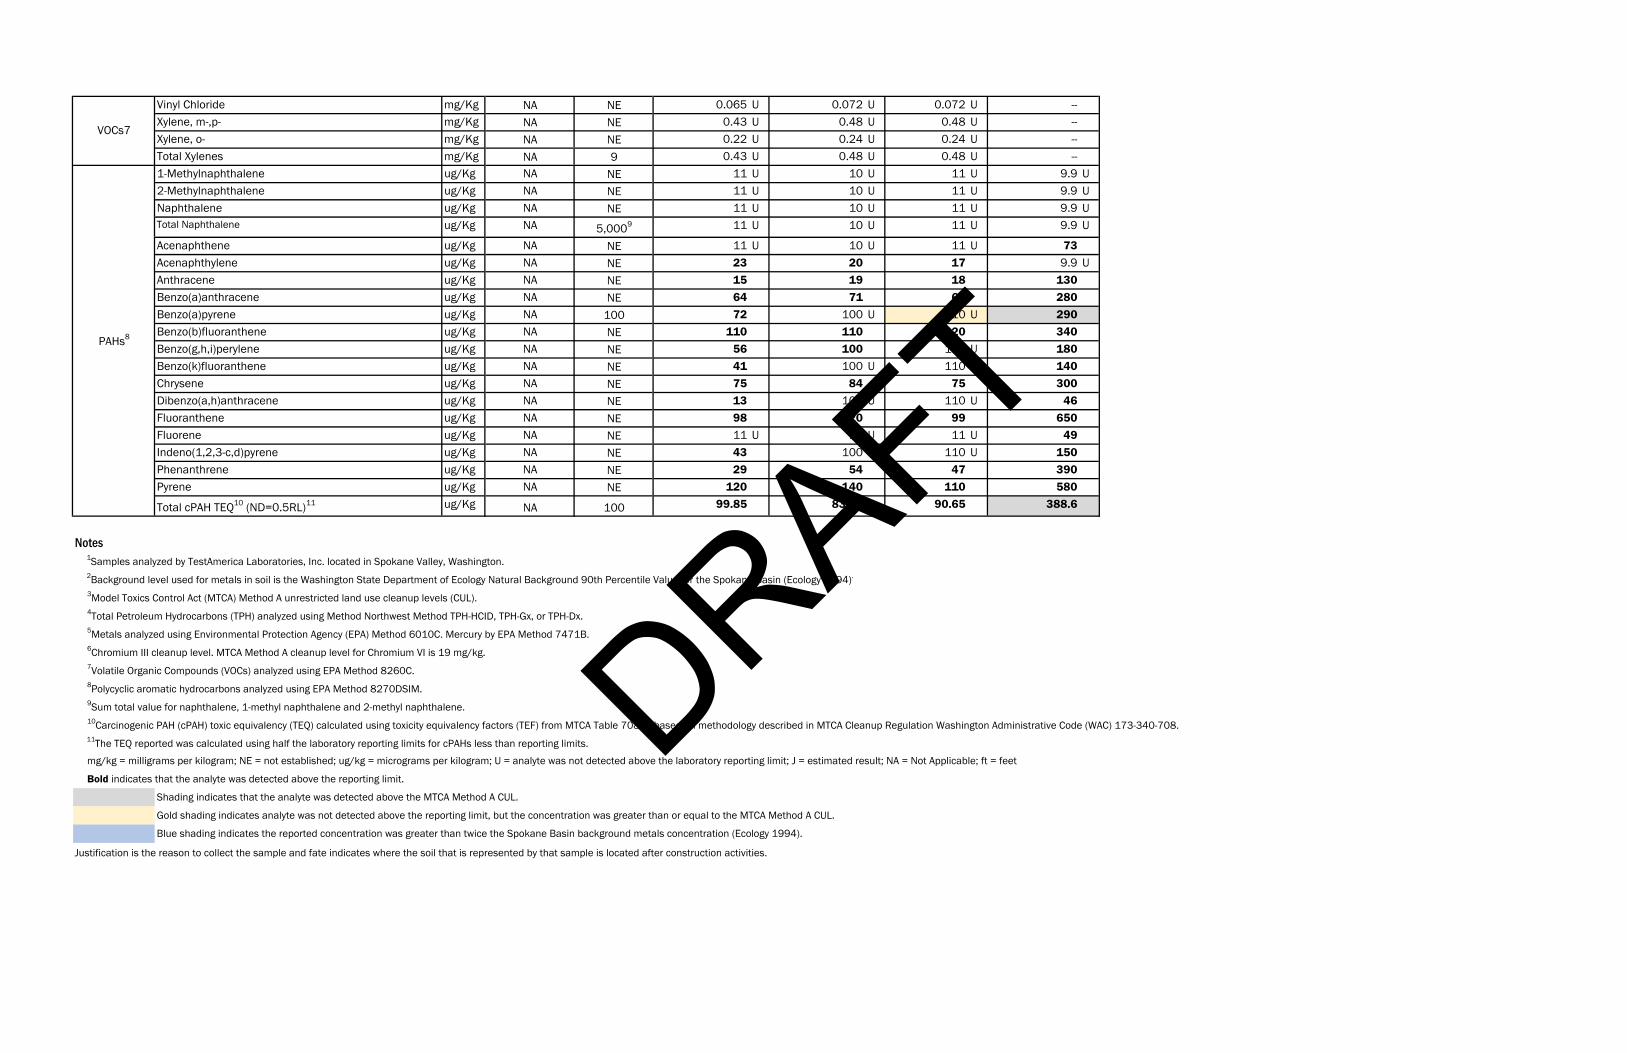
Table 1Soil Chemical Analytical Data - TPH, Metals, VOCs, and PAHs1
Riverfront Park - Howard Street Promenade and United States PavilionSpokane, Washington
Justification
Fate
Gasoline-range hydrocarbons (HCID) mg/Kg NA 100 26 U 26 U 26 U 25 U 27 U 25 U 26 U --Diesel-range hydrocarbons (HCID) mg/Kg NA 2,000 52 U 53 U 51 U 49 U 55 U 51 U 53 U --Lube Oil-range Hydrocarbons (HCID) mg/Kg NA 2,000 260 110 U 100 U 130 110 U 100 U 110 U --Gasoline-range hydrocarbons mg/Kg NA 100 -- -- -- -- -- -- -- 6.2 UDiesel-range hydrocarbons mg/Kg NA 2,000 -- -- -- -- -- -- -- 31Lube Oil-range Hydrocarbons mg/Kg NA 2,000 -- -- -- -- -- -- -- 230Arsenic mg/Kg 18.68 20 13 14 15 24 8.9 8.4 8.2 11Barium mg/Kg NE NE 91 58 69 88 140 65 71 56Cadmium mg/Kg 1.4 2 1.5 U 1.7 U 1.8 U 3.6 11 1.6 U 1.7 U 0.77 UChromium mg/Kg 35.6 2,0006 12 11 9.3 10 14 11 11 9.5
Lead mg/Kg 29.8 250 290 46 54 1,000 290 22 20 53Mercury ug/Kg 40 2,000 140 37 43 230 230 70 53 60Selenium mg/Kg NE NE 7.6 U 8.7 U 8.9 U 7.9 U 8.5 U 7.8 U 8.7 U 3.9 USilver mg/Kg NE NE 1.9 U 2.2 U 2.2 U 2.0 U 2.1 U 1.9 U 2.2 U 0.96 U1,1,1,2-Tetrachloroethane mg/Kg NA NE -- -- -- -- -- -- -- --1,1,1-Trichloroethane mg/Kg NA 2 -- -- -- -- -- -- -- --1,1,2,2-Tetrachloroethane mg/Kg NA NE -- -- -- -- -- -- -- --1,1,2-Trichloro-1,2,2-trifluoroethane (CFC-113) mg/Kg NA NE -- -- -- -- -- -- -- --1,1,2-Trichloroethane mg/Kg NA NE -- -- -- -- -- -- -- --1,1-Dichloroethane mg/Kg NA NE -- -- -- -- -- -- -- --1,1-Dichloroethene mg/Kg NA NE -- -- -- -- -- -- -- --1,1-Dichloropropene mg/Kg NA NE -- -- -- -- -- -- -- --1,2,3-Trichlorobenzene mg/Kg NA NE -- -- -- -- -- -- -- --1,2,3-Trichloropropane mg/Kg NA NE -- -- -- -- -- -- -- --1,2,4-Trichlorobenzene mg/Kg NA NE -- -- -- -- -- -- -- --1,2,4-Trimethylbenzene mg/Kg NA NE -- -- -- -- -- -- -- 0.12 U1,2-Dibromo-3-Chloropropane mg/Kg NA NE -- -- -- -- -- -- -- --1,2-Dibromoethane mg/Kg NA 0.005 -- -- -- -- -- -- -- --1,2-Dichlorobenzene (o-Dichlorobenzene) mg/Kg NA NE -- -- -- -- -- -- -- --1,2-Dichloroethane mg/Kg NA NE -- -- -- -- -- -- -- --1,2-Dichloropropane mg/Kg NA NE -- -- -- -- -- -- -- --
VOCs7
Location ID, Sample ID, Date, and Depth Interval
Characterization Sample
Characterization Sample
Characterization Sample
Characterization Sample
Characterization Sample
Characterization Sample
HSP-13C HSP-14C HSP-15CMTCA Method
A CUL3
Analyte Group Analyte Units
Twice the Spokane Basin
Background Metal
Concentration2
HSP-SP1
TPH4
Metals5
HSP-SP1-0816188/16/2018
NA
Evaluate Soil Stockpile for Reuse
Used in Promenade and Pavilion Construction
HSP-10C HSP-11C HSP-12C
Left in PlaceLeft in Place
Characterization Sample
1 - 2 ft
DUP-0828188/28/2018
1 - 2 ft
HSP-15C (7)9/19/2018
7 ft
Left in Place
HSP-14C (1-2)8/28/20188/28/2018
1 - 2 ft
Left in Place
HSP-13C (1-2)8/28/2018
1 - 2 ft
Left in Place
HSP-12C (1-2)8/28/2018
1 - 2 ft
Left in Place
HSP-11C (1-2)8/28/2018
1 - 2 ft
Left in Place
HSP-10C (1-2)
DRAFT
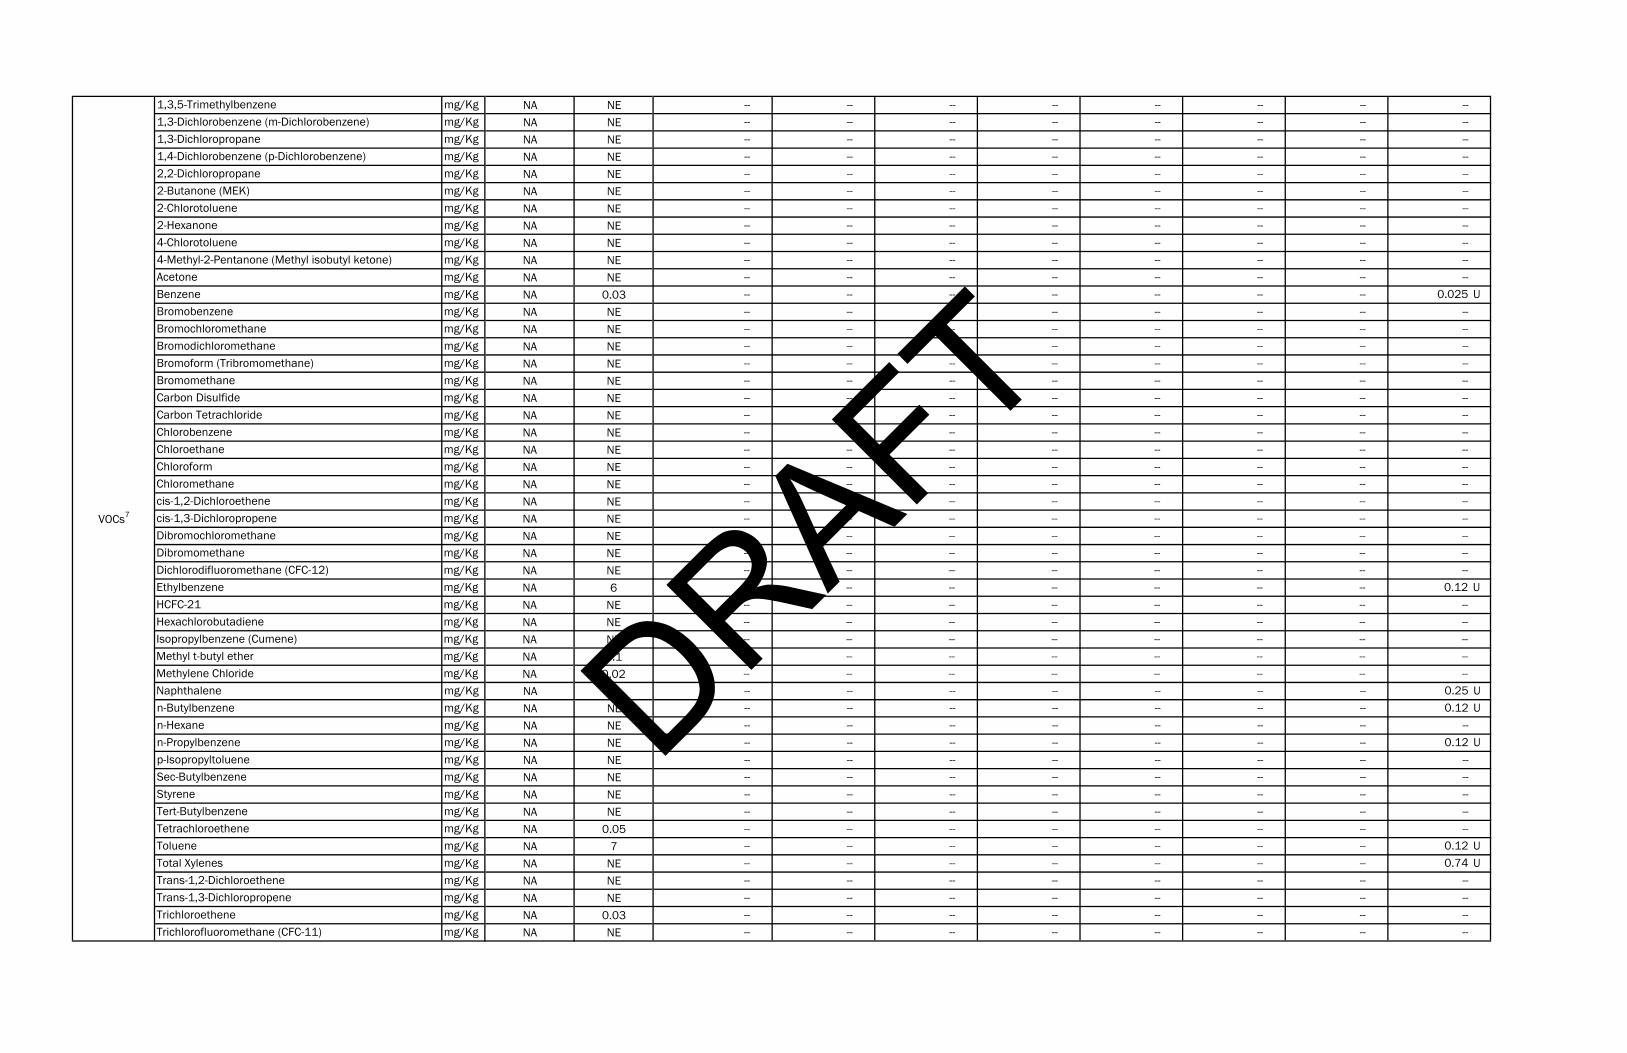
1,3,5-Trimethylbenzene mg/Kg NA NE -- -- -- -- -- -- -- --1,3-Dichlorobenzene (m-Dichlorobenzene) mg/Kg NA NE -- -- -- -- -- -- -- --1,3-Dichloropropane mg/Kg NA NE -- -- -- -- -- -- -- --1,4-Dichlorobenzene (p-Dichlorobenzene) mg/Kg NA NE -- -- -- -- -- -- -- --2,2-Dichloropropane mg/Kg NA NE -- -- -- -- -- -- -- --2-Butanone (MEK) mg/Kg NA NE -- -- -- -- -- -- -- --2-Chlorotoluene mg/Kg NA NE -- -- -- -- -- -- -- --2-Hexanone mg/Kg NA NE -- -- -- -- -- -- -- --4-Chlorotoluene mg/Kg NA NE -- -- -- -- -- -- -- --4-Methyl-2-Pentanone (Methyl isobutyl ketone) mg/Kg NA NE -- -- -- -- -- -- -- --Acetone mg/Kg NA NE -- -- -- -- -- -- -- --Benzene mg/Kg NA 0.03 -- -- -- -- -- -- -- 0.025 UBromobenzene mg/Kg NA NE -- -- -- -- -- -- -- --Bromochloromethane mg/Kg NA NE -- -- -- -- -- -- -- --Bromodichloromethane mg/Kg NA NE -- -- -- -- -- -- -- --Bromoform (Tribromomethane) mg/Kg NA NE -- -- -- -- -- -- -- --Bromomethane mg/Kg NA NE -- -- -- -- -- -- -- --Carbon Disulfide mg/Kg NA NE -- -- -- -- -- -- -- --Carbon Tetrachloride mg/Kg NA NE -- -- -- -- -- -- -- --Chlorobenzene mg/Kg NA NE -- -- -- -- -- -- -- --Chloroethane mg/Kg NA NE -- -- -- -- -- -- -- --Chloroform mg/Kg NA NE -- -- -- -- -- -- -- --Chloromethane mg/Kg NA NE -- -- -- -- -- -- -- --cis-1,2-Dichloroethene mg/Kg NA NE -- -- -- -- -- -- -- --cis-1,3-Dichloropropene mg/Kg NA NE -- -- -- -- -- -- -- --Dibromochloromethane mg/Kg NA NE -- -- -- -- -- -- -- --Dibromomethane mg/Kg NA NE -- -- -- -- -- -- -- --Dichlorodifluoromethane (CFC-12) mg/Kg NA NE -- -- -- -- -- -- -- --Ethylbenzene mg/Kg NA 6 -- -- -- -- -- -- -- 0.12 UHCFC-21 mg/Kg NA NE -- -- -- -- -- -- -- --Hexachlorobutadiene mg/Kg NA NE -- -- -- -- -- -- -- --Isopropylbenzene (Cumene) mg/Kg NA NE -- -- -- -- -- -- -- --Methyl t-butyl ether mg/Kg NA 0.1 -- -- -- -- -- -- -- --Methylene Chloride mg/Kg NA 0.02 -- -- -- -- -- -- -- --Naphthalene mg/Kg NA 5 -- -- -- -- -- -- -- 0.25 Un-Butylbenzene mg/Kg NA NE -- -- -- -- -- -- -- 0.12 Un-Hexane mg/Kg NA NE -- -- -- -- -- -- -- --n-Propylbenzene mg/Kg NA NE -- -- -- -- -- -- -- 0.12 Up-Isopropyltoluene mg/Kg NA NE -- -- -- -- -- -- -- --Sec-Butylbenzene mg/Kg NA NE -- -- -- -- -- -- -- --Styrene mg/Kg NA NE -- -- -- -- -- -- -- --Tert-Butylbenzene mg/Kg NA NE -- -- -- -- -- -- -- --Tetrachloroethene mg/Kg NA 0.05 -- -- -- -- -- -- -- --Toluene mg/Kg NA 7 -- -- -- -- -- -- -- 0.12 UTotal Xylenes mg/Kg NA NE -- -- -- -- -- -- -- 0.74 UTrans-1,2-Dichloroethene mg/Kg NA NE -- -- -- -- -- -- -- --Trans-1,3-Dichloropropene mg/Kg NA NE -- -- -- -- -- -- -- --Trichloroethene mg/Kg NA 0.03 -- -- -- -- -- -- -- --Trichlorofluoromethane (CFC-11) mg/Kg NA NE -- -- -- -- -- -- -- --
VOCs7
DRAFT
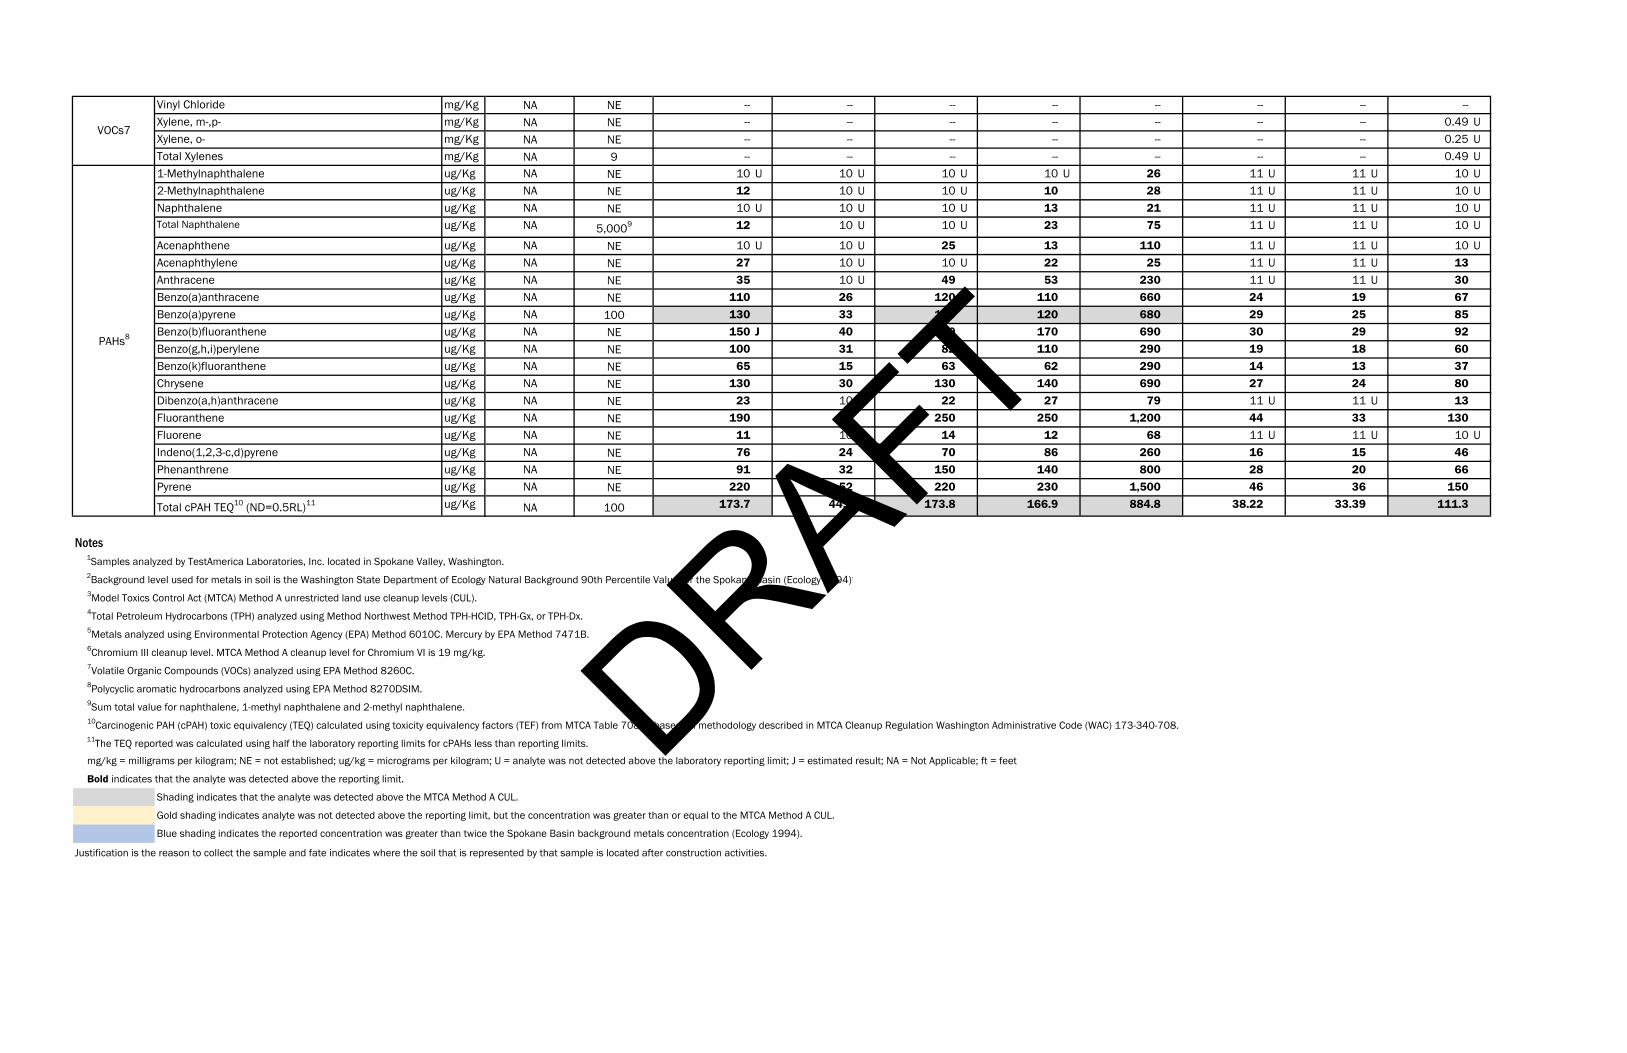
Vinyl Chloride mg/Kg NA NE -- -- -- -- -- -- -- --Xylene, m-,p- mg/Kg NA NE -- -- -- -- -- -- -- 0.49 UXylene, o- mg/Kg NA NE -- -- -- -- -- -- -- 0.25 UTotal Xylenes mg/Kg NA 9 -- -- -- -- -- -- -- 0.49 U1-Methylnaphthalene ug/Kg NA NE 10 U 10 U 10 U 10 U 26 11 U 11 U 10 U2-Methylnaphthalene ug/Kg NA NE 12 10 U 10 U 10 28 11 U 11 U 10 UNaphthalene ug/Kg NA NE 10 U 10 U 10 U 13 21 11 U 11 U 10 UTotal Naphthalene ug/Kg NA 5,0009 12 10 U 10 U 23 75 11 U 11 U 10 U
Acenaphthene ug/Kg NA NE 10 U 10 U 25 13 110 11 U 11 U 10 UAcenaphthylene ug/Kg NA NE 27 10 U 10 U 22 25 11 U 11 U 13Anthracene ug/Kg NA NE 35 10 U 49 53 230 11 U 11 U 30Benzo(a)anthracene ug/Kg NA NE 110 26 120 110 660 24 19 67Benzo(a)pyrene ug/Kg NA 100 130 33 130 120 680 29 25 85Benzo(b)fluoranthene ug/Kg NA NE 150 J 40 150 170 690 30 29 92Benzo(g,h,i)perylene ug/Kg NA NE 100 31 82 110 290 19 18 60Benzo(k)fluoranthene ug/Kg NA NE 65 15 63 62 290 14 13 37Chrysene ug/Kg NA NE 130 30 130 140 690 27 24 80Dibenzo(a,h)anthracene ug/Kg NA NE 23 10 U 22 27 79 11 U 11 U 13Fluoranthene ug/Kg NA NE 190 56 250 250 1,200 44 33 130Fluorene ug/Kg NA NE 11 10 U 14 12 68 11 U 11 U 10 UIndeno(1,2,3-c,d)pyrene ug/Kg NA NE 76 24 70 86 260 16 15 46Phenanthrene ug/Kg NA NE 91 32 150 140 800 28 20 66Pyrene ug/Kg NA NE 220 52 220 230 1,500 46 36 150
Total cPAH TEQ10 (ND=0.5RL)11 ug/Kg NA 100 173.7 44.3 173.8 166.9 884.8 38.22 33.39 111.3
Notes1Samples analyzed by TestAmerica Laboratories, Inc. located in Spokane Valley, Washington.2Background level used for metals in soil is the Washington State Department of Ecology Natural Background 90th Percentile Value for the Spokane Basin (Ecology 1994).
3Model Toxics Control Act (MTCA) Method A unrestricted land use cleanup levels (CUL).4Total Petroleum Hydrocarbons (TPH) analyzed using Method Northwest Method TPH-HCID, TPH-Gx, or TPH-Dx.5Metals analyzed using Environmental Protection Agency (EPA) Method 6010C. Mercury by EPA Method 7471B.6Chromium III cleanup level. MTCA Method A cleanup level for Chromium VI is 19 mg/kg.7Volatile Organic Compounds (VOCs) analyzed using EPA Method 8260C.8Polycyclic aromatic hydrocarbons analyzed using EPA Method 8270DSIM.9Sum total value for naphthalene, 1-methyl naphthalene and 2-methyl naphthalene.10Carcinogenic PAH (cPAH) toxic equivalency (TEQ) calculated using toxicity equivalency factors (TEF) from MTCA Table 708-2, based on methodology described in MTCA Cleanup Regulation Washington Administrative Code (WAC) 173-340-708. 11The TEQ reported was calculated using half the laboratory reporting limits for cPAHs less than reporting limits.
mg/kg = milligrams per kilogram; NE = not established; ug/kg = micrograms per kilogram; U = analyte was not detected above the laboratory reporting limit; J = estimated result; NA = Not Applicable; ft = feet
Bold indicates that the analyte was detected above the reporting limit.
Shading indicates that the analyte was detected above the MTCA Method A CUL.
Gold shading indicates analyte was not detected above the reporting limit, but the concentration was greater than or equal to the MTCA Method A CUL.
Blue shading indicates the reported concentration was greater than twice the Spokane Basin background metals concentration (Ecology 1994).
Justification is the reason to collect the sample and fate indicates where the soil that is represented by that sample is located after construction activities.
VOCs7
PAHs8
DRAFT
Justification
Fate
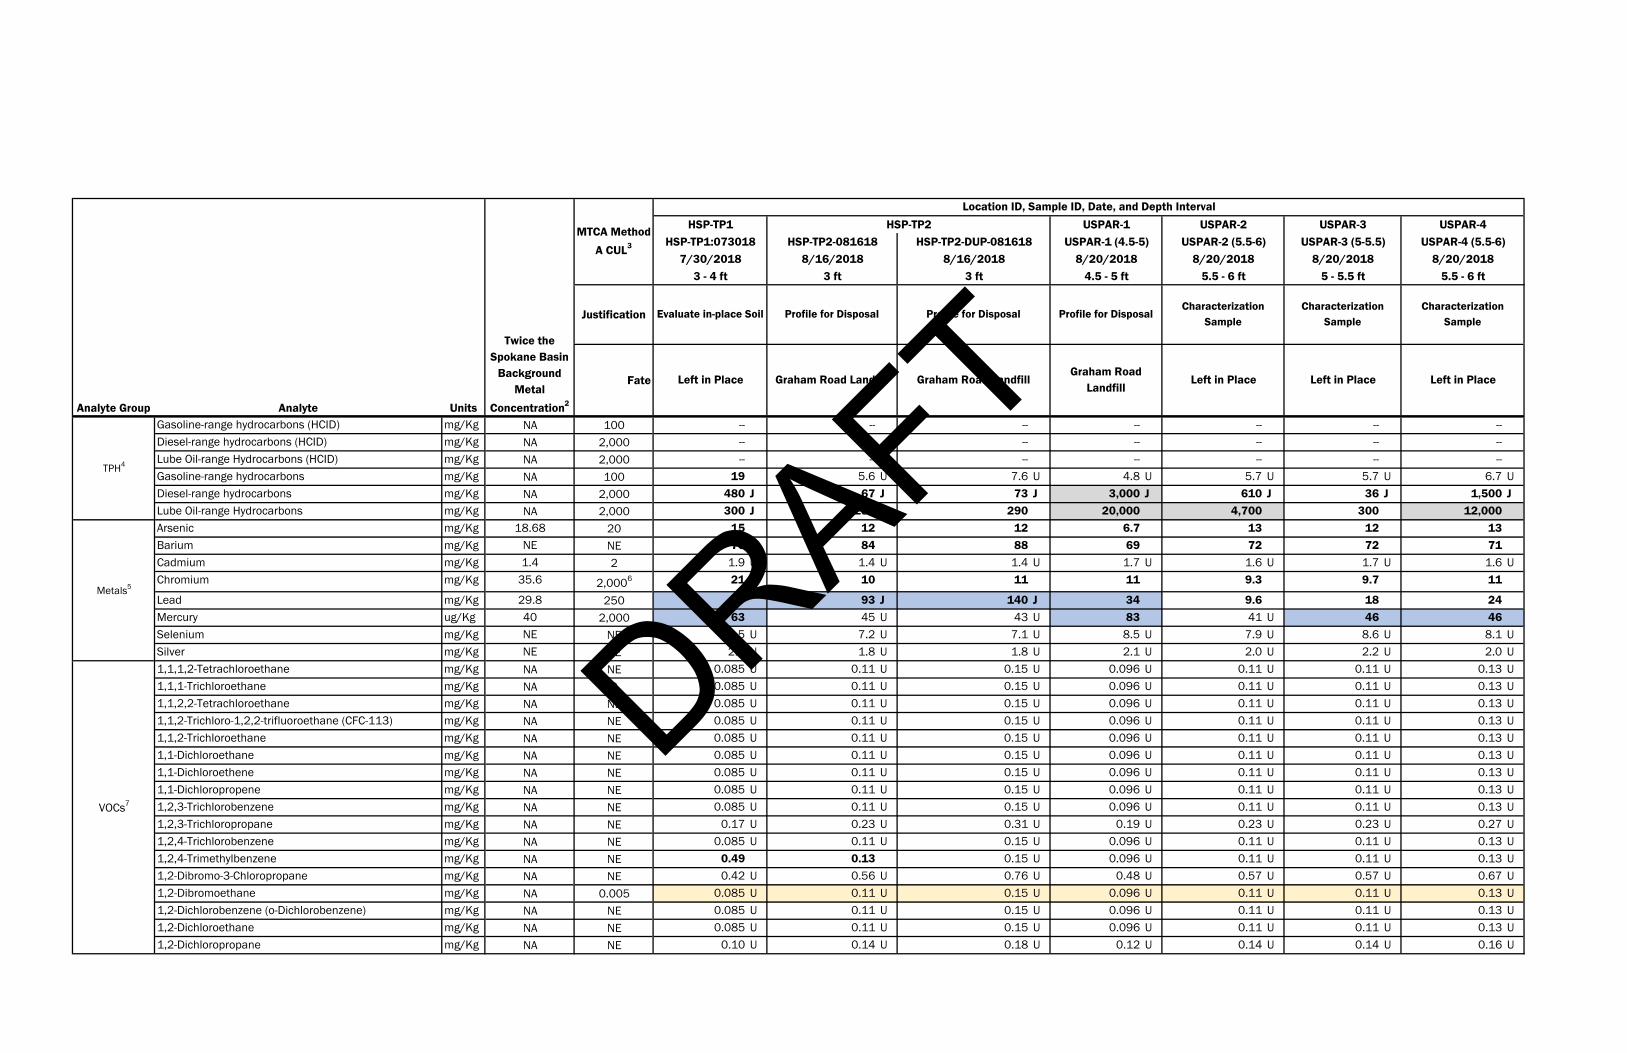
Gasoline-range hydrocarbons (HCID) mg/Kg NA 100 -- -- -- -- -- -- --Diesel-range hydrocarbons (HCID) mg/Kg NA 2,000 -- -- -- -- -- -- --Lube Oil-range Hydrocarbons (HCID) mg/Kg NA 2,000 -- -- -- -- -- -- --Gasoline-range hydrocarbons mg/Kg NA 100 19 5.6 U 7.6 U 4.8 U 5.7 U 5.7 U 6.7 UDiesel-range hydrocarbons mg/Kg NA 2,000 480 J 67 J 73 J 3,000 J 610 J 36 J 1,500 JLube Oil-range Hydrocarbons mg/Kg NA 2,000 300 J 280 290 20,000 4,700 300 12,000Arsenic mg/Kg 18.68 20 15 12 12 6.7 13 12 13Barium mg/Kg NE NE 70 84 88 69 72 72 71Cadmium mg/Kg 1.4 2 1.9 U 1.4 U 1.4 U 1.7 U 1.6 U 1.7 U 1.6 UChromium mg/Kg 35.6 2,0006 21 10 11 11 9.3 9.7 11
Lead mg/Kg 29.8 250 87 93 J 140 J 34 9.6 18 24Mercury ug/Kg 40 2,000 63 45 U 43 U 83 41 U 46 46Selenium mg/Kg NE NE 9.5 U 7.2 U 7.1 U 8.5 U 7.9 U 8.6 U 8.1 USilver mg/Kg NE NE 2.4 U 1.8 U 1.8 U 2.1 U 2.0 U 2.2 U 2.0 U1,1,1,2-Tetrachloroethane mg/Kg NA NE 0.085 U 0.11 U 0.15 U 0.096 U 0.11 U 0.11 U 0.13 U1,1,1-Trichloroethane mg/Kg NA 2 0.085 U 0.11 U 0.15 U 0.096 U 0.11 U 0.11 U 0.13 U1,1,2,2-Tetrachloroethane mg/Kg NA NE 0.085 U 0.11 U 0.15 U 0.096 U 0.11 U 0.11 U 0.13 U1,1,2-Trichloro-1,2,2-trifluoroethane (CFC-113) mg/Kg NA NE 0.085 U 0.11 U 0.15 U 0.096 U 0.11 U 0.11 U 0.13 U1,1,2-Trichloroethane mg/Kg NA NE 0.085 U 0.11 U 0.15 U 0.096 U 0.11 U 0.11 U 0.13 U1,1-Dichloroethane mg/Kg NA NE 0.085 U 0.11 U 0.15 U 0.096 U 0.11 U 0.11 U 0.13 U1,1-Dichloroethene mg/Kg NA NE 0.085 U 0.11 U 0.15 U 0.096 U 0.11 U 0.11 U 0.13 U1,1-Dichloropropene mg/Kg NA NE 0.085 U 0.11 U 0.15 U 0.096 U 0.11 U 0.11 U 0.13 U1,2,3-Trichlorobenzene mg/Kg NA NE 0.085 U 0.11 U 0.15 U 0.096 U 0.11 U 0.11 U 0.13 U1,2,3-Trichloropropane mg/Kg NA NE 0.17 U 0.23 U 0.31 U 0.19 U 0.23 U 0.23 U 0.27 U1,2,4-Trichlorobenzene mg/Kg NA NE 0.085 U 0.11 U 0.15 U 0.096 U 0.11 U 0.11 U 0.13 U1,2,4-Trimethylbenzene mg/Kg NA NE 0.49 0.13 0.15 U 0.096 U 0.11 U 0.11 U 0.13 U1,2-Dibromo-3-Chloropropane mg/Kg NA NE 0.42 U 0.56 U 0.76 U 0.48 U 0.57 U 0.57 U 0.67 U1,2-Dibromoethane mg/Kg NA 0.005 0.085 U 0.11 U 0.15 U 0.096 U 0.11 U 0.11 U 0.13 U1,2-Dichlorobenzene (o-Dichlorobenzene) mg/Kg NA NE 0.085 U 0.11 U 0.15 U 0.096 U 0.11 U 0.11 U 0.13 U1,2-Dichloroethane mg/Kg NA NE 0.085 U 0.11 U 0.15 U 0.096 U 0.11 U 0.11 U 0.13 U1,2-Dichloropropane mg/Kg NA NE 0.10 U 0.14 U 0.18 U 0.12 U 0.14 U 0.14 U 0.16 U
VOCs7
MTCA Method
A CUL3
TPH4
Metals5
Analyte Group Analyte
Location ID, Sample ID, Date, and Depth Interval
Units
Twice the Spokane Basin
Background Metal
Concentration2
Characterization Sample
Left in Place
USPAR-4 (5.5-6)8/20/2018
5.5 - 6 ft
Characterization Sample
Left in Place
USPAR-3 USPAR-4USPAR-3 (5-5.5)
8/20/20185 - 5.5 ft
Profile for Disposal
Graham Road Landfill
USPAR-2 (5.5-6)8/20/2018
5.5 - 6 ft
Characterization Sample
Left in Place
USPAR-1 USPAR-2USPAR-1 (4.5-5)
8/20/20184.5 - 5 ft
HSP-TP2-DUP-0816188/16/2018
3 ft
Profile for Disposal
Graham Road Landfill
Profile for Disposal
Graham Road Landfill
HSP-TP2-0816188/16/2018
3 ft
HSP-TP1:0730187/30/2018
3 - 4 ft
Evaluate in-place Soil
Left in Place
HSP-TP1 HSP-TP2
DRAFT
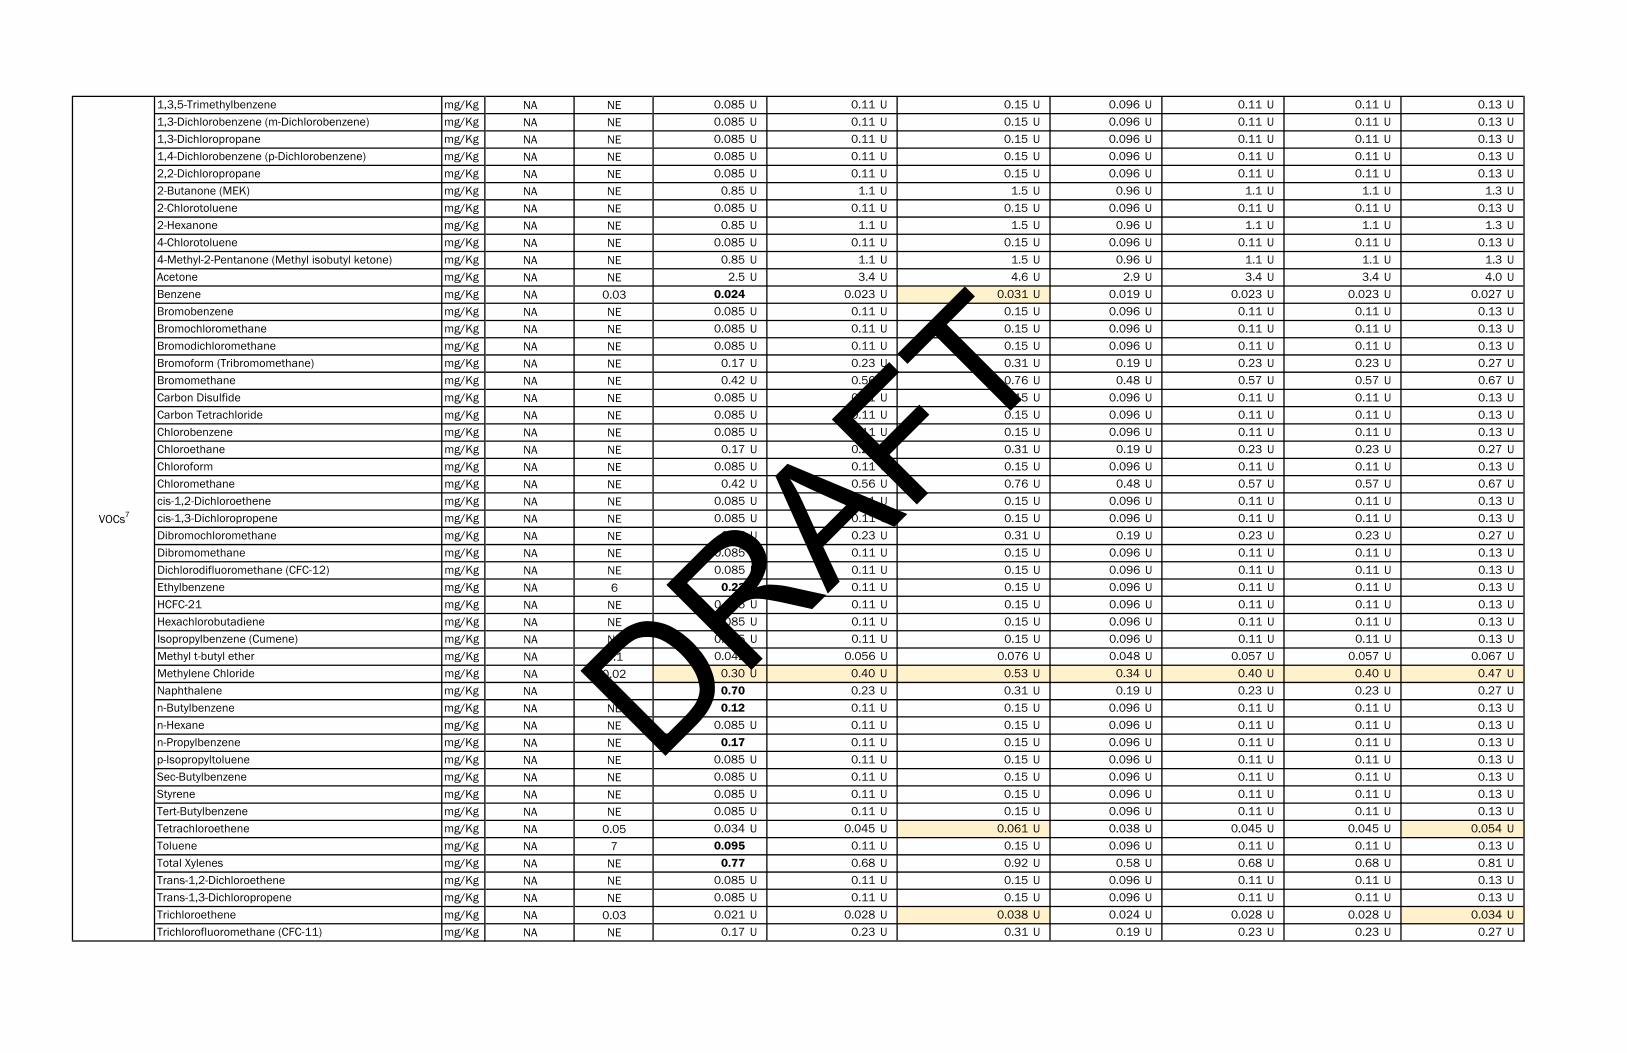
1,3,5-Trimethylbenzene mg/Kg NA NE 0.085 U 0.11 U 0.15 U 0.096 U 0.11 U 0.11 U 0.13 U1,3-Dichlorobenzene (m-Dichlorobenzene) mg/Kg NA NE 0.085 U 0.11 U 0.15 U 0.096 U 0.11 U 0.11 U 0.13 U1,3-Dichloropropane mg/Kg NA NE 0.085 U 0.11 U 0.15 U 0.096 U 0.11 U 0.11 U 0.13 U1,4-Dichlorobenzene (p-Dichlorobenzene) mg/Kg NA NE 0.085 U 0.11 U 0.15 U 0.096 U 0.11 U 0.11 U 0.13 U2,2-Dichloropropane mg/Kg NA NE 0.085 U 0.11 U 0.15 U 0.096 U 0.11 U 0.11 U 0.13 U2-Butanone (MEK) mg/Kg NA NE 0.85 U 1.1 U 1.5 U 0.96 U 1.1 U 1.1 U 1.3 U2-Chlorotoluene mg/Kg NA NE 0.085 U 0.11 U 0.15 U 0.096 U 0.11 U 0.11 U 0.13 U2-Hexanone mg/Kg NA NE 0.85 U 1.1 U 1.5 U 0.96 U 1.1 U 1.1 U 1.3 U4-Chlorotoluene mg/Kg NA NE 0.085 U 0.11 U 0.15 U 0.096 U 0.11 U 0.11 U 0.13 U4-Methyl-2-Pentanone (Methyl isobutyl ketone) mg/Kg NA NE 0.85 U 1.1 U 1.5 U 0.96 U 1.1 U 1.1 U 1.3 UAcetone mg/Kg NA NE 2.5 U 3.4 U 4.6 U 2.9 U 3.4 U 3.4 U 4.0 UBenzene mg/Kg NA 0.03 0.024 0.023 U 0.031 U 0.019 U 0.023 U 0.023 U 0.027 UBromobenzene mg/Kg NA NE 0.085 U 0.11 U 0.15 U 0.096 U 0.11 U 0.11 U 0.13 UBromochloromethane mg/Kg NA NE 0.085 U 0.11 U 0.15 U 0.096 U 0.11 U 0.11 U 0.13 UBromodichloromethane mg/Kg NA NE 0.085 U 0.11 U 0.15 U 0.096 U 0.11 U 0.11 U 0.13 UBromoform (Tribromomethane) mg/Kg NA NE 0.17 U 0.23 U 0.31 U 0.19 U 0.23 U 0.23 U 0.27 UBromomethane mg/Kg NA NE 0.42 U 0.56 U 0.76 U 0.48 U 0.57 U 0.57 U 0.67 UCarbon Disulfide mg/Kg NA NE 0.085 U 0.11 U 0.15 U 0.096 U 0.11 U 0.11 U 0.13 UCarbon Tetrachloride mg/Kg NA NE 0.085 U 0.11 U 0.15 U 0.096 U 0.11 U 0.11 U 0.13 UChlorobenzene mg/Kg NA NE 0.085 U 0.11 U 0.15 U 0.096 U 0.11 U 0.11 U 0.13 UChloroethane mg/Kg NA NE 0.17 U 0.23 U 0.31 U 0.19 U 0.23 U 0.23 U 0.27 UChloroform mg/Kg NA NE 0.085 U 0.11 U 0.15 U 0.096 U 0.11 U 0.11 U 0.13 UChloromethane mg/Kg NA NE 0.42 U 0.56 U 0.76 U 0.48 U 0.57 U 0.57 U 0.67 Ucis-1,2-Dichloroethene mg/Kg NA NE 0.085 U 0.11 U 0.15 U 0.096 U 0.11 U 0.11 U 0.13 Ucis-1,3-Dichloropropene mg/Kg NA NE 0.085 U 0.11 U 0.15 U 0.096 U 0.11 U 0.11 U 0.13 UDibromochloromethane mg/Kg NA NE 0.17 U 0.23 U 0.31 U 0.19 U 0.23 U 0.23 U 0.27 UDibromomethane mg/Kg NA NE 0.085 U 0.11 U 0.15 U 0.096 U 0.11 U 0.11 U 0.13 UDichlorodifluoromethane (CFC-12) mg/Kg NA NE 0.085 U 0.11 U 0.15 U 0.096 U 0.11 U 0.11 U 0.13 UEthylbenzene mg/Kg NA 6 0.23 0.11 U 0.15 U 0.096 U 0.11 U 0.11 U 0.13 UHCFC-21 mg/Kg NA NE 0.085 U 0.11 U 0.15 U 0.096 U 0.11 U 0.11 U 0.13 UHexachlorobutadiene mg/Kg NA NE 0.085 U 0.11 U 0.15 U 0.096 U 0.11 U 0.11 U 0.13 UIsopropylbenzene (Cumene) mg/Kg NA NE 0.085 U 0.11 U 0.15 U 0.096 U 0.11 U 0.11 U 0.13 UMethyl t-butyl ether mg/Kg NA 0.1 0.042 U 0.056 U 0.076 U 0.048 U 0.057 U 0.057 U 0.067 UMethylene Chloride mg/Kg NA 0.02 0.30 U 0.40 U 0.53 U 0.34 U 0.40 U 0.40 U 0.47 UNaphthalene mg/Kg NA 5 0.70 0.23 U 0.31 U 0.19 U 0.23 U 0.23 U 0.27 Un-Butylbenzene mg/Kg NA NE 0.12 0.11 U 0.15 U 0.096 U 0.11 U 0.11 U 0.13 Un-Hexane mg/Kg NA NE 0.085 U 0.11 U 0.15 U 0.096 U 0.11 U 0.11 U 0.13 Un-Propylbenzene mg/Kg NA NE 0.17 0.11 U 0.15 U 0.096 U 0.11 U 0.11 U 0.13 Up-Isopropyltoluene mg/Kg NA NE 0.085 U 0.11 U 0.15 U 0.096 U 0.11 U 0.11 U 0.13 USec-Butylbenzene mg/Kg NA NE 0.085 U 0.11 U 0.15 U 0.096 U 0.11 U 0.11 U 0.13 UStyrene mg/Kg NA NE 0.085 U 0.11 U 0.15 U 0.096 U 0.11 U 0.11 U 0.13 UTert-Butylbenzene mg/Kg NA NE 0.085 U 0.11 U 0.15 U 0.096 U 0.11 U 0.11 U 0.13 UTetrachloroethene mg/Kg NA 0.05 0.034 U 0.045 U 0.061 U 0.038 U 0.045 U 0.045 U 0.054 UToluene mg/Kg NA 7 0.095 0.11 U 0.15 U 0.096 U 0.11 U 0.11 U 0.13 UTotal Xylenes mg/Kg NA NE 0.77 0.68 U 0.92 U 0.58 U 0.68 U 0.68 U 0.81 UTrans-1,2-Dichloroethene mg/Kg NA NE 0.085 U 0.11 U 0.15 U 0.096 U 0.11 U 0.11 U 0.13 UTrans-1,3-Dichloropropene mg/Kg NA NE 0.085 U 0.11 U 0.15 U 0.096 U 0.11 U 0.11 U 0.13 UTrichloroethene mg/Kg NA 0.03 0.021 U 0.028 U 0.038 U 0.024 U 0.028 U 0.028 U 0.034 UTrichlorofluoromethane (CFC-11) mg/Kg NA NE 0.17 U 0.23 U 0.31 U 0.19 U 0.23 U 0.23 U 0.27 U
VOCs7
DRAFT
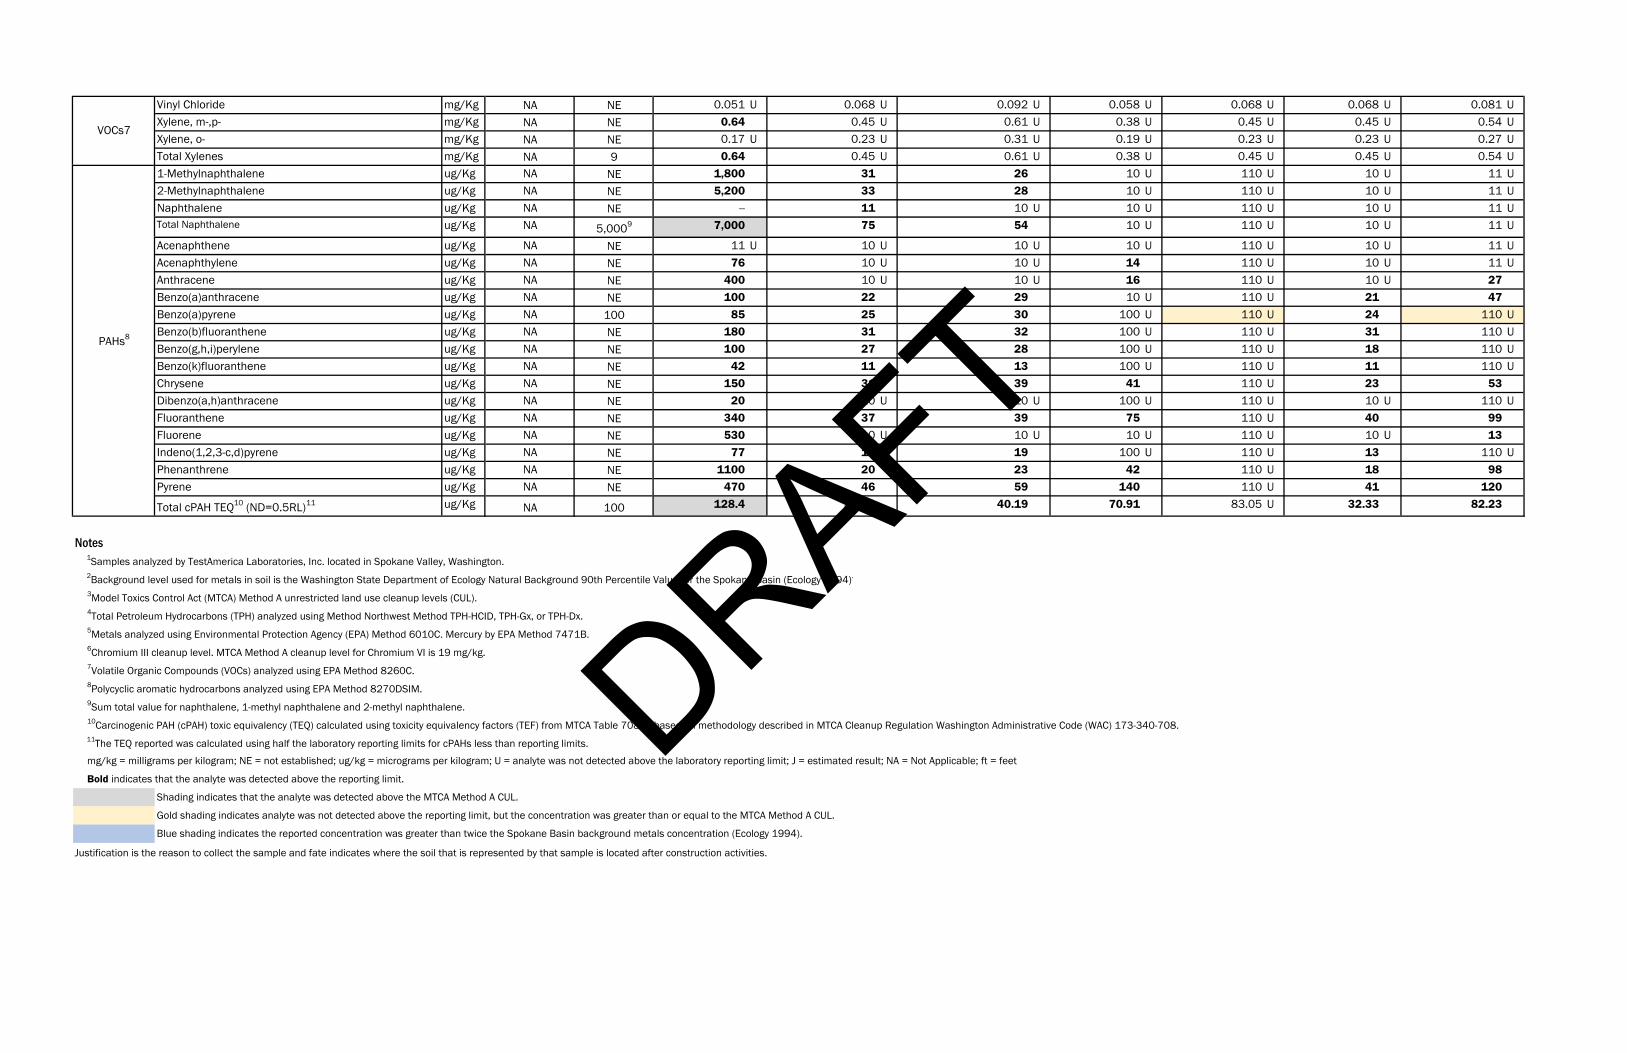
Vinyl Chloride mg/Kg NA NE 0.051 U 0.068 U 0.092 U 0.058 U 0.068 U 0.068 U 0.081 UXylene, m-,p- mg/Kg NA NE 0.64 0.45 U 0.61 U 0.38 U 0.45 U 0.45 U 0.54 UXylene, o- mg/Kg NA NE 0.17 U 0.23 U 0.31 U 0.19 U 0.23 U 0.23 U 0.27 UTotal Xylenes mg/Kg NA 9 0.64 0.45 U 0.61 U 0.38 U 0.45 U 0.45 U 0.54 U1-Methylnaphthalene ug/Kg NA NE 1,800 31 26 10 U 110 U 10 U 11 U2-Methylnaphthalene ug/Kg NA NE 5,200 33 28 10 U 110 U 10 U 11 UNaphthalene ug/Kg NA NE -- 11 10 U 10 U 110 U 10 U 11 UTotal Naphthalene ug/Kg NA 5,0009 7,000 75 54 10 U 110 U 10 U 11 U
Acenaphthene ug/Kg NA NE 11 U 10 U 10 U 10 U 110 U 10 U 11 UAcenaphthylene ug/Kg NA NE 76 10 U 10 U 14 110 U 10 U 11 UAnthracene ug/Kg NA NE 400 10 U 10 U 16 110 U 10 U 27Benzo(a)anthracene ug/Kg NA NE 100 22 29 10 U 110 U 21 47Benzo(a)pyrene ug/Kg NA 100 85 25 30 100 U 110 U 24 110 UBenzo(b)fluoranthene ug/Kg NA NE 180 31 32 100 U 110 U 31 110 UBenzo(g,h,i)perylene ug/Kg NA NE 100 27 28 100 U 110 U 18 110 UBenzo(k)fluoranthene ug/Kg NA NE 42 11 13 100 U 110 U 11 110 UChrysene ug/Kg NA NE 150 31 39 41 110 U 23 53Dibenzo(a,h)anthracene ug/Kg NA NE 20 10 U 10 U 100 U 110 U 10 U 110 UFluoranthene ug/Kg NA NE 340 37 39 75 110 U 40 99Fluorene ug/Kg NA NE 530 10 U 10 U 10 U 110 U 10 U 13Indeno(1,2,3-c,d)pyrene ug/Kg NA NE 77 18 19 100 U 110 U 13 110 UPhenanthrene ug/Kg NA NE 1100 20 23 42 110 U 18 98Pyrene ug/Kg NA NE 470 46 59 140 110 U 41 120
Total cPAH TEQ10 (ND=0.5RL)11 ug/Kg NA 100 128.4 34.01 40.19 70.91 83.05 U 32.33 82.23
Notes1Samples analyzed by TestAmerica Laboratories, Inc. located in Spokane Valley, Washington.2Background level used for metals in soil is the Washington State Department of Ecology Natural Background 90th Percentile Value for the Spokane Basin (Ecology 1994).
3Model Toxics Control Act (MTCA) Method A unrestricted land use cleanup levels (CUL).4Total Petroleum Hydrocarbons (TPH) analyzed using Method Northwest Method TPH-HCID, TPH-Gx, or TPH-Dx.5Metals analyzed using Environmental Protection Agency (EPA) Method 6010C. Mercury by EPA Method 7471B.6Chromium III cleanup level. MTCA Method A cleanup level for Chromium VI is 19 mg/kg.7Volatile Organic Compounds (VOCs) analyzed using EPA Method 8260C.8Polycyclic aromatic hydrocarbons analyzed using EPA Method 8270DSIM.9Sum total value for naphthalene, 1-methyl naphthalene and 2-methyl naphthalene.10Carcinogenic PAH (cPAH) toxic equivalency (TEQ) calculated using toxicity equivalency factors (TEF) from MTCA Table 708-2, based on methodology described in MTCA Cleanup Regulation Washington Administrative Code (WAC) 173-340-708. 11The TEQ reported was calculated using half the laboratory reporting limits for cPAHs less than reporting limits.
mg/kg = milligrams per kilogram; NE = not established; ug/kg = micrograms per kilogram; U = analyte was not detected above the laboratory reporting limit; J = estimated result; NA = Not Applicable; ft = feet
Bold indicates that the analyte was detected above the reporting limit.
Shading indicates that the analyte was detected above the MTCA Method A CUL.
Gold shading indicates analyte was not detected above the reporting limit, but the concentration was greater than or equal to the MTCA Method A CUL.
Blue shading indicates the reported concentration was greater than twice the Spokane Basin background metals concentration (Ecology 1994).
Justification is the reason to collect the sample and fate indicates where the soil that is represented by that sample is located after construction activities.
PAHs8
VOCs7
DRAFT
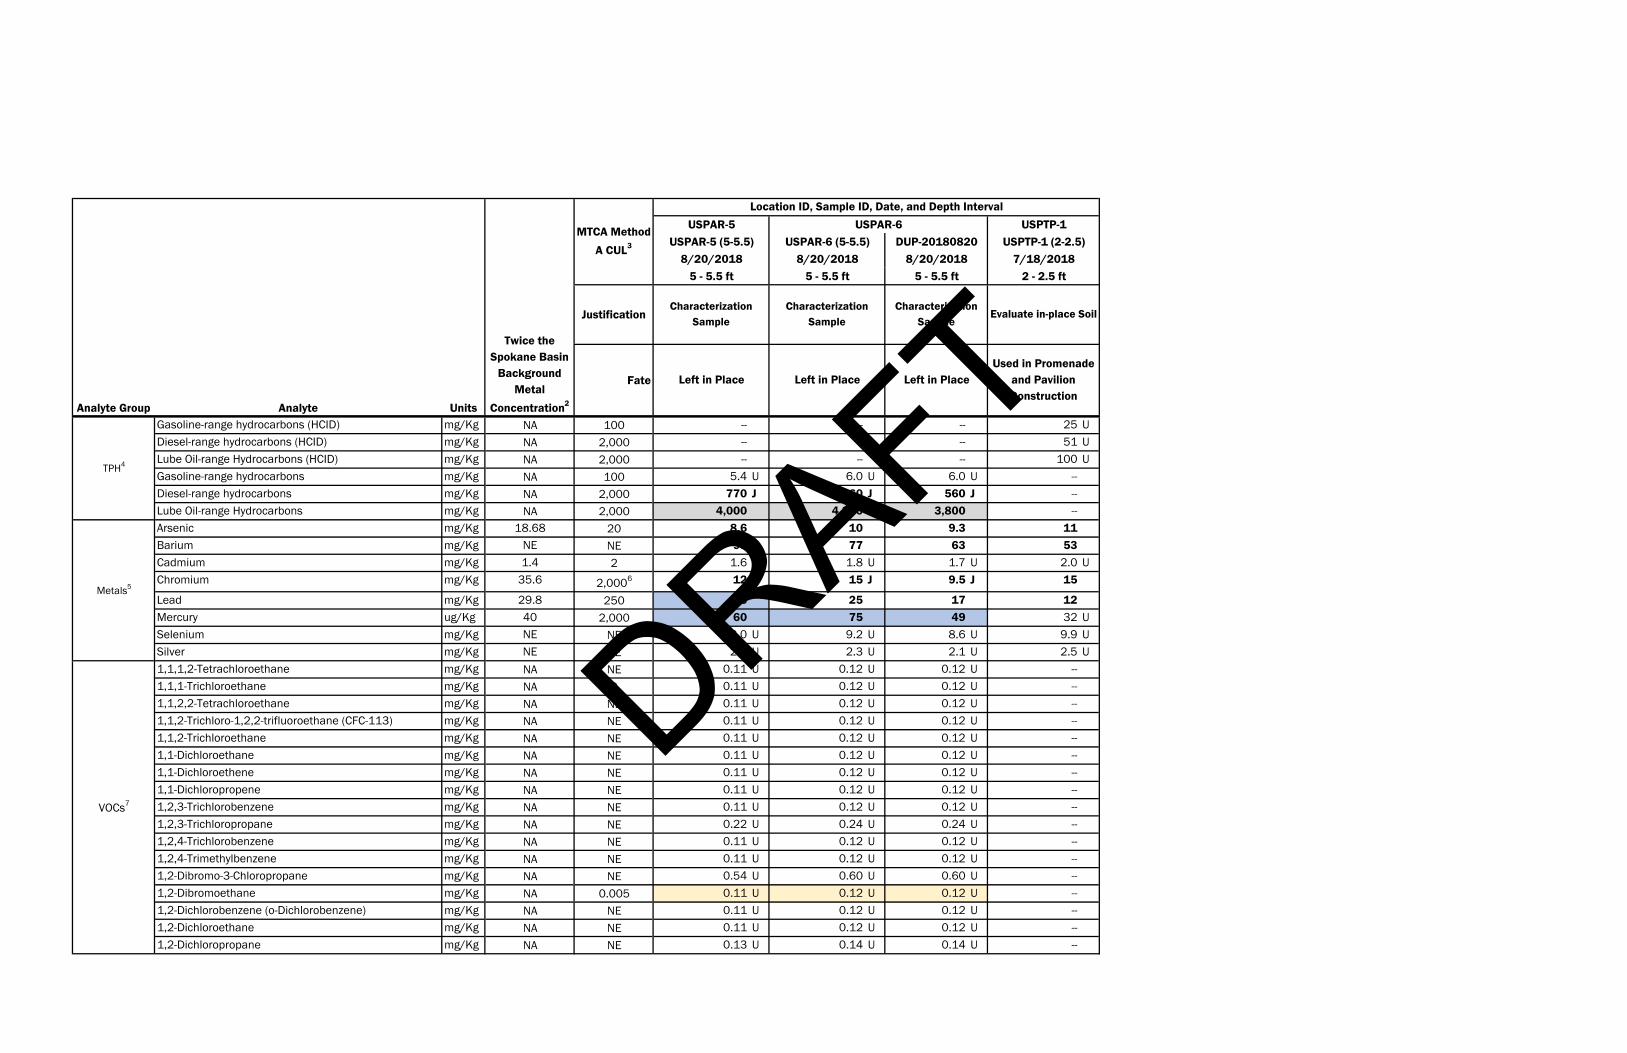
Justification
Fate
Gasoline-range hydrocarbons (HCID) mg/Kg NA 100 -- -- -- 25 UDiesel-range hydrocarbons (HCID) mg/Kg NA 2,000 -- -- -- 51 ULube Oil-range Hydrocarbons (HCID) mg/Kg NA 2,000 -- -- -- 100 UGasoline-range hydrocarbons mg/Kg NA 100 5.4 U 6.0 U 6.0 U --Diesel-range hydrocarbons mg/Kg NA 2,000 770 J 760 J 560 J --Lube Oil-range Hydrocarbons mg/Kg NA 2,000 4,000 4,300 3,800 --Arsenic mg/Kg 18.68 20 8.6 10 9.3 11Barium mg/Kg NE NE 93 77 63 53Cadmium mg/Kg 1.4 2 1.6 U 1.8 U 1.7 U 2.0 UChromium mg/Kg 35.6 2,0006 12 15 J 9.5 J 15
Lead mg/Kg 29.8 250 36 25 17 12Mercury ug/Kg 40 2,000 60 75 49 32 USelenium mg/Kg NE NE 8.0 U 9.2 U 8.6 U 9.9 USilver mg/Kg NE NE 2.0 U 2.3 U 2.1 U 2.5 U1,1,1,2-Tetrachloroethane mg/Kg NA NE 0.11 U 0.12 U 0.12 U --1,1,1-Trichloroethane mg/Kg NA 2 0.11 U 0.12 U 0.12 U --1,1,2,2-Tetrachloroethane mg/Kg NA NE 0.11 U 0.12 U 0.12 U --1,1,2-Trichloro-1,2,2-trifluoroethane (CFC-113) mg/Kg NA NE 0.11 U 0.12 U 0.12 U --1,1,2-Trichloroethane mg/Kg NA NE 0.11 U 0.12 U 0.12 U --1,1-Dichloroethane mg/Kg NA NE 0.11 U 0.12 U 0.12 U --1,1-Dichloroethene mg/Kg NA NE 0.11 U 0.12 U 0.12 U --1,1-Dichloropropene mg/Kg NA NE 0.11 U 0.12 U 0.12 U --1,2,3-Trichlorobenzene mg/Kg NA NE 0.11 U 0.12 U 0.12 U --1,2,3-Trichloropropane mg/Kg NA NE 0.22 U 0.24 U 0.24 U --1,2,4-Trichlorobenzene mg/Kg NA NE 0.11 U 0.12 U 0.12 U --1,2,4-Trimethylbenzene mg/Kg NA NE 0.11 U 0.12 U 0.12 U --1,2-Dibromo-3-Chloropropane mg/Kg NA NE 0.54 U 0.60 U 0.60 U --1,2-Dibromoethane mg/Kg NA 0.005 0.11 U 0.12 U 0.12 U --1,2-Dichlorobenzene (o-Dichlorobenzene) mg/Kg NA NE 0.11 U 0.12 U 0.12 U --1,2-Dichloroethane mg/Kg NA NE 0.11 U 0.12 U 0.12 U --1,2-Dichloropropane mg/Kg NA NE 0.13 U 0.14 U 0.14 U --
Metals5
Analyte Group Analyte Units
Twice the Spokane Basin
Background Metal
Concentration2
MTCA Method
A CUL3
TPH4
VOCs7
Evaluate in-place Soil
Used in Promenade and Pavilion Construction
Location ID, Sample ID, Date, and Depth Interval
USPAR-6 USPTP-1USPAR-6 (5-5.5)
8/20/20185 - 5.5 ft5 - 5.5 ft
USPTP-1 (2-2.5)7/18/2018
2 - 2.5 ft
Characterization Sample
Left in Place
DUP-201808208/20/2018
Characterization Sample
Left in Place
USPAR-5 (5-5.5)8/20/2018
5 - 5.5 ft
Characterization Sample
Left in Place
USPAR-5
DRAFT
1,3,5-Trimethylbenzene mg/Kg NA NE 0.11 U 0.12 U 0.12 U --1,3-Dichlorobenzene (m-Dichlorobenzene) mg/Kg NA NE 0.11 U 0.12 U 0.12 U --1,3-Dichloropropane mg/Kg NA NE 0.11 U 0.12 U 0.12 U --1,4-Dichlorobenzene (p-Dichlorobenzene) mg/Kg NA NE 0.11 U 0.12 U 0.12 U --2,2-Dichloropropane mg/Kg NA NE 0.11 U 0.12 U 0.12 U --2-Butanone (MEK) mg/Kg NA NE 1.1 U 1.2 U 1.2 U --2-Chlorotoluene mg/Kg NA NE 0.11 U 0.12 U 0.12 U --2-Hexanone mg/Kg NA NE 1.1 U 1.2 U 1.2 U --4-Chlorotoluene mg/Kg NA NE 0.11 U 0.12 U 0.12 U --4-Methyl-2-Pentanone (Methyl isobutyl ketone) mg/Kg NA NE 1.1 U 1.2 U 1.2 U --Acetone mg/Kg NA NE 3.3 U 3.6 U 3.6 U --Benzene mg/Kg NA 0.03 0.022 U 0.024 U 0.024 U --Bromobenzene mg/Kg NA NE 0.11 U 0.12 U 0.12 U --Bromochloromethane mg/Kg NA NE 0.11 U 0.12 U 0.12 U --Bromodichloromethane mg/Kg NA NE 0.11 U 0.12 U 0.12 U --Bromoform (Tribromomethane) mg/Kg NA NE 0.22 U 0.24 U 0.24 U --Bromomethane mg/Kg NA NE 0.54 U 0.60 U 0.60 U --Carbon Disulfide mg/Kg NA NE 0.11 U 0.12 U 0.12 U --Carbon Tetrachloride mg/Kg NA NE 0.11 U 0.12 U 0.12 U --Chlorobenzene mg/Kg NA NE 0.11 U 0.12 U 0.12 U --Chloroethane mg/Kg NA NE 0.22 U 0.24 U 0.24 U --Chloroform mg/Kg NA NE 0.11 U 0.12 U 0.12 U --Chloromethane mg/Kg NA NE 0.54 U 0.60 U 0.60 U --cis-1,2-Dichloroethene mg/Kg NA NE 0.11 U 0.12 U 0.12 U --cis-1,3-Dichloropropene mg/Kg NA NE 0.11 U 0.12 U 0.12 U --Dibromochloromethane mg/Kg NA NE 0.22 U 0.24 U 0.24 U --Dibromomethane mg/Kg NA NE 0.11 U 0.12 U 0.12 U --Dichlorodifluoromethane (CFC-12) mg/Kg NA NE 0.11 U 0.12 U 0.12 U --Ethylbenzene mg/Kg NA 6 0.11 U 0.12 U 0.12 U --HCFC-21 mg/Kg NA NE 0.11 U 0.12 U 0.12 U --Hexachlorobutadiene mg/Kg NA NE 0.11 U 0.12 U 0.12 U --Isopropylbenzene (Cumene) mg/Kg NA NE 0.11 U 0.12 U 0.12 U --Methyl t-butyl ether mg/Kg NA 0.1 0.054 U 0.060 U 0.060 U --Methylene Chloride mg/Kg NA 0.02 0.38 U 0.42 U 0.42 U --Naphthalene mg/Kg NA 5 0.22 U 0.24 U 0.24 U --n-Butylbenzene mg/Kg NA NE 0.11 U 0.12 U 0.12 U --n-Hexane mg/Kg NA NE 0.11 U 0.12 U 0.12 U --n-Propylbenzene mg/Kg NA NE 0.11 U 0.12 U 0.12 U --p-Isopropyltoluene mg/Kg NA NE 0.11 U 0.12 U 0.12 U --Sec-Butylbenzene mg/Kg NA NE 0.11 U 0.12 U 0.12 U --Styrene mg/Kg NA NE 0.11 U 0.12 U 0.12 U --Tert-Butylbenzene mg/Kg NA NE 0.11 U 0.12 U 0.12 U --Tetrachloroethene mg/Kg NA 0.05 0.043 U 0.048 U 0.048 U --Toluene mg/Kg NA 7 0.11 U 0.12 U 0.12 U --Total Xylenes mg/Kg NA NE 0.65 U 0.72 U 0.72 U --Trans-1,2-Dichloroethene mg/Kg NA NE 0.11 U 0.12 U 0.12 U --Trans-1,3-Dichloropropene mg/Kg NA NE 0.11 U 0.12 U 0.12 U --Trichloroethene mg/Kg NA 0.03 0.027 U 0.030 U 0.030 U --Trichlorofluoromethane (CFC-11) mg/Kg NA NE 0.22 U 0.24 U 0.24 U --
VOCs7
DRAFT
Vinyl Chloride mg/Kg NA NE 0.065 U 0.072 U 0.072 U --Xylene, m-,p- mg/Kg NA NE 0.43 U 0.48 U 0.48 U --Xylene, o- mg/Kg NA NE 0.22 U 0.24 U 0.24 U --Total Xylenes mg/Kg NA 9 0.43 U 0.48 U 0.48 U --1-Methylnaphthalene ug/Kg NA NE 11 U 10 U 11 U 9.9 U2-Methylnaphthalene ug/Kg NA NE 11 U 10 U 11 U 9.9 UNaphthalene ug/Kg NA NE 11 U 10 U 11 U 9.9 UTotal Naphthalene ug/Kg NA 5,0009 11 U 10 U 11 U 9.9 U
Acenaphthene ug/Kg NA NE 11 U 10 U 11 U 73Acenaphthylene ug/Kg NA NE 23 20 17 9.9 UAnthracene ug/Kg NA NE 15 19 18 130Benzo(a)anthracene ug/Kg NA NE 64 71 64 280Benzo(a)pyrene ug/Kg NA 100 72 100 U 110 U 290Benzo(b)fluoranthene ug/Kg NA NE 110 110 120 340Benzo(g,h,i)perylene ug/Kg NA NE 56 100 110 U 180Benzo(k)fluoranthene ug/Kg NA NE 41 100 U 110 U 140Chrysene ug/Kg NA NE 75 84 75 300Dibenzo(a,h)anthracene ug/Kg NA NE 13 100 U 110 U 46Fluoranthene ug/Kg NA NE 98 120 99 650Fluorene ug/Kg NA NE 11 U 10 U 11 U 49Indeno(1,2,3-c,d)pyrene ug/Kg NA NE 43 100 U 110 U 150Phenanthrene ug/Kg NA NE 29 54 47 390Pyrene ug/Kg NA NE 120 140 110 580
Total cPAH TEQ10 (ND=0.5RL)11 ug/Kg NA 100 99.85 83.94 90.65 388.6
Notes1Samples analyzed by TestAmerica Laboratories, Inc. located in Spokane Valley, Washington.2Background level used for metals in soil is the Washington State Department of Ecology Natural Background 90th Percentile Value for the Spokane Basin (Ecology 1994).
3Model Toxics Control Act (MTCA) Method A unrestricted land use cleanup levels (CUL).4Total Petroleum Hydrocarbons (TPH) analyzed using Method Northwest Method TPH-HCID, TPH-Gx, or TPH-Dx.5Metals analyzed using Environmental Protection Agency (EPA) Method 6010C. Mercury by EPA Method 7471B.6Chromium III cleanup level. MTCA Method A cleanup level for Chromium VI is 19 mg/kg.7Volatile Organic Compounds (VOCs) analyzed using EPA Method 8260C.8Polycyclic aromatic hydrocarbons analyzed using EPA Method 8270DSIM.9Sum total value for naphthalene, 1-methyl naphthalene and 2-methyl naphthalene.10Carcinogenic PAH (cPAH) toxic equivalency (TEQ) calculated using toxicity equivalency factors (TEF) from MTCA Table 708-2, based on methodology described in MTCA Cleanup Regulation Washington Administrative Code (WAC) 173-340-708. 11The TEQ reported was calculated using half the laboratory reporting limits for cPAHs less than reporting limits.
mg/kg = milligrams per kilogram; NE = not established; ug/kg = micrograms per kilogram; U = analyte was not detected above the laboratory reporting limit; J = estimated result; NA = Not Applicable; ft = feet
Bold indicates that the analyte was detected above the reporting limit.
Shading indicates that the analyte was detected above the MTCA Method A CUL.
Gold shading indicates analyte was not detected above the reporting limit, but the concentration was greater than or equal to the MTCA Method A CUL.
Blue shading indicates the reported concentration was greater than twice the Spokane Basin background metals concentration (Ecology 1994).
Justification is the reason to collect the sample and fate indicates where the soil that is represented by that sample is located after construction activities.
PAHs8
VOCs7
DRAFT