filter / sort - q-das
TRANSCRIPT
Filter / Sort Basic graphics - handling
Graphics 9 December 2021 Created with Version 13.0.5.1
QDas-1515 v-0.2 1 2
Information about this document
All rights, including translation into foreign languages, are reserved. It is not allowed to reproduce any part of
this document in any way without written permission of Hexagon.
Parts of this document may be automatically translated.
Document History
Version Date Author(s) Modifications / Remarks
24.10.2021 GA Initial Release
05.11.2021 GA Translation
QDas-1515 v-0.2 1 3
CONTENTS
1 Foreword .............................................................................................................................. 5
2 Filter ..................................................................................................................................... 6
2.1 Characteristic class.......................................................................................................... 6
2.2 Characteristic type ........................................................................................................... 7
2.3 Control item (characteristics) ........................................................................................... 7
2.4 Characteristic grouping .................................................................................................... 8
2.4.1 Superordinate group characteristics (top level) ...................................................... 10
2.4.2 Higher-level position tolerance characteristics (top level) ...................................... 10
2.4.3 Higher-level 3D position tolerance characteristics (top level) ................................. 11
2.4.4 Superordinate group characteristics (lower levels) ................................................ 11
2.4.5 Higher-level position tolerance characteristics (lower levels) ................................. 11
2.4.6 Higher-level 3D position tolerance characteristics (deeper levels) ......................... 12
2.4.7 Subordinate characteristics ................................................................................... 12
2.4.8 Subordinate position tolerance characteristics ....................................................... 13
2.4.9 Subordinate 3D position tolerance characteristics ................................................. 13
2.4.10 Characteristics without grouping ............................................................................ 14
2.4.11 Allow display of pure groups .................................................................................. 14
2.5 Tool wear type (trend) .................................................................................................... 16
2.6 Overall evaluation of characteristics .............................................................................. 17
2.7 Alarms ........................................................................................................................... 18
2.8 Characteristic selection .................................................................................................. 21
2.9 100% - Measurement .................................................................................................... 23
2.10 Parts info only ........................................................................................................... 24
2.11 Partial selection ......................................................................................................... 25
2.12 Type .......................................................................................................................... 27
3 Sort ..................................................................................................................................... 28
3.1 Sorting the parts ............................................................................................................ 28
3.2 Sorting the characteristics ............................................................................................. 29
3.3 Handling groups when sorting ....................................................................................... 30
3.4 Sorting according to characteristic classes .................................................................... 31
QDas-1515 v-0.2 1 4
3.5 Sorting according to capability index ............................................................................. 32
3.6 Sort single values .......................................................................................................... 33
4 Measurements Filtering / Selection of Measurements ................................................... 35
4.1 Tolerance....................................................................................................................... 36
4.2 Point rating .................................................................................................................... 38
5 Selection of measured values .......................................................................................... 39
5.1 Tolerance....................................................................................................................... 40
5.2 Events ........................................................................................................................... 40
Software documentation
QDas-1515 v-0.2 1 5
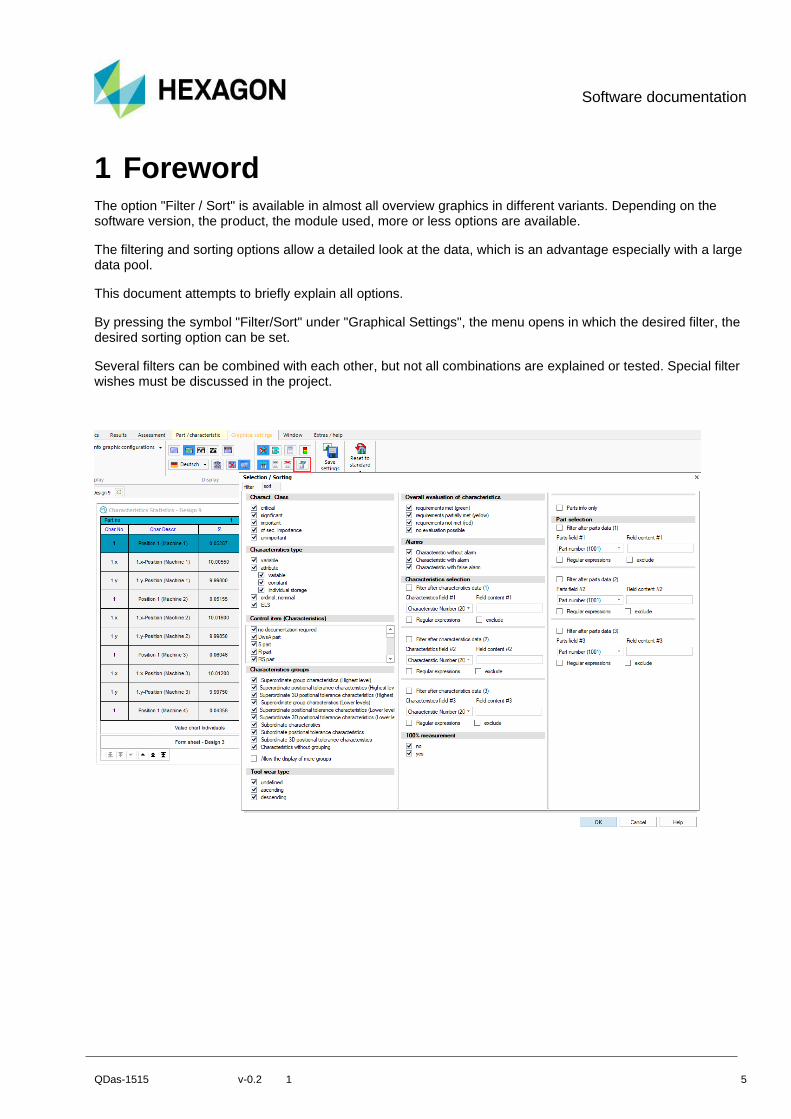
1 Foreword The option "Filter / Sort" is available in almost all overview graphics in different variants. Depending on the software version, the product, the module used, more or less options are available.
The filtering and sorting options allow a detailed look at the data, which is an advantage especially with a large data pool.
This document attempts to briefly explain all options.
By pressing the symbol "Filter/Sort" under "Graphical Settings", the menu opens in which the desired filter, the desired sorting option can be set.
Several filters can be combined with each other, but not all combinations are explained or tested. Special filter wishes must be discussed in the project.

Software documentation
QDas-1515 v-0.2 1 6
2 Filter
2.1 Characteristic class
Filtering on the characteristic class is one of the most important filters. Here, the view can be directed directly to the high characteristic classes in overview graphics.
The filter affects the K field K2005 on the characteristics mask.
Here, for characteristics 1, 2, 6 and 10 in a data set with a total of 13 characteristics, the characteristic class in the characteristic mask was set to "critical". By selecting the characteristic classes in the "Filter" window, the graphic is only displayed with the corresponding contents.
Software documentation
QDas-1515 v-0.2 1 7
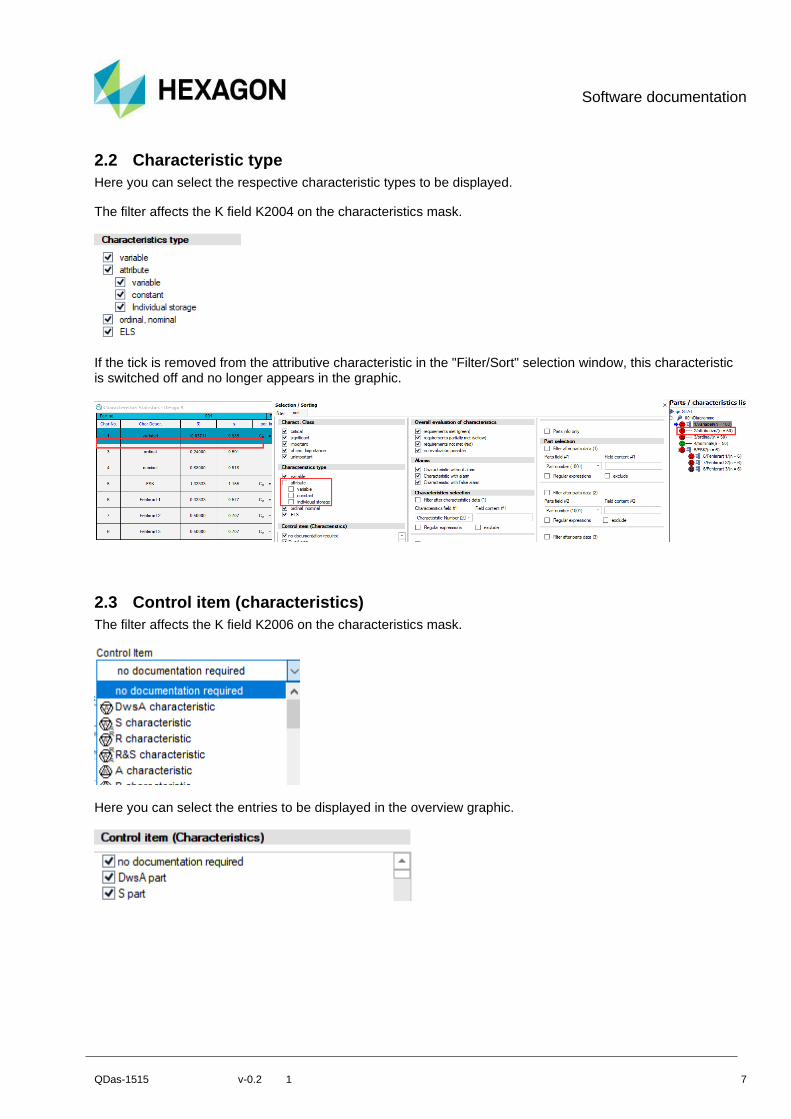
2.2 Characteristic type
Here you can select the respective characteristic types to be displayed.
The filter affects the K field K2004 on the characteristics mask.
If the tick is removed from the attributive characteristic in the "Filter/Sort" selection window, this characteristic is switched off and no longer appears in the graphic.
2.3 Control item (characteristics)
The filter affects the K field K2006 on the characteristics mask.
Here you can select the entries to be displayed in the overview graphic.
Software documentation
QDas-1515 v-0.2 1 8
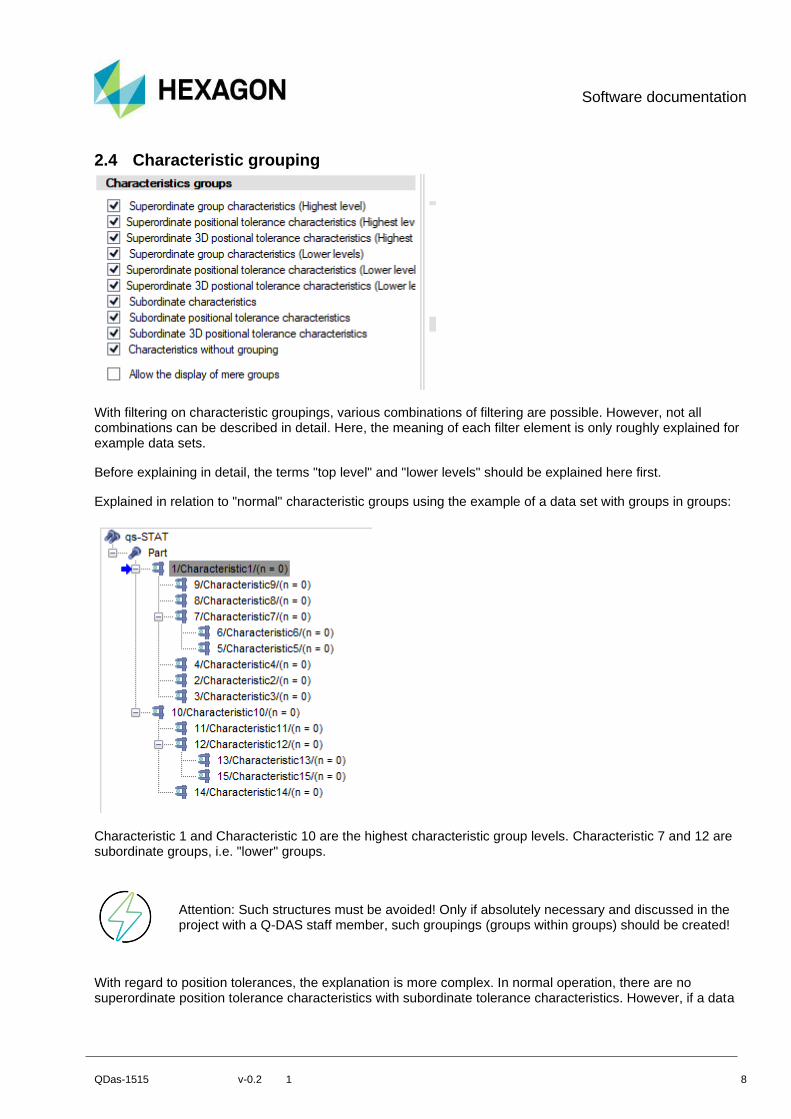
2.4 Characteristic grouping
With filtering on characteristic groupings, various combinations of filtering are possible. However, not all combinations can be described in detail. Here, the meaning of each filter element is only roughly explained for example data sets.
Before explaining in detail, the terms "top level" and "lower levels" should be explained here first.
Explained in relation to "normal" characteristic groups using the example of a data set with groups in groups:
Characteristic 1 and Characteristic 10 are the highest characteristic group levels. Characteristic 7 and 12 are subordinate groups, i.e. "lower" groups.
Attention: Such structures must be avoided! Only if absolutely necessary and discussed in the project with a Q-DAS staff member, such groupings (groups within groups) should be created!
With regard to position tolerances, the explanation is more complex. In normal operation, there are no superordinate position tolerance characteristics with subordinate tolerance characteristics. However, if a data

Software documentation
QDas-1515 v-0.2 1 9
set with position tolerances is loaded from the database, with an automatic selection according to an additional data field, together with the option "Superordinate characteristics with measured values", a virtual structure is created which, after the groups of individual position tolerances per additional data field, once again shows the entire position at the upper level. In this case there are upper and lower levels of position tolerances.
Software documentation
QDas-1515 v-0.2 1 10
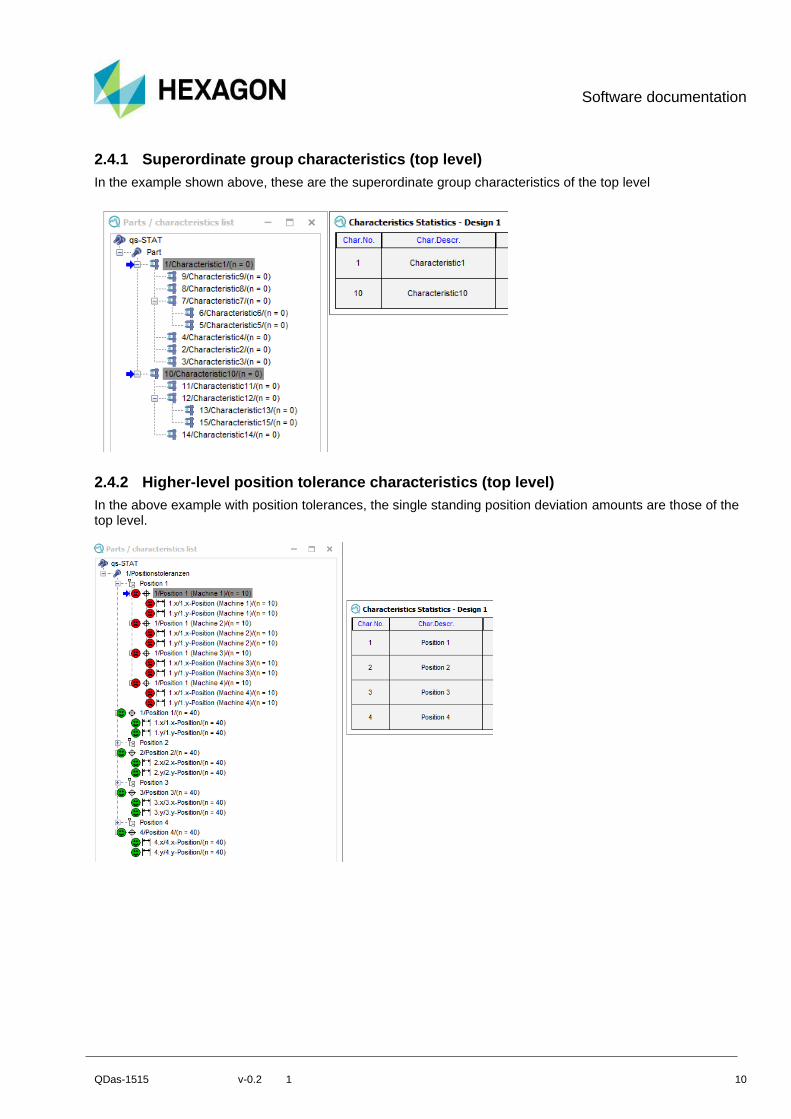
2.4.1 Superordinate group characteristics (top level)
In the example shown above, these are the superordinate group characteristics of the top level
2.4.2 Higher-level position tolerance characteristics (top level)
In the above example with position tolerances, the single standing position deviation amounts are those of the top level.
Software documentation
QDas-1515 v-0.2 1 11
2.4.3 Higher-level 3D position tolerance characteristics (top level)
The filtering of the 3D positions is analogous to the 2D positions.
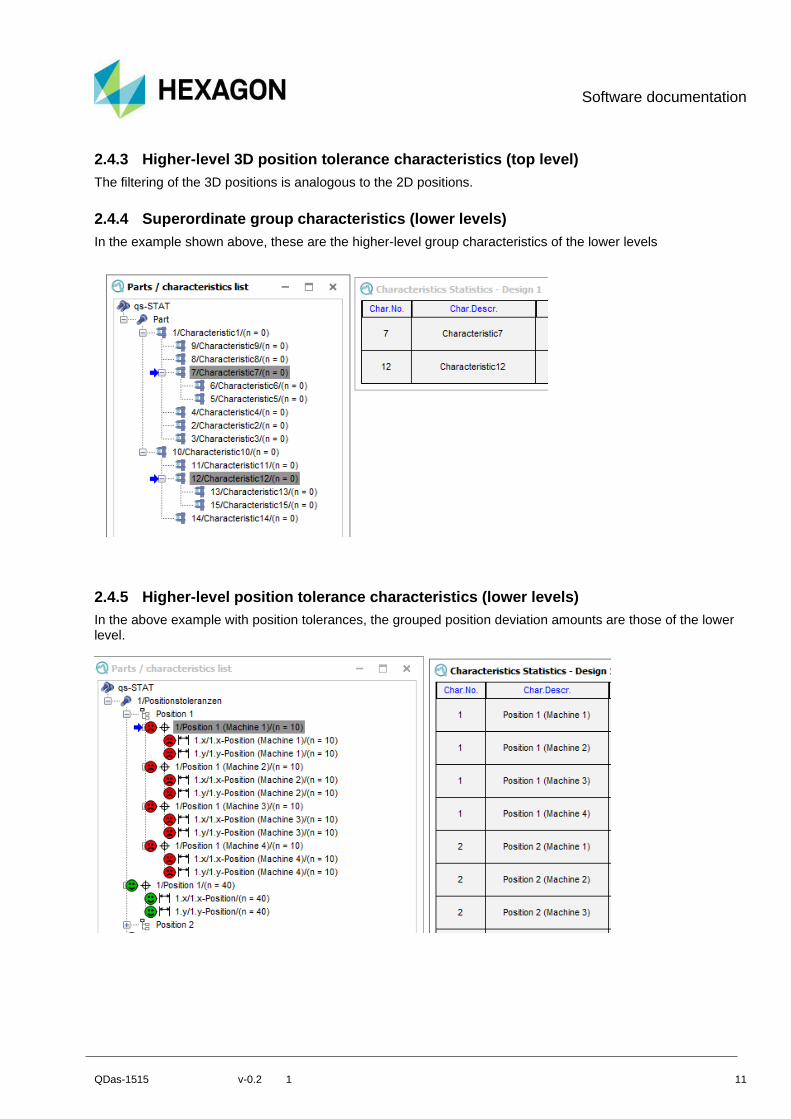
2.4.4 Superordinate group characteristics (lower levels)
In the example shown above, these are the higher-level group characteristics of the lower levels
2.4.5 Higher-level position tolerance characteristics (lower levels)
In the above example with position tolerances, the grouped position deviation amounts are those of the lower level.
Software documentation
QDas-1515 v-0.2 1 12
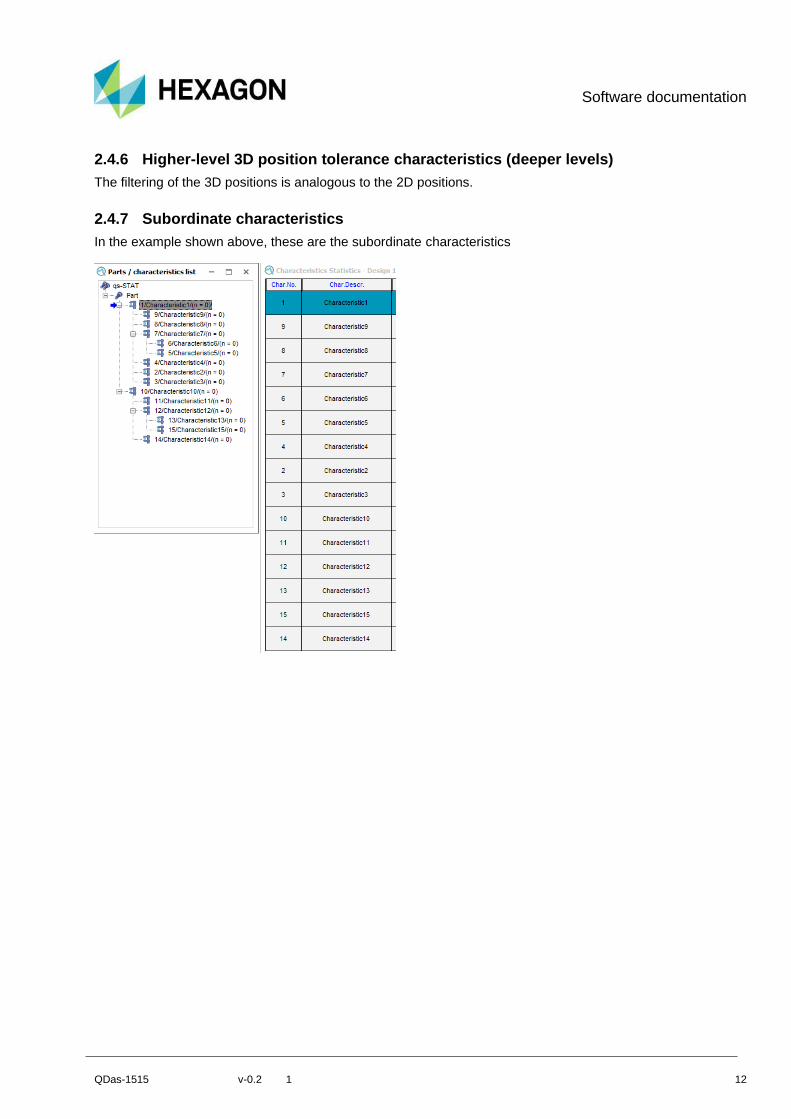
2.4.6 Higher-level 3D position tolerance characteristics (deeper levels)
The filtering of the 3D positions is analogous to the 2D positions.
2.4.7 Subordinate characteristics
In the example shown above, these are the subordinate characteristics

Software documentation
QDas-1515 v-0.2 1 13
2.4.8 Subordinate position tolerance characteristics
This addresses all axes of 2D position tolerances, regardless of whether the position deviation amount belongs to the upper or lower level.
2.4.9 Subordinate 3D position tolerance characteristics
The filtering of the 3D positions is analogous to the 2D positions.

Software documentation
QDas-1515 v-0.2 1 14
2.4.10 Characteristics without grouping
This option means all characteristics that hang directly below the part and do not have any subordinate characteristics themselves.
2.4.11 Allow display of pure groups
This option has its origin in the Long-Term Analysis module. Together with the deactivated option not to show subordinate characteristics, only the main groups of the summarised data are shown (true groups).

Software documentation
QDas-1515 v-0.2 1 15
All subordinate characteristics can then be displayed in the columns of the graphical output points:

Software documentation
QDas-1515 v-0.2 1 16
2.5 Tool wear type (trend)
The filter affects the K field K2015 on the characteristics mask.
If characteristics are trended and this is specified, the filtering can be used to filter the characteristics that have a technically conditioned trend:
Software documentation
QDas-1515 v-0.2 1 17
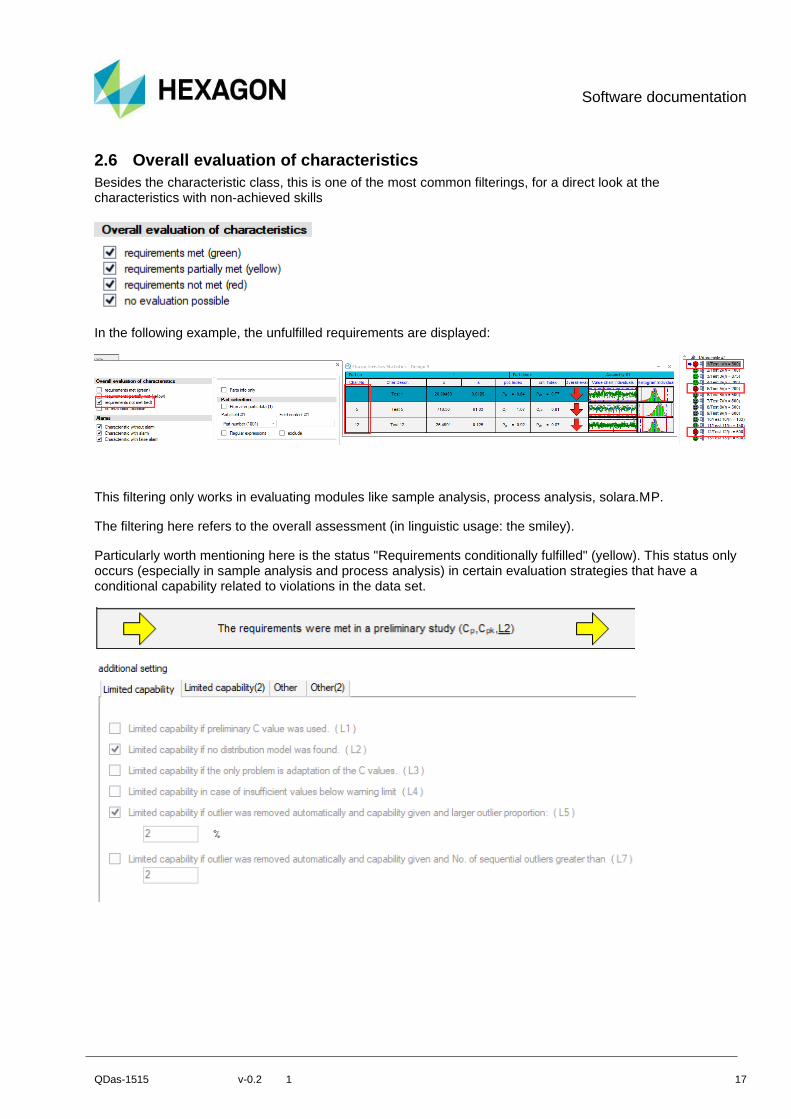
2.6 Overall evaluation of characteristics
Besides the characteristic class, this is one of the most common filterings, for a direct look at the characteristics with non-achieved skills
In the following example, the unfulfilled requirements are displayed:
This filtering only works in evaluating modules like sample analysis, process analysis, solara.MP.
The filtering here refers to the overall assessment (in linguistic usage: the smiley).
Particularly worth mentioning here is the status "Requirements conditionally fulfilled" (yellow). This status only occurs (especially in sample analysis and process analysis) in certain evaluation strategies that have a conditional capability related to violations in the data set.
Software documentation
QDas-1515 v-0.2 1 18
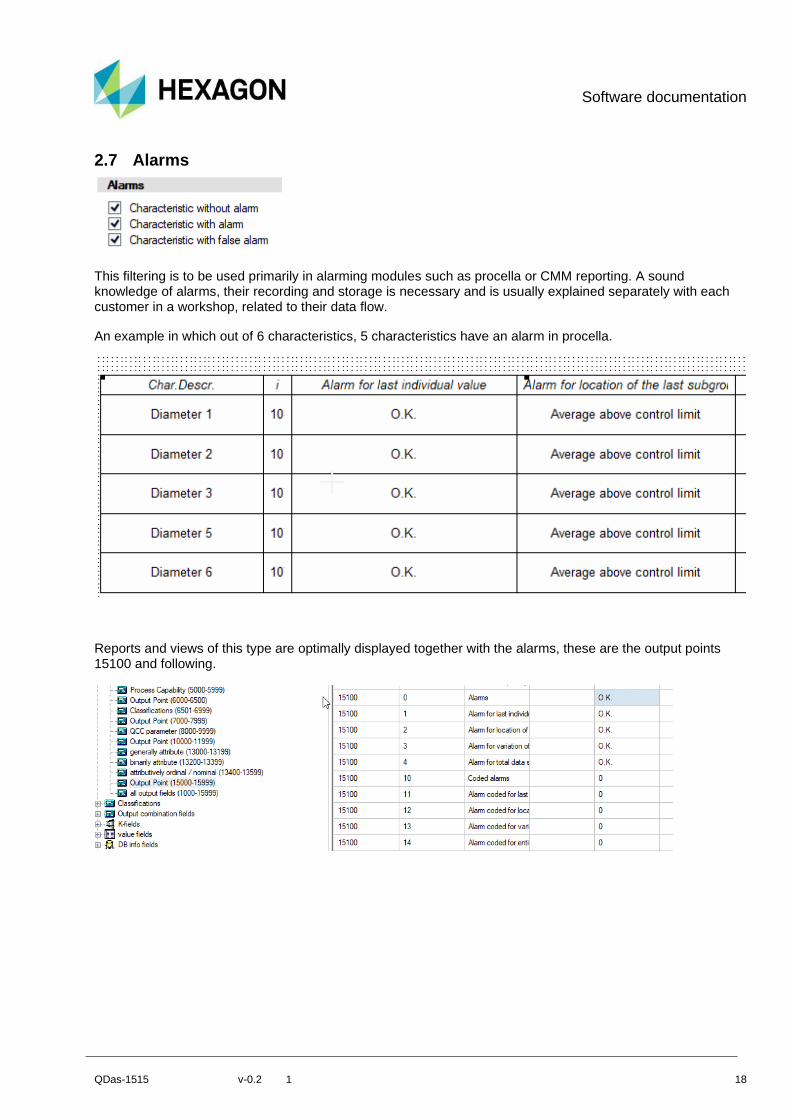
2.7 Alarms
This filtering is to be used primarily in alarming modules such as procella or CMM reporting. A sound knowledge of alarms, their recording and storage is necessary and is usually explained separately with each customer in a workshop, related to their data flow.
An example in which out of 6 characteristics, 5 characteristics have an alarm in procella.
Reports and views of this type are optimally displayed together with the alarms, these are the output points 15100 and following.

Software documentation
QDas-1515 v-0.2 1 19
Characteristics with false alarm
If the value / alarm type cannot be checked as "OK", this is considered a false alarm.
As an example from the process analysis: "Requirements" is activated as an alarm for the evaluation, a characteristic cannot be evaluated due to too few measured values.
When filtering "with false alarms", this characteristic is also shown.
This is suppressed when filtering without false alarms:

Software documentation
QDas-1515 v-0.2 1 20
Software documentation
QDas-1515 v-0.2 1 21
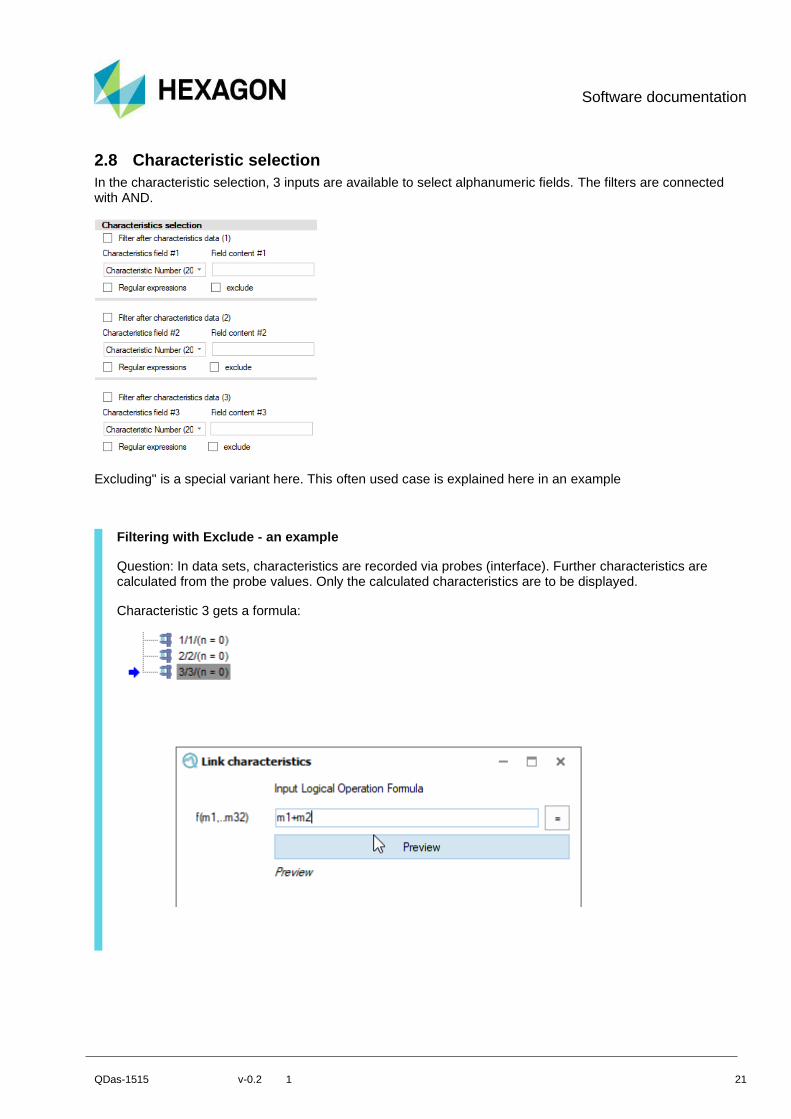
2.8 Characteristic selection
In the characteristic selection, 3 inputs are available to select alphanumeric fields. The filters are connected with AND.
Excluding" is a special variant here. This often used case is explained here in an example
Filtering with Exclude - an example
Question: In data sets, characteristics are recorded via probes (interface). Further characteristics are calculated from the probe values. Only the calculated characteristics are to be displayed.
Characteristic 3 gets a formula:
Software documentation
QDas-1515 v-0.2 1 22
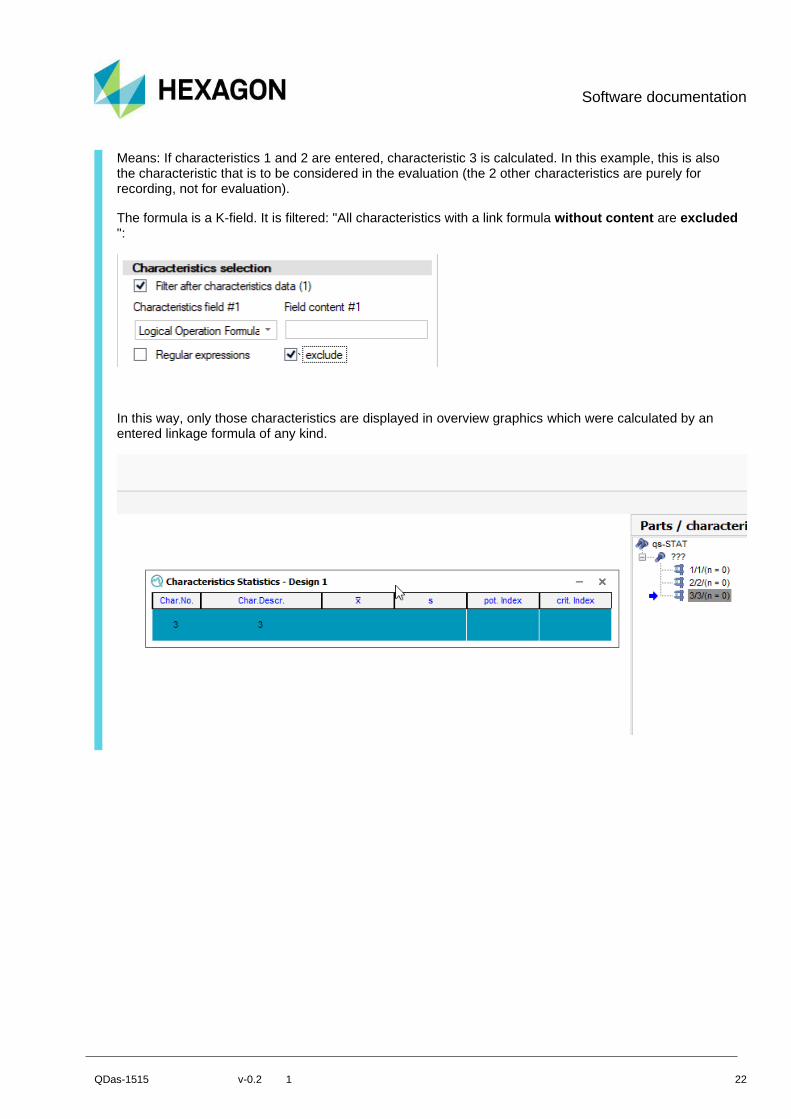
Means: If characteristics 1 and 2 are entered, characteristic 3 is calculated. In this example, this is also the characteristic that is to be considered in the evaluation (the 2 other characteristics are purely for recording, not for evaluation).
The formula is a K-field. It is filtered: "All characteristics with a link formula without content are excluded ":
In this way, only those characteristics are displayed in overview graphics which were calculated by an entered linkage formula of any kind.

Software documentation
QDas-1515 v-0.2 1 23
2.9 100% - Measurement
The filter affects the K field K2016 on the characteristics mask.

Software documentation
QDas-1515 v-0.2 1 24
2.10 Parts info only
If the option "only part info" is set, the heading is automatically active when the part type is changed, as this is then the only line per part.
Apply Filter - Example
The graphic "Characteristic values parts" is structured in such a way that the part heading line only contains part evaluation information. No characteristics are shown.
Software documentation
QDas-1515 v-0.2 1 25
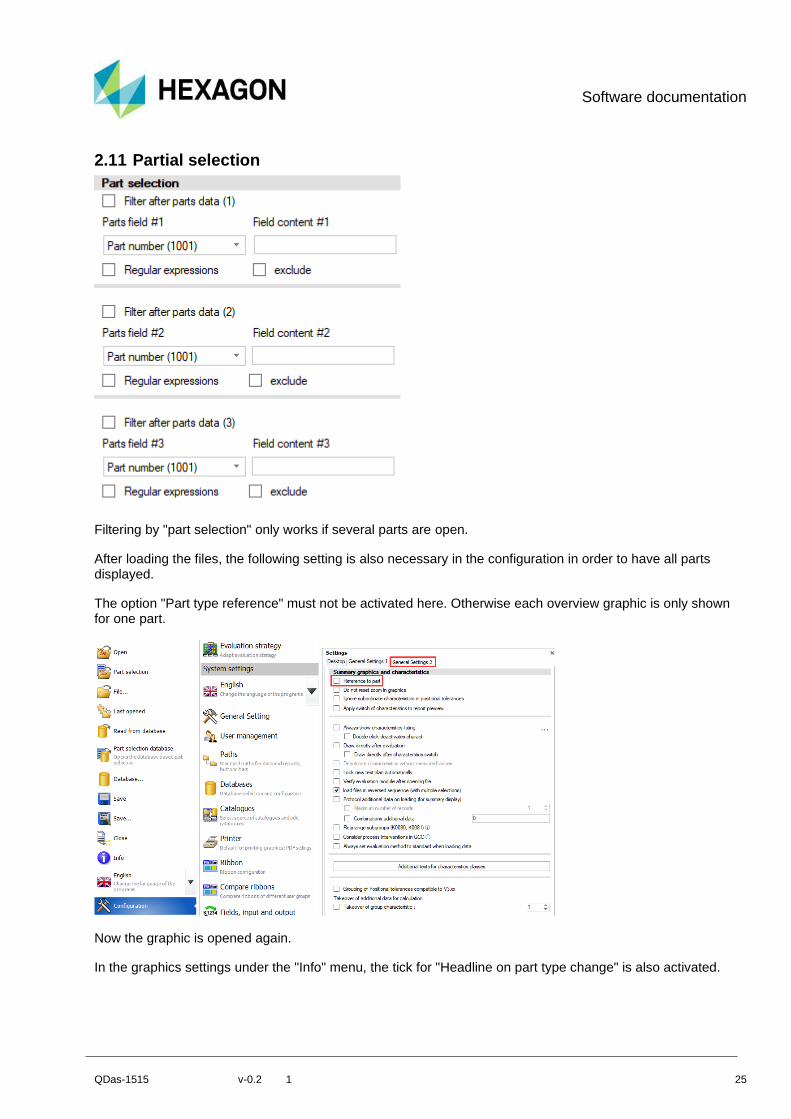
2.11 Partial selection
Filtering by "part selection" only works if several parts are open.
After loading the files, the following setting is also necessary in the configuration in order to have all parts displayed.
The option "Part type reference" must not be activated here. Otherwise each overview graphic is only shown for one part.
Now the graphic is opened again.
In the graphics settings under the "Info" menu, the tick for "Headline on part type change" is also activated.

Software documentation
QDas-1515 v-0.2 1 26
Now the filtering can take place after the corresponding part.
In this example, K-field 1002 was applied.
This is also case sensitive.
This filtering is useful if there are several parts and these are also displayed at the same time.
Software documentation
QDas-1515 v-0.2 1 27
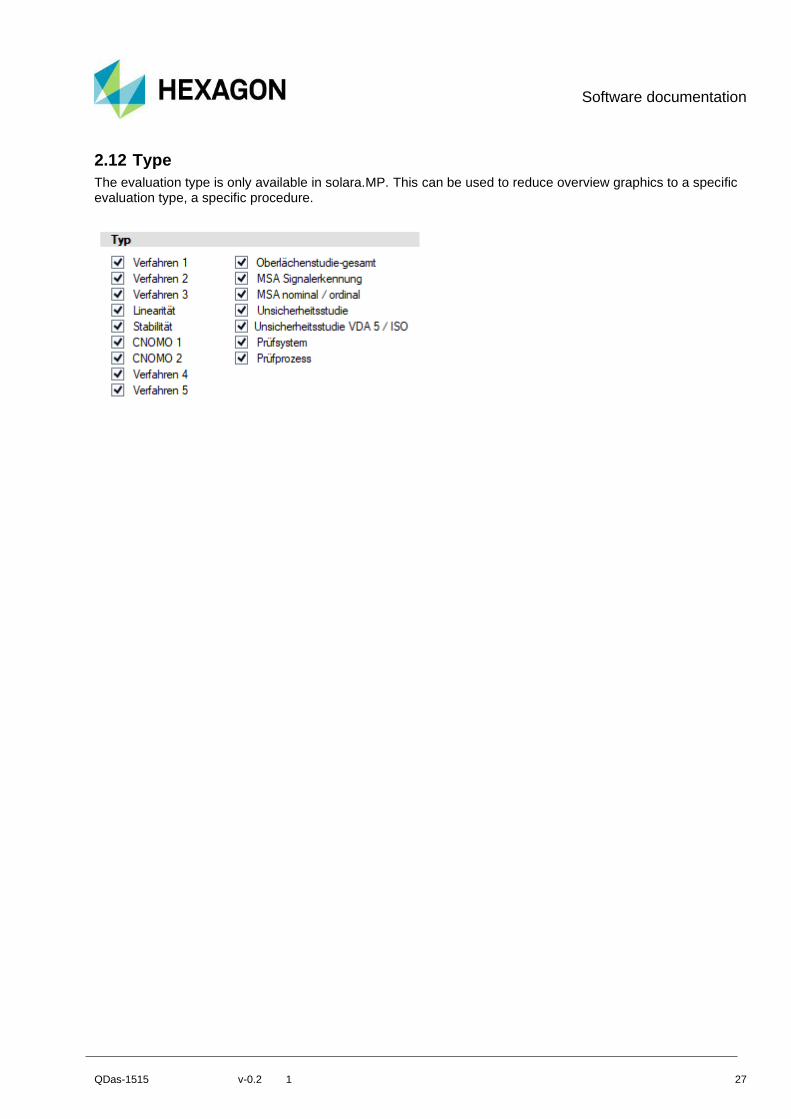
2.12 Type
The evaluation type is only available in solara.MP. This can be used to reduce overview graphics to a specific evaluation type, a specific procedure.

Software documentation
QDas-1515 v-0.2 1 28
3 Sort
3.1 Sorting the parts
The sorting of the parts can be designed according to requirements.
Ascending or descending
Here, the K field is sorted in ascending or descending order.
The selection of the desired field is done via the output list.
Unsorted
With the setting "unsorted", the graphic is loaded in the same way as the "parts characteristics list".

Software documentation
QDas-1515 v-0.2 1 29
3.2 Sorting the characteristics
The sorting of the characteristics can be done here according to different aspects.
Ascending or descending
Here, the K field is sorted in ascending or descending order.
The selection of the desired field is done analogously to the sorting of the parts via the output list.
Sort by further field
In addition, you can sort by another field within the characteristics.

Software documentation
QDas-1515 v-0.2 1 30
3.3 Handling groups when sorting
This option was created especially for position tolerances. When sorting by "highest tolerance utilisation upwards", you can see from this example that the position tolerances are no longer displayed coherently due to their different tolerance utilisation.
If, on the other hand, the option is set, then these groups are retained. The highest tolerance utilisation, one of the characteristics of the group, defines the position within the sorted order.
Software documentation
QDas-1515 v-0.2 1 31
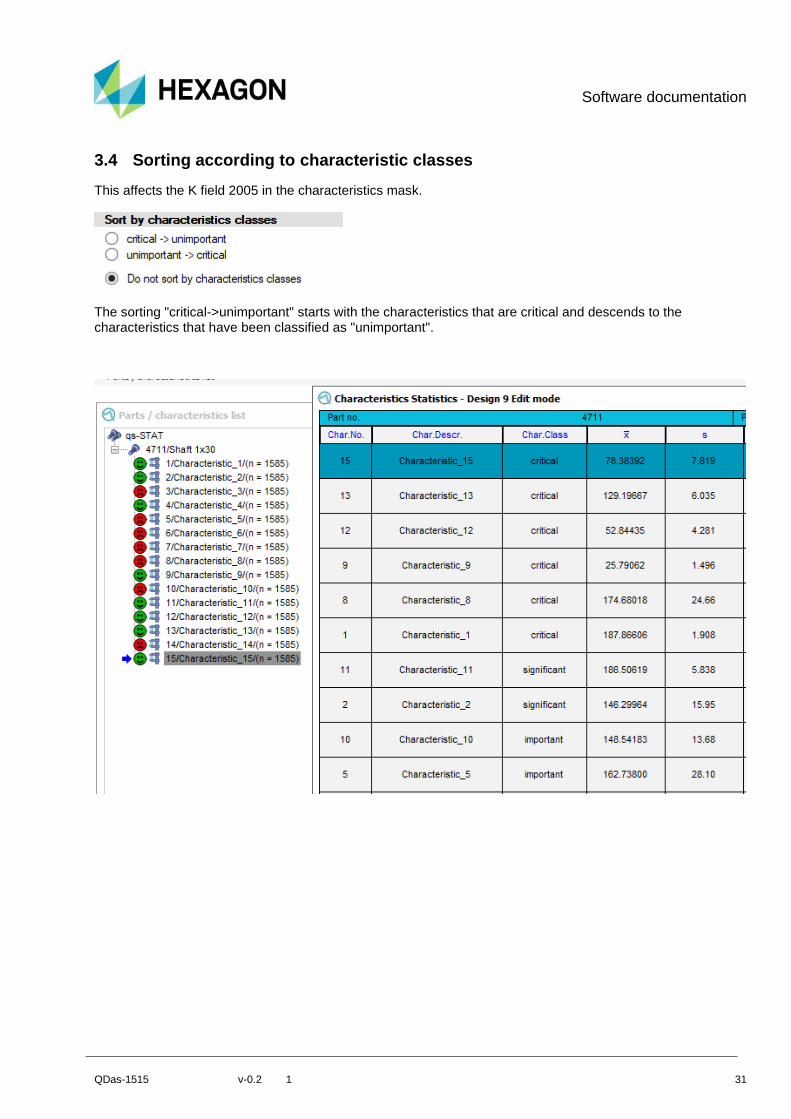
3.4 Sorting according to characteristic classes
This affects the K field 2005 in the characteristics mask.
The sorting "critical->unimportant" starts with the characteristics that are critical and descends to the characteristics that have been classified as "unimportant".
Software documentation
QDas-1515 v-0.2 1 32
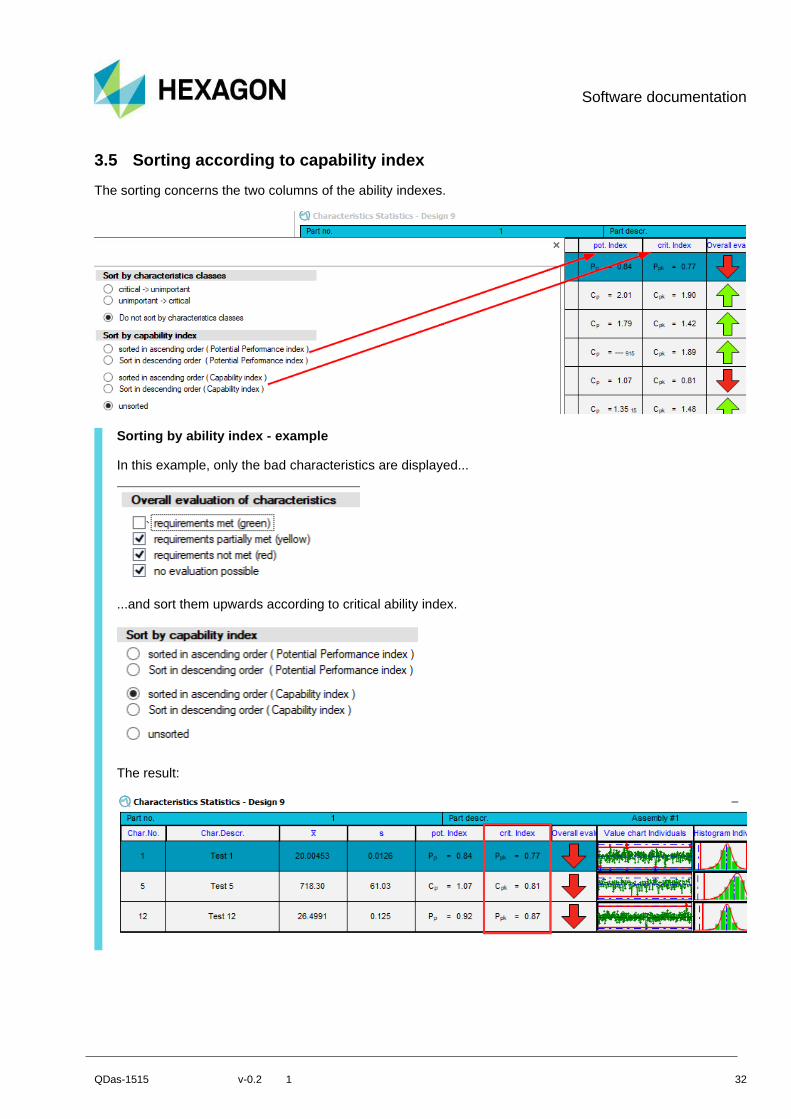
3.5 Sorting according to capability index
The sorting concerns the two columns of the ability indexes.
Sorting by ability index - example
In this example, only the bad characteristics are displayed...
...and sort them upwards according to critical ability index.
The result:

Software documentation
QDas-1515 v-0.2 1 33
3.6 Sort single values
This option is only available in the parts protocol. (Single values all characteristics)
Sorting ascending / descending (last value)
Makes sense if only the "last value" is displayed in the graph. The buttons for changing to other measurements disappear as a result.
Software documentation
QDas-1515 v-0.2 1 34
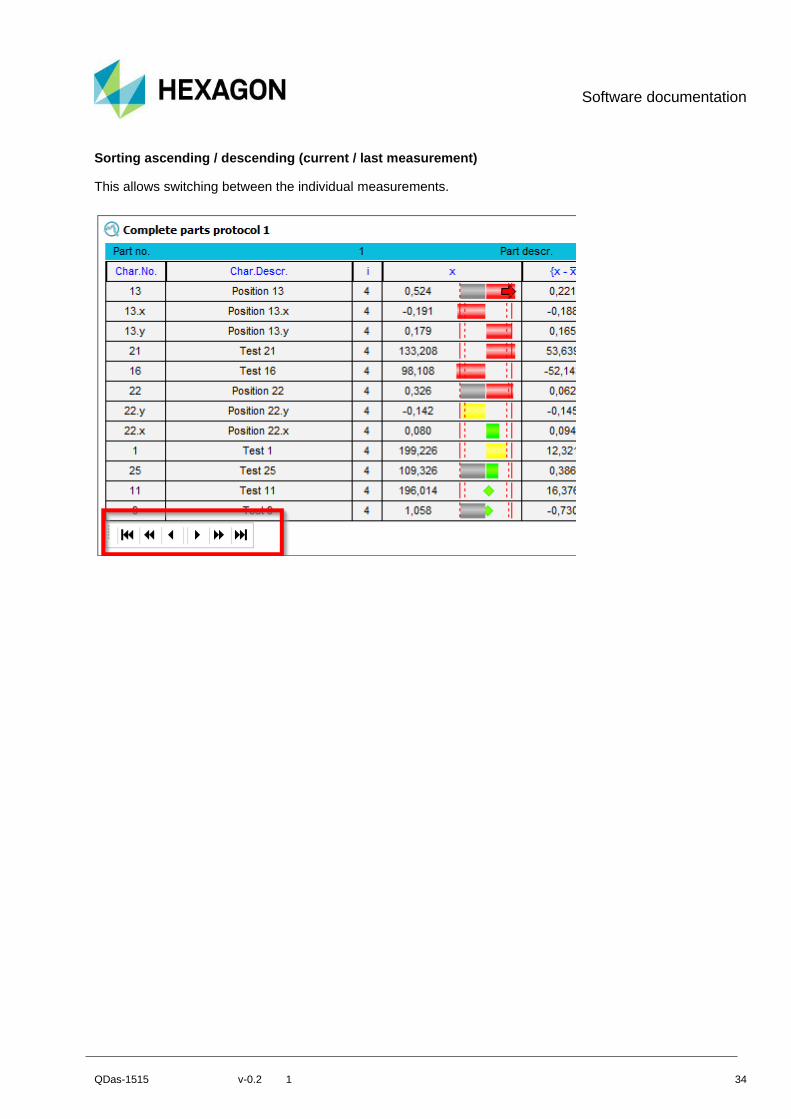
Sorting ascending / descending (current / last measurement)
This allows switching between the individual measurements.
Software documentation
QDas-1515 v-0.2 1 35
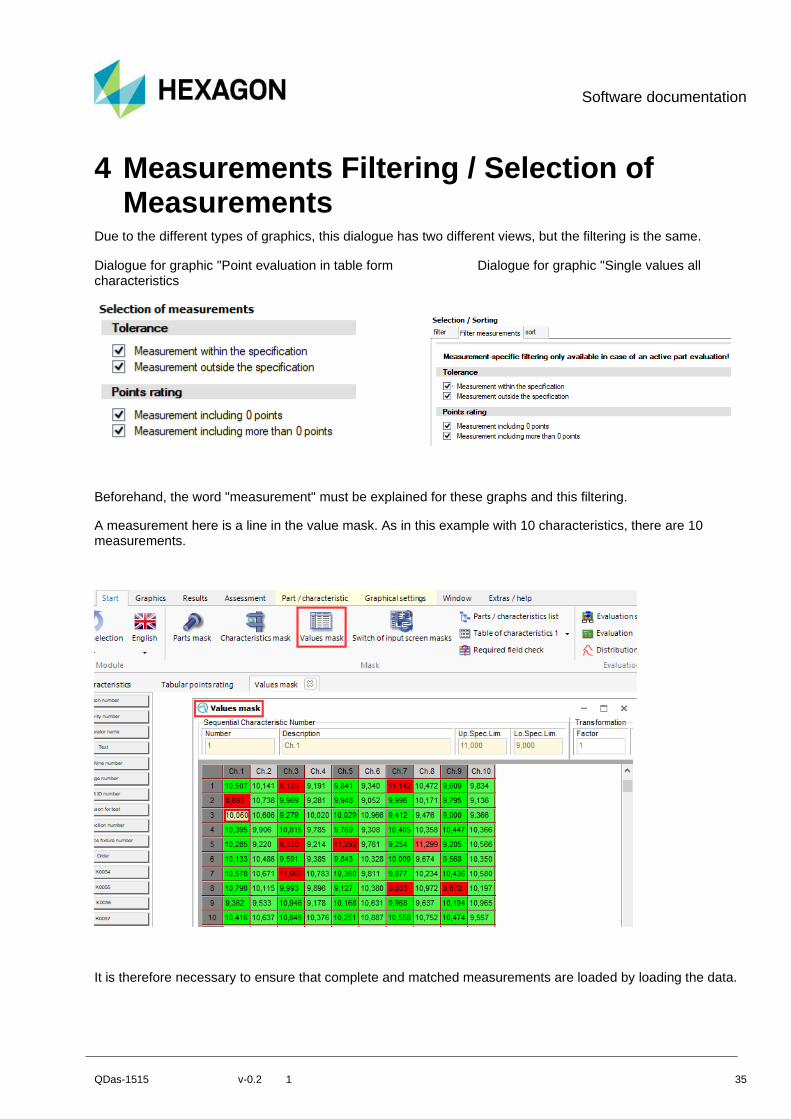
4 Measurements Filtering / Selection of Measurements
Due to the different types of graphics, this dialogue has two different views, but the filtering is the same.
Dialogue for graphic "Point evaluation in table form Dialogue for graphic "Single values all characteristics
Beforehand, the word "measurement" must be explained for these graphs and this filtering.
A measurement here is a line in the value mask. As in this example with 10 characteristics, there are 10 measurements.
It is therefore necessary to ensure that complete and matched measurements are loaded by loading the data.

Software documentation
QDas-1515 v-0.2 1 36
Furthermore, any assessment by measurements only happens if this option is active in the strategy:
Therefore, this option is the only one that can be temporarily activated without having to change the strategy.
4.1 Tolerance
With the example above:
The filter Measurements out of tolerance.

Software documentation
QDas-1515 v-0.2 1 37
Software documentation
QDas-1515 v-0.2 1 38
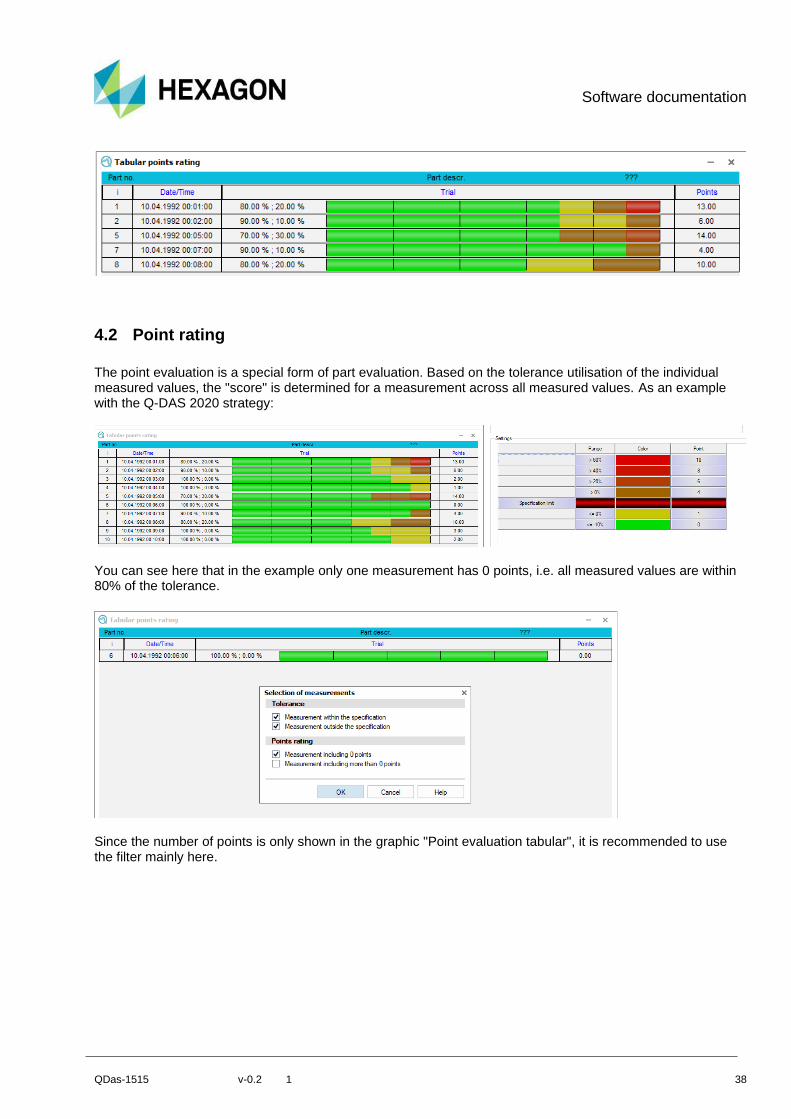
4.2 Point rating
The point evaluation is a special form of part evaluation. Based on the tolerance utilisation of the individual measured values, the "score" is determined for a measurement across all measured values. As an example with the Q-DAS 2020 strategy:
You can see here that in the example only one measurement has 0 points, i.e. all measured values are within 80% of the tolerance.
Since the number of points is only shown in the graphic "Point evaluation tabular", it is recommended to use the filter mainly here.

Software documentation
QDas-1515 v-0.2 1 39
5 Selection of measured values This chapter explains how to select according to the individual measured values.
The selection can be made here either according to the measured values lying within the tolerance or according to whether the values lie outside the tolerance.
Or the measured values are displayed that contain an event or do not contain an event.
The selection cannot be combined. Only one of the two options can be chosen....
Software documentation
QDas-1515 v-0.2 1 40
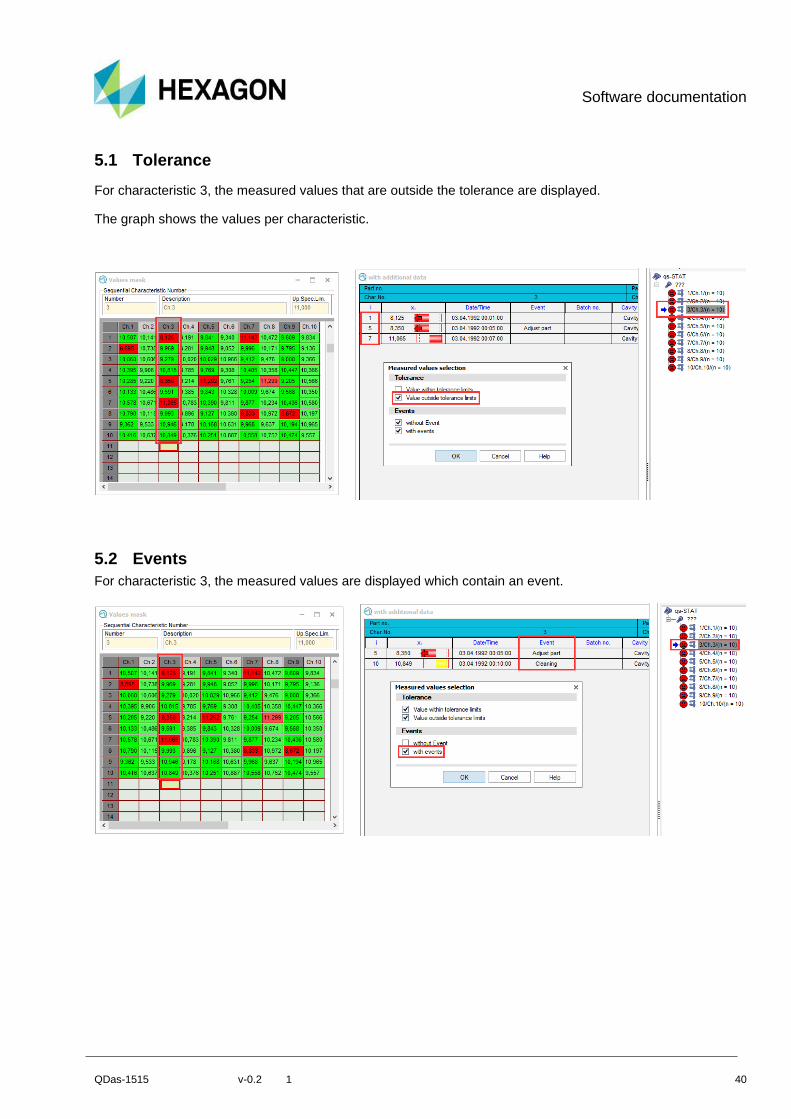
5.1 Tolerance
For characteristic 3, the measured values that are outside the tolerance are displayed.
The graph shows the values per characteristic.
5.2 Events
For characteristic 3, the measured values are displayed which contain an event.