fiber optic #ow and cure sensing for liquid composite molding
TRANSCRIPT
*Corresponding author. Tel.: 001-301-975-6841; fax: 001-301-975-3928.E-mail address: [email protected] (J.P. Dunkers).
Optics and Lasers in Engineering 35 (2001) 91}104
Fiber optic #ow and cure sensing for liquidcomposite molding
Joy P. Dunkers��*, Joseph L. Lenhart�, Sylvia R. Kueh�,John H. van Zanten�, Suresh G. Advani�, Richard S. Parnas��Polymer Composites Group, National Institute of Standards and Technology, Gaithersburg, MD, USA
�Department of Chemical Engineering, Johns Hopkins University, Baltimore, MD, USA�Department of Mechanical Engineering, University of Delaware, Newark, DE, USA
�Department of Chemical Engineering, North Carolina State University, Raleigh, NC, USA
Received 3 November 2000; accepted 8 December 2000
Abstract
The Polymer Composites group at the National Institute of Standards and Technology hase!orts in both on-line #ow and cure sensing for liquid composite molding. For our #owprogram, a novel "ber optic real-time sensor system has been developed that can sense resin atvarious locations on a single "ber using long-period gratings and a polychromatic source. Thesensor operation and characterization will be discussed along with sensor performance duringmold "lling with various types of reinforcement. The cure sensing program focuses on theinterface-sensitive #uorescence response of a dye molecule grafted to a high-index glass "ber.The #uorescence emission of the #uorophore undergoes a blue shift as the resin cures. The#uorescence sensor is made by grafting a silane functional #uorophore onto the surface of theglass with close attention to layer thickness. Fluorescence emission of the grafted #uorophore"lm is shown to be sensitive to epoxy resin cure, co-silane, and layer thickness. The response ofthe grafted #uorophore to cure on a high-index "ber is demonstrated. Published by ElsevierScience Ltd.
Keywords: Sensor; Flow; Long-period gratings; Cure; Fluorescence; Fiber optic; Liquid composite molding
1. Introduction
The major advantages of polymer matrix composite products include a highstrength-to-weight ratio, corrosion resistance, and thermal and electrical insulating
0143-8166/01/$ - see front matter Published by Elsevier Science Ltd.PII: S 0 1 4 3 - 8 1 6 6 ( 0 0 ) 0 0 1 1 0 - X

properties. However, the cost of polymer matrix composites must be reduced forcomposites to be competitive against traditional materials such as wood and metal inconsumer markets. One strategy is to decrease the cost of manufacturing the com-posite through process optimization and reduction of scrap. The introduction of "beroptic sensors into the liquid composite molding (LCM) process for #ow and curemonitoring provides a non-invasive means of obtaining real time information onmold "lling and resin cure for control decisions.
In LCM, the "ber preforms are placed in a steel mold, which is then closed. Resin isinjected to saturate the empty pores in the preforms. However, under these typicalmanufacturing circumstances, it is di$cult to detect if the resin is saturating thepreform. Embedded sensors can help monitor the impregnation process and manysuch developments have been attempted [1}4]. For the "rst time, long period gratings(LPGs) will be used as embedded #ow monitoring sensors in LCM to detect thearrival of resin in the mold during "lling. LPGs are similar in nature to Bragggratings, but function di!erently because they are used to couple light out of the core.LPGs have a grating periodicity of typically 130}150�m.When the higher index resincovers a LPG sensor, the light that would have been attenuated gets coupled backinto the core and, hence, there is no corresponding dip in the transmission spectrum.Resin #ow-front information is very useful to composite manufacturers because italerts them to speci"c problems that occur during resin injection.
Although the many existing mold-"lling simulation packages [5}7] have contrib-uted tremendous insight and understanding of this process, the design optimizationsbased on them have traditionally been conducted o!-line. This poses a di$culty whenunanticipated anomalies are encountered during manufacturing. Moreover, the vari-ations in the processing parameters are too numerous to be accounted for in thesesimulations. A more e!ective approach would be to monitor the progression of themold "lling as it occurs and implement appropriate corrective measures as necessary.We believe LPGs have the potential to serve in such a sensory capacity.
LPGs possess the usual advantages associated with "ber optic systems, for instancesmall size and light weight, which allows them to be embedded without compromisingthe structural integrity of the composite. Furthermore, their inherent immunity toelectromagnetic interference gives these systems a clear edge over other #ow-sensingsystems that are based on the resin dielectric properties [8,9]. Moreover, LPG sensorshave an additional advantage over other intensity-based "ber optic systems [1] inthat they are robust to #uctuations in light amplitude due to unquanti"ed connectionlosses and #uctuating light sources [2}4]. As each LPG sensor is uniquely wavelengthencoded, several of them can be multiplexed on a single strand of "ber, therebyminimizing the degree of additional heterogeneity introduced into the process.
Grafting a #uorophore to a glass "ber allows a cure sensor that is also interfacesensitive to be fabricated. Fluorescent probe molecules have been used to monitormany properties of polymer and composite materials. For example,dimethylaminonitrostilbene (DMANS) was used to measure the glass transition ofa cured epoxy resin and to study the physical aging of the resin below the glasstransition [10]. Fluorescence monitoring has also been used to study water sorptionand di!usion in polymers [11], polymer reaction kinetics [12], and the onset of
92 J.P. Dunkers et al. / Optics and Lasers in Engineering 35 (2001) 91}104
� Identi"cation of a commercial product is made only to facilitate experimental reproducibility and toadequately describe experimental procedure. In no case does it imply endorsement by NIST or imply that itis necessarily the best product for the experimental procedure.
gelation during cure of thermosetting resins [13,14]. Some groups are trying todevelop practical sensor devices by combining "ber optic technology with #uores-cence probe molecules. For example, after doping the resin with trace levels ofa #uorescent dye molecule, both distal and evanescent mode "ber optic #uorescencemethods have been used to measure the cure of epoxy [14}18] and polyurethaneresins [14]. In one study, the position of the #uorescence maximum from the dyeshifted during the resin cure [14]. In another work, the intensity changes froma #uorescing dye were monitored, via "ber optics, to follow cure of an epoxy resinsystem [18].
These and many #uorescence methods for composite monitoring involve dissolvingthe #uorophore directly into the bulk resin. This can create problems in a manufactur-ing environment. First, an extra processing step may be required to mix the dye intothe resin. Second, a small concentration of dye can drastically change the resin color,which could be undesirable. Finally, since the dye is dissolved in the bulk resin, the#uorescence response comes from the bulk, and the behavior of the "ber/resininterface is ignored. Even if evanescent wave "ber optics are employed to focus on theinterface, the evanescent wave may still propagate a micrometer or more into theresin, and much of the sensor response will be from the bulk resin [19].
Immobilizing a #uorescent dye onto "ber optics has been used to make a variety ofsensors [20] including oxygen, glucose [21], and calcium [22] sensors. In order tomake a sensor that is sensitive to the composite glass/resin interface, a #uorescentlylabeled silane-coupling agent (FLSCA) has been chemically grafted to glass surfaces.FLSCA is a molecule that contains the DMANS #uorophore tethered to a triethoxysilane-coupling agent. When the #uorophore is covalently immobilized at the glasssurface, the #uorescence response of FLSCA can be used to directly study theglass/resin interface. In order to graft the #uorophore to the glass, the ethoxyfunctionalities on the silane end of FLSCA must be converted to hydroxyl groups.These hydroxyl groups can then condense with hydroxyl groups already present onthe glass surface, forming covalent siloxane bonds.
This paper focuses on the development and implementation of both the "ber optic #owand cure sensors. In addition, external factors such as preform architecture and deforma-tion, co-silane, and layer thickness on the response of the sensors are presented. Bystudying the e!ects of these external factors, sensor design and function can be optimized.
2. Experimental
2.1. Flow sensing
The LPGs were prepared by F&S Optics (Blacksburg, VA)� on communication-grade optical "ber with a cladding diameter of 125�m. Each strand of "ber used had
J.P. Dunkers et al. / Optics and Lasers in Engineering 35 (2001) 91}104 93
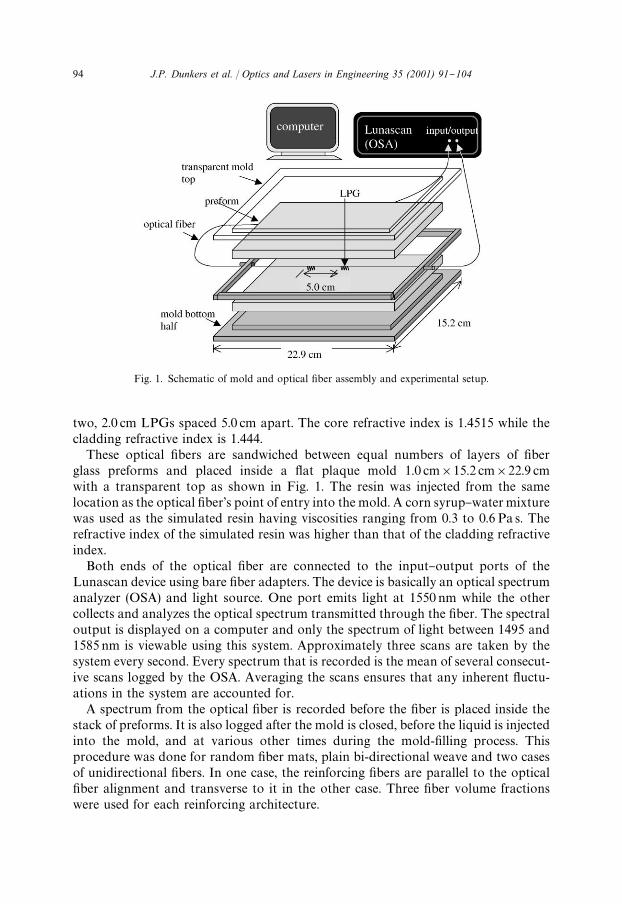
Fig. 1. Schematic of mold and optical "ber assembly and experimental setup.
two, 2.0 cm LPGs spaced 5.0 cm apart. The core refractive index is 1.4515 while thecladding refractive index is 1.444.
These optical "bers are sandwiched between equal numbers of layers of "berglass preforms and placed inside a #at plaque mold 1.0 cm�15.2 cm�22.9 cmwith a transparent top as shown in Fig. 1. The resin was injected from the samelocation as the optical "ber's point of entry into the mold. A corn syrup}watermixturewas used as the simulated resin having viscosities ranging from 0.3 to 0.6Pa s. Therefractive index of the simulated resin was higher than that of the cladding refractiveindex.
Both ends of the optical "ber are connected to the input}output ports of theLunascan device using bare "ber adapters. The device is basically an optical spectrumanalyzer (OSA) and light source. One port emits light at 1550 nm while the othercollects and analyzes the optical spectrum transmitted through the "ber. The spectraloutput is displayed on a computer and only the spectrum of light between 1495 and1585nm is viewable using this system. Approximately three scans are taken by thesystem every second. Every spectrum that is recorded is the mean of several consecut-ive scans logged by the OSA. Averaging the scans ensures that any inherent #uctu-ations in the system are accounted for.
A spectrum from the optical "ber is recorded before the "ber is placed inside thestack of preforms. It is also logged after the mold is closed, before the liquid is injectedinto the mold, and at various other times during the mold-"lling process. Thisprocedure was done for random "ber mats, plain bi-directional weave and two casesof unidirectional "bers. In one case, the reinforcing "bers are parallel to the optical"ber alignment and transverse to it in the other case. Three "ber volume fractionswere used for each reinforcing architecture.
94 J.P. Dunkers et al. / Optics and Lasers in Engineering 35 (2001) 91}104

Fig. 2. The dimethylaminonitrostilbene #uorophore is tethered to a triethoxy silane coupling agent, givingthe FLSCA molecule shown here. This entire molecule is then grafted to the glass surface, immobilizing theFLSCA molecule at the interface.
2.2. Cure sensing
The structure of FLSCA is shown in Fig. 2. Synthesis of the FLSCA dye and theethanol-based deposition procedure used to deposit FLSCA with the diluting}couplingagent on the glass surface are described in a previous paper [23]. The diluting}couplingagents used in this work are glycidoxypropyl trimethoxy silane (GPS), isocyanatopropyltriethoxy silane (IPS), aminopropyl triethoxy silane (APS), propyltriethoxysilane (PTS),and octadecyltriethoxysilane (OTS). After coating glass "bers and glass microscope coverslips with a silane layer, they were immersed in epoxy resin. Fluorescence from the graftedFLSCA was measured during the resin cure. The resin system used in this study wasa stoichiometric mixture of diglycidyl ether of bisphenol A (DGEBA Tactix 123, DowChemical Company) with the amine hardener poly(propylene glycol) bis 2-amino propylether (Je!amine D400, Aldrich Chemical Company) [23].
Fluorescence measurements made on the glass microscope cover slips were takenon a Spex Fluorolog Fluorimeter (Edison, NJ), using 460nm excitation as described ina previous paper [23]. Fluorescence measurements made on the glass "ber optic weretaken from a laser-based "ber optic #uorimeter described in the literature [14]. In thiscase, the excitation was from an argon ion laser at 488 nm. Unless stated otherwise,the data uncertainty is given as a standard deviation frommeasurements made on 8 ormore samples.
3. Results and discussion
3.1. Flow sensing
The OSA system proved to be a fairly stable system since there was very little#uctuation (less than 2%) in the scans obtained for each case. Fig. 3a shows a typical
J.P. Dunkers et al. / Optics and Lasers in Engineering 35 (2001) 91}104 95
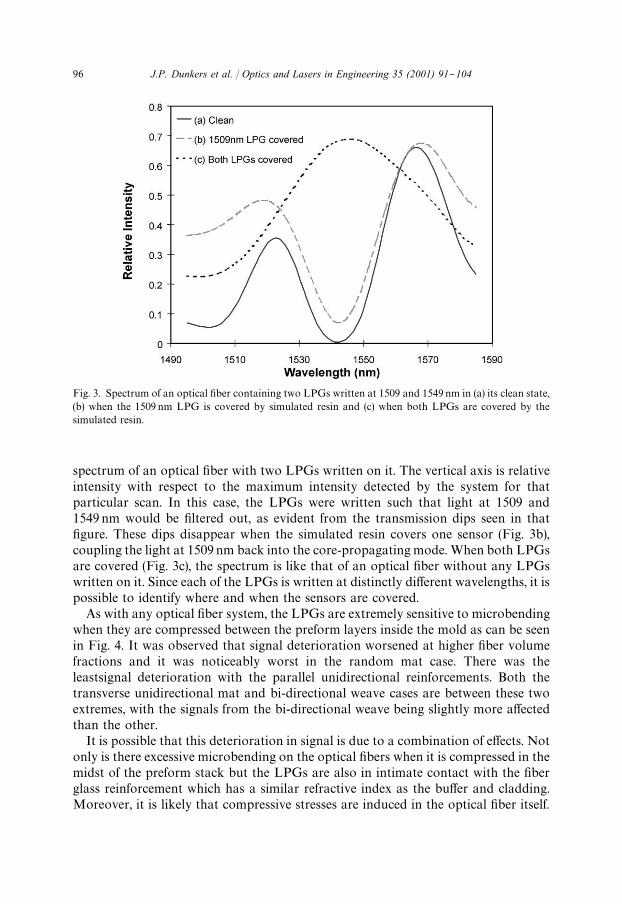
Fig. 3. Spectrum of an optical "ber containing two LPGs written at 1509 and 1549 nm in (a) its clean state,(b) when the 1509 nm LPG is covered by simulated resin and (c) when both LPGs are covered by thesimulated resin.
spectrum of an optical "ber with two LPGs written on it. The vertical axis is relativeintensity with respect to the maximum intensity detected by the system for thatparticular scan. In this case, the LPGs were written such that light at 1509 and1549nm would be "ltered out, as evident from the transmission dips seen in that"gure. These dips disappear when the simulated resin covers one sensor (Fig. 3b),coupling the light at 1509nm back into the core-propagatingmode.When both LPGsare covered (Fig. 3c), the spectrum is like that of an optical "ber without any LPGswritten on it. Since each of the LPGs is written at distinctly di!erent wavelengths, it ispossible to identify where and when the sensors are covered.
As with any optical "ber system, the LPGs are extremely sensitive to microbendingwhen they are compressed between the preform layers inside the mold as can be seenin Fig. 4. It was observed that signal deterioration worsened at higher "ber volumefractions and it was noticeably worst in the random mat case. There was theleastsignal deterioration with the parallel unidirectional reinforcements. Both thetransverse unidirectional mat and bi-directional weave cases are between these twoextremes, with the signals from the bi-directional weave being slightly more a!ectedthan the other.
It is possible that this deterioration in signal is due to a combination of e!ects. Notonly is there excessive microbending on the optical "bers when it is compressed in themidst of the preform stack but the LPGs are also in intimate contact with the "berglass reinforcement which has a similar refractive index as the bu!er and cladding.Moreover, it is likely that compressive stresses are induced in the optical "ber itself.
96 J.P. Dunkers et al. / Optics and Lasers in Engineering 35 (2001) 91}104
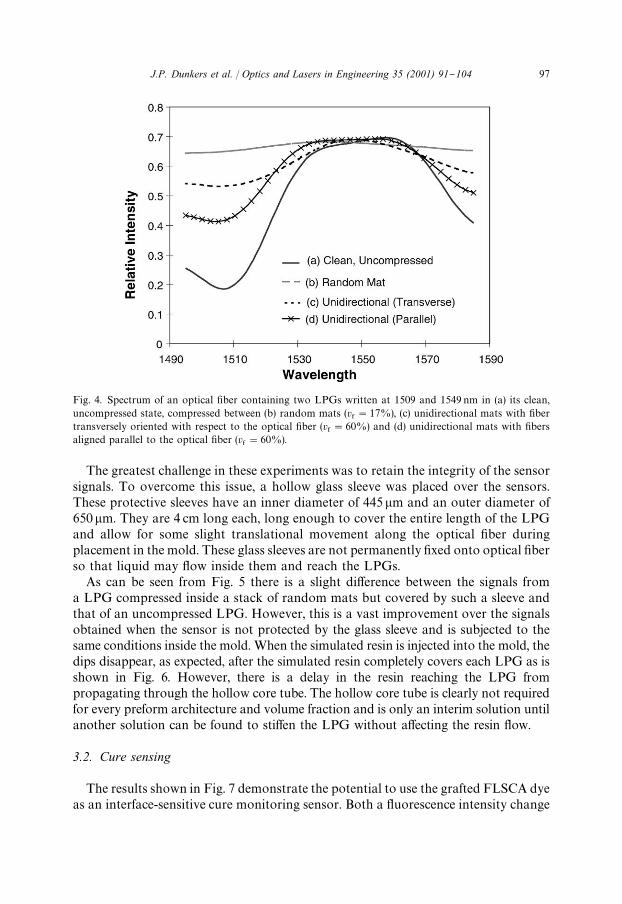
Fig. 4. Spectrum of an optical "ber containing two LPGs written at 1509 and 1549 nm in (a) its clean,uncompressed state, compressed between (b) random mats (v
�"17%), (c) unidirectional mats with "ber
transversely oriented with respect to the optical "ber (v�"60%) and (d) unidirectional mats with "bers
aligned parallel to the optical "ber (v�"60%).
The greatest challenge in these experiments was to retain the integrity of the sensorsignals. To overcome this issue, a hollow glass sleeve was placed over the sensors.These protective sleeves have an inner diameter of 445�m and an outer diameter of650�m. They are 4 cm long each, long enough to cover the entire length of the LPGand allow for some slight translational movement along the optical "ber duringplacement in the mold. These glass sleeves are not permanently "xed onto optical "berso that liquid may #ow inside them and reach the LPGs.
As can be seen from Fig. 5 there is a slight di!erence between the signals froma LPG compressed inside a stack of random mats but covered by such a sleeve andthat of an uncompressed LPG. However, this is a vast improvement over the signalsobtained when the sensor is not protected by the glass sleeve and is subjected to thesame conditions inside the mold. When the simulated resin is injected into the mold, thedips disappear, as expected, after the simulated resin completely covers each LPG as isshown in Fig. 6. However, there is a delay in the resin reaching the LPG frompropagating through the hollow core tube. The hollow core tube is clearly not requiredfor every preform architecture and volume fraction and is only an interim solution untilanother solution can be found to sti!en the LPG without a!ecting the resin #ow.
3.2. Cure sensing
The results shown in Fig. 7 demonstrate the potential to use the grafted FLSCA dyeas an interface-sensitive cure monitoring sensor. Both a #uorescence intensity change
J.P. Dunkers et al. / Optics and Lasers in Engineering 35 (2001) 91}104 97
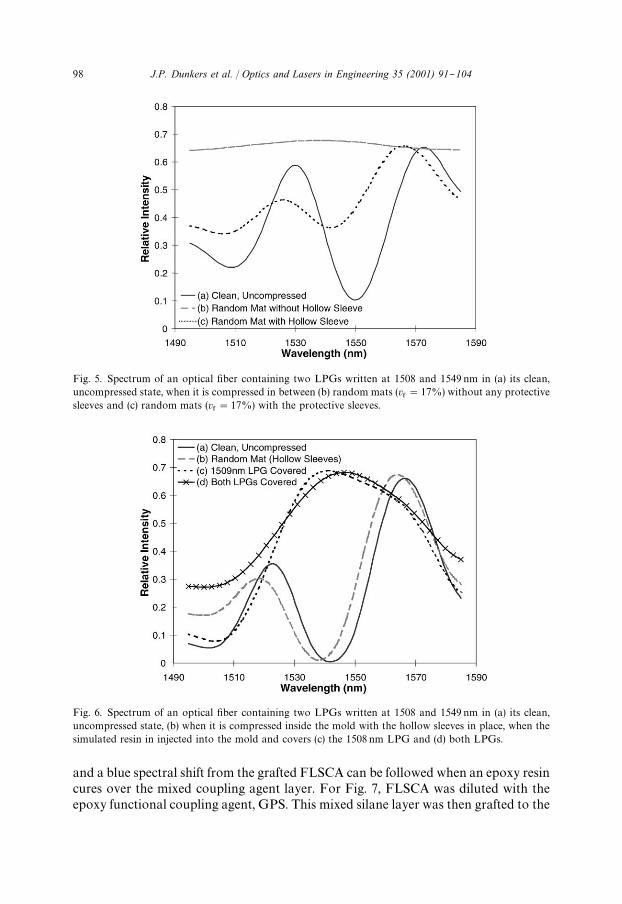
Fig. 5. Spectrum of an optical "ber containing two LPGs written at 1508 and 1549 nm in (a) its clean,uncompressed state, when it is compressed in between (b) random mats (v
�"17%) without any protective
sleeves and (c) random mats (v�"17%) with the protective sleeves.
Fig. 6. Spectrum of an optical "ber containing two LPGs written at 1508 and 1549 nm in (a) its clean,uncompressed state, (b) when it is compressed inside the mold with the hollow sleeves in place, when thesimulated resin in injected into the mold and covers (c) the 1508 nm LPG and (d) both LPGs.
and a blue spectral shift from the grafted FLSCA can be followed when an epoxy resincures over the mixed coupling agent layer. For Fig. 7, FLSCA was diluted with theepoxy functional coupling agent, GPS. This mixed silane layer was then grafted to the
98 J.P. Dunkers et al. / Optics and Lasers in Engineering 35 (2001) 91}104
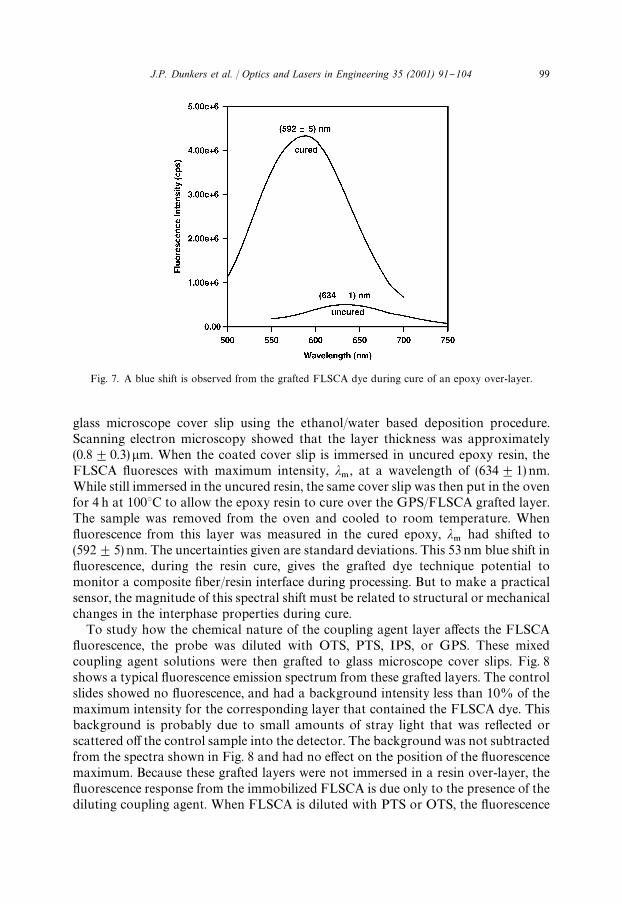
Fig. 7. A blue shift is observed from the grafted FLSCA dye during cure of an epoxy over-layer.
glass microscope cover slip using the ethanol/water based deposition procedure.Scanning electron microscopy showed that the layer thickness was approximately(0.8$0.3)�m. When the coated cover slip is immersed in uncured epoxy resin, theFLSCA #uoresces with maximum intensity, �
�, at a wavelength of (634$1) nm.
While still immersed in the uncured resin, the same cover slip was then put in the ovenfor 4 h at 1003C to allow the epoxy resin to cure over the GPS/FLSCA grafted layer.The sample was removed from the oven and cooled to room temperature. When#uorescence from this layer was measured in the cured epoxy, �
�had shifted to
(592$5) nm. The uncertainties given are standard deviations. This 53nm blue shift in#uorescence, during the resin cure, gives the grafted dye technique potential tomonitor a composite "ber/resin interface during processing. But to make a practicalsensor, the magnitude of this spectral shift must be related to structural or mechanicalchanges in the interphase properties during cure.
To study how the chemical nature of the coupling agent layer a!ects the FLSCA#uorescence, the probe was diluted with OTS, PTS, IPS, or GPS. These mixedcoupling agent solutions were then grafted to glass microscope cover slips. Fig. 8shows a typical #uorescence emission spectrum from these grafted layers. The controlslides showed no #uorescence, and had a background intensity less than 10% of themaximum intensity for the corresponding layer that contained the FLSCA dye. Thisbackground is probably due to small amounts of stray light that was re#ected orscattered o! the control sample into the detector. The background was not subtractedfrom the spectra shown in Fig. 8 and had no e!ect on the position of the #uorescencemaximum. Because these grafted layers were not immersed in a resin over-layer, the#uorescence response from the immobilized FLSCA is due only to the presence of thediluting coupling agent. When FLSCA is diluted with PTS or OTS, the #uorescence
J.P. Dunkers et al. / Optics and Lasers in Engineering 35 (2001) 91}104 99
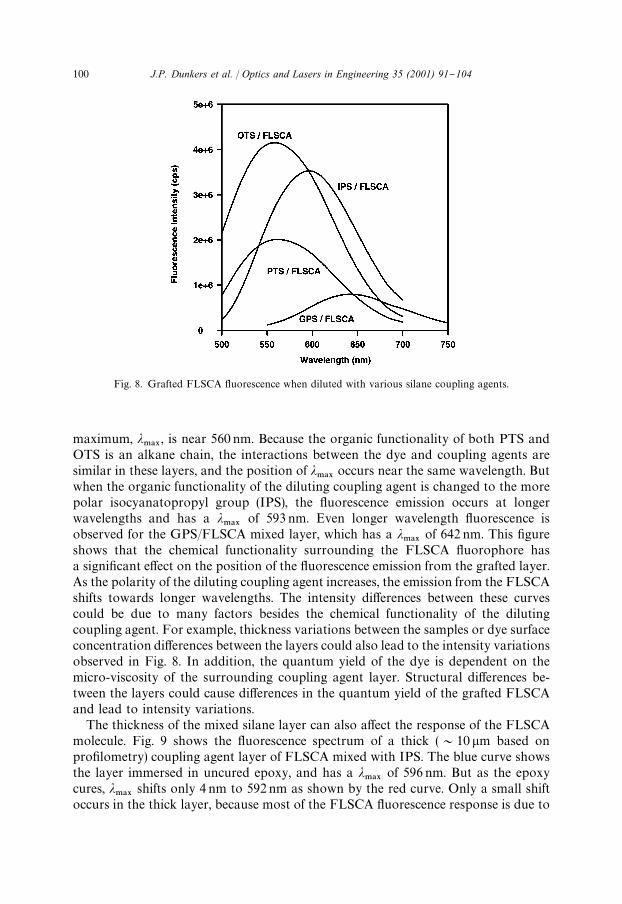
Fig. 8. Grafted FLSCA #uorescence when diluted with various silane coupling agents.
maximum, ����
, is near 560 nm. Because the organic functionality of both PTS andOTS is an alkane chain, the interactions between the dye and coupling agents aresimilar in these layers, and the position of �
���occurs near the same wavelength. But
when the organic functionality of the diluting coupling agent is changed to the morepolar isocyanatopropyl group (IPS), the #uorescence emission occurs at longerwavelengths and has a �
���of 593nm. Even longer wavelength #uorescence is
observed for the GPS/FLSCA mixed layer, which has a ����
of 642 nm. This "gureshows that the chemical functionality surrounding the FLSCA #uorophore hasa signi"cant e!ect on the position of the #uorescence emission from the grafted layer.As the polarity of the diluting coupling agent increases, the emission from the FLSCAshifts towards longer wavelengths. The intensity di!erences between these curvescould be due to many factors besides the chemical functionality of the dilutingcoupling agent. For example, thickness variations between the samples or dye surfaceconcentration di!erences between the layers could also lead to the intensity variationsobserved in Fig. 8. In addition, the quantum yield of the dye is dependent on themicro-viscosity of the surrounding coupling agent layer. Structural di!erences be-tween the layers could cause di!erences in the quantum yield of the grafted FLSCAand lead to intensity variations.
The thickness of the mixed silane layer can also a!ect the response of the FLSCAmolecule. Fig. 9 shows the #uorescence spectrum of a thick (&10 �m based onpro"lometry) coupling agent layer of FLSCA mixed with IPS. The blue curve showsthe layer immersed in uncured epoxy, and has a �
���of 596 nm. But as the epoxy
cures, ����
shifts only 4 nm to 592nm as shown by the red curve. Only a small shiftoccurs in the thick layer, because most of the FLSCA #uorescence response is due to
100 J.P. Dunkers et al. / Optics and Lasers in Engineering 35 (2001) 91}104
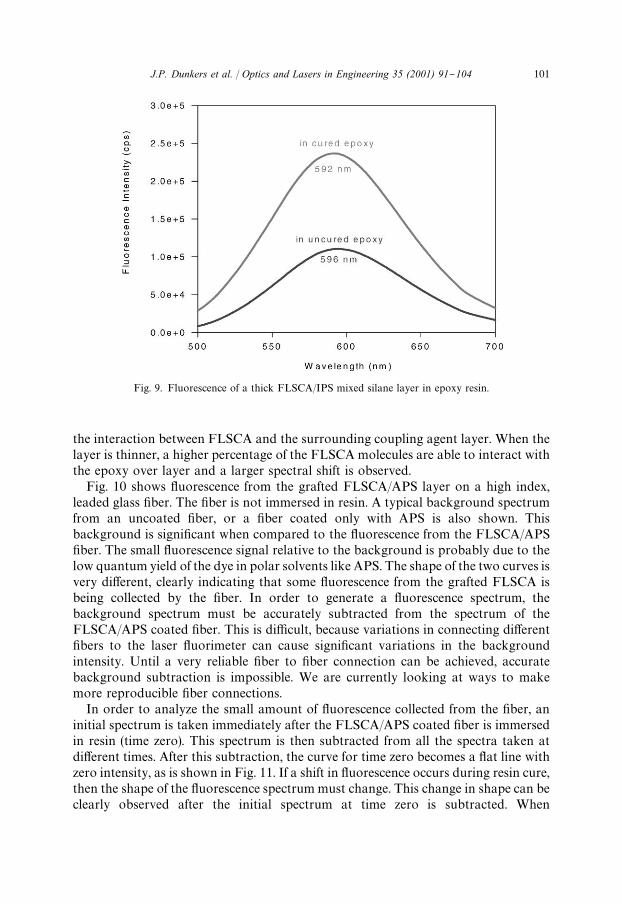
Fig. 9. Fluorescence of a thick FLSCA/IPS mixed silane layer in epoxy resin.
the interaction between FLSCA and the surrounding coupling agent layer. When thelayer is thinner, a higher percentage of the FLSCAmolecules are able to interact withthe epoxy over layer and a larger spectral shift is observed.
Fig. 10 shows #uorescence from the grafted FLSCA/APS layer on a high index,leaded glass "ber. The "ber is not immersed in resin. A typical background spectrumfrom an uncoated "ber, or a "ber coated only with APS is also shown. Thisbackground is signi"cant when compared to the #uorescence from the FLSCA/APS"ber. The small #uorescence signal relative to the background is probably due to thelow quantum yield of the dye in polar solvents like APS. The shape of the two curves isvery di!erent, clearly indicating that some #uorescence from the grafted FLSCA isbeing collected by the "ber. In order to generate a #uorescence spectrum, thebackground spectrum must be accurately subtracted from the spectrum of theFLSCA/APS coated "ber. This is di$cult, because variations in connecting di!erent"bers to the laser #uorimeter can cause signi"cant variations in the backgroundintensity. Until a very reliable "ber to "ber connection can be achieved, accuratebackground subtraction is impossible. We are currently looking at ways to makemore reproducible "ber connections.
In order to analyze the small amount of #uorescence collected from the "ber, aninitial spectrum is taken immediately after the FLSCA/APS coated "ber is immersedin resin (time zero). This spectrum is then subtracted from all the spectra taken atdi!erent times. After this subtraction, the curve for time zero becomes a #at line withzero intensity, as is shown in Fig. 11. If a shift in #uorescence occurs during resin cure,then the shape of the #uorescence spectrummust change. This change in shape can beclearly observed after the initial spectrum at time zero is subtracted. When
J.P. Dunkers et al. / Optics and Lasers in Engineering 35 (2001) 91}104 101
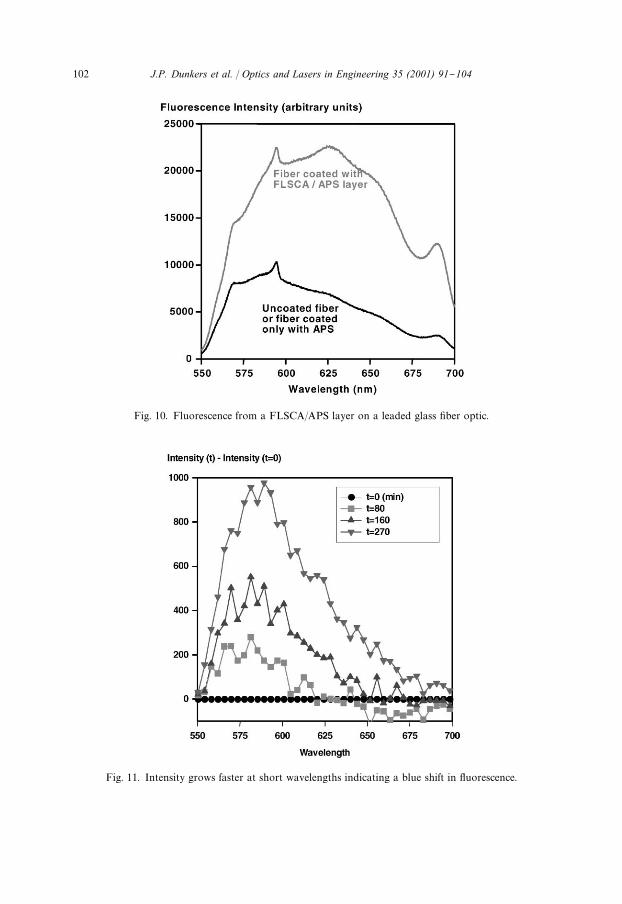
Fig. 10. Fluorescence from a FLSCA/APS layer on a leaded glass "ber optic.
Fig. 11. Intensity grows faster at short wavelengths indicating a blue shift in #uorescence.
102 J.P. Dunkers et al. / Optics and Lasers in Engineering 35 (2001) 91}104
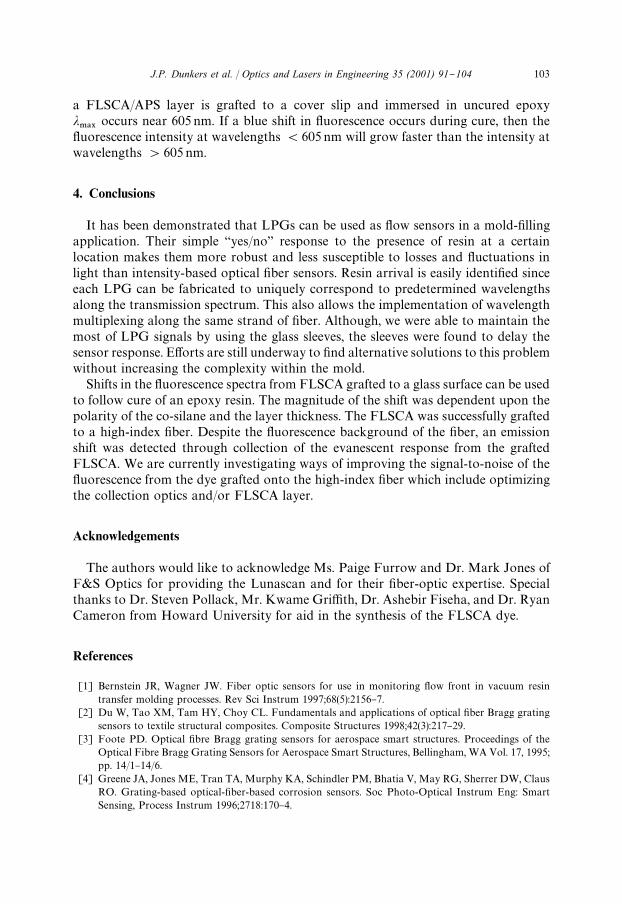
a FLSCA/APS layer is grafted to a cover slip and immersed in uncured epoxy����
occurs near 605nm. If a blue shift in #uorescence occurs during cure, then the#uorescence intensity at wavelengths (605nm will grow faster than the intensity atwavelengths '605nm.
4. Conclusions
It has been demonstrated that LPGs can be used as #ow sensors in a mold-"llingapplication. Their simple `yes/noa response to the presence of resin at a certainlocation makes them more robust and less susceptible to losses and #uctuations inlight than intensity-based optical "ber sensors. Resin arrival is easily identi"ed sinceeach LPG can be fabricated to uniquely correspond to predetermined wavelengthsalong the transmission spectrum. This also allows the implementation of wavelengthmultiplexing along the same strand of "ber. Although, we were able to maintain themost of LPG signals by using the glass sleeves, the sleeves were found to delay thesensor response. E!orts are still underway to "nd alternative solutions to this problemwithout increasing the complexity within the mold.
Shifts in the #uorescence spectra from FLSCA grafted to a glass surface can be usedto follow cure of an epoxy resin. The magnitude of the shift was dependent upon thepolarity of the co-silane and the layer thickness. The FLSCA was successfully graftedto a high-index "ber. Despite the #uorescence background of the "ber, an emissionshift was detected through collection of the evanescent response from the graftedFLSCA. We are currently investigating ways of improving the signal-to-noise of the#uorescence from the dye grafted onto the high-index "ber which include optimizingthe collection optics and/or FLSCA layer.
Acknowledgements
The authors would like to acknowledge Ms. Paige Furrow and Dr. Mark Jones ofF&S Optics for providing the Lunascan and for their "ber-optic expertise. Specialthanks to Dr. Steven Pollack, Mr. Kwame Gri$th, Dr. Ashebir Fiseha, and Dr. RyanCameron from Howard University for aid in the synthesis of the FLSCA dye.
References
[1] Bernstein JR, Wagner JW. Fiber optic sensors for use in monitoring #ow front in vacuum resintransfer molding processes. Rev Sci Instrum 1997;68(5):2156}7.
[2] Du W, Tao XM, Tam HY, Choy CL. Fundamentals and applications of optical "ber Bragg gratingsensors to textile structural composites. Composite Structures 1998;42(3):217}29.
[3] Foote PD. Optical "bre Bragg grating sensors for aerospace smart structures. Proceedings of theOptical Fibre Bragg Grating Sensors for Aerospace Smart Structures, Bellingham, WA Vol. 17, 1995;pp. 14/1}14/6.
[4] Greene JA, Jones ME, Tran TA, Murphy KA, Schindler PM, Bhatia V, May RG, Sherrer DW, ClausRO. Grating-based optical-"ber-based corrosion sensors. Soc Photo-Optical Instrum Eng: SmartSensing, Process Instrum 1996;2718:170}4.
J.P. Dunkers et al. / Optics and Lasers in Engineering 35 (2001) 91}104 103

[5] Han K, Lee LJ, Nakamura S, Sha" S, White D. Dry spot formation and changes in liquid compositemolding: II * modeling and simulation. J Comp Mater 1996;30(13):1475}93.
[6] Lin M, Hahn HT. A robust and e$cient approach for RTM simulation. Proceedings of the ASMEMDAdvancedMaterials: Development, Characterization, Processing and Mechanical Behavior Vol.74, No. (1) 1993; pp. 71}81.
[7] Phelan Jr. FR. Flow simulation of the resin transfer molding process. Proceedings of the 7th TechnicalConference of the American Society for Composites, State College, PA 1992. p. 374}380.
[8] Kikuchi A, Higuerey E, Coulter J. An experimental investigation of resin #ow sensing during moldingprocesses. Proceedings of the ASMEMD (HTD) Advances in Computer-Aided Engineering (CAE) ofPolymer Processing Vol. 49, No. (1), 1995; pp. 86}93.
[9] Milovich D. Dielectric resin #ow sensing as an aid to RTM process development. Proceedings of the41st Sagamore Army Materials Research Conference 1994. p. 365}376.
[10] Schwab SD, Levy RL. In: Polymer characterization: advances in chemistry Series 227, ACS, Washing-ton DC, 1990. p. 397.
[11] Sung CSP, Sung NH. Fluorescence characterization of cure and water uptake in polymers andcomposites. Mater Sci Eng 1993;A162:241.
[12] Sung CSP, Song JC. Fluorescence studies of diaminodiphenyl sulfone curing agent for epoxy curecharacterization. Macromolecules 1993;26(18):4818.
[13] Lin KF, Wang FW. Fluorescence monitoring of polarity change and gelation during epoxy cure.Polymer 1994;35:687.
[14] Ne! RA, Woerdeman DL, Parnas RS. Use of a charged coupled device (CCD) camera for evanescentwave optical "ber cure monitoring of liquid composite molding resins. Polym Comp 1997;18(4):518.
[15] Woerdeman DL, Spoerre JK, Flynn KM, Parnas RS. Cure monitoring of the liquid compositemolding process using "ber-optic sensors. Polym Comp 1997;18:133.
[16] Paik H-J, Sung NH. Fiberoptic intrinsic #uorescence for in-situ cure monitoring of amine curedepoxy and composites. Polym Eng Sci 1994;35(12):1025.
[17] Dang W, Sung NH. In-situ cure monitoring of diamine cured epoxy by "beroptic #uorimetry usingextrinsic reactive #uorophore. Polym Eng Sci 1994;34(9):709.
[18] Fuchs A, Sung NH. Composite interphase study be evasescent wave "beroptic #uorescence. ANTECconference proceedings 1995, Boston, MA, p. 2347.
[19] Parnas RS, Woerdeman DL. Mode coupling theory for evanescent wave "ber optics sensors.Proceedings of ASME International Mechanical Engineering Congress & Exposition, Dallas, TX,1997.
[20] Ingersoll CM, Bright FV. Using sol}gel-based platforms for chemical sensors. Chem Technol1997;69:26
[21] Rosenzweig Z, Kopelman R. Analytical properties of miniaturized oxygen and glucose "ber opticsensors. Sen. Act. B 1996;35}36:475.
[22] ShortreedM, KopelmanR, KuhnM, Hoyland B. Fluorescent "ber-optic calcium sensor for physiolo-gical measurements. Anal Chem 1996;68(9):1414.
[23] Lenhart JL, van Zanten JH, Dunkers JP, Zimba CG, James CA, Pollack SP, Parnas RS. Using animmobilized #uorescent dye to investigate the glass/resin interface. J Coll Interface Sci 2000; 221(1):75.
104 J.P. Dunkers et al. / Optics and Lasers in Engineering 35 (2001) 91}104