fetal microglial phenotype in vitro carries memory of prior in vivo exposure to inflammation
TRANSCRIPT

ORIGINAL RESEARCHpublished: 04 August 2015
doi: 10.3389/fncel.2015.00294
Frontiers in Cellular Neuroscience | www.frontiersin.org 1 August 2015 | Volume 9 | Article 294
Edited by:
Carlos Barcia,
Universitat Autònoma de Barcelona,
Spain
Reviewed by:
Hermona Soreq,
The Hebrew University of Jerusalem,
Israel
Gunnar P. H. Dietz,
Schwabe Pharma Deutschland,
Germany
*Correspondence:
Martin G. Frasch,
Départment Obstétrique-Gynécologie,
CHU Ste-Justine Research Centre,
Université de Montréal, 3175,
Côte-Sainte-Catherine, Montréal,
QC H3T 1C5, Canada
martin.frasch@
recherche-ste-justine.qc.ca
†These authors have contributed
equally to this work.
Received: 03 May 2015
Accepted: 16 July 2015
Published: 04 August 2015
Citation:
Cao M, Cortes M, Moore CS, Leong
SY, Durosier LD, Burns P, Fecteau G,
Desrochers A, Auer RN, Barreiro LB,
Antel JP and Frasch MG (2015) Fetal
microglial phenotype in vitro carries
memory of prior in vivo exposure to
inflammation.
Front. Cell. Neurosci. 9:294.
doi: 10.3389/fncel.2015.00294
Fetal microglial phenotype in vitrocarries memory of prior in vivoexposure to inflammationMingju Cao 1, 2 †, Marina Cortes 3†, Craig S. Moore 4, Soo Yuen Leong 4,
Lucien D. Durosier 1, 2, Patrick Burns 5, Gilles Fecteau 5, Andre Desrochers 5,
Roland N. Auer 6, Luis B. Barreiro 7, Jack P. Antel 4 and Martin G. Frasch 1, 2, 3*
1Department of Obstetrics and Gynaecology, Faculty of Medicine, CHU Ste-Justine Research Centre, Université de
Montréal, Montréal, QC, Canada, 2Department of Neurosciences, Faculty of Medicine, CHU Ste-Justine Research Centre,
Université de Montréal, Montréal, QC, Canada, 3 Faculty of Veterinary Medicine, Animal Reproduction Research Centre,
Université de Montréal, Montréal, QC, Canada, 4Neuroimmunology Unit, Montréal Neurological Institute, McGill University,
Montréal, QC, Canada, 5Department of Clinical Sciences, Faculty of Veterinary Medicine, Université de Montréal, QC,
Canada, 6Département de Pathologie, University Hospital Ste-Justine, Université de Montréal, QC, Canada, 7Department of
Pediatrics, Faculty of Medicine, CHU Ste-Justine Research Centre, Université de Montréal, Montréal, QC, Canada
Objective: Neuroinflammation in utero may result in life-long neurological disabilities.
The molecular mechanisms whereby microglia contribute to this response remain
incompletely understood.
Methods: Lipopolysaccharide (LPS) or saline were administered intravenously
to non-anesthetized chronically instrumented near-term fetal sheep to model fetal
inflammation in vivo. Microglia were then isolated from in vivo LPS and saline (naïve)
exposed animals. To mimic the second hit of neuroinflammation, these microglia were
then re-exposed to LPS in vitro. Cytokine responses were measured in vivo and
subsequently in vitro in the primary microglia cultures derived from these animals. We
sequenced the whole transcriptome of naïve and second hit microglia and profiled their
genetic expression to define molecular pathways disrupted during neuroinflammation.
Results: In vivo LPS exposure resulted in IL-6 increase in fetal plasma 3 h post LPS
exposure. Even though not histologically apparent, microglia acquired a pro-inflammatory
phenotype in vivo that was sustained and amplified in vitro upon second hit LPS
exposure as measured by IL-1β response in vitro and RNAseq analyses. While NFKB and
Jak-Stat inflammatory pathways were up regulated in naïve microglia, heme oxygenase
1 (HMOX1) and Fructose-1,6-bisphosphatase (FBP) genes were uniquely differentially
expressed in the second hit microglia. Compared to the microglia exposed to LPS in vitro
only, the transcriptome of the in vivo LPS pre-exposed microglia showed a diminished
differential gene expression in inflammatory and metabolic pathways prior and upon
re-exposure to LPS in vitro. Notably, this desensitization response was also observed in
histone deacetylases (HDAC) 1, 2, 4, and 6. Microglial calreticulin/LRP genes implicated
in microglia-neuronal communication relevant for the neuronal development were up
regulated in second hit microglia.
Discussion: We identified a unique HMOX1down and FBPup phenotype of microglia
exposed to the double-hit suggesting interplay of inflammatory and metabolic pathways.

Cao et al. Fetal microglia in vivo and in vitro
Our findings suggest that epigenetic mechanisms mediate this immunological and
metabolic memory of the prior inflammatory insult relevant to neuronal development and
provide new therapeutic targets for early postnatal intervention to prevent brain injury.
Keywords: brain, neuroinflammation, bioinformatics, RNAseq, sheep, metabolism, cytokines, epigenetics
Introduction
Brain injury acquired antenatally remains a major cause of long-term neurodevelopmental sequelae (Saigal and Doyle, 2008).There is growing clinical and experimental evidence for maternaland fetal infection acting via systemic and neuroinflammation tocause fetal brain injury or contributing to in utero asphyxial braininjury with consequences for postnatal health (Hagberg et al.,2002; Rees and Inder, 2005; Wang et al., 2006; Gotsch et al., 2007;Murthy and Kennea, 2007; Fahey, 2008).
In humans, the main cause of fetal inflammation ischorioamnionitis, a frequent condition affecting 10% of allpregnancies and up to 40% of preterm births. Chorioamnionitisis associated with ∼nine-fold increased risk for cerebral palsyspectrum disorders with life lasting neurological deficits and anincreased risk for acute or life-long morbidity and mortality(Fahey, 2008; Agrawal and Hirsch, 2012; Fishman and Gelber,2012).
In addition to short-term brain damage, neuroimmuneresponses to in utero infection may also have long-term healthconsequences, the “second hit” hypothesis: In adults, exposureto inflammatory stimuli can activate microglia (glial priming,reviewed in Billiards et al., 2006; Karrow, 2006; Bilbo andSchwarz, 2009; Bilbo and Tsang, 2010; Ajmone-Cat et al., 2013;Bolton et al., 2014).
We hypothesized that an inflammatory response induced bylipopolysaccharide (LPS) will result in microglial activationreflecting neuroinflammation. To test the “second hit”hypothesis, we developed a protocol to culture fetal sheepmicroglia and re-expose them to LPS under in vitroconditions allowing a more mechanistic study of theirphenotype.
Materials and Methods
Ethics StatementThis study was carried out in strict accordance withthe recommendations in the Guide for the Care andUse of Laboratory Animals of the National Institutesof Health. The respective in vivo and in vitro protocolswere approved by the Committee on the Ethics of AnimalExperiments of the Université de Montréal (Permit Number:10-Rech-1560).
Anesthesia and Surgical ProcedureWe instrumented pregnant time-dated ewes at 126 daysof gestation (dGA, ∼0.86 gestation) with arterial, venousand amniotic catheters and ECG electrodes (Frasch et al.,2007). Ovine singleton fetuses of mixed breed were surgicallyinstrumented with sterile technique under general anesthesia
(both ewe and fetus). In case of twin pregnancy the larger fetuswas chosen based on palpating and estimating the intertemporaldiameter. The total duration of the procedure was approximately2 h. Antibiotics were administered to the mother intravenously(trimethoprim sulfadoxine 5mg/kg body weight) as well as tothe fetus intravenously and into the amniotic cavity (ampicillin250 mg). Amniotic fluid lost during surgery was replaced withwarm saline. The catheters exteriorized through the maternalflank were secured to the back of the ewe in a plastic pouch.For the duration of the experiment the ewe was returnedto a metabolic cage, where she could stand, lie and eat adlibitum while we monitored the non-anesthetized fetus withoutsedating the mother. During postoperative recovery antibioticadministration was continued for 3 days. Arterial blood wassampled for evaluation of maternal and fetal condition andcatheters were flushed with heparinized saline to maintainpatency.
In vivo Experimental ProtocolPostoperatively, all animals were allowed 3 days to recover beforestarting the experiments. On these 3 days, at 9.00 am 3mLarterial plasma sample were taken for blood gasses and cytokineanalysis. Each experiment commenced at 9.00 am with a 1 hbaseline measurement followed by the respective intervention asoutlined below. FHR and arterial blood pressure was monitoredcontinuously (CED, Cambridge, UK, and NeuroLog, Digitimer,Hertfordshire, UK). Blood samples (3mL) were taken for arterialblood gasess, lactate, glucose, and base excess (ABL800Flex,Radiometer) and cytokines at the time points 0 (baseline), +1(i.e., after LPS administration), +3, +6, +24, +48, and +54 h(i.e., before sacrifice at day 3). For the cytokine analysis, plasmawas spun at 4◦C (4min, 4000 g, Eppendorf 5804R, Mississauga,ON), decanted and stored at−80◦C for subsequent ELISAs. Afterthe +54 h (Day 3) sampling, the animals were sacrificed with anoverdose of barbiturate (30mg pentobarbital sodium, Fatal-Plus;Vortech Pharmaceuticals, Dearborn, MI) and a post mortemwas carried out during which fetal gender and weight weredetermined. The fetal brain was then perfusion-fixedwith 250mLof cold saline followed by 250mL of 4% paraformaldehydeand processed for histochemical analysis or dissected forcell culture (details see in vitro microglia culture paragraph).Fetal growth was assessed by body, brain, liver, and maternalweights.
Nine fetuses were used as controls receiving NaCl 0.9%.Twelve fetuses received LPS (400 ng/fetus/day) derived from E.coli (Sigma L5293, from E. coli O111:B4, ready-made solutioncontaining 1mg/ml of LPS) were administered intravenously tofetuses on days 1 and 2 at 10.00 am to mimic high levels ofendotoxin in fetal circulation over several days as it may occurin chorioamnionitis.
Frontiers in Cellular Neuroscience | www.frontiersin.org 2 August 2015 | Volume 9 | Article 294

Cao et al. Fetal microglia in vivo and in vitro
In vitro Microglia Culture ProtocolFetal sheep brain tissues were obtained during sheep autopsyafter completion of the experiment for in vitro study (Figure 1A).The non-instrumented, untreated twins were designated “naïve”(NC, no LPS exposure in vivo) and NL when exposed to LPSin vitro for the first time. Instrumented animals that received LPSin vivo (SHC) were used for 2nd hit LPS exposure in vitro (SHL).Fetal sheep microglia culture protocol was adapted from anestablished human adult and fetal microglia culture protocol thatwas modified to include a myelin removal step following high-speed centrifugation (Durafourt et al., 2013). Briefly, fetal sheepcells were plated on poly-L-lysine (PLL)-coated tissue cultureflasks at a concentration of 2 × 10⁶ cells /ml in DMEM with5% heat-inactivated fetal bovine serum (Gibco, Canada Origin),1% penicillin/ streptomycin, and 1% glutamine (5% DMEM), inwhich microglia are preferable to grow (Durafourt et al., 2013).Cells were allowed to incubate for seven days at 37◦C, 5% CO2,
followed by media change by centrifugation and addition of re-suspended cells back to the culture flask. Cells were continuedto incubate for seven more days with 5% DMEM at 37◦C, 5%CO2, before floating cells were collected. Carefully collecting thefloating microglia to avoid contamination with astrocytes andoligodendrocytes, the cells were incubated in 24-well plates at1 × 105 cells/1.82 cm2 surface area with 1mL of 5% DMEM foranother 4–5 days, and then treated with or w/o LPS (100 ng/ml,Sigma L5024, from E. coli O127, B8) for 6 h. Cell conditionedmedia were collected for cytokine analysis, 0.5ml TriZol wereadded per well for RNA extraction.
To verify microglia purity, a portion of floating cells werecultured in 24-well plates at above conditions for flow cytometryanalysis, cell morphology was documented with light microscopy(see Supplementary Material). Another portion of floating cellswere plated into Lab-Tek eight well chamber glass slide (ThermoScientific) and treated with or w/o LPS for immunocytochemistry
FIGURE 1 | Fetal sheep in vivo LPS exposure causes a systemic
inflammation. (A) Experimental design. In vivo, in vitro and RNAseq
experiments are illustrated. In vivo study, Control (saline) and LPS;
in vitro study, cultured cells derived from in vivo Control animal, named
as Naïve, whereas cells derived from LPS-exposed animal named as
2nd hit (second hit, SH), there are four experimental groups: naïve
Control (NC), naïve LPS (NL ), 2nd hit control (SHC), and 2nd hit LPS
(SHL ), respectively. For RNAseq data comparisons, we first compared
pair 1 (n = 6) Control (NC) vs. LPS-exposed naïve microglia (NL ); then
pair 2 (n = 4) naïve control (NC) vs. 2nd hit Control (SHC); and finally
pair 3 (n = 4) naïve LPS-exposed microglia (NL ) vs. 2nd hit
LPS-exposed microglia (SHL ). (B) IL-6 levels peaked at 3 h in fetal
sheep plasma following LPS administration in vivo (***P < 0.001). In vivo
Control group, n = 9, in vivo LPS group, n = 12. Blood samples were
collected in heparinized syringe from fetal arterial catheter, plasma was
obtained by centrifugation. A sheep specific IL-6 ELISA was performed
to measure the cytokine levels. (C) No evidence of Iba1+ fetal brain
microglia inflammatory response to LPS exposure in vivo. Normalized
Iba1 + signal (microglia) fluorescence in six randomly chosen high power
fields per brain region is shown in hippocampus [CA1, CA234, and
dentate gyrus (DG) subregions], cortical gray matter (GM) layers GM13,
GM46, white matter (WM), and thalamus. GEE model for prediction of
Iba1+ normalized signal intensity: group main effect p = 0.62; brain
region main effect p < 0.001; brain region*group interaction p = 0.13.
Frontiers in Cellular Neuroscience | www.frontiersin.org 3 August 2015 | Volume 9 | Article 294

Cao et al. Fetal microglia in vivo and in vitro
analysis, in this experiment, some wells of astrocytes cultured atDMEM with 10% FCS were included for comparison.
Measurements of Inflammatory ResponsesMeasurement of Cytokines in Plasma and Cell
Culture MediaCytokine concentrations in plasma (IL-6) and cell culture media(IL-1β) were determined by using an ovine-specific sandwichELISA. Briefly, 96-well plates (Nunc Maxisorp, high capacitymicrotitre wells) were pre-coated with the capture antibody,the mouse anti sheep monoclonal antibodies (IL-6, MCA1659;IL-1β, MCA1658, Bio Rad AbD Serotec) at a concentration4µg/ml on ELISA plates at 4◦C for overnight, after 3 timeswash with washing buffer (0.05% Tween 20 in PBS, PBST),plates were then blocked for 1 h with 1% BSA in PBST forplasma samples or 10% FBS for cell culture media. Recombinantsheep proteins (IL-6, Protein Express Cat. no 968-305; IL-1 β,Cat. no 968-405) were used as ELISA standard. All standardsand samples (50µl per well) were run in duplicate. Rabbit antisheep polyclonal antibodies (detection antibody IL-6, AHP424;IL-1β, AHP423, Bio Rad AbD Serotec) at a concentration of4µg/ml were applied in wells and incubated for 30min atroom temperature. Plates were washed with washing bufferfor 5–7 times between each step. Detection was accomplishedby assessing the conjugated enzyme activity (goat anti-rabbitIgG-HRP, dilution 1:5000, Jackson ImmunoResearch, Cat. No111-035-144) via incubation with TMB substrate solution (BDOptEIA TMB substrate Reagent Set, BD Biosciences Cat. No555214), color development reaction was stopped with 2 Nsulphuric acid. Plates were read on ELISA plate reader at 450 nm,with 570 nm wavelength correction (EnVision 2104 MultilabelReader, Perkin Elmer). The sensitivity of IL-6 ELISA for plasmawas 16 pg/ml, the sensitivity of IL-1b ELISA for media was41.3 pg/ml, respectively. For all assays, the intra-assay and inter-assay coefficients of variance was <5 and <10%, respectively.
Immunofluorescence Imaging AnalysisComplete brain was taken from the fetus during necropsy afterperfusion and immediately immersed in 4% PFA for 48–72 h.The tissue sample was then washed and stored in 1× PBS bufferchanged daily for 3 days. Finally, the brain was stored in 70%ethanol until further processing. All the brain tissue sampleswere kept at 4◦C when they were in liquid. The fetal brains werecut into two equal halves of left and right hemispheres, and thensliced coronally and placed into cassettes to be processed withLeica TP 1020 Automatic Tissue Processor (Leica Instruments,Mussloch, Germany). The tissues were embedded in paraffinwithLeica EG 1160 Paraffin Embedding Center (Leica Instruments,Mussloch, Germany). Five-micrometer slices were obtainedfrom slicing the embedded tissue samples with the Leica RM2145RotaryMicrotome (Leica Instruments, Mussloch, Germany), andmounted on the Fisherbrand Colorfrost Plus microscope slides(Fischer Scientific). The sectioned brain tissue samples wentthrough de-paraffinization with CitroSolv (Fischer Scientific),100, 95, 70, and 50% ethanol at room temperature, and antigenretrieval with 10mM citrate buffer at pH 6 before being washedwith water and 1× PBS, and blocked by Background SniperBlocking Reagent (Biocare Medical, Cat. No BS966JJ). Then the
sections were incubated with the primary antibody (Iba1, rabbitpolyclonal antibody 4, 1:250 dilution, Wako, Cat No. 019-19741)for 1 h, followed by washing with 1× PBS and incubationwith secondary antibody (Alexa Fluor 568 goat anti-rabbitIgG, 1:400 dilution, Life Technologies, Cat no A-11011) for30min in the dark. After that, the sections were washed againwith 1× PBS, and the nuclei were counterstained with DAPI(1:4000 dilution, Sigma D-9564). Finally, the sections werecover-slipped with Fisherfinest Premium Cover glass (22× 50-1,Fisher Scientific) and Fluoromount-G (SouthernBiotech, Cat no0100-01) mounting medium, and viewed after 24 h of drying.Widefield fluorescence microscopy was performed on thestained brain tissue samples with a Zeiss Axiovert 200M invertedmicroscope (Jena, Germany), at the magnification of 40× usinga HBO100 mercury-arc lamp as a light source. The imageswere captured using a Zeiss Axiocam HRm (high-resolutionmonochrome) CCD (charged-coupled device) camera. Six highpower field (HPF) images at 40× magnification were obtainedfor each animal. Multichannel imaging was used with the Iba1channel and the DAPI channel for obtaining the pictures usedfor macrophage quantification. Appropriate ranges of color wereselected showing positive contiguous cytoplasmic staining asa criterion for microglia cell count scoring which were thenapplied uniformly to calibrated images for all brain regions(Figure 2). Scoring was performed in a blinded fashion toexperimental groups. To normalize for cell density Iba1+ signalover the whole area measured (100 sq micron) was divided bythe respective optical intensity values for each HPF according toLin et al. (2000).
RNAseq ApproachTo extract and quantify RNA, total RNA was extracted fromcultured microglia using TRIzol Reagent (Life Technologies).To obtain enough RNA, same treatment cells were pooledin one replicate. RNA quantity and quality (RNA integritynumber, RIN) was determined by using a RNA Nano Chips(Agilent RNA 6000 Nano Chips) with Agilent 2100 BioAnalyzer.All samples had a RIN-value ranging from 6 to 8.5, exceptfor one sample having RIN = 5.5 but an acceptable 84% oftranscripts mapped, which did not affect the read count for thissample.
A total of eight samples from four set of replicates wereselected for RNA sequencing at high throughput, of which threereplicates were derived from in vivo control fetal sheep and onereplicate was from in vivo LPS-exposed (second hit) fetal sheep.RNAseq libraries were prepared by using Illumina TruSeq RNASample Preparation v2 kit (Illumina) and quality control wasperformed on the BioAnalyzer. Single-end 50-bp sequencing wasperformed at high throughput on an Illumina HiSeq2500 at theCHU Ste-Justine Core Facility Sequencing Platform. Raw dataand RNAseq data discussed in this publication were deposited onNCBI and are accessible online with the GEO accession numberGSE71037.
RNAseq Data Analysis
Reads alignment to the reference genomeTo maximize the amount of genes covered, raw data weremapped to the reference genome of the sheep Ovis aris v3.1
Frontiers in Cellular Neuroscience | www.frontiersin.org 4 August 2015 | Volume 9 | Article 294
Cao et al. Fetal microglia in vivo and in vitro
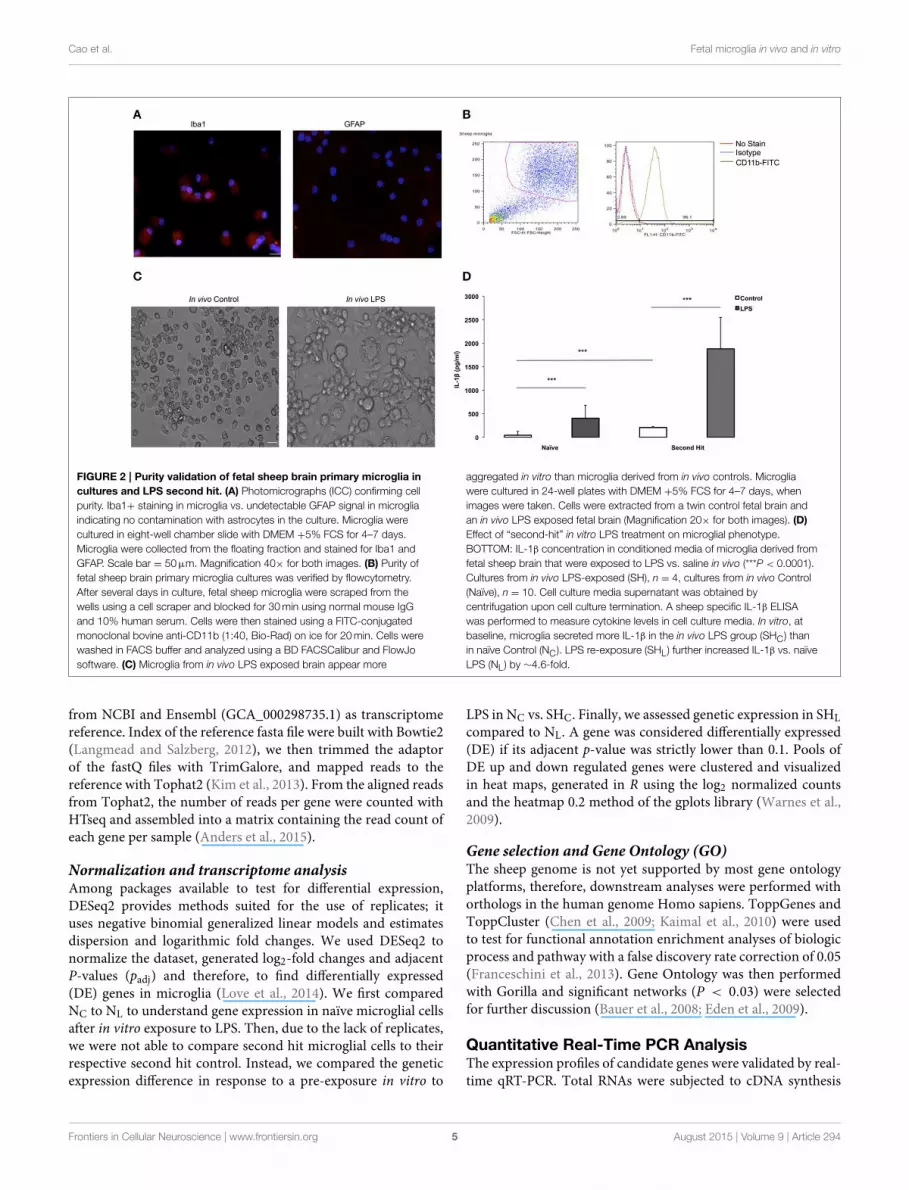
FIGURE 2 | Purity validation of fetal sheep brain primary microglia in
cultures and LPS second hit. (A) Photomicrographs (ICC) confirming cell
purity. Iba1+ staining in microglia vs. undetectable GFAP signal in microglia
indicating no contamination with astrocytes in the culture. Microglia were
cultured in eight-well chamber slide with DMEM +5% FCS for 4–7 days.
Microglia were collected from the floating fraction and stained for Iba1 and
GFAP. Scale bar = 50µm. Magnification 40× for both images. (B) Purity of
fetal sheep brain primary microglia cultures was verified by flowcytometry.
After several days in culture, fetal sheep microglia were scraped from the
wells using a cell scraper and blocked for 30min using normal mouse IgG
and 10% human serum. Cells were then stained using a FITC-conjugated
monoclonal bovine anti-CD11b (1:40, Bio-Rad) on ice for 20min. Cells were
washed in FACS buffer and analyzed using a BD FACSCalibur and FlowJo
software. (C) Microglia from in vivo LPS exposed brain appear more
aggregated in vitro than microglia derived from in vivo controls. Microglia
were cultured in 24-well plates with DMEM +5% FCS for 4–7 days, when
images were taken. Cells were extracted from a twin control fetal brain and
an in vivo LPS exposed fetal brain (Magnification 20× for both images). (D)
Effect of “second-hit” in vitro LPS treatment on microglial phenotype.
BOTTOM: IL-1β concentration in conditioned media of microglia derived from
fetal sheep brain that were exposed to LPS vs. saline in vivo (***P < 0.0001).
Cultures from in vivo LPS-exposed (SH), n = 4, cultures from in vivo Control
(Naïve), n = 10. Cell culture media supernatant was obtained by
centrifugation upon cell culture termination. A sheep specific IL-1β ELISA
was performed to measure cytokine levels in cell culture media. In vitro, at
baseline, microglia secreted more IL-1β in the in vivo LPS group (SHC) than
in naïve Control (NC). LPS re-exposure (SHL ) further increased IL-1β vs. naïve
LPS (NL ) by ∼4.6-fold.
from NCBI and Ensembl (GCA_000298735.1) as transcriptomereference. Index of the reference fasta file were built with Bowtie2(Langmead and Salzberg, 2012), we then trimmed the adaptorof the fastQ files with TrimGalore, and mapped reads to thereference with Tophat2 (Kim et al., 2013). From the aligned readsfrom Tophat2, the number of reads per gene were counted withHTseq and assembled into a matrix containing the read count ofeach gene per sample (Anders et al., 2015).
Normalization and transcriptome analysisAmong packages available to test for differential expression,DESeq2 provides methods suited for the use of replicates; ituses negative binomial generalized linear models and estimatesdispersion and logarithmic fold changes. We used DESeq2 tonormalize the dataset, generated log2-fold changes and adjacentP-values (padj) and therefore, to find differentially expressed(DE) genes in microglia (Love et al., 2014). We first comparedNC to NL to understand gene expression in naïve microglial cellsafter in vitro exposure to LPS. Then, due to the lack of replicates,we were not able to compare second hit microglial cells to theirrespective second hit control. Instead, we compared the geneticexpression difference in response to a pre-exposure in vitro to
LPS in NC vs. SHC. Finally, we assessed genetic expression in SHL
compared to NL. A gene was considered differentially expressed(DE) if its adjacent p-value was strictly lower than 0.1. Pools ofDE up and down regulated genes were clustered and visualizedin heat maps, generated in R using the log2 normalized countsand the heatmap 0.2 method of the gplots library (Warnes et al.,2009).
Gene selection and Gene Ontology (GO)The sheep genome is not yet supported by most gene ontologyplatforms, therefore, downstream analyses were performed withorthologs in the human genome Homo sapiens. ToppGenes andToppCluster (Chen et al., 2009; Kaimal et al., 2010) were usedto test for functional annotation enrichment analyses of biologicprocess and pathway with a false discovery rate correction of 0.05(Franceschini et al., 2013). Gene Ontology was then performedwith Gorilla and significant networks (P < 0.03) were selectedfor further discussion (Bauer et al., 2008; Eden et al., 2009).
Quantitative Real-Time PCR AnalysisThe expression profiles of candidate genes were validated by real-time qRT-PCR. Total RNAs were subjected to cDNA synthesis
Frontiers in Cellular Neuroscience | www.frontiersin.org 5 August 2015 | Volume 9 | Article 294

Cao et al. Fetal microglia in vivo and in vitro
using a QuantiTech Rev. Transcription Kit (Qiagen). HMOX1and FBPmRNA were quantified by qRT-PCR using a QuantiFastSYBR Green PCR Kit (Qiagen) with STRATAGENE 3000 P,mRNA relative expression was calculated by the 2−11Ct methodover housekeeping gene GAPDH compared to baseline (Livakand Schmittgen, 2001). Sheep specific HMOX1 primers weredesigned with primer3 (Untergasser et al., 2012) and FBP primerswere designed using Integrated DNA Technologies online tooland listed in Table 1.
Statistical AnalysesGeneralized estimating equations (GEE) modeling was usedto assess the effects of LPS while accounting for repeatedmeasurements on fetal blood gasses and acid-base status,plasma and in vitro cytokines, cardiovascular responses [AR(1)correlation matrix to account for temporal structure] and in vivoIba1+ fluorescence (independent correlation matrix to deal withthe spatial distribution of Iba1+ fluorescence across the brainregions). We used a linear scale response model with LPSand time or brain regions as predicting factors to assess theirinteractions using maximum likelihood estimate and Type IIIanalysis with Wald Chi-square statistics. Correlation analysiswas performed using Spearman correlation coefficient. SPSSVersion 21 was used for these analyses (IBM SPSS Statistics,IBM Corporation, Armonk, NY). Significance was assumed forp < 0.05. Results are provided as means ± SEM. Not allmeasurements were obtained for each animal studied.
Results
In vivo StudiesCohorts’ CharacteristicsMaternal venous blood gasses, pH, and lactate did notsignificantly change during the experiments and were withinphysiological range throughout the experiment for both groups.Maternal and fetal cohort’s characteristics are summarized inTable 2. Gestational age at time of the experimental day 1averaged 130 days ± 1.3 dGA (term 145 dGA). Overall, motherand fetus were considered healthy based upon a physicalexamination and laboratory data collected.
Clinical-chemical DataClinical-chemical data, reported elsewhere, (Durosier et al., 2015)are summarized in Table 2 and were within physiological rangefor both groups. We found significant time∗LPS interactions forpH (P = 0.03), pO2, pCO2, lactate, and BE (all P < 0.001).
TABLE 1 | Primers of quantitative real time PCR analysis of HMOX1 and
FBP.
Gene Forward Reverse
name
HMOX1 CACCAAGTTCAAGCAGCTGT CAACCCTGCGAGAAATGTCC
FBP CGAATGTGACGGGAGATCAA GGCATGTTTGTCTTCTTCTGAC
GADPH TGAGATCAAGAAGGTGGTGAAG GCATCGAAGGTAGAAGAGTGAG
Cardiovascular AnalysisAs reported (Durosier et al., 2015), we found time-LPSinteractions for mean arterial blood pressure and fetal heart rateresponses (P = 0.015 and P < 0.001, respectively).
Plasma Cytokines Response to LPSIn vivo LPS exposure resulted in a peak of IL-6 at 3 h compared tobaseline. We detected time-LPS interaction for fetal plasma IL-6(P < 0.001, Figure 1B).
In vivo LPS Effect on NeuroinflammationTo assess the effect of in vivo LPS exposure onneuroinflammation in situ we measured microglial activationas Iba1+ immunofluorescence signal. We found a significantbrain region main effect (p < 0.001), but no group main effect(p = 0.62) and no significant brain region∗group interaction(p = 0.13) (Figure 1C). Thus, in vivo LPS exposure did not causeany measurable neuroinflammation as can be seen with higherdoses of LPS using the same microglia marker (Keogh et al.,2012; Kuypers et al., 2013).
Overall, fetuses responded to the in vivo LPS exposure withsigns of moderate sepsis as evident by the changes observed witharterial blood gas, pH, lactate, but with no signs of cardiovasculardecompensation. Despite the systemic response to the LPSchallenge, we observed no signs of neuroinflammation in vivo.
In vitro StudiesHaving established a moderate LPS-induced in vivo fetal systemicinflammation paradigm without overt neuroinflammation insitu, we next aimed to test the functional properties ofmicroglia exposed to LPS in vivo in an in vitro settingallowing characterization of microglial cytokine secretion andtranscriptome profiles in response to LPS.
Primary Fetal Sheep Microglia CultureIn vitro studies were conducted in primary cultures derived fromsix controls (naïve) and from two in vivo LPS-exposed animals(SH). We were able to perform 1–2 in vitro replicates per eachanimal depending on cell numbers obtained.
TABLE 2 | Maternal and fetal in vivo clinical characteristics.
Characteristics Maternal* Fetal**
Averaged body weight (kg) 76± 11 3.8± 0.9
Gender: control group, male 5/9
Gender: LPS group, male 4/12
Parity: control group 7/9
Parity: LPS group 3/12
pO2 (mmHg) 54± 6 20± 1
pCO2 (mmHg) 41± 2 52± 2
pH 7.44± 0.01 7.37± 0.04
Lactate (mmol/L) 0.7± 0.2 1.5± 0.9
BE (mmol/L) 1.1± 0.2 3.3± 2.3
*Values averaged over the course of the experiment, mean ± SEM.
**Baseline characteristics averaged for control and LPS groups.
Frontiers in Cellular Neuroscience | www.frontiersin.org 6 August 2015 | Volume 9 | Article 294

Cao et al. Fetal microglia in vivo and in vitro
We identified oligodendrocytes and neurons in the initialcell isolation in addition to microglia and astrocytes (data notshown). To enrich for microglia we subjected the cells to asecond step as detailed in Methods. To verify cell culture purity,we performed immunofluorescence staining with a microgliamarker confirming that the isolated primary microglia was veryhigh (Figure 2A), whereas an astrocyte marker, GFAP, was absentfrom the cell population. To further verify cell purity, flowcytometry CD11b-FITC antibody was performed resulting in96% of cultured cells are CD11b+ (Figure 2B), further indicatingthat a highly pure microglia population was obtained.
We used the purified highly enriched microglia cultures topursue the second hit paradigm, i.e., how these cells behavein vitro in dependence on previous in vivo LPS exposure(Figure 1A). We found that microglia from in vivo LPS exposedfetal brain differ in morphology, showing more aggregation orclumping compared to naïve microglia (Figure 2C). This findingindicates that these microglia might have already been activatedby LPS exposure in vivo.
Next, we investigated cytokine secretion properties of thesecells in the absence or presence of LPS. For IL-1β, we foundthat in vitro LPS administration resulted in increased IL-1β inmicroglia compared to control cell cultures; this IL-1β responsewas potentiated by 4.6-fold in cells derived from animals within vivo LPS exposure: 1884 ± 481 pg/ml vs. 406.14 ± 193 pg/ml(all p < 0.001, Figure 2D). Moreover, even in the absence ofLPS in vitro, at baseline, microglia from the in vivo LPS groupsecreted more IL-1β (208.1 ± 16.63 pg/ml vs. 44.97 ± 59.21pg/ml) with the fold increase being concordant with the levelof gene expression increase (all P < 0.001, Table 3). Otherpro-inflammatory cytokines of interest such as IL-6 and TNF-α were undetectable in cell-conditioned media (ELISA data notshown). Our findings suggest that a pro-inflammatory microglialphenotype acquired during in vivo exposure to LPS is sustainedin vitro (second hit paradigm).
RNAseq Approach
General overview of the whole transcriptome sequencingTo explore the genomic landscape of fetal sheep microglia,we sequenced the transcriptome of naïve and “second hit”microglia. As a quality control, we tested the expression levels ofGFAP and TNFα across our three comparisons, and confirmedthat all cells in our platform shared the same gene expressioncharacteristics of microglia (Table 3). As a control measurefor cell purity, our data confirmed the presence of TGF-β1in each sample, as previously reported (Butovsky et al., 2014).To further confirm cell purity and the findings on proteinlevel (ELISA), our transcriptome analysis showed a 1.654-fold increase of IL-1β (log2 = 0.726) between naïve andsecond hit LPS-exposed microglia (Table 3, respectively NL
and SHL).Firstly, we compared gene expression between the naïve
controls and naïve LPS-exposed microglial cells. We found 258differentially expressed genes (padj < 0.1), among which, 205genes were up regulated and 53 were down regulated. Weselected relevant differentially expressed genes with ToppCluster
(logP > 4.00) based on their role in the immune response(Figures 3A,B).
Then, to better understand the effect of an in vivo pre-exposure to LPS on biological processes, we compared geneexpression between the naïve and second hit controls, i.e., NC andSHC, respectively. We found 6642 differentially expressed genes,among which, we identified 4112 up regulated and 2530 downregulated genes. Selection of relevant genes with ToppCluster(logP > 4.00) showed that up regulated genes in SHC are mainlycomposed of GABA genes and genes responsible for calcium,potassium, and second messengers transport. Differentiallyexpressed down regulated genes comprised the genes of the NF-κB signaling pathway and the HMOX1 gene, responsible for ironmetabolism (log2 = −4.462 and padj = 4.22× 10⁻¹⁹).
Finally, in an effort to discover the differences in responsebetween NL and SHL, we compared gene expression of the NL
set of three replicates and SHL (n = 1). We identified a totalof six differentially expressed genes: five were up regulated andone gene, HMOX1, was strongly down regulated (HMOX1down,log2 = −4.303 and padj = 8.13 × 10⁻²). Among thefive differentially up regulated genes identified, Fructose-1,6-bisphosphatase (FBP) was uniquely differentially expressed insecond hit LPS-exposed microglia (FBPup, log2 = 4.057 andpadj = 9.40 × 10⁻²). The expression profile of HMOX1 andFBP were assessed by quantitative real-time PCR (qRT-PCR).The results showed that the expressions of HMOX1 and FBPwere consistent with the expressions from the transcriptomeanalyses (Figures 4A,B). The roles of these genes are discussedbelow.
Discussion
We established for the first time an in vivo–in vitro endotoxindouble-hit mammalian microglia experimental model to mimicmultiple perinatal neuroinflammation episodes. The isolation ofviable and highly purified microglia populations from in vivoLPS-exposed brain allowed an in vitro characterization of this celltype. Our most striking discovery was that the fetal inflammatorymicroglial phenotype acquired during in vivo exposure toLPS, even if not histologically apparent, is sustained andpotentiated in vitro upon re-exposure to LPS. The subsequentRNA sequencing of the microglial genome revealed a uniqueHMOX1down and FBPup phenotype of microglia exposed to thedouble-hit, suggesting interplay of inflammatory and metabolicpathways.
In vivo–In vitro Model of Perinatal InflammationDouble-hitIntrauterine exposure to inflammatory stimuli may switch innateimmunity cells such as macrophages and microglia to a reactivephenotype (“priming”). Confronted with renewed inflammatorystimuli during labor or postnatally (especially in pretermneonates in the intensive care unit), such sensitized cells cansustain a chronic or exaggerated production of proinflammatorycytokines associated with neurodevelopmental deficits persistinginto adulthood (double-hit hypothesis) (Larouche et al., 2005;Spencer et al., 2006; Wang et al., 2006).
Frontiers in Cellular Neuroscience | www.frontiersin.org 7 August 2015 | Volume 9 | Article 294

Cao et al. Fetal microglia in vivo and in vitro
TABLE 3 | Gene expression summary in naïve (one time exposure to LPS in vitro) and second hit (exposed once in vivo and second time in vitro) microglia.
Relevance Gene name (Common name) Naïve microglia Second hit control Second hit
Activated mitochondrial biogenesis SLC2A4 6.386 8.911 0.821
PPARGC1A 4.842 5.835 1.466
Adipocytokine signaling pathway CAMKK1 −1.110 0.511 −0.205
CAMKK2 0.660 1.206 0.453
Adiponectin ADIPOQ 2.422 4.588 1.137
Adrenoceptor alpha 1A ADRA1A 2.572 4.687 −0.471
AMPK signaling pathway PRKAA1 0.169 0.218 −0.643
PRKAA2 2.776 4.784 1.774
PRKAB1 −0.189 −1.319 −2.603
PRKAB2 0.861 0.179 0.066
PRKAG1 −0.379 −3.249 −2.168
PRKAG2 −0.405 −1.194 −0.513
PRKAG3 −1.329 0.099 −0.050
B-cell development and survival TNFSF13B (BAFF) 2.562 −0.955 −1.823
Calcium binding protein 39 CAB39 0.279 −1.520 −1.583
CAB39L −0.076 −1.092 −1.106
Esterase enzyme ACHE −0.036 −0.978 −0.698
BCHE −0.475 −3.197 −1.782
Fractalkine/CX3CR1 axis and biological signature of CX3CR1 2.017 3.079 0.880
microglial cells CX3CL1 0.618 −0.443 0.076
ITGAM (CD11b) 0.130 −0.113 −1.083
IL1B 7.578 1.766 0.726
Fructose-1,6-Biphosphate FBP −0.792 1.465 4.057
Gluconeogenesis and glucolysis ALDOA −0.106 −0.485 0.355
ALDOB −1.659 −1.842 −2.033
ALDOC −0.266 −0.717 0.328
PFKP −0.461 −0.228 0.686
GPI −0.940 −2.001 −0.363
Growth, proliferation, fate determination, ELAVL1 −0.252 −0.986 −0.895
development, immunity CCNA1 2.574 6.259 2.854
CCNA2 0.143 0.098 0.686
IRF9 (p48) 0.407 −1.286 −0.641
PIM1 3.108 −0.815 −2.762
EP300 (CBP) 0.784 0.638 −1.094
CREBBP (CBP) 0.881 0.752 −0.835
CISH (CIS) 7.170 2.217 −2.097
HDAC genes: potential epigenetic regulators HDAC1 2.271 0.145 0.676
HDAC10 −0.242 −0.840 0.116
HDAC11 −0.214 0.867 0.812
HDAC2 −0.299 −2.746 −2.423
HDAC3 0.045 −0.692 0.321
HDAC4 1.292 1.502 −0.691
(Continued)
Frontiers in Cellular Neuroscience | www.frontiersin.org 8 August 2015 | Volume 9 | Article 294

Cao et al. Fetal microglia in vivo and in vitro
TABLE 3 | Continued
Relevance Gene name (Common name) Naïve microglia Second hit control Second hit
HDAC5 −0.869 0.333 0.501
HDAC6 −0.688 −0.126 −0.430
HDAC7 −0.109 0.643 −0.486
HDAC8 0.336 −0.889 −2.510
HDAC9 0.732 1.556 −1.816
Increased FFA oxidation CPT1A −0.260 0.631 0.100
CPT1B 0.496 1.140 0.304
CPT1C 0.608 0.315 0.503
Inhibit cell growth and protein synthesis RPS6KB1 −0.078 −1.659 −1.444
RPS6KB2 −0.569 −1.900 −0.634
EIF4EBP1 −0.822 −2.609 −1.533
PPARG2 −2.093 −2.107 −0.656
Inhibit protein synthesis EEF2 −0.005 0.210 0.421
EEF2K −0.394 0.208 −0.321
Initiators of the JAK-Stat pathway JAK1 0.213 −1.404 −2.112
JAK2 2.289 0.000 −1.430
JAK3 2.965 2.121 −0.920
TYK2 0.948 −0.296 −0.929
STAT1 −0.136 −0.825 −0.563
STAT2 1.276 −1.321 −2.852
STAT3 0.660 −2.050 −0.889
STAT5A 3.365 −0.188 −2.798
STAT5B 1.554 −0.436 −1.093
Insulin signaling pathway IGF1 1.601 2.264 1.177
IGF1R −0.125 −0.489 −0.838
IRS1 1.241 2.665 0.344
IRS4 4.420 7.086 1.953
Iron metabolism and/or anti-inflammatory HMOX1 −2.686 −4.462 −4.303
NRF-2 0.855 −1.235 −1.225
JNK/P38 MAPK MAPK8 (JNK) 0.544 −2.918 −1.173
MAPK9 (JNK) −0.266 −2.257 −2.853
MAPK10 (JNK) 1.492 3.024 −0.262
MAPK12 (P38) −0.905 −0.708 0.458
MAPK13 (P38) 3.294 3.173 0.171
MAPK14 (P38) −0.848 −0.612 0.113
Leptin LEP 5.033 7.429 −0.143
LRP phagocytosis signaling LRP1B 4.522 6.380 0.336
LRP2 4.860 6.571 1.410
LRP6 1.052 1.850 0.157
Lymphocyte adhesion, T-cell costimulation ICAM-1 4.055 −0.181 −2.801
Lymphoid-tissue homing CCL21 18.917 20.916 0.368
CCL19 5.439 5.328 −0.321
mTOR signaling pathway RHEB −0.257 −3.516 −2.292
(Continued)
Frontiers in Cellular Neuroscience | www.frontiersin.org 9 August 2015 | Volume 9 | Article 294

Cao et al. Fetal microglia in vivo and in vitro
TABLE 3 | Continued
Relevance Gene name (Common name) Naïve microglia Second hit control Second hit
AKT1S1 0.908 −0.657 −1.496
MTOR −0.107 −0.234 −1.066
RPTOR 0.298 0.361 −0.625
Myeloiesis and B-cell lymphopoiesis CXCL12 (SDF-1alpha) −0.545 1.552 0.268
NF-kB signaling and inflammation RELB 1.503 −1.389 −1.227
NFKB 2.676 −0.323 −0.200
NFKBIA 2.578 −1.934 −1.546
NFKB1 (p50) 2.569 −0.801 −2.673
RELA (p65) −0.031 −2.098 −2.268
PTGS2 5.166 −0.609 −2.168
TNF 4.990 0.028 −2.743
PTGS2 5.166 −0.609 −2.168
IL8 4.779 −2.847 −3.988
IL1B 7.578 1.766 0.726
TNFAIP3 2.628 −0.542 −3.162
Nitric oxide (NO) and NO production NOS1 6.201 8.416 1.233
NOS1AP 0.386 −0.599 −1.393
NOS2 5.951 3.039 −1.958
NOS3 5.266 7.637 1.112
P53 TP53 −0.554 −0.379 −1.539
MDM4 3.489 −13.081 −1.120
PIK3-Akt signaling pathway PIK3CA 0.018 −1.584 −1.561
PIK3CB 1.793 −0.972 −1.750
PIK3CG 1.950 1.106 −0.094
PIK3R1 1.330 −1.533 −1.884
PIK3R3 1.083 2.066 −1.507
PIK3R5 4.343 2.695 −0.635
PDPK1 0.915 0.946 −0.606
AKT2 −0.335 −0.857 −1.328
AKT3 0.350 0.104 −1.292
TSC1 1.099 0.940 −0.386
TSC2 0.219 0.587 1.182
Quality control TGFBR1 0.327 0.158 −0.943
TGFβ −0.419 −1.798 −0.690
GFAP −1.044 −5.512 −3.709
ITGAM (CD11b) 0.130 −0.113 −1.083
CD40 4.656 2.831 1.352
IBA1 (AIF1) 0.060 0.208 0.956
Serine/threonine kinase 11 STK11 −0.178 −1.553 −1.491
STE20-related kinase adaptor alpha STRADA −0.536 −1.252 −1.293
STRADB −0.506 −2.816 −3.582
Tak1 protein MAP3K7 −0.057 −0.809 −2.136
Toll-like receptor 4 TLR4 0.807 −2.451 −3.749
LY96 (MD-2) 1.213 0.263 0.340
LBP 4.472 5.990 0.172
(Continued)
Frontiers in Cellular Neuroscience | www.frontiersin.org 10 August 2015 | Volume 9 | Article 294

Cao et al. Fetal microglia in vivo and in vitro
TABLE 3 | Continued
Relevance Gene name (Common name) Naïve microglia Second hit control Second hit
Transcription factors C-JUN 0.795 −1.539 −2.385
C-FOS (FOS) −3.072 −1.635 −0.317
NFKB 2.676 −0.323 −0.200
CREB1 0.782 −0.228 0.190
ATF4 (creb TF) 0.968 −0.319 0.163
CEBPB (CEBP) 0.586 −0.993 −1.451
Bold values correspond to a significant log2 fold change (padj < 0.1).
Differential analysis of the count data was done with the DESeq2 package; up regulated genes are highlighted in red and down regulated genes are highlighted in blue. Values in the
column “naïve cells” correspond to fold change from the naïve controls (NC ) to LPS-exposed microglia (NL). In the same way, we compared second hit control (SHC ) to the NC. Fold
changes are summarized in the column “second hit control.” Values in the “second hit” column represent the fold change from NL to second-hit, i.e., LPS re-exposed, (SHL) microglia.
Experimentally induced inflammation in chronicallyinstrumented non-anesthetized fetal sheep is a well-establishedin vivo model of fetal physiology (Prout et al., 2010, 2012).Primary microglia cultures in different species have beenreported for decades (Stansley et al., 2012). We integratedboth in vivo and in vitro models into a new, hybrid systemadding the layer of the whole transcriptome analysis usingRNAseq analyses. The chief advantage of the new in vivo–in vitromodel presented here is that it allows us to examine microgliaresponses to LPS-induced double-hit inflammation in situ andin vitro on integrative physiological, protein and genomic levels,and in a physiologically and clinically meaningful context.This approach has the potential to uncover hitherto unseenrelationships between brain and immune system on differentscales of organization in the perinatal stage of development,which might accelerate discovery of new treatment strategies.
In vivo, our experimental cohort’s morphometric, arterialblood gasses, acid-base status and cardiovascular characteristicswere within physiological range and representative for late-gestation fetal sheep as a model of human fetal development nearterm (Frasch et al., 2007; Rurak and Bessette, 2013). As reportedelsewhere (Durosier et al., 2015), the effect of the low LPS dosewe administered on the arterial blood gasses, acid-base status andcardiovascular responses is compatible with a mild septicemia(mild compensated metabolic acidemia and hypoxia) evidencedby a transient rise of IL-6 at 3 h without overt shock, i.e., withoutcardiovascular decompensation. Similar levels of systemic IL-6have been reported (Prout et al., 2010).
In vitro, we developed a new microglia isolation protocolthat combines the human adult and fetal brain microgliaisolation protocols (Durafourt et al., 2013) and successfullycollected a highly enriched microglia population. The use of amodified cell isolation approach from fetal brain tissue is mainlydue to the higher degree of myelination in the adult humanbrain compared to that of a near-term fetus (Durafourt et al.,2013). We were able to attain high purity of microglia, whichwe validated by flow cytometry and immunocytochemistry.Moreover, RNAseq showed a consistent and constant low level ofexpression of the astrocyte marker GFAP further confirming cellpurity.
In this study, the morphology of microglia from in vivo LPSexposed fetal brain was distinguished by more aggregation or
clumping and less ramification compared to naïve microglia(Suzuki et al., 2006; Henkel et al., 2009). This suggests thatmicroglia exposed to LPS in vivomay have been already activatedbefore plating in cultures.
Single-hit LPS Exposure In vitro Results in UpRegulation of Inflammatory Pathways JAK-STATand NFKB and Down Regulation of MetabolicPathwaysGene ontology analyses of DE genes in NL microglia revealedan up regulation of inflammatory pathways NFκB, PIK3-Akt,and Jak-STAT. Interestingly, this was accompanied by a downregulation of metabolic pathways in LPS-induced inflammatoryresponse (Figures 3A,B and Table 3). These findings may beexplained, at least in part, by the emerging role of energy-sensingAMPK signaling in microglia, which links the inflammatory andmetabolic regulatory networks (Frasch, 2014), We will returnto this observation in Section Double-hit LPS Exposure ofMicroglia In vivo and In vitro Is Uniquely Characterized By aHMOX1down/FBP
up Phenotype.Among differentially expressed genes selected, NFKB (log2 =
2.676 and padj = 4.58 × 10⁻²) and JAK3 (log2 = 2.965
padj = 2.49 × 10⁻³) were up regulated in NL microglia.We then investigated the expression of genes involved in theNFκB and JAK-Stat pathways; our data showed that IL1B(log2 = 7.578), TNF (log2 = 4.990), NFKBIA (log2 = 2.578and padj = 9.09 × 10⁻²), and RELB (log2 = 1.503) were upregulated in NL microglia. Gene ontology analysis revealed downregulation of the energy consuming processes and up regulationof energy conserving processes, as evidenced by the downregulation of genes related to glycolysis (GPI) and up regulationof gluconeogenesis (FBP) and the insulin signaling pathway.Furthermore, Gene Ontology of up regulated genes revealed thatthe GO term “immune system process” clustered key genes ofinflammatory pathways, such as, JAK3, NFKBIA, and NFKBIB(GO:0002376 and P = 9.56 × 10⁻⁸). Differentially expresseddown regulated genes also affected “the immune system process”(GO:0002376 and P = 3.24 × 10⁻⁴) and cellular response tometal ion (GO: 0071248 and P = 6.05 × 10⁻⁶). HMOX1 andFOS clustered in both GO terms underlying the potential role ofHMOX1 in the immune system in relation with FOS. Analysisof all down regulated genes showed that the “metabolic process”
Frontiers in Cellular Neuroscience | www.frontiersin.org 11 August 2015 | Volume 9 | Article 294

Cao et al. Fetal microglia in vivo and in vitro
FIGURE 3 | Heat maps of the gene expression in microglia cells
exposed to LPS. Selected up regulated (red) and down regulated (blue)
genes are listed; genes were selected with ToppCluster based on their
significance in the immune response (logP > 4.00) (A) Heat map of 205
differentially expressed (padj < 0.1) up regulated genes (red) in NL microglia.
(B) Heat map of 53 differentially expressed down regulated genes in NL
microglia, among selected genes indicated in blue, HMOX1 was strongly
differentially expressed (log2 = −2.686 and padj = 3.09× 10⁻⁸). In both up
and down regulated genes, we observed a different behavior for NL3 that did
not affect our differential analysis. (C) Heat map of the 4112 most
differentially expressed and up regulated genes in SHC compared to NC
cells. Selected genes with ToppCluster (logP > 4.00) include GABA receptor
genes and genes related to the transport of ion, Calcium, Sodium, and
Potassium. IL1B was up regulated with log2 = 1.766 (padj = 1.53× 10⁻³)
corresponding to a 3.40-fold increase (D) Among the 2530 most differentially
expressed and down regulated genes identified, HMOX1 was significantly
down regulated (log2 = −4.462 and padj = 4.22× 10⁻¹⁹). The reported
genes were selected with ToppCluster (logP > 4.00) for their implication in
the inflammatory response. (E) Differentially expressed up and down
regulated genes in SHL compared to NL microglia. HMOX1 was the only
down regulated gene (log2 = −4.303, padj = 8.13× 10⁻²). When comparing
common genes in SHC and SHL cells, the gene FBP was unique to SHL (red
rectangle). NC, Naïve control microglia; NL, Naïve LPS-exposed microglia;
SHC, Second hit control microglia; SHL, Second hit LPS-exposed microglia.
(GO:0008152 and P = 2.38 × 10⁻⁸) was also globally affected(data not shown).
Double-hit LPS Exposure of Microglia In vivo andIn vitro is Uniquely Characterized By aHMOX1down/FBP
up PhenotypeInterestingly, HMOX1 gene expression showed a strong downregulation in SHL and SHC by four-fold (Table 3, Figures 3D,E).The level of expression of HMOX1 was higher in SHC than inSHL (log2 = −4.462 and padj = 4.22 × 10⁻¹⁹; log2 = −4.303
and padj = 8.13 × 10⁻², respectively). Such differences inresponse patterns were observed in other genes as well suggesting
a memory of inflammation induced by pre-exposure to LPS invivo.
HMOX1 role in microglia is yet to be fully understood.
Across the three group comparisons (Figure 1A), HMOX1 was
significantly down regulated and in vivo pre-exposure to LPSseemed to further enhance the down regulation of HMOX1 in
response to second-hit in vitro LPS stimulation. We confirmed
by RT-PCR that transcript amounts of HMOX1 are low in NL
and SHL microglia (Figures 4A,B). HMOX1 was suggested to
play an anti-inflammatory role in LPS-induced murine adult cellline macrophages via the activation of the Nrf2/ARE pathway(Ye et al., 2014). Pre-treatment with Oroxylin A, an inhibitor of
Frontiers in Cellular Neuroscience | www.frontiersin.org 12 August 2015 | Volume 9 | Article 294

Cao et al. Fetal microglia in vivo and in vitro
FIGURE 4 | Validation of RNAseq findings by qRT-PCR analysis of
HMOX1 and FBP. (A) Quantification of HMOX1 in each NL microglia
compared to averaged-NC. (B) Quantification of HMOX1 and FBP in SHL
compared to averaged-NL microglia. Avg, Averaged; NC, Naïve control
microglia; NL, Naïve LPS-exposed microglia; SHL, Second hit LPS-exposed
microglia.
LPS-induced mRNA, substantially increased the levels of NRF-2and heme oxygenase 1. The response of SHC and SHL comparedto their single-hit microglia counterpart NL showed thatHMOX1and NRF-2 had a greater down regulation after pre-exposure toLPS in vivo (Table 3), supporting the potential role of HMOX1in the inflammatory response and as a determinant of microglialphenotype.
While the role of FBP in inflammation is unclear, itsneuroprotective effect in brain injury models was suggestedthrough various mechanisms. During hypoxia, FBP supportsATP production via stimulation of glycolysis which resultsin maintenance of normal intracellular calcium levels via thephospholipase-C dependent MAP kinase signaling pathway(Bickler and Kelleher, 1992; Fahlman et al., 2002). Whencomparing gene expression in SHC (Figures 3C,D), we observedthat genes responsible for the transport of calcium, potassiumand second messengers were also differentially expressed and upregulated.
It was previously reported that FBP dose-dependentlysuppressed LPS-induced nitric oxide (NO) production, andhigher FBP doses were also associated with decreased levels of thetranscription factor activator protein AP-1 in primary neonatalmurine microglia cultures (Kim et al., 2012). We confirmedthis observation in our comparison of SHL to SHC, whereinwe observed that up regulation of FBP was concordant withlower expression of NOS1AP (log2 = −1.393) suggesting lowerproduction of NO. We also observed that lower FBP transcriptsamount in NL was accompanied by higher expression level ofNOS production related genes (Table 3). The authors observedthat FBP had an effect on the binding of transcription factors toDNA: FBP diminished the binding of AP-1 to DNA, but NFKBand CREB did not seem affected. We found down regulation ofAP-1 (log2 = −2.385) and a slight down regulation of NFKBand CEBP, though CREB1 remained unaffected. In the SHL, ourresults confirmed that DNA binding nuclear factors were notstrongly down regulated upon higher transcript level of FBP.The authors suggested that FBP inhibits iNOS expression byblocking the JNK/p38 MAPK pathway. We confirmed that JNKrelated genes may have lower expression level, however we didnot observe any marked difference for P38.
A common theme within the newly foundHMOX1down/FBP
up phenotype appears to be its memoryof the “energy restoring direction” following in vivo exposureto LPS. This metabolic effect is evidenced for example byup regulation of AMPK, insulin, growth arrest processes,mitochondrial biogenesis signaling pathways and downregulation of mTOR signaling pathway and such energyconsuming processes as cell growth and protein synthesis (cf.Table 3).
Does In vivo Endotoxin Exposure InduceTranscriptome Memory of Inflammation in FetalMicroglia Mediated By Epigenetic Mechanisms?Pre-exposure to LPS in vivo affected globally the transcriptomeof microglia (Table 3). We observed that SHC microglia hada diminished response in gene expression of inflammatorypathways NF-κB, JAK-Stat, and PIK3-Akt compared to thebehavior of the NL microglia; this phenomenon was sustainedin SHL microglia. As mentioned in Section Double-hit LPSExposure of Microglia in vivo and In vitro Is UniquelyCharacterized By a HMOX1down/FBP
up Phenotype, this was alsotrue for the metabolic pathways. This desensitization was alsoobserved in histone deacetylase 1 (HDAC1 and 6), which wasDE up regulated by two-fold in NL (log2 = 2.271 and padj =
8.58× 10⁻²), and up regulated by less than one-fold in SHC andSHL (log2 = 0.676 and log2 = 0.145, respectively, Table 3).This HDAC1 profile was accompanied by a less than one-folddown regulation of HDAC6 (log2 = −0.688 and padj = 8.75 ×
10−2) followed again by desensitization in microglia exposed toLPS in vivo. HDAC4 was 2.5-fold up regulated (log2 = 1.292and padj = 0.133) in NL vs. NC microglia followed also bydesensitization in the comparison to the in vivo pre-exposedmicroglia; meanwhile,HDAC2 showed a less than one-fold downregulation (log2 = −2.746 and padj = 2.30 × 10⁻⁴) in NC vs.SHC microglia, with no detectable change in microglia exposedto LPS in vitro only or upon double-hit exposure. In parallel,HMOX1 was down regulated by four-fold in SHL and SHC,and by two-fold in NL microglia, and did not seem to havea diminished response in SHL. These findings underscore thepotential role of HDAC1, 2, 4, and 6 in the memory of the
Frontiers in Cellular Neuroscience | www.frontiersin.org 13 August 2015 | Volume 9 | Article 294

Cao et al. Fetal microglia in vivo and in vitro
in vivo exposure to inflammation in line with the histone codehypothesis (Jenuwein and Allis, 2001).
In light of the putative epigenetic mechanisms underlying ourfindings of single- and double-hit LPS signatures in microglialtranscriptomes, it remains to be tested whether these signaturesare indeed unique to LPS or apply more widely for perinatalexposures to other stressors, such as the psychosocial stress, e.g.,caused by fear (Shapiro et al., 2013; Monteleone et al., 2014;Metz et al., 2015). Forced-swim stress applied over 4 days inadult male mice induced changes lasting at least two followingweeks in neuronal acetylcholine esterase (AChE) expression viaan epigenetic mechanism of hypoacetylation, with near-exclusiveenrichment of HDAC4, and hypermethylation of histone H3K9at a specific promoter of AChE (mP1c) with resulting suppressionof the mE1c exon expression levels (Meshorer et al., 2002; Sailajaet al., 2012). Interestingly, a non-exclusive increase of HDAC-1,2, and 7 was also detected. Animals showed anxiety-like behaviorand this behavior as well as the AChE chromatine structure andthe entire HDAC enrichment profile were reversed by NaBu,an HDAC inhibitor; the restoration of mE1c expression levelwas however due to HDAC4 inhibition entirely. AChE-R is thealternative splicing soluble variant of AChE-S in neurons; AChE-R production increases under various stress influences (Soreqand Seidman, 2001). This splicing switch can be induced byshort-lasting (minutes) stress exposures, but can then last forweeks as shown in adult neuronal and hippocampal slice cultures(Meshorer et al., 2002; Sailaja et al., 2012). NaBu restored thissplicing switch with regard to reduction in AChE-R, although therenewed increase of AChE-S variant was incomplete compared tothe non-stressed animals. This finding is particularly interesting,as it sheds a new light on how stress may modulate inflammationvia epigenetic mechanisms impacting the pro-inflammatoryAChE. AChE inhibition restricts inflammation not only in theperipheral organs, but also in the brain (Pollak et al., 2005). Theincomplete restoration of AChE-S suggests a complex regulatorynetwork controlling AChE-S/AChE-R ratio in response tostress. Ultimately, such shifts in AChE presence in intercellularspace may have long-lasting effects on cholinergic transmissionwith regard to cognition (cf. Section Microglial LRP-mediatedNeuronal Phagocytosis May Be Enhanced By In utero Exposureto Inflammation) and neuroinflammation. Adding to thecomplexity of epigenetic regulation of cholinergic signaling andneuroinflammation, microRNA (miRNA)-132 has been shownin adult murine model and cell lines to potentiate cholinergicanti-inflammatory signaling in the periphery, myeloid cells inparticular, and in the brain by inhibiting AChE expression(Shaked et al., 2009). The role of miRNA-132 in microglia isnot yet known, but the evidence is growing for the overallimportance of miRNA signaling in determining the polarizationand phenotype of microglia and myeloid cells in general(Ponomarev et al., 2013).
Fear represents a model system to study chronic impactof stress on epigenome and cardiovascular system (Shenhar-Tsarfaty et al., 2015). As noted above, this approach mayrelate conceptually to our current findings bringing togetherthe effects of in vivo endotoxin exposure as a stressor on thebrain’s microglial transcriptome and the cardiovascular system.
Interestingly, changes in miRNA-608 activity on AChE bindingsites in the brain (e.g., due to single nucleotide polymorphisms,SNPs) concomittantly raise levels of anxiety and blood pressurein adult mice and humans by decreasing the inhibition ofAChE expression, while reducing CDC42 and IL-6 levels,important pro-inflammatory mediators (Hanin et al., 2014).This link between epigenetic signaling mechanisms, stress, andcardiovascular system is further strengthened by the recent study,in adult humans showing synergistic effects of fear as a stressor onheart rate and inflammation with cholinergic signaling playing acentral role in modulating both systems (Shenhar-Tsarfaty et al.,2014, 2015). We found an increase of heart rate and a slightdrop of blood pressure within the time frame of the IL-6 peakfollowing LPS injection to the ovine fetus (Durosier et al., 2015).However, this effect appeared to dissipate at 54 h following theinitial LPS exposure. Still, our experimental design does not allowdrawing conclusions whether such intrauterine exposure to low-dose endotoxin concentrationsmay induce lasting cardiovascularchanges along with alterations in innate immune responses uponrepeated exposure to inflammatory stimuli. This remains subjectof future studies. Interestingly, BCHE, but not ACHE, showedDE and less than one-fold down regulation (log2 = −3.197and padj = 6.86 × 10⁻³) in NC vs. SHC microglia, with nodetectable change in microglia exposed to LPS in vitro only orupon double-hit exposure; both BCHE and ACHE were also lessthan one-fold down regulated, but not differentially expressed inall other comparisons. In this regard, the potential role of serumcholinesterases as easily accessible biomarkers of neuroimmunefunction, along with heart rate variability monitoring, presentan attractive opportunity to translate these insights into bedsideapplications to improve perinatal health outcomes (Durosieret al., 2015; Lake et al., 2014; Shenhar-Tsarfaty et al., 2014).
In summary, microglia pre-exposed to inflammation in vivoseem to acquire a memory of inflammation that reflects on thetranscriptome by an overall decreased response in inflammatorypathways while the production of the pro-inflammatory cytokineIL-1β is up regulated. In light of the above discussion, ourfindings lend support to the notion of an inflammation memoryin SHC sustained in SHL microglia that may be mediated byepigenetic regulatory processes involving histone acetylation andmiRNA signaling. The intriguing link to the metabolic processesand cardiovascular system also deserves attention in futurestudies. Additional mechanistic studies (knockout, knockdown,or overexpression) are needed to validate these observations.
Microglial LRP-Mediated Neuronal PhagocytosisMay be Enhanced By In utero Exposure toInflammationCalreticulin (CRT) exposure on the surface of viable or apoptoticneurons is required for their phagocytosis via low-densitylipoprotein receptor-related protein (LRP) receptors on LPS-stimulated primary culture rat microglia (Fricker et al., 2012).We found that the gene LRP6 is significantly up regulated afterLPS exposure in vitro in NL microglia (log2 = 1.052 and padj =
2.76 × 10⁻²) and the activation of LRP6 is sustained in vitroin SHC microglia (log2 = 1.850 and padj = 5.58 × 10⁻³), i.e.,after the LPS exposure in vivo. LRP1B (log2 = 6.380 and padj =
Frontiers in Cellular Neuroscience | www.frontiersin.org 14 August 2015 | Volume 9 | Article 294

Cao et al. Fetal microglia in vivo and in vitro
5.66 × 10⁻⁵) and LRP2 (log2 = 6.571 and padj = 4.24 × 10⁻¹¹)were also strongly up regulated in SHC microglia. LRP1B andLRP2 showed a four-fold up regulation in NL microglia, however,adjacent p-values were not consistent to support this observation.
We show that a single LPS exposure in vivo or in vitro sufficesto up regulate LRP genes suggesting that in utero exposure toinflammation may alter microglial—neuronal communicationmaking CRT expressing neurons vulnerable to LRP-mediatedphagocytosis. Our data does not allow validating the idea thatdouble hit exposure to an inflammatory stimulus enhancesup regulation of microglial LRP, because we could not testdirectly SHL vs. SHC (cf. SectionMethodological Considerations,Discussion on limitations of RNAseq approach). Future studies,should estimate genetic expression profile of SHL comparedto SHC.
Methodological ConsiderationsWe could not detect any in situ neuroinflammation using Iba1, awell-established myeloid cell marker in sheep and other species.Despite the lack of overt neuroinflammation seen in situ wedemonstrated a pattern of LPS-induced systemic IL-6 cytokineproduction in vivo and microglial IL-1β cytokine secretionin vitro. This further supports the notion that even subtle LPSexposures in utero in vivo may polarize microglia toward aneuroinflammatory phenotype without or with secondary re-exposure to an inflammatory stimulus. The LPS-triggered rise ofIL-6 in plasma is in line with animal and human studies at thisdevelopmental stage (Duncombe et al., 2010; Chan et al., 2013).Microglia in vitro have been shown to secrete IL-1β preferentiallywhen challenged with LPS, while IL-6 secretion is a hallmark ofcultured astrocytes in rat (Gottschall et al., 1994). Our findingsare consistent with literature and further support the cell culturepurity.
In parallel to our team, the feasibility of creating a mixedprimary fetal ovine brain culture has been recently, demonstrated(Weaver-Mikaere et al., 2012). We have advanced this work byfocusing on late rather than mid-gestation fetuses and creatingprimary pure microglial culture rather than mixed culture. Thisallowed us to then study the microglia-specific effects of thedouble hit in vivo/in vitro LPS exposure on the secretion profileof the inflammatory cytokine IL-1β and the high-throughputtranscriptome.
In this study, we did not discriminate between the variousphenotypes of the endogenous microglia as well as the microgliarecruited to the brain during the inflammatory process viathe blood brain barrier, whose permeability increases underconditions of hypoxia/ischemia and fetal inflammatory response(Hutton et al., 2007, 2008; Butovsky et al., 2014; Yamasaki et al.,2014; Greter et al., 2015; Sadowska et al., 2015). Considering themild, low-dose LPS exposure, we speculate that no recruitmentof peripheral monocytes was triggered. However, we cannot statewith certainty whether the microglial memory of inflammationwas entirely newly established upon in vivo LPS exposure,or certain pre-existing sub-populations of microglia respondeddifferentially to the endotoxin; another possibility needingvalidation remains that progenitor cells from the peripherydifferentiated accordingly. Hence, future studies, perhaps using
single cell RNAseq, will elucidate whether the “memory”is entirely newly established, carried by a subpopulation ofendogenous or periphery-recruited microglia. Isolating singlecells and expanding them in culture may be another approachto test these hypotheses.
In our approach, we used DESeq2 to normalize readcounts and identify differentially expressed genes. DESeq2 wasspecifically designed to estimate differential expression in adataset containing replicates for both control and treatmentsamples. Our method used a large number of animals allowing usto have replicates for naïve control and LPS-exposed microglia.However, a limitation of our RNAseq analysis is the lack ofreplicates for SHC and SHL preventing us from comparingSHC to SHL directly. Other platforms meant to analyze sampleswithout replicate could have been used here. However, we chosenot to disrupt the analytical pipeline and keep the statisticalanalysis consistent throughout the analysis. Despite qualitycontrol measures prior to sequencing, the sample NL3 had adifferent expression pattern than the two other NL samples. Webelieve it is not related to RNA quality, and may have been dueto environmental or other physiological conditions of the animalthat we were not aware of at the time of the experiment. Ininterrogating the differential gene expression, we have ensuredthat the partially deviating pattern observed in sample NL3 didnot confound our findings (Figures 3A,B).
Conclusions
Inflammatory microglial phenotype acquired during in vivoexposure to LPS is sustained and potentiated in vitro upon re-exposure to LPS. We identified a uniqueHMOX1down and FBP
up
phenotype of microglia exposed to the double-hit. Our resultsalso suggest that microglia may have acquired in vivo a memoryof inflammation regulated by an epigenetic process that shouldbe confirmed by further epigenomic studies. This model allowsstudying mechanisms of fetal neuroinflammation in utero in vivoand in vitro to identify potential therapeutic targets for earlypostnatal intervention to prevent brain injury.
Acknowledgments
The authors thank Dora Siontas, Manon Blain for cell culture andICC, Lamia Naouel Hachehouche for help with setting up thesheep specific cytokine ELISA assay, Vania Yotova for RNAseqlibrary preparation, Jean-Christopher Grenier for alignment tothe reference genome and read count, St-Hyacinthe CHUV teamand M. Michel-Robinson for technical assistance. Supported bygrants from the Canadian Institute of Health Research (CIHR)(MF); Fonds de la recherche en santé du Québec (FRSQ) (MF)and Molly Towell Perinatal Research Foundation (MF); QTNPR(by CIHR) (LD).
Supplementary Material
The Supplementary Material for this article can be foundonline at: http://journal.frontiersin.org/article/10.3389/fncel.2015.00294
Frontiers in Cellular Neuroscience | www.frontiersin.org 15 August 2015 | Volume 9 | Article 294

Cao et al. Fetal microglia in vivo and in vitro
References
Agrawal, V., and Hirsch, E. (2012). Intrauterine infection and preterm labor.
Semin. Fetal Neonatal Med. 17, 12–19. doi: 10.1016/j.siny.2011.09.001
Ajmone-Cat, M. A., Mancini, M., De Simone, R., Cilli, P., andMinghetti, L. (2013).
Microglial polarization and plasticity: evidence from organotypic hippocampal
slice cultures. Glia 61, 1698–1711. doi: 10.1002/glia.22550
Anders, S., Pyl, T. P., and Huber, W. (2015). HTSeq—A Python framework to
work with high-throughput sequencing data. Bioinformatics 31, 166–169. doi:
10.1093/bioinformatics/btu638
Bauer, S., Grossmann, S., Vingron, M., and Robinson, P. N. (2008). Ontologizer
2.0–a multifunctional tool for GO term enrichment analysis and data
exploration. Bioinformatics 24, 1650–1651. doi: 10.1093/bioinformatics/btn250
Bickler, P. E., and Kelleher, J. A. (1992). Fructose-1,6-bisphosphate stabilizes
brain intracellular calcium during hypoxia in rats. Stroke 23, 1617–1622. doi:
10.1161/01.STR.23.11.1617
Bilbo, S. D., and Schwarz, J. M. (2009). Early-life programming of later-life brain
and behavior: a critical role for the immune system. Front. Behav. Neurosci.
3:14. doi: 10.3389/neuro.08.014.2009
Bilbo, S. D., and Tsang, V. (2010). Enduring consequences of maternal obesity for
brain inflammation and behavior of offspring. FASEB J. 24, 2104–2115. doi:
10.1096/fj.09-144014
Billiards, S. S., Haynes, R. L., Folkerth, R. D., Trachtenberg, F. L., Liu, L. G., Volpe,
J. J., et al. (2006). Development of microglia in the cerebral white matter of the
human fetus and infant. J. Comp. Neurol. 497, 199–208. doi: 10.1002/cne.20991
Bolton, J. L., Auten, R. L., and Bilbo, S. D. (2014). Prenatal air pollution
exposure induces sexually dimorphic fetal programming of metabolic and
neuroinflammatory outcomes in adult offspring. Brain Behav. Immun. 37,
30–44. doi: 10.1016/j.bbi.2013.10.029
Butovsky, O., Jedrychowski, M. P., Moore, C. S., Cialic, R., Lanser, A. J.,
Gabriely, G., et al. (2014). Identification of a unique TGF-beta-dependent
molecular and functional signature in microglia. Nat. Neurosci. 17, 131–143.
doi: 10.1038/nn.3599
Chan, C. J., Summers, K. L., Chan, N. G., Hardy, D. B., and Richardson,
B. S. (2013). Cytokines in umbilical cord blood and the impact of labor
events in low-risk term pregnancies. Early Hum. Dev. 89, 1005–1010. doi:
10.1016/j.earlhumdev.2013.08.017
Chen, J., Bardes, E. E., Aronow, B. J., and Jegga, A. G. (2009). ToppGene Suite for
gene list enrichment analysis and candidate gene prioritization. Nucleic Acids
Res. 37, W305–W311. doi: 10.1093/nar/gkp427
Duncombe, G., Veldhuizen, R. A., Gratton, R. J., Han, V. K., and Richardson,
B. S. (2010). IL-6 and TNFalpha across the umbilical circulation in term
pregnancies: relationship with labour events. Early Hum. Dev. 86, 113–117. doi:
10.1016/j.earlhumdev.2010.01.027
Durafourt, B. A., Moore, C. S., Blain, M., and Antel, J. P. (2013). Isolating,
culturing, and polarizing primary human adult and fetal microglia. Methods
Mol. Biol. 1041, 199–211. doi: 10.1007/978-1-62703-520-0_19
Durosier, L. D., Herry, C., Cortes, M., Cao, M., Burns, P., Desrochers, A.,
et al. (2015). Does heart rate variability provide a signature of fetal systemic
inflammatory response in a fetal sheep model of lipopolysaccharide-induced
sepsis? Physiol. Meas. (in press).
Eden, E., Navon, R., Steinfeld, I., Lipson, D., and Yakhini, Z. (2009). GOrilla: a tool
for discovery and visualization of enriched GO terms in ranked gene lists. BMC
Bioinformatics 10:48. doi: 10.1186/1471-2105-10-48
Fahey, J. O. (2008). Clinical management of intra-amniotic infection and
chorioamnionitis: a review of the literature. J. Midwifery Womens Health 53,
227–235. doi: 10.1016/j.jmwh.2008.01.001
Fahlman, C. S., Bickler, P. E., Sullivan, B., and Gregory, G. A. (2002). Activation
of the neuroprotective ERK signaling pathway by fructose-1,6-bisphosphate
during hypoxia involves intracellular Ca2+ and phospholipase C. Brain Res.
958, 43–51. doi: 10.1016/S0006-8993(02)03433-9
Fishman, S. G., and Gelber, S. E. (2012). Evidence for the clinical management
of chorioamnionitis. Semin. Fetal Neonatal Med. 17, 46–50. doi:
10.1016/j.siny.2011.09.002
Franceschini, A., Szklarczyk, D., Frankild, S., Kuhn, M., Simonovic, M., Roth,
A., et al. (2013). STRING v9.1: protein-protein interaction networks, with
increased coverage and integration. Nucleic Acids Res. 41, D808–D815. doi:
10.1093/nar/gks1094
Frasch, M. G. (2014). Putative role of AMPK in fetal adaptive brain shut-down:
linking metabolism and inflammation in the brain. Front. Neurol. 5:150. doi:
10.3389/fneur.2014.00150
Frasch, M. G., Müller, T., Wicher, C., Weiss, C., Löhle, M., Schwab, K.,
et al. (2007). Fetal body weight and the development of the control of
the cardiovascular system in fetal sheep. J. Physiol. 579, 893–907. doi:
10.1113/jphysiol.2006.124800
Fricker, M., Olíva-Martin, M. J., and Brown, G. C. (2012). Primary phagocytosis
of viable neurons by microglia activated with LPS or Abeta is dependent
on calreticulin/LRP phagocytic signalling. J. Neuroinflammation 9, 196. doi:
10.1186/1742-2094-9-196
Gotsch, F., Romero, R., Kusanovic, J. P., Mazaki-Tovi, S., Pineles, B. L., Erez, O.,
et al. (2007). The fetal inflammatory response syndrome. Clin. Obstet. Gynecol.
50, 652–683. doi: 10.1097/GRF.0b013e31811ebef6
Gottschall, P. E., Tatsuno, I., and Arimura, A. (1994). Regulation of interleukin-6
(IL-6) secretion in primary cultured rat astrocytes: synergism of interleukin-1
(IL-1) and pituitary adenylate cyclase activating polypeptide (PACAP). Brain
Res. 637, 197–203. doi: 10.1016/0006-8993(94)91233-5
Greter, M., Lelios, I., and Croxford, A. L. (2015). Microglia versus myeloid
cell nomenclature during brain inflammation. Front. Immunol. 6:249. doi:
10.3389/fimmu.2015.00249
Hagberg, H., Peebles, D., and Mallard, C. (2002). Models of white matter injury:
comparison of infectious, hypoxic-ischemic, and excitotoxic insults. Ment.
Retard. Dev. Disabil. Res. Rev. 8, 30–38. doi: 10.1002/mrdd.10007
Hanin, G., Shenhar-Tsarfaty, S., Yayon, N., Yau, Y. H., Bennett, E. R., Sklan,
E. H., et al. (2014). Competing targets of microRNA-608 affect anxiety and
hypertension. Hum. Mol. Genet. 23, 4569–4580. doi: 10.1093/hmg/ddu170
Henkel, J. S., Beers, D. R., Zhao, W., and Appel, S. H. (2009). Microglia in ALS:
the good, the bad, and the resting. J. Neuroimmune Pharmacol. 4, 389–398. doi:
10.1007/s11481-009-9171-5
Hutton, L. C., Castillo-Melendez, M., Smythe, G. A., and Walker, D. W. (2008).
Microglial activation, macrophage infiltration, and evidence of cell death in
the fetal brain after uteroplacental administration of lipopolysaccharide in
sheep in late gestation. Am. J. Obstet. Gynecol. 198, 117.e1–117.e11. doi:
10.1016/j.ajog.2007.06.035
Hutton, L. C., Castillo-Melendez, M., and Walker, D. W. (2007). Uteroplacental
inflammation results in blood brain barrier breakdown, increased activated
caspase 3 and lipid peroxidation in the late gestation ovine fetal cerebellum.
Dev. Neurosci. 29, 341–354. doi: 10.1159/000105475
Jenuwein, T., and Allis, C. D. (2001). Translating the histone code. Science 293,
1074–1080. doi: 10.1126/science.1063127
Kaimal, V., Bardes, E. E., Tabar, S. C., Jegga, A. G., and Aronow, B. J. (2010).
ToppCluster: a multiple gene list feature analyzer for comparative enrichment
clustering and network-based dissection of biological systems. Nucleic Acids
Res. 38, W96–W102. doi: 10.1093/nar/gkq418
Karrow, N. A. (2006). Activation of the hypothalamic-pituitary-adrenal axis and
autonomic nervous system during inflammation and altered programming
of the neuroendocrine-immune axis during fetal and neonatal development:
lessons learned from the model inflammagen, lipopolysaccharide. Brain Behav.
Immun. 20, 144–158. doi: 10.1016/j.bbi.2005.05.003
Keogh, M. J., Bennet, L., Drury, P. P., Booth, L. C., Mathai, S., Naylor, A. S., et al.
(2012). Subclinical exposure to low-dose endotoxin impairs EEG maturation
in preterm fetal sheep. Am. J. Physiol. Regul. Integr. Comp. Physiol. 303,
R270–R278. doi: 10.1152/ajpregu.00216.2012
Kim, D., Pertea, G., Trapnell, C., Pimentel, H., Kelley, R., and Salzberg, S. L. (2013).
TopHat2: accurate alignment of transcriptomes in the presence of insertions,
deletions and gene fusions. Genome Biol. 14, R36. doi: 10.1186/gb-2013-14-4-
r36
Kim, Y. C., Park, T. Y., Baik, E., and Lee, S. H. (2012). Fructose-1,6-bisphosphate
attenuates induction of nitric oxide synthase in microglia stimulated
with lipopolysaccharide. Life Sci. 90, 365–372. doi: 10.1016/j.lfs.2011.
12.011
Kuypers, E., Jellema, R. K., Ophelders, D. R., Dudink, J., Nikiforou, M., Wolfs,
T. G., et al. (2013). Effects of intra-amniotic lipopolysaccharide and maternal
betamethasone on brain inflammation in fetal sheep. PLoS ONE 8:e81644. doi:
10.1371/journal.pone.0081644
Lake, D. E., Fairchild, K. D., and Moorman, J. R. (2014). Complex signals
bioinformatics: evaluation of heart rate characteristics monitoring as a novel
Frontiers in Cellular Neuroscience | www.frontiersin.org 16 August 2015 | Volume 9 | Article 294

Cao et al. Fetal microglia in vivo and in vitro
risk marker for neonatal sepsis. J. Clin. Monit. Comput. 28, 329–339. doi:
10.1007/s10877-013-9530-x
Langmead, B., and Salzberg, S. L. (2012). Fast gapped-read alignment with Bowtie
2. Nat. Methods 9, 357–359. doi: 10.1038/nmeth.1923
Larouche, A., Roy, M., Kadhim, H., Tsanaclis, A. M., Fortin, D., and Sébire,
G. (2005). Neuronal injuries induced by perinatal hypoxic-ischemic insults
are potentiated by prenatal exposure to lipopolysaccharide: animal model
for perinatally acquired encephalopathy. Dev. Neurosci. 27, 134–142. doi:
10.1159/000085985
Lin, J. W., Ju, W., Foster, K., Lee, S. H., Ahmadian, G., Wyszynski, M., et al. (2000).
Distinct molecular mechanisms and divergent endocytotic pathways of AMPA
receptor internalization. Nat. Neurosci. 3, 1282–1290. doi: 10.1038/81814
Livak, K. J., and Schmittgen, T. D. (2001). Analysis of relative gene expression
data using real-time quantitative PCR and the 2(-Delta Delta C(T)) Method.
Methods 25, 402–408. doi: 10.1006/meth.2001.1262
Love, M. I., Huber,W., and Anders, S. (2014). Moderated estimation of fold change
and dispersion for RNA-Seq data with DESeq2. Genome Biol. 15, 550. doi:
10.1186/s13059-014-0550-8
Meshorer, E., Erb, C., Gazit, R., Pavlovsky, L., Kaufer, D., Friedman, A., et al.
(2002). Alternative splicing and neuritic mRNA translocation under long-
term neuronal hypersensitivity. Science 295, 508–512. doi: 10.1126/science.10
66752
Metz, G. A., Ng, J.W., Kovalchuk, I., andOlson, D.M. (2015). Ancestral experience
as a game changer in stress vulnerability and disease outcomes. Bioessays 37,
602–611. doi: 10.1002/bies.201400217
Monteleone, M. C., Adrover, E., Pallarés, M. E., Antonelli, M. C., Frasch, A. C., and
Brocco, M. A. (2014). Prenatal stress changes the glycoprotein GPM6A gene
expression and induces epigenetic changes in rat offspring brain. Epigenetics 9,
152–160. doi: 10.4161/epi.25925
Murthy, V., and Kennea, N. L. (2007). Antenatal infection/inflammation and
fetal tissue injury. Best Pract. Res. Clin. Obstet. Gynaecol. 21, 479–489. doi:
10.1016/j.bpobgyn.2007.01.010
Pollak, Y., Gilboa, A., Ben-Menachem, O., Ben-Hur, T., Soreq, H., and Yirmiya,
R. (2005). Acetylcholinesterase inhibitors reduce brain and blood interleukin-
1beta production. Ann. Neurol. 57, 741–745. doi: 10.1002/ana.20454
Ponomarev, E. D., Veremeyko, T., and Weiner, H. L. (2013). MicroRNAs
are universal regulators of differentiation, activation, and polarization of
microglia and macrophages in normal and diseased CNS. Glia 61, 91–103. doi:
10.1002/glia.22363
Prout, A. P., Frasch, M. G., Veldhuizen, R. A., Hammond, R., Ross, M. G., and
Richardson, B. S. (2010). Systemic and cerebral inflammatory response to
umbilical cord occlusions with worsening acidosis in the ovine fetus. Am. J.
Obstet. Gynecol. 202, 82.e81–82.e89. doi: 10.1016/j.ajog.2009.08.020
Prout, A. P., Frasch, M. G., Veldhuizen, R., Hammond, R., Matushewski, B., and
Richardson, B. S. (2012). The impact of intermittent umbilical cord occlusions
on the inflammatory response in pre-term fetal sheep. PLoS ONE 7:e39043. doi:
10.1371/journal.pone.0039043
Rees, S., and Inder, T. (2005). Fetal and neonatal origins of
altered brain development. Early Hum. Dev. 81, 753–761. doi:
10.1016/j.earlhumdev.2005.07.004
Rurak, D., and Bessette, N. W. (2013). Changes in fetal lamb arterial blood gas and
acid-base status with advancing gestation. Am. J. Physiol. Regul. Integr. Comp.
Physiol. 304, R908–R916. doi: 10.1152/ajpregu.00430.2012
Sadowska, G. B., Chen, X., Zhang, J., Lim, Y. P., Cummings, E. E., Makeyev, O.,
et al. (2015). Interleukin-1β transfer across the blood-brain barrier in the ovine
fetus. J. Cereb. Blood Flow Metab. doi: 10.1038/jcbfm.2015.134. [Epub ahead of
print].
Saigal, S., and Doyle, L. W. (2008). An overview of mortality and sequelae
of preterm birth from infancy to adulthood. Lancet 371, 261–269. doi:
10.1016/S0140-6736(08)60136-1
Sailaja, B. S., Cohen-Carmon, D., Zimmerman, G., Soreq, H., and
Meshorer, E. (2012). Stress-induced epigenetic transcriptional memory of
acetylcholinesterase byHDAC4. Proc. Natl. Acad. Sci. U.S.A. 109, E3687–E3695.
doi: 10.1073/pnas.1209990110
Shaked, I., Meerson, A., Wolf, Y., Avni, R., Greenberg, D., Gilboa-Geffen,
A., et al. (2009). MicroRNA-132 potentiates cholinergic anti-inflammatory
signaling by targeting acetylcholinesterase. Immunity 31, 965–973. doi:
10.1016/j.immuni.2009.09.019
Shapiro, G. D., Fraser, W. D., Frasch, M. G., and Séguin, J. R. (2013). Psychosocial
stress in pregnancy and preterm birth: associations and mechanisms. J. Perinat.
Med. 41, 631–645. doi: 10.1515/jpm-2012-0295
Shenhar-Tsarfaty, S., Berliner, S., Bornstein, N. M., and Soreq, H. (2014).
Cholinesterases as biomarkers for parasympathetic dysfunction and
inflammation-related disease. J. Mol. Neurosci. 53, 298–305. doi:
10.1007/s12031-013-0176-4
Shenhar-Tsarfaty, S., Yayon, N., Waiskopf, N., Shapira, I., Toker, S., Zaltser,
D., et al. (2015). Fear and C-reactive protein cosynergize annual pulse
increases in healthy adults. Proc. Natl. Acad. Sci. U.S.A. 112, E467–E471. doi:
10.1073/pnas.1418264112
Soreq, H., and Seidman, S. (2001). Acetylcholinesterase–new roles for an old actor.
Nat. Rev. Neurosci. 2, 294–302. doi: 10.1038/35067589
Spencer, S. J., Auer, R. N., and Pittman, Q. J. (2006). Rat neonatal immune
challenge alters adult responses to cerebral ischaemia. J. Cereb. Blood Flow
Metab. 26, 456–467. doi: 10.1038/sj.jcbfm.9600206
Stansley, B., Post, J., and Hensley, K. (2012). A comparative review of cell
culture systems for the study of microglial biology in Alzheimer’s disease.
J. Neuroinflammation 9, 115. doi: 10.1186/1742-2094-9-115
Suzuki, T., Hide, I., Matsubara, A., Hama, C., Harada, K., Miyano, K., et al. (2006).
Microglial alpha7 nicotinic acetylcholine receptors drive a phospholipase C/IP3
pathway and modulate the cell activation toward a neuroprotective role.
J. Neurosci. Res. 83, 1461–1470. doi: 10.1002/jnr.20850
Untergasser, A., Cutcutache, I., Koressaar, T., Ye, J., Faircloth, B. C., Remm, M.,
et al. (2012). Primer3–new capabilities and interfaces. Nucleic Acids Res. 40,
e115. doi: 10.1093/nar/gks596
Wang, X., Rousset, C. I., Hagberg, H., and Mallard, C. (2006). Lipopolysaccharide-
induced inflammation and perinatal brain injury. Semin. Fetal Neonatal Med.
11, 343–353. doi: 10.1016/j.siny.2006.04.002
Warnes, G. R., Bolker, B., Bonebakker, L., Gentleman, R., Huber, W., Liaw, A.,
et al. (2009). Gplots: Various R Programming Tools for Plotting Data. R package
version 2.
Weaver-Mikaere, L., Gibbons, H. M., De Silva, D., and Fraser, M. (2012).
Primary mixed glial cultures from fetal ovine forebrain are a valid model of
inflammation-mediated white matter injury. Dev. Neurosci. 34, 30–42. doi:
10.1159/000338039
Yamasaki, R., Lu, H., Butovsky, O., Ohno, N., Rietsch, A. M., Cialic, R.,
et al. (2014). Differential roles of microglia and monocytes in the inflamed
central nervous system. J. Exp. Med. 211, 1533–1549. doi: 10.1084/jem.201
32477
Ye,M.,Wang, Q., Zhang,W., Li, Z.,Wang, Y., andHu, R. (2014). Oroxylin A exerts
anti-inflammatory activity on lipopolysaccharide-induced mouse macrophage
via Nrf2/ARE activation. Biochem. Cell Biol. 92, 337–348. doi: 10.1139/bcb-
2014-0030
Conflict of Interest Statement: The authors declare that the research was
conducted in the absence of any commercial or financial relationships that could
be construed as a potential conflict of interest.
Copyright © 2015 Cao, Cortes, Moore, Leong, Durosier, Burns, Fecteau, Desrochers,
Auer, Barreiro, Antel and Frasch. This is an open-access article distributed under the
terms of the Creative Commons Attribution License (CC BY). The use, distribution or
reproduction in other forums is permitted, provided the original author(s) or licensor
are credited and that the original publication in this journal is cited, in accordance
with accepted academic practice. No use, distribution or reproduction is permitted
which does not comply with these terms.
Frontiers in Cellular Neuroscience | www.frontiersin.org 17 August 2015 | Volume 9 | Article 294