feedstock recycling from the printed circuit boards of used computers
TRANSCRIPT
Feedstock Recycling from the Printed Circuit Boards of UsedComputers
C. Vasile,*,† M. A. Brebu,† M. Totolin,† J. Yanik,‡ T. Karayildirim,‡ and H. Darie†
Romanian Academy, “Petru Poni” Institute of Macromolecular Chemistry, Department of PhysicalChemistry of Polymers, 41A Grigore Ghica Voda Alley, 700487 Iasi, Romania, and Ege UniVersity,
Faculty of Science, Department of Chemistry, 35100 Izmir, Turkey
ReceiVed NoVember 5, 2007. ReVised Manuscript ReceiVed January 21, 2008
Here, we focused on the pyrolysis of printed circuit boards (PCBs) from used computers using variouscombined procedures of thermal and catalytic pyrolysis and dehalogenation (absorption) aiming to obtainpyrolysis oils with low amounts of heteroatoms (Br, Cl, N, and O) that might be suitable for use as fuel orfeedstock. The composition of degradation oils was established by suitable methods, such as gas chromatography(GC-MSD and GC-AED), 1H nuclear magnetic resonance (NMR), and Fourier transform infrared spectroscopy(FTIR), and common methods for the analysis of petrochemical products. It has been found that catalyticcracking and dehalogenation procedures are simple and effective methods to convert PCBs into some usefulproducts.
Introduction
Plastic waste is one of the major problems facing theconsumer societies in Europe, Japan, and North America. Inrecent years, there has been a growing interest in using pyrolysisto process scrap plastics from waste electrical and electronicequipment (WEEE). In the European Union, the disposal ofWEEE is closely controlled by the WEEE directive of theEuropean Commission, which requires that WEEE is collectedseparately and each type of material (e.g., plastics and metals)is separated and recycled.1 In Romania, disposal/recycling ofsuch kind of waste is also starting to be controlled.2 However,the plastic fraction of WEEE is particularly problematic torecycle. This contains additives, such as heavy metals (Hg, Pb,Cd, and CrVI) and halogenated flame retardants, especiallypolybrominated ones (BFRs), such as polybrominated diphenylethers or tetrabromobisphenol A, which have a negative impacton the environment. WEEE consists mainly of (i) thermoplastics,such as acrylonitrile-butadiene-styrene (ABS), high-impactpolystyrene (HIPS), and polycarbonate (PC), that are used forcasings, and (ii) thermosets (e.g., epoxy resins) as majorcomponents of printed circuit boards (PCBs). Pyrolysis of epoxyresins in the presence of different additives showed that theinteractions between the additives and the epoxy resin result ina change in the decomposition pathways and an increased charformation.3–6 BFRs are considered to be extremely toxic, andplastics that contain BFRs need careful processing to either
destroy or remove the flame-retardant additives.7 Therefore, theuse of pyrolysis for processing WEEE plastics has beenintensively investigated as a means of thermally degrading thetoxic flame retardants. Various pyrolysis procedures8–10 havebeen applied, some of them using different catalysts, such asiron- and calcium-based catalysts11–13 or zeolites.14–18
We previously reported on the pyrolysis of various computerscraps and upgrading of pyrolysis oils by hydrogenation.19,20
Here, we focused on the degradation of waste PCBs usingcoupled thermal, catalytic, and dehalogenation (absorption)procedures, aiming to obtain pyrolysis products with low
* To whom correspondence should be addressed. E-mail: [email protected].
† Romanian Academy.‡ Ege University.(1) Directive 2002/96/EC of the European Parliament and of the Council
on Waste Electrical and Electronic Equipment. Official Journal of theEuropean Commission, 2003, L37/24, Brussels, Belgium.
(2) HG 448/2005 and HG 992/2005 Romanian Government decisionson WEEE and limitations of the use of certain hazardous substances inEEE. Romanian Ordin 901/2005 concerning specific measures for WEEEcollection which present safety and health risks.
(3) Chen, K. S.; Yeh, R. Z. J. Hazard. Mater. 1996, 49, 105–113.(4) Bychkov, S. G.; Desyatkov, A. V.; Biketov, A. A.; Ksandopulo, G. I.
Combust., Explos. Shock WaVes 1986, 22, 340–342.
(5) Prabhu, T. N.; Hemalatha, Y. J.; Harish, V.; Prashantha, K.; Iyengar,P. J. Appl. Polym. Sci. 2007, 104, 500–503.
(6) Schartel, B.; Balabanovich, A. I.; Braun, U.; Knoll, U.; Artner, J.;Ciesielski, M.; Döring, M.; Perez, R.; Sandler, J. K. W.; Alstädt, V.;Hoffmann, T.; Pospiech, D. J. Appl. Polym. Sci. 2007, 104, 2260–2269.
(7) Tohka, A.; Zevenhoven, R. Brominated flame retardantssA nuisancein thermal waste processing? TMS Extraction and Processing DivisionMeeting on Recycling and Waste Treatment in Mineral and MetalProcessing: Technical and Economic Aspects: Lulea, Sweden, June 16–20, 2002.
(8) Hall, W. J.; Williams, P. T. J. Anal. Appl. Pyrolysis 2006, 77, 75–82.
(9) Hall, W. J.; Williams, P. T. J. Anal. Appl. Pyrolysis 2007, 79, 375–386.
(10) Bhaskar, T.; Hall, W. J.; Mitan, N. M. M.; Muto, A.; Williams,P. T.; Sakata, Y. Polym. Degrad. Stab. 2007, 92, 211–221.
(11) Mitan, N. M. M.; Brebu, M.; Bhaskar, T.; Muto, A.; Sakata, Y. J.Mater. Cycles Waste Manage. 2007, 9, 56–61.
(12) Brebu, M.; Bhaskar, T.; Murai, K.; Muto, A.; Sakata, Y.; Uddin,M. D. A. Polym. Degrad. Stab. 2005, 87, 225–230.
(13) Brebu, M.; Bhaskar, T.; Murai, K.; Muto, A.; Sakata, Y.; Uddin,M. D. A. Polym. Degrad. Stab. 2004, 84, 459–467.
(14) Blazsó, M.; Czégény, Zs. J. Chromatogr., A 2006, 1130, 91–96.(15) Blazsó, M. J. Anal. Appl. Pyrolysis 2005, 74, 344–352.(16) Blazsó, M.; Czégény, Zs.; Csoma, Cs. J. Anal. Appl. Pyrolysis 2002,
64, 249–261.(17) Miskolczi, N.; Bartha, L.; Déak, G. Y. Polym. Degrad. Stab. 2006,
91, 517–526.(18) Bagri, R.; Williams, P. T. J. Inst. Energy 2002, 75, 117–123.(19) Vasile, C.; Brebu, M. A.; Karayildirim, T.; Yanik, J.; Darie, H. J.
Mater. Cycles Waste Manage. 2006, 8, 99–108.(20) Vasile, C.; Brebu, M. A.; Karayildirim, T.; Yanik, J.; Darie, H.
Fuel 2007, 86, 477–485.
Energy & Fuels XXXX, xxx, 000–000 A
10.1021/ef700659t CCC: $40.75 XXXX American Chemical Society
Published on Web 03/04/2008
amounts of heteroatoms (Br, Cl, N, and O) that might be suitableto be used by the petrochemical industry.
Materials and Methods
Materials. The PCB sample was obtained from waste computerparts by a systematic disassembly followed by homogenization, sizereduction, and sampling. PCBs and associated components repre-sented 15 wt % of the initial WEEE, while thermoplastics, metal,and glass represented 30, 23, and 32 wt %, respectively. The averageelemental composition (wt %) of the PCB sample was C, 24.69;H, 1.38; N, 0.85; Cl, 2.05; Br, 4.94; and S, 1.97. The ash contentof PCBs (mainly metals and glass) was of 63.4 wt %, while thevolatiles were of 36.6 wt %. The Fourier transform infraredspectroscopy (FTIR) spectrum of PCBs revealed signals in the rangeof 3300–3500 and 1600–1800 cm-1, indicating the presence of-OH and other oxygen-containing groups, while the presence ofhalogenated flame retardants was evidenced by bands at 1000–1200and 600–750 cm-1. Some thermal properties of the organic fractionof PCBs have been compared to those of commercial epoxy resins(Ropoxid 501) obtained from bisphenol A hardened with diami-nodiphenylmethane (ER/DDM) in a 9:2 ratio, with the resultsproving that the main component of PCBs is a flame-retarded epoxyresin. The amount of metals (in mg/g of sample) was determinedby atomic absorption spectroscopy as following: Fe, 19.7; Ni, 1.7;Cr, 0.03; Mn, 1.4; Co, 0.01; Cu, 137.9; Zn, 4.84; Mg, 2.2; and Ca,29.0.
The cracking catalyst (Crack) used in the experiments was asilica–alumina amorphous one, with the following characteristics:SiO2, 86%; Al2O3, 12%; Fe2O3, 0.12%; and Na2O, 0.32%; density,0.684 g/cm3; granulation, 3–4 mm; and activity index, 37.
The red mud resulted as a byproduct of the electrochemicalprocess of aluminum production was supplied by SeydisehirAlumina Plant, Turkey. The components in Red Mud were detectedby X-ray fluorescence spectrophotometry. The main analytical data(wt %) obtained by this method are Fe2O3, 37.72; Al2O3, 17.27;SiO2, 17.10; TiO2, 4.81; Na2O, 7.13; and CaO, 4.54. Silica andaluminum were detected in the AlSixOy form, and iron was foundin the Fe2O3 form.
CaCO3 (analytical grade, Merck) was used as received.We have used the system composed of a cracking catalyst
relatively resistant to acidic medium in combination with twoabsorbers for halogenated compounds (CaCO3 and Red Mud),which demonstrated their efficacy in cracking21 and capture of somehazardous compounds,22 respectively.
M-Ac catalyst was prepared by a wet impregnation method usingmetal salts. Activated carbon used as a catalyst support was obtainedfrom pyrolytic carbon black from pyrolysis at 800 °C of used scraptruck tires. The demineralized pyrolytic carbon black was activatedwith carbon dioxide at a flow rate of 350 mL/min for 6 h at 900°C and then loaded with metal by an impregnation method. M-Achas the following characteristics: Mo, 2.89 wt %; Ni, 4.63 wt %;surface area, 215.13 m2/g.
DHC-8 was a commercial catalyst commonly used for hydroc-racking of vacuum gas oil in Izmir refinery, Turkey. DHC-8 is abifunctional amorphous catalyst consisting of non-noble hydrogena-tion metals on a silica–alumina base, thus incorporating bothhydrotreating and hydrocracking functions. It was used in the sulfideform of powder with a specific surface area of 102 m2/g.
The selection of catalysts was performed on the basis of ourprevious experience because they are resistant to impurities, whichwas already tested in feedstock recycling of thermoplastics andwaste plastics.
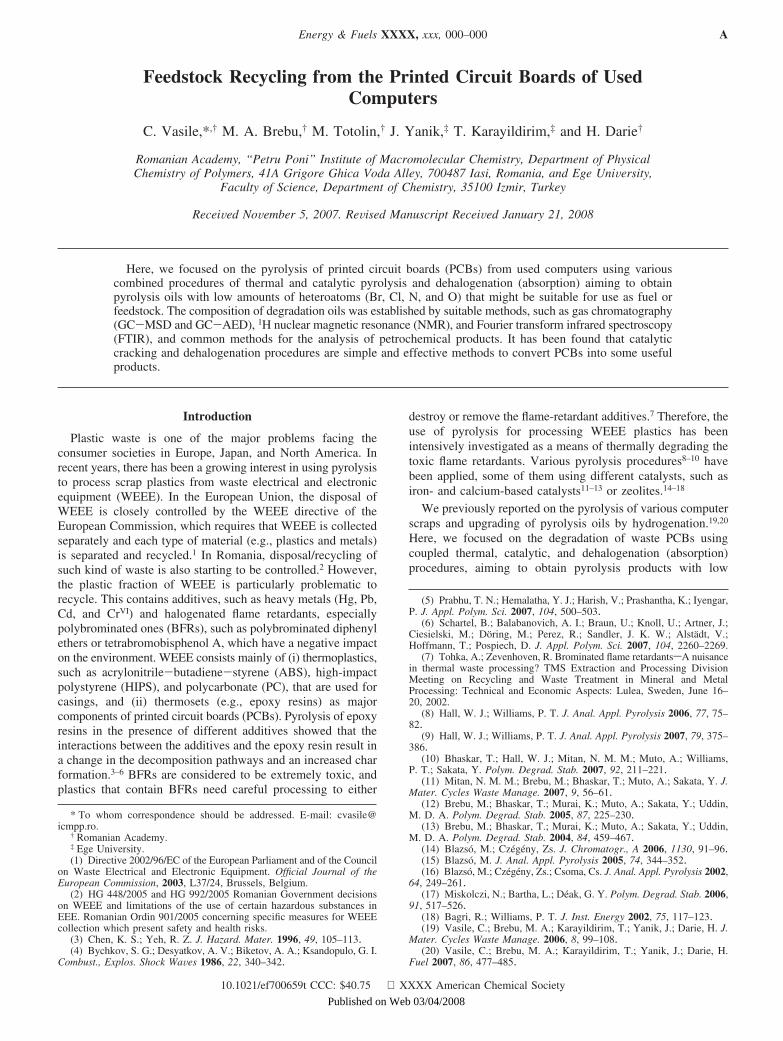
Pyrolysis Procedure. Pyrolysis was performed under atmo-spheric pressure by semibatch operation (Figure 1)23,24 introducing300 g of material in a metal reactor heated at 300–540 °C. Forcatalytic upgrading, the volatile pyrolysis products were directlypassed to a secondary reactor that allows for a combination ofvarious layers of catalysts. In our upgrading experiments, thecatalytic reactor was filled with CaCO3/cracking catalyst or withCaCO3/cracking catalyst/Red Mud in 2.5:1 and 2.5:1:1 weight ratios,respectively, and it was heated to 470 °C. The residence time ofthe volatiles on the catalyst layer was of 1.0–2.5 s, varying withthe evolution rate of volatile products from the pyrolysis reactor.The space velocity of volatiles in the catalyst bed was estimated tobe of about 0.044 L/s. The volatile products of catalytic upgradingwere passed through a cooling/collection system that separatedliquids (pyrolysis oils and aqueous fraction) from gases. A gas metermeasuring the evolution of gaseous products noncondensable atroom temperature helped to estimate the end of pyrolysis experi-ments that occurred after about 120 min, when no gaseous productwas observed.
In a series of experiments, the PCB oils from thermal degradationwere upgraded by thermal and catalytic hydrotreating in a shaking-type batch autoclave.25 Commercially available DHC-8 catalyst anda metal-loaded activated carbon (M-Ac) were used for catalytichydrogenation. Reactions were carried out at 350 °C, 6.5 MPa initialhydrogen pressure, 15 g of oil feed, 3 g of catalyst, and reactiontime of 120 min.
Analysis and Characterization Methods. The distribution ofbromine (Br), chlorine (Cl), nitrogen (N), and oxygen (O) containingorganic compounds in pyrolysis oils was analyzed by a gaschromatograph equipped with an atomic emission detector (AED;HP G2350A; column, HP-1; cross-linked methyl siloxane; 25 m× 0.32 m × 0.17 µm). 1-Bromohexane and 1,2,4-trichlorobenzenewere used as internal standards for the quantitative determinationof Br and Cl, and nitrobenzene was used as the internal standardfor N and O. This allows for quantitative determination of Br, Cl,N, and O in pyrolysis oil; however, because of the lack of availablemethods for quantitative analysis of compounds in solid residue,water phase, and gaseous products, we were unable to calculatethe balance of heteroelements in pyrolysis products.
The qualitative composition of liquid products was analyzed bya gas chromatograph using a mass-selective detector (MSD; HP5973; column, HP-1; cross-linked methyl siloxane; 25 m × 0.32mm × 0.17 µm; temperature program, 40 °C (hold for 10 min)and 300 °C (rate of 5 °C/min, hold for 5 min).
The composition of the liquid products was characterized usingthe C-NP gram method (C stands for carbon, and NP stands fornormal paraffin) based on chromatographic results.26,27 In a similarway, the organic Br-, Cl-, N-, and O-containing compounds werecharacterized using Br-, Cl-, N-, and O-NP grams.
High-performance liquid chromatography (HPLC) has beenapplied for the analysis of aqueous fraction by means of aSpectroflow 783 instrument from ABI Analytical Kratos Division
(21) Moiceanu, E.; Ocneanu, I.; Vasile, C.; Sabliovschi, M.; Moroi, G.;Darie, H.; Zaharia, C. Romanian Patent 92783, 1987.
(22) Karayildirim, T.; Yanik, J.; Yuksel, M.; Saglam, M.; Vasile, C.;Bockhorn, H. J. Anal. Appl. Pyrolysis 2006, 75, 112–119.
(23) Vasile, C.; Pakdel, H.; Brebu, M.; Onu, P.; Darie, H.; Ciocalteu,S. J. Anal. Appl. Pyrolysis 2001, 57, 287–303.
(24) Vasile, C.; Calugaru, C. M.; Sabliovschi, M.; Cascaval, C. N.Romanian Patents 74577, 1980, and 78462, 1981.
(25) Karagoz, S.; Yanik, J.; Ucar, S.; Song, C. Energy Fuels 2002, 16,1301–1308.
(26) Murata, K.; Hirano, Y.; Sakata, Y.; Uddin, M. A. J. Anal. Appl.Pyrolysis 2002, 65, 71–90.
(27) Shiraga, Y.; Uddin, M. A.; Muto, A.; Narazaki, M.; Sakata, Y.;Murata, K. Energy Fuels 1999, 13, 428–432.
Figure 1. Schematic experimental setup for thermal degradation andcatalytic upgrading of PCBs.
B Energy & Fuels, Vol. xxx, No. xx, XXXX Vasile et al.
with a Spectroflow 491 Injector at a wavelength of 254 nm and aLKB Bromma 2150 HPLC Pump. The column with a length of250 mm and inner diameter of 4 mm was packed with Nucleosil5C18 from Macherey and Nagel. The elution was made with a 60:40 (v/v) methanol/water mixture, in isocratic regime, with a flowrate of 1 or 2 mL/min. Sample volumes of 200 µL were injected.
1H nuclear magnetic resonance (NMR) spectra of liquid productswere recorded with a Bruker GMBH DPX-400 (Germany) usingCDCl3 as the solvent, and they were used to determine thehydrocarbon types and research octane number (RON) of the oils.28
FTIR spectra were recorded on a FTIR Bomem MB-104 spectro-meter (Canada) with a resolution of 4 cm-1, with a very thin layerof pyrolysis oil being deposited on KBr tablets. Common analysismethods for petrochemical products [paraffins, isoparaffins, olefins,naphthenes, and aromatics (PIONA)] were also considered for theanalysis of pyrolysis liquid products.
The thermogravimetric/derivative thermogravimetric (TG/DTG)curves were recorded on a Paulik-Paulik-Erdey-type derivato-graph (MOM, Budapest, Hungary) under the following operationalconditions: heating rate, 12 °C/min; temperature range, 25–600 °C;and sample mass, 50 mg, using platinum crucibles and a self-generated atmosphere. Two curves were recorded for each sample.
Results and Discussion
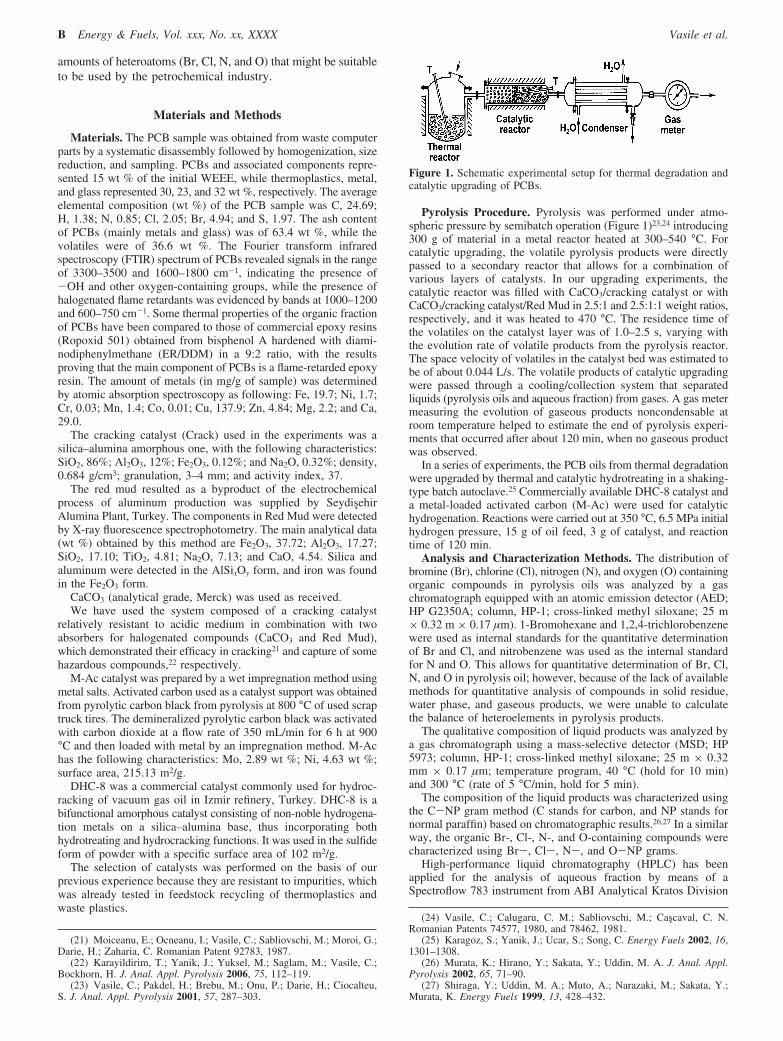
The decomposition pathway was envisaged from the shapeof TG/DTG curves and from the characteristic temperatures ofdegradation (Figure 2 and Table 1). A comparison of the thermalbehavior of PCBs with that of an epoxy resin (ER) cross-linked(hardened) with diamonodiphenylmethane (DDM) showedsimilar TG/DTG curves; however, the one of PCBs is shiftedto lower temperatures. The results confirmed that an epoxy resinis the main polymeric component in the composition of thePCBs.
PCB decomposes at 180–348 °C, leaving a high quantity ofresidue because of the presence of metals. The particularbehavior of PCBs during decomposition can be explained bythe radicals easily formed from flame retardants, which arepresented in greater amounts in PCB scraps. It is known thatmost flame retardants decompose around 300 °C, mainly bythe removal of hydrogen bromide. In contrast, the decompositionof epoxy resin is finished at 450 °C. Luda and others29 observeda decrease in the decomposition temperature of epoxy resin inthe presence of flame retardants, which implies that the radicalsderived from the flame retardants induced decomposition ofepoxy resin.30 The residue amount from PCBs is almost equalwith the ash content. The amount of volatiles below 700 °C isof about 35 wt %.
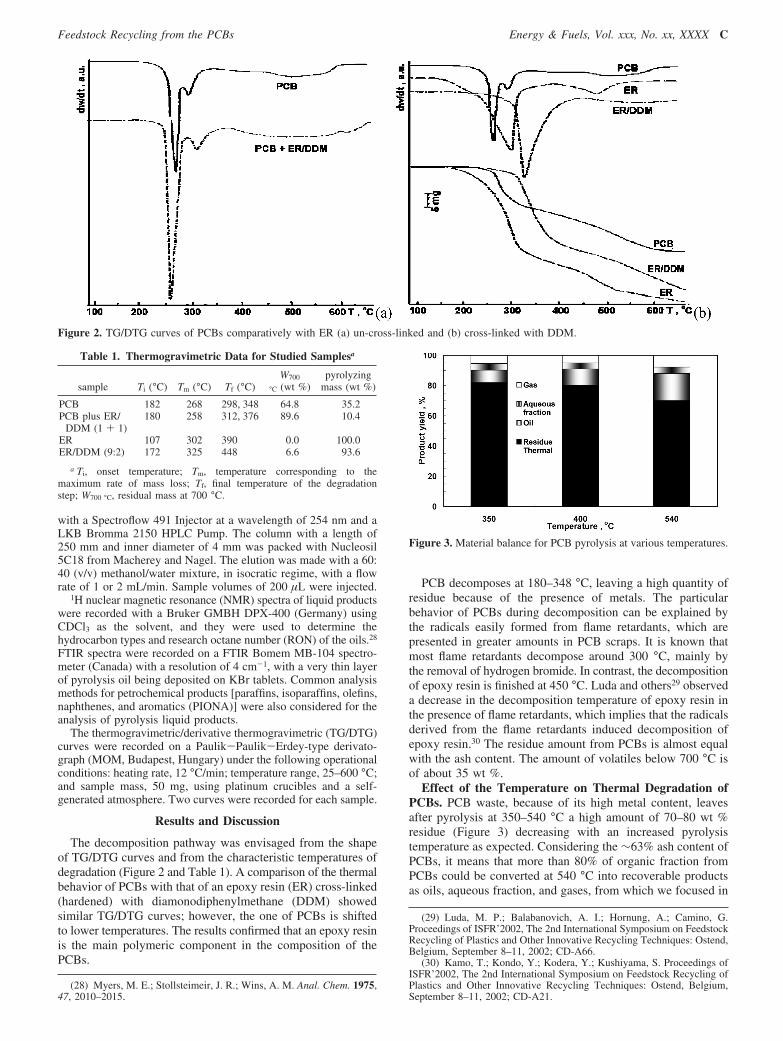
Effect of the Temperature on Thermal Degradation ofPCBs. PCB waste, because of its high metal content, leavesafter pyrolysis at 350–540 °C a high amount of 70–80 wt %residue (Figure 3) decreasing with an increased pyrolysistemperature as expected. Considering the ∼63% ash content ofPCBs, it means that more than 80% of organic fraction fromPCBs could be converted at 540 °C into recoverable productsas oils, aqueous fraction, and gases, from which we focused in
(28) Myers, M. E.; Stollsteimeir, J. R.; Wins, A. M. Anal. Chem. 1975,47, 2010–2015.
(29) Luda, M. P.; Balabanovich, A. I.; Hornung, A.; Camino, G.Proceedings of ISFR’2002, The 2nd International Symposium on FeedstockRecycling of Plastics and Other Innovative Recycling Techniques: Ostend,Belgium, September 8–11, 2002; CD-A66.
(30) Kamo, T.; Kondo, Y.; Kodera, Y.; Kushiyama, S. Proceedings ofISFR’2002, The 2nd International Symposium on Feedstock Recycling ofPlastics and Other Innovative Recycling Techniques: Ostend, Belgium,September 8–11, 2002; CD-A21.
Figure 2. TG/DTG curves of PCBs comparatively with ER (a) un-cross-linked and (b) cross-linked with DDM.
Table 1. Thermogravimetric Data for Studied Samplesa
sample Ti (°C) Tm (°C) Tf (°C)W700
°C (wt %)pyrolyzing
mass (wt %)
PCB 182 268 298, 348 64.8 35.2PCB plus ER/
DDM (1 + 1)180 258 312, 376 89.6 10.4
ER 107 302 390 0.0 100.0ER/DDM (9:2) 172 325 448 6.6 93.6
a Ti, onset temperature; Tm, temperature corresponding to themaximum rate of mass loss; Tf, final temperature of the degradationstep; W700 °C, residual mass at 700 °C.
Figure 3. Material balance for PCB pyrolysis at various temperatures.
Feedstock Recycling from the PCBs Energy & Fuels, Vol. xxx, No. xx, XXXX C
our study on pyrolysis oils. Increasing the pyrolysis temperaturefrom 350 to 540 °C enhances the thermal degradation, with theoil yield increasing more that 2 times, while the amount ofgaseous products increased from 5 to about 8 wt %. The amountof water fraction resulted from pyrolysis was not affected bythe temperature of the process.
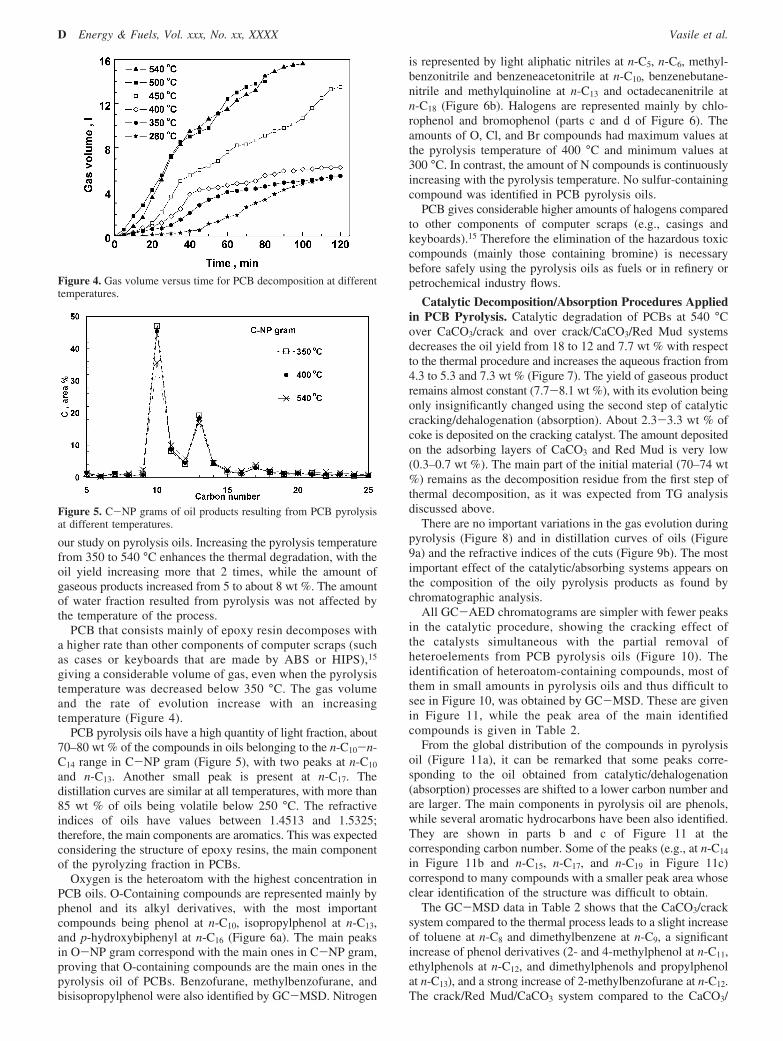
PCB that consists mainly of epoxy resin decomposes witha higher rate than other components of computer scraps (suchas cases or keyboards that are made by ABS or HIPS),15
giving a considerable volume of gas, even when the pyrolysistemperature was decreased below 350 °C. The gas volumeand the rate of evolution increase with an increasingtemperature (Figure 4).
PCB pyrolysis oils have a high quantity of light fraction, about70–80 wt % of the compounds in oils belonging to the n-C10-n-C14 range in C-NP gram (Figure 5), with two peaks at n-C10
and n-C13. Another small peak is present at n-C17. Thedistillation curves are similar at all temperatures, with more than85 wt % of oils being volatile below 250 °C. The refractiveindices of oils have values between 1.4513 and 1.5325;therefore, the main components are aromatics. This was expectedconsidering the structure of epoxy resins, the main componentof the pyrolyzing fraction in PCBs.
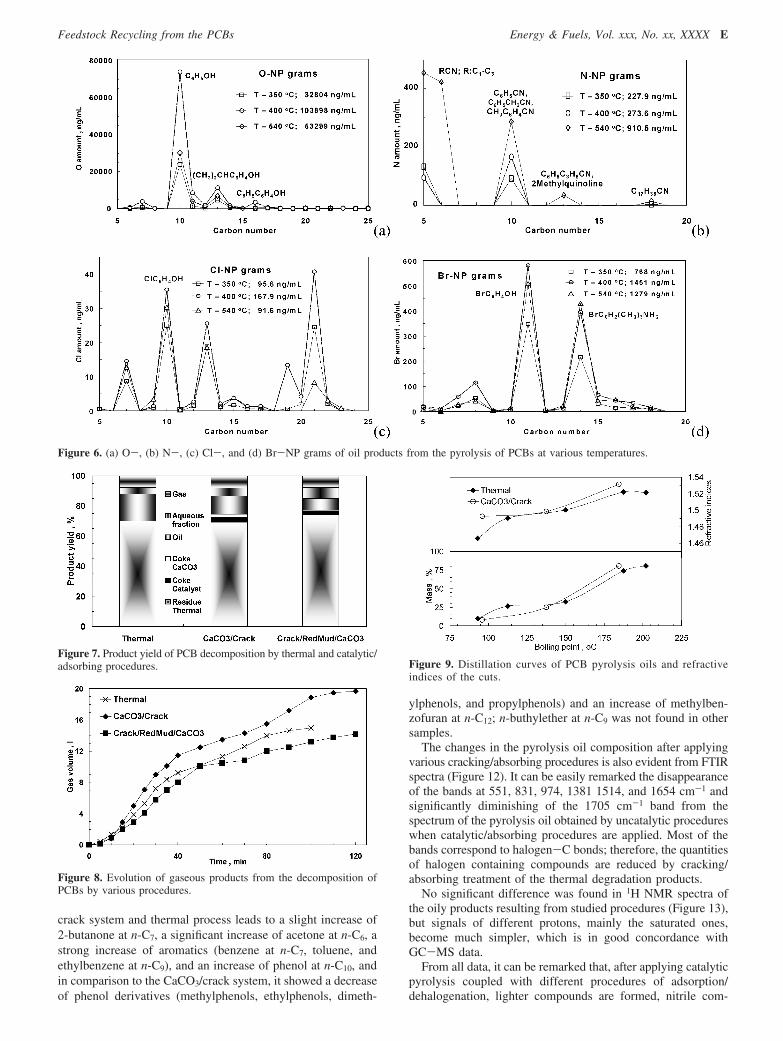
Oxygen is the heteroatom with the highest concentration inPCB oils. O-Containing compounds are represented mainly byphenol and its alkyl derivatives, with the most importantcompounds being phenol at n-C10, isopropylphenol at n-C13,and p-hydroxybiphenyl at n-C16 (Figure 6a). The main peaksin O-NP gram correspond with the main ones in C-NP gram,proving that O-containing compounds are the main ones in thepyrolysis oil of PCBs. Benzofurane, methylbenzofurane, andbisisopropylphenol were also identified by GC-MSD. Nitrogen
is represented by light aliphatic nitriles at n-C5, n-C6, methyl-benzonitrile and benzeneacetonitrile at n-C10, benzenebutane-nitrile and methylquinoline at n-C13 and octadecanenitrile atn-C18 (Figure 6b). Halogens are represented mainly by chlo-rophenol and bromophenol (parts c and d of Figure 6). Theamounts of O, Cl, and Br compounds had maximum values atthe pyrolysis temperature of 400 °C and minimum values at300 °C. In contrast, the amount of N compounds is continuouslyincreasing with the pyrolysis temperature. No sulfur-containingcompound was identified in PCB pyrolysis oils.
PCB gives considerable higher amounts of halogens comparedto other components of computer scraps (e.g., casings andkeyboards).15 Therefore the elimination of the hazardous toxiccompounds (mainly those containing bromine) is necessarybefore safely using the pyrolysis oils as fuels or in refinery orpetrochemical industry flows.
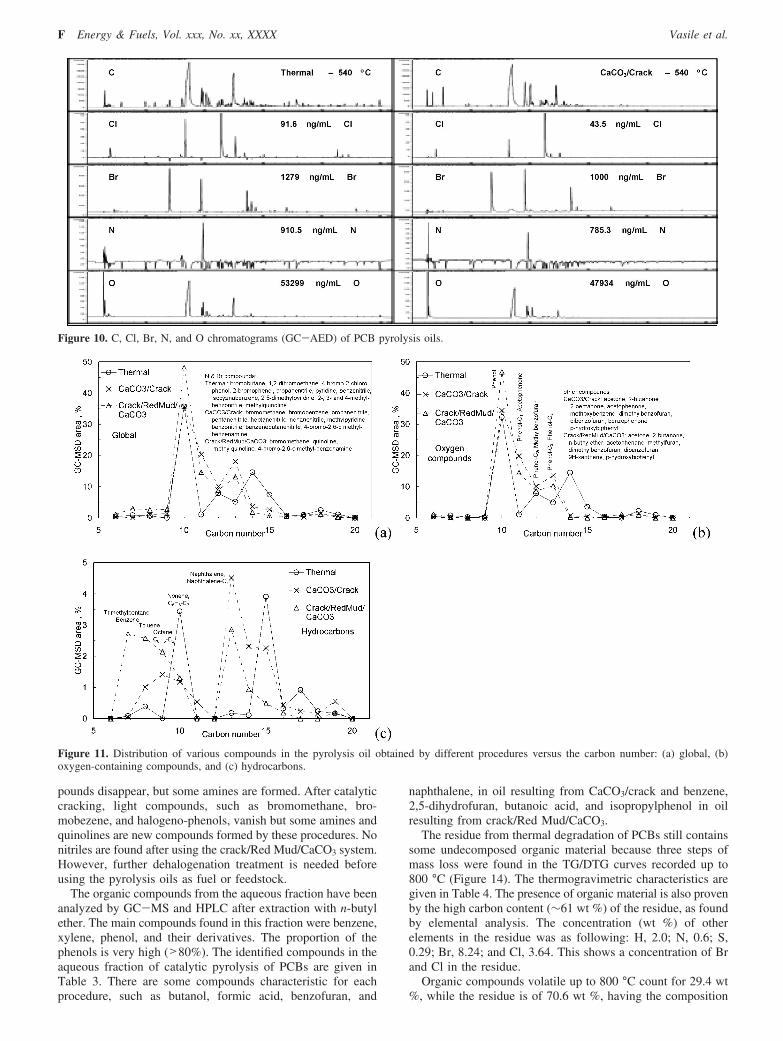
Catalytic Decomposition/Absorption Procedures Appliedin PCB Pyrolysis. Catalytic degradation of PCBs at 540 °Cover CaCO3/crack and over crack/CaCO3/Red Mud systemsdecreases the oil yield from 18 to 12 and 7.7 wt % with respectto the thermal procedure and increases the aqueous fraction from4.3 to 5.3 and 7.3 wt % (Figure 7). The yield of gaseous productremains almost constant (7.7-8.1 wt %), with its evolution beingonly insignificantly changed using the second step of catalyticcracking/dehalogenation (absorption). About 2.3-3.3 wt % ofcoke is deposited on the cracking catalyst. The amount depositedon the adsorbing layers of CaCO3 and Red Mud is very low(0.3–0.7 wt %). The main part of the initial material (70–74 wt%) remains as the decomposition residue from the first step ofthermal decomposition, as it was expected from TG analysisdiscussed above.
There are no important variations in the gas evolution duringpyrolysis (Figure 8) and in distillation curves of oils (Figure9a) and the refractive indices of the cuts (Figure 9b). The mostimportant effect of the catalytic/absorbing systems appears onthe composition of the oily pyrolysis products as found bychromatographic analysis.
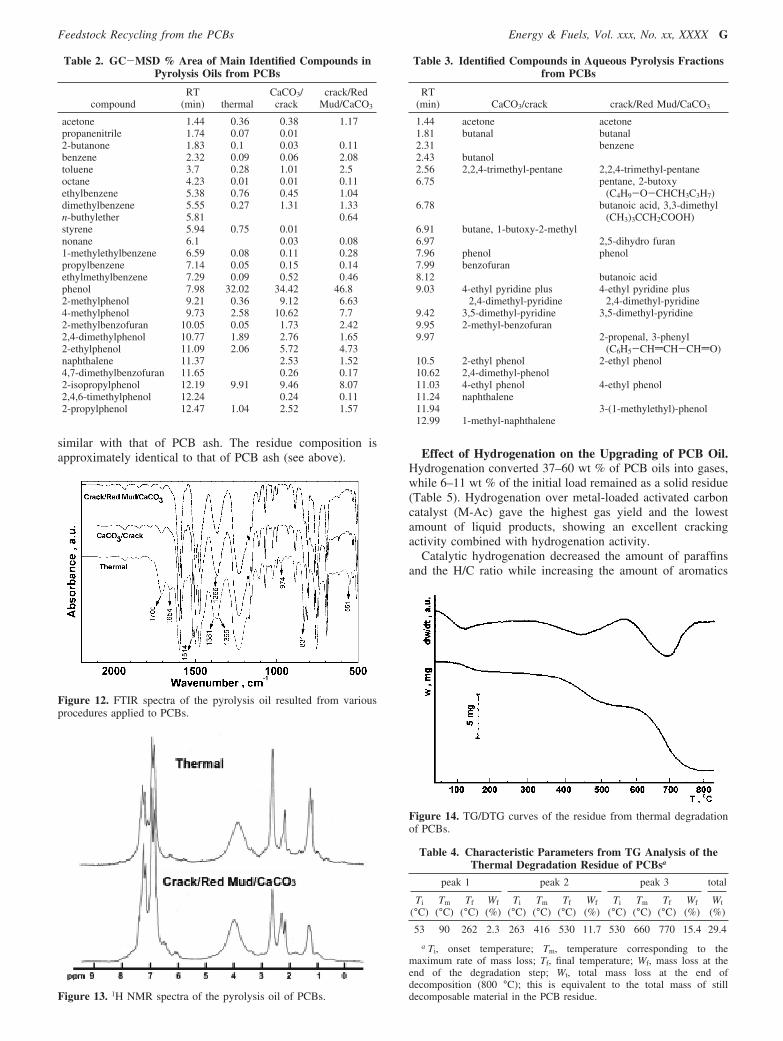
All GC-AED chromatograms are simpler with fewer peaksin the catalytic procedure, showing the cracking effect ofthe catalysts simultaneous with the partial removal ofheteroelements from PCB pyrolysis oils (Figure 10). Theidentification of heteroatom-containing compounds, most ofthem in small amounts in pyrolysis oils and thus difficult tosee in Figure 10, was obtained by GC-MSD. These are givenin Figure 11, while the peak area of the main identifiedcompounds is given in Table 2.
From the global distribution of the compounds in pyrolysisoil (Figure 11a), it can be remarked that some peaks corre-sponding to the oil obtained from catalytic/dehalogenation(absorption) processes are shifted to a lower carbon number andare larger. The main components in pyrolysis oil are phenols,while several aromatic hydrocarbons have been also identified.They are shown in parts b and c of Figure 11 at thecorresponding carbon number. Some of the peaks (e.g., at n-C14
in Figure 11b and n-C15, n-C17, and n-C19 in Figure 11c)correspond to many compounds with a smaller peak area whoseclear identification of the structure was difficult to obtain.
The GC-MSD data in Table 2 shows that the CaCO3/cracksystem compared to the thermal process leads to a slight increaseof toluene at n-C8 and dimethylbenzene at n-C9, a significantincrease of phenol derivatives (2- and 4-methylphenol at n-C11,ethylphenols at n-C12, and dimethylphenols and propylphenolat n-C13), and a strong increase of 2-methylbenzofurane at n-C12.The crack/Red Mud/CaCO3 system compared to the CaCO3/
Figure 4. Gas volume versus time for PCB decomposition at differenttemperatures.
Figure 5. C-NP grams of oil products resulting from PCB pyrolysisat different temperatures.
D Energy & Fuels, Vol. xxx, No. xx, XXXX Vasile et al.
crack system and thermal process leads to a slight increase of2-butanone at n-C7, a significant increase of acetone at n-C6, astrong increase of aromatics (benzene at n-C7, toluene, andethylbenzene at n-C9), and an increase of phenol at n-C10, andin comparison to the CaCO3/crack system, it showed a decreaseof phenol derivatives (methylphenols, ethylphenols, dimeth-
ylphenols, and propylphenols) and an increase of methylben-zofuran at n-C12; n-buthylether at n-C9 was not found in othersamples.
The changes in the pyrolysis oil composition after applyingvarious cracking/absorbing procedures is also evident from FTIRspectra (Figure 12). It can be easily remarked the disappearanceof the bands at 551, 831, 974, 1381 1514, and 1654 cm-1 andsignificantly diminishing of the 1705 cm-1 band from thespectrum of the pyrolysis oil obtained by uncatalytic procedureswhen catalytic/absorbing procedures are applied. Most of thebands correspond to halogen-C bonds; therefore, the quantitiesof halogen containing compounds are reduced by cracking/absorbing treatment of the thermal degradation products.
No significant difference was found in 1H NMR spectra ofthe oily products resulting from studied procedures (Figure 13),but signals of different protons, mainly the saturated ones,become much simpler, which is in good concordance withGC-MS data.
From all data, it can be remarked that, after applying catalyticpyrolysis coupled with different procedures of adsorption/dehalogenation, lighter compounds are formed, nitrile com-
Figure 6. (a) O-, (b) N-, (c) Cl-, and (d) Br-NP grams of oil products from the pyrolysis of PCBs at various temperatures.
Figure 7. Product yield of PCB decomposition by thermal and catalytic/adsorbing procedures.
Figure 8. Evolution of gaseous products from the decomposition ofPCBs by various procedures.
Figure 9. Distillation curves of PCB pyrolysis oils and refractiveindices of the cuts.
Feedstock Recycling from the PCBs Energy & Fuels, Vol. xxx, No. xx, XXXX E
pounds disappear, but some amines are formed. After catalyticcracking, light compounds, such as bromomethane, bro-mobezene, and halogeno-phenols, vanish but some amines andquinolines are new compounds formed by these procedures. Nonitriles are found after using the crack/Red Mud/CaCO3 system.However, further dehalogenation treatment is needed beforeusing the pyrolysis oils as fuel or feedstock.
The organic compounds from the aqueous fraction have beenanalyzed by GC-MS and HPLC after extraction with n-butylether. The main compounds found in this fraction were benzene,xylene, phenol, and their derivatives. The proportion of thephenols is very high (>80%). The identified compounds in theaqueous fraction of catalytic pyrolysis of PCBs are given inTable 3. There are some compounds characteristic for eachprocedure, such as butanol, formic acid, benzofuran, and
naphthalene, in oil resulting from CaCO3/crack and benzene,2,5-dihydrofuran, butanoic acid, and isopropylphenol in oilresulting from crack/Red Mud/CaCO3.
The residue from thermal degradation of PCBs still containssome undecomposed organic material because three steps ofmass loss were found in the TG/DTG curves recorded up to800 °C (Figure 14). The thermogravimetric characteristics aregiven in Table 4. The presence of organic material is also provenby the high carbon content (∼61 wt %) of the residue, as foundby elemental analysis. The concentration (wt %) of otherelements in the residue was as following: H, 2.0; N, 0.6; S,0.29; Br, 8.24; and Cl, 3.64. This shows a concentration of Brand Cl in the residue.
Organic compounds volatile up to 800 °C count for 29.4 wt%, while the residue is of 70.6 wt %, having the composition
Figure 10. C, Cl, Br, N, and O chromatograms (GC-AED) of PCB pyrolysis oils.
Figure 11. Distribution of various compounds in the pyrolysis oil obtained by different procedures versus the carbon number: (a) global, (b)oxygen-containing compounds, and (c) hydrocarbons.
F Energy & Fuels, Vol. xxx, No. xx, XXXX Vasile et al.
similar with that of PCB ash. The residue composition isapproximately identical to that of PCB ash (see above). Effect of Hydrogenation on the Upgrading of PCB Oil.
Hydrogenation converted 37–60 wt % of PCB oils into gases,while 6–11 wt % of the initial load remained as a solid residue(Table 5). Hydrogenation over metal-loaded activated carboncatalyst (M-Ac) gave the highest gas yield and the lowestamount of liquid products, showing an excellent crackingactivity combined with hydrogenation activity.
Catalytic hydrogenation decreased the amount of paraffinsand the H/C ratio while increasing the amount of aromatics
Table 2. GC-MSD % Area of Main Identified Compounds inPyrolysis Oils from PCBs
compoundRT
(min) thermalCaCO3/crack
crack/RedMud/CaCO3
acetone 1.44 0.36 0.38 1.17propanenitrile 1.74 0.07 0.012-butanone 1.83 0.1 0.03 0.11benzene 2.32 0.09 0.06 2.08toluene 3.7 0.28 1.01 2.5octane 4.23 0.01 0.01 0.11ethylbenzene 5.38 0.76 0.45 1.04dimethylbenzene 5.55 0.27 1.31 1.33n-buthylether 5.81 0.64styrene 5.94 0.75 0.01nonane 6.1 0.03 0.081-methylethylbenzene 6.59 0.08 0.11 0.28propylbenzene 7.14 0.05 0.15 0.14ethylmethylbenzene 7.29 0.09 0.52 0.46phenol 7.98 32.02 34.42 46.82-methylphenol 9.21 0.36 9.12 6.634-methylphenol 9.73 2.58 10.62 7.72-methylbenzofuran 10.05 0.05 1.73 2.422,4-dimethylphenol 10.77 1.89 2.76 1.652-ethylphenol 11.09 2.06 5.72 4.73naphthalene 11.37 2.53 1.524,7-dimethylbenzofuran 11.65 0.26 0.172-isopropylphenol 12.19 9.91 9.46 8.072,4,6-timethylphenol 12.24 0.24 0.112-propylphenol 12.47 1.04 2.52 1.57
Figure 12. FTIR spectra of the pyrolysis oil resulted from variousprocedures applied to PCBs.
Figure 13. 1H NMR spectra of the pyrolysis oil of PCBs.
Table 3. Identified Compounds in Aqueous Pyrolysis Fractionsfrom PCBs
RT(min) CaCO3/crack crack/Red Mud/CaCO3
1.44 acetone acetone1.81 butanal butanal2.31 benzene2.43 butanol2.56 2,2,4-trimethyl-pentane 2,2,4-trimethyl-pentane6.75 pentane, 2-butoxy
(C4H9-O-CHCH3C3H7)6.78 butanoic acid, 3,3-dimethyl
(CH3)3CCH2COOH)6.91 butane, 1-butoxy-2-methyl6.97 2,5-dihydro furan7.96 phenol phenol7.99 benzofuran8.12 butanoic acid9.03 4-ethyl pyridine plus
2,4-dimethyl-pyridine4-ethyl pyridine plus
2,4-dimethyl-pyridine9.42 3,5-dimethyl-pyridine 3,5-dimethyl-pyridine9.95 2-methyl-benzofuran9.97 2-propenal, 3-phenyl
(C6H5-CHdCH-CHdO)10.5 2-ethyl phenol 2-ethyl phenol10.62 2,4-dimethyl-phenol11.03 4-ethyl phenol 4-ethyl phenol11.24 naphthalene11.94 3-(1-methylethyl)-phenol12.99 1-methyl-naphthalene
Figure 14. TG/DTG curves of the residue from thermal degradationof PCBs.
Table 4. Characteristic Parameters from TG Analysis of theThermal Degradation Residue of PCBsa
peak 1 peak 2 peak 3 total
Ti
(°C)Tm
(°C)Tf
(°C)Wf
(%)Ti
(°C)Tm
(°C)Tf
(°C)Wf
(%)Ti
(°C)Tm
(°C)Tf
(°C)Wf
(%)Wt
(%)
53 90 262 2.3 263 416 530 11.7 530 660 770 15.4 29.4
a Ti, onset temperature; Tm, temperature corresponding to themaximum rate of mass loss; Tf, final temperature; Wf, mass loss at theend of the degradation step; Wt, total mass loss at the end ofdecomposition (800 °C); this is equivalent to the total mass of stilldecomposable material in the PCB residue.
Feedstock Recycling from the PCBs Energy & Fuels, Vol. xxx, No. xx, XXXX G
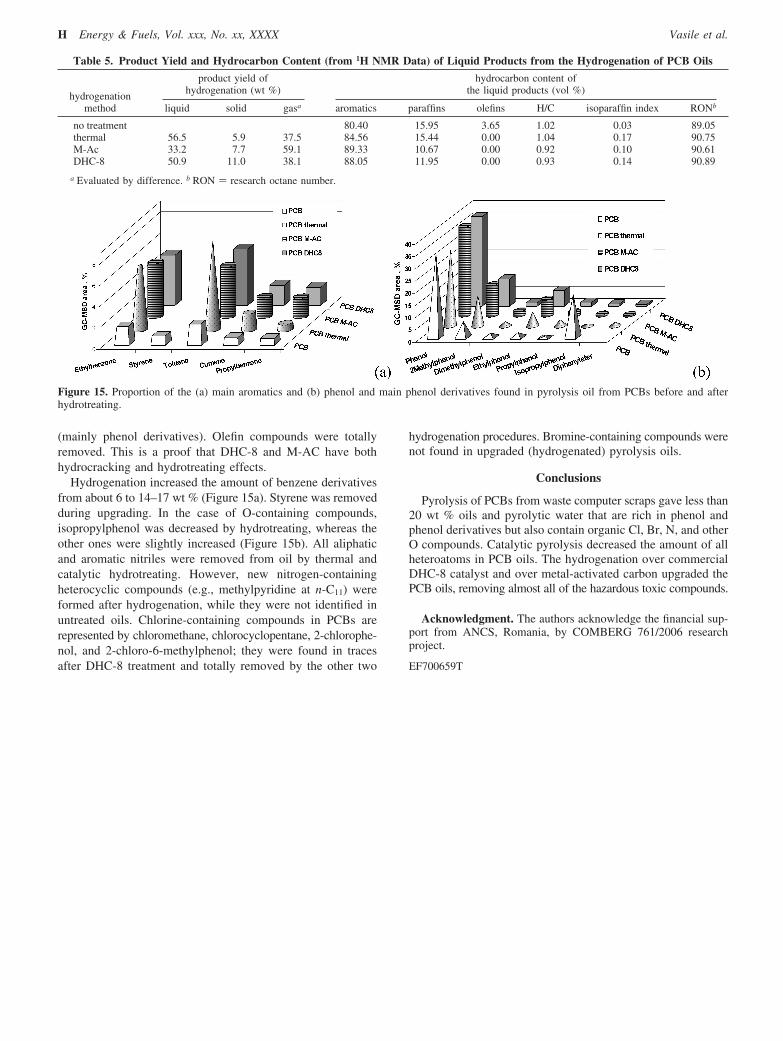
(mainly phenol derivatives). Olefin compounds were totallyremoved. This is a proof that DHC-8 and M-AC have bothhydrocracking and hydrotreating effects.
Hydrogenation increased the amount of benzene derivativesfrom about 6 to 14–17 wt % (Figure 15a). Styrene was removedduring upgrading. In the case of O-containing compounds,isopropylphenol was decreased by hydrotreating, whereas theother ones were slightly increased (Figure 15b). All aliphaticand aromatic nitriles were removed from oil by thermal andcatalytic hydrotreating. However, new nitrogen-containingheterocyclic compounds (e.g., methylpyridine at n-C11) wereformed after hydrogenation, while they were not identified inuntreated oils. Chlorine-containing compounds in PCBs arerepresented by chloromethane, chlorocyclopentane, 2-chlorophe-nol, and 2-chloro-6-methylphenol; they were found in tracesafter DHC-8 treatment and totally removed by the other two
hydrogenation procedures. Bromine-containing compounds werenot found in upgraded (hydrogenated) pyrolysis oils.
Conclusions
Pyrolysis of PCBs from waste computer scraps gave less than20 wt % oils and pyrolytic water that are rich in phenol andphenol derivatives but also contain organic Cl, Br, N, and otherO compounds. Catalytic pyrolysis decreased the amount of allheteroatoms in PCB oils. The hydrogenation over commercialDHC-8 catalyst and over metal-activated carbon upgraded thePCB oils, removing almost all of the hazardous toxic compounds.
Acknowledgment. The authors acknowledge the financial sup-port from ANCS, Romania, by COMBERG 761/2006 researchproject.
EF700659T
Table 5. Product Yield and Hydrocarbon Content (from 1H NMR Data) of Liquid Products from the Hydrogenation of PCB Oils
product yield ofhydrogenation (wt %)
hydrocarbon content ofthe liquid products (vol %)
hydrogenationmethod liquid solid gasa aromatics paraffins olefins H/C isoparaffin index RONb
no treatment 80.40 15.95 3.65 1.02 0.03 89.05thermal 56.5 5.9 37.5 84.56 15.44 0.00 1.04 0.17 90.75M-Ac 33.2 7.7 59.1 89.33 10.67 0.00 0.92 0.10 90.61DHC-8 50.9 11.0 38.1 88.05 11.95 0.00 0.93 0.14 90.89
a Evaluated by difference. b RON ) research octane number.
Figure 15. Proportion of the (a) main aromatics and (b) phenol and main phenol derivatives found in pyrolysis oil from PCBs before and afterhydrotreating.
H Energy & Fuels, Vol. xxx, No. xx, XXXX Vasile et al.