feeding across the food web: the interaction between diet, movement and body size in estuarine...
TRANSCRIPT
Feeding across the food web: The interaction between diet,movement and body size in estuarine crocodiles(Crocodylus porosus)
JEFFREY O. HANSON,1* STEVEN W. SALISBURY,1 HAMISH A. CAMPBELL,1
ROSS G. DWYER,1 TIMOTHY D. JARDINE2 AND CRAIG E. FRANKLIN1
1School of Biological Sciences, The University of Queensland, Brisbane, Qld 4072, Australia (Email:[email protected]), and 2Australian Rivers Institute, Griffith University, Brisbane,Queensland, Australia
Abstract The estuarine crocodile (Crocodylus porosus) is an apex predator across freshwater, estuarine and coastalenvironments. The impact of a changing C. porosus population upon the ecosystem is unknown, but due to largeontogenetic changes in body mass (>1000-fold) their impact may be wide reaching and substantial. Here weinvestigated the relationship between diet, movement and body size in a population of C. porosus inhabiting a tidalriver in northern Australia. Subcutaneous acoustic transmitters and fixed underwater receivers were used todetermine the activity space and movement patterns of 42 individuals (202–451 cm in total length).There was nosize-related spatial partitioning among different sized crocodiles. Large individuals (snout–vent length (SVL):160 cm < SVL < 188.5 cm) did, however, exhibit a much larger activity space than other size classes. Diet andindividual specialization was assessed using the composition of stable carbon (δ13C) and nitrogen (δ15N) isotopesin tissues with different turnover rates. There was a quadratic relationship between body size and δ15N, suggestingthat medium-sized individuals (110 cm < SVL < 160 cm) incorporated a greater proportion of high trophic preyinto their diets than small (SVL < 110 cm) or large individuals (SVL > 160 cm). Tissue δ13C composition on theother hand was positively correlated with body size, indicating that different size classes were trophically linked toprimary producers in different habitats. Individual-level analyses showed that small crocodiles were generalistfeeders while medium and large size classes specialized on particular prey items within the food webs they fed.Thefindings further our understanding of ontogenetic variation in C. porosus diet, and suggest that change in C. porosuspopulation size or demographics may be influential at various levels across the local food web.
Key words: acoustic telemetry, discrimination factor, home range, stable isotope, apex predator.
INTRODUCTION
Estuarine crocodiles (Crocodylus porosus) are the largestand most geographically widespread species of extantcrocodilian (Webb & Manolis 1989).Their geographicrange currently stretches from the west coast of India toSri Lanka, Bangladesh, the southern Malay Peninsula,throughout the Indonesian archipelago, north to thePhilippines and Palau, then south through New Guineato northern Australia, and east to Bismarck Archi-pelago, the Solomon Islands, New Hebrides, Fiji and
Vanuatu (Steel 1989;Webb & Manolis 1989).Through-out this range, C. porosus can be found in freshwater,brackish and marine habitats (Limpus 1980;Magnusson 1980; Magnusson et al. 1980; Webb &Manolis 1989; Letnic 2008; Campbell et al. 2010,2013). Adult C. porosus are the apex predator in theenvironments they inhabit, and because individualsundergo a greater than 1000-fold increase in body sizethroughout their lifetime (Fukuda et al. 2008), they arelikely to remove prey from a variety of trophic levels andfood webs. Despite their possible role as a keystonespecies for trophic interaction, very little is knownabout the mechanisms that drive variation in their dietand where different sized C. porosus fit into freshwater,brackish, marine and adjacent terrestrial food webs.
As C. porosus grow, their snouts become proportion-ately broader with increased structural reinforcement(Busbey 1989, 1995), and they are able to produceincreasingly powerful bite forces (Erickson et al. 2012,2013). These ontogenetic changes in body size andcranial biomechanics are thought to play a major role in
*Corresponding author.Accepted for publication November 2014.Author contributions: HAC, RGD and CEF conceived the
study. JOH, HAC, SWS, CEF and RGD designed the study.JOH, HAC, RGD and SWS sampled captive animals. CEF,HAC and RGD conducted fieldwork. JOH andTDJ collaboratedfor sample preparation and mass spectrometry analysis. JOHperformed statistical analyses, with advice from RGD and TDJ.CEF, SWS and HAC supervised the study. All authors contrib-uted to manuscript preparation.
Austral Ecology (2014) ••, ••–••
bs_bs_banner
© 2014 The Authors doi:10.1111/aec.12212Austral Ecology © 2014 Ecological Society of Australia
prey selection during the lifetime of an individualcrocodile (Taylor 1979; Webb et al. 1991). To under-stand size-related variation in C. porosus diet, previousresearch has used direct observations of feeding behav-iour and stomach contents analyses (e.g. Taylor 1979;Webb et al. 1991; Sah & Stuebing 1996; Whiting &Whiting 2011).These methods have identified many ofthe animals that C. porosus consume (Taylor 1979; Kar& Bustard 1981; Webb & Manolis 1989; Webb et al.1991; Sah & Stuebing 1996; Whiting & Whiting 2011).However, they suffer from biases in digestion time andseasonal availability (Jackson et al. 1974) that misrep-resent the significance of certain prey items within theoverall diet.They are also poorly suited for determiningthe trophic position and dominant food webs ofC. porosus across size classes, and describing individual-level feeding patterns such as individual specialization(wherein similar-sized individuals specialize on differ-ent prey; Roughgarden 1974; Bolnick et al. 2003).
The composition of stable carbon and nitrogen iso-topes in animal tissues (expressed as δ13C and δ15N)reflects their diet. Specifically, tissue δ15N compositionsare a relative indicator of trophic position (DeNiro &Epstein 1981; Post 2002), and tissue δ13C compositionsreflect the habitats and food webs that animals use toacquire prey (DeNiro & Epstein 1978; Chisholm et al.1983).Since different tissues turnover at different rates,the isotopic composition of different tissues in the sameanimal can provide insight into diet over multiple timeframes (Tieszen et al. 1983; Hobson & Clark 1992;Dodge et al. 2011) and individual specialization(Bolnick et al. 2003; Newsome et al. 2009; Matich et al.2011). In addition, stable isotopes can be coupled withindividual tracking methods to describe spatial varia-tion in diet (Rosenblatt & Heithaus 2011), which inturn could be used to determine whether size-relatedchanges in an animal’s movement patterns or feedingcapabilities drive size-related variation in its diet.
Throughout northern Australia, different size classesof C. porosus have been observed to occur at differentdensities in upstream areas compared with downstreamareas (Messel & Vorlicek 1986; Letnic 2008; Nichols &Letnic 2008). Although variation in physiology, mor-phology and feeding capability are considered to be themain drivers of size-related variation in the diets ofC. porosus (Webb et al. 1991) – and for crocodilians ingeneral (Brochu 2001) – the amount of variation thatmight also be associated with spatial partitioning withinthe same or adjacent habitats is poorly understood.
The objective of this study was to provide insightinto the dietary ecology of C. porosus and the mecha-nisms driving variation in diet using underwater acous-tic telemetry and stable isotope analysis of bodytissues. Although stable isotope analysis has not yetbeen applied to C. porosus, it has been used to investi-gate dietary patterns in several other crocodilians. Nilecrocodiles (Crocodylus niloticus) and broad-snouted
caimans (Caiman latirostris) were found to exhibit size-related variation in their δ13C and δ15N compositions –indicating ontogenetic changes in diet (Radloff et al.2012; Marques et al. 2013). By combining stableisotope analysis with movement data, American alliga-tors (Alligator mississippiensis) were found to exhibitspatially structured diets (Rosenblatt & Heithaus2011), with individuals inhabiting downstream areasfeeding (partially) from marine food webs. This sug-gests that some crocodilians may have a key role inlinking marine and estuarine food webs. Here, size-related variation in diet over both the short and thelong term were investigated in C. porosus by samplingmultiple tissues from a range of individuals within asingle tidally influenced river system.
METHODS
Data collection
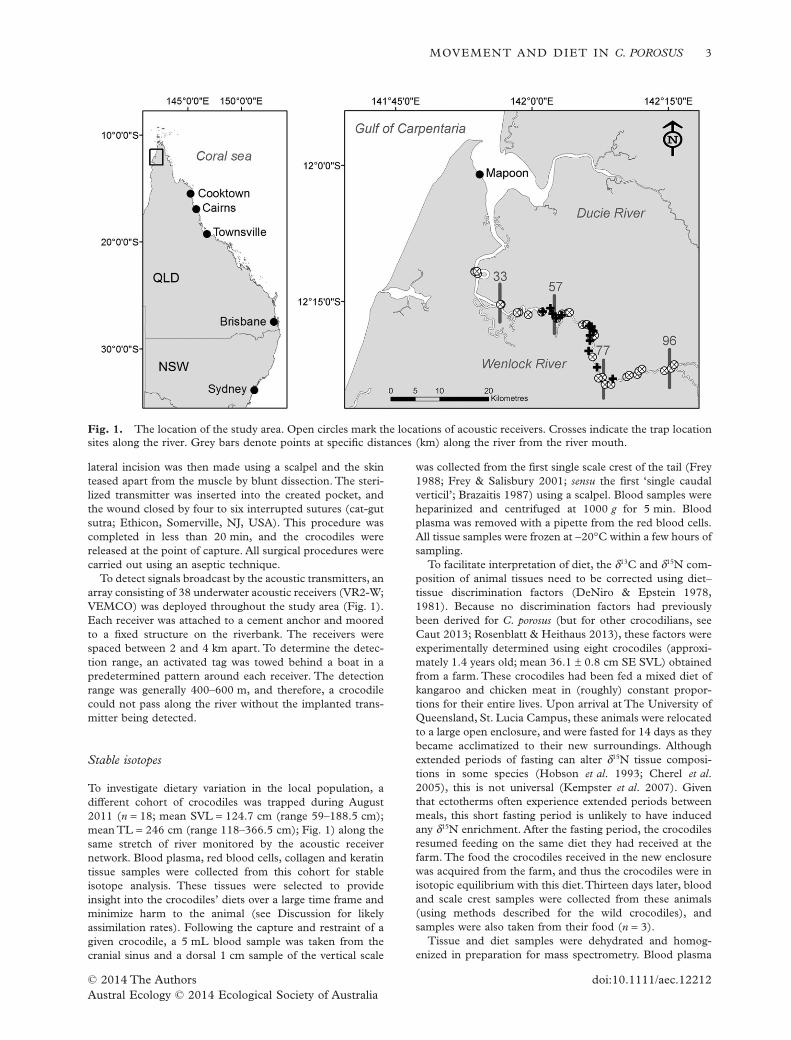
The study was conducted on a population of C. porosusinhabiting the Wenlock River, Cape York, Queensland, Aus-tralia (Fig. 1).The study area covered a 60 km stretch of theriver, spanning from freshwater tidal reaches to macrotidalbrackish water (see Pillans et al. 2008 for water quality data).In upstream areas, Melaleuca forests dominated the vegeta-tion along the riverbanks. Further downstream, these forestswere replaced by mangrove palm (Nypa fruticans).The regionexperiences little rainfall and slightly cooler temperaturesduring the dry season (January–April), and is inundated withrain during the wet season (May–December; RAAF Schergerand Skardon River stations; Australian Bureau ofMeteorology 1988).
The crocodiles inhabiting this area range from hatchlings toadults (Messel et al. 1981), making it ideal for investigatingsize-related variation in diet. Crocodiles were head caughtusing a pole and noose or captured using baited traps through-out a 48 km freshwater stretch of river.The traps were floatedon the water surface or placed at the water’s edge along theriverbank. Each trap was baited with wild pig meat (Sus scrofa)and the trap door was activated by a trigger mechanismattached to the bait. Once captured, crocodiles were removedfrom the trap, manually restrained, and two parameters ofbody size (snout–vent length (SVL): distance from snout tothe anterior tip of the cloaca; total length (TL)) were meas-ured to the nearest millimetre using a tape measure.
Acoustic telemetry
In August 2008, 2009 and 2010, a total of 43 crocodiles werecaptured (mean SVL = 160.4 cm (range 100.6–239 cm);mean TL = 315.1 (range 202–451 cm)). Individuals wererestrained and implanted with coded acoustic transmittersthat emitted pulses at variable intervals between 90 and 120 s(98 × 16 mm, mass in air 36 g, VEMCO, Bedford, NovaScotia, Canada; using methods in Franklin et al. 2009). Tenmillilitres of local anaesthetic (Lignocaine, Troy Laborato-ries, Smithfield, Australia) were injected into the area of softskin and muscle immediately behind the left forelimb. A 2 cm
2 J. O. HANSON ET AL.
© 2014 The Authorsdoi:10.1111/aec.12212Austral Ecology © 2014 Ecological Society of Australia
lateral incision was then made using a scalpel and the skinteased apart from the muscle by blunt dissection. The steri-lized transmitter was inserted into the created pocket, andthe wound closed by four to six interrupted sutures (cat-gutsutra; Ethicon, Somerville, NJ, USA). This procedure wascompleted in less than 20 min, and the crocodiles werereleased at the point of capture. All surgical procedures werecarried out using an aseptic technique.
To detect signals broadcast by the acoustic transmitters, anarray consisting of 38 underwater acoustic receivers (VR2-W;VEMCO) was deployed throughout the study area (Fig. 1).Each receiver was attached to a cement anchor and mooredto a fixed structure on the riverbank. The receivers werespaced between 2 and 4 km apart. To determine the detec-tion range, an activated tag was towed behind a boat in apredetermined pattern around each receiver. The detectionrange was generally 400–600 m, and therefore, a crocodilecould not pass along the river without the implanted trans-mitter being detected.
Stable isotopes
To investigate dietary variation in the local population, adifferent cohort of crocodiles was trapped during August2011 (n = 18; mean SVL = 124.7 cm (range 59–188.5 cm);mean TL = 246 cm (range 118–366.5 cm); Fig. 1) along thesame stretch of river monitored by the acoustic receivernetwork. Blood plasma, red blood cells, collagen and keratintissue samples were collected from this cohort for stableisotope analysis. These tissues were selected to provideinsight into the crocodiles’ diets over a large time frame andminimize harm to the animal (see Discussion for likelyassimilation rates). Following the capture and restraint of agiven crocodile, a 5 mL blood sample was taken from thecranial sinus and a dorsal 1 cm sample of the vertical scale
was collected from the first single scale crest of the tail (Frey1988; Frey & Salisbury 2001; sensu the first ‘single caudalverticil’; Brazaitis 1987) using a scalpel. Blood samples wereheparinized and centrifuged at 1000 g for 5 min. Bloodplasma was removed with a pipette from the red blood cells.All tissue samples were frozen at −20°C within a few hours ofsampling.
To facilitate interpretation of diet, the δ13C and δ15N com-position of animal tissues need to be corrected using diet–tissue discrimination factors (DeNiro & Epstein 1978,1981). Because no discrimination factors had previouslybeen derived for C. porosus (but for other crocodilians, seeCaut 2013; Rosenblatt & Heithaus 2013), these factors wereexperimentally determined using eight crocodiles (approxi-mately 1.4 years old; mean 36.1 ± 0.8 cm SE SVL) obtainedfrom a farm. These crocodiles had been fed a mixed diet ofkangaroo and chicken meat in (roughly) constant propor-tions for their entire lives. Upon arrival at The University ofQueensland, St. Lucia Campus, these animals were relocatedto a large open enclosure, and were fasted for 14 days as theybecame acclimatized to their new surroundings. Althoughextended periods of fasting can alter δ15N tissue composi-tions in some species (Hobson et al. 1993; Cherel et al.2005), this is not universal (Kempster et al. 2007). Giventhat ectotherms often experience extended periods betweenmeals, this short fasting period is unlikely to have inducedany δ15N enrichment. After the fasting period, the crocodilesresumed feeding on the same diet they had received at thefarm. The food the crocodiles received in the new enclosurewas acquired from the farm, and thus the crocodiles were inisotopic equilibrium with this diet.Thirteen days later, bloodand scale crest samples were collected from these animals(using methods described for the wild crocodiles), andsamples were also taken from their food (n = 3).
Tissue and diet samples were dehydrated and homog-enized in preparation for mass spectrometry. Blood plasma
Fig. 1. The location of the study area. Open circles mark the locations of acoustic receivers. Crosses indicate the trap locationsites along the river. Grey bars denote points at specific distances (km) along the river from the river mouth.
MOVEMENT AND DIET IN C. POROSUS 3
© 2014 The Authors doi:10.1111/aec.12212Austral Ecology © 2014 Ecological Society of Australia
samples were oven dried (80°C for > 48 h). Red blood cellsamples from the captive animals were freeze dried (−15°Cfor > 96 h), and those from the wild animals were oven dried(80°C for > 48 h). All blood plasma and red blood cellsamples were homogenized using mortar and pestles, andtest tube pestles. Separate collagen and keratin samples weredissected from scale crests. Each of these samples was thinlydiced, homogenized in 3 mL distilled water using an Ultra-Turrax disperser, oven dried (80°C for > 48 h) and furtherhomogenized using test tube pestles, and mortar and pestles.Diet samples were prepared using methods described forcollagen and keratin.
A small amount from each sample (0.5–0.9 mg) was encap-sulated into tin foil cups for mass spectrometry. Samples wereanalysed in three batches using a continuous flow isotope ratiomass spectrometer (Micromass Isoprime Eurovector EA300,Manchester, UK) using nitrogen (IAEA-N-1; ammoniumsulphate; 0.4 δ15N ‰; calibrated against atmospheric nitro-gen) and carbon (IAEA-CH-6; sucrose; −10.449 δ13C ‰;calibrated against Vienna Pee Dee Belemnite) standards. Toassess precision within batches, standards were interspersedthroughout each batch (n = 11, 18, 8) to yieldδ15N = −11.5 ± 0.1, −11.6 ± 0.3, −11.5 ± 0.1‰ SD andδ13C = 0.5 ± 0.2, 0.4 ± 0.1, 0.5 ± 0.2‰ SD. To assess preci-sion between batches, replicates from a token tissue sample(n = 1 per batch) were included in each batch to yieldδ15N = 0.5‰ SD and δ13C = 0.2‰ SD. The elemental ratiosof carbon to nitrogen isotope abundance (C : N ratio) in alltissue samples (one sided t-test, t98 = −10.951, P < 0.001)were within acceptable limits for aquatic samples (<3.5).Similarly, the C : N ratios for dietary samples (mean−14.1 ± 1.76‰ SD δ13C; mean 3.86 ± 0.13‰ SD δ15N; meanC : N = 3.8 ± 0.26 SD) were within acceptable limits for ter-restrial samples (<4.0).Thus variation in lipid content was notlarge enough to influence results (Post et al. 2007; Logan et al.2008). The δ13C and δ15N composition of samples wereexpressed using delta notation (δ*X; see DeNiro & Epstein1978).
Data analyses
Movement and activity space
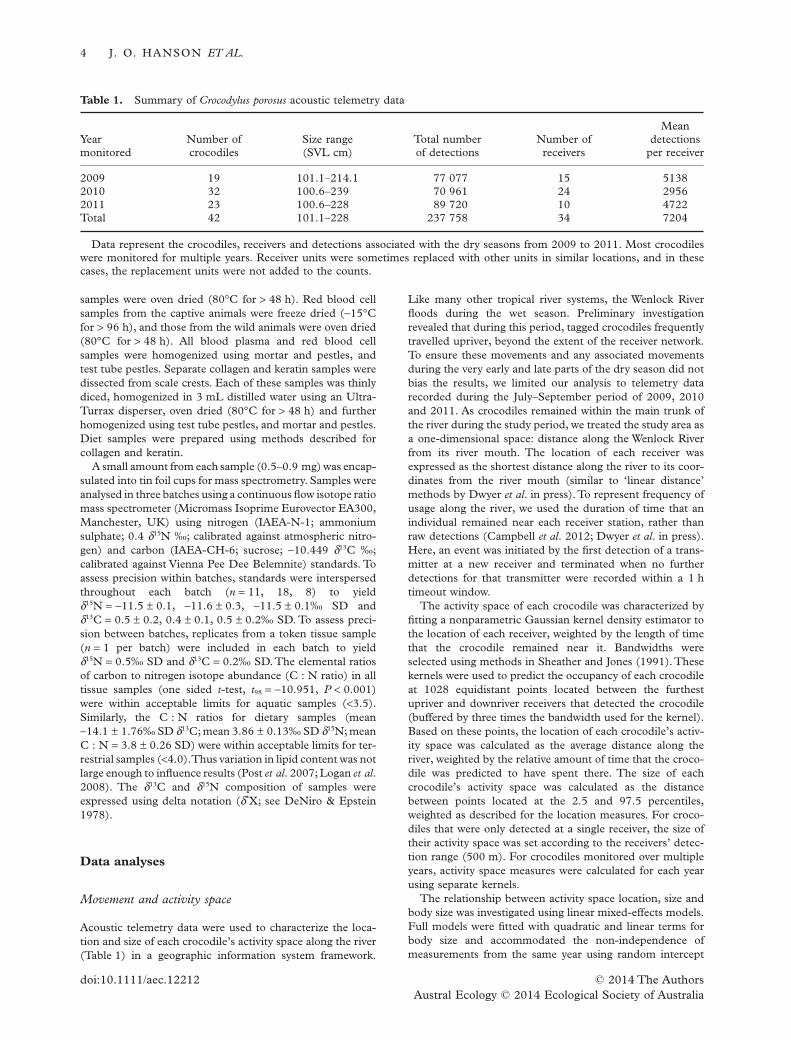
Acoustic telemetry data were used to characterize the loca-tion and size of each crocodile’s activity space along the river(Table 1) in a geographic information system framework.
Like many other tropical river systems, the Wenlock Riverfloods during the wet season. Preliminary investigationrevealed that during this period, tagged crocodiles frequentlytravelled upriver, beyond the extent of the receiver network.To ensure these movements and any associated movementsduring the very early and late parts of the dry season did notbias the results, we limited our analysis to telemetry datarecorded during the July–September period of 2009, 2010and 2011. As crocodiles remained within the main trunk ofthe river during the study period, we treated the study area asa one-dimensional space: distance along the Wenlock Riverfrom its river mouth. The location of each receiver wasexpressed as the shortest distance along the river to its coor-dinates from the river mouth (similar to ‘linear distance’methods by Dwyer et al. in press).To represent frequency ofusage along the river, we used the duration of time that anindividual remained near each receiver station, rather thanraw detections (Campbell et al. 2012; Dwyer et al. in press).Here, an event was initiated by the first detection of a trans-mitter at a new receiver and terminated when no furtherdetections for that transmitter were recorded within a 1 htimeout window.
The activity space of each crocodile was characterized byfitting a nonparametric Gaussian kernel density estimator tothe location of each receiver, weighted by the length of timethat the crocodile remained near it. Bandwidths wereselected using methods in Sheather and Jones (1991).Thesekernels were used to predict the occupancy of each crocodileat 1028 equidistant points located between the furthestupriver and downriver receivers that detected the crocodile(buffered by three times the bandwidth used for the kernel).Based on these points, the location of each crocodile’s activ-ity space was calculated as the average distance along theriver, weighted by the relative amount of time that the croco-dile was predicted to have spent there. The size of eachcrocodile’s activity space was calculated as the distancebetween points located at the 2.5 and 97.5 percentiles,weighted as described for the location measures. For croco-diles that were only detected at a single receiver, the size oftheir activity space was set according to the receivers’ detec-tion range (500 m). For crocodiles monitored over multipleyears, activity space measures were calculated for each yearusing separate kernels.
The relationship between activity space location, size andbody size was investigated using linear mixed-effects models.Full models were fitted with quadratic and linear terms forbody size and accommodated the non-independence ofmeasurements from the same year using random intercept
Table 1. Summary of Crocodylus porosus acoustic telemetry data
Yearmonitored
Number ofcrocodiles
Size range(SVL cm)
Total numberof detections
Number ofreceivers
Meandetections
per receiver
2009 19 101.1–214.1 77 077 15 51382010 32 100.6–239 70 961 24 29562011 23 100.6–228 89 720 10 4722Total 42 101.1–228 237 758 34 7204
Data represent the crocodiles, receivers and detections associated with the dry seasons from 2009 to 2011. Most crocodileswere monitored for multiple years. Receiver units were sometimes replaced with other units in similar locations, and in thesecases, the replacement units were not added to the counts.
4 J. O. HANSON ET AL.
© 2014 The Authorsdoi:10.1111/aec.12212Austral Ecology © 2014 Ecological Society of Australia
terms. They were tested for assumptions of residual normal-ity and homoscedasticity using graphical methods andsubject to backwards stepwise term deletion routines toderive term significance and minimal adequate models(terms retained when P < 0.05; see Murtaugh 2009 forevaluation). Models used to assess term significance werefitted using maximum likelihood. Minimal adequate modelswere refit using restricted maximum likelihood for parameterestimation and graphical presentation.
Diet–tissue discrimination factors
Discrimination factors (Δ*XTissue Type; Eqn 1) were determinedfor each tissue type as the difference between the averagetissue δ13C or δ15N composition sampled from the captive
animals δ*XTissue Type and samples taken from their
diet δ*XDiet . Standard errors were calculated using thestandard deviation of tissue ( SD *XTissue Typeδ ) and diet
SD *XDietδ( ) sample δ13C and δ15N compositions and the
number of tissue (nTissue Type; blood plasma n = 6; red bloodcells n = 7; collagen n = 7; keratin n = 8) and diet samples(nDiet = 3; Eqn 2).These discrimination factors were used tocorrect the δ13C and δ15N composition of tissue samplescollected from the wild crocodiles (expressed as cδ13C andcδ15N; Eqn 3).
Δ*X *X *XTissue Type Tissue Type Diet‰( ) = −δ δ (1)
SESD SD
*X*X
Tissue Type
*XTissue Type
Tissue Type DieΔ ‰( ) = +δ δ
2
ntt
Diet
2
n(2)
cδ δ*X *X *XTissue Type‰( ) = − Δ (3)
Wild crocodile tissue δ13C and δ15N compositions
Linear mixed-effects models were fit to the cδ13C and cδ15Ncomposition of 18 wild C. porosus, accommodating the non-independence of samples from the same individual usingrandom intercept terms. Full models contained tissue type,linear and quadratic terms for body size, and all possibleinteractions between them as fixed effects. These modelswere then checked for their conformity to parametricassumptions and subject to routines to derive term signifi-cance and minimal adequate models (see previous page).Tissue samples collected from one wild crocodile wereexcluded from all analyses because their cδ15N compositionswere outliers (Cook’s distance > 0.7).
Individual specialization in diet was assessed by calculatingthe total amount of isotopic variation in the wild C. porosus(total niche width (TNW)) and separating it into intra-individual variation (within individual component (WIC))and inter-individual variation (between individual compo-nent (BIC); Roughgarden 1974). The WIC : TNW ratiodescribes the degree of individual specialization in a group ofanimals. As this ratio approaches zero, it indicates a greaterdegree of individual specialization.The composition of cδ13Cand cδ15N in the crocodile tissues were analysed separately todetermine whether individuals specialized on a specific
aspect of their diet. The absolute value of tissue cδ13C com-positions were used for analysis since negative numbers werenot permitted.To ensure that size-related variation in diet didnot bias this analysis, crocodiles were binned into three sizeclasses (small: SVL < 110 cm, medium: 110 cm < SVL <160 cm, large: 160 cm > SVL) and measures were derivedfor each size class. Monte Carlo samples (100 000 replicates)were used to determine whether theWIC : TNW ratios devi-ated from random expectations.
Software
Numerical analyses were performed in ArcGIS 10.0 (ESRI,Redlands, CA, USA) and R (version 2.15.3; R DevelopmentCore Team 2011). Spatial data were processed using thegdistance (van Etten 2012), raster (Hijmans & van Etten2012), rgeos (Bivand & Rundel 2012), sp (Bivand et al.2008) and VTrack (Campbell et al. 2012) R packages. Sta-tistical analyses used the influence.ME (Nieuwenhuis et al.2011) and lme4 (Bates et al. 2011) R packages. Individualspecialization analyses were performed using the RInSp(Zaccarelli et al. 2013) R package.
RESULTS
Crocodile movement and activity space
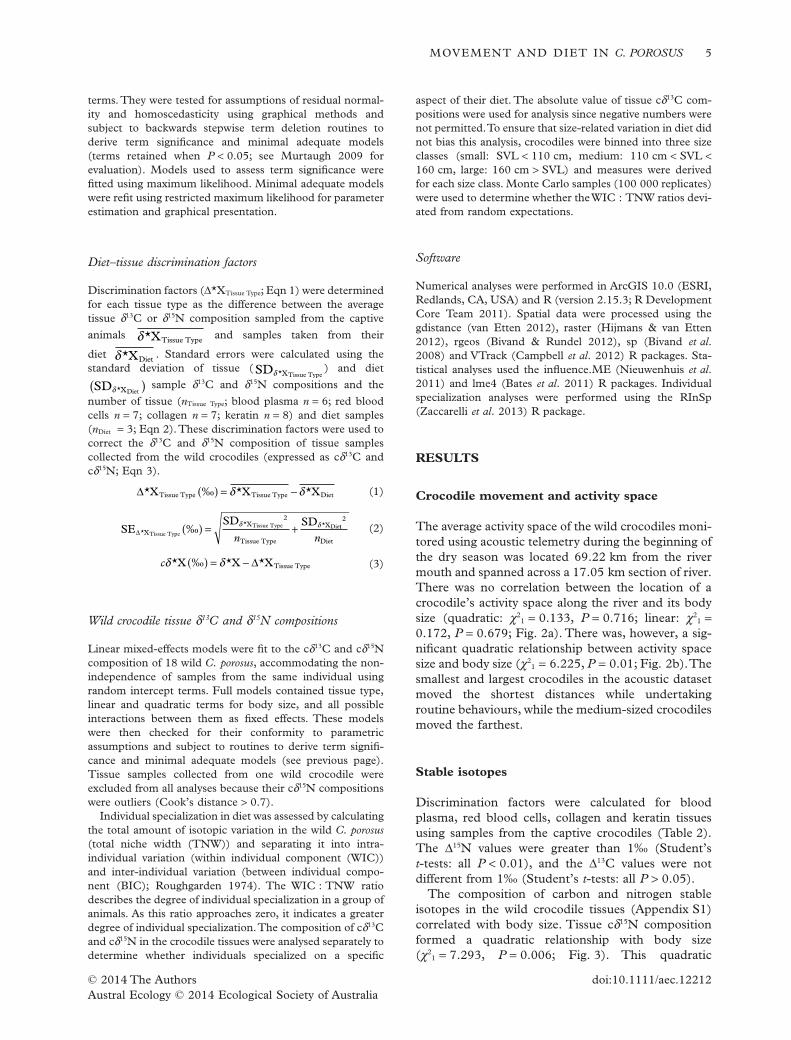
The average activity space of the wild crocodiles moni-tored using acoustic telemetry during the beginning ofthe dry season was located 69.22 km from the rivermouth and spanned across a 17.05 km section of river.There was no correlation between the location of acrocodile’s activity space along the river and its bodysize (quadratic: χ2
1 = 0.133, P = 0.716; linear: χ21 =
0.172, P = 0.679; Fig. 2a). There was, however, a sig-nificant quadratic relationship between activity spacesize and body size (χ2
1 = 6.225, P = 0.01; Fig. 2b).Thesmallest and largest crocodiles in the acoustic datasetmoved the shortest distances while undertakingroutine behaviours, while the medium-sized crocodilesmoved the farthest.
Stable isotopes
Discrimination factors were calculated for bloodplasma, red blood cells, collagen and keratin tissuesusing samples from the captive crocodiles (Table 2).The Δ15N values were greater than 1‰ (Student’st-tests: all P < 0.01), and the Δ13C values were notdifferent from 1‰ (Student’s t-tests: all P > 0.05).
The composition of carbon and nitrogen stableisotopes in the wild crocodile tissues (Appendix S1)correlated with body size. Tissue cδ15N compositionformed a quadratic relationship with body size(χ2
1 = 7.293, P = 0.006; Fig. 3). This quadratic
MOVEMENT AND DIET IN C. POROSUS 5
© 2014 The Authors doi:10.1111/aec.12212Austral Ecology © 2014 Ecological Society of Australia
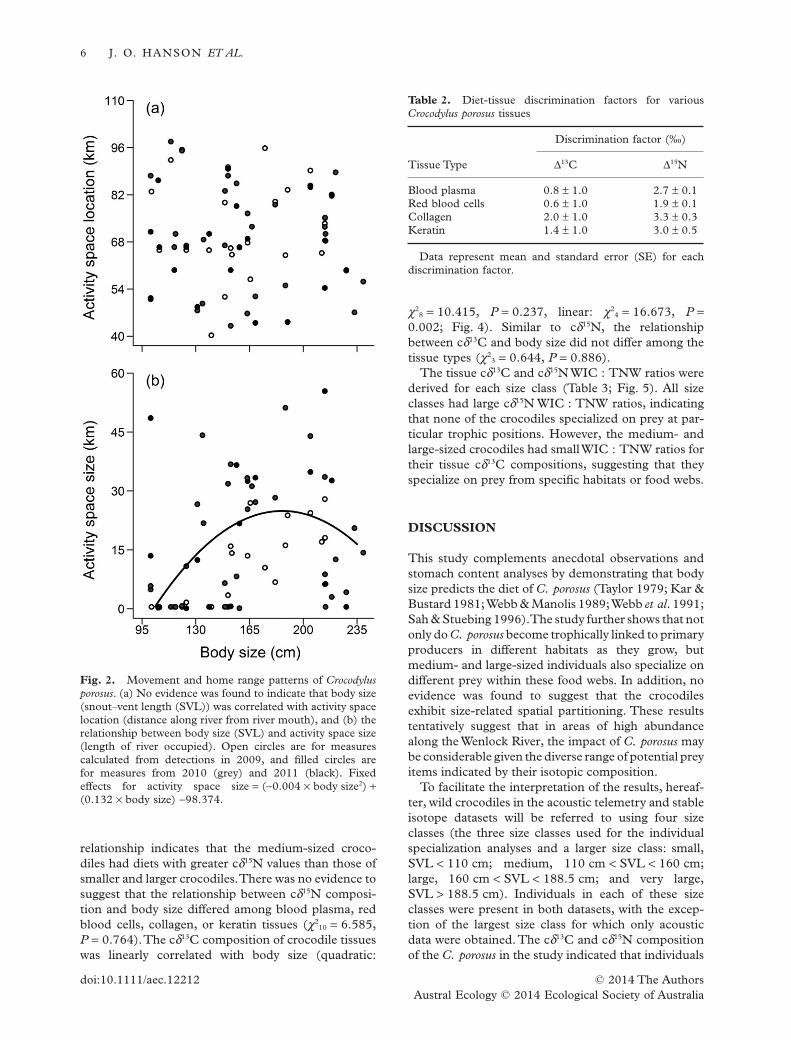
relationship indicates that the medium-sized croco-diles had diets with greater cδ15N values than those ofsmaller and larger crocodiles.There was no evidence tosuggest that the relationship between cδ15N composi-tion and body size differed among blood plasma, redblood cells, collagen, or keratin tissues (χ2
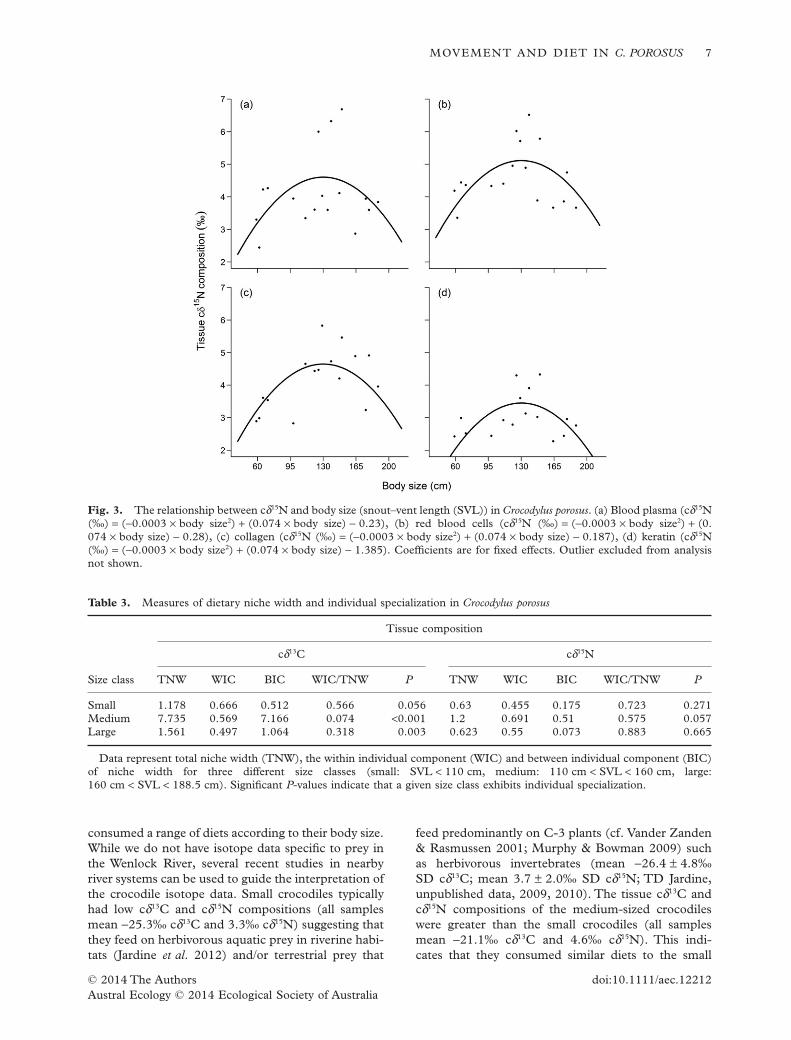
10 = 6.585,P = 0.764).The cδ13C composition of crocodile tissueswas linearly correlated with body size (quadratic:
χ28 = 10.415, P = 0.237, linear: χ2
4 = 16.673, P =0.002; Fig. 4). Similar to cδ15N, the relationshipbetween cδ13C and body size did not differ among thetissue types (χ2
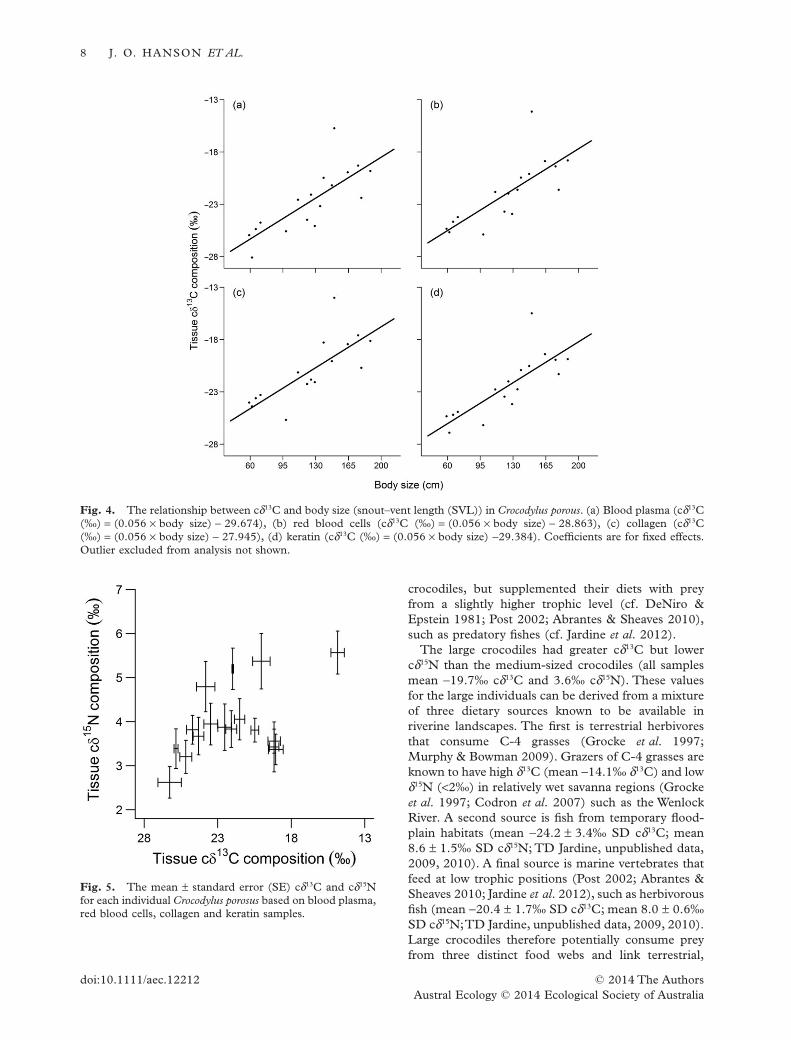
3 = 0.644, P = 0.886).The tissue cδ13C and cδ15N WIC : TNW ratios were
derived for each size class (Table 3; Fig. 5). All sizeclasses had large cδ15N WIC : TNW ratios, indicatingthat none of the crocodiles specialized on prey at par-ticular trophic positions. However, the medium- andlarge-sized crocodiles had smallWIC : TNW ratios fortheir tissue cδ13C compositions, suggesting that theyspecialize on prey from specific habitats or food webs.
DISCUSSION
This study complements anecdotal observations andstomach content analyses by demonstrating that bodysize predicts the diet of C. porosus (Taylor 1979; Kar &Bustard 1981;Webb & Manolis 1989;Webb et al. 1991;Sah & Stuebing 1996).The study further shows that notonly do C. porosus become trophically linked to primaryproducers in different habitats as they grow, butmedium- and large-sized individuals also specialize ondifferent prey within these food webs. In addition, noevidence was found to suggest that the crocodilesexhibit size-related spatial partitioning. These resultstentatively suggest that in areas of high abundancealong the Wenlock River, the impact of C. porosus maybe considerable given the diverse range of potential preyitems indicated by their isotopic composition.
To facilitate the interpretation of the results, hereaf-ter, wild crocodiles in the acoustic telemetry and stableisotope datasets will be referred to using four sizeclasses (the three size classes used for the individualspecialization analyses and a larger size class: small,SVL < 110 cm; medium, 110 cm < SVL < 160 cm;large, 160 cm < SVL < 188.5 cm; and very large,SVL > 188.5 cm). Individuals in each of these sizeclasses were present in both datasets, with the excep-tion of the largest size class for which only acousticdata were obtained.The cδ13C and cδ15N compositionof the C. porosus in the study indicated that individuals
Fig. 2. Movement and home range patterns of Crocodylusporosus. (a) No evidence was found to indicate that body size(snout–vent length (SVL)) was correlated with activity spacelocation (distance along river from river mouth), and (b) therelationship between body size (SVL) and activity space size(length of river occupied). Open circles are for measurescalculated from detections in 2009, and filled circles arefor measures from 2010 (grey) and 2011 (black). Fixedeffects for activity space size = (−0.004 × body size2) +(0.132 × body size) −98.374.
Table 2. Diet-tissue discrimination factors for variousCrocodylus porosus tissues
Tissue Type
Discrimination factor (‰)
Δ13C Δ15N
Blood plasma 0.8 ± 1.0 2.7 ± 0.1Red blood cells 0.6 ± 1.0 1.9 ± 0.1Collagen 2.0 ± 1.0 3.3 ± 0.3Keratin 1.4 ± 1.0 3.0 ± 0.5
Data represent mean and standard error (SE) for eachdiscrimination factor.
6 J. O. HANSON ET AL.
© 2014 The Authorsdoi:10.1111/aec.12212Austral Ecology © 2014 Ecological Society of Australia
consumed a range of diets according to their body size.While we do not have isotope data specific to prey inthe Wenlock River, several recent studies in nearbyriver systems can be used to guide the interpretation ofthe crocodile isotope data. Small crocodiles typicallyhad low cδ13C and cδ15N compositions (all samplesmean −25.3‰ cδ13C and 3.3‰ cδ15N) suggesting thatthey feed on herbivorous aquatic prey in riverine habi-tats (Jardine et al. 2012) and/or terrestrial prey that
feed predominantly on C-3 plants (cf. Vander Zanden& Rasmussen 2001; Murphy & Bowman 2009) suchas herbivorous invertebrates (mean −26.4 ± 4.8‰SD cδ13C; mean 3.7 ± 2.0‰ SD cδ15N; TD Jardine,unpublished data, 2009, 2010). The tissue cδ13C andcδ15N compositions of the medium-sized crocodileswere greater than the small crocodiles (all samplesmean −21.1‰ cδ13C and 4.6‰ cδ15N). This indi-cates that they consumed similar diets to the small
Fig. 3. The relationship between cδ15N and body size (snout–vent length (SVL)) in Crocodylus porosus. (a) Blood plasma (cδ15N(‰) = (−0.0003 × body size2) + (0.074 × body size) − 0.23), (b) red blood cells (cδ15N (‰) = (−0.0003 × body size2) + (0.074 × body size) − 0.28), (c) collagen (cδ15N (‰) = (−0.0003 × body size2) + (0.074 × body size) − 0.187), (d) keratin (cδ15N(‰) = (−0.0003 × body size2) + (0.074 × body size) − 1.385). Coefficients are for fixed effects. Outlier excluded from analysisnot shown.
Table 3. Measures of dietary niche width and individual specialization in Crocodylus porosus
Size class
Tissue composition
cδ13C cδ15N
TNW WIC BIC WIC/TNW P TNW WIC BIC WIC/TNW P
Small 1.178 0.666 0.512 0.566 0.056 0.63 0.455 0.175 0.723 0.271Medium 7.735 0.569 7.166 0.074 <0.001 1.2 0.691 0.51 0.575 0.057Large 1.561 0.497 1.064 0.318 0.003 0.623 0.55 0.073 0.883 0.665
Data represent total niche width (TNW), the within individual component (WIC) and between individual component (BIC)of niche width for three different size classes (small: SVL < 110 cm, medium: 110 cm < SVL < 160 cm, large:160 cm < SVL < 188.5 cm). Significant P-values indicate that a given size class exhibits individual specialization.
MOVEMENT AND DIET IN C. POROSUS 7
© 2014 The Authors doi:10.1111/aec.12212Austral Ecology © 2014 Ecological Society of Australia
crocodiles, but supplemented their diets with preyfrom a slightly higher trophic level (cf. DeNiro &Epstein 1981; Post 2002; Abrantes & Sheaves 2010),such as predatory fishes (cf. Jardine et al. 2012).
The large crocodiles had greater cδ13C but lowercδ15N than the medium-sized crocodiles (all samplesmean −19.7‰ cδ13C and 3.6‰ cδ15N). These valuesfor the large individuals can be derived from a mixtureof three dietary sources known to be available inriverine landscapes. The first is terrestrial herbivoresthat consume C-4 grasses (Grocke et al. 1997;Murphy & Bowman 2009). Grazers of C-4 grasses areknown to have high δ13C (mean −14.1‰ δ13C) and lowδ15N (<2‰) in relatively wet savanna regions (Grockeet al. 1997; Codron et al. 2007) such as the WenlockRiver. A second source is fish from temporary flood-plain habitats (mean −24.2 ± 3.4‰ SD cδ13C; mean8.6 ± 1.5‰ SD cδ15N; TD Jardine, unpublished data,2009, 2010). A final source is marine vertebrates thatfeed at low trophic positions (Post 2002; Abrantes &Sheaves 2010; Jardine et al. 2012), such as herbivorousfish (mean −20.4 ± 1.7‰ SD cδ13C; mean 8.0 ± 0.6‰SD cδ15N;TD Jardine, unpublished data, 2009, 2010).Large crocodiles therefore potentially consume preyfrom three distinct food webs and link terrestrial,
Fig. 4. The relationship between cδ13C and body size (snout–vent length (SVL)) in Crocodylus porous. (a) Blood plasma (cδ13C(‰) = (0.056 × body size) − 29.674), (b) red blood cells (cδ13C (‰) = (0.056 × body size) − 28.863), (c) collagen (cδ13C(‰) = (0.056 × body size) − 27.945), (d) keratin (cδ13C (‰) = (0.056 × body size) −29.384). Coefficients are for fixed effects.Outlier excluded from analysis not shown.
Fig. 5. The mean ± standard error (SE) cδ13C and cδ15Nfor each individual Crocodylus porosus based on blood plasma,red blood cells, collagen and keratin samples.
8 J. O. HANSON ET AL.
© 2014 The Authorsdoi:10.1111/aec.12212Austral Ecology © 2014 Ecological Society of Australia
freshwater and saltwater ecosystems. These findingscan be supported by anecdotal observations of largeC. porosus consuming cattle, kangaroos, and marineand freshwater fish (Kar & Bustard 1981; Webb &Manolis 1989). Our interpretations were restricted tothe feeding habits of C. porosus during the dry season.Since C. porosus in other areas have been shown totake advantage of seasonal prey abundance (e.g.Pseudogobius sp. in Taylor 1979), future studies will berequired to characterize annual dietary variation inC. porosus inhabiting the Wenlock River.
The low WIC : TNW ratios for tissue cδ13C compo-sitions for medium- and large-sized crocodiles indicatethat they specialize on prey that are trophically linkedto primary producers in different habitats. In contrast,the small-sized individuals had large WIC : TNWratios for their tissue cδ13C compositions. This resultsuggests that small-sized individuals trophically linkdifferent habitats, as reported in other populationswhere they consume tiny fish from aquatic habitatsand insects from terrestrial habitats (Sah & Stuebing1996). Because of the high connectivity among habi-tats within these wet-dry tropical landscapes, mediatedby fish and other mobile prey (Jardine et al. 2012),food sources from all potential habitats would be avail-able to crocodiles at all of our study points along thefreshwater–marine interface.This would allow them tofeed on prey according to their body size, regardless ofwhere in the freshwater–marine continuum their activ-ity space lies, and without having to travel to isotopi-cally distinct habitats.Thus, as a population, C. porosusin the Wenlock River appear to link different habitats,with different individuals feeding in freshwater, terres-trial and marine food webs, but only small-sized indi-viduals consume a considerable amount of prey frommore than one of these food webs. Given that substan-tial size-related variation in diet was also detected,individual specialization probably has a lesser role indetermining the diets of these crocodiles than theirbody size. Individual specialization and its conse-quences for habitat linkages in C. porosus requirefurther investigation.
The cδ13C and cδ15N composition of multiple tissuesreflects variation in diet over time (Tieszen et al. 1983).The duration of this snapshot relates to the difference inthe assimilation rates of the sampled tissues, wherebyusing tissues with faster and slower turnover yields alarger window than using tissues with similar turnover.Although assimilation rates have not yet been derivedfor C. porosus, blood plasma has an average residencetime of 90.9 days for δ13C and 90.1 days for δ15N andwhole scale crests have an average residence time of212.8 days for δ13C and 149.3 days for δ15N inA. mississippiensis (Rosenblatt & Heithaus 2013; con-verted from turnover rates using del Rio & Anderson-Sprecher 2008). Based on these assimilation rates,even a conservative estimate of assimilation rates in
C. porosus along with the isotopic composition of theC. porosus tissues would suggest that none of the sizeclasses underwent a substantial change in diet at thestart of the dry season (June–July). These patternsmight be attributed to the cooler temperatures associ-ated with the dry season, which could affect theiractivity levels and in turn their feeding strategies anddiet.
Body size was not correlated with the location of acrocodile’s activity space along the river. This resultindicates that the population of C. porosus inhabitingthe Wenlock River does not exhibit size-related spatialpartitioning during the early-mid section of the dryseason. However, only the movements of crocodilesbetween 160 and 240 cm SVL were monitored, and soany size-related spatial partitioning between smallerand larger sized individuals present in the study areawould not have been detected by our analyses. Never-theless, the movement patterns of the size classes thatwere monitored are in contrast to other AustralianC. porosus populations in the Northern Territory (seeLetnic 2008; Nichols & Letnic 2008). These differentspatial patterns could be attributed to differences intheir habitats because the Wenlock River ecosystemdiffers substantially from the grassy floodplain systemsof the Northern Territory. Alternatively, these differ-ences could be attributed to the use of differentmethods (tracking vs. spotlight survey counts), whichonly provide a snapshot of the population at a specifictime interval and do not provide any index of move-ment or space use.
Large-sized crocodiles, whose movements weretracked by acoustic telemetry, had an activity spacethat was greater than the small, medium and very largecrocodiles.This variation in space use may result fromdifferences in feeding strategy and intra-specificaggression (adults of C. porosus often act aggressivelytowards smaller individuals; Messel & Vorlicek 1986).Very large crocodiles may have been able to monopo-lize specific parts of the river that provide them withaccess to key resources, such as riverbanks where theycan ambush large terrestrial vertebrates that approachthe river to drink (Kar & Bustard 1981), and as suchwould not need to forage over a large area. Large-sizedcrocodiles, on the other hand, may not have been ableto access areas guarded by the very large crocodiles,and may therefore had to forage over a wider area, asobserved in satellite telemetry studies (Campbell et al.2013). As they traverse over large areas, based on theindividual specialization analyses, the large-sizedindividuals seem to forage for resources from specificfood webs. Further study is needed to determine thetissue cδ13C and cδ15N compositions of crocodiles inthe very large size class to confirm this hypothesis.
This study has several limitations. First, the δ13C andδ15N compositions of potential prey items in theWenlock River were not sampled, and specific prey
MOVEMENT AND DIET IN C. POROSUS 9
© 2014 The Authors doi:10.1111/aec.12212Austral Ecology © 2014 Ecological Society of Australia
items were not identified. But the diets of non-adultC. porosus have been well characterized by conventionalanalysis (see Taylor 1979; Webb et al. 1991; Sah &Stuebing 1996), and the main aim of the study was toprovide unique insight into the feeding ecology ofC. porosus to complement previous work. Second, thediet and movement data were not collected from thesame set of crocodiles. However, each cohort involved afairly large sample size and significant relationshipswere detected. Third, the discrimination factors werederived using a small sample size. This may introduceuncertainty into the discrimination factors and, in turn,the dietary analyses and interpretations regarding thewild crocodiles. However, the captive crocodiles wereraised on a single diet since hatchlings which makesthese discrimination factors comparable to thosederived in other studies. Moreover, only the analysesthat related to temporal variation in diet (i.e. differencesin isotopic composition between tissues and their inter-action with body size) would be compromised – theanalyses regarding individual specialization and size-related variation in diet would be unaffected.
The tissue cδ15N compositions of the wild C. porosusindicate a change in diet at approximately 130 cmSVL.This change in diet also occurs in similarly sizedC. niloticus (Radloff et al. 2012), even though thesespecies occur in different habitats (Steel 1989) andconsume different prey (cf. Cott 1961; Hutton 1987;Wallace & Alison 2008). Since these species are mor-phologically similar (Brochu 2001; Erickson et al.2012, 2013), this shared diet change further suggeststhat ontogenetic development – presumably feedingbehaviour – plays a major role in inter-specific size-related variation in diet for crocodilians.
Combining acoustic telemetry with stable isotopeanalysis showed that body size was a more importantdriver for variation in diet than size-related spatialpartitioning. Different size classes consumed preyfrom different food webs and trophic positions, andindividuals specialized in feeding on these specific preyitems. This size-related and individual-level variationin diet will no doubt have implications for the influ-ence that crocodile populations have on energy flowand prey densities along tropical savanna rivers.
ACKNOWLEDGEMENTS
We thank Rene Diocares for performing the mass spec-trometry analyses and RichardWebb for assistance withsample preparation in the Centre of Microscopy andMicroanalysis.The study was funded by the AustralianResearch Council linkage project with Australia Zoo asan industry partner.Research was completed in accord-ance to the ethical permits issued by The University ofQueensland SBS/015/11 (WISP05816009) for thecaptive crocodiles and SBS/204/11/ARC/AUST ZOO
(NF)WISP0225590) for the wild crocodiles. We arealso grateful to two anonymous referees whose com-ments greatly improved the manuscript.
REFERENCES
Abrantes K. & Sheaves M. (2010) Use of a δ13C-δ15N relation-ship to determine animal trophic positions in a tropicalAustralian estuarine wetland. Aust. Ecol. 35, 96–103.
Australian Bureau of Meteorology (1988) Climate averages. Aus-tralian Government 452 Printing Service, Canberra.
Bates D., Maechler M. & Bolker B. (2011) Lme4: Linear mixed-effects models using S4 classes. R package version 0.999375–42. [Cited 1 August 2013.] Available from URL:http://CRAN.R-project.org/package=lme4
Bivand R. & Rundel C. (2012) Rgeos: interface to geometryengine – open source (GEOS). R package version 0.2–6.[Cited 1 August 2013.] Available from URL: http://CRAN.R-project.org/package=rgeos
Bivand R. S., Pebesma E. J. & Gomez-Rubio V. (2008) AppliedSpatial Data Analysis with R. Springer, New York.
Bolnick D. I., Svanback R., Fordyce J. A. et al. (2003) Theecology of individuals: incidence and implications of indi-vidual specialisation. Am. Nat. 161, 1–28.
Brazaitis P. (1987) The identification of crocodilian skins andproducts. In: Wildlife Management: Crocodiles and Alligators(eds G. J. W. Webb, S. C. Manolis & P. J. Whitehead)pp. 373–86. Surrey Beatty and Sons Pty. Ltd, ChippingNorton.
Brochu C. A. (2001) Crocodylian snouts in space and time:phylogenetic approaches toward adaptive radiation. Am.Zool. 41, 564–85.
Busbey A. B. (1989) Form and function of the feeding apparatusof Alligator mississippiensis. J. Morphol. 202, 99–127.
Busbey A. B. (1995) The structural consequences of skull flat-tening in crocodilians. In: Functional Morphology inVertebratePaleontology. Cambridge University Press, Cambridge, pp.173–92.
Campbell H. A., Dwyer R. G., Irwin T. R. & Franklin C. E.(2013) Home range utilisation and long-range movementsof estuarine crocodiles during the breeding and nestingseason. PLoS ONE 8, 1–9.
Campbell H. A., Watts M. E., Dwyer R. G. & Franklin C. E.(2012) V-Track: software for analysing and visualisinganimal movement from acoustic telemetry detections. Mar.Freshwater Res. 63, 815–20.
Campbell H. A., Watts M. E., Sullivan S. et al. (2010) Estuarinecrocodiles ride surface currents to facilitate long-distancetravel. J. Anim. Ecol. 79, 955–64.
Caut S. (2013) Isotope incorporation in broad-snouted caimans(crocodilians). Biol. Open 2, 629–34.
Cherel Y., Hobson K. A., Bailleul F. & Groscolas R. (2005)Nutrition, physiology, and stable isotopes: new informationfrom fasting and molting penguins. Ecology 86, 2881–8.
Chisholm B. S., Nelson D. E. & Schwarcz H. P. (1983) Marineand terrestrial protein in prehistoric diets on the British-Columbia coast. Curr. Anthropol. 24, 396–8.
Codron D., Lee-Thorp J. A., Sponheimers J. C., De Ruiter D. &Brink J. S. (2007) Significance of diet type and diet qualityfor ecological diversity of African ungulates. J. Anim. Ecol.76, 526–37.
Cott H. B. (1961) Scientific results of an inquiry into the ecologyand economic status of the Nile Crocodile (Crocodilus
10 J. O. HANSON ET AL.
© 2014 The Authorsdoi:10.1111/aec.12212Austral Ecology © 2014 Ecological Society of Australia
niloticus) in Uganda and Northern Rhodesia. Trans. Zool.Soc. Lond. 29, 211–356.
del Rio C. M. & Anderson-Sprecher R. (2008) Beyond thereaction progress variable: the meaning and significance ofisotopic incorporation data. Oecologia 156, 765–72.
DeNiro M. J. & Epstein S. (1978) Influence of diet on thedistribution of carbon isotopes in animals. Geochim.Cosmochim. Acta 42, 495–506.
DeNiro M. J. & Epstein S. (1981) Influence of diet on thedistribution of nitrogen isotopes in animals. Geochim.Cosmochim. Acta 45, 341–51.
Dodge K. L., Logan J. M. & Lutcavage M. E. (2011) Foragingecology of leatherback sea turtles in the Western NorthAtlantic determined through multi-tissue stable isotopeanalyses. Mar. Biol. 158, 2813–24.
Dwyer R. G., Campbell H.A., Irwin T. & Franklin C. E. (in press)Does the telemetry technology matter? Comparing estimatesof aquatic animal space-use generated from GPS-based andpassive acoustic tracking. Mar. Freshwater Res. http://www.publish.csiro.au/view/journals/dsp_journals_pip_abstract_scholar1.cfm?nid=126&pip=MF14042
Erickson G. M., Gignac P. M., Lappin A. K., Vliet K. A.,Brueggen J. D. & Webb G. J. W. (2013) A comparativeanalysis of ontogenetic bite-force scaling among Crocodylia.J. Zool. 1, 48–55.
Erickson G. M., Gignac P. M., Steppan S. J. et al. (2012) Insightsinto the ecology and evolutionary success of crocodiliansrevealed through bite-force and tooth-pressure experimen-tation. PLoS ONE 7, 1–12.
Franklin C. E., Read M. A., Kraft P. G., Liebsch N., Irwin S. R. &Campbell H. A. (2009) Remote monitoring of crocodilians:implantation, attachment and release methods for transmit-ters and data-loggers. Mar. Freshwater Res. 60, 284–92.
Frey E. (1988) Anatomie des Körperstammes von Alligatormississippiensis Daudin. Stuttg. Beitr. Naturkt. Ser. A. 424,1–106.
Frey E. & Salisbury S. W. (2001) The kinematics of aquaticlocomotion in Osteolaemus tetraspis Cope. In: CrocodilianBiology and Evolution (eds G. C. Grigg, F. Seebacher & C. E.Franklin) pp. 165–79. Surrey Beatty and Sons Pty. Ltd.,Chipping Norton.
Fukuda Y., Whitehead P. & Boggs G. (2008) Broad-scale envi-ronmental influences on the abundance of saltwater croco-diles (Crocodylus porosus) in Australia. Wildl.Res. 35, 167–76.
Grocke D. R., Bocherens H. & Mariotti A. (1997) Annual rain-fall and nitrogen-isotope correlation in macropod collagen:application as a palaeoprecipitation indicator. Earth Planet.Sci. Lett. 153, 279–85.
Hijmans R. J. & van Etten J. (2012). Raster: Geographic analysisand modeling with raster data. R package version 2.0–08.[Cited 1 August 2013.] Available from URL: http://CRAN.R-project.org/package=raster
Hobson K. A., Alisauskas R. T. & Clark R. G. (1993) Stable-nitrogen isotope enrichment in avian tissues due to fastingand nutritional stress: implications for isotopic analyses ofdiet. Condor 95, 388–94.
Hobson K. A. & Clark R. G. (1992) Assessing avian diets usingstable isotopes. 1. Turnover of 13C in tissues. Condor 94,181–8.
Hutton J. M. (1987) Growth and feeding ecology of the Nilecrocodile Crocodylus niloticus at Ngezi, Zimbabwe. J. Anim.Ecol. 56, 25–38.
Jackson J. F., Campbell H. W. & Campbell K. E. Jr. (1974) Thefeeding habits of crocodilians: validity of the evidence fromstomach contents. J. Herpetol. 8, 378–81.
Jardine T., Pusey B., Hamilton S. et al. (2012) Fish mediate highfood web connectivity in the lower reaches of a tropicalfloodplain river. Oecologia 168, 829–38.
Kar S. K. & Bustard H. R. (1981) Attacks on domestic livestockby the saltwater crocodile (Crocodylus porosus) in Orissa,India. Brit. J. Herpetol. 6, 135–6.
Kempster B., Zanette L., Longstaffe F. J., MacDougall-Shackleton S. A., Wingfield J. C. & Clinchy M. (2007)Do stable isotopes reflect nutritional stress? Results from alaboratory experiment on song sparrows. Oecologia 151,365–71.
Letnic M. (2008) A comparison of saltwater crocodile(Crocodylus porosus) populations in freshwater-floodplainand tidal river habitats of the Adelaide River catchment,Northern Territory, Australia. Appl. Herpetol. 5, 243–52.
Limpus C. J. (1980) Observations of Crocodylus porosus in thenorthern Great Barrier Reef. Herpetofauna 12, 34.
Logan J. M., Jardine T. D., Miller J. M., Bunn S. E., Cunjak R.A. & Lutcavage M. E. (2008) Lipid corrections in carbonand nitrogen stable isotope analyses: comparison of chemi-cal extraction and modelling methods. J. Anim. Ecol. 77,838–46.
Magnusson W. E. (1980) Habitat required for nesting byCrocodylus porosus (Reptilia, Crocodilidae) in northernAustralia. Aust.Wildl. Res. 7, 149–56.
Magnusson W., Grigg G. & Taylor J. (1980) An aerial survey ofpotential nesting areas of Crocodylus porosus on the westcoast of Cape York peninsula. Aust.Wildl. Res. 7, 465–78.
Marques T. S., Lara N. R., Bassetti L. A., Piña C. L. & VerdadeL. M. (2013) Intraspecific isotopic niche variation in broad-snouted caiman (Caiman latirostris). Isotopes.Environ.Health.Stud. 49, 325–35.
Matich P., Heithaus M. R. & Layman C. A. (2011) Contrastingpatterns of individual specialisation and trophic coupling intwo marine apex predators. J. Anim. Ecol. 80, 294–305.
Messel H. & Vorlicek G. C. (1986) Population dynamics andstatus of Crocodylus porosus in the tidal waterways of north-ern Australia. Aust.Wildl. Res. 13, 71–111.
Messel H., Vorlicek G. C., Wells A. G. et al. (1981) Surveys ofTidalWaterways on CapeYok Peninsula, Queensland Australia,and Their Crocodile Populations. Monograph 16. PergamonPress, Sydney.
Murphy B. P. & Bowman D. (2009) The carbon and nitrogenisotope composition of Australian grasses in relation toclimate. Funct. Ecol. 23, 1040–9.
Murtaugh P. A. (2009) Performance of several variable-selectionmethods applied to real ecological data. Ecol. Lett. 12,1061–8.
Newsome S. D., Tinker M.T., Monson D. H. et al. (2009) Usingstable isotopes to investigate individual diet specialisation inCalifornia sea otters (Enhydra lutris nereis). Ecology 90, 961–74.
Nichols T. & Letnic M. (2008) Problem crocodiles: reducing therisk of attacks by Crocodylus porosus in Darwin harbour,Northern Territory, Australia. In: Urban Herpetology, Herpe-tological Conservation 3 (eds R. E. Jung & J. C. Mitchel) pp.509–17. Society for the study of Amphibians and Reptiles,Salt Lake City.
Nieuwenhuis R., Pelzer B. & te Grotenhuis M. (2011) Influence.ME: Tools for detecting influential data in mixed effectsmodels. R package version 0.8.1. [Cited 1 August 2013.]Available from URL: http://CRAN.R-project.org/package=influence.ME
Pillans R. D., Stevens J. D. & Edgar S. (2008) Spatial distributionand habitat utilisation of the speartooth shark Glyphis sp. A
MOVEMENT AND DIET IN C. POROSUS 11
© 2014 The Authors doi:10.1111/aec.12212Austral Ecology © 2014 Ecological Society of Australia
in relation to fishing in Northern Australia. CSIRO Marineand Atmospheric Research.
Post D. M. (2002) Using stable isotopes to estimate trophicposition: models, methods, and assumptions. Ecology 83,703–18.
Post D. M., Layman C., Arrington D., Takimoto G., QuattrochiJ. & Montaña C. (2007) Getting to the fat of the matter:models, methods and assumptions for dealing with lipids instable isotope analyses. Oecologia 152, 179–89.
R Development Core Team (2013) A Language and Environmentfor Statistical Computing. R Foundation for Statistical Com-puting, Vienna. ISBN 3-900051-07-0. [Cited 1 August2013.] Available from URL: http://www.R-project.org/.
Radloff F. G. T., Hobson K. A. & Leslie A. J. (2012) Character-ising ontogenetic niche shifts in Nile crocodile using stableisotope (δ13C, δ15N) analyses of scute keratin. Isotopes.Environ. Health. Stud. 48, 439–56.
Rosenblatt A. E. & Heithaus M. R. (2011) Does variation inmovement tactics and trophic interactions among Americanalligators create habitat linkages? J. Anim. Ecol. 80, 786–98.
Rosenblatt A. E. & Heithaus M. R. (2013) Slow isotope turnoverrates and low discrimination values in the American alliga-tor: implications for interpretation of ectotherm stableisotope data. Physiol. Biochem. Zool. 86, 137–48.
Roughgarden J. (1974) Niche width: biogeographic patternsamong Anolis lizard populations. Am. Nat. 108, 429–42.
Sah S. A. M. & Stuebing R. B. (1996) Diet, growth and move-ments of juvenile crocodiles Crocodylus porosus Schneider inthe Klias River, Sabah, Malaysia. J.Trop. Ecol. 12, 651–62.
Sheather S. J. & Jones M. C. (1991) A reliable data-based band-width selection method for kernel density estimation. J. Roy.Stat. Soc. B 53, 683–90.
Steel R. (1989) Crocodiles. Christopher Helm, London.Taylor J. (1979) The foods and feeding habits of subadult
Crocodylus porosus Schneider in northern Australia. Aust.Wildl. Res. 6, 347–59.
Tieszen L. L., Boutton T.W., Tesdahl K. G. & Slade N. A. (1983)Fractionation and turnover of stable carbon isotopes inanimal tissues – implications for δ13C analysis of diet.Oecologia 57, 32–7.
van Etten J. (2012) Gdistance: distances and routes on geographi-cal grids. R package version 1.1–4. [Cited 1 August 2013.]Available from URL: http://CRAN.R-project.org/package=gdistance
Vander Zanden M. J. & Rasmussen J. B. (2001) Variation in δ15Nand δ13C trophic fractionation: implications for aquatic foodweb studies. Limnol. Oceanogr. 46, 2061–6.
Wallace K. M. & Alison J. L. (2008) Diet of the Nile Crocodile(Crocodylus niloticus) in the Okavango Delta, Botswana. J.Herpetol. 42, 361–8.
Webb G. J. W., Hollis G. J. & Manolis S. C. (1991) Feeding,growth, and food conversion rates of wild juvenile saltwatercrocodiles (Crocodylus porosus). J. Herpetol. 25, 462–73.
Webb G. & Manolis S. (1989) Crocodiles of Australia. Reed NewHolland, Sydney.
Whiting S. D. & Whiting A. U. (2011) Predation by the saltwatercrocodile (Crocodylus porosus) on sea turtle adults, eggs, andhatchlings. Chelonian Conserv. Biol. 10, 198–205.
Zaccarelli N., Mancinelli G. & Bolnick D. I. (2013) RInSp: an Rpackage for the analysis of individual specialisation in
resource use. Methods Ecol. Evol. 4, 1018–23.
SUPPORTING INFORMATION
Additional Supporting Information may be found inthe online version of this article at the publisher’sweb-site:
Appendix S1. Wild Crocodylus porosus tissue sampleand body size data.
12 J. O. HANSON ET AL.
© 2014 The Authorsdoi:10.1111/aec.12212Austral Ecology © 2014 Ecological Society of Australia