feedforward ankle strategy of balance during quiet stance in adults
TRANSCRIPT
A major problem for human standing posture is a high
centre of gravity (COG) maintained over a relatively small
base of support. The body, therefore, has a high potential
energy, leading to priority of equilibrium control during
almost all motor tasks including quiet standing. Research
on postural control has focused mainly on two types of
study. One type evaluates balance with respect to external
conditions. Unexpected external disturbances reveal centrally
programmed stereotyped postural responses. Afferent
feedback also influences posture when the initial setting is
disturbed. The second type evaluates postural adjustments
to anticipated internal disturbances of balance and reveals
feedforward postural adjustments (for review, see Oddson,
1990; Dietz, 1992). By feedforward, we mean that the
controller predicts an external input or behaves using higher-
order processing rather than simple negative feedback of a
variable.
Fewer studies have dealt with the problem of maintaining
balance during quiet relaxed stance. Hellebrandt (1938)
introduced the concept of the stretch reflex strategy, or
‘geotropic reflex’ where the shift of the COG constantly
stimulated stretch afferents of postural muscles that then
contracted reflexively. This strategy was questioned since
the angular motion at the ankle was less than necessary to
elicit a stretch reflex (Kelton & Wright, 1949). Subsequent
studies supported a central organization of posture that did
not regulate the ankle angle or muscle length but a more
global parameter such as the position of the COG (Gurfinkel
et al. 1980; Dietz, 1992). Thus, the system strategy replaced
the stretch reflex strategy whose role was then limited to
Journal of Physiology (1999), 514.3, pp.915—928 915
Feedforward ankle strategy of balance during quiet stance
in adults
Plamen Gatev*, Sherry Thomas, Thomas Kepple† and Mark Hallett
Human Motor Control Section, National Institute of Neurological Disorders and Stroke,
NIH, Bethesda, MD 20892, USA, *Institute of Physiology, Bulgarian Academy
of Sciences, 1113 Sofia, Bulgaria and †Rehabilitation Medicine Department,
Warren Grant Magnusson Clinical Center, NIH Bethesda, MD 20892, USA
(Received 22 September 1998; accepted after revision 15 October 1998)
1. We studied quiet stance investigating strategies for maintaining balance. Normal subjects
stood with natural stance and with feet together, with eyes open or closed. Kinematic,
kinetic and EMG data were evaluated and cross-correlated.
2. Cross-correlation analysis revealed a high, positive, zero-phased correlation between
anteroposterior motions of the centre of gravity (COG) and centre of pressure (COP), head
and COG, and between linear motions of the shoulder and knee in both sagittal and frontal
planes. There was a moderate, negative, zero-phased correlation between the anteroposterior
motion of COP and ankle angular motion.
3. Narrow stance width increased ankle angular motion, hip angular motion, mediolateral
sway of the COG, and the correlation between linear motions of the shoulder and knee in the
frontal plane. Correlations between COG and COP and linear motions of the shoulder and
knee in the sagittal plane were decreased. The correlation between the hip angular sway in
the sagittal and frontal planes was dependent on interaction between support and vision.
4. Low, significant positive correlations with time lags of the maximum of cross-correlation of
250—300 ms were found between the EMG activity of the lateral gastrocnemius muscle and
anteroposterior motions of the COG and COP during normal stance. Narrow stance width
decreased both correlations whereas absence of vision increased the correlation with COP.
5. Ankle mechanisms dominate during normal stance especially in the sagittal plane. Narrow
stance width decreased the role of the ankle and increased the role of hip mechanisms in the
sagittal plane, while in the frontal plane both increased.
6. The modulation pattern of the lateral gastrocnemius muscle suggests a central program of
control of the ankle joint stiffness working to predict the loading pattern.
8119
Keywords: Posture, Joint, stance width
coping with perturbations not predicted by the ongoing
central program.
Current understanding of the system strategy, however,
leaves many important questions open. The first concerns
the mechanism of the system strategy. It might be based on
internal central commands andÏor reflexive responses in
terms of a stretch reflex with a co_ordinated supraspinal
gain control. Fitzpatrick et al. (1992) extrapolated from their
protocol of random and gentle disturbances of stance and
proposed a reflexive postural control for unperturbed stance
assuming there were postural reflexes with a broad range of
latencies. However, Collins & De Luca (1993, 1995), in their
studies of quiet stance using a ‘random walk’ model of the
centre-of-pressure (COP) excursions, suggested that two
types of postural control, ‘open-loop’ and ‘closed-loop’,
coexist in the sagittal and frontal planes. The ‘open-loop’
postural behaviour had a fixed time of close to a second, but
its mechanism remained uncertain. The ‘closed-loop’ control
was found to be utilized over an interval longer than a second.
Studies of the postural responses to unexpected small and
slow external disturbances by support translation in the
anteroposterior direction found that most people reposition
the COG by swaying as a flexible inverted pendulum
primarily about the ankles with little hip or knee motion.
This stereotyped pattern of muscle activation was called
‘ankle strategy’. When responding to larger, faster
displacement of support, the primary action of most people
occurs at the hip resulting in active trunk rotation or the so-
called ‘hip strategy’ (Nashner & McCollum, 1985). The
choice of a postural strategy to disturbance was found to
depend on the available appropriate sensory information
(Nashner et al. 1989). However, biomechanical optimization
models (Kuo & Zajak, 1993; Kuo, 1995) have suggested that
a mixed hip—ankle strategy in the anteroposterior direction
instead of a pure ankle strategy would be used to correct
postural disturbances of any speed if the main objective of
optimization is a minimal ‘neural effort’. The prediction was
based on the limited effectiveness of ankle torques to correct
disturbances due to the great moment of inertia of the
whole body and on the difficulties of independent control of
ankle and hip postural mechanisms. The application of these
models to quiet stance, however, is still far from clear.
Studies of quiet stance have suggested separate postural
strategies of quiet stance for the anteroposterior and
mediolateral equilibrium depending on the stance position
(Day et al. 1993; Winter et al. 1996). Hip—ankle joint
coupling in the frontal plane during quiet stance was found
to increase with stance width implying afferent control of
lateral sway (Day et al. 1993). Moreover, the postural
strategies for anteroposterior and mediolateral equilibrium
may use separate afferent inputs (Gatev et al. 1996).
However, there is evidence for interaction between postural
strategies for two equilibria in both motor (Day et al. 1993;
Winter et al. 1996) and sensory aspects (Day et al. 1993;
Gatev et al. 1996), and the nature of this interaction needs
further clarification.
Postural sway during quiet stance is often assumed to be a
resultant sum of internal noises generated in the postural
control system carrying little useful information (Ishida &
Imai, 1980; Fitzpatrick et al. 1992). This suggests that a
small and slow sway as a part of the postural control during
quiet stance might be important to provide updated and
appropriate sensory information helpful to standing balance.
The main aim of the present work is to assess strategies of
balance during quiet stance. We sought to determine the
correlation between postural muscle activity and sway
events. As the choice of postural strategy depends on the
support and sensory conditions, we also evaluated the
influences of narrow stance width and absence of vision.
METHODS
Experimental subjects
Seven healthy male volunteers aged 24—54 years (mean, 42·3 years)
participated in the study. They ranged in height from 165 to
185 cm and weighed between 57 and 89 kg. The study was
approved by the NINDS Institutional Review Board, and all
subjects gave informed consent.
Experimental set
The kinematic data were collected using the VICON system (Oxford
Metrics Inc., Oxford, UK) with five CCD (charge-coupled device)
cameras. The cameras were calibrated in a volume extending 2·0 m
in the vertical (Z), 1·2 m in the anterior (Y) and 0·6 m in the
lateral (X) direction. Camera system calibration and three-
dimensional target reconstruction were done by AMASS (Adtech,
Adelphi, MD, USA) software. Average residual errors did not
exceed 3 mm for each camera. A camera non-linearity process was
performed before the camera calibration and was applied to all
kinematic data. The co_ordinate system of the laboratory had a
positive sense in the directions: Z = up, Y = forward, X = right.
Retroreflective spherical markers covered with 3 M high gain 7610
retroreflective tape of 25·4 mm diameter were affixed bilaterally to
the fifth metatarsal head, lateral malleolus, lateral femoral
epicondyle, greater trochanter, acromion, cheekbone in front of the
tragus, forehead, elbow, and the styloid process of the radius. Root-
mean-square (RMS) noise level of the system measured at the right
ankle marker did not exceed 0·2 mm for X and Z and 0·3 mm for Y
components.
Kinetic data were collected by a force platform AMTI type OR6-3
(Advanced Mechanical Technology, Inc., Newton, MA, USA), that
measures the X, Y and Z forces (Fx, Fy and Fz) as well as the X,
Y and Z moments (Mx, My and Mz). The centre of pressure (COP)
(at the force transducers) was determined based on the cross product:
Moment on plates = (COP) (Force).
From this, the X (CPx) and Y (CPy) co_ordinates of the COP at the
surface of the plate were determined:
CPx = ([(CPz) (Fx)] − My)ÏFz
and
CPy = ([(CPz) (Fy)] + Mx)ÏFz,
where CPz is the distance from transducers to the surface of the
plate.
Bipolar electrodes with preamplifiers (frequency band, 10—40 kHz;
gain, ²300) were fixed to the right anterior tibial, lateral
P. Gatev, S. Thomas, T. Kepple and M. Hallett J. Physiol. 514.3916
gastrocnemius, femoral quadriceps (vastus lateralis) and femoral
biceps (lateral head) muscles. Two simultaneous recordings were
made from each muscle with leading-off sites separated by about
3 cm along and 2 cm across the muscle fibres. The EMG signal was
preamplified, then sequentially high-pass filtered, rectified and
low-pass filtered with a 50 Hz Bessel filter and amplified. Video
and force platform data were synchronously sampled (sampling
rate, 50 Hz) with the EMG data (sampling rate, 200 Hz) by a
PDP_11Ï73 computer (10-bit ADC) and transferred to a VAX
11Ï750 computer. The collected kinematic and kinetic data
underwent a smoothing procedure with a second order Butterworth
filter (6 Hz) with the data filtered in the forward and reverse
direction to avoid phase lag (Winter, 1990).
The task of the subject was to step on the force platform after a
command and to maintain balance holding a very light wooden bar
(weight, 50 g; length, 0·9 m) in his hands with the arms freely
hanging along the body and forearms in supination. This arm
position was chosen to avoid both masking the markers and having
the arms enter into the dynamics. Subjects were instructed to stand
quietly.
Four experimental conditions were studied: (1) EO, standing with
eyes open and natural support area (approximately 1—2 in between
the heels and 10 in between the toes); (2) EC, standing with eyes
closed and natural support area; (3) EOR, standing with eyes open
and with feet close together (Romberg stance); and (4) ECR,
standing with eyes closed and with feet close together. The duration
of each whole trial was 50 s. The initial epoch of the first 13 s was
discarded from the analysis. There were five trials for each
condition; sufficient time for rest was allowed between the trials
and between the conditions.
Measures and statistical procedures
Postural alignment. The right ‘COG’, which we will refer to as the
COG, was calculated according to Dempster (1956) using the set of
markers on the right side and assuming head and trunk as a whole.
This procedure produces a measure to the right of the true COG.
Mid-ankle point Y and X co_ordinates were calculated from the data
for the two ankle markers. Quasijoint right ankle and hip angles were
computed based on the relationship between markers. The trunk and
pelvis were assumed as a whole for the hip angle computation.
The following were measured: (1) anteroposterior and mediolateral
displacements of the COG from the mid-ankle point; (2) right ankle
angle in the sagittal plane defined by foot, ankle and knee markers
on the right side; (3) right hip angle in the sagittal plane defined by
the knee, hip and shoulder markers; and (4) right hip angle in the
frontal plane defined by the knee, hip and shoulder markers. The
mean of all frames during the last 37 s of the trial was calculated
and used to measure the mean of the means and s.d. for each
condition and each subject.
Postural sway. Balance during the four experimental conditions
was described by the following measures: (1) standard deviation
(s.d.) and range of anteroposterior sway of COG during each trial
(duration 37 s, sampling rate 50 Hz); (2) s.d. and range of
mediolateral sway of COG; (3) s.d. and range of angular motion of
the right ankle angle defined by the foot, ankle and knee markers;
(4) s.d. and range of angular displacements of the right hip angle in
the sagittal plane defined from knee, hip and shoulder markers; and
(5) s.d. and range of angular displacements of the right hip angle in
the frontal plane defined from knee, hip and shoulder markers. The
mean and s.d. of each measure for each condition were calculated;
s.d. is numerically equivalent to the RMS of a signal that has a
mean value of zero. These measures of angular motion were chosen
to obtain data for co_ordination of body parts in addition to COG
motion data.
Cross-correlation analysis. The data were subjected to correlation
analysis using a program specially designed for this study to make
cross-correlation between two signals (Draper & Smith, 1981). The
cross-correlation window was 10 s with a maximal time shift of 3 s.
The sampling interval was 80 ms (125 samples in 10 s). The
sampling step of 80 ms was used because this was the largest step
time that could be used without aliasing the 6 Hz signal. Using the
largest step time reduced processing time and increased the value
of the correlation coefficient needed for significance, thus avoiding
false positives. Slow linear trends were eliminated by baseline
correction for the whole cross-correlation epoch of 16 s. To remove
the slow drift (or DC) component of the signal, a line was made
through the first and last data points, and each data point was
adjusted by the following equation:
Y(t)' = Y(t) − (Y(o) + (slope² time)),
where Y(t)' is the adjusted value of the signal at time t, Y(t) is the
original value of the signal at time t, Y(o) is the first signal value
and the slope is: (Y(last) − Y(o))Ïsampling period. Thus, the
correlation analysis focused on postural sway frequency content
from 0·1 to 6 Hz. Cross-correlations were done for two separate
epochs for each trial; all cross-correlation functions were averaged.
Cross-correlation was evaluated between: (1) anteroposterior motions
of the COG and the COP; (2) EMG activity of the lateral gastroc-
nemius muscle and the anteroposterior motion of the COG; (3) EMG
activity of the lateral gastrocnemius muscle and the anteroposterior
motion of the COP; (4) EMG activity of the lateral gastrocnemius
muscle and angular motion of the anatomical ankle angle defined
by the foot, ankle and knee points; (5) COP anteroposterior motion
and angular motion of the anatomic ankle angle defined by the foot,
ankle and knee points; (6) anteroposterior motion of the COP and
angular motion of the knee angle in the sagittal plane defined by
the ankle, knee and hip points; (7) anteroposterior motion of the
COP and angular motion of the hip angle in the sagittal plane
defined by the knee, hip and shoulder points; (8) anteroposterior
motions of the knee and shoulder points; (9) mediolateral motions of
the knee and shoulder points; (10) anteroposterior motion of the hip
point and angular displacement of the hip angle in the sagittal plane
defined by the knee, hip and shoulder points; (11) mediolateral
motion of the hip point and angular motion of the hip angle in the
frontal plane defined by the knee, hip and shoulder points;
(12) anteroposterior motion of the right head point and the COG;
and (13) angular motions of the hip angle in the sagittal and frontal
planes defined by the knee, hip and shoulder points.
The value and time shift of the highest extremes of the averaged
cross-correlation function for each condition and for each subject
were measured. The correlation between the two planar projections
of the hip angle was done to test the association between the
anteroposterior and lateral sway or the so-called diagonal sway.
Since left-to-right diagonal sway and right-to-left sway may cause a
positive or negative correlation depending on the prevailing
direction, we also averaged the absolute values of the cross-
correlation extremes. This will indicate a preference for diagonal
sway regardless of which diagonal is preferred. The value of each
maximal cross-correlation coefficient underwent Z-transformation
to normalize the data (Sachs, 1982). The difference from zero of the
mean maximal cross-correlation coefficient of the group for a given
condition was tested by means of Student’s t test. As a level of
significance, P < 0·001 or Zr > 0·31 was used to prevent excessive
false positives. After the statistical procedures, the Z-transformed
correlation coefficients were transformed back to the correlation
Feedforward ankle strategy of stanceJ. Physiol. 514.3 917
coefficients that are presented in the figures for the convenience of
the reader. In the time lag of the maximum of the cross-correlation
function, the difference of the mean time lag of the group from zero
was tested with Student’s t test for each condition. A two-way
ANOVA test was applied to evaluate the statistical significance of
the factor width of the support with two levels: normal and narrow
support (Romberg stance); and the factor of vision with two levels:
eyes open and eyes closed. P < 0·05 was used as the level of
significance.
RESULTS
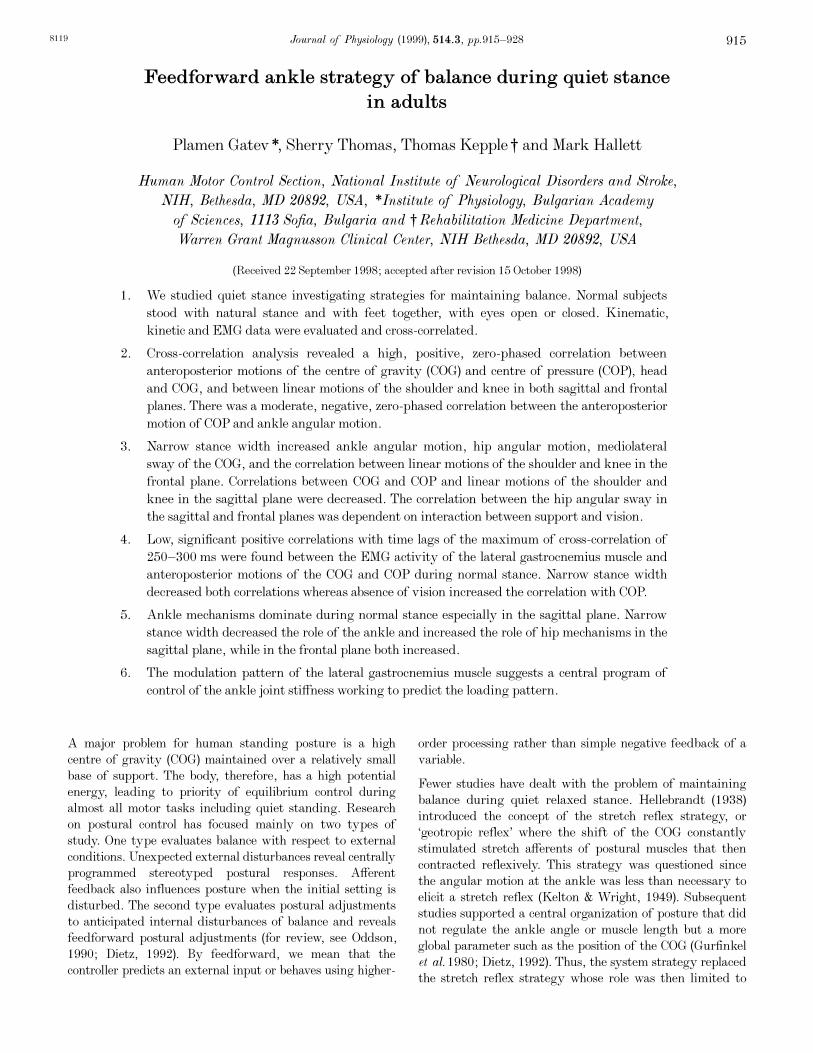
Postural alignment
The means and s.d.s for the group of the postural alignment
measures during the four conditions are presented in Fig. 1.
The means of ankle angle for the group varied about 3 deg
between the conditions and were, in general, smaller with
the Romberg stance. The means of hip angle of the group in
the sagittal plane showed similar values in all conditions
except in EOR, when this angle was about 1 deg larger. The
COG in the Y direction was closer to the mid-ankle point by
4—5 mm during narrow width stance conditions. These
findings indicate a tendency for postural change with
narrow stance including dorsiflexion at the ankle, extension
at the hip, and movement of the COG backward. However,
none of these changes reached statistical significance. The
hip angle in the frontal plane decreased significantly by
about 2 deg with narrow stance (F = 11·1, P < 0·05)
reflecting decreased hip lateral flexion due to thigh
P. Gatev, S. Thomas, T. Kepple and M. Hallett J. Physiol. 514.3918
Figure 1. Postural alignment during standing with normal stance width and eyes open (EO),
standing with normal stance width and eyes closed (EC); standing with narrow stance width
(Romberg stance) and eyes open (EOR); and standing with narrow stance width and eyes closed
(ECR)
Top, group means ± standard error of mean (s.e.m.) (n = 7) of the ankle and hip angles (all in deg) in the
sagittal plane and hip angle in the frontal plane during four conditions. Bottom, group means ± s.e.m. of
the distances of the right centre of gravity (COG) to the mid-ankle point in the sagittal and frontal planes
during the four conditions.
adduction (Fig. 1). There was a very small difference in the
distance between the COG and the mid-ankle point in the X
direction (< 2 mm) among the four conditions. ANOVA
revealed no significant effect of vision, nor were there any
interactions between support and vision.
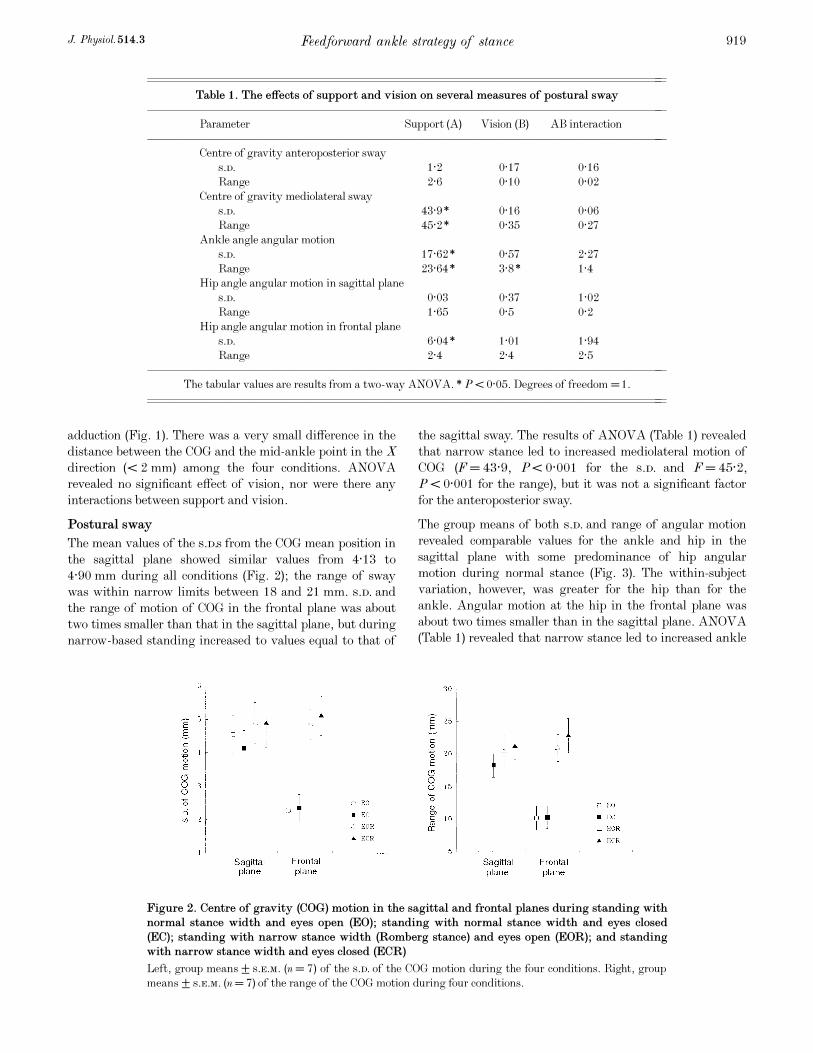
Postural sway
The mean values of the s.d.s from the COG mean position in
the sagittal plane showed similar values from 4·13 to
4·90 mm during all conditions (Fig. 2); the range of sway
was within narrow limits between 18 and 21 mm. s.d. and
the range of motion of COG in the frontal plane was about
two times smaller than that in the sagittal plane, but during
narrow-based standing increased to values equal to that of
the sagittal sway. The results of ANOVA (Table 1) revealed
that narrow stance led to increased mediolateral motion of
COG (F = 43·9, P < 0·001 for the s.d. and F = 45·2,
P < 0·001 for the range), but it was not a significant factor
for the anteroposterior sway.
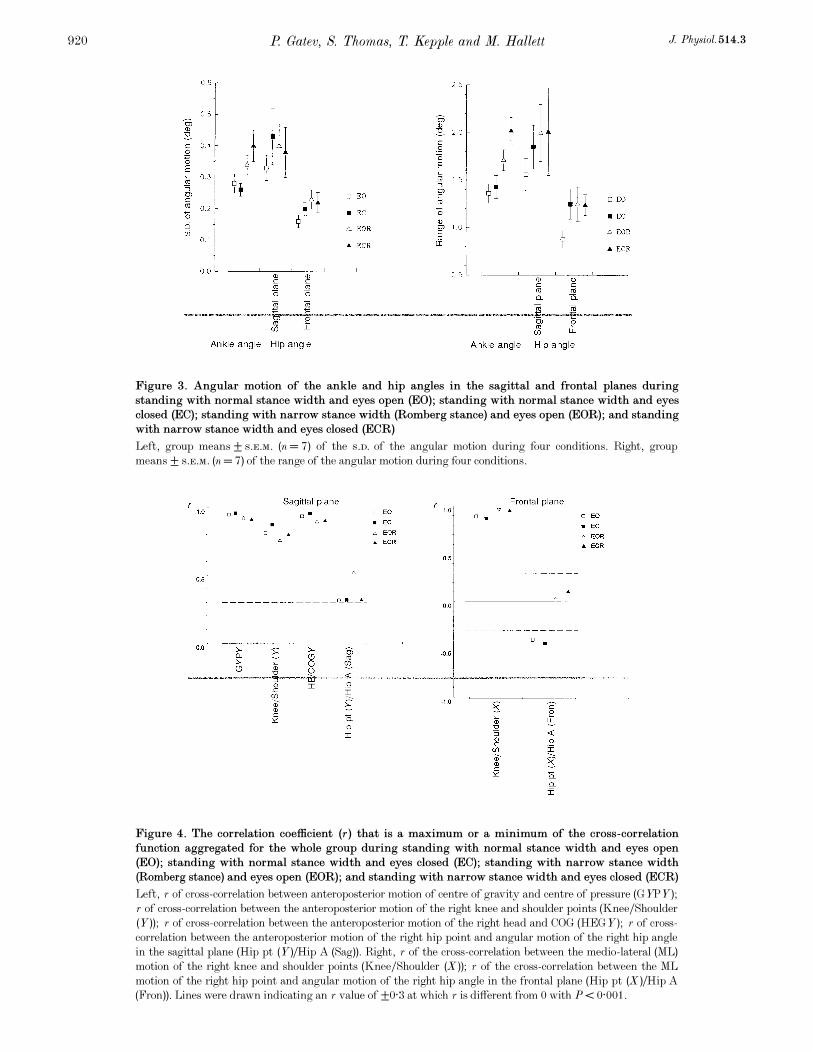
The group means of both s.d. and range of angular motion
revealed comparable values for the ankle and hip in the
sagittal plane with some predominance of hip angular
motion during normal stance (Fig. 3). The within-subject
variation, however, was greater for the hip than for the
ankle. Angular motion at the hip in the frontal plane was
about two times smaller than in the sagittal plane. ANOVA
(Table 1) revealed that narrow stance led to increased ankle
Feedforward ankle strategy of stanceJ. Physiol. 514.3 919
Figure 2. Centre of gravity (COG) motion in the sagittal and frontal planes during standing with
normal stance width and eyes open (EO); standing with normal stance width and eyes closed
(EC); standing with narrow stance width (Romberg stance) and eyes open (EOR); and standing
with narrow stance width and eyes closed (ECR)
Left, group means ± s.e.m. (n = 7) of the s.d. of the COG motion during the four conditions. Right, group
means ± s.e.m. (n = 7) of the range of the COG motion during four conditions.
––––––––––––––––––––––––––––––––––––––––––––––––––––––––––––––––––––––––––––––––––––––––––––
Table 1. The effects of support and vision on several measures of postural sway
––––––––––––––––––––––––––––––––––––––––––––––
Parameter Support (A) Vision (B) AB interaction
––––––––––––––––––––––––––––––––––––––––––––––
Centre of gravity anteroposterior sway
s.d. 1·2 0·17 0·16
Range 2·6 0·10 0·02
Centre of gravity mediolateral sway
s.d. 43·9* 0·16 0·06
Range 45·2* 0·35 0·27
Ankle angle angular motion
s.d. 17·62* 0·57 2·27
Range 23·64* 3·8* 1·4
Hip angle angular motion in sagittal plane
s.d. 0·03 0·37 1·02
Range 1·65 0·5 0·2
Hip angle angular motion in frontal plane
s.d. 6·04* 1·01 1·94
Range 2·4 2·4 2·5
––––––––––––––––––––––––––––––––––––––––––––––
The tabular values are results from a two-way ANOVA. *P < 0·05. Degrees of freedom =1.
––––––––––––––––––––––––––––––––––––––––––––––––––––––––––––––––––––––––––––––––––––––––––––
P. Gatev, S. Thomas, T. Kepple and M. Hallett J. Physiol. 514.3920
Figure 3. Angular motion of the ankle and hip angles in the sagittal and frontal planes during
standing with normal stance width and eyes open (EO); standing with normal stance width and eyes
closed (EC); standing with narrow stance width (Romberg stance) and eyes open (EOR); and standing
with narrow stance width and eyes closed (ECR)
Left, group means ± s.e.m. (n = 7) of the s.d. of the angular motion during four conditions. Right, group
means ± s.e.m. (n = 7) of the range of the angular motion during four conditions.
Figure 4. The correlation coefficient (r) that is a maximum or a minimum of the cross-correlation
function aggregated for the whole group during standing with normal stance width and eyes open
(EO); standing with normal stance width and eyes closed (EC); standing with narrow stance width
(Romberg stance) and eyes open (EOR); and standing with narrow stance width and eyes closed (ECR)
Left, r of cross-correlation between anteroposterior motion of centre of gravity and centre of pressure (GYPY);
r of cross-correlation between the anteroposterior motion of the right knee and shoulder points (KneeÏShoulder
(Y)); r of cross-correlation between the anteroposterior motion of the right head and COG (HEGY); r of cross-
correlation between the anteroposterior motion of the right hip point and angular motion of the right hip angle
in the sagittal plane (Hip pt (Y)ÏHip A (Sag)). Right, r of the cross-correlation between the medio-lateral (ML)
motion of the right knee and shoulder points (KneeÏShoulder (X)); r of the cross-correlation between the ML
motion of the right hip point and angular motion of the right hip angle in the frontal plane (Hip pt (X)ÏHip A
(Fron)). Lines were drawn indicating an r value of ±0·3 at which r is different from 0 with P < 0·001.
angle sway, estimated both by the s.d. (F = 17·62, P < 0·001)
and range (F = 23·64, P < 0·001). While there was a
tendency for an increased range of hip angle sway with
narrow stance, there was no good evidence for increased hip
motion in the sagittal plane. However, narrow stance
produced a statistical increase in the s.d. of the hip angle in
the frontal plane (F = 6·04, P < 0·05).
The findings suggest that narrow stance leads to greater
angular motion at the ankle, but no greater movement of
the COG in the anteroposterior direction. On the other hand,
with narrow stance there is both increased hip motion in the
frontal plane and lateral movement of the COG. There were
no significant changes due to the absence of vision nor were
there any significant interactions between support and
vision. Closure of the eyes in five of the subjects produced an
increase of postural sway estimated by the s.d. and range of
anteroposterior sway of COG and ankle angular motion,
while the other two subjects showed an opposite change.
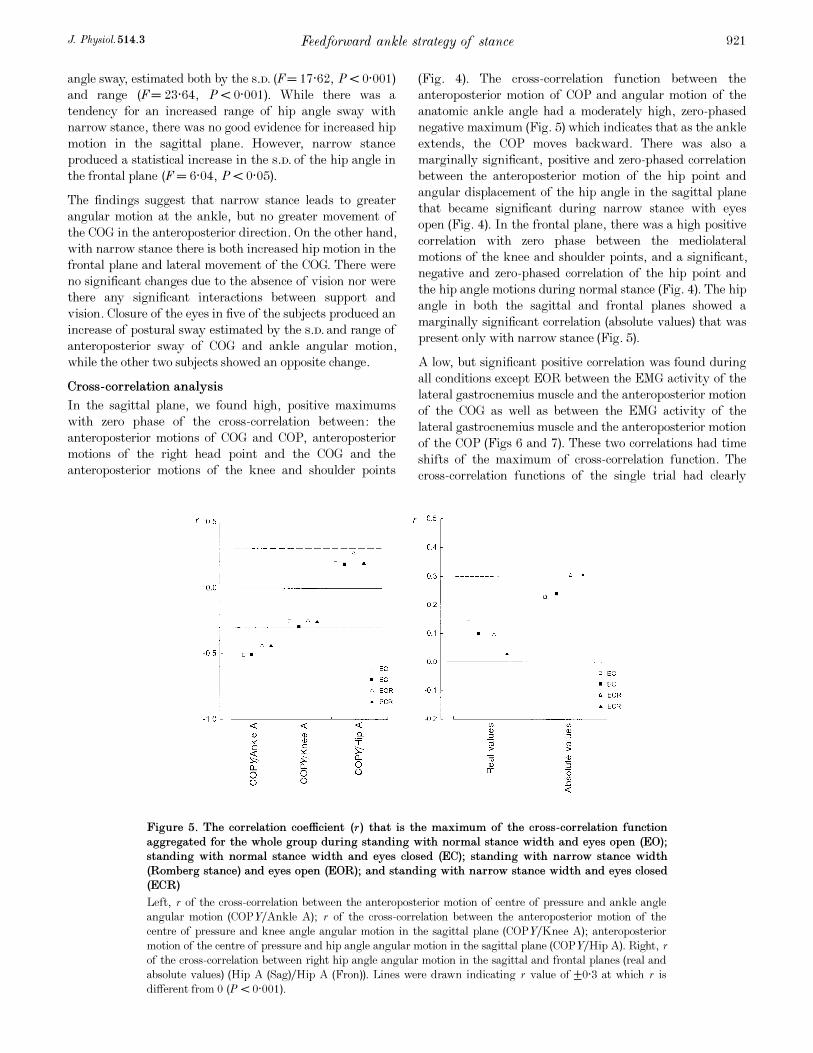
Cross-correlation analysis
In the sagittal plane, we found high, positive maximums
with zero phase of the cross-correlation between: the
anteroposterior motions of COG and COP, anteroposterior
motions of the right head point and the COG and the
anteroposterior motions of the knee and shoulder points
(Fig. 4). The cross-correlation function between the
anteroposterior motion of COP and angular motion of the
anatomic ankle angle had a moderately high, zero-phased
negative maximum (Fig. 5) which indicates that as the ankle
extends, the COP moves backward. There was also a
marginally significant, positive and zero-phased correlation
between the anteroposterior motion of the hip point and
angular displacement of the hip angle in the sagittal plane
that became significant during narrow stance with eyes
open (Fig. 4). In the frontal plane, there was a high positive
correlation with zero phase between the mediolateral
motions of the knee and shoulder points, and a significant,
negative and zero-phased correlation of the hip point and
the hip angle motions during normal stance (Fig. 4). The hip
angle in both the sagittal and frontal planes showed a
marginally significant correlation (absolute values) that was
present only with narrow stance (Fig. 5).
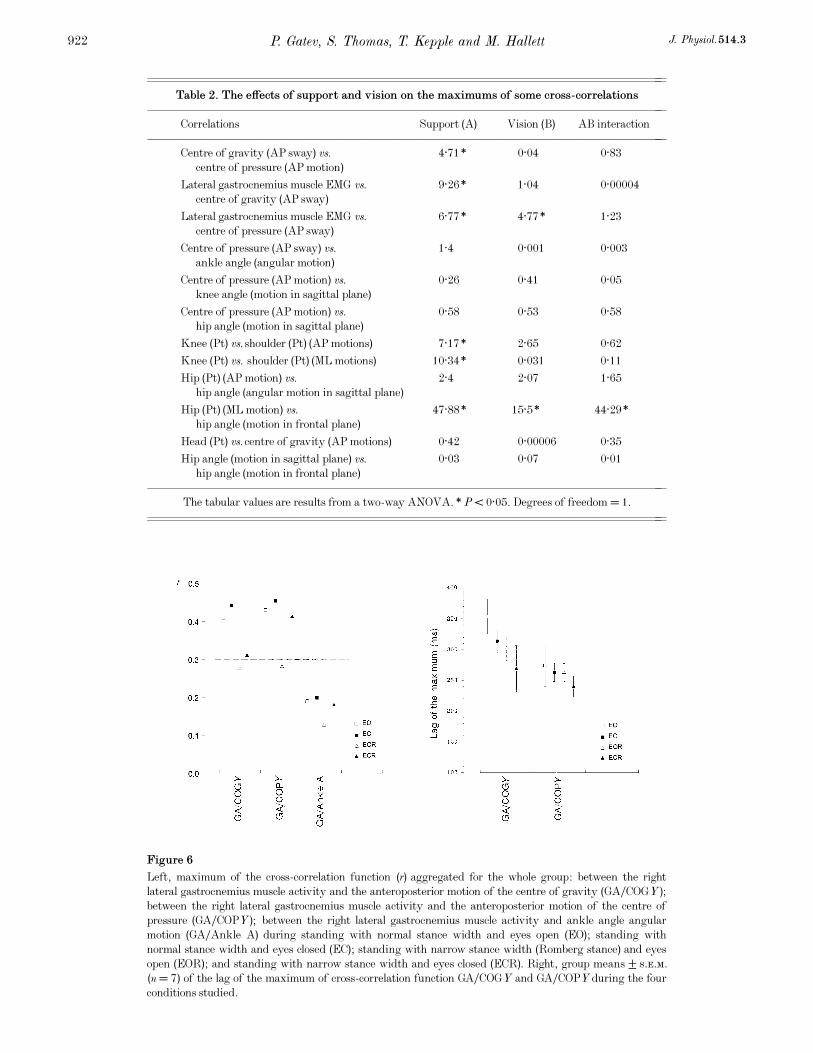
A low, but significant positive correlation was found during
all conditions except EOR between the EMG activity of the
lateral gastrocnemius muscle and the anteroposterior motion
of the COG as well as between the EMG activity of the
lateral gastrocnemius muscle and the anteroposterior motion
of the COP (Figs 6 and 7). These two correlations had time
shifts of the maximum of cross-correlation function. The
cross-correlation functions of the single trial had clearly
Feedforward ankle strategy of stanceJ. Physiol. 514.3 921
Figure 5. The correlation coefficient (r) that is the maximum of the cross-correlation function
aggregated for the whole group during standing with normal stance width and eyes open (EO);
standing with normal stance width and eyes closed (EC); standing with narrow stance width
(Romberg stance) and eyes open (EOR); and standing with narrow stance width and eyes closed
(ECR)
Left, r of the cross-correlation between the anteroposterior motion of centre of pressure and ankle angle
angular motion (COPYÏAnkle A); r of the cross-correlation between the anteroposterior motion of the
centre of pressure and knee angle angular motion in the sagittal plane (COPYÏKnee A); anteroposterior
motion of the centre of pressure and hip angle angular motion in the sagittal plane (COPYÏHip A). Right, r
of the cross-correlation between right hip angle angular motion in the sagittal and frontal planes (real and
absolute values) (Hip A (Sag)ÏHip A (Fron)). Lines were drawn indicating r value of ±0·3 at which r is
different from 0 (P < 0·001).
P. Gatev, S. Thomas, T. Kepple and M. Hallett J. Physiol. 514.3922
Figure 6
Left, maximum of the cross-correlation function (r) aggregated for the whole group: between the right
lateral gastrocnemius muscle activity and the anteroposterior motion of the centre of gravity (GAÏCOGY);
between the right lateral gastrocnemius muscle activity and the anteroposterior motion of the centre of
pressure (GAÏCOPY); between the right lateral gastrocnemius muscle activity and ankle angle angular
motion (GAÏAnkle A) during standing with normal stance width and eyes open (EO); standing with
normal stance width and eyes closed (EC); standing with narrow stance width (Romberg stance) and eyes
open (EOR); and standing with narrow stance width and eyes closed (ECR). Right, group means ± s.e.m.
(n = 7) of the lag of the maximum of cross-correlation function GAÏCOGY and GAÏCOPY during the four
conditions studied.
––––––––––––––––––––––––––––––––––––––––––––––––––––––––––––––––––––––––––––––––––––––––––––
Table 2. The effects of support and vision on the maximums of some cross-correlations
––––––––––––––––––––––––––––––––––––––––––––––
Correlations Support (A) Vision (B) AB interaction
––––––––––––––––––––––––––––––––––––––––––––––
Centre of gravity (AP sway) vs. 4·71* 0·04 0·83
centre of pressure (AP motion)
Lateral gastrocnemius muscle EMG vs. 9·26* 1·04 0·00004
centre of gravity (AP sway)
Lateral gastrocnemius muscle EMG vs. 6·77* 4·77* 1·23
centre of pressure (AP sway)
Centre of pressure (AP sway) vs. 1·4 0·001 0·003
ankle angle (angular motion)
Centre of pressure (AP motion) vs. 0·26 0·41 0·05
knee angle (motion in sagittal plane)
Centre of pressure (AP motion) vs. 0·58 0·53 0·58
hip angle (motion in sagittal plane)
Knee (Pt) vs. shoulder (Pt) (AP motions) 7·17* 2·65 0·62
Knee (Pt) vs. shoulder (Pt) (ML motions) 10·34* 0·031 0·11
Hip (Pt) (AP motion) vs. 2·4 2·07 1·65
hip angle (angular motion in sagittal plane)
Hip (Pt) (ML motion) vs. 47·88* 15·5* 44·29*
hip angle (motion in frontal plane)
Head (Pt) vs. centre of gravity (AP motions) 0·42 0·00006 0·35
Hip angle (motion in sagittal plane) vs. 0·03 0·07 0·01
hip angle (motion in frontal plane)
––––––––––––––––––––––––––––––––––––––––––––––
The tabular values are results from a two-way ANOVA. *P < 0·05. Degrees of freedom = 1.
––––––––––––––––––––––––––––––––––––––––––––––––––––––––––––––––––––––––––––––––––––––––––––
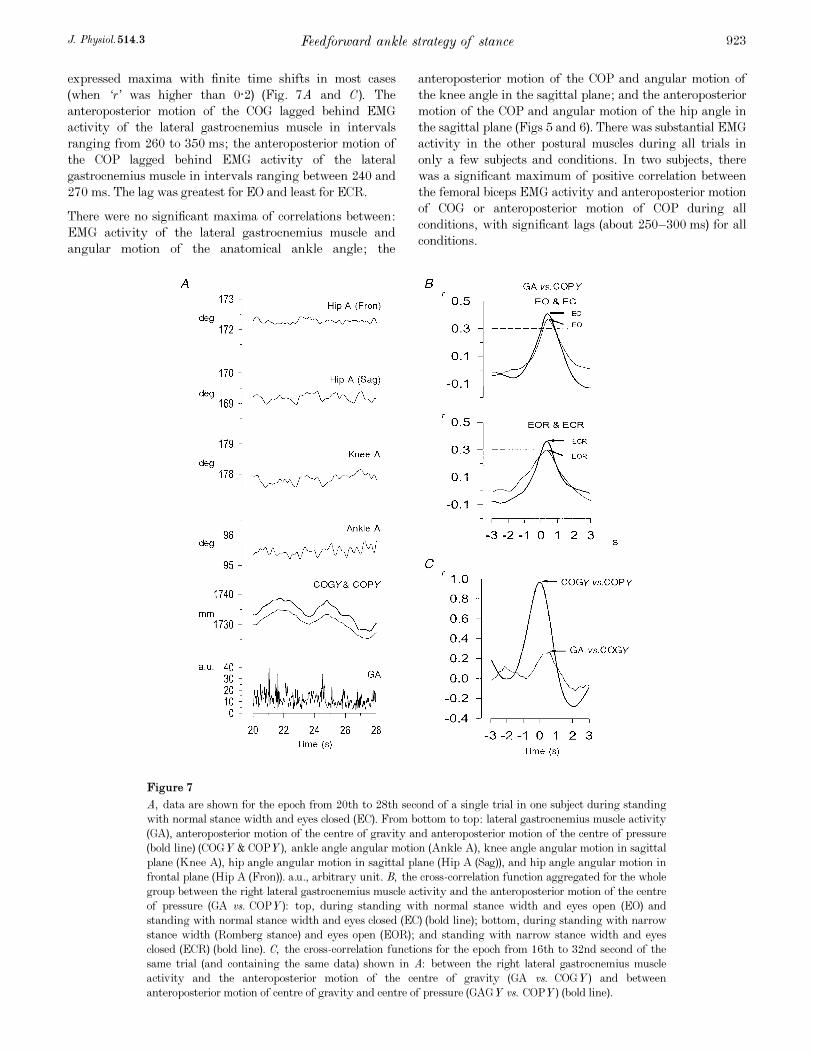
expressed maxima with finite time shifts in most cases
(when ‘r’ was higher than 0·2) (Fig. 7A and C). The
anteroposterior motion of the COG lagged behind EMG
activity of the lateral gastrocnemius muscle in intervals
ranging from 260 to 350 ms; the anteroposterior motion of
the COP lagged behind EMG activity of the lateral
gastrocnemius muscle in intervals ranging between 240 and
270 ms. The lag was greatest for EO and least for ECR.
There were no significant maxima of correlations between:
EMG activity of the lateral gastrocnemius muscle and
angular motion of the anatomical ankle angle; the
anteroposterior motion of the COP and angular motion of
the knee angle in the sagittal plane; and the anteroposterior
motion of the COP and angular motion of the hip angle in
the sagittal plane (Figs 5 and 6). There was substantial EMG
activity in the other postural muscles during all trials in
only a few subjects and conditions. In two subjects, there
was a significant maximum of positive correlation between
the femoral biceps EMG activity and anteroposterior motion
of COG or anteroposterior motion of COP during all
conditions, with significant lags (about 250—300 ms) for all
conditions.
Feedforward ankle strategy of stanceJ. Physiol. 514.3 923
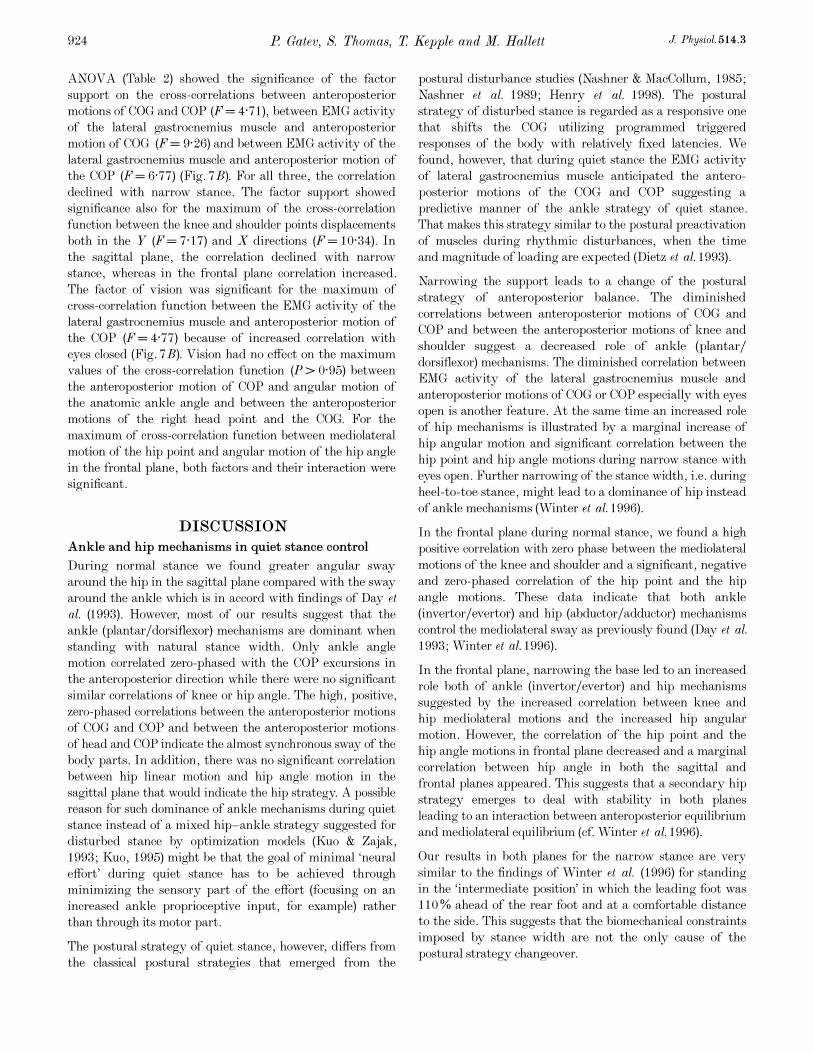
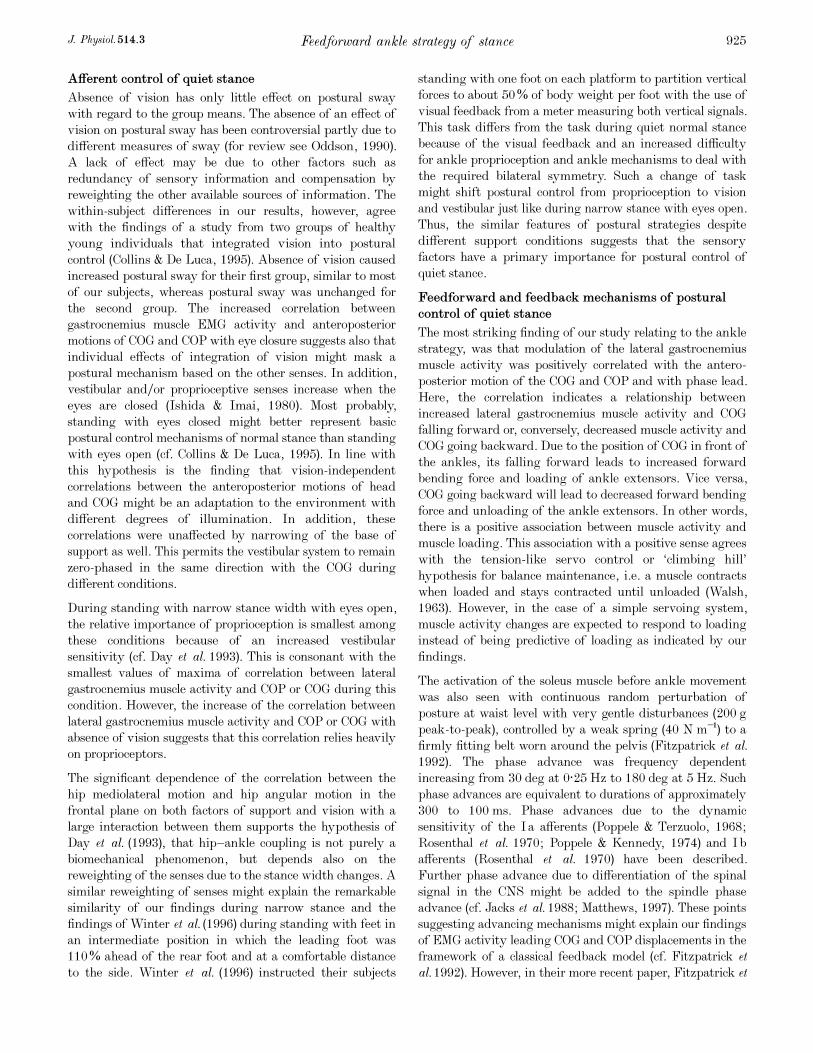
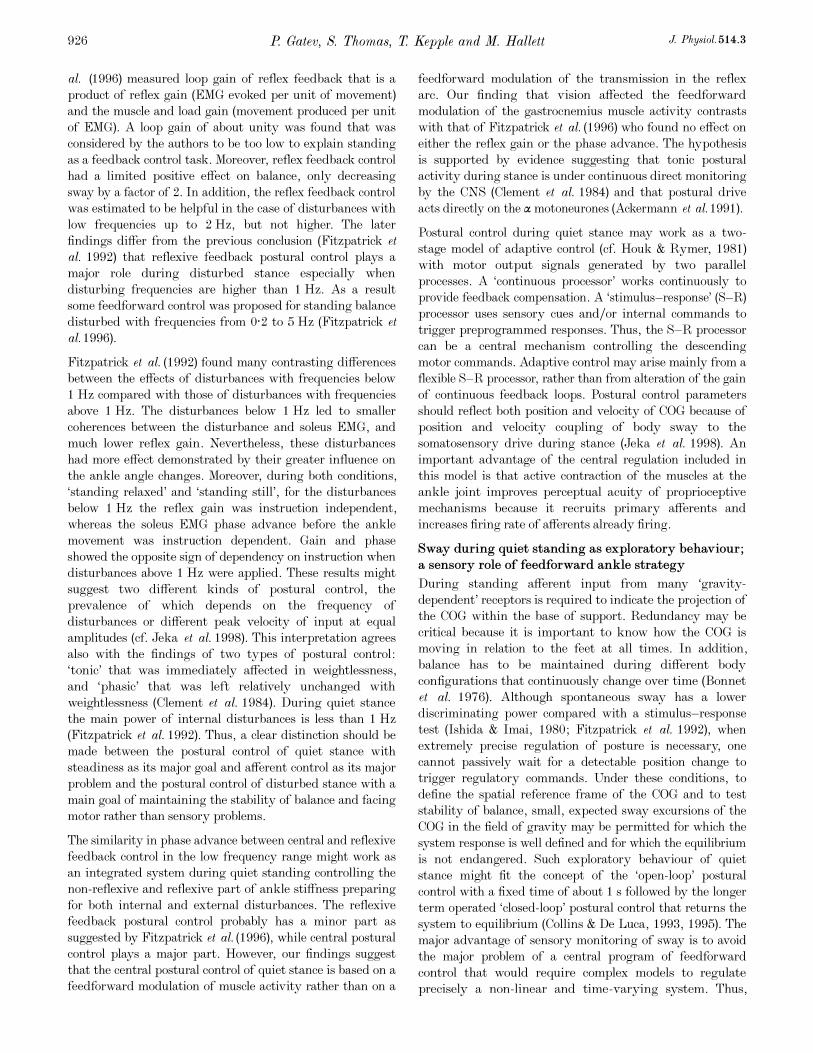
Figure 7
A, data are shown for the epoch from 20th to 28th second of a single trial in one subject during standing
with normal stance width and eyes closed (EC). From bottom to top: lateral gastrocnemius muscle activity
(GA), anteroposterior motion of the centre of gravity and anteroposterior motion of the centre of pressure
(bold line) (COGY & COPY), ankle angle angular motion (Ankle A), knee angle angular motion in sagittal
plane (Knee A), hip angle angular motion in sagittal plane (Hip A (Sag)), and hip angle angular motion in
frontal plane (Hip A (Fron)). a.u., arbitrary unit. B, the cross-correlation function aggregated for the whole
group between the right lateral gastrocnemius muscle activity and the anteroposterior motion of the centre
of pressure (GA vs. COPY): top, during standing with normal stance width and eyes open (EO) and
standing with normal stance width and eyes closed (EC) (bold line); bottom, during standing with narrow
stance width (Romberg stance) and eyes open (EOR); and standing with narrow stance width and eyes
closed (ECR) (bold line). C, the cross-correlation functions for the epoch from 16th to 32nd second of the
same trial (and containing the same data) shown in A: between the right lateral gastrocnemius muscle
activity and the anteroposterior motion of the centre of gravity (GA vs. COGY) and between
anteroposterior motion of centre of gravity and centre of pressure (GAGY vs. COPY) (bold line).
ANOVA (Table 2) showed the significance of the factor
support on the cross-correlations between anteroposterior
motions of COG and COP (F = 4·71), between EMG activity
of the lateral gastrocnemius muscle and anteroposterior
motion of COG (F = 9·26) and between EMG activity of the
lateral gastrocnemius muscle and anteroposterior motion of
the COP (F = 6·77) (Fig. 7B). For all three, the correlation
declined with narrow stance. The factor support showed
significance also for the maximum of the cross-correlation
function between the knee and shoulder points displacements
both in the Y (F = 7·17) and X directions (F = 10·34). In
the sagittal plane, the correlation declined with narrow
stance, whereas in the frontal plane correlation increased.
The factor of vision was significant for the maximum of
cross-correlation function between the EMG activity of the
lateral gastrocnemius muscle and anteroposterior motion of
the COP (F = 4·77) because of increased correlation with
eyes closed (Fig. 7B). Vision had no effect on the maximum
values of the cross-correlation function (P > 0·95) between
the anteroposterior motion of COP and angular motion of
the anatomic ankle angle and between the anteroposterior
motions of the right head point and the COG. For the
maximum of cross-correlation function between mediolateral
motion of the hip point and angular motion of the hip angle
in the frontal plane, both factors and their interaction were
significant.
DISCUSSION
Ankle and hip mechanisms in quiet stance control
During normal stance we found greater angular sway
around the hip in the sagittal plane compared with the sway
around the ankle which is in accord with findings of Day et
al. (1993). However, most of our results suggest that the
ankle (plantarÏdorsiflexor) mechanisms are dominant when
standing with natural stance width. Only ankle angle
motion correlated zero-phased with the COP excursions in
the anteroposterior direction while there were no significant
similar correlations of knee or hip angle. The high, positive,
zero-phased correlations between the anteroposterior motions
of COG and COP and between the anteroposterior motions
of head and COP indicate the almost synchronous sway of the
body parts. In addition, there was no significant correlation
between hip linear motion and hip angle motion in the
sagittal plane that would indicate the hip strategy. A possible
reason for such dominance of ankle mechanisms during quiet
stance instead of a mixed hip—ankle strategy suggested for
disturbed stance by optimization models (Kuo & Zajak,
1993; Kuo, 1995) might be that the goal of minimal ‘neural
effort’ during quiet stance has to be achieved through
minimizing the sensory part of the effort (focusing on an
increased ankle proprioceptive input, for example) rather
than through its motor part.
The postural strategy of quiet stance, however, differs from
the classical postural strategies that emerged from the
postural disturbance studies (Nashner & MacCollum, 1985;
Nashner et al. 1989; Henry et al. 1998). The postural
strategy of disturbed stance is regarded as a responsive one
that shifts the COG utilizing programmed triggered
responses of the body with relatively fixed latencies. We
found, however, that during quiet stance the EMG activity
of lateral gastrocnemius muscle anticipated the antero-
posterior motions of the COG and COP suggesting a
predictive manner of the ankle strategy of quiet stance.
That makes this strategy similar to the postural preactivation
of muscles during rhythmic disturbances, when the time
and magnitude of loading are expected (Dietz et al. 1993).
Narrowing the support leads to a change of the postural
strategy of anteroposterior balance. The diminished
correlations between anteroposterior motions of COG and
COP and between the anteroposterior motions of knee and
shoulder suggest a decreased role of ankle (plantarÏ
dorsiflexor) mechanisms. The diminished correlation between
EMG activity of the lateral gastrocnemius muscle and
anteroposterior motions of COG or COP especially with eyes
open is another feature. At the same time an increased role
of hip mechanisms is illustrated by a marginal increase of
hip angular motion and significant correlation between the
hip point and hip angle motions during narrow stance with
eyes open. Further narrowing of the stance width, i.e. during
heel-to-toe stance, might lead to a dominance of hip instead
of ankle mechanisms (Winter et al. 1996).
In the frontal plane during normal stance, we found a high
positive correlation with zero phase between the mediolateral
motions of the knee and shoulder and a significant, negative
and zero-phased correlation of the hip point and the hip
angle motions. These data indicate that both ankle
(invertorÏevertor) and hip (abductorÏadductor) mechanisms
control the mediolateral sway as previously found (Day et al.
1993; Winter et al. 1996).
In the frontal plane, narrowing the base led to an increased
role both of ankle (invertorÏevertor) and hip mechanisms
suggested by the increased correlation between knee and
hip mediolateral motions and the increased hip angular
motion. However, the correlation of the hip point and the
hip angle motions in frontal plane decreased and a marginal
correlation between hip angle in both the sagittal and
frontal planes appeared. This suggests that a secondary hip
strategy emerges to deal with stability in both planes
leading to an interaction between anteroposterior equilibrium
and mediolateral equilibrium (cf. Winter et al. 1996).
Our results in both planes for the narrow stance are very
similar to the findings of Winter et al. (1996) for standing
in the ‘intermediate position’ in which the leading foot was
110% ahead of the rear foot and at a comfortable distance
to the side. This suggests that the biomechanical constraints
imposed by stance width are not the only cause of the
postural strategy changeover.
P. Gatev, S. Thomas, T. Kepple and M. Hallett J. Physiol. 514.3924
Afferent control of quiet stance
Absence of vision has only little effect on postural sway
with regard to the group means. The absence of an effect of
vision on postural sway has been controversial partly due to
different measures of sway (for review see Oddson, 1990).
A lack of effect may be due to other factors such as
redundancy of sensory information and compensation by
reweighting the other available sources of information. The
within-subject differences in our results, however, agree
with the findings of a study from two groups of healthy
young individuals that integrated vision into postural
control (Collins & De Luca, 1995). Absence of vision caused
increased postural sway for their first group, similar to most
of our subjects, whereas postural sway was unchanged for
the second group. The increased correlation between
gastrocnemius muscle EMG activity and anteroposterior
motions of COG and COP with eye closure suggests also that
individual effects of integration of vision might mask a
postural mechanism based on the other senses. In addition,
vestibular andÏor proprioceptive senses increase when the
eyes are closed (Ishida & Imai, 1980). Most probably,
standing with eyes closed might better represent basic
postural control mechanisms of normal stance than standing
with eyes open (cf. Collins & De Luca, 1995). In line with
this hypothesis is the finding that vision-independent
correlations between the anteroposterior motions of head
and COG might be an adaptation to the environment with
different degrees of illumination. In addition, these
correlations were unaffected by narrowing of the base of
support as well. This permits the vestibular system to remain
zero-phased in the same direction with the COG during
different conditions.
During standing with narrow stance width with eyes open,
the relative importance of proprioception is smallest among
these conditions because of an increased vestibular
sensitivity (cf. Day et al. 1993). This is consonant with the
smallest values of maxima of correlation between lateral
gastrocnemius muscle activity and COP or COG during this
condition. However, the increase of the correlation between
lateral gastrocnemius muscle activity and COP or COG with
absence of vision suggests that this correlation relies heavily
on proprioceptors.
The significant dependence of the correlation between the
hip mediolateral motion and hip angular motion in the
frontal plane on both factors of support and vision with a
large interaction between them supports the hypothesis of
Day et al. (1993), that hip—ankle coupling is not purely a
biomechanical phenomenon, but depends also on the
reweighting of the senses due to the stance width changes. A
similar reweighting of senses might explain the remarkable
similarity of our findings during narrow stance and the
findings of Winter et al. (1996) during standing with feet in
an intermediate position in which the leading foot was
110% ahead of the rear foot and at a comfortable distance
to the side. Winter et al. (1996) instructed their subjects
standing with one foot on each platform to partition vertical
forces to about 50% of body weight per foot with the use of
visual feedback from a meter measuring both vertical signals.
This task differs from the task during quiet normal stance
because of the visual feedback and an increased difficulty
for ankle proprioception and ankle mechanisms to deal with
the required bilateral symmetry. Such a change of task
might shift postural control from proprioception to vision
and vestibular just like during narrow stance with eyes open.
Thus, the similar features of postural strategies despite
different support conditions suggests that the sensory
factors have a primary importance for postural control of
quiet stance.
Feedforward and feedback mechanisms of postural
control of quiet stance
The most striking finding of our study relating to the ankle
strategy, was that modulation of the lateral gastrocnemius
muscle activity was positively correlated with the antero-
posterior motion of the COG and COP and with phase lead.
Here, the correlation indicates a relationship between
increased lateral gastrocnemius muscle activity and COG
falling forward or, conversely, decreased muscle activity and
COG going backward. Due to the position of COG in front of
the ankles, its falling forward leads to increased forward
bending force and loading of ankle extensors. Vice versa,
COG going backward will lead to decreased forward bending
force and unloading of the ankle extensors. In other words,
there is a positive association between muscle activity and
muscle loading. This association with a positive sense agrees
with the tension-like servo control or ‘climbing hill’
hypothesis for balance maintenance, i.e. a muscle contracts
when loaded and stays contracted until unloaded (Walsh,
1963). However, in the case of a simple servoing system,
muscle activity changes are expected to respond to loading
instead of being predictive of loading as indicated by our
findings.
The activation of the soleus muscle before ankle movement
was also seen with continuous random perturbation of
posture at waist level with very gentle disturbances (200 g
peak-to-peak), controlled by a weak spring (40 N m¢) to a
firmly fitting belt worn around the pelvis (Fitzpatrick et al.
1992). The phase advance was frequency dependent
increasing from 30 deg at 0·25 Hz to 180 deg at 5 Hz. Such
phase advances are equivalent to durations of approximately
300 to 100 ms. Phase advances due to the dynamic
sensitivity of the Ia afferents (Poppele & Terzuolo, 1968;
Rosenthal et al. 1970; Poppele & Kennedy, 1974) and Ib
afferents (Rosenthal et al. 1970) have been described.
Further phase advance due to differentiation of the spinal
signal in the CNS might be added to the spindle phase
advance (cf. Jacks et al. 1988; Matthews, 1997). These points
suggesting advancing mechanisms might explain our findings
of EMG activity leading COG and COP displacements in the
framework of a classical feedback model (cf. Fitzpatrick et
al. 1992). However, in their more recent paper, Fitzpatrick et
Feedforward ankle strategy of stanceJ. Physiol. 514.3 925
al. (1996) measured loop gain of reflex feedback that is a
product of reflex gain (EMG evoked per unit of movement)
and the muscle and load gain (movement produced per unit
of EMG). A loop gain of about unity was found that was
considered by the authors to be too low to explain standing
as a feedback control task. Moreover, reflex feedback control
had a limited positive effect on balance, only decreasing
sway by a factor of 2. In addition, the reflex feedback control
was estimated to be helpful in the case of disturbances with
low frequencies up to 2 Hz, but not higher. The later
findings differ from the previous conclusion (Fitzpatrick et
al. 1992) that reflexive feedback postural control plays a
major role during disturbed stance especially when
disturbing frequencies are higher than 1 Hz. As a result
some feedforward control was proposed for standing balance
disturbed with frequencies from 0·2 to 5 Hz (Fitzpatrick et
al. 1996).
Fitzpatrick et al. (1992) found many contrasting differences
between the effects of disturbances with frequencies below
1 Hz compared with those of disturbances with frequencies
above 1 Hz. The disturbances below 1 Hz led to smaller
coherences between the disturbance and soleus EMG, and
much lower reflex gain. Nevertheless, these disturbances
had more effect demonstrated by their greater influence on
the ankle angle changes. Moreover, during both conditions,
‘standing relaxed’ and ‘standing still’, for the disturbances
below 1 Hz the reflex gain was instruction independent,
whereas the soleus EMG phase advance before the ankle
movement was instruction dependent. Gain and phase
showed the opposite sign of dependency on instruction when
disturbances above 1 Hz were applied. These results might
suggest two different kinds of postural control, the
prevalence of which depends on the frequency of
disturbances or different peak velocity of input at equal
amplitudes (cf. Jeka et al. 1998). This interpretation agrees
also with the findings of two types of postural control:
‘tonic’ that was immediately affected in weightlessness,
and ‘phasic’ that was left relatively unchanged with
weightlessness (Clement et al. 1984). During quiet stance
the main power of internal disturbances is less than 1 Hz
(Fitzpatrick et al. 1992). Thus, a clear distinction should be
made between the postural control of quiet stance with
steadiness as its major goal and afferent control as its major
problem and the postural control of disturbed stance with a
main goal of maintaining the stability of balance and facing
motor rather than sensory problems.
The similarity in phase advance between central and reflexive
feedback control in the low frequency range might work as
an integrated system during quiet standing controlling the
non-reflexive and reflexive part of ankle stiffness preparing
for both internal and external disturbances. The reflexive
feedback postural control probably has a minor part as
suggested by Fitzpatrick et al. (1996), while central postural
control plays a major part. However, our findings suggest
that the central postural control of quiet stance is based on a
feedforward modulation of muscle activity rather than on a
feedforward modulation of the transmission in the reflex
arc. Our finding that vision affected the feedforward
modulation of the gastrocnemius muscle activity contrasts
with that of Fitzpatrick et al. (1996) who found no effect on
either the reflex gain or the phase advance. The hypothesis
is supported by evidence suggesting that tonic postural
activity during stance is under continuous direct monitoring
by the CNS (Clement et al. 1984) and that postural drive
acts directly on the á motoneurones (Ackermann et al. 1991).
Postural control during quiet stance may work as a two-
stage model of adaptive control (cf. Houk & Rymer, 1981)
with motor output signals generated by two parallel
processes. A ‘continuous processor’ works continuously to
provide feedback compensation. A ‘stimulus—response’ (S—R)
processor uses sensory cues andÏor internal commands to
trigger preprogrammed responses. Thus, the S—R processor
can be a central mechanism controlling the descending
motor commands. Adaptive control may arise mainly from a
flexible S—R processor, rather than from alteration of the gain
of continuous feedback loops. Postural control parameters
should reflect both position and velocity of COG because of
position and velocity coupling of body sway to the
somatosensory drive during stance (Jeka et al. 1998). An
important advantage of the central regulation included in
this model is that active contraction of the muscles at the
ankle joint improves perceptual acuity of proprioceptive
mechanisms because it recruits primary afferents and
increases firing rate of afferents already firing.
Sway during quiet standing as exploratory behaviour;
a sensory role of feedforward ankle strategy
During standing afferent input from many ‘gravity-
dependent’ receptors is required to indicate the projection of
the COG within the base of support. Redundancy may be
critical because it is important to know how the COG is
moving in relation to the feet at all times. In addition,
balance has to be maintained during different body
configurations that continuously change over time (Bonnet
et al. 1976). Although spontaneous sway has a lower
discriminating power compared with a stimulus—response
test (Ishida & Imai, 1980; Fitzpatrick et al. 1992), when
extremely precise regulation of posture is necessary, one
cannot passively wait for a detectable position change to
trigger regulatory commands. Under these conditions, to
define the spatial reference frame of the COG and to test
stability of balance, small, expected sway excursions of the
COG in the field of gravity may be permitted for which the
system response is well defined and for which the equilibrium
is not endangered. Such exploratory behaviour of quiet
stance might fit the concept of the ‘open-loop’ postural
control with a fixed time of about 1 s followed by the longer
term operated ‘closed-loop’ postural control that returns the
system to equilibrium (Collins & De Luca, 1993, 1995). The
major advantage of sensory monitoring of sway is to avoid
the major problem of a central program of feedforward
control that would require complex models to regulate
precisely a non-linear and time-varying system. Thus,
P. Gatev, S. Thomas, T. Kepple and M. Hallett J. Physiol. 514.3926
central control of modulation of postural activity during
standing allows continuous updating of the internal
representation of stance (Clement et al. 1984).
Sway restriction during quiet standing; a motor role
of feedforward ankle strategy
During quiet standing, triceps surae activity is not
continuous, indicating how little muscular activity is needed
to maintain balance (Bonnet et al. 1976). Our finding of a
correlation between postural muscle activity and COG
motion as well as between COP and ankle angle motion
indicates that the COG motion is permitted during standing.
Thus, feedforward modulation of the muscle activity
correlated with the anteroposterior motion of the COG most
probably establishes the exact minimum of ankle stiffness
needed to restrict the small allowable amount of sway. This
strategy of postural control is possible because the low
frequency of postural sway enables the fluctuating activity
of the lateral gastrocnemius muscle to correlate in advance
with both the viscoelastic resistance and force. Such a
strategy has many potential benefits. Lengthening of an
already activated gastrocnemius muscle would act in a
spring-like manner to absorb body weight (Appenteng &
Prochazka, 1984). The compliant interface between the
body and its support would also attenuate transmission of
the impacts due to abrupt changes in loading to the head. In
addition, feedforward setting of stiffness might avoid the
residual lags in a feedback loop (Fitzpatrick et al. 1996) and
subsequent deterioration of stability properties due to the
tendency to oscillate (Rack, 1981). Since ankle joint stiffness
depends on the moment carried by the joint (Bergmark,
1989), there is also a possibility that by leaning more or less
forward, a proper level of stiffness can be chosen by adjusting
the postural alignment. The choice should be based on the
trade-off between the accuracy of measurement and the
requirement of minimal loading or minimal expenditure of
energy. This hypothesis is supported by the finding of
forward body inclination during spaceflight (Clement et al.
1984) when significant diminution of loading of ankle
extensors challenged load estimation and measurement. We
also found a tendency for such a load-seeking behaviour
with the COG situated further forward from the mid-ankle
during normal stance compared with narrow stance.
Ackerman, H., Scholz, E., Koeler, W. & Dichgans, J. (1991).
Influence of postural and voluntary background contraction upon
compound muscle action potentials from anterior tibial and soleus
muscle following transcranial magnetic stimulation. Electro-
encephalography and Clinical Neurophysiology 81, 71—80.
Appenteng, K. & Prochazka, A. (1984). Tendon organ firing during
active lengthening in awake, normally behaving cats. Journal of
Physiology 353, 81—92.
Bergmark, A. (1989). Stability of the lumbar spine. A study in
mechanical engineering. Acta Orthopaedica Scandinavica 60,suppl. 30, 1—52.
Bonnet, M., Gurfinkel, S., Lipshits, M.-J. & Popov, K. E. (1976).
Central programming of lower limb muscular activity in the
standing man. Agressologie 17 Specno, 35—42.
Clement, G., Gurfinkel, V. S., Lestienne, F., Lipshits, M. I. &
Popov, K. E. (1984). Adaptation of postural control to weightlessness.
Experimental Brain Research 57, 61—72.
Collins, J. J. & De Luca, C. J. (1993). Open-loop and closed loop
control of posture: a random-walk analysis of center-of-pressure
trajectories. Experimental Brain Research 95, 308—318.
Collins, J. J. & De Luca, C. J. (1995). The effects of visual input on
open loop and closed loop postural control mechanisms.
Experimental Brain Research 103, 151—163.
Day, B. L., Steiger, M. J., Thomson, P. D. & Marsden, C. D. (1993).
Effect of vision and stance width on human body motion when
standing: implications for afferent control of lateral sway. Journal of
Physiology 469, 479—499.
Dempster, W. T. (1956). Space requirements of the seated operator:
geometrical, kinematic and mechanical aspects of the body, with
special reference to the limbs. Wright Air Development Center
Technical Report 55-159, 1—241.
Dietz, V. (1992). Human neuronal control of automatic functional
movements: Interaction between central programs and afferent
input. Physiological Reviews 72, 33—69.
Dietz, V., Trippel, M., Ibrahim, I. K. & Berger, W. (1993). Human
stance on a sinusoidally translating platform: balance control by
feedforward and feedback mechanisms. Experimental Brain
Research 93, 352—362.
Draper, N. & Smith, H. (1981). Applied Regression Analysis. John
Wiley & Sons, Inc., New York.
Eklund, G. (1972). General features of vibration-induced effects on
balance. Upsala Journal of Medical Sciences 78, 65—72.
Fitzpatrick, R. C., Burke, D. & Gandevia, S. C. (1996). Loop gain
of reflexes controlling human standing measured with the use of
postural and vestibular disturbances. Journal of Neurophysiology
76, 3994—4008.
Fitzpatrick, R. C., Gorman, R. B., Burke, D. & Gandevia, S. C.
(1992). Postural proprioceptive reflexes in standing human subjects:
bandwidth of response and transmission characteristics. Journal of
Physiology 458, 69—83.
Fung, J. & Macpherson, J. M. (1995). Determinants of postural
orientation in quadrupedal stance. Journal of Neuroscience 15,1121—1131.
Gatev, P., Thomas, S., Lou, J. S., Lim, M. & Hallett, M. (1996).
Effects of diminished and conflicting sensory information on
balance in patients with cerebellar deficits. Movement Disorders 11,654—664.
Gurfinkel, V. S., Lipshits, M. I., Mori, S. & Popov, K. E. (1980).
Stabilization of body position as the main task of postural
regulation. Fiziologia Cheloveka 73, 400—410.
Hellebrandt, F. A. (1938). Standing as a geotropic reflex. The
mechanism of the asynchronous rotation of motor units. American
Journal of Physiology 121, 471—474.
Henry, S. M., Fung, J. & Horak, F. B. (1998). Control of stance
during lateral and AÏP surface translations. IEEE Transactions in
Rehabilitation Engineering 6, 32—42
Houk, J. C. & Rymer, W. Z. (1981). Neural control of muscle length
and tension. In Handbook of Physiology, vol. II, Motor Control, part
1, ed. Brookhart, J. M. & Mountcastle, V. B., pp. 257—323.
American Physiological Society, Bethesda, MD, USA.
Ishida, A. & Imai, S. (1980). Responses of the posture-control system
to pseudorandom acceleration disturbances. Medical and Biological
Engineering and Computing 18, 433—438.
Feedforward ankle strategy of stanceJ. Physiol. 514.3 927
Jacks, A., Prochazka, A. & Trend, P. St J. (1988). Instability in
human forearm movements studied with feed-back controlled
electrical stimulation of muscles. Journal of Physiology 402,443—461.
Jeka, J., Oie, K., Schoner, G., Dijkstra, T. & Henson, E. (1998).
Position and velocity coupling of postural sway to somatosensory
drive. Journal of Neurophysiology 79, 1661—1674.
Kelton, I. W. & Wright, R. D. (1949). The mechanism of easy
standing by man. Australian Journal of Experimental Biology and
Medicine 27, 505—516.
Kuo, A. D. (1995). An optimal control model for analyzing human
postural balance. IEEE Transactions on Biomedical Engineering 42,87—101.
Kuo, A. D. & Zajac, F. E. (1993). Human standing posture: multi-
joint movement strategies based on biomechanical constraints.
Progress in Brain Research 97, 349—358.
Mattews, P. B. C. (1997). Spindle and motoneuronal contributions to
the phase advance of the human stretch reflex and the reduction of
tremor. Journal of Physiology 498, 249—275.
Nashner, L. M. & McCollum, G. (1985). The organization of human
postural movements: A formal basis and experimental synthesis.
Behavioral Brain Sciences 8, 135—172.
Nashner, L. M., Shupert, C. L., Horak, F. B. & Black, F. O. (1989).
Organization of posture controls: an analysis of sensory and
mechanical constraints. Progress in Brain Research 80, 411—418.
Oddson, L. (1990). Control of voluntary trunk movements in man.
Acta Physiologica Scandinavica 140, suppl. 595, 1—60.
Poppele, R. E. & Kennedy, W. R. (1974). Comparison between
behaviour of human and cat muscle spindles recorded in vitro. Brain
Research 75, 316—319.
Poppele, R. E. & Terzuolo, C. A. (1968). Myotatic reflex: its input—
output relation. Science 159, 743—745.
Rack, P. M. H. (1981). Limitations of somatosensory feedback in
control of posture and movement. In Handbook of Physiology,
vol. II, Motor Control, part 1, ed. Brookhart, J. M. &
Mountcastle, V. B., pp. 229—256. American Physiological Society,
Bethesda, MD, USA.
Rosenthal, N. P., McKean, T. A., Roberts, W. J. & Terzuolo, C. A.
(1970). Frequency analysis of stretch reflex and its main subsystems
in triceps surae muscles of the cat. Journal of Neurophysiology 34,620—634.
Sachs, L. (1982). Applied Statistics. Springer-Verlag, New York.
Walsh, E. G. (1963). Possible factors in postural sway. In Cerebellum,
Posture and Cerebral Palsy, ed. Walsh, E. G., pp. 31—37. Little
Club Clinics N.3. Heinemann, London.
Winter, D. (1990). Biomechanics and Motor Control of Human
Movement, pp. 36—41. JohnWiley & Sons, Inc., New York.
Winter, D., Prince, F., Frank, J. S., Powell, C. & Zabjek, K. F.
(1996). Unified theory regarding AÏP and MÏL balance in quiet
stance. Journal of Neurophysiology 75, 2334—2343.
Acknowledgements
P.G. was a recipient of a Central and Eastern Europe Senior
Fellowship in the Neurosciences from the Fogarty Foundation,
National Institutes of Health, Bethesda, MD, USA.
Corresponding author
M. Hallett: Clinical Director, NINDS, National Institutes of Health,
Building 10, Room 5N-226, 10 CENTER DR MSC 1428, Bethesda,
MD 20892-1428, USA.
Email: [email protected]
P. Gatev, S. Thomas, T. Kepple and M. Hallett J. Physiol. 514.3928