federal reserve bulletin january 1938 - fraser - st. louis fed
TRANSCRIPT

FEDERAL RESERVEBULLETIN
JANUARY 1938
Recent Business and Credit Developments
Changes in Regulation on Common TrustFunds
International Capital Movements
* * * * ? * * * *
' * * * « * * *
BOARD OF GOVERNORS
OF THE FEDERAL RESERVE SYSTEMCONSTITUTION AVENUE AT 20TH STREET
WASHINGTON
Digitized for FRASER http://fraser.stlouisfed.org/ Federal Reserve Bank of St. Louis

TABLE OF CONTENTS
Page
Review of the month—Recent business and credit developments 1-5Changes in regulation on common trust funds 4-5Election of directors of Federal Reserve banks -r 5National summary of business conditions.. 6-7Summary of financial and business statistics - -Law Department:
Revision of Regulation F 10-13Time for obtaining statements in connection with special omnibus accounts _- 13Extension of time by business conduct committees in connection with cash transactions- * 13
Statistics of International Capital Transactions of the United States, July-September, 1937 14-18Financial, industrial, and commercial statistics, United States:
Member bank reserves, Reserve bank credit, and related items - - - 20Federal Reserve bank statistics 21-25Reserve position of member banks; deposits in larger and smaller centers 26Money in circulation . 27Gold stock and gold movements; bank suspensions; bank debits 28All banks in the United States - 29All member banks.._ - 30-31Reporting member banks in leading cities 32-35Acceptances, commercial paper, and brokers' balances 36Federal Reserve bank discount rates 37Money rates and bond yields 38Security markets . . . 39Treasury finance . . . 40-41Governmental corporations and credit agencies; Postal Savings System 42-43Production, employment, and trade 44-52Wholesale prices 53Crop report 54
International financial statistics:Gold reserves of central banks and governments . 56Gold'production _ 57Gold movements -„__,. - 57-58Central banks 59-62Bank for International Settlements 63Commercial banks r__ 63-64Discount rates of central banks 65Money rates u 65Foreign exchange rates 66Price movements:
Wholesale prices 67Retail food prices and cost of living 68Security prices- 6g
Federal Reserve directory:Board of Governors and staff; Open Market Committee and staff; Federal Advisory Council 70Senior officers of Federal Reserve banks; managing directors of branches •_ _ 71
II
Digitized for FRASER http://fraser.stlouisfed.org/ Federal Reserve Bank of St. Louis

FEDERAL RESERVE BULLETINVOL. 24 JANUARY, 1938 No. 1
REVIEW OF THE MONTHIn December industrial activity declined
further to a level about 25 percent belowthe first eight months of 1937.
Recent business Retail trade at the holidaydevelopments season showed slightly less
than the usual increase andwas somewhat smaller than a year before.Wholesale commodity prices, which declinedsharply in October and November, werefirmer in December. Prices of the highest-grade bonds rose to the highest levels sincelast March, while prices of stocks and lower-grade bonds fluctuated slightly above the lowlevels reached in November. Demand forcurrency in December was less than usuallyoccurs, and excess reserves of member bankswere only slightly reduced before Christmas.Banks in leading cities increased their hold-ings of securities, and the decline in theirloans was smaller than in October or Novem-ber. Total deposits at reporting banks in-creased as the result of a substantial increasein United States Government deposits.
Excess reserves of member banks in De-cember averaged somewhat over $1,000,000,-
000, the approximate level^XDece n1ferrVes P r e v a i l i nS generally since the
release of $300,000,000 of in-active gold by the Treasury last September.At the end of November excess reserves ex-ceeded $1,100,000,000; in the first threeweeks of December they declined to $1,000,-000,000, reflecting primarily the seasonalrise in money in circulation just beforeChristmas and variations in Treasury andother nonmember deposits at the FederalReserve banks. The decline in excess re-serves in the first three weeks of Decemberwas mostly at New York City banks.
After Christmas excess reserves were rap-idly built up at all classes of banks throughthe return of currency from circulation andnet disbursements of foreign bank and othernonmember deposits with the Reserve banks.On December 31, excess reserves totaled$1,200,000,000, the largest amount held bymember banks since the final increase inreserve requirements on May 1, 1937.
The decline in reserves before Christmaswas smaller than usually occurs because ofthe reduced seasonal demand for currency.From the middle of November to December22, money in circulation increased by only$150,000,000, as compared with an increaseof $300,000,000 in the corresponding periodlast year, and a customary seasonal increaseof about $260,000,000. In the week endingDecember 29, the decrease in money in cir-culation was $110,000,000, which was onlyslightly less than the customary seasonal de-crease.
Following a substantial decline in Octoberand November, total loans and investments
of reporting member banks inleading cities showed little netchange in the month of De-
cember. These banks purchased substantialamounts of the new notes and bonds sold bythe Treasury on December 15, but this in-crease in investments was partially offset byredemption of Treasury bills maturing in thefollowing week. Commercial and industrialloans declined somewhat less in Decemberthan in November, and loans to brokers anddealers in securities continued at around$900,000,000, the low level reached early inNovember after a sharp decline in the twopreceding months.
Member bankcredit
Digitized for FRASER http://fraser.stlouisfed.org/ Federal Reserve Bank of St. Louis

FEDERAL RESERVE BULLETIN JANUARY 1938
Adjusted demand deposits at reportingmember banks showed a decline in December,while deposits of the United States Govern-ment increased. The increase in Governmentdeposits at these banks, amounting to $275,-000,000, represented purchases of Govern-ment securities by book-credits. Collectionof income taxes by the Treasury, sales ofGovernment securities by reporting banks,and a decline in bank loans were the principalfactors in the reduction of about $180,000,000in adjusted demand deposits at these banks.Time deposits and bankers' balances at re-porting member banks showed little changeduring the month.
The Treasury's quarterly financing in De-cember consisted of the sale of $290,000,000
of 8-year bonds and of $220,000,-000 of 5-year notes for cash, andexchanges of $250,000,000 of the
Treasuryfinancing
new bonds and $10,000,000 of the new notesfor Treasury notes maturing on February 1,1938. Both of the new issues advanced in themarket to substantial premiums, the bondsbeing quoted toward the end of December at apremium of 2V& points and the notes at apremium of 1% points. From the proceedsof these sales of securities and from tax re-ceipts, the Treasury met interest and otherpayments, retired about $450,000,000 ofTreasury bills maturing around the middleof the month, and added substantially to itsworking balance. The Government debtshowed little change as the result of thesesecurity operations.
Open-market money rates on Treasurybills and notes continued in December the
decline which began about
have remained unchanged in recent months.The average yield on long-term Treasury
bonds declined to about 2Y2 percent, whichcompares with 2% percent about the middleof November and nearly 2% percent in Sep-tember. The yield on the highest-gradecorporate bonds declined to below 3 ^ per-
Prices of stocks and lower-grade corporatebonds, which declined in November to thelowest levels since 1935, recovered somewhatduring the last week of November and thefirst week of December. This recovery wasfollowed by irregular movements until theclosing days of December when prices againdeclined. At the end of December averageprices of common stocks were only slightlyabove the November lows and about 40 per-cent below the high level of the year reachedin March. Average yields on lower-gradecorporate bonds, as shown by Moody's Baabonds, were about 6 percent at the end ofDecember, as compared with 4i/2 percent atthe beginning of the year.
The volume of new securities sold by do-mestic corporations continued to decline
sharply in November and De-New security cember but there was a mod-issues . . **?„**
erate increase m other otter-ings, which include those of State and local
Money andsecurity markets the middle of September
and reached new low levelssince early in the year. The new issues of91-day Treasury bills sold in the last halfof December at below one-eighth of one per-cent, and the average yield on 3 to 5 yearTreasury notes declined to below 1*4 percentas compared with almost 1% percent in Sep-tember. Other short-term open-market rates
governments and Federal agencies. Totalsecurity offerings, exclusive of direct obliga-tions of the United States Government, wereabout $150,000,000 each month, includingthose for refunding and for new capital; thisis a somewhat smaller volume than duringthe immediately preceding months.
The small volume of security issues duringthe final quarter of 1937 indicates the greatlyreduced activity in the capital markets thathas accompanied recent developments in thesecurity markets and in the business situa-tion. During this quarter security offeringstotaled about $500,000,000, which is one-third of the average quarterly volume during1936 and the first quarter of 1937- Issuesby domestic corporations in the fourth quar-
Digitized for FRASER http://fraser.stlouisfed.org/ Federal Reserve Bank of St. Louis

JANUARY 1938 FEDERAL RESERVE BULLETIN
ter of 1937 amounted to only $200,000,000,or about one-fifth of the quarterly volumeduring the earlier period.
Department store sales have shown slightlyless than the usual seasonal increase during
recent months, and preliminaryitoSTs^ea11 i n f o r m a t i o n f o r December indi-
cates that the Board's seasonallyadjusted index for that month will be a littlebelow 90 percent of the 1923-1925 average,as compared with a level of 93 percent dur-ing the first eight months of the year. Whiledepartment store sales have continued some-what above the average for 1936 and con-siderably above that for 1935, production oftextiles, shoes, and many other commoditiessold by department stores has been drasticallycurtailed to a level below the average for1935. It appears that current output ofthese products is below the rate of consumerpurchases and that inventories of many ofthem have been considerably reduced fromthe large volume of a few months ago.
Industrial production was further reducedin December, and the Board's seasonally ad-
justed index is estimated on theprodSn b a s i s o f P a r t i a l information at
about 83 percent of the 1923-1925 average as compared with 89 in Novem-ber and an average of 116 in the first eightmonths of the year. The sharp decline inrecent months has reflected chiefly decreasedactivity in the durable goods industries whichhad operated at a high rate during the firsteight months of the year. Steel productionhas shown the greatest decline, with the rateof activity averaging 38 percent of capacityin November and approximately 26 percentin December, as compared with 85 percent inAugust. There have been substantial reduc-tions also in output of lumber and plate glass.Automobile assemblies showed considerablyless than the usual seasonal increase in No-vember and a decrease in December.
In the nondurable goods industries activ-ity has continued the decline that has beenin progress since spring. Reductions at
woolen mills, rayon mills, and shoe factorieshave been particularly marked and in No-vember these industries were operating atrates little above those of the lowest levels ofthe depression. At cotton mills and silkmills also activity has declined considerably.Output of minerals in recent months has beenmaintained at near the level of the earlier-part of the year. Crude petroleum produc-tion has continued in large volume, whileoutput of coal has shown some decline.
The general level of wholesale commodityprices, after a broad decline from 87.5 per-
cent of the 1926 average for theweek ending September 25 to82.0 for the week of November27, declined slightly further in
December. In the latter part of the month, asshown in the accompanying table, the generalindex had returned to the level prevailingbefore the sharp advance that had occurredbetween the end of October 1936 and April1937.
WHOLESALE COMMODITY PRICES
(Indexes, 1926 = 100)
Wholesalecommodityprices
All commodities..Farm productsFoodsOther commodities
Durable:Metals and metal products..Building materialsHousefurnishing goods
Nondurable:Hides and leather products-Textile productsChemicals and drugsMiscellaneous _ __.
Fuel and lighting materials.
WeekendingDec. 25,
1937
81.272.978.983.6
96.292.591.4
98.469.479.274.978.6
Percentage changesince—
Apr. 3,1937
-24-10- 3
0- 4
+1- 7
-11
+2
Oct. 31,1936
0- 1 3- 4+4
+U+6
+10
+3- 3- 3+4+2
Source: Bureiu of Labor Statistics.
Prices of raw materials, which as a groupadvanced most rapidly in that period, de-clined steadily from the beginning of Aprilto the latter part of November, but in De-cember showed little change. Some com-modities, such as cotton, hides, and steelscrap, advanced in December. Prices of mostfinished products, which earlier had advanced
Digitized for FRASER http://fraser.stlouisfed.org/ Federal Reserve Bank of St. Louis

FEDERAL RESERVE BULLETIN JANUARY 1938
by a smaller amount, continued to increaselast summer but since that time have beendeclining- slowly.
In general, prices of durable goods continusubstantially higher than they were in Octo-ber 1936, while most nondurable goods, in-cluding farm products and foods, are lower.Prices of finished steel, which had advancedsharply last spring, have since remainedunchanged and automobile prices have ad-vanced. Building materials, other than steeland cement, have declined somewhat in re-cent months. Farm products as a group areat the lowest level in the past three years.
REGULATION RELATING TO COMMON TRUSTFUNDS
The Board of Governors of the Federal Re-serve System has issued, effective December81, 1937, an amendment to its Regulation Fto provide for the collective investment oftrust funds by national banks under certainconditions in States where this is permittedby State law. The amended regulation pro-vides for two general types or classes of suchinvestments. First, it permits a nationalbank, subject to certain regulatory provi-sions, to invest funds of various individualtrusts in participations in a common trustfund, provided that the amount so investedfrom any one trust may not exceed $25,000,or ten percent of the value of the assets ofsuch common trust fund, whichever amountis less. It has been urged upon the Boardthat it is not practicable or efficient for trustinstitutions to invest the funds of relativelysmall trusts separately with the desired di-versification of investments, and this pro-vision is designed to facilitate the investmentof the funds of such small trusts. Second,the amended regulation permits a nationalbank, with a minimum of specific regulatoryrequirements, to make collective investmentof funds of individual trusts in participationsin a common trust fund, provided the amountinvested from any one such trust accountdoes not exceed $1,200. The regulation hasheretofore permitted national banks to make
collective investment of funds of individualtrusts if such funds were too small to be in-vested separately to advantage, and this pro-vision in the amended regulation continuesthe authority to invest collectively such oddbalances to the credit of various trusts withas few regulatory provisions as possible.
The Board also amended subsections (b)and (c) of section 6 of Regulation F, in cer-tain minor respects, with respect to the trustdepartment committees already provided forin the regulation.
In the Revenue Act of 1936 Congress rec-ognized the desirability, under proper safe-guards, of permitting banks to operate com-mon trust funds when it granted certain taxexemptions to common trust funds adminis-tered by any bank in conformity with rulesand regulations prescribed for national banksby the Board of Governors. Some Stateshave enacted legislation specifically authoriz-ing the operation of common trust funds andin other States similar legislation has beenconsidered.
In upholding and construing provisions oflaw relative to the exercise of trust powersby national banks, the courts have recognizedthat the regulation of the administration oftrusts is a matter peculiarly within the prov-ince of the States. In issuing the presentamendment, the Board has permitted the col-lective investment of funds of various trustsin common trust funds only when the laws ofthe State in which the particular nationalbank is located authorize or permit such in-vestments by State banks, trust companies,or other corporations which compete withnational banks.
Issuance of such an amendment was recom-mended by a special committee of the Ameri-can Bankers Association, and the amendmentwas drafted after consultation with the com-mittee and after submission of a tentativedraft of the proposed regulation to and re-ceiving criticisms and comments from thatcommittee, all Federal Reserve banks andother interested groups.
Digitized for FRASER http://fraser.stlouisfed.org/ Federal Reserve Bank of St. Louis

JANUARY : FEDERAL RESERVE BULLETIN
The Board's regulations have been drawnspecifically with a view to preventing com-mon trust funds from being operated as in-vestment trusts for other than strictly fidu-ciary purposes and to providing safeguardsto prevent preferences or other inequitiesbetween trusts participating in common trustfunds. The text of these amendments isprinted herein on pages 10-13.
Election of Class A and B Directors
The member banks elected the followingClass A and Class B directors of the FederalReserve banks for the three-year term begin-ning January 1, 1938:
CLASS A
Boston—Lewis S. Reed (reelected).New York—William C. Potter.Philadelphia—John B. Henning (reelected).Cleveland—H. B. McDowell.Richmond—James C. Braswell (reelected).Atlanta—W. D. Cook (reelected).Chicago^—E. R. Esthers (reelected).St, Louis—(election being held).Minneapolis—M. 0. Grangaard (reelected).Kansas City—Frank W. Sponable (reelected).Dallas—Pat E. Hooks (reelected).San Francisco—C. K. Mclntosh (reelected).
CLASS B
Boston-^E. S. French (reelected)New York—Thomas J. Watson (reelected).Philadelphia—C. Frederick C. Stout (re-
elected) .Cleveland—R. P. Wright (reelected).Richmond—John H. Hanna (reelected).Atlanta—Fitzgerald Hall (reelected).Chicago—S. T. Crapo (reelected).St. Louis—Harvey C. Couch.Minneapolis—W. 0. Washburn (reelected).Kansas City-r-J. M. Bernardin (reelected).Dallas—Harry C. Wiess.San Francisco—Elmer H. Cox (reelected).
Appointment of Class C DirectorsThe Board of Governors appointed the fol-
lowing Class C directors of Federal Reservebanks for the three-year term beginningJanuary 1, 1938:
CLASS C
New York—Owen D. Young (reappointed).Cleveland—G. C. Brainard (reappointed).Richmond—Robert Lassiter (reappointed).Chicago—F. J. Lewis (reappointed).St. Louis—Oscar Johnston.
Designation of Chairmen and Federal Reserve Agentsand Appointment of Deputy Chairmen
The Board of Governors designated thefollowing Federal Reserve agents and chair-men of the boards of directors of Federalreserve banks for the year 1938:
Boston—F. H. Curtiss (redesignated).Philadelphia—R. L. Austin (redesignated).Cleveland—E. S. Burke, Jr. (redesignated).Richmond—Robert Lassiter (redesignated).Atlanta—F. H. Neely.St. Louis—W. T. Nardin (redesignated).Minneapolis—W. B. Geery (redesignated).Kansas City—J. J. Thomas (redesignated).Dallas—J. H. Merritt.San Francisco—A. 0. Stewart (redesignated).
The Board of Governors appointed thefollowing deputy chairmen of Federal Reservebanks for the year 1938:
Boston—H. S. Dennison.New York—Owen D. Young (reappointed).Philadelphia—T. B. McCabe.Cleveland—G. C. Brainard (reappointed).Richmond—W. G. Wysor.Chicago—R. E. Wood (reappointed).
Retirement of Chairmen and Federal Reserve Agentsat the Federal Reserve Banks of Atlanta and DallasEffective at the close of December 31,1937,
Messrs. W. H. Kettig and C. C. Walsh retiredas Class C directors and Chairmen and Fed-eral Reserve Agents at the Federal ReserveBanks of Atlanta and Dallas, respectively.
Mr. Kettig served as a Class C director ofthe Federal Reserve Bank of Atlanta fromthe date of its establishment, and also asDeputy Chairman of the bank from January1, 1922, to May 27, 1937, on which date hewas designated as Chairman and FederalReserve Agent. Mr. Kettig also served as anappointee of the Board on the board of direc-tors of the Birmingham Branch of the Atlantabank from August 1, 1918, through 1935.
Mr. Walsh was appointed a Class C direc-tor and designated as Chairman and FederalReserve Agent at the Federal Reserve Bankof Dallas on July 1,1925, and served in thesecapacities until his retirement on December31, 1937.
Appointment of First Vice President of the FederalReserve Bank of St. Louis
On December 6, 1937, the Board approvedthe appointment by the board of directors ofthe Federal Reserve Bank of St. Louis, effec-tive December 16,1937, of Mr. F. Guy Hitt asFirst Vice President of the bank for the un-expired portion of the five-year term endingFebruary 28, 1941.
Digitized for FRASER http://fraser.stlouisfed.org/ Federal Reserve Bank of St. Louis

6 FEDERAL RESERVE BULLETIN JANUARY 1938
NATIONAL SUMMARY OF BUSINESS CONDITIONS
[Compiled December 22 and released for publication December 24]
In November, volume of industrial produc-tion continued to decline sharply, and em-ployment and payrolls also decreased. Dur-ing the first half of November commodityprices declined further but for the past monththey have been steady.
Production and employment.—Volume ofindustrial output, as measured by the Board'sseasonally adjusted index, declined from 103percent of the 1923-1925 average in October
INDUSTRIAL PRODUCTION
3
PERCENT
1929 1930 I93t 1932 1933 1934 1935 1936 1937
90
50
Monthly index of physical volume of production, adjusted forseasonal variation, 1923-1925 average — 100.
to 90 percent in November, reflecting chieflya sharp reduction in the manufacture of dur-able goods. There was a further curtail-ment of activity at steel mills and output forthe month was at a rate of 38 percent of ca-pacity, a decline of one-third from October.In the first three weeks of December steel pro-duction was at about 28 percent of capacity.Output of lumber and plate glass also de-clined substantially in November, and auto-mobile production showed considerably lessthan the usual seasonal increase. Productionof nondurable goods, which had decreased bya substantial amount earlier this year, de-clined further in November, reflecting a con-tinued reduction in output of textiles andshoes, partly offset in the total by an increasein activity at sugar refineries. Output ofminerals, as well as manufactures, declinedin November. There were marked decreases
in output of bituminous coal and in iron oreshipments, while crude petroleum productioncontinued in large volume.
Total value of construction contractsawarded, as reported by the F. W. Dodge Cor-poration, showed little change in Novemberand the first half of December. Awards forprivately-financed projects declined, reflect-ing chiefly a further reduction in residentialbuilding, while contracts for publicly-financedwork increased.
Employment and payrolls at factoriesshowed an unusually sharp decline betweenthe middle of October and the middle of No-vember, and there were decreases also in thenumber employed in trade and other non-manufacturing lines. The Board's seasonallyadjusted index of factory employment was at94 percent of the 1923-1925 average in No-vember as compared with a level of 102 lastsummer and 96 in November last year. In
FACTORY EMPLOYMENT AND PAYROLLSPER CENT
120
30
^ - C E &
\
\
Employment'
\Payrol ls^ V
V
JJ
/v//v/
., r
ft
J
Hno
100
60
1929 1930 1931 1932 1933 t934 1935 1936 1937
Monthly indexes of number employed and payrolls at factories,unadjusted for seasonal variation, 1923-1925 average = 100.
the steel, machinery, lumber, and textile in-dustries the number employed decreased bysubstantially more than the usual seasonalamount, and there was some decline at auto-mobile factories, although an increase is usualat this season. There were declines also inthe seasonally adjusted indexes for most otherlines, except foods and tobacco which showedlittle change.
Digitized for FRASER http://fraser.stlouisfed.org/ Federal Reserve Bank of St. Louis

JANUARY 1938 FEDERAL RESERVE BULLETIN
Agriculture,—Department of Agricultureestimates recently issued indicate that mostcrops will be about the same size as forecastearlier but that cash farm income will belower than had been anticipated, largely be-cause of price declines both for crops and live-stock. Cash income in 1937 is expected to be$8,500,000,000, as compared with $7,918,-000,000 in 1936. The increase over a yearago is due primarily to increased income frommarketings of wheat, tobacco, and fruits andto larger Government payments.
Distribution.—Distribution of commoditiesto consumers, which earlier had been main-tained, declined slightly in November. Therewas a slight decline in sales at departmentstores, and mail order sales decreased consid-erably, while sales at variety stores showedlittle change. Preliminary information forthe first half of December indicates that de-partment store sales increased by approxi-mately the usual seasonal amount.
Freight-car loadings declined by consider-ably more than the seasonal amount in No-vember and the Board's adjusted index forthat month was 71 percent of the 1923-1925average as compared with 76 percent in Octo-ber and an average of 81 percent in the firsthalf of the year. The decline from Octoberto November reflected principally marked de-creases in loadings of coal and miscellaneousfreight.
Commodity prices.—The general level of
WHOLESALE PRICESPERCENT
120
110
100
90
70
PERCENT
120
110
J1929 1930 1931 1932 1933 1934 1935 1936 1937
Index compiled by United States Bureau of Labor Statistics,1926 = 100. By months, 1929 to 1931; by weeks, Jan. 2. 1932,to December 18, 1937.
wholesale commodity prices, which had de-lined sharply from the latter part of Sep-
tember to the third week of November, hasshown little change since that time. Pricesof nonferrous metals, leather, wool, textileyarns, and finished cotton goods have declinedsomewhat further in this period, while steelscrap, hides, rubber, cotton, print cloths, andbituminous coal have recently shown someadvance.
Bank credit.—Excess reserves of memberbanks showed a small decline but for the firstthree weeks of December remained somewhatover $1,000,000,000. The increase in demandfor currency during December has beensmaller than usual, reflecting largely the ef-fects of the recent sharp decline in businessactivity and payrolls.
Total loans and investments of reportingmember banks in 101 leading cities increased
BlUUONS OF DOLLARSMEMBER BANK CREDIT
BILLIONS Of COLLARS
U S . Go* Deposit*
5rfc ^ ^ - ^ i
y£ *^ ^ ^
U.&GovtObligotions ^fe
'34 1935 1936 t937 '34 1935 1936 1937
24
£3
22
21
20
11
10
9
8T
4
3
Z2 O
Wednesday figures for reporting member banks in 101 leadingcities, September 5, 1934, to December 15, 1937. Loans on realestate, loans to banks, and acceptances and commercial paperbought included in total loans and investments but not shownseparately.
somewhat during the four weeks ending De-cember 15, reflecting a growth of $190,000,-000 in holdings of United States Governmentobligations, mostly in New York City. A fac-tor in this increase was the purchase bybanks of the December 15 issues of Govern-ment securities. Commercial loans, whichhad begun to decline in October, showed afurther reduction.
Digitized for FRASER http://fraser.stlouisfed.org/ Federal Reserve Bank of St. Louis

8 FEDERAL RESERVE BULLETIN JANUARY 1038
MEMBER BANK RESERVES AND RELATED ITEMSBILLIONS OF DOLLARS WEDNESDAY FIGURES BILLIONS OF DOLLARS
13
12
11
10
8
3
2
1
0
8
*****. 9+»+m+m*
5-^ ^-O
I»* ^ H * * « » ^
MONEY IN CIRCULATION /
...„«„,.«•'»*••i.—* . - ^ - *
_. TREASURY CASH
.RESERVE BANKCREDIT
TREASURY DEPOSITS
-L6*-firfJth * \A
/ '
j_.A-i
13
12
11
10
8
3
2
1
1932 1933 1934 1935 1936 1937
1932 1933 1934 1935 1936Latest figuics for December 29. See table on page 20.
1937
Digitized for FRASER http://fraser.stlouisfed.org/ Federal Reserve Bank of St. Louis

JANUARY 1938
SUMMARY
FEDERAL BESERVE
OF FINANCIAL AND
1037 1
Nov. Oct. Sept.
BULLETIN
BUSINESS
1936
Nov. Oct. Sept.
STATISTICS
9
Annual averages
1936 1035 1034 1933 1932 1929
HBSEBVE BANK CREDIT, MEMBER BANK RESERVES,AND RELATED ITEMS
Reserve bank credit outstanding—totalBills discounted-Bills boughtU. S. Government securities
Monetary gold stock -Treasury currency outstanding „Money in circulation .Treasury cash holdingsTreasury deposits with F. R. banks -Nonmember deposits and other accountsMember bank reserve balances:
Total -Excess
REPORTING MEMBEB BANES
Total loans and InvestmentsLoans to brokers and dealers insecuritiesLoans on securities to others (except banks)1
All other loansU. S. Government obligations:
DirectFully guaranteed.
Other securitiesKeserve with Federal Reserve banksCash in vaultBalances with domestic banksDemand deposits—adjusted , _.Time deposits (excluding interbank)*Deposits of domestic banks*Borrowinp , - — —
21,556881
1,9766,702
7,9701,1272,9005,348
3201,804
14,6365,2875,039
6
MONET RATES AND BOND YIELDS
Commercial paperStock exchange call loans __U. 8. Treasury bills (91 days)U. S. Treasury bonds, long termCorporate high grade bonds (Moody's Aaa)
CAPITAL ISSUES
All Issues—total-New _Refunding —
Domestic corporate issues—totalNew..Refunding
PRICES
Common stocks (1926=100)Wholesale commodity prices (1926=100):
All commodities _Farm productsFoodsOther commodities
Retail food prices (1923-25=100) „
BUSINESS INDEXES
Industrial production— -.ManufacturesMinerals
Construction—totalResidentialAll other -
Factory employment _.Factory payrolls (unadjusted)..Freight-car loadingsDepartment store sales . . . .
MERCHANDISE EXPORTS AND IMPORTS
Exports, including re-exportsGeneral imports—
Averages of daily figures; In millions of dollars
2,592193
2,645.2,7882,6136,5583,642
125750
2,533223
2,52712,7822,6036,5663,636
95717
1,104 1,043
2,684243
2,52612,6532,6906,5583,618
190607
2,47263
2,43011,1162,5176,4012,373
86461
6,919 6,654 6,854 6,785 6,694 6,345
2,480
32,430
10,9832,5126,3212,413
146502
900 2,219 2,043 1,852
2,47983
2,43010,7642,5076,2582,385
233528
2,4816
2,43010,5782,5036,1012,474
446551
2,47575
2,4319,0592,4785,5852,791
128C07
6,989 5,001 3,6762, 512 2,469 1,564
2,5023625
2,4327,5122,3315,4032,798
81438
2,42928383
2,0524,0592,2715,576
28855
497
2,343528
2,07762171
1,4613,9522,0966,328
23639
407
2,114256
1,459952241208
3,9962,0164,476
20722
406
3,368
Averages of Wednesday figures; in millions of dollars
21,8891,1031,9966,791
7,9141,1322,9535,384
3261,781
14,7565,2786,088
5
22,1871,3172,0076,702
8,0681,1312,9625,313
3051,703
14,8435,2834,990
22,4441,1562,0245,575
9,2321,2553,2025,422
4042,463
15,3625,0326,236
22,5661,1632,0255,530
9,3101,2553,2835,276
3992,385
15,1525,0706,080
1
22,5201,1952,035
9,3201,2463,3264,995
3832,311
14,9625,0365,890
15
22,0641,1812,0555,226
9,0801,2503,2724,799
3832.358
14,6194,9996,810
5
19,997990
2,1314,907
7,989928
3,0524,024
3262,112
12,7204,8834,938
6
8,672981
2,5454,965
6.856•325
•3,0002,875
2711,688
<•)4,9373,814
8
17,505777
3,1575,222
5,228
3,1211,822
2401,322
&2,822
115
19,080618
4,2266,578
4,413
3,2451,673
2141,250(»)
5,6662 772
228
22,599•2,208•5,4489,231
2,865
2,8471,725248
1,142
ft.Averages of weekly figures; percent per annum
1.001.00.15
2.603.26
1.001.00.26
2.653,29
1.001.00.37
2.673.30
.751.00.11
2.293.15
.751.00.13
2.423.18
.751.00.16
2.413.18
• .75.91.17
2.473.24
.76
.66
.172.703.60
1.021.00.28
3.104.00
L721.16.52
3.314.49
2.732.05.88
3.655.01
5,857.61
3.604.73
Amounts per month; in millions of dollars
1349341362610
19689
1071295970
22315667
15211239
372158214264109155
46418627836695
272
40917823125075
175
51816435438299
282
39212127018934
155
18011664411526
896029321318
14610046M2727
959841118781667116
Index numbers
83 91
8580868585
106
8786888686
124
8285848183
119
8284838083
114
8284838084
111
8181828082
78
8079847880
72
7565717874
63
6651617166
49
6543617068
190
6510510002
105
Index numbers, adjusted for seasonal variation, 1923-^5=100
*>89P85
*108*>55P32*74J>94*>897191
10210011352366598
1007693
111110115563771
1011007894
11411511258407296918294
11011110557436994897790
10911010259476994847588
105.10510455377092827588
90909137215088716479
79788832124883636275
76753225113772495867
64637128134066466569
11911911511787142106109107111
Amounts per month; in millions of dollars
*315P223
333224
297233
226196
265213
221216
205202
100171
178138
140121
134110
437367
p Preliminary. • Partly estimated.1 Includes loans on securities to banks, 1929-1934.* Figures not available.> Includes time deposits of banks, domestic and foreign, 1929-1934.« Does not include time deposits 1929-1934.
Digitized for FRASER http://fraser.stlouisfed.org/ Federal Reserve Bank of St. Louis

10 FEDERAL RESERVE BULLETIN JANUARY 1938
LAW DEPARTMENT
AMENDMENTS TO REGULATION F
There is set forth below the text of amend-ments to its Regulation F, regarding trustpowers of national banks, which have beenadopted by the Board of Governors of theFederal Reserve System, effective December31, 1937. The amendment to section 10 andthe new section 17 which has been incorpo-rated in the regulation relate to the invest-ment of funds held by a national bank as afiduciary in common trust funds, and theamendments to section 6 of the regulationrelate to trust department committees of na-tional banks.
Subsection (c) of section 10 of RegulationF was amended to read as follows:
(c) Collective investment of trustl funds.—Fundsreceived or held by a national bank as fiduciary shallnot be invested collectively2 except as permitted insection 17 of this regulation.
A new section 17 was inserted in Regula-tion F and reads as follows:
SECTION 17. COMMON TRUST FUNDS(a) In general.—Funds received or held by a na-
tional bank as fiduciary may be invested collectivelyin any Common Trust Fund established and main-tained in accordance with the provisions of this sec-tion whenever the laws of the State in which thenational bank is located authorize or permit suchinvestments by State banks, trust companies, or othercorporations which compete with national banks.
As used in this regulation the term "Common TrustFund" means a fund maintained by a national bankexclusively for the collective investment and rein-vestment of moneys contributed thereto by the bankin its capacity as trustee, executor, administrator,or guardian.*
The purpose of this section is to permit the use ofCommon Trust Funds, as denned in section 169 ofthe Revenue Act of 1936,* for the investment of fundsheld for true fiduciary purposes; and the operationof such Common Trust Funds as investment trusts
1 Unless the context otherwise indicates, the term "trust**, asused m this section or in any other part of this regulation, refersto any fiduciary relationship which a national bank is authorizedto enter into under the provisions of section 11 (k) of the FederalReserve Act.
2 This does not prevent the bank from investing the funds ofseveral trusts in a single real estate loan of the kind which couldbe made by the bank under the provisions of section 24 of theFederal Reserve Act, as amended, if the bank owns no participa-tion in the loan and has no interest therein except in its capacityas fiduciary.
8 As used in this regulation the term "guardian" means guard-ian or committee of the estate of an infant, incompetent, or absen-tee, by whatever name known in the State in which a particularnational bank is located.
4 For applicable provisions of the Revenue Act of 1936, BeeAppendix.
for other than strictly fiduciary purposes is herebyprohibited. No bank administering a Common TrustFund shall issue any document evidencing a director indirect interest in such Common Trust Fund inany form which purports to be negotiable or assign-able. The trust investment committee of a bankoperating a Common Trust Fund shall not permitany funds of any trust to be invested in a CommonTrust Fund if it has reason to believe that suchtrust was not created or is not being used for bonafide fiduciary purposes.
Common Trust Funds administered under this sec-tion shall be subject to the following requirements:
(1) Assets in a Common Trust Fund shallbe considered as assets held by the bank asfiduciary;
(2) A bank administering a Common TrustFund shall not invest any of its own funds insuch Common Trust Fund and if a bank, becauseof a creditor relationship or any other reason,acquires any interest in a participation in a Com-mon Trust Fund under its administration theparticipation shall be withdrawn on the firstdate on which such withdrawal can be effected inaccordance with the provisions of this section;
(3) A bank administering a Common TrustFund shall not have any interest5 in the assetsheld in such Common Trust Fund, other thanin its capacity as fiduciary, except to the extentpermitted for a temporary period as providedin the immediately preceding paragraph.
(b) Common Trust Funds for investment of smallamounts.—Subject to all other provisions of thisregulation except subsection (c) of this section, cashbalances received or held by a bank in its capacityas trustee, executor, administrator, or guardian,which the bank considers to be individually too smallto be invested separately to advantage may be in-vested, with the approval of the trust investmentcommittee, in participations in a Common TrustFund, provided the total investment of the funds ofany one trust in one or more such Common TrustFunds shall not exceed $1,200.
(c) Common Trust Funds for general investment,—Subject to all other provisions of this regulationexcept subsection (b) of this section, funds receivedor held by a bank in its capacity as trustee, executor,administrator, or guardian may be invested in par-ticipations in a Common Trust Fund. All participa-tions in such a Common Trust Fund shall be on thebasis of a proportionate interest in all of the assetsof the Common Trust Fund.
(1) Common Trust Fund to be operated underwritten plan.—Each Common Trust Fund ad-ministered by a bank shall be established andmaintained in accordance with a written plan(referred to herein as the Plan) approved by aresolution of the bank's board of directors andapproved in writing by competent legal counsel.
^A,baVtk ^ a U . n o t b e deemed to have an interest in assets inwhich collective investments are made merely because of the factthat the bank owns in its own right other stocks, or bonds or otherobligations of a person, firm, or corporation, the stocks, or bondsor other obligations of which are among the assets of a CommonTrust Fund.
Digitized for FRASER http://fraser.stlouisfed.org/ Federal Reserve Bank of St. Louis

JANUARY 1938 FEDERAL RESERVE BULLETIN 11
The Plan shall provide that the Common TrustFund shall be administered in conformity withthe rules and regulations, prevailing from timeto time, of the Board of Governors of the Fed-eral Reserve System pertaining to the collectiveinvestment of trust funds by national banks,and shall contain full and detailed provisionsnot inconsistent with the provisions of such rulesand regulations as to the manner in which theCommon Trust Fund is to be operated, includingprovisions relating to the investment powers ofthe bank with respect to the Common TrustFund, the allocation of income, profits and losses,the terms and conditions governing the admissionor withdrawal of participations in the CommonTrust Fund, the auditing and settlement of ac-counts of the bank with respect to the CommonTrust Fund, the basis and method of valuingassets in the Common Trust Fund, the basisupon which the Common Trust Fund may beterminated, and such other matters as may benecessary to define clearly the rights of par-ticipants in the Common Trust Fund. A copyof the Plan shall be available at the principaloffice of the bank for inspection, during all bank-ing hours, to any person having an interest ina trust any funds of which are invested in aparticipation in the Common Trust Fund; andupon reasonable request a copy of the Plan shallbe furnished to such person.
(2) Trust investment committee to approveparticipation.—No funds of a trust shall beinvested in a participation in a Common TrustFund without the approval of the trust invest-ment committee. Before permitting any fundsof any trust to be invested in a participation ina Common Trust Fund, the trust investmentcommittee shall review the investments com-prising the Common Trust Fund; and, if itfinds that any such investment is one in whichfunds of such trust might not lawfully be in-vested at that time, funds of such trust shallnot be invested in a participation in such Com-mon Trust Fund.
At the time of making the first investment offunds of a trust in a participation in any Com-mon Trust Fund, the bank shall send a noticeof such investment to each person to whom anaccounting ordinarily would be rendered.1 (3) Common Trust Fund to be audited an-nually.—A bank administering a Common TrustFund shall, at least once during each periodof twelve months, cause an audit to be made ofthe Common Trust Fund by auditors responsibleonly to the board of directors of the bank. Thereport of such audit shall include a list of theinvestments comprising the Common Trust Fundat the time of the audit which shall show thevaluation placed on each item on such list by thetrust investment committee of the bank as of thedate of the audit, a statement of purchases,sales and any other investment changes and ofincome and disbursements since the last audit,and appropriate comments as to any invest-ments in default as to payment of principal orinterest. The reasonable expenses of any suchaudit made by independent public accountantsmay be charged to the Common Trust Fund.
The bank shall, without charge, send a copyof the latest report of such audit annually toeach person to whom an accounting of the trustsparticipating in the Common Trust Fund ordi-
narily would be rendered or shall send advice toeach such person annually that the report isavailable and that a copy will be furnishedwithout charge uoon request.
(U) Value of assets to be determined period-ically.—Not less frequently than once duringeach period of three months the trust investmentcommittee of a bank administering a CommonTrust Fund shall determine the value of theassets in the Common Trust Fund. No par-ticipation shall be admitted to or withdrawnfrom the Common Trust Fund except on thebasis of such valuation and on the date of thedetermination of such valuation or, if permittedby the Plan, within two business days subsequentto the date of such determination. No par-ticipation shall be admitted or withdrawn unless,in accordance with provisions of the Plan, priorto the date of the determination of such valua-tion, notice of intention to participate or tomake such withdrawal shall have been given inwriting to the bank administering the Com-mon Trust Fund, or a written notation of thecontemplated participation or withdrawal shallhave been made in the records of the bank.
(5) Miscellaneous limitations.—No funds ofany trust shall be invested in a participationin a Common Trust Fund if such investmentwould result in such trust having an interest inthe Common Trust Fund in excess of 10 percent of the value of the assets of the CommonTrust Fund, as determined by the trust invest-ment committee, or the sum of $25,000, which-ever is less at the time of investment. If thebank administers more than one Common TrustFund, no investment shall be made which wouldcause the aggregate investment of funds of anyone trust in all such Common Trust Funds toexceed such limitations. In applying the limita-tions contained in this paragraph, if two ormore trusts are created by the same settlor orsettlors and as much as one-half of the incomeor principal or both of each trust is payable orapplicable to the use of the same person orpersons, such trusts shall be considered as one.
No investment for a Common Trust Fund shallbe made in stocks, or bonds or other obligationsof any one person, firm, or corporation whichwould cause the total amount of investment instocks, or bonds or other obligations issued orguaranteed by such person, firm, or corpora-tion to exceed 10 per cent of the value of theCommon Trust Fund, as determined by the trustinvestment committee, provided that this limita-tion shall not apply to investments in obligationsof the United States or for the payment of theprincipal and interest of which the faith andcredit of the United States shall be pledged.
No investment for a Common Trust Fundshall be made in any one class of shares of stockof any one corporation which would cause thetotal number of such shares held by the Com-mon Trust Fund to exceed 5 per cent of thenumber of such shares outstanding. If the bankadministers more than one Common Trust Fundno investment shall be made which would causethe aggregate investment for all such CommonTrust Funds in shares of stock of any one cor-poration to exceed such limitation.
Any bank administering a Common TrustFund shall have the responsibility of maintain-
Digitized for FRASER http://fraser.stlouisfed.org/ Federal Reserve Bank of St. Louis

12 FEDERAL RESERVE BULLETIN JANUARY 1938
ing in cash and readily marketable securities6
such part of the assets of the Common TrustFund as shall be deemed by the bank to benecessary to provide adequately for the needsof participating trusts and to prevent inequitiesbetween such trusts. In any event, prior to anyadmissions to or withdrawals from a CommonTrust Fund, the trust investment committeeshall determine what percentage of the value ofthe assets of a Common Trust Fund is composedof cash and readily marketable securities; and ifsuch committee determines that, after effectingthe admissions and withdrawals which are tobe made pursuant to notice given as required insubdivision (4) of this subsection, less than 40,per cent of the value of the remaining assets ofthe Common Trust Fund would be composed ofcash and readily marketable securities, no admis-sions to or withdrawals from the Common TrustFund shall be permitted as of the valuationdate upon which such determination is made, ex-cept that ratable distribution upon all partici-pations is not prohibited.
(6) Distribution upon withdrawal of partici-pation.—When participations are withdrawnfrom a Common Trust Fund, distributions maybe made in cash or ratably in kind, or partly incash and partly ratably in kind, provided thatall distributions as of any one valuation dateshall be made on the same basis. Before anydistribution in cash is made, the trust invest-ment committee shall determine whether any in-vestment remaining in the Common Trust Fundwould be unlawful for one or more participatingtrusts if funds of such trusts were being in-vested at that time; and no distribution shallbe made in cash until any such unlawful invest-ment shall have been eliminated from the Com-mon Trust Fund either through sale, distributionin kind, or segregation as provided in the sub-division immediately following hereafter.
(7) Segregation of investments.—If for anyreason an investment is withdrawn in kind froma Common Trust Fund for the benefit of alltrusts participating in the Common Trust Fundat the time of such withdrawal and such invest-ment is not distributed ratably in kind it shallbe segregated and administered or realized uponfor the benefit ratably of all trusts participatingin the Common Trust Fund at the time of with-drawal.
(8) Management of Common Trust Fund andfees.—A national bank administering a CommonTrust Fund shall have the exclusive manage-ment thereof and shall not charge a fee forthe management of the Common Trust Fund, orreceive, either from the Common Trust Fund orfrom any trusts the funds of which are investedin participations therein, any additional fees,commissions, or compensations of any kind byreason of such participation. The bank shall notpay a fee, commission, or compensation out ofthe Common Trust Fund for management Noth-ing in this paragraph shall be construed as pro-hibiting a bank from reimbursing itself out of aCommon Trust Fund for such reasonable ex-
6 A readily marketable security within the meaning of this sec-tion means a security which is the subject of frequent dealings inready markets with such frequent quotations of price as to make(a) the price easily and definitely ascertainable and (b) thesecurity itself easy to realize upon by sale at any time.
penses incurred by it in the administrationthereof as would have been chargeable to therespective participating trusts if incurred in theseparate administration of such participatingtrusts.
(B) Effect of mistakes.—No mistake made ingood faith and in the exercise of due care inconnection with the administration of a Com-mon Trust Fund shall be deemed to be a viola-tion of this regulation if promptly after thediscovery of the mistake the bank takes what-ever action may be practicable in the circum-stances to remedy the mistake.
The second sentence of subsection (b) ofsection 6 of Regulation F was amended to readas follows:
The acceptance of all trusts shall be approvedby the board of directors or a committee ap-pointed by such board, and the closing out orrelinquishment of all trusts shall be approvedor ratified by the board of directors or a com-mittee appointed by such board; and such com-mittee or committees shall be composed of capa-ble and experienced officers or directors of thebank.
The first sentence of subsection (c) of sec-tion 6 of Regulation F was amended by ap-pending thereto a footnote reading as follows:
It is contemplated that there shall be a com-mittee the members of which shall have a con-tinuity of responsibility for the discharge of theduties of the committee. However, alternatesappointed by the board of directors may serve inplace of regular members of the committee whoare unable to serve on account of vacations, ill-ness, or other good and sufficient reasons if theminutes of the committee show the reason forthe service of such alternate in place of theregular member.
The following additions were made to theAppendix to Regulation F :
There are printed below certain provisions of theRevenue Act of 1936 which are pertinent to some ofthe subject' matter of this regulation.
SEC. 169. COMMON TRUST FUNDS.(a) DEFINITIONS.—The term "common trust fund"
means a fund maintained by a bank (as defined insection 104)—
(1) exclusively for the collective investmentand reinvestment of moneys contributed theretoby the bank in its capacity as a trustee, executor,administrator, or guardian; and
(2) in conformity with the rules and regula-tions, prevailing from time to time, of the Boardof Governors of the Federal Reserve System per-taining to the collective investment of trust fundsby national banks.
(b) TAXATION OF COMMON TRUST FUNDS.—A com-mon trust fund shall not be subject to taxation underthis title, Title IA, or section 105 or 106 of the Reve-
Digitized for FRASER http://fraser.stlouisfed.org/ Federal Reserve Bank of St. Louis

JANUAEY 1938 FEDERAL RESERVE BULLETIN 13
nue Act of 1935, and for the purposes of such titlesand sections shall not be considered a corporation.
(c) INCOME OF PARTICIPANTS IN FUND.—Each par-ticipant in the common trust fund shall include incomputing its net income its proportionate share,whether or not distributed and whether or not dis-tributable, of the net income of the common trustfund. The net income of the common trust fund shallbe computed in the same manner and on the samebasis as in the case of an individual. The propor-tionate share of each participant in the amount ofinterest specified in section 25(a) received by thecommon trust fund shall for the purposes of thisSupplement be considered as having been received bysuch participant as such interest.
(d) ADMISSION AND WITHDRAWAL.—No gain orloss shall be realized by the common trust fund bythe admission or withdrawal of a participant. Thewithdrawal of any participating interest by a par-ticipant shall be treated as a sale or exchange ofsuch interest by the participant.
(e) RETURNS BY BANK.—Every bank (as definedin section 104) maintaining a common trust fundshall make a return under oath for each taxable year,stating specifically, with respect to such fund, theitems of gross income and the deductions allowed bythis title, and shall include in the return the namesand addresses of the participants who would be en-titled to share in the net income if distributed andthe amount of the proportionate share of each par-ticipant. The return shall be sworn to as in thecase of a return filed by the bank under section 52.
(f) DIFFERENT TAXABLE YEARS OF COMMON TRUSTFUND AND PARTICIPANT.—If the taxable year of thecommon trust fund is different from that of a par-ticipant, the proportionate share of the net income ofthe common trust fund to be included in computingthe net income of the participant for its taxable yearshall be based upon the net income of the commontrust fund for any taxable year of the common trustfund (whether beginning on, before, or after January1, 1936) ending within the taxable year of the par-ticipant.
SEC. 104. BANKS AND TRUST COMPANIES.(a) DEFINITIONS.—As used in this section the term
"bank" means a bank or trust company incorporatedand doing business under the laws of the UnitedStates (including laws relating to the District ofColumbia), of any State, or of any Territory, a sub-stantial part of the business of which consists ofreceiving deposits and making loans and discounts,or of exercising fiduciary powers similar to thosepermitted to national banks under section 11 (k) ofthe Federal Reserve Act, as amended, and which issubject by law to supervision and examination byState or Federal authority having supervision overbanking institutions.
Additional Time for Obtaining Statements in Con-nection with Special Omnibus Accounts Under Re-vised Regulation T.Section 4(b) of Regulation T, as revised effective
January 1, 1938, provides that in a special omnibusaccount carried by a member of a national securi-ties exchange for a customer, transactions may beeffected in reliance upon a signed statement whichthe member has accepted from the customer in goodfaith, and a duplicate original of which has been filedby the member with the secretary of a national se-
curities exchange of which he is a member, that thecustomer is a broker or dealer who is subject to theprovisions of Regulation T or has places of businessonly in foreign countries. Section 4(b) also pro-vides that in a special omnibus account no securityshall have loan value and no short sales of securitiesshall be carried except securities and short sales as towhich the member shall have accepted in good faitha signed statement of the customer that he is in turncarrying such securities and such short sales for theaccount of his customers other than his partners.
In order to facilitate the transition from the oldregulation to the revised regulation, the Board hasprescribed that a member who on December 31, 1937,was carrying for a customer an account that com-plied with the provisions of section 3(b) of Regula-tion T as then-in effect, may, until March 1, 1938, orsuch earlier time as he may be able to obtain fromthe customer the statements referred to above, usein lieu of such statements of the customer, the mem-ber's own signed statement that he believes the factsto be as they are required to be stated by the customerin such statements under the revised regulation.
Extensions of Time by Business Conduct Committeesin Connection with Cash Transactions Under Re-vised Regulation T.Section 4(c) of Regulation T, as revised effective
January 1, 1938, provides for a special cash account,and the section contemplates that the usual purchaseor sale in such an account will be settled in full by thecustomer not later than 7 days after the transaction.In connection with this time limit, however, certainexceptions are provided and the business conductcommittees of national securities exchanges are au-thorized to extend the time in certain circumstances.
The Board recently considered a case in which amember of a national securities exchange who is domi-ciled in this country maintains for a customer who isdomiciled abroad a special cash account that conformsto section 4(c) of the revised regulation. Securitiessold "regular way" in this account are shipped by thecustomer to the member promptly after the sale. Dueto the time required in transit, the average intervalbetween the sale and the receipt of the securities bythe member is greater than 7 days, but less than 15days. Such sales and shipments are of frequent oc-currence.
The inquiry indicated that the business conductcommittee of the member's exchange was satisfiedthat the facts are such that under section 4(c) itwould be justified in extending the time to 15 daysseparately for each such transaction if the membermade a separate application in connection with eachtransaction. The member and the committee would,however, like to avoid the necessity for repeated sepa-rate applications and extensions on the occasion ofeach such transaction between the given member andcustomer.
The question presented was whether in the circum-stances described the committee may, on the basis ofa single application by the member, extend the periodto 15 days for all transactions of the type describedthat the member may effect in the future for the cus-tomer named in the application. The Board expressedthe opinion that section 4(c) permits such an ex-tension of time, and that repeated individual applica-tions and extensions in connection with such trans-actions between the member and the customer maythus be avoided.
Digitized for FRASER http://fraser.stlouisfed.org/ Federal Reserve Bank of St. Louis

14 FEDERAL RESERVE BULLETIN JANUARY 193S
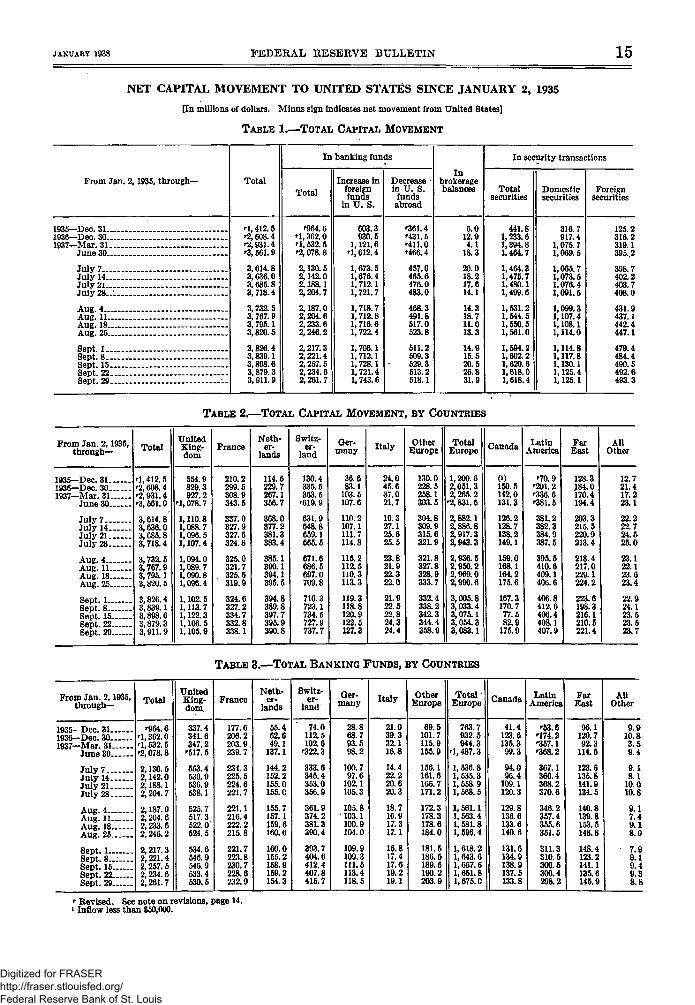
STATISTICS OF. INTERNATIONAL CAPITAL TRANSACTIONS OF THE UNITED STATESJULY-SEPTEMBER 1937
Statistics of international capital transac-tions of the United States through the thirdquarter of 1937 are published in the tables onthe following pages. Similar tables coveringthe first and second quarters of 1937 werepublished in the Federal Reserve Bulletins
for July, pages 639-642, and October, pages998-1001. Monthly and weekly data for theperiod from M&y 1929 to the end of 1936, to-gether with five charts and a detailed descrip-tion of the statistics, were published in theBulletin for May 1937, pages 394-431.
NOTE ON REVISIONS IN PREVIOUSLY PUBLISHED FIGURES
The inclusion of certain figures on outstand-ing short-term foreign liabilities and assetsnot previously reported by certain institu-tions has necessitated revisions in some of thestatistics of international capital transactionspublished in the Bulletins for May, July, andOctober, 1937. Figures in the tables on thefollowing pages for dates prior to July 7,1937, have been revised accordingly. Previ- Tables 1, 2, 3, 4, and 5.
ously published figures for other dates may berevised on the basis of the information givenin the tables below. These tables show di-rectly the changes to be made in Table 10,Outstanding Short-term Liabilities to For-eigners, and Table 11, Outstanding Short-term Foreign Assets; and provide the datafor computing the corresponding revisions in
CORRECTIONS TO TABLE 10.—OUTSTANDING SHORT-TERM LIABILITIES TO FOREIGNERS
Date
Amounts to beadded
Total UnitedKingdom
Switzer-land
TotalEurope
April 14, 1937, to May 12,1937, inclusive.May 19, 1937, to May 26,1937, inclusive.On June 2,1937On June 9, 1937June 16,1937, to June 30,1937, inclusive.
1.02.05.08.4
(Millions of dollars)
1.02.04.06.87.0
1.01.61.6
1.02.05.08.48.6
CORRECTIONS TO TABLE 11.—OUTSTANDING SHORT-TERM FOREIGN ASSETS
Date
Amounts to beadded
nonfatloiai
1.019.719.018.317.616.816.515.915.5
LatinAmerica
(Millions
1.024.924.223.522.822.021.721.120.7
Amounts to besubtracted
UnitedKingdom
TotalEurope
of dollars)
5.25.25.25.25.26.25.25.2
5.25.25.25.25.25.25.25.2
Aug. 26,1931, to Feb. 3,1932, inclusive..Feb. 10,1932, to July 26,1933, inclusive-Aug. 2,1933, to Dec. 27,1933. inclusive..Jan. 3,1934> to June 27,1934, inclusive-July 3,1934, to Jan. 30,1935, inclusive..Feb. 6,1935, to July 31,1935, inclusive..Aug. 7,1935, to July 29,1936, inclusive..Aug. 5,1936, to April 28,1937 inclusive..May 5,1937, to June 30,1937, inclusive.-
Digitized for FRASER http://fraser.stlouisfed.org/ Federal Reserve Bank of St. Louis

JANUARY 1938 FEDERAL RESERVE BULLETIN 15
NET CAPITAL MOVEMENT TO UNITED STATES SINCE JANUARY 2, 1935
[In millions of dollars. Minus sign indicates net movement from United States]
TABLE 1.—TOTAL CAPITAL MOVEMENT
From Jan. 2, 1935, through— Total
'1 ,412.5••2,608.4••2,931.4••3,661.9
3,614.83,636.03,685.83,718.4
3,732.53,767.93,795.13,820.5
3,826.43,839.13,898.63,879.33,911.9
In banking funds
Total
^964.6'1,362.0'1,532.5••2,078.8
2,130.52,142.02.1R8.12,204.7
2,187.02,204.62,233.62,246.2
2,217.32,221.42,257.52,234.62,261.7
Increase Inforeignfunds
In U. S.
603.3930.5
1,121.6'1,612.4
1,673.51,676.41.712.11,721.7
1,718.71,712.81, 716.61,722.4
1,706.11,712.11, 728.11, 721.41,743.6
Decreasein U. 8.
fundsabroad
••361.4'431.5'411.0'466.4
457.0465.6476.0483.0
468.3491.8517.0523.8
511.2509.3529.3513.2518.1
Inbrokeragebalances
6.012.94.1
18.3
20.018.217.614.1
14.318.711.013.3
14.915.520.526.831.9
In security transactions
Totalsecurities
441.81,233.61,394.81,464.7
1,464.31,475.71.480.11,499.6
1,531.21,544.51,550.51,561.0
1,594.21,602.21,620.61,618.01,618.4
Domesticsecurities
316.7917.4
1,075.71,069.5
1,065.71,073.51.076.41,091.5
1,099.31,107.41,108.11,114.0
1,114.81,117.81,130.11,125.41,125.1
Foreignsecurities
125.2316.2319.1305..2
398.7402.2403.7408.0
431.9437.1442.4447.1
479.4484.4490.5492.6493.3
1935—Dec. 31..1936—Dec. 30..1937^Mar. 31.
June 30..
July 7.. .July 14..July 2i_.July 28..
Aug. 4...Aug. 11.Aug. 18.Aug. 25.
Sept. 1..Sept. 8-.Sept. 15.Sept. 22.Sept. 29.
From Jan. 2,1935,through—
1935—Dec. 311936—Dec. 301937—Mar. 31
June 30
July 7July 14July 21July 28
Aug. 4Aug. 11Aug. 18Aug. 25
Sept. 1 . . . . .Sept. 8Sept. 15Sept. 22Sept. 29
Total
1,412.5'2,608.4'2,931.4'3,561.9
3,614.83,636.03,685.83,718.4
3,732.53,767.93,795.13,820.5
3,826.43,839.13,898.63,879.33,911.9
TABLE 2.—TOTAL CAPITAL MOVEMENT
UnitedKing-dom
554.9829.3927.2
"•1,078.7
1,110.81,088.71,096.51,107.4
1,094.01,089.71,090.81,096.4
1,102.51,113.71,122.31,106. 51,105.9
France
210.2299.5308.9343.5
337.0327.9327.6324.8
325.0321.7325.6319.9
324.6327.2334.7332.8338.1
Neth-er-
lands
114.5229.7267.1356.7
368.0377.2381.3383.4
385.1390.1394.1395.5
394.8389.8397.7395.9390.8
Switz-er-
land
130.4335.5363.5
'619.9
631.9648.8659.1665.5
671.6686.5697.0709.8
710.3723.1734.5727.9737.7
Ger-many
36.683.1
103.5107.6
110.2107.1111.7114.8
115.2112.5110.3113.3
119.3118.8120.9122.5127.3
Italy
24.045.637.021.7
19.327.125.625.5
23.821.922.322.0
21.922.522.824.324.4
, BY COUNTRIES
OtherEurope
130.0228.5258.1303.5
304.8309.9315.6321.9
321.8327.8328.9333.7
332.4338.2342.3344.4358.9
TotalEurope
1,200.62,051.32,265.2
"2,831.5
2,882.12,886.82,917.32,943.3
2,936.52,950.22,969.02,990.6
3,005.83,033.43,075.13,054.33,083.1
}
Canada
0)150.5142.0131.3
126.2128.7138.2149.1
159.0168.1164.2175.6
167.3170.777.582.9
175.9
LatinAmerica
'70.9'201.2'336.6'381.5
381.2382.3384.9387.5
395.5410.6409.1406.6
406.8412.6406.4408.1407.9
FarEast
128.3J84.0170.4194.4
203.3215.5220.9213.4
218.4217.0229.1224.2
223.6198.3216.1210.5221.4
AllOther
12.721.417.223.1
22.222.724.525.0
23.122.123.623.4
22.924.123.523.523.7
TABLE 3.—TOTAL BANKING FUNDS, BY COUNTRIES
From Jan. 2,1935,th rough- Total
UnitedKing-dom,
FranceNeth-
er-lands
Switz-er-
landGer-
many Italy OtherEurope
TotalEurope Canada Latin
AmericaFar
EastAll
Other
1935—Dec. 3 1 . . .1936— Dec. 30. __1937—Mar. 31 . . .
June 3O._-
July7_ —July 14 . . .July 2 1 . . .July 28 —
Aug. 4Aug. 11.. . .Aug. 18—Aug. 25. . .
Sept. U...Sept. 8....Sept. 15..Sept. 22...Sept. 29...
'064.61,362.0'1,532.5'2,078.8
2,130.52,142.02.18S. 12,204.7
2,187.02,204.62.233.62.246.22.217.32,221.42,257.52,234.62.261.7
337.4341.6347.2
'517. 5
553.4530.9538.9538.1
525.7517.3522.0524.5
534.6546.9546.9633.4530.5
177.6206.2203.9239.7
234.3225.5224.6221.7
221.1216.4222.2215.8
221.7223.8230.7228.6232.9
55.462.649.1
137.1
144.2152.2155.0155. C
155.7157.1159.6160.6
160.0155.2158.9159.2154.3
74.0112.5102.6
'322.3
333.6345.4353.0356.9
361.9374.2381.3390.4
393.7404.6412.4407.8415.7
28.868.793.598.2
100.797.6
102.1105.3
105.8' 103.1100.9104.0
109.9109.3111.5113.4118.5
21.039.332.116.8
14.422.220.620.3
18.716.917.317.1
16.817.417.619.219.1
69.5101.7115.9155.9
156.1161.6166.7171.2
172.3178.3178.6184.0
181.5186.5189.5190.2203.9
763.7932.5944.3
1,487.3
1,536.81,535.31,558.91,568.5
1,561.11,563.4,581.8,596.4
[, 618.21,643.6,667.6:,651.S1,675.0
41.4123.6135.399.3
94.096.4
109.1120.3
129.8136.6133.6140.6
131.6134.9138.9337.5133.8
'53.6'174.2'357.1'368.2
367.1366.4368.2370.6
346.2357.4355.6351.5
311.3310.5300.5300.4298.2
96.1120.792.3
114.6
123.6135.8141.9134.5
140.8139.8153.5148.8
148.4123.2141.1135.6145.9
9.910.83.59.4
9.18.1
10.010.8
9.17.49.18.9
7.99.19.49.38.S
' Revised. See note on revisions, page 14.i Inflow less than $50,000.
Digitized for FRASER http://fraser.stlouisfed.org/ Federal Reserve Bank of St. Louis

14 FEDERAL RESERVE BULLETIN JANUARY 1933
STATISTICS OR INTERNATIONAL CAPITAL TRANSACTIONS OF THE UNITED STATESJULY-SEPTEMBER 1937
Statistics of international capital transac- for July, pages 639-642, and October, pagestions of the United States through the third 998-1001. Monthly and weekly data for thequarter of 1937 are published in the tables on period from May 1929 to the end of 1936, to-the following pages. Similar tables covering gether with five charts and a detailed descrip-the first and second quarters of 1937 were tion of the statistics, were published in thepublished in the Federal Reserve Bulletins Bulletin for May 1937, pages 394-431.
NOTE ON REVISIONS IN PREVIOUSLY PUBLISHED FIGURES
The inclusion of certain figures on outstand-ing short-term foreign liabilities and assetsnot previously reported by certain institu-tions has necessitated revisions in some of thestatistics of international capital transactionspublished in the Bulletins for May, July, andOctober, 1937. Figures in the tables on thefollowing pages for dates prior to July 7,1937, have been revised accordingly. Previ-
ously published figures for other dates may berevised on the basis of the information givenin the tables below. These tables show di-rectly the changes to be made in Table 10,Outstanding Short-term Liabilities to For-eigners, and Table 11, Outstanding Short-term Foreign Assets; and provide the datafor computing the corresponding revisions inTables 1, 2, 3, 4, and 5.
CORRECTIONS TO TABLE 10.—OUTSTANDING SHORT-TERM LIABILITIES TO FOREIGNERS
Date
Amounts to beadded
Total UnitedKingdom
Switzer-land
TotalEurope
April 14,1937, to May 12, 1937, inclusiveMay 19,1937, to May 26, 1937, inclusive.On June 2, 1937On June 9,1937June 16, 1937, to June 30, 1937, inclusive.
1.02.05.08.48.6
(Millions of dollars)
1.02.04.06.87.0
1.01.61.6
1.02.05.08.48.6
CORRECTIONS TO TABLE 11.—OUTSTANDING SHORT-TERM FOREIGN ASSETS
Date
Aug. 26, 1931, to Feb. 3,1932, inclusiveFeb. 10,1932, to July 26,1933, inclusiveAug. 2,1933, to Dec. 27,1933. inclusive—Jan. 3,1934, to June 27,1934, inclusiveJuly 3,1934, to Jan. 30,1935, inclusiveFeb. 6,1935, to July 31,1935, inclusive .. ._Aug. 7,1935, to July 29, 1936, inclusiveAug. 5,1936, to April 28,1937 inclusive...May 5,1937, to June 30,1937, inclusive
Amounts to beadded
Total
1.019.719.018.317.616.816.515.915.5
LatinAmerica
(Millions
1.024.924.223.522.822.021.721.120.7
Amounts to besubtracted
UnitedKingdom
of dollars)
5.25.25.25.25.25.25.25.2
TotalEurope
5.25.25.25.25.25.25.25.2
Digitized for FRASER http://fraser.stlouisfed.org/ Federal Reserve Bank of St. Louis
JANUARY 1938 FEDERAL RESERVE BULLETIN 15
NET CAPITAL MOVEMENT TO UNITED STATES SINCE JANUARY 2, 1935
[In millions of dollars. Minus sign Indicates net movement from United States]
TABLE 1.—TOTAL CAPITAL MOVEMENT
From Jan. 2, 1935, through—
1936—Dec. 311936—Dec. 301937-v-Mar 31 -.~
June 30
July 7July 14 -July 2i -~ ~July 28-.".
Aug. 4Aug. 11Aug. 18 ~ . fc
AUg 25
Sept 1 .Sept. 8Sept 15Sept. 22 „Sept 29 -
Total
••1,412.5'2,608.4"•2,931.4'3,561.9
3,614.83,636.03,685.83,718.4
3,732. 53, 767.93, 795.13,820.5
3,826.43,839.13,898.63,879.33,911.9
In banking funds
Total
r964.6*1,362.0'1, 532.5'2,078.82,130.52,142.02.188.12,204.7
2,187.02,204.62,233.62,246.2
2,217.32,221.42,257.62,234.62,261.7
Increase inforeignfunds
in U. S.
603.3930.5
1,121.6'1,612.4
1,673.51,676.41.712.11,721.7
1,718.71,712.81,716.61,722.4
1,706.11,712.11,728.11,721.41,743.6
Decreasein U. S.
fundsabroad
'361.4'431.5'411.0••466.4
457.0465.6476.0483.0
468.3491.8517.0523.8
511.2509.3529.3513.2518.1
Inbrokeragebalances
6.012.94.1
18.3
20.018.217.614.1
14.318.711.013.3
14.915.520.526.831.9
In security transactions
Totalsecurities
441.81,233.61,394.81,464.7
1,464.31,475.71.480.11,499.6
1,531.21,544.51,550.51,561.0
1,594.21,602.21,620.61,618.01,618.4
Domesticsecurities
316.7917.4
1,075.71,069.5
1,065 71.073.5L. 076.41,091.5
1,099.31,107.4, 108.1,114.0
1,114.81,117.8L. 130.11,125.41,125.1
Foreignsecurities
125.2316.2319.139S..2398.7402.2403.7408.0
431.9437.1442.4447.1
479.4484.4490.5492.6493.3
From Jan. 2,1935,through—
1935—Dec. 311936—Dec. 301937—Mar. 31
June 30
July 7July 14July 21July 28
Aug. 4Aug. 11Aug. 18Aug. 25.
Sept. 1Sept. 8._Sept. 15Sept. 22Sept. 29
Total
"1,412.5'2,608.4'2,931.4'3, 561.9
3,614.83,636.03,685.83,718.4
3,732.53,767.93,795.13,820.5
3,826.43,839.13,898.63,879.33,911.9
TABLE 2.—TOTAL CAPITAL MOVEMENT
UnitedKing-dom
554.9829.3927.2
'1,078.7
1,110.81,088.71,096.51,107.4
1,094.01,089.71,090.81,096.4
1,102. 51,113.71,122.31,106.51,105.9
France
210.2299.5308.9343.5
337.0327.9327.6324.8
325.0321.7
, 325.6319.9
324.6327.2334.7332.8338.1
Neth-er-
lands
114.5229.7267.1356.7
368.0377.2381.3383.4
385.1390.1394.1395.5
394.8389.8397.7395.9390.8
Switz-er-
land
130.4335.5363.5
'619.9
631.9648.8659.1665.5
671.6686.5697.0709.8
710.3723.1734.5727.9737.7
Ger-many
36.683.1
103.5107.6
110.2107.1111.7114.8
115.2112.5110.3113.3
119.3118.8120.9122.5127.3
Italy
24.045.637.021.7
19.327.125.625.5
23.821.922.322.0
21.922.522.824.324.4
, BY COUNTRIES
OtherEurope
130.0228.5258.1303.5
304.8309.9315.6321.9
321.8327.8328.9333.7
332.4338.2342.3344.4358.9
TotalEurope
1,200.62,051.32,265.2
'2,831.5
2,882.12,886.82,917.32,943.3
2,936.52,950.22,969.02,990.6
3,005.83,033.43,075.13,054.33,083.1
Canada
0)150.5142.0131.3
126.2128.7138.2149.1
159.0168.1164.2175.6
167.3170.777.582.9
175.9
LatinAmerica
'70.9'20L2'336. 6'381.5
381.2382.3384.9387.5
395.5410.6409.1406.6
406.8412.6406.4408.1407.9
FarEast
128.3J84.0170.4194.4
203.3215.5220.9213.4
218.4217.0229.1224.2
223.6198.3216.1210.5221.4
AllOther
12.721.417.223.1
22.222.724.525.0
23.122.123.623.4
22.924.123.523.523.7
TABLE 3.—TOTAL BANKING FUNDS, BY COUNTRIES
From Jan. 2,1935,through—
1935—Dec. 311936—Dec. 301937—Mar. 31
June 30
July 7._July 14July 21July 28
Aug. 4Aug. 11Aug. 18Aug. 25
Sept. 1Sept. 8~~~_Sept. 15Sept. 22Sept. 29
Total
'964.6'1,362.0'1,532.5'2,078.8
2,130.52,142.02.188.12,204.7
2,187.02,204.62,233.62,246.2
2,217.32,221.42,257.52,234.62,261.7
UnitedKing-dom,
337.4341.6347.2
'517.5
553.4530.9536.9538.1
525.7517.3522.0524.5
534.6546.9546.9533.4530.5
France
177.6206.2203.9239.7
234.3225.5224.6221.7
221.1216.4222.2215.8
221.7223.8230.7228.6232.9
Neth-er-
lands
55.462.649.1
137.1
144.2152.2155.0155. C
155.7157.1159.6160.6
160.0155.2158.9159.2154.3
Switz-er-
land
74.0112.5102.6
'322.3
333.6345.4353.0356.9
361.9374.2381.3390.4
393.7404.6412.4407.8415.7
Ger-many
28.868.793.598.2
100.797.6
102.1105.3
105.8' 103.1100.9104.0
109.9109.3111.5113.4118.5
Italy
21.039.332.116.8
14.422.220.620.3
18.716.917.317.1
16.817.417.619.219.1
OtherEurope
69.5101.7115.9155.9
156.1161.6166.7171.2
172.3178.3178.6184.0
181.5186.5189.5190.2203.9
TotalEurope
763.7932.5944.3
'1,487.3
1,536.81,535.31,558.91,568.5
1,561.11,563.41,581.81,596.4
1,618.21,643.61,667.61,651.81,675. C
Canada
41.4123.6135.399.3
94.096.4
109.1120.3
129.8136.6133.6140.6
131.6134.9138.9137.5133.8
LatinAmerica
'53.6'174.2'357.1'368.2
367.1366.4368.2370.6
346.2357.4355.6351.5
311.3310.5300.5300.4298.2
FarEast
96.1120.792.3
114.6
123.6135.8141.9134.5
140.8139.8153.5148.8
148.4123.2141.1135.6145.9
AllOther
9.910.83.59.4
9.18.1
10.010.8
9.17.49.18.9
• 7.99.19.49.38.8
' Revised. See note on revisions, page 14.i Inflow less than $50,000.
Digitized for FRASER http://fraser.stlouisfed.org/ Federal Reserve Bank of St. Louis

16 FEDERAL RESERVE BULLETIN JANUARY 1938
NET CAPITAL MOVEMENT TO UNITED STATES SINCE JAN. 2, 1935—Continued[In millions of dollars* Minus sign indicates net movement from United States]
TABLE 4.—FOREIGN BANKING FUNDS IN UNITED STATES, BY COUNTRIES
From Jan. 2,1935,through—
1935—Dec. 311936—Dec. 301937—Mar. 31
June 30
July 7July 14July 21July 28
Aug. 4-Aug. 11Aug. 18Aug. 25 -
Sept. 1 <. -Sept. 8Sept. 15Sept. 22Sept. 29
Total
603.3930.5
1,121.6'1,612.4
1,673.51,676.41,712.11,721.7
1,718.71,712.81, 716.61,722.4
1,706.11,712 11,728.11,721.41,743.6
UnitedKing-dom
128.6163.6154.7
r300.9
339.4329.8330.0324.8
321.5307.9303.3303.8
316.7316.7316.2318.8313.7
France
129.6144.2140.9174.1
168.1160.3
, 156.8154.2
153.6149.5154.5148.1
153.8156.0163.3162.9165.2
Neth-er-
lands
55.765.947.6
132.2
138.3146.6150.2150.9
152.4153.9155.8156.6
159.0157.5156.1159.8154.8
Switz-er-
land
72.4109.899.4
'317.7
329.2340.6348.4352.2
357.2369.6376.9385.7
389.5400.1408.1403.7411.8
Ger-many
- . 82.7
24.510.9
11.66.6
10.111.7
10.79.76.28.8
12.111.512.214.219.4
Italy
7.323.017.94.3
2.210.07.67.3
5.55.55.85.9
6.05.77.36.88.8
OtherEurope
60.779.794.2
131.3
132.1135:2141.1145.4
145.0150.8151.1156.5
153.7157.6160.1161.1176.9
TotalEurope
453.5588.9579.2
'1,071.5
1,121.01,129.01,144.31,146.5
1,146.01,146.81,153.81,165.5
1,190.91,205.11,230.71,226.91,250.5
Canada
46.086.8
110.790.8
91.789.197.1
102.5
108.3112.8112.6116.0
115.3116.3117.5122.0120.0
LatinAmerica
33.5149.3326.4334.2
332.9331.7332.2333.3
309.4297.8294.2290.2
250.3250.1241.8241.1239.2
FarEast
58.890.494.7
100.6
112.7112.3122.4122.8
139.6141.6140.5135.4
135.1125.9123.5116.7120.0
AllOther
11.515.210.515.4
15.214.216.116.6
15.313.915.415.3
14.514.714.514.713.9
From Jan. 2, 1935,through—
1935-Dec. 311936—Dec. 301937-Mar. 31
June 30
July 7July 14July 21July 28
Aug. 4Aug. 11Aug. 18Aug. 25
Sept. 1Sept. 8Sept. 15_Sept. 22Sept. 29
TABLE 5.—UNITED STATES BANKING FUNDS .
Total
••361.4••431.5'411.0'466.4
457.0465. 6476.0483.0
468.3491.8517.0523.8
511.2509.3529.3513.2518.1
UnitedKing-dom
208.8178.0192.4216.5
214.0201.1206.9213.3
204.2209.4218.6220.7
217.9230.2223.4215.1216.8
France
48.162.063.065.6
66.265.267.867.5
67.566.967.767.7
67.867.867.465.667.7
Neth-er-
lands
- . 4- 3 . 3
1.54.9
5.95.64.74.1
3.23.33.74.0
1.0- 2 . 3
2.8- . 6- . 5
Switz-er-
land
1.62.73.24.6
4.34.84.64.7
4.74.74.44.7
4.24.54.34.13.9
Ger-many
29.766.069.087.3
89.191.092.093.6
95.193.494.795.2
97.897.899.399.199.1
Italy
13.716.314.212.4
12.212.113.013.1
13.111.411.511.2
10.811.610.312.410.4
ABROAD
OtherEurope
8.822.021.724.6
24.026.425.625.8
27.327.527.527.5
27.828.929.429.227.0
, BY COUNTRIES
TotalEurope
310.2343.7365.1415.9
415.8406.3414.6422.0
415.1416.6428.0430.9
427.3438.5436.9424.9424.5
Canada
- 4 . 636.924.68.4
2.27.3
12.017.9
21.523.821.024.7
16.218.621.415.513.8
5
LatinAmerica
'20.1'24.9'30.7
' '34.0
34.234.7*36.037.2
36.859.661.461.3
61.060.458.659.259.0
FarEast
37.330.4
- 2 . 414.0
10.923.419.511.7
1.2- 1 . 712.913.4
13.3- 2 . 617.518.925.9
AllOther
- 1 . 6- 4 . 4- 7 . 0- 6 . 0
- 6 . 1- 6 . 2- 6 . 2- 5 . 8
- 6 . 2- 6 . 4- 6 . 4- 6 . 4
- 6 . 6- 5 . 6- 5 . 1- 5 . 4- 5 . 0
From Jan. 2,1935,through—
1935—Dec. 311936—Dec. 301937—Mar. 31
June 30
July 7July 14July 21July 28
Aug. 4Aug. 11 _Aug. 18Aug. 25
Sept. 1—. —Sept. 8 _Sept. 15Sept. 22Sept. 29
Total
6.012.94.1
18.3
20.018.217.614.1
. 14.318.711.013.3
14.915.520.526.831.9
UnitedKing-dom
0)4.0.8
6.1
7.56.56.67.0
6.08.68.36.0
5.05.15.28.08.2
TABLE
France
2.410.49.4
11.7
11.110.610.710.3
10.711.69.4
10.6
10.010.710.710.811.5
6.—BROKERAGE BALANCES, BY COUNTRIES
Neth-er-
lands
1.3- . 92.74.2
6.74.94.S4.4
3.63.03.83.9
3.93.63.94.44.4
Switz-er*
land
2.59.1
10.311.8
12.212.511.810.7
11.010.29.6
10.3
10.811.211.511.812.3
Ger-many
- . 2- . 7- . 1
(*)
- . 1- . 1- . 1- . 2
- . 2- . 1- . 2- . 1
(»T"1
-.'i- . i
Italy
.1
.3
.2
.2
.2
.2
.3
.2
.2
.2
.2
.1
.1
.1
.1.1.2
OtherEurope
1.4.4.9
2.0
3.22.42.72.5
2.42.02.72.4
3.03.33.54.73.5
TotalEurope
7.622.624.335.8
40.836.936.834.8
33.635.333.833.2
32.833.935.039.740.0
Canada
-4 .5-7.6
-10.0-11.3
-13.2-12.6-12.8-13.2
-12.3-10.6-16.4-14.1
-12.8-13.9-11.2-9.9-8.6
LatinAmerica
1.0-4.2-5.4-5.5
-5.9-5.6-6.C-6.6
-6.3-6 .3-6.6-6.1
-6.2-5.9-5 .3-5.2-3.2
FarEast
2.92.1
-5.4- . 5
- . 4- . 8- . 6- . 8
- . 3.2.2.4
.91.23.43.23.9
AllOther
- . 9
" - !
-1 .3.3.3
- . 2
- . 3.1
- . 1
.2
.2-1 .4-1.0- . 3
i Inflow less than $50,000.Eevised. See note on revisions, page 14.
» Outflow less than $50,000.
Digitized for FRASER http://fraser.stlouisfed.org/ Federal Reserve Bank of St. Louis

JANUARY 1938 FEDERAL RESERVE BULLETIN 17
NET CAPITAL MOVEMENT TO UNITED STATES SINCE JAN. 2, 1935—Continued[In millions of dollars. Minus sign indicates net movement from United States]
TABLE 7.—TOTAL SECURITIES, BY COUNTRIESNet Purchases by Foreigners
From Jan. 2,1935,through- Total
UnitedKing-dom
FranceNeth-
er-lands
Switz-er-
landGer-
many Italy OtherEurope
TotalEurope Canada Latin
AmericaFarEast
AllOther
1935—Dec. 31-._1936—Dec. 30.. .1937—Mar. 31_._
June 30.^
July7.___.July 14....July 2 1 . . .July28___.
Aug. 4... . ,Aug. ll.._.Aug. 18^_.Aug. 25....
Sept. l-__Sept. 8—-Sept. 15...Sept. 22...Sept. 29...
441.81,233.61,394.81,464.7
1,464.31,475.71,480.11,499.6
1,531.21, 544. 51, 550. 51, 561.0
1,594.21,602.21,620.61,618.01,618.4
217.5483.8579.2555.2
549.9551.4553.0562.3
562.3563.8560.5565.9
562.9561.8570.1565.0567.2
30.282.995.692.1
91.69L992.292.8
93.393.894.093.5
92.992.893.393.493.7
57.9168.0215.3215.5
217.0220.1221.5224.1
225.8230.0230.8231.0
230.9231.1234.8232.3232.0
53.9213.9250.5285.8
286.1290.9294.3298.0
298.7302.1306.1309.1
305.8307.3310.5308.3309.7
7.915.110.09.4
9.69.69.79.7
, 9.69.69.69.5
9.59.69.59.28.8
2.96.14.74.8
4.84.84.85.0
5.04.84.84.7
5.05.05.06.05.1
69.1126.4141.3145.6
145.5145.9146.2148.3
147.1147.5147.6147.4
147.8148.4149.3149.4151.5
429.4,096.2[,296.61,308.4
[,304.51,314.6[,321.7[,340.0
,341.8,351.6,353.4
1,361.1
,35481,355.91,372.5[,362.71,368.0
-36.934.416.843.4
45.444.841.941.9
41.542.047.049.1
48.549.749.755.450.8
16.431.2
-15.218.7
20,021,522.623.6
55.759.560.06L2
101.7108.0111.2112.9112.9
29.361.283.480.3
80.080.579.679.7
77.976.975.475.0
74.473.871.671.871.6
3.710.613.213.9
11411314.314.4
14.314.514.6116
11711715.515.215.1
TABLE 8.—DOMESTIC SECURITIES, BY COUNTRIESNet Purchases by Foreigners
From Jan. 2, 1935,through—
1935_Dec. 311936—Dec. 301937—Mar. 31
June 30
J u l v 7 - - —July 14July 21July 28
Aug 4Aug. 11Aug. 18Aug. 25
Sept 1Sept. 8Sept. 15Sept. 22 _Sept. 29
Total
316.7917.4
1,075.71,069.5
1,065.71,073.51,076.41,091. 5
1,099.31,107.41,108.11,1110
1,114.81,117.81,130.11,125.41,125.1
UnitedKing-dom
149.8367.7438.7412.2
407.5409.5411.7420.3
424.2425.4422.1426.8
429.6428.6436.2431.4432.1
France
23.464.772.969.0
68.768.869.169.7
70.070.470.670.0
69.769.669.969.970.0
Neth-er-
lands
50.5157.6197.5193.1
194.4196.7197.7200.0
202.0206.1206.8206.9
207.3207.6211.3208.6208.6
Switz-er-
land
55.1200.2222.7249.7
249.3253.1255.7258.8
261.92618268.4270.1
268.4271.92714271.6272.2
Ger-many
-5.4- 7 .5
-13.6- 1 1 9
-15.0-15.1-15.3-15.4
-15.5-15.6-15.7-15,8
-15.8-15.9-16.0-16.0-16.1
Italy
- . 1-3 .3- 1 6-5 .0
-5 .0-5 .0-5 .0- 1 8
-4 .8- 1 9- 1 8- 1 8
- 1 9- 1 9- 1 9- 1 9- 1 9
OtherEurope
12.938.542.444.2
44.244.644.945.7
46.046.246.145.7
46.146.447.046.947.9
TotalEurope
286.2818.0956.0948.2
944.2952.6958.99714
983.9992.3993.5998.9
1,000.41,003.31,018.01,007.41,009.8
Canada
2.832.630.236.4
36.43 1 832.231.6
31.432.033.234.2
33.834.634.340.239.7
LatinAmerica
3.715.516.916.8
17.217.818.218.5
18.718.618.518.8
19.119.019.119.217.6
FarEast
21.44 1 163.659.2
58.859.258.158.3
56.655.754.153.2
52.652.049.549.549.2
AllOther
2.67.19.09.0
9.19.09.08.8
8.88.88.88.8
8.88.89.49.18.9
TABLE 9.—FOREIGN SECURITIES, BY COUNTRIESNet Purchases by Foreigners
From Jan. 2, 1935,through—
1935—Dec. 311936—Dec. 301937—Mar. 31
June 30
July 7July 14July 21July 28
Aug. 4_ -Aug. 11Aug. 18Aug. 25
Sept. 1Sept. 8Sept. 15Sept. 22Sept. 29
Total
125.2316.2319.1395.2
'398.7402.2403.74oao
431.9437.1442.4447.1
479.44814490.5492.6493.3
UnitedKing-dom
67.8116.1140.5143.0
142.3141.8141.3142.0
138.1138.5138.4139.2
133.2133.1133.9133.7135.1
France
6.818.222.723.1
22.923.123.223.1
23.223.423.423.4
23.223.223.423.523.7
Neth-er-
lands
7.410.417.822.4
22.623.423.8210
23.823.9210211
23.623.523.523.723.5
Switz-er-
land
-1 .213.727.836.2
36.837.838.539.2
36.737.337.739.0
37.435.536.136.737.5
Ger-many
13.322.523.6213
24.521721925.1
25.125.225.325.2
25.325.425.425.225.0
Italy
2.99.49.39.8
9.89.89.89.8
9.89.79.69.6
9.99.99.99.9
10.0
OtherEurope
46.187.998.9
101.4
101.3101.4101.3102.5
101.2101.3101.5101.7
101.8102.0102.3102.6103.6
TotalEurope
143.1278.3340.6360.2
360.3362.0362.8365.7
357.9359.2359.9362.2
3514352.63515355.33£8.3
Canada
-39.71.7
-13.47.0
9.010.09.7
10.3
10.110.113.9119
11715.115.415.211.1
LatinAmerica
12.715.7
-32.11.9
2.93.74.45.1
37.040.841.642.4
82.689.092.293.895.3
FarEast
7.917.019.821.2
21.221.321.521.4
2L221.221.321.8
21.821.822.222.322.4
AllOther
1.13.54.21 9
5.35.35.35.5
5.55.75.85.8
5.95.96.16.16.2
Digitized for FRASER http://fraser.stlouisfed.org/ Federal Reserve Bank of St. Louis

18 FEDERAL RESERVE BULLETIN JANUARY 1938
OUTSTANDING SHORT-TERM ACCOUNTS, BY COUNTRIES[In millions of dollars]
TABLE 10.—LIABILITIES TO FOREIGNERS
Date TotalUnitedKing-dom
FranceNeth-
er-lands
Switz-er-
landGer-
many Italy OtherEurope
TotalEurope Canada Latin
AmericaFarEast
AllOther
1929-Dec. 3 1 . . .1930—Dec. 31__.1931-Dec. 30, . .1932—Dec. 23 . . .1933—Dec. 27. . .
1934—Dec. 26....1935—Dec. 3 1 . . .1936—Dec. 30 . - ,1937—Mar. 31 . . .1937—June 30...
July 7July 14...,July 21 . . . .July 28.. . .
Aug. 4. . . . .Aug. II—.Aug. 18.-.,Aug. 2.1..-,
Sept. 1—.Sept. 8....Sept. 15...Sept. 22...Sept. 29...
2,672.72,335.01,303.5
745.5392.0
610.61,200.21,491.61,682.7
"2,173.6
2,234.72,237.62,273,22,282.8
2,279.82,273.92,277.72,283.5
2,267.22,273.22,289.32,282.52,304.8
Reported by Banks in New York City
301.5214.5104.9169.743.9
923.7799.4549.271.127.0
99.1122.244.611.98.0
105.2222.266.078.011.5
204.5161.041.132.917.5
157.4111.233.239.811.7
371.3281.3122.266.231.1
2,162.81,911.7
961.2469.6155.7
241.8216.8148.398.286.1
188.2130.8103.3121.796.7
49.038.269.043.542.7
Reported by Banks in United States
83.0205.5235.7226.9
'373.1
411.6401.9402.1396.9
393.7380.0375.5375.9
383.9388.9395.7390.5385.8
39.6163.5176.3173.0206.2
200.2192.4188.9186.3
185.7131.6186.7180.2
185.9188.1195.4195.0197.3
12.268.678.860.4
145.0
151.2159.4163.1163.8
165.3166.7168.7169.4
171.9170.3169.0172.7167.6
13.586.1
123.5113.1
'331.4
342.9354.3362.1365.8
370.9383.2390.6399.4
403.2413.8421.8417.4425.5
30.0'29.032.053.940.3
40.935.939.541.1
40.139.035.538.2
41.440.041.543.648.7
19.526.141.736.623.0
20.928.826.426.0
24.324.324.524.7
24.824.526.125.527.5
47.1107.5126.3140.8177.9
178.6181.7187.6192.0
191.5197.3197.7203.1
200.2204.2206.6207.6223.4
245.0686.3814.3804.7
•-1,296.9
1,346.41,354.51,369.71,371.9
1,371.41,372.21,379.21,390.9
1,416.31,430.51,456.21,452.31,475.9
97.9145.3186.1210.0190.1
191.0188.4196.4201.8
207.6212.1211.9215.3
214.6215.6216.9221.3219.3
125.2156.3263.9441.0448.8
447.5446.3446.8447.9
424.0412.3408.7404.3
364.9364.7356.4355,7353.8
130.1188.9200.2204.6210.4
222.6222.2232.2232.7
249.5251.5250.4245.3
245.0235.7233.4226.6229.9
31.037.521.612.610.9
12.423.427.122.527.4
27.226.228.128.6
27.325.827.427.2
26.426.726.526.725.8
TABLE 11.—FOREIGN ASSETS
Date TotalUnitedKing-dom
FranceNeth-
er-lands
Switz-er-
landGer-
many Italy OtherEurope
TotalEurope Canada Latin
AmericaFarEast
AllOther
1931—Dec, 301932—Dec. 281933—Dec. 27
1934-Dec. 26_._.1935—Dec. 31 . . . .1936—Dec. 30....1937—Mar. 31—1937—June 30—.
••1,103.3'937.9
July 7July 14 . . . .July 2 1 . . . .July 28.
Aug. 4Aug. 11....Aug. 18—Aug. 25—
Sept. 1Sept. 8Sept. 15—,Sept. 22....Sept. 29—.
Reported by Banks in New York City
166.2••87.3
••192.5
29.562.966.9
20.913.018.4
12.66.2
12.3
467.2434.9260.9
18.711.816.7
149.297.083.2
864.3'713.1'651.0
58.142.232.3
••136.5'155.2'159.7
41.824.049.7
Reported by Banks in United States
1,132.6'778.6'672.6'693.1'637.7
647.1638.5628.1621.1
635.8612.3587.1580.3
592.9594.8574.8590.9586.0
'281.8'88.1
'114.1'99.7'75.6
78.191.085.278.8
83.082.773.571.5
74.261.968.877.075.3
85.732.516.815.813.2
12.613.611.011.3
11.311.911.111.0
10.910.911.413.111.1
17.619.021.917.113.7
12.713.013.914.5
15.415.414.914.6
17.620.915.819.219.1
8.36.65.44.93.5
3.73.33.43.4
3.43.43.73.4
3.93.63.84.04.2
233.6202.0165.1162.2143.9
142.1140.2139.2137.6
136.1137.8136.5136.0
133.4133.4131.8132.0132.0
29.713.510.913.014.8
15.015.114.314.1
14.115.815.716.0
16.515.616.914.816.8
81.071.257.858.155.2
55.753.454.254.0
52.552.352.352.3
51.950.950.350.652.8
•737.6'433.0'392.1'370.7'319.9
320.0329.5321.1313.8
320.7319.2307.7304.9
308.5297.2298.9310.8311.3
94.0100.959.471.787.8
94.088.984.278.4
74.872.575.371.6
80.077.774.980.882.5
'175.2'154.5'141.1'135.3'132.0
131.8131.3130.0123.8
129.2106.3104.5104.6
105.0105.6107.3106.7107.0
117.880.167.2
100.083.6
86.774.278.185.9
96.499.384.784.2
84.3100.2
• 80.178.771.7
2.63.56.2
8.010.112.915.514.5
14.614.614.714.3
14.7'14.914.914.9
15.114.113.613.913.5
' Revised. See note on revisions, page 14.
Digitized for FRASER http://fraser.stlouisfed.org/ Federal Reserve Bank of St. Louis

FINANCIAL, INDUSTRIAL, AND COMMERCIAL STATISTICSUNITED STATES
19
Digitized for FRASER http://fraser.stlouisfed.org/ Federal Reserve Bank of St. Louis

20 FEDERAL RESERVE BULLETIN JANUARY 1938
MEMBER BANK RESERVES, RESERVE BANK CREDIT, AND RELATED ITEMS[In millions of dollars]
Date
End of month figures:1936—Dec. 311937—Jan. 31
Feb. 27 . . . .Mar 31~"""Apr. 30. ™ .May 31June 30July 3 1 . . . . .Aug. 3l"I*-S e p t . 30~~JL—Oct. 30Nov. 361
Wedoesday figures:1937—Jan. 6
Jan.13Jan. 201Jan. 27
Feb.3Feb. 10Feb. 17Feb. 24
Mar. 3Mar. 10Mar. 17Mar. 24Mar. 31
Apr. 7Apr. 14Apr. 21Apr. 28
May 5May 12May 19May 26
June 2June 9 * -June 16June 23June 30
July 7July 14July 21July 28
Aug. 4Aug. 11Aug. 18Aug. 25
Sept. 1Sept. 8Sept. 15.—-Sept. 22
Sept. 29Oct. 6Oct. 13Oct. 20Oct. 27
Nov. 3Nov. 10Nov. 17Nov. 24 . . „
Dec. 1..Dec. 8Dec. 15Dec. 22Dec. 29
Reserve bank credit outstanding
Billsdis-
counted
335
121217101522222117
3223
3334
7548
12
8118
11
17161516
1714141310
13151215
15171819
24242324
2423231823
24211916
1717161613
Billsbought
3333
6433333
3333
3333
33333
3434
4546
66544
4433
3333
3333
33333
3333
33333
U.,S.Gov-ern-
mentsecuri-
ties
2,4302,4302,4302,4302,5252,5262,5262,5262,5262,5262,5262,564
2,4302,4302,4302,430
2,4302,4302,4302,430
2,4302,4302,4302,4302,430
2,4592,4872,4872,526
2,5262,5282,5262,526
2,5262,5262,5262,5262,526
2,5262,5262,5262,526
2,5262,6262,6262,526
2,5262,5262,5262,526
2,5262,5262.5262,5262,526
2,5262,5372,5552,664
2,5642,5642,5642,5642,564
OtherReserve
bankcredit*
646027122435223026283023
28403242
28424122
1716122212
23272529
3029199
2326381922
35402216
17261817
26204624
20316
1717
6151413
1827487522
Total
2,5002,4972,4652,4682,5652,5852,5622,5742,6772,5792,5802,606
2,4642,4762,4682,478
2,4632,4772,4782,460
2,4572,4542,4502,4632,468
2,4932,5282,5232,571
2,5772,5762,5652,557
2,5732,5732,5832,6622,562
2,5782,5852,5642,560
2,5612,5722,5652,565
2,5792,5722,5982,678
2,5732,5832,5582,5652,570
2,5592,5762,5902,596
2,6032,6122.6312,6582,602
Mone-
SBstock
11,25811,35811,43611,57411,79911,99012,31812,44612,56712,74112,80312,774
11,27111,30611,31711,345
11,36411,38711,40311,425
11,44311,48411,51511,54111,574
11,69211,69711,73711,782
11,83811,88211,90711,977
12,02712,11812,22012,27012,318
12,37612,42312,40412,433
12,46212,49712,52712,541
12,56712,60412,65112,694
12,73412,76512,78412,79312,801
12,80412,78912,78912,774
12,77412,76412.76512,76512,760
Treas-urycur-
rencyout-
stand-ing
2,5322,5322,6362,5412,5432,5472,5502,5722,5852,5992,6092,621
2,5312,5282,6332,531
2,5312,6312,6302,532
2,5302,5372,5382,5372,541
2,5392,5412,5402,541
2,5472,5452,5472,546
2,5482,6472,6482,5502,550
2,6522,5512,5632,574
2,5722,5732,5772,577
2,6852,6872,5902,593
2,5962 5962,6012,6052,607
2,6082,6112,6112,619
2 6212,6232.6252,6302,634
Moneyin cir-cula-tion
6,5436,3496,3996,3776,4266,4626,4476,4606,5246,6426,5556,561
6,4736,3716,3396,318
6,3486,3606,3516,372
6,4076,3766,3856,3766,377
6,3876,3836,3886,381
6,4266,4056,3996,399
6,4876,4356,4156,3946,447
6,5246,4576,4366,424
6,4686,4826,5006,495
6,5326,5976,5546,529
6,5206,5696,5856.5466,519
6,5656,5646,5346,554
6,5686,5916.5966,6816,571
Treas-urycashhold-ings
2,376'2,5202,6082,7532,9673,1443,4453,5863,7203,5823,6613,631
2,3952,4392,4632,503
2,5292,5632,5752,602
2,6202,6722,6972,7232,753
2,7742,8762,9142,956
3,0133,0663,0793,140
3,1823,2543,3483,3963,445
3,5113,5503,5273,576
3,6053,6403,6723,683
3,7193,7563,4953,537
3,5753,6103,6343,6543,666
3,6623,6483,6333,626
3,6273,' 6223,6203,6253,620
Treasurydeposits
withFederalReservebanks
244195194311887393
233139141114121
232190188180
176132162180
21618687
279311
27511211995
97• 106
11780
11585
25015193
10190
184228
309253156161
156130348193
14076838294
111139135113
177242232153140
Non-mem-ber de-posits
259281288236288272285301337374472465
278308312315
286310300302
280238243326236
247236245270
286237250261
255'279267324285-
285275258305
320327340356
337314313362
369421458479485
482483503485
446419470413
OtherFed-eral
Reserveac-
counts
261260253258257255260258257265263261
261261261259
261269256255
253254261260258
258258259258
257257256256
256255263263260
258258258253
258259258258
256257266266
266265264264264
263263262261
9fi1262270269269
Member bankeserve balances
Total
6,6066,7816,695
S'«?6,8816,9156,9006,7536,7517,0146,9286,962
6,6276,7406,7556,770
6,7586,7716,7686,705
6,6606,7496,8306,5786,639
6,6846,9016,8776,934
6,8826,9436,9186,944
6,8546,9296,8086,8546,900
6,8276,9286,8586,776
6,6366,6316,7446,730
6,7316,7106^8656,977
7,0337,0036,9196,9396,951
6,8896,8796,9226,949a Qf\aD, m)\6,8366.8846,8556,983
Excess(esti-
mated)
1,9842,1522,0781,3981,594
918865791773
1.0381,0551,169
2,0102,1032,1302,160
2,1502,1842,1862,097
]:
:
1,3101,3801,4491,2691,398
1,4421,6271,6871,643
887036907938
860931752814865
875964874813
704740782761
750756880
1,020
1,0621 090*992
1,0211,073
1,0461,0661,1001,138
i noIf XIV1,0521,0571,0071,157
1 Includes industrial advances.NOTE.—For description of figures in this table and discussion of their significance, see BULLETIN for July 1935, pp. 419-429. Reprints of article,
together with all available back figures, may be obtained upon request from Division of Research and Statistics. Back figures are also shown inAnnual Report for 1936 (tables 3 and 4) and for excess reserves in BULLETIN for August 1035, pp. 499-500. Averages of daily figures for recentmonths and years are shown in the table on p. 9.
Digitized for FRASER http://fraser.stlouisfed.org/ Federal Reserve Bank of St. Louis

JANITART 1938 FEDERAL RESERVE BULLETIN 21
PRINCIPAL ASSETS AND LIABILITIES OF ALL FEDERAL RESERVE BANKS[In thousands of dollars]
Wednesday figures
1937
Dec. 29 Dec. 22 D e c 15 Dec. 8 Dec. 1 Nov . 24 Nov . 17
E n d of month
1937
N o v . Oct.
1936
N o v .
ASSETS
Gold certificates on hand and doe from U. S.Treasury .
Redemption fund—F. R. notes— I_.I"Other cash „ .. „„„_„
9,120,3919,913
330,644
9,120,390 9,121,907 9,121,907— " " - — 9 688
311,2829,912
283,3668,920
313,180
9,121,905 9,122,402 9,123,8989,787
322,2649,940
319,1839,287
325,221
9,122,4089,940
318,036
9,124,892 8,799,020
314,25511,407
237,476
Tota l reserves. 9,460,848 9,413,668 9,444,007
Bills discounted:For member banksFor nonmember banks , etc. . . .
12,847 16,121 15,771
9,442,877
17,3882
9,453,956
17,0312
9,451,525 9,458,406 9,450,384 9,448,529 9,047,903
15,8612
18,6942
16,5842
20,8622
6,146503
Tota l bills discounted _ 12,847
Bills bought :Payable in foreign currencies.
Indust r ia l advances2,827
18,291
16,121
2,82518,380
15,772
2,82518,432
17,390
2,82518,450
XJ. S. Government securities:BondsTreasury notes .*Treasury bills -
751,5391,154,997 1
657,479
751,539., 154,997
657,479997 1,
771,5391,134,997
657,479
738,073,168,463657,479
17,033
2,82818,464
738,0731,168,463 1
657,479
15,863
2,82818,589
738,073, 168,463 1,657,479
18,696
2,83119,256
738,073,168,463648,179
16,586 20,864 6,649
2,82818,557
738,0731,168,463
657,479
2,83219,414
3,08725,828
738,0731,158,463 1,
629,654
381,326,449,163599,738
Total Government securities,.Other Reserve bank credit-
2,564,015 2,564,015 2,564,015 2, 564,015 2,564,015 2,564,015 2,554,715 2,564,015 2,526,1903,577 56,533 29,633 9,008 495 -5 ,632 -5 ,102 4,458 10,976
2,430,227-12,734
Total Reserve bank credit outstanding....
LIABILITIES
F . R . notes in actual circulation
Deposits:Member bank—reserve account __U. S. Treasurer—general accountForeign bank _Other deposits _
2,601,557 2,657,874 2,630,577 2,611,688 2,602,835 2,595,763 2,590,396 2,606,444 2,580,276 2,463,057
4,283,385 4,346,383 4,293,307 4,294,885 4,279,489 4,264,829 4,249,618 4,273,526 4,278,921
6,982,752 6,854,904 6,884,407 6,836,282 6,906,472 6,948,927 6,922,400 6,961,735 6,927, 591Ho, Vbo258,775212,798
139,604172,634239,983
152, 593188,837280,868
231,540216,438202,583
241,843225,938219,700
176,637272,492186,855
113,302270,068214,742
135,165266,227237,178
121,300271,662193,161
4,198,618
6,788,055J 78,377
57,489143,879
Tota l depos i t s . . 7,634,973 7,477,2027,534,968 7,523,763 7,542,456 7,547,039 7,560,970 7,647,868 7,513,1307,067,800
Ratio of total reserves to deposit and F. R. noteliabilities combined (percent) 80.1 79.6 79.8 79.9 80.0 SO.O 80.1 79.9 80.1 80.3
MATURITY DISTRIBUTION OF BILLS AND U, S. GOVERNMENT SECURITIESHELD BY FEDERAL RESERVE BANKS
[In thousands of dollars]
Total Within15 days
16 to 30days
31 to 60days
61 to 90days
91 daysto 6
months
6 monthsto
lyear
1 yearto
2 years
2 yearsto
5 yearsOver
5 years
Bills discounted:Dec. 1Dec. 8Dec. 15Dec. 22__Dec. 29__
Bills bought in open market:Dec. 1 -Dec. 8..Dec. 15_.Dec. 22Dec. 29 _
Industrial advances:Dec. 1Dec. 8_Dee. 15 —Dec. 22Dec. 29
tr. S. Government securities:D e c lDec.8_Dec. 15Dec. 22Dec. 29
17,03317,39015,77216,12112,847
2,8282,8252,8252,8252,827
18,46418,45018,43218,38018,291
2,664,0152,564,0152,564,0152,564,0152,564,015
14,88915,34913,32613,06110,697
586767
1,545
4783S1826914395
1,4511,269
604625434972582
1,0911,037921
1,3051,334
33,10346,08349,01126,33324,385
438
244596563271302
41,78326,33324,38527,72033,296
174173268400
751799758684677
57,681141,93263,92666,47168,350
383275428426414
791615
1,1071,2881,989
802392515471438
147,81670,582180,299240,424265,085
645727717707728
1,3671,3861,4461,6041,431
414,467426,720415,784389,907381,170
3,6663,3173,3663,4923,490
329,712312,912252.476235,326213,895
4,8045,3845,5145,4625,602
211,298211,298275,189283,389
5,7395,5395,3495,2915,217
640,915640,916582,239593,739
687,240687,240720,706700,706700,706
Digitized for FRASER http://fraser.stlouisfed.org/ Federal Reserve Bank of St. Louis

22 FEDERAL RESERVE BULLETIN JANUARY 193&
ASSETS AND LIABILITIES OF THE FEDERAL RESERVE BANKS, BY WEEKS[In thousands of dollars]
ASSETS
Gold certificates on band and duefrom U. S. Treasury:
Dec. 1Dec. 8Dec. 15 — .Dec. 22Dec. 29
Redemption fund—Federal Re-serve notes:
Dec. 1Dec. 8Dec. 15Dec. 22..Dec. 29
Other cash:Dec. 1Dec. 8Dec. 15Dec. 22Dec. 29
Total reserves:Dec. 1Dec. 8Dec. 15Dec. 22Dec. 29
Bills discounted:Secured by U. S. Government
obligations direct or fullyguaranteed:
Dec. 1Dec. 8Dec. 15Dec. 22Dec. 29
Other bills discounted:Dec. 1Dec. 8Dec. 15Dec. 22Dec. 29
Total bills discounted:Dec. 1Dec. 8Dec. 15Dec. 22Dec. 29
Bills bought in open market:Dec. 1Dec. 8Dec. 15Dec. 22Dec. 29..
Industrial advances:Dec. 1 _Dec. 8Dec. 15Dec. 22.Dec. 29
V. S. Government securities:Bonds:
Dec. lDec. 8Dec. 15Dec. 22Dec. 29
Treasury notes:Dec. 1Dec. 8Dec. 15Dec. 22Dec. 29
Treasury bills:Dec. 1Dec. 8Dec. 15Dec. 22 _Dec. 29 ._
Total U. S. Government securities:Dec. 1 _____Dec. 8.Dec. 15Dec. 22 _Dec. 29
Total
9,121,905 478,990 3,559,741 481,9389,121,907 502,622 3,504,112 488,1849,121,907 522,856 3,458,263 499,2279.120,390 505,902 3, 542,410 489,3219.120,391 509,298 3, 556,816 490,479
9,7879,6888,9209,9129,913
322,264311,282313,180283,366330, 544
9,453,956 511,394 3,638,733 505,2169,442,877 534,466 3,583,648 508,7389,444,007 554,951 3,537,089 520,1349,413,668 535,626 3,612,756 509,1489,460,848 542,433 3,638,388 514,385
12,07212,21012,00411,6999,340
4,9615,1803,7684,4223,507
17,03317,39015,77216,12112,847
2,8282,8252,8252,8252,827
18,46418,45018,43218,38018,291
738,073738,073771, 539751,539751, 539
1,168,4631,168,4631,134,9971,154,9971,154,997
657,479657,479657,479657,479657,479
2,564,0152,564,0152,564,0152,564,0152,564,015
Bos-ton
908907865850850
31,49630,93731,23028,87432,285
1,208816851
495246150110150
1,3231,454
966961846
205205205205205
2,8422,9222,8812,8732,872
53,77053,77056,20854,75154,751
85,12585,12582,68784,14484,144
47,89947,89947,89947,89947,899
186,794186,794186,794186,794186,794
NewYork
1,1,6191,4371,3181,318
77,36877,91777,389
80,254
3,1203,6503,9934,6333,596
457448312395258
3,577
4^3055,0283,854
1,0071,0041,0041,0041,006
4,6054,5994,5844,5834,577
212,930212,930222,584216,814216,814
337,095337,095327,441333,211333,211
189,679189,679189,679189, 679189,679
Phila-del-phia
752689689586
22,52619,86520,21819,24123,320
2,6392,3962,4392,281I t " "
493483716739673
3,1322,8793,1553,0202,559
293293293293293
3,6013,5853,6853,6753,645
62,42362,42365,25263,56163,561
95,99497,68597,685
55,60755,60755,60755,60755,607
739,704 216,853739,704 216,853739,704 216,853739,704 216,853739, 704 216,853
Cleve-land
675,916 317,031677,687,674,681
217,691709 315; 938 220,729566 315, 543 231,719"• --" "• 229,340305,824
676, 706 297, 524 230,093 1,758,076 284,300
873872806722722
24,37722,98622,32020,64925,151
701,166 338,450 233,396 1,799,731701,567 336, 723 235,743 1,815,966 296; 427 201J 848 302i 323710,692 336,357 246,718 1,817,700 300,566 200,752 301,634 200|
,.. s 297,161702,579 319,976 246,868 1, 799,438 299,011696,052 324,678 242,606 1
840635
1,027817678
175147139233231
1,015782
1,1661,050909
269269269
779767765762762
71,84771,84775,10473,15773,157
113,742113,742110,485112,432112,432
64,00264,00264,00264,00264,0C2
Rich-mond
667362853853
20,75020,11820,45218,00121,599
392546416415385
183243299234263
575789715649648
110110110110110
1,8091,7941,7831,7751,773
38,68738,68740,44239,39439,394
61,24761,24759,49260,54060,540
34,46234,46234,46234,46234,462
134,396 112,238134,396 112,238
249,591249,591249,591 134; 396 112; 2382 4 9 , 5 9 1 • - • - - • •
249,591134,396134,396
At-lanta
1,
l! 778; 889 285; 6331,762,174 284,111
1,6481,6471,6151,5671,568
14,05713,36713,38411,69915,207
2,6322,4512,0361,471521
1,9532,370883
1,441719
4,5854,8212,9192,9121,240
99
136127127127128
32,308
33,77532,89932,899
51,15051,15049,68350,55950,559
28,78028,78028,78028,78028,780
112,238112,238
Chicago
759,709 274,623776,369 281,979
421404332761761
39,60139,19338,47934, 25940,601
290,479 198,358 303,621
.817,,797,194
255200220125150
851091127982
340309332204232
353353353353353
753753750750705
81,17381,17384,85482,65582,655
128,508128,508124,827127,026127,026
72,31072,31072,31072,31072,310
281,991281,991281,991281,991281,991
St.Louis
189,282 268,42C— """267,800
841839821806806
15,01513,60914,11212,24413,905
197,239 290,818194,681 292,226
510160303312734
22151513
532175318325735
7878787878
239237239237237
32,37932,37933,84732,96932,969
51,26051,26049,79250,67050,670
28,84428,84428,84428,84428,844
112,483112,483112,483112,483112,483
Min-neap-olis
.88,737 281,402
.92,664 280,630
.91,691 278,19589,282 7 " ' ~.85,417
468461453453
9,1528,7168,6007,5048,811
214212253249179
264262303284179
5454545454
663655642638
23,89523,89524,97924,33224,332
37.82937,82936,74537,39237,392
21,28521,28521,28521,28521,285
83,009
Kan-sas
City
787662
554554
22,14121,61723,37721,84423,872
203, 918199,993J00,632L97, 675.97,304
139279214297352
703739759797900
8421,018973
1,0941,252
8080808080
477477465464464
36,05836,05837,69436, 71736,717
57,08557,08555,44956,42656,426
32,12032,12032,12032,12032,120
83,009 125,26383,009 125,26383,009 125,26383,009 125,263
125,263
Dallas
.90,070
.86,976
.87,36085,946.84,191
261260251245245
13,58712,75713,02111,48412,868
28226216217257
18116312512741
46342528729998
80
8080
1,005998970968966
28,70928,70930,00929,23129,231
45,44845,44844,14844,92644,926
25,57'25,57<25,57^25, 5?25, 57-
99,73:99,73:99,7399,7399,73
SanFran-cisco
696,057693,995684,965682,979679,691
1,2431,2401,2191,1971,197
32,19430,20030,59828,53932,671
729,494725,435716,782712,715713, 559
385373328290285
55510
38537S333295295
200200200200200
1,5301,5281,528.1,5241,524:
63,89466,79165,05965,059*
101,151101,15198,254,99,986-99,986.
56,91756,91756,917"56,91756,917
221,962221,962221,962!221,962;221,962;
Digitized for FRASER http://fraser.stlouisfed.org/ Federal Reserve Bank of St. Louis

JANUAKT 1938 FEDERAL RESERVE BULLETIN 23
ASSETS AND LIABILITIES OF THE FEDERAL RESERVE BANKS,BY WEEKS—Continued
[In thousands of dollars]
Total Bos-ton
NewYork
Phila-del-phia
Cleve-land
Rich-mond
At-lanta Chicago St.
LouisMin-neap-olis
Kan-sas
CityDallas
SanFran-cisco
ASSETS—Continued
Total bills and securities:Dec. 1Dec. 8Dec. 15Dec. 22Dec. 29
Due from foreign banks:Dec. 1Dec. 8Dec. 15Dec. 22Dec. 29
Federal Reserve notes of otherbanks:
Dec. 1Dec. 8Dec. 15Dec. 22Dec. 29
Uncollected items:Dec. 1Dec. 8Dec. 15Dec. 22Dec. 29
Bank premises:Dec. 1Dec. 8Dec. 15Dec. 22Dec. 29
All other assets:Dec. 1Dec. 8. .Dec. 15Dec. 22Dec. 29
Total assets:Dec. 1Dec. 8Dec. 15Dec. 22 _.Dec. 29
LIABILITIES
Federal Reserve notes in actualcirculation:
Dec. 1 ,Dec. 8Dec. 15Dec. 22Dec. 29
Deposits:Member bank—reserve ac-
count:Dec. 1Dec. 8Dec. 15Dec. 22Dec. 29
U. S. Treasurer—general ac-count:
Dec. 1Dec. 8Dec. 15Dec. 22Dec. 29 _
Foreign bank:Dec. 1Dec. 8Dec. 15Dec. 22Dec. 29
Other deposits:Dec. 1Dec. 8Dec. 15Dec. 22Dec. 29
2,602,340 191,1642,602,680 191,3752,601,044 190,8462,601,341 I2, 597,980
748,893 223,879749,405 223,610
190,833190,717
749,597 223,986750,319749,141750,319 223,841
178181181181179
25,78426,31423,35821,62925,740
670,245569,040774,034681,498685,237
45,26845, 26945,28445,25145,235
44,16146,22336,06636,95637, 802
547451459466411
69,16156,56270,92263,17371,414
3,0063,0063,0063,0063,001
2,6372,6872,0362,1092,129
223,350
1818181818
5,9678,4025,9474,1444,546
169,390135,667193,335166,892177,089
- 9,9699,9699,9699,909
12,94013,21510,69310,83311,169
817811901906
1,281
52,74547,37960,23457,61158,904
4,8364,8364,8364,8364,826
4,9026,4184,2054,4904,607
251,654251,409251,791251,672251,531
1616161616
1,2811,2461,4521,8271,401
61,89452,26479,94061,668
6,2286,2286,2286,2156,215
4,6774,7233,8723,9364,022
12,841,932 777,922 4,585,96012,732,584 788,560 4,500,377 '12,923,974 822,233 4, 506,701 814,314
[36,890137,089[37,00436,930.36,927
8
3,3841,9471,6161,1722,316
60,97751,04764,36556,39252,416
2,7092,7092,7092,7002,700
2,6632,7002,2432,2202,294
545,081
17,05817,285.15,38315,37613,705
2,3941,9132,0122,2043,107
22,64520,11629,23026, 81523,490
2,1982,1982,1982,1952,195
1,6981,7041,3281,3591,390
379,395
283,437283,406283,426283,298283,281
2121212121
3,1473,333
12, 800,12,853,
524 795,226 4, 554,984021 810,118 4,590,371
-, ' 792,413 1,026,916 I .4,500,377 791,810 1,017,453 532,223 378,965J 814,314 1,053,991 544,302 396,875
800,850 1,021,386 524,100 390,561807,371 1,035,703 516,637 390,761
4,279,489 285,1514,294,885"4,293,3074,346, 3834,283,385 285,83!
2S8,739288,026290,003
954,736948,653
319,791322,903
955,207 323,4119C6,056 325, 720953,606 320,375
213,703214,340
433,149438,519: .437,549 213,210444,657 r436,919
217,856211,833
162,773162,721163,233166,740162,016
2,9484,219
85,56773,942107,03192,46090,043
4,5994,5994,6014,6014,601
4,0624,1173,1623,2653,332
2,180,564' 185,3842| 219,8292,183,787" 184,935
OSS, 778992,066989, 545
1,002,134994, 662
13,33212,97313,11813,12313,533
1,8372,0011,7222,2421,768
27,42326,70933,70031,76529,433
2,3452,3452,3452,3452,344
1,6461,6741,2981,3301,347
t37,065[42,132152,752147,969147,439
80,738SO, 991.81,85484, 536.82, 765
84,015
84,02183,98983,880
22222
1,522782855
1,1951,820
20,62216,75621,38020,58918,022
1,5081,5091,5221,5221,522
1,5371,5511,2641,2991,310
307,564306,436309,796305,835301,237
38,68439,095.38,431.40,012.37,965
.26,662
.26,838,26, 78126,90127,059
55555
9921,5381,6461,6321,135
37,22231,93038,60935,08132,281
3,1593,1593,1593,1593,159
1,8951,9131,5261,5651,600
173,556t67,706173,360159,161157,465
01,27901,23401,06801,07800,875
55565
504502542604785
24,85924,07029,45828,87826,307
1,3561,3561,3561,3571,357
1,6341,5901,2751,3381,336
333,555328,750334,336330,935327,969
6,906,472 372,568 3,018,691352,74'6,836,282 395,158 2,938,379 347,490
"- I 2,980,729 353, """2,986,485 357,849
6.884,40'6,854,904 396; 4006,982,752 406,079 3,04l | 232 373,430
452,611449,407450,042449,083
231,421224, 51:215,12:
465,906 219,012
167,628169,063
. L 172,435216,809 171,739
2 178,060
1,006,4001,006,48:1,012,68'
197,782 125,254204,440 !200,042
998,856 203,250,006,555 204,582
129,19:125,95123,62124,77S
68,30768,84:68,50:70,19368,424
240,280240,754237,18'234,679234,934
89,40'89,23488,19089,30287,039
192,34187, 55S189,606185,457187, 987
176, 63:241, 843231, 540152,593139, 604
272, 492225,938216,438188,837172, 634
186,855219,700202,583280,868239,983
4,0934,211
18,24'5,5775,712
19,83116, 38515,75413,78012,5S7
2,5582,7433,9174,1184,070
92,101111,65629,44219,99742,021
98,00082,51478,53968, 21362,453
133,382168,422158,578238,164197,449
3,13613,36021,307
7,4242,390
26,62321,99621,14918,50016,898
5,2904,9682,0921,9492,259
10,99617,30336,84218,90112,601
24,99320,65019,85417,36"15,863
10,8247,5703,6703,0302,956
10,31815,29026,80313,8598,729
11,6829,6519,2808,1177,41£
3,3943,3433,3952,9733,000
3,0904,484
12,8129,0176,234
9,5087,8567,5536,6076,035
2,03e2,0212,28:1,9612,491
20,54239,97741,10133,88726,744
31, 51226,03e25,03221,89720,002
l,50S1,2201,6751,22-1 , "
6,1566,145
13,7787,0607,067
8,1506,7346,4745,6635,173
5,1315,7845,6425,8515,21!
5,513,8277,7026,6824,156
6,2455,1624,9644,3423,96(
2,62C3,3512,8713,0922,958
9,0739,897
13,8355,8326,685
7,87£6, SOS6,25£5,4^5,00C
31'375446348342
3,3S76,7284,1178,18:3,35:
7,8786,5096,25$5,4745,0OC
1,8252,0352,9242,5832,74£
224,077224,068224,023223,981223,981
1313131313
3,3923,3882,3182,2892,951
37,74032,59845,83040,17435,899
3,3553,3553,3553,3463,346
3,8703,9313,1643,2123,266
001,941992,788995,4859S5,730983,015
344, 275345, 783346f 149349,174341,949
548,740543,847547,515530,676540,197
8,2298,9655,55716,17013,914
19,28815,93615,32213,40312,242
17,97217,86815,09515,55815,134
Digitized for FRASER http://fraser.stlouisfed.org/ Federal Reserve Bank of St. Louis

24 FEDERAL RESERVE BULLETIN JANXTABT 1938
ASSETS AND LIABILITIES OF THE FEDERAL RESERVE BANKS,BY WEEKS—Continued
[In thousands of dollars]
Total Bos-ton
NewYork
Phila-del-phia
Cleve*land
Rich-mond
At-lanta Chicago St.
LouisMin-neap-olis
Kan-sas
CityDallas
SanFran-cisco
LIABILITIES—Continued
Total deposits:Dec. 1_Dec. 8Dec. 15Dec. 22Dec. 29
Deferred availability items:Dec. 1_Dec. 8Dec. ISDec. 22 _Dec. 29
Capital paid in:Dec. 1Dec. 8Dec. 15Dec. 22.Dec. 29
Surplus (section 7):Dec. 1 _.Dec. 8Dec. 15Dec. 22Dec. 29
Surplus (section 13b):Dec. 1Dec. 8Dec. 15Dec. 22Dec. 29
Reserve for contingencies:Dec. 1Dec. 8Dec. 15Dec. 22Dec. 29
All other liabilities:Dec. 1Dec. 8Dec. 15Dec. 22Dec. 29_._
Total liabilities:Dec. 1 _...Dec. 8Dec. 15. _„ .Dec. 22 _Dec. 29
Contingent liability on bills pur-chased for foreign correspond-ents:
Dec. l _Dec. 8Dec. 15Dec. 22Dec. 29
Commitments to make industrialadvances:Dec. 1 _Dec. 8 _ _Dec. 15Dec. 22Dec. 29
7,542,456 399,050 3,343,074 387,7967,523; 763 418,497 3,300,971 387,8147,534,968 437,544 3,247,288 398,0147,477,202 419,875 3,312,859 385,7227,534,973 428,448 3,343,155 394,977
499,424 .494,930 252,797
256,819 182,262 1,059,964-' 1,073,714
1,080,493241,758 189,330 1,055,867
497; 326 238,156 192,826 1,054,662
510,408 254,599 195,081488,381 "" "
669,928560,213744,682625,146681,839
132,518132,534132,550132,619132,737
145,854145,854145,854145,854145,854
27,61527,61527,61527,61527,615
35,73435,73335,69735,67335,673
8,33811,9879,30110,03210,945
69,57555,30972,43761,06971,454
9,3839,3839,386
9,8269,8269,8269,826
2,8742,8742,8742,8742,874
1,5701,5701,5701,5701,570
4932,362573626728
166,374129,123182,176154,006171,116
51,04551,05351,04951,05651,059
51,47451,47451,47451,47451,474
7,7447,7447,7447,7447,744
9,1179,1179,1179,1179,117
2,3962,2422,6462,6723,100
51,12045,82459,10055,29257,839
12,26212,26212,26212,25812,258
13,36213,36213,36213,36213,362
4,32,4,3254,3254,3254,325
3,0003,0003,0003,0002,999
7572,320839
1,1711,236
62,22951,82373,79756,05169,024
12,94612,94712.95812.95913,036
14,32314,32314,32314,32314,323
1,0071,0071,0071,0071,007
3,1213,1213,1213,1213,121
717783828887947
59, 58550,08161,49049,43851, 564
4,8854,r~4,8874,8884,896
4,14,J4,8694 , r "4,!3,4223,4223,4223,4223,422
1,4971,4971,4961,4971,497
301331329372400
21,49419,94025,65721,59623,002
4,3924,3904,3914,4024,400
5,6165,6165,6165,6165,616
754754754754754
1,7151,7151,7151,7141,715
405428409432
86,95674,673104,80780,68090,449
12,90212,90312,90512,90712,920
21,50421,50421,50421,50421,504
1,4161,4161,4161,4161,416
7,6947,6947,C"7,<7,666
1,3501,4141,4931,6131,656
217,219223,103225,936221,832222,034
28,56427,44934,38830,99532,007
3,8433,8493,8563,867
139,638141,531141,488137,737135,858
19,83016,34520,40118,60717,928
2,8922,892
4,6554,6554,6554,6554,655
545545545545545
1,1751,1741,1741,1741,174
326366344365391
2,8932,893
3,1163,1163,1163,1163,116
1,0031,0031,0031,0031,003
2,0202,0202,0132,0132,013
381434451454461
257,545257,535257,723246,333246,961
37,71531,31237,05032,51131,926
4,0704,0704,0734,0834,084
3,6133,6133,6133,6133,613
1,1421,1421,1421,1421,142
941941941941941
223252317345374
205,436202,831202,905201,701199,083
27,56725,54732,10828,75630,623
3,8773,8773,8773,8773,891
3,8513,8513,8513,8513,851
262262262262262
,847,847,8471,8471,847
311301296339373
594,229586,616583,486575,807581,487
38,91932,78741,27136,14534,907
10,02110,02210,01610,04610,046
9,6459,6459,6459,6459,645
2,1212,1212,1212,1212,121
2,0372,0372,0372,0132,013
777757779847
12,841,932 777,922 4,585,960 792,413 1,026,916 545,081 379,395 2,180,5641,017,453 532,223 378,965 2,185,3841,053,991 544,302 396,875 .1,021,386 524,100 390, 5611,035,703 516,637 390,761
12,732,584 788,560 4,500,377 79lj 81012,923,974 822,233 4,506, 701 814, "12,800,524 795,226 4, 554,984 800,12,853,021 810,118 4,590,371 807,371
437,065 307,564', , 442,132 306,436 467,706 328,750
544,302 396,875 2,219,829 452,752 309,796 473,360 334,336"' 2,183,787 447,969 305,835 459,161 330,935
2,184,935 447,439 301,237 457,465 327,969
473,556 333,555 1,001,941992,788995,485985,730983,015
I,1,1,7851,6801,""
13,24913,13712,95512,84112,780
138138138123123
1,7711,7641,7341,7221,706
682476579606623
4,7754,7744,6124 , • • •
4,555
185185185165165
136141141143173
174174174154154
'812805833761753
1,6581,6571,6511,6401,634
350350350350345
219219219195195
183181176176176
114112112112111
269269269269
134134134119119
3,1203,0233,0163,0093,007
Digitized for FRASER http://fraser.stlouisfed.org/ Federal Reserve Bank of St. Louis

JANUABT 1938 FEDERAL RESERVE BULLETIN 25
INDUSTRIAL ADVANCES AND COMMITMENTS UNDER SECTION 13b OF THE FEDERALRESERVE ACT, JUNE 19, 1934, TO DECEMBER 29, 1937
[Amounts in thousands of dollars]
Date (last Wednesday ofeach month)
Applicationsreceived to date,
net
Number Amount
Applications rec-ommended forapproval by In-dustrial Advi-sory Commit-tees to date(with and with-out conditions)
Applications approved to date by Federal Reserve banks (with andwithout conditions)
Total
Number Amount Number Amount
FederalReserve
bankadvances
out-standing
FederalReserve
bankcommit-mentsout-
standing
Approvedbut not
com-pleted*
Expired,repaid,or with-drawn by
appli-cant,etc.
Financ-ing insti-
tutionpartici-pations
out-standing3
1936-July 29Aug. 26..Sept. 30 ,Oct. 28 _Nov. 25Dec. 30 ,
1937-Jan. 27.Feb. 24 . „ _Mar. 31Apr. 28May 26 >_June 30July 28Aug. 25Sept. 29Oct. 27Nov. 24 _.Dec. 29
8,1978,2408,2848,308
8,379
8,4278,4838,5108,5248,5468,5548,5728,5938,6068,6338,677
331,659333,930336,119336,763339,903342,699342,999343,904346,911348,342349,288351,420352,024352,666354,426354,872359, 706363,292
2,4132,4372,4632,4772,4832,5002,5062,5172,5432,5632,5772,5872,5902,5982,6102,6182,6242,640
143,978145,939147,191148,237148,317149,204149,527149,711150,561152,724153,720154,960155,023155,514155,902156,413156,533158,743
2,1982,2182,2432,2592,2662,2802,2872,2972,3232,3362,3532,3612,3672,3732,381
2,3922,406
134,233135,421137,251138,731138,938139,829140,213140, 515141,545144,564145,228145,768145,887146,457146,724147,295148,208150,987
30,21729,26528,88527,03826,72025,53324,78124,20823,05423,90423,19623,01422,46221,75221,39520,87520,61620,200
23,71123,35523,30722,79022,04020,95920,23819,52318,61117,52817,18816,33115,72615,17914,88014,48813,31612,780
8,4299,1688,5668,5447,7198,2267,6977,7097,8989,0458,4621,4701,0981,151
534899
1,3823,369
64,34266,30469,21772,91575,04577,90380,50082,16385,21586,80689,26897,66899,271
101,139102,611103,806105,749109,400
7,5347,3297,2767,4447,4147,2086,9976,9126,7677,2817,1147,2757,3307,2367,3047,2277,1457,238
* Includes applications approved conditionally by the Federal Reserve banks and under consideration by applicant.* Does not include financing institution guaranties of advances and commitments made by Federal Reserve banks, which amounted to
$11,168,763 on December 29,1937.NOTE.—On December 29,1937, there were 46 applications amounting to $3,583,250 under consideration by the Industrial Advisory Committees
and the Federal Reserve banks.
FEDERAL RESERVE NOTES—FEDERAL RESERVE AGENTS* ACCOUNTS, BY WEEKS[In thousands of dollars]
Total Bos-ton
NewYork
Phila-del-phia
Cleve-land
Rich-mond
At-lanta
Chi-cago
St.Louis
Min-neap-olis
Kan-sas
CityDallas
SanFran-cisco
Federal Reserve notes:Issued to F . R. bank by F . R . agent:
Dec. 1Dec. 8Dec. 15Dec. 22Dec. 29 „_
Held by Federal Reserve bank:Dec. 1Dec. 8Dec. 15_.._ _Dec. 22Dec. 29 _
In actual circulation;!Dec. 1Dec. 8..Dec. 15.Dec. 22Dec. 29
Collateral held by agent as security fornotes issued to bank:
Gold certificates on hand and duefrom U. S. Treasury:
Dec. 1Dec. 8 __Dec. 15 _ „ .Dec. 22 _ _Dec. 29
Eligible paper:Dec. 1Dec. 8Dec. 15Dec. 22Dec. 29
U. S. Government securities:Dec. 1 -Dec. 8Dec. 15Dec. 22Dec. 29
Total collateral;Dec. 1Dec. 8.Dec. 15 -Dec. 22 _Dec. 29
4,623,6034,665,9624,669,1984,709,9224,683,094
344,114371,077375,891363, 539399,709
4,279,4894,294,8854,293,3074,346,3834, 283,385
4,645,6324,690,6324,705,6324,730,6324,735,132
16,45016,67714,80115,11811,950
20,00020,000
335,848339,506336,366336,759328,956
50,69750,76748,34046,75643,124
285,151288,739288,026290,003285,832
,064,619, 079,529,084,993,094,666,091,838
109,883130,876129,786128,610138,232
954,736948,653
[61,148 226,780t65, 572 227,085
335,406338,938 4 ,343,502 464,540 226,963343,982 4341,969
i68,191167,997 227,
231,676"",487
15,61516,03520,09018,26221,594
319,791322,903
955,207 323,412966,056 325,720
341,000341,"*341,341,341,
000 1,000 1,000 I000 L
1,3231 435893894784
953,606
1,070,000\ 080,000i, 090,000., 100,000.,100,000
3,5174,0234,2754,9973,812
320,375
27,99927,05326,99123,53431,078
133,149138, 519137,549144,657L36,919
13,07712,74513,75313,82015,654
213,703214,340213,210217,856211,833
337,000 462,500342,000 466,500 228,000
227,000228,000228,000347,000 466,5001 ,
347,000 471,500 232,000347,000 ^
.81,792S2,2S482,569.84,90784,486
19,01919,56319,33618,16722,470
162,773162,72163,233.66,740.62,016
.62,000162,000162,000166,000
014,391021,273020,288037,197030,395
25,61329,20730,74335,06335,733
988,778992,066989,545002,134994,662
.94,317
.95,44194,674.97,600.07,474
13,57914,45012,82013,06414,709
L80,738180,991.81,854.84,53682,765
1020,000,040,000,040,000
471,500 228,000 166,000
200,632200,632
. . (200,632,040,000 200,632056,000 200,632
2,9742,6752,7012,5812,161
1,015777
1,161945804
560789715649648
340284306204232
20,00020,00025,000
4,682,0824,727,3054,740,4334,765,75C4,772,082
1,073,51"1,084,"
342,323342,435 . .341.893 1,094,275 349,341.894 1,104,997 ' "341,784 1,103,812
339,974023 344,675
. . ',701894 1,104,997 349,581
349,161
463,515467,277467,661472,445 232; 64!
227,560228,789228,715
4,3494,5482,6592,6761,046
20,00020,00020,00020,00020,000
186,349 1,020,34C31,040.284
1,040,306
532175318325735
44,30144,243.44,446.44,765.43,595
5,6175,1486,0154,7535,630
.38,684
.39,095
.38,431
.40,012[37,965
L47,000L47,000147,000147,000140,500
17917720818S102
11,326.80,564179,911[81,260L79,153
9,01911,72311,41011,06710,729
[68,307168,841.68,501.70,193.68,424
80,00080,000.80,00082,000£2,000
813990945
1,0651,233
96,79298,08297,84497,91297,489
7,3888,8489,6548,610
10,450
390,883593,445393,102391,007392,255
46,60844,66246,95341, 83350,306
404 344,275348,783346,149
, !349,17487,039 341,949
89,23488,19089,302
99,500 399,00099,500 404,00099,500 404,00099,500 404,00099,500 404,000
46342628729998
385378333295295
5,00C
472,304 228,648
, ',179 180,812040.284 200,807 147,177 180,99C"'"• ~" 1147,208 180,945
147,188 183,065
186, 548 1,184,659 1 ,188,6761,040,204 200,957187,046
201,164 147,:200, £200,950
99,96399,92€99,78;
399,385404,378404,333
99,926 404,378
1,055,232 201,367 145,602 183,23399,799 404,29599,598 404,295
1 Includes Federal Reserve notes held by the United States Treasury or by a Federal Reserve bank other than the issuing bank.
Digitized for FRASER http://fraser.stlouisfed.org/ Federal Reserve Bank of St. Louis

26 FEDERAL RESERVE BULLETIN JANUARY 1938
RESERVE POSITION OF MEMBER BANKS,NOVEMBER, 1937
[Averages of daily figures. In millions of dollars]
Classes of banksand districts
All member banks. .
Central reserve city banks:New YorkChicago
Reserve city banks:Boston districtNew York districtPhiladelphia district-.Cleveland districtRichmond districtAtlanta districtChicago districtSt. Louis districtMinneapolis d i s t r i c t -Kansas City district...Dallas districtSan Francisco district.
Total
Country banks:Boston districtNew York districtPhiladelphia district..Cleveland districtRichmond districtAtlanta districtChicago districtSt. Louis districtMinneapolis d i s t r i c t -Kansas City d i s t r i c t -Dallas districtSan Francisco district.
Total
Grossde-
mandde-
posits
28,717
9,5322,144
944175
1,0301,386
620556
1,112683348922605
1,914
10,298
7801,196
573571500418781333302443501344
6,742
Netde-
mandde-
posits *
23,875
8,8321,892
843145861
1,142468423855544269669429
1,558
8,206
620938452428345291573237202285332242
4,945
Timede-
posits
11,555
850445
11115424973320317350917293
159117
1,852
4,525
5751,413
87466333221065223127615794
258
5,735
Reserves withFederal Reserve
banks
Re-quired
5,815
2,347519
17538
18727210695
20211959
14393
423
1,913
1212161161006853
1194745495249
1,036
Held
6,919
2,720588
21942
21731813410423814068
173107485
2,246
1462841441349465
1676061727960
1,365
Ex-cess
1,104
37369
444
3046289
37219
291462
333
246828342611481316232710
328
i Gross demand deposits minus demand balances with domestic banks(except private banks and American branches of foreign banks) andcash items in process of collection.
NOTE.—See table at foot of page 37, for percentages of deposits re-quired to be held as reserves.
MEMBER BANK RESERVE BALANCES,BY CLASSES OF BANKS
[Averages of daily figures. In millions of dollars]
Total reserves held:1936—October
NovemberDecember _.
1937—JanuaryFebruaryMarch»AprilMay*JuneJuly _AugustSeptemberOctober.November.
Week ending (Friday):Nov. 5Nov. 12Nov. 19Nov. 26Dec. 3Dec. 10_-__Dec. 17Dec. 24
Excess reserves:1936— October
November.December
1937—JanuaryFebruaryMarch» _.April __.May * __.JuneJulyAugustSeptemberOctoberNovember.
Week ending (Friday):Nov. 5 _Nov. 12Nov. 19Nov. 26Dec. 3Dec. 10Dec. 17Dec. 24
Allmem-
berbanks1
6,5946,7856,6656,7166,7476,7046,8246,9326,8786,8456,7016,8546,9546,919
6,9016,8786,9166,9546,9266,8516,887
2,0432,2192,046
2,1521,3711,552
927876876750900
1,0431,104
1,0601,0591,0991,1511,1331,066
PI, 052n,019
Central reservecity banks
NewYork
2,5742,695
2,7192,8122,6522,7392,6842,6692,6522,5222,6722,7672,720
2,7412,6852,7122,7502,7112,6212,6602,657
639751697767868401530203176199108235354373
377339367404374285291298
Chi-cago
637651605568546533563589603581568576581588
582580583593605606611585
20522117514712854
1015170523443
Re-servecity
banks
2,1532,1852,1572,1582,1282,2032,2012,2722,2302,2522,2482,2322,2402,246
2,2172,2332,2462,2612,2602,2632,2702,260
724675662651488490316289301287289307333
297317330356358363359351
Coun-try
banks*
1,2301,2541,2411,2711,2611,3151,3211,3861,3771,3601,3621,3751,3661,365
1,3611,3811,3741,3511,3501,3611,3461,336
502523498518505428431357341324321333323328
321341338318317329
P313P303
1 Weekly figures of excess reserves of all member banks and of countrybanks are estimates.
» Reserve requirements increased March 1,1937, and May 1, 1937; seetable at foot of page 37 for amount of changes.
p Preliminary.
DEPOSITS OF MEMBER BANKS IN LARGER AND SMALLER CENTERS[Averages of daily figures. In millions of dollars]
Federal Reserve district
All member banks
Gross demand
Nov. Oct.
Time
Nov. Oct,
Member banks in larger centers(places over 15,000)
Gross demand
Nov. Oct.
Time
Nov. Oct,
Member banks in smaller centers(places under 15,000)
Gross demand
Nov. Oct.
Time
Nov. Oct,
BostonNew York . . . .Philadelphia..ClevelandRichmondAtlantaChicagoSt. LouisMinneapolis-Kansas C i ty . .DallasSan Francisco.,
* Tota l . . -
1,72510,9041,6021,9561,120
9744,0371,021650
1,3651,1062,258
1,74511,1941,6281,9891,121984
4,0701,022
6491,3811,1102,286
6862,4171,1231,395
535383
1,606404369316211
2,110
2,4051,1321,395
537385
1,599403369317210
2,125
1,6021 1,101
1,3811,736
934835
1 1,594827470
1,039819
2,126
1,618i 1,121
1,4011,762
935847
U,611822468
1,052827
2,151
558i 1,075
6721,103
349302
1890292180200168
2,013
56411,078
6811,103
350304
1886290181201167
2,028
123271221221186139299194180326287132
128275227227185137304200181329283134
1284924502921S681
2711121881164396
12849645129218781
2691131891164397
28,717 29,179 11,555 11,569 l14,462 U4,616 17,804 17,832 2,578 2,611 2,456 2,462
* Excluding central reserve city banks, for which figures for latest month are shown in table above.
Digitized for FRASER http://fraser.stlouisfed.org/ Federal Reserve Bank of St. Louis

JANUARY FEDERAL RESERVE BULLETIN 27
KINDS OF MONEY IN CIRCULATION[Outside Treasury and Federal Reserve banks. In millions of dollars]
End of month
1936—September .__October
December
1937—January *. . . . . . . . . . . .FebruaryMarch .
May . . . . . .June —JulyAugust „ -Sept.GTTiber
November ~_~_
Total
6,2676,3516,4666,543
6,3496,3996,3776,4266,4626,4476,4606,5246,5426,5556,561
Goldcertifi-cates
98979695
9402919089888786868584
Silverdollars
37373738
3737373738383839393940
Silvercertifi-cates
9981,0201,0511,057
1,0121,0221,0221,0391,0621,0781,0881,1151,1271,1291,144
Treas-ury
notesof 1S90
1111
11111111111
Subsid-iary
silver
326329334337
329329333335338341341345348349352
Minorcoin
138139141142
140140141142143144144146147147148
UnitedStatesnotes
278282289289
276288287291289281286286284285284
FederalReserve
notes
4,0114,0764,1564,233
4,1184,1554,1394,1714,1894,1694,1764,2134,2224,2384,232
FederalReserve
banknotes
47464544
4241404038383736353534
Na-tionalbanknotes
332324316307
300294287281275269263258253248243
Back figures.See Annual Report for 1936 (table 36).
PAPER CURRENCY, BY DENOMINATIONS, AND COIN IN CIRCULATION[Outside Treasury and Federal Reserve banks. In millions of dollars]
End of monthTotalin cir-cula-tiom
Coin
Paper currency *
$2 $5 $10 $20$50 and over
Total $50 $100 $500 Sl.CCO $5,000 $10,000
Un-assort-ed*
1936—September.October...November.December.
1937—January...February.-MarchAprilMayJuneJulyAugustSeptember.October...November.
6,2676,3516,4666,543
6,3496,3996,3776,4266,4626,4476,4606,5246,5426,5556,561
501505513517
506506511514518523523529534535540
477484492499
472475476482489487488498503502504
33333335
3333333333343333333333
882900906
864874869883893885894907908909912
1,4881,5161,5481,563
1,5001,5191,5191,5421,5581,5391,5501,5741,5741,5761,574
1,4371,460;, 486,501
i,458,464,451,468,466,458,454.,466,467
1,4741,480
1,4671,4781,5011,530
1,5251,5381,5201,5071,5071,5261,5201,5201,5271,5311,525
383385390399
393395386381380384381382382384381
673679690707
702706696687689
702704701
130132132135
135135136137136138137137138138136
253255258265
269273275277278283283283285286287
47
8
910234524456
i Total of amounts of coin and paper currency shown by denominations less unassorted currency in Treasury and Federal Reserve banks.* Includes unassorted currency held in Treasury and Federal Reserve banks and $1,000,000 of currency of unknown denominations reported by
the Treasury as destroyed.Back figures.—See Annual Report for 1936 (table 37).
TREASURY CURRENCY OUTSTANDING[Held by Treasury and Federal Reserve banks and in circulation. In
millions of dollars]
SHIPMENTS AND RECEIPTS OF UNITEDSTATES PAPER CURRENCY
[By selected banks in New York City. In thousands of dollars]
End of month
1936—September.OctoberNovember.December..
1937—JanuaryFebrua ry -MarchAprilMayJuneJulyAugustSeptember.OctoberNovember.
Total
2,5122,5152,5212,532
2,5322,5362,5412,5432,5472,5502,5722,5852,5992,6092,621
Silverdollars
andsilverbul-lioni
1,2941,3031,3101,323
1,3321,3431,3551,3651,3751,3821,4091,4241,4411,4551,468
Sub*sid-iarysilver
341346351356
356356357357358359361363364367370
Minorcoin
143145146147
148149149150150151151152153154155
UnitedStatesnotes
347347347347
347347347347347347347347347347347
Fed-eralRe-
servebanknotes
•35
Na-tionalbanknotes
Year or month
339329322314
305298291284278272266262257251247
1932.1933.1934.1935.1936.
1936—No vember..December..
1937—JanuaryFebruaryMarchAprilMayJuneJulyAugustSeptember-OctoberNovember..
Ship-ments toEurope
567554345
10,62834,774
5,9608,469
2,0924,279
9681,434
9097,000
809877
1,946781336
Receiptsfrom
Europe
83,83891,05940,58719,96626,216
1,536745
2,1973,2653,7283,0231,8651,9722,5862.8392,2714,531
13,326
Netship-
ments
8,558
4,4247,724
1,014
5,028
Netreceipts
83,27190,50540,2429,338
105
2,7601,589
956
1,7771,962
3253,750
12,990
* Includes silver held against silver certificates amounting to $1,380,-000,000 on Nov. 30, 1937 and $1,211,000,000 on Nov. 30, 1936.
For description and back figures seepp. 7-9.
BULLETIN for January 1932,
Digitized for FRASER http://fraser.stlouisfed.org/ Federal Reserve Bank of St. Louis

28 FEDERAL RESERVE BULLETIN JANUARY 1938
ANALYSIS OF CHANGES IN MONETARY GOLDSTOCK
[In millions of dollars]
Year or month
1934
1936—November.December-
Year
1936—JanuaryFebruary __MarchAprilMayJuneJulyAugustSeptember-October-—November.December _
Year ; . . . .
1937—JanuaryFebruary._March ,AprilMay^_,June _,JulyAugustSeptember-OctoberNovember..
Gold stock atend of yearor month
TotalInactiveaccount
8,238
9,92010,125
10,125
10,18210,16710,18410,22510,40210,C0810,64810,71010,84511,04511,18411, 258
11,258
11, 35811,43611,57411, 79911,99012,31812,44612,56712,74112,80312,774
26.5
26.5
126.5204.7342.soao759.1
1,086.81,214.11,335. 71,210.01,271.91,242. 5
Increasein
totalgoldstock
4202.5
226.7205.2
1,887.2
57.2-15.5
17.241.0
176.7206.639.268.4
129.0199.7139.673.3
1,132.5
100.178.2
137.9225.6191.1327.8127.3121.6174.362.0
-29.3
Netgold
import
1,133.9
210.6190.0
1,739.0
45.6-16.6
5.528.1
170.0277.8
15.467.5
171.8218.8
75.857.0
1,116.6
121.3120.3154.3215.8155.4262.0175.4104.8145.590.522.1
Netreleasefromear-
mark
82.6
1.3
.2
- 1 . 7- 9 . 5
1.0- . 2
- 3 . 2-24 .8
2.3-11.9-28.8-11.3
3.0- . 7
-85.9
-48.3- 8 . 0- . 47.2
26.2-15.9-35.5- 5 . 3
9.3- 8 . 0
-20.1
Do-mes-tic
goldpro-duc-tion
96.3
9.611.5
110.7
9.28.49.69.6
10.410.012.813.112.113.811.810.9
131.6
9.48.1
10.68.9
12.111.012.516.612.014.6
*13.7
J» Preliminary.NOTE.—Figures for domestic production of gold are those published
In table, p. 57, adjusted to exclude production in Philippines. Adjust-ment based on annual figures reported by Director of Mint and monthlyimports of gold to 17. S. from Philippines. For back figures, other thanthose of domestic gold production, see Annual Keport for 1936 (table 30.)
BANK
Number of banks suspended:1934193519361937, Jan.-Nov
Deposits of suspended banks(in thousands of dollars):*
1934 .19351936.1937, Jan.-Nov
SUSPENSIONS1
Total,all
banks
67344456
36,93710,01511,30618,602
Memberbanks
Na-tional
1414
406,313
5077,158
State
2
1,707
Non-memberbanks
In-sured1
8224044
1,9123,763
10,2079,257
Notinsured
48836
34,985939692480
i Represents licensed banks suspended; does not include non-licensedbanks placed in liquidation or receivership.
* Federal deposit insurance became operative January 1, 1934.1 Deposits of member banks and insured non-member banks suspendedare as of dates of suspension, and deposits of non-insured non-memberbanks are based on the latest data available at the time the suspen-sions were reported.
Back figuret.—Bto Annual Report for 1936 (table 71).
MOVEMENT OF GOLD TO AND FROMUNITED STATES*[In thousands ot dollars]
From or to—
Belgium .„_ .France »-GermanyNetherlandsSwitzerlandUnion of Soviet
S o c i a l i s t He-publics
United Kingdom..CanadaCentral America. _,Mexico ,ArgentinaChile _ColombiaEcuadorPeru.. . .—UruguayVenezuelaAustraliaBritish IndiaChina and Hong
KongDutch East Indies.JapanPhilippine Islands.All other countries'.
Total
1937
November
Im-ports
33 25,001
15816331
2,308
4874,323
126178
1043,173
767
37,1482,286
100
52,194
Ex-ports
5,060
23
30,084
October
Im-ports
22,030
24,402
2902,313
1,1658
145149
492,0766,902
19,8821,376
252
90,709
Ex-ports
224
232
Jan.-Nov.
Im-ports
90,87026,278
6,46154,452
504896,713108,761
3,44535,835
118,897
18,3811,6132,882
53130,92750,655
1,556
227, 69623,136
1,598,490
Ex-ports
1225,001
5,14347
756
30,968
* Figures represent customs valuations which, with some exceptions,are at rate of $35 a fine ounce.
> Includes all movements of unreported origin or destination.Back figures.—See table p. 57, and Annual Report for 1936 (tables 32
and 33).
BANK DEBITS[Debits to individual accounts. Amounts in millions of dollars]
New York CityOutside New York City..Federal Reserve districts:
Boston. __New YorkPhiladelphiaClevelandRichmondAtlantaChicagoSt. LouisMinneapolisKansas CityDallasSan Francisco
Total..
Num-berof
centers
140
141
1937
Nov. Oct.
13,43218,160
1,96614,1191,4581,841
708846
4,694925633
1,086694
2,623
31,593
16,15119,923
1,98116,8831,6222,137
810952
5,0961,075
6911,200
7542,871
36,073
1936
Nov.
17,39418,475
35,869
Back figures.—See Annual Report for 1936 (table 67).
Digitized for FRASER http://fraser.stlouisfed.org/ Federal Reserve Bank of St. Louis

JAKTOABT 1938 FEDERAL RESERVE BULLETIN 29
ALL BANKS IN THE UNITED STATESComprises all national banks in the continental United States and all State commercial banks, trust companies, mutual and stock savings banks
and such private and industrial banks as are included in abstracts issued by State banking departments. Also includes, during the periodJune 1934-June 1935, private banks which, pursuant to the provisions of sec. 21 (a) of the Banking Act of 1933, submitted condition reports tothe Comptroller of the Currency. Under the amended provisions of Sec. 21 (a) private banks no longer report to the Comptroller of the Cur-rency, For comparative figures of private banks included in the figures from June 1934 to December 1935, see Federal Reserve Bulletin forDecember 1935, p. 883, and July 1936, p. 535. Figures for nonmember banks are for dates indicated or nearest thereto for which figures areavailable.
NUMBER OF BANKS
Call date
1933—June 30Oct 25 l
Dec. 30
1934—Mar. 5*.June 30Oct 17l
Dec. 31
1935— Mar. 4June 29Nov. 1Dec. 31
1936—Mar. 4June 30Dec. 31 _
1937—Mar. 31June 30*.
Total
14,519
15,011
15,835
16,039
16,02415,99415,90415,837
15,80815,75215,628
15,56915,527
Member banks
Total
5,6065,8186,011
6,2066,3756,4336,442
6,4226,4106,4006,387
6,3776,4006,376
6,3676,357
Na-tional
4,8975,0525,154
5,2885,4175,4616,462
5,4465,4256,4035,386
5,3755,3685,325
5,3055,293
State
709766857
918958972980
976985997
1,001
1,0021,0321,051
1,0621,064
Nonmemberbanks
Mutualsavingsbanks
576
579
578"
579
579571571570
569566565
565564
Othernon-
mem-ber
banks
8,337
8,421
"1"882
9,018
9,0239,0138,9338,880
8,8628,7868,687
8,6378,606
For footnotes see table below.
DEPOSITS, EXCLUSIVE OF INTERBANKDEPOSITS*
[In millions of dollars]
Call date
1933—June 30...Oct. 251Dec. 30. . .
1934—Mar. 5 » „June 30—.Oct 17l
Dec. 31
1935—Mar. 4 . . . .June 29.._Nov. 1_._.Dec. 3 1 . . .
1936—Mar. 4 . . . .June 30.. .Dec. 3 1 . . .
1937—Mar. 31. . .June30»__
Allbanks
37,998
38,505
"41,"870"
44,770
44,45545,76647,52248,964
48,71651,33553,701
52,57753,287
Member banks
Total
23,33S23,45323,771
25,29326,61527,48428,943
28,58929,49631,07232,159
31,77434,09835,893
34,74635,440
Na-tional
14,77215,07015,386
16,20317,09717,69318,519
18,50219,03120,12820,886
20,60521,98623,107
22,35522,926
State
8,5668,3838,385
9,0909,5189,791
10,424
10,08710,46510,94411,273
11,16912,11212,786
12,39012,514
Nonmember banks
Mutualsavingsbanks
9,713
9,708
9,780
9,828
9,8379,9209,9369,903
9,97210,06010,143
10,15710,213
Othernonmem-ber banks
4,946
5,026
5,475
6,000
6,0296,3506,5136,842
6,9707,1767,666
7,6747,635
For footnotes see table below.
LOANS AND INVESTMENTS[In millions of dollars
Call date
1933—June 30Oct. 25 l
Dec. 30
1934—Mar. 5 *June 30Oct. 17 *Dec. 31
1935—-Mar. 4June 29Nov 1Dec. 31.
1936—Mar 4June 30 „ . .Dec. 31
1937—Mar. 31June 30«
All banks
Total
40,076
40,319
42,602
43,458
43,74744,41645,00845,717
46,11548,45849, 524
49,13849,696
Loans
22,203
21,977
21,278
20,473
20,39420,27220,14020,329
20,26720,67921,449
21,79022,514
Invest-ments
17,872
18,342
21,224
22,984
23,35324,14524,86825,388
25,84727,77828,075
27,34827,182
Member banks
Total
24,78624,95325,220
26,64827,17527,55928,160
28,27128,78529,30129,985
30,28832,25933,000
32,52532,739
Loans
12,85813,05912,833
12,70612,52312,29312,028
11,95311,92811,84112,175
12,09912,54213,360
13,69914,285
Invest-ments
11,92811,89412,386
13,84214,65215,26716,122
16,31816,85717,46017,810
18,18919,71719,640
18,82618,454
Nonmember banks
Mutual savings banks
Total
10,044
9,985
9,904
9,782
9,7759,8529,8549,804
9,7959,961
10,060
10,09610,180
Loans
5,941
5,906
5,648
5,491
5,4785,3415,3025,210
5,2025,1055,027
5,0266,002
Invest-ments
4,103
4,079
4,256
4,291
4,2974,5114,5524,594
4,5924,8565,034
5,0705,178
Other nonmember banks
Total
5,246
5,115
5,423
5,526
5,7015,7795,8535,927
6,0326,2386,464
6,5186,778
Loans
3,404
3,238
3,108
2,955)
2,9633,0032,9972,944
2,9663,0323,062
3,0653,227
Invest-ments
1,841
1,877
2,315
2,571
2,7382,7772,8562,983
3,0663,2063,402
3,4533,550
* Nonmember bank figures not available.» Prior to Dec. 30,1933, member-bank figures include interbank deposits not subject to immediate withdrawal, which aggregated $103,000,000
on that date. The nonmember bank figures on all call dates include interbank deposits to the extent (estimated as $150,000,000 on June 30, 1937)that they were not shown separately in a few State bank abstracts.
* Beginning with this date (1) the figures exclude private banks in Georgia which no longer report to the State banking department (43 suchbanks reported deposits of $2,491,000 and loans and investments of $1,087,000 on December 31,1936); and (2) the figures include Morris Plan andindustrial banks in New York and North Carolina, of which there were 45 on June 30,1937 with deposits of $50,287,000 and total loans and invest-ments of $61,165,000. The figures already include such Morris Plan and industrial banks in other States as are covered by State banking depart-ment reports.
Back figures.—Bee Annual Report for 1936 (tables 48-49).
Digitized for FRASER http://fraser.stlouisfed.org/ Federal Reserve Bank of St. Louis

30 FEDERAL EESERVE BULLETIN JANUARY 1938
ALL MEMBER BANKS—LOANS AND INVESTMENTS[In millions of dollars]
Call date
TOTAL—ALL MEM-BER BANKS
1929-Dec. 311933—June 30»1934—Dec. 311935—June 29
Dec. 311936—-Mar. 4
June 30 —Dec 31
1037—Mar. 31June 30 -.—
. NEW YORK CITY '
1929—Dec. 311Q1&—Time " 0*1934—Dec. 311935—June 29
Dec 311036-Mar. 4
June 30 - --Pec. 31
19^7 Mar 31June 30 -...,
CITY OF CHICAGO *
1929 Dec 31toqq Tune 30 *1934—Dec. 311936—June 29
Dec. 311936—Mar. 4
June 30Pec. 31
1937—Mar. 31June 30
EESERVE CITYBANKS
1929—Dec. 311933—June 30 *1934—Dec. 31 - —1935—June 29
Dec. 311936-Mar. 4
June 30Dec. 31
1937—Mar 31June 30
COUNTRY BANKS
1929—Dec. 311933—June 30 >1934—Dec. 311935—June 29
Dec. 311936—Mar. 4. , .
June 30Pec. 31
1937-Mar. 31June 30
Totalloansand
invest-ments
35,93424,78628,15028,78529.98530,28832,25933,00032,52532,739
8,7747 1337,7618,3038,4188,8029,6569,2809 1019,006
1,7571 2871,6811,5921,8681,9461,9512,1001,8681,969
12,0298,492
10,02810,15110,78010,65511,30611,79511 61111,629
13,3757,8738,7808,7398,9198,8859,4469,8259,945
10,134
Loans to customers (except banks)
Total
23,19311,33710,50910,36910,54810,46010,94311,62811,86212,369
4,9642 2972,2022,1462,1962,2152,3382,5672,6762,890
1,330589435458455456513613629651
8,4184,2584,0243,9674,1444,0714,2424,5824,6184,739
8,4814,1943,8493,7983,7543,7163,8503,8663,9404,089
Tobro-kersout-sideNewYorkCityi
803165187192196211266266258258
55386458606476787476
240482933283259605260
' 42563908796
101115123114114
83151413131517161718
Toothers
onsecuri-
ties
7,6853,7523,1102,9312,8932,8322,8632,7852,8162,829
2,1451,044
820783793792813753790824
533251170163149148145140155145
2,7751,3401,1241,0531,0571,0271,04410481,0391,032
2,2311,117
996932894865861843833828
Healestateloans
3,1912,3722,2732,2772,2842,3012,3402,4052,4402,505
169157139138140148146144142149
21301815151314131413
1,5381,1311,0901,1051,0941,0961,1011,1241,1351,164
1,4621,0551,0261,0201,0351,0431,0781,1231,1501,179
Re-port-ing
banks'ownccept-ances
11,192232135169156117131128113
2,120164
821079965656965
5241612141210
826
3,464940464340565539
22222322
Other-wisese-
curedand
unse-cured
154,8574,7084,8345,0064,9606,3556,0416,2206,663
595937
1,0241,0851,0961,1121,2381,5271,6001,776
S5237202236249251284402407437
>791,6781,6711,6821,8511,8051,9412,2312,2762,389
'052,0051,8101,8311,8101,7911,8911,8811,9372,062
Loansto
>anks
7143301551199882818599
115
3221626348422928425162
8830117655642
258995543343131232934
45382721171716141516
Open-market loans
Purchased paper
Ac-cept-ances
Sein[JnitedStates
212291256201181164144161170131
12822421018315814112313611998
92729
4123323
42361310191816173725
3345333
4124
Billspay-ablebroad
80253117292518182215
4610167
16138
1061
5751112111
24697
10975
107
5122n£
11tA55
Com-mer-cial
paperought
29187
2322472722S0278324386377
211065543545
5122714121010101216
10238
108112120120113131154145
1632792
116135145152178216211
Loansto
bro-ersintfew
YorkCityi
1,660788843975
1,0471,0891,0791,1441,1591,278
1,202720662930
1,0181,0431,0281,0951,1051,219
111326
1111111
23945
10525213034363844
2081050187
1416131615
Investments
Total
9,7841,9286,1226,8577,8108,1899,7179,6408,8268,464
2,0913,7094,6024,9834,9855,3556,0285,4255,1404,730
309610
1,0491,1071,3921,4701,4191,4671,2201,295
2,9444,0115,7155,9866,4326,3756,8637,0006,7256,635
4,4393,5984,7564,7805,0024,9895,4075,7475,7415,794
U.S. Govern-ment obliga-
tions
irect
3,8636,8879,9069,8710,5010,6641,7211,6390,8560,870
1,1122,5513,2463,4623,4253,6024,1963,7393,3563,176
116384743766
1,0611,1311,0141,107
853907
1 3682,4833 8093 7124,0763,9584 3494 4264,2504,267
1,2671,4692,1081,9311,9401,8732 1632,3682,3972,520
Fullyguar-nteed
"989"1,5581,7681,8801,9501,9061,8611,819
278348401505567470473454
7887888992949494
279571656656651697669635
""355553623630640645626635
Otherecuri-ties
5,9215,0415f2275,4275,5415,7456,0456,0956,1085,765
9791,1581,0781,1741,1591,2481,2651,2171,3111,100
193220229254243250312266273294
1,5761,5281,6281,7031,7011,7611,8631,8771 805l|733
3,1722,1292,2932,29«2,4392,4862,6052,7342,7192,6311
1 Loans (secured by stocks and bonds) to brokers and dealers in securities.> Beginning June 30,1633, figures relate to licensed banks only.» Central reserve city banks.Backfigures.—See Annual Report for 1936 (table 53).
Digitized for FRASER http://fraser.stlouisfed.org/ Federal Reserve Bank of St. Louis

JANUARY FEDERAL RESERVE BULLETIN 31
ALL MEMBER BANKS—RESERVES, DEPOSITS, AND BORROWINGS[In millions of dollars]
Call date
TOTAL—ALL MEM*BER BANK?
1929-Dec.311933—June 30 •1934—Dec. 3 1 . . . —1936 June 29 -
Dec. 311 9 3 6 — M a r . 4
June 30Dec. 31-
1937—Mar 31June 30 „
NEW YORK CITY '1920—Dec. 3110^3 June 30 5
1934 T)ec 31-ltns June 29
Dec 31 - —IQQA Mar 4
June 30 -Dec. 31
1007 Mar 31June 30
C I T Y O F C H I C A G O 6
I Q 2 Q D e c 3 11 9 3 3 — J u n e 3 0 B
1 9 3 4 — D e c . 3 1 - - .I 9 3 5 — J u n e 2 9 . --_
D e c . 3 1 .1 9 3 6 — M a r . 4
June 30Dec. 31
1 9 3 7 — M a r . 3 1J u n e 3 0 -
R E S E R V E C I T Y B A N K S
1 9 2 9 — D e c 3 11 9 3 3 — J u n e 3 0 B . . .1 9 3 4 — D e c . 3 1 .1 0 3 5 J u n e 2 9
D e c . 3 1 . . .1 9 3 6 — M a r 4
June 30 -Dec. 31
1 9 3 7 M a r 3 1June 30 -
C O U N T R Y B A N K S
1 9 2 9 — D e c . 3 11 9 3 3 - J u n e 3 0 *1 9 3 4 — D e c 3 1I 9 3 5 — j U n e 2 9
Dec. 311936—Mar. 4
June 30Dec. 31-
1937—Mar. 31June 30
Re-serveswithFed-eralRe-
servebanks
2 , 3 7 42 , 2 3 54 , 0 8 24 , 9 3 35 , 5 7 35 , 7 8 45 , 6 0 76 , 5 7 26 , 6 1 36 , 8 9 7
8 2 7846
1 , 5 7 61 , 9 3 52 , 5 4 12 , 4 9 32 , 1 0 62 , 6 5 82 , 7 1 92 , 7 4 9
1 6 92 3 24 1 56 7 5511480749558482696
7 5 17 0 5
1 , 2 6 81 , 4 0 31 , 5 9 41 , 7 9 41 , 7 6 32 , 1 0 82 , 1 0 82 , 2 1 5 *
6 2 74 5 28 2 29 2 09 2 7
1 , 0 1 79 8 9
1 , 2 4 71 , 3 0 4 -1 , 3 3 7
Cashin
vault
5 5 84 0 56095376656247136976626 2 9
6 846865165676561566 0
1 33 44 03 7393538322127
1 5 61 2 22 0 72132562 6 42 8 92852 6 42 1 2
3 2 12 0 32 7 52 3 63 0 52683 2 23 1 9321330
Bal-anceswithdo-
mes-tic
banks1
2 , 1 6 82 , 0 0 83 , 1 4 93 , 3 9 63 , 7 7 63 , 9 7 03 , 9 4 44 , 0 6 63 , 4 4 53 , 2 0 7
1 7 91011031331111081141331231 0 5
1 3 32 0 32 0 72 4 920919519518893
156
9 4 71 , 0 0 21 , 5 4 31 , 6 0 71 , 7 7 91 , 9 1 01 , 9 0 71 , 8 1 61 , 5 4 51 , 3 9 2
«
9 0 87 0 2
1 , 2 9 61 , 4 0 61 , 6 7 61 , 7 5 71 , 7 2 71 , 9 2 91 , 6 8 41 , 5 5 4
Cashitems
report-ed as
inproc-ess
of col-lec-
tion *
3 , 8 9 61 , 4 8 51 , 9 0 31 , 1 8 32 , 2 5 51 , 7 1 82 , 1 4 72 , 5 3 31 , 9 7 42 , 2 0 1
2 , 4 0 6874
1 , 0 6 9447
1 , 1 3 3829982
1 , 0 8 78539 9 6
1 5 86 19 07 3
13596
147159114130
1 , 0 4 14 0 15 3 74717526 0 77 6 39717 6 48 0 5
2 9 11 4 92 0 71 9 22 3 51872 5 63 1 6242269
Demand deposits
Interbank
Do-mes-tic
banks
3 , 5 1 73 , 0 5 74 , 5 6 94 , 9 7 85 , 6 9 66 , 1 4 85 , 9 8 66 , 4 0 25 , 7 5 25 , 2 9 8
1 , 1 9 81 , 2 5 51 , 7 9 81 , 9 8 32 , 3 3 82 , 6 2 72 , 3 9 02 , 4 9 32 , 1 7 12 , 0 1 4
3 1 02 5 94 4 55 0 4522594635599596536
1 , 6 0 41 , 3 1 51 , 9 8 42 , 1 4 52 , 4 2 22 , 5 9 42 , 5 5 12 , 8 2 62 , 5 4 62 , 3 3 9
4 0 52 2 83 4 23 4 74 1 54334 1 04 8 3440409
For-eign
banks
5 4 41 4 51472734443944654324586 1 5
4 6 41271262484103634283934196 7 5
2 6223445556
5 01 51 721282 63 0333 23 3
31
' 21111222
Unit-ed
StatesGov-ern-
ment
1 4 38 0 6
1 , 6 3 6779844600
1 , 0 3 78824156 2 8
2 03327923692241402152251293 0 6
84 64 62 09881
102729641
7 63 1 26 2 02993852 8 55 1 34071 3 22 1 2
3 91 1 61 7 8
9 01 3 7
932 0 71 7 8
5769
Pub-lic
funds
1 , 3 3 51 , 0 8 71 , 7 9 92 , 0 9 12 , 1 3 92 , 1 7 32 , 3 2 02 , 3 2 92 , 5 6 42 , 5 7 7
1 2 896
2293543232603572853143 6 8
4 28 7
1 8 21 9 8208217221191203208
4 2 33 4 95 8 56747077 3 37 3 38439 3 59 3 4
7 4 25 5 58 0 48 6 59 0 1965
1 , 0 0 81 , 0 1 11 , 1 1 31 , 0 6 7
Certi-fiedandoffi-cers'
checkscash
lettersof
credit >
1 , 6 8 16 5 78384178827797898816777 5 2
1 , 1 8 04615401495244964894573544 2 7
3 21 62 32 4272627273822
3 0 01 0 81 6 91402041 5 11 5 22301 5 51 6 3
1 6 97 2
1 0 61 0 41 2 71061 2 11 6 7130139
'Indi-vid-uals,part-ner-
ships,cor-
pora-tions,etc.
1 7 , 5 2 61 1 , 8 3 01 4 , 9 5 11 6 , 2 0 61 8 , 0 3 51 7 , 9 2 71 9 , 3 2 22 0 , 9 7 02 0 , 0 8 52 0 , 2 7 2
5 , 8 4 74 , 6 7 66 , 3 7 05 , 9 2 46 , 4 7 96 , 4 7 16 , 8 9 17 , 2 7 47 , 2 3 76 , 9 3 4
1 , 0 4 18 7 0
1 , 0 7 31 , 2 0 81 , 3 0 11 , 2 4 31 , 4 4 41 , 4 9 51 , 0 0 11 , 4 0 9
6 , 5 4 73 , 7 0 84 , 9 1 95 , 3 1 46 , 0 0 15 , 9 6 16 , 4 1 97 , 0 2 36 , 8 3 36 , 8 4 0
5 , 0 9 12 , 5 7 63 , 5 8 93 , 7 6 14 , 2 5 44 , 2 5 24 , 5 6 75 , 1 7 75 , 0 1 35 , 0 8 9
De-manddepos-its ad-justed*
1 6 , 6 4 71 2 , 0 8 91 5 , 6 8 61 7 , 5 3 01 8 , 8 0 11 9 , 1 6 12 0 , 2 8 42 1 , 6 4 72 1 , 3 5 22 1 , 4 0 1
4 , 7 5 04 , 3 5 85 , 0 6 95 , 9 7 96 , 1 9 36 , 3 9 86 , 7 5 66 , 9 2 97 , 0 5 16 , 7 3 3
9 5 79 1 2
1 , 1 8 91 , 3 5 71 , 4 0 11 , 3 9 01 , 5 4 61 , 5 5 41 , 1 2 81 , 5 0 9
5 , 2 2 93 , 7 6 45 , 1 3 65 , 6 5 66 , 1 6 16 , 2 3 86 , 5 4 17 , 1 2 67 , 1 5 97 , 1 3 2
5 , 7 1 13 , 0 5 44 , 2 9 24 , 6 3 85 , 0 4 75 , 1 3 65 , 4 4 06 , 0 3 96 , 0 1 26 . 0 2 7
Time deposits
Interbank
Do-mes-tic
banks
9 58 9
1341361511521511531531 2 3
4 022
1
19
3 05 9
1 1 71191341 3 51 3 51371 3 71 0 8
67
1 61 61 6171 61 61615
For-eign
banks
1 5 417555666
1 4
1 3 317444545
1 2
7
14
11111122
Pos-tal
sav-ings
1 2 27 8 845230721816715210497
1 0 0
1 811056273
261
4 13 8 81 8 6118797 26 5353 43 5
6 12 8 52 1 01 6 21 3 6958 76 96464
P u b -l i c
f u n d s
5 9 53 0 02942853613443782962692 9 2
3 3446
12111013141 7
5 81
3 7 12 0 82 0 62032662 5 12 8 82031 7 61 9 0
1 3 38 68 47 68 3828 08 07985
Indi-vid-uals,part-ner-
ships,cor-
pora-tions,etc.
1 2 , 2 6 77 , 8 0 39 , 0 2 09 , 4 6 29 , 6 8 09 , 7 8 40 , 0 9 90 , 4 2 90 , 6 3 90 , 8 1 8
1 , 1 1 26715915675915866016797587 6 7
3 3 23 5 83 8 14 6 9413407444449440452
4 , 4 3 32 , 9 4 13 , 4 9 43 6 7 03 , 7 9 63 , 8 5 33 9 6 04 0 2 64 , 0 6 44 , 1 4 0
6 , 3 9 03 , 8 3 34 , 5 5 44 , 7 5 64 8 7 94 9 3 85 , 0 9 45 2 7 55 3 7 75 , 4 5 9
Bor-row-ings
8 7 91 9 11396
116
15181 6
1 7 98
2
1213
4 1
1
2 9 21 6
1
51
3 6 71 6 7
1 396863
1112
1 Prior to Dec. 31,1935, excludes balances with private banks to the extent that they were then reported in " Other assets." Since Oct. 25,1933,includes time balances with domestic banks which on that date amounted to $69,000,000 and which prior to that time were reported in "Other assets."
* Does not include cash items in process of collection reported in balances with domestic banks. Prior to Dec. 31,1935, includes cash items onhand but not in process of collection, amounting on that date to $16,000,000.
* Includes t4Due to Federal Reserve banks (transit account)," known as "Due to Federal Reserve banks (deferred credits)" prior to Dec. 31,1935.4 Demand deposits other than interbank and U. S. Government, less cash items reported as in process of collection and, prior to Dec. 31, 1935,
less cash items reported on hand but not in process of collection.»Beginning June 1933 figures relate to licensed banks only.* Central reserve city banks.Back figures.—Bee Annual Report for 1936 (table 54).
Digitized for FRASER http://fraser.stlouisfed.org/ Federal Reserve Bank of St. Louis

32 FEDERAL RESERVE BULLETIN JANUARY 1938
REPORTING MEMBER BANKS IN 101 LEADING CITIES[Monthly data are averages of weekly figures. In millions of dollars]
Date or month
Totalloansand
invest-ments
Loans1
Total
Tobrokers
anddealersin se-
curities!
Onsecuri-ties toothers
(exceptbanks)i
Tobanks
Realestateloans
Openmar-ket
papers
Otherloans'
Investments
Total
XI. S. Govern-ment obliga-
tions
DirectFullyguar-anteed
Othersecuri-
ties
Re-servewithFed-eralRe-
servebanks
Cashin
vault
Bal-anceswith
domes-tie
banks
TOTAL—101 CITIES
1936—November1937—May
JuneJulyAugustSeptemberOctoberNovember
1937—October 20October 27November 3November 10November 17November 24December 1December 8 _.December 15December 22December 29
NEW YORK CITY
3936—November1937—May
JuneJulyAugustSeptemberOctoberNovember
1937—October 20October 27November 3November 10November 17November 24December 1December 8December 15December 22December 29
OUTSIDE NEW YORKCITY
1936—November1937—May
JuneJulyAugustSeptember....OctoberNovember
1937—October 20October 27November 3 _ . .November 10November 17November 24December 1December 8December 15December 22December 29
22,44422,20122,33022,21922,33222,18721,88921,556
21,80021, 69421,65421,60S21,53021, 43221,38121, 48921,6C821, 48021,402
8,7559,5239,6979,7439,92910,0269,8909,559
9,9139,6829,6259,6009,5329,4799,4419,5099,5009,4189,387
8,6228.3358,4918,3758,3558,2738,0687,875
8,0757,9147,9137,8887,8677,8337,8197,9277,9817,8697,857
13.82213,86613,83913,84413,97713,91413, 82113,681
13, 81513,78013,74113,72013,66313,59913,56213, 56213, 68713, 61113,545
3,4203,804
3,9754,0214,0403,8813,605
3,9033,7023,6573,6283,5783,5593,5343,5903,5703,5183,513
5,3355,7195,7285,7685,9085,9866,0095,954
6,010
5,9685,9725,9545,9205,9075,9195,9305,9005,874
,156.,328,393,375,3621,3171,103881
1,119956901877865881876946913887
978* 1,1331,1841,1591,1481,108915715
929779732709701718710770732714719
178U95209216214209188166
190177169168164163166176181173175
2,02412,0612,0062,0012,0022,0071,9961,976
1,9391,9791,9811,9801,9781,9651,9671,9651,9611,9521,951
710*733758754739727713710
708702711711711705701702701691683
1,314* 1,328
1,2481,2471,2631,2801,2831,266
1,2811,2771,2701,2691,2671,2601,2661,2631,2601,2611,268
621201311241451179074
30768885107836238
6655593728273038483634
1,148• 160
167164164
,164,168,169
,167i,169,169.,169,169i,16S,167.,168
1,1701,1661,165
130129132134135134135133
135134134134133132131131130128129
1,0181,0311,0351,0301,0291,0301,0331,036
1,0321,0351,0351,0351,0361,0361,0361,0371,0401,0381,036
323S382474463467468479481
482481477481485479475476476472461
1353103163161162168185187
187186182188190190191191194194192
188*279311302305300294294
295295295293295289284285282278
4,0422 4,4774,5264,6164,7894,9535,0544,978
5,0635,0165,0015,0204,9704,9224,8884,8774,8964,8704,850
1,4371,6321,6441,6821,7301,8201,8711,822
1,8781,8461,8391,8491,8151,7871,7711,7581,7651,7551,756
2,605*2,8452,8822,9343,0593,1333 1833,156
3,1853,1703,1623,1713,1553,1353,1173,1193,1313,1153,094
13,68912,67812,63312,47612,40312,16111,99911,997
11,97712,01212,02912,00811,99811,95311, 94011,98012,16812,06212,015
5,2024,5314,5224,4004,3344,2334,1874,270
4,1724,2124,2564,2604,2894,2744,2854,3374,4114,3514,344
8,4878,1478,1118,0768,0697,9287,8127,727
7,8057,8007,7737,7487,7097,6797,6557,6437,7577,7117,671
9,2328,3208,3558,2688,2298,0687,9147,970
7,8967,9337,9687,9727,9747,9667,9638,0138,1728,0678,018
3,7213,0243,059
2,9442,8662,8142,943
2,7992,8492,9072,9292,9582,9762,9903,0493,1113,0463,031
5,5115,2965,2965,2825,2855,2025,1005,027
5,0975,0845,0615,0435,0164,9904,9734,9645,0615,0214,987
1,2551,1631,1601,1701,1601,1311,1321,127
1,1321,1331,1371,1281,1251,1201,1181,1021,1141,1101,116
461435437441420395390
392382384378375364359359366
794728723729740736742743
743744745746741742743738755751750
3,2023,1953,1183,0383,0142,9622,9532,900
2,9492,9462,9242,9082,8992,8672,8592,8652,8822,8852,881
1,0201,0721,026973970972983
984974957949947920920924941946947
2,1822,1232,0922,0652,0441,9901,9701,957
1,9651,9721,9671;9591,9521,9471,9391,9411,9411,9391,934
5,4225,3505,3325,2915,1495,3135,3845,348
5,3685,4045,3255,3095,3655,3945,3745,2915,3655,3355,427
2,5752,4922t5062,4862,3622,5272,5972,540
2,5782,6242,5392,4992,5512,5692,5432,4512,5302,5152,553
2,8472,8582,8262,8052,7872,7862,7872,808
2,7902,7802,7862,8102,8142,8252,8312,8402,8352,8202,874
404338315312296305326320
318334318331314317304340337367355
346284262261246252266261
260272256269260258252284277298294
2,4631,7901,7611,7711,6831,7031,7811,804
1,7871,7421,7441,7551,8671,8501,8691,8031,8691,8251,886
7870666866666769
6968
72697666737173
2,3851,7201,6951,7031,6171,6371,7141,735
1,7181,6741,6761,6871,7951,7811,7931,7371,7961,7541,813
i Loan classification revised May 19 and beginning with that date figures for the items indicated are not strictly comparable with those formerlypublished; for explanation of revision see June BULLETIN, pages 530-531.
* Average of figures for May 5 and 12 only (see note above).
Digitized for FRASER http://fraser.stlouisfed.org/ Federal Reserve Bank of St. Louis

JANUARY 1938 FEDERAL RESERVE BULLETIN 33
REPORTING MEMBER BANKS IN 101 LEADING CITIES—Continued[Monthly data are averages of weekly figures. In millions of dollars]
Date or month
Cashitems
report-ed as
in proc-ess ofcollec-tion i
Otherassets
Total
Totalliabil-ities
Demand deposits
Interbank
Domes-tic
banksForeignbanks
UnitedStates
Govern-ment
Certi-fied
checks,etc.
Other
De-manddepos-its—ad-justed!
Time deposits
Interbank
Do-mesticbanks
For-eign
banks
Other
Bor-row-ings
Otherliabil-ities
Capi-tal ac-count
TOTAL—101 CITIES
1936—November1937—May
JuneJulyAugust _.SeptemberOctoberNovember
1937—October 20October 27November 3 . . .November 10..November 17..November 24..Dec. 1Dec. 8 ,Dec. 15Dec. 22Dec. 29
NEW YORK CITY
1936—November1937—May...
JuneJuly ,August ,SeptemberOctober _ .November . . . . .
1937—October 20October 27. . . . .November 3 . . . .November 10...November 17..November 24...Dec. 1 _ .Dec. 8Dec. 15Dec. 22Dec. 29 _ „ .
OUTSIDE NEW YORKCITY
1936—November1937—May
June ,JulyAugust.SeptemberOctober. _.November
1937—October 20 ,October 27November 3 . . . .November 10...November 17...November 24...Dec. 1.. .Dec. 8. . .Dec. 15.Dec. 22..Dec. 29.
,6631,460,569,497,322,568,568,511
,571,479
1,6071,4991,5801,3601,5881,2671,9001,5581,550
795622716658541722675695
694683786712701fi82725563
1,034733691
86882S853839781846893816
877796821787879778863704926825859
,318,338.,325,277,269,286,304,305
,314,311
L,309i,2921,308.,310,313,307
1,2961,2881,267
468482474455450459459478
463458462482485483483477470468467
850856851822819827845827
851853847810823827830830826820800
33, 71432,46732,63232,36732,05132,36232, 25231,844
32, 24831, 96431,95731, 79431,96431,66331,82931, 49732,49531, 85331,887
12,59612,05512,30612,09311,82412,10011,92611,716
11,93711,80911,83011,71111,73011, 59511,69811,54012,14811,72511,702
21,11820,41220,32620,27420,22720,26220,32620,128
20,31120,15520,12720,08320,23420,06820,13119,95720,34720,12820,185
6,1065,0324,9274,9844,8804,8784,9764,928
4,9754,8364,9294,8685,0104,9064,9514,8854,9634,9334,981
2,5291,9261,9111,9401,8631,8961,9411,940
1,9421,8871,9541,8951,9591,9521,9851,9362,0211,9722,005
3,5773,1063,0163,0443,0172,9823,0352,988
3,0332,9492,9752,9733,0512,9542,9662,9492,9422,9612,976
448528579606568559503425
497472457428414402397388401435433
490540563524516466390
459436421393380367362353366398397
548201378447515616555424
508471447416416418416417684689691
10250179233275346303232
279257245228. 228228228228364364364
446151199214240270252192
229214202188188190188189320325327
584441489480402510448467
503456489512455410493431637470446
402274311307241332287301
329300332317302254292257452314280
182167178173161178161166
174156157195153156201174185156166
16,44116,42916,38016,00115,83815,90015,87515,681
15,85715,82715,72815,64415,73715,61515, 70715,54315,99815, 51115,535
6,7566,7306,7296,4046,2986,3976,3246,228
6,3126,3246,2666,2456,2326,1696,2356,2236,4086,1516,142
9,6859,6999,6519,5979,5409,5039,5519,453
9,5459,5039,4629,3999,5059,4469,4729,3209,5909,3609,393
15,36215,42015,30014,98414,91814,84314,75614,636
14,78914,80414,61014,65714,61214,66514,61214,70714,67514,42314,431
6,3636,3826,3246,0545,9986,0075,9365,834
5,9475,9415,8125,8505,8335,8415,8025,9175,8265,7325,731
8,9999,0388,9768,9308,9208,8368,8208,802
8,8428,8638,7988,8078,7798,8248,8108,7908,8498,6918,700
13010610110199112112111
113110111112112110109111111109109
13010610110199112112111
113110111112112110109111111109109
21
5,0325,1945,2335,2545,2455,2835,2785,287
5,2R55,2745,2785,3025,2965,2735,2345,1835,1925t2015,205
583697723746726726728747
734734736759751742722662662665660
4,4494,4974,5104,5084,5194,5574,5504,540
4,5514,5404,5424,5434,5454,5314,5124,5214,5304,5364,545
915906863843863862873
866872865867877884864872848859843
369394404400379390380381
384375374377383388373374366367360
511521502463464473482492
482497491490494496491498482492483
3,5393,5933,6023,5973,6073,6123,6173,623
3,6173,6203,6213,6233,6243,6243,6313,6343,6303,6303,626
1,4421,4751,4771,4751,4821,4771,4781,481
1,4781,4791,4801,4811,4801,4801,4831,4831,4831,4841,484
2,0972,1182f1252,122
'2,1252,1352,1392,142
2,1392,1412,1412,1422,1442,1442,1482,1512,1472,1462,142
i Does not include cash items in process of collection reported in balances with domestic banks,s Demand deposits other than interbank and U. S. Government, less cash items reported as in process of collection.NOTE.—For back figures and description of figures see BUILETIN for November 1935, pp. 711-738, or reprint, which may be obtained from the
Division of Besearch and Statistics. See also p. 876 of BULLETIN for December 1935 and Annual Report for 1932 (tables 78-82).
Digitized for FRASER http://fraser.stlouisfed.org/ Federal Reserve Bank of St. Louis

34 FEDERAL RESERVE BULLETIN JANUARY 1938
REPORTING MEMBER BANKS IN 101 LEADING CITIESASSETS AND LIABILITIES BY DISTRICTS AND FOR NEW YORK CITY AND CHICAGO
[In millions of dollars]
ASSETS
Loans and investments-total:
Dec. 1Dec.8Dec. 15Dec. 22 . . . .Dec. 29
Loans—total:Dec. 1Dec.8Dec. 15Dec. 22Dec. 29
Commercial, industrial, andagriculture loans:
On securities:Dec. 1 -Dec.8Dec. 15Dec. 22 _.Dec. 29
Otherwise secured andunsecured:
Dec. 1Dec.8Dec. UDec. 22Dec. S9
Open market paper:Dec. l ._. ---Dec. 8 -Dec. 15Dec. 22Dec. 29 --
Loans to brokers and dealers:Dec. 1Dec. 8 . .Dec. 15Dec. 22Dec. 29..
Other loans for purchasing orcarrying securities:
Dec. 1Dec.8Dec. 15Dec. 22 . . . .Dec. 29
Real estate loans:Dec. 1Decs....Dec. 15Dec. 22Dec. 29.. ._
Loans to banks:Dec. 1Dec.8Dec. 15Dec. 22Dec. 29
Other loans:On securities:
Dec. 1 . . :Dec. SDec. 15Dec. 22Dec. 29
Otherwise secured andunsecured:
Dec. 1Dec.8Dec. 15 .Dec. 22Dec. 29
U. S. Government directobligations:
Dec. 1 „Dec.8 _.,Dec. 15Dec. 22Dec. 29... , . ,
Obligations fully guaranteedby U. S. Government:
Dec. 1Dec.8Dec. 15 . . . .Dec. 2 2 . . . .r iw OQ
Total
21,38121,48921,66821,48021, 402
9,4419, 5099,5009,4189,387
579576574576579
4,058•4,0524,0714,0414,022
4754764764724G1
876946913887894
650654654649635
1,1671,1681,1701,1661,165
738735733727737
830825825829828
7,9638,013'8,1728,0678,018
1,1181,102a, 1141,110
Federal Reserve District
Bos-ton
1,2251,2221,2171,2081, 198
667662658649644
274271265262260
8382818079
3132363130
409410408406402
NewYork
8,7948,8578,7448,725
3,9774,0344,0183, 9673,957
249247247247241
1,7001,6921,7011,6861,684
202202206206203
719781745727733
306309308304293
239239238236236
3139493735
269268263270
262256256261262
3,2073,2633,3283,2613,244
421410407408
Phila-del-
phia*
1,1301,1261,1271,1161,110
459459462460458
167165170171169
2122202018
1920191921
310310310303299
94
Cleve-land
1,8481,8441,8571,8341,828
715720721714712
248250252248243
1818201917
2323242324
3940404039
176176176175175
46333
121121120120125
811803814797796
Rich-mond
625633648645645
253252254255257
99100
1515151515
44544
30
263272284280279
Atlan-ta
553556565564556
292293295298295
144145148151149
44444
151153160157153
Chica-go
2,9692,9703,0002, 9882,973
9921,001999985981
554559560546543
5253504947
4550494947
1,3961,389
r l ,4l71,4201,408
189187
••191189
St.Louis
652654663658658
320322324323324
145146148149151
101010
193194198195194
Min-neap-olis
393392392389387
185185182181179
151151154153154
Kan-sasCity
685679685676672
281280280280278
159158158159158
23232322.21
44444
240238245238235
Dallas
507508512514509
251252252254253
148149149151150
33333
34333
179179182182178
SanFran-cisco
2,1062,1112,1452,1442,141
1,0491,0491,0551,0521,049
337337341339336
3737373837
1616161516
372373374373373
33333
103103105107105
653651672675676
118121126124
City
NewYork
7,8197,9277,9817,8697,857
3,5343,5903,5703,5183,513
235233233233227
1,5751,5681,5761,5611,560
191191194194192
710770732714719
229232232227217
131131130128129
237237236231239
196190
194196
2,9903,0493,1113,0463,031
375364359359
Chica-go
1,9191,9201,9441,9361,925
659665666649641
3131313134
410411414400395
2930292827
3944434239
7777777675
1313131313
22121
2221222121
3636363636
904899920929926
100100103102
Digitized for FRASER http://fraser.stlouisfed.org/ Federal Reserve Bank of St. Louis

JANUARY 1938 FEDERAL RESERVE BULLETIN 35
REPORTING MEMBER BANKS IN 101 LEADING CITIES—ContinuedASSETS AND LIABILITIES BY DISTRICTS AND FOR NEW YORK CITY AND CHICAGO—Continued
Iln millions of dollars]
ASSETS—continued
Other securities:Dec. 1Dec 8Dec. 15Dec. 22Dec. 29
Reserve with Federal Re-serve bank:
Dec 1Dec. 8Dec. 15Dec. 22Dec. 29. .-
Cash in vault:Dec 1Dec. 8Dec. 15 - .Dec. 22Dec. 29
Balances with domesticbanks:
Dec. 1Dec. 8Dec. 15.Dec 22Dec. 29
Other assets:Dec. 1 -Dec. 8Dec 15Dec 22Dec. 29
LIABILITIES
Demand deposits—adjusted:Dec. 1Dec. 8 _Dec. 15 . . .Dec. 22Dec 29
Time deposits:Dec 1Dec. 8Dec 15Dec 22Dec 29
U. S. Government deposits:Dec. I -Dec 8Dec 15Dec 22Dec 29
Interbank deposits:Domestic banks:
Dec. lDec. 8Dec 15Dec 22Dec °9
Foreign banks:Dec 1Dec 8Dec 15Dec. 22Dec 29
Borrowings:Dec 1Dec 8Dec. 15.Dec. 22 -Dec 29Other liabilities:Dec 1Dec 18Dec 15 . . .Dec 22Dec. 29
Capital account:Dec 1Dec 8 . . -Dec. 15Dec. 22Dec. 29
Total
2,8592,8652.8822,8852,881
5,3745,2915,3055.3355,427
304340337367355
1,869• 1,803
1,8691,8251,886
1,3131,3071,2961,2881,207
14, 61214,70714, 67514,42314,431
5,2345,1835,1925,2015,2C5
416417684689691
5,0604,9965,0745,0425,090
418408415444442
61317
9
864872848859843
3,6313,6343,6303,6303,626
Federal Reserve District
Bos-ton
126127128130129
286306308311314
3638404140
117109108109115
8180808180
981999976976966
270270270269268
1818404040
203195194192198
99g8
10
11
1
2626272626
237237238238238
NewYork
1,0831,0871,1041,1081,109
2,6612,5792,6402,6352,678
6975788980
153141158151154
571565558559539
6,3406,4696,3746,2866,267
1,1301,0681,0701,0741,069
235235374375375
2,0512,0002,0842,0352,068
382371379406405
4 -
1444
386387379381373
1,6181,6171,6171,6171,615
Phila-del-
phia-
267264263263262
222217222229239
1821202120
130122136128146
8888888789
785776785772792
275275271271272
88
252525
'265260257258259
33333
2424252526
228228227227227
Cleve-land
261200260260258
333330334328345
3742424443
181173174171188
108108105106105
1,0721,0661,0911,0601,070
739738730729733
99
172020
315309305304316
11111
23
1921192020
350350349349349
Rich-mond
6566656363
138135129131130
1720192120
135123113107103
3639393736
4174164124064C4
193193193192193
66
141414
215216211209203
1
2
2826252625
9293939393
Atlan-ta
7677767676
101101105104107
1011111213
909495979S
3838383737
324321329323321
185184183185183
1011171818
180186186189190
11212
322
9
66676
8989898989
Chica-go
392393393394394
808810818802807
6168677473
319313317306324
9595918S90
2,2062,2122,2232,1782,182
870871870871872
6101898889
716712712719723
7/78i
2223222423
37037037C37C371
St.Louis
9494959494
137142140141141
1011101212
97949192
105
2423232323
40841141240440S
184183183183183
449
1010
228228225232240
1
788i
8
8990899C90
Min-neap-olis
4342424141
7275737273
566G6
767777i i80
1617171716
264205263
261
121121121121121
222«?
2
110113113115113
11111
78888
5757575756
Kan-sas
City
116115114113114
106165163160101
1113121313
194191209216222
2323232223
489478491485488
145145145145145
1011141414
340342346348349
3333
9292939292
Dallas
5050505050
117112113111113
1012111212
158164172104158
2929292828
401402407393391
127127127127128
1616222222
188190192198191
1
1
87
66
8182828282
SanFran-cisco
280290292293291
333319320311319
2023212223
213202219207193
204202205203201
925892912883881
9951,0081,0291,0341,038
3736616162
249245249243240
1414141413
32833S319326319
328329326321324
City
York
9209219419 in947
, 543,451,530,515, 553
5250600961
7000737173
4834774704 OS407
\ 8025,9175, 8205, 7325,731
722602602605060
22S228364364364
1,9851,9362,0211,9722,005
3S0370378405403
714
4
37337-1366367360
1,4831,48;1,4831,48-1,484
hica-go
256256255250256
60760S613595595
2931313334
1G1159104100109
0263595859
1,4801,4861,4961,4581,457
453454454455455
4545056565
529523524530532
66676
1819192019
247248247247248
Digitized for FRASER http://fraser.stlouisfed.org/ Federal Reserve Bank of St. Louis

36 FEDERAL RESERVE BULLETIN JANUARY 1938
COMMERCIAL PAPER, ACCEPTANCES, AND BROKERS' BALANCES
COMMERCIAL PAPER AND BANKERS' ACCEPTANCES OUTSTANDING[In millions of dollars]
End of month
Com-mer-cial
paperout-
stand-ing!
Dollar acceptances outstanding
Totalout-
stand-ing
By holders
Held by acceptingbanks
Total Ownbills
Billsbought
Held by FederalReserve banks
Forown ac-count
For ac-count offoreigncorre-spond-
ents
Heldby
others
By classes
Basedonim-
portsintoU.S.
Basedon ex-portsfromU.S.
Dollarex-
change
Based on goodsstored in or shippedbetween points in
U.S.Foreigncoun-tries
1936—September.October. __November.December.
1937—January...February..MarchAprilMay. _JuneJulyAugust....September.OctoberNovember.
197199191215
244268290285287285325329331323311
315330349373
387401396395386364352344344346348
276296309315
325'341r317318295273265263274282279
139150157151
154160150147137130144143-•148153148
137147152164
171180166171159143121120127129131
(*)
<2)
107110112126
141158160167168157143133127127122
758383
8479766862556568737579
76777670
77777676757471
6261
r Revised.i As reported by dealers; includes some finance company paper sold in open market.* Less than $500,000.Back figures.See Annual Report for 1936 (table 66).
CUSTOMERS' DEBIT BALANCES, MONEY BORROWED, AND PRINCIPAL RELATED ITEMS OFSTOCK EXCHANGE FIRMS CARRYING MARGIN ACCOUNTS
[Member firms of New York Stock Exchange. Ledger balances in millions of dollars]
End of month
Debit balances
Customers'debit
balances(net)i
Debitbalances in
partners'investmentand trading
accounts
Debitbalances In
firminvestmentand trading
accounts
Cash onhandand inbanks
Credit balances
Moneybor-
rowed *
Customers'credit balances*
Free Other(net)
Other credit balances
Inpartners'invest-
ment and ment andtrading
accounts
Infirm
in vest-
tradingaccounts
Incapital
accounts(net)
410429420423435424
428418419417408397397391385383376
1935—SeptemberDecember.
1938— March—.JuneSeptember,November.December.
1937—January....February-MarchAprilMayJune.-lJulyAugustSeptember.October. __November.
1,0981,2581,3511,2671,3171,3641,395
1,4331,4821,5491,5591,5031,4891,4931,5091,3631,0531,034
119135168164141150164
162188175163149161157149128135120
182179181219227260249
243230223227209214206202239263225
771930995985995986
1,048
1,0281,0841,1721,2151,1881,2171.3131,2331,088781723
257286303276289346342
372366346314284266265252256272270
8979898699110103
1181161151111019296929610795
i Excluding balances with reporting firms (1) of member firms of New York Stock Exchange and other national securities exchanges and (2)of firms' own partners.
s Includes both money borrowed from banks and trust companies in New York City and elsewhere in the United States and also money bor-rowed from other lenders (not including member firms of national securities exchanges).
NOTE.—For explanation of these figures see "Statistics on Margin Accounts" in BULLETIN for September 1936. The article describes the methodsby which the figures are derived and reported, distinguishes the table from a "statement of financial condition," and explains that the last columnis not to be taken as representing the actual net capital of the reporting firms.
Digitized for FRASER http://fraser.stlouisfed.org/ Federal Reserve Bank of St. Louis

JANUARY 1938 FEDERAL RESERVE BULLETIN 37
FEDERAL RESERVE BANK DISCOUNT RATES[Percent per annum]
Federal Reserve Bank
Rediscounts and advances un-der sees. 13 and 13a of the Fed-
eral Reserve Ac t l
RateDec. 31
In effectbeginning-
Pre-viousrate
Advances under sec.10(b) of the Federal
Reserve Act
RateDec. 31
In effectbeginning-
Advances secured bydirect obligations ofthe United States(last paragraph of
sec. 13 of the FederalReserve Act)
RateDec. 31
In effectbeginning-
BostonNew YorkPhiladelphia...ClevelandRichmondAtlantaChicagoSt. LouisMinneapolis...Kansas C i t y -DallasBan Francisco..
Sept. 2, 1937Aug. 27, 1937Sept. 4, 1937May 11, 1935Aug. 27, 1937Aug. 21, 1937Aug. 21, 1937Sept. 2, 1937Aug. 24, 1937Sept. 3, 1937Aug. 31, 1937Sept. 3, 1937
2
lH222222222
Sept.Oct.Sept.Oct.Sept.Aug.Aug.Sept.Aug.Sept.Aug.Sept.
2, 193710, 19354, 193719, 193510, 193721, 193721, 19372, 193724, 19373, 193731, 1937,17, 1937
444W4W2
4
Oct.Feb.Oct.MayFeb.Mar.Oct.Feb.Apr.MayMar.Oct.
20, 19338, 193420, 193311, 193519, 193417, 193416, 193323, 193515, 103310, 193512, 193419, 1933
i Rates indicated also apply to United States Government securities bought under repurchase agreement.Back figures.—See Annual Report for 1936 (table 40).
FEDERAL RESERVE BANKBUYING RATES ON ACCEPTANCES
[Percent per annum]
Maturity
1-15 days J_.16-30 days...31-45 days—46-60 days...61-90 days—91-120 days..121-180 days.
Rate ineffect onDec. 31
In effect be-ginning—
Oct. 20, 1933dodododo.dodo
Previousrate
111111IK
i This rate also applies to acceptances bought under repurchase agree-ments, which agreements are always for a period of 15 days or less..
NOTE.—Minimum buying rates at the Federal Reserve Bank ofNew York on prime bankers' acceptances payable in dollars; higherrates may be charged for other classes of bills. The same minimumrates apply to purchases, if any, made by other Federal Reserve banks.
Back figures.—See Annual Report for 1936 (table 41).
MAXIMUM RATES ON TIME DEPOSITSMaximum rates that may be paid by member banks as established by
the Board of Governors under provisions of Regulation Q.
[Percent per annum]
Savings deoosits -- *Postal Savings depositsOther time deposits pay-
able in;6 months or more90 days to 6 months —Less than 90 days
Nov
Jan.
. Itto31,
1933
1935
33
33
Feb. 1,to
Dec. 31,
1935
1935
?M
2lA
In effectbeginning
Jan. 1, 1936
2H2H
2H21
NOTE.—Maximum rates that may be paid by insured nonmemberbanks as established by the Federal Deposit Insurance Corporation,effective February 1, 1936, are the same as those in effect for mem-ber banks. In some States the maximum rates established by the Boardand the Federal Deposit Insurance Corporation are superseded bylower maximum rates established by State authority.
FEDERAL RESERVE BANKRATES ON INDUSTRIAL ADVANCES
Rates in effect Dec. 31,1937, on advances and commitments under Sec.13(b) of the Federal Reserve Act as amended June 19, 1934.
[Percent per annum except as otherwise specified]
Federal Reserve Bank
BostonNew York. . . .Philadelphia-Cleveland
RichmondAtlantaChicagoSt. Louis
Minneapolis..Kansas City..DallasSan Francisco
Advancesdirect to j
industrialor com*
mercial or-ganizations
3M~64-64-6
4^-6
66
5-64-5M
64-65-65-6
Advances to financ-ing institutions—
On por-tion forwhichinstitu-tion is
obligated
33
*2H2V2
4-65
I 2 H
4M-5
43-4
On re-mainingportion
3 ^4-5
(*)4
4-65
5-64
4M-5
5-64-5
Commit-ments
to makeadvances
1-1
1-2
1-1
* • }H-2
1 Authorized rate 1 percent above prevailing discount rate.* Same as to borrower but not less than 4 percent.1 Flat charge.Back figures,—See Annual Report for 1936 (table 40).
MEMBER BANK RESERVE REQUIREMENTS[Percent of deposits]
Classes of depositsand banks
On net demand deposits:!Central reserve city.Reserve cityCountry
On time deposits:AH member banks
June 21,1917-
Aug. 15,1936
13107
3
Aue. 16,1936-
Feb. 28,1937
19H15
4H
Mar. 1,1937-
Apr. 30,1937
22%17H12 M
May 1,1937,
and after
262014
6
1 See footnote to table on page 26 for explanation of method of comput-ing net demand deposits.
Digitized for FRASER http://fraser.stlouisfed.org/ Federal Reserve Bank of St. Louis

38 FEDERAL RESERVE BULLETfN JANUARY 1938
MONEY RATES AND BOND YIELDSOPEN-MARKET RATES Il>
Year,month* or
week
1934 average.* .1035 a v e r a g e . . .1936 ave rage . . .
1936—No vDec
1937—JanFebMar... . .AprMayJuneJulyAugSeptOctNov
Week ending:Nov. fL..._Nov. 1 3 . . . .Nov. 2O.___Nov. 27 . . . .Dec. 4Dec. 1 1 _ _Dec. 18....
[f NEW YORK CITY
Percent per annum]
Prevailing rate on—
Primecom-
mercialpaper,4 to 6months
1.02.76.75
H%
UU
U-
111
Primebank-
ers'accept-ances,
90days
.25
.13
.15
*/»Vie
5/l«
Vu~Vis
Vr-Vu
VieV«ViaVwVu
Vi«V I IVie7*V I IV I «Vie
Stock-ex-
changetimeloans,
90days
,90.56
1.16
IKIK
IKIKIKIKIK
IKiKIK
!H18IKIKIKIV*IK
Average rate o n -
Stockex-
changecallloanre-
new-als
1.00.56.91
1.001.00
1.001.001.001.001.001.001.001.001.001.001.00
1.001.001.001.001.001.001.00
U. S. Treas-ury bills
Newissues
of-fered
withinperiod1
.26
.14
.14
.10
.21
.36
.38
.58
.70
.65
.58
.49
.52
.53*.41
.15
.20
.14
.12
.12
.13
.12
.10
91-daydeal-ers'quo-
tation
.28
.17
.17
.11
.12
.22
.25
.42
.60
.57
.41
.34
.34
.37
.26
.15
.20
.16
.12
.12
.16
.18
.18
Aver-age
yield onU.S.Treas-
ury3-5 yearnotes
2.111.291.11
.991.04
1.181.221.421.591.481.541.441.451.501.421.31
1.341.321.281.301.311.271.28
f Revised.1 Series comprises 91-day bills until February 23, 1934, 182-day bills
from March 2, 1934, to February 23, 1935, 273-day bills from March 1,1935, to October 15, 1937, bills maturing about March 16, 1938, fromOctober 22, to December 11,1937, and 91*day bills thereafter.
* Average of 3 issues of 273-day bills.Back figures.—See Annual Report for 1936 (tables 42 and 43). Figures
for 91-day Treasury bills available on request.
RATES CHARGED CUSTOMERS BY BANKSPRINCIPAL CITIES
(Weighted averages of prevailing rates; percent per annum]
New York City:JanuaryFebruaryMarchAprilMayJune ——JulyAugustSeptemberOctoberNovember.December
Year8 other northern and
eastern cities;JanuaryFebruaryMarchAprilMayJune — -*.JulyAugust ,SeptemberOctoberNovemberDecember
Year27 southern and
western cities:JanuaryFebruaryMarchAprilMayJuneJulyAugust-SeptemberOctoberNovemberDecember
Year
1929
fi 746.735.815.855.885 935.886.056.066.085.865.74
5.88
5.875.865.916.006.09ft 0?6.086.116.246.256.125.94
6.04
5.945.966.046.078.106.166.17ft ??6.276.296.296.20
6.14
1930
5.645.355.224.914.744.594.484.414.294.264.174.16
4.69
5.885.665.475.225.135.064.814.794.744.754.664.68
5.07
6.126.056.985.865.755.695.635.585.555.545.505.43
6.72
1931
4,244 314.204.174.114.134 Ofi3 973.934.274.674.64
4.??
4.614.634.624.674.554 494.484.474.484.624.874.91
4.61
5.505.435.405.365.265.345.306 ?85.325.385.535.56
5.39
1932
4.714 714.724,694.554.614.424 454.304 364.124.22
4 49
5.075.136.145.105.145 135.055.125.034.964.884.88
6.05
5.615.615.645.635.645.625.635.685.635.566.555.60
5.62
1933
4.124.114.884.334.244.103.933,973.793 763.523.48
4 02
4.894.845.395.094.994 974.824.684.654.514.544.59
4.83
5.605.565.665.685.665.625.545.535.555 505.426.43
5.56
1934
3.583.433.313.393.423.303.303.333.263 B83.223.18
3,33
4.654.494.524.524.394,304.154 1?4.114.134.083.98
4.29
5.405.395.405.345.285.196.075.055.046 054.934.92
5.17
1935
2.832.902.642.612.692.662,612.672.722.722.772.61
2.70
4 084.024.053.993.883,783.873 793.753.753.633.67
3.86
4.954.844.854.804.794.764.584.634.514 554.514.55
4.69
1936
2.642.562.612.542.512.442 442.422.402.462.432,43
2.49
3.623.633.603.473.453.513.613 473.453.503.473.46
3.62
4.474.514.444.404.434.394.354.254.294 234.244.14
4.35
IN
1937
2.502.412.502.532.442.342 362.412.39?, 382.452.40
2.43
3 363.433.343.363.453.323.323 993.333.373.423.36
3.36
4 Ifl4.154.154.214.174.184.194.184.184 164.174.15
4.17
BOND YIELDS1
I Percent per annum]
Year* month, or week
Number of Issues
1935 averaE©1936 average - .*1936—November
December..... _1937—January
February . ,MarchApril _May
JulyAugustpeptfiTTibar r- - ,October . . . . . . . .November , _ .
Week endinjr:N o v . 27Dec. 4Dec. 11 . . . . _Dec 18Dec 24
U.S.Treas-ury *
7-12
3.102.702.472.292.272.292.312.502.742.672.642.592.im2.672.652.60
2.582.562.552.542.52
Munic-ipal*
15
4.033.413.072.852.762.792.963.193.243.143.113.073.013.183.243.17
3.183.193.153.153.13
Corporate*
Total
120
4.964.463.873.713.67
1-3.673.753.873.983 92
'3.923.913.924.044.204.30
4.384.344.284.264.24
By ratings
Aaa
30
4.003.603.243.153.10
*3 103.223.323 42
-"3.343.283.263.2.1
'3 303.293.26
3.273.263.253.243.22
Aa
30
4.443.95
'3.463 313.283.30
'3.403.603.583.493.45
»-3.453.453.513 603.62
3.653.633.603.583.57
A
30
5.084.554.023.853.78
r3.773.853.984.053 993 993 973.984.074 234.32
4.384.364.324.304.28
Baa
30
6.325.754.774.524.634 504.544.694.864 874.974.97
«*5 005.275 676.01
6.216.125.935.925.88
Indus-trial
40
4.524.023.50
i-3. 373.373 363 463.553.653 553 513 503 47
'3.55r3 633.65
3.713.713.683.663.65
By groups
Rail-road
40
4.964.954.244.003.963.954.044.174.294.274.294 314.404.604 885.20
5.345.275.125.115.06
Publicutility
40
5.404.433.883.743.693.683.763.903.993.953.973.923.89
*\ {64.084.06
4.084.064.044.024.01
• Revised.i Monthly and weekly data are averages of daily figures, except for municipal bonds, which are based on Wednesday figures.* Average of yields of all outstanding bonds due or callable after 8 years.« Standard Statistics Co., revised series.* Moody's Investors Service, week ending Friday. Because of limited number of suitable issues, less than 40 industrial bonds are included;
the industrial A ft" «™«* »»«»• *"«"* ~*A—At ***-*» J* \ . -* - J .__ - . . » ^
Digitized for FRASER http://fraser.stlouisfed.org/ Federal Reserve Bank of St. Louis

JANUARY 1938 FEDERAL RESERVE BULLETIN 39
BOND PRICES *
Year, month, or date
Number of issues
1934 average1935 average..1936 average
1936—NovemberDecember.*
1937—~ JanuaryFebruaryMarchAprilMayJuneJulyAugustSeptemberOctober - ___November
Nov 24Dec. 1Dec. 8Dec. 15Dec 22
U.S.Treas-ury*
7-12
103.5r106.1107.0
108.2'107.9107.3107.2105.2102.6103.3103.5104.3104.0103.3103.5104.0
104.3104.5104.6104.6104.8
Munic-ipa l
15
96.1105.3110.8
114.6116.3115.8112.7108.9108.0109.6110.1110.8111.8109.0108.1109.1
108.9108.8109.4109.4109.8
Corporate3
Total
60
84.588.697.5
99.899.9
100.3100.098.596.696.295.095.394.891.386.483.3
81.182.383.582.883.0
Indus-trial
20
81.988.292.2
94.294.594.894.793.592.091.991.291.491.990.085.582.7
80.181.581.881.481.3
Rail-road
20
83.879.494.7
99.299.6
100.6100.298.395.395.093.293.291.085.678.472.1
69.371.374.272.773.7
Utility
20
87.898.2
105.4
106.0105.6105.7105.1103 6102.4101.8100.6101.2101.498.495.295.0
93.894.294.594.394.5
1 Monthly data are averages of daily figures except for municipal bonds,which are averages of Wednesday figures.
2 Average prices of all outstanding bonds due or callable after 8 years,based on quotations from Treasury Department.
• Prices derived from average yields, as computed by Standard Sta-tistics Co. Municipal series revised back to 1934.
Back figures.—See Annual Report for 1936 (table 73); for U. S. Treas-ury bonds, see BULLETIN for May 1936, p. 317
STOCK MARKET
Year, month, ordate
Number of issues...
1934 average1935 average1936 average . .
1936—November. _.December
1937—JanuaryFebruary.....MarchApril ._..MayJune _July.August.September...OctoberNovember...
Nov. 24Dec. 1Dec. 8Dee. 15Dec. 22
Stock prices>
Pre-ferred*
20
120.7133.8138.9
139.0'140.2141.8141.2138.0136.0135.4135.2135.7137.213G.4133.5132.3
131.9131.6132.6132. 6132.3
Common (index, 1926=100)
Total
420
7278
111
1241231201301301251161141181211069183
7681848184
Indus-trial
348
8T91
127
14414314715215314713713413914412610790
8794989407
Rail-road
32
iT3451
5854565863605754525143353t
2831323032
Utility
40
6971
104
10911111411110610194919697898180
76SO817779
Vol-ume oftrad-ing
1,2041,4111,824
2,5752,0952,6672,5642,1331,466
859097017729
1,4982.3241, 420
1,4701,1211,087
<J571,146
r Revised.i Standard Statistics Co. Monthly data are averages of Wednesday
figures.i Average prices of industrial high-grade, derived from yields.3 Average daily volume of trading in stocks on the New York Stock
Exchange, in thousands of shares. Weekly figures are averages for theweek ending Saturday.
Back figures.—For stock prices, see Annual Report for 1936 (table 73).
CAPITAL ISSUES[In millions of dollars]
Year ormonth
102719281929193019311932 . .193319341935__1936
1936—Nov.Dec
1937—Jan .F e b . .Mar....Apr. . . .May. . .JuneJuly....AugSept.OctNov... .
Total
andre-
fund-ing)
9,7749,898
11,5137,6194,0381,7511,0632,1604,6996,214
372726603497382272261560344184223196134
Total(do-
mesticandfor-
eign)
7,5558,040
10,0916,9093,0891,194
7201,3861,4571,972
158266241168185152150359250
761568993
Total
6,2196,7899,4206,0042,8601,165
7081,3861,4091,949
158266241168185152150359250
761538693
Stateandmu-nici-pal
1,4751,3791,4181,4341,235
762483803855735
4948
14634476743907926412642
For new capital
Domestic
Fed-eral
agen-cies*
87640
87757764
40515022
000400
290
89000
25
Corporate
Total
4,6575,3468,0024,4831,551
325161178404
1,192
10921895
1301388578
2698249
1125926
Bondsand
notes
3,1832,3852,0782,9801,239
30540
144334839
971006474994547
1873933873922
Stocks
1,4742,9615,9241,503
31120
1203569
362
12118315639403182431625214
For-eigni
1,3371,251
67190522929120
4823
0000000000330
For refunding
Total(do-
mesticandfor-
eign)
2,2181,8581,422
709940557343774
3,2424,242
21445936232919712111120093
10867
10741
Total
1,9781,6201,387
627893498283765
3,2164.123
199459289255197101111200
9310867
10541
Stateandmu-nici-pal
35361353218737
136365382
1649590
12138
218
25724
Domestic
Fed-eral
agen-cies1
03000
610326
317987353
283
2621
41
16302927203427
{
Total
1,8501,6841,374
474821310210312
1,8043,387
1554082042251818787
1495756397010
Corporate
Bondsand
notes
1,5861,054
542451789315187312
1,7823,187
14539587
1401626966
1392051
(*)7010
Stocks
264530833
23324
320
81200
1013
116841918211137
639
00
For-eign>
241238
3fi1826069000
26110
160
7374
020
0000020
1 Includes issues of noncontiguous U. S. Territories and Possessions.8 Includes publicly offered issues of Federal credit agencies, but excludes direct obligations of U. S. Treasury.* Less than $500,000.Source.—For domestic issues, Commercial and Financial Chronicle; for foreign issues, U. S. Department of Commerce. Monthly figures subject
to revision.Back figuret.—See Annual Report for 1936 (table 72).
Digitized for FRASER http://fraser.stlouisfed.org/ Federal Reserve Bank of St. Louis

40 FEDERAL RESERVE BULLETIN JANUARY 193S
TREASURY FINANCEUNITED STATES GOVERNMENT DEBTVOLUME AND KIND OF DIRECT OBLIGATIONS
[On basis of daily statements of United States Treasury. In millions of dollars]
End of monthTotalgrossdebt
Interest-bearing
Totalinterestbearing
Publicly offered»
Total
Bonds
Pre-war
Treas-ury*
U.S.Savings
Notes Bills
Ad-justedserviceissues3
Socialse- "
curityAll
other*
Noninterest-bearing
Ma-tureddebt
Other
1932—June1933—June1934—June1935—June1936—June
1936—November.December.
1937—January...February..MarchAprilMayJuneJulyAugustSeptember.October. . .November.
19,48722,53927,05328,70133,779
33,79434,40734, 50234,60134,72834,94135,21336,42536,71637,04536,87536,95637,094
19,16122,15826,48027,64532,989
33,08833,70033,82133,92634,06434,29534,59135,80036,11336,45036,26436,36636,511
18,816821,782«26,00626,91031,297
31,87732,49732,58232,61732,72232,88433,10733,73433,91834,14633,87733,90033,924
75375375375379
79797979797979797979797979
13,46013,41715,67914,01917,168
18,14919,45219,45219,45219,93619,93619,93619,93619,93619,93619,93619,93619,936
62316
447475509567722752775800
885908932
1,2614,5486,65310,02311,381
10,84910,28910,28910,2679,7839,7649,76410,61710,61710,61710, 57510,57510, 575
616954
1,4042,0532,354
2,3532,2032,2532,253
2,3532,5532,3032,4532,6532,4032,4032,403
10592118156
1,071
526504489475461451445926915905
883
19
4764119204322407489579649769868957
1,086
240284356680601
637635632630559552550560632630623620619
606654
231169
143153137139136126110119103100122109106
266315518825620
563554544536528620512506499494489482477
» Excludes postal savings bonds, formerly sold to depositors in the Postal Savings System.* Includes Liberty bonds.* Includes adjusted service bonds of 1945 and special issues of adjusted service bonds to Government Life Insurance Fund series and of cer-
tificates to the adjusted service fund.* Includes special issues to old-age reserve account, unemployment trust fund, and railroad retirement account.«Includes postal savings bonds and special issues to retirement funds, to Postal Savings System and to Federal Deposit Insurance Corporation* Includes certificates of indebtedness not shown separately: 1932—$2,726,000,000; 1933—$2,108,000,000; 1934—$1,517,000,000.
MATURITIES OF PUBLICLY OFFERED DIRECTOBLIGATIONS, NOVEMBER 30,1937
[In millions of dollars]
Date maturing
1937—December193S—Jan. 1-Mar. 31
Apr. 1-June 30.July l-Sept. 30Oct. 1-Dec. 31
1939—Jan. 1-Mar. 31Apr. 1-Dec. 31
19401941 .194219431945 „19461947 -1948 . „19491951195219531954195519561959I9601961
Total
Total
7011,6331,268
747433942
2,2472,8542,219
768898
1,5851,862
3 2,1011,036
8191,2231,2501,7862,663
755489982
2,61150
33,924
Bonds*
834"
8981,5851,862
l 2,1011,036
8191,2231,2501,7862,663
755489982
2,61150
20,946
Notes
732618596433942
2,2472,8541,385
768
10,575
Bills
701901650150
2,403
* Issues classified as of date of final maturity; most issues callable atearlier dates; most of the U. S. Savings bonds are redeemable at optionof holder.
»Includes unclassified U. S. Savings bonds.
FULLY GUARANTEED OBLIGATIONS, BY AGENCIES *
[In millions of dollars]
End of month
1933—December...1934—June
December-..1935-June
December.,.1936—June
1936—November-December..
1937—JanuaryFebruary... .MarchAprilMayJuneJulyAugustSeptember-OctoberNovember. .
Total
180681
3,0634,1234,4944,718
4,6624,6624,6624,6624,6624,6604,6604,6654,7034,6334,6334,6344,644
FederalFarm
MortgageCorpora-
tion
312980
1,2261,3871,422
1,4221,4221,4221,4221,4221,4221,4221,4221,4201,4001,4001,4001,410
HomeOwners'
LoanCorpora-
tion»
1341,8342,6472,8553,044
2,9882,9882,988
2,9882,9872,9872,9872,9872,9372,9372,9372,937
Recon-structionFinanceCorpora-
tion
»180235249250252252
252252252252251250250255295296296297207
i Principal amount of obligations guaranteed as to interest and princi-™w- ^ ^ J f ^ V 1 ? 1 1 8 h e l d b y U ' S* Treasury and reflected in the$£«?« A A ? w total includes guaranteed debentures of the Federal
i H i f t ^ ' amounting to $124,086 on November 30,1937.* Excludes obligations guaranteed as to interest only,
rua 1934 6S giVeD i n p u r c h a s e of S° ld w h i c h W(*e retired in Feb-
Digitized for FRASER http://fraser.stlouisfed.org/ Federal Reserve Bank of St. Louis

JANUARY 1938 FEDERAL RESERVE BULLETIN 41
SUMMARY OF TREASURY OPERATIONS[On basis of daily statements of United States Treasury. In millions of dollars]
Period
General and special accounts
Receipts
TotalIn-
cometaxes
Socialsecur-
itytaxes
Otherinter*nal
reve-nue^
Allother »
Expenditures *
Total
General
Inter-est ondebt
Na-tional
de-fenseandVet-
erans'Adm.*
Allother
Re-cov-eryand
relief
Re-volv-ing
funds(net)'
Trans-fers totrustaccts.etc.*
Excessof re-ceipts<+)or
ex-pendi-tures(-)
Trustac-
counts,etc7
excessof re*ceipts(+)or
ex-pendi-tures(-)
Increase or de-crease during
period
Generalfund
balanceGrossdebt
Fiscal year ending:June 1935June 1936June 1937
5 months ending:Nov. 1935Nov. 1936 ,Nov. 1937
1936—November..,December...,
1937—January.—_.FebruaryMarchAprilMayJuneJulyAugustSeptember _.OctoberNovember...
3,8004,1165,294
1,4681,6412,311
233517284275
1,012363335868409453788333327
1,0991,427'2,158
326420671
4358
7005747
5475735
5014037
<8>253
(8)276
8
2,1792,0862,187
9591,079
148175168148190166170212221301186189182
523603697
264262285
52577058716260567756515249
8,4778,001
2,8562,8473,053
535656631553754708552
1,300659556680616542
821749866
250263
81401420159
194122115967
1,0891,3401,436
508593635
114118116112121129119128128127125126128
1,3151,3101,994
584708
153150159176225230169179197162161183165
3,3663,3413,079
1,2441,403859
272294230214252243211232198175159168159
1419 78
»244
128»223
70
» 149 47
67»13M6• 79227»210201625
711,814
868
141102351
14545454545
54012561555555
-3,002-4,361-2,707
-1,387-1,206-742
-303-138-348-279+257-345-217-432-249-103+108-283-215
+613+123-67
+47-85
+128
- 1 7+26+72
-~98+8- 3
+20+44+37+20+18+10
-741+840-128
-407-1,276
+55
-358+500-180-187+287-124+52
+800+85
+263- 4 3
-184- 6 8
+1,648+5,078+2,646
+933+16
+669
-38+613+95+99
+127+212+272
+1,212+291+329-170+81
+137
1 Excludes debt retirement.* Includes miscellaneous internal revenue, unjust enrichment tax, and processing taxes.* Includes customs and miscellaneous receipts.* Excludes expenditures for adjusted service which are included under "Transfers to Trust Accounts, etc."e Includes revolving funds of Reconstruction Finance Corporation, Commodity Credit Corporation, Public Works Administration, Farm
Credit Administration, and Export-Import Banks.* Includes expenditures for retirement funds, adjusted service certificate fund, old-age reserve account, and railroad retirement account.»Includes, also, increment resulting from reduction in weight of the gold dollar, and expenditures chargeable against increment on gold (other
than retirement of national bank notes), receipts from seigniorage, transactions in checking accounts of Governmental agencies, unemploymenttrust fund, old-age reserve account, and railroad retirement account.
«Less than $500,000. 9 Excess of credits.
GENERAL FUND BALANCE[On basis of daily statements of United States Treasury. In millions
of dollars]
End of month
1932—June1933—June .1934—June1935—June-
1936-MayJuneJulyAugustSeptember-OctoberNovember..December.-
1937—JanuaryFebruary,..March ,AprilMayJuneJulyAugustSeptember.October __..November.
Total
417862
2,5821,841
2,3582,6822,2301,9042,188.,764,406,906
,726.,539,826,702,754
2,5532,6392,9022,8602,6762,608
In-activegold
26
127205343568758
1,0871,2131,3351,2091,2711,243
Incre-ment
on gold
811700
141140141140140141141141
141141141141141141141141141141141
iorage
140
308316319323329332333337
3443433503543563693753823SS394
Work-ing
balance
417862
1,7711,001
1,9102,2251,7711,4411,7191,291931
1,401
1,118849995642501970915
1,0511,128875831
Digitized for FRASER http://fraser.stlouisfed.org/ Federal Reserve Bank of St. Louis

42 FEDERAL RESERVE BULLETIN JANUARY 193S
GOVERNMENTAL CORPORATIONS AND CREDIT AGENCIES, OCTOBER 31, 1937[Based on compilation by D. S. Treasury Department from reports received from organizations concerned. In millions of dollars]
ASSETS
Loans and preferred stock:Loans to financial institutions^.Preferred stock, etcHome mortgage loans -Farm mortgage loansOther agricultural loansAll other loans
Total loans and preferredstock
CashUnited States direct obligationsObligations of Government credit
agencies:Fullv guaranteed by U. SOthers
Production credit association classA stock
Accounts and other receivablesAll other assets
Total assets other than inter-agency 2 __
LIABILITIES
Bonds, notes, and debentures:Guaranteed by United States.__Other2
Other liabilities (including reserves)
Total liabilities other thaninteragency 2
Excess of assets over liabilities, ex-cluding interagency transactions..
Privately owned interests _.
U. S. Government interests
Financed wholly from Government funds
Recon-structionFinanceCorpo-ration
296563
1834
1,6941
27
3311
1,766
297
53
350
1,416
1,416
Com-modityCreditCorpo*ration
130
1300)
(0(0
130
60(*)
60
70
70
PublicWorksAdmin*
istra*tion
124
124
22
146
146
146
Agricul-turalcredit
institu-tions
17
1795
1425
771
0)
148
5
5
143
143
Other
10)
170295
4665634
2
35322
915
(0
47
51
864
864
Financed partly from Governmentfunds
Farmmort-gage
institu-tions
2,887
2,8877851
(i) "25
177160
3,357
1,400= 1,115
175
2,689
668175
493
Otherfarmcredit
institu-tions
259
25938
107
406
5t1)
456
1817
188
2083
264
Homemort-gage
institu-tions
1843 203
2,446
2,8337318
14
26»458
3,422
2,93754
151
3,142
28039
241
Other
11
0)
119
359
102
423
508
0)109
109
399139
260
Total
Oct. 31,1937
492767
2,4462,887
578.1,253
8,422265600
17037
77282996
10,849
4,6341,413
547
6,594
4,255357
3,898
Sept. 30,1937
488766
2,4722,892
5611,272
8,452248597
17040
77279964
10,827
4,6691,423
529
6, 621
4,206355
3,851
Oct. 31,1936
534769
2,8352,939
6141,221
8,912265500
19729
75297628
10,904
4,6821,446
439
6,567
4,337350
3,987
i Less than $500,000. * Excludes $761,000,000 of Federal land bank bonds held by Federal Farm Mortgage Corporation.» Shares of Federal savings and loan associations subscribed by HOLC are classified in "Preferred stock, etc." Shares held by U. S. Treasury
amounting to $48,000,000 are classified under "All other-assets."NOTE.—For explanation of table and back figures see BULLETIN for April 1936, p. 220.
RECONSTRUCTION FINANCE CORPORATION LOANS AND INVESTMENTS{Amounts outstanding. In thousands of dollars]
Nov. 30,1936
May 31,1937
June 30,1937
July 31,1937
Aug. 31,1937
Sept. 30,1937
Oct. 31,1937
Nov. 30,1937
Loans to financial institutionsLoans on preferred stock of banks and insurance companies..Preferred stock, capital notes, and debentures ,Agricultural loansLoans to railroads (including receivers)Loans for self-liquidating projectsLoans to industrial and commercial businesses...Loans to drainage, levee, and irrigation districtsOther loansSecurities purchased from Public Works Administration...
Total loans and investments, other than interagency.
Loans to Federal land banksLoans to Commodity Credit Corporation ..._._Capital stock of Commodity Credit Corporation..Capital stock of, and loans to R. F. C. Mortgage Co-Preferred stock of Export-Import banksCapital stock of, and loans to other agencies
Total loans and investments
330,88347, 586
658,6541,273
345,190194,18461,64563,125
1,935136,850
277,34940,677
587,6681,402
344,823218,58969,52471,2532,312
120,404
271,85840,483
581,9001,349
354,320221,90770,54972,4242,533
119,585
271,00940,027
576,6721,236
351,936225,40771,18174,6052,562
87,320
266,28339,414
567,8791,073
351,855227,10872,83375,0382,793
86,843
261,10439,167
566,090973
356,279231,17173,10177,180
85,621
256,96538,949
563, 4651,035
355,932232,41473,28377,1602,911
88,999
i 249,59438,800
559,6231,028
355,923234,113
72, 68677,1792,941
117, 504
1,841,325
27,62098,41797,00035,70120,000
100
1,734,001
13,93450,37197,00045,99420,0007,400
1,736,909
13,75747,39397,00048,28620,00010,000
1,701,954
13,58661,23897,00051,30220,00011,898
1,691,120
13,2751,876
97,00053,07320,00012,948
1,693,584
13,2123,36197,00057,48720,00016,423
1,691,114
13,04210,16597,00060,15020,00019,698
1,709,392
12,30831,29897,00062,77920,00024,848
2,120,163 1,968,700 1,973,345 1,956,977 1,889,291 1,901,06' 1,911,168 1,957,624
* Includes $79,000,000 of loans for distribution to depositors of closed banks.NOTE.—For explanation of table and back figures, see BULLETIN for April 1936, p. 220.
Digitized for FRASER http://fraser.stlouisfed.org/ Federal Reserve Bank of St. Louis

JANUARY 1938 FEDERAL RESERVE BULLETIN 43
FARM CREDIT ADMINISTRATIONLOANS AND DISCOUNTS OUTSTANDING, BY INSTITUTIONS
[In thousands of dollars]
End of month
Farm mortgage loansb y -
Federalland banks
LandBank
Commis-sioner
Federal intermediatecredit bank loans toand discounts for—
Regionalagri-
culturalcredit cor-porations,productioncredit as-sociations,and banksfor cooper-
atives 1
Otherfinancinginstitu-tions,except
coopera-tives
Produc-tion creditassocia-
tions
Regionalagricul-
tural cred-it corpo-rations
Emer-gency
crop anddrought
loans
Loans to cooperatives by—
Federalinter-
mediatecreditbanks
Banks forcooper-atives,
includingCentralBank
Agricul-tural
Market-ing Actrevolv-
ing fund
1933—December1934—December1935—December1936—November
December1937—January
FebruaryMarchAprilMayJuneJuly ,AugustSeptemberOctoberNovember.,.
1,232,7071,915,7922,071,9252,065,7192,064,1582,061,4722,060,2332,057,9302,055,3972,053,5582,052,3392,050,5222,047,6502,045,2762, 042, 6372,039,005
70,738616,825794,726836,194836,779836,062835, 509833,821832,881831,705830,577828,771826,317823,257820,163816, 653
73,26399,675104,706131,644129,872125,825130,139144,250153,795159,073164,977170,110171,270167,477159,898160,627
60,98955,67247,16241,27741,01740,08041,06142,36744,04245,13147,33748,16748,38646,57342,41440,857
2760,85294,096
105,441105,212106,081114,551131,905143,902152,466160,051163,553162,515153,977142, 652137,473
144,63687,10243,40026,49125,28824,45424,24923,89223,58823,45322,91422,06921,12619,43417,49116,208
"91,090111,165172,489166,291164,887163,868163,250174,709187,185189,686189,141187,353185,802182,331177,362173,701
15,21133,969
2,7311,3361,6411,4861,3591,3051,2491,070
6351,1261,0471,1571,2291,509
18,69727,85160,01?72,60069,64764,41160,35666,73649,31445,00045,03252,40556,34166,89773,45082,026
157,75254,86344,43356,21653,75454,32262,35951,81048, 52247,73246,85445,66444,28147t23fl45,29645,284
*• Revised.i Some of the loans made by the regional agricultural credit corporations and the banks for cooperatives and most of the loans made by the
production credit associations are discounted with the Federal intermediate credit banks. The amounts in this column are thus included in thethree columns under those headings. Such loans are not always discounted in the same month in which the original credit is extended.
FEDERAL HOME LOAN BANK BOARD
LOANS OUTSTANDING, BY INSTITUTIONS
[Loans in thousands of dollars]
End of month
1933—December,.1934—December..1935—December..
1936—NovemberDecember
1937—January —FebruaryMarchApril ,MayJuneJulyAugustSeptemberOctoberNovember
Home mortgage loans b y -
HomeOwners'
Loan Cor-poration i
132,3862,379,4912,897,162
2,801,8272,765,0982,729,2742,698,6112,661,5422,625,4932,591,1152,556,4012,524,1292,497,2242.472.4212,446,0022,422,149
Federal savings andloan associations
Number ofassociations
Total
1,023
1,2061,2121,2281,2401,2491,2571,2701,2861,2931,2961,3071,3111,318
Re-port-ing
455881
1,0801,0651,1431,1571,1681,1681,1661,1811,1811,2001,2111,2111,194
Loansre-
ported
69,734316,683
544,130544,107576,299611,212630,680652,557679,949703,996722,442746,958769,117782,846782, 495
Federalhomeloanbank
loans tomemberinstitu-tions *
85,44286,658
102,795
137,261145,401143,745141,205142,720146,149153,491167,057169,571175,607179,511184,041187,336
ouU IJUCLII lUoliraDCo \JurporuiHJJj auu tu vmiuuo oariugo auu iuau wwu-
ciations, real estate and other property, and accrued interest receivable.* Includes loans to Federal savings and loan associations, all of which
are members, and a negligible amount to others than member institutions.
POSTAL SAVINGS SYSTEM
[In millions of dollars]
End of month
Depos-itors'bal-
ances'
1933—June..1934—June..1935—June.,1936—June..
1936—September—OctoberNovemberDecember
1937—January..FebruaryMarchAprilMayJuneJulyAugustSeptemberOctober . . .November.
1,1871,1981,2051,232
1,2511,2551,2571,2601,2661,2701,2721,2701,2681,2681,2711,2731,270
Pi, 269Pi, 270
Assets
Total
1,2071,2251,2361,265
1,2851,2901,2931,2961,3031,3071,3101,3071,3061,3071,3091,3121,307
CashIn de-posi-tory
banks
977695385203
162158145145136133132134134136134133133
U. B. Governmentsecurities
Total
131453777967
9821,0111,0291,0581,0601,0611,0971,1001,1001,1001,1001,1001,100
Di-rectobli-
tions
131418630800
815844862891893894930933933933933933933
Guar-an-teedobli-ga-
tions
35147167
167167167167167167167167167167167167167
Cash,re-
servefunds,etc2
99777495
141121119
93107113
81737271757974
p Preliminary.i Outstanding principal, represented by certificates of deposit. Does
not include accrued interest nor outstanding savings stamps.»Includes working cash with postmasters, 5-percent reserve fund and
miscellaneous working funds with the Treasurer of the United States,accrued interest on bond investments, and accounts due from late post-masters.
Back figures.See BULLETIN for August 1935, p. 502.
Digitized for FRASER http://fraser.stlouisfed.org/ Federal Reserve Bank of St. Louis

44 FEDERAL RESERVE BULLETIN JANUARY 1938
PRODUCTION, EMPLOYMENT, AND TRADE(Index numbers; 1923-25 average-100. The terms "adjusted" and "unadjusted" refer to adjustment for seasonal variation]
Yearand
monthUJUJ-lLrU
191919201QO119221923.10241925192619271928192919301931193219331QO41935.1936
1934
OctNov.Dec
1935
JanFebMar.....ApriU..May.—June....JulyAugSeptOct.
Dec
1936
Jan.FebMarApril....May..._JuneJulyAugSeptOct.NovDec
1937
JanFebMarApril....May....JuneJulyAugSept,....OctNov
Industrial production^
Total
A A.flu
justed
:::::
747586
9090888685878688919596101
07Mi
9493101101104108108109110114121
114116118118118114114117111102P&9
Unad-justed
8387678510195104108106111119968164767990105
757478
889191898786838790979896
959596104105104105106107111115114
112117122122122115111115109102
Manufac-tures
Ad-usted
—~-*
"I"'.
727485
9088878684858789929597101
969293100101105109
no110iii115121
115116117118118114114118110100J>85
Unad-justed
8487678610194
105108106112119958063757890105
737376
879191918784838789969895
959397105105105105106107110115114
11311812212512311411011410699
J>86
M in era Is
Ad-usted
-
:
- • " "
'.'.III
818190
9597978800998583879393102
1041119710610210010190102105112117
110115128116116114112112115113
*108
Unad-justed
77S9707410596O.Qyy
1081fl7IV 4
106115990471828691104
878485
9293907988978586931019697
1001079095101101102104110115115111
106111118105117117115120
, 125122
Pill
Construction contracts awarded (value) *
Total
Ad-justed
::::::
313131
272826272730353843486068
625247474652596259575866
63625653566168635652*55
Unad-justed
636356798494199
129inn13511792
DO28253237BE00
292825
2224263032353940444553£4
604547536660656560645163
51545661687275665649
Residential
Ad-usted
------
"III.
121112
121416182124252425252626
252526303236444647434045
45474544444244403736*32
Unad-justed
443044688195124121117126875037131112210701
121110
101316222526252425252522
212228353839454647413938
37424751524745403735*31
All other
Ad-usted
I" II"
-III-I
464847
3939353332364360686688103
Q9y*7663605765717569AQoy7283
77756461667787817165*74
Unad-lusted
799065888694120135139142142125CMO*40374860iV
434136
3233343839436054596276£0
if,to
6362677078828170(•rDO
6266
636463688192100887261*63
Factory em-ployment1
Ad-usted
IIIII
—
818182
848586868584858686878889
QQOtf
8788899090939394
9699
9910010110210210110310210198P94
Unad-usted
107108829010496100101999910591776672838609
828082
828586868583848688898988
070/8788899090919496Q7VI
9798
•97991011021021011011021021C1*>95
Fac-torypay-rolls*
Unad-usted
9811877821039610110410210210989674649637100O i
626164
657072726967677174767678
4%7478798181808484enoy9195
0196101106105103100104100100*89
Freigload
Ad-usted
E:"".—595960
636665626164596364686868
T(\(U7166717273767675778283
8082838480788079787671
ht-carings**
Unad-usted
8491788510098103107104104107927455586264
/o
656057
596263596063596471756964
656864687173777784868477
7376807980798281878472
Deparstore 1
(va
Ad-usted
IE——
747577
767779757479807781788283
818384848787918688909492
9395939393939492949391
tmentsales*ue)
Unad-usted
78948788989910310610710811110209\)£6967757988
8283135
5961717976765561868691145
636677858984636894100105161
7276908995906572100103101
p Preliminary.• Average per working day.t For indexes of groups and separate industries see pp. 45-46; for description see BULLETIN for February and March 1927S;?0?*? mov,m8,sverage of F. W. Dodge Corporation data centered at second month; for description see page 35S of BULLETIN for July 1931.
• The indexes for factory employment and payrolls unadjusted for seasonal variation are compiled by the Bu^au of Labour Statistics Fordescriptiont and back figuresRfor the seasonal y adjusted index of factory employment compiled by F. R. Board o^Governors Yw pagi 95^978 ofwdUu^^trr iddleofmonth * ° £ r ° U P S ^ S e p a r a t e m d u s t r l e s See PP- ^ Underlying figures are forplyrollperiod
* For indexes of groups see p. 52.
l oad ing%%5£m*2t£S£&J%S&t W)- F°r d6PartmeDt St°re S8le3 See P" m of »™*™ "* » 4 1836' and f°r " « «
Digitized for FRASER http://fraser.stlouisfed.org/ Federal Reserve Bank of St. Louis

JANCART 1938 FEDERAL RESERVE BULLETIN 45
INDUSTRIAL PRODUCTION, BY INDUSTRIES (ADJUSTED INDEXES)[Index numbers of the Board of Governors; adjusted for seasonal variation. 1923-25 average = 100]
Industry
Manufacture*—Total „
IRON AND STEEL _ __Pig ironSteel ingots
TEXTILES . . _ .Cotton consumptionWool .
Consumption.. . __Machinery activity i *Carpet and rug loom activity1
Silk deliveries
FOOD PRODUCTS:Slaughtering and meat packing....
HogsCattle -Calves. „.Sheep
Wheat flour . .Sugar meltings.—
PAPER AND PRINTING:Newsprint productionNewsprint consumption _ . . .
TRANSPORTATION EQUIPMENT:Automobiles .Locomotives3.—
LEATHER AND PRODUCTSTanning
Pottln hirta Innf-honsCalf and kip leathers . . .Goat and kid leathers
Boots and shoes .
CEMENT AND GLASS:Cement . . . . . . . . . . . . . . . .Glass, plate - —
NONFERROUS METALS:Tin deliveries1
ZincLead
FUELS, MANUFACTURED:Petroleum refining.
Gasoline1
Fuel oil*Lubricating oil»
finite, byproduct _ . . .Coke, beehive -- -
RUBBER TIRES AND TUBES » _
Inner tubes»
CigarsCigarettes .Manufactured tobacco . »-.
lUlnArnla Total
Petroleum, crude
Zinc . .LeadSilver
1936
Oct.
I l l
12798
130
114120105109104
95. 121
10594
1151291628268
62140
93
11293
10065
103125
87242
105101
71
191249
9012411012«
19
118121
94
14674
20286
105
8652
15298
10171
Nov.
115
13799
141
121123118128118
92125
109100115122169
8383
67150
105
116104111
79112124
91164
97100
74
188241
92124114130
20
126130
92
15075
20986
112
9569
152110100
74OQ
Dec.
121
143104147
139144140160134
94134
10085
117125160
87115
64141
1221 K
134108111
98111151
9189
1059880
191242102132116137
20
123128
91
18383
26592
117
9773
161
98SO
1937
Jan.
115
139107142
124129121126130
92118
8765
111130175
8798
63142
120
136108111
90119154
8677
1258076
189236117135111137
21
123128
91
16583
23476
110
8656
164
SO76no
Feb.
116
129107131
126132129132137104112
8666
1081221518989
62145
1201 1
134106108
92114162
85244
1318370
194245106130126136
22
133138
99
16878
24281
115
9850
168
837094
Mar.
117
126108128
••128136128139125101114
8969
113136139
89108
64144
12124
132103106
85115150
93229
144107
75
190242108126120138
25
13213799
15383
21284
128
11281
173
1077593
Apr .
118
130109132
124130119128118
96120
9375
113130142
95123
62144
130
13110710794
121146
87241
138110
85
195249103123131141
25
133138100
15882
22089
115
7297
174
11085
103
May
118
134114136
123130121132120
93109
765499
1241458998
62147
13531
133109111
82133148
78223
115116
76
200253112130131143
31
132137
94
15574
22181
116
8063
176169116
76101
June
114
119107121
126136119129118
94115
7749
111134145
9469
61145
13030
1181029983
128129
74260
112115
70
202256114133129134
29
123128
84
15073
21280
114
8074
172122115
70107
July
114
140121141
11112595
102967197
704499
1291399191
64140
12925
115949168
127129
75206
100112
82
20626111913912414432
102105
73
16478
23386
112
7947
174121112
82148
Aug.
118
142123144
115129106120
968392
7850
111141148
8396
65141
15721
109939363
124120
73216
108110
82
207265121134121149
28
15973
22979
112
7837
181126110
82139
Sept.
110
125119125
10812188968080
103
8767
109140150
8345
65147
13529
' 9 8'86'8760
108••105
73199
136116
77
21627710914712614825
16277
23181
115
8652
17711311677
116
Oct.
100
10095
101
91101G5637459
105
8976
102120139
8673
03145
14234
888085529294
79179
H I115
81
21727711014713412S
20
15573
22182
113
8355
17691
1158191
^ov.
*>S5
G86708
P80<J1
P51*>51*>59P40
94
867496
115139
86101
64130
92
*82
"~*S3
76151
11510879
14
15573
22183
J»108
*>75*>65
P17540
10879
i Without seasonal adjustment. * Preliminary. ' Revised.NOTE —For description see BULLETINS for February and March 1927. For latest revisions see BULLETINS for March 1932, pp. 194-196, Sep*
tember 1933 DD 584-587* November 1936, p. 911, and March 1937, p. 255. Series on silk-loom activity and on production of book paper, wrappingpaper, fine paper, box board, mechanical wood pulp, chemical wood pulp, paper boxes, and lumber, usually published in this table^ are in processof revision.
Digitized for FRASER http://fraser.stlouisfed.org/ Federal Reserve Bank of St. Louis

46 FEDERAL RESERVE BULLETIN JANUARY 1938
INDUSTRIAL PRODUCTION, BY INDUSTRIES (UNADJUSTED INDEXES)[Index numbers of the Board of Governors; without seasonal adjustment 1923-25 average= 100]
Industry
Manufactures—Total -
IRON AND STEELPig iron . . . .Steel ingots
TEXTILESCotton consumptionWool
Consumption __ -.*_.__Machinery activityCarpet and rug loom activity.
Silk deliveries . . .»
FOOD PRODUCTS:Slaughtering and meat packing..
CattleCalvesSheep
Wheat flourSugar meltings --- -- --
PAPER AND PRINTING:
NewsDrint consumption
TRANSPORTATION EQUIPMENT:AutomobilesLocomotives1
LEATHER AND PRODUCTSTanning
Cattle hide "leathersCalf and kip leathersOfifit flnd Virl IftjittafirsBoots and shoes*—., - . . ~--
CEMENT AND GLASS:CementQlass, plate .. - - -.._« --
NONFERROUS METALS:Tin deliveriesZinc — - - . . - -
FUELS, MANUFACTURED:Petroleum refining
GasolineKeroseneFuel oil - . -_ . .Lubricating oil
Coke, byproductCoke, beehive
RUBBER TIRE** AND TUBES .Tires, pneumatic . _ _.Inner tubes _. .
TOBACCO PRODUCTSCigars . . .Cigarettes - . .
Minerals—Total
Bituminous coal,_ . . -Anthracite ..Petroieumt cm deIron oreZinc ..........LeadSilver. „
Oct.
110
12398
126
118123til12010495
121
10480
1341351679265
62149
65
7
12398
10277
107140
09242
1059873
192249
9512411012P
19
11812194
15791
21290
115
9467
1531679873
118
193fi
Nov.
115
127100130
12512812514011892
129
1211101331241679065
66160
127
12
11210210975
111118
90164
9710077
189241100124114133
21
12613092
16390
20783
115
10671
15093
10077
106
Dec
114
125102128
132133141161134
m119
1171111221191578466
64145
147
15
11410510884
120119
7189
10510081
192242111132116138
21
12312891
14962
31775
111
10372
166
10081
114
J a n
113
134105136
130••13612313013092
135
10087
1121211768564
64137
120
10
12610411275
113140
5277
1258577
189236119135111138
24
12312891
15664
23077
06
9661
158
8577
100
Feb.
118
135109138
134141135144137104120
857395
114H28688
62143
12013
13611011685
119153
51244
1318972
1942451081301261402S
13313899
15367
22082
111
10354
165
8972
102
Mar .
122
142114145
132143129141125101110
846999
13712683
127
63149
140
13610310776
117157
67241
14411377
19024210412612014230
13213799
14676
20185
118
11267
171
11377
102
Apr.
125
144115146
12714011712411896
119
836799
14113387
143
63154
158
12810510785
120143
85265
13811484
19524910212313114227
133138100
14577
20086
105
61101174
11484
104
M a y
123
146116149
12313411612212093
108
745296
14014283
109
63151
163
12210310578
124134
92234
11511775
20025310813013114228
13213794
15776
22482
117
7063
1772381177598
193:
June
114
119105121
11913011311611894
102
7650
1041391428382
63144
147oo
1141009780
128123
91234
11211172
201256
" 10613312913224
12312884
16480
23482
117
7265
17524011172
105
July
110
130115132
1031148991967192
673998
12513988
111
62124
132OK
113938879
118127
92185
10010479
20626111013912414025
10210573
17882
25686
115
7238
17724510479
126
Aug.
114
139118141
108116102111968396
7038
10912915088
108
64126
116nO
121949176
122138
94216
10810379
20726511513412114523
17076
24781
120
7737
18425710379
138
Sept.
106
123116124
10711891
1018080
109
8350
1211341739848
'65144
53
11291
'9170
113"•126
92199
13611073
21627711214712614522
17988
25488
125
9253
182218110
73111
Oct.
99
989598
931046969IX59
105
8964
1191261539669
63154
100CM
9784886296
105
90179
14111284
21827711514713412820
16789
23385
122
9270
1771561128490
Nov.
p86
636862
»8395
P53*>55^59P4097
9581
1101171379379
63139
111
J>79
P79
76151
11510882
10615
15886
21981
P i l l
P 8 5P67
P17434
10882
p Preliminary. r Revised.NOTE.—For description see BULLETINS for February and March 1927. For latest revisions see BULLETINS for March 1932. p p 194-196, Sep-
tember 1933, pp . 584-587, and March 1937, p . 256. Series on silk-loom activity and on production of book paper, wrapping paper, fine paper, boiboard, mechanical wood pulp, chemical wood pulp, paper boxes, and lumber, usually published in this table, are in process of revision.
Digitized for FRASER http://fraser.stlouisfed.org/ Federal Reserve Bank of St. Louis

JANUARY 1938 FEDERAL RESERVE BULLETIN 47
FACTORY EMPLOYMENT, BY INDUSTRIES (ADJUSTED FOR SEASONAL VARIATION)[Index numbers of the Board of Governors; adjusted to Census of Manufactures through 1933. 1923-25 average=100]
Industry and group
TotalDurable noodsNondurable troods
IRON STEEL PRODUCTSBlftst furnaces steel worksBolts nuts washers rivetsCast-iron pipeCutlerv edce toolsFondncs
Pliimhprs* sunnlip^Stcani hot-water heatingStovesStructural ornjunpntfilTin cans tinw&reToolsWire work
M ACIIINERYAgricultural imnlpnifiTitsOfrsh rppist^rs AteTMpptripAl mflchitiprvPnEnnes turbines etcFoundry, machine-shop products-Machine toolsRadios DhonocranhsTPXHIP miohiticrvT VD R wri t ers
TRANSPORTATION EQUIPMENTAircraftAutomobiles
LocomotivesShipbuilding
R. AIT ROAD TIFPAIR SHOPSElectric railroadSteam railroad
NONFERROUS METALS, PRODUCTS
CMOPV*? w a t c h e rJewelry
Silvprwarp nlatfid w&tfcfiTneitinf? rGflnint?fitfiTtin^H Atiflmplpd ware
T TTHfRlTTl PRODUCTS
Lumher millworlcT iimViPr Sawmills
flTnKF Of AV OT ASS PRODUCTST^rirt tilp tprrfi cott&
GlassA/Tarhlp eranitft slat6Pottery
TFTTITFS PRODUCTSA Fabrics
Oarnpts Tii£SCJnttnn Crtodsf^nt tnn <iTTiall WfltftSDyeing, finishing textiles -TTntq fur-felt
SilV rflvnn troocls\Vnnlpn wnr<;tP<i Foods
TK Wparint? atittflrel("MntJiinu m fin's
TVTpn fiirnishinffS\ f illinprv^hfrt«? collars
1936
Oct.
94.488.2
101.2
98.410079668261848570
10773
10089
164
108.410211910011796
125176 •75
132
105.06451136141
102
60.16360
105.211511011488897078
153
66.2815350
67 24764
1034276
101,795.59297
10111582
1177978
113.410515589
13055
117
Nov .
96.289.9
102.9
99.610981678464918671
107739893
175
110.495
12010312297
127171
75135
112.3646123644298
60.66360
106.711811111591947078
154
66.2845449
66.34865964275
104.497.39398
10411787
1167984
118.411116391
13453
119
Dec.
98.692.7
104.9
101.011084688768959072
H I709795
188
114.010312110612510012918876
139
118.7698133624489
61.76362
110.711811511791997180
166
67.9865551
69.05168
1014276
106.8100.19999
10612189
1197992
119.811516092
13551
124
Jan.
98.892.4
105.4
102.311387688969809476
11473
10398
179
116.0109123104128102136201
79145
110.2740120624995
62.36362
109.612112012090757280
163
68.8896750
69.55468984377
108.3101.710110110712090
1238193
120.911415993
14057
132
Feb.
99.793.9
105.8
103.711289698770969078
11775
10599
176
118.911312710913410413619681
148
113.07721236654
100
61.96362
111.712112212089987379
159
68.1875750
72.65568
1094377
107.3100.710110210211789
1237985
119.811116191
14157
129
Mar.
100.996.3
105.9
106.411690718769999580
11676
104101187
121.1125131111137106141190 ,83
153
117.3783127
7154
106
62.26452
113.211912212290
1047381
161
71.4885854
72.65470
109 ,4378
107.0101.199
10310211688
1228088
117.911015690
14158
129
Apr.
101.697.4
106.2
108.011893728773999782
11378
105101186
123.713013111514010814718985
154
118.67981287055
106
62.46462
114.312112612490
1007485
158
71.4905853
71.85466
1084378
107.9103.8
10510311986
1228594
115.011314688
14054
124
May
102.298.4
106.2
108.712094728973989882
11377
107103183
125.613613411814711015015587
154
122.28071337155
104
62.46362
115.412312412595
1007388
160
71.7915654
71.35262
1104479
107.6103.210210696
11984
1218490
115.311614489
13853
119
1937
June
101.497.8
105.3
100.710682698673969180
11878
107102181
129.414313612014611315319087
159
122.67941347057
104
63.76364
115.013212312495967389
159
72.3925654
70.45062
1094282
105.4101.310210410011490
1188687
112.010914290
14154
118
July
103.0100.1106.2
108.312188688977968981
10779
110103176
131.5147137121150114154214
87156
123.57681366960
102
64.463 •64
115.4138121120101948294
153
72.9915656
70.45161
1104179
106.2102.010010510211687
1238484
113.110914591
14752
119
Aug.
102.499.3
105.6
108.712287CG9273939277
11179
109105171
131.3148135121151114161201
88155
121.38121326961
106 •
62.46362
115.913812112899937894
156
71.3885554
70.34864
1124179
105.9100.810110610411684
1218178
115.110815690
13954
117
Sept.
100.798. G
102.9
108.412388649174939577
10580
104t)9
170
130.215113712115511215718087
150
123.9799130G7G4
10G
60.163GO
113.71311171269397SO94
152
69.2865553
70.54966
1114278
100.995.9
10110110111479
1177670
109.710314789
12951
115
Oct.
1)8.4% 7
100.2
105.411985G2887294937199789890
187
128.015813611915711015710284
147
126.3817138
7166
106
58.76358
109.410311212492987890
152
66.4815451
69.44767
1094178
96.490.4879307
11382
1127368
107.410014389
12850
114
Nov.
94.191.307.0
98,6lit)81598005Wl90048574
10191
177
120.814013411315010G15312078
131
118.47511287464
106
57.36357
105.61221041199093SG87
140
61.8755147
67.24408
1054175
91.585.5868991
1081.871076860
103.195
13989
12248
109
Digitized for FRASER http://fraser.stlouisfed.org/ Federal Reserve Bank of St. Louis

48 FEDEKAL KESERVE BULLETIN JANUARY 1938
FACTORY EMPLOYMENT, BY INDUSTRIES (ADJUSTED FOR SEASONALVARIATION)—Continued
[Index numbers of the Board of Governors; adjusted to Census of Manufactures through 1933. 1923-25 average «= 100]
Industry and group1936
Oct. Nov. Dec,
1937
Jan. Feb. Mar. Apr. May June July Aug. Sept. Oct. Nov
LEATHER PRODUCTSBoots, shoes -Leather
FOOD PRODUCTSBakingBeveragesButter _Canning, preservingConfectionery jFlourIce creamSlaughtering, meat packingSugar, beetSugar refining, cane
TOBACCO MANUFACTURESTobacco, snuffCigars, cigarettes
PAPER, PRINTINGBoxes, paperPaper, pulpBook, job printingNewspaper, periodical printing.
CHEMICALS, PETROLEUM PRODUCTS,A. Other than petroleum
ChemicalsCottonseed oil, cake, meal_._Druggists' preparationsExplosivesFertilizersPaints, varnishesRayon, allied productsSoap ,
B. Petroleum refining
R U B B E R PRODUCTSRubber boots, shoesRubber goods, otherRubber tires, inner tubes
92.09296
112.713118782
14676746991
11874
81.15762
103.110011194
105
117.9117.412971
1009085
129354103119
98,375
13092
94.99599
113.413219782
13580737096
11467
62.45763
103.610011295
104
118.1117.412977
1029380
127357100121
99.474
13393
98.810098
115.013219784
147817472959370
62.05663
104.010311394104
118.6118.3129751059187130355100120
1027613895
99.110197
114.813320386148837571934464
62.066
104.010311494103
120.7120.9133851059487131364102120
102.37514095
98.110097
116.713520288157817573918978
61.85762
105.510411696104
121.6121.813380
1099286
133363110121
101.773
14094
97.49997
117.013620588
152807573939577
61.75662
107.410611898
105
122.5122.713567
1119088
135370111122
96.082
142
96.597
100
116.113419986
154797773919884
61.15662
107.510611997
105
124.4124.813677
1139594
136378107123
95.882
14479
96.096
100
114.813520388
144787676909078
61.25662
108.010612098
106
126.0126.113877
1129398
134392103125
101.781
14589
96.19799
114.713520690
143777577899075
60.25861
108.210612198
106
127.5128.013772
11497
110134408103125
100.076
144
95.29795
119.413620991
169817876919179
61.35762
107.310512098
105
127.7128.113862
11297
104136413104126
96.667
14087
93.09494
116.213421088
155827775
75
60.85761
107.410411998
105
127.2127.313762
11497
105136407103127
99.877
14090
90.09093
114.813420987
151767476 •88
10866
60.25661
107.810011999
107
127.4127.913797
1129794
134407102125
99.576
13791
90
113.813619986
13880757289
11067
59.356
107.099
11799
107
123.7123.413587
1109489
13238099
124
98.174
13590
86.18883
113.813420982
14080757390
107
59.75660
105.097
11398
106
120.6119.912889
1089386
12936798
124
91.666
12685
I i ? ^ E i T ? ' i ^ u r e s f o r November 1937 are preliminary. For description and back data see pages 950-978 of the BULLETIN for December 1936 andpage 259 of the BULLETIN for March 1937. Underlying figures are for payroll period ending nearest middle oimonth, ^ecemper uwo ana
Digitized for FRASER http://fraser.stlouisfed.org/ Federal Reserve Bank of St. Louis

JANUARY FEDEHAL EESERVE BULLETIN 49
FACTORY EMPLOYMENT AND PAYROLLS, BY INDUSTRIES (WITHOUTSEASONAL ADJUSTMENT)
flndex numbers of the Bureau of Labor Statistics; adjusted to Census of Manufactures through 1933. 1923-25 average=100]
Industry and group
Factory employment
1936
Oct. Nov.
1937
July Aug. Sept. Oct. Nov.
Factory payrolls
1936
Oct.
1937
uly •Ug. ept. Oct.
TotalDurable goodsNondurable goods.
IRON, STEEL PRODUCTSBlast furnaces, steel works,-Bolts, nuts, washers, rivets.Cast-iron pipeCutlery, edge toolsForcings , .Hardware -Plumbers' suppliesSteam, hot-water heating...StovesStructural, ornamentalTin cans, tinwareToolsWirework
MACHINERY _Agricultural implementsCash registers, etc _Electrical machineryEngines, turbines, etc .__Foundry, machine-shop productsMachine tools— -Radios, phonographsTextile machineryTypewriters
TRANSPORTATION EQUIPMENTAircraftAutomobiles—Cars, electric, steam railroad..Locomotives.—u.Shipbuilding
RAILROAD REPAIR SHOPS.Electric railroadSteam railroad
NONFERROUS METALS, PRODUCTS..Aluminum -Brass, bronze, copperClocks, watchesJewelry -Lighting equipmentSilverware, plated wareSmelting, refining-,..Stamped, enameled ware
LUMBER PRODUCTSFurnitureLumber, millwork...Lumber, sawmills .—
STONE, CLAY, GLASS PRODUCTS..Brick, tile, terra cottaCementGlassMarble, granite, slatePottery
TEXTILES, PRODUCTSA. Fabrics.——
Carpets, rugsCotton goodsCotton small waresDyeing, finishing textiles.Hats, fur-feltKnit goodsSilk, rayon goodsWoolen, worsted goods...
B. Wearing apparel..Clothing, men'sClothing, women'sCorsets, allied garments..Men's furnishingsMillineryShirts, collars
96.789.2104.7
98.9108796683618586731177510390164
109.6981191001139612621873133
102.16191105940103
60.463
108.3117111118102917279154
69.2875352
69.150661044477
104.397.1
102115831218279118.3108163>9013857
124
96.991.0103.3
19.310881668664928G74115739694175
111.4931201031189712821174139
115.0646128584197
6360
110.0119113121101977479156
67.8885350
67.35064984377
104.898.894100104118831218084116.01071589014348125
101.498.9104.1
107.6120
847293937710581115102176
129.913913712115211315319786152
119.97911307263100
63.86364
111.513211911591927492151
72.9885756
71.754701084473
100.098.01001029610984116£081102.01071178813039113
102.398.1106.9
108.7.218768897290947611381118100171
130.214113512115111315520486152
111.88121197363102
62.16362
112.813311712496917692153
73.0895756
71.952701104576
102.897.310110196109891168078113.01111468812853116
02.197.3,07.3
659073939577113821498170
130.74713712115411215820884151
107.07671136964106
60.46360
114.1131115127101978093153
71.7895655
72.752701114577
101.694.9
111861178070114.1091528912857119
,00.597.5LO3.6
105.81885629072949474[08790197,87
.28.91511361953.1015820183148
122.77841346864107
59.06359
112.71051131281061008192154
69.4875453
71.4506911043
98.891.9899498112831167568112.11041509013652121
94.792.397.3
8.2098158886591906791759992L77
21.444.34.13146LO51545577
121,2'511336662105
57.36357
108.9124106125100969089141
63.2795147
68.45671074277
91.986.987909110983112
89.085.393.7
3.20287507852936666.0969979452
02.7.06.17931009012217866129
95.8528[026027103
63.96404,
99.711110311684836868154
63.1775047
62. i41621033866
88.85.90871009861124676091.821199111838116
90.788.992.9
95.80589488358.066366L0366929873
105.6[021297.069324696734
13.4553L26582897
65.26665
102.011510412278977270155
60.8785043
61.14163993467
87.286.90889810168124646684.791038812631116
00.400,700.0
13.53294547804OS7271828222OS72
33.6.73.47124551559.660046
17.5583[248351.12
63.56763
105.313511710868896787146
67.3745553
66.14672109
85.589.69797909481113677273.867180972496
03.804.0.03.5
20.4420154856704777297852907M
37.1.8440.27.5619iGO7688.44
12.8'51158753.19
67.36967
109.914111712274877392157
71.4795656
70.546771204065
92.90.09897919487119666992.921158210240103
00.199.400.9
12.9.30974987700173729884230467
3i.389.47.24.5914667485.43
04.4>70[06805519
63.16S63
110.113611312882998189149
68.2785353
69.946731194067
87.85.38592969569117685887.84106849549103
00.101.798.2
06.81997468668156G79482080102
.34.201.48.255914.70.068128
.29.9r23.388356.24
64.96865
109.9116107133891048191156
65.3775249
69.644721193873
84.281.06485979562123625387.801108711236113
89.389.688.9
85.69379438056996453657410190159
120.9183141113154102158123ro
106
118.86891248451120
62.96863
100.51289212479988385136
54.9664640
63.737681123570
71.371.04976788961112524268.861858310327102
Digitized for FRASER http://fraser.stlouisfed.org/ Federal Reserve Bank of St. Louis

50 FEDERAL RESERVE BULLETIN JANUARY 1938
FACTORY EMPLOYMENT AND PAYROLLS, BY INDUSTRIES (WITHOUT SEASONALADJUSTMENT)—Continued
I Index numbers of the Bureau of Labor Statistics; adjusted to Census of Manufactures through 1933. 1923-25 average=100]
Industry and group
Factory employment
1936
Oct. Nov.
1937
July Aug. Sept. Oct. Nov,
Factory payrolls
1936
Oct. Nov.
1937
July Aug. Sept. Oct. Nov.
LEATHER PRODUCTS.Boots, shoesLeather
FOOD PRODUCTSBakingBeveragesButterCanning, preservingConfectionery,.Flour. _Ice creamSlaughtering, meat packing..Sugar, beetSugar refining, cane
TOBACCO MANUFACTURES..Tobacco, snuffCigars, cigarettes
PAPER, PRINTING..Boxes, paper..
ulp.. .Paper, pulp.Book, job printingNewspaper, periodical printing. . .
CHEMICAL, PETROLEUM PRODUCTS...A. Other than petroleum
Chemicals ..Cottonseed oil, cake, mealDruggists' preparations.ExplosivesFertilizersPaints, varnishesRayon, allied products.Soap..
B. Petroleum refining
RUBBER FRODVCTSRubber boots, shoesRubber goods, otherRubber tires, inner tubes.
92.89397
124.213319183
19791776692
27276
G4.55765
101010611194
105
120.3120.21301041049377129362107121
97.978133
19.0
114.11331838211392756297274
65.95767
105.010611296105
119.7119.41301041069570125364103121
200.08013691
96.39895
124.9137234972106978939053SI
60.65561
106.010212096103
124.3123.5140421069570136401102128
96.26213790
96.69994
132.513523194278737890877177
61.85663
106.310311997103
124.9124.1137541129673133403102128
97.97713588
92.79493
137.813722392312857782879267
62.15663
107.710311999106
128.6128.91371211149885132407103127
98.079135
89.59190
125.01382038618696
698925369
62.65663
107.910511799108
126.5126.71351271159781132388103126
97.77813787
81
114.31351948211792766591258
63.05764
106.410411399107
122.4122.11301201129576128374100124
92.17212883
74.06799
111.5119199651798673588920261
54.76154
96.510810285101
114.4113.9125851139670120308105116
96.86512894
67.358101
108. 3120191659885705610026959
54.86254
98.610910588102
114.7113.3128831139863117298102119
101.26913199
104
128.3135285782456480861005681
55.86655
101.610011990100
136.8134.91543511210477138393117143
96.85513694
83.779104
131.213227378294758084977581
57.26656
102.610312490
140.7137.71564812310779135401118151
97.07313490
71.66599
133.2136253743078981749810160
56.57055
103.710311893104
139.0137.715111212710697132394122143
66.35995
125.01372227018898816410022464
57.96857
105.110911793107
137.5136.115111912911183134375121142
97.476
13390
94.370
14084
54.54782
115.71302126710889776210227665
57.26456
101.610310593106
132.0129.514211112510778125360116140
83.362
12275
be obtaiNOTE.—Figures for November 1937 are preliminary. For description see pages 950-953 of the BULLETIN for December 1936 Bark data mav.btained from the Bureau of Labor Statistics. Underlying figures are for payroll period ending nearestlmiddle of month
Digitized for FRASER http://fraser.stlouisfed.org/ Federal Reserve Bank of St. Louis

J A N U A R Y 1938 FEDERAL RESERVE BULLETIN 51
CONSTRUCTION CONTRACTS AWARDED, BY TYPES OF CONSTRUCTION
[Figures for 37 States east of the Rocky Mountains, as reported by the F. W. Dodge Corporation Value of contracts in millions of dollars.l
Month
JanuaryFebruaryMarchAprilMayJuneJulyAugustSeptember . . . . . _..-OctoberNovemberDecember
Year
Total
1936
214.8140.4198.8234.6216.1232.7294.7275.3234.3225.8208.2199.7
2,675.3
1937
242.7188.3231.2269.5243.7317.8321.6285.1207.1202.1198.4
Residential
1936
37.431.255.267.270.373.672.0
100.580.779.768.465.5
801.6
1937
78.463.090.2
107.883.993.181.073.465.665.559.9
Factories
1936
9.013.418.425.512.910.219.115.018.818.414.123.1
198.0
1937
37.012.622.230.118.536.858.537.912.912.013.5
Commercial
1936
15.512.617.324.318.821.928.622.020.122.023.023.2
249.1
1937
21.522.330.028.525.624.529.129.625.325.218.9
Public worksand public
utilities
1936
86.946.662.373.463.680.0
126.694.484.567.073.961.3
920.4
1937
68.559.652.565.766.799.9
102.594.465.861.0GI. 4
Educational
1936
39.521.119.023.220.718.323.312.39.2
13.413.113.0
226.1
1937
19.611.310.014.022 037.415.817.215.810.819.3
AH other
1936
26.515.526 621.129.828.725.131.121.025.315.713.6
280.0
1937
17 819.426 423.426 926.134 732.621.52fi.425.4
CONSTRUCTION CONTRACTS AWARDED, BY TYPES OF FINANCING[Figures for 37 States east of the Rocky Mountains, as reported by the F. W. Dodge Corporation. Value of contracts In millions of dollars.]
Month
January.. __._.FebruaryMarchAprilMayJune .-... _.-..JulyAugustSeptemberOctoberNovemberDecember
Year
Total
1932
8589
11212214611312913412810710581
1,351
1933
8353605777
10283
106120145162207
1,256
1934
18697
17813113412712012011013511293
1,543
1935
10075
123124127148159169167201188264
1,845
1936
215140169235216233295276234226208200
2,675
1937
243188231270244318322285£07£02198
Publicly financed*
1932
393445619364858180617352
768
1933
392725182429204771
100126156
683
1934
15765
126787273526969797461
975
1935
553868634764679297
114118196
1,007
1936
1497996
10694
1161531531161018982
1,334
1937
11269667492
137131108807893
Privately financed*
1932
455567615449446347463229
583
1933
442635395374635949453661
673
1934
293162536364676141573832
668
1935
453755718084937670877068
837
1936
6662
103130122116141122119125119117
1,341
1937
130119166195162180191178127124106
i Data for years prior to 1932 not available.
CONSTRUCTION CONTRACTS AWARDED, BYDISTRICTS
[Figures for 37 States east of the Rocky Mountains, as reported by theF. W. Dodge Corporation. Value of contracts in thousands of dollars.]
Federal Reserve district
Boston _ _New YorkPhiladelphiaClevelandRichmondAtlantaChicagoSt. LouisMinneapolisKansas CityDallas ._
Total (11 districts)
1937
Nov.
13,89036,32716,39125,32519,43313,35828,14713,1946,97510,33415,027
198,402
Oct.
13,01045,87815, 77317,13915,94414,82039,47012,6886,5429,04711,771
1936
Nov.
14,62338,59714,07721,03420,89128,68935,67810,8647,5978,5917,564
202,081 208, 204f
COMMERCIAL FAILURES, BY DISTRICTS[Figures reported by Dun & Bradstreet. Amounts in thousands of
dottaTS.]
Federal Reservedistrict
Boston .New YorkPhiladelphiaClevelandRichmondAtlantaChicagoSt. LouisMinneapolisKansas City.DallasSan Francisco
Total .
:Number
1937
Nov.
6624728595249942520342191
786
Oct.
5624936613835
10119163219
106
7G8
1936
Nov.
7020537504424922512321582
688
Liabilities
1937
Nov.
7453,192
338705660520
1,7003812182303S0
1,009
10,078
Oct.
5133,090
6421,075
564263
1,21017377
356205
1,161
9,335
1936
Nov.
7854,550
4151,3091,201
3761,203
55383
157204696
11,532
Digitized for FRASER http://fraser.stlouisfed.org/ Federal Reserve Bank of St. Louis

52 FEDERAL RESERVE BULLETIN JANUARY 1938
MERCHANDISE EXPORTS AND IMPORTS[In millions of dollars]
Month
JanuaryFebruaryMarch
AprilMayJune
JulyAugustSeptember
OctoberNovemberDecember
Year
Merchandise exports *
J933
121102108
105114120
144131160
193184193
1,875
1934
172163191
179160171
162172191
206195171
2,133
1935
176163185
164165170
173172199
221270223
2,283
1936
199182195
193201186
180179221
265226230
2,456
1937
223233257
269290265
268278297
333P 3 1 5
1933
968495
88107122
143155147
151129134
1,450
Merchandise imports *
1934
136133153
147155136
127120132
130151132
1,655
1935
167152177
171171157
177169162
189169187
2,047
1936
187193199
203192191
195193216
213196245
2,423
1937
240278307
287285286
265246233
224J>223
Excess of exports
1933
251813
177
- 2
1- 2 3
13
425659
225
1934
373033
336
34
345260
774438
478
1935
911•8
- 6- 513
- 33
37
32100
37
235
1936
11- 1 1- 4
- 1 09
- 5
- 1 5-14
5
5230
- 1 5
34
1937
-18- 4 5- 5 1
-185
- 2 1
33263
108P91
p Preliminary.*Including both domestic and foreign merchandise.* General imports, including merchandise entered for immediate consumption and that entered for storage in bonded warehouses.Source: Bureau of Foreign and Domestic Commerce.
Back figures.—See BULLETIN for January 1931, p. 18, and for July 1933, p . 431.
FREIGHT-CAR LOADINGS, BY CLASSES[Index numbers; 1923-25 average=100]
TotalCoal , .CokeGrain and grain products . .Livestock . . . „Forest products _.Ore _Miscellaneous...Merchandise 1
TotalCoalCokeGrain and grain products . .LivestockForest productsOreMiscellaneousMerchandise *...
1936
Nov.
1937
July Aug. Sept. Oct. Nov.
Adjusted for seasonal variation
828596784950
1339067
8076
104813757
1078868
797798774253
1038868
788193714449
1048667
768174824546798166
717259924241737664
Without seasonal adjustment
849396735949739269
826488
1113257
2039067
816880934255
1908968
878488795654
1829670
848974826348
1179269
727859865140407865
1 In less-than-carload lots.NOTE.—For description and back data see pages 522-529 of BULLETIN
for June 1937. Based on daily average loadings. Basic data compiledby Association of American Railroads. Total index compiled by com-bining indexes for classes with weights derived from revenue data ofthe Interstate Commerce Commission.
DEPARTMENT STORES—SALES, STOCKS[Index numbers based on value figures; 1923*25 average «»100J
Month
JanuaryFebruaryMarch. „ „-
April.MayJune
JulyAugust .-September
October. * „NovemberDecember
Year
Index of sales i
Adjustedfor seasonal
variation
1936
818384
848787
918688
909492
1937
639593
939393
949294
9391
Withoutseasonal
adjustment
1936
636677
858984
636894
100105161
88
1937
727690
899590
6572
100
103101
Index of stocks (end ofmonth)
Adjustedfor seasonal
variation
1936
666665
656664
646768
697171
1937
747676
* 767675
747877
7776
Withoutseasonal
adjustment
1936
086267
686762
596571
76so67
67
1937
667278
797873
697480
8586
i Based on daily average sales—with allowance for changes frommonth to month in number of Saturdays and in number of Sundays andholidays. Adjustment for seasonal variation makes allowance in Marchand April for the effects upon sales of changes in the date of Easter.
Back figures.—Department store sales, see p . 631 of BULLETIN forAugust 1936; department store stocks, see pp . 254-255 of BULLETIN for
Digitized for FRASER http://fraser.stlouisfed.org/ Federal Reserve Bank of St. Louis

JANUARY 1938 FEDERAL RESERVE BULLETIN 53
WHOLESALE PRICES, BY GROUPS OF COMMODITIES[Index of Bureau of Labor Statistics. 1920-100]
Year, month, or week
19291930193119321933193419351936
1936—OctobarNovemberDecember
1937—JanuaryFebruaryMarchAprilMayJune - ---JulyAugustSeptemberOctoberNo vembef _„„„-„
Week ending—Aug. 7 -Aug 14Aug 21Aug. 28Sept 4 -Sept. 11Sept. 18Sept. 25Oct 2Oct 9 ~ .Oct. 16Oct 23Oct. 30Nov. 6Nov 13Nov. 20 . - .Nov 27Dec. 4Dec. 11Dec 18Dec 25
Allcom-modi-
ties
95.386.473.064.865.974.980.080 8
81.682.484.2
85.986 387 88S.087.487.287.987.587.485.483.3
87.487.587.386.586.486.887.487.586.986.085.284.984.083.883.282.982.082.081.981.581.2
Farmprod-ucts
104.988.364.848.2SI. 465.378.880.9
84.085.188.5
91.391.494.192.289.888.589.386.485.980.475.7
86.987.587.185.084.684.586.587.385.482.780.3SO. 777.877.777.875.973.473.973.473.272.9
Subgroups
FARM PRODUCTS:GrainsLivestock and poultrOther farm products.
FOODS:
Fruits and vegetablesMeats
y
HIDES AND LEATHER PRODUCTS:ShoesHides and skinsLeatherOther leather produc
TEXTILE PRODUCTS:Clothing _Cotton goods
ts
F U E L AND LIGHTING MATERIALS:
CokeElectricityGasPetroleum products-
Foods
1936
Nov.
102.979.782.9
88.285.974 885.281.4
99.3101. 288.495.9
81.5
61.233.484 366 5
82.497 297.882. 781.958.1
99.990.574.661.060.570.683.782.1
82.683.985.5
87.187.087.685.584.284.786.286.78S.085.583.1
86.386.586.885.385.786.688.688.787.886,985.485.083.884.383.683.281.580.780.779.778.9
Total
91.685.275.070.271.278.477.979.6
80.181.082.2
83.484.185.586.58,6.386.186.386.185.985.184.3
86.086.085.985.885.986.085.985.985.685.385.285.084.784.384.084.283.983.983.783.783.6
Other commodities
Hides andleather
Products
109.1100.086.172.980.986.689.695.4
95.697.099.7
101.7102.7104.2106.3106.7106.4106.7108.1107.6106.7101.4
109.1108.6108.6108.7108.6108.5108.3108.3108.2108.1107.7106.9106.4104.2103.0101.8100.299.898.398.298.4
Textileproducts
90.480.366.354.984.872.970.971.5
71.673.676.3
77.677.578.379.578.778.278.377.175.373.571.2
77.476.976.676.175.875.575.174.573.973.372.872.872.671.671.070.570.069.869.969.569.4
1937
Aug.
92.0108.271.4
79.787.965 3
112.173.6
107.4122.1100.0103.2
90.0
65.732.993 971.1
76.898 7
104.979.482.662.0
Sept.
91.9106.771.2
84.886.164 0
113.475.5
107.5120. 798.9
103.3
89.7
66.532.492 470.0
78.799 2
105.0SO. 584.062.2
Oct.
77.098. 570.1
85.784.662.2
107.473.4
107.6117.197.2
103.3
89.470 i
65.830.690.169.0
78.899.3
105.3
83.661.7
Nov.
69.286. 270.7
89.281.561.598.373.6
106.9
92.7103.1
87.3
64.230.185.169.0
79.899.2
105.4
60.6
Fuel andlighting
materials
83.078.567.570.366.373.373.fi76.2
76.876.876.6
76.676.876.276.877.277.578.178.478.778.578.2
78.978.978.979.179.279.879.479.679.479.579.279.178.978.979.078.678.678.678.678.678.6
Metalsand metalproducts
100.592.184.680.279.886.986.487.0
86.987.989.6
90.991.796.096.595.895.996.197.097.196.496.8
95.495.595.595.596.496.496.496.495.895.695.995.695.395.194.696.696.196.396.296.496.2
Buildingmaterials
95.489.979 271.477.086.285.3
• 86.7
87.387.789.5
91 393 395.996.797.296.996.796.396.295.493.7
96.796.796.496.596.396.496.396.596.295.995.995.495.094.494.093.893.793.093.092.892.5
Subgroups
METALS AND METAL PRODUCTS;Agricultural implementsIron and steelMotor vehicleNonferrous mPlumbing am
setalsi heating
BUILDING MATERIALS:Brick and tileCementLumberPaint and paint materiaPlumbing and heating..
s
Other building materialsCHEMI
ChDrT?OT
:ALS AND DRUGS:emicalsugs and pharmaceuticals
Mixed fertilizersHOUSEFURNISHING GOODS:
Furnishings.— _Furniture
MISCELLANEOUS:Auto tires and tubesCattle feedPaper and pulp
Other miscellaneous
Chemi-cals and
drugs
94.289.179 373.572.675.980.5SO.4
82.282.585.3
87.787 887.586.984.583.683.982.281.481.280.2
82.482.081.781.281.080.981.281.281.081.280.980.680.680.1sao79.879.679.478.979.179.2
1936
Nov.
92.988.992.075.476.7
88.895.586.680.576.7
90.9
89.277.9
69.6
85.778.8
50.1126.081.5
81.7
House-furnish-leg goods
Aug.
94.299.996.093.378.8
95.595. 599.584.178.8
101.0
87.078.271 774.8
95.087.1
MA82.994.1
85.4
94.392.784 975.176 881.680 681.7
82.082.383.2
86.587.988.489.089.389.589.791.191. 191.090.4
92.892.792.792.792.792.892.892.792.792.792.792.792.692.292.192.192.192.192.192.191.4
193*
Sept.
94.299.896.692.680.6
95.095.599.084.680.6
100.8
85.778.371 ft74.8
94.987.1
56.481.293.4
85.1
Mlscel*laneous
Oct.
94.299. 797.885.5SO. 6
93.495.597.384.2SO. 6
LOO. 2
85.378.379 *!74.9
94.987 1
56.483.692.4•!•? (•
84.6
82.677.769 864. 46° 569.768 370.5
71.57a 474.5
76 277 379 581.180.579.479.077.377 070.275.4
77.477.477.277.076.676.976.977.176.876.676.376.075.775.575.075.475.075.174.874.874.9
Xov.
95.999.3
102.578.579.6
92.995.594.881.579.6
98.7
84.276.871 Q74.5
94.8S6.0
57.483.390.4ori aS3. 5
Back figures.—"For monthly and annual indexes of groups, see Annual Report for 1936 (table SO); for indexes of subgroups see Annual Report for1936 (table 81).
Digitized for FRASER http://fraser.stlouisfed.org/ Federal Reserve Bank of St. Louis

54 FEDERAL RESERVE BULLETIN JANUARY 1938
DECEMBER CROP REPORT, BY FEDERAL RESERVE DISTRICTS[Based on estimates of the Department of Agriculture, by States, as of December 1,1937]
[In thousands of units
Federal Reserve district
Boston . * - -New YorkPhiladelphia . . .. .ClevelandRichmond .AtlantaChicagoSt. LouisMinneapolisKansas CityDallasSan Francisco
Total
Federal Reservedistrict
BostonNew York .,_PhiladelphiaClevelandRichmond _.Atlanta _.Chicago..„St. LouisMinneapolisKansas CityDallasSan Francisco
Total _.
Corn
Produc-tion1936
Bushels7,674
23,77848,734
155, 673124,649149,800527,836202,956107,34170,944SO, 6237,081
1,507,089
EstimateDec. 1
1937
Bushels7,693
28, 37955,607
207,157139,866182,250
1,140,744363,227248,022177,35286,945
7,753
2,644,995
Cotton
Produc-tion1936
Bales
1,4462,996
i 3,404
3523,587
614
12,399
EstimateDec. 1,
1937
Bales
1,8414,161
4,710
6856,387
962
18, 746
Oats
Produc-tion1936
Bushels6,900
19,81915,10450,26815,28610,496
362,04838,026
129,90782, 63024,57730,445
785, 506
EstimateDec. 1,
1937
Bushels6,142
20,19415,55745,85018,88513, 571
544, 64455,561
251, 656113,17233,08727,939
1,146,258
Total wheat
Produc-tion1936
Bushels119
6,60117,73045,81725,5015,938
63,35560,80755,101
213,95119,441
112,405
626, 766
EstimateDec. 1,
1937
Bushels76
9,25620,95253,64628,4597,530
79,70779,133
131,841299,49542,912
120, 986
873,993
Tame hay
Produc-tion1936
Tons3,1074,4431,7883,8052,4962,559
14,2324,5337,4006,1271,193
11,853
63, 536
EstimateDec. 1.
1937
Tons3,4926,0072,3434,9283,7453,118
15,3606,1629,3966,4271,211
11,596
73, 785
Winter wheat
Produc-tion1936
Bushels
6,49617,55545, 62425,5015,938
61,50460,6308,249
206,25119,34862, 778
519,874
EstimateDec. 1,
1937
Bushels
9,16420, 78353,52628,4597,530
78,01278,96614,346
291, 37442,80760,135
685,102
Tobacco
Produc-tion1936
Pounds27,748
1,00833,65080,888
659,694152,51518,752
176,4931,3312,052
1,154,131
EstimateDec. 1,
1937
Pounds31,749
1,45128,520
122,520832,231178,69024,629
280,0361,8934,043
1, 505, 762
Spring wheat
Produc-tion1936
Bushels119105175193
1,851177
46, 8527,700
9349,627
106,892
EstimateDec. 1,
1937
Bushels7692
169120
1,695167
117,4958,121
10560,851
188,891
White potatoes
Produc-tion1936
Bushels55,45931,00524,66221,36919,6209,921
47,4438,333
28,30329,30013,62052, 883
331,918
EstimateDec. 1,
1937
Bushels57,60933,56125, 33418, 60330,35214, 72251,03912,71646, 49730,1784,268
66,280
391,159
1 Includes 16,000 bales grown in miscellaneous territory.1 Includes 18,000 bales grown in miscellaneous territory.NOTE.—1936 figures for all crops except cotton are as revised in December, 1937.
Digitized for FRASER http://fraser.stlouisfed.org/ Federal Reserve Bank of St. Louis

INTERNATIONAL FINANCIAL STATISTICS
55
Digitized for FRASER http://fraser.stlouisfed.org/ Federal Reserve Bank of St. Louis

56 FEDERAL RESERVE BULLETIN JANUARY 1938
GOLD RESERVES OF CENTRAL BANKS AND GOVERNMENTS(In millions of dollars]
End of month
1934—December.1935—December.1936— September.
October . . .November.December.
1937—January...February..MarchAprilMayJuneJulyAugustSeptember-OctoberNovember.
Total*(52
coun-tries)'
21,05121,604
21,75121,81022,01022,63022, 66122,80623,00323,24623,61023,92923,756P23,710P23,862*>23,984
UnitedStates
8,23810,125
10,84511,04511,18411,258
11,35811,43611,57411,79911,99012,31812,44612,56712,74112,80312,774
Can-ada
134189
191186188188
190191194199193187188188186187187
Eu-rope(26
coun-tries)
11,0109,617
8,9198,7748,8299,307
9,2259,2689,2959,3029, 4649,4669,1599,1419,1299,191
J>9,359
LatinAmer-
ica(11
coun-tries) »•
601666
671690686736
726732765773798815821
P 8 2 1P816J>813
Asiaand
Oceania (8coun-tries)
80581b
857847852858865870858879875863876725726726
Africa(5
coun-tries)
263291
269269270283
• 297310317295291281267
*2fi7P264P 2 6 4
Europe
UnitedKing-dom
1,5841,648
2,0492,0492,0492,584
2,5842,584
•2,5842,5842,6472,6892,6892,6892,6892,6892,689
France
5,4454,395
3,3223,1943,1942.995
2,8462,8462,8462,8462,8462,7222,4222,4242,4282,4282,564
Ger-many Italy a
518270
208208208208
208208208208208208208208208208208
Bel-gium
Nether-lands
590611631621630632625626619607609625617607590572570
573438456
490558598626670769848862862862906940
Switzerland
Na-tionalBank
624464
624655
657657657635635635628615612646644
B.I.S.
48
12131311
1312151117834645
End of month
Europe—Continued Latin America
Aus-tria
Bul-garia
Czecho-slo-
vakiaDen-mark Greece Hun-
garyNor-way
Po-land
Portu- Ruma-nia Spain Swe-
denYugo-slavia
6 othercoun-tries
Ar-gen-tina
Brazil
1934—December.1935—December.1936—September.
October. . . .November.December.
1937—JanuaryFebruary...MarchAprilMayJuneJulyAugustSeptember.OctoberNovember.
1121121089191919191919190919090909091
68
104109.113113113114114,115115115116116117118118119119
7407354 718718718718718718718718718718718718718718718
159185238239239240240241241241242242243243243244244
60637879798282828282827978787878
P78
403444
437455452501487489519536565581587587587686
P586
81723232425
25262627282829293030t>30
End of month
Latin America—Continued
ChileCo-
lom-bia
Mex-ico Peru Uru-
guay
4othercoun-tries
Asia and Oceania Africa
Brit-ish
IndiaChina Japan Java
NewZea-land
Tur-key
2othercoun*tries
Egypt SouthAfrica
othercoun-tries
1934—December.1935—December.1936—September.
October. __November.December.
1937—January.,.February _MarchAprilMayJuneJulyAugustSeptember.October...
1819
19191919
19201819191919
P 1 9P 1 9P 1 9
275275
275275275275
275275275274274274274274274274
101216191655
6 555555
394425
453456459463
466469456459452443412261261261
184212
189189191203
217230237215211201187189180189
2424
25252525
2525252525
P25*25J>23P 2 1P 2 0
p Preliminary.* Revised. Uruguayan gold holdings revised beginning September 1935 to include gold in custody for account of the Exchange Office; figure
of 77 million dollars applies to every month covered by the revision.i See notes under United Kingdom, Italy, Spain, and China.•Decline in gold holdings of Bank of Italy from official figure for December 1935 to that for December 1936 has been distributed monthly on
basis of gold imports from Italy reported by other countries. December 1936 figure carried forward for January 1937; figures for February andMarch 1937 officially reported as of 20th of month; March figure carried forward for subsequent months.
> According to official announcement British Exchange Equalization Account held $934,000,000 of gold on Mar. 31,1937. Gold of the Account isnot included in above figures since this is first occasion on which amount has been reported. For detailed statement of statistics included in abovetable see BULLETINS to which reference is made in note at foot of page.
* No statements have been received for Bank of Spain since Aug. 1,1936. Figure as of that date Is given for August 1936 and carried forward forsubsequent months.
* No statement has been received from Central Bank of China since July 31,1937. Figure for that date carried forward for subsequentmonths.
NOTE.—The countries for which figures are not shown separately are, in Europe: Albania, DaDzig, Estonia, Finland, Latvia, and Lithuania;In Latin America: Bolivia, Ecuador, El Salvador, and Guatemala; in Asia and Oceania: Australia and Siam; and in Africa: Algeria, Belgian Congo,and Morocco.
For back figures and for full description of this table, see BULLETIN for May 1932, pp. 311-318; June 1933, pp. 368-372; July 1936, pp. 544-547;August 1936, p. 667; and December 1937, p. 1262.
Digitized for FRASER http://fraser.stlouisfed.org/ Federal Reserve Bank of St. Louis

JANUARY 1938 FEDEHAL EESERVE BULLETIN 57
GOLD PRODUCTION[In thousands of dollars]
Year or month
Estimatedworld
produc-tion
Production reported monthly
Total
Africa
SouthAfrica
Kho-desia
West BelgianAfrica Congo
North and South America
Canada UnitedStated Mexico Colom-
bia Chile
Far East
Austra-lia
Japan BritishIndia
%l—t5-8/10 grains of gold 9/10 fine; i. c, an ounce of fine gold~$ZO,67
1929.1930103119321933
19331934 ,19351936
1936—JuneJulyAugustSeptember.OctoberNovember _December—
1937—JanuaryFebruary . -MarchAprilMay.JuneJulyAugustSeptember.October
397,153432,119460,651498,164625,071
888,997968,033
1,040,2171,166,488
98,056107, S72107.160108,371113,293105,56196,583
91,82687,24094,12192,818101,655306,940114,901
P119.651*>115,695*>121,050
359,347373,154394,399421, 656420,093
711,260723,530771,827
••855,712
71,22475,84073,92875,139
'76,86172,73073,752
73,23568,40874,09072,54776,58476,58978,309
P 8 1 , 6 1 9P77,663*79,179
215,242221,526224,863238,931227,673
385,474366, 795377,090396,768
33,08633,84633,83033,81634,19933,04233,858
34,35232,33034,38134,30834,01034,13234,89534, 59834,170
P34.380
11,60711,47611,19312,00013,335
4,2974,9955,5245,6926,623
2,3902, G993,2243, 6423,031
30,86243,45455,68762,93360,9C8
45,83547,12349,524£0,62652,842
13,46313,81312,8C612,07013,169
2,8233,2814,0165,1326,165
683428442788
3,009
8,7129,553
12,13414,56316,7&O
6,9278,0218,1098,1988,968
7,M)86,7856,8156,7826,919
%1-15-6/SI grains of gold 9/10 fine; i. e., an ounce of fine gold=%S5
22. 57824,26425,47728,053
2,3842,3542,4252,3632,2922,2702,262
2,3152,1092,4162,3912,4082,3392,3642,4412,421
*2,421
1,6711,5631,6051,6691,5591,6491,6501,8221,890
"1,925
6,1486,5497,1597,386
585676675696691634631
586579634638681
710695P730
103. 224104,023114,971131,181
1U3311,23911,56811,63511,74911,22911,612
11,49910,85311,42011,31711,90412,07112,16212,19612,18412,559
89,467108,191126,325152,509
12,07715,17113, 75614,40915,95013,36913,106
11,48310,17112,53111,13114,24813,03614,87018,14014,94615,997
22,29723,13523,85826,465
- - -2,5702,6321,8182,3461,9432,2911,647
2,8542,2272,5102,1111,6783,7012,452
*>2,452*2,242"2,312
10,43812,04511,517
•12,961=a«"g
1,0651,2351,0981,236
'1,1081,0351,113
1,3321,1171,2851,2691,2341,2461,4761,4221,2981,281
6.0948,3509,2519,018
61?776
1,029467784768708
935769620926
1,860643'902782837"732
28,42830,44731,11739,793
3,4763,G023,4223,5153,5963,4674,170
3,1583,7143,5503,7253,8974,0333,8613,9613,964
P 3 , 8 5 9
1,9941,9771,9162,2462,0752,1622,118
2,0652,0772,1562,1062,1222,0931,945
*2,120P 2 , 0 8 5*2,050
p Preliminary. •• Revised .1 Includes production in the Philippines.NOTE —For monthly figures back to January 1929 and for explanation of tables see BULLETIN for April 1933, pp. 233-35, February 1934, p. 108,
November 1934, p. 737. July 1936, p. 600, March 1937, p. 267, April 1937, p. 363, May 1937, p. 487, July 1937, p. 687, and August 1937, p. 769. Forannual figures of world production back to 1873 see Annual Report of Director of the Mint for 1936, pp. 108-109. Figures for Canada beginningJanuary 1937 are subject to official revision. Estimated production of the U.S.S.B. for October 1937, in thousands of dollars: $32,640.
GOLD MOVEMENTS[In thousands of dollars at approximately $35 a fine ounce]
Year or month
1934 I
19351936
1936—SeptemberOctoberNovemberDecember
1Q37 JflniiflTVFebruary
AprilM a yJune __.July
SeptemberOctoberNovember
Totalnet
Importsor net
exports
1,131,9941,739,0191,116,584
171,824218 812
75,83656,970
121 325120,326154 332215 811155 362262,022175,417104 844145.40*90,47722,110
UnitedKing-dom
499,870315,727174,093
8,20472,15444,66532,998
73,95075,238
121,451175,165103,822156,94376,43230,14759. 06624,402
- 5 , 0 4 6
France
260,223934,243573,671
136,67195,013
209
10,8641,138
76596
1,37511,059
1,138
-24,968
Bel-gium
8,9023
3,351
7992,645
2
10,691
1,1315,399
5,22822,55610,11813,70322,030
Neth-er-
lands
94,348227,18571,006
1,46325,745
27114
1,086
1,3923,177
521
United States
Net imports from or net exports
Switz-er-
land
12,402968
7,511
5248
3,6983,281
6,5068,155
1,16636,2352,390
Can-ada
86,82995,17172,648
6,33812,22210,6604,709
5,86510,6614,9257,225
14,43420,9467,428
12,24714.4979,669
816
Mex-ico
30,27013,66739,966
634530368462
1,9459,1533,2421,9732,800
6655,3483,5242,0542,0892,285
Colom*bia
16,94410,89911,911
2,1014
1
34,2615,4962,177
21
2,1108
4,323
(-) to:
Philip-pine
Islands
12,03815,33521,613
2,4052,1571,6282,273
2,1232,1091,9442,2312,1062,0642,4101,5052,9811,3752,286
Aus-tralia
1,0293,498
23,280
2,8311,8693,781
936
1,6172,9103,4672,3882,6132,1673,7963,7103.0102,0763,173
Japan
4
5,6969,978
16,59315,31644,45937,69740,92719,87537,148
BritishIndia
76,82075,26877,892
6,9615,7826,182
10,108
6,0287,0774,0174,8573 t7973,9664.3553,6135.2756,902
767
Allothercoun*tries
32,31647,05439,745
3,6932,5302,2892,193
1,4633,8707,2961,7371,1603,8661,9251,7611.8712,0511,32€
» Differs from official customhouse figures in which imports and exports for January 1934 are valued at approximately $20.67 a fine ounce.
NOTE.—For gross import and export figures and for additional countries see table on page 28.
Digitized for FRASER http://fraser.stlouisfed.org/ Federal Reserve Bank of St. Louis

58 FEDERAL KESERVE BULLETIN JANUARY 1938
GOLD MOVEMENTS—Continuedfin thousands of dollars at approximately $35 a fine ounce!
Year ormonth
1934..1935..1936..
1936—May-June..July..Aug..Sept..Oct....Nov..Dec.
1937—Jan....Feb..,Mar...Apr. „May...June...July...Aug...Sept. _.OctNov.P.
United Kingdon
Totalnet im-portsor netexports
716,2G9369,747
1,170,023
74,59069,447195,066281,401151,8147,61583,168100,505
-25, 523122,29678,48412,036
-48,31922,957127,953122,643-29, 775-6, 34821,753
Net imports from or net exports (—) to:
UnitedStates
-497,166-435, 502-276,813
-12,011-26,802-4,384-16,120-14,096-72,441-49,224-63,914
-73, 568-75,615-104,399-149,444-101,710-128,380-79,498-26,043-86,145-16,236
4,990
France
348,190142,137756, 204
26,93627,060142, 535240,868108,666-383
72,506118,655
22,453163,919124,12111,281-274
79, 545112,11350,463
-2,034-2,831-3,209
Ger-many
121,017-4,72623,295
1,8753,9031,9131,7896,0863,964-163-624
-220153507
-1,055-1,786
8,39816,34812, 2128,2453,171
81
Bel-gium
Nether-lands
-13,585-17,476-15,133
-17, 602-536-747-804
-1,039377
-1,130
414452
1,587104
- 1 , 545-7, 915-9,207
416573
8,176-2,583
U.S.S.R.
32,57510, 796
-21,130
1,761606
-2,421-2,907-1,029
2,4581,4861,836
1,0211,756
965927452997
-208-662-420
-10,047-5,892
931
5,628
22, 52098, 5108,430
14,02714,15316,91419, 784
Austra-lia
41, 79037,98126,723
2,1671,6102,5312,0892,0841,9842,3042,126
2,5041,9682,7272,1222,3531,552
7051,9812,0391,4762,358
SouthAfrica,
Rho-desia,WestAfrica
335,253404,295488,814
53,80245,14743,12234, 55236, 51745,32336,23041,683
16,90324,11326, 59344.19837,10646,93357, 86154,46336.19936,24446,432
BritishIndia
206,693181,627128,421
13, 28910,8609,65715,0116,5817,85314,8967,243
3,9538,7055,7602,8488,3682,7826,1297,1784,7355,7395,419
OtherBritishcoun-tries
62,39732, 74428,068
2,6451,3781,1531,4071,2191,1991,6101,172
786592
1,220873
1,2511,2961,171
9891,0325,291
China
—51813,930
3,502
2,7104,7271,927
7,2278,454
Allothercoun-tries
i 79,105217,458s 17,644
-90,92042,969
1,868
2,3276,2211,7082,013-583
15,986-1 ,581- 8 , 467
-5 ,305-3 ,942-2,489
1,325-5863,767
. 1,032-3,903
-13,739-33,071-31,132
Ger-m a n y
Totalnet im-portsor netexports
(-)
-6301,1303,2481,580
- 3 , 514-3,521
4264,763
17,42627,024
5881,7782,956
-22, 222-11,355-11,467-8,182
63
Year ormonth
Switzerland
Totalnet
importsor netexports
Net imports from or net exports (—) to:
UnitedStates
UnitedKing-dom
FranceBel-gium Italy
Neth-er-
lands
Allothercoun-tries
British India
Totalnet
importsor netexports
Net imports from or netexports (—) to:
UnitedStates
UnitedKing-dom
Allothercoun-tries
Goldpro-duc-tion !in
India
Re-serves
inIndia*
Change in:
Privatehold-
ings inIndia*
19341935.. . . . .1936
1936—May .June _J u l y . .A u g . .Sept . .Oct.._N o v . .D e c . .
1937—Jan...F e b . .M a r . .Apr. _M a y .June .Ju ly . .A u g . .Sep t . .Oct . . .NOV.P
-46 , 065-230, 788
121,788
-12, 784647
-9,127
13,3865,188-3212,829
33,50614,8482,210
-2,874
-135-17,034
575-1,506-4,479
-49,417-6,038-1,630-7,147-1,138
4,117
32- 4- 7
-57519
-3,676-4,916
-6,675- 6 , 247
-45,95o-54,858-2,205
- 4 , :-1,704
820-113
-6,396
- 2 6-1,174-36,242-1,243
2,8922,291
5,2272,436-463
-1,987-4,351
-153-393-3763,2865,031
-29,235-181,725
39,305
2842,057-2493,176
40,875656
1,241- 4 7
-612- 1
-490-289
-3,132- 8 , 740-1,831-1,242-6 ,995-9,627- 6 , 403
18,397-13,94014,531
19,43125,54251,299
2,580342
4,600
1,500- 6 , 79523,378
-230,720-161,872-121,342
-2351,166-254-2868,1771,723
659
732852653192
1,107521
-5128
-109-229
1,4492,952
- 2 0- 2 0
-64162
- 6 5- 3 3
-100
1322,113-121- 2 1487579720
-575-566
55
-561687
274-2,278
350-1,1864,5593,202
9 15, 7949
-1,9115942
-112o
-848
1,866io-13,507
819584611
-879- 2 5
-3541,4561,3071,830
-11,392-10,355-15,032-7,983-8,273
-11,576-9,347-5,506
-8,477-3,161-3,494-6,068-4,933- 1 , " "
-82,183-46,172-43,963
- 8 , 451-3 ,563-6,267-6 ,273- 3 , 653-4,277-1 ,066
-271
-596-236-620-863
-1,101
-144,185-113,953
r - 77,554
-4,352 11,222-1,746 11,393
175 11,599
173
-5,197-4,532
*>-4, 598
-1,644-424
-3,201-6,641-8,329-1,776-4,823-7 , 517-8,420-5,359
- 7 , !-3,052-3,473-5,223-3,710-2,118-7,253-4,759-4,883
260-151-436
66203218139124
9912759918
-122309208
- 1 4352
979
981966982
899982956982957979975932
P932
- 3 8
—4
-219, 671-150,472-109,743
— =-10,413-9,397
-14,051-7,002-7,307
-10,594-8,381-4,523
-7,493-2,262-2,512-5,074-3,951
-853-7,706-4,222
p Preliminary. T Revised.
i Includes $17,465,000 exported to Rumania.
' K d e ? $ lS% $ Spof f l ° to° lweedlS:$12'571'00010 N o r w a y ' $15,714,000 to Switzerland; and unspecified net imports of $91,874,000.
* Includes $15,120,'000 exported to Central and South America and $4,007,000 imported from Janan
* Includes $27,511,000 exported to Central and South America. '
* Includes $24,828,000 exported to Central and South America.' Through March 1935 gold held by government;, subsequently, gold held by Reserve Bank of India to which government gold was transferred,s Figures derived from preceding columns; net imports plus production minus increase in reserves in India g o v e r n m e n t g o l u w a s i r a u
•Includes $15,433,000 imported from Czechoslovakia. *i° Includes $14,292,000 exported to Germany.NOTE.—Germany, SuitzetUmd, and United Kingdom—In seme cases annual aggregates of official monthly figures differ somewhat from re
vised official totals published for year as a whole. German gold movements by individual countries not availablePbSnntag July M37.
Digitized for FRASER http://fraser.stlouisfed.org/ Federal Reserve Bank of St. Louis

JANUARY 1938 FEDERAL RESERVE BULLETIN 59
Bank of England
(Figures in millions ofpounds sterling)
1929—Dec. 251930—Dec. 311931—Dec. 301932—Dec. 281933—Dec. 271934—Dec. 261935—Dec. 25
1936—July 29Aug. 26Sept 30Oct. 28N o v . 25Dec. 30
1937—Jan. 27Feb 24M a r . 31Apr. 28 . .M a y 26J u n e 30J u l y 28Aug. 25Sept . 29Oct. 27Nov 24Dec 29 P
Dank of France
(Figures in millions of francs)
1929—Dec 271Q30 Dec 26
1932 Dpf» 301933—Dec 291934 Dec 281935—jw 97
1936 Tulv 31Aug 28Sept. 25Oct. 30Nov. 27Dec. 30
1037—Jan. 29Feb. 26 — —Mar 26Apr 30 .May 27June 24July 29Aug. 25Sept 30Oct 28Nov. 25Dec. 30 ?- - —
Gold (inissue
depart-ment)!
145.8147.6120.7119.8190.7192.3200.1
239.9244.8248.7248 7248.7313.7
313.7313.7313.7313.7321.3326.4326.4326.4326.4326.4326 4326.4
CENTRAL BANKS
Assets of banking department
Cash reserves
Coin
. 2
. 6
.6
.81.0. 5.6
1.01.11.11.0.7.6
.4
.71.01.0
.9
.91.11.51.71.61.5. 8
Notes
26.338.831 623.658.747.135.5
61.461.359.365.963.146.3
61.458.639.844.846.038.028.138.137.943.366.041.1
Dis-countsand ad-vances
22 349.027.318.516.87.68.5
7.19.28.66.66.8
17.5
8.04.97.15.54.96.35.84.36.28.18.69.2
Securi-ties
84.9104.7133 0120.1101 498.294.7
115.5102.6100.799.798.6
155.6
97.4105.3123.4119.7119.7164.3135.2128.5126.6121.197.0
135.5
Notocircula-
tion
379 6368.8364 2371.2392.0405.2424.5
448.6443.4449.4442.7445.6467.4
452.3455.1473.8468.8475.2488.449S.3488.3488.5483.1480.4505.3
Liabilities of banking department
Deposits
Bankers'
71 0132.4126 4102.4101.289.172.1
75,2100.960.786.697.6
160.6
98.4100.462.387.691.4
140.5104.392.895.187.783.0
120. 6
Assets
Gold*
41,66853 57868 86383 01777,09882 12466 296
54,94254,51150,11164,35964,35960,359
57,35957,35957,35957,35957,35954,85955,67755,71855,80555,80558,93258,932
For-eignex-
change
25,94226 17921 111
4 4841,158
9631.328
1,2701,2501,2451,4711,4661,460
1,4351,3231,1941,1121,0531,058
951911825829965955
Domestic bills
Spe-c i a l
27547925
1,379
1,6201,5241,5141,4701,4371,260
991833600562722728
Other
8,6248,4297,3893,4384,7393,9719.712
6,0417,0637,4847,3328,0568,465
8,5538,9908,4407,6398,3779,356
10,1978,6559,799
10,6209,655
10,050
Ad-vanccs
toGov-ern-ment
14,33314,33315,90312,30312,29817,698
19, 77219, 77220,06619,99119,98021,38023,88725,21825,99926,91826,91831,908
]Loans on—
Short-term
Govern-ment se-curities
573
1,461809838668702715
1,168873225965385776958476
1,340483314676
Othersecuri-
ties
2,5212,9012,7302,5152,9213,2113,253
3,5553,4543,5533,4473,4643,583
3,7013,5943,6983,9183,7774,0134,0643,7634,1753,7103,6753,782
Negotia-ble se-
curities
5,6126,3047,1576,8026,1225,8375,800
5,7085,6406,6405,6405,6405,640
5,6406,6405,6405,6425,6425,6415,6415,6375,6375,6376,6375,580
Otherassets
5,6036,6098,5459,1968,2518,2887,879
8,6998,1259,6438,2048,0298,344
8,2098,2358,6439,2568,1588,1108,4678,4178,5587.2187,343
4
Public
8 86.67.78.9
22 29.9
12.1
42.317.249.727.612.112.1
12.113.052.226.224.910.810.525.421.832.235.411.4
Notecircula-
tion
68,57176,43685,72585,02S82,61383,41281,150
85,89284,32483,75087,19886,65189,342
87,68887,06285,74687,06385,74585,98589,30788,25591,37091,33690,13193,836
Other
35 836.240 333.836 636.437.1
39.437.840.941.441.739.2
38.437.938.539.637.540.237.330.037.230. 030.330. 0
Otherliabili-
ties
Liabilities
Deposits
Govern-ment
11,73712,6245,8082,3112,3223,7182,862
1,6941,5231,6793,9732,0692,089
1,9552,3151,9774,3613,1542,2092,5C32,2512,3512,6482,6S63,461
Other
7,85011,69822,18320,07213,41415,3598,716
6.2547,0376,6609,247
13,05813, 655
15,280'15,38616,40413,40814,76615,71015,81215,92715,88614,67917,89319,326
17 918.018 018.018.018.018.0
18.118.218.317.717.818.0
18.118.218.317.717.818.018.118.218.317.717.818.0
Otherliabili-
ties
1,8122,2411,9892,0411,9401,9072,113
2,2672,3012,3563,5533,1602,567
2,5342,5472,5522,5182,5022,5493,1523,1963,1333,1213,452
4
1 Issue department also holds securities and silver coin as cover for fiduciary issue, which is fixed by law at £200,000,000. However, by directionof British Treasury under Section 2, paragraph (2), of Currency and Bank Notes Act, 1928 (see BULLETIN for August 1928, pp. 567-569), reductionof £60,000,000 in amount of fiduciary issue (and securities held as cover) was in effect from pec. 16, 1936, to Nov. 10, 1937; beginning Nov. 17, 1937,amount of reduction was changed to £40,000,000. From August 1, 1931, to March 31, 1933, increase of £15,000,000 in fiduciary issue (and securitiesheld as cover) was authorized by British Treasury under Section 8 of Currency and Bank Notes Act.
» By law of October 1, 1936, gold provisionally revalued at rate of 49 milligrams gold 0.900 fine per franc (see BULLETIN for November 1936,
Ep. 878-880). Of total gold increment of about 17,000,000,000 francs, 10,000,000,000 francs was initially turned over to Stabilization Fund establishedy law of October 1. By decree of July 22,1937, gold was again revalued on basis of 43 milligrams of gold 0.900 fine per franc, and resulting incre*
ment of about 6,800,000,000 francs was allocated to fund for regulating market for Government securities (see BULLETIN for September 1937, p. 853).* Bills and warrants endorsed by National Wheat Board (law of Aug. 15,1936—see BULLETIN for October 1936, pp. 785-786), and bills redis-
counted for account of Banques Populates (law of Aug. 19, 1936—see BULLETIN for October 1936, p. 788).4 Figures not yet available.NOTK.—For explanation of table see BULLETIN for February 1931, pp. 81-83, July 1935, p. 463, July 1936, p. 603, and September 1937, p. 951.
Digitized for FRASER http://fraser.stlouisfed.org/ Federal Reserve Bank of St. Louis

60 FEDERAL RESERVE BULLETIN JANUARY 1933
CENTRAL BANKS—Continued
Reichsbank
(Figures in millions ofreichsmarks)
Assets
Reserves
Gold Foreignexchange
Treasurybills
Otherbills (andchecks)
Securityloans
Securities
Eligibleas notecover
Other
Otherassets
Liabilities
Notecircula-
tionDeposits
Otherliabili-
ties
1929—Dec. 31 _ . .1930-Dec. 31 „_,1931—Dec. 31_.._.1932—Dec. 31_...1933—Dec. 30.. . .1934—Dec. 311935— Dec. 31__...
ig36-May 30____June 30____July 31. . . . .Aug. 3 1 . . .Sept. 30....Oct. 31 . . . .Nov. 30.. . .Dec. 31
1937—Jan. 30Feb. 27Mar. 3 1 . . . .Apr. 30May 31____,June 30July 31Aug. 3 1 . . . .Sept. 30____Oct. 30Nov. 30 . . .Dec. 31 P . . .
2,2832,216
9848063867982
707272696365
404469172114
955
5666655
24120693
1494553
3798907451555762
2335102954612933537
27
2,6082,3664,1442,8063,1774.0214,498
4,6064,6994,6234,6934,8754,8884,8525,448
4,8354,7775,1015,1245,0015,2625,3165,2835, 5385,5785,520
25125624517618314684
60£6676559796774
6510251525055525251444660
259445349
219220220220219219219221
223222167106104104104104105105105
92102161398322319315
319311310
305303303
302302312310310300299299293293286
656638
1,0651,114735827853
648704711686695685770765
9591,0591,021896947878860905905844870
5,0444,7784,7763,5603,6453,9014,285
4,4304,3894,4714,5404,6574,7134,6744,980
4,7994,8164,9384,9794,9024,9925,1125,1165,2565,2755,1965,443
755652755540640984
1,032
729960787729744689753
1,012
707785970794804880732736838711766
1,059
736822
1,3381,313
8361,001
923
80781fl84085387S897911953
973968826816835862892901927959967
i Figures not yet available. v Preliminary.NOTE—For explanation of above table see BULLETIN for February 1931, pp. 81-83, and July 1935, p. 463.
Central bank(Figures as of last report
date of month]
1937
Nov. Oct. Sept.
1936
Nov.
Central bank[Figures as of last report
date of month]
1937
Nov. Oct. Sept,
1936
Nov.
National Bank of Albania (thou-sands of francs):
GoldForeign assetsLoans and discounts _Other assets . ___Note circulation...Other sight liabilities _Other liabilities
Central Bank of the ArgentineRepublic (millions of pesos):
Gold at homeGold abroad and foreign ex-
change _Negotiable Government bonds..Other assetsNote circulation,. ,Deposits—Member bank, ,
GovernmentOther
Other liabilities "[Commonwealth Bank of Aus-
tralia (thousands of pounds):Issue department:
Gold and English sterling...Securities
Banking department:Coin, bullion, and cashLondon balancesLoans and discountsSecuritiesDeposits
Note circulation,.Austrian National Bank (millions
of schillings):GoldForeign exchange (non-reserve) _Loans and discountsGovernment debtsOther assetsNote circulationDepositsOther liabilities I___IIIIII
National Bank of Belgium (mil-lions of belgas):
GoldDiscounts, domestic and foreign"Loans ___
243157187620183907299185
3,3621,266
35
7,55321,7174,3534,82311,05314,78012,614
1,314
14741194
1,119405115651
16,00840,304
1,23235,99413,85337, 71984, 87948, 784
243154188620186922279191
3,3771,256
37
7,55322,0424,0734,55611,03514,63612,554
1,254
22625167
1,114401101750
16,00839,806
1,27935,82012,83237,86483,77648, 284
243142191620167914272177
3,4831,251
50
7,55623,8043,7075,08210,85016,77212, 527
1,224
16650166
1,038385140637
16,00238, 559
1,20621,80317,56935,70272,48547,039
243105208624153915247171
3,7171,367
National Bank of Belgium—Cont.Note circulation.,. „Demand deposits—Treasury
OtherOther liabilities
Central Bank of Bolivia (thousandsof bolivianos):
Gold at home and abroad1
Foreign exchangeLoans and discountsSecurities—Government
OtherOther assetsNote circulationDeposits ._„Other liabilities
Bank of Brazil (millions of milreis):Cash „Correspondents abroad,Loans and discountsDeposits
National Bank of Bulgaria (mil-lions of leva):
GoldForeign exchangeLoans and discountsGovernment debtOther assets VNote circulationDeposits.._ __Other liabilities IIIIIII
Bank of Canada (thousands of Ca-nadian dollars):
Gold._Sterling and United States" ex"
change _ .Canadian Gov't. securities:
2 years or lessOver 2 years _
Other securitiesOther assetsNote circulationDeposits-Chartered banks.._I__I
Dominion GovernmentOther
Other liabilities II
4,2712760272
54,209138,758* 29,192397,8514,58717,699250,055331,07761,165
4,3491653872
53,569133,87028,065394,1204,66715,847253,862319,67256,603
1,900637
1,3843,5231,1102,7443,4752,334
179, 561
22,187
94,79097,43312,1899,818
156,319216,13028,376
57714, 575
1,871587
1,5703,523957
2,9683,2162,323
179,579
26,743
82,48796,79212,1937,236
160,356198,57231, 581
97613,544
4,4364253672
53,014122,29415,368384,0924,66715,947253,516286,79455,072
257176
2,4762,614
1,834399
1,4373,523965
2,9502,9722,235
179, 505
28,134
63,29896,10210,9957,255
161,619179,36130,132
50613,671
44634
91672
28,70132,2687,786
415,4414,65116,238196,913240,67467,498
244400
2,4482,992
1,618708
1,4902,5721,0102,5842,3322,483
179,148
17,607
66,480102,679
7,120125,344214,92016,8491,45814,463
Digitized for FRASER http://fraser.stlouisfed.org/ Federal Reserve Bank of St. Louis

JANUARY 1938 FEDEKAL RESERVE BULLETIN 61
CENTRAL BANKS—Continued[Figures as of last report date of month]
Central bank
Central Bank of Chile (millions ofpesos):
Gold and foreign exchange in re-serve
Loans and discountsGovernment debt
DepositsBank of the Republic of Colombia
(thousands of DesosVGoldForeien exchangeLoans and discountsGovernment loans and securities.Other assets „ - .Note circulation «,DepositsOther liabilities
National Bank of Czechoslovakia(millions of koruny):
GoldForeign exchangeDiscountsLoansOnvcmmpnt dpbtOther assetsNote circulationDemand depositsOther liabilities
Bank of Danzig (thousands ofgulden):
GoldForeign exchange of the reserve..Other forpiim exchangeLoans and discountsOther assets
Demand depositsOthpr TiahiiiTiM
National Bank of Denmark (mil-lions of kroner):
GoldForpiun exchangeDiscountsLoans—To Government agencies
OtherSecurities -Other assetsNote circulation „DepositsOther liabilities
Central Bank of Ecuador (thou-sands of sucres):
Gold
"Kntp pirpiilfltion
Nat iona l Bank of Egyp t l (thou-sands of pounds):
GoldForeign exchangeLoans and discountsBritish, Egyptian, and other
Otherfi+har linhiliti'p*?
Centra l Reserve Bank of El Salva-dor (thousands of colones):
Gold
Government debt and securities.
Nov.
27,11010,49828,71747,15627,08849,56449,06541,941
2,582474
1,1251,0302,0121,1646,441
2171,729
28,1152,912
34316,1163,693
34,44713,17119 012
1185925
222896471
39297
159
1937
Oct.
144119795674308
28,8925,242
23, 23246,31828,17350, 73540,37540, 748
2,569447
1,2631,1842,0131,0676,516
3041,722
28,1131,499
32016,4513,859
34, 78612,83219 012
1183825
196138
5870
41370
160
6,5452,3876,495
36,6087,153
21,7837,989
20,3939,024
13,1615,001
6355,9622,327
Sept.
144107795666321
27,20910,41717, 62445, 75326,95050,04537,51740,391
2,571390
1,2431,1402,014
8986,469
1701,617
28,1141,320
54916,5045,663
34, 53513, 64719,015
1182827
2351025366
38587
157
6,fi451,7954,781
37,3717,686
21,6767,333
20,2038,966
13,1615,694
3835,9792,493
1936
Nov.
143140702621279
31, 2665,327
11,40945,49726,12551,10833,49835,018
2,590486691869
2,0251,1325,662
5761,555
29,409489
4,40315,2824,079
30, 64610,96419,435
1181632
2291325580
385117160
32,37219,95338,05154,34736, 238
6,5452,9466,651
39,1714,804
22,8506,931
21, 7488,588
13,0401,6861,3356,6361,506
Central bank
Central Reserve Bank of El Salva-dor— Cont.
Note circulation
Other liabilitiesBank of Estonia (thousands of
krooni):GoldForeign exchange (net)Loans and discountsOther assetsNote circulationDemand depositsOther liabilities
Bank of Finland (millions of mark-kaa):
GoldForeign assetsLoans and discounts ..Domestic securities .Other assetsNote circulation „Deposits—Treasury
OtherOther liabilities
Hank of Greece (millions of drach-mas):
Gold and foreign exchange (net)..Loans and discountsGovernment obligations _.Other assetsNote circulationDeposits —-Other liabilities
National Bank of Hungary (mil-lions of pengos):
Gold . „ .Foreign exchange reserveDiscounts *Loans—To Treasury . .
OtherOther assetsNote circulationDemand depositsCertificates of indebtednessOther liabilities
Reserve Bank of India (millionsof rupees):
Issue department:Gold at home and abroadSterling securitiesIndian Gov't. securitiesRupee coinNote circulation
Banking department:Notes of issue department...Balances abroadLoans to Gov'tInvestmentsOther assetsDeposits
. Other liabilitiesBank of Japan (millions of yen):
DiscountsLoans—Government
OtherGovernment bondsOther assetsNote circulationDeposits—Government
OtherOther liabilities
Bank of Java (millions of guilders) :Gold _ . . . .Foreign billsLoans and discounts
1937
Nov.
34,21315,33427,05227, 5G149,80034, 97319, 379
6352,2641, 020
341437
1,99633
9801,687
3,4365,3594,3772,0196,5105,9092,770
8456
422114
17281431236
89219
444803274628
1, 799
35056106812
382
113
sni550
3207677205
1,787' 283
84288
Oct.
16,3526,0024,732
34,21416,22926,22126,28450,32734,44618,175
G352,2601,016
351381
2,02089
8421,093
3,4465,4624,3772,0436,8395,9212,507
8455
425114
1727046S19189
216
444803274624
1,816
32896
• 6 4
11388112
6343
200664177
1,787335
78279
1174
85
Sept.
16, 2516,9H84| 471
34,21617,5062G, 51524, 11147,12138,69316, 533
. 6352,3011,014
358451
2,005100917
1,676
3,2525,1814,3761,8036,7355,6602,217
8458
419112
1726545719793
209
444803274617
1,798
341127
7910
446110
801549
3158554222
1,570358
77281
1175
73
1936
Nov.
14,8544,4354,913
34,1786,140
21,07020,00244,99225,63313,764
7151,530
8U5354356
1,565285523
1,477
2,7655,2744,1621,6695*9695,890X 011
8431
5089512
17040219493
212
444673234671
1,748
274111
105811
345
568ISO197501179
1,491334
71273
893
64
1 Items for issue and banking departments consolidated.2 By law o i August 10, 1937, gold revalued on August 25 t Irate of 290 milligrams fine gold per yen.
Digitized for FRASER http://fraser.stlouisfed.org/ Federal Reserve Bank of St. Louis

62 FEDERAL RESERVE BULLETIN JANUARY 1938
CENTRAL BANKS—Continued[Figures as of last report date of month]
Central bank
Bank of Java—Cont.Other assets .Note circulationDepositsOther liabilities
Bank of Latvia (millions of Iats):GoldForeign exchange reserveLoans and discountsOther assetsNote circulationDepositsOfhpr liabilities
Bank of L i t h u a n i a (millions of litu)Gold
DepositsOther liabilities
N e t h e r l a n d s B a n k (millions of guil-ders):
GoldSilver (including subsidiary coin)
Other assets . . .Note circulation
OtherOther liabilities
Reserve Bank of New Zealand(thousands of pounds):
GoldSterling exchange reserveAdvances to State or State un*
dertakingsInvestmentsOther assets . . . . . _.
Demand depositsOther liabilities
Bank of Norway (millions ofkroner)*
GoldForeign assetsTotal domestic credits and
securitiesDiscounts . .Loans _.Securities
Other assets -Note circulation _.Demand deposits—Government
Other _Other liabilities . „
C e n t r a l Reserve B a n k of Pe ru(thousands of soles):
Gold and foreign exchangeDiscountsGovernment loansOther assets
DepositsOther liabilities
B a n k of P o l a n d (millions of zlotys)Gold.__ .Foreign exchange ,_.Loans and discountsSecurities .Other assets .. ,Note circulationOther sight liabilitiesOther liabilities
B a n k of P o r t u g a l (millions ofescudos):
GoldOther reserves (net)Non-reserve exchange
1937
Nov.
7746
1334162
20134
774
11136
1218324
1,382175
2619462
887
75446
189213
185(00)0)(04226245
0)
43435
650135490
1,034324388
917574151
Oct.
107191
26
7745
13142
20534
777
10642
1238524
1,331185
1021261
856
73645
2,80217, 595
4,2662,658
30413,27412,5911,761
189201
1839128656
425474365
58,68939,38945,24612,54596,21537,90121,753
43336
635136459
1,094215390
916595146
Sept.
109195on25
7745
12642
20333
776
10338
1178325
1.266195
1118263
83479
58844
2,80219,066
4,5662,906
19612,99414,7221,820
189189
193103266414
423425861
56,14338 09945 03911,27997,42833 25119,882
43135
650136456
1,045280383
916592154
1936
Nov.
54160
24
7725
11750
19433
718
9229
1136423
570192
2231461
80631
11042
2,80216, 579
5,0952,350
30711,83813,6361,659
21589
250188204312
406643364
46,7053&f58645,8479,244
92,21532,65813,510
37925
818135419
1,032221523
912542135
Central bank
Bank of Portugal—Cont.Loans and discountsGovernment debt —f + Viat* accotcNote circulationOther sight liabilitiesOther liabilities....
National Bank of Rumania (mil-lions of lei):
Gold.— —
Special exchange accountsLoans and discountsSnecia.1 loans ^Government debtOther assets
Demand depositsOther liabilities __
South African Reserve Bank(thousands of pounds):
Foreign billsOther bills and loansOther assetsNote circulationDepositsOther liabilities
Bank of Sweden (millions ofkronor):
Gold — - .Foreign assetsDiscountsLoansDomestic securitiesOther assetsNote circulationDemand depositsOther liabilities
Swiss National Bank (millions offrancs):
GoldForeign exchange -Discounts.LoansOther assetsNote circulationOther sight liabilitiesOther liabilities.
Central Bank of the Republic ofTurkey (thousands of pounds):
GoldForeign exchange—Free . *
In clearing acccountsLoans and discountsSecurities .Other assets. ._Note circulationDeposits .Other liabilities
Bank of the Republic of Uruguay(thousands of pesos):
TQQITP f^PT\Qrt"Tn*iTifr •Gold and silverNotp cirniifltinn
Loans and discountsOther assetsDeDositsOther liabilities
National Bank of the Kingdom ofYucoslflvifi (millions of tiinflrsV
GoldForeicn exchangeLoans and discountsGovernment debtOther asse ts . . . . . . f c „Note circulationOther sieht liabilitiesOther liabilities
1937
Nov.
3211,0421 4282,1021,1361,195
16,343
5,9426,1092,014
10,6958,690
28, 11112,1909,493
5381,089
14277
300893976105
2,6635082132
6261,4531,756
640
36,7202
26,77350,220
186,29035,070
177,17146,123
111,781
1 758472
1 6142,2532,9235 7532 515
751
Oct.
3281,0421 435% 1211,1431,197
16, 258
6,4556,3952,027
12,1158,582
27,89612,23411, 702
22,9386,1861,829
12,66117,35622,9803,279
5371,095
.13246
297931925117
2,6724952227
6101,4501,737
639
36, 71630
25,32751,181
186,93730,933
176 17147,621
107, 330
42 08786 427
32 53188 57158 48084 61494 969
1 749537
1 6122,2522,8635 8572 423
732
Sept.
3391,0421 4392,1231,1541,205
16,168
6,3946,6862,040
12,0948,820
27,38612,52712,288
22,9386,385
62312,38515,24123,9553,135
5361,078
13266
319947899133
*2,531
4142128
6091,4421,523
638
36,71246
29,83350,177
187,16033,807
173,25244,497
119,987
42 08787 166
28 57885 55466 29286 04094 383
1 704712
1 5892,2522,6785 8432 357'737
1936
Nov.
3531,0441 2132,1071,0491,042
15,494
3,8226,6212,4429,4219,515
24,54211,11112,072
23,1469,653
3413,23815,29127,9602,820
528655132833
255812599101
2,58156384280
1,4031,280
114
30,22333
25,17239,686
185, 23320, 702176,68438,58685,778
41,60182,291
35,65487,46161,79399,95384,954
1,599573
1,7162,2621,5475,2361,593
867
1 Figures not yet available.• Agricultural and urban loans in process of liquidation.
Digitized for FRASER http://fraser.stlouisfed.org/ Federal Reserve Bank of St. Louis

JANUARY 1938 FEDERAL EESERVE BULLETIN 63
BANK FOR INTERNATIONAL SETTLEMENTS[In thousands of Swiss gold francs1]
Assets
1937
N o v . 30 Oct . 31
1936
N o v . 30Liabilit ies
1937
N o v . 30 Oct. 31
1936
Nov. 30
Gold In bars ;Cash on hand and on current account
with banksDemand funds at interest
13, 775
25,88618,043
13,401
20,21216,810
40, COG
19,2625,050
Rediscountable bills and acceptances(at cost):
Commercial bills and bankers' ac-ceptances
Treasury bills123,337146,124
115,558148,389
129,6721G0,964
Total.. 269,461 263,948 290, 036
Time funds at interest—Not exceeding3 months
Between 3 and 6 monthsBetween 6 and 9 months
Sundry bills and investments:Maturing within 3 months:
Treasury billsSundry investments
Between 3 and 6 months:Treasury billsSundry investments
Over 6 months:Treasury billsSundry investments
39,8227,754
18,95874,839
33,99455, 636
39,25753,052
50,5531,6316,185
46,232103,113
20,65534, 383
47,50035,445
27, 0G0
17,99342,729
31,46352, 739
41,37133,830
Total.. 275,73G 2%, 328
Other assets:Guaranty of central banks on bills
sold -Sundry items.
1,0071,177
1,0151,177
220,131
1,372120
Total assets... 653, 262 671,260 604,907
Demand deposits (gold)
Short-term deposits (various curren-cies):
Central banks for own account:DemandTime—Not exceeding 3 months.Time—Between 3 and 6 monthsTime—Between 6 and 9 months
Total ,
Central banks for account of others:Demand
Other depositors:Demand.Time—Not exceeding 3 months.
Long-term deposits:Annuity trust accountGerman Government depositFrench Government guaranty fundFrench Government deposit (Saar).
Total ,
Capital paid inReserves:
Legal reserve fund ,Dividend reserve fundGeneral reserve fund
Other liabilities:Guaranty on commercial bills sold..Sundry items.. . . . . .
Total liabilities.
8,391
41,120134,423
6,253
8,415 27,516
40,985154,238
11,90498, 506
6,216
181,790 201,440
2,551
5,8221,025
2,622
6,0191,026
110,409
4,201
703S9
153,71376,85631,622
1,037
153,28076,64031,439
1,031
153,28070,64043,398
],423
263, 228 262,390 274,741
125,000
4,2386,315
12,031
2,42139,844
125,000
4,2386,315
12,031
2,43238,731
125,000
3,7846,092
12,183
1,37739,115
653, 202 671, 200 601,907
i See BULLETIN for December 1936, p. 1025.
COMMERCIAL BANKS[Figures are as of end of month, except those for United Kingdom, which are averages of weekly figures]
United Kingdom
(Figures in millions of pounds sterling)
1930—December1931—December -~~~1932—December1933—December ^1934—December1935—December1936— December
1936—AugustSeptemberOctober -
December
1937—January -~~ - ~.
March. .AprilMayJuneJulyAugust- - . _ _ . _ . . _ . _September - . . . . . . . .„OctoberNovember
Assets
Cashreserves
Money atcall and
shortnotice
Bills dis-counted
Securi-ties
Loans tocustom-
ersOtherassets
Liabilities
Total
Deposits
Demand1 Time»Other
liabilities
10 London clearing banks
208184207213216221236
233229227233244
238230226230233241235234238234235
144119127119151159187
163166164181105
179167170177168171163162162165161
322246408311255322316
345344351329322
345307248241244259282277281296298
285297472565594605630
11
641648655656660
669671667661657654647645641639634
933905778740759784864
240222208237247231238
1,8761,7371,9831,9411,9712,0912,238
London clearing banks'
877882892895890
885909939951957969975973978988991
226226231238249
239243254256259261251244240244245
2,2462,2572,2802,2872,315
2,3072,2742,2442,2522,2552,2932,2932,2832,2872,3122,311
992868991
1,0151,0441,1401,288
1,2121,2281,2381,2411,2S8
1,2541,2171,2001,1941,2031,2531,2391,2351,2421,244
847846963900910924
1,012
9911,000
9991,0061,012
1,005997
1,0031,0081,0061,0221,0101,0011,0091,019
254237216244251231232
240238230243245
247252259263263261259253251253252
* Excluding deposits of National Bank relating to offices outside United Kingdom, which are included in total.» District Bank included beginning in 1936.NOTE.—For other back figures and explanation of table see BULLETIN for October 1933, pages 639-640,
Digitized for FRASER http://fraser.stlouisfed.org/ Federal Reserve Bank of St. Louis

64 FEDERAL RESERVE BULLETIN JANUARY 1938
COMMERCIAL BANKS—Continued[Figures as of end of month]
France
(4 large banks. Figures in millions offrancs)
Assets
Cash Due frombanks
Bills dis-counted Loans Other
assets
Liabilities
Deposits
Total Demand Time
Ownaccept-ances
Otherliabilities
1630—December..1931—December..1932—December,.1933—December-1934—December..1935—December..1936—August
September..OctoberNovember..December..
1937—JanuaryFebruary. __MarchAprilMayJune _JulyAugustSeptember.
2,41911,3119,0075,8705,8363,7393,0973,0833,1863,1733,1002,8522,7985,2372,8913,0142,7612,7642,9252,790
4,6752,1681,7661,4161,4212,4842,3262,7572,766
2,975
3,7703,5963,5793,6663,9334.1764,2584,552
20,44818,44122,01419,84818,30416,14115,44514,87617,07017,29817,58218,28917,82516,70116,04316,47915,86916,95416,84216,802
10,7439,2747,8508,3098,1598,0257.031
c7,3017,4527,6257,6317,9498,0568,3578,1167,9968,5148,2768,0088,723
2,3612,1301,7491,8271,7171,9001,451'1,5541,7271,8241,9571,3401,3971,4481,4811,4461,5951,6021,6891,832
36,68138,24537,75932,63530,94327,55324,97925,13727,54928,01528,48429,83129,64431,00827,70328,24228,12829,06928,98829,838
35,28437,02336,49131,77330,03926,85924,45124,61327,02827,46727,95529,30429,06130,46527,16427,68227,56828,52328,438
1,3971,2221,268
862904694528524521648529627583543539560560546550550
921576295273193337335368403454473561602600583542591570583644
4,3574,5034,3314,3624,3014,3994,0354,0664,2444,2904,2893,6263,6003,7323,8253,8173,9544.1334,1524,216
Germany 1
(5 large Berlin banks. Figures in mil-lions of reichsmarks)
Assets
Cash Duefrom
banksBills dis-counted Loans Securi- Other
Liabilities
Deposits
Total Demand Time
Creditsobtained
frombanks
Otherliabili-
ties
1930—November1931—No vember1932—November1933—November1934—November1935—November1936—September....
October..November
1937—JanuaryFebruaryMarch ,AprilMayJuneJulyAugustSeptemberOctober
191173143131115139180130137154130201132139180145153216136
1,483817583471393316287273269303301315297288296298282322277
2,4531,4311,6311,7022,0372,1622,3602,5692,5672,8952,9662,9083,2043,1713,0913,0992,9952,8603,041
7,4165,3774,5703,7313,3312,8842,7792,7352,7292,6792,6732,7322,6662,6372,6362,6762,7012,7542,667
482807938860874
1,0271,0661,0751,1121,0201,0221,014949
1,0391,037981
1,0831,0701,050
1,127991
1,003983933847858851837822813805807778760758781806
9,0916,0626,1615,7545,8165,3765,6216,7125,7515,9736,0296,1356,2136,2466,2046.1646,1756,1726,141
3,8573,2522,9582,6242,7312,4352,5752,6442,6612,9232,7602,9422,9262,9792,9692,9182,8922,9162,862
5,2332,8103,2033,1303,0852,9413,0453,0683,0903,0503,2703,1943,2873,2673,2363,2453,2833,2563,279
1,9861,3281,146
661485686575586579557578559551543563533533539510
1,8282,3411,5501,4811,4321,4491,3231,3421,3341,3571,3071,2881,2891,2911,2511,2611 2651,2P21,327
Assets Liabilities
Canada(10 chartered banks. Figures in mil-
lions of Canadian dollars)
Entirely in Canada
Cashreserves
1930—December1931—December1932—December1933—December1934—December....-1935—December1936— September
OctoberNovemberDecember
1937—JanuaryFebruaryMarchAprilMay.JuneJulyAugustSeptemberOctober
207201211197228228226232264240247239242246240238231241238252
Securityloans
2051351031061038310510911611411911912412111711611411410082
Otherloans
and dis-counts
1,2751,2531,1041,036
977945807816800791796805814835852853852863
Securityloans
abroadand net
duefrom
foreignbanks
171146155134155141146146179161173214161141139128139119110114
Securi-ties
604694778861967
1,1551,3801,3631,316l',3841,4121,4221,4271,4401,4381,4421,4311,4161,4461,411
Otherassets
Notecircula-
tion
602510439432449485494491485507468433616511491520472483507496
133129115121124111111112109103103108106106103107107105103106
Deposits payable in Can-ada excluding interbank
deposits
Total Demand
2,1152,0581,9161,9202,0352,1802,2632,2612,2692,3032,3302,3692,3702,3832,3722,3792,3222,3452,3712,333
689698538563628694762751722755782305786799799809750767797749
Time
1,4261,3601,3781,3571,4071,4861,5011,5101,6471^481,5491,5641,5841,5831,5741,6701,5721,5781,5761,584
Otherliabili-
ties
8167527607257187457857847837907818048108058028)1810816
e Corrected.Berlin brnks^ B e S w hf m< fit™*l^5^ f°,r D e c e m b e t , *™J to merger of two of the banks in February 1932 figures refer to six large(Sec! BULLETIN fw June 1935? p389^f e r e l y c o m p a r a b l e W l t h t h o s e s h o w n *» Previous years due to changes In reporting practice.
NOTE.-For other back figures and explanation of table see BULLETIN for October 1933, pp. 641-646, and June 1935, pp. 388-390.
Digitized for FRASER http://fraser.stlouisfed.org/ Federal Reserve Bank of St. Louis

JANUARY 1938 FEDERAL EESERVE BULLETIN 65
DISCOUNT RATES OF CENTRAL BANKS[Percent per annum
Date effective
In effect Jan. 1, 1936Jan. 2, 1936Jan. 10Jan. 16Feb. 4Feb. 7 _Mar. 28May 7May 18..May 30June 4June 24June 25June 26June 30July 7July 10Sept. 9Sept. 25.Oct. 2Oct. 9Oct. 16Oct. 20Nov. 26Dec. 3Tan 98 1Q 7June 15July 7Aug. 4Sept. 3 .Nov 13In effect Dec. 31,1937
Central bank of—
UnitedKingdom
2
2
France
654
VA56
5
4
3
53
2
46543K33
Ger-many
4
4
Italy
5
VA
4M
Nether-lands
VA
3zy2
VAVA
4
V/23
2
2
Switzer-land
2 ^
2
IX
IX
Centralbank of—
AlbaniaArgentina—AustriaBelgiumBoliviaBritish IndiaBulgariaCanada.ChileColombia...Czechoslo-
vakiaDanzigDenmark...EcuadorEl Salvador.EstoniaFinlandFranceGermanyGreeceHungaryItaly
RateDec.31
6VA3H2636tYl/L
4
344444K2
34644K
Changes since Nov
Dateeffective
April 1,1937Mar. 1, 1936July 10, 1935May 16, 1935July 5, 1932Nov. 28, 1935Aug. 15, 1935Mar. 11, 1935Dec. 16, 1936July 18, 1933
Jan. 1,1936Jan. 2, 1937Nov. 19, 1936Nov. 30, 1932Aug. 23, 1935Oct. 1, 1935Dec. 3, 1934Nov. 13, 1937Sept. 22, 1932Jan. 4, 1937Aug. 29, 1935May 18,1936
Centralbank of—
JapanJavaLatviaLithuania...MexicoNetherlandsNew Zea-
landNorwayPeruPolandPortugalRumaniaSouth AfricaSpain..SwedenSwitzerland.TurkeyUnited King-
dom.U. S. S. R...Yugoslavia..
RateDec.31
3.2935
32
246
a*m52y2
Hi245
Dateeffective
Apr. 7, 1936Jan. 14, 1937Nov. 1, 1936July 1, 193GMar. 1, 1937Dec. 3, 1936
June 29, 1936Dec. 7, 1936May 20,1932Dec. 18,1937Aug. 11, 1937Dec. 15, 1934May 15, 1933July 15,1935Dec. 1, 1933Nov. 26, 1936Mar. 2, 1933
June 30, 1932July lf 1936Feb. 1, 1935
30: Poland—Dec. 18, down from 5 to 4 ^ percent
MONEY RATES IN FOREIGN COUNTRIES[Percent per annum]
Month
United Kingdom (London)
Bankers'icceptances3 months
Treasurybills, 3months
Day-to-daymoney
Bankers'allowance
on deposits
Germany (Berlin)
Privatediscount
rateMoney for1 month
Day-to-daymoney
Netherlands (Amster-dam)
Privatediscount
rateMoney for
1 month
1936—NovemberDecember.
1937—January...February..MarchAprilMayJuneJulyAugust.. __.SeptemberOctober-..November.
3.003.00
3.003.003.002.902.882.882.882.882.882.882.88
2.842.8S
2.882.862.862.712.632.632.652.692.732.912.81
2.793.05
2.542.473.102.552.692.782.642.853.072.812.65
1.00.82
.63
.39
.38
.38
.31
.25
.19
.19
.20
.21
.25
Month
Switzer-land
Belgium(Brussels)
France(Paris)
Italy(Milan)
HungarySweden(Stock-
ilm)(Stohoh
Japan (Tokyo)
Privatediscount
rate
Privatediscount
rate
Privatediscount
rate
Privatediscount
rate
Primecommer-
cial paperDay-to-day
moneyLoans up
to 3months
Discountedbills
Callmoney
overnight
1<J36—October...NovemberDecember.
1937—January. _.February..MarchApril ,MayJuneJulyAugustSeptember.October....
1.691.461.25
1.251.181.001.001.001.001.001.001.001.00
1.291.001.00
1.001.001.001.001.001.001.001.001.001.39
2.521.961.99
2.224.014.064.003.935.025.204.113.543.62
4.504.504.50
4.504.504.504.504.505.005.005.005.005.00
2X-V.2M+X
4.754.754.75
4.754.754.754.754.754.754.754.754.754.75
2.922.862.74
2.632.672.832.862.692.802.702.852.462.65
NOTE.—For explanation of table see BULLETIN for November 1926, pp. 794-796; April 1927, p. 289; July 1929, p. 503; November 1929, p. 736, andMay 1930, p. 318.
Digitized for FRASER http://fraser.stlouisfed.org/ Federal Reserve Bank of St. Louis

66 FEDERAL RESERVE BULLETIN JANUARY 193S
FOREIGN EXCHANGE RATES[Average of noon buying rates for cable transfers in New York. In cents per unit of foreign currency]
Year or month
19291930193119321933193419351936193G—November.
December.
1937—JanuaryFebruary..MarchAprilMayJuneJulyAugustSeptember.October..-November,
Argen-tina
(peso)
95.12783. 50566. 73858.44372.80133.57932. 65933.13732. 58332.718
32.71832. 62732. 57032. 77432.92832.89833.10733. 20633. 02033.03233.309
Aus-tralia(pound)
Austria(schil-ling)
480.83458.60351. 50279. 93337. 07400.95388. 86395. 94389. 54390. 99
390. 98389. 93389. 26391. 78393. 70393. 25395. 70396. 92394. 68394.80398.16
14. 05814. 08914.02313.96015. 44818. 79318.83118.79218.68718.692
18.68218. 67718. 67718.68718.71918. 71418.77518.85118.84518. 82318.900
Bel-gium(belga)
13.91213.952J3.92913. 91417.90023.28718. 42416. 91716. 90716. 901
16.86016.86116. 84716.86016.86816.86616.83516.83816.83816.85917.009
Brazil (milreis)
Offi<^ n S e t
11.807810.71367.02907.12237.96308. 42688. 29478.56818.66628.6981
8.70808. 70538. 70218. 71058. 71928.71798.72668. 73148.72168.72328.7635
5.87885.86315.9525
6.08126.10766.10696. 25386. 41646.55436. 63356.54496.39975.83225.7266
BritishIndia(rupee)
36.20236.06733. 69026.34731.81637.87936. 96437. 52330.91337.088
37.09436. 97336. 88837.12037. 28037. 24537. 48337. 60137.39037.41037. 711
Bul-garia(lev)
Canada(dollar)
.7216
.7209
.7163
.71931.00391. 28521.29511.29581. 27951. 2779
1.28731.29031.28841.28751. 28391.28301. 28251.28451. 28551. 28541. 2844
99. 24799.84296.35388.09091. 959101.00699.49399. 913100.120100.062
99.96099.964100.051100.120100.14999. 94499. 85899.98299.982100.017100.073
Chile(peso)
12.060112.078512.06697.90797.678710.14525.08335.12405.16885.1719
5.17265.17315.17265.17255.17255.17385.17675.15715.15795.16945.1680
China(yuan)
41.90129.91722.43721.73628.59834.09436.57129,75129.46629. 525
29.65429. 60029.66429.71429.79829.65329.494
i 29.65029. 66029. 46329.444
Colom-bia
(peso)
96.55196.49396. 57095.27581.69761.78056.01157.08357.09757.390
57. 39057.23457.00856. 95656. 96757.00656.99256.99756. 99356. 99955.958
Cuba(peso)
Year or monthCzecho-slovakia(koruna)
Den-mark
(krone)Egypt(pound)
Finland(mar-kka)
France(franc)
Ger-many(reichs-mark)
Greece(drach-
ma)
HongKong
(dollar)
Hun-gary
(pengo)Italy(lira)
Japan(yen)
Mexico(peso)
Nether-lands(florin)
1929...1930193119321933193419351936 -1936—November-
December .
1937—January . . .February. .March.. . . .April.MayJuneJuly ...AugustSeptember.October...November.
2.96092. 96402.96192. 96183.82324. 24244.16424.00783.53803.5200
3.4*9223.48833. 48793. 48623.48533.48413.48543. 48753. 49363.49993. 5146
26. 68026. 76525.05818.83219.07122. 50021.88322.18921.81821. 907
21. 90821. 84721.80721.94522.05122.03122.17322. 23622.10922.11922.301
498.07498.60465.11359.54434.39516. 85502.60509.68501.17503.20
503.17501. 78500.87504.07506.49506.05509.30510.83507.83508.05512. 27
2. 51602. 51692.38751. 55471.87082.22772.16272.19032.15312.1611
2.16072.15792.15312.16562.17842.17922.19182.19642.18882.18862.2061
3.91613.92493. 92003.92765.03136.56886.60136.11414. 64724. 6675
4. 66725.65554. 59454.49634.4768
5 4.43993.80483. 75013. 51933. 34913.3946
23.80923.85423. 63023.74930. 51839.37540. 25840. 29740. 22340. 230
40. 22540. 22640.21540.20640.17140.07140.19640. 21340.12140.15740.364
1. 29341.29591. 2926.8320.7233.9402.9386.9289.8935.8973
.8965
.8951
.9003
.9052
.9043
.9088
.9116
.9074
.9076
.9152
47.16733.85324.33123.46029.45238. 71648. 21731.71130.46230.540
30. 56630.40330. 35530.50930.60030.34930.34330.99330.95930.97531.124
17. 44117.49417.45217.44622.36029. 57529.60229. 55819. 77619.778
19.77619.78219.77919.78519. 78119. 77119. 77019.76419.74519. 74119.819
5. 23345.23745.20635.12536 70948. 56178.24717. 29165.26035.2609
5.26105.26085.26085.26075. 26065. 26075.26005.26035.26035.26045.2623
46.10049.39048.85128.Ill25. 64629.71528.70729.00228.55928.512
28.53728.52928.49428. 63528. 78028.71128.88229.02728.86728.85329.095
48.18347.13335.49231.85028.10327. 74227. 77827.76027.75027.750
27.75027.75027.75027. 75127.75027. 75127. 75127. 75127. 75027.75027.750
40.16240. 22540. 23040. 29551. 72167.38367.71564.48153.99154. 566
54. 75254. 68654.70254.75754. 93654.97655. 09155.15155.15055. 28455. 452
Year or monthNew
Zealand(pound)
Norway(krone)
Poland(zloty)
Portu-gal
(escudo)
Ruma-nia(leu)
SouthAfrica(pound)
Spain(peseta)
StraitsSettle-ments(dollar)
Swe-den
(krona)
Switz-erland(franc)
Turkey(pound)
UnitedKing-dom
(pound)
Uru-ftuay(peso)
Yugo-slavia(dinar)
192919301931193219331934193519361936—November.
December.
1937—January.,..February..MarchAprilMayJuneJulyAugustSeptember.OctoberNovember.
483.21468.22415.29320.19340.00402.46391.26398.92392.36393.87
393.82392.92392.32394.76396. 61396. 21398.14400.10397.58397. 72401.08
26. 68326.76025.05518.00421.42925,31624.62724.97424. 55524.656
24.65824. 58924.54424.69924.81924.79724.95725.03024.88424. 89525.100
11.19411.20511.19711.18214.41418.84618.88218.87518.82518.853
18.92418.92918.93918. 95918.93418.92818.91518.90218. 89118.89018. 923
4. 47144.49404. 24353.19603.91654.60894.45754. 51304.43734. 4514
4. 44874. 44574.44114. 45994.47234.46894. 49584. 50534. 48644.48704.5165
.5961
.5953
.5946
.5968
.77951.0006.9277.7382.7289.7285
.7273
.7275
.7284
.7286
. 7290'. 7279.7286.7270.7313.7307.7314
483.27483. 79480. 76476. 56414.98498.29484.66491. 65483.43485.33
485.40484.24483.81
489.17488.6849L95493. 61490. 66490.89494.98
14. 68311. 6679.5458.044
10. 71913. 61513. 67812. 3148.7987.727
7.0996.7366.1495.7115.3485.2155.0626.2736.4776.2676.276
56.01255.96452.44540. 39749. 23259.00557.17358.25857.31457.544
57. 54957.40457.19457.64057.92957.8365$. 24058.4145S.07658.10758. 572
26. 78426.85425.25418.47122.03225.98225.27125.62625.19625.300
25. 30125.23225.18625.33925. 46525. 44425. 60725. 68325. 53325. 54625.754
19.27919.38219.40119.40524.83632.36632.49730.18922.98422.985
22.93622.82922.79222.82422.87022.87922.92022.96322.96523.02123.149
48. 41147.06147.18147. 28560.44079.04780.31280.35779.88380.162
80.15679.70079.95380.24680.13479.89780. 53780.39379. 66579.82480.493
485.69486. 21453. 50350.61423.68503.93490.18497.09488.80490.78
490. 75489.39488.51491. 63493.99493. 55496.72498. 22495. 30495. 51499.61
98. 62985.86555.35747.06460.33679.95680.25179.87480.04580.000
78.92678. 85678.75378.62678.65979.14379.37379.25079.11879.05279.140
1.75911. 76811.76801. 64111.76072. 27192.28372. 29652.29902.3003
2.30222.30592.30572.30562.30602. 30502. 3C722. 30512.30192.30252.3096
* Quotations nominal August 18-23, 1937.* Quotations nominal June 29-30, 1937.3 Quotations nominal Sept. 26, 1936-Oct. 7, 1937.NOTE.—For additional information concerning nominal status of exchange quotations, special factors affecting the averages and changes in the
basis of quotation, see note in BULLETIN for April 1937, p. 371.
Digitized for FRASER http://fraser.stlouisfed.org/ Federal Reserve Bank of St. Louis

JANUARY 1938 FEDERAL RESERVE BULLETIN 67
PRICE MOVEMENTS IN PRINCIPAL COUNTRIESWHOLESALE PRICES—ALL COMMODITIES
[Index numbers]
Year or month
19261927 -1928192919301931 _19321933 .19341935 . . _1936
1936—-October „November. .December
1937—January ._FebruaryMarchAprilMayJuneJuly . . .AugustSeptemberOctoberNovember
UnitedStates
(1926=100)
10095979586736566758081
828284
8G86888887878888878583
Canada(1926=100)
10098969687726767727275
777780
8183868685858886858583
Uni tedKingdom(1930=100)
100888686888994
9898
101
103104107109111111112111111111109
France(1913=100)
C9564264562755450242739837G338411
471492519
538533550552550557582603630628622
Germany(1913=100)
134138140137125111979398
102104
104104105
105106100106106106106107106106
PIOO
Italy(1928=100)
1009585757063G26876
777879
82838580889090919293
Japan(October1900=100)
237225226220181153161ISO
.178186197
200204215
233230240248241238239235239237238
Nether-lands
(1926-30=1.00)
10610310210090766563630264
687071
7374767777767878777776
Switzer-land
(July 1914=100)
14414214514112611096Ut909096
103105107
108111113113113112112111111111
p Preliminary.
WHOLESALE PRICES—GROUPS OF COMMODITIES[Indexes for groups included in total index above]
Year or month
19261927192819291930 _.-193119321933193419351936
1936—OctoberNovemberDecember
1937—January -February.March --April
JuneJulyAugust -SeptemberOctoberNovember
United
Farmproducts
100991
10610588654851657981
848589
919194929089898686SO76
States (1926=100)
Foods
10097
101100
91756161718482
838486
8787888684858687888683
Othercommod-
ities
10094939285757071787880
808182
8384868786868686868584
United Kingdom(1930^100)
Foods
100898883858792
989799
9999
101102102102103103104105105
Indus-trial
products
100878587909096
9799
102
105107111113115115116116115113110
F r a n c e (1913=100)
Farmand foodproducts
581599584579526542482420393327426
487500522
532516528522520532549572612607615
Indus-trial
products
793678697069579464380380361348397
457484516
543548570577576579610629645646628
Germany
ARricul*tural
products
129138134130113104918796
102105
104103104
103103104104104105106106105105
P105
Provi-sions
132129133125113
968675768486
SO8691
93949595989898989797
i>96
(1913-100)
Indus-trial rawand semi-finishedproducts
1301321341321201038988919294
959590
97979897979796969695
J>94
Indus-trial fin-
ishedproducts
150147159157150136118113116119121
122123123
123123124124124124125125126126
P126
Sources— See BULLETIN for March 1931, p. 159, March 1935, p. 180, October 1935, p. 678, March 1937, p. 270, and April 1937, p. 372.
Digitized for FRASER http://fraser.stlouisfed.org/ Federal Reserve Bank of St. Louis

68 FEDERAL RESERVE BULLETIN JANUARY 1938
PRICE MOVEMENTS IN PRINCIPAL COUNTRIES—ContinuedRETAIL FOOD PRICES
.[Index numbers]
Year ormonth
19261927192819291930193119321933193419351936
1936—Oct. .NovDec
1937—jan. ,Feb..Mar..Apr.May.June.July.Aug.,Sept.Oct..
. . .
. . .
Nov
UnitedStates
1923-1925^=100
109105103105100826866748082
838383
8585858687868686868584
Eng-landJuly
1914=100
161156157154145131126120122125130
132136136
136135135135136136140140140143146
FranceJuly
1914=100
554557549611614611536491481423470
504520534
562577577580584576580594627644645
Ger-m a n y1913-
1914=100
146153153156146131116113118120122
122121121
121122122122122123125124122121121
Nether-lands1911-
1913=100
161163166162150136119120124118120
124124122
124122123125126129130130129130
Switz-er-
landJuly
1914=100
160158157156152141125117115114120
123123123
126129129129129131131130130130
COST OF LIVING[Index numbers]
Year ormonth
1926192719281929193019311932193319341935.1936
1936—Oct.Nov.Dec
1937—Jan.Feb.Mar....AprMay.. .June,._JulyAug.Sept....Oct.Nov....
UnitedStates1923-
1925=100
10310110010097898076798182
82
84
85
85
Eng-landJuly
1914=100
170164166164158148144140141143147
148151151
151151151151152152155155155158160
FranceJan.-June
1914=100
505514519556581569526520516483507
540
581
606
630
Ger-m a n y1913-
1914=100
142148152154148136121118121123125
124124124
125125125125125125126126125125125
Nether-lands1911-
1913=100
168168169168161151141139140136
t 132
134134133
134134134136136138139139139140
Switz-er-
landJuly
1914=100
162160161161158150138131129128130
132132132
133136136137136137137137137138
i Revised index as from March 1936 (see BULLETIN for April 1937, p . 373).Sources.—See BULLETIN for April 1937, p . 373.
SECURITY PRICES
[Index numbers except as otherwise specified]
Year or month
Number of issues. _
19261927192819291930193119321933193419351936 . .
1936— OctoberNovember...December...
1937—JanuaryFebruaryMarchAprilMayJuneJulyAugustSeptember...OctoberNovember...
Bonds
UnitedStates
(averageprice)*
60
97.6100.7100.898.099.390.969.573.484.588.697.5
99.699.899.9
100.3100.098.596.696.295.095.394.891.386.483.3
England(December1921—100)
87
110.0110.7112.3110.2111.8108.4113.2119.7127.5129.9131.2
132.9132.0130.9
129.7125.5124.3125.3125.0123.9123.3123.2122.8123.6124.1
France(1913=100)
36
57.471.780.885.195.896.988.681.382.183.576.3
80.878.878.4
77.575.174.672.672.374.675.077.274.875.676.4
Germany(averageprice)
139
85.581.483.3
* 83.4'67.1
82.590.795.395.8
96.296.396.4
96.797.497.798.598.898.999.099.499.399.4
*99.6
Nether-lands3
8
100.0104.3104.194.8
105.3113.4107.8109.1
117.5120.0120.3
U00.9100.398.8
100.0100.3101.5102.4103.7103.7102.4104.3
Common stocks
(1926=100)
UnitedStates
420
100.0118.3149.9190.3149.894.748.663.072.478.3
111.1
118.7124.2123.1
126.4129.5129.9124.5116.3113.6117.8120.5106.491.482.9
England
278
100.0107.0115.9119.5102.678.967.978.685.786.397.0
102.1103.2103.5
104.2103.8102.7101.099.397.096.896.892.788.285.8
France
300
100.0123.2178.1217.6187.6132.2105.299.683.379.777.2
83.789.794.8
114.6113.3112.096.694.894.090.693.690.191.890.1
Germany
329
100.0145.0136.1122.8100.2S78.0»50.3
61.771.182.991.6
97.297.896.7
97.899.2
100.3101.5102.6103.5105.1106.1105.3103.9
P102.8
Nether-lands
(1930=100)
100
100.70.46.52.55.55.66.
78.988.691.2
rlOO.9••108. 5'113.1'109.6'105.0••102.9'107. 2'114.7rlOS. 1r 94.8
90.5
v Preliminary. ' Revised1 Prices derived from average yields for 60 corporate bonds as published by Standard Statistics Co.2 Exchange closed from July 13 to Sept. 2,1931, and from Sept. 19,1931, to Apr. 11,1932. Index for 1931 represents average of months January-
June; index for 1932 represents average of months May-December.a Indexes of reciprocals of average yields. For old index, 1929-1936, 1929=100; average yield in base year was 4.57 percent. For new index
beginning January 1937, January-March 1937=100; average yield in base period was 3.39 percent.* New index. See note 3Sources.—See BULLETIN for February 1932, p. 121, June 1935, p. 394, April 1937, p. 373, July 1937, p. 698, and November 1937, p. J172.
Digitized for FRASER http://fraser.stlouisfed.org/ Federal Reserve Bank of St. Louis

FEDERAL RESERVE DIRECTORY
69
Digitized for FRASER http://fraser.stlouisfed.org/ Federal Reserve Bank of St. Louis

BOARD OF GOVERNORS OF THE FEDERAL RESERVE SYSTEM
M. S. SZYMCZAK
MARRINER S. ECCLES, Chairman
RONALD RANSOM, Vice Chairman
CHESTER C. DAVIS
JOHN K. MCKEE
CHARLES S. HAMLIN, Special CounselLAWRENCE CLAYTON, Assistant to the ChairmanELLIOTT THURSTON, Special Assistant to the ChairmanCHESTER MORRILL, Secretary
LISTON P. BETHEA, Assistant SecretaryS. R. CARPENTER, Assistant SecretaryJ. C. NOELL, Assistant Secretary
WALTER WYATT, General CounselJ. P. DREIBELBIS, Assistant General CounselGEORGE B. VEST, Assistant General CounselB. MAGRUDER WINGFIELD, Assistant General Counsel
LEO H. PAULGER, Chief, Division of ExaminationsR. F. LEONARD, Assistant Chief, Division of ExaminationsC. E. CAGLE, Assistant Chief, Division of Examinations
E. A. GOLDENWEISER, Director, Division of Research and StatisticsWOODLIEF THOMAS, Assistant Director, Division of Research and StatisticsLAUCHLIN CURRIE, Assistant Director, Division of Research and StatisticsGEORGE W. BLATTNER, Assistant Director, Division of Research and Statistics
EDWARD L. SMEAD, Chief, Division of Bank OperationsJ. R. VAN FOSSEN, Assistant Chief, Division of Bank OperationsJ. E. HORBETT, Assistant Chief, Division of Bank Operations
CARL E. PARRY, Chief, Division of Security LoansPHILIP E. BRADLEY, Assistant Chief, Division of Security Loans
0. E. FOULK, Fiscal AgentJOSEPHINE E. LALLY, Deputy Fiscal Agent
FEDERAL OPEN MARKET COMMITTEE
MARRINER S. ECCLES, Chairman
GEORGE L. HARRISON, Vice ChairmanCHESTER C. DAVIS
WM. A. DAY
WM. MCC. MARTIN
JOHN K. MCKEE
B. A. MCKINNEY
RONALD RANSOM
JOHN S. SINCLAIR
M. S. SZYMCZAK
CHESTER MORRILL, SecretaryWALTER WYATT, General CounselJ. P. DREIBELBIS, Assistant General CounselE. A. GOLDENWEISER, EconomistJOHN H. WILLIAMS, Associate EconomistW. RANDOLPH BURGESS, Manager of System Open
Market Account
FEDERAL ADVISORY COUNCIL
District No. 1 (BOSTON) THOMAS M. STEELE
District No. 2 (NEW YORK) W. W. ALDRICH
District No. 3 (PHILADELPHIA) HOWARD A. LOEB,
Vice-PresidentDistrict No. 4 (CLEVELAND) L. B. WILLIAMS
District No. 5 (RICHMOND) CHARLES M. GOHEN
District No. 6 (ATLANTA) EDWARD BALL
District No. 7 (CHICAGO) EDWARD E. BROWN
District No. 8 (ST. LOUIS) WALTER W. SMITH
PresidentDistrict No. 9 (MINNEAPOLIS) JOHN CROSBY
District No. 10 (KANSAS CITY) W. T. KEMPER
District No. 11 (DALLAS) R. E. HARDING
District No. 12 (SAN FRANCISCO) . . . PAUL S. DICK
WALTER LICHTENSTEIN, Secretary
70
Digitized for FRASER http://fraser.stlouisfed.org/ Federal Reserve Bank of St. Louis

SENIOR OFFICERS OF FEDERAL RESERVE BANKS
Federal ReserveBank of—
Chairman and FederalEeserve Agent President First Vice President Vice Presidents
BostonNew York _
Philadelphia
Cleveland
Richmond —
Atlanta ._.
Chicago --,
St. Louis
Minneapolis—
Kansas City.
Dallas
San Francisco..
F. H. Curtiss
Owen D. Young !
R. L. Austin
E. S. Burke, Jr
Robert Lassiter _ _
F. H. Neely
R. E. Woodi
W. T. Nardin.
W. B. Geery
J. Jt Thomas..
J. H. Merritt.
A. O. Stewart
R. A. Young...
G. L. Harrison.
J. S.Sinclair
M. J. Fleming
Hugh Leach
Oscar Newton _
G. J. Schaller: -
W. W. Paddock..
Allan Sproul
F. J. Drinnen..
F. J. Zurlinden
J. S. Walden, Jr..
II. S. Parker.
W. McC. Martin..—
J. N. Peyton
G. H. Hamilton....
B. A. McKixmey...
W.A. Day
H. P. Preston
F. G. Hitt
O.S.Powell
C, A. Worthington....
R. R. Gilbert
Ira Clerk..
W. Willett a
W. H. BurgessL. R. RoundsW. S. LoganJ. IL WilliamsR. M. GidneyL. W. KnokeC. II. Coe
C. A. Mcllhenny *W. J. DavisE. C. Hill
W. H. FletcherW. F.Taylor*
J. G. FryG. H. Keesee *II. F. ConniffW. S. McLarin, Jr. aW. II. Snyder'C. S. YoungJ. H. Dillard
0. M. AtteberyJ. S. WoodC M . Stewart a
H. I. Zicmer»E. W. Swanson
J. W. Helm *
R. B. Coleman aW. J. Evans
S. G. SargentW. M. HaleC. E. Earhart >
* Deputy chairman. » Cashier. * Also cashier.
MANAGING DIRECTORS OF BRANCHES OF FEDERAL RESERVE BANKS
Federal Reserve Bank of—
New York:Buffalo branch
Cleveland:Cincinnati branch ._Pittsburgh branch
Richmond:Baltimore branchCharlotte branch
Atlanta:Birmingham branchJacksonville branchNashville branchNew Orleans branch
Chicago:Detroit branch _
St. Louis:Little Rock branch __Louisville branchMemphis branch _
Managing director
R. M. O'Hara
B. J. LazarG. H. Wagner
W. R. MiliordW. T. Clements
P. L. T. BeaversG. S. Vardeman, Jr.J. B. Fort, Jr.L. M. Clark
R. H. Buss
A. F. Bailey
W. H. Glasgow
Federal Reserve Bank of—
Minneapolis:Helena branch
Kansas City:Denver branchOklahoma City branchOmaha branch
Dallas:El Paso branchHouston branch _San Antonio branch
San Francisco:Los Angeles branchPortland branchSalt Lake City branch _Seattle branchSpokane branch
Managing director
R. E. Towle
J. E. OlsonC. E. DanielL. H. EarhartJ. L. HermannW. D. GentryM. Crump
W. N. AmbroseR. B. WestW. L. PartnerC. R. ShawD. L. Davis
SUBSCRIPTION PRICE OF BULLETIN
The FEDERAL RESERVE BULLETIN is the Board's medium of communication with memberbanks of the Federal Reserve System and is the only official organ or periodical publication ofthe Board. The BULLETIN will be sent to all member banks without charge. To others thesubscription price, which covers the cost of paper and printing, is $2. Single copies will be soldat 20 cents. Outside of the United States, Canada, Mexico, and the insular possessions, $2.60;single copies, 25 cents,
71
Digitized for FRASER http://fraser.stlouisfed.org/ Federal Reserve Bank of St. Louis

FEDERAL RESERVE DISTRICTS
• — BOUNDARIES OF FEDERAL RESERVE DISTRICTS. _ - BOUNDARIES OF FEDERAL RESERVE BRANCH TERRITORIES
& FEDERAL RESERVE BANK CITIES• FEDERAL RESERVE BRANCH CITIES
' o FEDERAL RESERVE BANK AGENCY
LOUISVIILE, LITTLE ROCK, AND MEMPHIS BRANCHES SERVE CERTAIN DESIGNATEDCITIES RATHER THAN ZONES DETERMINED BY STATE OR COUNTY LINES
SPOKANE BRANCH SERVES CITY OF SPOKANE ONLY
Digitized for FRASER http://fraser.stlouisfed.org/ Federal Reserve Bank of St. Louis