fatness and overweight in women and children from riverine amerindian communities of the beni river...
TRANSCRIPT
1
Fatness and overweight in Amerindian women and children from riverine
Amerindian communities of the Beni River (Bolivian Amazon) 2
Running head title: Overweight in Amerindian children and women 4
Contributors: Eric Benefice 1, Ronald Lopez
1, 2, Selma Luna Monroy
1, 2 and Sonia Rodríguez
2 6
Affiliations: 8
1 Epidemiology and Prevention, Research Unit R024, IRD (Institut de Recherche pour le 10
Développement) Representación IRD en Bolivia, av Hernando Siles # 5290, Esq Calle 7
Obrajes 12
Po Box 9214, La Paz (Bolivia)
14
2 Instituto SELADIS (Facultad de Ciencias Bioquímicas y Farmacéuticas, Universidad Mayor de
San Andrés, La Paz, Bolivia) 16
Guarantor: Eric Benefice 18
Nature of the contributions: EB was responsible for all stages of the study and wrote the first 20
draft of the paper; EB and RL designed the survey; EB and SLM collected dietary, clinical and
anthropometric data; SLM and SR performed parasitological analysis; RL was in charge of 22
laboratory analysis and follow-up of subjects.
24
Corresponding author:
26
Eric Benefice
IRD Av H Siles #5297 * Esquina 7 de obrajes, PoBox: 9214 28
La Paz (Bolivia)
fax: (591 2) 2 78 29 44 30
tel: (591 2) 2 78 29 69
mail: [email protected] 32
http://www.bo.ird.fr/
34
ird-0
0192
474,
ver
sion
1 -
4 D
ec 2
007
Author manuscript, published in "American Journal of Human Biology 19, 1 (2007) 61-73" DOI : 10.1002/ajhb.20580
2
Abstract
2
Obesity is a worldwide public health problem impacting not only industrialized nations but also
developing countries. The main objective of this paper was to analyze risk factors for overweight 4
among Amerindian children and their mothers. Data were collected in 15 Amerindian riverside
communities from the Beni River (Bolivia). The total sample was 195 mothers and 452 children, 6
0-15 years of age. Information about family activity and dietary patterns was collected and a
clinical examination was performed. Stool samples were collected in children for parasitological 8
screening. Anthropometric measurements, including weight, height, arm circumference and 4
skinfolds were taken. A bio-electrical impedance analysis was performed in mothers. A total of 10
12.2% (IC 95%: 9.1~15.9%) of the children were considered overweight; less than 1% were
overtly obese (IOTF criteria). Among their mothers, 35.3% (IC 95%: 28.7~42.5%) were 12
overweight (BMI (weight / height 2
)> 25 kg/m2) and 5% (IC 95%:2.5~5.1%) were obese (BMI >
30 kg/m2). The BMI was moderately related to anthropometric indices of body composition in 14
children, but was highly correlated with fatness in mothers. The risk of overweight was not
associated with environmental factors in children. In mothers, there was a significant relationship 16
between BMI, health status and dietary diversity score. There was a moderate association in boys
between fatness and the BMI of their mothers (R2
= 0.12, p< 0.001), but not in girls. These 18
findings suggest a trend toward accumulation of fat related to possible changes at the economic
and agricultural levels, even in remote rural areas. 20
Sponsorship: Research Unit 024 “Epidémiologie et Prévention” of IRD (France) and “Action 22
Thématique Interdépartementale Usage des Sols et des Sédiments: Impact Sanitaire » (IRD).
24
Key words: Body mass index, Electric impedance, Skinfold thickness, Dietary diversity, South
American Indians, Bolivia 26
ird-0
0192
474,
ver
sion
1 -
4 D
ec 2
007
3
Introduction 2
Up until the last decade, research on malnutrition in developing countries focused almost 4
exclusively on undernutrition. However, about 7% of the world population is now considered to
be obese (Seidell 1999). The explosion of so-called “obesity epidemics” and increased awareness 6
that non-industrialized countries are also affected have prompted numerous investigations. The
rise in obesity is worrisome in developing countries since, in addition to its individual clinical 8
harm, it is likely to represent an unaffordable cost in funding of public health institutions in
terms of diagnosis, handling, treatment and rehabilitation of patients (Pena and Bacallao 2002). 10
The situation in developing countries is obscured by the coexistence of overweight or obesity 12
and undernutrition, especially chronic malnutrition. A recent report analyzed this so-called
“double burden” using data from 36 developing countries. Overweight prevalence exceeded 14
underweight in more than half of the selected countries. Urbanized and economically emergent
countries presented the highest overweight/underweight ratio (Mendez and others 2005). In 8 16
Latin America countries the median prevalence of overweight was 32.4% in urban women. This
trend toward increased obesity and overweight rates in Latin America and Caribbean regions was 18
first documented by Martorell and coworkers using DHS (Demographic and Health Surveys)
data (Martorell and others 1998). Obesity (body mass index or BMI > 30 kg/m2) ranged from 8-20
10% in Latin American women. Overall, 9 to 14.7% of children were overweight (weight-for-
height > 1 SD above the reference value). This unexpected overweight risk in children was 22
thereafter confirmed by an analysis of the WHO “Global Database on Child Growth and
Malnutrition” (de Onis and Blossner 2000). Using a weight-for-height cut-off of >2 SD as the 24
entry point into obesity, the authors found the highest prevalence rates in Latin America and the
Caribbean (4.4%). The overall prevalence was estimated at 3.3%, thereby exceeding the 2.3% 26
expected prevalence (de Onis and Blossner 2000).
28
A number of recent Latin American surveys have confirmed the rapid emergence of obesity. In
Chile, among poverty-stricken populations in the capital city, there was an increase in 30
prevalence from 6 to 11% in men and from 14 to 24% in women over only a 4-year period.
Overweight also increased in children, especially among the beneficiaries of a food supplement 32
program (Uauy and others 2001). In Mexico, children have been strongly affected by the obesity
ird-0
0192
474,
ver
sion
1 -
4 D
ec 2
007
4
wave: 10 to 16% of boys and 14 to 19% of girls are considered to be overweight (del Rio-
Navarro and others, 2004). In Brazil, based on 3 successive national surveys performed in 1975, 2
1989 and 1996, a rapid increase in obesity was clearly demonstrated. All population groups were
affected (Monteiro and others 2000). In large countries such as Mexico and Brazil, considerable 4
heterogeneity was found according to the geographic location and the economic situation
(Abrantes and others 2002; del Rio-Navarro and others 2004). 6
Trends in obesity patterns in Latin America cannot be viewed as a simple linear projection of the 8
trend in industrialized countries. Substantial heterogeneity exists in Latin American countries
from the standpoint of economic development, education and health services, the origins of the 10
populations (European versus Amerindian) etc., that may involve differences in nutritional
status. Bolivia, one of the most poorly developed Latin American countries, had the highest 12
prevalence of malnutrition among Andean countries (Larrea and Freire 2002). However, recent
studies indicate that Bolivia is also experiencing an increase in the prevalence of overweight and 14
obesity (Amigo 2003; Martorell and others 1998). Recent analyses of DHS surveys point to a
rise in an overweight prevalence (defined as 25<BMI<30 kg/m2) of 9 percent between1994 and 16
1998, but not in obesity (BMI>30 kg/m2). One explanation is that Bolivia is just at the beginning
of the “nutritional transition” process (Perez-Cueto and Kolsteren 2004; Popkin 2001). The latest 18
DHS survey (2003) confirmed this increase in the prevalence of both overweight (30.3%) and
obesity (15.1%) in women (MEASURE 2004). This trend is even more pronounced in the capital 20
city La Paz, and involves school-age children and adolescents (Perez-Cueto and others 2005).
The prevalence of overweight in women is higher in urban and lowland areas (“Llano” and 22
Amazon) than in rural or Andean areas of Bolivia (MEASURE 2004).
24
Since obesity and overweight indices are calculated from height and weight, one important
concern is their significance in populations of short stature and with a high degree of chronic 26
malnutrition, such as those found in Bolivia. According to the latest DHS survey, the mean
stature of women is 152 cm in Bolivia; 10.3% of females measured less than 145 cm 28
(MEASURE 2004). It has been argued that, for the same BMI, subjects with short stature are
fatter than taller persons (Lopez-Alvarenga and others 2003). This would mean that the 30
overweight prevalence in Bolivia is even worse. Likewise, an association between short stature
and obesity was found in Brazil, and was more pronounced in women than in men (Sichieri and 32
others 2003). It is thus important to use independent indicators of fatness, like skinfold thickness
and bioelectric impedance analysis. Interestingly, measurement of several skinfolds enabled the 34
ird-0
0192
474,
ver
sion
1 -
4 D
ec 2
007

5
elaboration of a simple index of regional fat distribution, such as the trunk-to-extremities ratio
(Malina and others 1999;Rolland-Cachera and others 1990). Moreover, fat distribution, 2
especially higher fat accumulation on the trunk in early adolescence , is an acknowledged risk
factor for metabolic diseases during adulthood (Malina and others 1999). 4
Hence, the main objective of this paper was to present data on overweight and obesity in children 6
and women in a population leading a “traditional” way of life in the Beni department (lowland
Bolivia). In addition, we sought to elucidate the role of environmental, familial and individual 8
factors in the risk of overweight.
10
ird-0
0192
474,
ver
sion
1 -
4 D
ec 2
007
6
Methods
2
Milieu and populations
4
Results presented here are drawn from a health study performed in 2004 and 2005 in a
population living along the Beni River (Bolivia), from the foothills (Rurrenabaque: south =14.4˚; 6
west= 67.5˚) of the Andes to 120 km downstream (Villa Fatima: south =13.8˚; west= 67.5˚). The
main purpose of that survey was to provide first-hand data on the health and nutritional status of 8
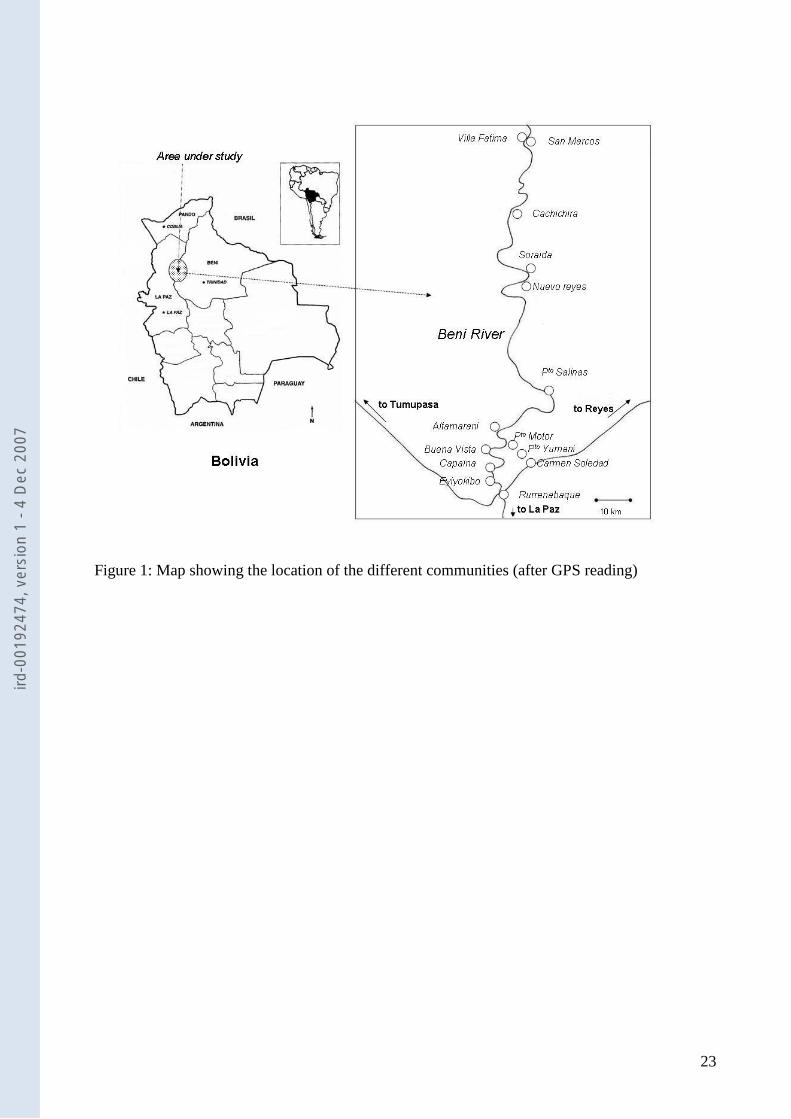
15 communities exposed to mercury contamination (see map, Figure 1). The study was carried
out below the 200 m contour in an area with a humid tropical climate characterized by high 10
annual rainfall, over 2500 mm, and an average temperature of 22 to 24 °C.
12
The total population living in the area, based on the 2001 census (INE 2001), is estimated at
about 14,000, but only 4,000 persons live along the banks of the Beni River. The sample size 14
was chosen on the basis of a reported prevalence of 35 % chronic malnutrition in 0-10-year-old
children in rural Bolivia (MEASURE 2004). A theoretical calculation showed that at least 364 16
children were required in order to obtain 5% precision, with a 95% confidence interval (CI 95%).
A total of 348 children 0 to 10-years-old were finally measured, providing adequate precision. 18
Communities were constituted by small hamlets scattered along the river, with frequent
displacement for fishing, logging and agricultural activities. It was not possible to draw a random 20
sample. Moreover, this procedure would have been misunderstood and unacceptable to the
population. We therefore decided to incorporate all mothers and their children up to 15 years of 22
age present in the communities at the time of our visits. Data were collected in 2004 during 4
field rounds (March to August) and completed by a survey carried out in March 2005 in order to 24
verify and complete certain data. The present sample (n=647) comprised 452 children (171
under 5 years of age, 177 between 5 and 10 years of age, and 104 adolescents older than 10 26
years), along with 195 mothers (33.5 ± 13.1 years old). Anthropometric data (skinfold
measurement) were incomplete for 2 children and 4 mothers; hence numbers varied in the table. 28
Most of the inhabitants belonged to the Takana ethnic group. The others were Esse Ejjas, a 30
closely related group. A small number of families were Aymaras who migrated from the
Altiplano to settle in the Beni. Takanas constitute a well-integrated group in modern Bolivian 32
ird-0
0192
474,
ver
sion
1 -
4 D
ec 2
007
7
society and speak Spanish. Wood-cutting is their main wage-earning activity. Esse Ejjas lead a
more traditional way of life, subsisting mostly on fishing. While this report does not intend to 2
compare the two groups, there exist differences in their way of life that will be accounted for in
this analysis. The living conditions of all riverside communities are unfavorable. Public 4
infrastructures such as health centers, elementary and secondary schools are rare. There exists
only limited access by roads, and traveling by canoes or small boats is the means of 6
transportation adopted by most communities. Nutritional and health indicators are mediocre.
Subjects have been exposed to multiple infections and parasitic infestations. Chronic 8
malnutrition, represented by stunting in growth, affects 41% of preschoolers; however, no cases
of severe malnutrition (wasting) were found. Mothers were found to be of short stature. Iron 10
deficiency anemia is quite frequent: 42% of the women had a hemoglobin concentration under
12 g/100 ml. More than half of the mothers surveyed had lost at least one child (Benefice and 12
others 2006). Food consumption was also analyzed in detail. The main meal was an association
of rice and meat or fish. Yucca or Manihot esculenta) and plátano (Musa paradisiaca) were 14
consumed almost every day by 2/3 of the households. Fruits consumption varied according to the
season with a predominance of oranges and grapefruits(Benefice and others 2006). 16
Ethical considerations
18
The study protocol was approved by the Facultad de Bioquimica y Farmacia (Universidad Mayor
de San Andrès, La Paz), the Seladis Institute (Servicio de Laboratorio de Diagnóstico e 20
Investigación en Salud) and the Institut de Recherche pour le Développement (IRD, France)
Review Boards. The Comité Nacional de Bioética (Bolivia) as well as the Comité Consultatif de 22
Déontologie et Bioéthique (CCDE, France) gave their agreement. Subjects were individually
notified about the aims of the study and had to sign an informed consent form. In the case of 24
children, their parents signed the form. When subjects were illiterate, a reliable witness signed
instead. Subjects freely agreed to participate in the study and did not receive any salary or 26
compensation for this. However, when they were found to be ill, they received free medical
orientation and treatment from one of the physicians on the team. Children were offered anti-28
helminth treatment when they had contaminated stools, and mothers received a 3-month supply
of ferrous iron and folate when their hemoglobin concentrations were low. 30
ird-0
0192
474,
ver
sion
1 -
4 D
ec 2
007
8
Study variables 2
Each subject underwent clinical examination by a physician (EB). A total of 373 subjects 4
(57.6%) were found to be free of clinically detectable disease; 250 (38.6%) presented mild
symptoms and 24 (3.7%) more severe illness requiring medical treatment. For simplicity of 6
analysis, the heath status was grouped into 2 categories (code: 1 = absence of clinical symptoms;
2= presence of clinical symptoms). The most frequently observed clinical abnormality was 8
dermatosis: 30% of the children suffered from pyodermatitis, scabies, impetigo or lice. Common
infections such as conjunctivitis, pharyngitis and rhinitis were also frequent (about 20%). Simple 10
diarrhea was frequently alleged by mothers (20% of responses). Finally more severe conditions
(otitis media, peneumonia) were observed in only a few occasions. 12
An anthropometric examination was next carried out (SL & RL). It consisted of measurements 14
of:
1) Body weight (kg) recorded with an electronic Seca ® scale (accuracy, 100 g); children 16
less than 2-years-old were weighed on an electronic Seca ® scale accurate to 10 g.
Subjects were weighed lightly clothed. 18
2) Standing height (cm) was measured with a Harpenden ® anthropometer (accuracy 1
mm). Children younger than 2 years were measured in a recumbent position with a 20
wooden board.
3) Mid-arm circumference (cm) was measured on the left side with an unstretchable tape. 22
4) 4 subcutaneous skinfolds (mm) were taken at the triceps (Tric), biceps (Bic), subscapular
(Sca) and supra-iliac (Sil) sites using a Holtain ® caliper. Sites were chosen in 24
accordance with the recommended technique and marked on the skin before the
measurement (Lohman and others 1988). 26
All measurements with the exception of body weight were taken on the right side, in duplicate, 28
and the average was used in the analysis.
30
Several anthropometric indices were calculated:
32
1) Indices of malnutrition according to the World Health Organization (WHO 1995): height
ird-0
0192
474,
ver
sion
1 -
4 D
ec 2
007
9
for age (H-age); weight for age (W-age); and height for height (H-W). Anthro software
enabled calculation of z-scores (Centers for Diseases Control: http://www.cdc.gov). 2
2) The arm muscle circumference (AMC, cm), considered as an indicator of muscularity,
was calculated using the formula by Gurney and Jelliffe (Gurney and Jelliffe 1973): 4
AMC = arm circumference – π (triceps skinfold).
3) The sum of 4 skinfolds (Sum 4 skf, mm) was used as an index of total subcutaneous 6
fatness.
4) Finally, regional fat distribution was assessed by the trunk-to-extremities ratio of 8
skinfold thickness: TER= (Sca+Sil)/ (Tric+Bic) (Malina and others 1999).
10
In addition, in mothers, body composition was quantified using bioelectrical impedance analysis
(BIA). BIA measures resistance and impedance properties of the body. It was introduced and 12
validated several years ago (Foster and Lukaski 1996). We used a Maltron analyzer ® (BF 900,
Maltron International Limited, Rayleigh, Essex, UK). BIA was performed on the left side of the 14
body by placing 4 electrodes at the sites indicated by the manufacturer (hand-wrist, foot-ankle)
(SL & RL). Measurements were taken with the subject lying down, barefoot, and corrected for 16
stature. Values were derived from the prediction equation provided by the apparatus
manufacturer for sex, age and geographic origin of the subject. In this report we used percent of 18
fat mass (%FM) as an index of adiposity.
20
Overweight and obesity were estimated in preschool children according to W-H z-scores
(Martorell and others 1998). We used a z-score value >1 to define overweight and >2 to define 22
obesity. The body mass index (BMI, kg/m2) was computed as weight/ (height) 2
, and overweight
and obesity were also assessed on the basis of International Obesity Task Force (IOTF) criteria 24
(Cole and others 2000). Sex and age-specific cut-off points corresponding to a BMI of 25 kg/m2
(overweight) and of 30 kg/m2 (obesity) at 18 years of age were calculated. In mothers, 26
overweight was defined as BMI > 25 kg/m2 and obesity as BMI > 30 kg/m
2
28
Stool parasitism
30
Each child was asked to provide a stool sample in a plastic bag. About 77 % (n=350) of the
children returned the bag. A portion of stool was examined in saline immediately after emission. 32
Then the stool was preserved in a formalin solution and carried in a small plastic container to the
ird-0
0192
474,
ver
sion
1 -
4 D
ec 2
007
10
SELADIS parasitological laboratory in La Paz. An enrichment procedure with formol-ether-
acetate after centrifugation was performed in order to observe the concentration of helminth 2
eggs. Slides were read twice by 2 different observers (SL & SR) and strong agreement was found
(>90%). In the present study, the presence or absence of soil-transmitted nematode eggs after 4
concentration (mainly Ascaris lumbricoides, Trichuris trichura and hookworm) served as an
overall index of parasitism in children. Presence of helminths in children suggested a low level 6
of hygiene in the familial environment (codification: 1= no infestation; 2= presence of
helminths). 8
Economic activity, diet and village accessibility 10
These consisted of information on the main household productive activities (agriculture, fishing, 12
forestry, public office, trade) via questionnaires give to the mothers (n=172). Family economic
activity was encoded into 2 categories. 1: agriculture, fishing and wood cutting; 2: wage earning, 14
storekeeping and handicraft. Mothers were also asked how they self-classified into an ethno-
linguistic group (Takana, Esse-Ejjas, Aymara, Quechua, and Castellan). This variable was used 16
as a proxy for the cultural background of the household. Only 172 mothers (88%) responded
correctly to the questionnaire after careful checking. Twenty-three mothers gave incomplete 18
responses, mainly because they did not have enough time to answer, and their responses were
discarded for analysis. One hundred forty-eight families out of 172 (86%) self-considered as 20
Takanas; 23 (13%) as Esse-Ejjas and 1 as colonist Quechua-Aymara.
22
An investigator trained in nutrition (SL) administered a questionnaire on dietary habits to the
mothers. They first responded to a 24 h food intake recall, recapitulating the main dishes 24
consumed in the household. Next they were asked about frequency of foods consumed on a daily
and weekly basis. Food items were allocated into 7 groups: fish, cereals, tubers, plantain, fruits, 26
meat and milk. Fish and plantain constituted the main caloric source of the diet. A food diversity
index (FDI) was elaborated, recording the presence or absence of consumption of food in each 28
group. This index was derived from a diversity score developed in West Africa and adapted to
the present situation (Savy and others 2005). During our visits, there were no evidence of energy 30
shortages, but the overall nutritional value of diet appeared suboptimal. This is a source of
concern, since nutrients such as the essential amino acids, zinc, iron, calcium and some vitamins 32
are crucial in preventing stunting (Golden 1991). Hence, it was decided to introduce weighting to
ird-0
0192
474,
ver
sion
1 -
4 D
ec 2
007
11
confer more importance to group food with higher nutritional value. This weighting gave a
higher rate to foods of animal origin, then to cereals and fruits, and finally a lower value to 2
starchy foods like tubers or plátano. Four categories were computed:
1) category 1: fish, meat and milk (weight=4) 4
2) category 2: cereals (weight=3)
3) category 3: fruits (weight=2) 6
4) category 4: tubers (mainly yucca or Manihot esculenta) and plátano (Musa paradisiaca)
(weight=1) 8
Interestingly, the FDI had a normal distribution (mean: 10.7 ±3.2; median : 11; min: 4; max: 18).
The median of FDI, equal to 11, was used as a cut-off point for dietary diversity (code= 1: high 10
diversity (FDI>11); code=2: low diversity (FDI<11)).
12
Finally, village accessibility, which conveys the idea of better access to health facilities or 14
market foods for communities living near the district town, was coded into 3 classes:
1) Easy to access all year round by road or canoe in no more than 2 h 16
2) Accessible by canoe only, within 2 to 5 h downstream
3) Accessible by canoe only, within 6 to 12 h downstream 18
Analysis 20
Data adjustments 22
Normality of variables was checked and could be assumed for anthropometric and BIA 24
measurements, but not for subcutaneous thickness. Skinfold distribution was heavily skewed to
the right. A log natural transformation was thus applied to normalize it. In mothers, BMI 26
distribution was slightly asymmetric. It was normalized after a log transformation. Log naturals
of the sum of 4 skinfolds (log sum 4 skf) and of TER (log TER) were used for analysis. During 28
childhood, body composition measurements vary strongly with age. To control this age effect,
stepwise regression between the different indices (BMI, S4skf, TER and AMC) and polynomial 30
expression of age (age, age 2 and age
3) were performed (p to enter <0.05). The residuals from
the regressions were then retained to represent the different body composition indices adjusted 32
for age effects.
ird-0
0192
474,
ver
sion
1 -
4 D
ec 2
007
12
Statistics 2
Continuous variables were expressed as means and standard deviation (SD). The 95% 4
confidence interval was indicated in case of prevalence estimates. Bivariate comparisons were
performed with the Student t test or the χ2 test in case of categorical variables. Multiple 6
associations between the different indices of body composition were studied with multiple
regression procedures. Residuals on age of anthropometric measurements, instead of crude 8
values, were entered into the regressions to control for an age effect. Multicolinearity of
variables was checked. Finally, a logistic regression was run to analyze the influence of 10
categorical variables (familial variables, health status, parasitism or FDI) on the risk of
overweight. Data entry and clearance were performed using Epi Info software (2004). Statistical 12
analysis was done using SPSS 11.01 (http://www.spss.com/) and NCSS software
(http://www.ncss.com/). The level of significance was set at p<0.05. 14
ird-0
0192
474,
ver
sion
1 -
4 D
ec 2
007
13
Results
Chronic malnutrition and overweight were estimated on the basis of anthropometric indices. 2
According to these indices, 39.4% (IC 95%: 34.0~44.0%) of the 0-10 year-old children were
stunted in growth (H-age <-2 z-scores) and 9.2% (IC 95%: 6.3~12.7%) presented a weight deficit 4
(W-age <-2 scores). No children were wasted. Among mothers, only 2 had a BMI between 17.5
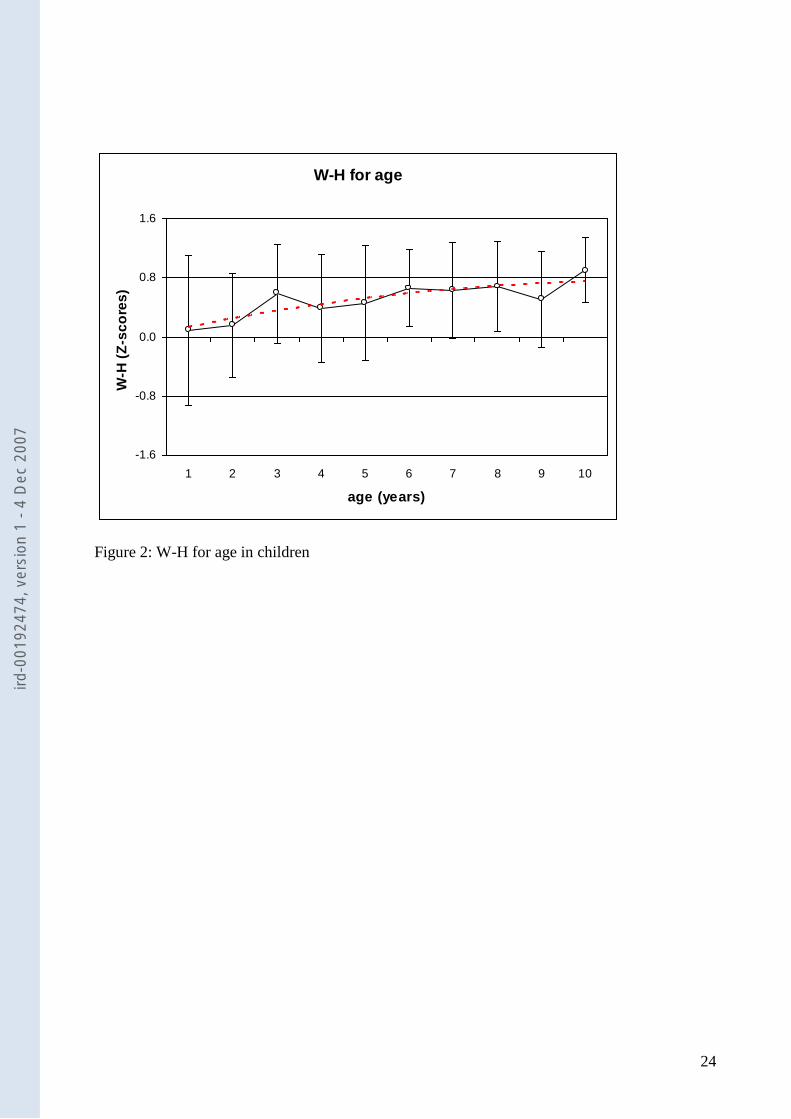
and 18 kg/m2, (entry point to chronic energy deficiency). There was no sex difference in the W-6
H index; hence, values were combined. Figure 2 indicates changes in W-H with age. Values
were above the references at all ages. A trend toward a linear increase with age was observed. 8
The W-H index could not be computed in boys taller than 145 cm or in girls taller than 137 cm;
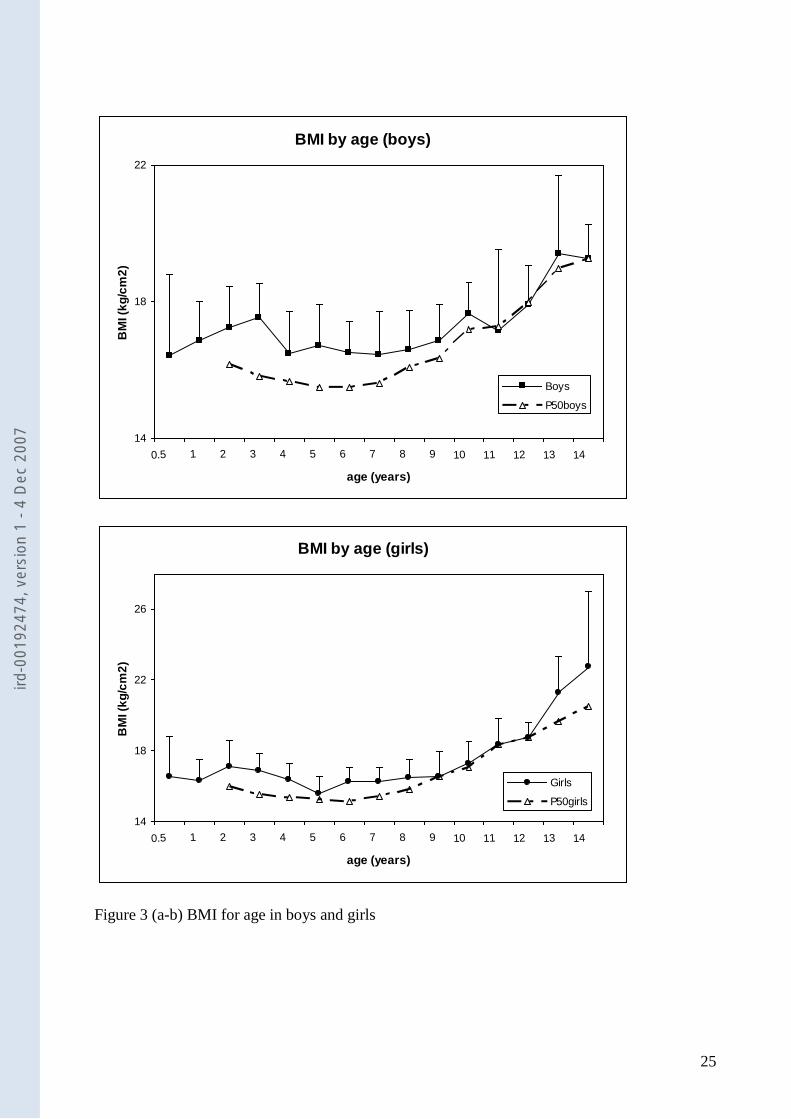
BMI values were used instead. Contrary to W-H, there existed significant sex differences in 10
BMI. Curves were thus drawn separately (Figs. 3 a-b). Curves from both sexes suggested a
curvilinear relationship, with a minimum reached by 7 years of age. Values were higher than the 12
50th
percentile of the reference for age and sex up until 10 years of age. Thereafter, differences
were less noticeable in boys. 14
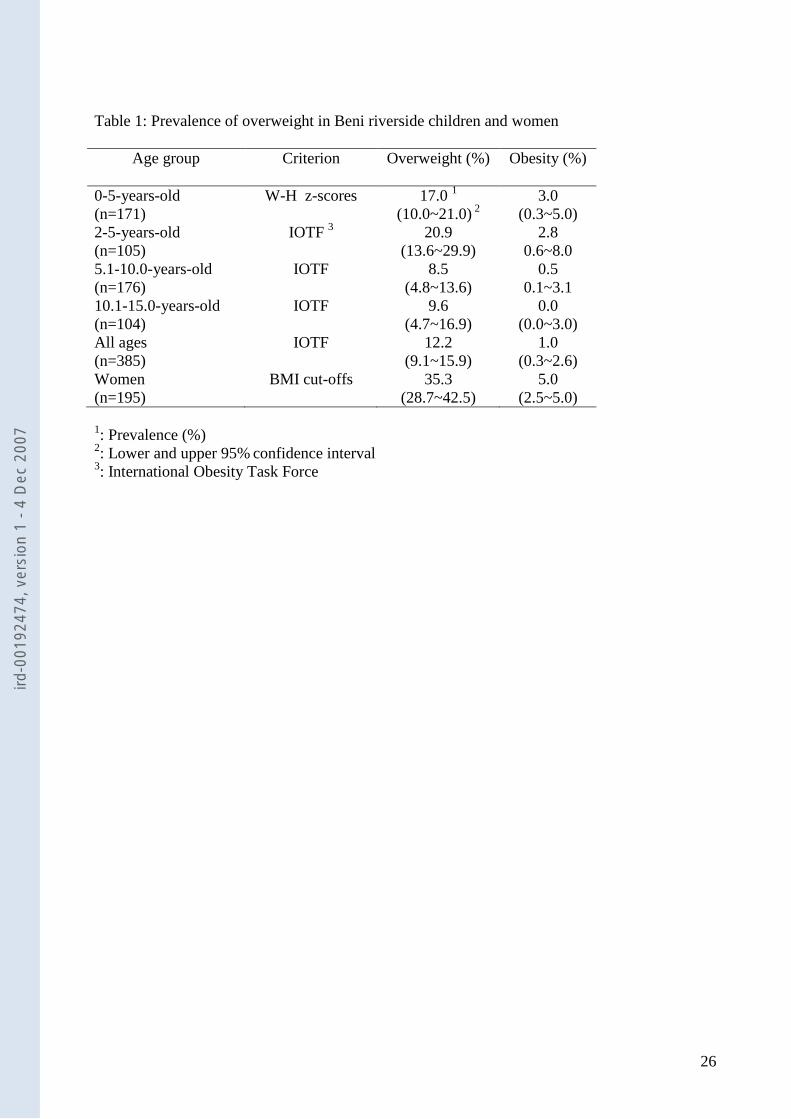
Overweight in preschool children was estimated using z-score cut-off values: about 17 % could 16
be considered as overweight (Table 1). IOTF criteria were used in children older than 2 years.
As a whole, 12.2% of children were overweight and only 1% were classified as obese. 18
Differences existed between age groups: there were significantly more overweight preschool
children (20.9%) than older children: 8.5% in the 5-10-year-old group and 9.6% in the 10-14-20
year-old group (χ2= 7.6, DF=2, p<0.02). In women, BMI cut-offs of 25 and 30 were used as
limits. A total of 35.3% of women were overweight but only 5% were overtly obese. There was a 22
non-significant trend toward an increase with age: 25% in women under 25 years of age
compared to 42% in women older than 35 (p=0.08). 24
Regional fat distribution, judged from the TER, varied with age. There was more fat trunk 26
accumulation in adolescents (TER > 1; TER= 1.30 ± 0.29) than in preschool (TER= 0.96 ± 0.20)
or school-age children (TER= 1.09 ± 0.20) (p<0.001). In women, the ratio was high (1.61 ± 28
0.35). Older women had a higher ratio than younger mothers. Normally nourished children had
significantly greater subcutaneous fat mass than stunted children, but no difference was apparent 30
in TER until 10 years of age, at which time normal adolescent males (not females) had higher
fat trunk deposits than stunted males (p<0.04). 32
ird-0
0192
474,
ver
sion
1 -
4 D
ec 2
007
14
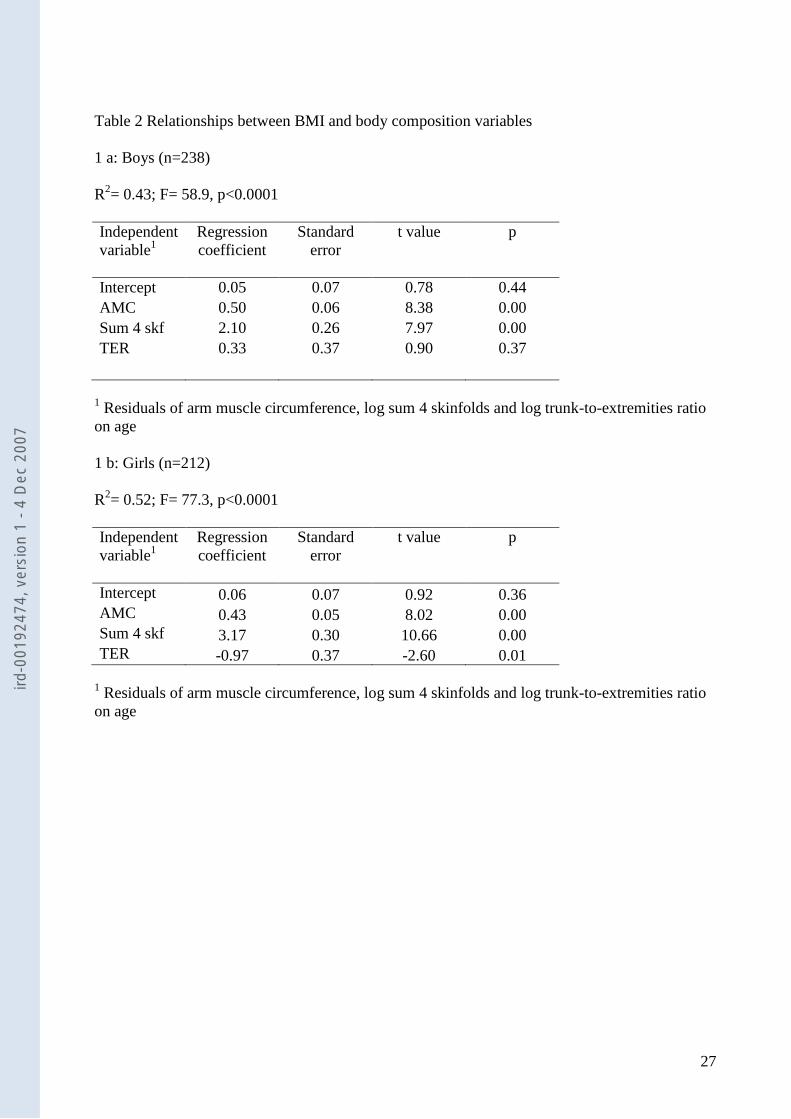
Because of the short stature of this population, it was of importance to examine relationships 2
between BMI and other indices of body composition or regional fat distribution. Hence, multiple
regression analysis was carried out between the BMI (dependent variable), AMC (muscularity 4
indicator), log sum 4 skf (fatness indicator) and log TER (fat distribution indicator) in children
(Table 2). Analyses were run separately in boys and girls to take into account sex differences. As 6
stated above, residuals on age were used to control for an age effect. In boys, body composition
variables explained 43% of the variance in BMI (p<0.001); AMC and the log sum 4 skf had 8
significant and positive effects, but log TER had no influence. In girls, the model explained a
higher percent of BMI variance (52%, p<0.0001). All variables were significant predictors. 10
Interestingly, log TER had a negative effect on BMI: a lower ratio was associated with higher
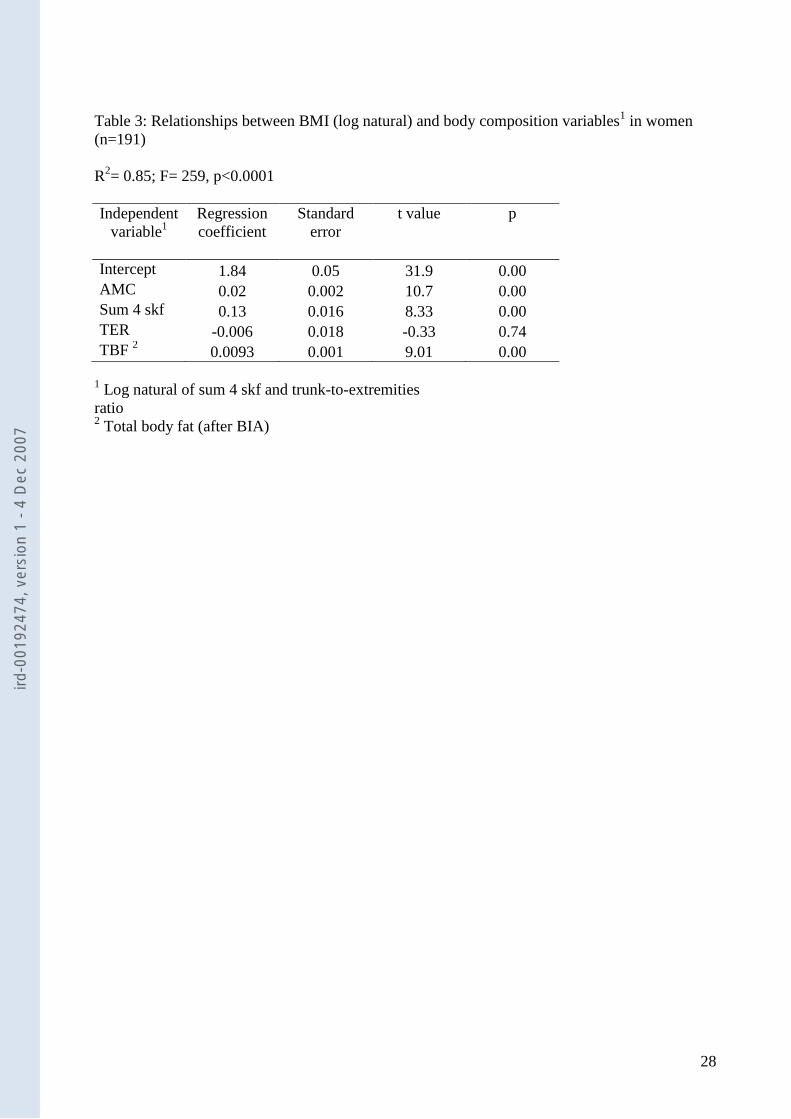
BMI. In women (Table 3), in addition to the previous variables, the total body fat mass 12
calculated after bioelectrical impedance measurements (TBF) was added. The model explained a
higher proportion of BMI variance (86%) than in children. All variables apart from TER had a 14
positive and significant effect on the variance of BMI.
16
In order to analyze cross-relationships between ethnic origins, family activity, heath status,
dietary diversity, parasitic infestation and village accessibility and the risk of overweight, 18
children were separated into 2 groups, normal and overweight, according to IOTF criteria. We
used cut-off points presented in the Methods section. We were unable to find any significant 20
differences between normal and overweight children with respect to these variables. The same
analysis was repeated in women. They were classified as normal (BMI<25 kg/m2) or overweight 22
(BMI ≥ 25 kg/m2). In contrast to children, all cross-relationships between familial and
environmental variables and the risk of overweight were significant. Village accessibility was the 24
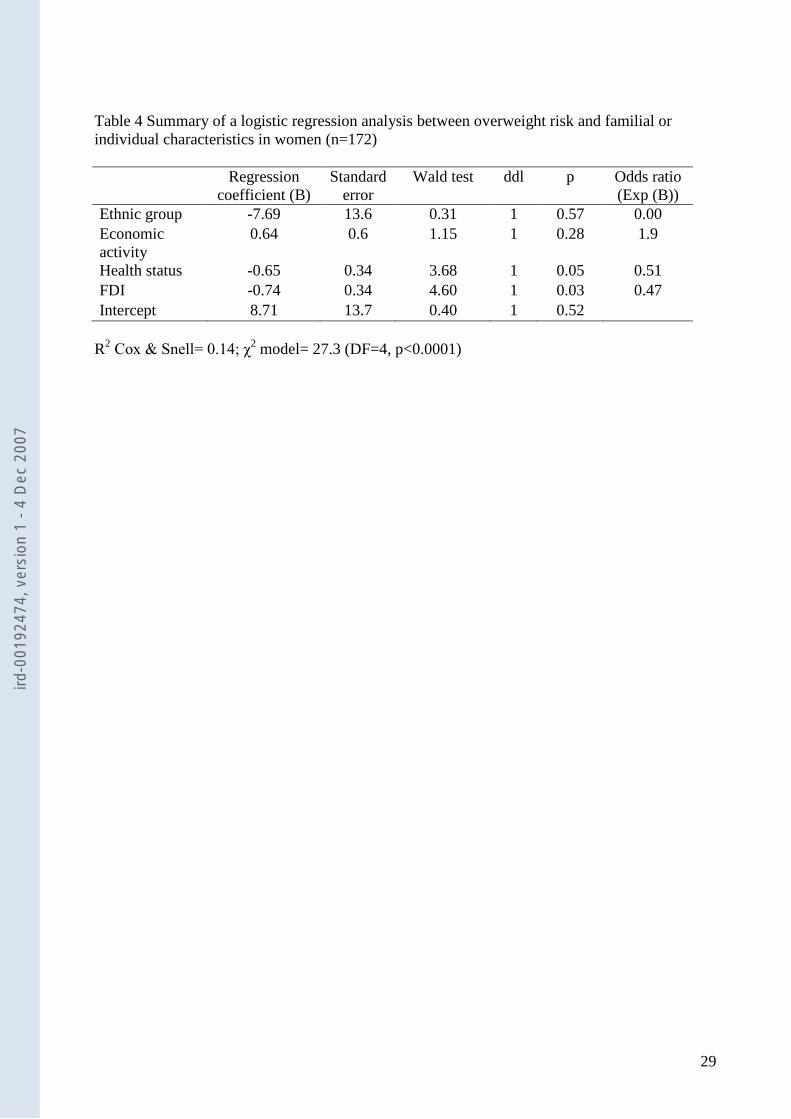
unique exception. To further explore these relationships, logistic regression analysis was run
between categories of BMI and the previous categorical variables (Table 4). The model was 26
pertinent (χ2=27.3, DF=4, p<0.0001) and correctly classified 67% of the subjects. Both FDI and
health status score had a significant effect: a low FDI and/or mediocre health status were 28
associated with lower BMI. However, ethnic group and economic activity variables no longer
had a significant independent effect. 30
Finally, the issue of the relationship between body composition indices of children and BMI of 32
their mothers was examined using multiple regression procedures. The model was adjusted for
ird-0
0192
474,
ver
sion
1 -
4 D
ec 2
007

15
the age effect using residuals on age of the different indices of body composition. Regressions
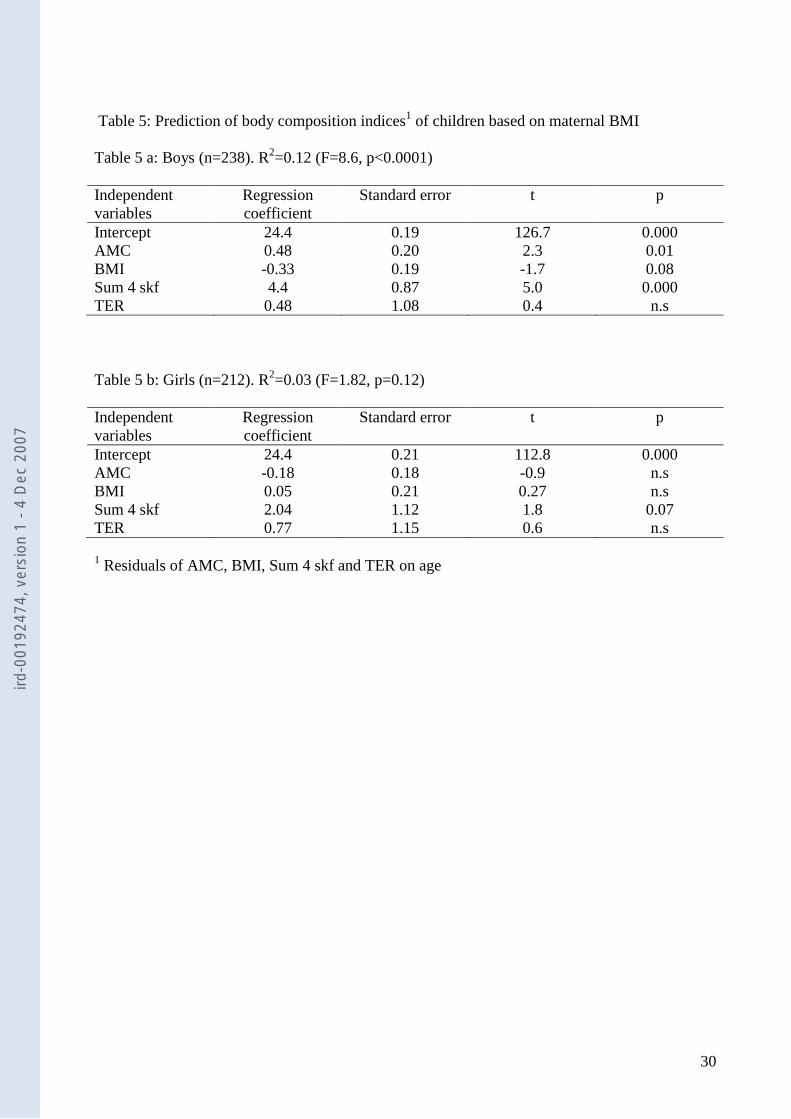
were run separately in girls and boys. Results are shown in table 5. In boys, predictions of total 2
fatness and arm muscle circumference based on maternal BMI were significant. However, in
girls, maternal BMI did not predict any of the body composition indices. 4
6
ird-0
0192
474,
ver
sion
1 -
4 D
ec 2
007
16
Discussion
2
Results of the study on this particular population confirm the existence of an overweight risk in
women and perhaps in children, while a substantial percentage of children (39.4%) still suffer 4
from chronic malnutrition (stunted growth). However, the overt obesity prevalence remains low.
Indeed, compared with the most recent DHS survey, these values are apparently lower. As a 6
whole, 35.3% (IC 95%: 28.7~42.5%) of women were overweight or obese compared to 45.5%
found at the national level and 50.7% in the Amazon departments of Beni and Pando 8
(MEASURE 2004). No recent estimates exist for children, but the average W-H was 0.4 z-score
in 2003 and 0.2 z-score in the present survey. Martorell and co-workers (Martorell and others 10
1998), from DHS 1994, found an overall prevalence of overweight in 15.2% of the 1-3-year-old
children. This figure very closely resembles that of the present study, 17 %. 12
Indicators of overweight or fatness based on weight and height have been consistently criticized 14
because they might be equally influenced by fat mass and fat-free mass. Limitations to the BMI
in children have been stressed (Malina and Katzmarzyk 1999). There exist important differences 16
between sexes, ethnic groups and age groups, resulting in poor BMI sensitivity when classifying
fatness (Baumgartner and others 1995). Despite these limitations, BMI is now considered an 18
international reference for overweight in children (Cole and others 2000; Dietz and Bellizzi
1999). In that study, the BMI was only moderately related to other body composition indices in 20
children. This suggests that the BMI might be better viewed as an index of heaviness (Campbell
and others 2001). BMI was inversely correlated with TER in girls, indicating more fat 22
accumulation in the limbs. This finding points to sexual dimorphism in overweight girls,
suggestive of gynoid deposition (He and others 2004). In contrast, in women, BMI was strongly 24
linked to subcutaneous fatness. In general, there was an increase in BMI and W-H with age.
26
Familial clustering of overweight is an important issue within the framework of the “nutritional
transition process” in which changes in food patterns and lifestyle occur very quickly (Popkin 28
2001). One might then ask whether recently acquired fatness traits and their concomitant
comorbidities will be transmitted to the next generation. Indeed, familial resemblance in total 30
fatness and regional fat distribution have been reported (Li and others 1996). Moderate familial
ird-0
0192
474,
ver
sion
1 -
4 D
ec 2
007
17
similarities between mothers and children were found in the Oaxaca Valley of Mexico (Little
and Malina 2005). In the present study, the prediction of children’s phenotypes from maternal 2
BMI was moderate in boys and practically non-existent in girls. Body composition
characteristics of mothers and children seem disconnected. It is thus tempting to infer that the 4
risk of overweight in mothers and children is of a different nature and originates from different
factors. It is conceivable that the high prevalence of overweight in mothers is the consequence of 6
recent events in terms of changes in food patterns or physical activity. These changes seem to
only slightly affect children, perhaps because of persistence of a heavy and widespread burden of 8
infection and poor hygiene status, evidenced by severe intestinal parasitism. This is in line with
the coexistence of overweight in mothers and stunting in children which was observed in 10
populations in transition (Garrett and others 2005).
12
The existence of a link between stunting and fatness was postulated in previously malnourished
children from Brazil (Sawaya and Roberts 2003). Likewise, several observations from Latin 14
America have confirmed the association between early malnutrition, represented by short stature,
and later adiposity (del Rio-Navarro and others 2004; Doak and others 2002; Garrett and others 16
2005; Schroeder and Martorell 1999; Sichieri and others 2003). In the present study, there was
no association between actual stunting in growth and overweight or regional fat distribution. 18
While the transversal nature of the data collected does not permit such a demonstration, it also
does not negate it. Likewise, a phenotype associating short stature with normal weight or slight 20
overweight in children has already been described in other Amazonian communities (Benefice
and Barral 1991; Capelli and Koifman 2001; Mattos and others 1999; Santos and Coimbra Junior 22
1991), and in the Bolivian Amazon (Foster and others 2005).
24
A tendency to accumulate fat in populations experiencing agricultural or economic development
is likely in the Amazon (Gugelmin and Santos 2001). The present findings shed light on more 26
specific factors. Body composition indices observed in children and adolescents were not
influenced by factors such as health status or parasitism, nor by dietary intake. It is possible that, 28
in the particular context of this survey, the different components of growth (linear growth and
body composition) do not respond in the same way to environmental or familial factors. 30
However, it must be underlined that body composition of children is mainly dependent on
biological and physiological factors like the tempo of growth and maturation before and during 32
puberty (Malina and others 1999). In contrast, in mothers, the risk of overweight was
ird-0
0192
474,
ver
sion
1 -
4 D
ec 2
007
18
significantly related to food diversity and health status. In its elaboration, the FDI assigns a
greater value to food of animal origin. Hence, women who ate more fish, meat, bread and rice 2
had a higher FDI and were more prone to overweight than mothers relying mostly on starchy
foods like cassava roots and plátano, maintaining a normal BMI. Thus, the FDI could reflect two 4
different ways of life in the area: the subsistence level of small communities of farmers and
fishermen dependent on their own production and consuming a monotonous diet, and a 6
population with agricultural and forestry activities integrated into a larger economic market.
8
The challenging aspect of the present survey lies in the fact that it was performed in an isolated
rural area where overweight is likely to be infrequent because of the level of physical activity 10
needed to cope with everyday duties (farming, fishing, carrying water, collecting plants, hunting,
cutting wood, etc.) and the persistence of food instability during drought periods (Dufour 1984). 12
This would signify that the nutritional transition theory designed by Popkin (Popkin 2002) is not
confined to urban or peri-urban areas of developing countries, but is evenly scattered. In many 14
parts of the Amazon, including the Beni, important economic changes are in progress due to the
building of roads and the development of forestry and tourism. Formerly isolated populations are 16
now incorporated into a large market exchange and in the monetization process that may have
both positive and undesirable effects upon health and nutrition (Leatherman and Goodman 2005 18
35). Health implications of this phenomenon are not clearly elucidated in the area studied. Given
its importance in other parts of Bolivia (Barcelo and others 2001; Perez-Cueto and Kolsteren 20
2004), it is likely to be harmful and warrants high priority from health institutions.
Acknowledgements 22 This study was conducted within the framework of an agreement between the San Andrès University of La Paz and 24 the IRD. We are grateful to the population of the communities visited for their kind collaboration. We also wish to
thank the medical authorities of Rurrenabaque. We are indebted to our colleagues from the SELADIS (namely Dr 26 Sara Perez, Susana Revollo and Mariluz Soto) for their kind help and advice and for technical support from their
laboratories. 28
ird-0
0192
474,
ver
sion
1 -
4 D
ec 2
007
19
References 2
Abrantes MM, Lamounier JA, Colosimo EA. 2002. Overweight and obesity prevalence among
children and adolescents from Northeast and Southeast regions of Brazil. J Pediatr (Rio J) 4
78(4):335-40.
Amigo H. 2003. Obesity in Latin American children: situation, diagnostic criteria and 6
challenges. Cad Saude Publica 19:Suppl, 1 S163-70.
Barcelo A, Daroca MC, Ribera R, Duarte E, Zapata A, Vohra M. 2001. Diabetes in Bolivia. Rev 8
Panam Salud Publica 10(5):318-23.
Baumgartner RN, Heymsfield SB, Roche AF. 1995. Human body composition and the 10
epidemiology of chronic disease. Obes Res 3(1):73-95.
Benefice E, Barral H. 1991. Differences in life style and nutritional status between settlers and 12
Siona-Secoya Indians living in the same Amazonian milieu. Ecology of Food and
Nutrition 25:307-322. 14
Benefice E, Monroy SL, Jimenez S, Lopez R. 2006. Nutritional status of Amerindian children
from the Beni River (lowland Bolivia) as related to environmental, maternal and dietary 16
factors. Public Health Nutr 9(3):327-35.
Campbell PT, Katzmarzyk PT, Malina RM, Rao DC, Perusse L, Bouchard C. 2001. Stability of 18
adiposity phenotypes from childhood and adolescence into young adulthood with
contribution of parental measures. Obes Res 9(7):394-400. 20
Capelli J, Koifman S. 2001. [Evaluation of the nutritional status of the Parkateje indigenous
community in Bom Jesus do Tocantins, Para, Brazil]. Cad Saude Publica 17(2):433-7. 22
Cole TJ, Bellizzi MC, Flegal KM, Dietz WH. 2000. Establishing a standard definition for child
overweight and obesity worldwide: international survey. Bmj 320(7244):1240-3. 24
de Onis M, Blossner M. 2000. Prevalence and trends of overweight among preschool children in
developing countries. Am J Clin Nutr 72(4):1032-9. 26
del Rio-Navarro BE, Velazquez-Monroy O, Sanchez-Castillo CP, Lara-Esqueda A, Berber A,
Fanghanel G, Violante R, Tapia-Conyer R, James WP. 2004. The high prevalence of 28
overweight and obesity in Mexican children. Obes Res 12(2):215-23.
Dietz WH, Bellizzi MC. 1999. Introduction: the use of body mass index to assess obesity in 30
children. Am J Clin Nutr 70(1 Part 2):123S-125S.
Doak C, Adair L, Bentley M, Fengying Z, Popkin B, 12027287. 2002. The 32
underweight/overweight household: an exploration of household sociodemographic and
dietary factors in China. Public Health Nutr 5(1A):215-21. 34
Dufour DL. 1984. The time and energy expenditure of indigenous women horticulturalists in the
northwest Amazon. Am J Phys Anthropol 65(1):37-46. 36
Foster KR, Lukaski HC. 1996. Whole-body impedance--what does it measure? Am J Clin Nutr
64(3 Suppl):388S-396S. 38
Foster Z, Byron E, Reyes-Garcia V, Huanca T, Vadez V, Apaza L, Perez E, Tanner S, Gutierrez
Y, Sandstrom B and others. 2005. Physical growth and nutritional status of Tsimane' 40
Amerindian children of lowland Bolivia. Am J Phys Anthropol 126(3):343-51.
Garrett JL, Ruel MT, 16060222. 2005. Stunted child-overweight mother pairs: prevalence and 42
association with economic development and urbanization. Food Nutr Bull 26(2):209-21.
Golden MH. 1991. The nature of nutritional deficiency in relation to growth failure and poverty. 44
Acta Paediatr Scand Suppl 374:95-110.
Gugelmin SA, Santos RV. 2001. [Human ecology and nutritional anthropometry of adult 46
Xavante Indians in Mato Grosso, Brazil]. Cad Saude Publica 17(2):313-22.
Gurney JM, Jelliffe DB. 1973. Arm anthropometry in nutritional assessment: nomogram for 48
ird-0
0192
474,
ver
sion
1 -
4 D
ec 2
007
20
rapid calculation of muscle circumference and cross-sectional muscle and fat areas. Am J
Clin Nutr 26(9):912-5. 2
He Q, Horlick M, Thornton J, Wang J, Pierson RN, Jr., Heshka S, Gallagher D. 2004. Sex-
specific fat distribution is not linear across pubertal groups in a multiethnic study. Obes 4
Res 12(4):725-33.
INE. 2001. Anuario Estadístico 2001. La Paz: Instituto Nacional de Estadística. 6
Larrea C, Freire W. 2002. Social inequality and child malnutrition in four Andean countries. Rev
Panam Salud Publica 11(5-6):356-64. 8
Leatherman TL, Goodman A. 2005. Coca-colonization of diets in the Yucatan. Soc Sci Med
61(4):833-46. 10
Li Z, Rice T, Perusse L, Bouchard C, Roa D. 1996. Familial aggregation of subcutaneous fat
patterning: principal components of skinfolds in the Quebec familiy study. Am J Hum 12
Biol 8:535-542.
Little BB, Malina RM. 2005. Familial similarity in body size in an isolated Zapotec-speaking 14
community in the valley of Oaxaca, southern Mexico: estimated genetic and
environmental effects. Ann Hum Biol 32(4):513-24. 16
Lohman TG, Roche A, Martorell R. 1988. Anthropometric standardization reference manual.
Champaign, Illinois: Human kinetics Books. 177 p. 18
Lopez-Alvarenga JC, Montesinos-Cabrera RA, Velazquez-Alva C, Gonzalez-Barranco J. 2003.
Short stature is related to high body fat composition despite body mass index in a 20
Mexican population. Arch Med Res 34(2):137-40.
Malina RM, Katzmarzyk PT. 1999. Validity of the body mass index as an indicator of the risk 22
and presence of overweight in adolescents. Am J Clin Nutr 70(1 Part 2):131S-136S.
Malina RM, Koziel S, Bielicki T. 1999. Variation in subcutaneous adipose tissue distribution 24
associated with age, sex, and maturation. Am J Human Biol 11(2):189-200.
Martorell R, Khan LK, Hughes ML, Grummer-Strawn LM. 1998. Obesity in Latin American 26
women and children. J Nutr 128(9):1464-73.
Mattos A, Morais MB, Rodrigues DA, Baruzzi RG. 1999. Nutritional status and dietary habits of 28
Indian children from Alto Xingu (Central Brazil) according to age. J Am Coll Nutr
18(1):88-94. 30
MEASURE. 2004. Encuesta nacional de demografia y salud ENDSA 2003. DHS+ OMM, editor:
(Electronic database). Available from http://www.measuredhs.com/. 32
Mendez MA, Monteiro CA, Popkin BM, 15755843. 2005. Overweight exceeds underweight
among women in most developing countries. Am J Clin Nutr 81(3):714-21. 34
Monteiro CA, MH DAB, Conde WL, Popkin BM. 2000. Shifting obesity trends in Brazil. Eur J
Clin Nutr 54(4):342-6. 36
Pena M, Bacallao J. 2002. Malnutrition and poverty. Annu Rev Nutr 22:241-53.
Perez-Cueto A, Almanza M, Kolsteren PW. 2005. Female gender and wealth are associated to 38
overweight among adolescents in La Paz, Bolivia. Eur J Clin Nutr 59(1):82-7.
Perez-Cueto FJ, Kolsteren PW. 2004. Changes in the nutritional status of Bolivian women 1994-40
1998: demographic and social predictors. Eur J Clin Nutr 58(4):660-6.
Popkin BM. 2001. The nutrition transition and obesity in the developing world. J Nutr 42
131(3):871S-873S.
Popkin BM. 2002. An overview on the nutrition transition and its health implications: the 44
Bellagio meeting. Public Health Nutr 5:93-103.
Rolland-Cachera MF, Bellisle F, Deheeger M, Pequignot F, Sempe M. 1990. Influence of body 46
fat distribution during childhood on body fat distribution in adulthood: a two-decade
follow-up study. Int J Obes 14(6):473-81. 48
Santos RV, Coimbra Junior CE. 1991. Socioeconomic transition and physical growth of Tupi-
Monde Amerindian children of the Aripuana Park, Brazilian Amazon. Hum Biol 50
ird-0
0192
474,
ver
sion
1 -
4 D
ec 2
007
21
63(6):795-819.
Savy M, Martin-Prevel Y, Sawadogo P, Kameli Y, Delpeuch F. 2005. Use of variety/diversity 2
scores for diet quality measurement: relation with nutritional status of women in a rural
area in Burkina Faso. Eur J Clin Nutr 59(5):703-16. 4
Sawaya AL, Roberts S. 2003. Stunting and future risk of obesity: principal physiological
mechanisms. Cad Saude Publica 19:Suppl, 1 S21-S28. 6
Schroeder DG, Martorell R. 1999. Fatness and body mass index from birth to young adulthood
in a rural Guatemalan population. Am J Clin Nutr 70(1 Part 2):137S-144S. 8
Seidell JC. 1999. Obesity: a growing problem. Acta Paediatr Suppl 88:46-50.
Sichieri R, Silva CV, Moura AS. 2003. Combined effect of short stature and socioeconomic 10
status on body mass index and weight gain during reproductive age in Brazilian women.
Braz J Med Biol Res 36(10):1319-25. 12
Uauy R, Albala C, Kain J, 3. 2001. Obesity trends in Latin America: transiting from under- to
overweight. Journal of Nutrition 131:893S-899S. 14
WHO. 1995. Physical status: The use and interpretation of anthropometry. Report of a WHO
expert committee. Geneva: World Health Organization. 452 p. 16
ird-0
0192
474,
ver
sion
1 -
4 D
ec 2
007

22
List of figures
Figure 1: Map showing the location of the different communities (after GPS reading)
Figure 2: W-H for age of children
Figure 3 a: BMI for age of boys
Figure 3 b: BMI for age of girls
ird-0
0192
474,
ver
sion
1 -
4 D
ec 2
007
23
Figure 1: Map showing the location of the different communities (after GPS reading)
ird-0
0192
474,
ver
sion
1 -
4 D
ec 2
007
24
W-H for age
-1.6
-0.8
0.0
0.8
1.6
1 2 3 4 5 6 7 8 9 10
age (years)
W-H
(Z
-sc
ore
s)
Figure 2: W-H for age in children
ird-0
0192
474,
ver
sion
1 -
4 D
ec 2
007
25
BMI by age (boys)
14
18
22
0.5 1 2 3 4 5 6 7 8 9 10 11 12 13 14
age (years)
BM
I (k
g/c
m2
)
Boys
P50boys
BMI by age (girls)
14
18
22
26
0.5 1 2 3 4 5 6 7 8 9 10 11 12 13 14
age (years)
BM
I (k
g/c
m2
)
Girls
P50girls
Figure 3 (a-b) BMI for age in boys and girls
ird-0
0192
474,
ver
sion
1 -
4 D
ec 2
007
26
Table 1: Prevalence of overweight in Beni riverside children and women
Age group Criterion Overweight (%)
Obesity (%)
0-5-years-old
(n=171)
W-H z-scores 17.0 1
(10.0~21.0) 2
3.0
(0.3~5.0)
2-5-years-old
(n=105)
IOTF 3 20.9
(13.6~29.9)
2.8
0.6~8.0
5.1-10.0-years-old
(n=176)
IOTF 8.5
(4.8~13.6)
0.5
0.1~3.1
10.1-15.0-years-old
(n=104)
IOTF 9.6
(4.7~16.9)
0.0
(0.0~3.0)
All ages
(n=385)
IOTF 12.2
(9.1~15.9)
1.0
(0.3~2.6)
Women
(n=195)
BMI cut-offs 35.3
(28.7~42.5)
5.0
(2.5~5.0)
1: Prevalence (%)
2: Lower and upper 95% confidence interval
3: International Obesity Task Force
ird-0
0192
474,
ver
sion
1 -
4 D
ec 2
007
27
Table 2 Relationships between BMI and body composition variables
1 a: Boys (n=238)
R2= 0.43; F= 58.9, p<0.0001
Independent
variable1
Regression
coefficient
Standard
error
t value p
Intercept 0.05 0.07 0.78 0.44
AMC 0.50 0.06 8.38 0.00
Sum 4 skf 2.10 0.26 7.97 0.00
TER 0.33 0.37 0.90 0.37
1 Residuals of arm muscle circumference, log sum 4 skinfolds and log trunk-to-extremities ratio
on age
1 b: Girls (n=212)
R2= 0.52; F= 77.3, p<0.0001
Independent
variable1
Regression
coefficient
Standard
error
t value p
Intercept 0.06 0.07 0.92 0.36
AMC 0.43 0.05 8.02 0.00
Sum 4 skf 3.17 0.30 10.66 0.00
TER -0.97 0.37 -2.60 0.01
1 Residuals of arm muscle circumference, log sum 4 skinfolds and log trunk-to-extremities ratio
on age
ird-0
0192
474,
ver
sion
1 -
4 D
ec 2
007
28
Table 3: Relationships between BMI (log natural) and body composition variables1 in women
(n=191)
R2= 0.85; F= 259, p<0.0001
Independent
variable1
Regression
coefficient
Standard
error
t value p
Intercept 1.84 0.05 31.9 0.00
AMC 0.02 0.002 10.7 0.00
Sum 4 skf 0.13 0.016 8.33 0.00
TER -0.006 0.018 -0.33 0.74
TBF 2 0.0093 0.001 9.01 0.00
1 Log natural of sum 4 skf and trunk-to-extremities
ratio 2 Total body fat (after BIA)
ird-0
0192
474,
ver
sion
1 -
4 D
ec 2
007
29
Table 4 Summary of a logistic regression analysis between overweight risk and familial or
individual characteristics in women (n=172)
Regression
coefficient (B)
Standard
error
Wald test ddl p Odds ratio
(Exp (B))
Ethnic group -7.69 13.6 0.31 1 0.57 0.00
Economic
activity
0.64 0.6 1.15 1 0.28 1.9
Health status -0.65 0.34 3.68 1 0.05 0.51
FDI -0.74 0.34 4.60 1 0.03 0.47
Intercept 8.71 13.7 0.40 1 0.52
R2 Cox & Snell= 0.14; χ
2 model= 27.3 (DF=4, p<0.0001)
ird-0
0192
474,
ver
sion
1 -
4 D
ec 2
007
30
Table 5: Prediction of body composition indices1 of children based on maternal BMI
Table 5 a: Boys (n=238). R2=0.12 (F=8.6, p<0.0001)
Independent
variables
Regression
coefficient
Standard error t p
Intercept 24.4 0.19 126.7 0.000
AMC 0.48 0.20 2.3 0.01
BMI -0.33 0.19 -1.7 0.08
Sum 4 skf 4.4 0.87 5.0 0.000
TER 0.48 1.08 0.4 n.s
Table 5 b: Girls (n=212). R2=0.03 (F=1.82, p=0.12)
Independent
variables
Regression
coefficient
Standard error t p
Intercept 24.4 0.21 112.8 0.000
AMC -0.18 0.18 -0.9 n.s
BMI 0.05 0.21 0.27 n.s
Sum 4 skf 2.04 1.12 1.8 0.07
TER 0.77 1.15 0.6 n.s
1 Residuals of AMC, BMI, Sum 4 skf and TER on age
ird-0
0192
474,
ver
sion
1 -
4 D
ec 2
007