a great diversity of amerindian mitochondrial dna ancestry is present in the mexican mestizo...
TRANSCRIPT

ORIGINAL ARTICLE
A great diversity of Amerindian mitochondrial DNAancestry is present in the Mexican mestizo population
Mariano Guardado-Estrada1, Eligia Juarez-Torres2, Ingrid Medina-Martinez1, Ana Wegier3, Antonio Macıas2,Guillermo Gomez4, Fernando Cruz-Talonia4, Edgar Roman-Bassaure4, Daniel Pinero3, Susana Kofman-Alfaro1
and Jaime Berumen1,2
There are limited data on mitochondrial DNA (mtDNA) variation in the Mexican mestizo population. To examine the genetic
diversity and matrilineal ancestry, the full mtDNA hypervariable regions I and II were sequenced in 270 unrelated mestizos
from different regions of Mexico. A total of 202 different haplotypes were identified and the haplotype diversity was 0.9945.
Amerindian haplotypes predominated in the sample with a proportion of 93.3%, followed by European (6.0%) and African
haplotypes (0.7%). The frequency of the Amerindian haplogroups A2, B2, C1 and D1 was 51.1, 17.8, 18.5 and 5.9%,
respectively. The frequency of Amerindian haplogroups was higher in the central region than in Mexico City, whereas it was the
contrary for European haplogroups. This difference was accounted principally by the high frequency of B2 haplotypes in the
central region. The minimum spanning network, the mismatch distribution and Tajima’s D neutrality test suggest a population
expansion for each Amerindian haplogroup, which could be initiated more recently for haplogroups A2 and D1. The present
knowledge combined with other nuclear genetic markers will be essential in future association studies to correct for genetic
substructure in mestizo populations.
Journal of Human Genetics (2009) 54, 695–705; doi:10.1038/jhg.2009.98; published online 16 October 2009
Keywords: Amerindian; control region; haplogroup; haplotype; mestizo; mtDNA; network
INTRODUCTION
A majority of the Mexican population is considered to be mestizo,which could be defined as a person who was born in Mexico, has aSpanish-derived last name and has a family of Mexican ancestorsbelonging to the third generation.1 Mestizos originated from theadmixture among the Spaniards, native Amerindians and Africansabout 500 years ago.2,3 Mexico City and its metropolitan regions arelocated in the valley of Mexico, which is situated in central Mexico.This geographical area was the heart of the Aztec empire and the mostpopulated region of Mesoamerica before the arrival of the Spaniards.4
In addition, a large amount of indigenous populations lived in thesouthern region of Mexico in well-established and populated Mesoa-merican cities.5–7 In contrast, indigenous populations settled in thenorthern region of Mexico comprised few individuals who resided insmall communities close to the rivers, and most of them were nomadsand hunters.4,8 After the conquest was concluded, most Spaniardsestablished in Mexico City and a large amount of the indigenouspopulations was displaced to small villages around the city in thevalley of Mexico.5 During the following 300 years, colonial Mexicoreceived a continuous flow of immigrants coming from Europe, inparticular Spain, and to a lesser extent black slaves from Africa in the
sixteenth century, who were established essentially in the coastalregion.9 In this period, the Spaniards expanded to the northern andsouthern regions of New Spain and founded the colonial cities, whichwere particularly located in areas that were rich in mineral reserves.10
According to historical data, estimation of admixture using classicalnuclear genetic markers has shown that European, Amerindian andAfrican ancestries vary across the geographical regions of the coun-try.11 Amerindian ancestry predominates in all regions, whereas theproportion of European and African ancestry is variable. There is ahigher proportion of individuals with Caucasoid ancestry in MexicoCity (35–71%) and the northern regions (35–55%) than in the centralregions (21%) around Mexico City and the southern regions (4.2–43%)of Mexico, whereas the African ancestry predominates in the coastalregions (22–41%).12 On the other hand, European ancestry, exploredusing mitochondrial DNA (mtDNA), was absent in the indigenouspopulation13–16 and was very low in the mestizos either from thenorth (5.3%)17 or from Mexico City (3.2%).12,18 Although thoseMexican mestizos come from modern populations, the fact thatmtDNA is maternally inherited19 without recombination indicatesthat the mestizo mitochondrial genome has initially been inheritedfrom indigenous women. This agrees with historical data because
Received 8 July 2009; accepted 15 September 2009; published online 16 October 2009
1Facultad de Medicina, UNAM, Mexico City, Mexico; 2Unidad de Medicina Genomica, Hospital General de Mexico, Mexico City, Mexico; 3Departamento de Ecologıa Evolutiva,Instituto de Ecologıa, UNAM, Mexico City, Mexico and 4Oncologıa, Servicio de Colposcopia, Hospital General de Mexico, Mexico City, MexicoCorrespondence: Dr J Berumen, Facultad de Medicina, Universidad Nacional Autonoma de Mexico, Dr Balmis 148, Colonia Doctores, Delegacion Cuauhtemoc, Mexico City,D.F. 06726, Mexico.E-mail: [email protected]
Journal of Human Genetics (2009) 54, 695–705& 2009 The Japan Society of Human Genetics All rights reserved 1434-5161/09 $32.00
www.nature.com/jhg
mating has been described essentially between Spaniard men andindigenous women.20,21 As mtDNA has a higher mutational rate thanthe nuclear genome,22 the former has been used as a tool in popula-tion genetics for making inferences and assumptions in ancestry andthe migration patterns of human populations.23 Furthermore, theAmerindian mtDNA has been well characterized and the haplogroupsfound in indigenous populations in the Americas were the firstidentified and named A, B, C, D and X.15,24,25 Those Amerindianhaplogroups were recently termed A2, C1, B2 and D1, once there weremore available data of the complete mtDNA genome sequence.26–28 Asmost studies that analyzed mtDNA polymorphism in the Mexicanpopulation used mainly restriction fragment length polymorphisms(RFLPs),13,17,18,29 and there are no available data from full controlregion sequences, the knowledge of mtDNA diversity is limited and ithas not been extensively analyzed.
To describe the genetic variability in the mtDNA control regionpresent in the Mestizo population, the hypervariable region I (HVR1)and hypervariable region II (HVR2) were analyzed in 270 unrelatedMexican mestizos. In addition, the mestizo population from MexicoCity was compared with Mestizo populations from the central andcoastal regions of Mexico. Besides the utility of the present knowledgefor forensic purposes and population genetics, mtDNA in conjunctionwith other genetic markers could be helpful to estimate the individualancestry proportion in admixed populations. These ancestry estimateswill be useful to match adequately the cases and controls in geneticassociation studies and to avoid the bias caused by populationstratification.30
MATERIALS AND METHODS
SamplesBlood samples were collected from 270 unrelated healthy women attending the
colposcopy screening program at the General Hospital of Mexico. All women
were born in Mexico and had a Mexican ancestry for two generations. From the
270 individuals, 100 were born in Mexico City, 115 in the central, 47 in the
coastal (8 from the Golf coastal and 39 from the Pacific coastal) and 8 in the
northern regions of the country (Figure 1). All the women accepted to
participate in the study and signed a written informative consent. The protocol
and procedures in this study were reviewed and approved by the local ethics
and scientific committee of the General Hospital of Mexico.
DNA extraction and sequencingWhole genomic DNA was extracted using a commercial DNA extraction
purification kit (Qiagen, Valencia, CA, USA) according to the manufacturer’s
protocol. The full control region (1261 bp) was amplified by PCR from 500 ng
of whole genomic DNA in a 25ml reaction containing 2 mM MgCl2, 1� PCR
buffer (50 mM KCl, 10 mM Tris-HCl and pH 8.3), 200mM of each of dATP,
dCTP, dGTP and dTTP, 1mM of each primer and 1 U of Taq Platinum DNA
polymerase (Invitrogen, Carlsbad, CA, USA). Reactions were carried out in a
GeneAmp PCR System 2720 (Applied Biosystems, Carlsbad, CA, USA). After
denaturing for 2 min at 94 1C, 32 cycles were performed by setting station 1 at
94 1C for 45 s, station 2 at 60 1C for 1 min and station 3 at 72 1C for 2 min.
Finally, the PCR reaction was kept at 72 1C for another 7 min. DNA strands of
both HVR1 (position 16024–16365) and HVR2 (position 73–340) were
sequenced using the fluorescent cycle-sequencing method (BigDye Terminator
Ready Reaction Kit, Applied Biosystems). Sequence analysis was performed
using an ABI PRISM 3130 genetic analyzer system (Applied Biosystems). The
sequence and position of the forward (F) and reverse (R) primers for PCR and
sequencing are as follows:
L-15926 (5¢-ATACACCAGTCTTGTAAACC-3¢, position 15 907–15 926),
H-00580 (5¢-TTGAGGAGGTAAGCTACATA-3¢, position 599–580),
H-16410 (5¢-CACGGAGGATGGTGGTCAAG-3¢, position 16 414–16 395),
L-00015 (5¢-CACCCTATTAACCACTCACG-3¢, position 15–34) and
H-00383 (5¢-AGGCTGGTGTTAGGGTTCTT-3¢, position 383–364).
Data analysisThe mtDNA HVR1 and HVR2 sequences of each individual were compared
with the revisited Cambridge Reference Sequence (rCSR)31 using the Applied
Biosystems Seq Scape ver. 2.5 Software. The polymorphisms identified in each
sample were stored in a Microsoft Office 2007 Access database to construct and
identify the haplotypes, and calculate the allelic and haplotype frequencies.
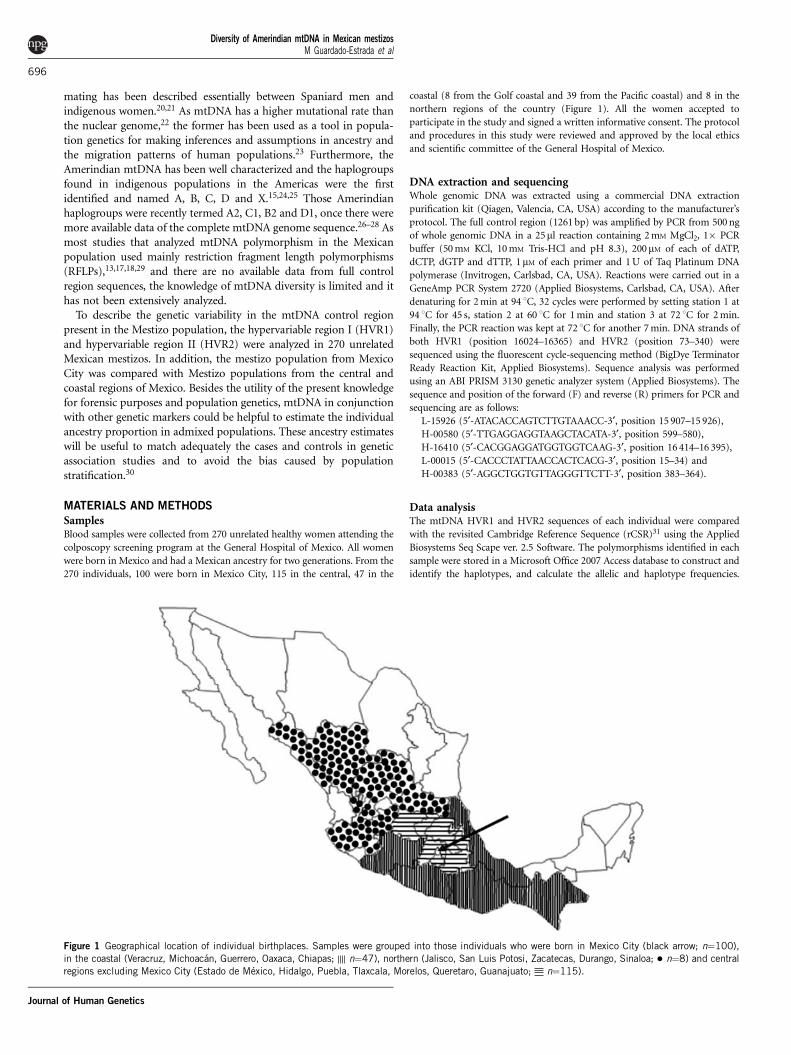
Figure 1 Geographical location of individual birthplaces. Samples were grouped into those individuals who were born in Mexico City (black arrow; n¼100),
in the coastal (Veracruz, Michoacan, Guerrero, Oaxaca, Chiapas; n¼47), northern (Jalisco, San Luis Potosi, Zacatecas, Durango, Sinaloa; � n¼8) and central
regions excluding Mexico City (Estado de Mexico, Hidalgo, Puebla, Tlaxcala, Morelos, Queretaro, Guanajuato; n¼115).
Diversity of Amerindian mtDNA in Mexican mestizosM Guardado-Estrada et al
696
Journal of Human Genetics
Calculations of the mean number of pairwise differences, nucleotide diversity,
haplotype diversity indexes, mismatch distribution, Thau (t) and Tajima’s D
neutrality test were performed using the population genetics software package
arlequin ver. 3.11.32 The motifs present in both regions that characterize the
Amerindian,27,28,33 European34,35 and African36 mitochondrial haplogroups
were used to classify each sample by their haplogroup. The statistical parsimony
algorithm was applied to construct a minimum spanning network with control
region sequences using the TCS ver. 1.21 software.37,38 Positions not adjusting
to an infinite sites model because of the presence of mutation heterogeneity in
both regions (16 051, 16 093, 16 126, 16 129, 16 172, 16 187, 16 189, 16 223, 146,
150, 152, 182, 189, 195) were removed from the analysis to reduce the degree of
homoplasy.39 Although those sites were removed, not all the reticulations were
eliminated in the network, and the remaining loops were solved using the
algorithms based on the coalescent theory.40 To evaluate the significance of
differences in the proportion of mitochondrial haplogroups ancestry among
the groups, a w2 test was performed. The significance of comparison of
the mean pairwise differences and the nucleotide diversity was evaluated using
the Student’s t-test. All statistical tests were carried out using the Minitab
statistical software.
RESULTS AND DISCUSSION
From 610 nucleotides analyzed, a total of 162 substitutions were foundin 154 polymorphic positions (102 in HVR1 and 52 in HVR2). A totalof 202 different haplotypes were identified in the whole sample(n¼270). The number of polymorphic positions present in thehaplotypes ranged from 1 to 16, with a mean of 8.9. In all, 168haplotypes (83.1%) were identified only once and the most frequenthaplotype (haplotype Mx7) was present in 15 (5.6%) individuals (seeTable 1). It is noteworthy that most haplotypes (192; 95%) have notbeen reported earlier (Table 1).27,39,40–42 The haplotype diversity of thewhole control region was 0.9945, with a mean number of pairwisedifferences of 11.14 and a nucleotide diversity of 0.0655 (see Table 2).Unlike HVR1, HVR2 had 15 sites that showed indels either as a single-point insertion (insertion at 180G) or as a part of polymorphicmicrosatellite (p248–249, p286–291, p303–309 and p311–315) andnon-microsatellite (p106–111) tracts. In the poly-cytosine tract p303–309, only 26% of individuals showed seven cytosines like the rCSR,whereas most individuals (54.8%) had eight cytosines and 18.8% hadnine cytosines (see Table 3). Interestingly, in the other microsatellite in311–315, all but one individual had six cytosines, one more cytosinethan in the rCSR. Both homopolymeric cytosine stretches are knownto be highly variable;43 however, in our sample only the microsatellitep303–309 was polymorphic. The frequency of alleles in the trackp303–309 in our sample was similar to the frequencies reported inother populations.39,44–48 The deletion of two adenines in the poly-Atrack at positions p286–291 was always linked with the deletion of oneadenine at position p248–249 and this combination was found in17.1% of the individuals examined, whereas the remaining individuals(82.9%) had six adenines in the first and two adenines in the lastpositions similar to the rCSR. A deletion of six nucleotides fromposition 106 to 111, which has been described earlier in the ChibchanAmerindian population,49 was found in four individuals. The inser-tion of guanine nucleotide in position 180 was found only in oneindividual.
Mitochondrial haplogroupsIn the whole sample, 252 individuals (93.3%) were classified to one ofthe Amerindian haplogroups. The Amerindian haplogroups foundwere A2, B2, C1 and D1, with a frequency of 51.1, 17.8, 18.5 and 5.9%,respectively (Figure 2b). The frequency of the non-Amerindianhaplogroups found in the sample was 6.7%, of which Europeanhaplogroups represented 5.9% (16 individuals) and the African
haplogroups 0.7% (2 individuals). The Amerindian ancestry propor-tion found in this sample is slightly higher but not significantlydifferent from that earlier reported in a study carried out in themestizo population from Mexico City (90.5%), where haplogroupswere identified by RFLPs.18 In comparison with that study, whichincluded persons with social security, individuals enrolled in this studyincluded women who attended the Pap screening program at theGeneral Hospital of Mexico, which regularly attends people with lowerincome lacking social security,50 and it has been suggested earlierthat the proportion of Amerindian ancestry could be higher inpeople coming from low socioeconomic strata than in those with ahigher-level income in the Mexican mestizo population.11,51
Amerindian mitochondrial haplogroupsHaplogroup A2. The polymorphisms that characterize this haplo-group are the transitions at positions C16111T, T16223C, C16290T,G16319A, T16362C, T146C, A153G and A235G.27,28 In addition tothese characteristic polymorphisms, 50 haplotypes, including thehaplotype Mx7, showed the transitions A73G and A263G (Table 1).As most reported studies analyzed only the HVR1, the positions ofthis region were compared with reported sequences. HVR1 poly-morphisms found in haplotype Mx7 (11.1% of all haplotypes whenonly HVR1 were considered) have been reported earlier in otherstudies but in lower proportions (5–8%).39–42 From 93 haplotypesthat composed the haplogroup A2, 77 had a thymine at position16111 and only 16 had the cytosine similar to the rCSR. Before theclassification suggested by Bandelt,26 haplogroup A was split into A1and A2 by the transition at this position.33 However, further studiesreported that the C allele at position 16111 in the A2 haplotypes wasinstead a back mutation to the rCSR from T back to the C allele,because of the high mutation rate present in the mtDNA controlregion.28 Transition at position C16111T is characteristic of theAmerindian A2 haplogroup because it is rarely found in Asianhaplogroup A sequences.52,53 Furthermore, this C16111T polymorph-ism has rarely been seen in other haplogroups.54,55 SubstitutionsA153G and A235G were highly frequent in the haplogroup A2, witha frequency of 88.4 and 94.2%, respectively. Although these positionscharacterize the A2 haplogroup, they were rarely found in otherAmerindian (C and B) and non-Amerindian haplogroups (H) inthis sample. Interestingly, the transition T152C was found only in17.8% of the A2 haplogroup sequences, whereas in Asian haplogroupA sequences it was found in 16 out of 18 sequences.56
Haplogroup B2. This haplogroup was present in 48 of the 270individuals analyzed and it was the third most common of theAmerindian haplogroups found in this sample. The HVR1 motifsthat are characteristic of haplogroup B2 are the transitions T16189Cand T16217C.27,52 However, other positions associated with B2haplotypes are the transversions A16182C and A16183C.28,39 Thehaplotype Mx101 was the most frequent from haplogroup B2 (fourindividuals) and included also the polymorphisms A16182C,A16183C, T16189C, T16217C, A73G and A263G (Table 1). Consider-ing only the positions at HVR1, this haplotype has been reportedearlier once in Latin America.40–42 Interestingly, the polymorphismA16183C was identified in all haplogroup B2 sequences. The haplo-group B2 in this study was further divided in two subgroups, basedon transversion A16182C, which was found in 54.1% of the B2haplotypes. These data highly contrast with an earlier study in theMexican mestizo population,17 in which transversions A16182C andA16183C were not found in 33 individuals that had the HVR1 regionanalyzed. On the other hand, transversion 16183 has already been
Diversity of Amerindian mtDNA in Mexican mestizosM Guardado-Estrada et al
697
Journal of Human Genetics
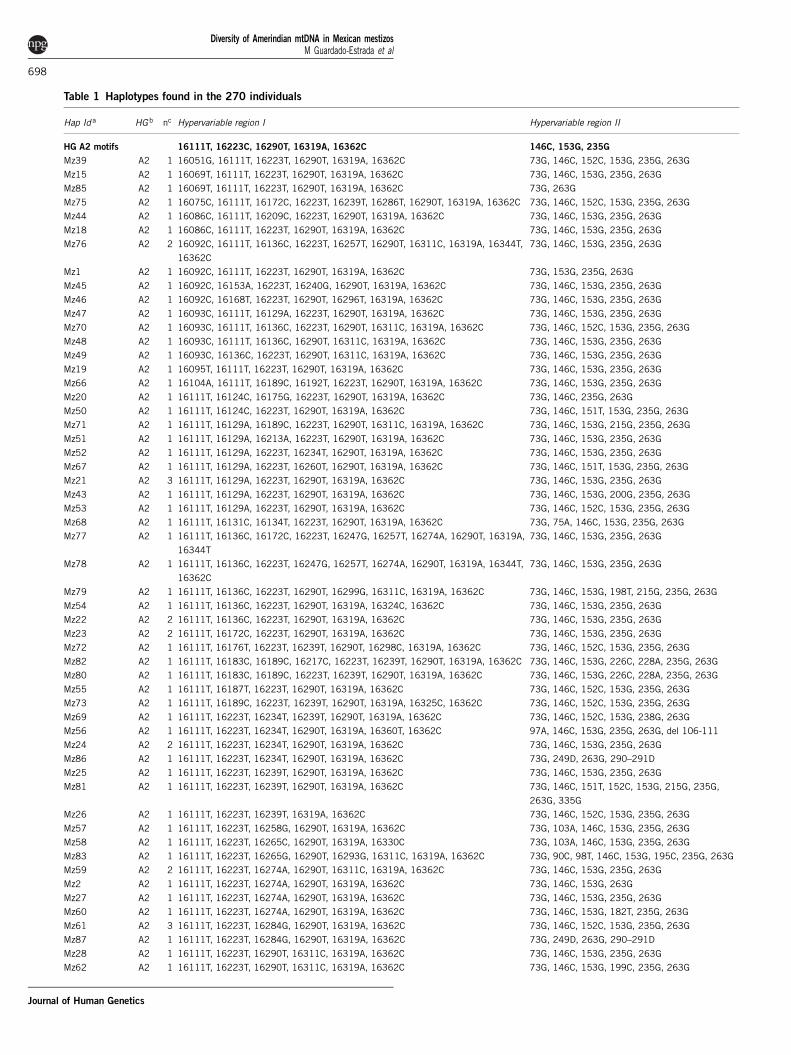
Table 1 Haplotypes found in the 270 individuals
Hap Id a HG b nc Hypervariable region I Hypervariable region II
HG A2 motifs 16111T, 16223C, 16290T, 16319A, 16362C 146C, 153G, 235G
Mz39 A2 1 16051G, 16111T, 16223T, 16290T, 16319A, 16362C 73G, 146C, 152C, 153G, 235G, 263G
Mz15 A2 1 16069T, 16111T, 16223T, 16290T, 16319A, 16362C 73G, 146C, 153G, 235G, 263G
Mz85 A2 1 16069T, 16111T, 16223T, 16290T, 16319A, 16362C 73G, 263G
Mz75 A2 1 16075C, 16111T, 16172C, 16223T, 16239T, 16286T, 16290T, 16319A, 16362C 73G, 146C, 152C, 153G, 235G, 263G
Mz44 A2 1 16086C, 16111T, 16209C, 16223T, 16290T, 16319A, 16362C 73G, 146C, 153G, 235G, 263G
Mz18 A2 1 16086C, 16111T, 16223T, 16290T, 16319A, 16362C 73G, 146C, 153G, 235G, 263G
Mz76 A2 2 16092C, 16111T, 16136C, 16223T, 16257T, 16290T, 16311C, 16319A, 16344T,
16362C
73G, 146C, 153G, 235G, 263G
Mz1 A2 1 16092C, 16111T, 16223T, 16290T, 16319A, 16362C 73G, 153G, 235G, 263G
Mz45 A2 1 16092C, 16153A, 16223T, 16240G, 16290T, 16319A, 16362C 73G, 146C, 153G, 235G, 263G
Mz46 A2 1 16092C, 16168T, 16223T, 16290T, 16296T, 16319A, 16362C 73G, 146C, 153G, 235G, 263G
Mz47 A2 1 16093C, 16111T, 16129A, 16223T, 16290T, 16319A, 16362C 73G, 146C, 153G, 235G, 263G
Mz70 A2 1 16093C, 16111T, 16136C, 16223T, 16290T, 16311C, 16319A, 16362C 73G, 146C, 152C, 153G, 235G, 263G
Mz48 A2 1 16093C, 16111T, 16136C, 16290T, 16311C, 16319A, 16362C 73G, 146C, 153G, 235G, 263G
Mz49 A2 1 16093C, 16136C, 16223T, 16290T, 16311C, 16319A, 16362C 73G, 146C, 153G, 235G, 263G
Mz19 A2 1 16095T, 16111T, 16223T, 16290T, 16319A, 16362C 73G, 146C, 153G, 235G, 263G
Mz66 A2 1 16104A, 16111T, 16189C, 16192T, 16223T, 16290T, 16319A, 16362C 73G, 146C, 153G, 235G, 263G
Mz20 A2 1 16111T, 16124C, 16175G, 16223T, 16290T, 16319A, 16362C 73G, 146C, 235G, 263G
Mz50 A2 1 16111T, 16124C, 16223T, 16290T, 16319A, 16362C 73G, 146C, 151T, 153G, 235G, 263G
Mz71 A2 1 16111T, 16129A, 16189C, 16223T, 16290T, 16311C, 16319A, 16362C 73G, 146C, 153G, 215G, 235G, 263G
Mz51 A2 1 16111T, 16129A, 16213A, 16223T, 16290T, 16319A, 16362C 73G, 146C, 153G, 235G, 263G
Mz52 A2 1 16111T, 16129A, 16223T, 16234T, 16290T, 16319A, 16362C 73G, 146C, 153G, 235G, 263G
Mz67 A2 1 16111T, 16129A, 16223T, 16260T, 16290T, 16319A, 16362C 73G, 146C, 151T, 153G, 235G, 263G
Mz21 A2 3 16111T, 16129A, 16223T, 16290T, 16319A, 16362C 73G, 146C, 153G, 235G, 263G
Mz43 A2 1 16111T, 16129A, 16223T, 16290T, 16319A, 16362C 73G, 146C, 153G, 200G, 235G, 263G
Mz53 A2 1 16111T, 16129A, 16223T, 16290T, 16319A, 16362C 73G, 146C, 152C, 153G, 235G, 263G
Mz68 A2 1 16111T, 16131C, 16134T, 16223T, 16290T, 16319A, 16362C 73G, 75A, 146C, 153G, 235G, 263G
Mz77 A2 1 16111T, 16136C, 16172C, 16223T, 16247G, 16257T, 16274A, 16290T, 16319A,
16344T
73G, 146C, 153G, 235G, 263G
Mz78 A2 1 16111T, 16136C, 16223T, 16247G, 16257T, 16274A, 16290T, 16319A, 16344T,
16362C
73G, 146C, 153G, 235G, 263G
Mz79 A2 1 16111T, 16136C, 16223T, 16290T, 16299G, 16311C, 16319A, 16362C 73G, 146C, 153G, 198T, 215G, 235G, 263G
Mz54 A2 1 16111T, 16136C, 16223T, 16290T, 16319A, 16324C, 16362C 73G, 146C, 153G, 235G, 263G
Mz22 A2 2 16111T, 16136C, 16223T, 16290T, 16319A, 16362C 73G, 146C, 153G, 235G, 263G
Mz23 A2 2 16111T, 16172C, 16223T, 16290T, 16319A, 16362C 73G, 146C, 153G, 235G, 263G
Mz72 A2 1 16111T, 16176T, 16223T, 16239T, 16290T, 16298C, 16319A, 16362C 73G, 146C, 152C, 153G, 235G, 263G
Mz82 A2 1 16111T, 16183C, 16189C, 16217C, 16223T, 16239T, 16290T, 16319A, 16362C 73G, 146C, 153G, 226C, 228A, 235G, 263G
Mz80 A2 1 16111T, 16183C, 16189C, 16223T, 16239T, 16290T, 16319A, 16362C 73G, 146C, 153G, 226C, 228A, 235G, 263G
Mz55 A2 1 16111T, 16187T, 16223T, 16290T, 16319A, 16362C 73G, 146C, 152C, 153G, 235G, 263G
Mz73 A2 1 16111T, 16189C, 16223T, 16239T, 16290T, 16319A, 16325C, 16362C 73G, 146C, 152C, 153G, 235G, 263G
Mz69 A2 1 16111T, 16223T, 16234T, 16239T, 16290T, 16319A, 16362C 73G, 146C, 152C, 153G, 238G, 263G
Mz56 A2 1 16111T, 16223T, 16234T, 16290T, 16319A, 16360T, 16362C 97A, 146C, 153G, 235G, 263G, del 106-111
Mz24 A2 2 16111T, 16223T, 16234T, 16290T, 16319A, 16362C 73G, 146C, 153G, 235G, 263G
Mz86 A2 1 16111T, 16223T, 16234T, 16290T, 16319A, 16362C 73G, 249D, 263G, 290–291D
Mz25 A2 1 16111T, 16223T, 16239T, 16290T, 16319A, 16362C 73G, 146C, 153G, 235G, 263G
Mz81 A2 1 16111T, 16223T, 16239T, 16290T, 16319A, 16362C 73G, 146C, 151T, 152C, 153G, 215G, 235G,
263G, 335G
Mz26 A2 1 16111T, 16223T, 16239T, 16319A, 16362C 73G, 146C, 152C, 153G, 235G, 263G
Mz57 A2 1 16111T, 16223T, 16258G, 16290T, 16319A, 16362C 73G, 103A, 146C, 153G, 235G, 263G
Mz58 A2 1 16111T, 16223T, 16265C, 16290T, 16319A, 16330C 73G, 103A, 146C, 153G, 235G, 263G
Mz83 A2 1 16111T, 16223T, 16265G, 16290T, 16293G, 16311C, 16319A, 16362C 73G, 90C, 98T, 146C, 153G, 195C, 235G, 263G
Mz59 A2 2 16111T, 16223T, 16274A, 16290T, 16311C, 16319A, 16362C 73G, 146C, 153G, 235G, 263G
Mz2 A2 1 16111T, 16223T, 16274A, 16290T, 16319A, 16362C 73G, 146C, 153G, 263G
Mz27 A2 1 16111T, 16223T, 16274A, 16290T, 16319A, 16362C 73G, 146C, 153G, 235G, 263G
Mz60 A2 1 16111T, 16223T, 16274A, 16290T, 16319A, 16362C 73G, 146C, 153G, 182T, 235G, 263G
Mz61 A2 3 16111T, 16223T, 16284G, 16290T, 16319A, 16362C 73G, 146C, 152C, 153G, 235G, 263G
Mz87 A2 1 16111T, 16223T, 16284G, 16290T, 16319A, 16362C 73G, 249D, 263G, 290–291D
Mz28 A2 1 16111T, 16223T, 16290T, 16311C, 16319A, 16362C 73G, 146C, 153G, 235G, 263G
Mz62 A2 1 16111T, 16223T, 16290T, 16311C, 16319A, 16362C 73G, 146C, 153G, 199C, 235G, 263G
Diversity of Amerindian mtDNA in Mexican mestizosM Guardado-Estrada et al
698
Journal of Human Genetics
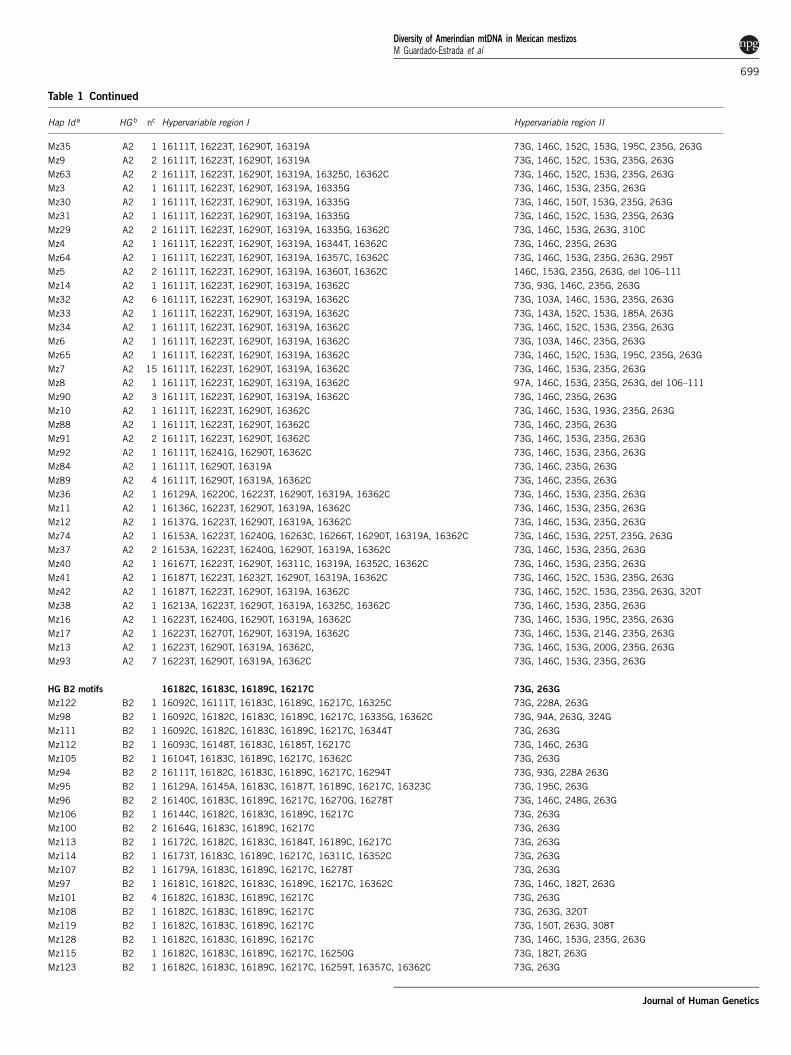
Table 1 Continued
Hap Id a HG b nc Hypervariable region I Hypervariable region II
Mz35 A2 1 16111T, 16223T, 16290T, 16319A 73G, 146C, 152C, 153G, 195C, 235G, 263G
Mz9 A2 2 16111T, 16223T, 16290T, 16319A 73G, 146C, 152C, 153G, 235G, 263G
Mz63 A2 2 16111T, 16223T, 16290T, 16319A, 16325C, 16362C 73G, 146C, 152C, 153G, 235G, 263G
Mz3 A2 1 16111T, 16223T, 16290T, 16319A, 16335G 73G, 146C, 153G, 235G, 263G
Mz30 A2 1 16111T, 16223T, 16290T, 16319A, 16335G 73G, 146C, 150T, 153G, 235G, 263G
Mz31 A2 1 16111T, 16223T, 16290T, 16319A, 16335G 73G, 146C, 152C, 153G, 235G, 263G
Mz29 A2 2 16111T, 16223T, 16290T, 16319A, 16335G, 16362C 73G, 146C, 153G, 263G, 310C
Mz4 A2 1 16111T, 16223T, 16290T, 16319A, 16344T, 16362C 73G, 146C, 235G, 263G
Mz64 A2 1 16111T, 16223T, 16290T, 16319A, 16357C, 16362C 73G, 146C, 153G, 235G, 263G, 295T
Mz5 A2 2 16111T, 16223T, 16290T, 16319A, 16360T, 16362C 146C, 153G, 235G, 263G, del 106–111
Mz14 A2 1 16111T, 16223T, 16290T, 16319A, 16362C 73G, 93G, 146C, 235G, 263G
Mz32 A2 6 16111T, 16223T, 16290T, 16319A, 16362C 73G, 103A, 146C, 153G, 235G, 263G
Mz33 A2 1 16111T, 16223T, 16290T, 16319A, 16362C 73G, 143A, 152C, 153G, 185A, 263G
Mz34 A2 1 16111T, 16223T, 16290T, 16319A, 16362C 73G, 146C, 152C, 153G, 235G, 263G
Mz6 A2 1 16111T, 16223T, 16290T, 16319A, 16362C 73G, 103A, 146C, 235G, 263G
Mz65 A2 1 16111T, 16223T, 16290T, 16319A, 16362C 73G, 146C, 152C, 153G, 195C, 235G, 263G
Mz7 A2 15 16111T, 16223T, 16290T, 16319A, 16362C 73G, 146C, 153G, 235G, 263G
Mz8 A2 1 16111T, 16223T, 16290T, 16319A, 16362C 97A, 146C, 153G, 235G, 263G, del 106–111
Mz90 A2 3 16111T, 16223T, 16290T, 16319A, 16362C 73G, 146C, 235G, 263G
Mz10 A2 1 16111T, 16223T, 16290T, 16362C 73G, 146C, 153G, 193G, 235G, 263G
Mz88 A2 1 16111T, 16223T, 16290T, 16362C 73G, 146C, 235G, 263G
Mz91 A2 2 16111T, 16223T, 16290T, 16362C 73G, 146C, 153G, 235G, 263G
Mz92 A2 1 16111T, 16241G, 16290T, 16362C 73G, 146C, 153G, 235G, 263G
Mz84 A2 1 16111T, 16290T, 16319A 73G, 146C, 235G, 263G
Mz89 A2 4 16111T, 16290T, 16319A, 16362C 73G, 146C, 235G, 263G
Mz36 A2 1 16129A, 16220C, 16223T, 16290T, 16319A, 16362C 73G, 146C, 153G, 235G, 263G
Mz11 A2 1 16136C, 16223T, 16290T, 16319A, 16362C 73G, 146C, 153G, 235G, 263G
Mz12 A2 1 16137G, 16223T, 16290T, 16319A, 16362C 73G, 146C, 153G, 235G, 263G
Mz74 A2 1 16153A, 16223T, 16240G, 16263C, 16266T, 16290T, 16319A, 16362C 73G, 146C, 153G, 225T, 235G, 263G
Mz37 A2 2 16153A, 16223T, 16240G, 16290T, 16319A, 16362C 73G, 146C, 153G, 235G, 263G
Mz40 A2 1 16167T, 16223T, 16290T, 16311C, 16319A, 16352C, 16362C 73G, 146C, 153G, 235G, 263G
Mz41 A2 1 16187T, 16223T, 16232T, 16290T, 16319A, 16362C 73G, 146C, 152C, 153G, 235G, 263G
Mz42 A2 1 16187T, 16223T, 16290T, 16319A, 16362C 73G, 146C, 152C, 153G, 235G, 263G, 320T
Mz38 A2 1 16213A, 16223T, 16290T, 16319A, 16325C, 16362C 73G, 146C, 153G, 235G, 263G
Mz16 A2 1 16223T, 16240G, 16290T, 16319A, 16362C 73G, 146C, 153G, 195C, 235G, 263G
Mz17 A2 1 16223T, 16270T, 16290T, 16319A, 16362C 73G, 146C, 153G, 214G, 235G, 263G
Mz13 A2 1 16223T, 16290T, 16319A, 16362C, 73G, 146C, 153G, 200G, 235G, 263G
Mz93 A2 7 16223T, 16290T, 16319A, 16362C 73G, 146C, 153G, 235G, 263G
HG B2 motifs 16182C, 16183C, 16189C, 16217C 73G, 263G
Mz122 B2 1 16092C, 16111T, 16183C, 16189C, 16217C, 16325C 73G, 228A, 263G
Mz98 B2 1 16092C, 16182C, 16183C, 16189C, 16217C, 16335G, 16362C 73G, 94A, 263G, 324G
Mz111 B2 1 16092C, 16182C, 16183C, 16189C, 16217C, 16344T 73G, 263G
Mz112 B2 1 16093C, 16148T, 16183C, 16185T, 16217C 73G, 146C, 263G
Mz105 B2 1 16104T, 16183C, 16189C, 16217C, 16362C 73G, 263G
Mz94 B2 2 16111T, 16182C, 16183C, 16189C, 16217C, 16294T 73G, 93G, 228A 263G
Mz95 B2 1 16129A, 16145A, 16183C, 16187T, 16189C, 16217C, 16323C 73G, 195C, 263G
Mz96 B2 2 16140C, 16183C, 16189C, 16217C, 16270G, 16278T 73G, 146C, 248G, 263G
Mz106 B2 1 16144C, 16182C, 16183C, 16189C, 16217C 73G, 263G
Mz100 B2 2 16164G, 16183C, 16189C, 16217C 73G, 263G
Mz113 B2 1 16172C, 16182C, 16183C, 16184T, 16189C, 16217C 73G, 263G
Mz114 B2 1 16173T, 16183C, 16189C, 16217C, 16311C, 16352C 73G, 263G
Mz107 B2 1 16179A, 16183C, 16189C, 16217C, 16278T 73G, 263G
Mz97 B2 1 16181C, 16182C, 16183C, 16189C, 16217C, 16362C 73G, 146C, 182T, 263G
Mz101 B2 4 16182C, 16183C, 16189C, 16217C 73G, 263G
Mz108 B2 1 16182C, 16183C, 16189C, 16217C 73G, 263G, 320T
Mz119 B2 1 16182C, 16183C, 16189C, 16217C 73G, 150T, 263G, 308T
Mz128 B2 1 16182C, 16183C, 16189C, 16217C 73G, 146C, 153G, 235G, 263G
Mz115 B2 1 16182C, 16183C, 16189C, 16217C, 16250G 73G, 182T, 263G
Mz123 B2 1 16182C, 16183C, 16189C, 16217C, 16259T, 16357C, 16362C 73G, 263G
Diversity of Amerindian mtDNA in Mexican mestizosM Guardado-Estrada et al
699
Journal of Human Genetics
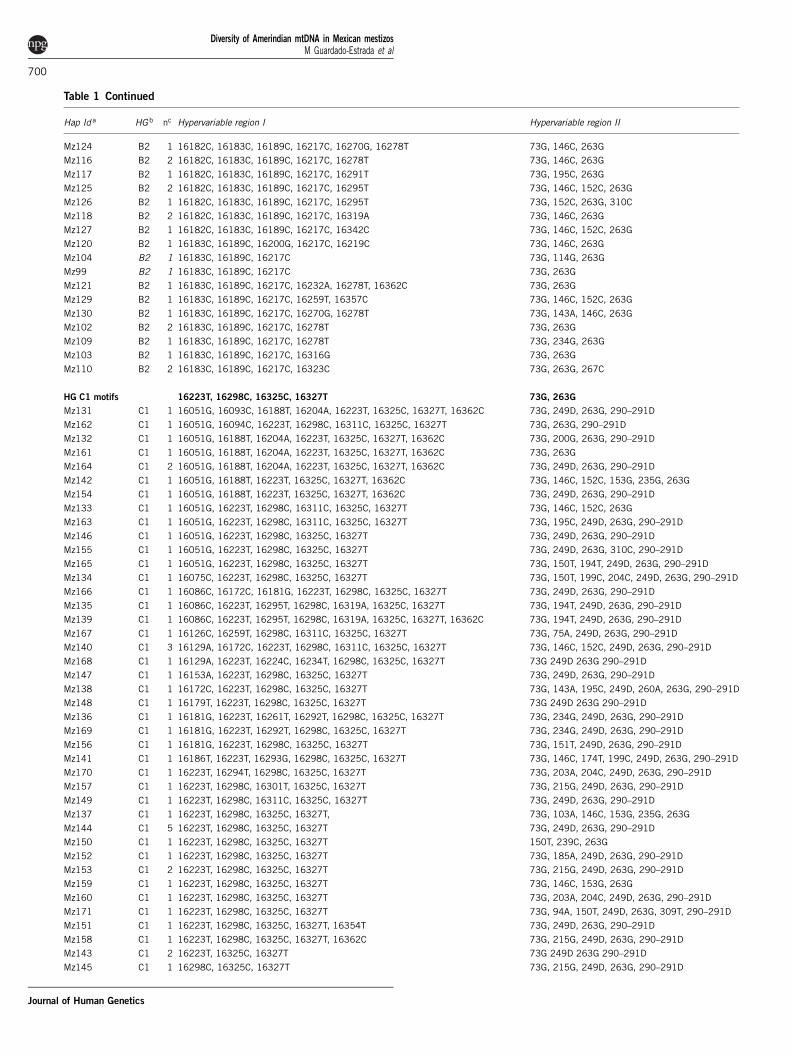
Table 1 Continued
Hap Id a HG b nc Hypervariable region I Hypervariable region II
Mz124 B2 1 16182C, 16183C, 16189C, 16217C, 16270G, 16278T 73G, 146C, 263G
Mz116 B2 2 16182C, 16183C, 16189C, 16217C, 16278T 73G, 146C, 263G
Mz117 B2 1 16182C, 16183C, 16189C, 16217C, 16291T 73G, 195C, 263G
Mz125 B2 2 16182C, 16183C, 16189C, 16217C, 16295T 73G, 146C, 152C, 263G
Mz126 B2 1 16182C, 16183C, 16189C, 16217C, 16295T 73G, 152C, 263G, 310C
Mz118 B2 2 16182C, 16183C, 16189C, 16217C, 16319A 73G, 146C, 263G
Mz127 B2 1 16182C, 16183C, 16189C, 16217C, 16342C 73G, 146C, 152C, 263G
Mz120 B2 1 16183C, 16189C, 16200G, 16217C, 16219C 73G, 146C, 263G
Mz104 B2 1 16183C, 16189C, 16217C 73G, 114G, 263G
Mz99 B2 1 16183C, 16189C, 16217C 73G, 263G
Mz121 B2 1 16183C, 16189C, 16217C, 16232A, 16278T, 16362C 73G, 263G
Mz129 B2 1 16183C, 16189C, 16217C, 16259T, 16357C 73G, 146C, 152C, 263G
Mz130 B2 1 16183C, 16189C, 16217C, 16270G, 16278T 73G, 143A, 146C, 263G
Mz102 B2 2 16183C, 16189C, 16217C, 16278T 73G, 263G
Mz109 B2 1 16183C, 16189C, 16217C, 16278T 73G, 234G, 263G
Mz103 B2 1 16183C, 16189C, 16217C, 16316G 73G, 263G
Mz110 B2 2 16183C, 16189C, 16217C, 16323C 73G, 263G, 267C
HG C1 motifs 16223T, 16298C, 16325C, 16327T 73G, 263G
Mz131 C1 1 16051G, 16093C, 16188T, 16204A, 16223T, 16325C, 16327T, 16362C 73G, 249D, 263G, 290–291D
Mz162 C1 1 16051G, 16094C, 16223T, 16298C, 16311C, 16325C, 16327T 73G, 263G, 290–291D
Mz132 C1 1 16051G, 16188T, 16204A, 16223T, 16325C, 16327T, 16362C 73G, 200G, 263G, 290–291D
Mz161 C1 1 16051G, 16188T, 16204A, 16223T, 16325C, 16327T, 16362C 73G, 263G
Mz164 C1 2 16051G, 16188T, 16204A, 16223T, 16325C, 16327T, 16362C 73G, 249D, 263G, 290–291D
Mz142 C1 1 16051G, 16188T, 16223T, 16325C, 16327T, 16362C 73G, 146C, 152C, 153G, 235G, 263G
Mz154 C1 1 16051G, 16188T, 16223T, 16325C, 16327T, 16362C 73G, 249D, 263G, 290–291D
Mz133 C1 1 16051G, 16223T, 16298C, 16311C, 16325C, 16327T 73G, 146C, 152C, 263G
Mz163 C1 1 16051G, 16223T, 16298C, 16311C, 16325C, 16327T 73G, 195C, 249D, 263G, 290–291D
Mz146 C1 1 16051G, 16223T, 16298C, 16325C, 16327T 73G, 249D, 263G, 290–291D
Mz155 C1 1 16051G, 16223T, 16298C, 16325C, 16327T 73G, 249D, 263G, 310C, 290–291D
Mz165 C1 1 16051G, 16223T, 16298C, 16325C, 16327T 73G, 150T, 194T, 249D, 263G, 290–291D
Mz134 C1 1 16075C, 16223T, 16298C, 16325C, 16327T 73G, 150T, 199C, 204C, 249D, 263G, 290–291D
Mz166 C1 1 16086C, 16172C, 16181G, 16223T, 16298C, 16325C, 16327T 73G, 249D, 263G, 290–291D
Mz135 C1 1 16086C, 16223T, 16295T, 16298C, 16319A, 16325C, 16327T 73G, 194T, 249D, 263G, 290–291D
Mz139 C1 1 16086C, 16223T, 16295T, 16298C, 16319A, 16325C, 16327T, 16362C 73G, 194T, 249D, 263G, 290–291D
Mz167 C1 1 16126C, 16259T, 16298C, 16311C, 16325C, 16327T 73G, 75A, 249D, 263G, 290–291D
Mz140 C1 3 16129A, 16172C, 16223T, 16298C, 16311C, 16325C, 16327T 73G, 146C, 152C, 249D, 263G, 290–291D
Mz168 C1 1 16129A, 16223T, 16224C, 16234T, 16298C, 16325C, 16327T 73G 249D 263G 290–291D
Mz147 C1 1 16153A, 16223T, 16298C, 16325C, 16327T 73G, 249D, 263G, 290–291D
Mz138 C1 1 16172C, 16223T, 16298C, 16325C, 16327T 73G, 143A, 195C, 249D, 260A, 263G, 290–291D
Mz148 C1 1 16179T, 16223T, 16298C, 16325C, 16327T 73G 249D 263G 290–291D
Mz136 C1 1 16181G, 16223T, 16261T, 16292T, 16298C, 16325C, 16327T 73G, 234G, 249D, 263G, 290–291D
Mz169 C1 1 16181G, 16223T, 16292T, 16298C, 16325C, 16327T 73G, 234G, 249D, 263G, 290–291D
Mz156 C1 1 16181G, 16223T, 16298C, 16325C, 16327T 73G, 151T, 249D, 263G, 290–291D
Mz141 C1 1 16186T, 16223T, 16293G, 16298C, 16325C, 16327T 73G, 146C, 174T, 199C, 249D, 263G, 290–291D
Mz170 C1 1 16223T, 16294T, 16298C, 16325C, 16327T 73G, 203A, 204C, 249D, 263G, 290–291D
Mz157 C1 1 16223T, 16298C, 16301T, 16325C, 16327T 73G, 215G, 249D, 263G, 290–291D
Mz149 C1 1 16223T, 16298C, 16311C, 16325C, 16327T 73G, 249D, 263G, 290–291D
Mz137 C1 1 16223T, 16298C, 16325C, 16327T, 73G, 103A, 146C, 153G, 235G, 263G
Mz144 C1 5 16223T, 16298C, 16325C, 16327T 73G, 249D, 263G, 290–291D
Mz150 C1 1 16223T, 16298C, 16325C, 16327T 150T, 239C, 263G
Mz152 C1 1 16223T, 16298C, 16325C, 16327T 73G, 185A, 249D, 263G, 290–291D
Mz153 C1 2 16223T, 16298C, 16325C, 16327T 73G, 215G, 249D, 263G, 290–291D
Mz159 C1 1 16223T, 16298C, 16325C, 16327T 73G, 146C, 153G, 263G
Mz160 C1 1 16223T, 16298C, 16325C, 16327T 73G, 203A, 204C, 249D, 263G, 290–291D
Mz171 C1 1 16223T, 16298C, 16325C, 16327T 73G, 94A, 150T, 249D, 263G, 309T, 290–291D
Mz151 C1 1 16223T, 16298C, 16325C, 16327T, 16354T 73G, 249D, 263G, 290–291D
Mz158 C1 1 16223T, 16298C, 16325C, 16327T, 16362C 73G, 215G, 249D, 263G, 290–291D
Mz143 C1 2 16223T, 16325C, 16327T 73G 249D 263G 290–291D
Mz145 C1 1 16298C, 16325C, 16327T 73G, 215G, 249D, 263G, 290–291D
Diversity of Amerindian mtDNA in Mexican mestizosM Guardado-Estrada et al
700
Journal of Human Genetics
reported in all B haplotypes analyzed in Latin America and almost allfrom Asia, whereas transversion A16182C was absent in the Argenti-nean population42 and it was found in low frequency in Colombia andBrazil (25%).40–42,53 The polymorphism A16182C is widely distrib-uted among Asian B haplogroups, mainly in the subhaplogroups B4aand B4b.53,55,56 In fact, it has been suggested that the Amerindianhaplogroup B2 descended from the haplogroup B4b.26,57 According tothe updated phylogeny, B haplotypes having the transversion A16182Cbelong to subhaplogroup B2c.28
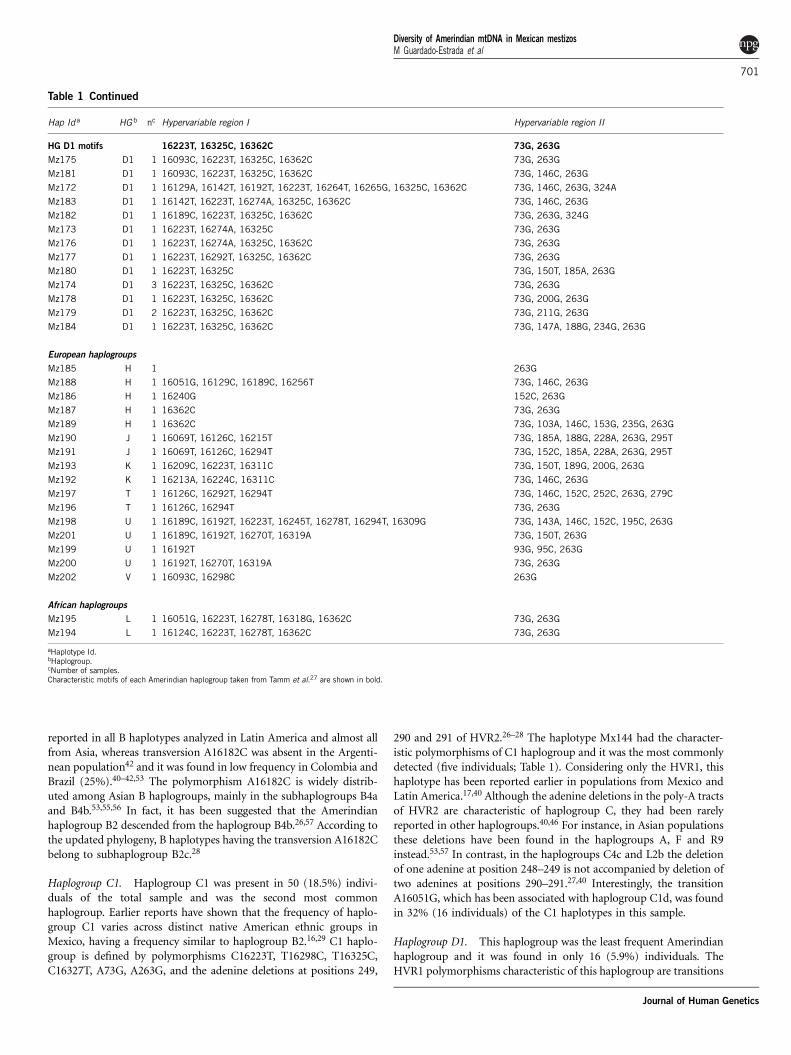
Haplogroup C1. Haplogroup C1 was present in 50 (18.5%) indivi-duals of the total sample and was the second most commonhaplogroup. Earlier reports have shown that the frequency of haplo-group C1 varies across distinct native American ethnic groups inMexico, having a frequency similar to haplogroup B2.16,29 C1 haplo-group is defined by polymorphisms C16223T, T16298C, T16325C,C16327T, A73G, A263G, and the adenine deletions at positions 249,
290 and 291 of HVR2.26–28 The haplotype Mx144 had the character-istic polymorphisms of C1 haplogroup and it was the most commonlydetected (five individuals; Table 1). Considering only the HVR1, thishaplotype has been reported earlier in populations from Mexico andLatin America.17,40 Although the adenine deletions in the poly-A tractsof HVR2 are characteristic of haplogroup C, they had been rarelyreported in other haplogroups.40,46 For instance, in Asian populationsthese deletions have been found in the haplogroups A, F and R9instead.53,57 In contrast, in the haplogroups C4c and L2b the deletionof one adenine at position 248–249 is not accompanied by deletion oftwo adenines at positions 290–291.27,40 Interestingly, the transitionA16051G, which has been associated with haplogroup C1d, was foundin 32% (16 individuals) of the C1 haplotypes in this sample.
Haplogroup D1. This haplogroup was the least frequent Amerindianhaplogroup and it was found in only 16 (5.9%) individuals. TheHVR1 polymorphisms characteristic of this haplogroup are transitions
Table 1 Continued
Hap Id a HG b nc Hypervariable region I Hypervariable region II
HG D1 motifs 16223T, 16325C, 16362C 73G, 263G
Mz175 D1 1 16093C, 16223T, 16325C, 16362C 73G, 263G
Mz181 D1 1 16093C, 16223T, 16325C, 16362C 73G, 146C, 263G
Mz172 D1 1 16129A, 16142T, 16192T, 16223T, 16264T, 16265G, 16325C, 16362C 73G, 146C, 263G, 324A
Mz183 D1 1 16142T, 16223T, 16274A, 16325C, 16362C 73G, 146C, 263G
Mz182 D1 1 16189C, 16223T, 16325C, 16362C 73G, 263G, 324G
Mz173 D1 1 16223T, 16274A, 16325C 73G, 263G
Mz176 D1 1 16223T, 16274A, 16325C, 16362C 73G, 263G
Mz177 D1 1 16223T, 16292T, 16325C, 16362C 73G, 263G
Mz180 D1 1 16223T, 16325C 73G, 150T, 185A, 263G
Mz174 D1 3 16223T, 16325C, 16362C 73G, 263G
Mz178 D1 1 16223T, 16325C, 16362C 73G, 200G, 263G
Mz179 D1 2 16223T, 16325C, 16362C 73G, 211G, 263G
Mz184 D1 1 16223T, 16325C, 16362C 73G, 147A, 188G, 234G, 263G
European haplogroups
Mz185 H 1 263G
Mz188 H 1 16051G, 16129C, 16189C, 16256T 73G, 146C, 263G
Mz186 H 1 16240G 152C, 263G
Mz187 H 1 16362C 73G, 263G
Mz189 H 1 16362C 73G, 103A, 146C, 153G, 235G, 263G
Mz190 J 1 16069T, 16126C, 16215T 73G, 185A, 188G, 228A, 263G, 295T
Mz191 J 1 16069T, 16126C, 16294T 73G, 152C, 185A, 228A, 263G, 295T
Mz193 K 1 16209C, 16223T, 16311C 73G, 150T, 189G, 200G, 263G
Mz192 K 1 16213A, 16224C, 16311C 73G, 146C, 263G
Mz197 T 1 16126C, 16292T, 16294T 73G, 146C, 152C, 252C, 263G, 279C
Mz196 T 1 16126C, 16294T 73G, 263G
Mz198 U 1 16189C, 16192T, 16223T, 16245T, 16278T, 16294T, 16309G 73G, 143A, 146C, 152C, 195C, 263G
Mz201 U 1 16189C, 16192T, 16270T, 16319A 73G, 150T, 263G
Mz199 U 1 16192T 93G, 95C, 263G
Mz200 U 1 16192T, 16270T, 16319A 73G, 263G
Mz202 V 1 16093C, 16298C 263G
African haplogroups
Mz195 L 1 16051G, 16223T, 16278T, 16318G, 16362C 73G, 263G
Mz194 L 1 16124C, 16223T, 16278T, 16362C 73G, 263G
aHaplotype Id.bHaplogroup.cNumber of samples.Characteristic motifs of each Amerindian haplogroup taken from Tamm et al.27 are shown in bold.
Diversity of Amerindian mtDNA in Mexican mestizosM Guardado-Estrada et al
701
Journal of Human Genetics
C16223T, T16325C and T16362C.27 Mx174 was the most frequent D1haplotype found (three individuals) in the sample and had thecharacteristic polymorphisms plus the transitions A73G and A263G(Table 1). Considering only HVR1 polymorphisms, this haplotype hasbeen found earlier in South America.41 The haplogroup D1 belongs tothe branch of Asian haplogroup D4; however, the transition atposition 16 325 is not found in D haplogroups from Asia.53,57 Thefrequencies of haplogroup D1 in Amerindian populations are lower inCentral America and higher in North and South America.15,16,58
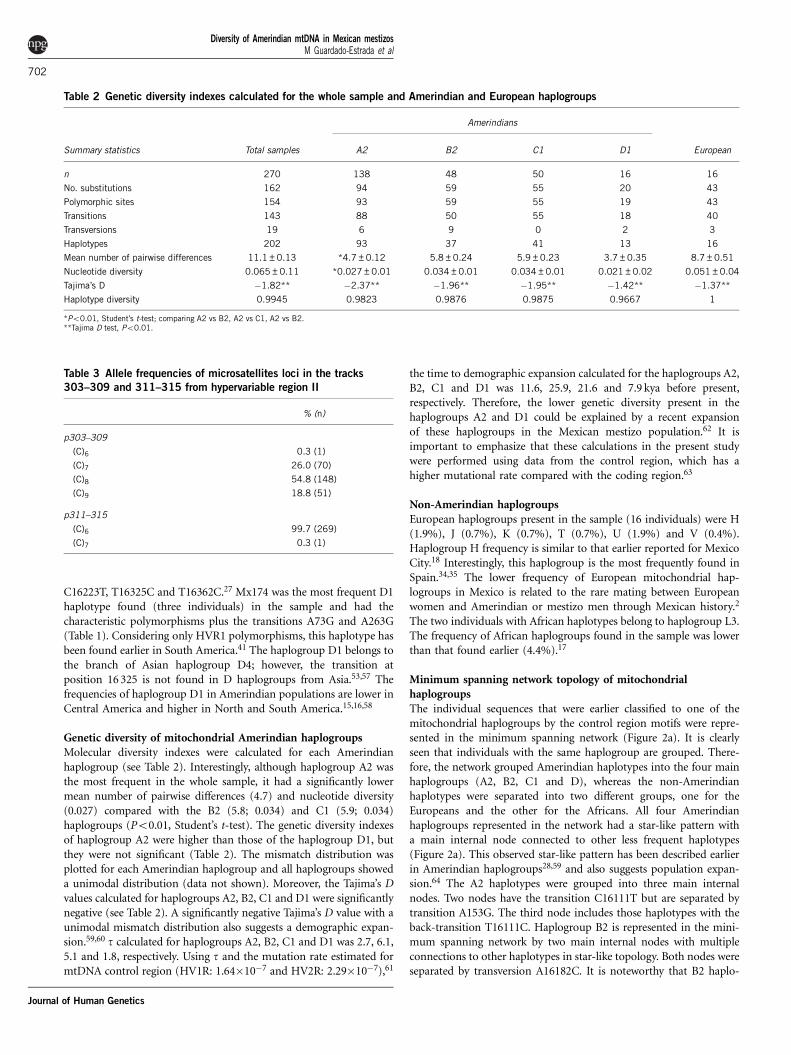
Genetic diversity of mitochondrial Amerindian haplogroupsMolecular diversity indexes were calculated for each Amerindianhaplogroup (see Table 2). Interestingly, although haplogroup A2 wasthe most frequent in the whole sample, it had a significantly lowermean number of pairwise differences (4.7) and nucleotide diversity(0.027) compared with the B2 (5.8; 0.034) and C1 (5.9; 0.034)haplogroups (Po0.01, Student’s t-test). The genetic diversity indexesof haplogroup A2 were higher than those of the haplogroup D1, butthey were not significant (Table 2). The mismatch distribution wasplotted for each Amerindian haplogroup and all haplogroups showeda unimodal distribution (data not shown). Moreover, the Tajima’s Dvalues calculated for haplogroups A2, B2, C1 and D1 were significantlynegative (see Table 2). A significantly negative Tajima’s D value with aunimodal mismatch distribution also suggests a demographic expan-sion.59,60 t calculated for haplogroups A2, B2, C1 and D1 was 2.7, 6.1,5.1 and 1.8, respectively. Using t and the mutation rate estimated formtDNA control region (HV1R: 1.64�10�7 and HV2R: 2.29�10�7),61
the time to demographic expansion calculated for the haplogroups A2,B2, C1 and D1 was 11.6, 25.9, 21.6 and 7.9 kya before present,respectively. Therefore, the lower genetic diversity present in thehaplogroups A2 and D1 could be explained by a recent expansionof these haplogroups in the Mexican mestizo population.62 It isimportant to emphasize that these calculations in the present studywere performed using data from the control region, which has ahigher mutational rate compared with the coding region.63
Non-Amerindian haplogroupsEuropean haplogroups present in the sample (16 individuals) were H(1.9%), J (0.7%), K (0.7%), T (0.7%), U (1.9%) and V (0.4%).Haplogroup H frequency is similar to that earlier reported for MexicoCity.18 Interestingly, this haplogroup is the most frequently found inSpain.34,35 The lower frequency of European mitochondrial hap-logroups in Mexico is related to the rare mating between Europeanwomen and Amerindian or mestizo men through Mexican history.2
The two individuals with African haplotypes belong to haplogroup L3.The frequency of African haplogroups found in the sample was lowerthan that found earlier (4.4%).17
Minimum spanning network topology of mitochondrialhaplogroupsThe individual sequences that were earlier classified to one of themitochondrial haplogroups by the control region motifs were repre-sented in the minimum spanning network (Figure 2a). It is clearlyseen that individuals with the same haplogroup are grouped. There-fore, the network grouped Amerindian haplotypes into the four mainhaplogroups (A2, B2, C1 and D), whereas the non-Amerindianhaplotypes were separated into two different groups, one for theEuropeans and the other for the Africans. All four Amerindianhaplogroups represented in the network had a star-like pattern witha main internal node connected to other less frequent haplotypes(Figure 2a). This observed star-like pattern has been described earlierin Amerindian haplogroups28,59 and also suggests population expan-sion.64 The A2 haplotypes were grouped into three main internalnodes. Two nodes have the transition C16111T but are separated bytransition A153G. The third node includes those haplotypes with theback-transition T16111C. Haplogroup B2 is represented in the mini-mum spanning network by two main internal nodes with multipleconnections to other haplotypes in star-like topology. Both nodes wereseparated by transversion A16182C. It is noteworthy that B2 haplo-
Table 2 Genetic diversity indexes calculated for the whole sample and Amerindian and European haplogroups
Amerindians
Summary statistics Total samples A2 B2 C1 D1 European
n 270 138 48 50 16 16
No. substitutions 162 94 59 55 20 43
Polymorphic sites 154 93 59 55 19 43
Transitions 143 88 50 55 18 40
Transversions 19 6 9 0 2 3
Haplotypes 202 93 37 41 13 16
Mean number of pairwise differences 11.1±0.13 *4.7±0.12 5.8±0.24 5.9±0.23 3.7±0.35 8.7±0.51
Nucleotide diversity 0.065±0.11 *0.027±0.01 0.034±0.01 0.034±0.01 0.021±0.02 0.051±0.04
Tajima’s D �1.82** �2.37** �1.96** �1.95** �1.42** �1.37**
Haplotype diversity 0.9945 0.9823 0.9876 0.9875 0.9667 1
*Po0.01, Student’s t-test; comparing A2 vs B2, A2 vs C1, A2 vs B2.**Tajima D test, Po0.01.
Table 3 Allele frequencies of microsatellites loci in the tracks
303–309 and 311–315 from hypervariable region II
% (n)
p303–309
(C)6 0.3 (1)
(C)7 26.0 (70)
(C)8 54.8 (148)
(C)9 18.8 (51)
p311–315
(C)6 99.7 (269)
(C)7 0.3 (1)
Diversity of Amerindian mtDNA in Mexican mestizosM Guardado-Estrada et al
702
Journal of Human Genetics
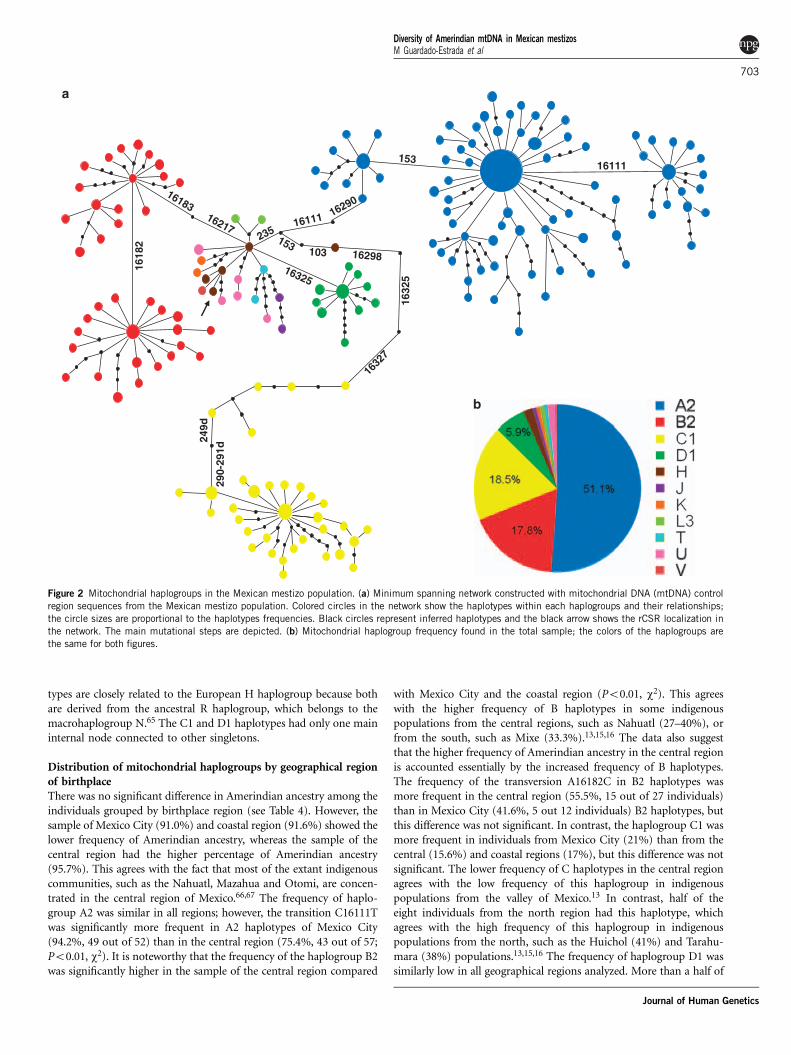
types are closely related to the European H haplogroup because bothare derived from the ancestral R haplogroup, which belongs to themacrohaplogroup N.65 The C1 and D1 haplotypes had only one maininternal node connected to other singletons.
Distribution of mitochondrial haplogroups by geographical regionof birthplaceThere was no significant difference in Amerindian ancestry among theindividuals grouped by birthplace region (see Table 4). However, thesample of Mexico City (91.0%) and coastal region (91.6%) showed thelower frequency of Amerindian ancestry, whereas the sample of thecentral region had the higher percentage of Amerindian ancestry(95.7%). This agrees with the fact that most of the extant indigenouscommunities, such as the Nahuatl, Mazahua and Otomi, are concen-trated in the central region of Mexico.66,67 The frequency of haplo-group A2 was similar in all regions; however, the transition C16111Twas significantly more frequent in A2 haplotypes of Mexico City(94.2%, 49 out of 52) than in the central region (75.4%, 43 out of 57;Po0.01, w2). It is noteworthy that the frequency of the haplogroup B2was significantly higher in the sample of the central region compared
with Mexico City and the coastal region (Po0.01, w2). This agreeswith the higher frequency of B haplotypes in some indigenouspopulations from the central regions, such as Nahuatl (27–40%), orfrom the south, such as Mixe (33.3%).13,15,16 The data also suggestthat the higher frequency of Amerindian ancestry in the central regionis accounted essentially by the increased frequency of B haplotypes.The frequency of the transversion A16182C in B2 haplotypes wasmore frequent in the central region (55.5%, 15 out of 27 individuals)than in Mexico City (41.6%, 5 out 12 individuals) B2 haplotypes, butthis difference was not significant. In contrast, the haplogroup C1 wasmore frequent in individuals from Mexico City (21%) than from thecentral (15.6%) and coastal regions (17%), but this difference was notsignificant. The lower frequency of C haplotypes in the central regionagrees with the low frequency of this haplogroup in indigenouspopulations from the valley of Mexico.13 In contrast, half of theeight individuals from the north region had this haplotype, whichagrees with the high frequency of this haplogroup in indigenouspopulations from the north, such as the Huichol (41%) and Tarahu-mara (38%) populations.13,15,16 The frequency of haplogroup D1 wassimilarly low in all geographical regions analyzed. More than a half of
1618
2
16111153
249d
290-29
1d
1632
5
16325
16327
16298103153
23516111
16290
1618316217
Figure 2 Mitochondrial haplogroups in the Mexican mestizo population. (a) Minimum spanning network constructed with mitochondrial DNA (mtDNA) control
region sequences from the Mexican mestizo population. Colored circles in the network show the haplotypes within each haplogroups and their relationships;
the circle sizes are proportional to the haplotypes frequencies. Black circles represent inferred haplotypes and the black arrow shows the rCSR localization in
the network. The main mutational steps are depicted. (b) Mitochondrial haplogroup frequency found in the total sample; the colors of the haplogroups are
the same for both figures.
Diversity of Amerindian mtDNA in Mexican mestizosM Guardado-Estrada et al
703
Journal of Human Genetics
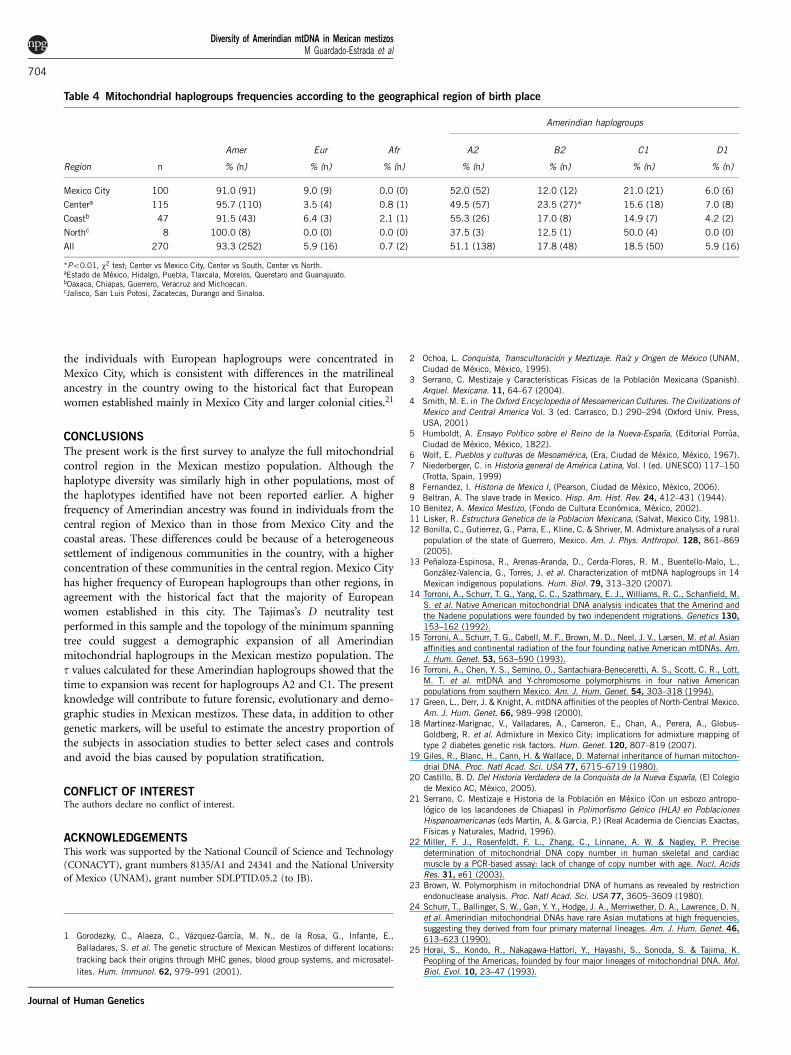
the individuals with European haplogroups were concentrated inMexico City, which is consistent with differences in the matrilinealancestry in the country owing to the historical fact that Europeanwomen established mainly in Mexico City and larger colonial cities.21
CONCLUSIONS
The present work is the first survey to analyze the full mitochondrialcontrol region in the Mexican mestizo population. Although thehaplotype diversity was similarly high in other populations, most ofthe haplotypes identified have not been reported earlier. A higherfrequency of Amerindian ancestry was found in individuals from thecentral region of Mexico than in those from Mexico City and thecoastal areas. These differences could be because of a heterogeneoussettlement of indigenous communities in the country, with a higherconcentration of these communities in the central region. Mexico Cityhas higher frequency of European haplogroups than other regions, inagreement with the historical fact that the majority of Europeanwomen established in this city. The Tajimas’s D neutrality testperformed in this sample and the topology of the minimum spanningtree could suggest a demographic expansion of all Amerindianmitochondrial haplogroups in the Mexican mestizo population. Thet values calculated for these Amerindian haplogroups showed that thetime to expansion was recent for haplogroups A2 and C1. The presentknowledge will contribute to future forensic, evolutionary and demo-graphic studies in Mexican mestizos. These data, in addition to othergenetic markers, will be useful to estimate the ancestry proportion ofthe subjects in association studies to better select cases and controlsand avoid the bias caused by population stratification.
CONFLICT OF INTERESTThe authors declare no conflict of interest.
ACKNOWLEDGEMENTSThis work was supported by the National Council of Science and Technology
(CONACYT), grant numbers 8135/A1 and 24341 and the National University
of Mexico (UNAM), grant number SDI.PTID.05.2 (to JB).
1 Gorodezky, C., Alaeza, C., Vazquez-Garcıa, M. N., de la Rosa, G., Infante, E.,
Balladares, S. et al. The genetic structure of Mexican Mestizos of different locations:
tracking back their origins through MHC genes, blood group systems, and microsatel-
lites. Hum. Immunol. 62, 979–991 (2001).
2 Ochoa, L. Conquista, Transculturacion y Meztizaje. Raız y Origen de Mexico (UNAM,Ciudad de Mexico, Mexico, 1995).
3 Serrano, C. Mestizaje y Caracterısticas Fısicas de la Poblacion Mexicana (Spanish).Arquel. Mexicana. 11, 64–67 (2004).
4 Smith, M. E. in The Oxford Encyclopedia of Mesoamerican Cultures. The Civilizations ofMexico and Central America Vol. 3 (ed. Carrasco, D.) 290–294 (Oxford Univ. Press,USA, 2001)
5 Humboldt, A. Ensayo Polıtico sobre el Reino de la Nueva-Espana, (Editorial Porrua,Ciudad de Mexico, Mexico, 1822).
6 Wolf, E. Pueblos y culturas de Mesoamerica, (Era, Ciudad de Mexico, Mexico, 1967).7 Niederberger, C. in Historia general de America Latina, Vol. I (ed. UNESCO) 117–150
(Trotta, Spain, 1999)8 Fernandez, I. Historia de Mexico I, (Pearson, Ciudad de Mexico, Mexico, 2006).9 Beltran, A. The slave trade in Mexico. Hisp. Am. Hist. Rev. 24, 412–431 (1944).10 Benitez, A. Mexico Mestizo, (Fondo de Cultura Economica, Mexico, 2002).11 Lisker, R. Estructura Genetica de la Poblacion Mexicana, (Salvat, Mexico City, 1981).12 Bonilla, C., Gutierrez, G., Parra, E., Kline, C. & Shriver, M. Admixture analysis of a rural
population of the state of Guerrero, Mexico. Am. J. Phys. Anthropol. 128, 861–869(2005).
13 Penaloza-Espinosa, R., Arenas-Aranda, D., Cerda-Flores, R. M., Buentello-Malo, L.,
Gonzalez-Valencia, G., Torres, J. et al. Characterization of mtDNA haplogroups in 14Mexican indigenous populations. Hum. Biol. 79, 313–320 (2007).
14 Torroni, A., Schurr, T. G., Yang, C. C., Szathmary, E. J., Williams, R. C., Schanfield, M.
S. et al. Native American mitochondrial DNA analysis indicates that the Amerind andthe Nadene populations were founded by two independent migrations. Genetics 130,
153–162 (1992).15 Torroni, A., Schurr, T. G., Cabell, M. F., Brown, M. D., Neel, J. V., Larsen, M. et al. Asian
affinities and continental radiation of the four founding native American mtDNAs. Am.J. Hum. Genet. 53, 563–590 (1993).
16 Torroni, A., Chen, Y. S., Semino, O., Santachiara-Beneceretti, A. S., Scott, C. R., Lott,M. T. et al. mtDNA and Y-chromosome polymorphisms in four native Americanpopulations from southern Mexico. Am. J. Hum. Genet. 54, 303–318 (1994).
17 Green, L., Derr, J. & Knight, A. mtDNA affinities of the peoples of North-Central Mexico.Am. J. Hum. Genet. 66, 989–998 (2000).
18 Martinez-Marignac, V., Valladares, A., Cameron, E., Chan, A., Perera, A., Globus-Goldberg, R. et al. Admixture in Mexico City: implications for admixture mapping oftype 2 diabetes genetic risk factors. Hum. Genet. 120, 807–819 (2007).
19 Giles, R., Blanc, H., Cann, H. & Wallace, D. Maternal inheritance of human mitochon-drial DNA. Proc. Natl Acad. Sci. USA 77, 6715–6719 (1980).
20 Castillo, B. D. Del Historia Verdadera de la Conquista de la Nueva Espana, (El Colegio
de Mexico AC, Mexico, 2005).21 Serrano, C. Mestizaje e Historia de la Poblacion en Mexico (Con un esbozo antropo-
logico de los lacandones de Chiapas) in Polimorfismo Genico (HLA) en Poblaciones
Hispanoamericanas (eds Martin, A. & Garcia, P.) (Real Academia de Ciencias Exactas,Fısicas y Naturales, Madrid, 1996).
22 Miller, F. J., Rosenfeldt, F. L., Zhang, C., Linnane, A. W. & Nagley, P. Precise
determination of mitochondrial DNA copy number in human skeletal and cardiacmuscle by a PCR-based assay: lack of change of copy number with age. Nucl. AcidsRes. 31, e61 (2003).
23 Brown, W. Polymorphism in mitochondrial DNA of humans as revealed by restrictionendonuclease analysis. Proc. Natl Acad. Sci. USA 77, 3605–3609 (1980).
24 Schurr, T., Ballinger, S. W., Gan, Y. Y., Hodge, J. A., Merriwether, D. A., Lawrence, D. N.et al. Amerindian mitochondrial DNAs have rare Asian mutations at high frequencies,suggesting they derived from four primary maternal lineages. Am. J. Hum. Genet. 46,
613–623 (1990).25 Horai, S., Kondo, R., Nakagawa-Hattori, Y., Hayashi, S., Sonoda, S. & Tajima, K.
Peopling of the Americas, founded by four major lineages of mitochondrial DNA. Mol.Biol. Evol. 10, 23–47 (1993).
Table 4 Mitochondrial haplogroups frequencies according to the geographical region of birth place
Amerindian haplogroups
Amer Eur Afr A2 B2 C1 D1
Region n % (n) % (n) % (n) % (n) % (n) % (n) % (n)
Mexico City 100 91.0 (91) 9.0 (9) 0.0 (0) 52.0 (52) 12.0 (12) 21.0 (21) 6.0 (6)
Centera 115 95.7 (110) 3.5 (4) 0.8 (1) 49.5 (57) 23.5 (27)* 15.6 (18) 7.0 (8)
Coastb 47 91.5 (43) 6.4 (3) 2.1 (1) 55.3 (26) 17.0 (8) 14.9 (7) 4.2 (2)
Northc 8 100.0 (8) 0.0 (0) 0.0 (0) 37.5 (3) 12.5 (1) 50.0 (4) 0.0 (0)
All 270 93.3 (252) 5.9 (16) 0.7 (2) 51.1 (138) 17.8 (48) 18.5 (50) 5.9 (16)
*Po0.01, w2 test; Center vs Mexico City, Center vs South, Center vs North.aEstado de Mexico, Hidalgo, Puebla, Tlaxcala, Morelos, Queretaro and Guanajuato.bOaxaca, Chiapas, Guerrero, Veracruz and Michoacan.cJalisco, San Luis Potosi, Zacatecas, Durango and Sinaloa.
Diversity of Amerindian mtDNA in Mexican mestizosM Guardado-Estrada et al
704
Journal of Human Genetics
26 Bandelt, H. J., Hernstadt, C., Yao, Y. G., Kong, Q. P., Kivisild, T., Rengo, C. et al.Identification of native American founder mtDNAs through the analysis of completemtDNA sequences: some caveats. Ann. Hum. Genet. 67, 512–524 (2003).
27 Tamm, E., Kivisild, T., Reida, M., Metspalu, M., Smith, D. G., Mulligan, C. J. et al.Beringian standstill and spread of native American founders. PLoS ONE 2, e829(2007).
28 Achilli, A., Perego, U. A., Bravi, C. M., Coble, M. D., Kong, Q. P., Woodward, S. R. et al.The phylogeny of the four Pan-American MtDNA haplogroups: implications for evolu-tionary and disease studies. PLoS ONE 3, e1764 (2008).
29 Gonzalez-Oliver, A., Marquez-Morfın, L., Jimenez, J. & Torre-Blanco, A. FoundingAmerindian mitochondrial DNA lineages in ancient Maya from Xcaret, Quintana Roo.Am. J. Phys. Anthropol. 116, 230–235 (2001).
30 Marchini, J., Cardon, L. R., Phillips, M. S. & Donnelly, P. The effects of humanpopulation structure on large genetic association studies. Nat. Genet. 36, 512–517(2004).
31 Andrews, R., Kubacka, I., Chinnery, P. F., Lightowlers, R. N., Turnbull, D. M. & Howell,N. Reanalysis and revision of the Cambridge reference sequence for human mitochon-drial DNA. Nat. Genet. 23, 147 (1999).
32 Excoffier, V., Laval, L. & Schneider, S. Arlequin ver 3.11: an integrated softwarepackage for population genetics data analysis. Evol. Bioinform. Online 1, 47–50(2005).
33 Forster, P., Harding, R., Torroni, A. & Bandelt, H. Origin and evolution of nativeAmerican mtDNA variation: a reappraisal. Am. J. Hum. Genet. 59, 935–945 (1996).
34 Torroni, A., Huoponen, K., Francalacci, P., Petrozzi, M., Morelli, L., Scozzari, R. et al.Classification of European mtDNAs from an analysis of three European populations.Genetics 144, 1835–1850 (1996).
35 Alvarez, J. C., Johnson, D. L., Lorente, J. A., Martinez-Espin, E., Martinez-Gonzalez, L.J., Allard, M. et al. Characterization of human control region sequences for Spanishindividuals in a forensic mtDNA data set. Leg. Med. 9, 293–304 (2007).
36 Salas, A., Richards, M., Lareu, M. V., Scorazzi, R., Coppa, A., Torroni, A. et al. TheAfrican diaspora: mitochondrial DNA and the Atlantic slave trade. Am. J. Hum. Genet.74, 454–465 (2004).
37 Templeton, A. R., Crandall, K. A. & Sing, C. F. A cladistic analysis of phenotypicassociations with haplotypes inferred from restriction endonuclease mapping and DNAsequence data. III. Cladogram estimation. Genetics 132, 619–633 (1992).
38 Clement, M., Posada, D. & Crandall, K. A. TCS: a computer program to estimate genegenealogies. Mol. Ecol. 9, 1657–1659 (2000).
39 Allard, M. W., Polanskey, D., Wilson, M. R., Monson, K. L. & Budowle, B. Evaluation ofvariation in control region sequences for hispanic individuals in the SWGDAM mtDNAdata set. J. Forensic Sci. 51, 566–573 (2006).
40 Barbosa, A., Antonio, L., Dalmo, d. S., Valdir, A. & Luiz, B. Mitochondrial DNA controlregion polymorphism in the population of Alagoas state, North-Eastern Brazil. J.Forensic Sci. 53, 142–146 (2008).
41 Salas, A., Acosta, V., Alvarez-Iglesias, M., Cerezo, C., Philips, M. V. & Carracedo, L. A.The mtDNA ancestry of admixed Colombian populations. Am. J. Hum. Biol. 20, 584–591 (2008).
42 Salas, A., Jaime, J. C., Alvarez-Iglesias, V. & Carracedo, A. Gender bias in themultiethnic genetic composition of central Argentina. J. Hum. Genet. 53, 662–674(2008).
43 Stewart, J., Fisher, C. L., Aagaard, P. J., Wilson, M. R., Isenberg, A. R., Polanskey, D.et al. Length variation in HV2 of the human mitochondrial DNA control region. J.Forensic Sci. 46, 862–870 (2001).
44 Vigilant, L., Stoneking, M., Harpending, H., Hawkes, K. & Wilson, A. C. Africanpopulations and the evolution of human mitochondrial DNA. Science 253, 1503–1507 (1991).
45 Yong Ji, Z., Qing Song, X., Zhe Jia, Z., Hai Yu, L. & Jung Bin, L. Haplotype diversity inmitochondrial DNA hypervariable region I, II and III in northeast China Han. ForensicSci. Int. 149, 267–269 (2005).
46 Crespillo, M., Luque, J. A., Paredes, M., Fernandez, R., Ramirez, E. & Valverde, J. L.Mitochondrial DNA sequences for 118 individuals from northeastern Spain. Int. J.Legal Med. 114, 130–132 (2000).
47 Salas, A., Lareu, V., Calafell, F., Bertranpetit, J. & Carracedo, A. mtDNA hypervariableregion II (HVII) sequences in human evolution studies. Eur. J. Hum. Genet. 8,
964–974 (2000).48 Turchi, C., Buscemi, L., Previdere, C., Grignani, P., Brandstatter, A., Achilli, A. et al.
Italian mitochondrial DNA database: results of a collaborative exercise and proficiencytesting. Int. J. Legal Med. 122, 199–204 (2008).
49 Santos., M. & Barrantes, R. D-loop mtDNA deletion as a unique marker of ChibchanAmerindians. Am. J. Hum. Genet. 55, 413–414 (1994).
50 Arredondo, A., Najera, P. & Leyva, R. Atencion medica ambulatoria en Mexico: el costopara los usuarios. Salud Publ. Mex. 41, 18–26 (1999).
51 Relethford, J., Stern, M., Gaskill, S. & Hazuda, H. Social class, admixture, and skincolor variation in Mexican-Americans and Anglo-Americans living in San Antonio,Texas. Am. J. Phys. Anthropol. 61, 97–102 (1983).
52 Easton, R. D., Merriwether, D. A., Crews, D. E. & Ferrell, R. E. mtDNA variation in theYanomami: evidence for additional new world founding lineages. Am. J. Hum. Genet.59, 213–225 (1996).
53 Kong, Q. P., Bandelt, H. J., Sun, C., Yao, Y. G., Salas, A., Achilli, A. et al. Updating theEast Asian mtDNA phylogeny: a prerequisite for the identification of pathogenicmutations. Hum. Mol. Genet. 15, 2076–2086 (2006).
54 Tanaka, M., Cabrera, V. M., Gonzalez, A. M., Larruga, J. M., Takeyasu, T., Fuku, N. et al.Mitochondrial genome variation in Eastern Asia and the peopling of Japan. GenomeRes. 14, 1832–1850 (2004).
55 Mabuchi, T., Susukida, R., Kido, A. & Oya, M. Typing the 1.1 kb control region ofhuman mitochondrial DNA in Japanese individuals. J. Forensic Sci. 52, 355–363(2007).
56 Yao, Y. G., Kong, Q. P., Bandelt, H. J., Kivisild, T. & Zhang, Y. P. Phylogeographicdifferentiation of mitochondrial DNA in Han Chinese. Am. J. Hum. Genet. 70, 635–651 (2002).
57 Kivisild, T., Tolk, H. V., Parik, J., Wang, Y., Papiha, S. S., Bandelt, H. J. et al. Theemerging limbs and twigs of the East Asian mtDNA tree. Mol. Biol. Evol. 19, 1737–1751 (2002).
58 Salzano, F. M. Molecular variability in Amerindians: widespread but uneven informa-tion. An. Acad. Bras. Cienc. 74, 223–263 (2002).
59 Harpending, H. C., Batzer, M. A., Gurven, M., Jorde, L. B., Rogers, A. R. & Sherry, S. T.Genetic traces of ancient demography. Proc. Natl Acad. Sci. USA 95, 1961–1967(1998).
60 Tajima, F. Statistical analysis of DNA polymorphism. Jpn. J. Genet. 68, 567–595(1993).
61 Soares, P., Ermini, L., Thomson, N., Mormina, M., Rito, T., Rohl, A. et al. Correcting forpurifying selection: an improved human mitochondrial molecular clock. Am. J. Hum.Genet. 84, 740–759 (2009).
62 Schneider, S. & Excoffier, L. Estimation of past demographic parameters from thedistribution of pairwise differences when the mutation rates vary among sites: applica-tion to human mitochondrial DNA. Genetics 152, 1079–1089 (1999).
63 Torroni, A., Neel, J. V., Barrantes, R., Schurr, T. G. & Wallace, D. C. Mitochondrial DNA‘‘clock’’ for the Amerinds and its implications for timing their entry into North America.Proc. Natl Acad. Sci. USA 91, 1158–1162 (1994).
64 Kaessmann, H. & Paabo, S. The genetical history of humans and the great apes. J. Int.Med. 251, 1–18 (2002).
65 Maca-Meyer, N., Gonzalez, A., Larruga, J., Flores, C. & Cabrera, V. Major genomicmitochondrial lineages delineate early human expansions. BMC Genet. 2, 13 (2001).
66 Valdes de Montano, L. La poblacion indigena. Hacia la expansion demografica de losgrupos etnicos. Demos 2, 17–18 (1989).
67 INEGI. Perfil Sociodemografico de la Poblacion Hablante de Nahuatl (INEGI, Mexico,2005)
Diversity of Amerindian mtDNA in Mexican mestizosM Guardado-Estrada et al
705
Journal of Human Genetics