father involvement in early head start programs: a practitioners' study
TRANSCRIPT

Father Involvement in Ear ly Head Star t Programs:
A Practitioners Study
Prepared by:
Helen Raikes, The Gallup Organization
K imber ly Boller and Welmoet vanKammen, Mathematica Policy Research
JeanAnn Summers, University of Kansas
Abbie Raikes, Debbie Laible, Br ian Wilcox, Lenna Ontai and Lanette Chr istensen, University of Nebraska
Mathematica Policy Research
with
The Ear ly Head Star t Father Studies Working Group, Ear ly Head Star t Research Consortium
THE GALLUP ORGANIZATION
The University of Nebraska-L incoln
August 20, 2002

FATHER INVOLVEMENT IN EARLY HEAD START PROGRAMS
1
������������� �� The findings reported here are based on research conducted under a grant from the Ford Foundation to Mathematica Policy Research. The research is part of a wider portfolio of studies being conducted within the national Early Head Start Research and Evaluation Project funded by the Administration on Children and Families (ACF), U.S. Department of Health and Human Services under contract to Mathematica Policy Research, Princeton, NJ, and Columbia University’s Center for Children and Families, Teachers College, in conjunction with the Early Head Start Research Consortium. The Consortium consists of representatives from 17 programs participating in the evaluation, 15 local research teams, the evaluation contractors, and ACF. Research institutions in the Consortium (and principal researchers) include ACF (Rachel Chazan Cohen, Judith Jerald, Esther Kresh, Helen Raikes, and Louisa Tarullo); Catholic University of America (Michaela Farber, Lynn Milgram Mayer, Harriet Liebow, Christine Sabatino, Nancy Taylor, Elizabeth Timberlake, and Shavaun Wall); Columbia University (Lisa Berlin, Christy Brady-Smith, Jeanne Brooks-Gunn, and Alison Sidle Fuligni); Harvard University (Catherine Ayoub, Barbara Alexander Pan, and Catherine Snow); Iowa State University (Dee Draper, Gayle Luze, Susan McBride, Carla Peterson); Mathematica Policy Research (Kimberly Boller, Ellen Eliason Kisker, John M. Love, Diane Paulsell, Christine Ross, Peter Schochet, Cheri Vogel, and Welmoet van Kammen); Medical University of South Carolina (Richard Faldowski, Gui-Young Hong, and Susan Pickrel); Michigan State University (Hiram Fitzgerald, Tom Reischl, and Rachel Schiffman); New York University (Mark Spellmann and Catherine Tamis LeMonda); University of Arkansas (Robert Bradley, Mark Swanson, and Leanne Whiteside-Mansell); University of California, Los Angeles (Carollee Howes and Claire Hamilton); University of Colorado Health Sciences Center (Robert Emde, Jon Korfmacher, JoAnn Robinson, Paul Spicer, and Norman Watt); University of Kansas (Jane Atwater, Judith Carta; and Jean Ann Summers); University of Missouri-Columbia (Mark Fine, Jean Ispa, and Kathy Thornburg); University of Pittsburgh (Beth Green, Carol McAllister, and Robert McCall); University of Washington School of Education (Eduardo Armijo and Joseph Stowitschek); University of Washington School of Nursing (Kathryn Barnard and Susan Spieker), and Utah State University (Lisa Boyce and Lori Roggman). Research reported in this report was carried out by the Father Studies Working Group, a sub group of the Early Head Start Research Consortium and includes, in addition to Consortium members, representatives from the National Institute of Health and Human Development (Natasha Cabrera and Michael Lamb); the Office of the Assistant Secretary for Policy and Evaluation, U.S. Department of Health and Human Development (Linda Mellgren); Head Start Bureau (Frankie Gibson and Gina Barclay-McLaughlin); and the University of Nebraska-Lincoln (Brian Wilcox). Researchers at the Center on Children, Families and the Law, University of Nebraska-Lincoln and The Gallup Organization, who gathered the data for the survey, are gratefully acknowledged. Additionally, members of the Father Studies Working Group, in addition to staff from Mathematica Policy Research and University of Nebraska-Lincoln, provided valuable assistance in conducting focus groups as follow up to the survey.
The authors wish to thank the Consortium reviewers who commented on earlier drafts of this manuscript under the guidelines of the Early Head Start Research Consortium publications polices. The content of this publication does not necessarily reflect the views or policies of the Ford Foundation or the U.S. Department of Health and Human Services, nor does mention of trade names, commercial products, or organizations imply endorsement.
FATHER INVOLVEMENT IN EARLY HEAD START PROGRAMS
2
���������
������������������������
Executive Summary 3
Introduction and Methodology 12
Introduction ...........................................................................................................................12 Early Head Start Program.....................................................................................................13 Context ....................................................................................................................................15 Focus on Fatherhood.............................................................................................................16 Early Head Start Father Studies...........................................................................................16 Practitioners Study Methodology..........................................................................................17 Practitioners Study Sample....................................................................................................19 Data Reduction.......................................................................................................................21 Practitioners Focus Groups..................................................................................................21
������������� �
Part I Father Involvement in Early Head Start Programs 22
1. Fathers of Early Head Start Children...............................................................................22 2. Features of Early Head Start Programs...........................................................................24 3. Goals of a Father Involvement Program..........................................................................27 4. Strategies for Becoming ‘Father Friendly’ ......................................................................30 5. Involvement of Fathers in Early Head Start Programs ..................................................32 6. Barriers to Father Involvement.........................................................................................36
Part II Practices of Successful Early Head Start Programs�
7. Dealing with Challenging Situations................................................................................38 8. Staffing and Training..........................................................................................................41 9. Recruiting Fathers.............................................................................................................44 10. Working with Nonresident Fathers.................................................................................47 11. Working within the Village...............................................................................................50 12. A Program As Much for Fathers.....................................................................................53
Recommendations for Father Involvement in Programs 55
References 59 Appendix A: Findings from the Focus Groups Appendix B: Survey Instrument Appendix C: Findings in Tabular Form

FATHER INVOLVEMENT IN EARLY HEAD START PROGRAMS
3
������������������A survey of all Early Head Start programs funded from 1995-1998 was conducted during the winter of 1999-2000. Program representatives from 261 programs completed the survey on the World Wide Web or by mail, for a 62.5% response rate. The survey was developed by building on lessons learned about program involvement of fathers from earlier qualitative and quantitative studies of program participation conducted by the Early Head Start Father Studies Working Group. Findings revealed variation among the programs with respect to the fathers served, goals for programs, program strategies for involving fathers, barriers, and the involvement of the fathers in the programs. Some of the variation occurred as a result of program stage of development. Our earlier work, following that of Levine et al. (1998), revealed that programs seem to pass through a predictable sequence of stages towards ever more complex and purposeful father involvement; we found strong evidence for this stage-like progression in the current study. Mature programs were characterized by greater father involvement, more goals and program activities for fathers, a different pattern of perceived barriers, more successful solutions to challenging situations, and greater likelihood of identifying staff for father involvement, providing father involvement training, recruiting using men; reaching out to nonresident as well as resident fathers and working with partners within the community than programs at large. To a lesser extent there was also variation as a result of program approach (whether serving families through home-based services; center-based services or a combination or mixed approach). Programs also varied according to the race/ethnicity of the families served, whether predominantly (50% or more) African American, Hispanic, white, Native American or families from a mixture of races and ethnic backgrounds, illustrating the importance of the cultural component of father involvement in programs. Many of the findings have implications for program practices.
�� ���� �!�� ���� �
The questions the study addressed are as follows. • Who are the fathers of Early Head Start children? What percent of the children
have resident and nonresident fathers? Do fatherhood populations differ according to race/culture, ages of families served, or by type of program?
FATHER INVOLVEMENT IN EARLY HEAD START PROGRAMS
4
• What are the characteristics of Early Head Start programs in the study? What percent of Early Head Start programs are mature in their father involvement efforts? What are the characteristics of mature programs?
• What are program goals for father involvement? Which fathers do programs aim
to include? How do program goals vary according to program maturity, race/ethnicity of families served and program approach?
• What types of strategies and activities do programs use to involve fathers? How
do strategies and activities vary according to program maturity, race/ethnicity of families served and program approach?
• How involved are fathers in Early Head Start programs? How do programs
recruit fathers to become involved? How does uptake of program offerings vary according to program maturity, race/ethnicity of families served and program approach?
• Who are the staff that carry out father involvement in programs? What kinds of
training do the persons responsible for father involvement receive? What training do all staff receive to build skills in father involvement? How do staffing and training vary according to program maturity, race/ethnicity of families served and program approach?
• What barriers do programs face in involving fathers? How do the programs work
through challenging situations to involve fathers? How does perception of barriers and success with challenging situations vary according to program maturity, race/ethnicity of families served and program approach?
• What are lessons for father involvement for early childhood programs of the
future? �
"�� � �
Building on growing interest and impetus for involving fathers in federal and other programs, the Early Head Start Father Studies Working Group launched a series of qualitative and quantitative studies related to fatherhood. One of these studies is the Practitioners’ Study that is specifically focused on how Early Head Start programs are working to involve fathers. This report presents findings from a survey of Early Head Start program practices in regards to father involvement. The survey was completed by 261 of 416 eligible Early Head Start Wave I through IV programs in the winter of 1999-2000 (response rate, 62.7%). Program representatives could choose whether to complete the survey over the World Wide Web (28.5%) or by paper (71.5%). Programs responding were diverse and ranged across all five funding waves (funded from 1995-1999); 3 program approaches (center-based; home-based and mixed); 5 ethnic/racial groups (predominantly African American; predominantly Hispanic; predominantly white; predominantly Native American; mixed racial/ethnic groups); rural and urban locations; and included high, middle and low percentages of teen parents served. Programs in the

FATHER INVOLVEMENT IN EARLY HEAD START PROGRAMS
5
study served 75 children on average. Follow-up focus groups (4) were conducted with program directors and father involvement coordinators to probe in areas where additional information was needed for a greater depth of understanding of program practices, e.g., working with nonresident and incarcerated fathers, working through challenging situations and stages of program development.
#�������� �
Most Ear ly Head Start children have either a father who lives with them or an involved nonresident father . In the typical Early Head Start program slightly fewer than half of the children have a resident father (44.6%). However, a number have involved nonresident fathers (24.9%). Most Early Head Start programs (73.7% of all programs) serve several children (3.6 on average) whose fathers are incarcerated. Slightly more than a third of the programs (37%) included at least one father who was the primary caregiver of his child/ren; 18 programs reported 3 or more custodial fathers. There is considerable var iation across programs in the population of fathers of Ear ly Head Star t children. Programs are likely to have different exper iences with father involvement due to var iability in the fatherhood population. Some programs serve a higher percentage of resident fathers. For example, home-based programs report that 48.8% of their children have resident fathers. Programs serving Hispanic families, 56.9%; those serving smaller proportions of teen parents, 47.2%, and those in rural areas, 46.6%, report more children with resident fathers than their counterparts. Other programs serve a higher percentage of involved, nonresident fathers. For example, programs serving African American children reported that 37.3% of their children had an involved, nonresident father; the percent of involved nonresident fathers was also higher in center-based programs (31.6%), among those serving a high proportion of teen parents (31.7%) and in urban areas (34.1%).
The programs themselves also vary. Most programs think of themselves as novices when it comes to father involvement (ear ly stage = 72%); some think they are somewhat more exper ienced (mid-stage = 21%) and a few regard themselves as exper ts in father involvement (mature = 7%). Mature programs were more likely to be found in among Wave I programs, to be serving African American families, to be slightly larger than the average program in the study and to be serving families with a higher proportion of nonresident fathers than other programs. Programs in early stages of father involvement were more likely to be in rural areas. Throughout the study we found highly significant differences according to stage in most father involvement practices.
Near ly all programs try to involve resident biological fathers (98.8%) and resident father figures (94.8%); however , there was more var iation when it came to intentions to involve nonresident fathers. A majority of all programs attempt to involve nonresident biological fathers (77.2%) and nonresident father figures (57.9%). Mature programs were more likely than others to try to involve these types of fathers. Mixed and home-based programs were significantly more likely to try to involve biological, resident fathers than was true for center-based programs while mixed and center-based programs
FATHER INVOLVEMENT IN EARLY HEAD START PROGRAMS
6
were significantly more likely to report they try to involve nonresident biological fathers, probably reflecting the different populations of fathers that home-based and center-based programs serve. Programs serving Native American families were least likely to say they served father figures, whether resident or nonresident, and programs serving African American families were more likely than other programs to report they served nonresident father figures.
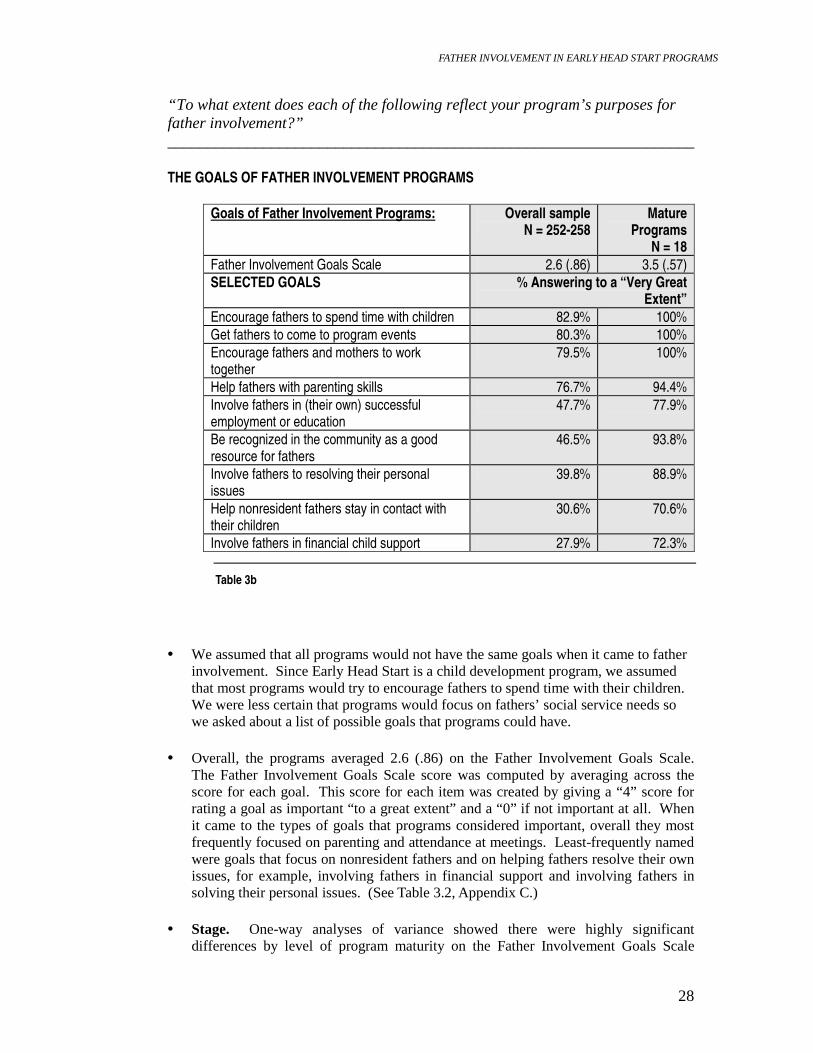
Programs vary in the types of goals they set for involving fathers. We asked about a wide spectrum of goals ranging from involving fathers with their children, with the program, and with mothers, and supporting the fathers in their own development, to providing leadership for father involvement program in the community. The most common goals across all programs were to encourage fathers to spend time with their children (named by 82.9% of all programs) and to come to program events (80.3%) and least common were to involve fathers in solving financial child support issues (27.9%); helping nonresident fathers stay in contact with their children (30.6%) and involving fathers in solving their own personal issues (39.8%).
• Mature programs more frequently named every goal and identified a broader array of
goals (as seen by higher scores on the Father Involvement Goals Scale). For example, 72.3% named as a goal to encourage financial child support; 70.6% to help nonresident fathers stay in contact with their children; and 88.9% to solve their own personal issues. A feature of maturity seems to be enhanced purpose about father involvement and a widening vision that focuses on the father’s needs and role as provider as well as on the father’s relationship to the child. Additionally, while mature programs want to “get the father to attend” the program, as is true for all programs, they have many goals for fathers that go beyond getting the father through the door.
• There were no differences by program or race/ethnicity with respect to goals for
father involvement with two exceptions. Mixed programs had higher Father Involvement Goals Scale scores and programs serving African American families were more likely to name enlisting the father in financial child support as a goal.
On average, Ear ly Head Star t programs reported they invite fathers to 13 of the 26 activities measured by our Father-Fr iendly Activities Scale. Most common activities were inviting the fathers to events planned for the family and ensuring that there is a place for the father’s name on enrollment forms. Least common were to include father involvement in appraisals of staff performance and to rely on fathers who had left the program to recruit new fathers.
• Not unexpectedly, there were large disparities between the practices of mature and
other programs. Mature programs reported they proffer 21 of the activities queried on average. Moreover, mature programs were from two to four times more likely than early-stage programs to complete a needs assessment for fathers; to engage fathers who had left the program to become mentors and recruiters; and to develop policies that make it clear the program is for fathers as much as for mothers.
• Mixed-approach programs proffered 15 father-friendly activities on average
compared to 12 for center-based and 13 for home-based. Mixed-approach programs
FATHER INVOLVEMENT IN EARLY HEAD START PROGRAMS
7
were more likely than other program types to help front-line staff with father involvement, to provide services for bi-lingual fathers and to obtain information about the father regardless of living arrangements; home-based and mixed programs were equally likely (and more than center-based) to refer fathers to other agencies and to draw the father in if he was hanging in the background of activities.
• There was not a difference by race/ethnicity on the Father-Friendly Activities Scale
but there were a number of differences in specific program activities offered to fathers by race/ethnicity. Programs serving African Americans were more likely to rely on male staff to recruit fathers and to complete a needs assessment; those serving Native Americans also were more likely to complete a needs assessment for fathers; to invite fathers to all events; to have a room or space just for fathers; and to hire male staff. Programs serving African Americans and Hispanics were more likely to allow staff time for outreach to fathers than other programs. As would be expected, programs serving mostly Hispanics and Native American families were most likely to provide bilingual services for fathers. Programs serving white and Hispanic fathers were more likely to send written materials to fathers than others.
Programs repor t a major ity of their resident fathers ever participated in the program but only about a quar ter were highly involved. Fewer nonresident fathers, about a third, were ever involved and fewer still, about a tenth, were highly involved. Mature programs reported nearly twice as many resident fathers highly involved as early-stage programs. There were no significant differences by stage in the proportion of nonresident fathers who participated or were highly involved. Both resident and nonresident were more likely to be reported as highly involved in programs serving Native American families than was true for any other racial/cultural group.
When it comes to participation in specific activities, we again found that par ticipation rates were low; the mean on the Father Uptake Scale showed that on average only “ a few” fathers attended most program activities and events. Programs reported highest father attendance for activities for all family members such as holiday parties, picnics, open houses; group parenting activities such as group socializations that involve mothers, fathers and children; attending home visits but not actually participating; and bringing and picking up children, in center-based care.
• Mature programs had much higher participation in all the activities on average than
mid-stage, in turn higher than for early-stage programs. Notably, mature programs achieved higher levels of involvement by involving many or most fathers in family activities; activities designed to improve parenting; and group parenting education activities such as group socializations.
• What appeals to fathers varies considerably by the race/culture of the fathers.
Programs serving Native Americans reported greatest success with overall turnout, boards, committees and participating in leadership such as Policy Council as well as attendance at events for the whole family, including socializations; programs serving African American fathers reported highest levels of involvement in “ for men only” groups and similar approaches; Hispanic fathers were reported as most responsive to group meetings that involved men and women together or were focused on language and literacy; while programs serving white fathers reported highest levels of
FATHER INVOLVEMENT IN EARLY HEAD START PROGRAMS
8
participation in home visits. Programs with a mixture of racial groups did not lead in father involvement in any areas, lending credence to the idea that fathers’ preferences in responding to program activities have cultural connections and suggesting that cultural homogeneity may contribute to father involvement.
Programs reported a number of bar r iers to involving fathers. Factors intrinsic to fathers (e.g., fathers’ work schedule; father doesn’ t live with the mother and child) were reported as greater barriers than barrier factors intrinsic to programs (e.g., program lacks male staff). The most frequently named barriers were fathers’ work schedules and mothers and fathers not living together.
• Mature programs perceived as many barriers intrinsic to fathers as all programs, but
as would be expected, fewer barriers intrinsic to programs. Mature programs were more likely than other programs to report substance abuse and two fathers in a child’s life as a barrier, possibly because of saliency of these issues due to increased efforts of mature programs to involve fathers despite difficult circumstances.
• Mixed and home-based programs were more likely to perceive domestic violence as a barrier than center-based programs, possibly due to difference in the populations that home-based and mixed-approach and center-based programs served.
• Programs serving Hispanic families perceived more barriers of many types; those
serving African American families most often reported the mother and father not getting along as a barrier; programs serving white families perceived not having male staff as a barrier more than other groups.
A number of program practices seem to be key to a father involvement program. Mature programs generally lead the way in modeling these practices. The following paragraphs are organized around the salient practices of mature programs. These items address the question: what are key practices of exemplary programs? It is hoped that identification of these practices will be helpful to early childhood programs seeking to implement father involvement components. Mature programs led the way in the following practices: • While Ear ly Head Star t programs have had some success involving some fathers
despite challenging situations, such as: when the mother and father are in conflict, when the father has been involved with domestic violence, when either the mother or the mother ’s family does not want the father involved with the child or the program, or when the father has been out of contact with the child for some time, mature programs are more often successful than other programs. Totaling across all challenging situations queried, mature programs were able to involve fathers in 47.1% (father out of contact) to 81.3% (mothers and fathers in conflict) of the challenging situations, demonstrating that it is possible to involve fathers despite difficult circumstances. These success rates were about double those for early- and mid-stage programs. Mature programs employed a variety of strategies beginning with communication and problem solving and turning also to working with separate caseworkers or to coordinate with other agencies to serve the father.
FATHER INVOLVEMENT IN EARLY HEAD START PROGRAMS
9
• Most, 82.4%, mature programs have designated day-to-day responsibility for father involvement to a specific individual in their agency. This compares to 62.3% for mid-stage programs and 24.9% for early stage programs. Among mature programs, 80.8% of the time, this person is a man. Rates of hiring a man were similar for mid-stage programs, 80.6%, but were much less frequent for early-stage programs, 33.3%. There were no differences by program approach in tendency of the program to hire a person to be in charge of father involvement but programs serving African American and Hispanic families were more likely than those serving other racial groups to have someone in charge of father involvement.
• Most, 88.9%, of mature programs have provided training for the father
involvement coordinator and for all staff, 77.8%, compared to 14.3% and 27.5% for early-stage and 62.3% and 60.4% for mid-stage programs who had provided these two forms of training. Mixed-approach and home-based programs were more likely than center-based programs to provide training on father involvement of both types.
• Most mature programs had hired male staff (83.3%), whereas only 40.1% of
ear ly-stage programs and 60.4% of mid-stage programs had done so. Moreover, mixed-approach and home-based programs were almost twice as likely to have hired male staff as center-based programs.
• Mature programs rely on men for outreach to a far greater extent than is true
for other programs. Slightly more than a third of programs recruit using fathers in the program to recruit more fathers (38.9%), or recruit through males in the community (17.5%), while these two forms of recruitment were employed by 82.4% and 73.3% of mature programs. Mature did not stand apart from other programs in the likelihood to rely on mothers to recruit, suggesting that what distinguishes the mature program is reliance on male networking to bring fathers to the program. Mixed-approach and programs serving Native American families led in outreach activities. Programs serving African American families were most likely to recruit through males in the community but also were more likely to recruit by working with the mother than other groups.
• Mature programs were also likely to use a wider var iety of strategies to involve nonresident fathers than was true for programs at large. Mature programs were equally as likely as other programs to discuss the situation in regards to a nonresident father with the mother, but mature programs were generally twice as likely to issue invitations to fathers by phone; using the mail or in person. There were some differences by program approach and race/ethnicity in strategies to involve nonresident fathers. Home-based programs were more likely to conduct home visits, mixed-approach programs, to have compiled a list of nonresident fathers and center-based programs, to do “nothing” to involve nonresident fathers. Programs serving Hispanic and African American families were most likely to invite nonresident fathers to events by mail while programs serving white fathers were most likely to mail progress notes to nonresident fathers. Programs serving Native American and mixed racial groups had the fewest strategies for involving nonresident fathers.
FATHER INVOLVEMENT IN EARLY HEAD START PROGRAMS
10
• Mature programs were more likely to reach out to incarcerated fathers. Of mature programs, 40.0% (vs. 20.0% mid-stage and 4.6% of early-stage programs) reported making a strong effort to involve incarcerated fathers. We reported earlier that that 73.7% of all programs included at least one father who was incarcerated. Mature programs were significantly more likely than others to visit fathers in prison (26.7% vs. 8.6% of mid-stage programs vs. 0% early- stage). No programs serving Native American families reported making a strong effort to reach out to incarcerated fathers. Mixed-approach and programs serving African American families were more likely to make a strong effort to reach out to incarcerated fathers than other types of programs, though the differences were not significant.
• Mature programs modeled collaboration for father involvement within their
communities, another hallmark of father involvement program matur ity. For example, 50.0% of mature programs vs. 28.0% of early-stage programs and 43.4% of mid-stage programs reported a relationship with local child support enforcement officials. Of mature programs, 93.8% said they wanted to be recognized in their communities as an important resource for fathers, nearly twice as many as for other programs (38.4% of early-stage and 59.6% of mid-stage programs).
• When we asked programs which of their program activities had been the biggest
success for their overall program development, noteworthy were how many mature programs said creating an image that the program is as much for fathers as for mothers. Thus, we identified this as the key, salient change that moves a program from early stages of father involvement to maturity. Nearly all mature programs (94.4%) reported they had developed such an image compared to about half (52.7%) of early-stage and about two-thirds (67.9%) of mid-stage programs.
������������� �$������ ������������������������%���������&����� �
Many lessons were learned from the study about the ingredients for success in father involvement programs Many of the lessons have been learned from mature programs, that have worked through some of the “bugs” of father involvement; others come from considering lessons from programs serving differing racial/cultural groups of fathers and still others can be gleaned by studying the patterns of father involvement from programs following different approaches for carrying out their services.
Implications for programs include:
1. Identify purposes for a father involvement program. 2. Think about the case management needs of fathers as well as of the mothers and
babies. Conduct needs assessments with fathers. 3. Hire a father involvement coordinator. 4. Hire men as program staff. 5. Train the father involvement coordinator. 6. Train all staff to work with fathers. 7. Identify and work through barriers. It is possible to involve many fathers despite
barriers.
FATHER INVOLVEMENT IN EARLY HEAD START PROGRAMS
11
8. Work with nonresident as well as resident fathers. 9. Recruit fathers in many ways, through men as well as mothers. 10. Develop strategies for working through challenging situations. 11. Work within the community. Form collaborations with child support and TANF
administrators and many other community collaborators. 12. Conduct many activities to become father friendly, from inviting fathers to events
in multiple ways and including fathers names on all materials to making the environment father friendly.
13. Form a program image that demonstrates the program is as much for fathers as for mothers and children.
14. Recognize that different cultural groups will have different ways to reach out to and include fathers. If the program serves mixed racial groups, recognize that father involvement will be more challenging and attempt to reach out to fathers through cultural subgroup channels, building towards more pluralistic involvement.
15. If the program is center-based, increase father involvement efforts. If the program is home-based, build on tendencies of fathers to show interest in home visit and group socializations. If the program is a mixed-approach program, consider alternative ways of involving fathers in all program services.
16. Early stage programs should follow the example of mature programs, but also recognize and appreciate the developmental aspects of father involvement and that it takes time to build a father involvement component. With time, however, quite high degrees of father involvement are possible.
By 2000, Early Head Start programs had made important strides in the area of father involvement. Continued growth is expected as programs build on the lessons learned from the current study, from their own natural desire to improve program practices and from lessons of the 21 Early Head Start Fatherhood Demonstration sites, a study that is following the current study.
FATHER INVOLVEMENT IN EARLY HEAD START PROGRAMS
12
Introduction and Overview
���������������"�� ������Building on growing interest and impetus for involving fathers in federal and other
programs, the Early Head Start Father Studies Working Group launched a series
of qualitative and quantitative studies related to fatherhood. One of these studies is
the Practitioners Study that is specifically focused on father involvement in the
Early Head Start program. This report presents findings from a survey of Early
Head Start father involvement program practices. The survey was completed by
261 of 416 eligible Early Head Start Wave I through IV programs in the winter of
1999-2000 (response rate, 62.5%). Program representatives could choose whether
to complete the survey over the World Wide Web (28.5%) or by paper (71.5%).
Programs responding were diverse and ranged across all five Early Head Start
funding waves (funded from 1995-1999); 3 program approaches (center-based;
home-based and mixed); 5 ethnic/racial groups (predominantly African American;
Hispanic; white; Native American; mixed); rural and urban locations; and
included high, middle and low proportions of teen parents served. Programs in the
study served 75 children on average. Follow-up focus groups (4) were conducted
with program directors and father involvement coordinators to probe in areas
where additional information was needed, e.g., working with nonresident and
incarcerated fathers, working through challenging situations and stages of
program development.
������������
Responding to a need for services for infants and toddlers, Congress passed the Head Start reauthorization Act of 1994, mandating new Head Start services for low-income pregnant women and families with infants and toddlers. Following the 1998 Head Start reauthorization, the resulting Early Head Start Program has expanded to include nearly 700 programs across the 50 states, the District of Columbia, and Puerto Rico. The program aims to enhance children’s physical, social, emotional, and cognitive development as well as to enable parents to meet their own goals while becoming better caregivers and teachers of their children. To this end, the Early Head Start Program supports the highest level of parent involvement and partnership, making a special effort to support the role of fathers in the lives of their children and families.
FATHER INVOLVEMENT IN EARLY HEAD START PROGRAMS
13
As Early Head Start continues to expand, many programs are searching for better ways to increase the connection between fathers and their children. The importance of father involvement in the lives and education of their children has been illustrated by a growing volume of research (Tamis-LeMonda and Cabrera 2002; Levine 1998; McBride, B., Rane, T.R., & Bae, J. 1999; Nord, C.W., Brinhall, D. & West, J. 1997). Additional studies have helped to identify the potential role of early education programs, such as Early Head Start, in promoting such father involvement. One recent study by Fagan and Iglesias (1999) suggests a positive association between high levels of participation of fathers in Head Start-based intervention programs and increased father involvement with children. An Urban Institute study (Sorensen, Mincy and Halpern, 2000) reported that fathers in “ fragile families,” families in which mothers and fathers were not married, were most likely to be present around the birth of the child and more likely to disappear as children grew older. These strands of findings, taken together, make apparent the potential of Early Head Start programs for increasing father involvement in children’s lives. However, relatively little is known about the most effective methods of engaging fathers and encouraging responsible parenting within the Early Head Start setting. Moreover, few studies have been completed that focus on the most effective strategies for involving fathers of very low-income infants within an intervention program. Thus, a study that identifies effective practices for father involvement has potential implications beyond Early Head Start, for early childhood programs serving infants and toddlers as well as for the wider array of Head Start programs.
The current report addresses the questions: What do we know about father involvement in Early Head Start programs (types and percentages of fathers involved, activities, barriers, aims, staffing, and successes)? What are effective practices to recommend to Early Head Start, Head Start and other early childhood programs? It reports from a survey of 261 Early Head Start programs conducted in the winter of 1999/2000 and from follow-up focus groups conducted in 2000.
� ��������%���������&������
The Carnegie Corporation of New York report, Starting Points: Meeting the Needs of Our Youngest Children (1994) showed that large numbers of infants and toddlers are starting life in poor environments, without adequate stimulation, and without sufficient interactions with caring, responsive adults. The release of Starting Points followed closely on a comprehensive self-examination of Head Start services conducted by the Advisory Committee on Head Start Quality and Expansion. This committee called for Head Start programs to improve their quality, address the fragmentation of services by forging new partnerships, and expand services in a number of ways, including serving more families with infants and toddlers (U.S. Department of Health and Human Services 1993). Subsequently, the Head Start Authorization Act of 1994 mandated new Head Start services for families with infants and toddlers, authorizing 3 percent of the total Head Start budget in 1995, 4 percent in 1996 and 1997, and 5 percent in 1998 for these services (U.S. Department of Health and Human Services 1994). The Coates Human Services Reauthorization Act of 1998 further expanded the
FATHER INVOLVEMENT IN EARLY HEAD START PROGRAMS
14
program, setting aside 7.5 percent of Head Start funds in 1999, 8 percent in 2000, and 10 percent in 2001 and 2002 for Early Head Start programs. In 1994, Donna Shalala, Secretary of the U.S. Department of Health and Human Services, created the Advisory Committee on Services for Families with Infants and Toddlers, which provided the guidelines for the new Early Head Start program. The report of the Advisory Committee set forth a vision and blueprint for Early Head Start programs and established principles and cornerstones for the new program (U.S. Department of Health and Human Services 1994).
Early Head Start programs are comprehensive child development programs. The Advisory Committee on Services for Families with Infants and Toddlers envisioned a two-generation program that included intensive services beginning before the child is born and concentrating on enhancing the child’s development and supporting the family during the critical first three years of the child’s life. The Advisory Committee recommended that programs be designed to produce outcomes in four domains:
• Child development--(including health, resiliency, and social, cognitive, and language development).
• Family development--(including parenting and relationships with children, the home environment and family functioning, family health, parent involvement, and economic self-sufficiency).
• Staff development--(including professional development and relationships with parents).
• Community development--(including enhanced child care quality, community collaboration, and integration of services to support families with young children).
The program guidelines specify that grantees may design programs that achieve these outcomes by providing home-based services, providing center-based child development services, combining these approaches, or implementing other locally designed options.
The first wave of grantees—68 programs—was funded in September 1995. Another 75 programs were funded in September 1996, and in subsequent years additional funding brought the total to almost 664 programs serving almost 60,000 infants and toddlers and their families today. Not only was the development of the overall Early Head Start program dramatic, this development took place within a changing context that we discuss below.
Head Start/Early Head Start provides an infrastructure that helps to shape the programs, including (1) the revised Head Start Program Performance Standards, (2) ongoing program monitoring, and (3) a training and technical assistance network to support programs in achieving full implementation and quality.
Early Head Start programs follow and are monitored according to the Head Start Program Performance Standards, an elaborate system of standards developed with input from a wide range of experts in early childhood, health and related areas. Full implementation of the performance standards has been shown to
FATHER INVOLVEMENT IN EARLY HEAD START PROGRAMS
15
predict child development and family outcomes in Early Head Start research programs (ACYF 2001a; ACF 2002). Head Start Bureau monitoring teams visit programs every three years to verify compliance with program standards and the revised Head Start Program Performance Standards.
Infancy-oriented training and technical assistance is led through the Early Head Start National Resource Center, which provides ongoing support, training, and technical assistance to all waves of Early Head Start programs under a contract with Zero to Three. General and more extensive training and technical assistance are provided by regional training grantees--the Head Start Quality Improvement Centers (HSQICs) and the Head Start Disabilities Quality Improvement Centers (DSQICs)--and with their infant-toddler specialists, as well as the 10 U.S. Department of Health and Human Services Regional Offices and Indian and Migrant branches that assumed responsibility for administrating Early Head Start grants.
������������ ��� ���$��������������� �� ���&����� ���������
Several broad social changes and contextual factors influence early childhood programs, and may have implications for father involvement in these programs: (1) increasing recognition of the importance of early childhood development including pre-kindergarten initiatives in states; (2) welfare reform; and (3) growing attention to the roles of fathers in young children’s lives.
Recent research verifies the importance of the early years and supports the importance of early childhood development programs. First, national attention focused on early brain development in spring 1997, when the White House convened the Conference on Early Childhood. Next, the increasing focus on services that start when women are pregnant and focus directly on child development gained the attention and support of policymakers, program sponsors, and community members. Recognizing the importance of early childhood education for school readiness, many states now provide funds for a pre-kindergarten program or have a school funding mechanism for 4-year-olds. Thus, there is widespread belief that early childhood programs have the potential to enhance school readiness. Taking together what we know about the importance of early childhood programs and about father involvement and children’s development, it is reasonable to think that increasing fathers’ involvement through early childhood programs would contribute to even greater gains for their children. The Personal Responsibility and Work Opportunity Reconciliation Act of 1996 (PRWORA), which became effective just as Early Head Start began serving families, reformed federal welfare policy and established clear expectations for families receiving welfare. For delivery of program services, PRWORA created a climate different from the one many early childhood programs had operated within prior to its existence. The new work requirements and time limits on cash assistance have increased demands on parents’ time, increased their child care needs, increased stress for some families, and made it more difficult for parents to participate in some program services (ACYF 2000). The new requirements also have made some parents more receptive to employment-related and child
FATHER INVOLVEMENT IN EARLY HEAD START PROGRAMS
16
care services and motivated them to find jobs and work toward self-sufficiency. The requirements also required biological parents not living with their children to provide child support.
� �������������� ������� �� ���
Today, policymakers, researchers, and educators are adopting a new, more explicit focus on fathers. Fathers are key partners in contributing emotional and economic support for the development of their children. As a consequence, to promote the positive involvement of fathers in the lives of their children, federal agencies are increasingly developing and enhancing fatherhood policies. The federal Fatherhood Initiative was galvanized by former President Clinton’s request for federal agencies to assume greater leadership in promoting the involvement of fathers and focusing on their contributions to their children’s well-being. The activities of this initiative have involved the White House, several key federal statistical agencies, the Family and Child Well-Being Research Network and the National Center on Fathers and Families. Together, they have created a national momentum for reconceptualizing the way fathers are incorporated into policies and programs. They also have set forward a research agenda that will improve federal data on fathers and will support the development of policies and programs that recognize the emotional, psychological, and economic contributions that fathers can make to the development of their children.
The growing attention to the roles of fathers has led some programs to devote more attention to strengthening fathers’ relationships with their children and enhancing their parenting skills. To support these growing efforts and to build father involvement among fathers of infants, the Head Start Bureau and the Office of Child Support Enforcement have jointly funded 21 Early Head Start fatherhood demonstration grants (ACYF 2002c)1. Father involvement is a priority initiative identified by Assistant Secretary Wade Horn, Administration on Children and Families, U.S. Department of Health and Human Services.
������%������������ �������� �
The current study is referred to as the Early Head Start Father Studies Practitioners Survey. It is one of a number of studies being carried out under the umbrella of the overall Early Head Start Research and Evaluation Project2 which includes a national evaluation of program implementation and impacts, and local research. Supported by the Administration on Children, Youth and Families, the
1 The evaluation is being conducted by Mathematica Policy Research, and lessons learned from this study will augment and extend upon findings reported here. 2 The Early Head Start Research and Evaluation Project has produced a number of national reports. These reports may be found at www.mathematica-mpr.com
FATHER INVOLVEMENT IN EARLY HEAD START PROGRAMS
17
national evaluation is being conducted by Mathematica Policy Research in conjunction with Columbia University Center for Children and Families and the Early Head Start Research Consortium. Data for the overall study are being collected in 17 research sites using an experimental design in which approximately 3000 program families were randomly assigned to either a program or control group. In 1997, Father Studies were added to the research effort.
Father Studies in Early Head Start have been supported by the Ford Foundation; the National Institute of Child Health and Human Development; the Administration on Children, Youth and Families; and the Office of the Assistant Secretary for Planning and Evaluation, U.S. Department of Health and Human Services. The Father Studies Working Group coordinates Father Studies in Early Head Start. The elements of Father Studies in Early Head Start include: • Surveys with fathers, including qualitative and quantitative questions, when
children are 24 and 36 months of age. These surveys are conducted in 12 Early Head Start sites and include approximately 800 fathers.
• Videotaped assessments of father-child interaction in 7 sites when children are 24 and 36 months of age.
• Follow-up interviews with fathers and videotaped assessments in 12 sites, immediately prior to children’s entry to kindergarten (this data collection is still underway).
• Interviews and videotaped assessments with fathers and mothers and infants with fathers of newborns, when children are 3, 6, 14, 24, and 36 months of age, begun with approximately 200 children and fathers.
• The EHS practitioners study includes: (1) focus groups with fathers, mothers and staff in four EHS research sites in 1997; (2) a survey completed by EHS research program directors in 1997; (3) focus groups with EHS and HS fathers in 1999; (3) in-depth study of father involvement in one site in 1999 and 2000; and (4) the survey of all EHS Wave I through Wave IV programs with focus group follow up in 1999-2000.
From the qualitative studies in four sites, the Father Studies Working Group learned about: (1) barriers to father involvement, (2) the activities programs were initiating, (3) the extent of father involvement, and (4) to a few recommended practices. Next, from the in-depth study in one site we learned about stages in developing a father involvement program. From the fathers we learned how important their children were to them, about how they felt about support, and in some cases about how they viewed Early Head Start and Head Start in their lives. The many lessons were applied to the Practitioners Survey and follow-up focus groups.
&����������� �����'��"�� ������
The current report presents findings from the Practitioners Survey conducted in late 1999 and early 2000. We broadened our focus to survey the wider field of Early Head Start programs in order to learn about some of the most innovative practices in father involvement. A questionnaire was developed using the survey conducted in 1997 as a basis while also building on the many lessons we had

FATHER INVOLVEMENT IN EARLY HEAD START PROGRAMS
18
learned since that initial survey. The questionnaire was designed to answer the following questions:
• Who are the fathers of Early Head Start children? What percent of the
children have resident and nonresident fathers? Do fatherhood populations differ according to race/culture, ages of families served, or by type of program?
• What are the characteristics of Early Head Start programs in the study? How many Early Head Start programs are mature in their father involvement efforts? What are the characteristics of mature programs?
• What are program goals for father involvement? Which fathers do programs
aim to include? How do program goals vary according to program maturity, race/ethnicity of families served and program approach?
• What types of strategies and activities do programs use to involve fathers?
How do strategies and activities vary according to program maturity, race/ethnicity of families served and program approach?
• How involved are fathers in Early Head Start programs? How do programs
recruit fathers? How does uptake of program offerings vary according to program maturity, race/ethnicity of families served and program approach?
• Who are the staff that carry out father involvement in programs? What kinds
of training do the persons responsible for father involvement receive? What training do all staff receive to build skills in father involvement? How do staffing and training vary according to program maturity, race/ethnicity of families served and program approach?
• What barriers do programs face in involving fathers? How do the programs
work through challenging situations to involve fathers? How does perception of barriers and success with challenging situations vary according to program maturity, race/ethnicity of families served and program approach?
• What are lessons for father involvement for early childhood programs of the
future?
The survey we report about here was conducted with the support and partnership of the National Head Start Association and the National Center for Strategic Nonprofit Planning and Community Leadership (NPCL). Following the guidance of Dr. Ron Mincy, of the Ford Foundation, other father involvement leadership organizations were contacted and these persons provided feedback on the questionnaire and our data collection approach. ZERO TO THREE provided a data file of all wave 1 through 5 Early Head Start programs. Mathematica Policy Research subcontracted with members of the Father Studies Working Group to carry out this type of survey. The University of Nebraska-

FATHER INVOLVEMENT IN EARLY HEAD START PROGRAMS
19
Lincoln, in partnership with the Gallup Organization, Lincoln, NE, conducted the survey.
In November of 1999, a letter was mailed to programs inviting them to participate in the study. This letter was sent from the Fatherhood Partnership, including the National Head Start Association and NPCL. The letter also gave participants a choice between returning the paper survey that was enclosed in their envelope or to complete a web-based survey. The letter provided each participant with a unique PIN number for accessing the web survey.
Respondents who did not immediately return surveys received reminder post cards. Several weeks later, non-respondents were telephoned. Participants in the Early Head Start Institute, January 2000, were given opportunities to complete the survey at the conference. Questionnaires were mailed a second time and follow-up calls were also conducted a second time. A data file was formed by combining all the web-based and paper-based surveys. Descriptive analyses and comparisons of means or Chi-Square analyses were conducted.
&����������� �����'�����(���
Total Pro-grams
Center-Based
Home-Based Mixed
African-
American
Hispanic White
Native
American
Mixed Racial
Groups
261
100%
65
25.7%
93
36.8%
95
37.5%
58
22.7%
33
12.6%
113
44.3%
11
4.3%
40
15.3%
Table i
The current report presents findings from the Practitioners Survey conducted in late 1999 and early 2000. For this study we broadened our focus from the 17 research sites to survey the wider field of all Early Head Start programs providing services to families at the time. Altogether, 422 surveys were mailed to EHS programs. Of these, 261 surveys were completed. Of the 422 surveys that were mailed to the Early Head Start programs, six were program duplicates or involved programs that notified us they were not serving families. Thus, of the 416 eligible programs, the 261 completed surveys resulted in a 62.5% response rate. Altogether, 28.5% of respondents completed the web-based survey and 71.5% completed the paper survey. It was reasonable to think that programs that had been funded longer and had more time to establish a father involvement program might be more likely to respond, but this was not the case. Response rates by wave were as follows: for Wave I (funded in 1995) 58.7% response rate; for Wave II (funded in 1996) 56.3% response rate; for Wave III (funded in 1997) 53.1% response rate; for
FATHER INVOLVEMENT IN EARLY HEAD START PROGRAMS
20
Wave IV (funded in 1998) 47.5% response rate and for Wave V (funded in late 1998) 59.8% response rate. When programs were identified with more than one wave, they were affiliated with the wave in which they were first funded for our analyses.
The programs also represented a range of program approaches. As we have noted, Early Head Start programs may adopt a center-based approach, home-based approach, a combination of the two or a locally designed option. In our sample, 65 (25.7%) identified themselves as center-based; 93 (36.8%) as home-based and 95 (37.5%) as combination or locally designed option programs, and which we are labeling “mixed” programs. (Table 2, Appendix A). The proportion of programs reporting specific approaches is similar to those reported in the 17 research sites when measured in 1997 (Administration on Children, Youth and Families, 2001); research programs at that time were identified as 23.5% center-based programs, 41.2% home-based and 35.3% mixed approach programs. The research sites evolved towards a greater likelihood of being mixed approach programs by 1999 when 23.5% were center-based; 11.8% home-based and 64.7% were mixed approach programs.
The Early Head Start programs in our sample varied substantially according to the racial composition in the communities they serve. About a quarter (22.7%) of the programs reported that they serve families that are predominantly African American; 12.6% of the programs serve a majority of Hispanic families; 44.3%, predominantly Caucasian families; 4.3%, a majority of Native American families; and 15.3% serve a mixture of racial groups. These figures are fairly similar to those of all Early Head Start Wave I and Wave II research programs (ACYF 1999a, 1999b, 2000). Since we were interested in determining if the programs served a majority of representatives of a cultural group to determine if there might be cultural differences in program practices, our figures are slightly different from reports asking about total families across all programs. For example, we report a lower percentage of African American and Hispanic families in our breakdown of programs than is found in the Wave I and Wave II research sites at the level of families (ACYF 1999a). It is possible that there were African American and Hispanic families included in programs that were serving a majority of Caucasian families and in the mixed racial group programs. It is also possible that not as many providers of services to African-American and Hispanic families returned our survey. Nonetheless, we have a good array of programs serving diverse racial groups within this study.
The Early Head Start programs in the study were serving families in a wide variety of community settings: 61.3% of the programs reported they served families in rural communities; 52.9% reported serving families in small towns or cities. Fewer served families in medium-sized cities (21.5%) and large cities (25.3%). Collapsing to achieve non-overlapping groups, 184 (70.5%) of the programs either served families in rural areas (rural and small towns) and only 77 (29.5% of our sample) served families in urban areas.
Programs also vary in the extent to which they serve parents who are teenagers. By program report, in the majority of programs (71.5%) fewer than a quarter of the parents are teens. However, in 17.4% of the programs between a quarter and
FATHER INVOLVEMENT IN EARLY HEAD START PROGRAMS
21
half of the parents are teens and in 11.1% of the programs more than half of the parents are teenagers. Programs varied somewhat in the number of children served. The average program in this study served 75.4 children.
�������������'������� �������(��$�����������!�� ���� �
To reduce the data, we created scales or subscales that produce a program father involvement scale score wherever possible. Findings from these scales are included in appropriate sections of the report. (See Table i.1, Appendix C for a complete list of scales created from the Practitioners Survey.) We describe the scales more completely in appropriate sections of the report.
� ��&����������� ����� �)���( ����
Four focus groups were held in January 2000, during the annual Early Head Start and Child Care Institute for Programs serving Families with Infants and Toddlers. These focus groups were intended to gain in-depth understanding of program practices that could not be fully explored through the questionnaire. Focus groups were scheduled on the following topics: • What are the practices of mature programs?
• What are the practices of programs just beginning father involvement efforts?
• What are program practices for engaging nonresident fathers?
• What are program practices for engaging incarcerated fathers?
On the Practitioners Survey, we asked if the respondent would be attending the Institute and if the respondent would be willing to participate in a focus group to discuss father involvement practices. From respondents who expressed willingness to participate and a few others who heard about the focus groups during the Institute, we were able to recruit approximately 30 participants for focus groups. Participants included program directors and father involvement coordinators or their representatives. The focus groups were tape-recorded and following the focus groups, leaders and recorders debriefed to identify key themes. The tapes were transcribed and Dr. Jean Ann Summers, a member of the Father Studies Working Group with expertise in qualitative analysis, summarized themes and illustrations of each theme from across the focus group transcriptions and the debriefing sessions. (See Appendix A for a list of themes and examples from the focus groups.) Focus group findings are presented throughout this report where appropriate.
FATHER INVOLVEMENT IN EARLY HEAD START PROGRAMS
22
Detailed Findings
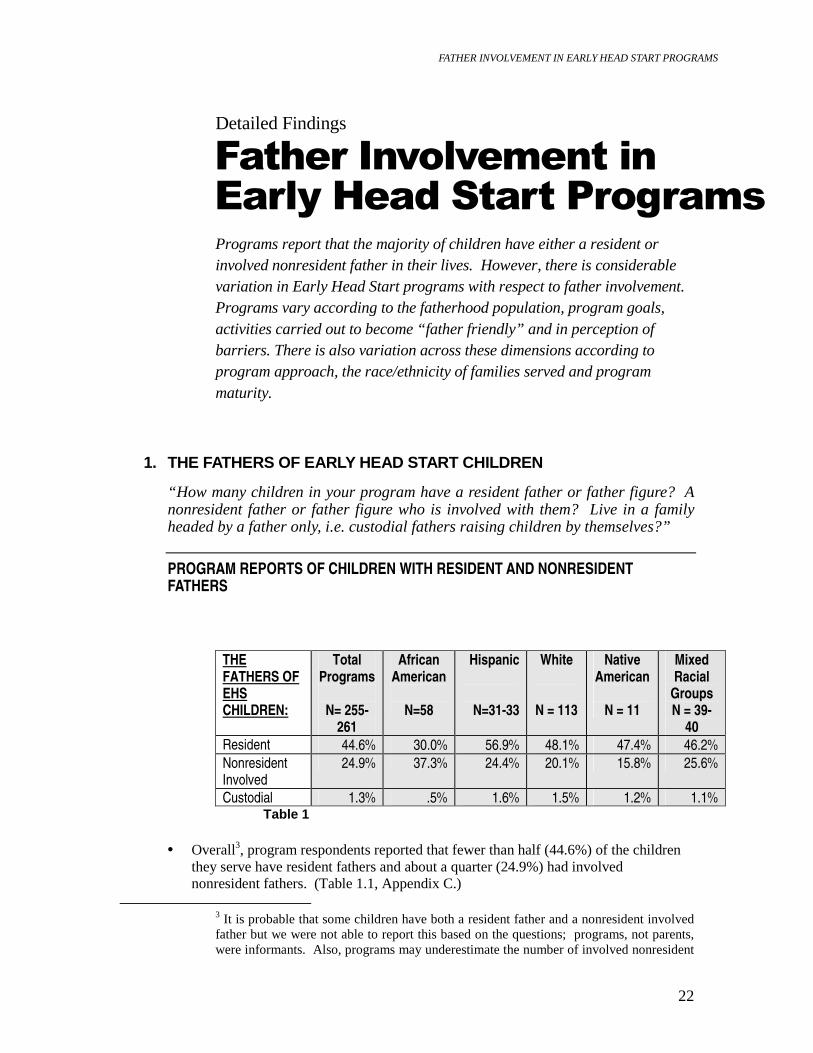
��� ������������������������%���������&����� �Programs report that the majority of children have either a resident or involved nonresident father in their lives. However, there is considerable variation in Early Head Start programs with respect to father involvement. Programs vary according to the fatherhood population, program goals, activities carried out to become “ father friendly” and in perception of barriers. There is also variation across these dimensions according to program approach, the race/ethnicity of families served and program maturity.
1. THE FATHERS OF EARLY HEAD START CHILDREN
“ How many children in your program have a resident father or father figure? A nonresident father or father figure who is involved with them? Live in a family headed by a father only, i.e. custodial fathers raising children by themselves?”
PROGRAM REPORTS OF CHILDREN WITH RESIDENT AND NONRESIDENT FATHERS
THE FATHERS OF EHS CHILDREN:
Total Programs
N= 255-
261
African American
N=58
Hispanic
N=31-33
White
N = 113
Native American
N = 11
Mixed Racial
Groups N = 39-
40 Resident 44.6% 30.0% 56.9% 48.1% 47.4% 46.2% Nonresident Involved
24.9% 37.3% 24.4% 20.1% 15.8% 25.6%
Custodial 1.3% .5% 1.6% 1.5% 1.2% 1.1% Table 1
• Overall3, program respondents reported that fewer than half (44.6%) of the children they serve have resident fathers and about a quarter (24.9%) had involved nonresident fathers. (Table 1.1, Appendix C.)
3 It is probable that some children have both a resident father and a nonresident involved father but we were not able to report this based on the questions; programs, not parents, were informants. Also, programs may underestimate the number of involved nonresident

FATHER INVOLVEMENT IN EARLY HEAD START PROGRAMS
23
• Race/Ethnicity. In programs serving African American families, almost a third of
the children (30.0%) were reported to have resident fathers while slightly more of the children (37.3%) were reported to have involved nonresident fathers. Programs in which over half of the families were Hispanic reported that a majority of their children had resident fathers (56.9%) while only 24.4% had involved nonresident fathers. Programs with a majority of Caucasian families reported slightly fewer than half of their children had a resident father (48.1%) and about a fifth (20.1%) had an involved, nonresident father. When it came to the 11 programs serving a majority of Native American families, fewer than half of the children (47.4%) were reported to have a resident father and fewer than had fifth (15.8%) had a nonresident involved father, the lowest proportion of involved nonresident fathers among the subgroups in the sample. Programs serving a mixture of racial groups reported 46.2% with resident fathers and 25.6% with a nonresident father.
• Program Approach. Home-based programs reported that 48.8% of their children
had resident fathers while only 18.9% had involved nonresident fathers. Center-based programs reported fewer children who had resident fathers (39.4%) and more with involved nonresident fathers (31.6%). Mixed programs that provide both home-based and center-based services were between home-based and center-based in proportions of resident (43.7%) and nonresident fathers (26.3%).
• Programs Serving Teen Parents. Programs serving a majority of teen parents also
reported less father involvement in children’s lives. Only about a third of children in these programs serving a majority of teens had resident fathers (32.6%); about a third had non-resident involved fathers (31.7%).
• Programs Serving Families in Rural and Urban areas. Programs serving families
in rural areas reported greater involvement of resident fathers in children’s lives than was true for programs in urban programs. Programs in rural areas reported 46.6% resident fathers, while urban programs reported 39.3% resident fathers. In rural areas, 21.5% of the children were reported to have nonresident involved fathers, while 34.1% of children in urban areas were reported to have nonresident involved fathers.
• Programs Serving Fathers Who Are Incarcerated. Most Early Head Start
programs (73.7% of all programs) have some children whose fathers are incarcerated. The average number of children with incarcerated fathers within these programs was 3.6; however, 12 programs had 10 or more children whose fathers were incarcerated.
• Programs Serving Custodial Fathers. Slightly more than a third (37% of all the
programs) served fathers who are the primary caregivers of their children. Most reported only one or two custodial fathers (1.2 on average), but 18 programs reported 3 or more.
fathers and may not be probing to learn about these men. Assessments obtained from interviewing mothers at the time of enrollment in the Early Head Start Research and Evaluation Project showed a slightly higher percentage of children with resident/nonresident involved fathers (86%) (ACYF, 1999) than reported here.

FATHER INVOLVEMENT IN EARLY HEAD START PROGRAMS
24
2. STAGES OF FATHER INVOLVEMENT
” Programs seem to pass through stages in their evolution towards becoming father friendly. Where is your program? Stage I. Little, if any thought has been given to the unique issues of involving any parent beyond the mother. Stage II. Some fathers are involved and some thought and effort have gone into father involvement. Most program activities revolve around women and children. Stage III. Program has developed ways to increase its attention to father involvement and has begun to show a concerted effort. Some exciting and promising changes are occurring as more staff and parents gain a sense of how to make the program father friendly. A father involvement coordinator may have been hired and that person does a good job of keeping other staff aware of father involvement. Stage IV. Many changes have been made in making the program father friendly. Father involvement now focuses on applying all program activities to fathers. Many resident fathers are now involved in the program and some nonresident fathers are involved. Stage V. Most resident fathers are involved in the program on at least a monthly basis. The program offers a great variety of father involvement activities. Many nonresident fathers are involved.” In the presentation in following sections, we often present data for all programs and those for mature programs in text tables to illustrate how mature programs stand apart from other programs.
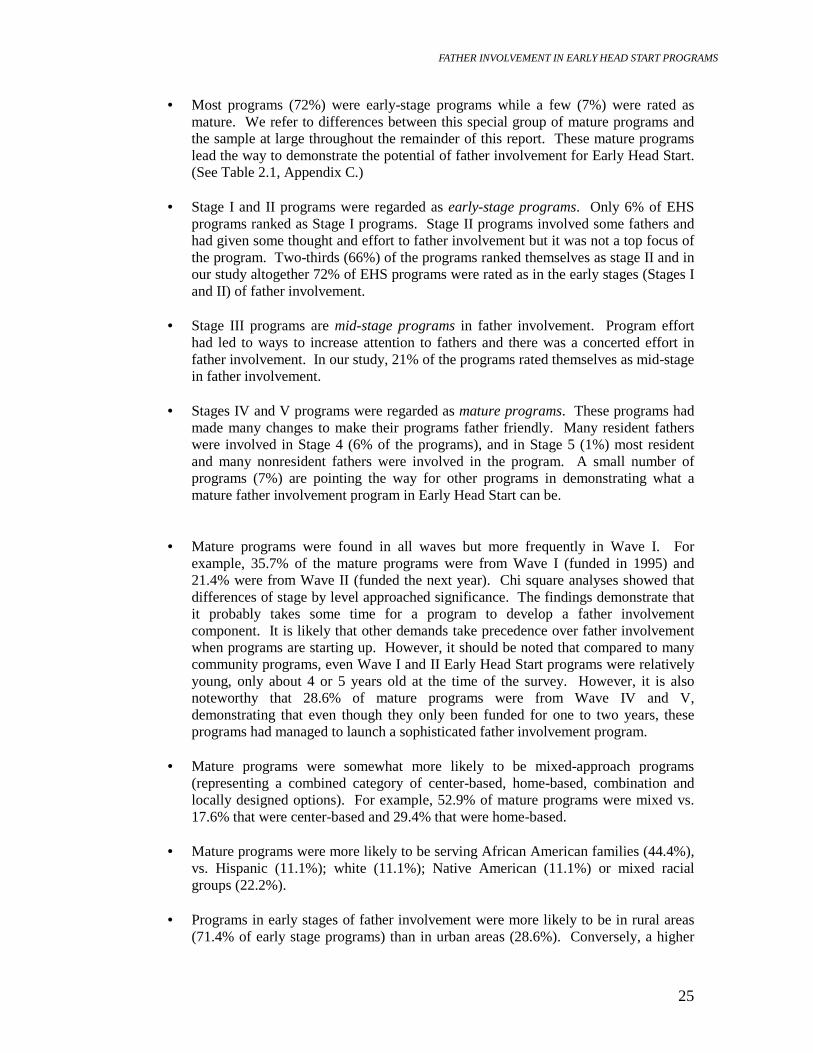
STAGE OF FATHER INVOLVEMENT (N= 235)
Early (I & II)72%
Mid (III)21% Mature (IV & V)
7%
Figure1
FATHER INVOLVEMENT IN EARLY HEAD START PROGRAMS
25
• Most programs (72%) were early-stage programs while a few (7%) were rated as mature. We refer to differences between this special group of mature programs and the sample at large throughout the remainder of this report. These mature programs lead the way to demonstrate the potential of father involvement for Early Head Start. (See Table 2.1, Appendix C.)
• Stage I and II programs were regarded as early-stage programs. Only 6% of EHS
programs ranked as Stage I programs. Stage II programs involved some fathers and had given some thought and effort to father involvement but it was not a top focus of the program. Two-thirds (66%) of the programs ranked themselves as stage II and in our study altogether 72% of EHS programs were rated as in the early stages (Stages I and II) of father involvement.
• Stage III programs are mid-stage programs in father involvement. Program effort
had led to ways to increase attention to fathers and there was a concerted effort in father involvement. In our study, 21% of the programs rated themselves as mid-stage in father involvement.
• Stages IV and V programs were regarded as mature programs. These programs had
made many changes to make their programs father friendly. Many resident fathers were involved in Stage 4 (6% of the programs), and in Stage 5 (1%) most resident and many nonresident fathers were involved in the program. A small number of programs (7%) are pointing the way for other programs in demonstrating what a mature father involvement program in Early Head Start can be.
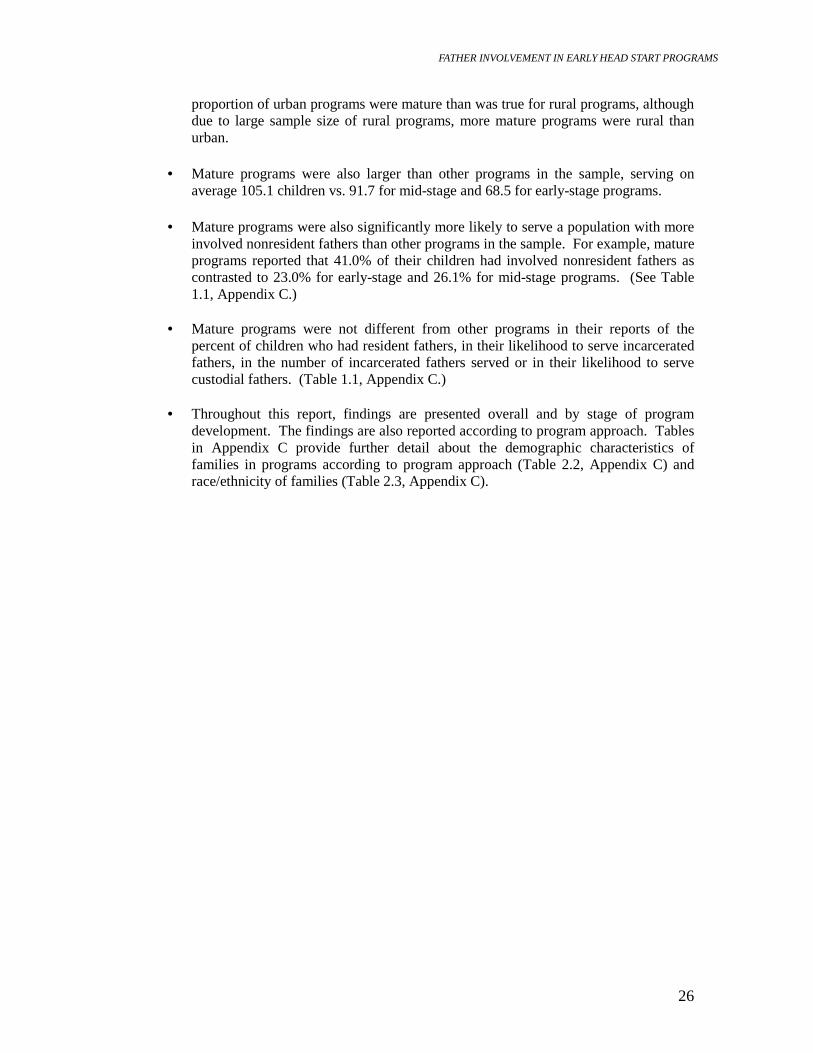
• Mature programs were found in all waves but more frequently in Wave I. For example, 35.7% of the mature programs were from Wave I (funded in 1995) and 21.4% were from Wave II (funded the next year). Chi square analyses showed that differences of stage by level approached significance. The findings demonstrate that it probably takes some time for a program to develop a father involvement component. It is likely that other demands take precedence over father involvement when programs are starting up. However, it should be noted that compared to many community programs, even Wave I and II Early Head Start programs were relatively young, only about 4 or 5 years old at the time of the survey. However, it is also noteworthy that 28.6% of mature programs were from Wave IV and V, demonstrating that even though they only been funded for one to two years, these programs had managed to launch a sophisticated father involvement program.
• Mature programs were somewhat more likely to be mixed-approach programs
(representing a combined category of center-based, home-based, combination and locally designed options). For example, 52.9% of mature programs were mixed vs. 17.6% that were center-based and 29.4% that were home-based.
• Mature programs were more likely to be serving African American families (44.4%),
vs. Hispanic (11.1%); white (11.1%); Native American (11.1%) or mixed racial groups (22.2%).
• Programs in early stages of father involvement were more likely to be in rural areas
(71.4% of early stage programs) than in urban areas (28.6%). Conversely, a higher
FATHER INVOLVEMENT IN EARLY HEAD START PROGRAMS
26
proportion of urban programs were mature than was true for rural programs, although due to large sample size of rural programs, more mature programs were rural than urban.
• Mature programs were also larger than other programs in the sample, serving on
average 105.1 children vs. 91.7 for mid-stage and 68.5 for early-stage programs. • Mature programs were also significantly more likely to serve a population with more
involved nonresident fathers than other programs in the sample. For example, mature programs reported that 41.0% of their children had involved nonresident fathers as contrasted to 23.0% for early-stage and 26.1% for mid-stage programs. (See Table 1.1, Appendix C.)
• Mature programs were not different from other programs in their reports of the
percent of children who had resident fathers, in their likelihood to serve incarcerated fathers, in the number of incarcerated fathers served or in their likelihood to serve custodial fathers. (Table 1.1, Appendix C.)
• Throughout this report, findings are presented overall and by stage of program
development. The findings are also reported according to program approach. Tables in Appendix C provide further detail about the demographic characteristics of families in programs according to program approach (Table 2.2, Appendix C) and race/ethnicity of families (Table 2.3, Appendix C).

FATHER INVOLVEMENT IN EARLY HEAD START PROGRAMS
27
3. GOALS OF A FATHER INVOLVEMENT PROGRAM
“ In your program, which fathers do you try to involve?”
THE FATHERS PROGAMS AIM TO INVOLVE
The Fathers Programs Aim to Involve4 Overall sample N = 252-258
Mature Programs
N = 18 Resident Biological Fathers 98.8% 100% Father Figures who Live With Child 94.8% 100% Nonresident Biological Fathers 77.2% 88.9% Nonresident Father Figures 57.9% 83.3%
_________________________________________________________________________________ Table 3a
• Most programs indicate they want to involve resident fathers. (See Table 3.1,
Appendix C). When it comes to nonresident fathers the differential between the mature and other programs increased. Slightly more mature programs responded that they attempt to involve nonresident biological fathers than was true for other programs (88.9% vs. 74.5% for early-stage and 84.9% for mid-stage) and mature programs were more likely to attempt to involve nonresident father figures than other programs (83.3% vs. 51.1% for early-stage and 69.8% for mid-stage).
• Program Approach. Which fathers programs aim to involve varied by program
approach as well. While all programs try to involve biological fathers living at home, center-based programs were significantly less likely to do so than other groups. There were not significant differences across groups in involving resident father figures. When it came to involving nonresident biological fathers, mixed programs were significantly more likely than center and home-based to involve these fathers.
• Race/Culture of Families. Finally, programs serving African American families
were significantly more likely than their counterparts to try to involve the group of father figures who do not reside with the child.
4 In this text table and throughout the report, to illustrate how mature programs stand apart from programs in general and may be viewed as exemplary, we descriptively present averages for all programs and for mature programs. We do not statistically compare mature to all programs. Tables in Appendix C (e.g., Table 1.1) show statistical differences by stage, as well as by approach and race-ethnicity.
FATHER INVOLVEMENT IN EARLY HEAD START PROGRAMS
28
“ To what extent does each of the following reflect your program’s purposes for father involvement?” __________________________________________________________________
THE GOALS OF FATHER INVOLVEMENT PROGRAMS
Goals of Father Involvement Programs: Overall sample
N = 252-258 Mature
Programs N = 18
Father Involvement Goals Scale 2.6 (.86) 3.5 (.57) SELECTED GOALS % Answering to a “Very Great
Extent” Encourage fathers to spend time with children 82.9% 100% Get fathers to come to program events 80.3% 100% Encourage fathers and mothers to work together
79.5% 100%
Help fathers with parenting skills 76.7% 94.4% Involve fathers in (their own) successful employment or education
47.7% 77.9%
Be recognized in the community as a good resource for fathers
46.5% 93.8%
Involve fathers to resolving their personal issues
39.8% 88.9%
Help nonresident fathers stay in contact with their children
30.6% 70.6%
Involve fathers in financial child support 27.9% 72.3%
Table 3b
• We assumed that all programs would not have the same goals when it came to father involvement. Since Early Head Start is a child development program, we assumed that most programs would try to encourage fathers to spend time with their children. We were less certain that programs would focus on fathers’ social service needs so we asked about a list of possible goals that programs could have.
• Overall, the programs averaged 2.6 (.86) on the Father Involvement Goals Scale.
The Father Involvement Goals Scale score was computed by averaging across the score for each goal. This score for each item was created by giving a “4” score for rating a goal as important “ to a great extent” and a “0” if not important at all. When it came to the types of goals that programs considered important, overall they most frequently focused on parenting and attendance at meetings. Least-frequently named were goals that focus on nonresident fathers and on helping fathers resolve their own issues, for example, involving fathers in financial support and involving fathers in solving their personal issues. (See Table 3.2, Appendix C.)
• Stage. One-way analyses of variance showed there were highly significant
differences by level of program maturity on the Father Involvement Goals Scale

FATHER INVOLVEMENT IN EARLY HEAD START PROGRAMS
29
(averaging 3.5 (.57) for mature programs vs. 2.9 (.66) for mid-stage programs and 2.4 (.85) for early-stage programs). Mature programs more often named every goal and more often said the goal was a purpose to a great extent than was true for mid-stage and early-stage programs; the differences between programs at different stages were significant in all cases but two. There were some goal areas in which the mature programs particularly stood apart from the others, areas mostly focused on helping the father as a person or on nonresident fathers. The goals for which mature programs were significantly far ahead of mid- and early-stage programs included the following: to involve fathers in successful employment or education; to involve fathers in financial child support; to help nonresident fathers stay in contact with their children; to involve fathers in their personal issues; and to be recognized in the community as a good resource for fathers.
• Program Approach. Mixed-approach programs had higher scores on the Father Involvement Goals Scale, meaning they had more goals they considered important (2.9 (.85)) than home-based programs (2.5 (.85)) and center-based programs (2.4 (.85)). There were no significant differences by program approach on any of the specific goals queried. However, mixed programs were slightly more likely to say it was important for them to get fathers to come to program events and to attempt to involve fathers in financial child support than was true for other program types.
• Race/Culture of Families. There was no difference on the Father Involvement
Goals Scale total by race/culture of families programs served. However, on the individual items, there was a trend for programs serving African American families were to identify financial child support by fathers as a goal and programs serving Native American families most often set the goal to be recognized as a good resource for fathers in their communities.5
5 Due to small sample size of predominantly Native American sites the difference was not significant.
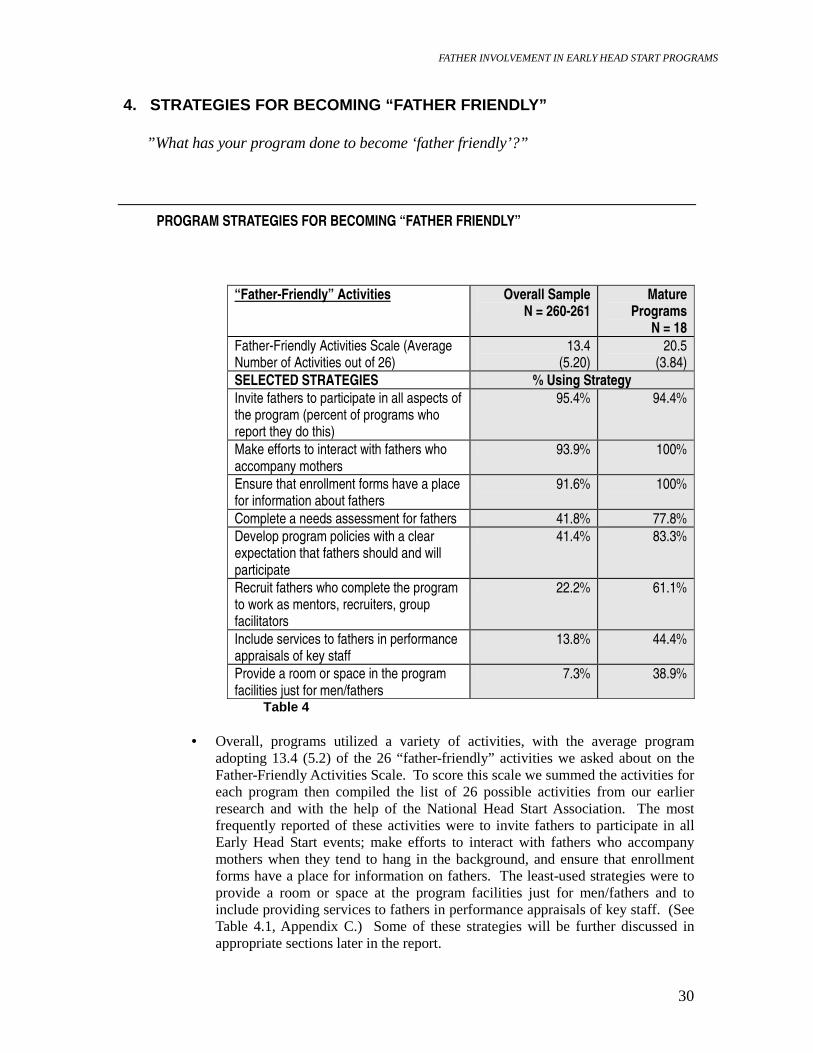
FATHER INVOLVEMENT IN EARLY HEAD START PROGRAMS
30
4. STRATEGIES FOR BECOMING “ FATHER FRIENDLY”
” What has your program done to become ‘ father friendly’?”
PROGRAM STRATEGIES FOR BECOMING “FATHER FRIENDLY”
“Father-Friendly” Activities Overall Sample N = 260-261
Mature Programs
N = 18 Father-Friendly Activities Scale (Average Number of Activities out of 26)
13.4 (5.20)
20.5 (3.84)
SELECTED STRATEGIES % Using Strategy Invite fathers to participate in all aspects of the program (percent of programs who report they do this)
95.4% 94.4%
Make efforts to interact with fathers who accompany mothers
93.9% 100%
Ensure that enrollment forms have a place for information about fathers
91.6% 100%
Complete a needs assessment for fathers 41.8% 77.8% Develop program policies with a clear expectation that fathers should and will participate
41.4% 83.3%
Recruit fathers who complete the program to work as mentors, recruiters, group facilitators
22.2% 61.1%
Include services to fathers in performance appraisals of key staff
13.8% 44.4%
Provide a room or space in the program facilities just for men/fathers
7.3% 38.9%
Table 4
• Overall, programs utilized a variety of activities, with the average program adopting 13.4 (5.2) of the 26 “ father-friendly” activities we asked about on the Father-Friendly Activities Scale. To score this scale we summed the activities for each program then compiled the list of 26 possible activities from our earlier research and with the help of the National Head Start Association. The most frequently reported of these activities were to invite fathers to participate in all Early Head Start events; make efforts to interact with fathers who accompany mothers when they tend to hang in the background, and ensure that enrollment forms have a place for information on fathers. The least-used strategies were to provide a room or space at the program facilities just for men/fathers and to include providing services to fathers in performance appraisals of key staff. (See Table 4.1, Appendix C.) Some of these strategies will be further discussed in appropriate sections later in the report.

FATHER INVOLVEMENT IN EARLY HEAD START PROGRAMS
31
• Stage. The number of activities programs used positively and significantly increased with the maturity of the program. The difference for stages on the Father-Friendly Activities Scale was significant. Mature programs used 20.5 (3.84) strategies on average, compared to 11.9 (4.39) for early-stage and 16.8 (4.67) for mid-stage programs. The most prevalent activities for early- and mid-stage programs were inviting fathers to participate in all Early Head Start events, home visits, and all aspects of the program. Of mature programs, 100% of programs reported they make efforts to interact with fathers who accompany mothers when they tend to hang in the background and ensure that fathers’ names are on enrollment forms. Differences between mature and other programs were most often seen among less frequently-used strategies; for example, most mature programs vs. a minority of early-stage programs reported they complete a needs assessment for fathers; recruit fathers who completed the program to work as mentors, recruiters, and group facilitators; and develop program policies that include a clear expectation that fathers should and will participate.
• Program Approach. There was a significant difference on the Father-Friendly
Activities Scale by program approach, with mixed programs reporting more activities (14.7, 5.18) on average than center-based (12.0, 5.00) or home-based programs (13.1, 5.18). For center-based and mixed-approach programs, inviting fathers to participate in EHS events was the most-often used approach (used by 92.3% of center-based programs and 96.8% of mixed). For home-based approaches, the most-used approach was to make efforts to interact with fathers who accompany mothers when they tend to hang in the background (reported by 97.8% of the programs). Mixed-approach programs were significantly more likely than other program approaches to enable front-line staff to promote father involvement; provide bi-lingual activities for fathers; send written information to both parents if they did not live together and to obtain contact information about the father regardless of living situations. Interestingly, center-based and mixed programs were both more likely to “send a message” that the program is for men as well as women significantly more often than were home-based programs, whereas home-based and mixed programs were both significantly more likely to refer fathers to other services than were center-based programs.
• Race/Culture. While there were not overall differences on the Father-Friendly
Activities Scale by race/culture of families served, there were some striking differences in the types of activities that programs selected to promote father involvement within programs serving fathers of different races or cultures. For example, programs serving mostly African American families were more likely than other groups to use male staff to recruit fathers and to allow staff time for outreach to fathers. Programs serving mostly Native American families were significantly more likely than other programs to have fathers complete a needs assessment; offer bilingual services (with those serving Hispanic families); have a room just for fathers; invite fathers to participate in all events (with those serving African American families); and hire male staff. There were other ways that programs serving mostly Native American families seemed different from all other programs that didn’ t reach significance, likely because the number of these programs (11) was small relative to other groups. Programs serving mostly white and those serving mostly Hispanic families were more likely than other programs to send written materials to both parents if they did not live together.

FATHER INVOLVEMENT IN EARLY HEAD START PROGRAMS
32
5. INVOLVEMENT OF THE FATHERS IN PROGRAMS “ How many children (in your program) have a father or father figure who has ever participated/is highly involved in the Early Head Start program?”
RESIDENT AND NONRESIDENT FATHERS EVER INVOLVED AND HIGHLY INVOLVED IN THE EARLY HEAD START PROGRAM
Fathers Ever and Highly Involved in the Early Head Start Program
Overall sample N = 220-240
Mature Programs N = 14-18
Percent of resident fathers who ever participated in the Early Head Start program
58.6% 65.4%
Percent of resident fathers who are highly involved in the Early Head Start program
24.1% 41.2%
Percent of nonresident fathers who ever participated in the Early Head Start program
30.4% 26.6%
Percent of nonresident fathers who are highly involved in the Early Head Start program
9.5% 13.5%
Table 5a
• While programs were adapting by making a number of activities available to fathers, we wanted to know to what extent were fathers of Early Head Start children actually participating. Programs report a majority of their resident fathers ever participated in the program and about a quarter were highly involved. Fewer nonresident fathers, about a third, were ever involved and fewer still, about a tenth, were highly involved. (See Table 5.1, Appendix C.)
The following example will illustrate how these estimates were calculated. The percent resident fathers ever involved equals the number of children the program identified as having a resident father ever involved divided by all children with a resident father.
• Stage. Mature and mid-stage programs reported significantly more often involving resident fathers than early-stage programs. Mature programs reported most resident fathers were involved and slightly less than half were highly involved (nearly twice the proportion for early-stage programs). Mature programs reported nearly twice as many resident fathers highly involved as early-stage programs. There was no significant difference by stage in the proportion of nonresident fathers who participated or were highly involved.
• Program Approach and Race/Culture. There were no significant differences in
degree of father involvement for resident and nonresident fathers by program approach or by race/culture of families served. However, it was interesting that across the categories of resident father involvement, the 11 programs serving Native Americans reported the highest proportion of fathers involved in the program.
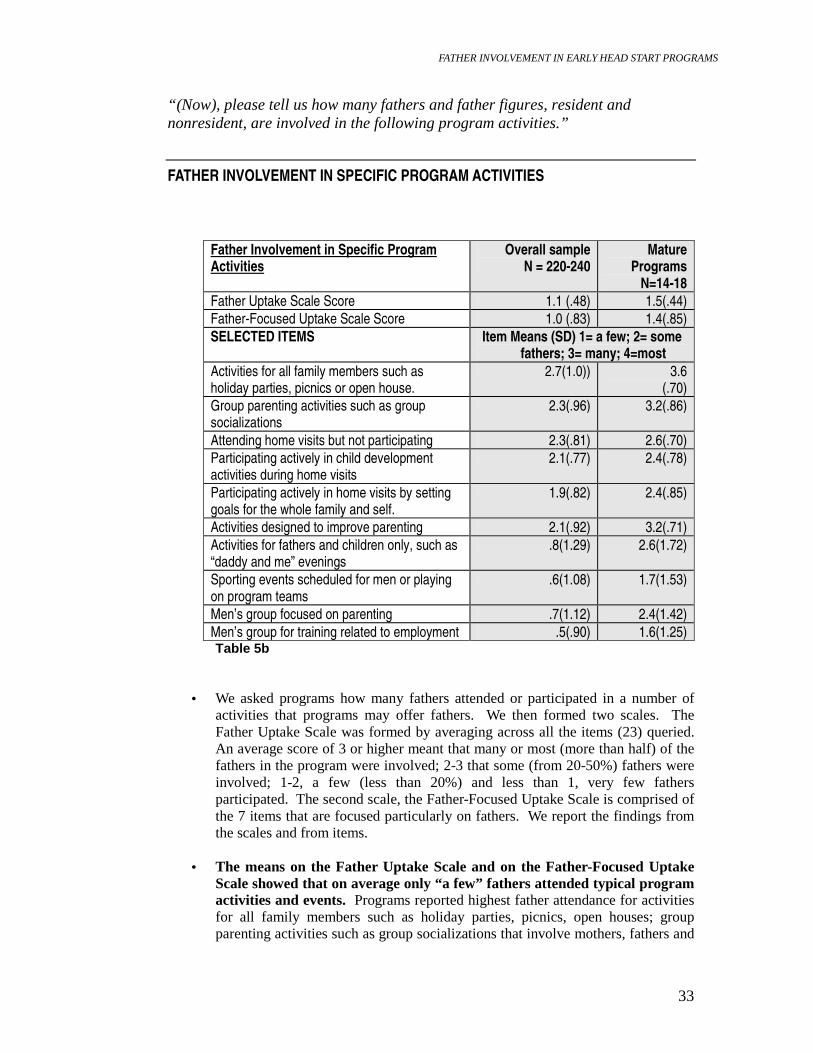
FATHER INVOLVEMENT IN EARLY HEAD START PROGRAMS
33
“ (Now), please tell us how many fathers and father figures, resident and nonresident, are involved in the following program activities.”
FATHER INVOLVEMENT IN SPECIFIC PROGRAM ACTIVITIES
Father Involvement in Specific Program Activities
Overall sample N = 220-240
Mature Programs
N=14-18 Father Uptake Scale Score 1.1 (.48) 1.5(.44) Father-Focused Uptake Scale Score 1.0 (.83) 1.4(.85) SELECTED ITEMS Item Means (SD) 1= a few; 2= some
fathers; 3= many; 4=most Activities for all family members such as holiday parties, picnics or open house.
2.7(1.0)) 3.6 (.70)
Group parenting activities such as group socializations
2.3(.96) 3.2(.86)
Attending home visits but not participating 2.3(.81) 2.6(.70) Participating actively in child development activities during home visits
2.1(.77) 2.4(.78)
Participating actively in home visits by setting goals for the whole family and self.
1.9(.82) 2.4(.85)
Activities designed to improve parenting 2.1(.92) 3.2(.71) Activities for fathers and children only, such as “daddy and me” evenings
.8(1.29) 2.6(1.72)
Sporting events scheduled for men or playing on program teams
.6(1.08) 1.7(1.53)
Men’s group focused on parenting .7(1.12) 2.4(1.42) Men’s group for training related to employment .5(.90) 1.6(1.25) Table 5b
• We asked programs how many fathers attended or participated in a number of activities that programs may offer fathers. We then formed two scales. The Father Uptake Scale was formed by averaging across all the items (23) queried. An average score of 3 or higher meant that many or most (more than half) of the fathers in the program were involved; 2-3 that some (from 20-50%) fathers were involved; 1-2, a few (less than 20%) and less than 1, very few fathers participated. The second scale, the Father-Focused Uptake Scale is comprised of the 7 items that are focused particularly on fathers. We report the findings from the scales and from items.
• The means on the Father Uptake Scale and on the Father-Focused Uptake
Scale showed that on average only “ a few” fathers attended typical program activities and events. Programs reported highest father attendance for activities for all family members such as holiday parties, picnics, open houses; group parenting activities such as group socializations that involve mothers, fathers and
FATHER INVOLVEMENT IN EARLY HEAD START PROGRAMS
34
children; attending home visits but not actually participating; and bringing and picking up children in center-based care. Lowest uptake was reported for sporting events for fathers, which were not offered by all programs (See also Table 5.2 in Appendix C).
• Stage. Differences by program stage on both the Father Uptake Scale and on the
Father-Focused Activities Subscale, consistent with other findings in this study, were significant. Overall Father Uptake Scale scores were 1.5 (.44) for mature programs and 1.3 (.52) for mid-stage and 1.0 (.46) for early-stage programs and Father-Focused Activities Scale scores were 1.4 (.85) for mature programs and 1.1 (.81) for mid-stage and .7 (.78) for early-stage programs showing that mature programs involved more fathers in overall program activities and involved more fathers in activities for fathers only. Mature programs had much higher participation in all the activities on average than mid-stage, in turn higher than for early-stage programs. Differences by stage were significant for every type of program activity with the exception of five items (involvement in center committees; bringing and picking up children in center-based care; working in the classroom; attending home visits but not participating; and fixing up the EHS grounds). Mature programs achieved higher levels of involvement by involving many or most fathers in family activities; activities designed to improve parenting; and group parenting education activities such as group socializations. Mid-stage programs consistently had higher father involvement than early-stage programs but did not involve most fathers in any of the activities we asked about. Thus we find as programs mature, more fathers attend program activities, and a hallmark of maturity may be that most fathers attend major events as well as events at the heart of the program (e.g., group socializations).
• Program Approach. Overall Father Uptake Scale and Father-Focused Activities Uptake Scale differences by program approach were not significant. For a few items there were significant differences in father attendance as would be expected from the services offered. For example, center-based and mixed-approach programs had higher father involvement in center committee efforts, working in the classroom, bringing and picking up children, participating in parent-teacher conferences and fixing up the program grounds, while home-based programs had highest father involvement in home visits.
• Race/Culture. Overall differences in the Father Uptake Scale based on
race/culture approached significance. The highest reports of overall father attendance came from programs serving Native Americans, followed by those serving Hispanic families. Differences by race/culture on the Father-Focused Uptake Subscale were not significant; however, there were significant differences in involvement in many of the activities, showing that fathers of different races/cultures differentially take up activities that programs offer.
��Programs serving Native Americans reported the highest proportion of father involvement in a number of areas. Programs serving Native Americans reported the highest (of all the race/culture groups) father turnout at Health Advisory Board or Policy Council; center committees; working in the classroom; bringing children and picking them up; attending home visits but not actually participating; and fixing up EHS grounds.
FATHER INVOLVEMENT IN EARLY HEAD START PROGRAMS
35
��Programs serving African American fathers reported the highest turnout
for sporting events for men; men’s group focused on parenting; men’s group for training related to employment; and men’s group for education or literacy.
��Programs serving Hispanic families reported the highest father
involvement as compared to programs serving other racial groups in applying for the EHS program; participating in a group of men and women for education or literacy and participating in parent-teacher conferences other than home visits.
��Programs serving mostly Caucasian parents reported relatively higher
father turnout when it came to participating actively in home visits and participating actively in home visits by setting goals for the whole family and for self.
��Thus, it appears that what appeals to fathers in father involvement
programs varies considerably by the race/culture of the fathers. Native Americans reported greatest success with overall turnout, and dads may respond to invitations to be on boards, committees and to help the program overall as well as to come to events for the whole family, including socializations; African American fathers were reported to respond to “ for men only” groups and approaches; Hispanic fathers were reported to be most responsive to group meetings that involved men and women together and focused on language and literacy, while Caucasian fathers reportedly participated more in home visits. Programs with a mixture of racial groups did not lead in father involvement in any areas, lending credence to the idea that fathers’ preferences in responding to program activities have strong cultural connections and suggesting that cultural homogeneity within a program may contribute to father involvement.
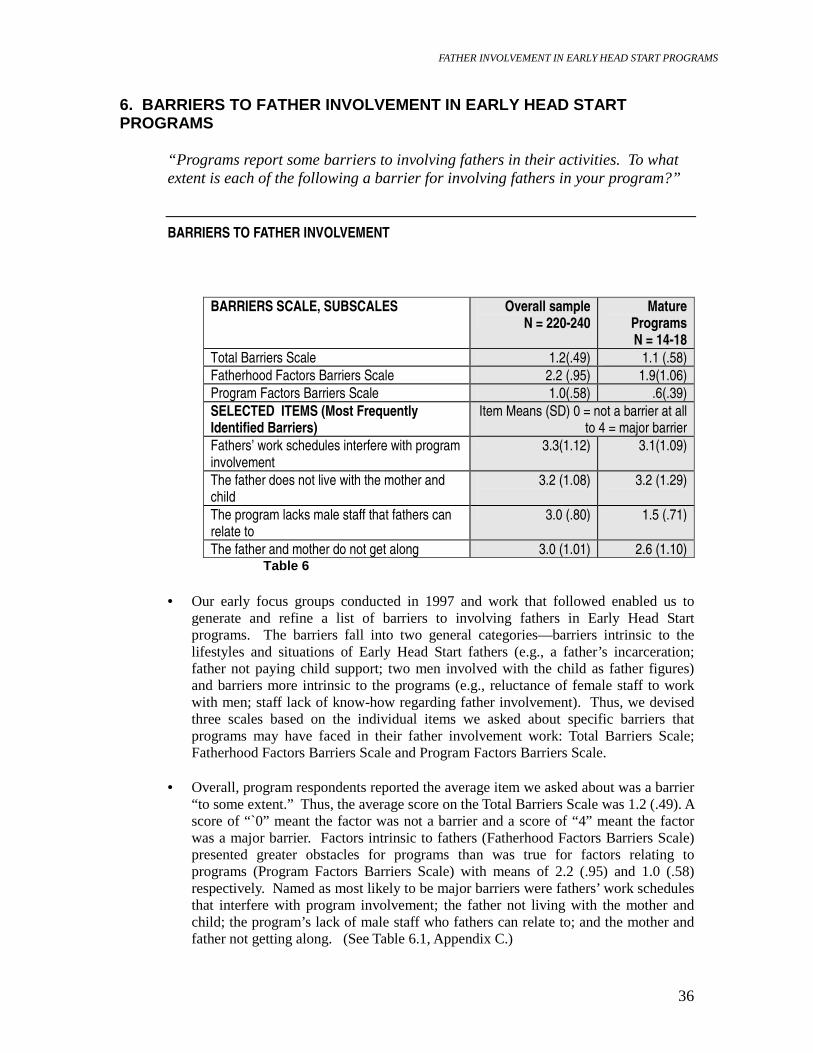
FATHER INVOLVEMENT IN EARLY HEAD START PROGRAMS
36
6. BARRIERS TO FATHER INVOLVEMENT IN EARLY HEAD START PROGRAMS
“ Programs report some barriers to involving fathers in their activities. To what extent is each of the following a barrier for involving fathers in your program?”
BARRIERS TO FATHER INVOLVEMENT
BARRIERS SCALE, SUBSCALES Overall sample N = 220-240
Mature Programs N = 14-18
Total Barriers Scale 1.2(.49) 1.1 (.58) Fatherhood Factors Barriers Scale 2.2 (.95) 1.9(1.06) Program Factors Barriers Scale 1.0(.58) .6(.39) SELECTED ITEMS (Most Frequently Identified Barriers)
Item Means (SD) 0 = not a barrier at all to 4 = major barrier
Fathers’ work schedules interfere with program involvement
3.3(1.12) 3.1(1.09)
The father does not live with the mother and child
3.2 (1.08)
3.2 (1.29)
The program lacks male staff that fathers can relate to
3.0 (.80) 1.5 (.71)
The father and mother do not get along 3.0 (1.01) 2.6 (1.10) Table 6
• Our early focus groups conducted in 1997 and work that followed enabled us to
generate and refine a list of barriers to involving fathers in Early Head Start programs. The barriers fall into two general categories—barriers intrinsic to the lifestyles and situations of Early Head Start fathers (e.g., a father’s incarceration; father not paying child support; two men involved with the child as father figures) and barriers more intrinsic to the programs (e.g., reluctance of female staff to work with men; staff lack of know-how regarding father involvement). Thus, we devised three scales based on the individual items we asked about specific barriers that programs may have faced in their father involvement work: Total Barriers Scale; Fatherhood Factors Barriers Scale and Program Factors Barriers Scale.
• Overall, program respondents reported the average item we asked about was a barrier
“ to some extent.” Thus, the average score on the Total Barriers Scale was 1.2 (.49). A score of “ `0” meant the factor was not a barrier and a score of “4” meant the factor was a major barrier. Factors intrinsic to fathers (Fatherhood Factors Barriers Scale) presented greater obstacles for programs than was true for factors relating to programs (Program Factors Barriers Scale) with means of 2.2 (.95) and 1.0 (.58) respectively. Named as most likely to be major barriers were fathers’ work schedules that interfere with program involvement; the father not living with the mother and child; the program’s lack of male staff who fathers can relate to; and the mother and father not getting along. (See Table 6.1, Appendix C.)
FATHER INVOLVEMENT IN EARLY HEAD START PROGRAMS
37
• Stage. As expected, mature programs perceived significantly fewer program-related
barriers than mid- and early-stage programs (Program Factors Barriers Scale), but there was not a difference in barriers specific to fathers (Fatherhood Factors Barriers Scale) or in overall barriers (Total Barriers Scale), suggesting that a number of challenges are inherent to involving fathers in Early Head Start, though as we’ ll see in a subsequent section of this report focused on dealing with challenging situations, mature programs have devised enhanced ways of dealing with the barriers that all programs face. There were many differences on specific items. Compared to mature programs, mid- and early-stage programs were significantly more likely to perceive lacking male staff, lacking know-how, or receiving regional or national support as barriers. On the other hand, compared to early-stage programs, mature programs were significantly more likely to perceive two fathers in the child’s life and substance abuse as barriers. Mid-stage programs were also more likely to perceive two fathers in the child’s life as a barrier. It appears that as programs mature, challenging issues such as a child having two fathers and substance abuse become more salient, perhaps because programs are attempting to engage fathers in spite of difficult situations.
• Program Approach. While there were no overall or subscale differences by
program approach, there were some differences on specific items. Home-based programs were significantly more likely to identify barriers related to fathers not feeling welcome in the program. Mixed and home-based programs identified fathers’ involvement with domestic violence and fathers trying to control mothers’ involvement in the program as barriers more than did center-based program. Mixed programs identified the mother not wanting the father to be involved in the program and not wanting the father involved with the child as barriers more than other programs.
• Race/Culture. Programs serving families of different races and cultures perceived
barriers in many different ways. Programs serving Hispanic families reported significantly more barriers overall, more barriers related to fathers, more barriers related to programmatic factors, and barriers in many more specific areas than the other groups. Specifically, these programs were significantly more likely than those serving other racial/cultural groups to believe they had faced a number of barriers: men feel unwelcome in the program; Early Head Start has an image as a program for women and children; female staff are reluctant to work with fathers; classroom and center environments are not father friendly; staff lack know how regarding father involvement; the program perceives a lack of support from the Head Start Bureau; fathers are involved in domestic violence (with programs serving whites); fathers try to control mothers’ involvement in the program; mothers do not want the fathers to be involved with the program or with the child (with programs serving white families); and fathers’ work schedule interferes with program involvement. Programs serving mostly African Americans identified mothers and fathers “not getting along” as a barrier more than any other group, a difference that approached significance. Programs serving mostly Caucasian families perceived not having male staff as a barrier, significantly more than any other group.
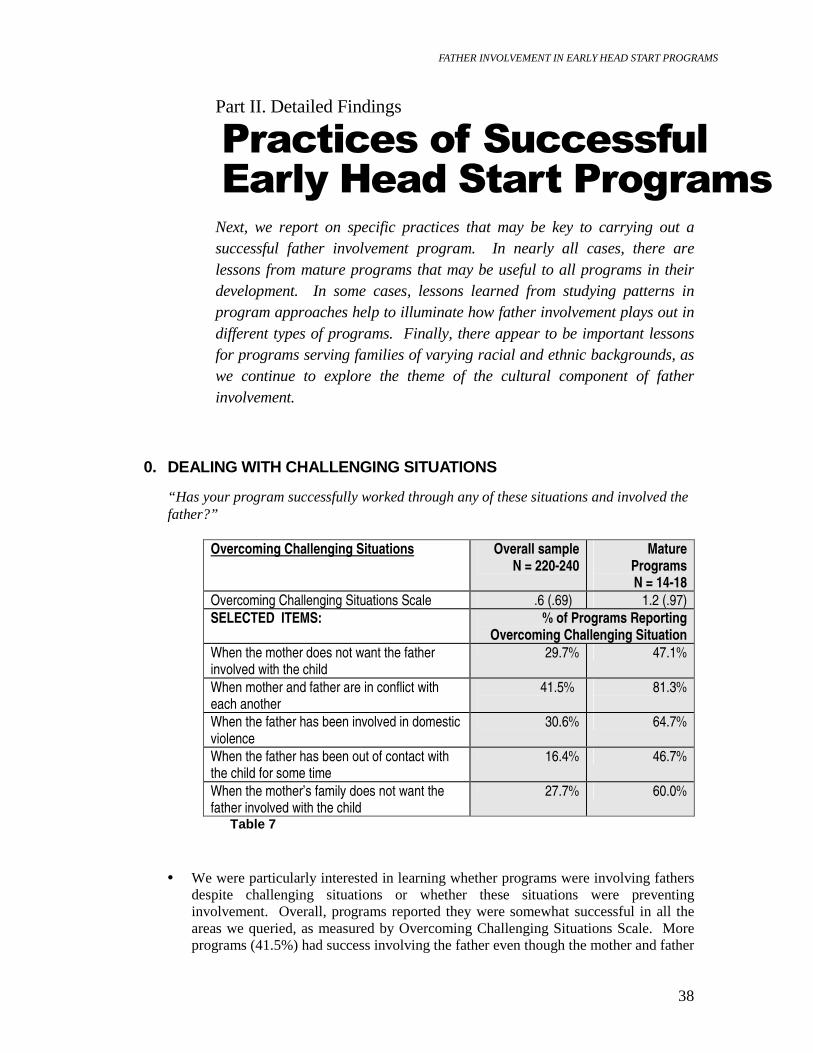
FATHER INVOLVEMENT IN EARLY HEAD START PROGRAMS
38
Part II. Detailed Findings
&������� ��$������ $���������%���������&����� �
Next, we report on specific practices that may be key to carrying out a successful father involvement program. In nearly all cases, there are lessons from mature programs that may be useful to all programs in their development. In some cases, lessons learned from studying patterns in program approaches help to illuminate how father involvement plays out in different types of programs. Finally, there appear to be important lessons for programs serving families of varying racial and ethnic backgrounds, as we continue to explore the theme of the cultural component of father involvement.
0. DEALING WITH CHALLENGING SITUATIONS
“ Has your program successfully worked through any of these situations and involved the father?”
Overcoming Challenging Situations Overall sample N = 220-240
Mature Programs N = 14-18
Overcoming Challenging Situations Scale .6 (.69) 1.2 (.97) SELECTED ITEMS: % of Programs Reporting
Overcoming Challenging Situation When the mother does not want the father involved with the child
29.7% 47.1%
When mother and father are in conflict with each another
41.5%
81.3%
When the father has been involved in domestic violence
30.6% 64.7%
When the father has been out of contact with the child for some time
16.4% 46.7%
When the mother’s family does not want the father involved with the child
27.7% 60.0%
Table 7
• We were particularly interested in learning whether programs were involving fathers despite challenging situations or whether these situations were preventing involvement. Overall, programs reported they were somewhat successful in all the areas we queried, as measured by Overcoming Challenging Situations Scale. More programs (41.5%) had success involving the father even though the mother and father
FATHER INVOLVEMENT IN EARLY HEAD START PROGRAMS
39
were in conflict but fewer had successes involving father when the father had been out of contact for some time (16.4%) and when the mother’s family opposed the father’s involvement (27.7%). (Table 7.1 in Appendix C)
• Stage. Again, mature programs led the way and nearly two-thirds of these programs
report they successfully worked through all of the challenging situations we presented in the survey and were able to involve the father, in spite of obstacles, as compared to less than a third for mid-stage and early-stage programs. For every item we queried, mature significantly more than other programs reported success involving the father despite challenging situations and the overall score on the Overcoming Challenging Situations Scale was more than twice as high for mature programs as for early-stage programs (1.2 vs. .5). A full 81.3% of mature programs reported success involving the father when mother and father were in conflict and 85.7% of the mature programs were able to involve the father when he was not paying child support; 64.7% successfully involved the father, likely including getting him social services, when he’d perpetrated domestic violence; and 60.0% involved the father in the difficult situation when the mother’s family did not want him to be involved with the child. Thus, mature programs demonstrate that many of these situations can be worked through. Indeed, mature program staff participating in our focus groups shared the language they used in some of these situations. One father involvement coordinator shared how he patiently explained to the child’s grandmother that he knew she was angry with the father of the child, but the child still needed a dad and if she wanted to help her grandchild, she could support the child’s relationship with the father.
• Program Approach. There were no significant differences on the Overcoming
Challenging Situations Scale by program approach; however, mixed-approach programs reported significantly greater success than other program types in involving the father in the face of opposition of mother’s family (center-based programs also reported relatively good success with this challenge), when the father had been out of contact with the child for some time, and when the father had not been paying child support.
• Race/Culture. Programs serving African American families reported significantly
higher Overcoming Challenging Situations Scale scores than those serving other racial groups, although none of the individual items showed significant differences.
�������� �(����� �� �������������$�� �� ����� �������� �������� ����������������
We next asked the program respondents what they did to achieve success in challenging situations. Program staff in focus groups provided further insights on strategies they used in challenging situations. “ To what extent have you relied on the following strategies to involve the father in the EHS program when there are conflicts with respect to father roles and program involvement?”

FATHER INVOLVEMENT IN EARLY HEAD START PROGRAMS
40
• The average on the Total Challenging Situations: Strategies Scale was 1.2, meaning that the average program relied on a host of strategies to a limited extent. True to the relationship orientation of Early Head Start, the most common strategy for involving the father in challenging situations when there are conflicts with respect to father roles was to discuss the situation among the staff to find the best solution; 51.4% of programs carried out this practice; 37.5% of programs reported they talk to the mother and father about how they want to handle the situation; and 15.1% of programs refer the father to another agency but coordinate the efforts with that agency (Table 7.1, Appendix C).
• Stage. As expected, mature programs reported significantly more strategies than
mid-stage and early-stage programs. Mature programs were significantly more likely to talk with the mother and father about what to do (66.7% of programs did this); and mature (66.7%) and mid-stage programs (64.2%) were more likely than early-stage programs (46.0%) to discuss the situation among their staff, bringing problem solving skills of staff to bear. Mature programs, and to some extent, mid-stage programs also led the way in a number of specific practices for resolving challenging situations. For example, mature programs were significantly more likely than other programs to involve separate case workers with the father and other family members (16.7% vs. 5.7% for early-stage programs); and to refer and coordinate efforts with the other agency (33.3% vs. 10.9% early stage).
• Program Approach and Race/Culture. Mixed programs reported significantly
more strategies than other program approaches and there were no significant differences by race/culture of families served. Mixed programs led the way in finding most solutions to challenging situations and center-based programs had the fewest solutions. Differences in working with TANF and child support administrators reached significance, favoring mixed-approach programs. There were no significant differences by race/culture of families served.
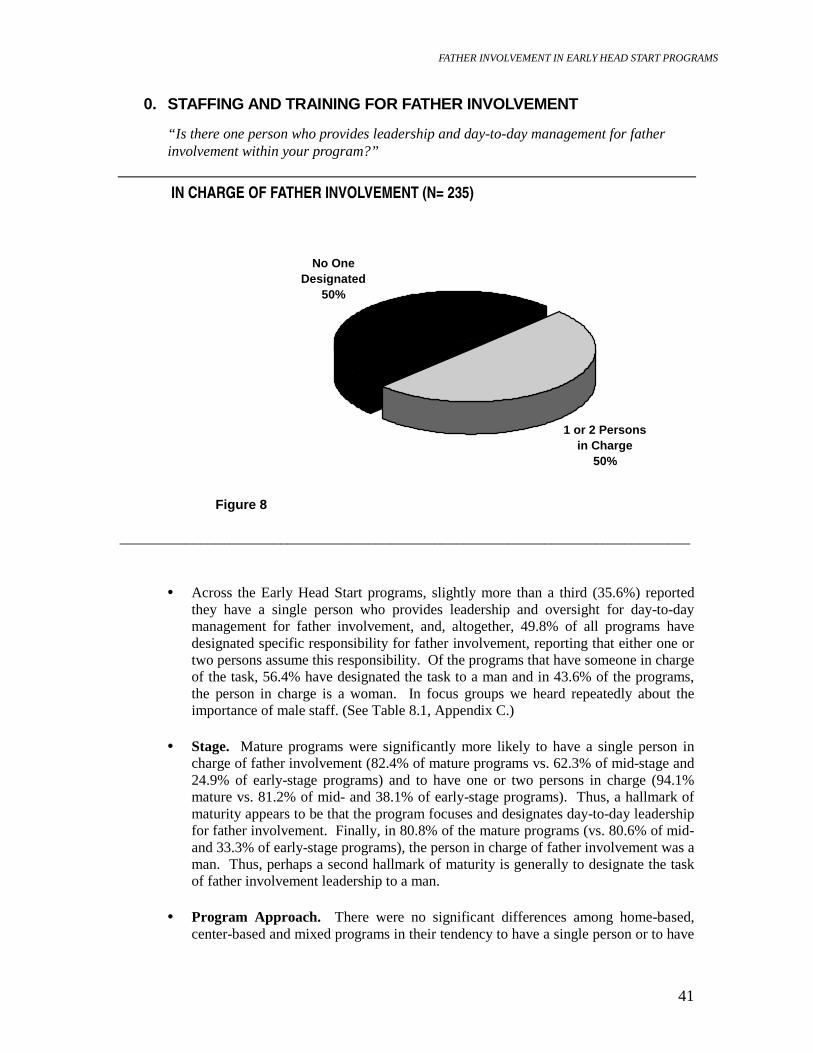
FATHER INVOLVEMENT IN EARLY HEAD START PROGRAMS
41
0. STAFFING AND TRAINING FOR FATHER INVOLVEMENT
“ Is there one person who provides leadership and day-to-day management for father involvement within your program?”
IN CHARGE OF FATHER INVOLVEMENT (N= 235)
1 or 2 Persons in Charge
50%
No One Designated
50%
Figure 8
______________________________________________________________________________
• Across the Early Head Start programs, slightly more than a third (35.6%) reported
they have a single person who provides leadership and oversight for day-to-day management for father involvement, and, altogether, 49.8% of all programs have designated specific responsibility for father involvement, reporting that either one or two persons assume this responsibility. Of the programs that have someone in charge of the task, 56.4% have designated the task to a man and in 43.6% of the programs, the person in charge is a woman. In focus groups we heard repeatedly about the importance of male staff. (See Table 8.1, Appendix C.)
• Stage. Mature programs were significantly more likely to have a single person in
charge of father involvement (82.4% of mature programs vs. 62.3% of mid-stage and 24.9% of early-stage programs) and to have one or two persons in charge (94.1% mature vs. 81.2% of mid- and 38.1% of early-stage programs). Thus, a hallmark of maturity appears to be that the program focuses and designates day-to-day leadership for father involvement. Finally, in 80.8% of the mature programs (vs. 80.6% of mid- and 33.3% of early-stage programs), the person in charge of father involvement was a man. Thus, perhaps a second hallmark of maturity is generally to designate the task of father involvement leadership to a man.
• Program Approach. There were no significant differences among home-based,
center-based and mixed programs in their tendency to have a single person or to have
FATHER INVOLVEMENT IN EARLY HEAD START PROGRAMS
42
one or two persons in charge of father involvement (56.9% of center-based; 41.3% of home-based and 53.2% of mixed programs) or to hire men in the position.
• Race/Culture. There was no difference by race/culture of families served in
tendency to have a single father involvement specialist, but the difference in the tendency to have one or two persons in charge approached significance. Programs serving African American families (63.2%) and Hispanic families (60.6%) were most likely to have the father involvement job designated, vs. programs serving families of other races/cultures, who designated the job less than half of the time. Moreover, programs serving African American, Hispanic, and Native American all hired a man in over 60% of the programs, while only 40.0% of programs serving Caucasians had designated the job to a man when there was a staff person or persons hired to oversee father involvement. This finding is consistent with barriers reported by programs serving white families who were most likely to report being stalled by not finding male staff.
�����
������������� ������������������ ���� ����������&������
What has your program done to become “ father friendly” ? Has your program integrated staff working with fathers into the overall program (father-oriented staff work cooperatively with all staff on all aspects of the program)? • While it appears to be important to have staff in charge of father involvement and to
hire men in the program, it is also important to for all staff to bring the lens of father involvement to their practice. A majority, 64.0%, of programs reported they had taken steps to enable front-line staff to become open and receptive to working with fathers; however, only 35.6% of programs had integrated father-oriented staff to work cooperatively with all staff on all aspects of the program. For father involvement to be far reaching, staff need time for father involvement; only 40.6% of programs allowed staff time and resources for recruitment and outreach to fathers, and very few (13.8%) included working with fathers in performance appraisals of staff. (Table 4.1, Appendix C)
• Stage, Approach, Race/Culture. Predictably, a higher percentage of mature
programs, followed by mid-stage programs, carried out the practices of taking steps to help front-line staff become open to working with fathers (89.9%, 75.5% and 59.3% for mature, mid- and early-stage programs, respectively); of integrating father-oriented staff to work with all staff (83.3%, 54.7% and 26.9%); and of allowing staff time to work with fathers (88.9%, 67.9% and 29.1%), although not even a majority of mature programs (44.4%, 20.8% and 8.8%) included father involvement in performance appraisals of all staff. Mixed (71.6%) and home-based (64.5%) programs were more likely than center-based (51.6%) programs to have taken steps for a majority of frontline staff to become open to working with fathers. Programs serving African American families (56.9% were more likely than programs serving other racial/ethnic groups to allow staff time and resources for recruitment and outreach to fathers (48.5% for Hispanic, 36.6% for Caucasian, 27.3% for Native American and 32.5% for mixed). There were no significant differences on other items by program model or race/ethnicity.
FATHER INVOLVEMENT IN EARLY HEAD START PROGRAMS
43
���$$�������� �
What has your program done to become “ father friendly” ? Has your program provided specific training for the EHS father involvement coordination or person in charge of father involvement? • In most areas of program practices, training helps staff learn about expectations.
Thus, it was instructive that only 28.8% of all programs had ensured that a father involvement coordinator had received father-specific training; however, it is important to keep in mind that not all programs had hired such a person. Only 38.1% of all the programs had provided training for all their staff on how to work with fathers, suggesting that training for involving fathers is an important need of programs. As noted elsewhere in this report, since this study was completed the Head Start Bureau has initiated training for the 21 sites funded to complete father involvement demonstrations and for approximately 100 other programs that applied for the demonstrations. (Table 4.1 and Table 8.1, Appendix C)
• Stage, Approach, Race/Culture. Predictably, 88.9% of mature programs provided
training for the person responsible for day-to-day administration of the father involvement component, and 77.8% of these programs provided training for all staff on father involvement; more than half of mid-stage programs provided both types of training (62.3% and 60.4%, respectively) and fewer than a fifth of early-stage programs (14.3% and 27.5%, respectively) provided either type of training. Mixed-approach and home-based programs were more likely than center-based programs to train all staff to work with fathers than center-based programs, and the difference approached significance. Differences according to race/culture of families programs served were not significant.
����
%�����"�������$$�
What has your program done to become “ father friendly” ? Has your program hired male staff? • Only 47.1% of all programs have hired male staff. However, 83.3% of mature
programs have hired male staff, compared to 60.4% of mid-stage program and 40.1% of early-stage programs. (Table 4.1 and Table 8.1, Appendix C)
• There was not a significant difference according to program approach in the
likelihood of hiring male staff. Programs serving a majority of Native American families were nearly twice as likely to hire male staff (81.8% vs. 55.2% for African American; 45.1% for Hispanic, 41.1% for Caucasian and 50.0% for programs serving families from a mix of racial/ethnic backgrounds).
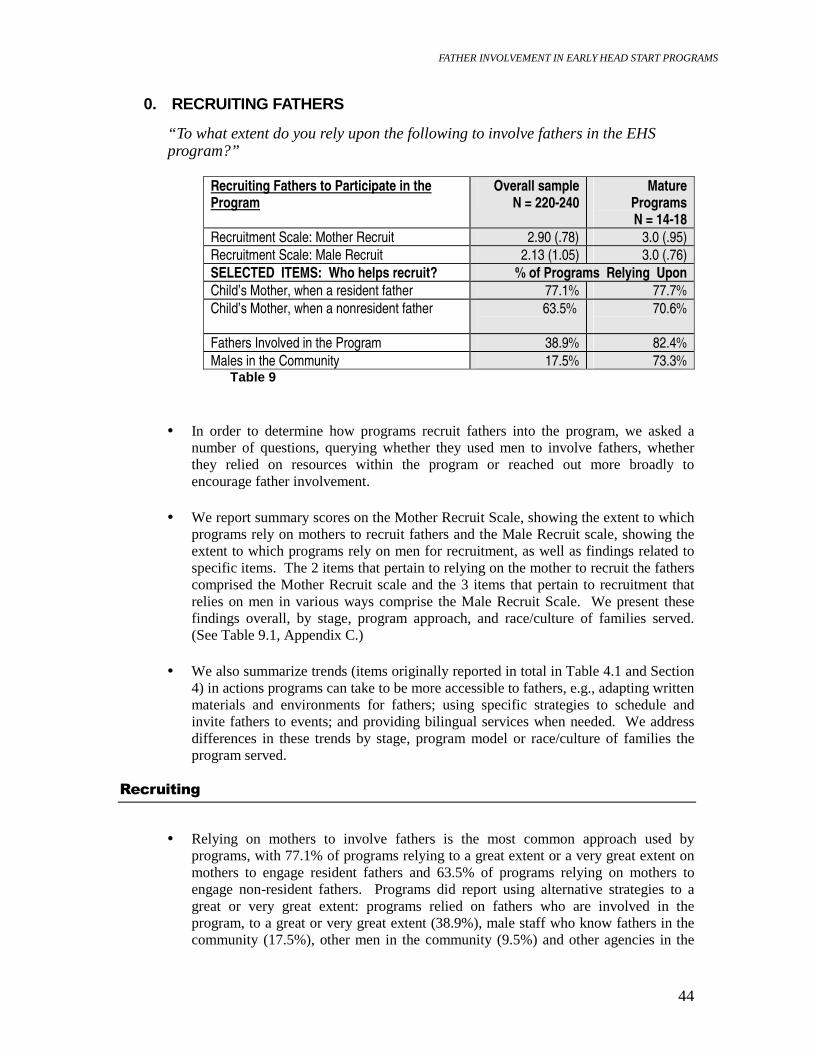
FATHER INVOLVEMENT IN EARLY HEAD START PROGRAMS
44
0. RECRUITING FATHERS
“ To what extent do you rely upon the following to involve fathers in the EHS program?”
Recruiting Fathers to Participate in the Program
Overall sample N = 220-240
Mature Programs N = 14-18
Recruitment Scale: Mother Recruit 2.90 (.78) 3.0 (.95) Recruitment Scale: Male Recruit 2.13 (1.05) 3.0 (.76) SELECTED ITEMS: Who helps recruit? % of Programs Relying Upon Child’s Mother, when a resident father 77.1% 77.7% Child’s Mother, when a nonresident father 63.5%
70.6%
Fathers Involved in the Program 38.9% 82.4% Males in the Community 17.5% 73.3%
Table 9
• In order to determine how programs recruit fathers into the program, we asked a number of questions, querying whether they used men to involve fathers, whether they relied on resources within the program or reached out more broadly to encourage father involvement.
• We report summary scores on the Mother Recruit Scale, showing the extent to which
programs rely on mothers to recruit fathers and the Male Recruit scale, showing the extent to which programs rely on men for recruitment, as well as findings related to specific items. The 2 items that pertain to relying on the mother to recruit the fathers comprised the Mother Recruit scale and the 3 items that pertain to recruitment that relies on men in various ways comprise the Male Recruit Scale. We present these findings overall, by stage, program approach, and race/culture of families served. (See Table 9.1, Appendix C.)
• We also summarize trends (items originally reported in total in Table 4.1 and Section
4) in actions programs can take to be more accessible to fathers, e.g., adapting written materials and environments for fathers; using specific strategies to schedule and invite fathers to events; and providing bilingual services when needed. We address differences in these trends by stage, program model or race/culture of families the program served.
����������
• Relying on mothers to involve fathers is the most common approach used by programs, with 77.1% of programs relying to a great extent or a very great extent on mothers to engage resident fathers and 63.5% of programs relying on mothers to engage non-resident fathers. Programs did report using alternative strategies to a great or very great extent: programs relied on fathers who are involved in the program, to a great or very great extent (38.9%), male staff who know fathers in the community (17.5%), other men in the community (9.5%) and other agencies in the
FATHER INVOLVEMENT IN EARLY HEAD START PROGRAMS
45
community (16.8%). Programs also volunteered they used other strategies such as employing a male home visitor, a special father’s initiative, and having activities specially designed for fathers. Consistent with strategies reported, the Mother Recruit summary score at 2.9 was higher than the Male Recruit summary score at 2.13.
• Stage. Interestingly, there was no difference by stage in mother recruitment
strategies, meaning that early-, mid- and mature-stage programs were equally likely to rely on mothers to recruit fathers. On the other hand, mature programs were significantly more likely to recruit using men in all the ways we measured, with higher Male Recruit summary scores, higher percent of mature programs relying on EHS fathers to recruit to a great or very great extent and higher percent relying on various ways to recruit fathers through community contacts. Mature programs were equally likely to rely on men to recruit as to rely on mothers, while less mature programs seem to basically rely on mothers.
• Approach. Mixed-approach programs were significantly more likely to recruit
fathers by recruiting through mothers and by recruiting through men. That is, mixed-approach programs had highest Mother Recruit and Father Recruit Scale scores, as well as more programs reporting recruiting through mothers when the father was not in residence. Center-based programs had the lowest Mother Recruit and Male Recruit Scale scores.
• Race/Culture. Programs serving mostly African American families relied more than
programs serving other racial/cultural groups on recruiting through mothers, with higher Mother Recruit scores. According to the program reports, African American fathers were also significantly more likely to be recruited through staff and other male contacts in the community than was true for fathers in programs serving other racial/cultural groups. Programs serving mostly white families were least likely to recruit relying on mothers, men, and to recruit through male community contacts.
"�����&����� ����� �*��������� �� �
What has your program done to become “ father friendly” ? Has your program ensured that all mailing and printed materials include the names of the fathers as well as the mothers? Ensured that enrollment forms have a place for information on fathers? Planned the environment in the center/program to make it father-friendly? Displayed positive and diverse images of fathers on the walls and in brochures? Provided a room or space at the program facilities just for men/fathers? Scheduled group meetings and/or home visits with fathers’ schedules in mind? Provided bilingual program activities for non-English speaking fathers? • Although on average, most programs include fathers’ names on enrollment forms
(91.6%), only about half (49.8 %) ensure that mailing materials in general include fathers’ names as well as mothers’ and only 29.5% of programs send written materials to both parents, if parents don’ t live together. Although 63.5% of programs have adapted their environment to make it more “ father friendly,” only 7.3% have
FATHER INVOLVEMENT IN EARLY HEAD START PROGRAMS
46
created a space just for men. About three quarters (70.1%) intentionally schedule meetings with fathers’ schedules in mind and about a third (36.4%) provide bi-lingual services when needed, though, of course, not all programs need bilingual services for fathers. (See Table 4.1, Appendix C.)
• Stage, Approach, Race/Culture. Mature programs, closely followed by mid-stage
programs, lead the way in all actions that encourage access, as they have led in so many other areas. Among program models, mixed-approach programs seemed to take the lead, when there was a difference by approach, in actions that make the program more accessible. Among programs serving families of different racial/cultural groups, programs serving mostly Native American families often led in the actions that encourage access. However, programs serving mostly Caucasian and Hispanic families tend to lead when it comes to reaching out to fathers using written materials.
• Summary. Altogether, our study shows that programs maximize father involvement
if they recruit in many ways and, particularly, recruit using men, take many steps to put fathers names on materials and to include them in meetings and program events, make environments father friendly, and reach out to fathers in their own language.
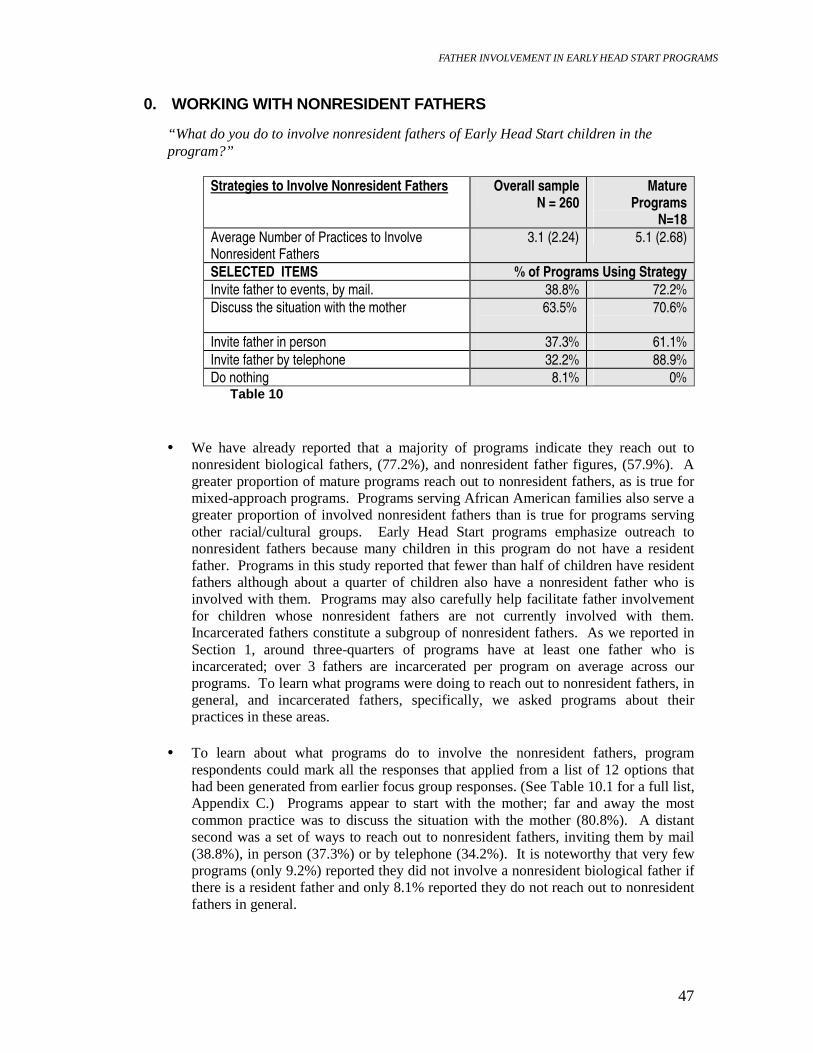
FATHER INVOLVEMENT IN EARLY HEAD START PROGRAMS
47
0. WORKING WITH NONRESIDENT FATHERS
“ What do you do to involve nonresident fathers of Early Head Start children in the program?”
Strategies to Involve Nonresident Fathers Overall sample N = 260
Mature Programs
N=18 Average Number of Practices to Involve Nonresident Fathers
3.1 (2.24) 5.1 (2.68)
SELECTED ITEMS % of Programs Using Strategy Invite father to events, by mail. 38.8% 72.2% Discuss the situation with the mother 63.5%
70.6%
Invite father in person 37.3% 61.1% Invite father by telephone 32.2% 88.9% Do nothing 8.1% 0%
Table 10
• We have already reported that a majority of programs indicate they reach out to nonresident biological fathers, (77.2%), and nonresident father figures, (57.9%). A greater proportion of mature programs reach out to nonresident fathers, as is true for mixed-approach programs. Programs serving African American families also serve a greater proportion of involved nonresident fathers than is true for programs serving other racial/cultural groups. Early Head Start programs emphasize outreach to nonresident fathers because many children in this program do not have a resident father. Programs in this study reported that fewer than half of children have resident fathers although about a quarter of children also have a nonresident father who is involved with them. Programs may also carefully help facilitate father involvement for children whose nonresident fathers are not currently involved with them. Incarcerated fathers constitute a subgroup of nonresident fathers. As we reported in Section 1, around three-quarters of programs have at least one father who is incarcerated; over 3 fathers are incarcerated per program on average across our programs. To learn what programs were doing to reach out to nonresident fathers, in general, and incarcerated fathers, specifically, we asked programs about their practices in these areas.
• To learn about what programs do to involve the nonresident fathers, program
respondents could mark all the responses that applied from a list of 12 options that had been generated from earlier focus group responses. (See Table 10.1 for a full list, Appendix C.) Programs appear to start with the mother; far and away the most common practice was to discuss the situation with the mother (80.8%). A distant second was a set of ways to reach out to nonresident fathers, inviting them by mail (38.8%), in person (37.3%) or by telephone (34.2%). It is noteworthy that very few programs (only 9.2%) reported they did not involve a nonresident biological father if there is a resident father and only 8.1% reported they do not reach out to nonresident fathers in general.
FATHER INVOLVEMENT IN EARLY HEAD START PROGRAMS
48
• Stage. Mature and mid-stage programs were not significantly different from early- stage programs in their tendency to discuss the situation with the mother, but they went further in regards to invitations to fathers by phone (88.9% of mature programs), mail (72.2%); or in person (61.1%). Mature programs were also significantly more likely than other programs to hold meetings for nonresident fathers (50.0% vs. 24.5% for mid-stage and 5.0% for early-stage programs) and to invite fathers to home visits by mail (38.9% vs. 18.9% vs. 14.4%). However, mid-stage followed by mature programs were far ahead of early-stage programs in actually conducting home visits with nonresident fathers (32.1% vs. 27.8% vs. 16.6%).
• Program Approach. There were a few differences in outreach strategies to
nonresident fathers by program approach and race, but not many. Notably, mixed-approach programs were significantly more likely to have compiled a list of nonresident fathers (about a fifth of these programs); as would be expected, home-based programs were more likely to conduct home visits with nonresident fathers (nearly a third of the home-based programs did this). Center-based programs were most likely to report they “do nothing” when it comes to outreach to nonresident fathers. However, only 13.8% of the center-based programs reported they do nothing.
• Race/Culture. Programs serving largely Hispanic and Caucasian families were most
likely to prepare duplicate Early Head Start materials for nonresident fathers as for mothers (about a third did this), while programs serving mostly Hispanic and African American fathers were most likely to invite nonresident fathers to events by mail (about half of these programs). Interestingly, programs serving mostly white families were most likely to mail “progress notes” to the nonresident father (about a fifth of these programs). Outreach of all kinds to nonresident fathers was least common in programs serving Native American families followed by those serving a mixture of racial/cultural groups.
���� ������������������������� �� �������������
“ Do you make an effort to involve incarcerated fathers? • Working with Early Head Start fathers who are in prison is a practice that may be
new to Early Head Start staff but it is not impossible. As we have noted, nearly three-quarters of Early Head Start programs have children with fathers who are in prison, some with several and a few with a large numbers of incarcerated fathers.
• We find that of programs that serve incarcerated fathers, about 10% reported they
make a strong effort to work with some or many fathers who are incarcerated.
• Stage. Mature programs were significantly more likely to report strong efforts to involve incarcerated fathers than other programs (40.0% of mature vs. 20.0% of mid- stage vs. 4.6% of early-stage programs), despite the fact mid-stage programs had more fathers in prison on average than early stage or mature programs.
• Approach, Race/Culture. There were no significant differences by program
approach or race/culture of families served in the tendency of programs to work with

FATHER INVOLVEMENT IN EARLY HEAD START PROGRAMS
49
incarcerated fathers; however, 17.7% of mixed programs as compared to a low of 2.5% of center-based programs made a strong effort to reach out to incarcerated fathers. Additionally, nearly 18.4% of programs serving African American families made a strong effort to reach out to incarcerated fathers, while, notably, no programs serving Native American fathers reported this form of outreach.
“ What do you do to involve incarcerated fathers?” • Overall, the most common practice related to incarcerated fathers was to “do
nothing” to involve incarcerated fathers (55.9%) and next, to discuss the situation with the mother (39.0%). Overt practices were fairly rare but included preparing duplicates of program materials for the fathers (completed in 7.5% of the programs with incarcerated fathers); mailing progress notes to fathers (4.8%); visiting fathers in prison (3.7%); discussing the situation with the fathers’ warden (3.2%); and conducting home visits in prison (2.7%).
• Stage. There were some differences by stage. Mature programs were significantly
more likely than others to visit the father in prison (26.7% mature vs. 8.6% of mid- stage programs vs. 0% early-stage) and to conduct home visits in prisons (13.3% mature vs. 5.7% mid-stage vs. .8% early). Mid-stage (14.3%) and mature programs (13.3%) both led early-stage programs (1.5%) in mailing progress notes to the father in prison. Interestingly, mid-stage programs (20.0%) were significantly more likely to report they send the father duplicates of program materials than early (5.3%) or mature (0%) programs.
• Program Approach. There were also some differences by program model. Center-
based programs (75.0%) were significantly more likely than home-based (54.7%) and mixed-approach programs (48.5%) report they “do nothing” in outreach to incarcerated fathers. Only one other difference approached significance; mixed programs were more likely to mail progress reports to fathers in prison (8.8%) than home-based programs (2.7%) or center-based (0%).
• Race/Culture. There were no significant differences based on race/culture of
families served in tendency to serve fathers in prison. However, it is noteworthy that no programs serving Native American fathers reported carrying out any of the practices to serve incarcerated fathers.

FATHER INVOLVEMENT IN EARLY HEAD START PROGRAMS
50
0. WORKING WITHIN THE COMMUNITY
The staff focus groups, comprised mostly of father involvement specialists from mature programs, revealed an important theme we had not anticipated. To be effective, these program representatives said programs have to “work within the village.” That means that successful father involvement programs cannot exist in isolation within Early Head Start or even Head Start. Rather, these successful programs work closely with other programs promoting fathers’ involvement within their communities and work together to create new and better services for fathers. The focus group participants provided examples of community-wide programs they had created, e.g., a program with local corporations to provide training and work experiences with good career opportunity for low-income men. Such a program, one father involvement coordinator stressed, would not be possible for one program working with a small group of fathers. Given the strength with which this theme came through the focus groups, we report here from questions on the survey that provide a focus on the community. Most of these items have been covered in our report already; however, here we bring the community lens to the findings.
+��������� �� �����((������$��������������� ����������������
• The 1996 welfare reform legislation stressed enforcement of child support by noncustodial parents, generally fathers. As Early Head Start serves many children whose fathers are noncustodial, as we have already demonstrated, it is reasonable to examine the relationships that exist between Early Head Start programs and child support enforcement agencies within communities. We asked several questions that have relevance to child support enforcement.
• The most general of these questions focused on involving the father in the program in
spite of child support issues was, “ Has your program worked through any of these situations and involved the father, when the father is not paying his share of child support.” (See Table 7.1.) Only 28.8% of the programs said they had success under this condition; however, 85.7% of mature programs had successfully worked this situation through, demonstrating that it is possible for Early Head Start programs to involve the father, even when he is so estranged from the family he is not paying child support. Mixed-approach programs were also significantly more likely to have success with this challenge.
• The foregoing is consistent with program responses to the questions, “ To what extent
does … (a) to involve fathers in financial child support or (b) to involve fathers to help nonresident dads stay in contact with their children and provide child support…reflect your program’s purpose for father involvement activities?” (Table 3.2.) about program purposes. Mature programs were most likely to include involving fathers in financial child support among their purposes (72.3% of mature vs. 27.9% of all programs) and to aim to help nonresident fathers stay in contact with their children and provide child support (68.8% of mature programs vs. 27.1% of all programs).

FATHER INVOLVEMENT IN EARLY HEAD START PROGRAMS
51
• Another question focused on the extent to which programs worked cooperatively with child support agencies to involve the father, “To what extent have you relied on… working with child support officials… to involve the father in the Early Head Start program when there are conflicts with respect to father roles and involvement?” (Table 7.1.) Only 11.4% of the programs reported they work with child support agencies to engage the father into Early Head Start. However, 27.8% of mature programs worked cooperatively with child support agencies as part of a strategy to engage fathers, and 15.1% of mixed approach programs did so as well. In both cases, the differences between these programs and their counterparts were significant.
• A more general question focuses on whether the program has a relationship with
child support at all, among the many community collaborators Early Head Start programs has community partnerships with. We asked, “ What has your program done to become father friendly? Have you developed a relationship with local child support enforcement?” (Table 4.1.) Only 32.6% of all programs report having such a relationship, although 50.0% of mature programs report a relationship with their local child support enforcement agency, significantly more than for their counterparts. Since this study was completed, the federal Head Start Bureau and the Office of Child Support Enforcement have collaboratively funded 21 Early Head Start programs to conduct fatherhood demonstration programs that emphasize, among other things, a working relationship between Early Head Start and child support enforcement.
+��������� ����������� ������ ��������������
• In other Early Head Start studies (ACYF 1999), we have learned that from a third to nearly a half of Early Head Start parents are receiving cash assistance when they begin the program. Thus, it is reasonable to propose that Early Head Start programs would have relationships with Temporary Assistance for Needy Families (TANF) administrators in their communities.
• We asked, first, the question that is more focused on the families, “ Has your
program successfully worked through any of these situations and involved the father…when the mother does not want to identify the father for fear of losing TANF subsidies?” (Table 7.1.) Only 29.6% of programs said they had worked through this challenge; however, 75.0% of mature programs had done so.
• A more specific question focused on community relationships with TANF
administrators as a way to engage fathers, “ To what extent have you relied upon…working with TANF administrators…to involve the father in the EHS programs when there are conflicts with respect to father roles an program involvement?” (Table 7.1.) Only 13.3% of programs said they had resolved such a challenge; however, 38.9% of mature programs had done so.
FATHER INVOLVEMENT IN EARLY HEAD START PROGRAMS
52
)������������*������� ������$����� �$������ �� ���� ���� ������������������������
• We asked a number of questions that focus on how programs view their mission for father involvement in light of community relationships and collaborations.
• To the question, “ To what extent does…to be recognized in the community as a
good resource for fathers…reflect your program’s purpose for father involvement?” (Table 3.2.) About half of all programs (46.5%) reported this was among their program’s purposes; however, 93.8% of mature programs aimed to be regarded as a good resource for fathers within their communities.
• Other questions focused on the extent to which programs referred fathers to other
program services within the community. To the question set “ What has your program done to become father friendly? Have you referred fathers to other agencies?” (Table 4.1.) 71.3% of programs reported they refer fathers to other agencies in the community. Mature programs were somewhat and significantly more likely than other programs to refer fathers (88.9%). Mixed approach (75.8%) and home-based (76.3%) programs were also significantly more likely to refer fathers to services in the community than center-based programs (59.4%).
• To the question focused on relying on the community to engage fathers when there is
family conflict, “ To what extent have you relied upon…referring the father to another agency (outside of EHS) and coordinate efforts with that agency…when there are conflicts with respect to father roles and program involvement?” (Table 7.1) only 15.1% of programs overall and 33.3% of mature programs responded affirmatively that they had worked with community agencies under such circumstances.
• Some programs operate “within the community” by relying on community sources to
help recruit fathers for Early Head Start program involvement. We asked, “To what extent do you rely upon the… (a) male staff who know fathers in the community; (b) other men in the community; and (c) other agencies within the community…to involve fathers in the Early Head Start program?” (Table 9.1.) In general, relying on the community for help in recruitment is fairly rare; 17.5% of all programs rely on male staff community contacts; 9.5% rely on other men in the community to help; and 16.8% rely on other agencies in the community to help recruit. Mature programs turned to the community more often; 73.3% rely on community contacts; 33.4% on other men in the community and 41.1% on other agencies for support in recruitment, all significantly higher than for early- and mid-stage programs. Interestingly, programs serving mostly African American, Hispanic and Native American families relied upon the community to a significantly greater extent than those serving families who were predominantly white or a mixture of races and cultures. Thus, the programs relying upon community appear to be building capital in their communities and may be able to grow father involvement more rapidly than is true for those less involved in community contacts. It is also possible that it is easier to turn to the community for support in homogenous racial/cultural communities where there are shared goals for families among service providers.
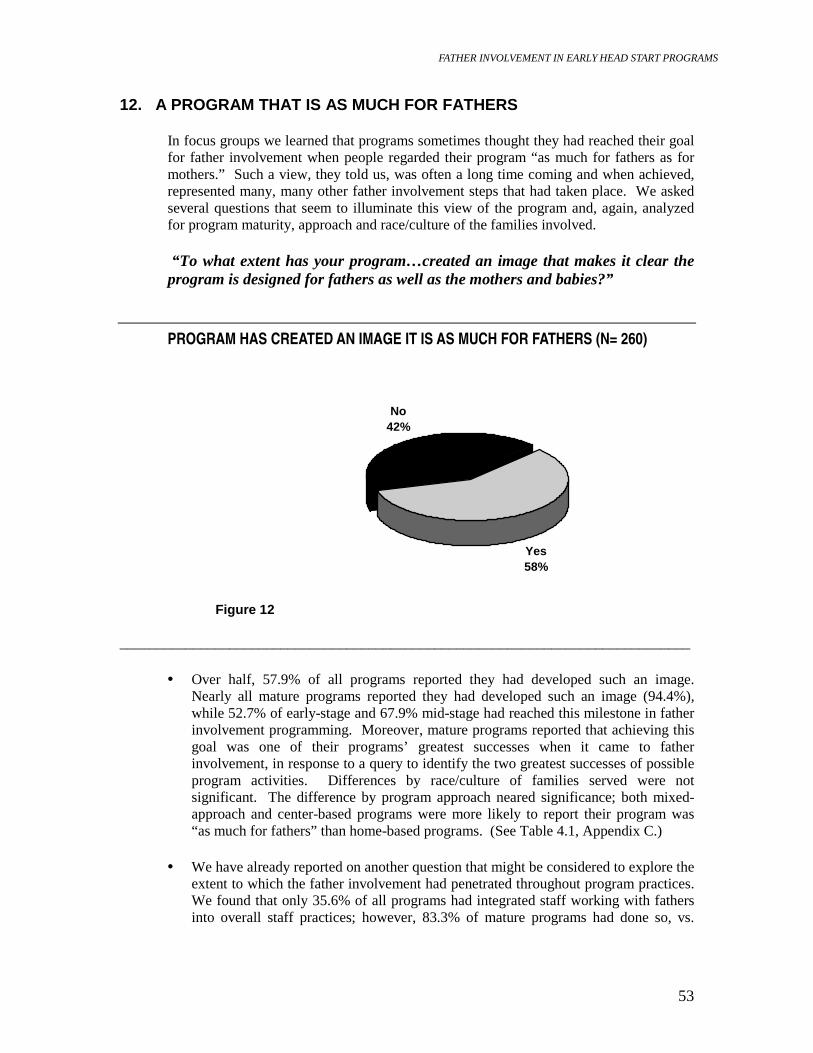
FATHER INVOLVEMENT IN EARLY HEAD START PROGRAMS
53
12. A PROGRAM THAT IS AS MUCH FOR FATHERS
In focus groups we learned that programs sometimes thought they had reached their goal for father involvement when people regarded their program “as much for fathers as for mothers.” Such a view, they told us, was often a long time coming and when achieved, represented many, many other father involvement steps that had taken place. We asked several questions that seem to illuminate this view of the program and, again, analyzed for program maturity, approach and race/culture of the families involved.
“ To what extent has your program…created an image that makes it clear the program is designed for fathers as well as the mothers and babies?”
PROGRAM HAS CREATED AN IMAGE IT IS AS MUCH FOR FATHERS (N= 260)
Yes58%
No42%
Figure 12
______________________________________________________________________________
• Over half, 57.9% of all programs reported they had developed such an image. Nearly all mature programs reported they had developed such an image (94.4%), while 52.7% of early-stage and 67.9% mid-stage had reached this milestone in father involvement programming. Moreover, mature programs reported that achieving this goal was one of their programs’ greatest successes when it came to father involvement, in response to a query to identify the two greatest successes of possible program activities. Differences by race/culture of families served were not significant. The difference by program approach neared significance; both mixed-approach and center-based programs were more likely to report their program was “as much for fathers” than home-based programs. (See Table 4.1, Appendix C.)
• We have already reported on another question that might be considered to explore the
extent to which the father involvement had penetrated throughout program practices. We found that only 35.6% of all programs had integrated staff working with fathers into overall staff practices; however, 83.3% of mature programs had done so, vs.

FATHER INVOLVEMENT IN EARLY HEAD START PROGRAMS
54
26.9% of early-stage and 54.7% of mid-stage programs. There were no differences by program model or race/culture of families served.
• Finally, another question may help us get at the question from another angle. We
asked, “What has your program done…recruit fathers who completed the program to work as mentors, recruiters and group facilitators.” Completing this activity aims at synergy by keeping the cycle going and building the pool of fathers who’ve been involved in the program to influence new fathers. Only 22.3% of all programs are able to build in this way; however, 61.1% of mature programs and 41.5% of mid- stage and 13.7% of early-stage programs reported so doing. (See Table 4.1, Appendix C.) There were no differences by program approach or race/culture of families served. Recruiting fathers who completed the program to work as mentors, recruiters and group facilitators was a second item that mature programs named as their “most important success” in building their father involvement program.
• Thus, when mature programs take stock of the successes that are most important to
them, they identify the types of actions that are most related to synergies of the program, developing a program image that the program is as much for fathers as for mothers, moving father involvement throughout program practices and having an “ infrastructure” of former fathers that helps them perpetuate the program.

FATHER INVOLVEMENT IN EARLY HEAD START PROGRAMS
55
������������� �$������ ������������������������%���������&����� �Early Head Start program responses to the survey (and focus groups) provided important information that can be used to more effectively involve fathers in programs in the future. Practices of mature programs point the way to greater father involvement in programs. In this section, we present recommendations based on the findings in the study.
DEVELOPING A FATHER INVOLVEMENT PROGRAM
Many lessons were learned from the survey about the ingredients for success in father involvement programs. Many of the lessons have been learned from mature program that have worked through some of the “bugs” of father involvement; others come from considering lessons from programs serving differing racial/cultural groups of fathers and still others can be gleaned by studying the patterns of father involvement from programs of different approaches.
Recommendations for programs include:
0. Identify purposes for a father involvement program. Identify multiple
goals for fathers. The study found that programs leading the way had a broad range purposes that they considered important aims for a father involvement program. In addition to focusing on increasing fathers’ involvement with children, these programs were more likely to have program goals focused on the father’s personal developments and on the father-mother relationship and on the leadership role of the program in the community than was true for other programs.
0. Think about the case management needs of fathers as well as of the
mothers and babies. Conduct needs assessments and make refer rals for fathers. Programs leading the way identified case management goals for fathers and they took steps to make the goals a reality. For example, they were more likely to conduct needs assessments with fathers and to make referrals of fathers to community services.
0. Hire a father involvement coordinator . Mature programs nearly all had
designated the responsibility of day-to-day management of father
FATHER INVOLVEMENT IN EARLY HEAD START PROGRAMS
56
involvement to an individual or, in some cases, two individuals. The findings suggest that it is difficult to carry out a father involvement component without a person who takes ownership for developing this component.
0. Hire men as program staff. Both the survey and focus groups underscored
the value of having men on staff. Mature programs often, but not always, hired a man for the role of father involvement coordinator but they nearly all had hired men in some capacities within the programs. Focus group participants stressed the value of men for recruiting male involvement in the program and for creating an impression that the program was for men as well as women and children.
0. Train the father involvement coordinator . Successful implementation of a
father involvement component is complex. Fortunately, training approaches have been developed for training staff to maximize the investment. Mature programs had nearly all provided training for their father involvement leadership while fewer other programs had done so.
0. Train all staff to work with fathers. Most staff have not had the training
they need to work with fathers. Every staff person can benefit from hearing about the best approaches for involving fathers. Many situations involving fathers are quite complex and staff can benefit from strategic planning and skills can be developed through training.
0. Identify and work through barr iers and challenging situations. It is
possible to involve many fathers despite barriers. The study showed that the majority of programs leading the way are able to involve fathers despite many challenging situations that might otherwise present insurmountable barriers. A first step is to identify the barriers and challenges. Some barriers seem to become even more apparent as programs mature, but awareness is the first step. The next step is to recognize that many barriers are surmountable. Program personnel can learn from the many strategies that mature programs employed and will develop their own strategies through awareness, problem solving and determination. Other barriers may require a concerted community approach and require a long-term effort on the part of the program.
0. Work with nonresident as well as resident fathers. Mature programs
successfully involved the majority of resident fathers but they also implemented many strategies for involving nonresident fathers. Such strategies may require considerable planning and problem solving. Mature programs had also identified some creative ways of working with incarcerated fathers.
0. Recruit fathers in many ways, though men as well as mothers. A key
finding in the study is that mature programs recruit very differently from other programs. They recruit through men and mothers, while other programs tend to recruit fathers through mothers. Relying on men to attract men may be a critical reason why the mature programs operate at a much higher level of father involvement than other programs. These programs
FATHER INVOLVEMENT IN EARLY HEAD START PROGRAMS
57
recruited through men on many levels—they hired men; used fathers involved in the program to attract other fathers; called upon fathers who had formerly been involved in the program to recruit; and worked in the community to recruit.
0. Work within the community. Form collaborations with child support and
TANF administrators and many other community collaborators. Mature programs appear to be highly engaged in community-wide efforts on behalf of fathers. It may take community-wide work to implement the father-focused social services that programs require for referrals. It may take a coordinated effort to recruit fathers across programs and within a single community. Our findings support a view that fathers get involved when other fathers like them are involved and critical mass for father involvement may require a community effort.
0. Conduct many activities to become father fr iendly, from inviting fathers
to events in multiple ways and including fathers’ names on all materials to making the environment father friendly. We learned about 26 different types of activities that are possible under the umbrella of father involvement. There are probably many more possible. The average program had only offered about half of the ones we queried although mature programs were carrying out nearly all of them. There is a very wide range of possibilities for father-friendly activities once a program brings the father lens to all the work that it does.
0. Form a program image that demonstrates the program is as much for
fathers as for mothers and children. Mature programs indicated they had reached a critical watermark by creating an image their program was as much for fathers as mothers and children. It likely takes some time and considerable effort to be able to send such a message to the fathers. Mature programs indicated this was one of the most important changes they had made and that this image successfully opened the door to higher levels of father involvement.
0. Recognize that different cultural groups will have different ways to
reach out to and include fathers. If the program serves African American families, recognize that similar programs have had success involving fathers in support groups, sports leagues and in father-child activities; if the program serves Hispanic families, recognize that similar programs have had successes involving fathers in whole family events and literacy and employment activities; if the program serves Caucasian families, recognize that similar programs have had successes involving fathers in home visits and group socializations but address the challenge of hiring men and a male father involvement coordinator. If the program serves Native Americans, recognize that similar groups have had successes involving fathers in all aspects of the program especially leadership positions, but also develop new programs to reach out to nonresident fathers. If the program serves mixed racial groups, recognize that father involvement will be more challenging for your program and attempt to reach out to fathers through cultural subgroup channels building towards more pluralistic involvement.

FATHER INVOLVEMENT IN EARLY HEAD START PROGRAMS
58
0. Capitalize on strengths of the program model and compensate for features not inherent in the model. If the program is center-based, plan for intentional father involvement in ways that are consistent with the program model. Fathers drop off and pick up their children for child care and such activities offer an opportunity for engaging the fathers. Provide case-management services for fathers as well as mothers and children. Consider fathers when planning the environment. If the program is home-based, build on tendencies of fathers to show interest in home visits; schedule home visits when fathers are home; encourage fathers to participate in group socializations and other group activities and provide case-management for fathers. If the program is a mixed-approach program, consider alternative ways of involving fathers in all program services, not just for those in center-based or home-based services.
0. Recognize the developmental nature of father involvement. Early-stage
programs should follow the example of mature programs, but also recognize and appreciate the developmental aspects of father involvement. It takes time to build a father involvement component; with time, however, high levels of father involvement are possible.
Early Head Start programs have made tremendous strides in the area of father involvement. Continued growth is expected as programs build on the lessons learned from the current study, from their own natural desire to improve program practices and from lessons of the 21 Early Head Start Fatherhood Demonstration sites, a study that is following the current study. Mature programs provide a model of exemplary practices and lead the way for all Early Head Start Programs.
FATHER INVOLVEMENT IN EARLY HEAD START PROGRAMS
59
REFERENCES Administration for Children and Families (2002). Making A Difference in the Lives of Infants and Toddlers and Their Families: The Impacts of Early Head Start. Washington, DC: DHHS. Administration on Children, Youth and Families (2001a). Building Their Futures: How Early Head Start Programs are Enhancing the Lives of Infants and Toddlers in Low-Income Families. Washington, DC: DHHS. Administration on Children, Youth and Families (2000a). Leading the Way: Characteristics and Early Experiences of Selected First-Wave Early Head Start Programs. Volume III: Program Implementation. Washington, DC: DHHS. Administration on Children, Youth and Families (2000b). Leading the Way: Characteristics and Early Experiences of Selected First Wave Early Head Start Programs. Executive Summary. Washington, DC: DHHS. Administration on Children, Youth and Families (2000c). Request for Applications: Fatherhood Demonstration. Program Announcement No. ACYF/HS 2000-10. Administration on Children, Youth and Families (1999a). Leading the Way: Characteristics and Early Experiences of Selected First-Wave Early Head Start Programs. Volume I: Cross Site Perspectives. Washington, DC: DHHS. Administration on Children, Youth and Families (1999b). Leading the Way: Characteristics and Early Experiences of Selected First-Wave Early Head Start Programs. Volume II: Program Profiles. Washington, DC: DHHS. The Carnegie Corporation of New York (1994). Starting Points: Meeting the Needs of Our Youngest Children. New York: NY: The Carnegie Corporation. Fagan, J. and Iglesias, A. (1999). Father involvement program effects on fathers, father figures and their Head Start children: A quasi-experimental study. Early Childhood Research Quarterly, 14-2, p. 243-269. Levine, J. Murphy, D.T. and Wilson, S. (1998). Getting men involved: strategies for early childhood programs. New York, NY: Families and Work Institute. Levine, J. (1993). Involving fathers in Head Start: A framework for public policy and program development. Families in Society, 74, 4-21. McBride, B.A., Rane, T.R., and Bae, J.H. (2000). Intervening with teachers to encourage father/male involvement in early childhood programs. Unpublished paper. Urbana, IL: University of Illinois.

FATHER INVOLVEMENT IN EARLY HEAD START PROGRAMS
60
Nord, C.W., Brinhall, D. and West, J. (1997). Fathers’ involvement in their children’s schools. Publication no. NCES 98-091. Washington, DC: National Center on Education Statistics. Sorensen, E., Mincy, R.B., and Halpern, A. (2000). Redirecting welfare policy toward building strong families. Paper prepared by the Urban Institute. Washington, D.C.: Urban Institute. Tamis-LeMonda, C.S. and Cabrera, N. (2002). The handbook of father involvement: multidisciplinary approaches. Mahwah, NJ: Lawrence Erlbaum Associates, Inc. U.S. Department of Health and Human Services (1994). The Statement of the Advisory Committee on Services for Families with Infants and Toddlers. Washington, DC: DHHS. U.S. Department of Health and Human Services (1993). Creating a 21st Century Head Start: Final Report of the Advisory Committee on Head Start Quality and Expansion. Washington, DC: DHHS.
FATHER INVOLVEMENT IN EARLY HEAD START PROGRAMS
61
Appendix A
Survey of Father Involvement in Ear ly Head Star t Programs
Can be found in Father Involvement Survey.

FATHER INVOLVEMENT IN EARLY HEAD START PROGRAMS
62
FATHER INVOLVEMENT IN EARLY HEAD START PROGRAMS
63
Appendix B
Issues and Oppor tunities in Involving Fathers in Ear ly Head
Star t Program
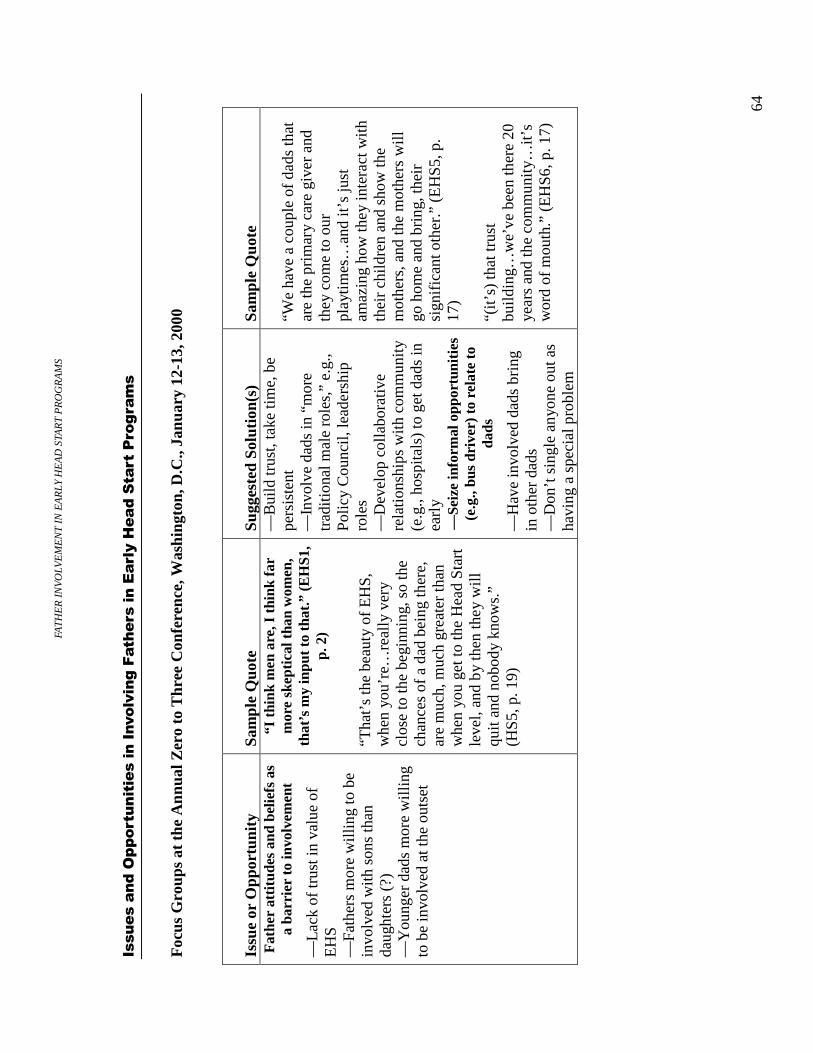
FA
TH
ER
IN
VO
LVE
ME
NT
IN E
AR
LY H
EA
D S
TAR
T P
RO
GR
AM
S
64
� �� �����((��������� ���������������� �� ����������%���������&����� �
Foc
us G
roup
s at
the
Ann
ual Z
ero
to T
hree
Con
fere
nce,
Was
hing
ton,
D.C
., Ja
nuar
y 12
-13,
200
0 Is
sue
or O
ppor
tuni
ty
Sam
ple
Quo
te
Sugg
este
d So
luti
on(s
) Sa
mpl
e Q
uote
F
athe
r at
titu
des
and
belie
fs a
s a
barr
ier
to in
volv
emen
t
—L
ack
of tr
ust i
n va
lue
of
EH
S
—Fa
ther
s m
ore
wil
ling
to b
e in
volv
ed w
ith
sons
than
da
ught
ers
(?)
—Y
oung
er d
ads
mor
e w
illi
ng
to b
e in
volv
ed a
t the
out
set
“I t
hink
men
are
, I t
hink
far
mor
e sk
epti
cal t
han
wom
en,
that
’s m
y in
put t
o th
at.”
(EH
S1,
p. 2
)
“Tha
t’s
the
beau
ty o
f E
HS
, w
hen
you’
re…
real
ly v
ery
clos
e to
the
begi
nnin
g, s
o th
e ch
ance
s of
a d
ad b
eing
ther
e,
are
muc
h, m
uch
grea
ter
than
w
hen
you
get t
o th
e H
ead
Sta
rt
leve
l, an
d by
then
they
wil
l qu
it a
nd n
obod
y kn
ows.
” (H
S5,
p. 1
9)
—B
uild
trus
t, ta
ke ti
me,
be
pers
iste
nt
—In
volv
e da
ds in
“m
ore
trad
itio
nal m
ale
role
s,”
e.g.
, P
olic
y C
ounc
il, l
eade
rshi
p ro
les
—D
evel
op c
olla
bora
tive
re
lati
onsh
ips
wit
h co
mm
unit
y (e
.g.,
hosp
ital
s) to
get
dad
s in
ea
rly
—Se
ize
info
rmal
opp
ortu
niti
es
(e.g
., bu
s dr
iver
) to
rel
ate
to
dads
—H
ave
invo
lved
dad
s br
ing
in o
ther
dad
s —
Don
’t s
ingl
e an
yone
out
as
havi
ng a
spe
cial
pro
blem
“We
have
a c
oupl
e of
dad
s th
at
are
the
prim
ary
care
giv
er a
nd
they
com
e to
our
pl
ayti
mes
…an
d it
’s ju
st
amaz
ing
how
they
inte
ract
wit
h th
eir
chil
dren
and
sho
w th
e m
othe
rs, a
nd th
e m
othe
rs w
ill
go h
ome
and
brin
g, th
eir
sign
ific
ant o
ther
.” (
EH
S5,
p.
17)
“(it
’s)
that
trus
t bu
ildi
ng…
we’
ve b
een
ther
e 20
ye
ars
and
the
com
mun
ity…
it’s
w
ord
of m
outh
.” (
EH
S6,
p. 1
7)

FA
TH
ER
IN
VO
LVE
ME
NT
IN E
AR
LY H
EA
D S
TAR
T P
RO
GR
AM
S
65
Cul
tura
l exp
ecta
tion
s m
itiga
te
agai
nst i
nvol
vem
ent
—C
ultu
ral r
ole
defi
niti
ons
(e.g
., H
ispa
nic)
exc
lude
fa
ther
s fr
om in
volv
emen
t in
chil
d’s
educ
atio
n
—
Wor
k w
ith
His
pani
c co
mm
unit
y on
impo
rtan
ce o
f fa
ther
in e
duca
tion
Sta
ff a
ttit
udes
and
EH
S
envi
ronm
ent a
s a
barr
ier:
“m
en k
ind
of f
eel i
ntim
idat
ed
bein
g in
the
cent
er…
part
of
—H
ave
mor
e st
aff
trai
ning
on
fath
er in
volv
emen
t iss
ues
“The
tea
cher
s w
ill te
ll (u
s) if
th
ey s
ee is
sues
wit
h th
ose
Is
sue
or O
ppor
tuni
ty
Sam
ple
Quo
te
Sugg
este
d So
luti
on(s
) Sa
mpl
e Q
uote
—
staf
f ar
e al
l fem
ale
—st
aff
have
thei
r ow
n is
sues
ab
out m
en
—m
ind
set i
s to
war
d w
omen
—
idea
that
fat
her
invo
lvem
ent
is a
spe
cial
pro
gram
, don
’t
need
to m
odif
y th
e w
hole
pr
ogra
m
—S
taff
in d
iffe
rent
pro
gram
s fe
el is
olat
ed in
dea
ling
wit
h fa
ther
issu
es
that
is o
ur f
ault
, bei
ng a
mon
g w
omen
, not
alw
ays
sens
itiv
e to
w
hat t
he m
en w
ant a
nd w
hat
mak
es th
em f
eel c
omfo
rtab
le”
(EH
S5,
p. 6
)
—H
ave
dad/
chil
d pi
ctur
es,
men
fea
ture
d in
pro
mot
iona
l m
ater
ials
—
Ens
ure
fath
er in
volv
emen
t in
all
par
ts o
f pr
ogra
m, e
.g.,
heal
th s
ervi
ces,
etc
. —
Dis
sem
inat
e re
sear
ch
resu
lts
quic
kly
—O
ffer
who
le-f
amil
y so
cial
izat
ions
—
Off
er s
port
s re
late
d ev
ents
—
Rel
ate
to d
ads
in w
ays
that
fi
t the
ir c
ogni
tive
sty
le; i
.e.,
conc
rete
act
ivit
ies,
act
ions
ra
ther
than
wor
ds
fam
ilies
and
we’
ll co
me
up w
ith
crea
tive
thin
gs t
hat t
hey
can
do
so t
hat
the
fath
ers
won
’t th
ink
that
they
’re
bein
g pi
cked
on,
w
e’ll
have
them
all
do t
hem
.”
(EH
S5, p
.25)
“It’
s re
ally
impo
rtan
t tha
t we
have
som
ebod
y…to
hel
p th
em
find
thei
r pl
ace
and…
spea
k to
th
em in
a w
ay th
at th
ey’l
l un
ders
tand
. A
h, th
eir
lear
ning
st
yle.
A lo
t of
guys
like
to d
o ac
tivi
ties
...w
here
as a
w
oman
…m
aybe
she
like
s to
sit
th
ere
and
talk
.” (
EH
S6,
p. 2
3)
Mot
hers
as
gate
keep
er
—M
om r
esen
ts d
ads
“hor
ning
“t
here
are
oft
en ti
mes
I w
ill
talk
to m
om a
nd m
om w
ill
—W
ork
wit
h m
othe
rs to
ed
ucat
e ab
out i
mpo
rtan
ce o
f “W
hen
it c
omes
to th
e ch
ild’
s ne
eds,
mom
alw
ays
wan
t to
do
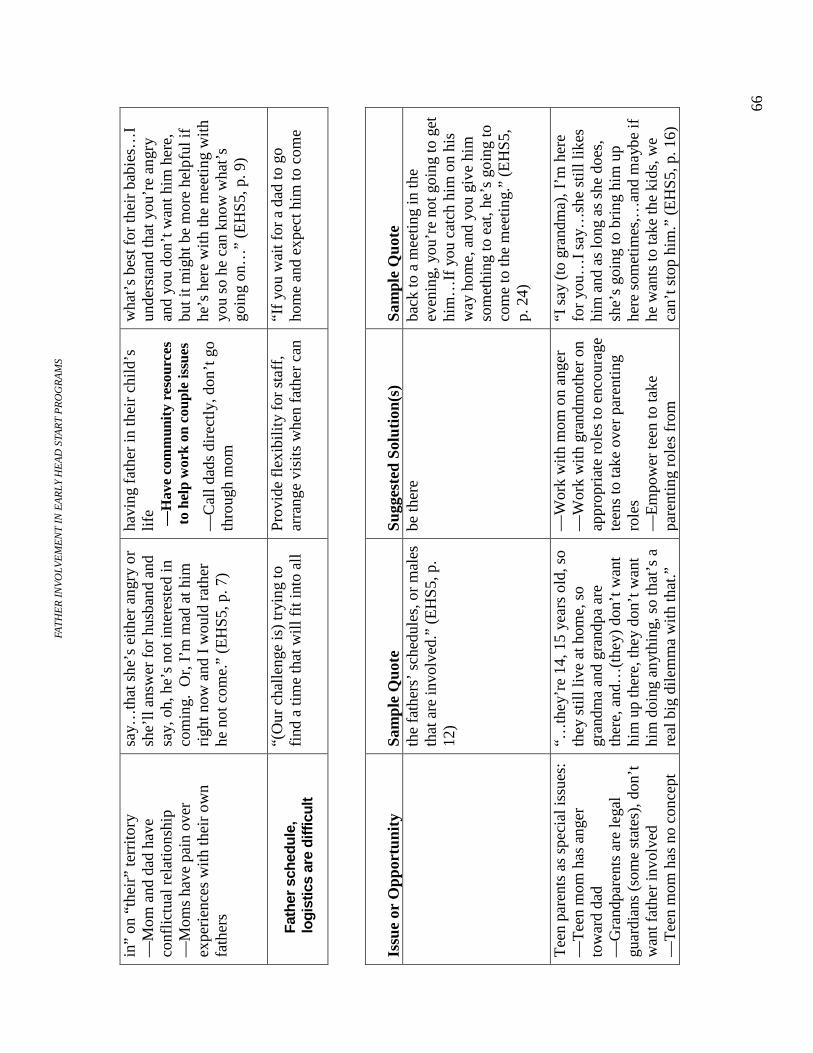
FA
TH
ER
IN
VO
LVE
ME
NT
IN E
AR
LY H
EA
D S
TAR
T P
RO
GR
AM
S
66
in”
on “
thei
r” te
rrit
ory
—M
om a
nd d
ad h
ave
conf
lict
ual r
elat
ions
hip
—M
oms
have
pai
n ov
er
expe
rien
ces
wit
h th
eir
own
fath
ers
say…
that
she
’s e
ithe
r an
gry
or
she’
ll a
nsw
er f
or h
usba
nd a
nd
say,
oh,
he’
s no
t int
eres
ted
in
com
ing.
Or,
I’m
mad
at h
im
righ
t now
and
I w
ould
rat
her
he n
ot c
ome.
” (E
HS
5, p
. 7)
havi
ng f
athe
r in
thei
r ch
ild’
s li
fe
—H
ave
com
mun
ity
reso
urce
s to
hel
p w
ork
on c
oupl
e is
sues
—C
all d
ads
dire
ctly
, don
’t g
o th
roug
h m
om
wha
t’s
best
for
thei
r ba
bies
…I
unde
rsta
nd th
at y
ou’r
e an
gry
and
you
don’
t wan
t him
her
e,
but i
t mig
ht b
e m
ore
help
ful i
f he
’s h
ere
wit
h th
e m
eeti
ng w
ith
you
so h
e ca
n kn
ow w
hat’
s go
ing
on…
” (E
HS
5, p
. 9)
Fath
er s
ched
ule,
lo
gist
ics
are
diff
icul
t
“(O
ur c
hall
enge
is)
tryi
ng to
fi
nd a
tim
e th
at w
ill f
it in
to a
ll
Pro
vide
fle
xibi
lity
for
sta
ff,
arra
nge
visi
ts w
hen
fath
er c
an
“If
you
wai
t for
a d
ad to
go
hom
e an
d ex
pect
him
to c
ome
Issu
e or
Opp
ortu
nity
Sa
mpl
e Q
uote
Su
gges
ted
Solu
tion
(s)
Sam
ple
Quo
te
th
e fa
ther
s’ s
ched
ules
, or
mal
es
that
are
invo
lved
.” (
EH
S5,
p.
12)
be th
ere
back
to a
mee
ting
in th
e ev
enin
g, y
ou’r
e no
t goi
ng to
get
hi
m…
If y
ou c
atch
him
on
his
way
hom
e, a
nd y
ou g
ive
him
so
met
hing
to e
at, h
e’s
goin
g to
co
me
to th
e m
eeti
ng.”
(E
HS
5,
p. 2
4)
T
een
pare
nts
as s
peci
al is
sues
: —
Tee
n m
om h
as a
nger
to
war
d da
d —
Gra
ndpa
rent
s ar
e le
gal
guar
dian
s (s
ome
stat
es),
don
’t
wan
t fat
her
invo
lved
—
Tee
n m
om h
as n
o co
ncep
t
“…th
ey’r
e 14
, 15
year
s ol
d, s
o th
ey s
till
live
at h
ome,
so
gran
dma
and
gran
dpa
are
ther
e, a
nd…
(the
y) d
on’t
wan
t hi
m u
p th
ere,
they
don
’t w
ant
him
doi
ng a
nyth
ing,
so
that
’s a
re
al b
ig d
ilem
ma
wit
h th
at.”
—W
ork
wit
h m
om o
n an
ger
—W
ork
wit
h gr
andm
othe
r on
ap
prop
riat
e ro
les
to e
ncou
rage
te
ens
to ta
ke o
ver
pare
ntin
g ro
les
—E
mpo
wer
teen
to ta
ke
pare
ntin
g ro
les
from
“I s
ay (
to g
rand
ma)
, I’m
her
e fo
r yo
u…I
say…
she
stil
l lik
es
him
and
as
long
as
she
does
, sh
e’s
goin
g to
bri
ng h
im u
p he
re s
omet
imes
,…an
d m
aybe
if
he w
ants
to ta
ke th
e ki
ds, w
e ca
n’t s
top
him
.” (
EH
S5,
p. 1
6)
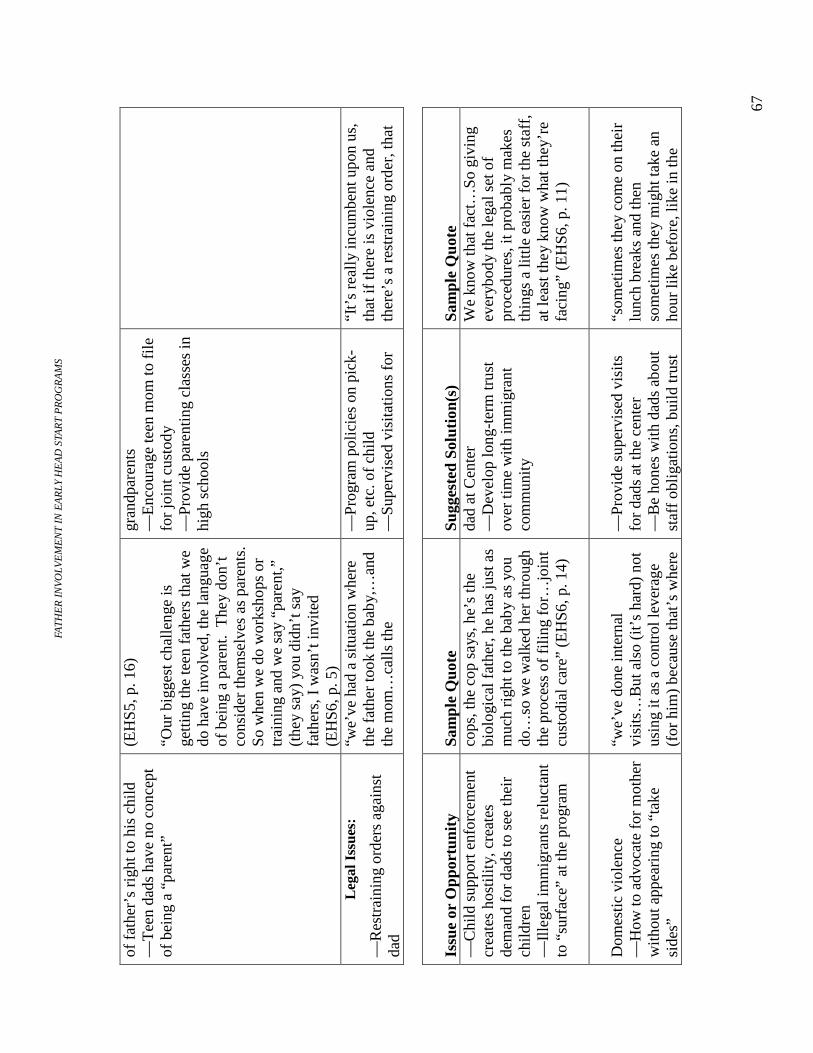
FA
TH
ER
IN
VO
LVE
ME
NT
IN E
AR
LY H
EA
D S
TAR
T P
RO
GR
AM
S
67
of f
athe
r’s
righ
t to
his
chil
d —
Tee
n da
ds h
ave
no c
once
pt
of b
eing
a “
pare
nt”
(EH
S5,
p. 1
6)
“Our
big
gest
cha
llen
ge is
ge
ttin
g th
e te
en f
athe
rs th
at w
e do
hav
e in
volv
ed, t
he la
ngua
ge
of b
eing
a p
aren
t. T
hey
don’
t co
nsid
er th
emse
lves
as
pare
nts.
S
o w
hen
we
do w
orks
hops
or
trai
ning
and
we
say
“par
ent,”
(t
hey
say)
you
did
n’t s
ay
fath
ers,
I w
asn’
t inv
ited
(E
HS
6, p
. 5)
gran
dpar
ents
—
Enc
oura
ge te
en m
om to
fil
e fo
r jo
int c
usto
dy
—P
rovi
de p
aren
ting
cla
sses
in
high
sch
ools
Leg
al I
ssue
s:
—R
estr
aini
ng o
rder
s ag
ains
t da
d
“we’
ve h
ad a
sit
uati
on w
here
th
e fa
ther
took
the
baby
,…an
d th
e m
om…
call
s th
e
—P
rogr
am p
olic
ies
on p
ick-
up, e
tc. o
f ch
ild
—S
uper
vise
d vi
sita
tion
s fo
r
“It’
s re
ally
incu
mbe
nt u
pon
us,
that
if th
ere
is v
iole
nce
and
ther
e’s
a re
stra
inin
g or
der,
that
Issu
e or
Opp
ortu
nity
Sa
mpl
e Q
uote
Su
gges
ted
Solu
tion
(s)
Sam
ple
Quo
te
—C
hild
sup
port
enf
orce
men
t cr
eate
s ho
stil
ity,
cre
ates
de
man
d fo
r da
ds to
see
thei
r ch
ildr
en
—Il
lega
l im
mig
rant
s re
luct
ant
to “
surf
ace”
at t
he p
rogr
am
cops
, the
cop
say
s, h
e’s
the
biol
ogic
al f
athe
r, h
e ha
s ju
st a
s m
uch
righ
t to
the
baby
as
you
do…
so w
e w
alke
d he
r th
roug
h th
e pr
oces
s of
fil
ing
for…
join
t cu
stod
ial c
are”
(E
HS
6, p
. 14)
dad
at C
ente
r —
Dev
elop
long
-ter
m tr
ust
over
tim
e w
ith
imm
igra
nt
com
mun
ity
We
know
that
fac
t…S
o gi
ving
ev
eryb
ody
the
lega
l set
of
proc
edur
es, i
t pro
babl
y m
akes
th
ings
a li
ttle
eas
ier
for
the
staf
f,
at le
ast t
hey
know
wha
t the
y’re
fa
cing
” (E
HS
6, p
. 11)
Dom
esti
c vi
olen
ce
—H
ow to
adv
ocat
e fo
r m
othe
r w
itho
ut a
ppea
ring
to “
take
si
des”
“we’
ve d
one
inte
rnal
vi
sits
…B
ut a
lso
(it’
s ha
rd)
not
usin
g it
as
a co
ntro
l lev
erag
e (f
or h
im)
beca
use
that
’s w
here
—P
rovi
de s
uper
vise
d vi
sits
fo
r da
ds a
t the
cen
ter
—B
e ho
nes
wit
h da
ds a
bout
st
aff
obli
gati
ons,
bui
ld tr
ust
“som
etim
es th
ey c
ome
on th
eir
lunc
h br
eaks
and
then
so
met
imes
they
mig
ht ta
ke a
n ho
ur li
ke b
efor
e, li
ke in
the

FA
TH
ER
IN
VO
LVE
ME
NT
IN E
AR
LY H
EA
D S
TAR
T P
RO
GR
AM
S
68
—H
ow to
kee
p tr
ust o
f da
d w
hen
staf
f ar
e m
anda
ted
repo
rter
s —
How
to a
sses
s ho
me
situ
atio
n to
det
erm
ine
risk
s
stuf
f (v
iole
nce)
com
es
from
…N
ot tr
ying
to a
ppea
r to
m
om th
at w
e’re
, you
kno
w,
sidi
ng u
p w
ith
him
as
wel
l, so
it
’s a
rea
l fin
e li
ne to
wal
k”
(EH
S6,
p. 1
2)
mor
ning
and
com
e an
d sp
end
that
hou
r in
the
clas
sroo
m…
beca
use
they
are
in
a si
tuat
ion
wit
h th
e m
om,
they
’ll c
ome
and
spen
d an
hou
r (h
ere)
” (E
HS
5, p
.21)
“W
e ar
e al
l man
date
d re
port
ers…
part
of
that
trus
t is
bein
g up
fro
nt a
nd o
pen
from
th
e be
ginn
ing
and
esta
blis
hing
, w
e’re
not
goi
ng to
kee
p an
ythi
ng f
rom
you
. I’
m g
oing
to
let y
ou k
now
thin
gs u
p fr
ont.”
(E
HS
9, p
. 19)
C
onfu
sion
abo
ut o
utco
mes
of
fath
er in
volv
emen
t:
—Is
pur
pose
pur
ely
to in
volv
e
“Eve
n li
ke m
y hu
sban
d…I’
m
like
, oka
y, y
ou’r
e a
man
, and
yo
u lo
ve, y
ou k
now
, you
love
Cla
rify
val
ue o
f fa
ther
in
volv
emen
t to
chil
d de
velo
pmen
t
“The
re’s
a lo
t to
be g
aine
d fr
om
staf
f pe
ople
. I
thin
k a
lot o
f te
ache
rs…
espe
cial
ly if
you
Issu
e or
Opp
ortu
nity
Sa
mpl
e Q
uote
Su
gges
ted
Solu
tion
(s)
Sam
ple
Quo
te
Dad
in E
HS
? —
Is p
urpo
se to
invo
lve
dad
wit
h ch
ild?
—
Wha
t is
outc
ome
of
invo
lvin
g da
d w
ith
chil
d?
our
kid,
and
he
just
was
n’t a
ny
help
, bec
ause
he
felt
like
he
did
ever
ythi
ng w
ith
our
kids
in
our
hom
e an
d he
did
ev
eryt
hing
we
wan
ted
fath
ers
to d
o at
hom
e, b
ut h
e w
ould
n’t
go to
sch
ool.”
(E
HS
5, p
. 22)
ta
lk a
bout
how
the
love
of
the
fath
er a
nd h
ow it
aug
men
ts o
r ac
cele
rate
s le
arni
ng, h
ey m
an,
wha
t mor
e do
you
wan
t?”
(EH
S4,
p. 1
7)
Hir
ing
men
as
staf
f in
EH
S
—Is
sues
wit
h fi
ndin
g “I
thin
k m
y bi
gges
t cha
llen
ge
is th
at w
e be
abl
e to
kee
p (3
P
lace
fat
hers
in v
isib
le c
hild
nu
rtur
ing
role
s in
Cen
ter
“The
y ha
ve a
mal
e ro
le m
odel
at
the
cent
er, a
nd…
I m
ean
he
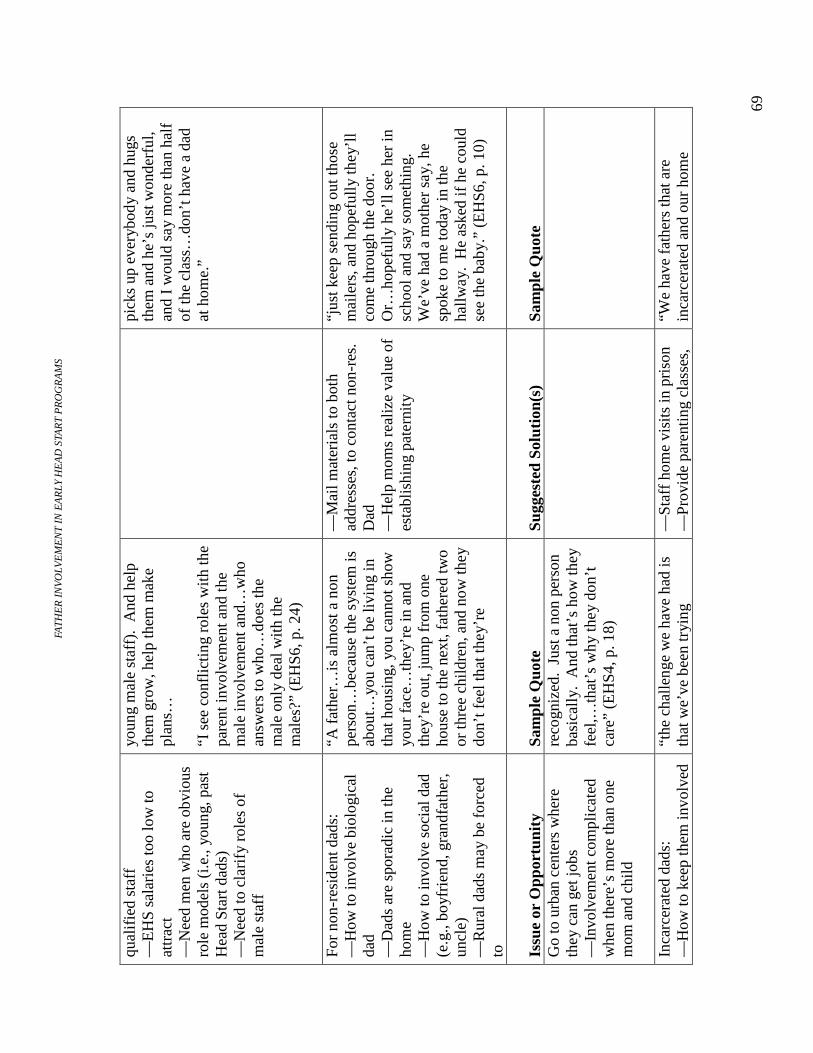
FA
TH
ER
IN
VO
LVE
ME
NT
IN E
AR
LY H
EA
D S
TAR
T P
RO
GR
AM
S
69
qual
ifie
d st
aff
—E
HS
sal
arie
s to
o lo
w to
at
trac
t —
Nee
d m
en w
ho a
re o
bvio
us
role
mod
els
(i.e
., yo
ung,
pas
t H
ead
Sta
rt d
ads)
—
Nee
d to
cla
rify
rol
es o
f m
ale
staf
f
youn
g m
ale
staf
f).
And
hel
p th
em g
row
, hel
p th
em m
ake
plan
s…
“I s
ee c
onfl
icti
ng r
oles
wit
h th
e pa
rent
invo
lvem
ent a
nd th
e m
ale
invo
lvem
ent a
nd…
who
an
swer
s to
who
…do
es th
e m
ale
only
dea
l wit
h th
e m
ales
?” (
EH
S6,
p. 2
4)
pi
cks
up e
very
body
and
hug
s th
em a
nd h
e’s
just
won
derf
ul,
and
I w
ould
say
mor
e th
an h
alf
of th
e cl
ass…
don’
t hav
e a
dad
at h
ome.
”
For
non-
resi
dent
dad
s:
—H
ow to
invo
lve
biol
ogic
al
dad
—D
ads
are
spor
adic
in th
e ho
me
—H
ow to
invo
lve
soci
al d
ad
(e.g
., bo
yfri
end,
gra
ndfa
ther
, un
cle)
—
Rur
al d
ads
may
be
forc
ed
to
“A f
athe
r…is
alm
ost a
non
pe
rson
…be
caus
e th
e sy
stem
is
abou
t…yo
u ca
n’t b
e li
ving
in
that
hou
sing
, you
can
not s
how
yo
ur f
ace…
they
’re
in a
nd
they
’re
out,
jum
p fr
om o
ne
hous
e to
the
next
, fat
here
d tw
o or
thre
e ch
ildr
en, a
nd n
ow th
ey
don’
t fee
l tha
t the
y’re
—M
ail m
ater
ials
to b
oth
addr
esse
s, to
con
tact
non
-res
. D
ad
—H
elp
mom
s re
aliz
e va
lue
of
esta
blis
hing
pat
erni
ty
“jus
t kee
p se
ndin
g ou
t tho
se
mai
lers
, and
hop
eful
ly th
ey’l
l co
me
thro
ugh
the
door
. O
r…ho
pefu
lly
he’l
l see
her
in
scho
ol a
nd s
ay s
omet
hing
. W
e’ve
had
a m
othe
r sa
y, h
e sp
oke
to m
e to
day
in th
e ha
llw
ay.
He
aske
d if
he
coul
d se
e th
e ba
by.”
(E
HS
6, p
. 10)
Issu
e or
Opp
ortu
nity
Sa
mpl
e Q
uote
Su
gges
ted
Solu
tion
(s)
Sam
ple
Quo
te
Go
to u
rban
cen
ters
whe
re
they
can
get
jobs
—
Invo
lvem
ent c
ompl
icat
ed
whe
n th
ere’
s m
ore
than
one
m
om a
nd c
hild
reco
gniz
ed.
Just
a n
on p
erso
n ba
sica
lly.
And
that
’s h
ow th
ey
feel
,…th
at’s
why
they
don
’t
care
” (E
HS
4, p
. 18)
Inca
rcer
ated
dad
s:
—H
ow to
kee
p th
em in
volv
ed
“the
cha
llen
ge w
e ha
ve h
ad is
th
at w
e’ve
bee
n tr
ying
—
Sta
ff h
ome
visi
ts in
pri
son
—P
rovi
de p
aren
ting
cla
sses
, “W
e ha
ve f
athe
rs th
at a
re
inca
rcer
ated
and
our
hom
e

FA
TH
ER
IN
VO
LVE
ME
NT
IN E
AR
LY H
EA
D S
TAR
T P
RO
GR
AM
S
70
duri
ng ja
il te
rm
—H
ow to
pre
pare
for
re-
entr
y in
fam
ily
and
com
mun
ity
—D
eali
ng w
ith
host
ilit
y an
d an
ger
of in
carc
erat
ed d
ads
—In
carc
erat
ed d
ads
may
hav
e ba
ck c
hild
sup
port
that
ac
cum
ulat
ed f
rom
thei
r ti
me
in p
riso
n
to…
subm
it g
rant
s an
d th
ey g
et
turn
ed d
own…
revi
ewer
s sa
y th
ings
like
, inc
arce
rate
d m
en
aren
’t f
athe
rs”
(EH
S4,
p. 5
) “A
noth
er th
ing
wit
h m
en w
ho
are
inca
rcer
ated
is, t
hey
have
a
lot o
f ho
stil
ity,
that
’s n
ot
sepa
rate
d fr
om th
e no
rmal
pe
rson
on
the
stre
et…
you
have
to
be
able
to, i
n a
grou
p se
ttin
g, b
e ab
le to
dea
l wit
h th
ose
issu
es”
(EH
S4,
p. 1
8)
“I w
as a
maz
ed a
t how
the
pris
on a
lso
did
not t
hink
of
the
men
as
fath
ers.
Whe
n I
aske
d th
em, w
hat p
erce
ntag
e, h
ow
man
y of
you
r in
mat
es a
re
fath
ers,
he
didn
’t k
now
” (E
HS
4, p
. 13)
“T
o be
hon
es w
ith
you,
I w
as
iden
tify
dev
. Cha
ract
eris
tics
of
chi
ld a
t rel
ease
tim
e —
Pro
vide
fun
ding
to s
uppo
rt
mom
and
chi
ld v
isit
s to
pri
son
—E
ncou
rage
mom
to w
rite
to
dad
—P
rovi
de a
ran
ge o
f co
ordi
nate
d re
sour
ces
to h
elp
dad
re-c
onne
ct
—P
rovi
de a
nger
man
agem
ent
prog
ram
s —
Use
men
who
wer
e in
carc
erat
ed a
s le
ader
s
visi
tor
wen
t up
and
visi
ted
the
fath
er, i
n pr
ison
. A
nd a
sked
the
mom
if it
was
oka
y, if
she
sen
t pr
ogre
ss n
otes
to th
e da
d, to
let
him
kno
w h
ow th
e ba
by w
as
prog
ress
ing,
cop
ies
of th
e A
SQ
, pi
ctur
es…
” (E
HS
6, p
. 7)
“…if
you
wer
e in
pri
son
whe
n th
is c
hild
was
2 y
ears
old
, and
no
w th
e ch
ild
is 6
yea
rs o
ld, i
t’s
goin
g to
be
a di
ffer
ent
ball
gam
e. S
o th
at m
an n
eeds
to
be f
ocus
ed, w
hat k
ind
of a
chi
ld
is a
six
yea
r ol
d li
ke…
” (E
HS
4,
p. 1
3)
Issu
e or
Opp
ortu
nity
Sa
mpl
e Q
uote
Su
gges
ted
Solu
tion
(s)
Sam
ple
Quo
te
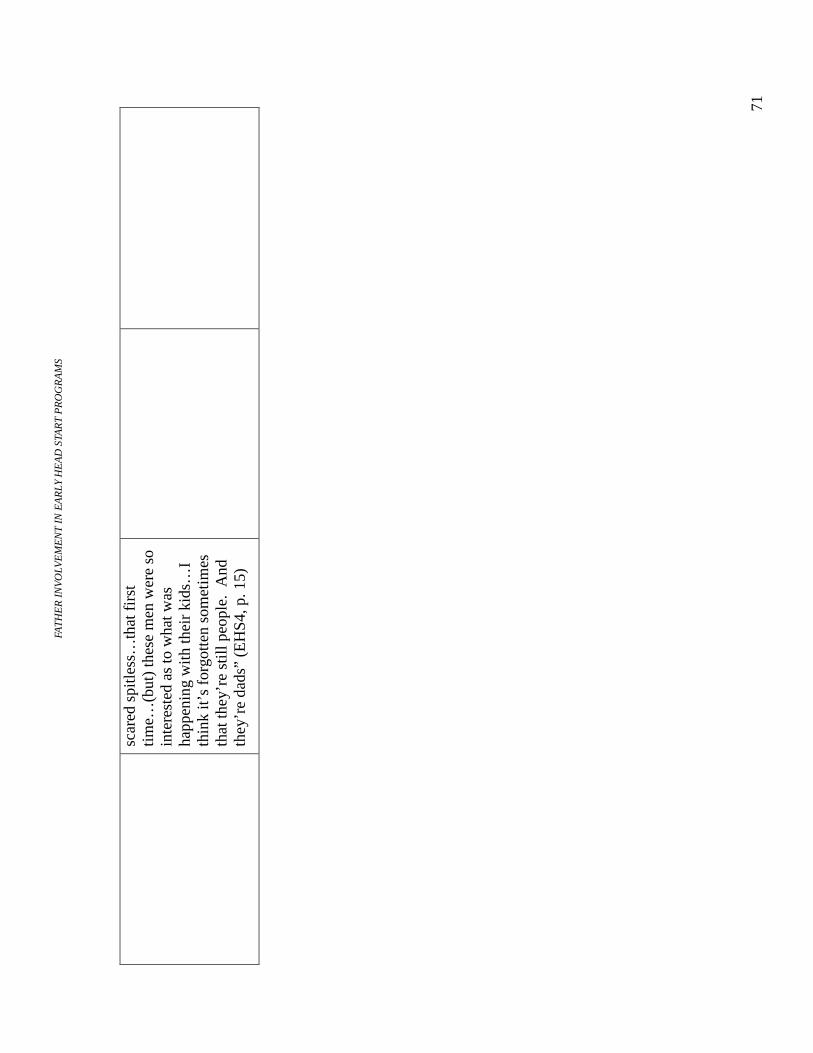
FA
TH
ER
IN
VO
LVE
ME
NT
IN E
AR
LY H
EA
D S
TAR
T P
RO
GR
AM
S
71
sc
ared
spi
tles
s…th
at f
irst
ti
me…
(but
) th
ese
men
wer
e so
in
tere
sted
as
to w
hat w
as
happ
enin
g w
ith
thei
r ki
ds…
I th
ink
it’s
for
gott
en s
omet
imes
th
at th
ey’r
e st
ill p
eopl
e. A
nd
they
’re
dads
” (E
HS
4, p
. 15)

FA
TH
ER
IN
VO
LVE
ME
NT
IN E
AR
LY H
EA
D S
TAR
T P
RO
GR
AM
S
72
Nee
d fo
r co
mm
unit
y-w
ide
coll
abor
atio
n—vi
llag
e ap
proa
ch
—N
eed
to u
tili
ze w
ide
vari
ety
of c
omm
unit
y re
sour
ces
—N
eed
to a
dvoc
ate
for
othe
r ag
enci
es to
cha
nge
expe
ctat
ions
abo
ut f
athe
rs
—L
ack
of a
war
enes
s by
oth
er
agen
cies
of
pote
ntia
l use
of
EH
S
—E
HS
as
a ch
ild
deve
lopm
ent p
rogr
am m
ay
not b
e fo
cusi
ng o
n, s
uch
serv
ices
suc
h as
thes
e, e
.g.
empl
oym
ent a
nd o
ther
ag
enci
es m
ay c
ompl
emen
t —
EH
S m
ay to
o of
ten
oper
ate
in a
vac
uum
—
Oth
er a
genc
ies
may
not
be
carr
ying
out
fat
her
init
iati
ves
“I d
id g
et to
hav
e a
conv
ersa
tion
wit
h th
e di
rect
or
of th
e (d
omes
tic
viol
ence
sh
elte
r), a
nd s
he w
as
won
deri
ng w
hy w
e w
ere
ther
e…th
en a
cou
ple
of w
eeks
la
ter…
we
got a
ref
erra
l (fr
om
stat
e pr
otec
tion
ser
vice
).
The
y’re
bac
k in
our
pr
ogra
m…
DC
FS h
as n
o cl
ue
why
wer
en’t
see
ing
her,
ther
e’s
just
a lo
t of
conf
usio
n, a
lot o
f do
uble
sto
ries
.” (
EH
S6,
p. 2
6)
—In
tera
genc
y ed
ucat
ion,
tr
aini
ng
—A
dvoc
ate
on b
ehal
f of
dad
s fo
r ch
ange
in s
ervi
ce s
yste
m
—E
HS
as
havi
ng a
lead
ersh
ip
role
in m
ale
invo
lvem
ent
—B
roke
r an
d br
ing
in e
xper
ts
from
var
iety
of
reso
urce
s
“The
re a
re r
esou
rces
in o
ur
com
mun
ity
and
I th
ink
the
firs
t st
ep w
e ta
ke is
to m
ake
them
aw
are
of th
e re
sour
ces
that
are
av
aila
ble
to th
em”
(EH
S6,
p.
25)
“Whe
n I
say
advo
cacy
, I’m
sa
ying
that
we
need
to b
e th
e on
es, a
s th
e pr
ogra
m in
our
co
mm
unit
y, to
rea
lly
step
out
an
d m
ake
sure
that
peo
ple
know
th
at th
is p
rogr
am is
a le
ader
in
invo
lvin
g m
ales
in th
e li
ves
of
thei
r ch
ildr
en”
EH
S6,
p. 3
4)

FA
TH
ER
IN
VO
LVE
ME
NT
IN E
AR
LY H
EA
D S
TAR
T P
RO
GR
AM
S
73


FATHER INVOLVEMENT IN EARLY HEAD START PROGRAMS
75
Appendix C
Findings in Tabular Form
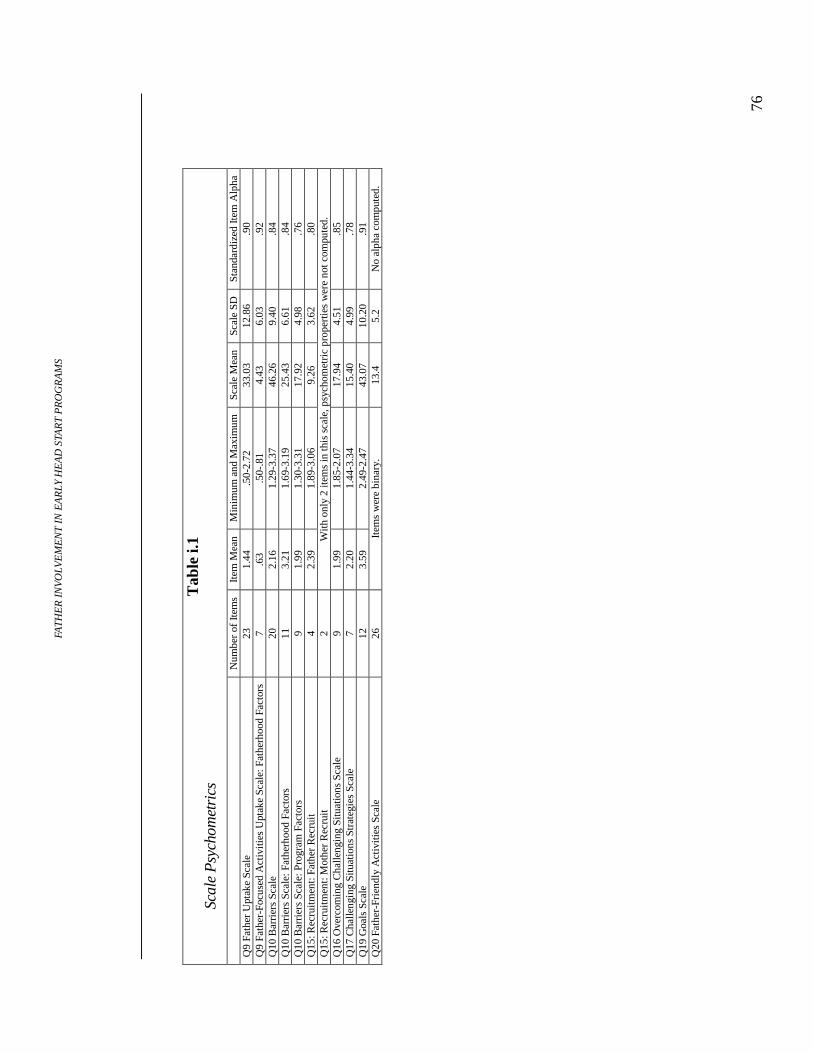
FA
TH
ER
IN
VO
LVE
ME
NT
IN E
AR
LY H
EA
D S
TAR
T P
RO
GR
AM
S
76
�
Tab
le i.
1 Sc
ale
Psy
chom
etri
cs
N
umbe
r of
Ite
ms
Item
Mea
n M
inim
um a
nd M
axim
um
Scal
e M
ean
Scal
e SD
St
anda
rdiz
ed It
em A
lpha
Q
9 Fa
ther
Upt
ake
Scal
e 23
1.
44
.50-
2.72
33
.03
12.8
6 .9
0 Q
9 Fa
ther
-Foc
used
Act
iviti
es U
ptak
e Sc
ale:
Fat
herh
ood
Fact
ors
7 .6
3 .5
0-.8
1 4.
43
6.03
.9
2 Q
10 B
arri
ers
Scal
e 20
2.
16
1.29
-3.3
7 46
.26
9.40
.8
4 Q
10 B
arri
ers
Scal
e: F
athe
rhoo
d Fa
ctor
s 11
3.
21
1.69
-3.1
9 25
.43
6.61
.8
4 Q
10 B
arri
ers
Scal
e: P
rogr
am F
acto
rs
9 1.
99
1.30
-3.3
1 17
.92
4.98
.7
6 Q
15: R
ecru
itmen
t: Fa
ther
Rec
ruit
4
2.39
1.
89-3
.06
9.26
3.
62
.80
Q15
: Rec
ruitm
ent:
Mot
her
Rec
ruit
2
Wit
h on
ly 2
item
s in
this
sca
le, p
sych
omet
ric
prop
ertie
s w
ere
not c
ompu
ted.
Q
16 O
verc
omin
g C
halle
ngin
g Si
tuat
ions
Sca
le
9 1.
99
1.85
-2.0
7 17
.94
4.51
.8
5 Q
17 C
halle
ngin
g Si
tuat
ions
Str
ateg
ies
Scal
e 7
2.20
1.
44-3
.34
15.4
0 4.
99
.78
Q19
Goa
ls S
cale
12
3.
59
2.49
-2.4
7 43
.07
10.2
0 .9
1 Q
20 F
athe
r-Fr
iend
ly A
ctiv
ities
Sca
le
26
Item
s w
ere
bina
ry.
13.4
5.
2 N
o al
pha
com
pute
d.
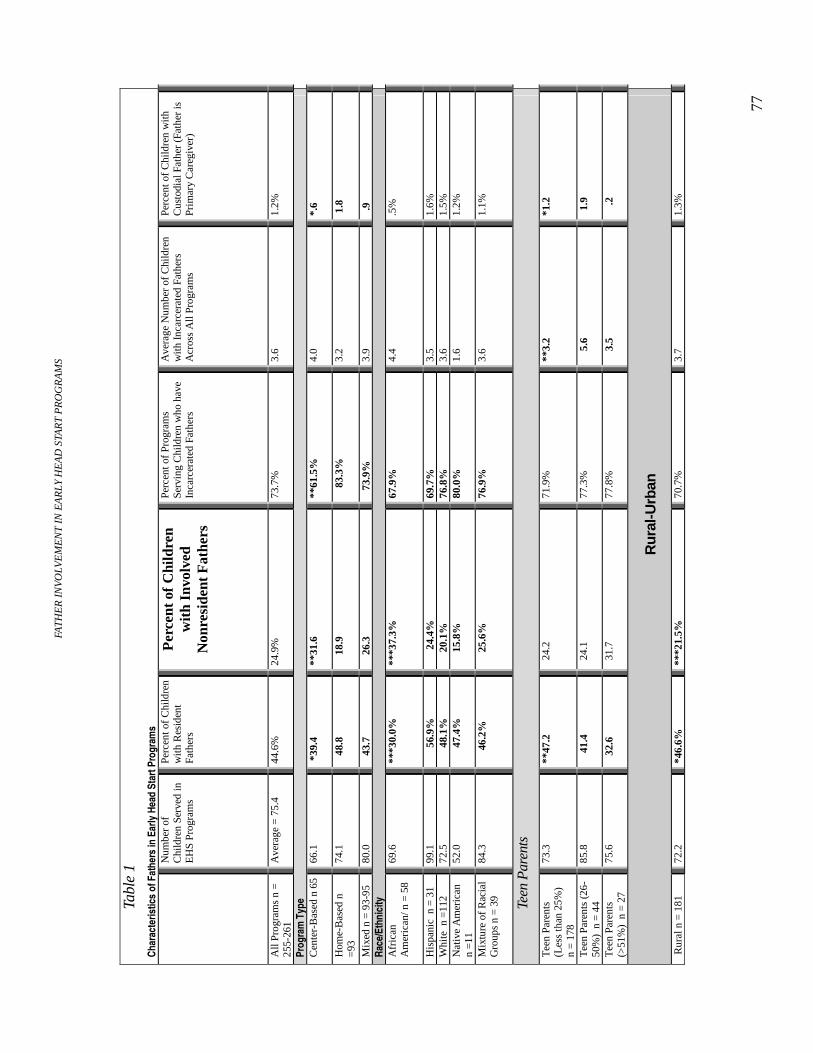
FA
TH
ER
IN
VO
LVE
ME
NT
IN E
AR
LY H
EA
D S
TAR
T P
RO
GR
AM
S
77
Tabl
e 1
Char
acte
ristic
s of
Fat
hers
in E
arly
Hea
d St
art P
rogr
ams
N
umbe
r of
C
hild
ren
Serv
ed in
E
HS
Prog
ram
s
Perc
ent o
f C
hild
ren
wit
h R
esid
ent
Fath
ers
Per
cent
of
Chi
ldre
n w
ith
Invo
lved
N
onre
side
nt F
athe
rs
Perc
ent o
f Pr
ogra
ms
Serv
ing
Chi
ldre
n w
ho h
ave
Inca
rcer
ated
Fat
hers
Ave
rage
Num
ber
of C
hild
ren
wit
h In
carc
erat
ed F
athe
rs
Acr
oss
All
Prog
ram
s
Perc
ent o
f C
hild
ren
with
C
usto
dial
Fat
her
(Fat
her
is
Prim
ary
Car
egiv
er)
All
Prog
ram
s n
= 25
5-26
1 A
vera
ge =
75.
4 44
.6%
24
.9%
73
.7%
3.
6 1.
2%
Prog
ram
Typ
e C
ente
r-B
ased
n 6
5 66
.1
*39
.4
**31
.6
**
61.5
%
4.0
*.6
Hom
e-B
ased
n
=93
74
.1
48
.8
1
8.9
8
3.3%
3.
2 1
.8
Mix
ed n
= 9
3-95
80
.0
43
.7
2
6.3
73
.9%
3.
9 .
9 Ra
ce/E
thni
city
A
fric
an
Am
eric
an/ n
= 5
8
69.6
**
*30.
0%
***3
7.3%
67
.9%
4.
4 .5
%
His
pani
c n
= 3
1 99
.1
56.9
%
24.4
%
69.7
%
3.5
1.6%
W
hite
n =
112
72.5
48
.1%
20.
1%
76.8
%
3.6
1.5%
N
ativ
e A
mer
ican
n
=11
52.0
47
.4%
15.
8%
80.0
%
1.6
1.2%
Mix
ture
of
Rac
ial
Gro
ups
n =
39
84.3
46.
2%
2
5.6%
76
.9%
3.
6
1.1%
Teen
Par
ents
Tee
n Pa
rent
s (L
ess
than
25%
)
n =
178
73.3
**
47.2
2
4.2
71.9
%
**3.
2 *1
.2
Tee
n Pa
rent
s (2
6-50
%)
n =
44
85.8
41.
4 2
4.1
77.3
%
5
.6
1.9
Tee
n Pa
rent
s (>
51%
) n
= 2
7 75
.6
32
.6
31.
7 77
.8%
3.5
.2
Rur
al-U
rban
Rur
al n
= 1
81
72.2
*4
6.6%
**
*21.
5%
70.7
%
3.7
1.3%
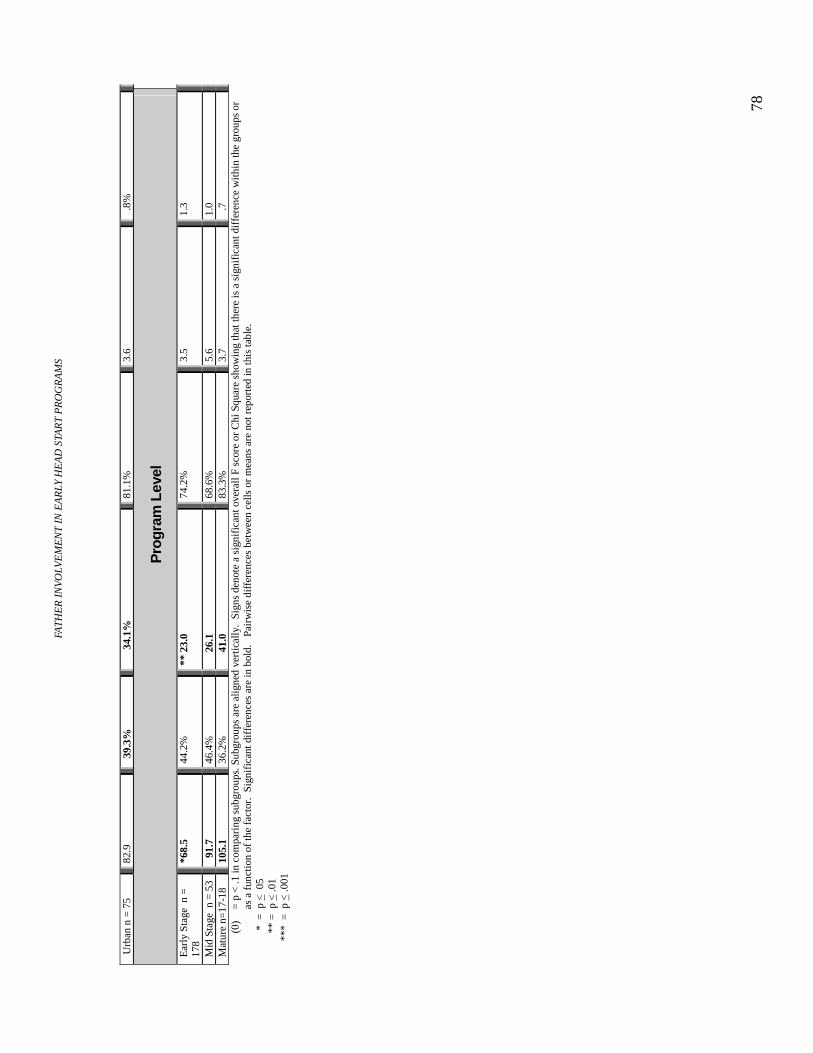
FA
TH
ER
IN
VO
LVE
ME
NT
IN E
AR
LY H
EA
D S
TAR
T P
RO
GR
AM
S
78
Urb
an n
= 7
5 82
.9
39.
3%
34.1
%
81.1
%
3.6
.8%
Pro
gram
Lev
el
Ear
ly S
tage
n =
17
8 *6
8.5
44.2
%
** 2
3.0
74.2
%
3.5
1.3
Mid
Sta
ge n
= 5
3 9
1.7
46.4
%
2
6.1
68.6
%
5.6
1.0
Mat
ure
n=17
-18
105.
1 36
.2%
41.
0 83
.3%
3.
7 .
7 (0
) =
p <
.1 in
com
pari
ng s
ubgr
oups
. Sub
grou
ps a
re a
ligne
d ve
rtic
ally
. Si
gns
deno
te a
sig
nifi
cant
ove
rall
F sc
ore
or C
hi S
quar
e sh
owin
g th
at th
ere
is a
sig
nifi
cant
dif
fere
nce
wit
hin
the
grou
ps o
r as
a f
unct
ion
of th
e fa
ctor
. Si
gnif
ican
t dif
fere
nces
are
in b
old.
Pa
irw
ise
diff
eren
ces
betw
een
cells
or
mea
ns a
re n
ot r
epor
ted
in th
is ta
ble.
*
= p
< 0
5 **
= p
< .0
1
**
* =
p <
.001
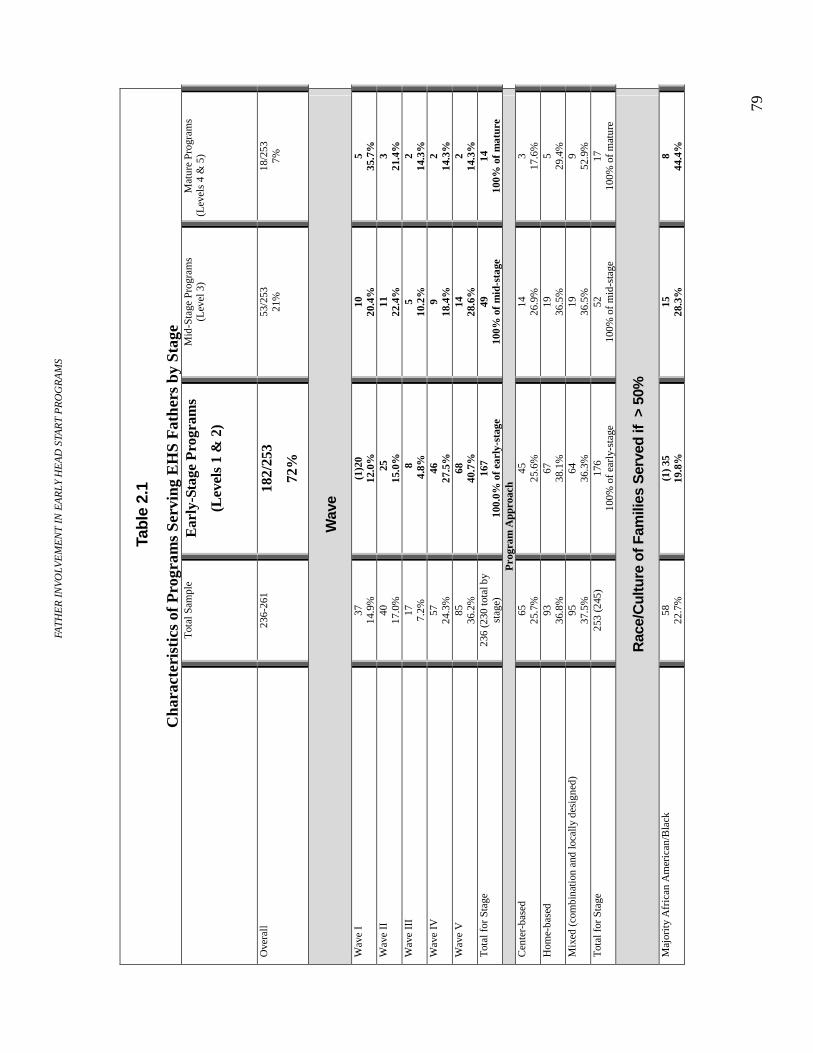
FA
TH
ER
IN
VO
LVE
ME
NT
IN E
AR
LY H
EA
D S
TAR
T P
RO
GR
AM
S
79
Tabl
e 2.
1
Cha
ract
eris
tics
of
Pro
gram
s Se
rvin
g E
HS
Fat
hers
by
Stag
e
Tot
al S
ampl
e
Ear
ly-S
tage
Pro
gram
s
(Lev
els
1 &
2)
Mid
-Sta
ge P
rogr
ams
(Lev
el 3
)
Mat
ure
Prog
ram
s (L
evel
s 4
& 5
)
Ove
rall
236-
261
182/
253
72%
53/2
53
21%
18
/253
7%
Wav
e
Wav
e I
37
14
.9%
(1
)20
12
.0%
10
20
.4%
5
35.7
%
Wav
e II
40
17
.0%
2
5 15
.0%
11
22
.4%
3
21.4
%
Wav
e II
I 17
7.
2%
8
4.8
%
5 10
.2%
2
14.3
%
Wav
e IV
57
24
.3%
46
27
.5%
9
18.4
%
2 14
.3%
W
ave
V
85
36.2
%
68
40.7
%
14
28.6
%
2 14
.3%
T
otal
for
Sta
ge
236
(230
tota
l by
stag
e)
167
100.
0% o
f ea
rly-
stag
e 49
10
0% o
f m
id-s
tage
14
10
0% o
f m
atur
e P
rogr
am A
ppro
ach
Cen
ter-
base
d 65
25
.7%
45
25
.6%
14
26
.9%
3
17.6
%
Hom
e-ba
sed
93
36.8
%
67
38.1
%
19
36.5
%
5 29
.4%
M
ixed
(co
mbi
nati
on a
nd lo
cally
des
igne
d)
95
37.5
%
64
36.3
%
19
36.5
%
9 52
.9%
T
otal
for
Sta
ge
253
(245
) 17
6 10
0% o
f ea
rly-
stag
e 52
10
0% o
f m
id-s
tage
17
10
0% o
f m
atur
e
Rac
e/C
ultu
re o
f Fam
ilies
Ser
ved
if >
50%
Maj
orit
y A
fric
an A
mer
ican
/Bla
ck
58
22.7
%
(1)
35
19.8
%
15
28.3
%
8 44
.4%
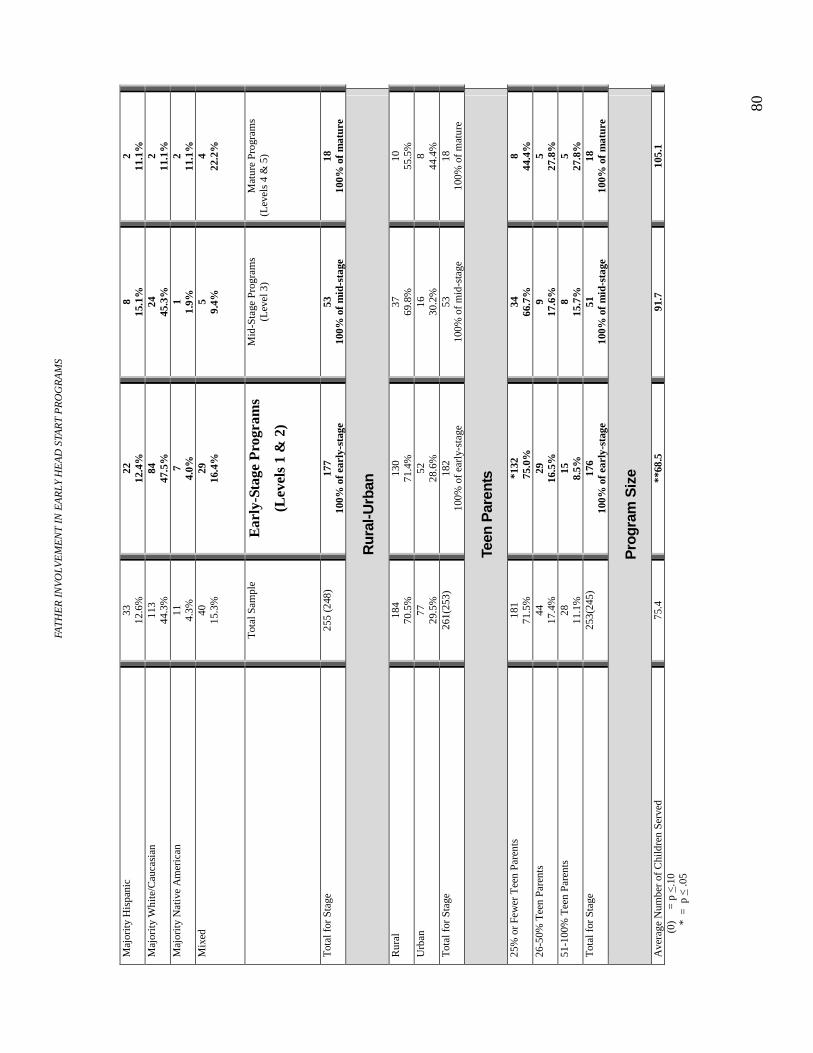
FA
TH
ER
IN
VO
LVE
ME
NT
IN E
AR
LY H
EA
D S
TAR
T P
RO
GR
AM
S
80
Maj
orit
y H
ispa
nic
33
12.6
%
22
12.4
%
8 15
.1%
2
11.1
%
Maj
orit
y W
hite
/Cau
casi
an
113
44.3
%
84
47.5
%
24
45.3
%
2 11
.1%
M
ajor
ity
Nat
ive
Am
eric
an
11
4.3%
7
4.0%
1
1.9%
2
11.1
%
Mix
ed
40
15.3
%
29
16.4
%
5 9.
4%
4 22
.2%
T
otal
Sam
ple
Ear
ly-S
tage
Pro
gram
s
(Lev
els
1 &
2)
Mid
-Sta
ge P
rogr
ams
(Lev
el 3
)
Mat
ure
Prog
ram
s (L
evel
s 4
& 5
)
Tot
al f
or S
tage
25
5 (2
48)
177
100%
of
earl
y-st
age
53
100%
of
mid
-sta
ge
18
100%
of
mat
ure
Rur
al-U
rban
Rur
al
184
70.5
%
130
71.4
%
37
69.8
%
10
55.5
%
Urb
an
77
29.5
%
52
28.6
%
16
30.2
%
8 44
.4%
T
otal
for
Sta
ge
261(
253)
18
2 10
0% o
f ea
rly-
stag
e 53
10
0% o
f m
id-s
tage
18
10
0% o
f m
atur
e
Teen
Par
ents
25%
or
Few
er T
een
Pare
nts
181
71
.5%
*1
32
75
.0%
34
66
.7%
8
44.4
%
26-5
0% T
een
Pare
nts
44
17.4
%
29
16.5
%
9 17
.6%
5
27.8
%
51-1
00%
Tee
n Pa
rent
s 28
11
.1%
15
8.
5%
8 15
.7%
5
27.8
%
Tot
al f
or S
tage
25
3(24
5)
176
100%
of
earl
y-st
age
51
100%
of
mid
-sta
ge
18
100%
of
mat
ure
Pro
gram
Siz
e
Ave
rage
Num
ber
of C
hild
ren
Serv
ed
75.4
**
68.5
91
.7
105.
1 (0
) =
p <
.10
*
= p
< .0
5
FA
TH
ER
IN
VO
LVE
ME
NT
IN E
AR
LY H
EA
D S
TAR
T P
RO
GR
AM
S
81
**
= p
< .0
1
*
** =
p <
.001
A
NO
VA
s an
d ch
i-sq
uare
test
s w
ere
used
to d
eter
min
e ov
eral
l sig
nifi
cant
dif
fere
nces
(in
bol
d) a
cros
s le
vels
of
a va
riab
le, d
enot
ed b
y bl
ack
col
umn
mar
kers
. D
etai
led
pair
wis
e di
ffer
ence
s be
twee
n ce
lls
or m
eans
are
not
rep
orte
d in
this
tabl
e. N
’s m
ay v
ary
som
ewha
t bec
ause
sam
ple
resp
onde
nts
did
not a
nsw
er e
very
que
stio
n.
Not
all
prog
ram
s co
uld
be c
lass
ifie
d by
sta
ge.

FA
TH
ER
IN
VO
LVE
ME
NT
IN E
AR
LY H
EA
D S
TAR
T P
RO
GR
AM
S
82
Tabl
e 2.
2
Cha
ract
eris
tics
of
Pro
gram
s by
Pro
gram
App
roac
h
Tot
al S
ampl
e
Cen
ter
Bas
ed P
rogr
ams
Hom
e-B
ased
Pro
gram
s
Mix
ed-A
ppro
ach
Prog
ram
s
Ove
rall
236-
261
65
25.7
%
93
36.8
%
95
37.5
%
Wav
e
Wav
e I
37
14
.9%
6
10
.2%
14
16
.7%
16
18
.8%
W
ave
II
40
17.0
%
9
15.3
%
17
20.2
%
14
16.5
%
Wav
e II
I 17
7.
2%
10.
2 4
.8%
3
3.6%
8
9.4%
W
ave
IV
57
24.3
%
19
32.2
%
23
27.4
%
12
14.1
%
Wav
e V
85
36
.2%
19
32
.2%
27
32
.1%
35
41
.2%
Rac
e/C
ultu
re o
f Fam
ilies
Ser
ved
if >
50%
Maj
orit
y A
fric
an A
mer
ican
/Bla
ck
58
22.7
%
22*
* 34
.9%
11
12
.1%
22
23
.7%
M
ajor
ity
His
pani
c 33
12
.6%
9
14.3
%
9 9.
9%
15
16.1
%
Maj
orit
y W
hite
/Cau
casi
an
113
44.3
%
19
30.2
%
56
61.5
%
34
36.6
%
Maj
orit
y N
ativ
e A
mer
ican
11
4.
3%
5 7.
9%
3 3.
3%
3 3.
2%
Mix
ed
40
15
.3%
8
12.7
%
12
13.2
%
19
20.4
%
Rur
al-U
rban
Rur
al
184
70.5
%
44
67.7
%
68
73.1
%
65
68.4
%

FA
TH
ER
IN
VO
LVE
ME
NT
IN E
AR
LY H
EA
D S
TAR
T P
RO
GR
AM
S
83
Urb
an
77
29.5
%
21
32.3
%
25
26.9
%
30
39.5
%
Teen
Par
ents
25%
or
Few
er T
een
Pare
nts
181
71
.5%
*4
6
71.9
%
65
73.0
%
63
68.5
%
26-5
0% T
een
Pare
nts
44
17.4
%
10
15.6
%
21
23.6
%
13
14.1
%
51-1
00%
Tee
n Pa
rent
s 28
11
.1%
8
12.5
%
3 3.
4%
16
17.4
%
Pro
gram
Siz
e
Ave
rage
Num
ber
of C
hild
ren
Serv
ed
75.4
66
.1
74.1
80
.0
(0)
= p
<.1
0
* =
p <
.05
**
= p
< .0
1
*
** =
p <
.001
A
NO
VA
s a
nd c
hi-s
quar
e te
sts
wer
e us
ed to
det
erm
ine
over
all s
igni
fica
nt d
iffe
renc
es (
in b
old)
acr
oss
leve
ls o
f a
vari
able
, den
oted
by
blac
k c
olum
n m
arke
rs.
Det
aile
d pa
irw
ise
diff
eren
ces
betw
een
cells
or
mea
ns a
re n
ot r
epor
ted
in th
is ta
ble.
N’s
may
var
y so
mew
hat b
ecau
se s
ampl
e re
spon
dent
s di
d no
t ans
wer
eve
ry q
uest
ion.
N
ot a
ll pr
ogra
ms
coul
d be
cla
ssif
ied
by s
tage
.
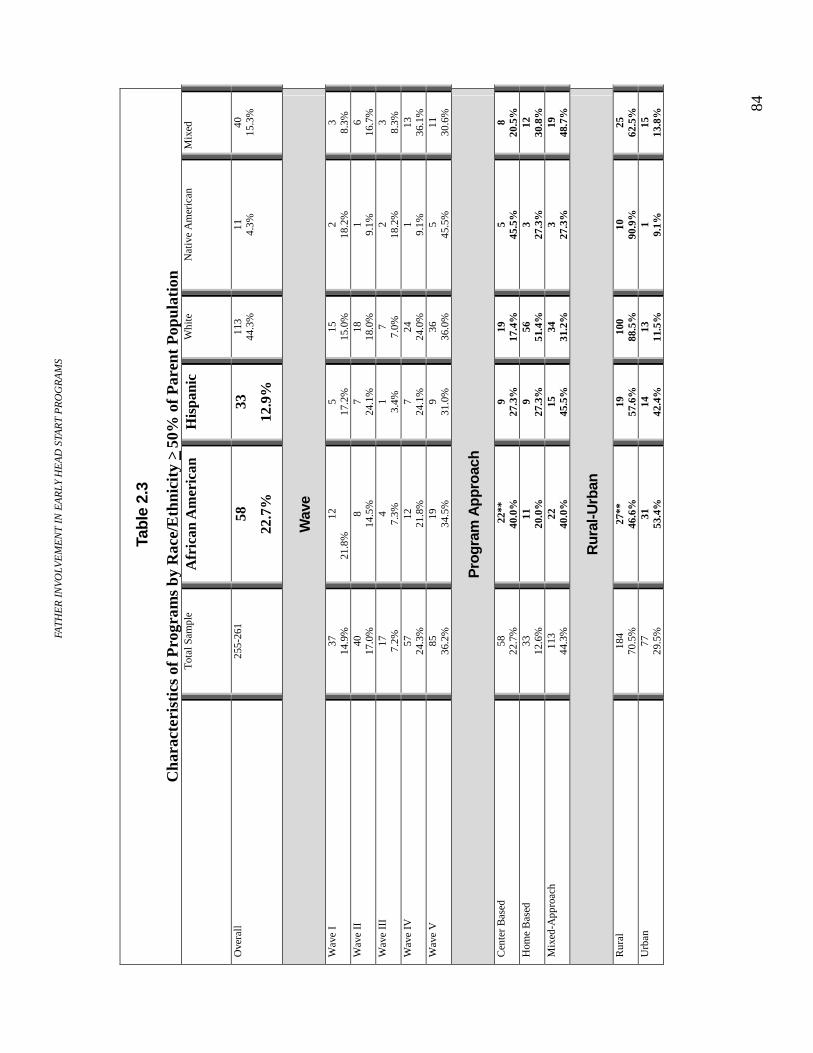
FA
TH
ER
IN
VO
LVE
ME
NT
IN E
AR
LY H
EA
D S
TAR
T P
RO
GR
AM
S
84
Tabl
e 2.
3
Cha
ract
eris
tics
of
Pro
gram
s by
Rac
e/E
thni
city
> 50
% o
f P
aren
t P
opul
atio
n
Tot
al S
ampl
e
Afr
ican
Am
eric
an
His
pani
c W
hite
Nat
ive
Am
eric
an
Mix
ed
Ove
rall
255-
261
58
22.7
%
33
12.9
%
113
44.3
%
11
4.3%
40
15
.3%
Wav
e
Wav
e I
37
14
.9%
12
2
1.8%
5
17.2
%
15
15.0
%
2 18
.2%
3
8.3%
W
ave
II
40
17.0
%
8 14
.5%
7
24.1
%
18
18.0
%
1 9.
1%
6 16
.7%
W
ave
III
17
7.2%
4
7.3%
1
3.4%
7
7.0%
2
18.2
%
3 8.
3%
Wav
e IV
57
24
.3%
12
21
.8%
7
24.1
%
24
24.0
%
1 9.
1%
13
36.1
%
Wav
e V
85
36
.2%
19
34
.5%
9
31.0
%
36
36.0
%
5 45
.5%
11
30
.6%
Pro
gram
Ap
pro
ach
Cen
ter
Bas
ed
58
22.7
%
22*
* 40
.0%
9
27.3
%
19
17.4
%
5 45
.5%
8
20.5
%
Hom
e B
ased
33
12
.6%
11
20
.0%
9
27.3
%
56
51.4
%
3 27
.3%
12
30
.8%
M
ixed
-App
roac
h 11
3 44
.3%
22
40
.0%
15
45
.5%
34
31
.2%
3
27.3
%
19
48.7
%
Rur
al-U
rban
Rur
al
184
70.5
%
27**
46
.6%
19
57
.6%
10
0 88
.5%
10
90
.9%
25
62
.5%
U
rban
77
29
.5%
31
53
.4%
14
42
.4%
13
11
.5%
1
9.1%
15
13
.8%
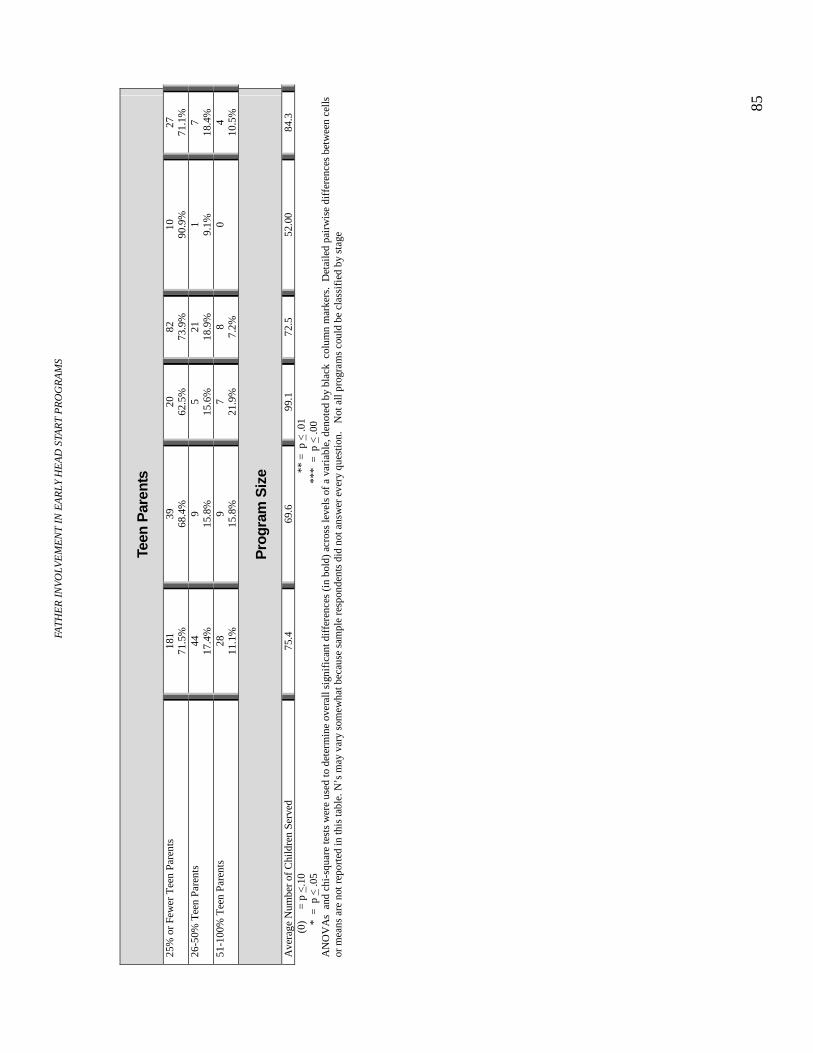
FA
TH
ER
IN
VO
LVE
ME
NT
IN E
AR
LY H
EA
D S
TAR
T P
RO
GR
AM
S
85
Teen
Par
ents
25%
or
Few
er T
een
Pare
nts
181
71
.5%
39
68
.4%
20
62
.5%
82
73
.9%
10
90
.9%
27
71
.1%
26
-50%
Tee
n Pa
rent
s 44
17
.4%
9
15.8
%
5 15
.6%
21
18
.9%
1
9.1%
7
18.4
%
51-1
00%
Tee
n Pa
rent
s 28
11
.1%
9
15.8
%
7 21
.9%
8
7.2%
0
4 10
.5%
Pro
gram
Siz
e
Ave
rage
Num
ber
of C
hild
ren
Serv
ed
75.4
69
.6
99.1
72
.5
52.0
0 84
.3
(0)
= p
<.1
0
* =
p <
.05
**
= p
< .0
1
*
** =
p <
.00
AN
OV
As
and
chi
-squ
are
test
s w
ere
used
to d
eter
min
e ov
eral
l sig
nifi
cant
dif
fere
nces
(in
bol
d) a
cros
s le
vels
of
a va
riab
le, d
enot
ed b
y bl
ack
col
umn
mar
kers
. D
etai
led
pair
wis
e di
ffer
ence
s be
twee
n ce
lls
or m
eans
are
not
rep
orte
d in
this
tabl
e. N
’s m
ay v
ary
som
ewha
t bec
ause
sam
ple
resp
onde
nts
did
not a
nsw
er e
very
que
stio
n.
Not
all
prog
ram
s co
uld
be c
lass
ifie
d by
sta
ge

FA
TH
ER
IN
VO
LVE
ME
NT
IN E
AR
LY H
EA
D S
TAR
T P
RO
GR
AM
S
86
��*���,-.�
��� �� �&����� ����������������
A
ll Pr
ogra
ms
(n =
258-
259
)
Ear
ly
Stag
e (n
=180
)
Mid
St
age
(n=5
3)
Mat
ure
(n=1
8)
Cen
ter
(n=6
4
Hom
e (n
=92)
Com
bina
tion
and
Loc
ally
Des
igne
d (n
=95)
Afr
ican
A
mer
ican
(n
=57)
His
pani
c (n
=33)
Whi
te
(n=1
13)
Nat
ive
Am
eric
an
(n=1
1)
Mix
ed
(n=3
9-40
)
Q 7
. In
you
r pr
ogra
m w
hat t
ypes
of
fath
ers
do y
ou t
ry to
invo
lve?
Per
cent
ans
wer
ing
“yes
” to
eac
h qu
esti
on.
B
iolo
gica
l fat
hers
who
live
in th
e sa
me
hous
ehol
d w
ith
the
Ear
ly H
ead
Star
t chi
ld
256
98.8
%
178
98.9
%
52
98.1
%
18
100%
*6
1 95
.3%
92
10
0%
95
100%
55
96
.5%
33
100%
112
99.1
%
11
100%
40
100%
Fa
ther
fig
ures
(so
meo
ne li
ke a
fat
her
to th
e ch
ild)
who
live
wit
h th
e E
arly
H
ead
Star
t Chi
ld
245
94.8
%
(1)
167
92.8
%
53
100%
18
10
0%
60
93.8
%
90
97.8
%
87
92.6
%
(1)
52
91.2
%
31
93.9
%
111
98.2
%
9 81.8
%
37
94.9
%
Bio
logi
cal f
athe
rs w
ho d
o no
t liv
e in
th
e sa
me
hous
ehol
d w
ith th
e E
arly
H
ead
Star
t chi
ld
200
77.2
%
134
74.5
45
84
.9%
16
88
.9%
*5
1 79
.7%
63
68
.5%
79
83
.2%
49
86
%
26
78.8
%
81
71.7
%
9 81.8
%
31
77.5
%
Fath
er f
igur
es w
ho d
o no
t liv
e w
ith
the
Ear
ly H
ead
Star
t chi
ld
150
57.9
%
**92
51
.1%
37
69
.8%
15
83
.3%
38
59
.4%
47
51
.1%
58
61
.1%
*4
3 75
.4%
16
48
.5%
58
51
.3%
5 45
.5%
25
62
.5%
(1
) =
p <
.10
*
= p
< .
05
**
= p
< .
01
***
= p
< .0
01
AN
OV
As
and
chi
-squ
are
test
s w
ere
used
to d
eter
min
e ov
eral
l sig
nifi
cant
dif
fere
nces
(in
bol
d) a
cros
s le
vels
of
a va
riab
le, d
enot
ed b
y bl
ack
col
umn
mar
kers
. D
etai
led
pair
wis
e di
ffer
ence
s be
twee
n ce
lls
or m
eans
are
not
rep
orte
d in
this
tabl
e. N
’s m
ay v
ary
som
ewha
t bec
ause
sam
ple
resp
onde
nts
did
not a
nsw
er e
very
que
stio
n.

FA
TH
ER
IN
VO
LVE
ME
NT
IN E
AR
LY H
EA
D S
TAR
T P
RO
GR
AM
S
87
��*���,-/�
)��� �$�������� ���������������&������
A
ll Pr
ogra
ms
(n =
258
)
Ear
ly
Stag
e (1
82)
Mid
St
age
(n=5
3)
Mat
ure
(n=1
8)
Cen
ter
(n=6
4-65
)
Hom
e (n
=90-
91)
Mix
ed
(n=9
5)
Afr
ican
A
mer
ican
(n
=57)
His
pani
c (n
=33)
Whi
te
(n=1
13)
Nat
ive
Am
eric
an
(n=1
1)
Mix
ed
(n=4
0)
Q 1
9. T
o w
hat e
xten
t do
es e
ach
of th
e fo
llow
ing
refl
ect y
our
prog
ram
’s p
urpo
ses
for
fath
er in
volv
emen
t ac
tivi
ties
?
Pro
gram
s in
dica
ting
goa
l is
thei
r pu
rpos
e to
a m
oder
ate
or g
reat
ext
ent.
Sc
ale
scor
e (S
D).
Fa
ther
Inv
olve
men
t Goa
ls S
cale
2.
6 (.
86)
***2
.4
(.85
) 2.
9 (.
66)
3.5
(.57
) **
2.4
(.85
) 2.
5 (.
85)
2.9
(.85
) 2.
8 (.
96)
2.7
(.83
) 2.
5 (.
80)
2.6
(.94
) 2.
5 (.
84)
Q 1
9. T
o w
hat e
xten
t do
es e
ach
of th
e fo
llow
ing
refl
ect y
our
prog
ram
’s p
urpo
ses
for
fath
er in
volv
emen
t ac
tivi
ties
?
Pro
gram
s in
dica
ting
goa
l is
thei
r pu
rpos
e to
a m
oder
ate
or g
reat
ext
ent.
T
o he
lp f
athe
rs w
ith
pare
ntin
g sk
ills
198
76.7
%
128
71.5
%
47
88.6
%
17
94.4
%
44
67.7
%
68
75.6
%
80
84.2
%
42
73.7
%
24
72.8
%
87
77.6
%
9 81.8
%
32
82
To
enco
urag
e fa
ther
s to
spe
nd ti
me
wit
h ch
ildre
n
213
82.9
%
* 13
9 7
7.6%
50
96
.2%
18
10
0%
51
79.7
%
73
81.1
%
81
85.3
%
50
87.7
%
23
69.7
%
94
84.7
%
10
90.9
%
31
79.5
%
To
enco
urag
e fa
ther
s to
be
emot
iona
lly
supp
orti
ve o
f th
eir
child
’s m
othe
r 15
5 59
.8%
*
98
54.4
%
37
69.8
%
17
94.5
%
32
49.3
%
56
61.6
%
64
67.4
%
42
73.6
%
18
54.5
%
62
55.3
%
7 63.7
%
23
57.5
%
To
enco
urag
e th
e fa
ther
and
mot
her
to
wor
k to
geth
er a
s co
-par
ents
20
5 79
.5%
13
8 76
.7%
43
82
.7%
18
10
0%
47
73.5
%
71
78.0
%
79
83.2
%
47
82.4
%
26
81.3
%
86
76.8
%
10
91.0
%
30
75%
To
get f
athe
rs to
com
e to
pro
gram
ev
ents
20
7 80
.3%
**
136
76
.0%
47
88
.7%
18
10
0%
(1)
49
76.6
%
66
72.5
%
84
88.4
%
47
82.5
%
27
81.8
%
84
75.6
%
10
90.9
%
34
85%
T
o in
volv
e fa
ther
s to
res
olve
thei
r pe
rson
al is
sues
10
3 39
.8%
**
*56
31.1
%
28
52.8
%
16
88.9
%
20
30.7
%
36
39.1
%
43
45.7
%
28
49.1
%
14
42.4
%
39
34.9
%
5 45.5
%
15
37.5
%
To
invo
lve
fath
ers
in e
mpl
oym
ent o
r ed
ucat
ion
124
47.7
%
***7
4 40
.9%
31
54
.5%
14
77
.9%
26
40
.0%
40
43
.5%
53
55
.8%
32
56
.1%
19
57
.6%
47
41
.6%
5 45
.5%
19
47
.5%
T
o in
volv
e fa
ther
s in
fin
anci
al c
hild
su
ppor
t 72
27
.9%
**
*42
23.3
%
16
30.8
%
13
72.3
%
(1)1
8 27
.7%
22
24
.2%
29
30
.8%
(1
) 23
41.1
%
10
30.3
%
27
23.9
%
2 18.2
%
8 20.5
%
To
invo
lve
fath
ers
in f
amily
goa
l se
ttin
g 17
7 68
.8%
*1
11
61.3
%
44
86.3
%
16
94.1
%
41
63%
66
71
.7%
63
67
.8%
34
61
.8%
23
69
.7%
79
70
.5%
9 81
.9%
29
72
.5%
T
o be
rec
ogni
zed
in th
e co
mm
unity
as
a re
sour
ce f
or f
athe
rs
119
46.5
%
***6
9 38
.4%
31
59
.6%
15
93
.8%
27
41
.6%
39
43
.8%
48
51
.1%
31
56
.4%
13
39
.4%
49
43
.7%
8 72
.8%
14
35
.8%
T
o he
lp n
onre
side
nt d
ads
stay
in
cont
act w
ith
thei
r ch
ildre
n 79
30
.6%
**
*44
24.4
%
20
38.4
%
12
70.6
%
15
23.1
%
25
27.8
%
35
36.8
%
26
45.6
%
12
36.4
%
24
21.4
%
4 36.4
%
11
28.2
%
To
help
non
resi
dent
dad
s st
ay in
co
ntac
t wit
h th
eir
child
ren
and
prov
ide
70
27.1
%
***4
0 22
.1%
18
33
.8%
11
68
.8%
12
18
.5%
22
24
.2%
32
34
.0%
23
41
.1%
6 18
.2%
26
23
%
3 27.3
%
10
25.6
%
FA
TH
ER
IN
VO
LVE
ME
NT
IN E
AR
LY H
EA
D S
TAR
T P
RO
GR
AM
S
88
child
sup
port
(1
)= p
< .1
0
* =
p <
.05
**
= p
< .0
1
**
* =
p <
.001
AN
OV
As
and
chi
-squ
are
test
s w
ere
used
to d
eter
min
e ov
eral
l sig
nifi
cant
dif
fere
nces
(in
bol
d) a
cros
s le
vels
of
a va
riab
le, d
enot
ed b
y bl
ack
col
umn
mar
kers
. D
etai
led
pair
wis
e di
ffer
ence
s be
twee
n ce
lls
or m
eans
are
not
rep
orte
d in
this
tabl
e. N
’s m
ay v
ary
som
ewha
t bec
ause
sam
ple
resp
onde
nts
did
not a
nsw
er e
very
que
stio
n.
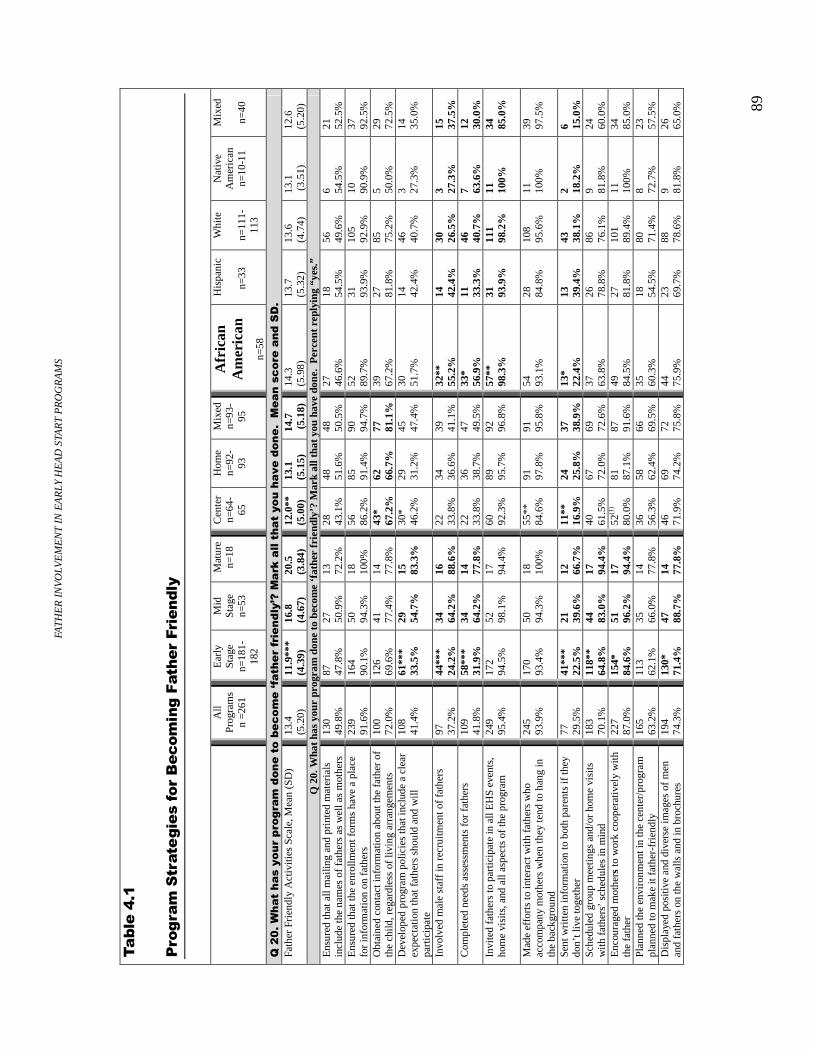
FA
TH
ER
IN
VO
LVE
ME
NT
IN E
AR
LY H
EA
D S
TAR
T P
RO
GR
AM
S
89
��*���0-.�
&�������������� �$���1���������� �����������
A
ll Pr
ogra
ms
n =2
61
Ear
ly
Stag
e n=
181-
182
Mid
St
age
n=53
Mat
ure
n=18
C
ente
r n=
64-
65
Hom
e n=
92-
93
Mix
ed
n=93
-95
Afr
ican
A
mer
ican
n=
58
His
pani
c
n=
33
Whi
te
n=
111-
113
Nat
ive
Am
eric
an
n=10
-11
Mix
ed
n=
40
!�/2-�+ ��� � ������(�������������*������3$�� ���$������45�"��������� ������� �������-��"���� ����������-�
Fath
er F
rien
dly
Act
iviti
es S
cale
, Mea
n (S
D)
13.4
(5
.20)
11
.9**
* (4
.39)
16
.8
(4.6
7)
20.5
(3
.84)
12
.0**
(5
.00)
13
.1
(5.1
5)
14.7
(
5.18
) 14
.3
(5.9
8)
13.7
(5
.32)
13
.6
(4.7
4)
13.1
(
3.51
) 12
.6
(5.2
0)
Q 2
0. W
hat h
as y
our
prog
ram
don
e to
bec
ome
‘fat
her
frie
ndly
’? M
ark
all t
hat y
ou h
ave
done
. P
erce
nt r
eply
ing
“yes
.”
Ens
ured
that
all
mai
ling
and
prin
ted
mat
eria
ls
incl
ude
the
nam
es o
f fa
ther
s as
wel
l as
mot
hers
13
0 49
.8%
87
47
.8%
27
50
.9%
13
72
.2%
28
43
.1%
48
51
.6%
48
50
.5%
27
46
.6%
18
54
.5%
56
49
.6%
6 54
.5%
21
52
.5%
E
nsur
ed th
at th
e en
rollm
ent f
orm
s ha
ve a
pla
ce
for
info
rmat
ion
on f
athe
rs
239
91.6
%
164
90.1
%
50
94.3
%
18
100%
56
86
.2%
85
91
.4%
90
94
.7%
52
89
.7%
31
93
.9%
10
5 92
.9%
10
90
.9%
37
92
.5%
O
btai
ned
cont
act i
nfor
mat
ion
abou
t the
fat
her
of
the
child
, reg
ardl
ess
of li
ving
arr
ange
men
ts
100
72.0
%
126
69.6
%
41
77.4
%
14
77.8
%
43*
67.2
%
62
66.7
%
77
81.1
%
39
67.2
%
27
81.8
%
85
75.2
%
5 50.0
%
29
72.5
%
Dev
elop
ed p
rogr
am p
olic
ies
that
incl
ude
a cl
ear
expe
ctat
ion
that
fat
hers
sho
uld
and
will
pa
rtic
ipat
e
108
41.4
%
61**
* 33
.5%
29
54
.7%
15
83
.3%
30
* 46
.2%
29
31
.2%
45
47
.4%
30
51
.7%
14
42
.4%
46
40
.7%
3 27
.3%
14
35
.0%
Invo
lved
mal
e st
aff
in r
ecru
itmen
t of
fath
ers
97
37.2
%
44**
* 24
.2%
34
64
.2%
16
88
.6%
22
33
.8%
34
36
.6%
39
41
.1%
32
**
55.2
%
14
42.4
%
30
26.5
%
3 27.3
%
15
37.5
%
Com
plet
ed n
eeds
ass
essm
ents
for
fat
hers
10
9 41
.8%
58
***
31.9
%
34
64.2
%
14
77.8
%
22
33.8
%
36
38.7
%
47
49.5
%
33*
56.9
%
11
33.3
%
46
40.7
%
7 63.6
%
12
30.0
%
Invi
ted
fath
ers
to p
artic
ipat
e in
all
EH
S ev
ents
, ho
me
visi
ts, a
nd a
ll as
pect
s of
the
prog
ram
24
9 95
.4%
17
2 94
.5%
52
98
.1%
17
94
.4%
60
92.3
%
89
95.7
%
92
96.8
%
57**
98
.3%
31
93
.9%
11
1 98
.2%
11
10
0%
34
85.0
%
Mad
e ef
fort
s to
inte
ract
wit
h fa
ther
s w
ho
acco
mpa
ny m
othe
rs w
hen
they
tend
to h
ang
in
the
back
grou
nd
245
93.9
%
170
93.4
%
50
94.3
%
18
100%
55
**
84.6
%
91
97.8
%
91
95.8
%
54
93.1
%
28
84.8
%
108
95.6
%
11
100%
39
97
.5%
Sent
wri
tten
info
rmat
ion
to b
oth
pare
nts
if th
ey
don’
t liv
e to
geth
er
77
29.5
%
41**
* 22
.5%
21
39
.6%
12
66
.7%
11
**
16.9
%
24
25.8
%
37
38.9
%
13*
22.4
%
13
39.4
%
43
38.1
%
2 18.2
%
6 15.0
%
Sche
dule
d gr
oup
mee
ting
s an
d/or
hom
e vi
sits
w
ith
fath
ers’
sch
edul
es in
min
d 18
3 70
.1%
11
8**
64.8
%
44
83.0
%
17
94.4
%
40
61.5
%
67
72.0
%
69
72.6
%
37
63.8
%
26
78.8
%
86
76.1
%
9 81.8
%
24
60.0
%
Enc
oura
ged
mot
hers
to w
ork
coop
erat
ivel
y w
ith
the
fath
er
227
87.0
%
154*
84
.6%
51
96
.2%
17
94
.4%
52
(1)
80.0
%
81
87.1
%
87
91.6
%
49
84.5
%
27
81.8
%
101
89.4
%
11
100%
34
85
.0%
Pl
anne
d th
e en
viro
nmen
t in
the
cent
er/p
rogr
am
plan
ned
to m
ake
it fa
ther
-fri
endl
y 16
5 63
.2%
11
3 62
.1%
35
66
.0%
14
77
.8%
36
56
.3%
58
62
.4%
66
69
.5%
35
60
.3%
18
54
.5%
80
71
.4%
8 72
.7%
23
57
.5%
D
ispl
ayed
pos
itive
and
div
erse
imag
es o
f m
en
and
fath
ers
on th
e w
alls
and
in b
roch
ures
19
4 74
.3%
13
0*
71.4
%
47
88.7
%
14
77.8
%
46
71.9
%
69
74.2
%
72
75.8
%
44
75.9
%
23
69.7
%
88
78.6
%
9 81.8
%
26
65.0
%
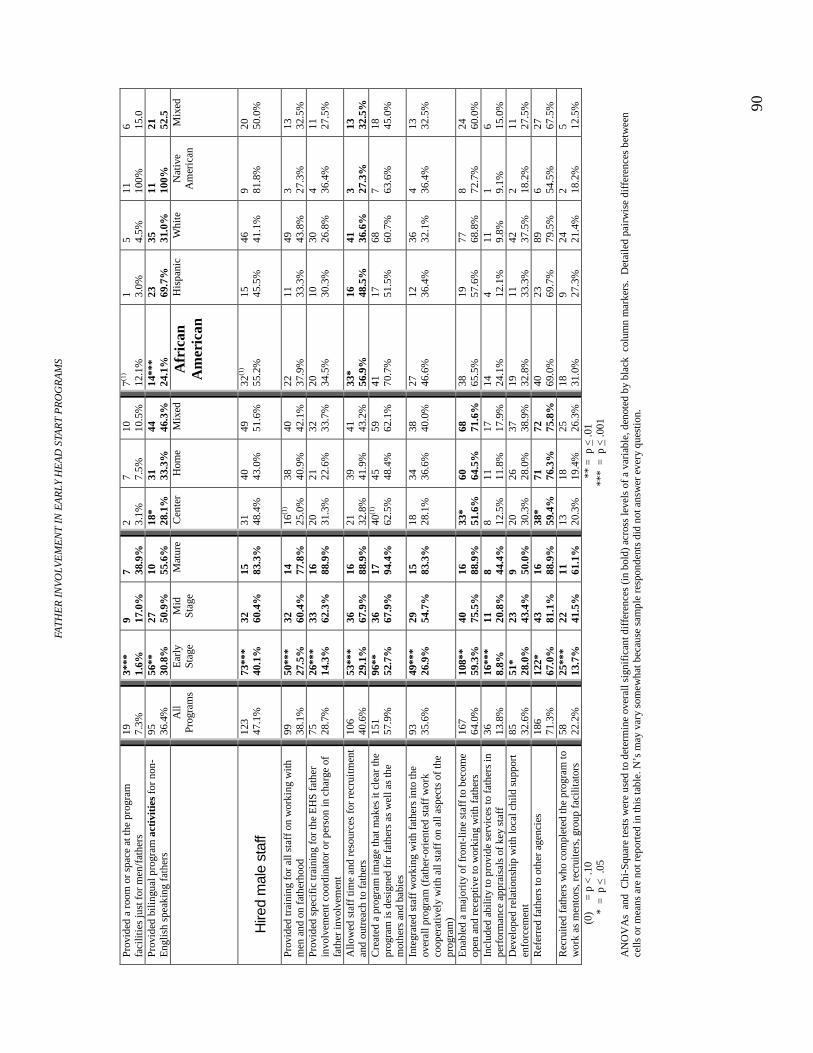
FA
TH
ER
IN
VO
LVE
ME
NT
IN E
AR
LY H
EA
D S
TAR
T P
RO
GR
AM
S
90
Prov
ided
a r
oom
or
spac
e at
the
prog
ram
fa
cilit
ies
just
for
men
/fat
hers
19
7.
3%
3***
1.
6%
9 17.0
%
7 38.9
%
2 3.1%
7 7.
5%
10
10.5
%
7(1)
12.1
%
1 3.0%
5 4.
5%
11
100%
6 15
.0
Prov
ided
bili
ngua
l pro
gram
act
ivit
ies
for
non-
Eng
lish
spea
king
fat
hers
95
36
.4%
56
**
30.8
%
27
50.9
%
10
55.6
%
18*
28.1
%
31
33.3
%
44
46.3
%
14**
* 24
.1%
23
69
.7%
35
31
.0%
11
10
0%
21
52.5
All
Prog
ram
s
Ear
ly
Stag
e
Mid
St
age
Mat
ure
Cen
ter
Hom
e
Mix
ed
Afr
ican
A
mer
ican
His
pani
c
Whi
te
Nat
ive
Am
eric
an
Mix
ed
Hire
d m
ale
staf
f 12
3 47
.1%
73
***
40.1
%
32
60.4
%
15
83.3
%
31
48.4
%
40
43.0
%
49
51.6
%
32(1
) 55
.2%
15
45
.5%
46
41
.1%
9 81
.8%
20
50
.0%
Prov
ided
trai
ning
for
all
staf
f on
wor
king
with
m
en a
nd o
n fa
ther
hood
99
38
.1%
50
***
27.5
%
32
60.4
%
14
77.8
%
16(1
) 25
.0%
38
40
.9%
40
42
.1%
22
37
.9%
11
33
.3%
49
43
.8%
3 27
.3%
13
32
.5%
Pr
ovid
ed s
peci
fic
trai
ning
for
the
EH
S fa
ther
in
volv
emen
t coo
rdin
ator
or
pers
on in
cha
rge
of
fath
er in
volv
emen
t
75
28.7
%
26**
* 14
.3%
33
62
.3%
16
88
.9%
20
31
.3%
21
22
.6%
32
33
.7%
20
34
.5%
10
30
.3%
30
26
.8%
4 36
.4%
11
27
.5%
Allo
wed
sta
ff ti
me
and
reso
urce
s fo
r re
crui
tmen
t an
d ou
trea
ch to
fat
hers
10
6 40
.6%
53
***
29.1
%
36
67.9
%
16
88.9
%
21
32.8
%
39
41.9
%
41
43.2
%
33*
56.9
%
16
48.5
%
41
36.6
%
3 27.3
%
13
32.5
%
Cre
ated
a p
rogr
am im
age
that
mak
es it
cle
ar th
e pr
ogra
m is
des
igne
d fo
r fa
ther
s as
wel
l as
the
mot
hers
and
bab
ies
151
57.9
%
96**
52
.7%
36
67
.9%
17
94
.4%
40
(1)
62.5
%
45
48.4
%
59
62.1
%
41
70.7
%
17
51.5
%
68
60.7
%
7 63.6
%
18
45.0
%
Inte
grat
ed s
taff
wor
king
with
fat
hers
into
the
over
all p
rogr
am (
fath
er-o
rien
ted
staf
f w
ork
coop
erat
ivel
y w
ith
all s
taff
on
all a
spec
ts o
f th
e pr
ogra
m)
93
35.6
%
49**
* 26
.9%
29
54
.7%
15
83
.3%
18
28
.1%
34
36
.6%
38
40
.0%
27
46
.6%
12
36
.4%
36
32
.1%
4 36
.4%
13
32
.5%
Ena
bled
a m
ajor
ity
of f
ront
-lin
e st
aff
to b
ecom
e op
en a
nd r
ecep
tive
to w
orki
ng w
ith f
athe
rs
167
64.0
%
108*
* 59
.3%
40
75
.5%
16
88
.9%
33
* 51
.6%
60
64
.5%
68
71
.6%
38
65
.5%
19
57
.6%
77
68
.8%
8 72
.7%
24
60
.0%
In
clud
ed a
bilit
y to
pro
vide
ser
vice
s to
fat
hers
in
perf
orm
ance
app
rais
als
of k
ey s
taff
36
13
.8%
16
***
8.8%
11
20
.8%
8 44
.4%
8 12
.5%
11
11
.8%
17
17
.9%
14
24
.1%
4 12
.1%
11
9.
8%
1 9.1%
6 15
.0%
D
evel
oped
rel
atio
nshi
p w
ith lo
cal c
hild
sup
port
en
forc
emen
t 85
32
.6%
51
* 28
.0%
23
43
.4%
9 50
.0%
20
30
.3%
26
28
.0%
37
38
.9%
19
32
.8%
11
33
.3%
42
37
.5%
2 18
.2%
11
27
.5%
R
efer
red
fath
ers
to o
ther
age
ncie
s 18
6 71
.3%
12
2*
67.0
%
43
81.1
%
16
88.9
%
38*
59.4
%
71
76.3
%
72
75.8
%
40
69.0
%
23
69.7
%
89
79.5
%
6 54.5
%
27
67.5
%
Rec
ruite
d fa
ther
s w
ho c
ompl
eted
the
prog
ram
to
wor
k as
men
tors
, rec
ruit
ers,
gro
up f
acili
tato
rs
58
22.2
%
25**
* 13
.7%
22
41
.5%
11
61
.1%
13
20
.3%
18
19
.4%
25
26
.3%
18
31
.0%
9 27
.3%
24
21
.4%
2 18
.2%
5 12
.5%
(0
) =
p <
.10
*
= p
< .
05
** =
p <
.01
***
= p
< .0
01 A
NO
VA
s a
nd C
hi-S
quar
e te
sts
wer
e us
ed to
det
erm
ine
over
all s
igni
fica
nt d
iffe
renc
es (
in b
old)
acr
oss
leve
ls o
f a
vari
able
, den
oted
by
blac
k c
olum
n m
arke
rs.
Det
aile
d pa
irw
ise
diff
eren
ces
betw
een
cells
or
mea
ns a
re n
ot r
epor
ted
in th
is ta
ble.
N’s
may
var
y so
mew
hat b
ecau
se s
ampl
e re
spon
dent
s di
d no
t ans
wer
eve
ry q
uest
ion.

FA
TH
ER
IN
VO
LVE
ME
NT
IN E
AR
LY H
EA
D S
TAR
T P
RO
GR
AM
S
91
��*���6-.�
�� ������������� �������� �� 4�7������$����������������������%���������&����� �
A
ll Pr
ogra
ms
n =2
20-2
43
Ear
ly
Stag
e n=
155-
167
Mid
Sta
ge
n=47
-51
Mat
ure
n=14
-18
Cen
ter
n=54
-59
Hom
e n=
80-9
0 C
ombi
natio
n an
d L
ocal
ly
Des
igne
d n=
81-9
0
Afr
ican
A
mer
ican
n=
51-5
6
His
pani
c N
=27
-29
Whi
te
n=96
-106
N
ativ
e A
mer
ican
n=
9-11
Mix
ed
n=
31-3
5
Q 8
. H
ow m
any
child
ren
(in
your
pro
gram
) ha
ve a
…
Res
iden
t fa
ther
/fat
her
figu
re e
ver
part
icip
ated
in
the
EH
S pr
ogra
m
220
58.6
%
**15
5 54
.9%
47
68
.6%
14
65
.4%
54
57
.4%
80
59
.9%
81
58
.7%
51
57
.6%
28
58
.9%
96
58
.3%
9 69
.7%
31
54
.5%
Res
iden
t fa
ther
/fat
her
figu
re, h
ighl
y in
volv
ed in
the
EH
S pr
ogra
m
235
24.1
%
***1
63
21.4
%
50
27.1
%
17
41.2
%
59
24.6
%
83
24.1
%
88
24.3
%
51
25.3
%
29
23.1
%
104
21.2
%
11
33.8
%
35
28.5
%
Non
resi
dent
fa
ther
/fat
her
figu
re e
ver
part
icip
ated
in
the
EH
S pr
ogra
m
227
30.4
%
156
28.8
%
49
37.2
%
18
26.6
%
57
27.2
%
83
32.9
%
83
31.0
%
54
32.0
%
27
21.9
%
99
31.1
%
11
40.9
%
33
27.1
%
Non
resi
dent
fa
ther
/fat
her
figu
re h
ighl
y in
volv
ed in
the
EH
S pr
ogra
m
240
9.5%
16
7 9.
1%
51
10.0
%
18
13.5
%
59
7.0%
89
10
.1%
90
10
.3%
56
9.
7%
28
8.5
106
8.7%
11
17.6
%
35
7.9%
(1)
= p
< .1
0
* =
p <
.05
**
= p
< .0
1
***
= p
< .0
01
AN
OV
As
and
chi
-squ
are
test
s w
ere
used
to d
eter
min
e ov
eral
l sig
nifi
cant
dif
fere
nces
(in
bol
d) a
cros
s le
vels
of
a va
riab
le, d
enot
ed b
y bl
ack
col
umn
mar
kers
. D
etai
led
pair
wis
e di
ffer
ence
s be
twee
n ce
lls
or m
eans
are
not
rep
orte
d in
this
tabl
e. N
’s m
ay v
ary
som
ewha
t bec
ause
sam
ple
resp
onde
nts
did
not a
nsw
er e
very
que
stio
n.

FA
TH
ER
IN
VO
LVE
ME
NT
IN E
AR
LY H
EA
D S
TAR
T P
RO
GR
AM
S
92
��*���6-/�
��� �� 4�7������$����������������������%���������&��������������� �
A
ll Pr
ogra
ms
n =2
20-2
54
Ear
ly
Stag
e n=
155-
181
Mid
Sta
ge
n=42
-52
Mat
ure
n=14
-18
Cen
ter
n=54
-59
Hom
e N
=80
-90
Com
bina
tion
and
Loc
ally
D
esig
ned
n=81
=90
Afr
ican
A
mer
ican
n=
51-5
6
His
pani
c n=
27-2
9 W
hite
n=
96-1
06
Nat
ive
Am
eric
an
n=9-
11
Mix
ed
N=
31=3
5
Q 9
. P
leas
e te
ll ho
w m
any
fath
ers
and
fath
er fi
gur
es, r
esid
ent a
nd
nonr
esid
ent,
are
invo
lved
in th
e fo
llow
ing
prog
ram
ac
tiviti
es,
0 =
no fa
ther
s ar
e in
volv
ed; 1
= a
few
fath
ers
are
invo
lved
; 2 =
som
e fa
ther
s ar
e in
volv
ed; 3
= m
any
fath
ers
are
invo
lved
; 4 =
mos
t fat
hers
are
invo
lved
. Sca
le m
eans
(SD
)
Fath
er U
ptak
e Sc
ale
(Tot
al
invo
lvem
ent o
f fa
ther
s)
1.1
(.48
) **
*1.0
(.
46)
1.3
(.52
) 1.
5 (.
44)
1.0
(.54
) 1.
2 (.
50)
1.1
(.45
) (1
) 1.
0 (.
47)
1.2
(.53
) 1.
1 (.
45)
1.4
(.49
) 1.
1 (.
50)
Fath
er-F
ocus
ed
Upt
ake
Scal
e (F
athe
rhoo
d Fa
ctor
s)
1.0
(.83
)
**.7
(.
78)
1.1
(.81
) 1.
4 (.
85)
.8
(.71
) 1.
1 (.
94)
1.0
(.86
) .9
(.
75)
.9
(.78
) 1.
0 (.
96)
1.3
(.50
) .8
(.
62)
Q 9
. P
leas
e te
ll ho
w m
any
fath
ers
and
fath
er fi
gur
es, r
esid
ent a
nd
nonr
esid
ent,
are
invo
lved
in th
e fo
llow
ing
prog
ram
ac
tiviti
es,
0 =
no fa
ther
s ar
e in
volv
ed; 1
= a
few
fath
er a
re in
volv
ed; 2
= s
ome
fath
ers
are
invo
lved
; 3 =
man
y fa
ther
s ar
e in
volv
ed; 4
= m
ost f
athe
rs a
re in
volv
ed.
Item
mea
ns (S
D).
App
lyin
g fo
r E
HS
prog
ram
2.
0 (.
72)
*1.9
(.
65)
2.1
(.83
) 2.
4 (.
84)
2.0
(.73
) 2.
0 (.
71)
2.1
(.70
) 1.
9 (.
67)
2.3
(.53
) 1.
9 (.
77)
2.0
(.63
) 2.
2 (.
72)
Act
ivit
ies
for
all
fam
ily, e
.g.,
holid
ay p
arti
es,
picn
ics,
ope
n ho
use
2.7
(1.0
0)
**2.
6 (.
92)
2.8
(1.2
0)
3.6
(.70
) 2.
7 (1
.08)
2.
8 (.
96)
2.8
(.98
) 2.
5 (.
92)
2.8
(1.0
3)
2.7
(1.0
0)
3.0
(1.4
1)
3.0
(.97
)
Act
iviti
es to
im
prov
e pa
rent
ing
2.1
(.92
) **
*1.9
(.
86)
2.3
(.92
) 3.
2 (.
71)
2.0
(.88
) 2.
1 (.
90)
2.1
(1.0
2)
1.9
(.95
) 2.
2 (.
97)
2.2
(.87
) 2.
2 (1
.08)
1.
9 (1
.09)
Gro
up p
aren
ting
activ
ities
, gro
up
2.3
(.96
) **
*2.2
(.
91)
2.5
(1.0
1)
3.2
(.86
) 2.
1 (1
.02)
2.
4 (.
92)
2.3
(.98
) 2.
2 (.
89)
2.5
(1.0
0)
2.2
(1.0
1)
2.8
(.87
) 2.
4 (.
93)

FA
TH
ER
IN
VO
LVE
ME
NT
IN E
AR
LY H
EA
D S
TAR
T P
RO
GR
AM
S
93
soci
aliz
atio
ns
Act
ivit
ies
for
fath
ers
and
child
ren
only
.8
(1.2
9)
***.
5 (.
97)
1.4
(1.4
4)
2.6
(1.7
2)
.8
(1.2
3)
.8
(1.3
4)
.8
(1.2
5)
1.0
(1.3
0)
.7
(1.2
6)
.8
(1.3
3)
.4
(.81
) .6
(1
.06)
Spor
ting
even
ts
for
men
or
prog
ram
team
s.
.6
(1.0
8)
***.
3 (.
81)
.9
(1.3
5)
1.7
(1.5
3)
.6
(1.0
7)
.4
(.93
) .6
(1
.12)
**
*1.1
(1
.29)
.9
(1
.25)
.3
(.
80)
.2
(.60
) .3
(.
78)
Men
’s g
roup
fo
cuse
d on
pa
rent
ing
.7
(1.1
2)
***.
4 (.
81)
1.2
(1.2
5)
2.4
(1.4
2)
.7
(1.0
0)
.6
(1.0
5)
.8
(1.2
2)
*1.1
(1
.19)
.7
(1
.15)
.6
(1
.05)
2 (.
60)
5 (.96
)
Men
’s s
uppo
rt
grou
p on
a
vari
ety
of to
pics
.7
(1.1
0)
***.
5 (.
85)
1.2
(1.2
1)
2.3
(1.3
2)
.8
(1.0
1)
.7
(1.1
2)
.7
(1.1
3)
*.9
(1.1
2)
1.0
(1.1
3)
.6
(1.0
9)
.2
(.60
) .5
(.
88)
A
ll Pr
ogra
ms
Ear
ly
Stag
e
Mid
Sta
ge
M
atur
e
Cen
ter
H
ome
M
ixed
Afr
ican
A
mer
ican
His
pani
c
Whi
te
Nat
ive
Am
eric
an
Mix
ed
Men
’s g
roup
for
tr
aini
ng r
elat
ed
to e
mpl
oym
ent
.5
(.90
) **
*.3
(.70
) .8
(1
.07)
1.
6 (1
.25)
.6
(.
88)
.3
(.81
) .5
(.
93)
***.
9 (1
.06)
.6
(.
87)
.3
(.78
) .2
(.
60)
.3
(.59
)
Men
’s g
roup
for
ed
ucat
ion
or
liter
acy
.5
(.91
) **
*.4
(.77
) .7
(1
.08)
1.
5 (1
.10)
.6
(.
82)
.5
(.92
) .6
(.
95)
.***
9 (.
98)
.8
(1.0
6)
.4
(.80
) .0
(.
00)
.3
(.61
)
Men
’s g
roup
on
subs
tanc
e ab
use
or m
enta
l hea
lth
.6
(.97
) **
*.3
(.69
) 1.
0 (1
.21)
1.
9 (1
.08)
.6
(.
88)
.5
(.97
) .7
(1
.07)
.8
(1
.04)
.7
(.
91)
.5
(1.0
0)
.5
(.82
) .4
(.
98)
Men
and
wom
en
for
trai
ning
for
em
ploy
men
t.
1.1
(1.1
9)
**1.
0 (1
.14)
1.
2 (1
.17)
2.
1 (1
.35)
1.
2 (1
.11)
1.
0 (1
.23)
1.
1 (1
.17)
1.
4 (1
.17)
1.
2 (1
.20)
1.
0 (1
.14)
.8
(1
.17)
1.
0 (1
.23)
Men
and
wom
en
for
lite
racy
. 1.
3 (1
.18)
*1
.3
(1.1
5)
1.5
(1.1
5)
1.9
(1.3
9)
1.4
(1.1
2)
1.4
(1.3
0)
1.3
(1.1
5)
*1.4
(1
.03)
1.
9 (1
.04)
1.
2 (1
.20)
1.
0 (1
.48)
1.
2 (1
.24)
H
ealth
Adv
isor
y B
oard
/Pol
icy
Cou
ncil.
1.7
(.79
) *1
.6
(.74
) 1.
9 (.
89)
1.9
(90)
1.
6 (.
84)
1.7
(.76
) 1.
7 (.
78)
***1
.6
(.79
) 1.
9 (.
78)
1.7
(.78
) 2.
0 (.
77)
1.3
(.78
)
Cen
ter
com
mitt
ees.
1.
7 (.
93)
1.6
(.83
) 1.
8 (1
.22)
1.
9 (.
83)
*1.9
(.
96)
1.5
(.98
) 1.
7 (.
82)
*1.7
(.
87)
1.9
(.91
) 1.
6 (.
87)
2.2
(1.1
7)
1.4
(.87
) M
en a
nd w
omen
on
sub
stan
ce
abus
e
1.1
(1.0
6)
**.9
(1
.06)
1.
2 (.
95)
1.8
(1.0
4)
1.1
(1.0
2)
1.0
(1.1
0)
1.1
(1.0
5)
1.2
(.98
) 1.
4 (1
.08)
.9
(1
.02)
.7
(1
.10)
1.
0 (1
.06)
Wor
king
in th
e cl
assr
oom
1.
6 (.
98)
1.5
(.93
) 1.
6 (1
.08)
1.
9 (1
.08)
**
*2.0
(.
74)
1.1
(1.1
1)
1.7
(.77
) *1
.8
(.69
) 1.
7 (1
.13)
1.
4 (.
99)
1.8
(.98
) 1.
4 (.
89)
Bri
ngin
g ch
ildre
n to
chi
ld
care
(or
pic
king
th
em u
p) a
nd
2.2
(1.2
3)
2.1
(1.2
8)
2.2
(1.3
6)
2.6
(1.2
5)
***2
.8
(1.1
0)
1.4
(1.3
6)
2.6
(.95
) (1
) 2.
4 (1
.06)
2.
4 (1
.30)
2.
0 (1
.24)
2.
7 (1
.56)
2.
1 (1
.41)

FA
TH
ER
IN
VO
LVE
ME
NT
IN E
AR
LY H
EA
D S
TAR
T P
RO
GR
AM
S
94
talk
ing
to th
e te
ache
r A
tten
ding
hom
e vi
sits
, not
ac
tivel
y pa
rtic
ipat
ing
2.3
(.81
) (1
)2.2
(.
79)
2.5
(.87
) 2.
6 (.
70)
*2.1
(.
75)
2.4
(.79
) 2.
3 (.
81)
**2.
1 (.
58)
2.3
(.96
) 2.
4 (.
78)
2.8
(.75
) 2.
0 (.
93)
Part
icip
atin
g ac
tivel
y in
chi
ld
deve
lopm
ent
duri
ng h
ome
visi
ts
2.1
(.77
) **
2.0
(.71
) 2.
4 (.
88)
2.4
(.78
) **
*1.7
(.
84)
2.4
(.66
) 2.
1 (.
70)
*1.9
(.
70)
2.0
(.92
) 2.
3 (.
68)
2.0
(.89
) 2.
1 (.
93)
A
ll Pr
ogra
ms
Ear
ly
Stag
e
Mid
Sta
ge
M
atur
e
Cen
ter
H
ome
M
ixed
Afr
ican
A
mer
ican
His
pani
c
Whi
te
Nat
ive
Am
eric
an
Mix
ed
Part
icip
atin
g ac
tivel
y in
hom
e vi
sits
set
ting
goal
s fo
r fa
mil
y an
d se
lf
1.9
(.82
) **
1.8
(.74
) 2.
1 (.
97)
2.4
(.85
) (1
)1.8
(.
77)
2.1
(.71
) 1.
9 (.
91)
*1.8
(.
77)
2.0
(.95
) 2.
1 (.
71)
1.3
(1.1
0)
1.9
(.89
)
Part
icip
atin
g in
pa
rent
teac
her
conf
eren
ces
1.5
(1.1
5)
(1)1
.4
(1.1
1)
1.6
(1.2
6)
2.0
(1.1
4)
***1
.8
(.81
) .9
(1
.15)
1.
8 (1
.12)
*1
.7
(.88
) 1.
8 (1
.15)
1.
2 (1
.12)
1.
5 (1
.37)
1.
6 (1
.10)
Fixi
ng u
p th
e E
HS
grou
nds,
pa
intin
g
1.1
(1.0
5)
1.0
(1.0
2)
1.3
(1.1
3)
1.3
(1.1
4)
***1
.4
(.98
) .7
(1
.02)
1.
2 (1
.05)
1.
1 (.
85)
1.1
(1.2
6)
1.0
(.98
) 1.
5 (1
.21)
.9
(1
.05)
(1)=
p <
.10
*
= p
< .
05
**
= p
< .0
1
**
* =
p <
.001
A
NO
VA
s a
nd c
hi-s
quar
e te
sts
wer
e us
ed to
det
erm
ine
over
all s
igni
fica
nt d
iffe
renc
es (
in b
old)
acr
oss
leve
ls o
f a
vari
able
, den
oted
by
blac
k c
olum
n m
arke
rs.
Det
aile
d pa
irw
ise
diff
eren
ces
betw
een
cells
or
mea
ns a
re n
ot r
epor
ted
in th
is ta
ble.
N’s
may
var
y so
mew
hat b
ecau
se s
ampl
e re
spon
dent
s di
d no
t ans
wer
eve
ry q
uest
ion.
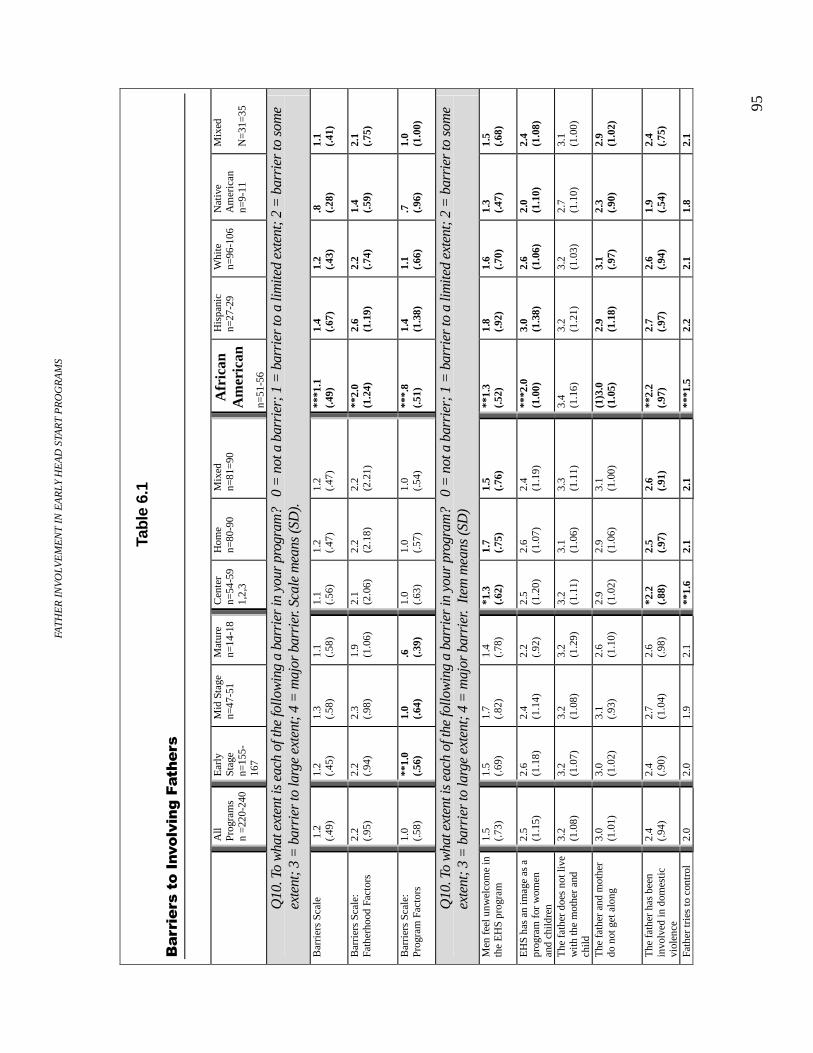
FA
TH
ER
IN
VO
LVE
ME
NT
IN E
AR
LY H
EA
D S
TAR
T P
RO
GR
AM
S
95
Tabl
e 6.
1
1������ ���������������� �� ��
A
ll Pr
ogra
ms
n =2
20-2
40
Ear
ly
Stag
e n=
155-
167
Mid
Sta
ge
n=47
-51
Mat
ure
n=14
-18
Cen
ter
n=54
-59
1,2,
3
Hom
e n=
80-9
0 M
ixed
n=
81=
90
Afr
ican
A
mer
ican
n=
51-5
6
His
pani
c n=
27-2
9 W
hite
n=
96-1
06
Nat
ive
Am
eric
an
n=9-
11
Mix
ed
N=
31=3
5
Q10
. To
wha
t ext
ent i
s ea
ch o
f the
follo
win
g a
barr
ier
in y
our
prog
ram
? 0
= n
ot a
bar
rier
; 1 =
bar
rier
to a
lim
ited
exte
nt; 2
= b
arri
er to
som
e ex
tent
; 3 =
bar
rier
to la
rge
exte
nt; 4
= m
ajor
bar
rier
. Sca
le m
eans
(SD
).
Bar
rier
s Sc
ale
1.2
(.
49)
1.2
(.45
) 1.
3 (.
58)
1.1
(.58
) 1.
1 (.
56)
1.2
(.47
) 1.
2 (.
47)
***1
.1
(.49
)
1.4
(.67
) 1.
2 (.
43)
.8
(.28
) 1.
1 (.
41)
Bar
rier
s Sc
ale:
Fa
ther
hood
Fac
tors
2.
2 (.
95)
2.2
(.94
)
2.3
(.98
) 1.
9 (1
.06)
2.
1 (2
.06)
2.
2 (2
.18)
2.
2 (2
.21)
**
2.0
(1.2
4)
2.6
(1.1
9)
2.2
(.74
) 1.
4 (.
59)
2.1
(.75
)
Bar
rier
s Sc
ale:
Pr
ogra
m F
acto
rs
1.0
(.58
) **
1.0
(.56
)
1.0
(.64
) .6
(.
39)
1.0
(.63
) 1.
0 (.
57)
1.0
(.54
) **
*.8
(.51
) 1.
4 (1
.38)
1.
1 (.
66)
.7
(.96
) 1.
0 (1
.00)
Q10
. To
wha
t ext
ent i
s ea
ch o
f the
follo
win
g a
barr
ier
in y
our
prog
ram
? 0
= n
ot a
bar
rier
; 1 =
bar
rier
to a
lim
ited
exte
nt; 2
= b
arri
er to
som
e ex
tent
; 3 =
bar
rier
to la
rge
exte
nt; 4
= m
ajor
bar
rier
. It
em m
eans
(SD
)
Men
fee
l unw
elco
me
in
the
EH
S pr
ogra
m
1.5
(.73
)
1.5
(.69
) 1.
7 (.
82)
1.4
(.78
) *1
.3
(.62
) 1.
7 (.
75)
1.5
(.76
) **
1.3
(.52
) 1.
8 (.
92)
1.6
(.70
)
1.3
(.47
) 1.
5 (.
68)
E
HS
has
an im
age
as a
pr
ogra
m f
or w
omen
an
d ch
ildre
n
2.5
(1.1
5)
2.6
(1.1
8)
2.4
(1.1
4)
2.2
(.92
) 2.
5 (1
.20)
2.
6 (1
.07)
2.
4 (1
.19)
**
*2.0
(1
.00)
3.
0 (1
.38)
2.
6 (1
.06)
2.
0 (1
.10)
2.
4 (1
.08)
The
fat
her
does
not
live
w
ith
the
mot
her
and
child
3.2
(1.0
8)
3.2
(1.0
7)
3.2
(1.0
8)
3.2
(1.2
9)
3.2
(1.1
1)
3.1
(1.0
6)
3.3
(1.1
1)
3.4
(1.1
6)
3.2
(1.2
1)
3.2
(1.0
3)
2.7
(1.1
0)
3.1
(1.0
0)
The
fat
her
and
mot
her
do n
ot g
et a
long
3.
0 (1
.01)
3.
0 (1
.02)
3.
1 (.
93)
2.6
(1.1
0)
2.9
(1.0
2)
2.9
(1.0
6)
3.1
(1.0
0)
(1)3
.0
(1.0
5)
2.9
(1.1
8)
3.1
(.97
)
2.3
(.90
)
2.9
(1.0
2)
T
he f
athe
r ha
s be
en
invo
lved
in d
omes
tic
viol
ence
2.4
(.94
) 2.
4 (.
90)
2.7
(1.0
4)
2.6
(.98
) *2
.2
(.88
) 2.
5 (.
97)
2.6
(.91
) **
2.2
(.97
) 2.
7 (.
97)
2.6
(.94
) 1.
9 (.
54)
2.4
(.75
)
Fath
er tr
ies
to c
ontr
ol
2.0
2.0
1.9
2.1
**1.
6 2.
1 2.
1 **
*1.5
2.
2 2.
1 1.
8 2.
1
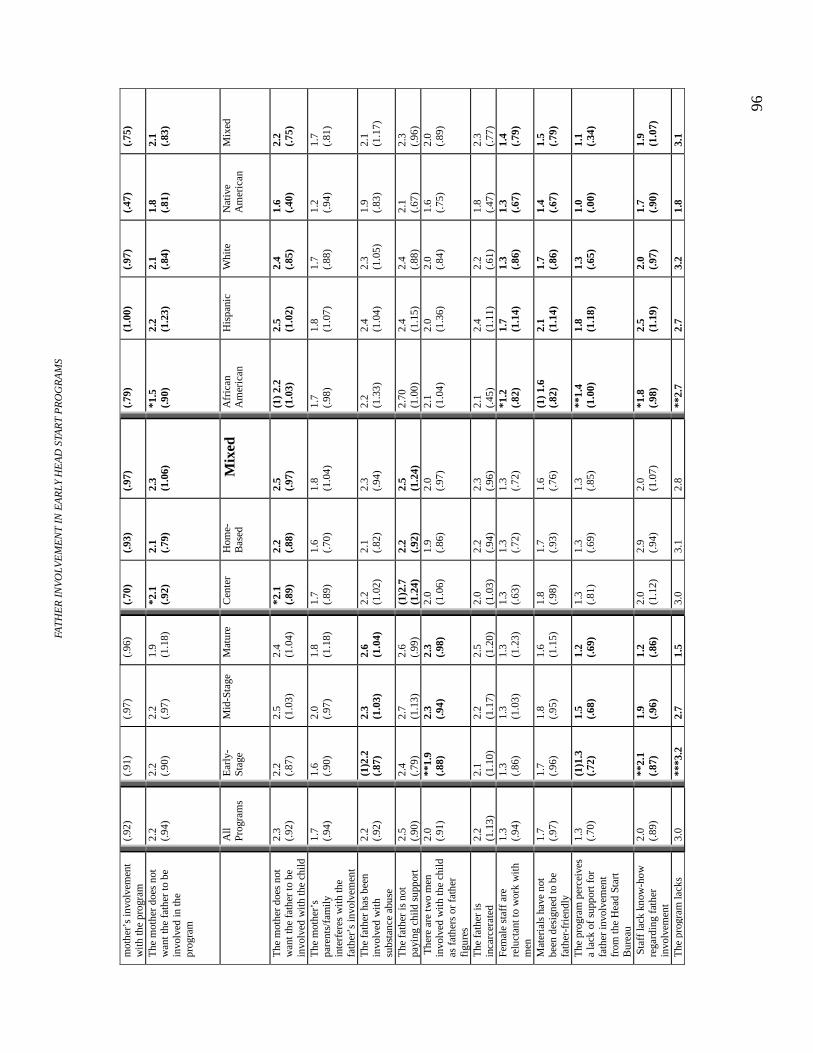
FA
TH
ER
IN
VO
LVE
ME
NT
IN E
AR
LY H
EA
D S
TAR
T P
RO
GR
AM
S
96
mot
her’
s in
volv
emen
t w
ith
the
prog
ram
(.
92)
(.91
) (.
97)
(.96
) (.
70)
(.93
) (.
97)
(.79
) (1
.00)
(.
97)
(.47
) (.
75)
The
mot
her
does
not
w
ant t
he f
athe
r to
be
in
volv
ed in
the
prog
ram
2.2
(.94
) 2.
2 (.
90)
2.2
(.97
) 1.
9 (1
.18)
*2
.1
(.92
) 2.
1 (.
79)
2.3
(1.0
6)
*1.5
(.
90)
2.2
(1.2
3)
2.1
(.84
) 1.
8 (.
81)
2.1
(.83
)
A
ll Pr
ogra
ms
Ear
ly-
Stag
e
Mid
-Sta
ge
M
atur
e
Cen
ter
H
ome-
Bas
ed
Mix
ed
Afr
ican
A
mer
ican
His
pani
c
Whi
te
N
ativ
e A
mer
ican
Mix
ed
The
mot
her
does
not
w
ant t
he f
athe
r to
be
invo
lved
wit
h th
e ch
ild
2.3
(.92
) 2.
2 (.
87)
2.5
(1.0
3)
2.4
(1.0
4)
*2.1
(.
89)
2.2
(.88
) 2.
5 (.
97)
(1)
2.2
(1.0
3)
2.5
(1.0
2)
2.4
(.85
) 1.
6 (.
40)
2.2
(.75
)
The
mot
her’
s pa
rent
s/fa
mily
in
terf
eres
wit
h th
e fa
ther
’s in
volv
emen
t
1.7
(.94
) 1.
6 (.
90)
2.0
(.97
) 1.
8 (1
.18)
1.
7 (.
89)
1.6
(.70
) 1.
8 (1
.04)
1.
7 (.
98)
1.8
(1.0
7)
1.7
(.88
) 1.
2 (.
94)
1.7
(.81
)
The
fat
her
has
been
in
volv
ed w
ith
subs
tanc
e ab
use
2.2
(.92
) (1
)2.2
(.
87)
2.3
(1.0
3)
2.6
(1.0
4)
2.2
(1.0
2)
2.1
(.82
) 2.
3 (.
94)
2.2
(1.3
3)
2.4
(1.0
4)
2.3
(1.0
5)
1.9
(.83
) 2.
1 (1
.17)
The
fat
her
is n
ot
payi
ng c
hild
sup
port
2.
5 (.
90)
2.4
(.79
) 2.
7 (1
.13)
2.
6 (.
99)
(1)2
.7
(1.2
4)
2.2
(.92
) 2.
5 (1
.24)
2.
70
(1.0
0)
2.4
(1.1
5)
2.4
(.88
) 2.
1 (.
67)
2.3
(.96
) T
here
are
two
men
in
volv
ed w
ith
the
child
as
fat
hers
or
fath
er
figu
res
2.0
(.91
) **
1.9
(.88
) 2.
3 (.
94)
2.3
(.98
) 2.
0 (1
.06)
1.
9 (.
86)
2.0
(.97
) 2.
1 (1
.04)
2.
0 (1
.36)
2.
0 (.
84)
1.6
(.75
) 2.
0 (.
89)
The
fat
her
is
inca
rcer
ated
2.
2 (1
.13)
2.
1 (1
.10)
2.
2 (1
.17)
2.
5 (1
.20)
2.
0 (1
.03)
2.
2 (.
94)
2.3
(.96
) 2.
1 (.
45)
2.4
(1.1
1)
2.2
(.61
) 1.
8 (.
47)
2.3
(.77
) Fe
mal
e st
aff
are
relu
ctan
t to
wor
k w
ith
men
1.3
(.94
) 1.
3 (.
86)
1.3
(1.0
3)
1.3
(1.2
3)
1.3
(.63
) 1.
3 (.
72)
1.3
(.72
) *1
.2
(.82
) 1.
7 (1
.14)
1.
3 (.
86)
1.3
(.67
) 1.
4 (.
79)
Mat
eria
ls h
ave
not
been
des
igne
d to
be
fath
er-f
rien
dly
1.7
(.97
) 1.
7 (.
96)
1.8
(.95
) 1.
6 (1
.15)
1.
8 (.
98)
1.7
(.93
) 1.
6 (.
76)
(1)
1.6
(.82
) 2.
1 (1
.14)
1.
7 (.
86)
1.4
(.67
) 1.
5 (.
79)
The
pro
gram
per
ceiv
es
a la
ck o
f su
ppor
t for
fa
ther
invo
lvem
ent
from
the
Hea
d St
art
Bur
eau
1.3
(.70
) (1
)1.3
(.
72)
1.5
(.68
) 1.
2 (.
69)
1.3
(.81
) 1.
3 (.
69)
1.3
(.85
) **
1.4
(1.0
0)
1.8
(1.1
8)
1.3
(.65
) 1.
0 (.
00)
1.1
(.34
)
Sta
ff la
ck k
now
-how
re
gard
ing
fath
er
invo
lvem
ent
2.0
(.89
) **
2.1
(.87
) 1.
9 (.
96)
1.2
(.86
) 2.
0 (1
.12)
2.
9 (.
94)
2.0
(1.0
7)
*1.8
(.
98)
2.5
(1.1
9)
2.0
(.97
) 1.
7 (.
90)
1.9
(1.0
7)
The
pro
gram
lack
s 3.
0 **
*3.2
2.
7 1.
5 3.
0 3.
1 2.
8 **
2.7
2.7
3.2
1.8
3.1

FA
TH
ER
IN
VO
LVE
ME
NT
IN E
AR
LY H
EA
D S
TAR
T P
RO
GR
AM
S
97
mal
e st
aff
that
fat
hers
ca
n re
late
to
(.80
) (.
70)
(1.0
9)
(.71
) (1
.56)
(1
.43)
(1
.39)
(1
.62)
(1
.59)
(1
.30)
(.
98)
(1.4
5)
Fath
ers’
wor
k sc
hedu
les
inte
rfer
e w
ith
prog
ram
in
volv
emen
t
3.3
(1.1
2)
3.4
(1.1
3)
3.1
(1.0
8)
3.1
(1.0
9)
3.3
(1.2
1)
3.2
(1.1
2)
3.4
(1.0
9)
***2
.9
(1.1
4)
4.1
(1.0
7)
3.2
(1.0
8)
3.3
(1.0
1)
3.4
(.92
)
Cla
ssro
om a
nd c
ente
r en
viro
nmen
ts a
re n
ot
fath
er f
rien
dly
1.4
(.77
) 1.
4 (.
77)
1.6
(.81
) 1.
2 (.
53)
1.5
(.95
) 1.
4 (.
75)
1.4
(.65
) *1
.3
(.70
) 1.
8 (1
.04)
1.
4 (.
76)
1.2
(.40
) 1.
4 (.
59)
(0)
= p
< .1
0
* =
p <
.05
**
= p
< .
01
***
= p
< .0
01
AN
OV
As
and
chi
-squ
are
test
s w
ere
used
to d
eter
min
e ov
eral
l sig
nifi
cant
dif
fere
nces
(in
bol
d) a
cros
s le
vels
of
a va
riab
le, d
enot
ed b
y bl
ack
col
umn
mar
kers
. D
etai
led
pair
wis
e di
ffer
ence
s be
twee
n ce
lls
or m
eans
are
not
rep
orte
d in
this
tabl
e. N
’s m
ay v
ary
som
ewha
t bec
ause
sam
ple
resp
onde
nts
did
not a
nsw
er e
very
que
stio
n.
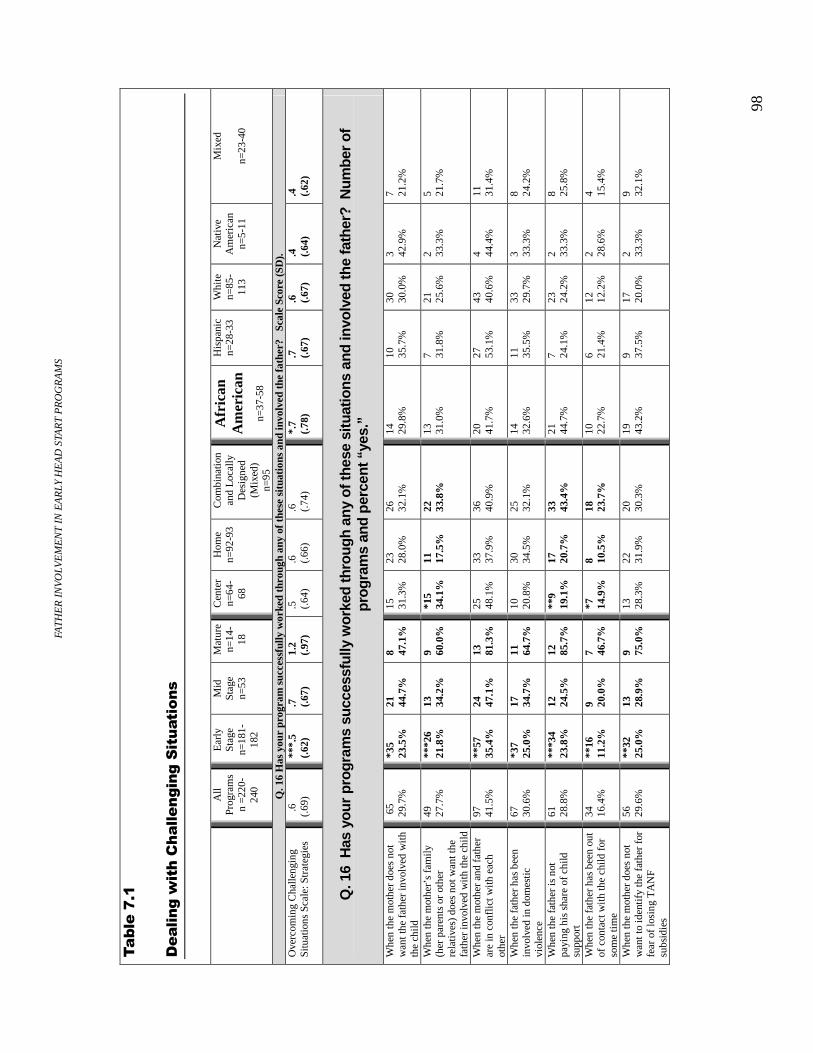
FA
TH
ER
IN
VO
LVE
ME
NT
IN E
AR
LY H
EA
D S
TAR
T P
RO
GR
AM
S
98
��*���8-.�
���������� �� ����������������� �
A
ll Pr
ogra
ms
n =2
20-
240
Ear
ly
Stag
e n=
181-
182
Mid
St
age
n=53
Mat
ure
n=14
-18
Cen
ter
n=64
-68
Hom
e n=
92-9
3 C
ombi
natio
n an
d L
ocal
ly
Des
igne
d (M
ixed
) n=
95
Afr
ican
A
mer
ican
n=
37-5
8
His
pani
c n=
28-3
3 W
hite
n=
85-
113
Nat
ive
Am
eric
an
n=5-
11
Mix
ed
n=
23-4
0
Q. 1
6 H
as y
our
prog
ram
suc
cess
fully
wor
ked
thro
ugh
any
of t
hese
sit
uati
ons
and
invo
lved
the
fath
er?
Sca
le S
core
(SD
).
Ove
rcom
ing
Cha
lleng
ing
Situ
atio
ns S
cale
: Str
ateg
ies
.
6 (.
69)
***.
5 (.
62)
.7
(.67
) 1.
2 (.
97)
.5
(.64
) .6
(.
66)
.6
(.74
) *.
7 (.
78)
.7
(.67
) .6
(.
67)
.4
(.64
) .4
(.
62)
Q. 1
6 H
as y
our
prog
ram
s su
cces
sful
ly w
orke
d th
roug
h an
y of
thes
e si
tuat
ions
and
invo
lved
the
fath
er?
Num
ber
of
prog
ram
s an
d p
erce
nt “
yes.
”
Whe
n th
e m
othe
r do
es n
ot
wan
t the
fat
her
invo
lved
wit
h th
e ch
ild
65
29.7
%
*35
23.5
%
21
44.7
%
8 47.1
%
15
31.3
%
23
28.0
%
26
32.1
%
14
29.8
%
10
35.7
%
30
30.0
%
3 42.9
%
7 21.2
%
Whe
n th
e m
othe
r’s
fam
ily
(her
par
ents
or
othe
r re
lati
ves)
doe
s no
t wan
t the
fa
ther
invo
lved
wit
h th
e ch
ild
49
27.7
%
***2
6 21
.8%
13
34
.2%
9 60
.0%
*1
5 34
.1%
11
17
.5%
22
33
.8%
13
31.0
%
7 31.8
%
21
25.6
%
2 33.3
%
5 21.7
%
Whe
n th
e m
othe
r an
d fa
ther
ar
e in
con
flic
t with
eac
h ot
her
97
41.5
%
**57
35
.4%
24
47
.1%
13
81
.3%
25
48
.1%
33
37
.9%
36
40
.9%
20
41
.7%
27
53
.1%
43
40
.6%
4 44
.4%
11
31
.4%
Whe
n th
e fa
ther
has
bee
n in
volv
ed in
dom
estic
vi
olen
ce
67
30.6
%
*37
25.0
%
17
34.7
%
11
64.7
%
10
20.8
%
30
34.5
%
25
32.1
%
14
32.6
%
11
35.5
%
33
29.7
%
3 33.3
%
8 24.2
%
Whe
n th
e fa
ther
is n
ot
payi
ng h
is s
hare
of
child
su
ppor
t
61
28.8
%
***3
4 23
.8%
12
24
.5%
12
85
.7%
**
9 19
.1%
17
20
.7%
33
43
.4%
21
44
.7%
7 24
.1%
23
24
.2%
2 33
.3%
8 25
.8%
Whe
n th
e fa
ther
has
bee
n ou
t of
con
tact
wit
h th
e ch
ild f
or
som
e ti
me
34
16.4
%
**16
11
.2%
9 20
.0%
7 46
.7%
*7
14
.9%
8 10
.5%
18
23
.7%
10
22.7
%
6 21.4
%
12
12.2
%
2 28.6
%
4 15.4
%
Whe
n th
e m
othe
r do
es n
ot
wan
t to
iden
tify
the
fath
er f
or
fear
of
losi
ng T
AN
F su
bsid
ies
56
29.6
%
**32
25
.0%
13
28
.9%
9 75
.0%
13
28
.3%
22
31
.9%
20
30
.3%
19
43.2
%
9 37.5
%
17
20.0
%
2 33.3
%
9 32.1
%
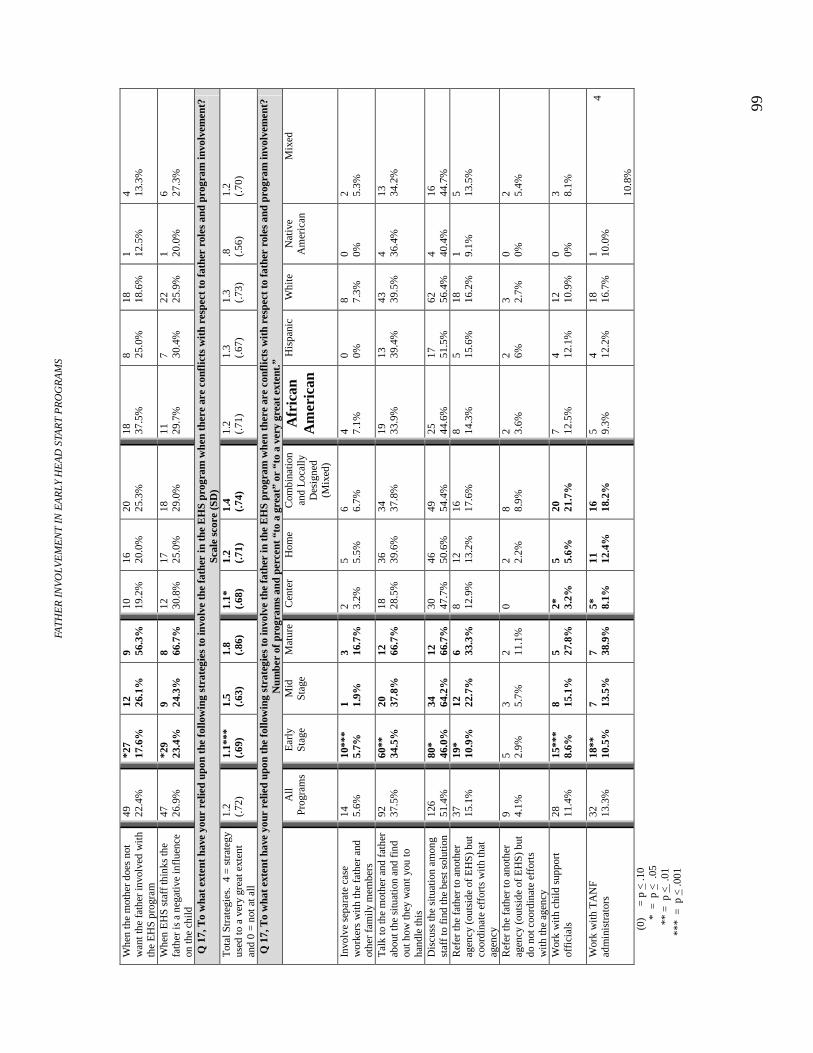
FA
TH
ER
IN
VO
LVE
ME
NT
IN E
AR
LY H
EA
D S
TAR
T P
RO
GR
AM
S
99
Whe
n th
e m
othe
r do
es n
ot
wan
t the
fat
her
invo
lved
wit
h th
e E
HS
prog
ram
49
22.4
%
*27
17.6
%
12
26.1
%
9 56.3
%
10
19.2
%
16
20.0
%
20
25.3
%
18
37.5
%
8 25.0
%
18
18.6
%
1 12.5
%
4 13.3
%
Whe
n E
HS
staf
f th
inks
the
fath
er is
a n
egat
ive
infl
uenc
e on
the
child
47
26.9
%
*29
23.4
%
9 24.3
%
8 66.7
%
12
30.8
%
17
25.0
%
18
29.0
%
11
29.7
%
7 30.4
%
22
25.9
%
1 20.0
%
6 27.3
%
Q 1
7, T
o w
hat e
xten
t ha
ve y
our
relie
d up
on t
he f
ollo
win
g st
rate
gies
to in
volv
e th
e fa
ther
in t
he E
HS
prog
ram
whe
n th
ere
are
conf
licts
wit
h re
spec
t to
fat
her
role
s an
d pr
ogra
m in
volv
emen
t?
Scal
e sc
ore
(SD
) T
otal
Str
ateg
ies.
4 =
str
ateg
y us
ed to
a v
ery
grea
t ext
ent
and
0 =
not a
t all
1.2
(.72
) 1.
1***
(.
69)
1.5
(.63
) 1.
8 (.
86)
1.1*
(.
68)
1.2
(.71
) 1.
4 (.
74)
1.2
(.71
) 1.
3 (.
67)
1.3
(.73
) .8
(.
56)
1.2
(.70
)
Q 1
7, T
o w
hat e
xten
t ha
ve y
our
relie
d up
on t
he f
ollo
win
g st
rate
gies
to in
volv
e th
e fa
ther
in t
he E
HS
prog
ram
whe
n th
ere
are
conf
licts
wit
h re
spec
t to
fat
her
role
s an
d pr
ogra
m in
volv
emen
t?
Num
ber
of p
rogr
ams
and
perc
ent “
to a
gre
at”
or “
to a
ver
y gr
eat e
xten
t.”
All
Prog
ram
s
Ear
ly
Stag
e
Mid
St
age
Mat
ure
C
ente
r
Hom
e
Com
bina
tion
and
Loc
ally
D
esig
ned
(Mix
ed)
Afr
ican
A
mer
ican
His
pani
c
Whi
te
Nat
ive
Am
eric
an
Mix
ed
Invo
lve
sepa
rate
cas
e w
orke
rs w
ith
the
fath
er a
nd
othe
r fa
mily
mem
bers
14
5.6%
10
***
5.7%
1 1.
9%
3 16.7
%
2 3.2%
5 5.
5%
6 6.7%
4 7.
1%
0 0%
8 7.3%
0 0%
2 5.
3%
Tal
k to
the
mot
her
and
fath
er
abou
t the
situ
atio
n an
d fi
nd
out h
ow th
ey w
ant y
ou to
ha
ndle
this
92
37.5
%
60**
34
.5%
20
37
.8%
12
66
.7%
18
28
.5%
36
39
.6%
34
37
.8%
19
33
.9%
13
39
.4%
43
39
.5%
4 36
.4%
13
34
.2%
Dis
cuss
the
situ
atio
n am
ong
staf
f to
fin
d th
e be
st s
olut
ion
126
51.4
%
80*
46.0
%
34
64.2
%
12
66.7
%
30
47.7
%
46
50.6
%
49
54.4
%
25
44.6
%
17
51.5
%
62
56.4
%
4 40.4
%
16
44.7
%
Ref
er th
e fa
ther
to a
noth
er
agen
cy (
outs
ide
of E
HS)
but
co
ordi
nate
eff
orts
wit
h th
at
agen
cy
37
15.1
%
19*
10.9
%
12
22.7
%
6 33.3
%
8 12.9
%
12
13.2
%
16
17.6
%
8 14.3
%
5 15.6
%
18
16.2
%
1 9.1%
5 13
.5%
Ref
er th
e fa
ther
to a
noth
er
agen
cy (
outs
ide
of E
HS)
but
do
not
coo
rdin
ate
effo
rts
wit
h th
e ag
ency
9 4.1%
5 2.
9%
3 5.7%
2 11
.1%
0
2 2.2%
8 8.
9%
2 3.6%
2 6%
3 2.
7%
0 0%
2 5.4%
Wor
k w
ith
child
sup
port
of
fici
als
28
11.4
%
15**
* 8.
6%
8 15.1
%
5 27.8
%
2*
3.2%
5 5.
6%
20
21.7
%
7 12.5
%
4 12.1
%
12
10.9
%
0 0%
3 8.1%
Wor
k w
ith
TA
NF
adm
inis
trat
ors
32
13.3
%
18**
10
.5%
7 13
.5%
7 38
.9%
5*
8.
1%
11
12.4
%
16
18.2
%
5 9.3%
4 12
.2%
18
16
.7%
1 10
.0%
4
10.8
%
(0)
= p
< .1
0
* =
p <
.05
** =
p <
.01
*
** =
p <
.001
FA
TH
ER
IN
VO
LVE
ME
NT
IN E
AR
LY H
EA
D S
TAR
T P
RO
GR
AM
S
10
0
AN
OV
As
and
chi
-squ
are
test
s w
ere
used
to d
eter
min
e ov
eral
l sig
nifi
cant
dif
fere
nces
(in
bol
d) a
cros
s le
vels
of
a va
riab
le, d
enot
ed b
y bl
ack
col
umn
mar
kers
. D
etai
led
pair
wis
e di
ffer
ence
s be
twee
n ce
lls
or m
eans
are
not
rep
orte
d in
this
tabl
e. N
’s m
ay v
ary
som
ewha
t bec
ause
sam
ple
resp
onde
nts
did
not a
nsw
er e
very
que
stio
n.

FA
TH
ER
IN
VO
LVE
ME
NT
IN E
AR
LY H
EA
D S
TAR
T P
RO
GR
AM
S
10
1
��*���9-.�
���$$��������������
A
ll Pr
ogra
ms
n =6 53
-259
Ear
ly
Stag
e n=
48-1
82
Mid
St
age
n=31
-53
Mat
ure
n=15
-18
Cen
ter
n=24
-65
Hom
e n=
31-9
3 C
ombi
natio
n an
d L
ocal
ly
Des
igne
d n=
19-9
5
Afr
ican
A
mer
ican
n=
28-5
8
His
pani
c n=
14-3
3 W
hite
n=
35-
113
Nat
ive
Am
eric
an
n=3-
11
Mix
ed
n=
12-
40
Q 1
8. Is
ther
e on
e pe
rson
who
pro
vide
s th
e le
ader
ship
and
day
-to-
day
man
agem
ent f
or fa
ther
invo
lvem
ent w
ithin
you
r pr
ogra
m?
Num
ber
of
prog
ram
s an
d pe
rcen
t “ye
s.”
Yes
, one
per
son
is in
cha
rge
of
fath
er in
volv
emen
t. 93
35
.6%
***
45
24.9
%
33
62.3
%
14
82.4
%
26
40.0
%
29
31.5
%
35
37.2
%
28
49.1
%
13
39.4
%
33
29.5
%
3 27.3
%
15
37.5
%
Res
pons
ibili
ty is
sha
red
by
two
peop
le.
36
13.8
%
***2
4 13
.3%
10
18
.9%
2 11
.8%
11
16
.9%
9 9.
8%
15
16.0
%
8 14.0
%
7 21.2
%
15
13.4
%
2 18.2
%
3 7.5%
Y
es, o
ne o
r tw
o pe
rson
s ar
e in
ch
arge
of
fath
er in
volv
emen
t 12
9 49
.8%
**
*69
38.1
%
43
81.2
%
16
94.1
%
37
56.9
%
38
41.3
%
50
53.2
%
(1)3
6 63
.2%
20
60
.6%
48
42
.9%
5 45
.5%
18
45
.0%
Am
ong
the
prog
ram
s w
ho h
ave
desi
gnat
ed a
sin
gle
pers
on to
pro
vide
lead
ersh
ip a
nd d
ay-t
o-da
y m
anag
emen
t for
fath
er in
volv
emen
t with
in th
e pr
ogra
m, i
s th
at p
erso
n a
man
? N
umbe
r of
pro
gram
s an
d pe
rcen
t “ye
s.”
Yes
, per
son
in c
harg
e is
a
man
. 53
56
.4%
16
33
.3%
25
80
.6%
12
80
.8%
12
50
.0%
20
64
.5%
19
52
.8%
18
64
.3%
10
71
.4%
14
40
.0%
2 66
.7%
8 53
.3%
Has
you
r pr
ogra
m h
ired
mal
e st
aff?
Num
ber
of p
rogr
ams
and
perc
ent “
yes.
”
Hir
ed m
ale
staf
f 12
3 47
.1%
73
40
.1%
32
60
.4%
15
83
.3%
31
48
.4%
40
43
.0%
49
51
.6%
32
55
.2%
15
45
.5%
46
41
.1%
9 81
.8%
20
50
.0%
H
as y
our
prog
ram
pro
vide
d tr
aini
ng f
or t
he E
HS
fath
er in
volv
emen
t co
ordi
nato
r or
per
son
in c
harg
e of
fat
her
invo
lvem
ent
or fo
r al
l sta
ff o
n w
orki
ng w
ith
men
and
on
fath
erho
od o
r al
low
ed t
ime
for
outr
each
to
fath
ers?
Num
ber
of p
rogr
ams
and
per
cent
“ye
s.”
(A
lso
in T
able
4.1
) Pr
ovid
ed tr
aini
ng f
or a
ll st
aff
on w
orki
ng w
ith
men
and
on
fath
erho
od
99
38.1
%
50**
* 27
.5%
32
60
.4%
14
77
.8%
16
(1)
25
.0%
38
40
.9%
40
42
.1%
22
37
.9%
11
33
.3%
49
43
.8%
3 27
.3%
13
32
.5
Prov
ided
spe
cifi
c tr
aini
ng f
or
the
EH
S fa
ther
invo
lvem
ent
coor
dina
tor
or p
erso
n in
ch
arge
of
fath
er in
volv
emen
t
75
28.8
%
26**
* 14
.3%
33
62
.3%
16
88
.9%
20
31
.3%
21
22
.6%
32
33
.7%
20
34
.5%
10
30
.3%
30
26
.8%
4 36
.4%
11
27
.5
6 L
ower
num
bers
ref
lect
res
pons
es b
y a
subs
et o
f th
e pr
ogra
ms.
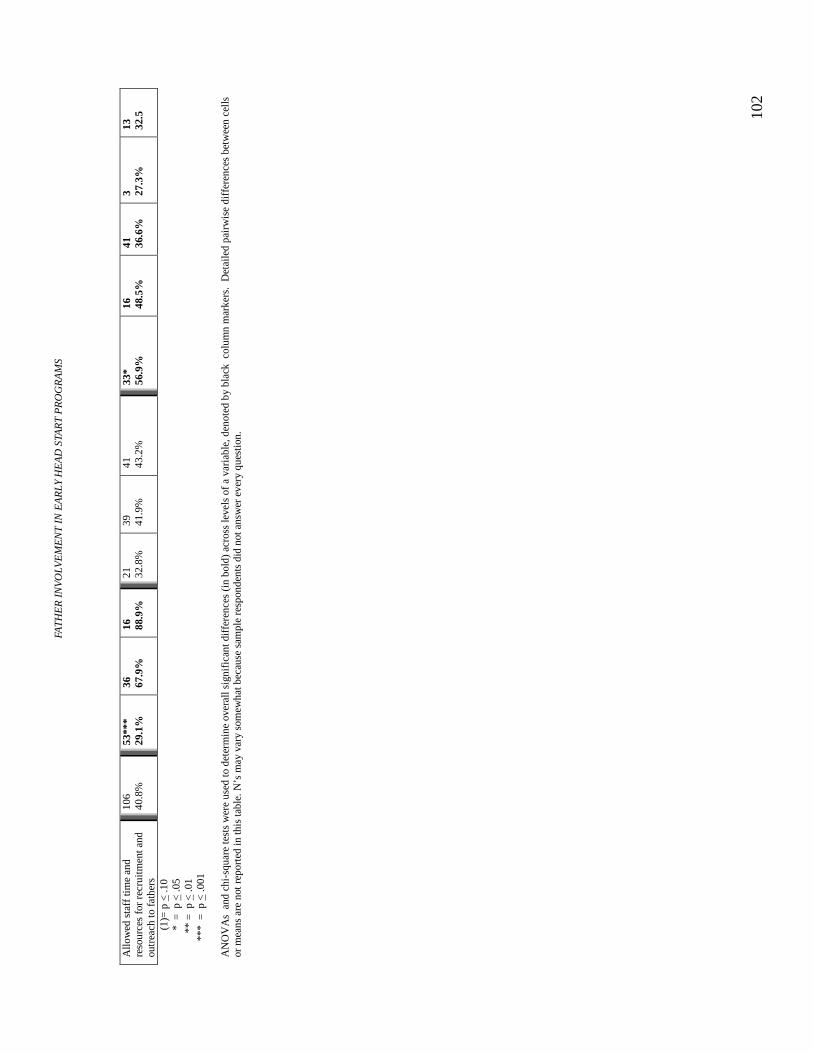
FA
TH
ER
IN
VO
LVE
ME
NT
IN E
AR
LY H
EA
D S
TAR
T P
RO
GR
AM
S
10
2
Allo
wed
sta
ff ti
me
and
reso
urce
s fo
r re
crui
tmen
t and
ou
trea
ch to
fat
hers
106
40.8
%
53**
* 29
.1%
36
67
.9%
16
88
.9%
21
32
.8%
39
41
.9%
41
43
.2%
33
* 56
.9%
16
48
.5%
41
36
.6%
3 27
.3%
13
32
.5
(1)=
p <
.10
*
= p
< .0
5 **
= p
< .0
1
**
* =
p <
.001
A
NO
VA
s a
nd c
hi-s
quar
e te
sts
wer
e us
ed to
det
erm
ine
over
all s
igni
fica
nt d
iffe
renc
es (
in b
old)
acr
oss
leve
ls o
f a
vari
able
, den
oted
by
blac
k c
olum
n m
arke
rs.
Det
aile
d pa
irw
ise
diff
eren
ces
betw
een
cells
or
mea
ns a
re n
ot r
epor
ted
in th
is ta
ble.
N’s
may
var
y so
mew
hat b
ecau
se s
ampl
e re
spon
dent
s di
d no
t ans
wer
eve
ry q
uest
ion.
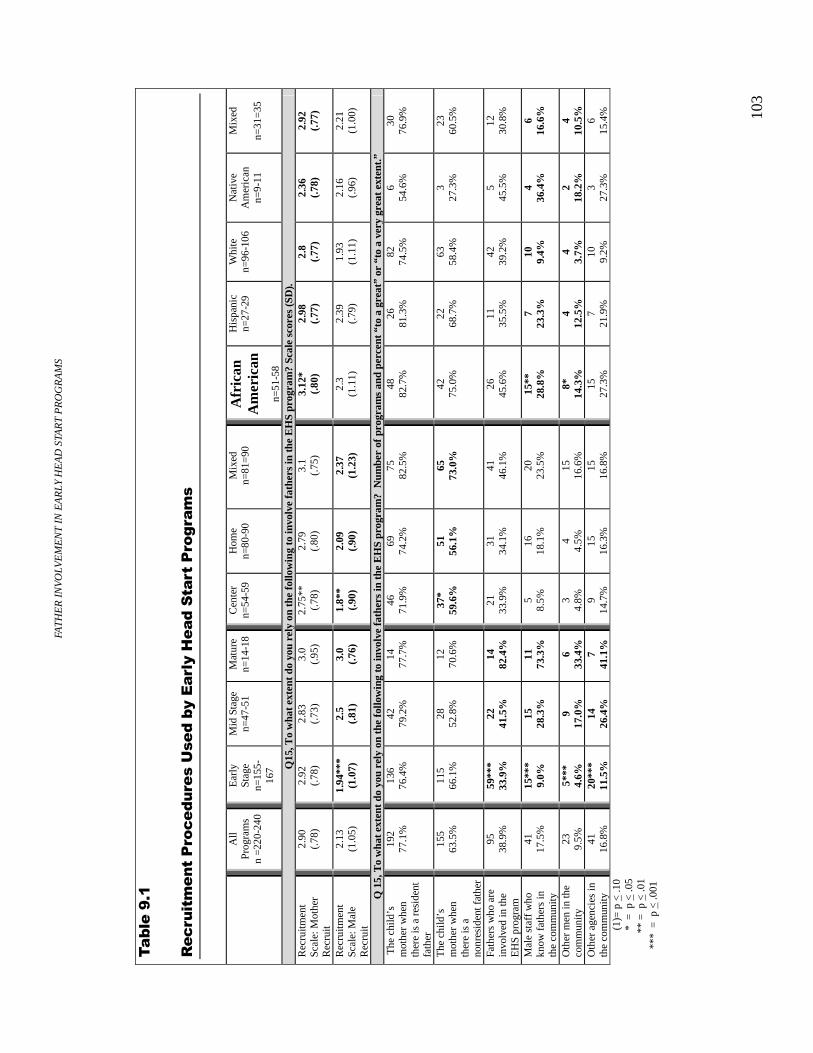
FA
TH
ER
IN
VO
LVE
ME
NT
IN E
AR
LY H
EA
D S
TAR
T P
RO
GR
AM
S
10
3
��*���:-.�
������������&������� �; ��*��������%���������&����� �
A
ll Pr
ogra
ms
n =2
20-2
40
Ear
ly
Stag
e n=
155-
167
Mid
Sta
ge
n=47
-51
Mat
ure
n=14
-18
Cen
ter
n=54
-59
Hom
e n=
80-9
0 M
ixed
n=
81=
90
Afr
ican
A
mer
ican
n=
51-5
8
His
pani
c n=
27-2
9 W
hite
n=
96-1
06
Nat
ive
Am
eric
an
n=9-
11
Mix
ed
n=
31=
35
Q15
, To
wha
t ext
ent
do y
ou r
ely
on th
e fo
llow
ing
to in
volv
e fa
ther
s in
the
EH
S pr
ogra
m?
Scal
e sc
ores
(SD
). R
ecru
itmen
t Sc
ale:
Mot
her
Rec
ruit
2.90
(.
78)
2.92
(.
78)
2.83
(.
73)
3.0
(.95
) 2.
75**
(.
78)
2.79
(.
80)
3.1
(.75
) 3.
12*
(.80
) 2.
98
(.77
) 2.
8 (.
77)
2.36
(.
78)
2.92
(.
77)
Rec
ruitm
ent
Scal
e: M
ale
Rec
ruit
2.13
(1
.05)
1.
94**
* (1
.07)
2.
5 (.
81)
3.0
(.76
) 1.
8**
(.90
) 2.
09
(.90
) 2.
37
(1.2
3)
2.3
(1.1
1)
2.39
(.
79)
1.93
(1
.11)
2.
16
(.96
) 2.
21
(1.0
0)
Q 1
5, T
o w
hat e
xten
t do
you
rel
y on
the
fol
low
ing
to in
volv
e fa
ther
s in
the
EH
S pr
ogra
m?
Num
ber
of p
rogr
ams
and
perc
ent “
to a
gre
at”
or “
to a
ver
y gr
eat
exte
nt.”
T
he c
hild
’s
mot
her
whe
n th
ere
is a
res
iden
t fa
ther
192
77.1
%
136
76.4
%
42
79.2
%
14
77.7
%
46
71.9
%
69
74.2
%
75
82.5
%
48
82.7
%
26
81.3
%
82
74.5
%
6 54
.6%
30
76
.9%
The
chi
ld’s
m
othe
r w
hen
ther
e is
a
nonr
esid
ent f
athe
r
155
63.5
%
115
66.1
%
28
52.8
%
12
70.6
%
37*
59.6
%
51
56.1
%
65
73.0
%
42
75.0
%
22
68.7
%
63
58.4
%
3 27
.3%
23
60
.5%
Fath
ers
who
are
in
volv
ed in
the
EH
S pr
ogra
m
95
38.9
%
59**
* 33
.9%
22
41
.5%
14
82
.4%
21
33
.9%
31
34
.1%
41
46
.1%
26
45
.6%
11
35
.5%
42
39
.2%
5
45.5
%
12
30.8
%
Mal
e st
aff
who
kn
ow f
athe
rs in
th
e co
mm
unity
41
17.5
%
15**
* 9.
0%
15
28.3
%
11
73.3
%
5 8.
5%
16
18.1
%
20
23.5
%
15**
28
.8%
7
23.3
%
10
9.4%
4
36.4
%
6 16
.6%
Oth
er m
en in
the
com
mun
ity
23
9.5%
5*
**
4.6%
9
17.0
%
6 33
.4%
3
4.8%
4
4.5%
15
16
.6%
8*
14
.3%
4
12.5
%
4 3.
7%
2 18
.2%
4
10.5
%
Oth
er a
genc
ies
in
the
com
mun
ity
41
16.8
%
20**
* 11
.5%
14
26
.4%
7
41.1
%
9 14
.7%
15
16
.3%
15
16
.8%
15
27
.3%
7
21.9
%
10
9.2%
3
27.3
%
6 15
.4%
(1
)= p
< .1
0 *
= p
< .0
5 **
= p
< .0
1
***
= p
< .0
01
FA
TH
ER
IN
VO
LVE
ME
NT
IN E
AR
LY H
EA
D S
TAR
T P
RO
GR
AM
S
10
4
AN
OV
As
and
chi
-squ
are
test
s w
ere
used
to d
eter
min
e ov
eral
l sig
nifi
cant
dif
fere
nces
(in
bol
d) a
cros
s le
vels
of
a va
riab
le, d
enot
ed b
y bl
ack
col
umn
mar
kers
. D
etai
led
pair
wis
e di
ffer
ence
s be
twee
n ce
lls
or m
eans
are
not
rep
orte
d in
this
tabl
e. N
’s m
ay v
ary
som
ewha
t bec
ause
sam
ple
resp
onde
nts
did
not a
nsw
er e
very
que
stio
n.
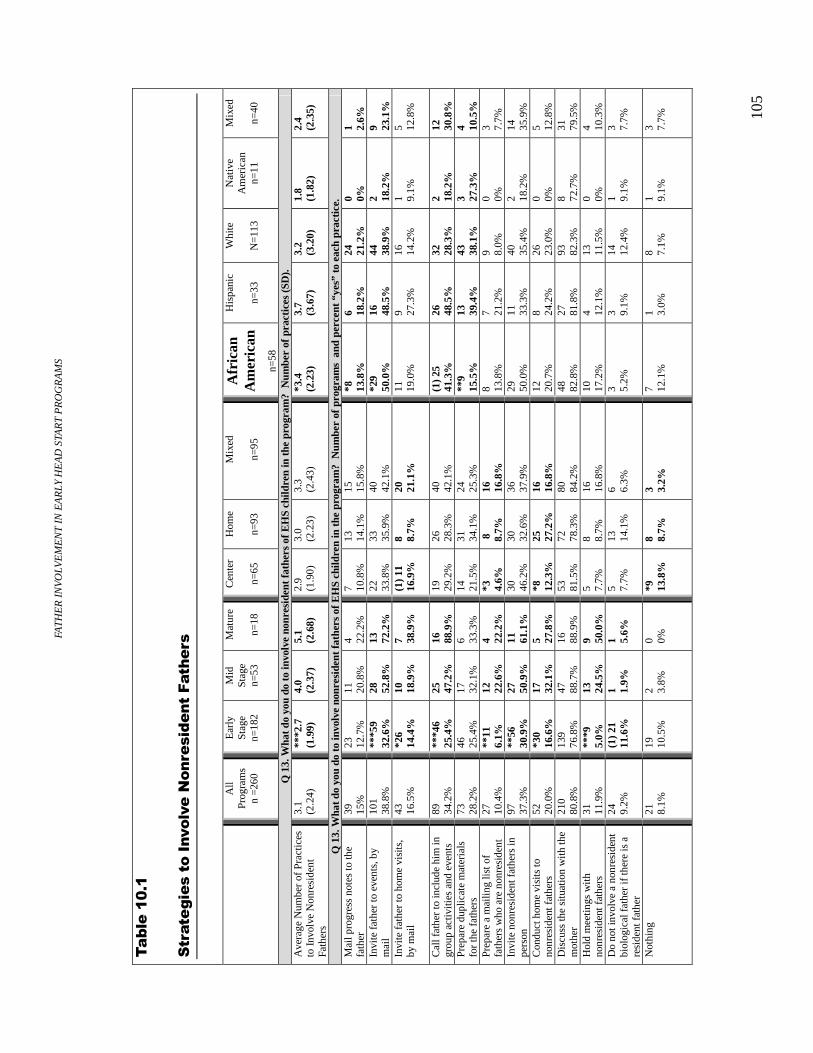
FA
TH
ER
IN
VO
LVE
ME
NT
IN E
AR
LY H
EA
D S
TAR
T P
RO
GR
AM
S
10
5
��*���.2-.�
�������� ����������������� �������� �� �
A
ll Pr
ogra
ms
n =2
60
Ear
ly
Stag
e n=
182
Mid
St
age
n=53
Mat
ure
n=
18
Cen
ter
n=
65
Hom
e
n=93
Mix
ed
n=
95
Afr
ican
A
mer
ican
n=
58
His
pani
c
n=33
Whi
te
N
=11
3
Nat
ive
Am
eric
an
n=11
Mix
ed
n=
40
Q 1
3. W
hat d
o yo
u do
to
invo
lve
nonr
esid
ent
fath
ers
of E
HS
child
ren
in t
he p
rogr
am?
Num
ber
of p
ract
ices
(SD
).
Ave
rage
Num
ber
of P
ract
ices
to
Inv
olve
Non
resi
dent
Fa
ther
s
3.1
(2.2
4)
***2
.7
(1.9
9)
4.0
(2.3
7)
5.1
(2.6
8)
2.9
(1.9
0)
3.0
(2.2
3)
3.3
(2.4
3)
*3.4
(2
.23)
3.
7 (3
.67)
3.
2 (3
.20)
1.
8 (1
.82)
2.
4 (2
.35)
Q 1
3. W
hat d
o yo
u do
to
invo
lve
nonr
esid
ent
fath
ers
of E
HS
child
ren
in t
he p
rogr
am?
Num
ber
of p
rogr
ams
and
per
cent
“ye
s” to
eac
h pr
acti
ce.
Mai
l pro
gres
s no
tes
to th
e fa
ther
39
15
%
23
12.7
%
11
20.8
%
4 22.2
%
7 10.8
%
13
14.1
%
15
15.8
%
*8
13.8
%
6 18.2
%
24
21.2
%
0 0%
1 2.6%
In
vite
fat
her
to e
vent
s, b
y m
ail
101
38.8
%
***5
9 32
.6%
28
52
.8%
13
72
.2%
22
33
.8%
33
35
.9%
40
42
.1%
*2
9 50
.0%
16
48
.5%
44
38
.9%
2 18
.2%
9 23
.1%
In
vite
fat
her
to h
ome
visi
ts,
by m
ail
43
16.5
%
*26
14.4
%
10
18.9
%
7 38.9
%
(1)
11
16.9
%
8 8.7%
20
21
.1%
11
19
.0%
9 27
.3%
16
14
.2%
1 9.
1%
5 12.8
%
Cal
l fat
her
to in
clud
e hi
m in
gr
oup
activ
ities
and
eve
nts
89
34.2
%
***4
6 25
.4%
25
47
.2%
16
88
.9%
19
29
.2%
26
28
.3%
40
42
.1%
(1
) 25
41
.3%
26
48
.5%
32
28
.3%
2 18
.2%
12
30
.8%
Pr
epar
e du
plic
ate
mat
eria
ls
for
the
fath
ers
73
28.2
%
46
25.4
%
17
32.1
%
6 33.3
%
14
21.5
%
31
34.1
%
24
25.3
%
**9
15.5
%
13
39.4
%
43
38.1
%
3 27.3
%
4 10.5
%
Prep
are
a m
ailin
g lis
t of
fath
ers
who
are
non
resi
dent
27
10
.4%
**
11
6.1%
12
22
.6%
4 22
.2%
*3
4.
6%
8
8.7%
16
16
.8%
8 13
.8%
7 21
.2%
9 8.
0%
0 0%
3 7.7%
In
vite
non
resi
dent
fat
hers
in
pers
on
97
37.3
%
**56
30
.9%
27
50
.9%
11
61
.1%
30
46
.2%
30
32
.6%
36
37
.9%
29
50
.0%
11
33
.3%
40
35
.4%
2 18
.2%
14
35
.9%
C
ondu
ct h
ome
visi
ts to
no
nres
iden
t fat
hers
52
20
.0%
*3
0 16
.6%
17
32
.1%
5 27
.8%
*8
12
.3%
25
27
.2%
16
16
.8%
12
20
.7%
8 24
.2%
26
23
.0%
0 0%
5 12
.8%
D
iscu
ss th
e si
tuat
ion
with
the
mot
her
210
80.8
%
139
76.8
%
47
88.7
%
16
88.9
%
53
81.5
%
72
78.3
%
80
84.2
%
48
82.8
%
27
81.8
%
93
82.3
%
8 72.7
%
31
79.5
%
Hol
d m
eeti
ngs
wit
h no
nres
iden
t fat
hers
31
11
.9%
**
*9
5.0%
13
24
.5%
9 50
.0%
5 7.
7%
8 8.7%
16
16
.8%
10
17
.2%
4 12
.1%
13
11
.5%
0 0%
4 10
.3%
D
o no
t inv
olve
a n
onre
side
nt
biol
ogic
al f
athe
r if
ther
e is
a
resi
dent
fat
her
24
9.2%
(1
) 21
11
.6%
1 1.
9%
1 5.6%
5 7.
7%
13
14.1
%
6 6.3%
3 5.
2%
3 9.1%
14
12
.4%
1 9.
1%
3 7.7%
Not
hing
21
8.
1%
19
10.5
%
2 3.8%
0 0%
*9
13
.8%
8 8.
7%
3 3.2%
7 12
.1%
1 3.
0%
8 7.1%
1 9.
1%
3 7.7%
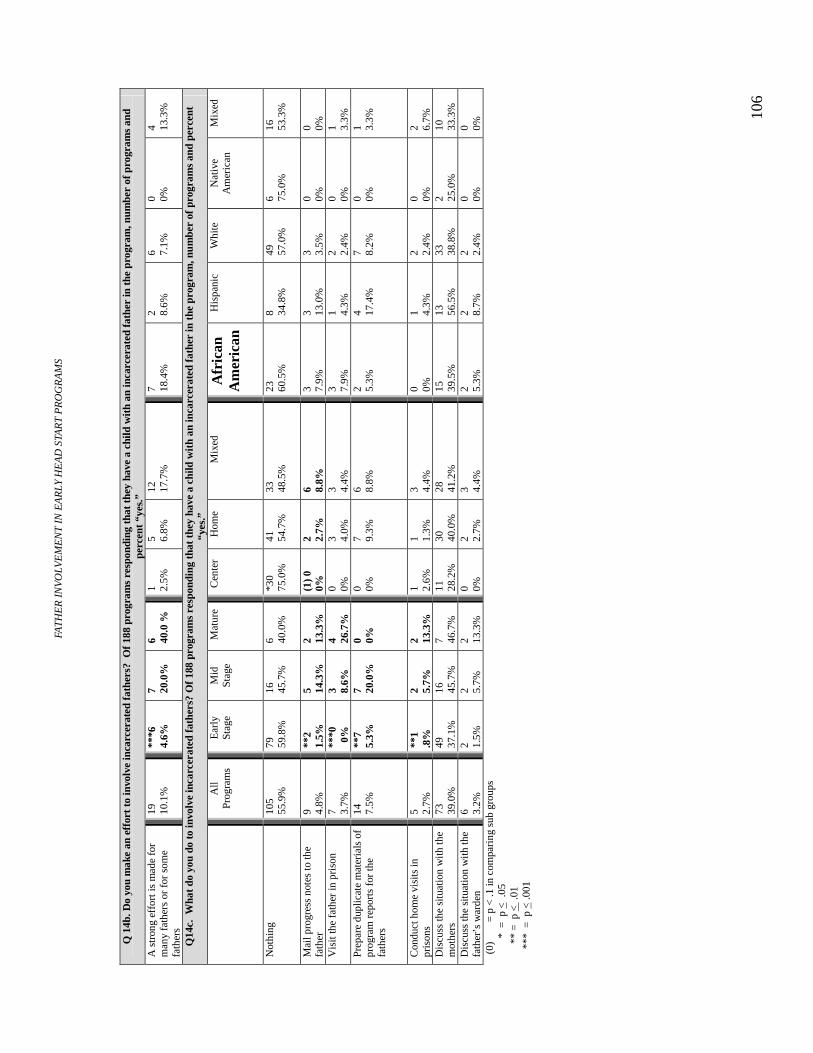
FA
TH
ER
IN
VO
LVE
ME
NT
IN E
AR
LY H
EA
D S
TAR
T P
RO
GR
AM
S
10
6
Q 1
4b. D
o yo
u m
ake
an e
ffor
t to
invo
lve
inca
rcer
ated
fat
hers
? O
f 18
8 pr
ogra
ms
resp
ondi
ng t
hat
they
hav
e a
child
wit
h an
inca
rcer
ated
fath
er in
the
pro
gram
, num
ber
of p
rogr
ams
and
perc
ent
“yes
.”
A s
tron
g ef
fort
is m
ade
for
man
y fa
ther
s or
for
som
e fa
ther
s
19
10.1
%
***6
4.
6%
7 20.0
%
6 40.0
%
1 2.5%
5 6.
8%
12
17.7
%
7 18.4
%
2 8.6%
6 7.
1%
0 0%
4 13.3
%
Q14
c. W
hat
do y
ou d
o to
invo
lve
inca
rcer
ated
fat
hers
? O
f 18
8 pr
ogra
ms
resp
ondi
ng t
hat
they
hav
e a
child
wit
h an
inca
rcer
ated
fat
her
in t
he p
rogr
am, n
umbe
r of
pro
gram
s an
d pe
rcen
t “y
es.”
All
Prog
ram
s
Ear
ly
Stag
e
Mid
St
age
Mat
ure
Cen
ter
Hom
e
Mix
ed
Afr
ican
A
mer
ican
His
pani
c
Whi
te
N
ativ
e A
mer
ican
Mix
ed
Not
hing
10
5 55
.9%
79
59
.8%
16
45
.7%
6 40
.0%
*30
75.0
%
41
54.7
%
33
48.5
%
23
60.5
%
8 34.8
%
49
57.0
%
6 75.0
%
16
53.3
%
Mai
l pro
gres
s no
tes
to th
e fa
ther
9 4.
8%
**2
1.5%
5 14
.3%
2 13
.3%
(1
) 0
0%
2 2.7%
6 8.
8%
3 7.9%
3 13
.0%
3 3.
5%
0 0%
0 0%
Vis
it th
e fa
ther
in p
riso
n 7 3.
7%
***0
0
%
3 8.6%
4 26
.7%
0 0%
3 4.
0%
3 4.4%
3 7.
9%
1 4.3%
2 2.
4%
0 0%
1 3.3%
Pr
epar
e du
plic
ate
mat
eria
ls o
f pr
ogra
m r
epor
ts f
or th
e fa
ther
s
14
7.5%
**
7 5.
3%
7 20.0
%
0 0%
0 0%
7 9.3%
6 8.
8%
2 5.3%
4 17
.4%
7 8.
2%
0 0%
1 3.3%
Con
duct
hom
e vi
sits
in
pris
ons
5 2.7%
**
1 .8
%
2 5.7%
2 13
.3%
1 2.
6%
1 1.3%
3 4.
4%
0 0%
1 4.3%
2 2.
4%
0 0%
2 6.7%
D
iscu
ss th
e si
tuat
ion
with
the
mot
hers
73
39
.0%
49
37
.1%
16
45
.7%
7 46
.7%
11
28
.2%
30
40
.0%
28
41
.2%
15
39
.5%
13
56
.5%
33
38
.8%
2 25
.0%
10
33
.3%
D
iscu
ss th
e si
tuat
ion
with
the
fath
er’s
war
den
6 3.2%
2 1.
5%
2 5.7%
2 13
.3%
0 0%
2 2.
7%
3 4.4%
2 5.
3%
2 8.7%
2 2.
4%
0 0%
0 0%
(0)
=
p <
.1 in
com
pari
ng s
ub g
roup
s
*
= p
< .
05
*
* =
p <
.01
***
= p
< .0
01

FA
TH
ER
IN
VO
LVE
ME
NT
IN E
AR
LY H
EA
D S
TAR
T P
RO
GR
AM
S
10
7
AN
OV
As
and
chi
-squ
are
test
s w
ere
used
to d
eter
min
e ov
eral
l sig
nifi
cant
dif
fere
nces
(in
bol
d) a
cros
s le
vels
of
a va
riab
le, d
enot
ed b
y bl
ack
col
umn
mar
kers
. D
etai
led
pair
wis
e di
ffer
ence
s be
twee
n ce
lls
or m
eans
are
not
rep
orte
d in
this
tabl
e. N
’s m
ay v
ary
som
ewha
t bec
ause
sam
ple
resp
onde
nts
did
not a
nsw
er e
very
que
stio
n.