fat chance: - why sugar taxes won't work
TRANSCRIPT
Fat Chance: Why sugar taxes won’t work 1
Fat Chance:Why sugar taxes won’t work
A report by the Menzies Research Centre with assistance from Cadence Economics
Obesity Epidemic in AustraliaSubmission 119 - Attachment 1
Fat Chance: Why sugar taxes won’t work2
Fat Chance: Why sugar taxes won’t work
A report by the Menzies Research Centre with assistance from Cadence Economics
The Authors Nick Cater is Executive Director of the Menzies Research Centre
Published by The Menzies Research Centre Ltd
RG Menzies House Cnr Blackall and Macquarie Streets BARTON, ACT PO Box 6091 KINGSTON, ACT 2604
Phone: 02 6273 5608
Email: [email protected]
Portal: www.menziesrc.org
ISBN: 978-0-9577259-2-8
Designed by: Branded Graphics
The Menzies Research Centre Limited is a company limited by guarantee
ACN 067 379 684
© 2017 THE MENZIES RESEARCH CENTRE
Obesity Epidemic in AustraliaSubmission 119 - Attachment 1

Fat Chance: Why sugar taxes won’t work i
IntroductionWhen good intentions trump rational policy, bad things happen.
The consequences of well-meaning but ill-judged government intervention can be very bad - like the distortionary effects
of a Renewable Energy Target - or just bad, like the wasteful expenditure a decade ago on school laptop computers.
Either way the frequency of feel-good policy blunders appears to be growing. So much so that governments are in danger of
being overwhelmed by the need to fix public policy “problems” caused by the public policy “solutions” of their predecessors.
The fiscal cost is one thing; the opportunity cost is quite another. Precious political capital is being spent on repairing policy
leaving little left to develop policy or lay the ground for long term reform. Little wonder that governments are frequently
accused of simply managing instead of governing.
That is why warning bells should be ringing over the noisy demands to tax sugar in order to reduce the prevalence of obesity.
The aim is noble: to improve the quality and duration of human lives and prevent needless health expenditure. But does the
scale of the problem justify the dangers of a state that seeks to overrule private decisions? Will the proposed intervention
actually fix the problem? Is it right to assume public responsibility for private behaviour, or is it better to make individuals
responsible for their own poor choices?
These are philosophical questions on which reasonable people may disagree. What we should not be arguing about, however, is
the evidence about whether a sugar tax - in reality a soda tax - could ever achieve the aim of making fat people slimmer. First,
is there a causal link between sugar consumption and obesity? Second, will a tax on sugar sweetened drinks prompt consumers
to cut down or switch to less sugary products? Unless these questions can be answered with empirical certainty, governments
should be cautious about succumbing to the siren song of the public health lobby.
The sugar tax discussion is too serious to be dismissed as a peripheral argument about the nanny state. Efficient and effective
government is one of the key reform goals the Menzies Research Centre aims to achieve. We agree with Robert Menzies that
the core business of any government is to foster an environment in which business can thrive. Legislation that attempts to
interfere with private choices, or turn a private problem into a public responsibility, steps well beyond the government’s remit.
What’s more, the imposition of another inefficient nuisance tax will place a compliance burden on business, raise the cost of
consumer goods, and place a disproportionate burden on the poor.
There may be exceptional circumstances, however, in which government intervention in consumer market behaviour can be
justified. Few would disagree that regulations are justified on tobacco, a surprisingly rare example in public health circles of
a concrete, epidemiological link between consumption and disease.
Does such a case exist for sugar? Such a possibility should not be ruled out completely, since the diminished quality of life
associated with obesity, not to mention the day to day challenges faced by the unfit and overweight, are not lightly dismissed.
The MRC commissioned Cadence Economics to conduct a review of the evidence to see if a case could be made for a sugar tax.
It was prompted by the publication last year of a report by the Grattan Institute, which argued strongly for a sugar tax. The
empirical failings of the report were highlighted by the MRC at the time. Our view was supported by respected economists
Henry Ergas and J. J. Pincus. It seemed incredible that the assessment by a think tank that makes solid contributions to public
policy in other fields could publish a paper so flawed. We asked Cadence for a fresh judgment of the Grattan report and other
similar research.
None of the five frequently cited reports interrogated by Cadence stood up to empirical cross-examination. None had
established a causal link between a tax on sugary drinks and a reduction in obesity; none had measured the cost of the
inefficiency, inequity and complexity of their proposed solution; none had questioned whether taxing the majority of soft-
drink consumers, who control their weight, was justified; none had correctly calculated the impact on society more broadly.
No evidence of market failure had been established; indeed consumption patterns show quite the opposite. Sugar consumption
is down in Australia, especially by children, and the volume of artificially sweetened beverages sold overtook the volume of
sugar-sweetened beverages some years ago.
Obesity Epidemic in AustraliaSubmission 119 - Attachment 1
Fat Chance: Why sugar taxes won’t workii
Cadence’s findings reflect poorly on the reliability of the advice the public health profession provides to government and its
ability to act in the public interest. The sector receives substantial public funding from state, territory and federal
governments both directly and through the provision of research grants. It receives support from registered charities - the
Cancer Council of Victoria, which supports the Obesity Policy Coalition, for example - and even more funding from the World
Health Organisation.
Yet the sector, by and large, behaves like activists rather than genuine information providers. Its research - so called - on
sugar is entirely consistent with its approach to alcohol, examined in a January 2017 MRC policy report, Damn Lies and
Statistics: The demonisation of the alcohol industry.
The “social cost” of the product under discussion is inflated using back-of-the-envelope calculations while the social benefits
are simply ignored. Its reductionist arguments are plainly absurd, laying the blame for a range of economic social ills from
poor productivity to domestic violence entirely at the feet of the alcohol industry.
Activist organisations employ quasi-economic arguments to make the case for public health measures citing the alleged cost
to the welfare, health and justice systems. Intangible costs are loaded on, such as the cost of lost productivity or the cost of
family disruption. The most questionable elements in such calculations are attempts to put a monetary value on pain,
suffering, diminished quality of life and loss of life. In the case of alcohol these can add billions of dollars to the supposed
‘social cost’.
This ‘apples and pears’ exercise is aimed at producing a confronting, large number to present as a credible estimate of the cost
of undesirable activity to the community. The kindest assessment is that they are guesstimates; a harsher judgement is
that they are simply conjured out of the air with the aim of delivering a headline that will advance a campaign for illiberal
interventionist measures. 1 The eagerness with which the public health lobby’s exaggerated claims are accepted by
journalists, commentators and politicians, and the gullibility with which their simplistic solutions are embraced, illustrates
the poor -
and perhaps declining - quality of public policy debate. The Fourth Estate has a responsibility to stress-test policy proposals
providing another line of defence against poor argument or groupthink. Instead it has become a cheer squad.
If the absence of empiricism, failure to apply basic economic principles, and casual abandonment of best-practice governance
standards were not bad enough, the sugar tax argument in morally flawed. It is premised on the assumption that individuals
cannot be trusted to make their own choices, and the state must step in to decide.
The language of the anti-sugar campaign - ‘obesogenic environment’; ‘obesity epidemic’; ‘vulnerable children’; ‘commercial
exploitation’ - paints a world in which helpless humans are surrounded by the evil forces of corporatism. They are absolved
of all responsibility for their own actions. To suggest that they should control their weight through exercise and willpower
is condemned by the anti-sugar lobby as insensitive, if not harmful.
We hope that by putting the flawed and simplistic claims of the anti-sugar campaign to an empirical test and exposing the
dangerous short-cuts taken in policy implementation, we can begin to re-focus the debate towards measures that will
reduce moral hazard and encourage citizens to take responsibility for their own lives.
Self-management should be the starting point for treating chronic diseases like obesity. Doctors need to be able to tell
patients that they are obese and that it lies within the patient’s power to do something about it. Attributing lifestyle disease
to social, cultural, legislative and environmental factors erodes the position of doctors to improve patient’s health literacy
and self-care.
There is evidence self-management works for a variety of chronic and lifestyle diseases including sugar control and weight
loss.2
1 Menzies Research Centre & Cadence Economics, The Demonisation of the Alcohol Industry, Menzies Research Centre, Canberra, 20172 Pettman, T., Misan, G., Owen, K., Warren, K., Coates, A., Buckley, J., & Howe, P. (2008). “Self-management for obesity and cardio-metabolic fitness: Description and evaluation of the lifestyle modification program of a randomised controlled trial”. International Journal of Behavioral Nutrition and Physical Activity, 5:53.
Obesity Epidemic in AustraliaSubmission 119 - Attachment 1
Fat Chance: Why sugar taxes won’t work iii
Even the World Health Organisation, a prominent proponent of the epidemiological approach, has conceded that “occasionally,
all citizens have to make important health decisions that affect health outcomes…Strategies for promoting an active role for
patients should pay attention to health literacy, shared decision-making and self-management.”
The Department of Health’s Obesity Guidelines implore clinicians treating obese adults to support self-management.
“Self-management is the ability of the patient to deal with all that a chronic illness entails, including symptoms, treatment,
physical and social consequences, and lifestyle changes. With effective self-management, the patient can monitor his or
her condition and make whatever cognitive, behavioral, and emotional changes are needed to maintain a satisfactory quality
of life”.3
It is time for the busy-body state to beat a steady retreat, and restore dignity, agency, freedom and empowerment to the people.
Nick Cater
Executive Director
The Menzies Research Centre
October 2017
3 Barlow J, Wright C, Sheasby J, Turner A, Hainsworth J. Self-management approaches for people with chronic conditions: a review. Patient Educ Couns. 2002; 48:177–87
Obesity Epidemic in AustraliaSubmission 119 - Attachment 1
Fat Chance: Why sugar taxes won’t workiv
GlossaryABS Australian Bureau of Statistics
AUD Australian dollar
BMI Body Mass Index
BMR Basal Metabolic Rate
CBA Cost Benefit Analysis
CEA Cost Effectiveness Analysis
DALY Disability-adjusted Life Years
GDP Gross Domestic Product
GSP Gross State Product
GVA Gross Value Added
HCA Human Capital Approach
MRC Menzies Research Centre
NCSS Non-Caloric Sugar Substitute
NPV Net Present Value
R&D Research and Development
RIA Regulatory impact statement
SSB Sugar Sweetened Beverage
Obesity Epidemic in AustraliaSubmission 119 - Attachment 1
Fat Chance: Why sugar taxes won’t work v
ContentsGlossary iv
Executive summary 1
1 Introduction 4
2 Critique of recent papers supporting a sugar tax 5
2.1 A note on assessing the evidence 5
2.2 Grattan Project (2016) 6
2.3 Veerman et al. (2016) 8
2.4 Cobiac et al. (2017) 9
2.5 Nomaguchi et al. (2017) 9
2.6 Lal (2017) 11
2.7 Colchero (2017) – the Mexican evidence 11
2.8 Other papers 12
2.9 Summary 12
3 Regulation Impact Assessment framework 14
3.1 Regulatory governance framework 14
3.2 Summary 17
4 Public policy principles 18
4.1 Good tax design 18
4.2 Public finance principles 19
4.3 Nanny State 19
4.4 Summary 20
5 Distributional impacts 21
6 Conclusions 22
References 23
Appendix 1: The Body Mass Index 24
Obesity Epidemic in AustraliaSubmission 119 - Attachment 1
Fat Chance: Why sugar taxes won’t work1
Executive summaryObesity rates in Australia have been rising since the 1980s. Rightly, this trend has sparked increased research into potential
causes and policy responses. Contemporary research into obesity in Australia has largely focused on the merits of proposals to
tax sugar-sweetened beverages (SSB) or broader taxes aimed at other nutritional inputs that are believed to cause obesity. In
the past 12 months, there have been a number of papers published in the Australian public health literature proposing an SSB
tax. For instance, a recent report published by the Grattan Institute (Duckett, Swerissen and Wiltshire, 2016) recommends a
tax of 40 cents per 100 grams of sugar in non-alcoholic, water-based beverages that contain added sugar.
This report, commissioned by the Menzies Research Centre (MRC), reviews several recent papers proposing an SSB tax and
assesses the evidence base underpinning the analysis and conclusions. It then outlines Australia’s regulation assessment
framework and assesses SSB taxes at a high level within this framework. The papers reviewed fail to provide a comprehensive
assessment of the overall costs and benefits that such a tax would impose on Australians, nor of the effectiveness of alternative,
less heavy-handed policy interventions.4
Below, we categorise the main issues with the papers.
The rationale for intervention is weak
The two rationales for government intervention, on the basis of SSB consumption having a causal impact on obesity and
information asymmetry on the part of consumers, are weak.
The papers do not demonstrate a causal link between added sugars and obesity
At the outset, in each of the papers reviewed, the inherent inconsistency of the observed rising obesity levels but declining SSB
consumption is never addressed (see section 1). As a result, the SSB tax proposals are not convincing. Further, the logic of the
connection between SSB consumption and obesity is weak because SSBs are neither the sole source of sugar in foods nor even
the main source. As a result, the necessary evidential links in the chain of argument from imposing an SSB tax to successfully
reducing measured obesity rates is either assumed or modelled as opposed to definitive evidence being presented.
In fact, the most recent Australian data suggests a negative correlation between added sugars and obesity. In October 2015,
the Australian Bureau of Statistics released its first Australian Health Survey: Food and Nutrients 2011-12 (ABS 2015). The
publication compared Australian nutrient intake in 2011-12 (the first year of the ABS survey) with nutrient intake in 1995
(where the data was sourced from the 1995 National Nutrition Survey). For example, in 1995, 43.2% of the population aged
two-years and over consumed SSBs. By 2011-12, that rate of consumption had fallen to 34.1%. And the rate of young children
and teenagers consuming SSBs had fallen from between 64-70% to 30-55%.
Further, Brand-Miller and Barclay (2017) investigated recent trends in the intake of sugars, including SSBs, using multiple data
sources reached the conclusion:
In Australia, four independent data sets confirmed shorter-and longer-term declines in the availability and intake of
added sugars, including those contributed by SSBs. The findings challenge the widespread belief that energy from added
sugars or sugars in solution are uniquely linked to the prevalence of obesity. (Brand-Miller and Barclay, 2017)
The papers fail to establish the existence of an information asymmetry around SBB consumption
Grattan (2016), for example, justifies intervention on the basis of a ‘market failure’, positing that consumers are fundamentally
uninformed about the consequences of excess consumption of SSBs. They particularly highlight an information asymmetry
issue for children and teenagers. However, obesity rates for children and teenagers, although higher than in the mid-1980s
have in fact plateaued and remain stable.
Adult obesity, however has increased over this period. No evidence or theoretical argument is cited to support the assertion
that, in an age where consumer information is readily available, adults are consuming SSBs without the knowledge of their
impacts on potential weight gain and the associated health impacts.
4 In general, the health policy literature applies a narrow cost effectiveness analysis (CEA) framework, rather than the standard cost benefit appraisal (CBA) framework required in Australian public policy proposals. The CEA framework of cost is a very poor substitute because CEA does not measure the costs and benefits borne by the whole population affected by the policy, including those not specifically targeted, The Grattan papers attempted CBA is poor for several reasons that are outlined in section 2.
Obesity Epidemic in AustraliaSubmission 119 - Attachment 1
Fat Chance: Why sugar taxes won’t work 2
The papers ignore the fundamental design of the health system
The justification of taxing SSBs on the grounds of raising revenue to pay for the additional costs of obesity on the health
system is over simplified. This argument fails to identify the fundamental design of Australia’s health system as one that
provides universal health care that is community rated. This taxpayer funded system has strengths and weaknesses in relation
to the incentives it creates for individuals. The notion of the government intervening to alter the diets of Australians in this case
cannot simply be considered in isolation from not only the systemic issues of the healthcare system but also broader lifestyle
issues (such as inactivity) that also effect obesity.
The proposed policy response has not been thoroughly examined
Apart from a weak rationale and evidence base, each of the papers does not represent what would be considered ‘best practice’
in relation to regulatory design. To begin with, only one regulatory response is considered. In this context, the assumption is
made – but never discussed – that broad interventions affecting all Australians are preferable to more targeted initiatives that
directly incentivise people to consider their own health outcomes in their consumption choices. As a result, these papers focus
their efforts on measures that are inherently inefficient, given that, in aggregate, significant costs would be imposed on the
great majority of Australians who are not obese or at risk of such outcomes.
None of the papers consider the benefits of sugar consumption, nor achieve a comprehensive cost benefit analysis. Overall, it
is notable that the ‘benefits’ of an SSB tax appear to be minimal. Notwithstanding the claim in the Grattan paper that an SSB
tax would generate a 15 per cent fall in consumption of SSBs, Grattan estimate that the reduction in the prevalence of
obesity amounts to only 2 per cent. In a study of Mexican beverage purchases following the introduction of a SSB tax, Colchero et al. (2017) found that the introduction of the excise tax reduced beverage consumption by 6% relative to forecast
purchases in the absence of the tax.
The papers fail to address the inherent difficulties in tax design and implementation. In particular, Grattan (2016), Veerman et al. (2016) and Cobiac et al. (2017) fail to consider the fundamental distinction between where a tax is levied and its
final incidence, in terms of who bears the cost. All three papers assume that any SSB tax would be passed through
fully to consumers, despite a lack of evidence that this would indeed be the case. There is also no consideration of any
unintended consequences in relation to consumer or producer behaviour that might render taxation less effective.
All papers reviewed suffer from logical inconsistencies and methodological deficiencies. Most importantly, none of the papers
attempt a comprehensive welfare analysis of the effects of an SSB tax that would shed light on the aggregate economic
costs of the proposed intervention, and in particular whether the claimed benefits of the proposed intervention would
exceed the costs.
A sugar tax is most likely to be regressive
Good tax design must consider a range of factors including efficiency, equity and simplicity.
While none of the aforementioned papers explicitly considered the equity effects of a proposed sugar tax, simple analysis
shows that a sugar tax is likely to be regressive, disproportionally affecting low-income households. This is because low-
income households spend relatively more on soft drinks as a share of their average weekly expenditure.
Even though the data available in relation to household expenditure is out-dated, the simple analysis presented in this paper
shows that a tax on sugar therefore needs to be considered in the context of the overall tax burden on different income
levels in order for a thorough assessment to be made on equity grounds.
Summary
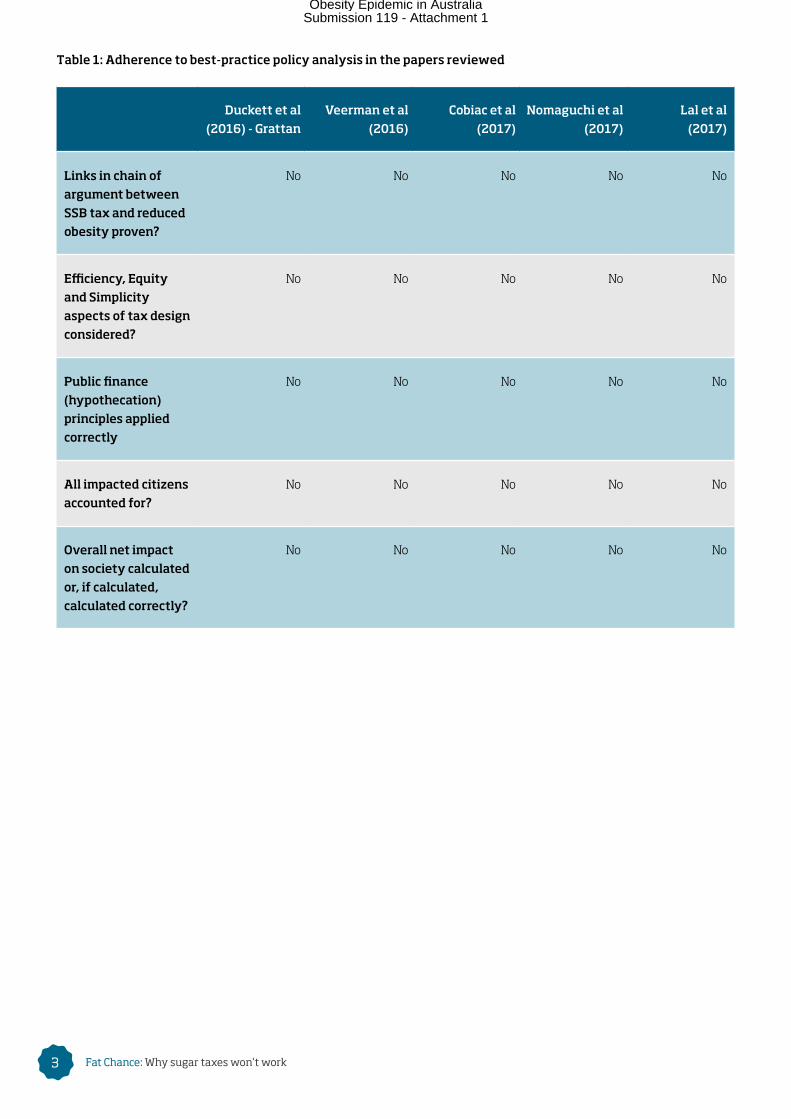
The table below summarises the flaws in the arguments for an SSB tax compared to best-practice public policy analysis as
contained in the papers reviewed in this paper. The analysis clearly shows that in terms of establishing a clear economic
argument for the imposition of an SSB tax, each of these papers falls well short. Indeed, none of the papers reviewed follow
what would be considered as best practice public policy analysis.
Obesity Epidemic in AustraliaSubmission 119 - Attachment 1
Fat Chance: Why sugar taxes won’t work3
Table 1: Adherence to best-practice policy analysis in the papers reviewed
Duckett et al
(2016) - Grattan
Veerman et al
(2016)
Cobiac et al
(2017)
Nomaguchi et al
(2017)
Lal et al
(2017)
Links in chain of
argument between
SSB tax and reduced
obesity proven?
No No No No No
Efficiency, Equity
and Simplicity
aspects of tax design
considered?
No No No No No
Public finance
(hypothecation)
principles applied
correctly
No No No No No
All impacted citizens
accounted for?
No No No No No
Overall net impact
on society calculated
or, if calculated,
calculated correctly?
No No No No No
Obesity Epidemic in AustraliaSubmission 119 - Attachment 1
Fat Chance: Why sugar taxes won’t work 4
1. IntroductionIncreasing rates of obesity have recently led to calls for a tax to be levied on sugar sweetened beverages (SSB), and more
broadly on other foods considered ‘harmful’, including unsaturated fats, salt and sugar. Thus a recent report published by the
Grattan Institute (Duckett, Swerissen and Wiltshire, 2016) recommends a sugary drinks tax of 40 cents per 100 grams of sugar
in non-alcoholic, water-based beverages that contain added sugar. This would translate, for example, into a price increase of up
to 16 cents for a can of Coke, which contains 40 grams of sugar.
Somewhat contrary to these proposals for an SSB tax, the ABS in its Australian Health Survey: Food and Nutrients 2011-12 has
found that the consumption of SSBs has fallen dramatically over the past decades, particularly for young people. For example,
in 1995 43.2% of the population aged two-years and over consumed SSBs. By 2011-12, that rate of consumption had fallen to
34.1%. And the rate of young children and teenagers consuming SSBs had fallen from between 64-70% to 30-55%.
The Grattan report and similar recent papers claim that taxing SSBs would result in some (albeit very limited) benefits, in terms
of reducing the prevalence of obesity in Australia. However, none of these papers achieve a comprehensive assessment of
the overall costs and benefits that such a tax would impose on Australians, nor of the effectiveness of alternative, less heavy-
handed policy interventions.
Against this background, the Menzies Research Centre has engaged Cadence Economics to undertake an assessment of the
evidence base underpinning calls for the introduction of a tax on SSBs, as well as more broad-based taxes to improve dietary
outcomes for Australians.
This report is structured as follows. Section 2 presents a critique of recent papers in support of an SSB tax in Australia, including
the Grattan (2016) paper. Section 3 describes the Regulation Impact Assessment process that represents the benchmark level
of analysis required for new policy proposals in Australia. Section 4 broadens the critique in Section 3 to consider general
principles of good public policy in relation to tax design, public finance and issues with the ‘nanny state’ approach to public
policy. Section 5 describes considers the distributional impacts of the proposed SSB tax and Section 6 discusses the results and
conclusions of the paper.
Obesity Epidemic in AustraliaSubmission 119 - Attachment 1
Fat Chance: Why sugar taxes won’t work5
2. Critique of recent papers supporting a sugar taxIn this section, six recent papers proposing the imposition of a sugar tax to combat obesity are reviewed. The papers include:
• Duckett, Swerissen and Wiltshire (2016) (for the Grattan Institute) titled ‘A sugary drinks tax: recovering the community costs of obesity’;
• Veerman et al. (2016) titled ‘The impact of a tax on sugar-sweetened beverages on health and health care costs: A
modelling study’;
• Cobiac et al. (2017) titled ‘Taxes and subsidies for improving diet and population health in Australia: a cost-effectiveness
modelling study’;
• Nomaguchi, T. et al. (2017) titled ‘The impact on productivity of a hypothetical tax on sugar-sweetened beverages’;
• Lal, A. et al. (2017) titled ‘Modelled health benefits of a sugar sweetened beverage tax across different socioeconomic
groups in Australia: A cost effectiveness and equity analysis’; and
• Colchero, M. et al. (2017) titled ‘Beverage purchases from stores in Mexico under the excise tax on sugar sweetened
beverages: observational study’.
At the outset it is important to recognise that measuring obesity rates is inherently difficult with the standard measure of
obesity being the Body Mass Index (BMI). A brief description of this metric and issues around measurement are discussed
in Appendix 1.
2.1 A note on assessing the evidence
Before providing a critique of the papers supporting an SSB tax, we first make some general points about the criteria that
should be applied to assessing the evidence cited by proponents of SSBs. A more thorough treatment of how to assess policy
proposals is provided in sections 3 and 4.
Public policy evaluation considers every conceivable cost and benefit of a policy change in relation to the policy objective and
compares them to the costs and benefits of alternative ways to achieve the objective. Tax policy should be evaluated against
three fundamental and long-held principles, namely: efficiency (minimising the economic costs of taxation), equity (achieving
society’s preferred income distribution) and simplicity (minimising administration costs and maximising understanding of, and
trust in, the tax system).
One general criticism of the health policy literature is that the commonly applied framework of cost effectiveness analysis
(CEA) is a very poor substitute for the best practice cost benefit analysis (CBA). This is because CEA does not measure the
costs and benefits borne by the whole population affected by the policy, including those not specifically targeted. None of the
academic papers that we consulted conducted a full CBA of the policy proposal.
A reasoned case for the introduction of a new tax would:
i. Demonstrate all linkages in an argument. That is, it would demonstrate - rather than assume - a causal relationship between
sugar consumption and obesity. It would also demonstrate a causal relationship between the application of a narrowly
applied tax, consumption and obesity.
ii. Consider the impact of an SSB tax on all consumers of SSBs, not just the obese and overweight. Every tax has both ‘income’
and ‘substitution’ effects that will vary according to the principle of ‘price elasticity’. A new tax would be absorbed partly by
the producer and partly by the consumer. To the extent that a tax is borne by a consumer, it will reduce their income and
cause the consumer to change their ‘consumption bundle’.
iii. Consider the impact across the income range. A tax on SSB is likely to be felt more heavily by consumers on lower incomes
who spend a greater proportion of their income on food and beverages.
iv. Consider the impact on the overall complexity of the tax system, including the cost of administration and compliance.
Obesity Epidemic in AustraliaSubmission 119 - Attachment 1
Fat Chance: Why sugar taxes won’t work 6
v. Consider whether there are better ways to achieve the policy objective that have a lower impact on those not targeted by
the policy.
vi. Consider what the tax revenue will be used for and whether that is the best way to achieve that particular objective.
Fundamental public finance principles dictate that spending priorities should be considered apart from revenue priorities.
Hypothecating the transference of revenue from a particular tax to trying to achieve a particular social outcome is
problematic.
2.2 Grattan Project (2016)
In November 2016, the Grattan Institute released a report entitled: A sugary drinks tax: recovering the community costs of obesity (Duckett et al. 2016).5
Summary
The Grattan paper argues that “Australians are getting fatter” and that this rise in obesity is caused by “excessive consumption
of unhealthy foods, including sugar-sweetened beverages (SSBs)”. Grattan states that this excessive consumption “not only
causes long-term problems for consumers but also imposes enormous costs on the broader community”.
Grattan identifies these large community costs as:
• healthcare costs, which are higher than they otherwise would be because obese people receive more taxpayer funded
healthcare than non-obese people; and
• forgone government revenue since obese people “also have lower rates of employment, receive more social services
payments, and contribute less income tax than people in the normal weight range”.
Grattan quantifies the total costs of forgone tax revenue and increased welfare expenses as $5.3 billion per year.
Grattan argues that the ‘excess consumption’ of ‘unhealthy foods’ arises as a result of a ‘market failure’, and that products that
contribute to the costs incurred by the community should therefore be taxed. Grattan then recommends the introduction of an
excise tax of 40 cents per 100 grams of sugar in SSBs. By way of example, since there are 40 grams of sugar in a 375 ml can of
Coca Cola the implied cost including taxes would increase by 16 cents.
Grattan accepts that: “Not all obesity is caused by SSBs – in fact we estimate about 10 per cent of Australia’s obesity problem
is due to these drinks” [Emphasis added]. Grattan nonetheless argues that it is important to reduce the consumption of SSBs
because of their contribution to obesity. Grattan’s modelling accordingly indicates that the effect of the sugar tax would be to
reduce obesity rates in Australia by “about 2%”.
Grattan claims that this tax “would raise about $500 million a year, generate a drop of about 15 per cent in consumption of SSBs
and likely result in a small decrease in obesity rates, as people switch to water and other drinks not subject to the tax”. Grattan
proposes that revenues raised by the new tax could go to programs to promote healthier eating, preventing obesity, or for other
purposes.
Discussion
The Grattan paper was widely discussed in the Australian media and has been critiqued by a number of leading commentators
and taxation economists.
Henry Ergas (2016) critiqued the Grattan paper shortly after its release in November 2016. Ergas identified a number of flaws in
the reasoning in the Grattan paper.
First, Ergas points out that the calculation of the claimed ‘costs’ imposed on the community as a result of obesity is flawed
because it includes foregone taxation revenue that is simply a transfer from one sector of the economy to another. This flaw
has the effect of identifying costs that are likely to be a magnitude below those claimed by the authors.
5 Referenced in the remainder of this paper as ‘Grattan’.
Obesity Epidemic in AustraliaSubmission 119 - Attachment 1
Fat Chance: Why sugar taxes won’t work7
Second, Ergas points to an inherent contradiction in the claim that consumers could ‘easily’ avoid the sugar tax by switching to
substitutes (thus engaging in ‘better’ behaviour), since the tax revenue figures presented in the report assume the opposite.
Third, it is questionable whether consumption of SSBs can legitimately be claimed to have contributed to Australia’s obesity
problem since while the incidence of obesity has increased:
• per capita consumption of SSBs has fallen, with the proportion of young children consuming SSBs halving from 1995
to 2011-12; and
• the natural sugar content of soft drinks has declined by even more as artificial sweeteners are substituted.
On this point, we note that the Howard Government introduced a domestic sugar levy on 1 January 2003, which was abolished
in 2006. The 3 cents per kilogram levy raised $80 million towards the federal government’s $444 million sugar industry reform
program, which provided funds for cane growers exiting the industry. More generally, global sugar prices exhibit volatility that
does not seem to impact on rising obesity levels in Australia or elsewhere. Hence, the link between the consumption of SSBs
and rising obesity therefore appears to be weak at best and barely relevant at worst.
Fourth, Grattan’s proposed sugar tax represents a broad-based intervention that would simultaneously affect all consumers
of sugary drinks – irrespective of whether they are obese or not – while being relatively ineffective, as indicated by the minor
improvement in obesity outcomes.
Since SSBs are consumed by more than 80 per cent of the population, most of whom are not at risk of becoming obese, the
tax will ‘punish’ and distort the choices of a large proportion of the community, constituting a welfare loss in its own right that
is not discussed. Ergas argues that targeted measures that force individuals to bear the costs of their choices would be more
effective and would address concerns about spill-over costs. Such measures include permitting health insurance deductibles
and co-payments so that individuals bear some of the costs of their choices.
Fifth, Ergas cites Professor Jonathan Pincus to argue that Grattan’s sugar tax represents a prima facie example of ‘the logic
of an overreaching welfare state’ . By making personal consumer choices a matter of momentous financial consequence for
others, the state then has an excuse to apply heavy-handed measures to control people’s decisions. That logic is inherently
contradictory. On the one hand, people are deemed to be myopic and uninformed, hence requiring the state to intervene to
protect them from the consequences of their actions. On the other, measures that encourage more efficient behaviour, such as
targeted medial co-payments, are deemed inefficient. Instead, Grattan argues for a broad-based consumption tax that punishes
the majority of the population that is not at risk of obesity.
Pincus released a careful study of the Grattan paper in April 2017. In this paper, Pincus (2017) builds on Ergas (2016) and others
(such as Freebairn 2010) to develop a welfare economics framework to assess Grattan’s proposed SSB tax in more detail by
taking Grattan’s empirical claims at face value.
Pincus concludes that the proposed sugar tax would in fact be a ‘nuisance’ tax, which would deliver very small economic benefits (even accepting Grattan’s claims). However, these benefits would approximately equal the annual cost of the tax
(the so-called ‘deadweight burden’) on the economy. Yet, in addition to this cost of raising taxation revenue, there are the
costs of implementing and operating the narrowly-based tax to consider. Therefore, Pincus concludes that, even accepting
Grattan’s empirical analysis, an SSB tax is not good policy.
A key conceptual point made by both Ergas and Pincus is that Grattan counts its estimates of foregone tax revenue as an
economic loss, as if the extra revenue would not have been otherwise spent or imposes no cost on the economy. Ergas puts
it thus:
Obesity Epidemic in AustraliaSubmission 119 - Attachment 1
Fat Chance: Why sugar taxes won’t work 8
“To the extent to which those revenue losses are genuine third party costs, the report errs in their calculation. In effect,
as the Productivity Commission has noted, the cost to the community of reducing tax revenues by a dollar is not one
dollar: it is, at most, that dollar’s opportunity cost, which can be estimated as the economic damage caused by raising
another dollar to replace it, with the rest of the fiscal loss being a transfer from one part of the community to another.
On the report’s assumptions, that net cost amounts to 25 cents. However, the report not only counts the 25 cents, but
adds to it the original dollar — so that 25 cents in community costs becomes $1.25, with the double counting generating
gasp-wrenching estimates.” (Ergas 2016)
2.3 Veerman et al. (2016)
Veerman et al. (2016) estimates the consequences of an additional 20 per cent tax on SSBs in Australia on health and health
care expenditure.
Summary
Veerman et al. test the assumption that a 20 per cent ad valorem tax would increase the retail price of SSBs by 20 per cent.
Veerman et al. apply estimates of the price elasticity of demand for SSB to derive the impact of an SSB tax on nine obesity-
related diseases and corresponding health care costs. It is assumed that an SSB tax will lower the mean of the BMI
distribution compared with a ‘business-as-usual’ scenario. They draw the following conclusions:
• an additional tax on SSBs would result in modest reductions in BMI and the proportion of Australians that are obese,
corresponding to a decline in of 0.7 per cent among men, and 1.2 per cent among women;
• such a reduction would translate into gains of up to 168,000 healthy life years over the lifetime of the 2010 Australian adult
population, and a reduction in all of the diseases modelled;
• while government would incur costs of around $27 million in implementing the tax, overall health care expenditure over
the lifetime of the target population would be reduced by $609 million; and
• the tax would raise more than $400 million each year.
The authors note that the results are highly sensitive to the assumptions made:
• limiting the effect of the tax on BMI outcomes to the first 10 years of implementation reduces any health impacts by
75 per cent; and
• discounting future lifetime health gains by 3 per cent also implies that any health impacts are reduced by 60 per cent.
Discussion
Veerman et al.’s analysis suffers from many of the same issues as the Grattan paper. There is no attempt to establish the
existence of a clear link between the consumption of SSBs and obesity; as noted above, consumption of SSBs has declined over
time, as has their sugar content. Moreover, rather than exploring targeted interventions that would directly incentivise persons
considered to be at risk of obesity, the authors propose a broad tax that would be borne by all Australians. That tax combines
very limited effectiveness with an impost on the broader population that is not at risk of obesity, distorting consumer choice
and imposing economic costs. There are also a number of methodological concerns with the analysis:
• Contrary to standard practice in cost-benefit evaluations, the central results reported in the paper were derived without
discounting future health and other outcomes. As is also acknowledged by the authors, even modest discounting using a
3 per cent discount rate reduces the claimed benefits of the tax by 75 per cent.
• The authors rely on the results from a California study to claim that any tax on SSBs would be passed on to consumers in
full. In fact, the cited study (Cawley and Frisvold, 2015) found that across all brands and sizes of products examined, only
43 per cent of SSB tax was passed on to consumers. The implication is that both health benefits and any revenue outcomes
would be substantially reduced if such lower pass-through rates are assumed.
Obesity Epidemic in AustraliaSubmission 119 - Attachment 1
Fat Chance: Why sugar taxes won’t work9
2.4 Cobiac et al. (2017)
Cobiac et al. (2017) simulate the effects of taxes on saturated fat, salt, sugar, and sugar-sweetened beverages, combined with a
subsidy of fruits and vegetables, over the lifetime of the Australian population.
Summary
Cobiac et al. assess the implications of combinations of multiple taxes, including a SSB tax of $0.47 per litre, on the daily intake
of various foods, and then applied statistical regressions to model changes in three disease risk factors.
The authors then simulated the 2010 Australian population over time, determining incidence, prevalence, and mortality for
each dietary-related disease in each year. The ‘cost-effectiveness’ of 31 combinations of the five taxation and subsidy options
was then evaluated, where the ‘optimal’ package of tax and subsidy options was determined by selecting intervention options
in order of ‘highest probability of maximum net benefit’.
The results reported by the authors are that:
• Only the sugar tax led to improvements in all dietary measures. For instance, and while taxes on saturated fat, salt and
SSBs all led to improvements in sodium and energy intake, due to cross-price elasticity effects, there was an accompanying
decrease in fruit and vegetable intake. The subsidy on fruits and vegetables led to an increase in fruit and vegetable intake,
but also an increase in sodium and energy intake.
• When modelled over the lifetime of the population, the fruit and vegetable subsidy did not lead to an improvement in health
or a reduction in disease treatment costs.
• Taxes on saturated fat, salt, sugar-sweetened beverages and sugar were nonetheless found to result in an improvement in
population health, ranging from 12,000 ‘disability-adjusted life years’ (DALYs) for the SSB tax to up to 270,000 DALYs for the
sugar tax. To some extent these gains were offset by an increase in the costs of treating non-dietary-related diseases in the
added years of life.
• Overall, all of the tax interventions were claimed to be cost-saving for the health sector, notwithstanding considerable
uncertainty in terms of the derived confidence intervals around these results.
Discussion
As with Dutton and Swerissen and Veerman et al., this paper fails to properly assess the theoretical link between foods that
are proposed to be taxed, in particular SSBs, and obesity outcomes. Instead they propose an extraordinarily complex set of
interventions that combine multiple policy measures to derive theoretical health benefits from posited changes in behaviour.
The focus is entirely on broad intervention that would affect the entire population of Australia, rather than encourage people
to take responsibility for their own health.
The large uncertainty intervals are reflective of the broad range of assumptions used to derive the modelled shifts in dietary
patterns, many of which are questionable. Thus the central assumptions for estimating changing dietary patterns – the price
elasticity of demand for targeted foods – reflects New Zealand, rather than Australian estimates. The relationship between
blood pressure and net changes in sodium intake are based on a 1991 study that is arguably dated. The assumption is again that
any price impacts on SSBs and other foods would be passed on in full by consumers. As noted above, there is no evidence that
this would be the case for SSBs, let alone for any of the other taxes and subsidies proposed by the authors.
2.5 Nomaguchi et al. (2017)
Nomaguchi et al. (2017) builds on the Veerman paper and attempts to model the impact on productivity in the ‘unpaid’ and ‘paid’
sectors of the economy of a hypothetical tax on sugar sweetened beverages.
The study uses the Human Capital Approach (HCA) to estimate productivity gains in paid employment. It identifies three types
of potential productivity changes:
Obesity Epidemic in AustraliaSubmission 119 - Attachment 1
Fat Chance: Why sugar taxes won’t work 10
• Productivity gains resulting from reduced mortality, estimated from the age of premature death until the age of traditional
retirement.
• Productivity gains from reduced absenteeism due to obesity related diseases.
• Productivity gains from higher employment due to reductions in obesity-related morbidity.
For the unpaid sector, the study applied a replacement cost methodology to find the value of household, and volunteer and
community work. The size of the unpaid sector is based on experimental estimates by the Australian Bureau of Statistics.
The paper finds that: “In the unpaid sector, the potential productivity gains amounted to AU$1,172 million using the
replacement cost method. These productivity benefits are in addition to the health benefits of 35,000 life years gained and
a reduction in healthcare costs of AU$425 million.”
The paper concludes that: “An additional 20% tax on SSBs not only improves health outcomes and reduces healthcare costs,
but provides productivity gains in both the paid and unpaid sectors of the economy.”
Discussion
The study suffers from most of the limitations identified in other reports. It unquestionably accepts a direct correlation
between obesity as defined by BMI and sugar consumption as if sugar consumption is the only path to obesity.
The authors imply a dramatic increase in rates of obesity and state that: “the combined prevalence of overweight and obesity
in adults rose by 4 percentage points from 57% in 1995 to 61% in 2012, and the prevalence of obesity in adults increased
significantly from 19% to 27% over the same period.” Yet, in 2014-15 the rate of obesity in Australia was 27.9%, which is a
similar rate that that in 2012, implying the rate of increase has slowed considerably.
The paper cites Colagiuri et al. (2010) who estimated the cost of obesity in Australia to be $10.2 billion in 2005. The Colagiuri
paper does not make any link between obesity and sugar consumption. In fact, the word ‘sugar’ is not mentioned once in the
paper. Nomaguchi proceeds in his paper with an implicit assumption that obesity and its costs are solely caused by sugar
consumption without either proving his assertion or pointing to other studies that prove the assertion.
Nomaguchi fails to account for the income effect - the costs of an SSB tax on the non-obese - yet the study claims that its
greatest strength is that “it took a societal perspective to estimate the impacts of the tax on SSBs”. Increasing taxes on non-
obese consumers of SSBs has real welfare effects as these consumers substitute away from their ideal ‘consumption bundle’
and suffer from a real reduction in income, meaning that their consumption bundle will be smaller than otherwise.
The three productivity pathways are themselves problematic. The authors undertake a static (rather than dynamic) analysis
of the impacts of obesity on productivity. They assume, for example, that a tax-induced obesity reduction will lead to an
expansion in employment. In our view, this is not a correct interpretation. It is true that reduced obesity would increase the size
of the labour force (i.e. the labour supply), but not necessarily employment which depends on many other factors such as the
strength of the economy, matching skills to jobs, and the wage rate.
Further, the paper does not make a corresponding downward adjustment to the wage rate that would need to occur in order
to ‘clear’ the labour market at the equilibrium rate of unemployment. For every obese person who doesn’t die early, there is
another person that would have been employed that remains unemployed. Therefore, the effect of reduced obesity is on the
supply of labour, not employment. And, as the supply of available labour increases, the wage rate should fall.
The paper makes the same error in relation to its assumptions around the costs of obesity-related absenteeism. The universal
application of sick leave entitlement helps firms manage the impacts of absent workers. Generally, workplaces assume and
make plans for a certain amount of absenteeism such that the full effect and costs of a worker being away is not felt. It is
therefore a stretch to argue that absenteeism leads to a reduction in workforce productivity at a 1:1 ratio. While there is no
doubt that significant absences affect workforce output, there are many factors that will mitigate this effect. Lower skilled
workers are easily substitutable, especially in large cities that have deep and dense labour markets.
The paper measures productivity benefits in the unpaid sector of the economy. The ABS has estimated that the unpaid sector
represents up to one-half of GDP, but it does not claim that the unpaid sector contributes to GDP. GDP represents the value-
added generated in the economy across all industries. Value-added is defined as the sum of wages and profits and taxes (less
Obesity Epidemic in AustraliaSubmission 119 - Attachment 1
Fat Chance: Why sugar taxes won’t work11
subsidies) and excludes costs (such as overheads) which would be counted elsewhere in GDP. This approach avoids the problem
of double-counting outputs. Given that no wage is paid and no monetary profit is made in the unpaid sector, it is nonsensical to
apply a productivity saving to a zero-value enterprise. The authors then make the mistake of adding the unpaid productivity
improvement estimate to the paid estimate and comparing that figure to GDP.
As the paper eventually concedes, there is no robust empirical data to demonstrate a relationship between obesity and
productivity. This is a complex issue, with potentially many ‘functionally obese’ workers adding to Australia’s GDP. In fact,
some people effectively choose to be obese or overweight (or in colloquial terms “not at my fighting weight”) to focus on a
successful career. So the relationship between obesity and workforce productivity is not as simple as the authors assume.
Further, with universal health insurance (low cost health care, sick leave etc), the costs of obesity in terms of productivity
are probably greatly attenuated in Australia.
Finally, the discount rate used (at 3%) is arguably too low and not consistent with standard policy evaluation parameters used
in Australia. This calls into question the calculated value of the claimed benefits, which would be significantly lower using the
standard 7% discount rate.
2.6 Lal et al. (2017)
Lal et al. (2017) modelled the impacts of a hypothetical SSB tax across different socioeconomic groups in Australia. The paper
focused on the distributional impacts of the tax and assessed “the potential cost-effectiveness, health gains, and financial
impacts by socioeconomic position (SEP) of a 20% SSB tax for Australia” (p.1).
As its starting point, Lal cites the recent experience in Mexico and argues that the SSB tax has been effective in reducing
consumption of SSBs, with larger decreases for low-income Mexican households (see discussion at section 2.7 below).
The Lal paper finds that the impact on low-income groups would be relatively minor because these SSB consumers would
switch away from the taxed SSBs to alternatives and also suffer from a reduction in real income. If it were true that low income
consumers would move away from their preferred SSBs, then this would indicate that the welfare loss for non-obese (the
majority of the population) would be large. Yet, as discussed above, in CEA this effect is not captured and accounted for in terms
of assessing the net benefits of the policy proposal.
Discussion
The Lal paper fails to provide concrete evidence to link sugar consumption and obesity, and an SSB tax and reductions in
obesity. Further, the paper (like most in the health policy literature) is based on cost effectiveness analysis and is, therefore, not
well suited to policy analysis because it fails to account for all of the costs and benefits of a policy on the Australian community.
In terms of the papers findings, the fact that the authors find only a small monetary cost for low-income groups implies a
significant welfare loss since these consumers switch to close substitutes and suffer a real income loss. This welfare loss is not
measured, either for the obese or non-obese.
2.7 Colchero et al. (2017) – the Mexican evidence
Colchero et al. (2017) reviewed beverage purchases in Mexico before and after the introduction of a specific excise tax of 1
peso/L (approximately a 10% price increase based on 2013 prices) on non-dairy and non-alcoholic beverages with added sugar
and an ad valorem tax of 8% on a defined list of non-essential highly energy dense foods (containing ≥275 calories (1151 kJ)
per 100 g). The taxes came into effect on 1 January 2014. The study analysed beverage consumption data from 1 January 2012
to 31 December 2014.
The study found that the introduction of the excise tax reduced beverage consumption by 6% relative to forecast purchases in
the absence of the tax. This is, essentially, a trivial result in the sense that the tax literature tells us that an increase in the price
of a good or service will result in a reduction in demand.
In terms of impacts of lower income groups, the study found a larger effect with beverage consumption declining by 9% over
the year (on average), but 17% in December 2014. Again, this finding is not surprising given that lower income groups spend
more of their income on food and beverages. The finding also highlights the fact that these studies do not account for the loss
Obesity Epidemic in AustraliaSubmission 119 - Attachment 1
Fat Chance: Why sugar taxes won’t work 12
in welfare caused by increasing the price of a consumer’s preferred products.
The authors of the Mexican study themselves find that: “A major limitation of this work is that causality cannot be established,
as other changes are occurring concurrent with the tax, including economic changes, health campaigns about sugar sweetened
beverages, and anti-obesity programs”.
In sum, the Mexican study produces results that would be expected from standard economic theory and, as such, are trivial.
The real public policy question is whether, on balance, a tax on sugar is ‘net beneficial’ to society as a whole. This study, and
the others discussed in this paper, does not attempt to answer that question.
2.8 Other papers
The negligible health impacts identified in these papers are consistent with other empirical research which suggests that taxes
on SSBs fail to reduce obesity and are regressive, in the sense that they disproportionately penalise lower income groups.
For instance, Kaiser et al. (2013) undertook a careful meta-analysis of several studies looking at the relationship between SSB
consumption and obesity and found that: “Evidence to date is equivocal in showing that decreasing SSB consumption will
reduce the prevalence of obesity”. The paper argues that, even if statistical significance is ignored (i.e. the results were not
statistically significant), “the point estimates of effects on BMI reduction are small, accounting for only 1.5% of the variance
observed in those who were overweight at baseline”.
A study published in Contemporary Economic Policy (Colantuoni et al., 2015), which analysed American states that had
introduced soft drink taxes, found they had practically no impact on BMI and obesity. The authors find that: “Results suggest
that neither sales tax had a statistically significant impact on the consumption of soft drinks. This finding is robust to several
alternative specifications.”
SSBs represent a small fraction of our daily caloric intake and can be easily substituted for other sugary drinks or other foods
like cakes and biscuits. These alternatives will not be subject to an SSB tax and it is reasonable to assume that as the price of
SSBs increase, the demand for these substitutes will rise. Indeed, a study in the Journal of Public Economics in 2010 (Fletcher et
al), found that state-based soft drink taxation in the US between 1989 and 2006 had been offset by consumption of other high
calorie drinks.
Further casting doubt of the efficacy of taxing SSGs, Brand-Miller and Barclay (2017) undertook a comprehensive analysis
of added sugars in the Australian diet, drawing on four separate data sources. Based on these data sources, the authors
demonstrated that at the time of increasing obesity rates, Australian’s consumption of sugar and SSBs has actually declined.
In Australia, four independent data sets confirmed shorter-and longer-term declines in the availability and intake of added
sugars, including those contributed by SSBs. The findings challenge the widespread belief that energy from added sugars
or sugars in solution are uniquely linked to the prevalence of obesity. (Brand-Miller and Barclay, 2017)
2.9 Summary
Each of the reviewed papers strongly conclude that sugar taxes provide significant health benefits, and will serve to raise
taxation revenues for the broader community. Dach, to varying dgrees, suffers from the same shortcomings:
• There is no underlying empirical analysis of the relationship between the consumption of SSBs and the prevalence of
obesity. As discussed by Ergas (2016) that linkage is weak and declining while Brand-Miller and Barclay demonstrate the
paradoxical relationship of increasing obesity at a time of declining added sugar consumption, including SSBs.
• The rationale for government intervention is weak or non-existent. Grattan, for example, attempts to justify intervention
on the basis of a ‘market failure’ positing that consumers are fundamentally uninformed about the consequences of excess
intake. This market failure, it is argued, results in obese people imposing costs on non-obese people, as a result of which
Grattan deems it necessary to apply SSB taxes that would then impose costs on all Australians.
• In each of these papers, the assumption is made – but never discussed – that broad interventions affecting all Australians
Obesity Epidemic in AustraliaSubmission 119 - Attachment 1
Fat Chance: Why sugar taxes won’t work13
are preferable to more targeted initiatives that directly incentivise people to consider their own health outcomes in their
consumption choices. As a result, all three papers focus their efforts on measures that are inherently inefficient, given that,
in aggregate, significant costs would be imposed on the great majority of Australians who are not obese or at risk of such
outcomes.
• In particular, Veerman et al. (2016) and Cobiac et al. (2016) fail to consider the fundamental distinction between where a
tax is levied and its final incidence, in terms of who bears the cost. Both of these papers assume that any SSB tax would be
passed through fully to consumers, despite a lack of evidence that this would indeed be the case. To the extent that any
price increases would be absorbed by manufacturers, wholesalers or retailers, the already weak effectiveness of SSB taxes
in terms of affecting obesity-related outcomes, would be further diminished. Relatedly, the fact that any such tax would
be regressive, since low-income households spend a higher proportion of their disposable income on drinks, and would
therefore be disproportionately be affected by the tax is only discussed (but discounted) in the Grattan paper.
• The papers suffer from methodological deficiencies. Most importantly, none of the papers attempt a comprehensive welfare
analysis of the effects of an SSB tax that would shed light on the aggregate economic costs of the proposed intervention,
and in particular whether the claimed benefits of the proposed intervention would exceed the costs. Furthermore, as
discussed in Pincus (2017), the Grattan paper substantially overestimates the likely tax revenues and benefits of an SSB tax.
• Veerman et al. (2016) fail to apply discounting to their analysis, which results in substantially inflated benefits.
Furthermore, the results of all three papers rely on the central assumption (based on various overseas studies) that any
tax on SSBs would be fully shifted to consumers. Another key assumption – the own price elasticity of SSBs is poorly
supported. Thus the Grattan paper applies a (high) price elasticity of demand of -0.9 for SSBs (which would tend to increase
any hypothesised benefits of an SSB tax, while Cobiac et al. merely note that New Zealand elasticity estimates have been
applied without reporting the actual figures.
Overall, it is notable that the ‘benefits’ of an SSB tax appear to be minimal. Notwithstanding the claim in the Grattan paper that
an SSB tax would generate a 15 per cent fall in consumption of SSBs, Grattan estimate that the reduction in the prevalence of
obesity amounts to only 2 per cent. The most recent (2014-15) ABS National Health Survey indicates that the prevalence of
obesity among Australian 18 years or older (defined as a BMI > 30) was 27.9 per cent, or around 4.9 million persons. 2 per cent
of 27.9 per cent would then amount to a reduction of 0.6 per cent in the rate of obesity, corresponding to less than 100,000
people. This figure is consistent with the findings in Veerman et al. (2016) who report reductions in obesity in the range of 0.7
per cent for men and 0.3 per cent for women.6
The negligible impacts identified in these papers are consistent with other empirical research (such as Kaiser, 2013), which
suggests that taxes on SSBs fail to reduce obesity and are regressive, in the sense that they disproportionately penalise
lower income groups. In sum, it has been found that these taxes change consumer behaviour in a very limited way, reducing
consumption of unhealthy food by such a marginal amount that they have almost no impact on rates of obesity.
6 Due to the combination of measures examined, it is not possible to identify numerical outcomes in the prevalence of obesity in Cobiac et al. (2017).
Obesity Epidemic in AustraliaSubmission 119 - Attachment 1
Fat Chance: Why sugar taxes won’t work 14
3. Regulation Impact Assessment frameworkThis section sets out the best-practice governance standards that would have to be met to justify the introduction of a new
tax on SSBs:
• Section 3.1 describes the governance framework around the introduction of new regulations focusing on the need to
conduct a regulatory impact assessment (RIA).
• Section 3.2 offers a summary of the main ingredients of good regulation in relation to tax design.
3.1 Regulatory governance framework
In recent years, the volume of regulations enacted by governments around the world has grown dramatically.7 Numerous
instances have been documented where regulatory solutions have been devised by government agencies without a clear
assessment of the need for or efficacy of a regulation, without an understanding of the cumulative impacts of regulations
across government, and without consideration of options that could lessen compliance costs. Even conservative estimates put
the costs of unnecessary regulation in the tens of billions of dollars annually.
Given this context, governments in the developed world have turned their attention to reducing the burden of excessive and
inappropriate regulation.8
Regulation may impose costs that are greater than benefits and thereby reduce community well-being, such as when
regulations fail to meet their objectives, or have unclear or questionable objectives that lead to unintended consequences, or
result in excessive compliance and administration costs. The challenge for government is then to deliver “effective and efficient
regulation — regulation that is effective in addressing an identified problem and efficient in terms of maximising the benefits
to the community, taking account of the costs” (Australian Government 2007, p.1). Ensuring that regulations are both effective
and efficient in turn requires a “structured approach to policy development that systematically evaluates costs and benefits”
(Australian Government 2007, p.1).
Regulatory Impact Assessment
The centerpiece of the regulatory assessment process in Australia is the requirement that an RIA be prepared for all
regulations that affect businesses, community organisations or individuals. A RIA systematically sets out the problem the
regulation addresses, the regulation’s objectives, the options to achieve them, the impacts of each option, and the consultation
undertaken.
An RIA is intended to make regulations more efficient and effective by making the legislation’s designers justify the reasons
for implementing them, consider the costs and benefits of other courses of action, and take a community-wide perspective of
their effects. They act as a check to ensure that the benefits to society of a regulation are greater than the costs and that it will
deliver the greatest net benefit to the community. The Government’s best practice regulatory assessment process therefore
requires a quantitative cost-benefit analysis (CBA), and a finding of net benefit to the Australian community for a regulation to
be adopted. Indeed, Principle 2 of the Australian Government Guide to Regulation states that: “Regulation should be imposed
only when it can be shown to offer an overall net benefit” (Australian Government 2014, p.2).
7 In the following, the term ‘regulation’ is broadly defined as ‘any rule endorsed by government where there is an expectation of compliance’ (Australian Government 2014), and therefore includes legislation and regulations (conventionally defined), as well as other ‘rules’ imposed by government. 8 The Organisation for Economic Cooperation and Development (OECD) has led the effort to develop guidelines and principles to ensure regulatory quality and performance. Major tools identified by the OECD to improve the efficiency and effectiveness of regulation include the use of regulatory impact analysis, the systematic consideration of alternatives, wide public consultation, and improved accountability arrangements in the review of existing regulations and development of new ones (Australian Government 2007).
Obesity Epidemic in AustraliaSubmission 119 - Attachment 1
Fat Chance: Why sugar taxes won’t work15
Framing a RIA of an SSB tax
Every conceivable policy proposal has its costs and benefits. The format of a RIA therefore follows a CBA accounting framework
as a means of systematically evaluating the impacts – in terms of the costs and benefits – of regulatory proposals, accounting
for all effects on the community and economy, rather than just the immediate effects on one particular group.
The Australian Government’s Regulation Impact Assessment (RIA) Guidelines sets out a methodology for assessing the net
benefits of a policy proposal in order to determine which option achieves the policy objective at least cost or in the least
harmful way. A key part of the RIA process is to consider whether there are alternative ways to achieve a policy objective that
is less harmful, or less distortionary, on the Australian economy.
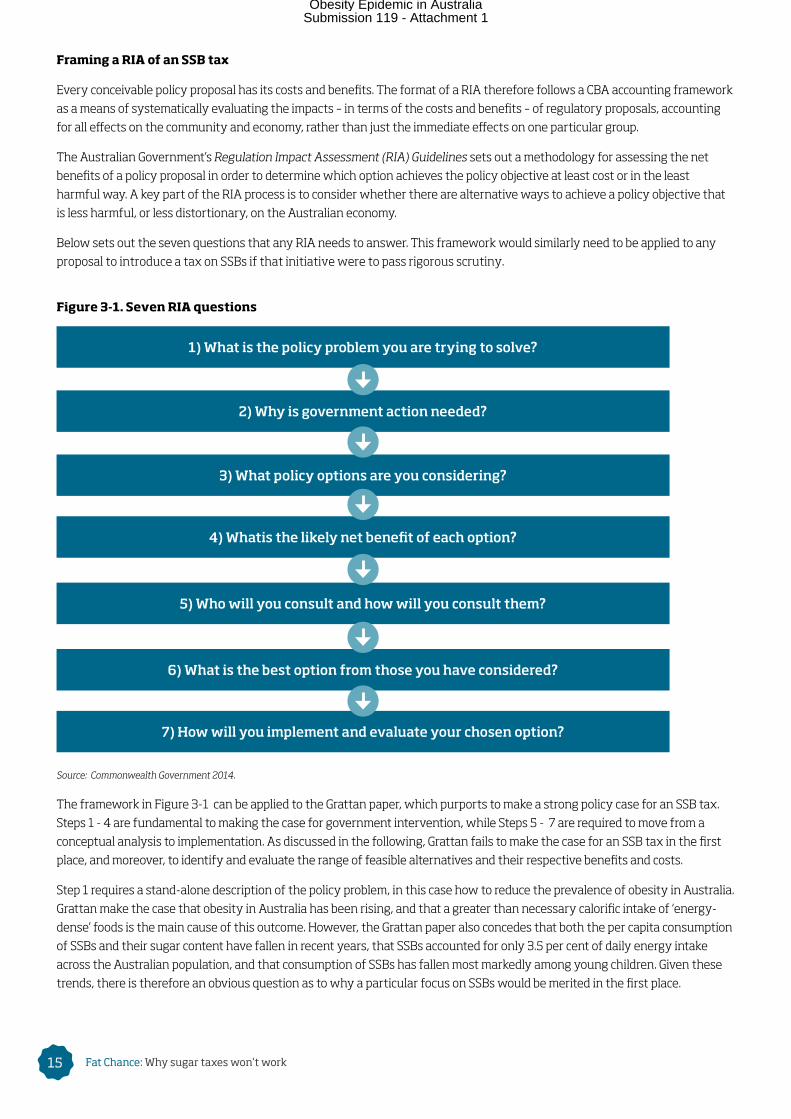
Below sets out the seven questions that any RIA needs to answer. This framework would similarly need to be applied to any
proposal to introduce a tax on SSBs if that initiative were to pass rigorous scrutiny.
Figure 3-1. Seven RIA questions
Source: Commonwealth Government 2014.
The framework in Figure 3-1 can be applied to the Grattan paper, which purports to make a strong policy case for an SSB tax.
Steps 1 - 4 are fundamental to making the case for government intervention, while Steps 5 - 7 are required to move from a
conceptual analysis to implementation. As discussed in the following, Grattan fails to make the case for an SSB tax in the first
place, and moreover, to identify and evaluate the range of feasible alternatives and their respective benefits and costs.
Step 1 requires a stand-alone description of the policy problem, in this case how to reduce the prevalence of obesity in Australia.
Grattan make the case that obesity in Australia has been rising, and that a greater than necessary calorific intake of ‘energy-
dense’ foods is the main cause of this outcome. However, the Grattan paper also concedes that both the per capita consumption
of SSBs and their sugar content have fallen in recent years, that SSBs accounted for only 3.5 per cent of daily energy intake
across the Australian population, and that consumption of SSBs has fallen most markedly among young children. Given these
trends, there is therefore an obvious question as to why a particular focus on SSBs would be merited in the first place.
1) What is the policy problem you are trying to solve?
2) Why is government action needed?
3) What policy options are you considering?
4) Whatis the likely net benefit of each option?
5) Who will you consult and how will you consult them?
6) What is the best option from those you have considered?
7) How will you implement and evaluate your chosen option?
Obesity Epidemic in AustraliaSubmission 119 - Attachment 1
Fat Chance: Why sugar taxes won’t work 16
Step 2 requires the proponent of an intervention to answer the question as to why government action is needed. Grattan claims
that people who are obese impose ‘an estimated $5.3 billion in costs on non-obese Australians’, an estimate that has been
challenged by Ergas (2016). There is a broader policy issue, however, that is not addressed in the Grattan paper, but that goes
to the fundamental purpose of the Australian healthcare system:9 Medicare is a universal healthcare system, which essentially
fully ensures people against illness and other negative health outcomes. In that context, an SSB tax then raises two issues:
• First, within the Australian healthcare system, people are generally not penalised for ‘bad’ behaviour, for instance for excess
alcohol consumption or for risky sporting activities. A case would then need to be made as to why the consumption of
sugary drinks in particular is considered particularly costly for society.
• Second, and if it is indeed considered that certain types of discretionary activities or behaviours are particularly costly, the
question then becomes whether the incentives inherent in the Medicare system materially contribute to negative outcomes.
Thus the current practice of charging people presenting at clinics a zero or negligible co-payment clearly creates a ‘moral
hazard’ problem, in the sense that individuals have no incentive to modify their behaviour so as to reduce health care costs
to the system overall. If this is a case, then an SSB tax, which penalises all Australians while creating no direct behavioural
incentives for people at risk of being obese is a poor second-best solution to the problem. In contrast, directly addressing the
moral hazard problem, for instance, by introducing some form of co-payment may at least signal to individuals that there are
costs involved with accessing health services.
Grattan instead points to the existence of a ‘market failure’ to justify the SSB tax, namely that people are not rational actors
and consume more or the ‘wrong’ type of food than they would if they understood the potential weight gain and were not
susceptible to marketing, or were confronted with the full costs of obesity. Market failure, if it is enduring and leads to material
adverse consequences, is a rationale for government interventions. However, to different degrees, market failures, whereby
people are not fully informed about some aspects of their decision-making exist in all walks of life, and most of these resolve
over time as people learn without the need for government to take action. Grattan offer various general statements about
Australians being ‘confused’ about nutrition, food and beverage labelling, as well as the link between obesity and bad health.
However, no evidence is presented to suggest that SSBs represent a specific source of market failure, for instance to suggest
that consumers are particularly uninformed about the calorie content of SSBs.
Step 3 requires a proponent of an intervention to consider all viable options to address a problem, including the option of not
regulating. Grattan fail entirely in this respect: the paper claims that a tax on SSBs “is the best tax option” without having
considered any alternative, whether or not they involve some form of taxation.10 As noted above, given that the underlying
issue is a moral hazard problem that eliminates the incentive for people to take into account the cost consequences of what
are essentially poor lifestyle choices, policy options that address this issue directly are likely to be far more effective. Without
consideration of any alternatives, Grattan instead promote a far-ranging tax that will impose costs on all Australians.
Step 4 asks proponents to quantify, as far as possible, the ‘net benefit’ – the difference between aggregate benefits and
aggregate costs – of all options considered to achieve the policy objectives. Underlying this requirement is a central concept
in welfare economics: that a society’s welfare is only improved and therefore an action is only worth taking if the benefits,
however defined, are greater than the costs that are incurred along the way. Aside from the (unsubstantiated) claim that
“an SSB tax would not be difficult to implement or overly expensive to administer” (P.42), no mention is made of the broader
economic costs of selective tax interventions. Yet a tax on SSBs would be levied on the overwhelming majority of Australians
who consume such beverages, and distort their choices, causing a cost to the community that must be set against any gain
from altering the behaviour of the at-risk population. For example, people value sugary drinks or confectionary to maintain
their energy levels, or for pure enjoyment. Similarly, on the producer side, the lost producer surplus would also need to be
considered in any full cost-benefit accounting exercise.
9 Similar arguments apply for the Australian social safety net system. 10 Grattan instead claims, without evidence, that SSB taxes have, in general, been successful in reducing consumption and raising revenue. Taxing the sugar content of SSBs, or SSBs as a product is then said to be the ‘best’ tax option because it is simple, can be implemented quickly, targets products contributing to the obesity problem, and can be incorporated into the existing excise tax system.
Obesity Epidemic in AustraliaSubmission 119 - Attachment 1
Fat Chance: Why sugar taxes won’t work17
3.2 Summary
The purpose of the Regulation Impact Assessment Guidelines is to make regulations more efficient and effective by having
designers of new legislations justify the reasons for implementing them, consider the costs and benefits of alternatives to the
regulation at an early stage, and take a community-wide perspective of their effects, ensuring that the benefits to society of
a regulation are greater than the costs, as well as encouraging the design and adoption of the regulation with the greatest net
benefit to the community.
The Government’s best practice regulatory assessment process therefore requires a quantitative cost-benefit analysis (CBA),
and a finding of net benefit to the Australian community for a regulation to be adopted. Indeed, Principle 2 of the Australian
Government Guide to Regulation states that: “Regulation should be imposed only when it can be shown to offer an overall net
benefit” (Australian Government 2014, p.2). We have demonstrated that the authors of the papers reviewed have failed to
meet this standard.
Obesity Epidemic in AustraliaSubmission 119 - Attachment 1
Fat Chance: Why sugar taxes won’t work 18
4. Public policy principlesThis section expands on the discussion in Section 3 and discusses three public policy principles that should be kept in mind
when considering a sugar tax, namely:
i. Good tax design principles;
ii. Good public finance principles; and
iii. More fundamental problems with so-called ‘nanny state’ taxes.
4.1 Good tax design
There is a well-established literature on the effects of taxation on the economy that includes lessons from tax design to
minimise these adverse impacts.
Efficiency, equity and simplicity
Good tax design effectively trades-off three goals, namely efficiency, equity and simplicity. A specific tax is not efficient since
it distorts behaviour and should only be used if there is supreme confidence that the tax will alter the behaviour of only
those the tax is trying to target. In this regard, the tax will be unfair since it discriminates based on health or body shape
(see discussion below).
The sugar tax is likely to be regressive, affecting low-income households. This is because lower income households spend
a greater proportion of their income on food and drinks. A tax on sugar therefore needs to be considered in the context of
the overall tax burden on different income levels. For instance, as part of the A New Tax System (ANTS) tax package (that
introduced the GST and abolished a number of inefficient nuisance taxes), lower income level households were compensated
(even overcompensated in some instances) for the adverse impact of the new tax through increases in pensions, welfare
benefits and the tax-free threshold.
Tax incidence
Analysing any new tax also requires an understanding of its actual effect on consumer behaviour. For instance, if the tax is effective then it will not raise any revenue. On the other hand, if the tax is not effective, it will not produce the desired
health outcome. Will Australian sugar producers be able to pass on the tax in full, or will these businesses need to absorb
some of the cost increase and what effect will this have on their business?
The incidence of the tax on consumers also needs to be understood. A consumer’s real income will fall with the imposition of
the tax – will the consumer purchase less of everything, or switch between goods and services to recalibrate their bundle of
goods and services to maximise their utility based on their lower income, (the so-called ‘income and substitution’ effects)?
Conclusions from the tax design literature
The tax design literature is extensive. One good summary of this literature is Jorgenson (2012) who finds that:
Our overall conclusion is that the most substantial gains from tax reform are associated with equalizing tax burdens
on all assets and all sectors and eliminating the progressive taxation of labour income. Efficient taxation of income
produces the largest welfare gains of any proposal that we consider.
Relating the tax design literature to the proposals for an SSB tax, we make the following points:
• Specific taxes need to be well-designed and well-targeted to be effective, collectively maximising efficiency, equity and
simplicity goals.
• This is problematic since there are many more factors that lead to obesity not related to SSBs, such as overall sugar intake,
total calorie intake, genetic factors (such as propensity to retain weight via a low Basal Metabolic Rate (BMR)), psychological
factors and income factors.
Obesity Epidemic in AustraliaSubmission 119 - Attachment 1
Fat Chance: Why sugar taxes won’t work19
• The economic efficiency (dead weight loss) of the tax, compared with other sources of revenue to fund activities such as
health research and obesity programs.
4.2 Public finance principles
In the case of taxation, there is a critical distinction between the need for government to raise revenue to fund the services it is
required to produce, and taxes designed to alter the behaviour of Australian’s for their own benefit.
The latter are sometimes referred to as ‘sin taxes’. A prime example of a sin tax is the current excise on tobacco products that is
aimed squarely at discouraging both the uptake and use of tobacco products for health reasons (this, along with a raft of other
measures such as advertising bans and packaging restrictions).
It is less than ideal to hypothecate particular taxes to particular uses. First, taxes should be collected in the most efficient (or
least distorting) manner and not be influenced by what the expenditure priorities are. Second, the tax collected should be
returned as a lump sum to those taxed in order to minimise the distortion (reduction) to their incomes. All taxes have ‘income’
and ‘substitution’ effects. Given that a sugar tax is designed solely to encourage substation away from (in this case) SSBs and
not to affect someone’s income, then the revenue should be returned to the taxpayer. If the revenue is not returned, then the
taxpayer experiences not only a reduction in ‘utility’ from the available bundle of goods and services, but also a real reduction in
income.
4.3 Nanny State
The previous section presented strong arguments against the proposed sugar tax on SSBs based on:
• Doubt around the claims made linking the (falling) consumption of SSBs to rising obesity;
• Grattan’s findings that obesity hardly falls yet the tax affects the non-obese consumers of SSBs (and this cost is not taken
into account);
• The calculation errors in the three papers that overstated the benefits of reduced SSB consumption, leading Pincus (2017)
to conclude the proposed sugar tax could be defined as a nuisance tax; and
• The economic efficiency costs of poorly designed taxes.
This section canvasses an additional, and equally important, set of arguments in relation to the government using the tax
system to infringe on the free choices of citizens. ‘Nanny State’ is a term used to describe a broad trend in liberal democracies
towards increased government interference into the lives of individuals. The tools of the state are differential taxes and
regulations, mainly focussed on (and justified by) manipulating health outcomes and, thus, minimising society’s total health
costs. For example, the Rudd Government’s National Preventative Health Taskforce (Moodie, 2009) recommended “…a review
of economic policies and taxation systems, and develop methods for using taxation, grants, pricing, incentives and/or subsidies
to promote production, access to and consumption of healthier foods.” (p.14)
This trend is, quite clearly, at odds with the founding principles of western liberal democracies in relation to individual freedom
and choice in almost every aspect of life.
Michalia Novak, in her 2012 paper,11 cited David Harsanyi who defined the nanny state as “a place where government takes a
hyper interest in micromanaging the welfare of its citizens”. This micromanagement is perhaps no more pernicious or arguably
less justified than in the state influencing the food choices people make.
11 Nanny State Taxes: Soaking the Poor in 2012 (Novak, 2012).
Obesity Epidemic in AustraliaSubmission 119 - Attachment 1
Fat Chance: Why sugar taxes won’t work 20
These types of nuisance taxes also have the problem of legitimising alternative, and equally ‘unhealthy’ choices. As Archer
has argued: “For instance, taxes on soda may signal to consumers that soft drinks are unhealthy in much the same way that
educational campaigns in print or radio media remind the public to avoid or limit soda consumption. The nontaxed status of
fruit juices and milk may confer a “health halo” on those drinks, similar to the effect of low-sugar or low-fat health claims.
Consumers may interpret such health claims to mean that a food item is healthy and consequently can be consumed in larger
quantities. However, many fruit juices contain as much sugar as sodas, so hikes in consumption of fruit juice may actually increase consumers’ caloric intake (Archer et al., 2017, p.34).
Putting aside the arguments made in section 2 questioning the practical effectiveness of these taxes, manipulating individuals’
food choices to target health is not consistent with the idea of universal public health insurance, which is common to all OECD
countries including the United States (following the introduction of the Affordable Care Act). A sugar tax is not consistent
with the Australian concept of fairness and equal treatment by our public health system. Australians do not regard sugar
consumption as a bad thing or guilty pleasure or would probably not accept the notion that they should pay extra for the
enjoyment.
Of course, as Ergas (2016) argued, when you fully insure people against health risks like obesity and charge them a zero
or negligible co-payment, it is bound to create moral hazard. But a sugar tax would be a very weak second best solution
(compared to increasing patient co-payments for medical goods and services) because a tax on SSBs cannot possibly isolate
the combination of obese people who consume SSBs without being discriminatory against fat people. Our universal health
system does not discriminate against fat people or any other body shape. Rather, our system is purposely designed not to
discriminate against anyone.
A further point is that the fundamental democratic principles of freedom and choice is promoted by a revenue system that
imposes an equal tax burden across all goods and services, thus guaranteeing effective freedom of choice between products.
In our view, it should be a high threshold indeed to move away from this fundamental principle.
Through the three levels of government operating in Australia, each already has a significant impact on the lives of Australians
through not only the provision of key services like education and health, there are also significant taxation and regulatory
burdens.
In summary, Novak (2012) argues that:
• Nanny State taxes infringe on the liberties of Australians to consume products of their choice.
• Nanny State taxes hurt the economic interests of the poorest in our community.
• Rising taxes on consumer products also invoke a host of unintended consequences that either exacerbates the
problems the taxes purport to resolve, or create new ones in the process.
4.4 Summary
The longstanding and widely accepted principles of good public policy have evolved for a purpose. We abandon them at our
peril in developing public policy that adds complexity to an already-over-complicated tax system. Changes to public finance
arrangements and policies that intrude on the day-to-day choices of individuals should not be taken lightly.
The most efficient and effective taxes on products are low and broad-based so as not to influence individual choices between
close substitutes and to minimise the ‘deadweight cost’ of taxation.
Sound public finance requires a separation between revenue and expenditure such that revenue is collected in the most efficient
and non-distorting way possible, while expenditure is prioritised according to the will of the people in a democracy. Hypothecating
certain taxes for certain expenditure does not fit into this best-practice framework because it is inefficient and risky.
Unless there is overwhelming evidence of a greater benefit, the government should avoid tampering with individuals’ day-to-
day food choices. Nanny state taxes have a tendency to penalise the poor for their choices while having little or no effect on
their behaviour.
Obesity Epidemic in AustraliaSubmission 119 - Attachment 1
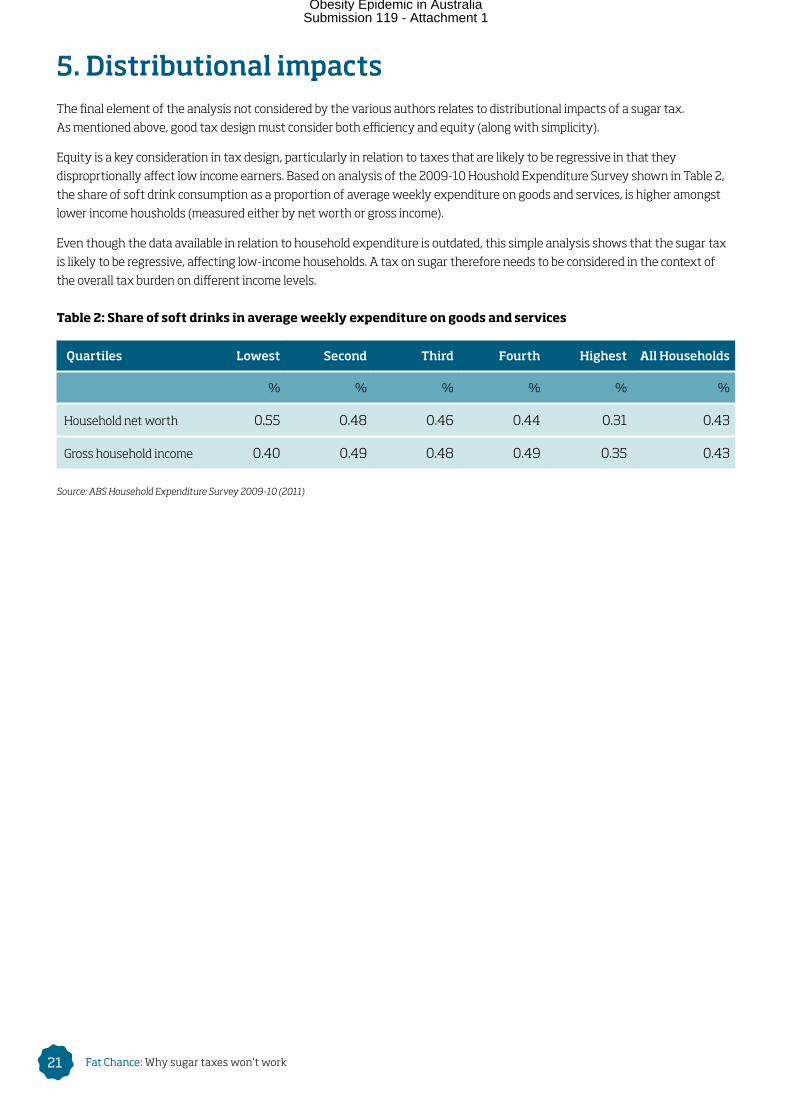
Fat Chance: Why sugar taxes won’t work21
5. Distributional impactsThe final element of the analysis not considered by the various authors relates to distributional impacts of a sugar tax.
As mentioned above, good tax design must consider both efficiency and equity (along with simplicity).
Equity is a key consideration in tax design, particularly in relation to taxes that are likely to be regressive in that they
disproprtionally affect low income earners. Based on analysis of the 2009-10 Houshold Expenditure Survey shown in Table 2,
the share of soft drink consumption as a proportion of average weekly expenditure on goods and services, is higher amongst
lower income housholds (measured either by net worth or gross income).
Even though the data available in relation to household expenditure is outdated, this simple analysis shows that the sugar tax
is likely to be regressive, affecting low-income households. A tax on sugar therefore needs to be considered in the context of
the overall tax burden on different income levels.
Table 2: Share of soft drinks in average weekly expenditure on goods and services
Quartiles Lowest Second Third Fourth Highest All Households
% % % % % %
Household net worth 0.55 0.48 0.46 0.44 0.31 0.43
Gross household income 0.40 0.49 0.48 0.49 0.35 0.43
Source: ABS Household Expenditure Survey 2009-10 (2011)
Obesity Epidemic in AustraliaSubmission 119 - Attachment 1
Fat Chance: Why sugar taxes won’t work 22
6. ConclusionsThe six papers that we have reviewed reach strong conclusions that taxing SSBs will provide significant health benefits, and
will serve to raise taxation revenues to benefit the broader community. This logic is inherently flawed because significant
health benefits could only be achieved if consumers switch out of SSBs to non-sugary alternatives (which wouldn’t raise any
revenue), or (alternatively) continue to consume SSBs, thus raising revenue (but not improving health outcomes). Even worse
than this, because the proposed SSB tax is product-specific, it could be the case that consumers switch out of SSBs towards
close sugary substitutes that are untaxed. In this case, the government would not raise any revenue and health outcomes
would not be improved.
Further, there is no underlying empirical analysis of the relationship between the consumption of SSBs and the prevalence
of obesity. None of the six papers sufficiently make the logical links in the chain between SSB consumption and obesity and,
consequently, taxing SSB consumption and obesity. Indeed, the evidence shows increasing measured rates of obesity and
declining consumption of SSBs. As a result, based on the papers reviewed the case for government intervention is weak or
non-existent.
In each of these papers, the assumption is made – but never discussed – that broad interventions affecting all Australians
are preferable to more targeted initiatives that directly incentivise people to consider their own health outcomes in their
consumption choices. As a result, all three papers focus their efforts on measures that are inherently inefficient, given that,
in aggregate, significant costs would be imposed on the great majority of Australians who are not obese or at risk of such
outcomes. The papers fail to consider the fundamental distinction between where a tax is levied and its final incidence, in terms
of who bears the cost.
None of the papers attempt a comprehensive welfare analysis of the effects of an SSB tax that would shed light on the
aggregate economic costs of the proposed intervention, and in particular whether the claimed benefits of the proposed
intervention would exceed the costs. Furthermore, as discussed in Pincus (2017), the Grattan paper substantially overestimates
the likely tax revenues and benefits of an SSB tax.
Overall, it is notable that despite numerous assumptions that would tend to skew the analysis in favour of finding major
benefits of an intervention, the ‘benefits’ of an SSB tax appear to be minimal. Notwithstanding the claim in the Grattan paper
that an SSB tax would generate a 15 per cent fall in consumption of SSBs, Grattan estimate that the reduction in the prevalence
of obesity amounts to only 2 per cent.
The most recent (2014-15) ABS National Health Survey indicates that the prevalence of obesity among Australian 18 years or
older (defined as a BMI > 30) was 27.9 per cent, or around 4.9 million persons. 2 per cent of 27.9 per cent would then amount to
a reduction of 0.6 per cent in the rate of obesity, corresponding to less than 100,000 people. This figure is consistent with the
findings in Veerman et al. (2016) who report reductions in obesity in the range of 0.7 per cent for men and 0.3 per cent
for women.
The negligible impacts identified in these four papers are consistent with other empirical research (such as Kaiser, 2013), which
suggests that taxes on SSBs fail to reduce obesity and are regressive, in the sense that they disproportionately penalise lower
income groups.
Obesity Epidemic in AustraliaSubmission 119 - Attachment 1
Fat Chance: Why sugar taxes won’t work23
ReferencesArcher, E. et al. (2017), Government Dietary Guidelines: Uncertain Science Leads to Questionable Public Health Policy, Mercatus Working Paper George Mason University. Accessed: https://www.mercatus.org/system/files/mercatus-archer-gov27t-dietary-guidelines-v1.pdf
Australian Bureau of Statistics (2016), 4364055001DO008_20142015 National Health Survey: First Results, 2014–15 — Australia, September.
____ (2011), Household Expenditure Survey, Australia: Detailed Expenditure Items, 2009-10, Australia, September
Australian Government (2014), The Australian Government Guide to Regulation.
____ (2007), Best Practice Regulation Handbook, August.
Brand-Miller, J.C. and Barclay, A.W., 2017, Declining consumption of added sugars and sugar-sweetened beverages in Australia: a challenge for obesity prevention. USA (10.3945/ajcn.116.145318). American Society of Nutrition.
Cawley, J. and Frisvold, D., 2015. The Incidence of Taxes on Sugar-Sweetened Beverages: The Case of Berkeley, California (No. w21465). National Bureau of Economic Research.
Cobiac, L.J., Tam, K., Veerman, L. and Blakely, T., 2017. Taxes and subsidies for improving diet and population health in Australia: a cost-effectiveness modelling study. PLoS medicine, 14(2), p.e1002232.
Colatuoni, F. et al., 2015, The impact of soda sales taxes on consumption: evidence from scanner data, Contemporary Economic Policy Vol.33 No.4 October 2015.
Colchero MA. et al., 2017, Beverage purchases from stores in Mexico under the excise tax on sugar sweetened beverages: observational study. BMJ. 2016; 352:h6704 Accessed: http://www.bmj.com/content/352/bmj.h6704
Commonwealth of Australia, 2014, The Australian Government Guide to Regulation.
Coulter, A., Parsons, S. and Askham, J., (2008). Where are the patients in decision-making about their own care? World Health organisation. Accessed: http://www.euro.who.int/__data/assets/pdf_file/0007/73285/E93419.pdf?ua=1
Department of Health (2013), Clinical practice guidelines for the management of overweight and obesity in adults, adolescents and children in Australia. Accessed: http://www.health.gov.au/internet/main/publishing.nsf/Content/obesityguidelines-index. htm
Duckett, S., Swerissen, H. and Wiltshire, T. 2016, A sugary drinks tax: recovering the community costs of obesity, Grattan Institute.
Ergas, H. (2016), Sugar coating hard truths about obesity tax, The Australian Newspaper Opinion 28 November. Accessed: http://www.theaustralian.com.au/opinion/columnists/henry-ergas/sugar-coating-hard-truths-about-obesity-tax/news-story /75de31a16f3611c7bae86e0761d6a2c4
Fletcher, J. et al. (2011), Are soft drink taxes an effective method for reducing obesity?, Journal of Policy Analysis and Management Vol.30 No.3.
Kaiser, K. et al. (2013), Will reducing SSB consumption reduce obesity? Obesity Reviews Vol.14 Issue 8, August 2013. Accessed: http://onlinelibrary.wiley.com/doi/10.1111/obr.12048/full
Lal, A. et al. (2017), Modelled health benefits of a sugar-sweetened beverage tax across different socioeconomic groups in Australia: A cost-effectiveness and equity analysis. Accessed: http://journals.plos.org/plosmedicine/article?id=10.1371/journal.pmed.1002326
Moodie, R. (2009), Australia: The Healthiest Country by 2020 – National Preventative Health Strategy – the roadmap for action, Australian Government Preventative Health Taskforce. Accessed: http://www.health.gov.au/internet/preventativehealth/publishing.nsf/Content/CCD7323311E358BECA2575FD000859E1/%24File/nphs-roadmap.pdf
Nomaguchi, T. et al. (2017), The impact on productivity of a hypothetical tax on sugar-sweetened beverages, Health Policy 121 (2017) (p.715-725).
Novak, M. (2012), Nanny State Taxes: Soaking the Poor in 2012, Institute of Public Affairs. http://archive.ipa.org.au/sectors/nanny-state/publication/2016/nanny-state-taxes-soaking-the-poor-in-2012
Pincus, J. (2017), Grattan Institute’s Case for Sugar Tax is Not Proven, University of Adelaide School of Economics Working Paper No. 2017-04; http://www.economics.adelaide.edu.au/ research/papers/doc/wp2017-04.pdf; accessed 15 May 2017.
Veerman, J.L., Sacks, G., Antonopoulos, N. and Martin, J., 2016. The impact of a tax on sugar-sweetened beverages on health and
health care costs: A modelling study. PloS one, 11(4), p.e0151460.
Obesity Epidemic in AustraliaSubmission 119 - Attachment 1

Fat Chance: Why sugar taxes won’t work 24
Appendix 1: The Body Mass IndexAt the outset it is important to recognise that measuring obesity rates is inherently difficult. The standard measure of obesity
is through the use of the Body Mass Index (BMI). The formula for this measure is:
BMI = Weight (kgs) / Height (m2)
For example, a person who is 1.75 metres tall and weighs 80 kgs has a BMI of 26.1 [80 / 1.752 = 26.1]. This result would
classify our friend as being in the ‘overweight’ range. Table A1 below reports Australian obesity rates using the BMI
classification system.
Table A.1. Australian obesity rates by BMI classification ranges, 2014-15
Males (18+, %) Females (18+, %) Persons (18+, %)
Underweight (BMI less than 18.50) 1.2 2.1 1.6
Normal range (18.50-24.99) 28.1 41.7 35.0
Overweight (25.00-29.99) 42.4 28.8 35.5
Obese (30.00+) 28.4 27.4 27.9
Total 100.0 100.0 100.0
Average BMI 27.8 27.2 27.5
Median BMI 27.1 26.0 26.6
Source: ABS (2015) National Health Survey: First Results, 2014-15 (Tables 8.1 and 8.3).
There are a number of conceptual problems with classifying obesity rates based on BMI results.
First, BMI does not distinguish between muscle and fat (or between surface fat and visceral fat around vital organs). For
instance, many professional athletes and ‘weekend warriors’ would find it perplexing to be defined as overweight (BMI>25) or
even obese (BMI>30) when they follow a healthy diet and lifestyle just because they might carry more muscle than average
and/or be of medium height (rather than tall).
Second, an issue that has been identified by the World Health Organisation is that different ethnic groups have, generally,
different body shapes. Therefore, judging two people from different ethnic backgrounds (not to mention different proportions of
muscle to fat) on the basis of BMI as similarly obese because they might share the same BMI number is plainly ill-advised.
Third, the Australian BMI data (Table A.1 above) reveals that the average BMI for both males and females is more than the
median (or middle) BMI figure. However, the median figure is more reflective of the BMI of most people. In other words, there
is a ‘long tail’ of very obese Australians who are pulling up the average BMI score above the median. Similarly to how we
measure median house prices to avoid the problem of the $10 million house pulling up average house prices in a suburb, the
median figure is a more accurate reflection of true BMI.
Taking these conceptual problems together, it is not at all clear that BMI is a completely accurate measure of the burden of
obesity in Australia. In fact, the rates reported in Table A.1 are more likely to be an overestimate than an underestimate.
Obesity Epidemic in AustraliaSubmission 119 - Attachment 1
Fat Chance: Why sugar taxes won’t work25
RG Menzies House Cnr Blackall & Macquarie Streets
Barton ACT 2600
PO Box 6091, Kingston ACT 2604
www.menziesrc.org
Obesity Epidemic in AustraliaSubmission 119 - Attachment 1