farm t ns' product - environment southland
TRANSCRIPT

ALLIANCEFARM T NS' PRODUCT
SINCE I94E
ALLIANCE GROUP LIMITED
MATAURA PROCESSING PLANT
Resource Consent Applications andAssessment of Environmental Effects
31 May 2019
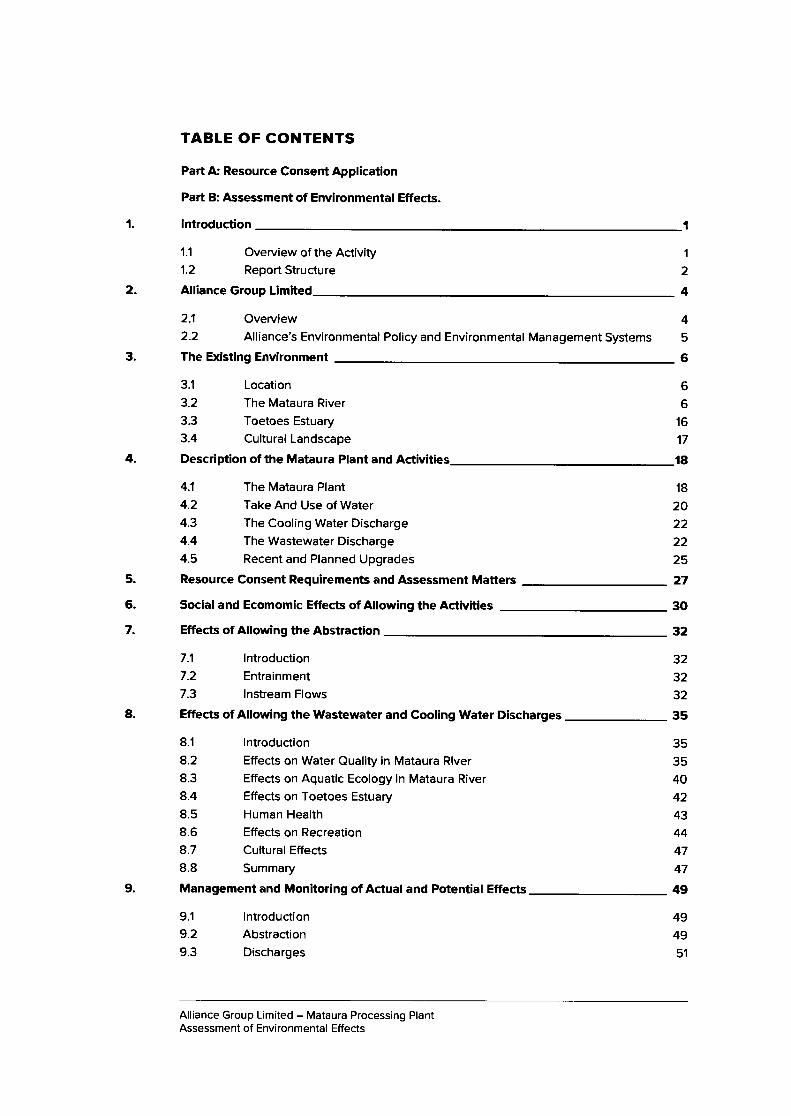
TABLE OF CONTENTS
Part A: Resource Consent Application
Part B: Assessment of Environmental Effects.
1. Introduction
2.
1.1 Overuiew of the Activity1.2 Report Structure
Alliance Group Limited
2.1
2.2
OverviewAlliance's Environmental Policy and Environmental Management Systems
3. The Existing Environment
4.
3.1 Location 63.2 The Mataura River 63.3 Toetoes Estuary 16
3.4 Cultural Landscape '1r7
DescriptionoftheMatauraP|antandActivities18
41 The Mataura Plant
4.2 Take And Use of Water
4.3 The Cooling Water Discharge
4.4 The Wastewater Discharge
4.5 Recent and Planned Upgrades
Resource Consent Requirements and Assessment Matters
Social and Ecomomic Effects of Allowing the Activities
Effects of Allowing the Abstraction
8.
7.1 lntroduction7.2 Entrainment
7.3 lnstream Flows
Effects of Allowing the Wastewater and Cooling Water Discharges
1
1
2
4
4
5
6
18
2022
22
25
27
30
32
32
32
32
35
35
35
4042
43
44
47
47
49
494951
5.
6.
7.
9.
8.1 lntroduction8.2 Effects on Water Quality in Mataura Rlver8.3 Effects on Aquatic Ecology in Mataura River8.4 Effects on Toetoes Estuary
8.5 Human Health
8.6 Effects on Recreation
8.7 Cultural Effects
8.8 Summary
Management and Monitoring of Actual and Potential Effects
9.1
9.2
9.3
lntroduclionAbstraction
Discharges
Alliance Group Limited - Mataura Processing PlantAssessment of Environmental Effects
10.
9.4 Kaitiakilnput 649.5 Summary of Mitigation, Monitoring and Other Measures for Managing Adverse
Effects 64
ConsiderationofAIternativesandtheBestPracticableoption-7.|
10.1
10.2
10.3
10.4
lntroductionOptions Assessment
Proposed ApproachAlternative Options
71
73
73
75
a211.
12.
14.
11.1 lntroduction11.2 Technical Working Party'11.3 lndividual Consultation with Technical Working Group Members
11.4 Local Residents
11.5 Regional Forum
11.6 Recreational Users
Provisions of the Relevant Planning Documents
82
82
85
88
88
89
90
9090
9697
97
102
111
123
132
Relevant Statutory Planning Documents
National Policy Statement for Freshwater Managemenl2Ol4Resource Management (Measurement and Reporting of Water Takes)
Regulations 2O1O
New Zealand Coastal Poliry Statement 2010
Southland Regional Poliry Statement
Operative Water Plan
Proposed Water and Land Plan
Te Tangi a Tauira - The Cry of the People
13. StatutoryAssessment
13.1 lntroduction13.2 Section 104D
13.3 Section 104
13.4 Section 105
13.5 Section 107
Concluding Statement
LIST OF FIGURES
The Alliance Mataura Plant (foreground).
Mataura Township with Mataura River flowing from north to south.
The Mataura Catchment
Weir, hydro race and discharge.
Mataura River approximately 2 km downstream of the discharge point.
12.1
12.2
12.3
12.4
12.5
12.6
12.7
2.4
Figure 1:
Figure 2:
Figure 3:
Figure 4:
Figure 5:
132
132
133
140
140
'142
6
7
9
15
Alliance Group Limited - Mataura Processing PlantAssessment of Environmental Effects
Figure 6:
Figure 7:
Figure 8:
Figure 9:
Figure 10:
Figure 11:
Figure 12:
Alliance Mataura Site Plan.
Plant location, hydro race and pump locations.
Existing wastewater treatment process at the Mataura Plant.
Final dried DAF solids ready to be taken off-site for composting
Beef boners at the Mataura Plant.
Take and discharge points.
Monitoring locations.
LIST OF TABLES
Table 1: Summary flow statistics for the Mataura River. 10
Table 2: Water quality state and trends in the lower Mataura River 12
Table 3: Summary of the discharge quality since November 2012 (all units g/m3 unless
stated). 24
Table 4: Pathogen monitoring data for treated wastewater from the Mataura Plant. 24
Table 5: Resource consent requirements and activity status. 27
Table 6: DIN and DRP concentrations upstream and downstream of the Plant. 38
Table 7: The MfE (2000) guideline maximum mean monthly DIN and DRP
concentrations for preventing excessive periphyton growth 38
Table 8: Freshwater NPS Attribute State of Mataura River based on historical E co/i
data. 39
Table 9: Total nitrogen load discharged in the Plant's wastewater. 55
Table 10: Proposed limits for new discharge permit (note: consistently maintained means
4 out of 5 samples meeting the relevant limit). 58
Table 11 Parameters for which the proposed conditions require weekly sampling
(Matters in bold underline are for compliance purposes) 62
Table 12: Summary of recommended mitigation, monitoring and reporting. 65
Table 13: Compulsory values and attributes. 93
Alliance Group Limited - Mataura Processing PlantAssessment of Environmental Effects
19
2'.1
23
23
30
33
63
LIST OF APPENDICES
Appendix 1: Proposed consent conditions.
Assessment of the Effects of Alliance Mataura's Discharges and Water
Take on Mataura River and Toetoes Estuary, Freshwater Solutions and
Aquatic Environmental Sciences, 2019.
Quantitative Microbial Risk Assessment of the Mataura Plant's wastewater
discharge, Streamlined Environmental, 2019.
Appendix 2:
Appendix 3:
Appendix 4: Determination of mixing zone of treated wastewater from Alliance Mataura
discharged into the Mataura River: a mixing modelling approach using
contaminant tracers, Streamlined Environmental, 2O19.
Appendix 5: Mataura River Alliance Discharge: ldentification of in-river recreation
values, Rob Greenaway & Associates, 20'19.
Appendix 6: Assessment of Economic Benefits, Mike Copeland - Brown, Copeland &
Co,2019.
Appendix 7: Mataura Plant Wastewater Treatment and Disposal Alternatives
Assessment, Pattle Delamore Partners, 2019.
Appendix 8: Alliance Mataura Plant - Water Use and Wastewater Management
Resilience Assessment
Appendix 9: Summary AEE document circulated to key stakeholders during
consultation.
Appendix 10: Consultation meeting notes.
Appendix 11: Consultation leaflet posted to letter boxes in Mataura Township
Alliance Group Limited - Mataura Processing PlantAssessment of Environmental Effects
AEE
LIST OF ACRONYMS / GLOSSARY OF TERMS
AES
Assessment of Environmental Effects
Aquatic Environmental Sciences Ltd
Alliance Group Ltd
ammoniacal nitrogen
Australian and New Zeatand Environment and Conservation Council
biological oxygen demand
best practicable option
capital expenditure
colony-forming unit
chemical oxygen demand
dissolved air fl oatation
dissolved inorganic nitrogen
dissolved oxygen
Department of Conservation
dissolved reactive phosphorus
Environmental Monitoring Plan
Ephemeroptera (mayfly), Plecoptera (stonefly) and Trichoptera
(caddisfly)
Environment Southland
faecal indicator bacleria
freshwater management unit
National Policy Statement for Freshwater Managemenl2Ol4
the average annual frequency at which flows exceed three times
the median
full time equivalent staff
Alliance
Amm-N
ANZECC
BOD
BPO
CAPEX
CFU
COD
DAF
DIN
DO
DoC
DRP
EMP
EPT
ES
FIB
FMU
Freshwater NPS
FRE3 flows
FTEs
Alliance Group Limited - Mataura Processing PlantAssessment of Environmental Effects
FWS
GDC
KW
MALF
MCI
MfE
MIE
MoU
NPS
Operative Plan
OPEX
PDP
Proposed Plan
QMCI
QMRA
RMA
RPS
TAMI
Te Tangi a Tauira
the Act
the Plant
Freshwater Solutions Ltd
Gore District Council
kilowatt
Mean annual low flow
Macroinvertebrate Community lndex
Ministry for the Environment
Mataura lndustrial Estate
Memorandum of Understanding
National Policy Statement
Operative Regional Water Plan
operating expense
Pattle Delamore Partners
Proposed Southland Water and Land Plan
Quantitative Macroinvertebrate Comm u nity I ndex
Quantitative Microbial Risk Assessment
Resource Management Act 199'l
Southland Regional Policy Statement
Te Ao Marama lnc
Ngai Tahu ki Murihiku Natural Resource and Environmental lwi
Management Plan 2008: Te Tongi o Touiro - The Cry of The People
Resource Management Act 1991
Alliance Mataura Plant
Total Kjeldahl nitrogen
total nitrogen
total phosphorus
total suspended solids
Tangata Whenua Consultation Group
TKN
TN
TP
TSS
TWCG
Alliance Group Limited - Mataura Processing PlantAssessment of Environmental Effects

UV ultra violet
Water Conservation (Mataura River) Order 1997WCO
Alliance Group Limited - Mataura Processing PlantAssessment of Environmental Effects

PART A
Resource Consent Applications
FORM 9
APPLICATION FOR RESOURCE NT OR FAST.TRACKRESOURCE CONSENT
1.
Sections 87AAC, 88, and 145, Resource Management Act 1991
To Environment Southland
2.
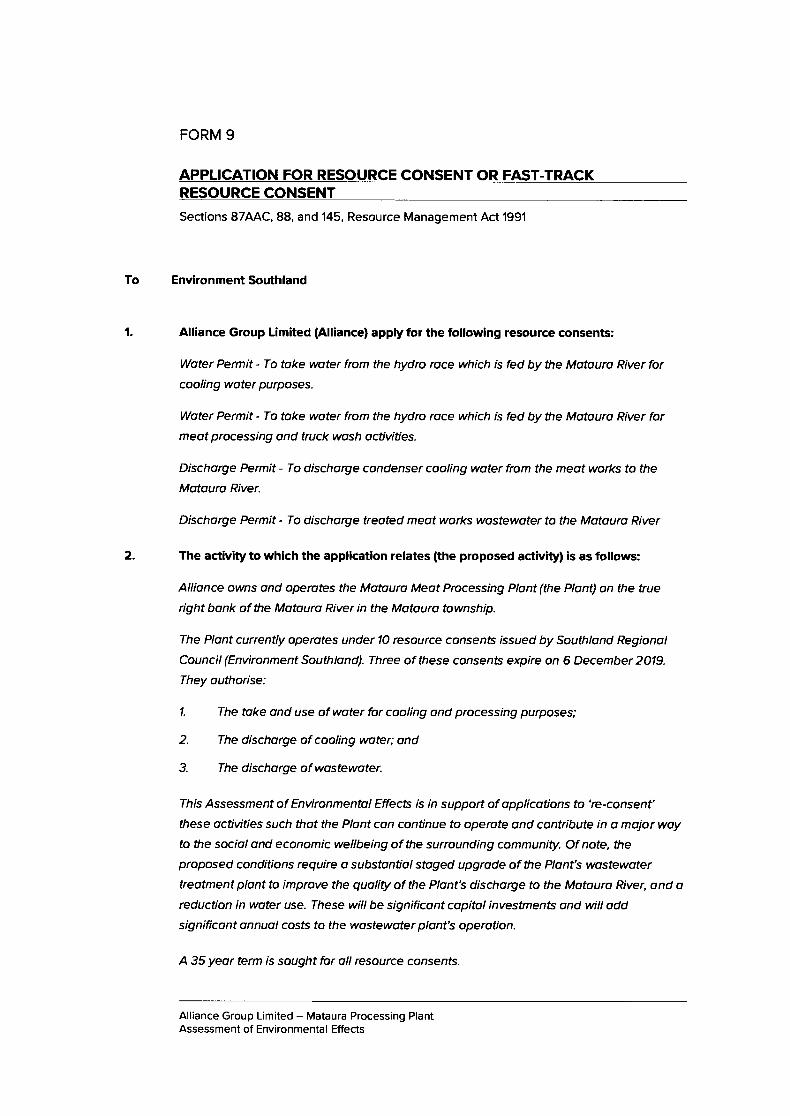
Alliance Group Limited (Alliance! apply for the following resource consents:
Woter Permit - To toke woter from the hydro roce which is fed by the Motouro River for
cooling woter pu rposes.
Woter Permit - To toke woter from the hydro roce which is fed by the Motouro River for
meot processing ond truck wosh octivities.
Dischorge Permit - To dischorge condenser cooling woter from the meot works to the
Motouro River.
Discharge Permit - To dischorge treoted meot works wostewoter to the Motaura River
The activ'rty to which the application relates (the proposed activityl is as follows:
Allionce owns ond operotes the Motouro Meot Processing Plont (the Plont) on the true
right bonk of the Motouro River in the Motouro township.
The Plont currently operotes under 10 resource consents issued by Southlond Regionol
Council (Environment Southland). Three of these consents expire on 6 December 2019.
They outhorise:
1. The toke ond use of woter for cooling ond processing purposes;
2. The discharge of cooling woter; ond
3. The dischorge of wostewoter.
Ihis Assessment of Environmentol Effects is in support of opplicotions to 're-consenf'
these activities such thot the Plont con continue to operote ond contribute in o mojor woy
to the sociol ond economic wellbeing of the surrounding community. Of note, the
proposed conditions require o substontial stoged upgrode of the Plont's wostewoter
treotment plont to improve the quolity of the Plant's dischorge to the Motouro River, ond o
reduction in woter use. Ihese will be significont copitol investments ond will odd
significont onnuol costs to the wostewoter plont's operotion.
A 35 yeor term is sought for oll resource consents.
Alliance Group Limited - Mataura Processing PlantAssessment of Environmental Effects

3.
4.
5.
7.
9.
6.
The site at which the proposed activity is to occur is as follows:
The Motouro Plont ond infrostructure ore locoted on the true right bonk of the Matouro
River, within the Motouro township.
Mop reference: NZMS 260 F46:911384
Legol description: Lots 1-2 DP12431 Lot 1 DP 125OO Blk Xlll Motouro TN
The full name and address of each owner or occupier (other than the applicant) of the
site to which the application relates are as follows:
The Allionce Group Limited is the owner ond occupier of the lond ossocioted with the
Motouro Plont.
The bed of the Motouro River is Crown Lond.
The value of the investment of the existing consent holder is considerable. The latest
estimate (December 2O18) for the Mataura plant's insured value is $225 million and
much of this value is sunk - i.e. it could not be recovered if the plant was forced todownsize, close or be relocated.
There are no other activities that are part of the proposal to which this application
relates.
No additional resource consents are needed for the proposal to which this application
relates.
I attach an assessment of the proposed activity's effect on the environment that-
(a) includes the information required by clause 6 of Schedule 4 of the Resource
Management Act 1991; and
(bl addresses the matters specified in clause 7 of Schedule 4 of the Resource
Management Act 1991; and
(cl includes such detai! as corresponds with the scale and significance of the effects
that the activity may have on the environment.
I attach an assessment of the proposed activity against the matters set out in Part 2 ofthe Resource Management Act 1991.
Alliance Group Limited - Mataura Processing PlantAssessment of Environmental Effects
8.
ro. ! attach an assessment of the proposed activity against any relevant provisions of a
document referred to in section 1O4(1Xb) of the Resource Management Act 1991,
including the information required by clause 2l2l ot Schedule 4 of that Act.
Signature:
Doyle Richardson
Group Environmenta! Manager
Date:31 May 2019
Electronic address for Service: Doyl e. Richa rdson@a I I ia n ce.co. n z
Telephone: +6427 537 815
Posta! address: PO Box 845, lnvercargill 9840, New Zealand
Contact person: Doyle Richardson
Alliance Group Limited - Mataura Processing PlantAssessment of Environmental Effects
PART B
Assessment of Environmenta I
Effects
1. INTRODUCTION
l.l ovERvtEw oF THE ACTIVITY
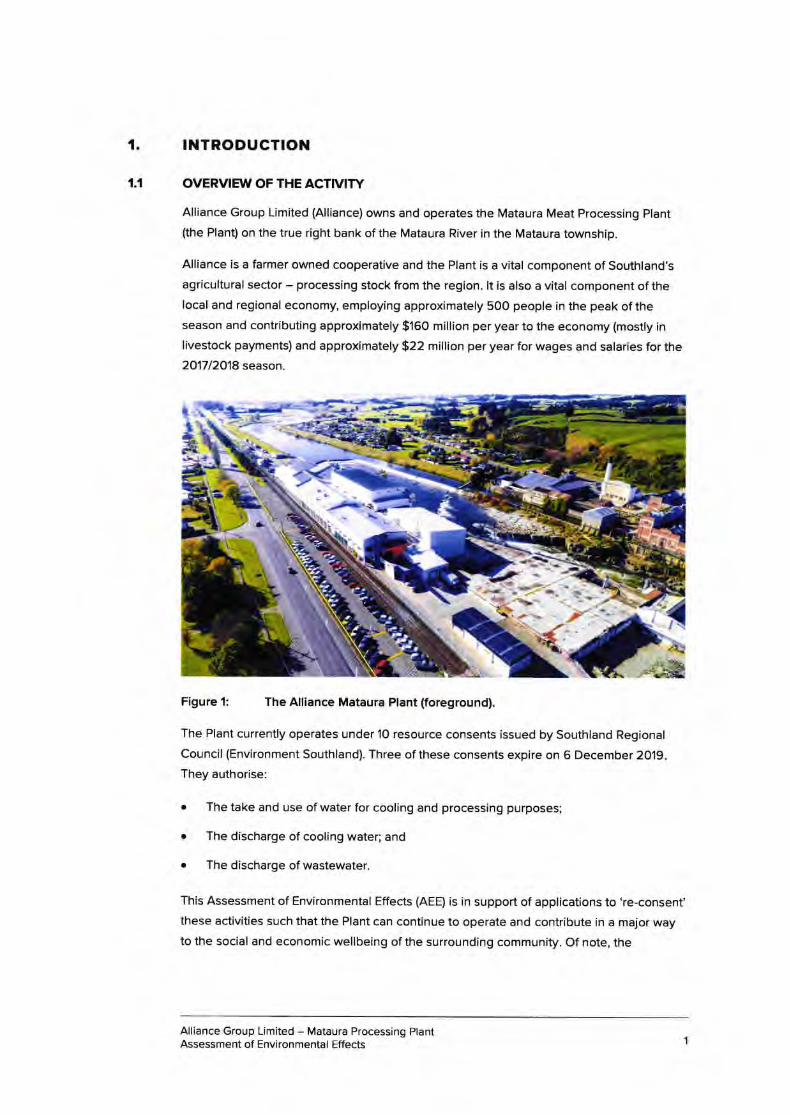
Alliance Group Limited (Alliance) owns and operates the Mataura Meat Processing Plant
(the Plant) on the true right bank of the Mataura River in the Mataura township.
Alliance is a farmer owned cooperative and the Plant is a vital component of Southland's
agricultural sector - processing stock from the region. lt is also a vital component of the
local and regional economy, employing approximately 500 people in the peak of the
season and contributing approximately $160 million per year to the economy (mostly in
livestock payments) and approximately $22 million per year for wages and salaries for the
2017l2O1A season.
Figure 1: The Alliance Mataura Plant (foreground).
The Plant currently operates under 10 resource consents issued by Southland Regional
Council (Environment Southland). Three of these consents expire on 6 December 2019
They authorise:
The take and use of water for cooling and processing purposes;
The discharge of cooling water; and
The discharge of wastewater.
This Assessment of Environmental Effects (AEE) is in support of applications to 're-consent'
these activities such that the Plant can continue to operate and contribute in a major way
to the social and economic wellbeing of the surrounding community. Of note, the
Alliance Group Limited - Mataura Processing PlantAssessment of Environ menta I Effects
a
a
proposed conditions require a substantial staged upgrade of the Plant's wastewater
treatment plant to improve the quality of the Plant's discharge to the Mataura River, and a
reduction in water use. These will be significant capital investments and will add significant
annual costs to the wastewater plant's operation.
Alliance is seeking a 35-year consent term for all replacement consents being sought.
Suitably recognising the value of Alliance's significant existing investment in the Plant, and
the future investment which it has committed to via the proposed wastewater treatment
plant upgrade, is vital in this context. And it is important to acknowledge that the additional
capital investment involved in the wastewater treatment plant upgrades is contingent on
securing a long consent term in order to enable those upgrades to be progressively
implemented and the financial investment to be justified and secured over an appropriate
timeframe. A long consent term also suitably reflects the significant social and economic
benefits this Plant provides in the local area and gives greater certainty those benefits will
endure.
The discharge to air permit for the site also expires shortly - in December 2O2O.
Applications to replace that resource consent will be made separately, probably in the first
half of 2020.
The Plant is specifically provided for in the Gore District Plan and industrial activities are
permitted on the site. No consents are needed or being sought from the District Council.
.1.2 REPORT STRUCTURE
This AEE addresses all of the matters Alliance is required to address in these consent
applications by Schedule 4 of the Resource Management Act (RMA or the Act). lt is set out
in 14 sections as follows:
Section 1 ls this introduction.
Section 2 Provides background information on Alliance and its environmental
management systems.
Sedion 3 Describes the existing environment for the proposed activities
Section 4 Provides a description of the activities for which consent is sought.
Section 5 Sets out the activity status of the resource consents sought and the scope
of the relevant matters when considering the applications.
Section 6 Assesses the social and economic effects of granting the consents sought
and enabling the Plant to continue to operate.
Section 7 Assesses the actual and potential effects of the abstraction of water on the
environment.
Alliance Group Limited - Mataura Processing PlantAssessment of Environ menta I Effects 2
Section 8 Assesses the actual and potential effects of the discharge of wastewater
and cooling water on the environment.
Section 9 Provides a summary of the measures proposed by Alliance to avoid,
remedy or mitigate any actual or potential effects on the environment, and
proposed monitoring.
Section'lO Provides an overview of how alternative means of undertaking the
proposed discharge activities have been considered and why the proposed
discharge aclivities are considered to be the best praclicable option.
Section 11 Describes the consultation undertaken in respect of these resource
consent applications.
Section 12 ls an assessment of the key directives in the relevant planning documents,
and how the proposed activities sit in relation to them.
Section 13 Sets out the RMA statutory framework which applies to resource consent
applications and assesses the proposal against those provisions.
Section 14 ls a concluding comment.
Various technical assessments have been commissioned by Alliance to support this AEE.
They are appended to this AEE and are referenced throughout this document as
necessary.
Alliance Group Limited - Mataura Processing PlantAssessment of Environmenta I Effects 3
2.1
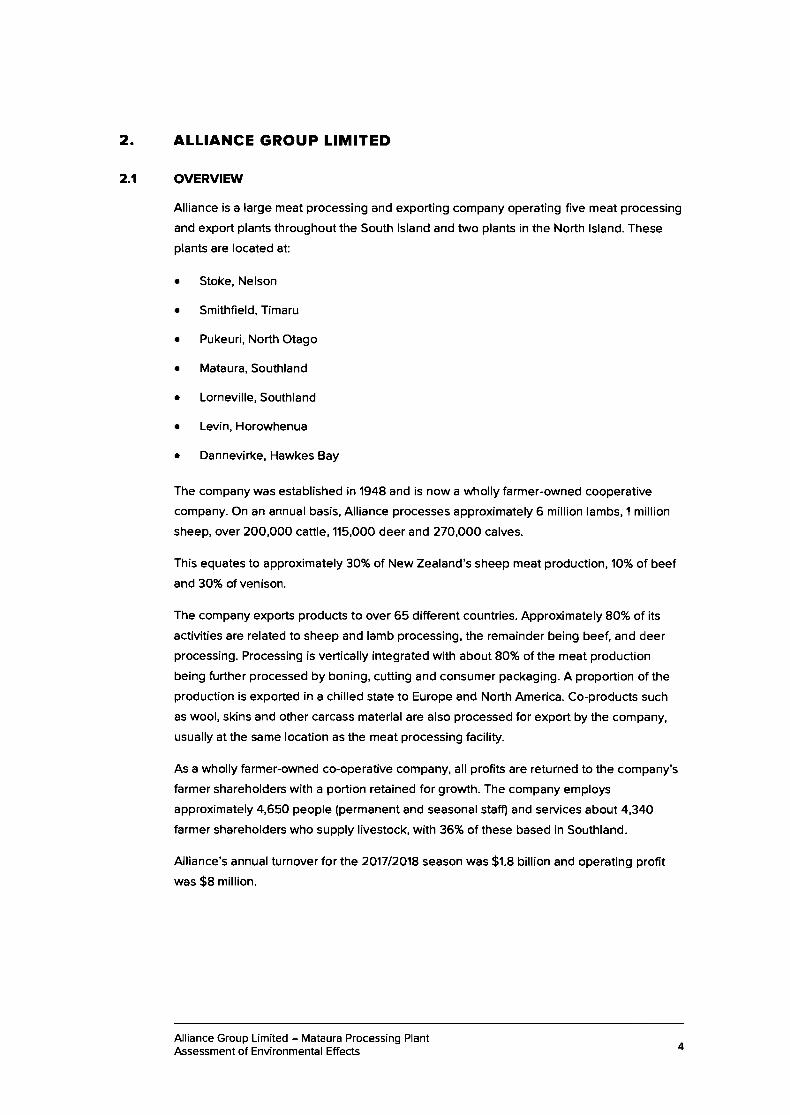
2. ALLIANCE GROUP LIMITED
ovERvtEw
Alliance is a large meat processing and exporting company operating flve meat processing
and export plants throughout the South lsland and two plants in the North lsland. These
plants are located at:
o Stoke, Nelson
o Smithfleld, Timaru
o Pukeuri, North Otago
o Mataura, Southland
o Lorneville,Southland
o Levin, Horowhenua
o Dannevirke, Hawkes Bay
The company was established in 1948 and is now a wholly farmer-owned cooperative
company. On an annual basis, Alliance processes approximately 6 million lambs, 1 million
sheep, over 200,000 cattle,115,O0O deer and 270,000 calves.
This equates to approximately 30% of New Zealand's sheep meat production, 10% of beef
and 30% of venison.
The company exports products to over 65 different countries. Approximately 80% of its
activities are related to sheep and lamb processing, the remainder being beef, and deer
processing. Processing is vertically integrated with about 80% of the meat production
being further processed by boning, cuting and consumer packaging. A proportion of the
production is exported in a chilled state to Europe and North America. Co-products such
as wool, skins and other carcass material are also processed for export by the company,
usually at the same location as the meat processing facility.
As a wholly farmer-owned co-operative company, all profits are returned to the company's
farmer shareholders with a portion retained for growth. The company employs
approximately 4,650 people (permanent and seasonal staff) and services about 4,340
farmer shareholders who supply livestock, with 36% of these based in Southland.
Alliance's annual turnover for the 201712018 season was $1.8 billion and operating profit
was $8 million.
Alliance Group Limited - Mataura Processing PlantAssessment of Environmenta I Effects 4
2.2 ALLIANCE'S ENVIRONMENTAL POLICY AND ENVIRONMENTAL MANAGEMENT
SYSTEMS
Alliance is committed to the sustainable management of the natural and physical
resources that it depends on. Alliance therefore adheres to the following environmental
policy:
Allionce Group Ltd is committed to the susto,noble monogement of the noturol ondphysicol resources which it depends on. ln meeting this commitment, Allionce Group
will olign itself with opplicoble New Zeolond ond internotionol stondords ond will
toke oll procticoble steps to.'
meet or exceed internol ond key stokeholder expectotions ond relevontre g u I oto ry re q u i re m e nts ;
continuolly improve environmentol performonce by identifying ond meosuringimpocts, developing cleor objectives ond meoningful torgets, ond meosuringprogress with effective monitoring;
optimise the use of oll resources including energy, woter, pockoging ondchemicols, to minimise the wostes produced ond the overoll impod of ouroperotions;
onnuolly review the odequocy of the environmentol monogement progromme
ond progress towords ochieving environmentol objedives ond torgets;
communicote regulorly on environmentol motters with stokeholders including
shoreholders, employees, customers, suppliers, communities ond regulototybodies;
ollocote oppropriote resources to enoble effective environmentol monogement.
Alliance holds ISO 14OO1:2015 environmental management systems certifications, as well
as numerous quality certifications including ISO 9001:2015. ISO'14001 is an internationally
recognised environmental management standard. As part of this system, all environmental
aspects and impacts of Alliance's plants are identified and prioritised for action, and
processes are put in place to control these aspects. Targets and objectives are
established and monitored to enable demonstration of continuous performance and
improvements are driven by internal audits and management reviews.
Alliance employs a Group Environmental Manager who has authority and responsibility to
co-ordinate and implement the on-site environmental management systems in conjunction
with site Environmental Managers or Environmental Representatives. The Group
Environmental Manager is also responsible for ensuring that all the necessary regulatory
consents and approvals are held and are current, and that compliance with all conditions
of the consents held is being achieved. The board of directors of Alliance receive and
review on a monthly basis a report on environmental performance matters including
environmental compliance. Alliance also engages expert environmental advisors.
Alliance Group Limited - Mataura Processing PlantAssessment of Environmental Effects
a
a
a
a
a
5
3. THE EXISTING ENVIRONMENT
3.1 LOCATTON
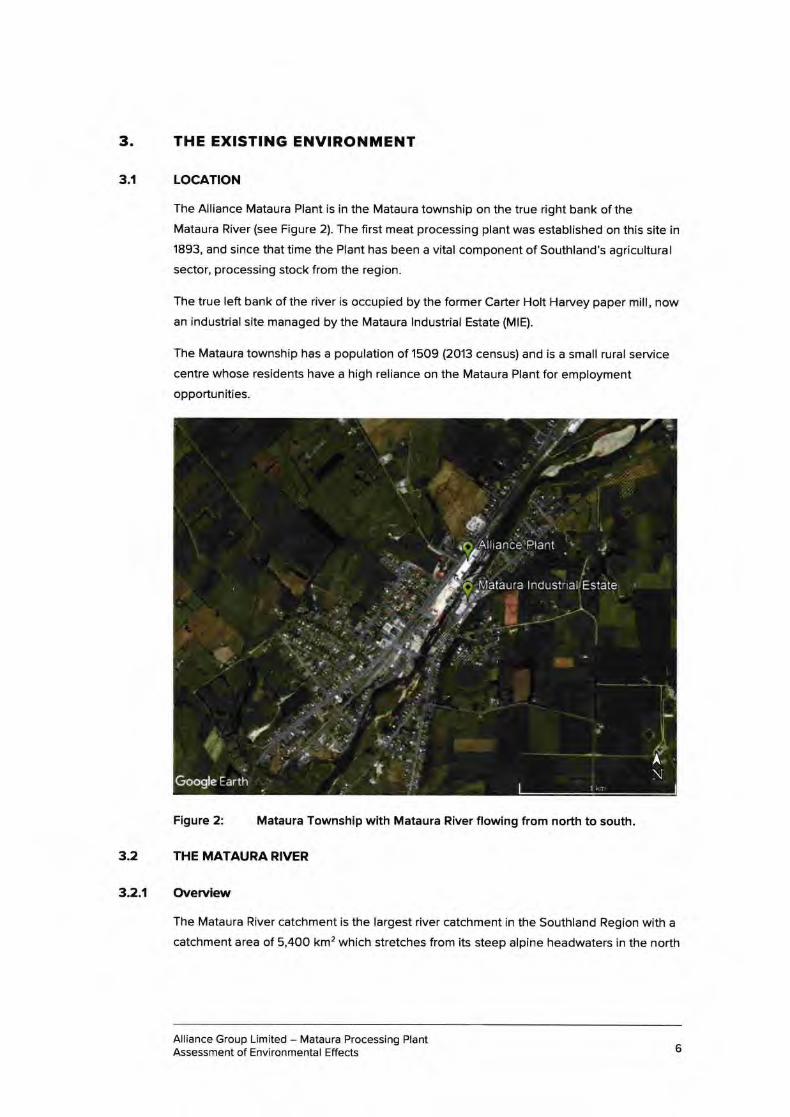
The Alliance Mataura Plant is in the Mataura township on the true right bank of the
Mataura River (see Figure 2). The first meat processing plant was established on this site in
1893, and since that time the Plant has been a vital component of Southland's agricultural
sector, processing stock from the region.
The true left bank of the river is occupied by the former Carter Holt Harvey paper mill, now
an industrial site managed by the Mataura lndustrial Estate (MlE).
The Mataura township has a population of 1509 (2013 census) and is a small rural seruice
centre whose residents have a high reliance on the Mataura Plant for employment
opportunities.
Figure 2: Mataura Township with Mataura River flowlng from north to south.
3.2 THE MATAURARIVER
&erview
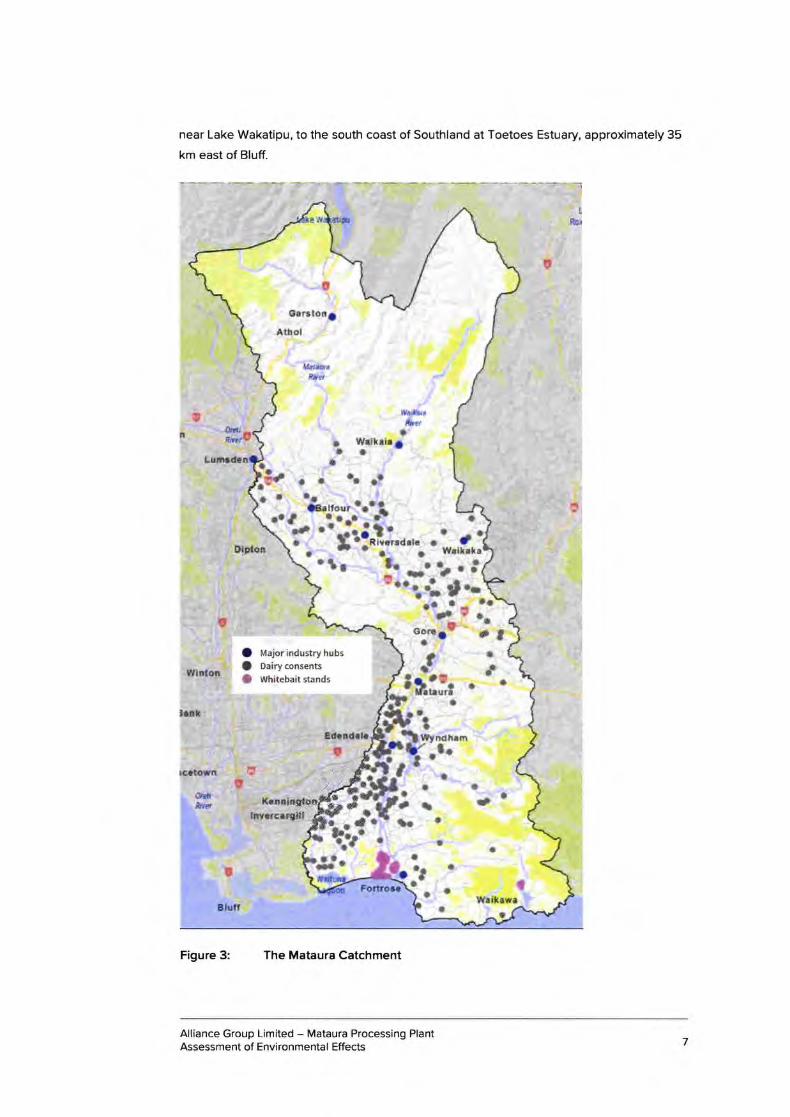
The Mataura River catchment is the largest river catchment in the Southland Region with a
catchment area of 5,4O0 km2 which stretches from its steep alpine headwaters in the north
Alliance Group Limited - Mataura Processing PlantAssessment of Envi ronmenta I Effects
3.2.1
6
O mahrinaustrytrubs! DiryconsenrO rfr*ebaitstands
t,
near Lake Wakatipu, to the south coast of Southland at Toetoes Estuary, approximately 35
km east of Bluff.
Figure 3: The Mataura Catchment
Alliance Group Limited - Mataura Processing PlantAssessment of Environmental Effects 7
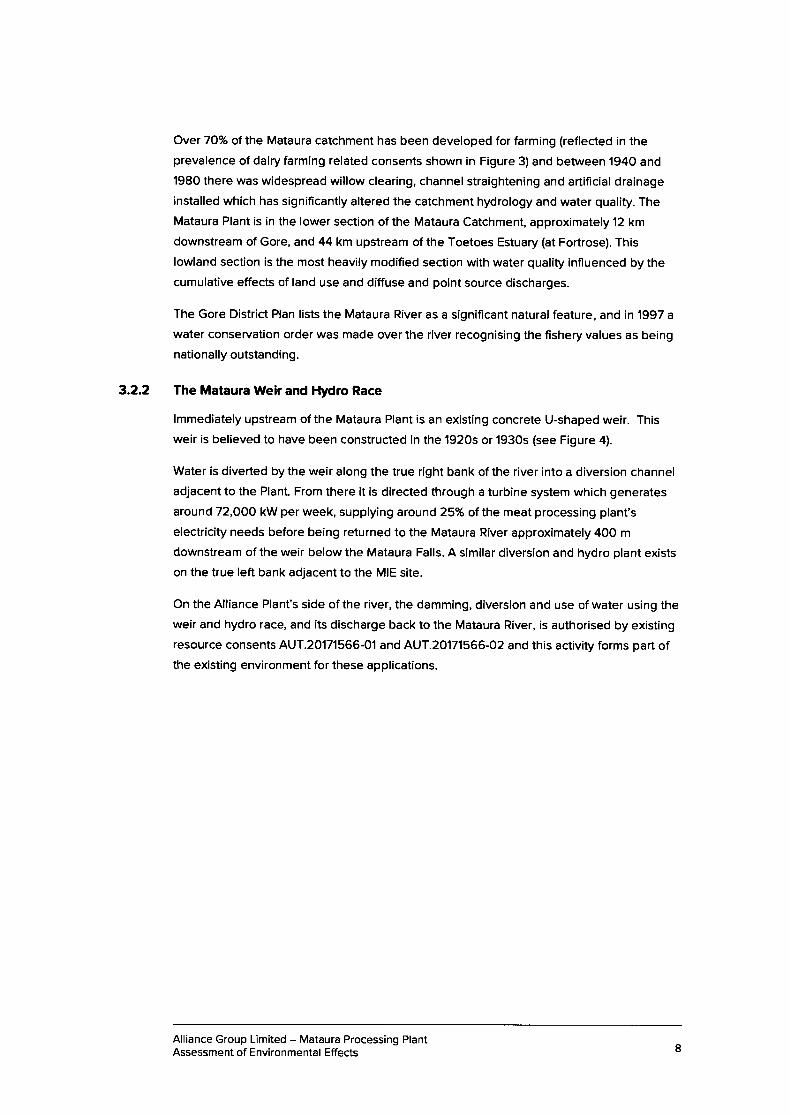
Over 7O7" of the Mataura catchment has been developed for farming (reflected in theprevalence of dairy farming related consents shown in Figure 3) and between 1940 and
1980 there was widespread willow clearing, channel straightening and artiflcial drainage
installed which has significantly altered the catchment hydrology and water quality. The
Mataura Plant is in the lower section of the Mataura Catchment, approximately 12 km
downstream of Gore, and 44 km upstream of the Toetoes Estuary (at Fortrose). This
lowland section is the most heavily modified section with water quality influenced by the
cumulative effects of land use and diffuse and point source discharges.
The Gore District Plan lists the Mataura River as a significant natural feature, and in 1997 a
water conservation order was made over the river recognising the fishery values as being
nationally outstanding.
3.2.2 The Mataura Weir and Hydro Race
lmmediately upstream of the Mataura Plant is an existing concrete U-shaped weir. This
weir is believed to have been constructed in the 192Os or 1930s (see Figure 4).
Water is diverted by the weir along the true right bank of the river into a diversion channel
adjacent to the Plant. From there it is directed through a turbine system which generates
around 72,OOO kW per week, supplying around 25% of the meat processing plant's
electricity needs before being returned to the Mataura River approximately 40O m
downstream of the weir below the Mataura Falls. A similar diversion and hydro plant exists
on the true left bank adjacent to the MIE site.
On the Alliance Plant's side of the river, the damming, diversion and use of water using the
weir and hydro race, and its discharge back to the Mataura River, is authorised by existing
resource consents AUT.20171565-O1 and AUT.2O17'1566-02 and this activity forms part ofthe existing environment for these applications.
Alliance Group Limited - Mataura Processing PlantAssessment of Environmental Effects 8
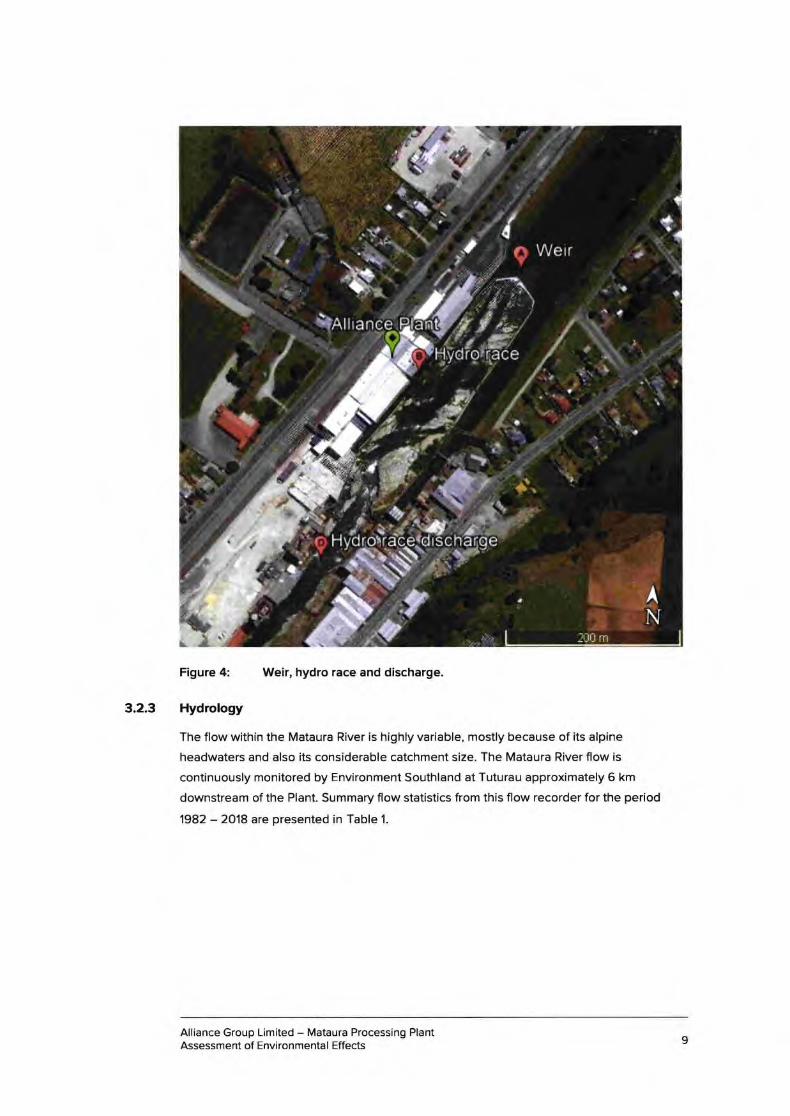
Figure 4: Weir, hydro race and discharge.
3.2.3 Hydrology
The flow within the Mataura River is highly variable, mostly because of its alpine
headwaters and also its considerable catchment size. The Mataura River flow is
continuously monitored by Environment Southland at Tuturau approximately 5 km
downstream of the Plant. Summary flow statistics from this flow recorder for the period
1982 - 2018 are presented in Table 1.
Alliance Group Limited - Mataura Processing PlantAssessment of Envi ronmenta I Effects 9
ValueStatistic
a
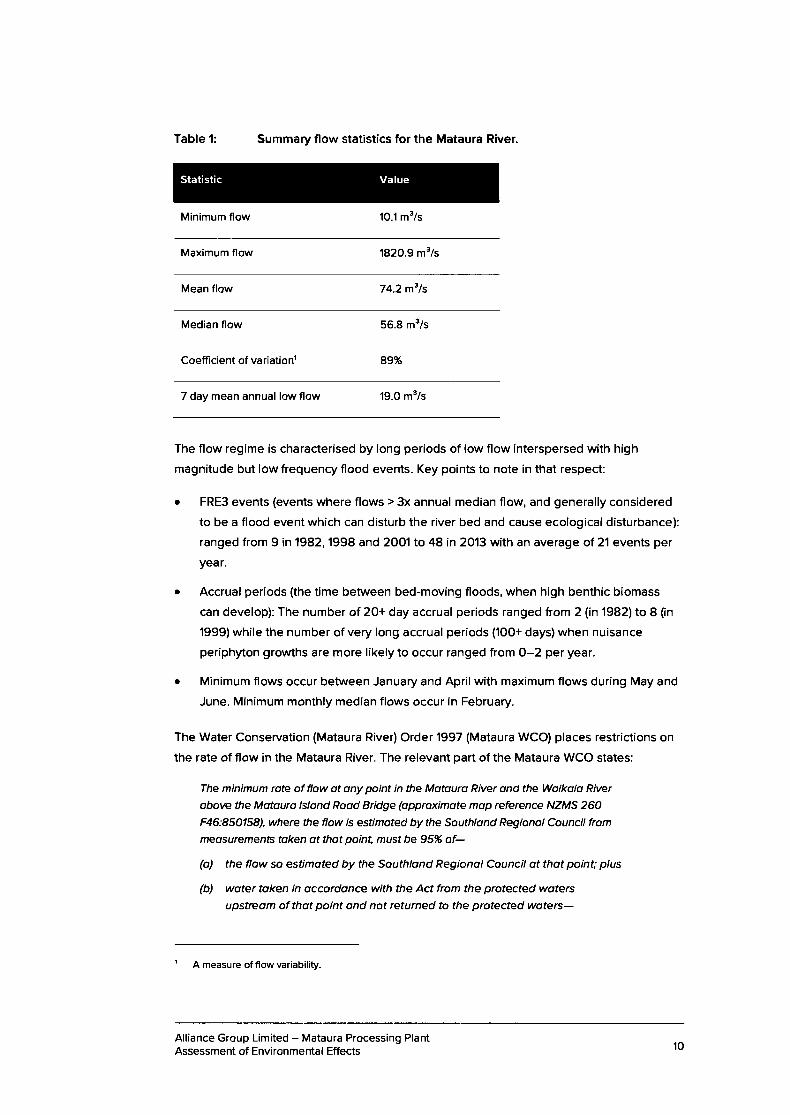
Table 1: Summary flow statistics for the Mataura River
Minimum flow '10.1 m3/s
Maximum flow 1820.9 m3/s
Mean flow 74.2 msls
Median flow 56.8 m3/s
Coefficient of variationt 89%
7 day mean annual low flow 19.o m3/s
The flow regime is characterised by long periods of low flow interspersed with high
magnitude but low frequency flood events. Key points to note in that respect:
FRE3 events (events where flows > 3x annual median flow, and generally considered
to be a flood event which can disturb the river bed and cause ecological disturbance):
ranged from 9 in '1982, 1998 and 2001 to 48 in 2013 with an average of 21 events per
year.
Accrual periods (the time between bed-moving floods, when high benthic biomass
can develop): The number of 20+ day accrual periods ranged from 2 (in 1982) to 8 (in
1999) while the number of very long accrual periods (1O0+ days) when nuisance
periphyton growths are more likely to occur ranged from 0-2 per year.
Minimum flows occur between January and April with maximum flows during May and
June. Minimum monthly median flows occur in February.
The Water Conservation (Mataura River) Order 1997 (Mataura WCO) places restrictions on
the rate of flow in the Mataura River. The relevant part of the Mataura WCO states:
The minimum rote of flow ot ony point in the Motouro River ond the Woikoio River
obove the Motouro lslond Rood Bridge (opproximote mop reference NZMS 260F46:850158), where the flow is estimoted by the Southlond Regionol Council from
meosurements token ot thot point, must be 95% of-
(o) the flow so estimoted by the Southlond Regionol Council ot thot point; plus
(b) woter token in occordonce with the Act from the protected wotersupstreom of thot point ond not returned to the protected woters-
A measure of flow variability
Alliance Group Limited - Mataura Processing PlantAssessment of Envi ronmental Effects
't0
/ess outl,o,sed inflows upstreom of thot point which did not hove their source in theprotected woters.
3.2.4 Water Quality
Surface water quality in the Mataura catchment has undergone significant changes over
the past 30 years. Point-source discharges and associated effects (Biological Oxygen
Demand (BOD), ammoniacal nitrogen (Amm-N) and dissolved oxygen (DO)) in the lower
catchment were a major issue in the 1970's (as shown in Figure 3, there are several
industry hubs in the catchment), but improvements to the quality of wastewater discharges
have significantly reduced these effects. However, over the corresponding period, an
increase in contaminants (particularly nutrients) associated with the intensiflcation ofagricultural land use has occurred across much of the catchment.2
The surface water quality monitoring data that Alliance has obtained generally supports
these findings. lt shows water quality in the vicinity of Mataura is characterised by:
Water temperature (between 2.3-23.2"C) and DO levels (>6 g/m3) suitable for
protecting river ecosystem health;
Variable visual clarity (0.07m - 3.29m).
Nitrate and Amm-N concentrations which meet National Policy Statement for
Freshwater Management 2014 (Freshwater NPS) Attribute State A or B for toxicity, but
which exceed the relevant ANZECC (2000) 'physical and chemical stressor'trigger
values which relate to nuisance plant growth;
Nutrient indicators (e.9. Dissolved lnorganic Nitrogen (DlN) and Dissolved Reaclive
Phosphorus (DRP)) which regularly exceed the Ministry for the Environment
periphyton guideline for protecting benthic biodiversity; and
Very high E coli concentrations which mean the Mataura River sits in the Red
Freshwater NPS Attribute State lor E.coli.
However, while water quality is clearly degraded for some parameters, water quality
monitoring data collected by Environment Southland does not suggest further
deterioration is occurring in this catchment in the vicinity of the Plant (refer to Table 2).
Motouro Cotchment Strotegic Woter Study, Report prepared for Environment Southland. May 2011. LiquidEarth Aqualinc Research Harris Consulting.
a
a
a
a
Alliance Group Limited - Mataura Processing PlantAssessment of Environmenta I Effects 11
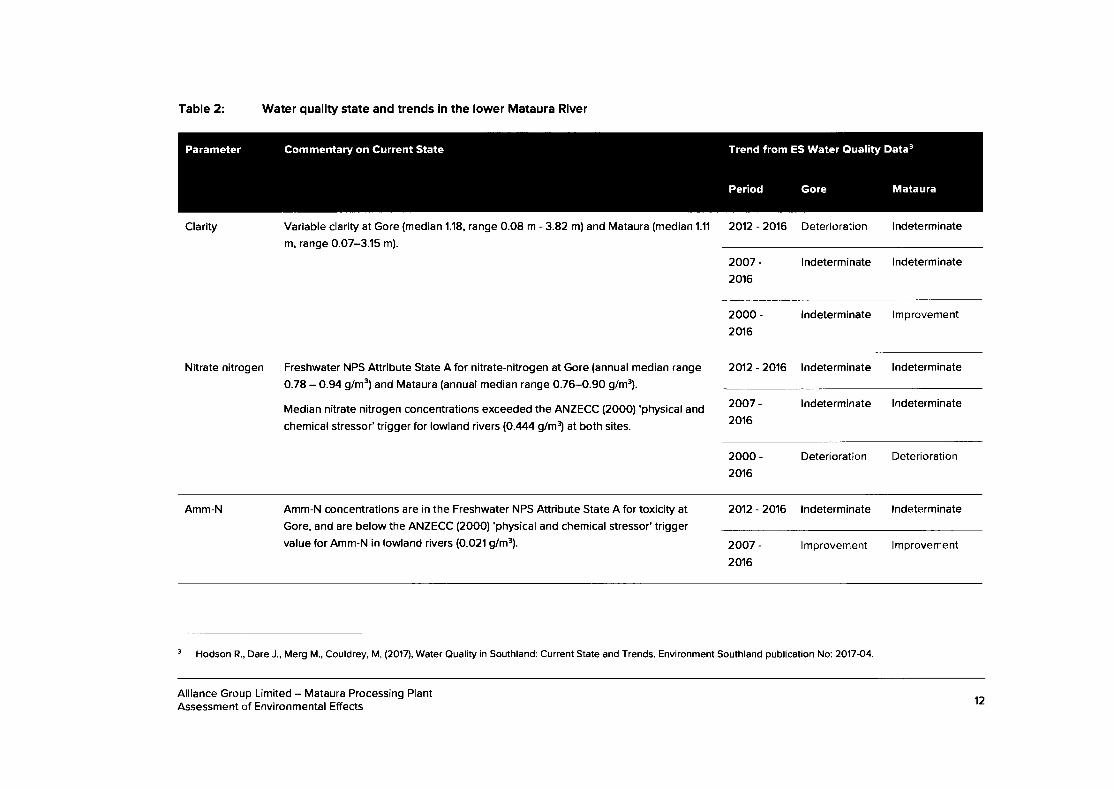
Table 2: Water quality state and trends in the lower Mataura River
Clarity Variable clarity at Gore (median 1.18, range O.O8 m - 3.82 m) and Mataura (median 1.11
m, range O.O7-3.15 m).
20'12 - 2016 Deterioration lndeterminate
2007 -
2016
lndeterminate lndeterminate
2000 -
2016
lndeterminate lmprovement
Commentary on Current State Trend from ES Water Quality Data3
Mataura
Parametel
Period Gore
Nitrate nitrogen Freshwater NPS Attribute State A for nitrate-nitrogen at Gore (annual median range
0.78 - O.94 g/m3) and Mataura (annual median range 0.76-0.90 g/m3).
Median nitrate nitrogen concentrations exceeded the ANZECC (2OOO) 'physical and
chemical stressor'trigger for lowland rivers (0.444 g/m3) at both sites.
20'12 - 2016 lndeterminate lndeterminate
2007 -
20't6
lndeterminate lndeterminate
2000 -2016
Deterioration Deterioration
Amm-N Amm-N concentrations are in the Freshwater NPS Attribute State A for toxicity at
Gore, and are below the ANZECC (2OOO) 'physical and chemical stressor'triggervalue for Amm-N in lowland rivers (0.O21 g/m3).
2012-2016 lndeterminate lndeterminate
2007 -
2016
lmprovement lmprovement
Hodson R., Dare J., Merg M., Couldrey, M.{'2014, Water Quality in Southland: Current State and Trends. Environment Southland publication No: 2O17-O4.
Alliance Group Limited - Mataura Processing PlantAssessment of Environmental Effects 12
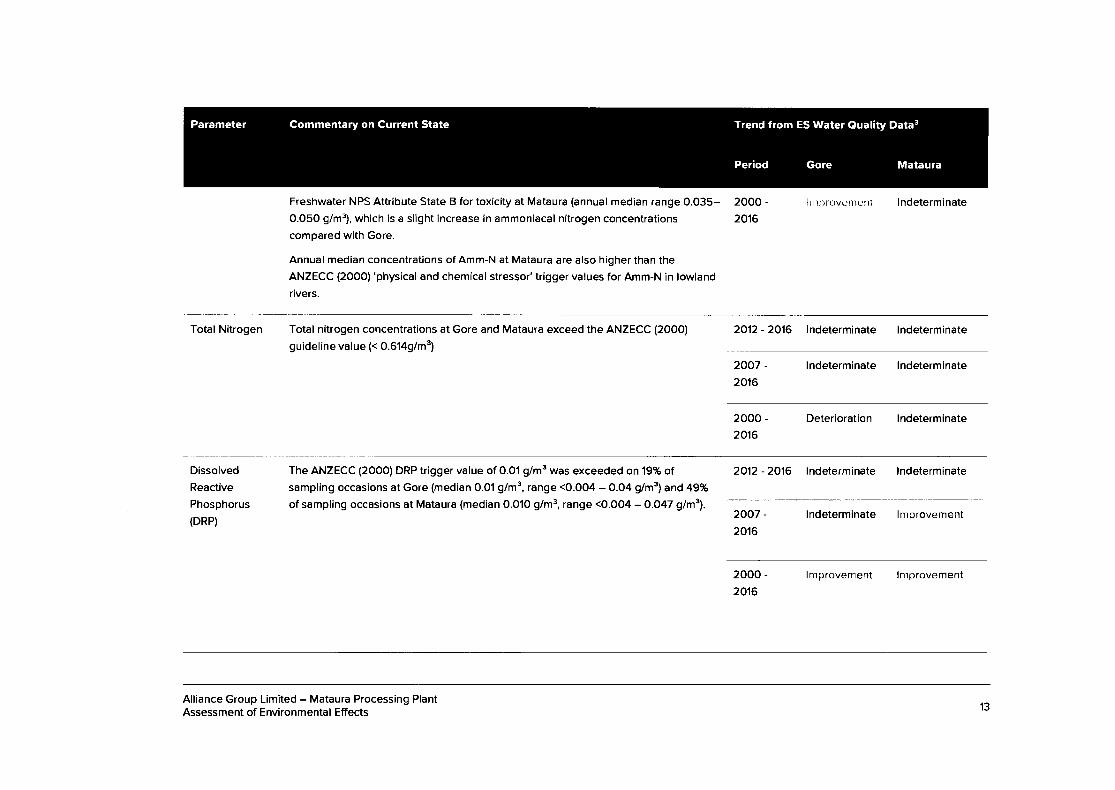
Commentary on Current State Trend from ES Water Gluality Data3Parametel
Period Gore Mataura
Freshwater NPS Attribute State B for toxicity at Mataura (annual median range 0.035-O.O5O g/m3), which is a slight increase in ammoniacal nitrogen concentrations
compared with Gore.
Annual median concentrations of Amm-N at Mataura are also higher than the
ANZECC (2OOO) 'physical and chemical stressor'trigger values for Amm-N in lowland
rivers.
2000 -2016
lnlprovcnre,rl lndeterminate
Total Nitrogen Total nitrogen concentrations at Gore and Mataura exceed the ANZECC (2OOO)
guideline value (< 0.6149/m3)
2012 - 20'16 lndeterminate lndeterminate
2007 -
2016
lndeterminate lndeterminate
2000 -
2016
Deterioration lndeterminate
Dissolved
Reactive
Phosphorus
(DRP)
The ANZECC (2OOO) DRP trigger value of O.O1 g/m3 was exceeded on '19% ofsampling occasions at Gore (median 0.01 g/m3, range <O.OO4 - O.O4 g/m3) and 49%
of sampling occasions at Mataura (median 0.010 g/m3, range <O.OO4 - O.O47 glm3l.
20'12 - 2016 lndeterminate lndeterminate
2007 -
2016
lndeterminate lmprovement
2000 -
2016
lmprovement lnrprovement
Alliance Group Limited - Mataura Processing PlantAssessment of Environmental Effects 13
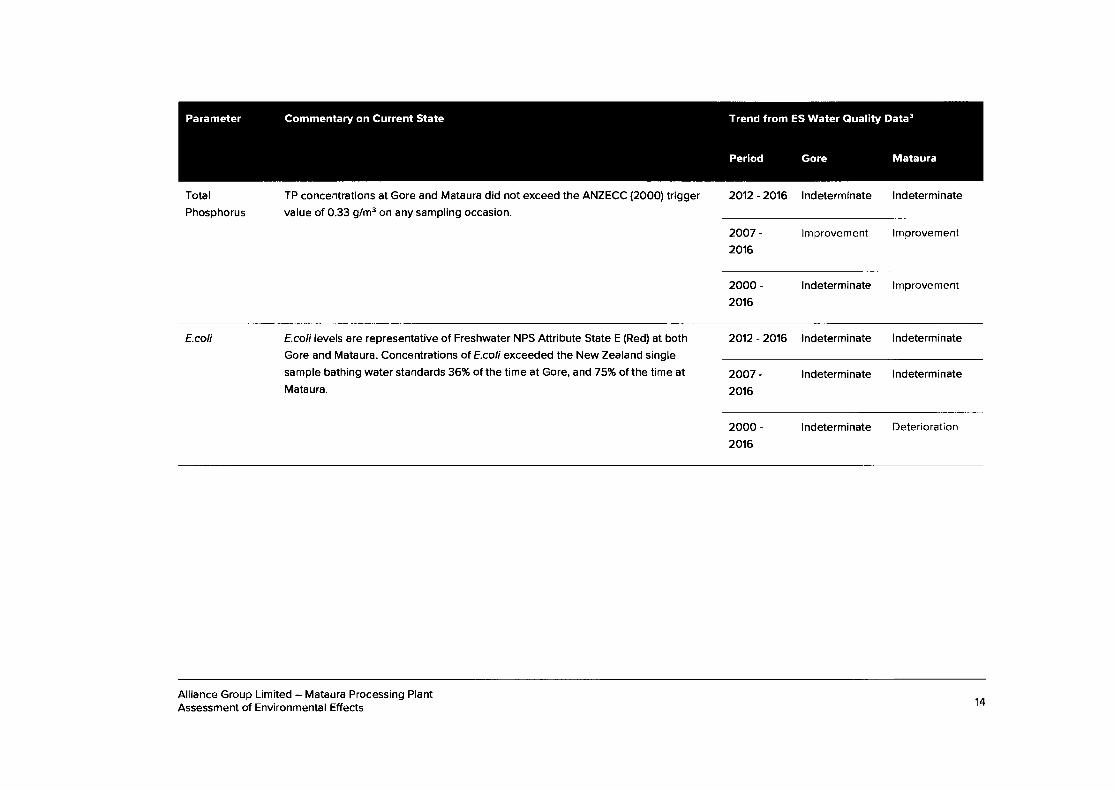
Parameter Commentary on Current State Trend from ES Water Gluality Data3
MatauraPeriod Gore
Total
Phosphorus
TP concentrations at Gore and Mataura did not exceed the ANZECC (2OOO) trigger
value of 0.33 g/m3 on any sampling occasion.
2012 - 2016 lndeterminate lndeterminate
2007 -
2016
lmprovement lmprovement
2000 -2016
lndeterminate lmprovement
E.coli Ecoli levels are representative of Freshwater NPS Attribute State E (Red) at both
Gore and Mataura. Concentrations of E.coli exceeded the New Zealand single
sample bathing water standards 36% of the time at Gore, and 75% of the time at
Mataura.
2012 - 2016 lndeterminate lndeterminate
2007 -
2016
lndeterminate lndeterminate
2000 -
2016
lndeterminate Deterioration
Alliance Group Limited - Mataura Processing PlantAssessment of Environmental Effects 14
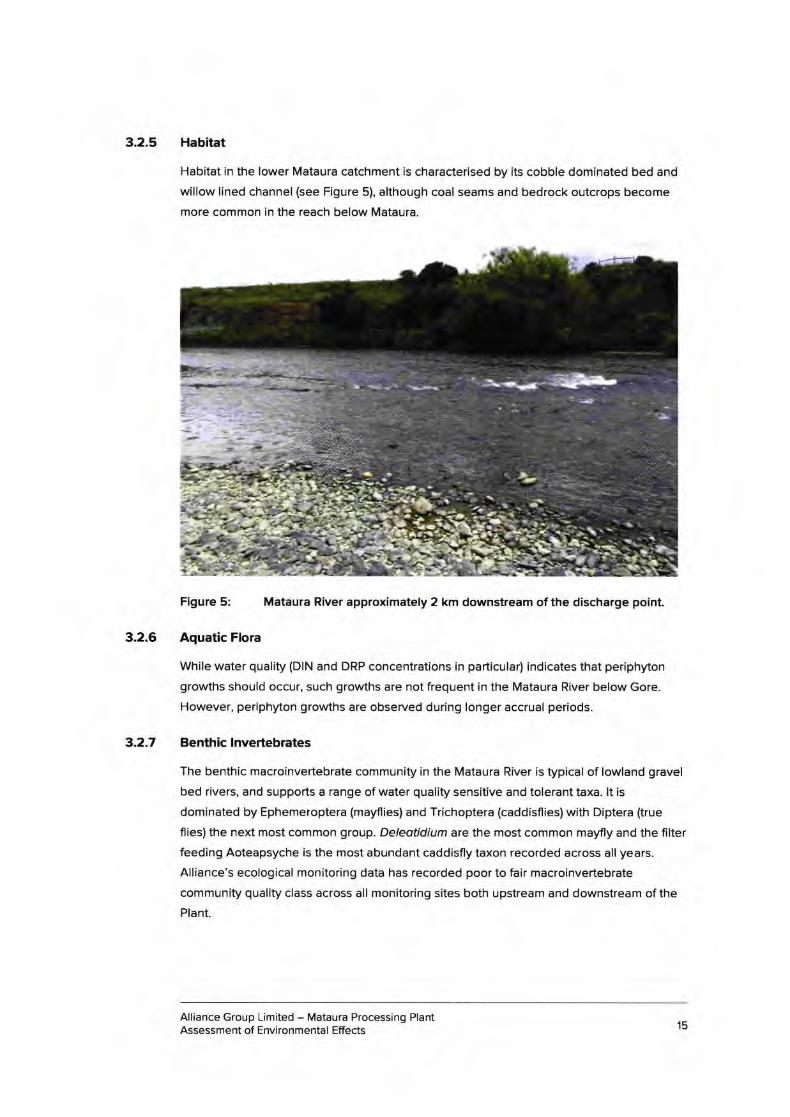
3.2.5 Habitat
Habitat in the lower Mataura catchment is characterised by its cobble dominated bed and
willow lined channel (see Figure 5), although coal seams and bedrock outcrops become
more common in the reach below Mataura.
Figure 5: Mataura River approximately 2 km downstream of the discharge point
3.2.6 Aquatic Flora
While water quality (DlN and DRP concentrations in particular) indicates that periphyton
growths should occur, such growths are not frequent in the Mataura River below Gore.
However, periphyton growths are observed during longer accrual periods.
3.2.7 Benthic lnvertebrates
The benthic macroinvertebrate community in the Mataura River is typical of lowland gravel
bed rivers, and supports a range of water quality sensitive and tolerant taxa. lt is
dominated by Ephemeroptera (maflies) and Trichoptera (caddisflies) with Diptera (true
flies) the next most common group. Deleotidium are the most common mayfly and the filter
feeding Aoteapsyche is the most abundant caddisfly taxon recorded across all years.
Alliance's ecological monitoring data has recorded poor to fair macroinvertebrate
community quality class across all monitoring sites both upstream and downstream of the
Plant.
Alliance Group Limited - Mataura Processing PlantAssessment of Environmental Effects 15
When periphyton growths are observed during longer accrual periods, the
Macroinvertebrate Community lndex (MCl) score typically decreases.
3.2.8 Fish
The lower Mataura River supports moderate to high native flsh diversity (13 native fish have
been recorded) including eight species with an 'At Risk Declining' conservation status -
longfin eels, torrentflsh, lamprey, Gollum galaxias, galaxias southern, inanga, giant kokopu
and koaro.
3.2.9 RecreationalValues
The Mataura River is regarded as one of New Zealand's premier lowland brown trout
fisheries and is internationally recognised. The Mataura WCO recognises the importance
of the river from source to sea with its outstanding fisheries and angling amenity.
With respect to other recreational values, the Mataura River supports a very popular
whitebait fishery in its lower reaches and is subject to relatively high use for swimming
during the summer months, both up and downstream of Mataura. This includes a bathing
site in the vicinity of the Mataura Bridge approximately 100m downstream of the most
southern end of the Plant site.
The Mataura River's various riverbanks, berms, reserves and angler access points are also
used for a variety of terrestrial aclivities, mostly around settlements.
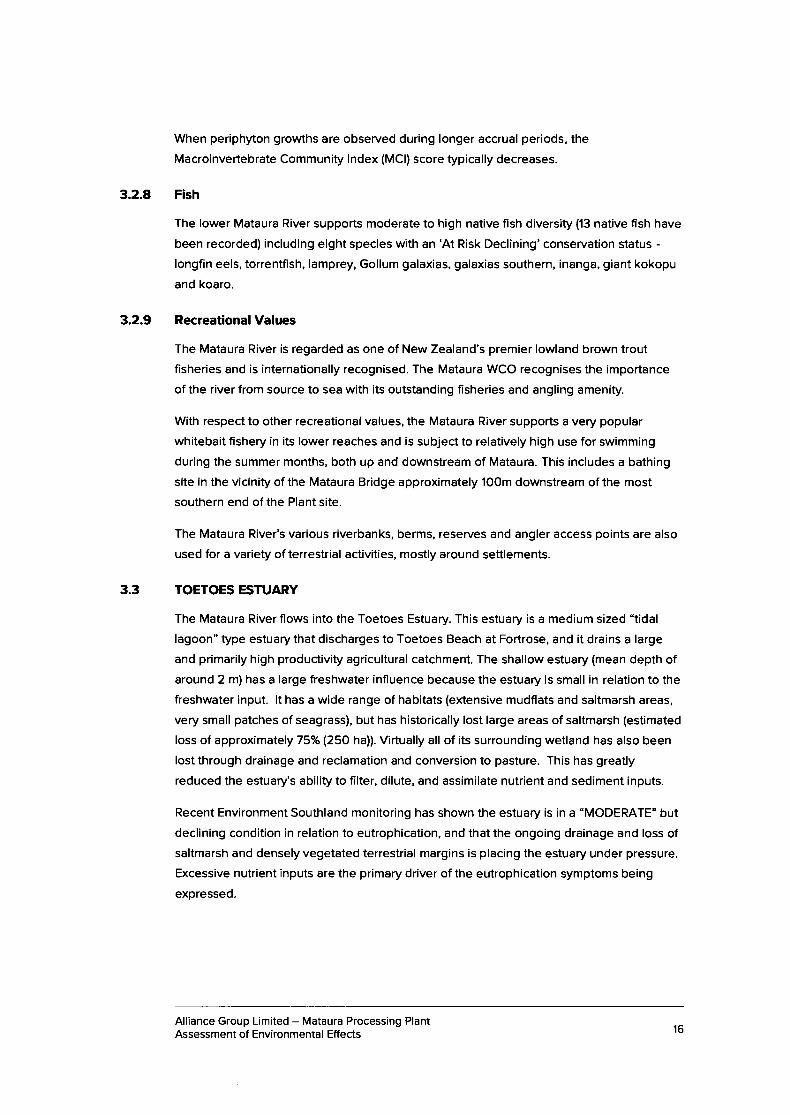
3.3 TOETOES ESTUARY
The Mataura River flows into the Toetoes Estuary. This estuary is a medium sized "tidal
lagoon" type estuary that discharges to Toetoes Beach at Fortrose, and it drains a large
and primarily high productivity agricultural catchment. The shallow estuary (mean depth of
around 2 m) has a large freshwater influence because the estuary is small in relation to the
freshwater input. lt has a wide range of habitats (extensive mudflats and saltmarsh areas,
very small patches of seagrass), but has historically lost large areas of saltmarsh (estimated
loss of approximately 75Vo (250 ha)). Virtually all of its surrounding wetland has also been
lost through drainage and reclamation and conversion to pasture. This has greatly
reduced the estuary's ability to filter, dilute, and assimilate nutrient and sediment inputs.
Recent Environment Southland monitoring has shown the estuary is in a "MODERATE" but
declining condition in relation to eutrophication, and that the ongoing drainage and loss of
saltmarsh and densely vegetated terrestrial margins is placing the estuary under pressure.
Excessive nutrient inputs are the primary driver of the eutrophication symptoms being
expressed.
Alliance Group Limited - Mataura Processing PlantAssessment of Environmental Effects 16
3.4 CULTURAL LANDSCAPE
lwi have a long association and a strong traditional relationship with the Mataura River. A
Statutory Acknowledgement exists for the Mataura River in Schedule 42 of lhe Ngai Tahu
Claims Settlement Ac1 1998. This Statutory Acknowledgement outlines Ngai Tahu's
association with the Mataura River. Above the Mataura Falls, the river was traditionally
used by the descendants of the Ngati Mamoe chief, Parapara Te Whenua, along with otherfamous tupuna. The Statutory Acknowledgement states that:
'The Motouro wos on importont mohingo koi, noted for its indigenous fishery. The
Motouro Folls were porticulorly ossocioted with the toking of konokono (lomprey).
The tupuno hod consideroble knowledge of whokopopo, troditionol troils ondtourongo woko, ploces for gothering koi ond other toongo, woys in which to use theresources of Motouro, the relotionship of people with the river ond their dependenceon it, ond tikongo for the proper ond sustoinoble utilisotion of resources. All of thesevolues remoin importont to Ngoi Tohu todoy.
The mouri of the Motouro represents the essence thot binds the phpicol ondspirituol elements of oll things together, generoting ond upholding oll life. All
e/ements of the noturol environment possess o life force, ond oll forms of life orereloted. Mouri is o criticol element of the spirituol relotionship of Ngoi Tohu Whonui
with the river."
The Mataura River is also subject to a Mdtaitai Reserve. This reserve status recognises the
importance of the river as providing a mahinga kai resource for Ngei Tahu Whiinui
because of its use as an access route between coastal Muruhiku (Southland) to Fiordland
and the West Coast for the gathering of pounamu. The Mataura was particularly noted for
the gathering of kanakana (lamprey) and tuna (eels), with annual fishing expeditions in
season to favoured nohoanga (campsites) along the river. The bylaw for the reserve
prohibits commercial fishing within the area. Customary fishing is permitted subject to
approval.
The takiwa of three nlnanga (Hokonui, WaihOpai and Awarua) extend across the area ofthe Mataura River catchment including the headwaters, main stem and coastal area. The
Plant itself is located within the takiwE of Hokonui RUnanga.
Alliance Group Limited - Mataura Processing PlantAssessment of Environmental Effects 17
4.
4.1
DESCRIPTION OF THE MATAURA PLANT AND ACTIVITIES
This section provides a description of the activities for which consent is sought. lt includes:
o A description of the Mataura Plant.
r A description of the proposed take and use of water for cooling and processing
purposes.
o A description of the cooling water discharge.
o A description of the wastewater discharge.
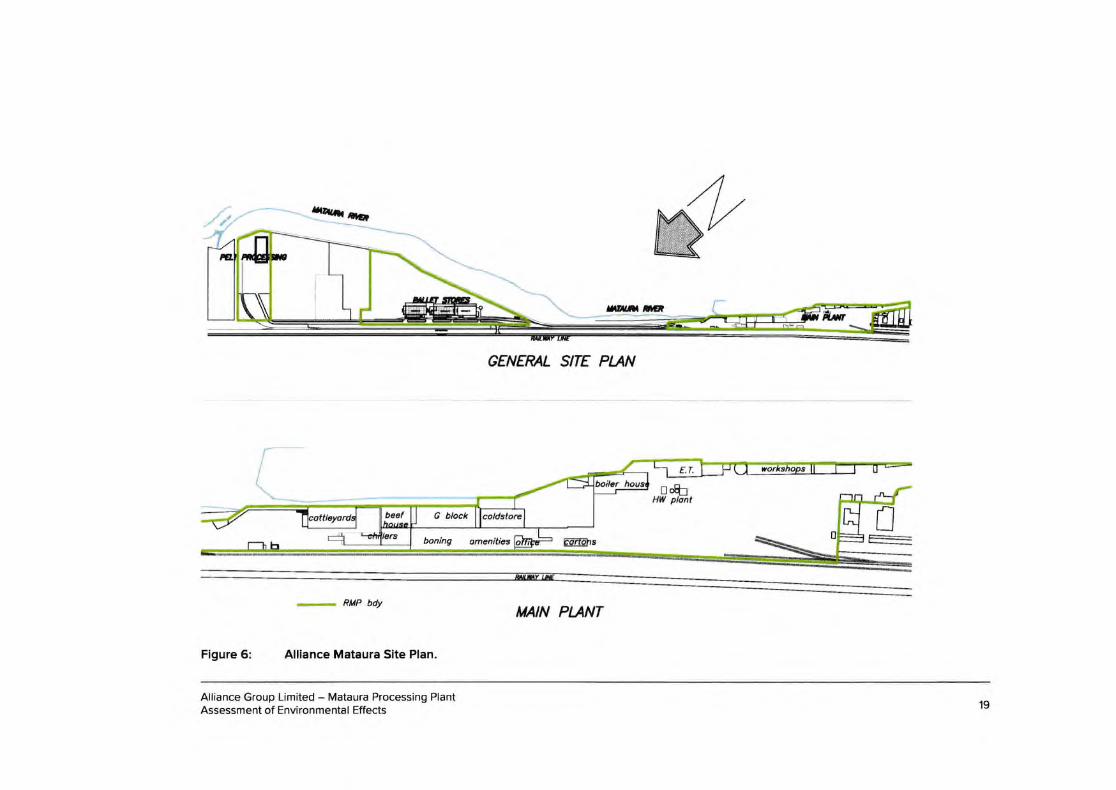
THE MATAURA PL/ANT
The Alliance Mataura Plant is located on the right bank of the Mataura River at the
nonhern end of Mataura Township (see Figure 2). A site plan is provided in Figure 6.
The Plant has historically processed up to 10,000 sheep per day and 560 beef animals per
day (with additional by-products processing including casings and rendering). ln 2012 the
processing of sheep and rendering ceased and beef production increased to up to '1,120
beef animals per day. For the foreseeable future, it is expected that the Mataura site will
continue to operate solely as a beef processing plant.
The Plant generally operates flve days per week, over almost 24 hours during peak
processing. Sunday processing has also been undertaken recently for mycoplasma bovis
infected stock culled by the Ministry for Primary lndustries. All processing of stock killed at
Mataura is carried out on-site, except for some transfer of soft offal and bones off-site for
further processing or rendering. Processed carcasses and meat cuts are refrigerated and
stored in large on-site chillers and freezers.
Stock are held in yards prior to slaughter. Cattle yards are located at the north end of the
site. Cleaning of the yards occurs regularly.
Alliance Group Limited - Mataura Processing PlantAssessment of Environmental Effects 18
T
- -- aterrr,ia
RMP Ny
Figure 5: Alliance Mataura Slte Plan.
OENEPd.L SITE PUN
EAFEhg
TIAIN PUNT
Wm
E{rHIY plont
:--
E.T,
bccf e Uock
bonlng omcnitics
Alliance Group Limited - Mataura Processing PlantAssessment of Environmental Effects 19
4.2 TAKE AND USE OF WATER
Abstraclion of water is essential for operations at the Plant. The existing consent
authorises the taking of up to 35,600 m3/day of water for freezing works supply. This is
made up ot
21,2OO m3/day for cooling water; and
14,4OO m3/day for processing water.
Alliance is of the view that all of the water taken is non-consumptive with the exception of
approximately 5% of the water taken for processing purposes and reserves its right in this
regard.
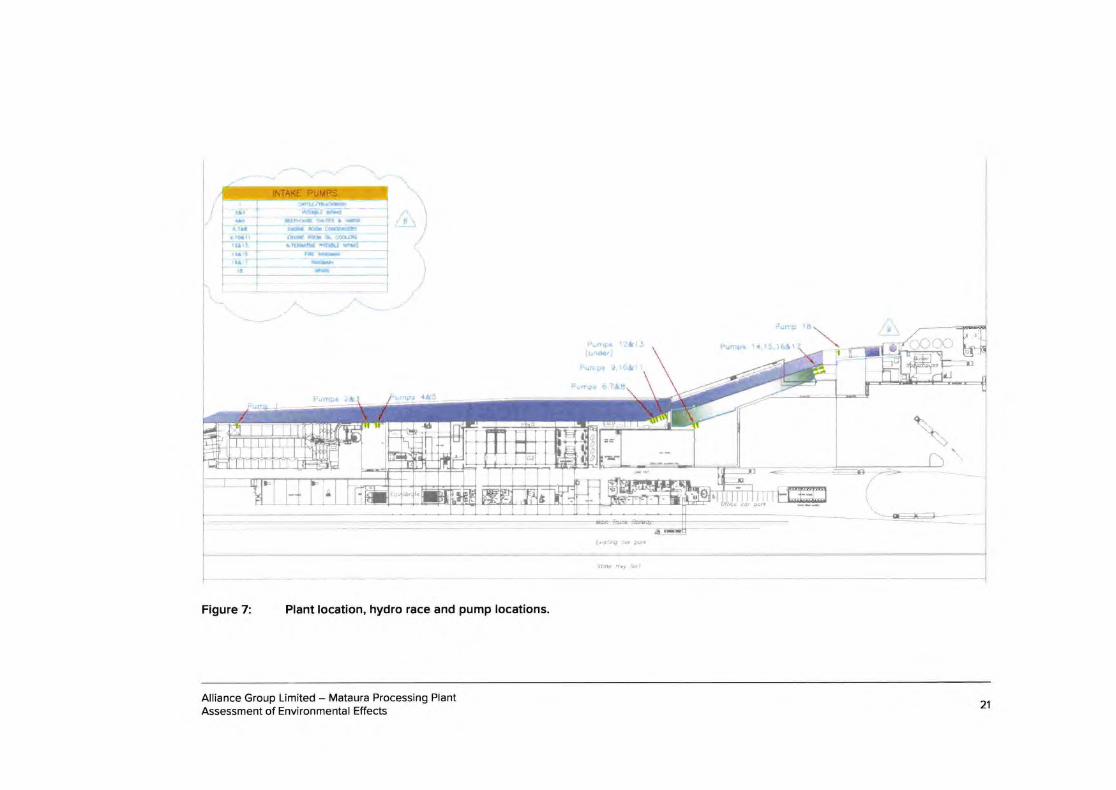
The water is taken using 18 intake pumps (see Figure 7). Six of these (pumps 6 - 11) supply
cooling water. The others supply process water.
Eleven of the intake pumps (No 1 - 11) are located in the hydro race and are screened with
an aperture size of 5 - 6 mm to prevent debris and fish from being drawn into the takes.
The remaining pumps (No. 12 - 18) are in a channel between the hydro race and the Plant.
Fish and debris are prevented from entering this channel by a passive screen which has a
bar spacing of 1.5 mm.
The existing consent was amended in May 2018 to require meters to be installed on all
intakes which abstract processing water. The taking of engine room condenser water and
engine room cooling water is not metered.
Since the processing of sheep and rendering ceased at the Plant, the amount of water
taken and used for processing purposes has reduced signiflcantly from the 14,4OO mt/day
provided for in the existing consent. This is reflected in the proposed conditions which
allow only 8,OOO m3/day of process water to be abstracted.
a
a
Alliance Group Limited - Mataura Processing PlantAssessment of Environmental Effects 20
ftrr.rd h{! a !*-I --' nia.-ar"rni;iix'r rr6F6a:@
r(EX q{ *rl
ij:r::::t,'&i3a ',i.13',
F.rrri: j.l{ra':
llLrlr l{,l'.. t.6 i
;*'.-tr i,?trmt. a* ,l&5
Flgure 7: Plant locatlon, hydro race and pump locatlons.
i r-;
J 'ren-I *-i II I t:3i13ir-.i
-'!.
Alliance Group Limited - Mataura Processing PlantAssessment of Environmental Effects
21
4.4.1
4.3 THE COOLING WATER DISCHARGE
The Plant contains large on-site chillers and freezers and the take, use and discharge ofwater from and to the hydro race adjacent to the Plant is essential to their operation.
The condenser cooling water pumps operate continuously because the demand for
refrigeration at the site is continuous. The estimated total condenser cooling water take is
21,2OO m3/day based on pump capacities. The cooling water system takes water from the
race, passes through the condensers once and then discharges water back into the hydro
race (see Figure 7).
There are water temperature monitoring requirements upstream and downstream of the
discharge.
4.4 THE WASTEWATER DISCHARGE
Synopsis
Two waste streams are generated on-site;
. green waste from the stockyards, gut cutting and tripe processing; and
. non-green wastes which are sourced from the slaughter floor, fufther processing and
hide wash overflow.
Wastewater from staff amenities is separated at source and discharged to the Gore District
Council wastewater system.
The wastewater treatment system at Mataura is designed to remove suspended solids,
including associated organic matter, oil and grease and some nitrogen and phosphorus
from the wastewater prior to its discharge. lt comprises preliminary treatment (screening),
primary treatment (settling) and physio-chemical treatment via a dissolved air floatation
(DAF) system of the wastewater prior to it being discharged to the Mataura River.
All solids are transported from site where they are composted by third parties, however
there is contingency for discharge to land, the Lorneville treatment plant, or landfill in the
event the material is not suitable for composting
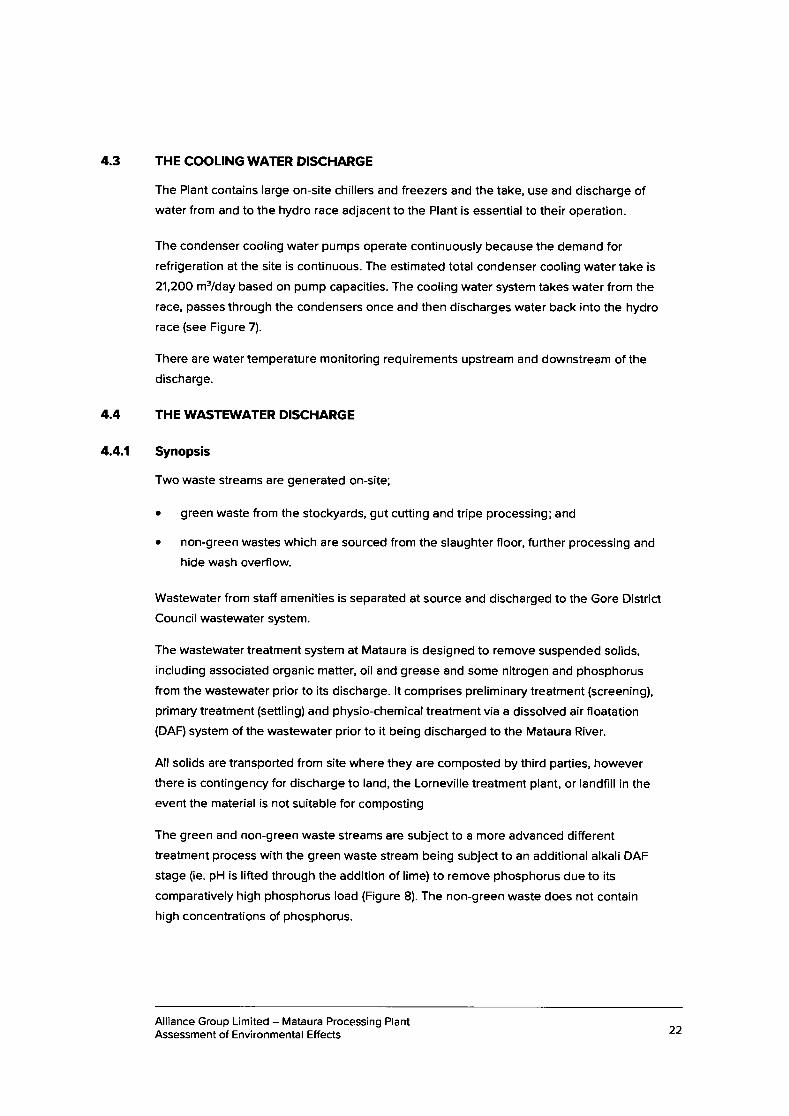
The green and non-green waste streams are subject to a more advanced different
treatment process with the green waste stream being subject to an additional alkali DAF
stage (ie. pH is lifted through the addition of lime) to remove phosphorus due to its
comparatively high phosphorus load (Figure 8). The non-green waste does not contain
high concentrations of phosphorus.
Alliance Group Limited - Mataura Processing PlantAssessment of Environmental Effects 22
9ilm
{d hn8
Arid tbrrn*
Figure 8: Existing wastewater treatment process at the Mataura Plant.
Treated wastewater is discharged through two 20O mm diameter pipes that exit the Plant
approximately 100 m below the hydro race discharge and drop approximately 10 m to the
river bed.
Ris Orrh:rge
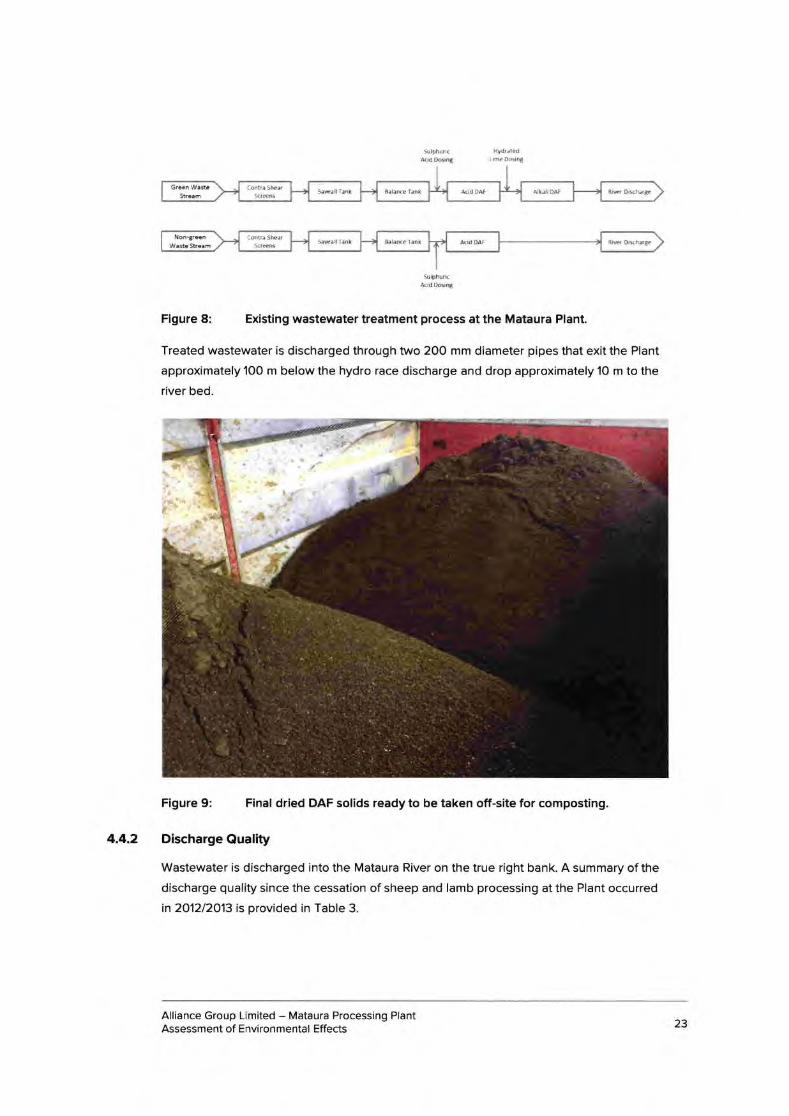
Figure 9: Final dried DAF solids ready to be taken off-site for composting
4.4.2 DischargeQuality
Wastewater is discharged into the Mataura River on the true right bank. A summary of the
discharge quality since the cessation of sheep and lamb processing at the Plant occurred
in 2012/2013 is provided in Table 3.
Alliance Group Limited - Mataura Processing PlantAssessment of Environmental Effects 23
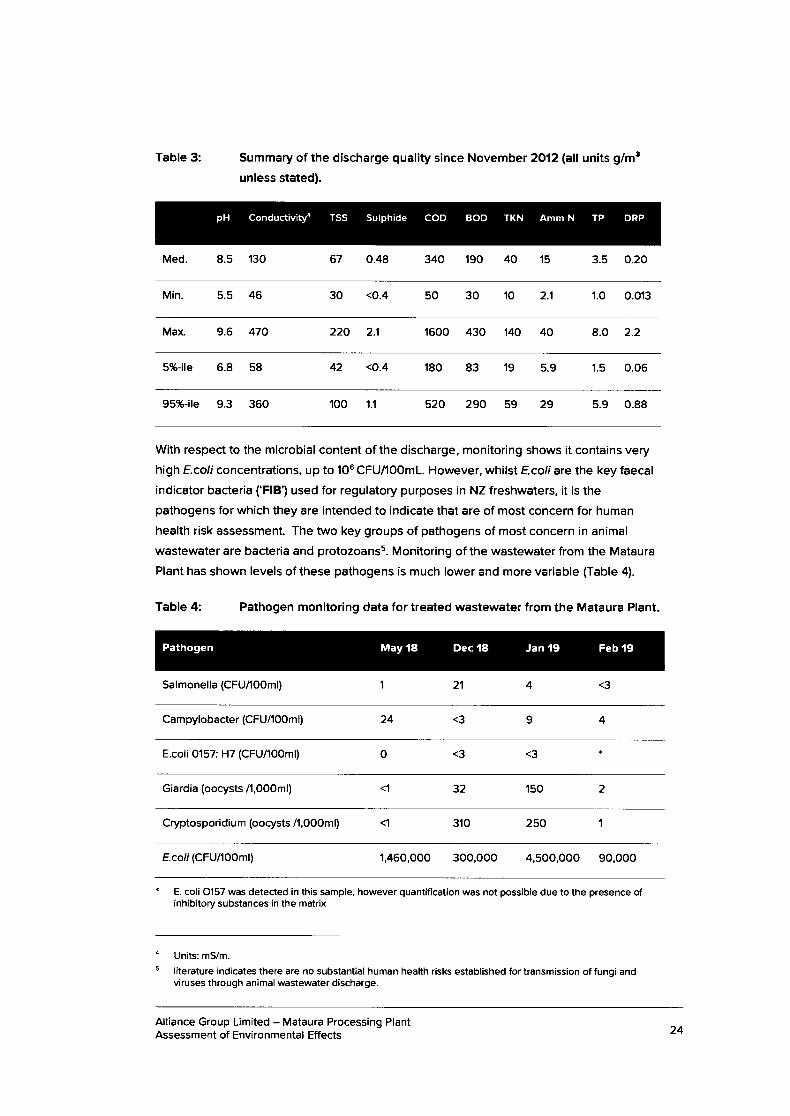
Table 3:
Med. 8.5 130
Summary of the discharge quality since November 2012 (all units g/m3
unless stated).
67 0.48 340 190 40 't5 3.5 0.20
pH Conductivif TSs Sutphide coD BoD TKN Amm-N TP DRP
Min 5.5 46 30 <0.4 50 30 10 2.1 1.0 0.013
Max. 9.6 47O 220 2.1 1500 430 140 40 8.0 2.2
S%{le 6.8 58 42 <O.4 180 83 't9 5.9 1.5 0.06
95%-ile 9.3 360 100 1.1 s20 290 59 29 5.9 0.88
With respect to the microbial content of the discharge, monitoring shows it contains very
high E coli concentrations, up to 106 CFU/100mL. However, whilst E coli are the key faecal
indicator bacteria ('FlB') used for regulatory purposes in NZ freshwaters, it is the
pathogens for which they are intended to indicate that are of most concern for human
health risk assessment. The two key groups of pathogens of most concern in animal
wastewater are bacteria and protozoanss. Monitoring of the wastewater from the Mataura
Plant has shown levels of these pathogens is much lower and more variable (Table 4).
Table 4: Pathogen monitoring data for treated wastewater from the Mataura Plant.
Salmonella (CFU/1OOml) 21 4 <3
Jan 19 Feb 19Pathogen May 18 Dec 18
Cam pylobacter (CFU/'IOOm l) 24 <3 9 4
E.coli 0157: H7 (CFU/100m1) o <3 <3
Giardia (oocysts /1,OOOml) <1 32 150 2
Cryptosporidium (oorysts /l,OOOml) <1 310 250
Ecoli (CFU/IOOml) 1,450,OOO 300,OOO 4,500,000 90,000
E. coli 0157 was detected in this sample, however quantification was not possible due to the presence ofinhibitory substances in the matrix
4 Units: ms/m.s literature indicates there are no substantial human health risks established for transmission of fungi and
viruses through animal wastewater discharge.
Alliance Group Limited - Mataura Processing PlantAssessment of Environmental Effects 24
4.5.r
4.5 RECENTAND PLANNED UPGRADES
Past Upgrade - Phosphorus Reduction
Since the existing resource consents were granted in 2OO4, Alliance has completed a
significant upgrade to its wastewater treatment plant to reduce phosphorus (particularly
DRP) concentrations in the discharge. The key elements of this upgrade were:
o lmproving separation of the high and low DRP waste streams entering the wastewater
treatment plant; and
o Modifications to the DAF plant, such that the waste stream with high DRP levels is now
subject to lime dosing and an additional alkali DAF stage to precipitate out the DRP.
4.5.2 Planned Upgrades
4.5.2.1 Year I - 3: lmplementing water reduction oppodunities and addressing existing
resilience issues.
Pattle Delamore Partners (PDP) has identified potential intermittent cross contamination
points between the green and non-green waste stream and potential failure points within
the reticulation system. To address these resilience issues, the following will be completed
in the first year of the new consent term:
Re-route all pipework that runs above or in the water race to a location that prevents
the risk of waste leaking into the water race or fresh water leaking into the treatment
system;
Re-route all pipework that runs above the river to a location that prevents the risk ofwaste leaking into the river;
Modifu the beef sump milli-screen overflow to prevent the risk of green waste
overflows into the non-green waste stream; and
Modify the stockyard and tripe rerycle area to prevent the risk of green waste
overflows into the non-green waste stream.
PDP has also identified scope to reduce the Plant's water use, and the volume of the
wastewater discharge by approximalely 377o by recycling white water within the
wastewater treatment plant, although there are issues relating to discharge quality that
need to be worked through, and which may mean this extent of reduction may not be able
to be realised prior to installation of the biological treatment system described in Section
4.5.2.3 below. The proposed conditions require Alliance to complete this process within
the first three years of the new consent term.
Alliance Group Limited - Mataura Processing PlantAssessment of Environmental Effects
a
a
a
25
4.5.2.2 Year 5: Tertiary Disinfection of Microbial Contaminants.
Within five years of the commencement of the new consent, Alliance proposes that any
wastewater discharged to the Mataura River is treated via a UV plant (or equivalent
disinfedion unit), in order to inactivate pathogens.
This upgrade is expected to incur capital costs of approximately $4.14 million, and
additional annual operational expenditure of $23O,O00.
Following installation of the treatment system the proposed conditions require the E coli
concentration in the discharged wastewater to not exceed an annual median of 1,0OO
CFU/1OOm| and 95th percentile of <10,00O CFU/1OOmL. This is a substantial reduction
relative to the concentrations set out above in Table 4.
4.5.2.3 Year 15: Biological Treatment System
By Year 15, Alliance proposes to install a full biological treatment system to treat the
Plant's wastewater. This system will reduce BOD, ammoniacal nitrogen and total nitrogen
loads.
Detailed design of the new biological treatment system will be completed closer to the
installation date. However, it is currently anticipated a large, lagoon based, biological
reactor will be installed. Due to the large lagoon size (approximately 8,500 m3), it will likely
be located 2 km away on land currently owned by Alliance Group Ltd, with wastewater
being pumped to the lagoon for treatment, and then back to the Plant for discharge via the
existing outfall.
The additional capital cost of installing tertiary disinfection of microbial contaminants and a
biological treatment system is signiflcant and estimated to be $13.98 million with annual
operating costs of $1.06 million.
Following installation of the biological treatment system, the discharge concentrations of
each parameter are expected to significantly reduce, and this is reflected in the allowable
concentrations in the proposed conditions following installation of the biological treatment
system (refer to Appendix 1).
More detail on these upgrades and the associated consent limits on discharge quality is
provided in Section 9.3 of this AEE.
Alliance Group Limited - Mataura Processing PlantAssessment of Environ menta I Effects 26
5 RESOURCE CONSENT REOUIREMENTS AND ASSESSMENT
MATTERS
There are currently two regional plans which contain rules relevant to the proposed
activity:
o The Operative Regional Water Plan for Southland (Operative Plan); and
o The Proposed Southland Water and Land Plan (Proposed Plan).
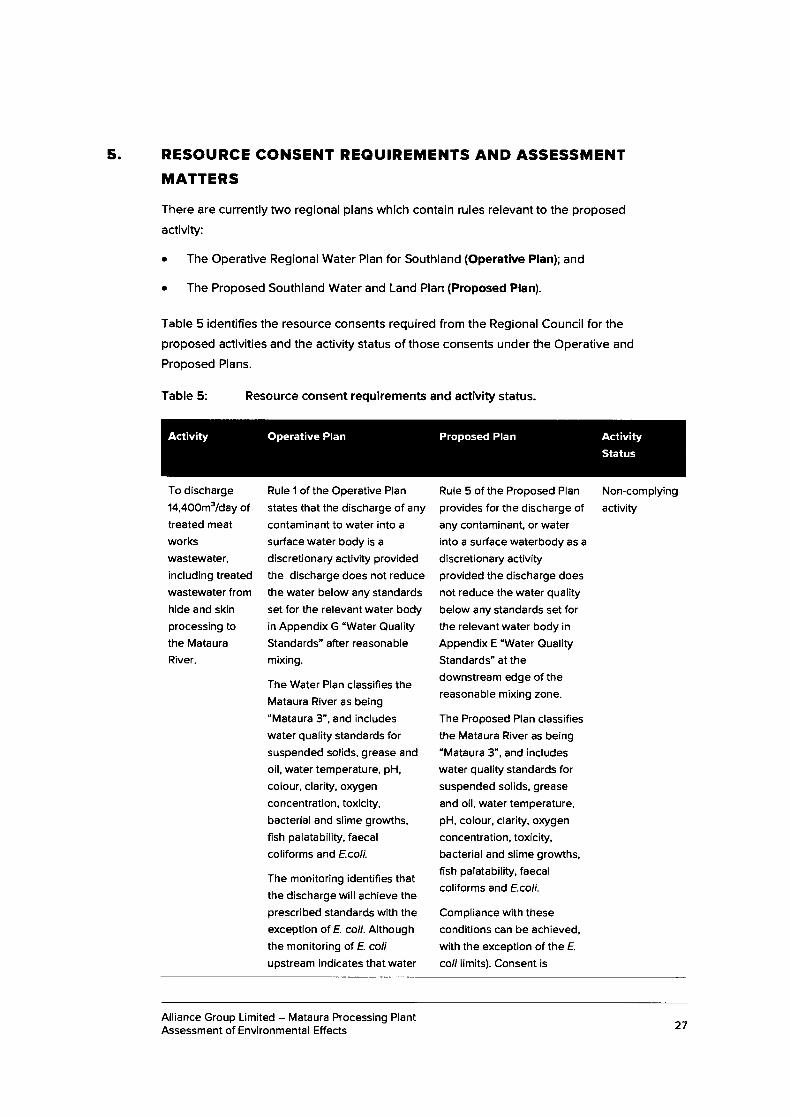
Table 5 identifles the resource consents required from the Regional Council for the
proposed activities and the activity status of those consents under the Operative and
Proposed Plans.
Table 5: Resource consent requirements and activity status.
To discharge'l4,4OOm3/day oftreated meat
works
wastewater,
including treated
wastewater from
hide and skin
processing to
the Mataura
River.
Rule 1 of the Operative Plan
states that the discharge of any
contaminant to water into a
surface water body is a
discretionary activity provided
the discharge does not reduce
the water below any standards
set for the relevant water body
in Appendix G "Water Quality
Standards" after reasonable
mixing.
The Water Plan classifies the
Mataura River as being
'Mataura 3", and includes
water quality standards forsuspended solids, grease and
oil, water temperature, pH,
colour, clarity, orygen
concentration, toxicity,
bacterial and slime growths,
fi sh palatability, faecal
coliforms and E.coli.
The monitoring identifies that
the discharge will achieve theprescribed standards with the
exception of E. coli. Although
the monitoring of E. coli
upstream indicates that water
Rule 5 of the Proposed Plan
provides for the discharge ofany contaminant, or water
into a surface waterbody as a
discretionary activityprovided the discharge does
not reduce the water quality
below any standards set for
the relevant water body in
Appendix E "Water Quality
Standards" at the
downstream edge ofthereasonable mixing zone.
The Proposed Plan classifies
the Mataura River as being
"Mataura 3", and includes
water quality standards forsuspended solids, grease
and oil, water temperature,pH, colour, clarity, orygenconcentration, toxicity,
bacterial and slime growths,
fish palatability, faecal
coliforms and E.coli.
Compliance with these
conditions can be achieved,
with the exception of the E.
co/i limits). Consent is
Non-complying
activity
ActivityStatus
Operative Plan Proposed PlanActivity
Alliance Group Limited - Mataura Processing PlantAssessment of Environmenta I Effects 27
ActivityStatus
Operative Plan Proposed PlanActivity
quality being received by thePlant can at times already
exceed the water quality
standard of 10OO E. coli per
1OOml, monitoring indicates
that it can be further affected
downstream of the dischargepoint, beyond the zone ofreasonable mixing. Further, as
set out in Table 4 above,
monitoring indicates that thekey human health risk
pathogens for which E. coli
acts as an indicator are at low
levels in the discharge.
Rule 2 provides that where a
discharge cannot meet the
conditions in Rule 1 it is a non-
complying activity.
therefore also required as a
non-complying activitypursuant to Rule 6 of the
Proposed Plan.
To discharge
condenser
cooling water
from freezing
works to the
Mataura River
The discharge of cooling water
into the hydro race is governed
by Rule 1 of the Water Plan.
The cooling water discharge
can comply with the limits set
out in Appendix G (refer above)
and therefore retains a
discretionary activity status.
The discharge of cooling
water is a discretionary
activity pursuant to Rule 5 ofthe Proposed Plan, due tocompliance with the waterquality standards set out in
Appendix E.
Discretionary
activity
To take water
from the hydro
race which is fed
by the Mataura
River for cooling
water purposes.
As outlined in Section 4.3,
cooling water is taken from
and discharged to the hydro
race.
Rule 18(d)(iii) provides that
where water is returned in thevicinity of the abstraction point,
it is a restricted discretionary
activity.
Rule 18(b)(ii) provides that the
taking of water is a restricted
discretionary activity where
the water is returned within
1OO metres of the take or
diversion point.
Restricted
discretionary.
To take water
from the hydro
race which is fed
by the Mataura
River meat
Approximately 14,4OOm3/s ofthe abstracted water is used
for meat processing and truck
wash activities. A large
proportion of this water is
The return point for theprocessing water is beyond'lOOm downstream of the
abstraction point. The take is
consistent with the flow
Discretionary.
28Alliance Group Limited - Mataura Processing PlantAssessment of Environmental Effects
Operative Plan Proposed PlanActivity ActivityStatus
processing and
truck wash
activities.
returned via the processing
discharge back to the Mataura
River, however as it is further
than 100m downstream oftheabstraction point, it is arguably"not within vicinity".
Rule 18(d) classifies the taking
and use ofwater from any
surface water body where the
total volume of water allocated
at any time is less than 10
percent ofthe mean annual
low flow at any downstream
point in the catchment as a
restricted discretiona ry activity.
Alliance understands that is
the case here.
regime and allocation
specified in the WCO and is
therefore assessed to be in
accordance with Rule 49(c)
as a discretionary activity.
Alliance Group Limited - Mataura Processing PlantAssessment of Environmental Effects 29
6. SOCIAL AND ECOMOMIC EFFECTS OF ALLOWING THE
ACTIVITIES
When considering these applications, the RMA requires the consent authority to have
regard to the actual and potential effects of allowing the activity, including positive effects
A detailed assessment of the economic benefits of the Plant continuing to operate has
been completed by Brown, Copeland & Co Ltd (the economic assessment). A copy of the
economic assessment is provided in Appendix 6 of this AEE.
The economic assessment has confirmed there are significant economic benefits accruing
from the Plant, and that it is an asset for the Gore District and Southland region. Obtaining
resource consents which allow the Plant to continue to operate would allow these benefits
to continue.
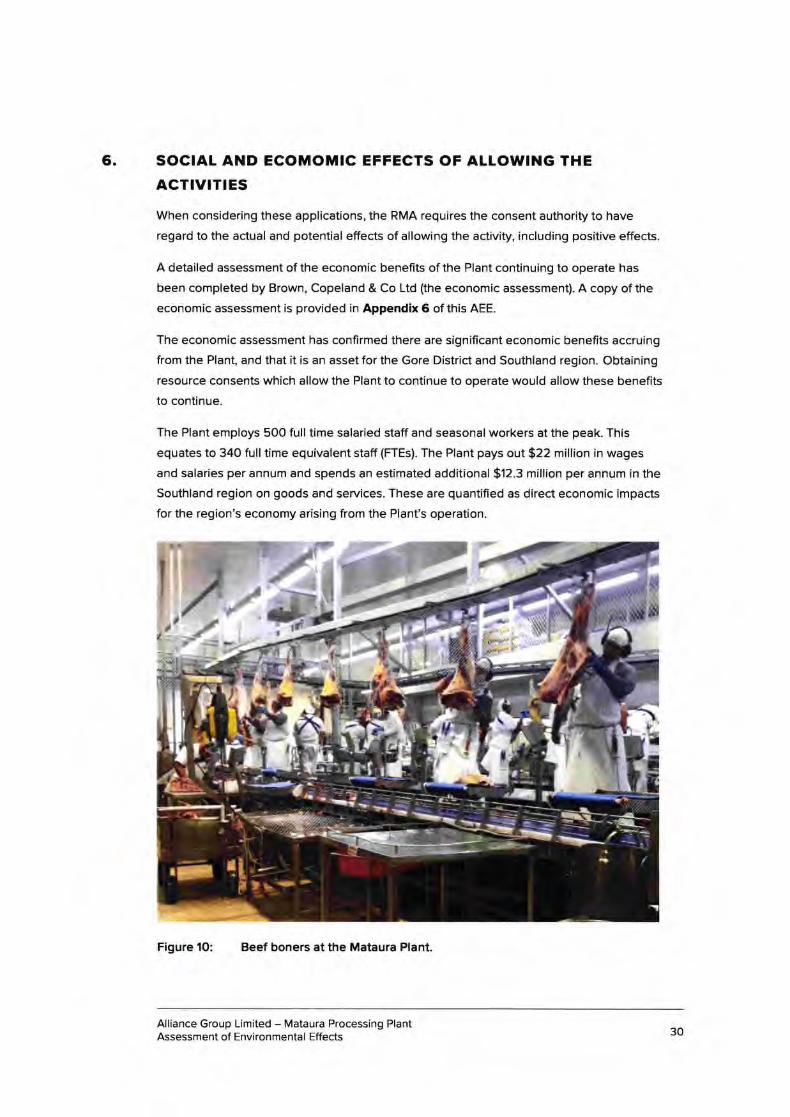
The Plant employs 500 full time salaried staff and seasonal workers at the peak. This
equates to 340 full time equivalent staff (FTES). The Plant pays out $22 million in wages
and salaries per annum and spends an estimated additional $12.3 million per annum in the
Southland region on goods and services. These are quantified as direct economic impacts
for the region's economy arising from the Plant's operation.
Figure 1O: Beef boners at the Mataura Plant.
Alliance Group Limited - Mataura Processing PlantAssessment of Envi ronmental Effects 30
a
ln addition, the economic assessment has identified a number of indirect impacls arising
from:
The effects on suppliers of goods and services provided to the Plant from within the
region (i.e. the "fonarard and backward linkage" effects); and
The supply of goods and services from within the region to employees at the Plant
and to those engaged in supplying goods and services to the Plant (i.e. the "induced"
effects). For example, there are additional jobs and incomes for employees of
supermarkets, restaurants and bars as a consequence of the additional expenditure
by employees directly employed at the Plant.
When these indirect effects are accounted for, the total contribution of the Plant's
operation is assessed to be 595 FTE jobs for Southland residents, and $38.5 million per
annum in wages and salaries for local Southland residents.
The economic assessment notes that the Mataura meat processing plant gives the Gore
District greater critical mass and, as a consequence, the residents and businesses within
the District benefit from economies of scale, greater competition, increased resource
utilisation and better central government provided services. This is also true for the
Southland region, although to a lesser eldent given the economic activity generated by the
Plant is proportionately less for the region as compared to the Gore District.
Continuation of the Plant at its current site, on a longer consent term (i.e. 35 years) also
generates a number of economic efficiency beneflts. The economic assessment identifies
these as including:
o the continued use of existing plant and equipment with an insured value of $225million (much of this value is sunk - i.e. it could not be recovered if the plant was
forced to downsize, close or be relocated);
o the minimisation of transport costs (and carbon footprint) due to the proximity of the
Plant to producers of livestock and finished product dispatch;
o the availability of a trained and experienced worKorce and businesses with
appropriate expertise and experience within close proximity of the PlanU and
r greater certainty for investment and management of the Plant.
lf the Plant were to cease operation and Southland farmers had to truck cattle out of the
region for processing, it would add to farmers' costs, reduce their disposable incomes and
reduce spending in the Gore District and elsewhere within the region.
Alliance also contributes directly to the economic and social wellbeing of the community
via its rates payments and other community contributions.
Alliance Group Limited - Mataura Processing PlantAssessment of Environmental Effects 31
7. EFFECTS OF ATLOWING THE ABSTRACTION
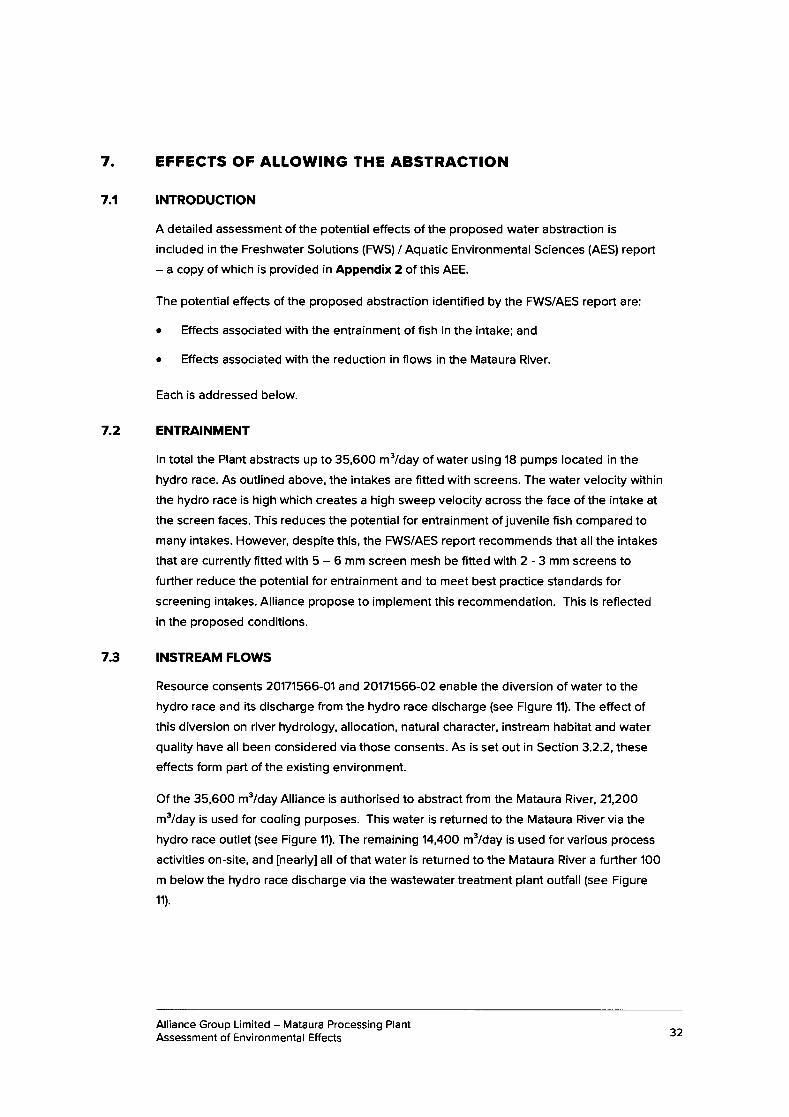
7.1 INTRODUCTION
A detailed assessment of the potential effects of the proposed water abstraction is
included in the Freshwater Solutions (FWS) / Aquatic Environmental Sciences (AES) report
- a copy of which is provided in Appendix 2 of this AEE.
The potential effects of the proposed abstraclion identified by the FWS/AES report are:
o Effects associated with the entrainment of fish in the intake; and
o Effects associated with the reduction in flows in the Mataura River.
Each is addressed below
7.2 ENTRAINMENT
ln total the Plant abstracts up to 35,600 m'/day of water using 18 pumps located in the
hydro race. As outlined above, the intakes are fitted with screens. The water velocity within
the hydro race is high which creates a high sweep velocity across the face of the intake at
the screen faces. This reduces the potential for entrainment of juvenile fish compared to
many intakes. However, despite this, the FWS/AES report recommends that all the intakes
that are currently fitted with 5 - 5 mm screen mesh be fitted with 2 - 3 mm screens to
further reduce the potential for entrainment and to meet best practice standards for
screening intakes. Alliance propose to implement this recommendation. This is reflected
in the proposed conditions.
7.3 INSTREAM FLOWS
Resource consents 20171566-01 and 20171566-02 enable the diversion of water to the
hydro race and its discharge from the hydro race discharge (see Figure 11). The effect of
this diversion on river hydrology, allocation, natural character, instream habitat and water
quality have all been considered via those consents. As is set out in Seclion 3.2.2, these
effects form part of the existing environment.
Of the 35,500 m3/day Alliance is authorised to abstract from the Mataura River, 21,200
m3/day is used for cooling purposes. This water is returned to the Mataura River via the
hydro race outlet (see Figure'11). The remaining 14,4OO m'/day is used for various process
aclivities on-site, and [nearly] all of that water is returned to the Mataura River a further 10O
m below the hydro race discharge via the wastewater treatment plant outfall (see Figure
11).
Alliance Group Limited - Mataura Processing PlantAssessment of Environmental Effects 32
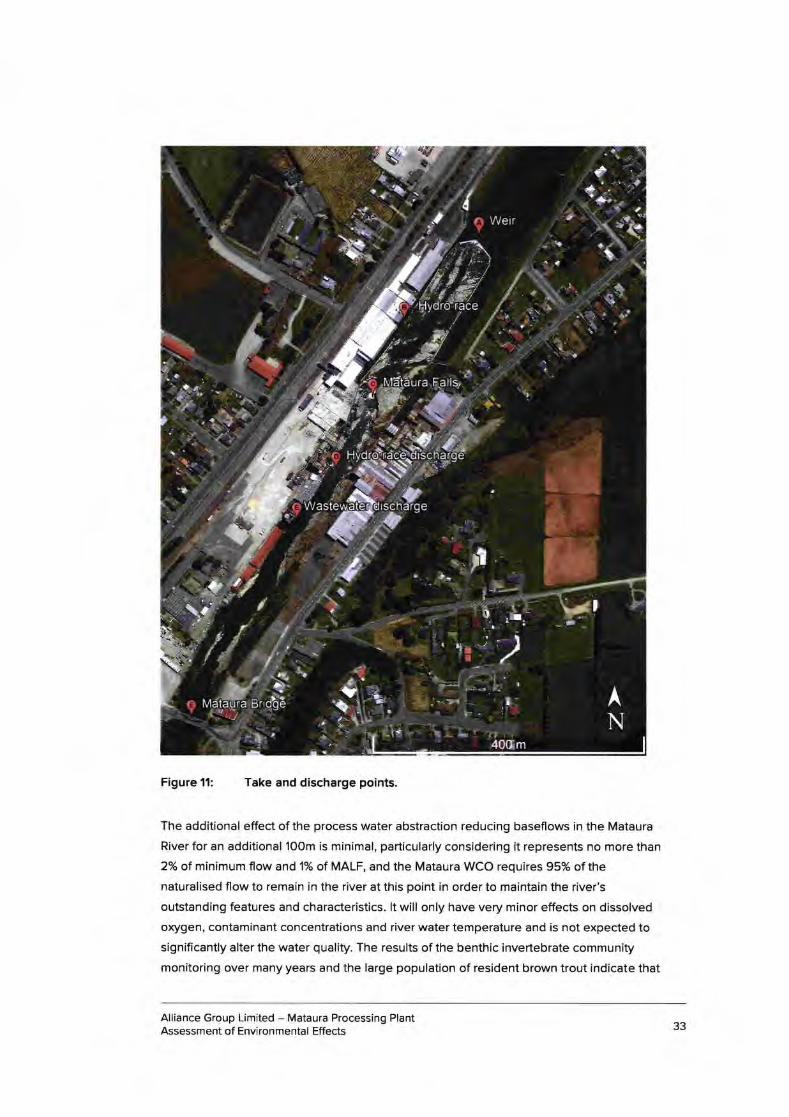
Figure 11: Take and discharge points.
The additional effect of the process water abstraction reducing baseflows in the Mataura
River for an additional 100m is minimal, particularly considering it represents no more than
2% of minimum flow and 'l% of MALF, and the Mataura WCO requires 95% of the
naturalised flow to remain in the river at this point in order to maintain the river's
outstanding features and characteristics. lt will only have very minor effecls on dissolved
oxygen, contaminant concentrations and river water temperature and is not expected to
signiflcantly alter the water quality. The results of the benthic invertebrate community
monitoring over many years and the large population of resident brown trout indicate that
Alliance Group Limited - Mataura Processing PlantAssessment of Environmental Effects 33

the water take does not adversely affect the benthic invertebrate community (an important
food source for fish), fish habitat or fish migration.
Alliance Group Limited - Mataura Processing PlantAssessment of Environmental Effects 34
8 EFFECTS OF ALLOWING THE WASTEWATER AND COOLING
WATER DISCHARGES
INTRODUCTION
This section addresses the effects of the wastewater and cooling water discharges on the
environment. They include effects on:
o Water quality in Mataura River;
. Aquatic ecology in Mataura River;
o Toetoes Estuary;
o Human health;
o Recreation; and
o Cultural values.
EFFECTS ON WATER OUALITY IN MATAURA RIVER
lntroduction
A detailed assessment of the effects of the wastewater and cooling water discharges on
the water quality is contained in the FWS/AES report, which is included in Appendix 2 of
this AEE. A summary of the report's key findings is provided below.
The FWS/AES report is informed by extensive monitoring data collected by Alliance over a
number of years in accordance with the requirements of its existing resource consents.
This is described further in Section 9 of this AEE. Additional detailed and focused
monitoring was also undertaken to inform this consent application, including longitudinal
surveys of water quality at multiple points upstream and downstream of the Plant, and
additional monitoring of periphyton, benthic invertebrates and fish.
Zone of Reasonable Mixing
The existing consent conditions set the mixing zone for the wastewater discharge 25Om
downstream of the outfall (see Figure '11), and a recent Streamlined Environmental
assessment (see Appendix 4) has shown the discharge is fully mixed before this point.
Physio-Ghemical Parameters
The FWS/AES report analyses the monitoring data and concludes it shows no evidence
that the discharge from the Plant is causing measurable effects on pH, temperature,
turbidity, TSS, colour, clarity or DO.
The FWS/AES report identified DO as being particularly important for supporting healthy
aquatic ecosystems with concentrations needing to be above 5 g/m3 as a minimum over
Alliance Group Limited - Mataura Processing PlantAssessment of Environmental Effects
8.2
8.1
4.2.1
8.2.2
8.2.3
35
4.2.4
seven days and above 4 glm3 as a one day minimum to avoid adverse effects. At all sites
on the longitudinal survey, dissolved o{ygen concentrations above and below the Plant
were above this measure, and depending on the survey, reflected either Freshwater NPS
numeric Attribute State A or B.
The FWS/AES report has identifled that on occasion, instream water temperature upstream
and downstream of the Plant is close to the upper lethal temperature limit (>23"C) for some
of the more sensitive benthic invertebrates' resident in this stretch of river. However, the
Plant has no apparent effect on water temperature so would not exacerbate this issue.
Colour, Clarity, Foams and Scums
The FWS/AES report concludes that the discharge does not have an adverse effect on
colour, clarity, or the generation of foams or scums. Notable observations from the
monitoring include:
o The water colour upstream and downstream of the Plant is predominantly pale
greenish yellow (2.5GY (32.51 812l..
r The Mataura River upstream and downstream of the discharge does meet the black
disc visual sighting distance of >1.5 m for waterways that are managed for contact
recreation.
There is a slight decrease in clarity and a slight increase in TSS and turbidity
downstream of the Plant, which may be due to the combined effect of the energy from
the Mataura Falls resuspending fine material and the discharge.
While some foam has been observed below the Mataura Falls, it has originated
upstream of the Plant's wastewater discharge indicating the discharge is not causing
that foam.
No changes to these effects due to the Plant's operation are expected in the future.
8.2.5 Ammonia & Nitrate Toxicity
The FWS/AES report analysis of monitoring data concludes the Plant's wastewater
discharge is elevating Amm-N concentrations in the Mataura River immediately
downstream of the discharge.
The monitoring data shows water quality reducing from Freshwater NPS Attribute State A
for toxicity (annual medians O.O2 - 0.03 g/m3) upstream of the Plant to Freshwater NPS
Attribute State B (annual medians 0.05 - 0.06 g/m3) downstream. The FWS/AES report has
examined this in some detail and advised it does not represent an effect which requires
immediate or urgent mitigation on ecological grounds.
This is because freshwater mussels are the only species protected by Freshwater NPS
Attribute State A Amm-N water quality, and they do not occur in the Mataura River
Alliance Group Limited - Mataura Processing PlantAssessment of Environmental Effects
a
36
immediately upstream or downstream of the discharge. The Amm-N sensitive species that
do occur in the Mataura River in the vicinity of the discharge are the mafly Deleotidium
sp. and the snail Potomopyrgus ontipodorum and these are protected by the Attribute
State B - which is achieved.
Following installation of the biological treatment system required by the proposed
conditions, the concentration of Amm-N in the discharge would be significantly reduced,
and it is expected the discharge will no longer elevate downstream Amm-N concentrations
in the manner currently observed.
Nitrate nitrogen is also an issue in many New Zealand rivers. However, in this case the
FWS/AES report notes that the discharge contains very low concentrations of nitrate
nitrogen, there is little difference between concentrations upstream and downstream ofthe discharge, and instream concentrations meet Freshwater NPS Attribute State A for
toxicity.
8.2.6 BiologicalOrygenDemand(BOD)
Monitoring results show median BOD concentrations both upstream and downstream ofthe Plant are below the guideline oI 2 glm3 for avoiding nuisance heterotrophic growths.
Therefore, the FWS/AES report concludes that effects on aquatic biota, or the formation ofheterotrophic growths, immediately downstream of the discharge due to BOD are not
anticipated. This is supported by the regular visual observations during summer lower flow
conditions between the discharge point and Mataura Bridge by Alliance staff.
No changes are expected in the immediate future. And following installation of the
biological treatment system required by the proposed conditions, the concentration ofBOD in the discharge would be further reduced.
8.2.7 Nutrient Enrichment
Algal growths in rivers are strongly influenced by a range of chemical (e.9. nutrient
concentrations), biological (e.9. grazing pressure from macroinvertebrates) and physical
factors (e.9. frequency of flow disturbance events). Therefore, for this assessment, the
FWS/AES report used the MfE (2000) periphyton guidelines which relate nutrient
concentrations to accrual periods and flow disturbance events to assess the potential
effects of the nutrients from the discharge on algal groMh.
The relevant DRP and DIN results are set out in Table 6 below. Concentrations are very
similar between upstream and downstream sites and the FWS/AES report analysis of the
monitoring data does not identif,T the Plant's discharge as having any notable impact on
downstream concentrations.
However, the FWS/AES report does identifu that the mean monthly DIN and DRP
concentrations at all sites upstream and downstream exceed the MfE periphyton guideline
Alliance Group Limited - Mataura Processing PlantAssessment of Environmental Effects 37
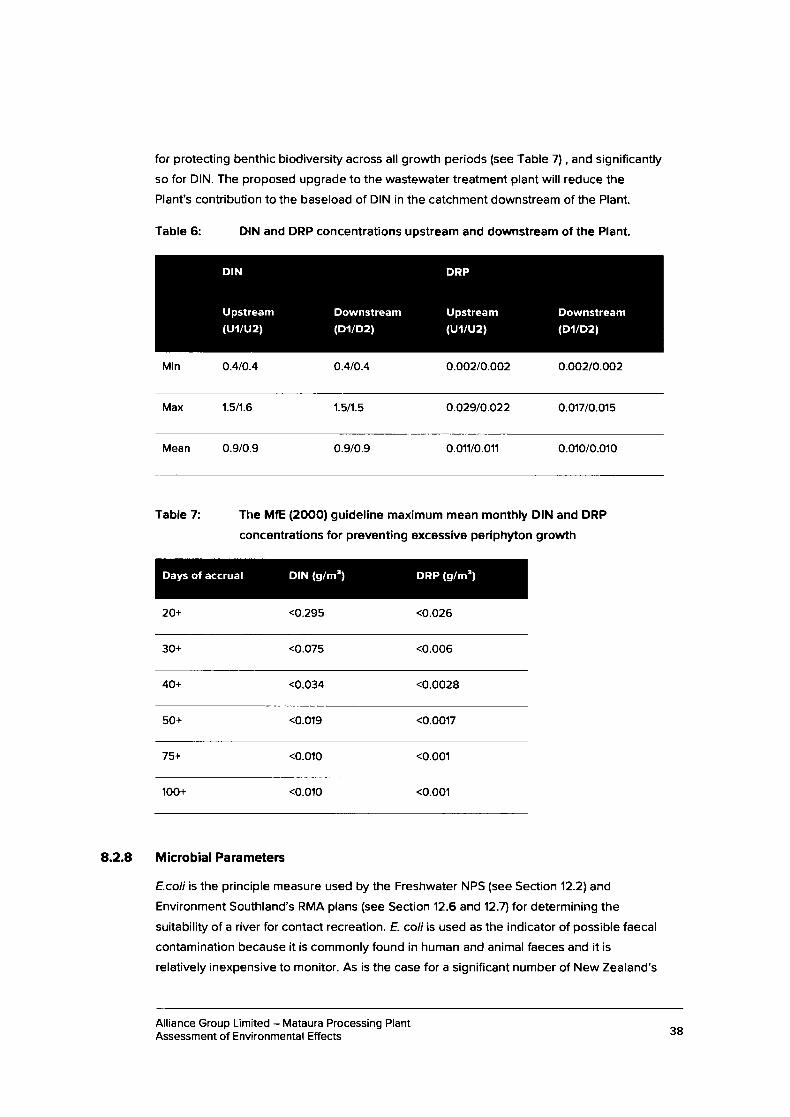
for protecting benthic biodiversity across all growth periods (see Table 7) , and significantly
so for DlN. The proposed upgrade to the wastewater treatment plant will reduce the
Plant's contribution to the baseload of DIN in the catchment downstream of the Plant.
Table 5: DIN and DRP concentrations upstream and downstream of the Plant.
Min o.4to.4 o.4to.4 0.002/o.o02 o.oo2lo.oo2
DIN
(D.r/D2)
DRP
DownstreamDownstream(Dl/D2)
Upstream
lullv2lUpstream
(u1/u2)
Max 1.511.6 1.5/1.5 o.o29lo.o22 0.017/o.015
Mean 0.9/0.9 0.9/0.9 0.011/0.011 0.010/0.010
Days of accrual DIN (g/m3) DRP (g/m')
Table 7: The MfE (2OOO) guideline maximum mean monthly DIN and DRP
concentrations for preventing excessive periphyton growth
20+ <o.295 <0.026
30+ <0.075 <0.006
4O+ <0.034 <0.0028
50+ <o.ot9 <o.oo't7
75+ <0.010 <o.oo1
100+ <0.010 <o.oo1
8.2.8 MicrobialParameters
E.coli is the principle measure used by the Freshwater NPS (see Section 12.21 and
Environment Southland's RMA plans (see Section 12.6 and 12.71 for determining the
suitability of a river for contact recreation. E. coli is used as the indicator of possible faecal
contamination because it is commonly found in human and animal faeces and it is
relatively inexpensive to monitor. As is the case for a significant number of New Zealand's
Alliance Group Limited - Mataura Processing PlantAssessment of Environmental Effects 38
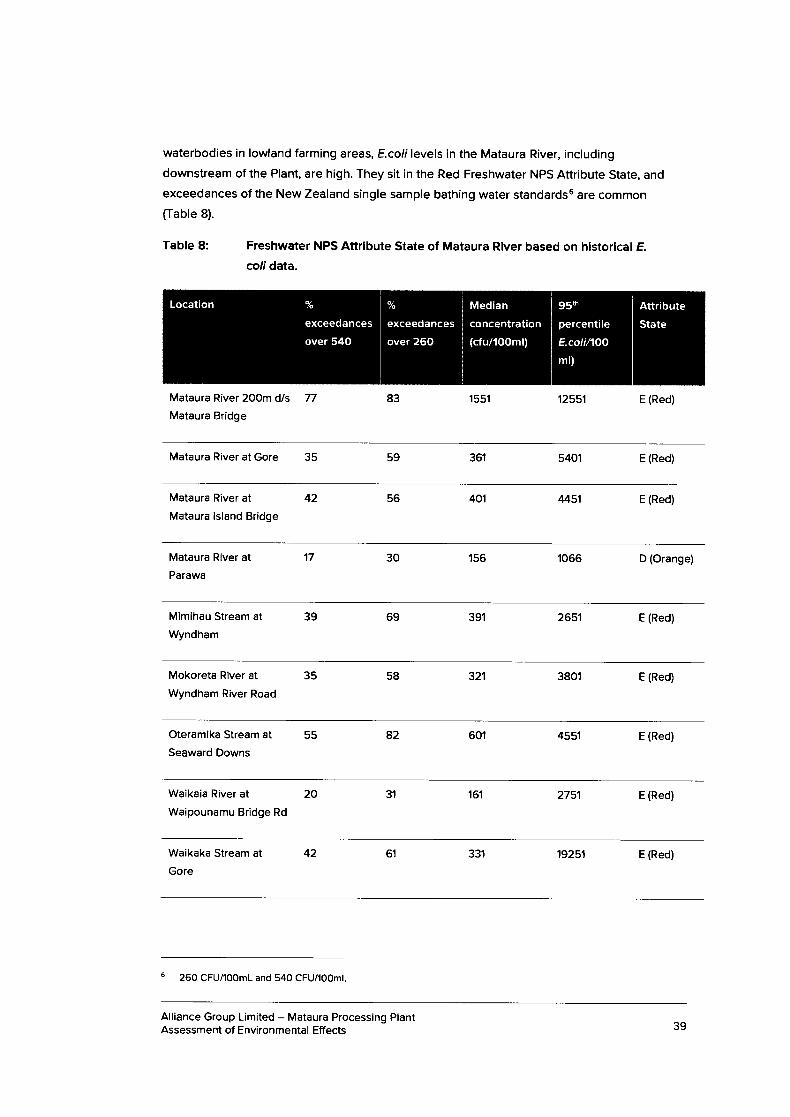
waterbodies in lowland farming areas, E coli levels in the Mataura River, including
downstream of the Plant, are high. They sit in the Red Freshwater NPS Attribute State, and
exceedances of the New Zealand single sample bathing water standards6 are common
(Table 8).
Table 8: Freshwater NPS Attribute State of Mataura River based on historical E
coli data.
Mataura River 200m d/s 77
Mataura Bridge
83 1551 12551 E (Red)
exceedances
over 54O
exceedances
over 26O
Median
concentration
(cfuilOOml)
95th
percentile
E.coli/1OO
ml)
Location Attribute
State
Mataura River at Gore 35 59 361 5401 E (Red)
Mataura River at
Mataura lsland Bridge
42 56 401 4451 E (Red)
Mataura River at
Parawa
17 30 156 1066 D (Orange)
Mimihau Stream at
Wyndham
39 69 391 2651 E (Red)
Mokoreta River at
Wyndham River Road
35 58 321 3801 E (Red)
Oteramika Stream at
Seaward Downs
55 82 601 4551 E (Red)
Waikaia River at
Waipounamu Bridge Rd
20 31 161 2751 E (Red)
Waikaka Stream at
Gore
42 61 331 19251 E (Red)
6 260 CFU/100mL and 540 CFU/100mt
Alliance Group Limited - Mataura Processing PlantAssessment of Environmental Effects 39
8.3
As outlined in Section 4.4.2,hhe Plant's discharge also contains relatively high
concentrations of E.coli, and instream monitoring data shows E coli concentrations
increase signiflcantly downstream of the Plant due to its wastewater discharge. For
instance, at the site immediately downstream of the discharge (Mataura River 200m d/s
Mataura Bridge), exceedance of the 540 CFU/1OOmL single sample standard increased
from 35% lo 77Y". This suggests the Plant's discharge is having an effect on the E coli
levels in the river downstream of the Plant.
However, as is outlined in Section 4.4.2, despite the Plant's discharge containing relatively
high E coli levels, the level of pathogens in the discharge, which are of most concern when
considering effects on human health, are much lower and more variable. ln turn, the Plant's
impact on the levels of those pathogens in the Mataura River below the discharge would
also be much smaller. This is discussed further in Section 8.5 below which addresses the
human health related effects of this change in water quality.
EFFECTS ON AOUATIC ECOLOGY IN MATAURA RIVER
ln addition to assessing effects on water quality, the FWS/AES report assessed effects on
in-stream ecological values with a view to identifiTing any instream effecls of the Plant's
discharge. Potential effects of concern which the FWS/AES report investigated included:
. Proliferation of nuisance algal growths;
. Reduced benthic invertebrate community health; and
. Reduced fish abundance, diversity and health.
A summary of the FWS/AES report's key flndings is provided below
8.3.1 AlgalGrowths
Nuisance algal growths include sewage fungus and periphyton. The amount of periphyton
in a river is determined by interactions between flow regime, nutrient status, light and
temperature, streambed substrate and benthic invertebrate grazing. Algal growths are the
most direct indicator of nutrient related effects on rivers and in turn have been monitored
upstream and downstream of the Plant at least annually since 2012.
This monitoring has recorded variable algal cover and biomass between sites upstream
and downstream of the Plant, and among surveys. lt indicates that while DRP and DIN
concentrations are relatively high, this is not stimulating periphyton growths upstream or
downstream of the Plant except following very long late summer - early autumn accrual
periods (the most noticeable example of which was in February / March 2O19). The
FWS/AES report also notes the sewage fungus and periphyton monitoring data shows no
effect from the Plant's wastewater discharge.
Alliance Group Limited - Mataura Processing PlantAssessment of Environmental Effects 40
8.3.2 Benthic lnvertebrates
Benthic invertebrates are a commonly used indicator of water quality with indices such as
the MCl, QMCI and percent EPTT designed to specifically assess nutrient related effects.
Benthic invertebrates have been monitored at least annually at several locations upstream
and downstream of the Plant since the early 1990s.
Overall, the benthic invertebrate community upstream and downstream of the discharge
reflects the cumulative effed of catchment-wide inputs upstream and is generally in fair topoor health across most benthic invertebrate indices.s
Total taxa number and EPT taxa number have been variable across sites and between
surveys over the 2012*2019 period with no clear evidence that the discharge causes a
reduction in total diversity or the diversity of water quality sensitive taxa. Prior to the most
recent surveys, there had been a general increasing trend in Deleotidium sp. abundance
at downstream monitoring locations. ln February 20',|9, Deleotidium sp. abundance at the
downstream monitoring sites was lower compared to upstream sites. The decline in
Deleotidium sp. abundance at downstream sites in February 2019 is not explained by
periphyton cover and biomass or Amm-N concentrations, which are all potential effects of
the discharge. Rather, the FWS/AES report has assessed that this decline in abundance
could be attributed to high river temperatures leading up to and at the time of the
February 2O19 survey and an increase in overall stress that occurred at the time. A sharp
decline at upstream and less pronounced decline at downstream sites in Deleotidium sp.
was also recorded in March 2019. This is very likely to be related to the elevated river
temperature and extensive late successional stage algal groMhs at the time of the survey
associated with the longest late summer - early autumn accrual period since 2O12. lt also
suggests the upstream decline may have been slightly delayed compared with
downstream.
MCI scores have been similar upstream and downstream of the Plant over the period
between January 2012 and March 2019 and remained within the 'fair'stream health range
for all sites. QMCI scores have been variable across years largely as a result of differences
in the relative abundance of Deleotidium. Overall, the FWS/AES report concludes that
results indicate the treated wastewater discharge has not resulted in a consistent
decrease in MCI and OMCI scores between upstream and downstream locations over a
range of accrual periods between April 2013 and December 2017. The FWS/AES report
also identifies no evidence or causal links that can be associated with the discharge for the
February 2019 survey and the March 2019 declines that occurred both upstream and
downstream.
EPT stands for Ephemeroptera (mayfly), Plecoptera (stonefly) and Trichoptera (caddisfly) which aremacroinvertebrates that are sensitive to water pollution.
It is notable however, that OMCI is sometimes in the'good'range.
Alliance Group Limited - Mataura Processing PlantAssessment of Environmental Effects 41
8.3.3 Fish
The lower Mataura River is a migratory pathway for a range of whitebait species, brown
trout, salmon. Fish abundance and health can be influenced by a wide range of factors
including proximity to the coast, barriers such as the Mataura Falls, habitat quality and
water quality.
Results from fish surveys indicate that the flsh community in run habitat is dominated by a
small number of species - longfin and shortfin eel, elvers and upland bully. Elvers were
more abundant at downstream sites compared to upstream sites and could either be
attributed to differences in habitat suitability, or simply the timing of the upstream
migration by a particular group of new recruits into the river. The fish community in the
reach between the Mataura Falls and Mataura Bridge, based on survey results, indicates
that the Mataura River immediately upstream and downstream of the discharge supports a
healthy longfin eel population including several very large fish (+5 kg).
Anecdotal evidence indicates that there is a large resident population of brown trout and
late summer and early autumn runs of sea run brown trout and salmon are regularly seen
and caught between the Mataura Falls and the Mataura Bridge. The presence of such
large numbers of brown trout and seasonal migration of brown trout and salmon indicate
that the water quality in this section of the river is suitable for supporting salmonids that
are amongst the most water quality sensitive species present in New Zealand.
The contaminants that can make fish unsuitable for consumption are persistent pollutants
such as certain metals (e.9. mercury) and persistent organic pollutants (e.9. dioxins). There
are no persistent pollutants of this type in the wastewater discharge and therefore adverse
effects from the discharge on fish health or the consumption of fish are not expected.
8.4 EFFECTS ON TOETOES ESTUARY
As outlined in Section 3.3, Toetoes Estuary is in declining condition in relation to
eutrophication with excessive nutrient inputs being the primary driver of the eutrophication
symptoms being expressed.
The TN and TP loads received by the Estuary have been estimated at 3,110 tonnes per
year and 345 tonnes per year respectively.
On this basis since 2012 the contribution of the Plant's discharge to Toetoes Estuary TN
loads has been assessed as being '|,.1 - 1.7% and its contribution to TP has been assessed
as 0.7 - 1.3%, with the majority of the TN and TP load entering Toetoes Estuary derived
from other catchment inputs, particularly diffuse sources.
ln turn, the FWS/AES report concludes that the effects of TN and TP in the Plant's
discharge on Toetoes Estuary are no more than minor.
Alliance Group Limited - Mataura Processing PlantAssessment of Environmenta I Effects 42
However, the FWS/AES report is of the view that Alliance will need to reduce its levels
over time as part of catchment-wide initiatives to improve water quality.
This will occur following installation of the biological treatment system which the proposed
conditions require to be commissioned within '15 years of the commencement of the new
consent, which is expected to reduce the concentration of TN in the discharge by
approximately 68% and annual loading by approximately 50% relative to present.
However, while this represents a significant reduction in the TN load contributed by the
Plant, it represents less than 1% of the total TN load received by the Estuary. ln turn, the
FWS/AES report expect it to have little, if any, detectable effect on the nutrient status ofToetoes Estuary.
8.5 HUMAN HEALTH
E.coli is the principle measure used by the Freshwater NPS and Environment Southland's
RMA plans for determining the suitability of a river for contacl recreation. E.coli is used as
the indicator of possible faecal contamination because it is commonly found in human and
animal faeces and it is relatively inexpensive to monitor. As is the case for a significant
number of New Zealand's waterbodies in lowland farming areas, E co/i levels in the
Mataura River, including downstream of the Plant, are high. They sit in the Red Freshwater
NPS Attribute State, and exceedances of the New Zealand single sample bathing water
standardse are common. They also do not meet the relevant Southland Land and Water
Plan standards. A recent Environment Southland study of Campylobacter risk in this
catchment using actual instream data for that parameter (rather than levels of E coli as an
indicator) suggests that the health risk in this catchment may not be anyruhere near as high
as is suggested by the E coli concentrations present,lo and additional monitoring data
collected in 2O'18 by Streamlined Environmental supported this finding. However, Alliance
understands that baseline water quality conditions in the Mataura River (absent any
contribution from the Plant) may be'un-swimmable' at times due to the contribution ofpathogens from other upstream sources.ll
As outlined in Section 4.4.2,the Plant's discharge also contains relatively high
concentrations of E co[, and as outlined in Section 8.2.8, instream monitoring data shows
E coli concentrations increase signiflcantly downstream of the Plant due to its wastewater
discharge. However, as is also outlined in those sections, despite the Plant's discharge
containing relatively high E.coli levels, the level of pathogens in the discharge, which are of
s 260 CFUflOOmL and 540 CFU/100mt.10 Cressey, P., Hodson, R., Ward, R., & Moriarty, E. (2014. Use of OMRA to Assess the Human Health Risk of the
Mataura River, Southland http://isrs?O17.com/images/Cre99ey_PelefpdJ.11 Cressey, P., Hodson, R., Ward, R., & Moriarty, E. l2O'14. Use of OMRA to Assess the Human Health Risk of the
Mataura River, Southland http://isrs2O17.com/images/Cregsey_Peteq.pdl
Alliance Group Limited - Mataura Processing PlantAssessment of Environmental Effects 43
most concern when considering effects on human health, are much lower and more
variable.
To further understand the effect of the Plant elevating downstream E coli levels on human
health, a Quantitative Microbial Risk Assessment (QMRA) has been undertaken by
Streamlined Environmental to predict the health risk to people swimming in the Mataura
River below the Plant's discharge point as a result of the Plant's discharge only. A copy of
this QMRA report is included in Appendix 3 of this AEE.
The QMRA shows that while the Plant causes E coli concentrations in the Mataura River to
increase signiflcantly below the Plant's discharge point, this does not equate to a
significant increase in health risk, and the risk of a person swimming below the Plant
becoming ill due to the Plant's discharge is well below 1% which is considered an
acceptable level. lt is noted that this is broadly consistent with the aforementioned
Environment Southland study which concluded the Plant's discharge contributed only a
relatively small proportion of the overall Campylobacter risk in this catchment.12
However, while the Environment Southland and Streamlined Environmental studies show
the baseline health risk in this catchment, and the Plant's contribution to that health risk,
are not as significant as measured E.coli levels would suggest, this does not equate to
there being no risk. lt is evident that there are times when the Mataura River is un-
swimmable and as is outlined in Section 12.2 of this AEE, Environment Southland is obliged
under the Freshwater NPS to set policy and methods to improve water quality so that it is
suitable for primary contact more often. The key indicator for how that is being achieved is
also instream E coli concentrations.
ln that context, Alliance acknowledges it should contribute to any catchment-wide plan for
improving water quality for contacl recreation, and reducing E coli concentrations in the
Mataura River. This will occur following installation of the UV treatment plant required by
the proposed conditions, which is expected to reduce the E coli levels in the Plant's
wastewater discharge by more than 99%.
8.6 EFFECTS ON RECREATION
Rob Greenaway & Associates has undertaken a qualitative and quantitative assessment in
order to determine the recreational values that exist in the Mataura River and whether
these are being affected by the Plant, and more specifically, the wastewater discharge to
the Mataura River (the recreation report). A copy of the recreation report is provided in
Appendix 5.
12 Cressey, P., Hodson, R., Ward, R., & Moriarty, E..2014. Use of QMRA to Assess the Human Health Risk of theMataura River, Southland http://isrs2017.com/imageslCre-sse-y-Petef,pdf.
Alliance Group Limited - Mataura Processing PlantAssessment of Environmental Effects 44
As outlined in Section 3 of this AEE, the following key recreational values have been
identified:
o The outstanding nature of the Mataura River for brown trout fishing;
o lts relatively high use for swimming, both upstream and downstream of Mataura;
. A very popular whitebait fishery in the lower reaches;
o Use of the riverbanks, berms, reserves and angler access points for a variety of
terrestrial activities, mostly around settlements, and with relatively high activity levels
at the Coal Pit Road angler access poin!
o A low level of use of the river for salmon flshing;
o Some use of the river for jet boating and kayaking, but with no relevant data to
quantifu these uses.
Consultation (including formal interviews) with key recreational stakeholders and users of
the Mataura River was also completed. The interviewees provided a variety of views on
the changes to the above recreation values over time.
While no-one interviewed would drink from the Mataura River below Cattle Flat, all agreed
that the river's water quality was far better than in the 1980s when there were a variety of
untreated municipal and industrial discharges occurring. Several respondents - mostly
anglers - considered the water quality now to be quite good, but potentially of decreasing
quality due to farming intensification. Others considered the water quality to be poor.
Many noted a variety of sources of contamination, including farming and treated municipal
wastewater, particularly at Gore. The Alliance discharge did not feature as a major issue
for most respondents, but was noted by kayakers.
Opinions about the quality of the flshery also varied and the presence of the Plant's
discharge does not appear to be having an adverse effect on the people's use and
enjoyment of the fishery. Most agreed that the mayfly rise on the Mataura River had
declined in frequency and intensity, with several theories as to the cause. The most
experienced angler on the river downstream of Mataura - with detailed angling diaries -considered the insect life in the river to be quite healthy, but that warmer summer
temperatures (climate change) were conflning the rise to evenings and night, were less
frequent generally, and were occurring later in the 'summer' season ('May is the new
April'). Warmer temperatures were also considered a cause in the change in the patterns
of the hatch by other anglers, but nutriflcation and sedimentation and (therefore) fewer
insects were also identified. Opinions about the number and quality of trout varied, with
some considering the numbers and quality to be consistent, and others considering size,
quality and numbers to have all declined. Some considered a reduction in trout size to be
the result of a cleaner river. The change in the frequency, timing and duration of the mayfly
Alliance Group Limited - Mataura Processing PlantAssessment of Environmental Effects 45
hatch has influenced a change in fishing technique, with more nymphing over dry fly
fishing.
Swimming appears to be, in the main, a very local activity with a small number of regular
users - also influenced by the recent closure of the community swimming pool at Mataura.
There appears to be no common local conversation about illnesses from contact with the
river water, and bathing water quality reports issued by Environment Southland do not
appear to affect many swimmers' choices. The results of the QMRA report are also
important when considering the effects of the Plant's discharge on swimming.
Having considered these responses, the FWS/AES report and the QMRA the key finding of
the recreation assessment is that:
The key potential issues when considering the effects of the proposed activities on
recreation values are:
The degree to which the proposed activities increase the risk of contracling a
waterborne disease from water contact recreation, including swimming, paddling
and trout and whitebait fishing;
The effect of the discharge on trout and whitebait abundance and quality,
associated with water quality and other habitat parameters, such as the health of
the in-river macroinvertebrate community and water temperature;
The degree to which the discharge exacerbates nuisance periphyton growths,
affecting bathing quality and the risk of anglers slipping; and
Odour from the discharge, alterations of water colour and clarity and the
generation of foams and scums, affecting water contact recreation as well as
visual amenity, angling and white baiting.
a The contribution of the discharge and water take to adverse effects on recreation in
the Mataura River in respect of the above are very slight and subsumed by the many
other sources of nutrification and contamination.
There appears to be no causal relationship between the discharge and levels ofperiphyton, macroinvertebrates, colour, clarity or the generation of foams or scums -and hence trout and whitebait habitat and the ability to catch them.
The Plant should reduce its levels of key contaminants as part of catchment wide
initiatives to improve water quality.
While not urgent considering the existing low scale of effect on recreation amenity
(and ecological values), it is recommended that options to reduce E coli levels in the
discharge be implemented during the life of a renewed consent.
o
o
a
a
a
Alliance Group Limited - Mataura Processing PlantAssessment of Environmental Effects 46
8.7 CULTURAL EFFECTS
ln order to identiff and assess the cultural effects of the activities, Alliance requested Te
Ao Marama lnc ITAMI] to prepare a Cultural Values Report. Alliance has also engaged with
TAMI and Hokonui Runanga in respect of these applications and that process.
It is clear from the engagement that has occurred thus far that iwi have a long association
and strong traditional relationship with the Mataura River, and mahinga kai resources,
nohoanga and mdtaitai are all important and relevant values here.
It is also clear that:
a The disposal of wastewater directly to water is an activity which is of potential cultural
concern
Generally speaking, Hokonui Runanga do not believe consents should be granted for
a term exceeding 25 years, as doing so is essentially making decisions for the next
generation.
Meaningful ongoing engagement and suitably recognising the role of Hokonui
Runanga as kaitiaki of the Mataura River is important.
These first two of these issues were important considerations in the detailed assessment
of alternative options for treatment and disposal of the Plant's wastewater which is
described in Sections 9.3.1 and 10. However, for reasons set out in Section 10, a discharge
to land option is not practicable here, and the proposed wastewater treatment plant
upgrades, along with a consent term which allows those upgrades to be progressively
implemented and the financial investment to be justified and secured over an appropriate
timeframe, is considered to be the best praclicable option.
Alliance welcomes the third matter and Key Alliance staff also met with key Te Ao Marama
and Hokonui Runanga on 23 May 2O19 to discuss the development of a Memorandum of
Understanding (MoU) between the two parties, separate from this consent process. lt is
expected that any MoU would eventually incorporate meaningful ongoing engagement
between the parties and provision for Hokonui Runanga to exercise kaitaikai over the
Mataura River.
8.8 SUMMARY
A comprehensive assessment of the effects of the discharge on the receiving environment
has determined that no adverse effeds trigger the need for immediate or urgent
mitigation.
However, that assessment has identified that the lower Mataura River contains very high
levels of Ecoli, and the Plant's discharge significantly increases those levels in the
receiving water downstream. But because the level of pathogens in the discharge, which
Alliance Group Limited - Mataura Processing PlantAssessment of Environmenta I Effects
a
a
47
are of most concern when considering effects on human health are much lower and more
variable, the Plant's discharge does not cause a significant increase in the health risk
experienced by a person swimming below the Plant, and the risk of a person becoming ill
due to the Plant's discharge is well below 1%, which is considered an acceptable level. lt
also appears the Plant's discharge is not having an adverse impact on people's use of the
river for recreation purposes. However, Alliance accepts it will need to reduce its levels of
E coli as part of catchment-wide initiatives to improve water quality. And this will occur
following the planned installation of the UV treatment plant required by the proposed
conditions, which is expected to reduce the E coli levels in the Plant's wastewater
discharge by more than 99%.
The assessment also identifies the Mataura River is degraded in terms of the nitrogen
levels present, periphyton reflects moderate to high enrichment at times, and MCI and
QMCI data are representative of fair to poor (but occasionally good) health. Toetoes
Estuary also continues to degrade with extensive macroalgal growth driven by very high
nutrient loads from the catchment. While there is no evidence suggesting the Plant's
discharge has a direct adverse effect on these stressors downstream of the discharge, it
does contribute a small portion to the overall loads of Amm-N and TN downstream of the
discharge.
Alliance accepts it will need to reduce its levels of Amm-N and TN as part of catchment-
wide initiatives to improve water quality. And this will occur following installation of the
biological treatment system required by the proposed conditions, which is expected to
reduce the concentration of TN in the discharge by approximately 68% relative to present.
The Mataura River is attributed significant value by iwi. Alliance is continuing to engage
with Hokonui Runanga and TAMI with a view to identifying appropriate alternate means of
avoiding, remedying or mitigating the effects of the discharge on cultural values.
Alliance Group Limited - Mataura Processing PlantAssessment of Environmental Effects 48
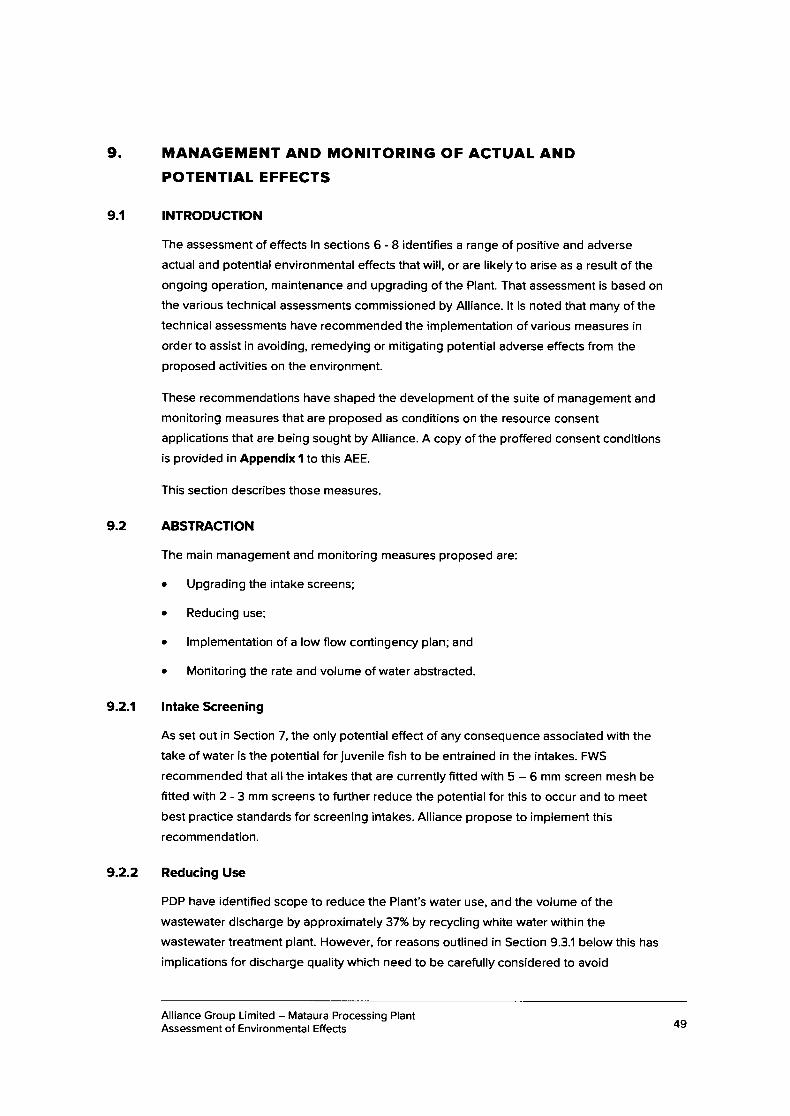
9 MANAGEMENT AND MONITORING OF ACTUAL ANDPOTENTIAL EFFECTS
9.1 INTRODUCTION
The assessment of effects in sections 6 - 8 identifies a range of positive and adverse
actual and potential environmental effects that will, or are likely to arise as a result of the
ongoing operation, maintenance and upgrading of the Plant. That assessment is based on
the various technical assessments commissioned by Alliance. lt is noted that many of the
technical assessments have recommended the implementation of various measures in
order to assist in avoiding, remedying or mitigating potential adverse effects from the
proposed activities on the environment.
These recommendations have shaped the development of the suite of management and
monitoring measures that are proposed as conditions on the resource consent
applications that are being sought by Alliance. A copy of the proffered consent conditions
is provided in Appendix 1 to this AEE.
9.2
This section describes those measures.
ABSTRACTION
The main management and monitoring measures proposed are:
o Upgrading the intake screens;
o Reducing use;
o lmplementation of a low flow contingenry plan; and
o Monitoring the rate and volume of water abstracted.
lntake Screening9.2.1
As set out in Section 7, the only potential effect of any consequence associated with the
take of water is the potential for juvenile fish to be entrained in the intakes. FWS
recommended that all the intakes that are currently fitted with 5 - 6 mm screen mesh be
fitted with 2 - 3 mm screens to further reduce the potential for this to occur and to meet
best practice standards for screening intakes. Alliance propose to implement this
recommendation.
9.2.2 Reducing Use
PDP have identified scope to reduce the Plant's water use, and the volume of the
wastewater discharge by approximalely 37"/o by recycling white water within the
wastewater treatment plant. However, for reasons outlined in Seclion 9.3.1 below this has
implications for discharge quality which need to be carefully considered to avoid
Alliance Group Limited - Mataura Processing PlantAssessment of Environmental Effects 49
unforeseen adverse toxicity and eutrophication effects on aquatic organisms within the
mixing zone and downstream.
ln turn, while the conditions require water use to be reduced within 3 years of the
commencement of the new consent, rather than specifuing a fixed reduction percentage
now, they require the actual volume reduction to be determined via a Resilience and
Water Saving Strategy which determines what can be reasonably achieved:
r without increasing the total contaminant load within the discharge when measured on
a daily basis when assessed against the limits which will apply from the
commencement ofthe new consent; and
o without giving rise to unforeseen adverse toxicity and eutrophication effecls on
aquatic organisms within the mixing zone and downstream.
This is discussed further in Section 9.3.1 below.
9.2.3 Low Flow Contingency Plan
During times of eldreme drought, when flows are low, farmers can often be forced to de-
stock their farms, which leads to an influx in animals at Alliance's plants. lt is therefore
essential to enable Alliance's plants to continue to process stock in the interests of animal
welfare during such periods.
To mitigate the effects of operating during low flows, the existing consent requires Alliance
to prepare and implement a low flow contingency plan which describes the practicable
measures to be taken by Alliance to minimise the abstraction of water during times when
the flow of the Mataura River at the Tuturau recording site is less than 20 cubic metres per
second. This will be retained.
9.2.4 Monitoring
Alliance is proposing to take up to approximately 21,2OOm3 of water per day for cooling
water purposes. As set out in Section 4, the cooling water system takes water from the
race, passes it through the condensers and then discharges the water back into the race
No monitoring is proposed for this take, other than recording the daily volume of water
taken using the existing methods deemed appropriate during a 2018 resource consent
process on that matter.
The remainder of the water that is to be taken by Alliance is used in processing activities,
potable water and for activities such as truck washing. The majority of this water is also
returned to the river via the treated wastewater discharge. As part of the existing consent
obligations, Alliance is required to install and maintain water metering devices on those
takes where the water is used or associated with Plant processing activities. Alliance will
continue to maintain this water metering and measure the quantum of take for processing
activities as part of this proposal.
Alliance Group Limited - Mataura Processing PlantAssessment of Environmental Effects 50
9.3
9.3.r
DISCHARGES
Three Stage Upgrade of the Wastewater Treatment Plant (Reducing Volumes and
!mproving Quality)
A comprehensive assessment of the effects of the discharge on the receiving environment
has determined that no adverse effects trigger the need for immediate or urgent
mitigation.l3
However, that assessment has identified that:
The lower Mataura River contains very high levels of Ecoli, and the Plant's discharge
significantly increases those levels in the receiving water downstream; and
The Mataura River can generally be characterised as degraded in respect of its
nutrient loads, and the estuary is in a "MODERATE" but declining condition in relation
to eutrophication, with the Plant's discharge contributing to catchment nutrient loads.
As set out in Section 12, the planning framework which applies here also anticipates a
long-term catchment-wide improvement in water quality for these key parameters. No
detail is available yet on the extent of the catchment scale improvement anticipated for
each parameter, or the timeframes and methods for achieving that improvement, including
which parameter should be afforded priority. The planning framework anticipates these
matters will be determined via a soon to be commenced collaborative planning process for
the Mataura Freshwater Management Unit involving all key stakeholders. The initial
outputs from that collaborative planning process are expected in 2022, and they are not
expected to be formalised via the RMA Schedule 1 process until at least2O24l2O25.
While the plan for improving catchment water quality will not be known for several years, it
will be flnalised, and implemented during the term of the resource consents being sought
by Alliance. Alliance has sought detailed advice from PDP on what methods and
technology could be potentially employed in order to reduce the loads of these key
parameters from the Plant to the Mataura River (refer Appendix 7 attached).
After considering the PDP assessment, a staged upgrade of the wastewater treatmentplant represents the best practicable option for the disposal of the Plant's wastewater. This
is addressed in more detail in Section 10 below.
The proposed upgrade represents a significant capital underlaking and it is proposed that
will be completed in a staged manner as follows:
a
a
13 Freshwater Solutions Ltd 2019. Assessment of the Effects of Alliance Mataura's Discharges and Water Takeon Mataura River and Toetoes Estuary. Submitted to Alliance Group Ltd (DRAFT). March 2019.
Alliance Group Limited - Mataura Processing PlantAssessment of Environ mental Effects 51
a
a
a
a
Year 1 - 3: lmplementing water reduction opportunities and addressing existing
resilience issues.
PDP have identified potential intermittent cross contamination points between the green
and non-green waste stream and, potential failure points within the reticulation system. To
address these resilience issues, the following will be completed in the first 3 years of the
new consent term:
Re-route all pipework that runs above or in the water race to a location that prevents
waste leaking into the water race or fresh water leaking into the treatment system;
Re-route all pipework that runs above the river to a location that prevents waste
leaking into the river;
Modify the beef sump milli-screen overflow to prevent green waste overflows into the
non-green waste stream;
Modify the stockyard and tripe rerycle area to prevent green waste overflows into the
non-green waste stream.
PDP has also identified scope to reduce the Plant's water use, and the volume of the
wastewater discharge by approximately 37% by rerycling white water within the
wastewater treatment plant. This is an essential initial step, in that any water reduction
measures that are successfully implemented will influence the sizing parameters applied
to any subsequent treatment upgrades required to further treat the discharge. However,
as set out above PDP note that recycling of treated wastewater for white-water generation
will require careful management to avoid foam generation in the inter-stage tank, and that
consideration will need to be given to the implications of the decreased dilution effect of
the white-water and the likely increase in concentration (but not load) of key parameters in
the discharge.
To address this uncertainty, within six months of the commencement of this consent, the
proposed conditions require Alliance to prepare and submit to Environment Southland a
Resilience and Water Saving Strategy, the purpose of which is to identifu:
Measures to avoid potential intermittent cross contamination points between the
Green and Non-Green waste streams and potential failure points within the
reticulation system; and
Methods to enable the rerycling of white water within the wastewater treatment plant
to reduce the total volume of wastewater discharged to the Mataura River to the
extent that can be reasonably achieved:
without increasing the total contaminant load within the discharge when
measured on a daily basis when assessed against the limits which apply from the
commencement of the new consent; and
a
Alliance Group Limited - Mataura Processing PlantAssessment of Envi ronmental Effects 52
o without giving rise to unforeseen adverse toxicity and eutrophication effects on
aquatic organisms within the mixing zone and downstream.
The proposed conditions require this Strategy to include:
a The new contaminant concentration limits to be applied to meet this obligation
(acknowledging that the volume of the discharge is reduced meaning that theproportion of contaminant load to discharged volume will be higher within the
discharged waste stream); and
a A review by a suitably qualified and experienced ecologist which assesses the effects
of the discharge in order to conflrm that the newly set contaminant limits for the
discharge will unforeseen adverse toxicity and eutrophication effects on aquatic
organisms within the mixing zone or downstream.
The proposed conditions require Alliance to implement the measures described in the
Resilience and Water Saving Strategy within three years of the commencement of the new
consent. Once implemented and trialling of the new system is complete, the proposed
conditions also require Alliance to commission a review by a suitably qualified and
experienced ecologist to assess the effects of the discharge in order to confirm that the
newly set contaminant limits within the discharge are not giving rise to adverse toxicity
effecls on aquatic organisms within the mixing zone. Year 5: Tertiary Disinfection ofMicrobial Contaminants.
Alliance proposes that within five years of the commencement of the new consent
equipment will be installed (a UV plant or similar) to disinfect the wastewater discharged
from the site in order to inactivate pathogens.
This upgrade is expected to incur capital costs of approximately $4.1 million, and additional
annual operational expenditure of $23O,00O.
Following installation of the treatment system the proposed conditions would require the
E coli concentration in the discharged wastewater to not exceed an annual mean of 1,000
CFU/100m1 and 95th percentile of <10,0O0 CFU/100m1. This is a substantial reduction
relative to the concentrations set out above in Table 4.
Year 15: Biological Treatment System
By Year 15, Alliance proposes to install a full biological treatment system to treat the
Plant's wastewater to reduce BOD, ammoniacal nitrogen and total nitrogen concentrations.
Alliance will firm up the detailed design of the new biological treatment system closer tothe installation date. However, it is currently anticipated a large, lagoon based, biological
reaclor will be installed. Due to the large lagoon size (approximately 8,500 m3), it will likely
be located 2 km away on land currently owned by Alliance Group Ltd, with wastewater
Alliance Group Limited - Mataura Processing PlantAssessment of Environmental Effects 53
9.3.2
being pumped to the lagoon for treatment, and then back to the Plant for discharge via the
existing outfall.
The additional capital cost of installing tertiary disinfection of microbial contaminants and a
biological treatment system is signiflcant and estimated to be $13.98 million with annual
operating costs of $1,050 million.
Discharge concentrations for Amm-N and TN are expected to significantly reduce and this
is reflected in the allowable concentrations in the proposed conditions following
installation of the biological treatment system.
The annual TN load will also reduce significantly relative to current, even if the Plant
operates at a significantly increased capacity relative to the numbers of stock processed in
the past five years.
Discharge Limits
ln accordance with the advice of Alliance's technical advisors, the proposed conditions
include:
A series of day to day compliance limits on the concentration of key parameters in the
wastewater discharge; and
Compliance limits on the total annual load of nutrients the Plant contributes to the
catchment per year.
The day to day concentration limits are important in respect of the discharge's effects on
the Mataura River, and are included for this purpose.
The annual load limits are important in respect of the discharge's effects on Toetoes
Estuary and are included for this purpose.
9.3.2.1 Day to Day Consent Limits
Concentration based limits are included to protect the Mataura River. As set out in Table
10 below, the proposed conditions include four stages of concentration-based limits as,
namely:
Limits which apply immediately, and which reflect the limits on the existing consent
and current discharge quality;
Limits which apply following the implementation of the Resilience and Water
Saving Strategy - which is expected to reduce water use by more than 30%, and
wastewater discharge volumes by a similar amount. The total load of each parameter
is not expected to change as a result, but the concentration of each parameter in the
wastewater discharge is expected to increase due to that load being entrained within
a lower volume of wastewater. The proposed conditions do not specifo what the
a
a
a
a
Alliance Group Limited - Mataura Processing PlantAssessment of Environmental Effects 54
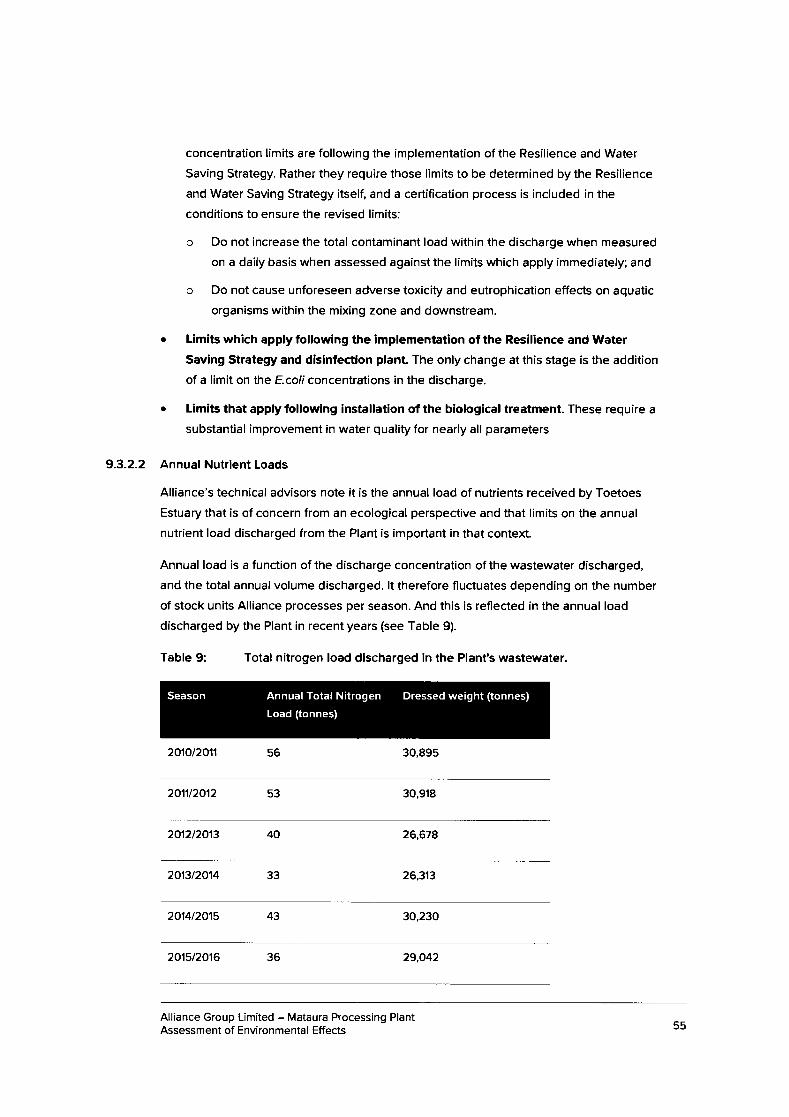
concentration limits are following the implementation of the Resilience and Water
Saving Strategy. Rather they require those limiG to be determined by the Resilience
and Water Saving Strategy itself, and a certification process is included in the
conditions to ensure the revised limits:
o Do not increase the total contaminant load within the discharge when measured
on a daily basis when assessed against the limits which apply immediately; and
o Do not cause unforeseen adverse toxicity and eutrophication effects on aquatic
organisms within the mixing zone and downstream.
Limits which apply following the implementation of the Resilience and Water
Saving Strategy and disinfection plant. The only change at this stage is the addition
of a limit on the E coli concentrations in the discharge.
Limits that apply following installation of the biological treatment. These require a
substantial improvement in water quality for nearly all parameters
9.3-2.2 Annual Nutrient Loads
Alliance's technical advisors note it is the annual load of nutrients received by Toetoes
Estuary that is of concern from an ecological perspective and that limits on the annual
nutrient load discharged from the Plant is important in that conte)ft.
Annual load is a function of the discharge concentration of the wastewater discharged,
and the total annual volume discharged. lt therefore fluctuates depending on the number
of stock units Alliance processes per season. And this is reflected in the annual load
discharged by the Plant in recent years (see Table 9).
Table 9: Total nitrogen load discharged in the Plant's wastewater.
201012011 56 30,89s
201'.v2012 53 30,918
201212013 40 26,678
2013t2014 33 26,313
201412015 43 30,230
201512016 36 29,O42
a
a
Annual Total Nitrogen
Load (tonnes)
Dressed weight (tonnes)Season
Alliance Group Limited - Mataura Processing PlantAssessment of Environmental Effects 55
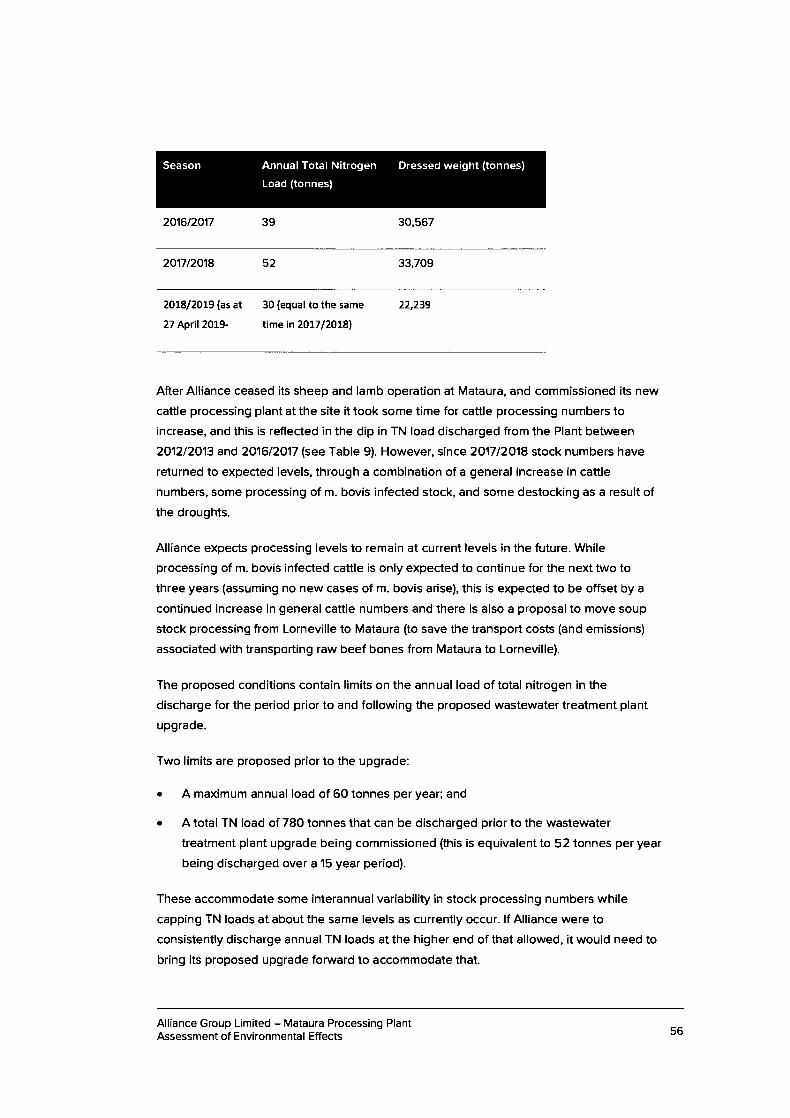
Annual Total Nitrogen Dressed weight (tonnes)
Load (tonnes)
Season
2016t2017 39 30,567
2017t2018 52 33,709
2018/2019 (as at
27 April2O!9-
30 (equal to the same
time in 201712018)
22,239
After Alliance ceased its sheep and lamb operation at Mataura, and commissioned its new
cattle processing plant at the site it took some time for cattle processing numbers to
increase, and this is reflected in the dip in TN load discharged from the Plant between
201212013 and 201612017 (see Table 9). However, since 201712O18 stock numbers have
returned to expected levels, through a combination of a general increase in cattle
numbers, some processing of m. bovis infected stock, and some destocking as a result of
the droughts.
Alliance expects processing levels to remain at current levels in the future. While
processing of m. bovis infected cattle is only expected to continue for the next two to
three years (assuming no new cases of m. bovis arise), this is expected to be offset by a
continued increase in general cattle numbers and there is also a proposal to move soup
stock processing from Lorneville to Mataura (to save the transport costs (and emissions)
associated with transporting raw beef bones from Mataura to Lorneville).
The proposed conditions contain limits on the annual load of total nitrogen in the
discharge for the period prior to and following the proposed wastewater treatment plant
upgrade.
Two limits are proposed prior to the upgrade:
A maximum annual load of 60 tonnes per year; and
A total TN load of 780 tonnes that can be discharged prior to the wastewater
treatment plant upgrade being commissioned (this is equivalent to 52 tonnes per year
being discharged over a'15 year period).
These accommodate some interannual variability in stock processing numbers while
capping TN loads at about the same levels as currently occur. lf Alliance were to
consistently discharge annual TN loads at the higher end of that allowed, it would need to
bring its proposed upgrade forward to accommodate that.
Alliance Group Limited - Mataura Processing PlantAssessment of Envi ronmental Effects 56

The limit which applies following the wastewater treatment plant upgrade is 25 tonnes per
year. This represents approximately a 50% reduction in annual load relative to that which
is currently occurring.
Alliance Group Limited - Mataura Processing PlantAssessment of Envi ronmenta I Effects 57
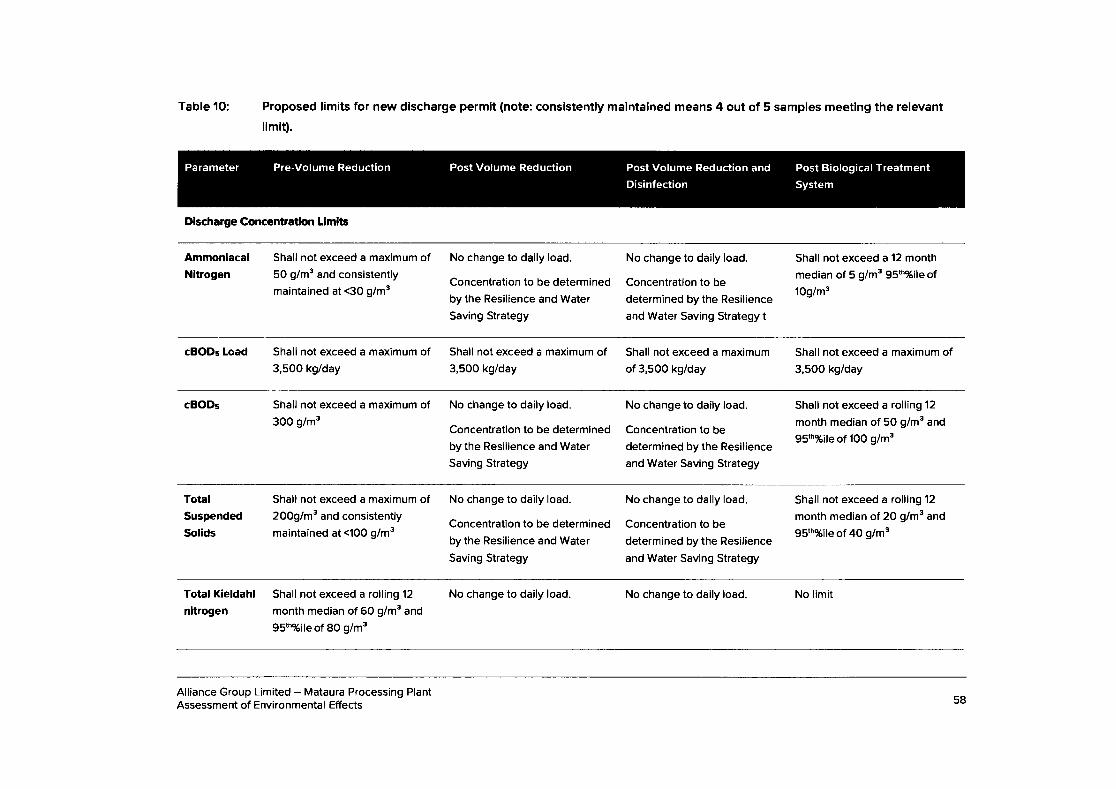
Table'lO: Proposed limits for new discharge permit (note: consistently maintained means 4 out of 5 samples meeting the relevant
limit).
Dlscharge Concentratlon Llmlts
Post Volume Reduction and
Disinfection
Post Biological Treatment
System
Post Volume ReductionParameter Pre-Volume Reduction
Ammoniacal
Nltrogen
Shall not exceed a maximum of5O g/m3 and consistently
maintained at <30 g/m3
No change to daily load.
Concentration to be determined
by the Resilience and Water
Saving Strategy
No change to daily load.
Concentration to be
determined by the Resilience
and Water Saving Strategy t
Shall not exceed a 12 month
median of 5 g/m3 95th%ile of'l0g/m3
cBODs Load Shall not exceed a maximum of3,500 kglday
Shall not exceed a maximum of3,500 kglday
Shall not exceed a maximum
of 3,500 kglday
Shall not exceed a maximum of3,500 kglday
cBODs Shall not exceed a maximum of
3OO g/m3
No change to daily load.
Concentration to be determined
by the Resilience and Water
Saving Strategy
No change to daily load
Concentration to be
determined by the Resilience
and Water Saving Strategy
Shall not exceed a rolling '12
month median of 5O g/m3 and
95th%ile of 1OO g/m3
Total
Suspended
Solids
Shall not exceed a maximum of200g/m3 and consistently
maintained at <1OO g/m3
No change to daily load.
Concentration to be determined
by the Resilience and Water
Saving Strategy
No change to daily load.
Concentration to be
determined by the Resilience
and Water Saving Strategy
Shall not exceed a rolling 12
month median of 2O g/m3 and
95th%ile of 40 g/m3
Total Kieldahl
nitrogenShall not exceed a rolling 12
month median of 6O g/m3 and
95th%ile of 8O g/m3
No change to daily load. No change to daily load. No limit
Alliance Group Limited - Mataura Processing PlantAssessment of Environmental Effects 58
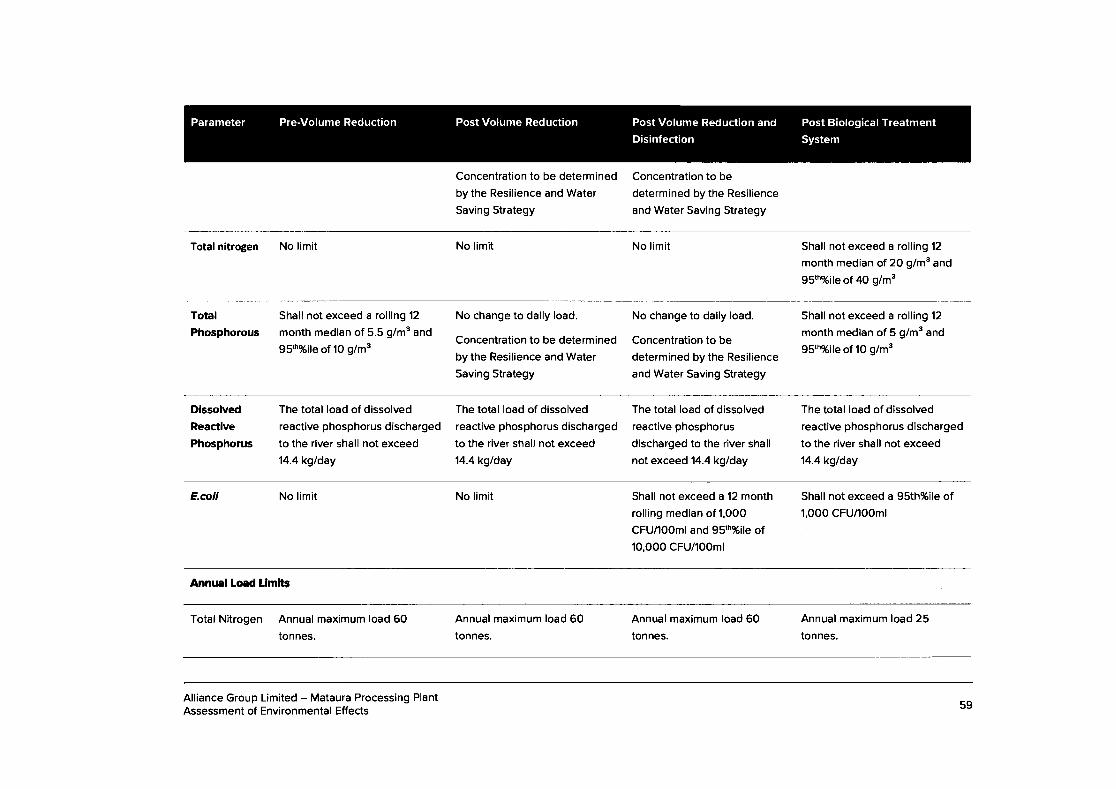
Post Volume Reduction and
Disinfection
Post Biological Treatment
System
Post Volume ReductionParameter Pre-Volume Reduction
Concentration to be determined
by the Resilience and Water
Saving Strategy
Concentration to be
determined by the Resilience
and Water Saving Strategy
Total nitrogen No limit No limit No limit Shall not exceed a rolling 12
month median of 2O g/m3 and
95th%ile of 4O g/m3
Total
Phosphorous
Shall not exceed a rolling 12
month median of 5.5 g/m3 and
9Sth%ile of 1O g/m3
No change to daily load.
Concentration to be determined
by the Resilience and Water
Saving Strategy
No change to daily load.
Concentration to be
determined by the Resilience
and Water Saving Strategy
Shall not exceed a rolling 12
month median of 5 g/m3 and
95th%ileof 10 g/m3
Dissolved
Reactive
Phosphorus
The total load of dissolved
reactive phosphorus discharged
to the river shall not exceed
14.4 kglday
The total load of dissolved
reactive phosphorus discharged
to the river shall not exceed
14.4 kglday
The total load of dissolved
reactive phosphorus
discharged to the river shall
not exceed 14.4 kglday
The total load of dissolved
reactive phosphorus discharged
to the river shall not exceed
l4.4kglday
E.coli No limit No limit Shall not exceed a 12 month
rolling median of I,OOO
CFU/'|OOml and 9Sth%ile of10,000 CFU/1OOml
Shall not exceed a 95th%ile of1,O00 CFU/1OOmr
Annual Load Llmlts
Total Nitrogen Annual maximum load 6O
tonnes.
Annual maximum load 60tonnes.
Annual maximum load 6O
tonnes.
Annual maximum load 25
tonnes.
Alliance Group Limited - Mataura Processing PlantAssessment of Environmental Effects 59
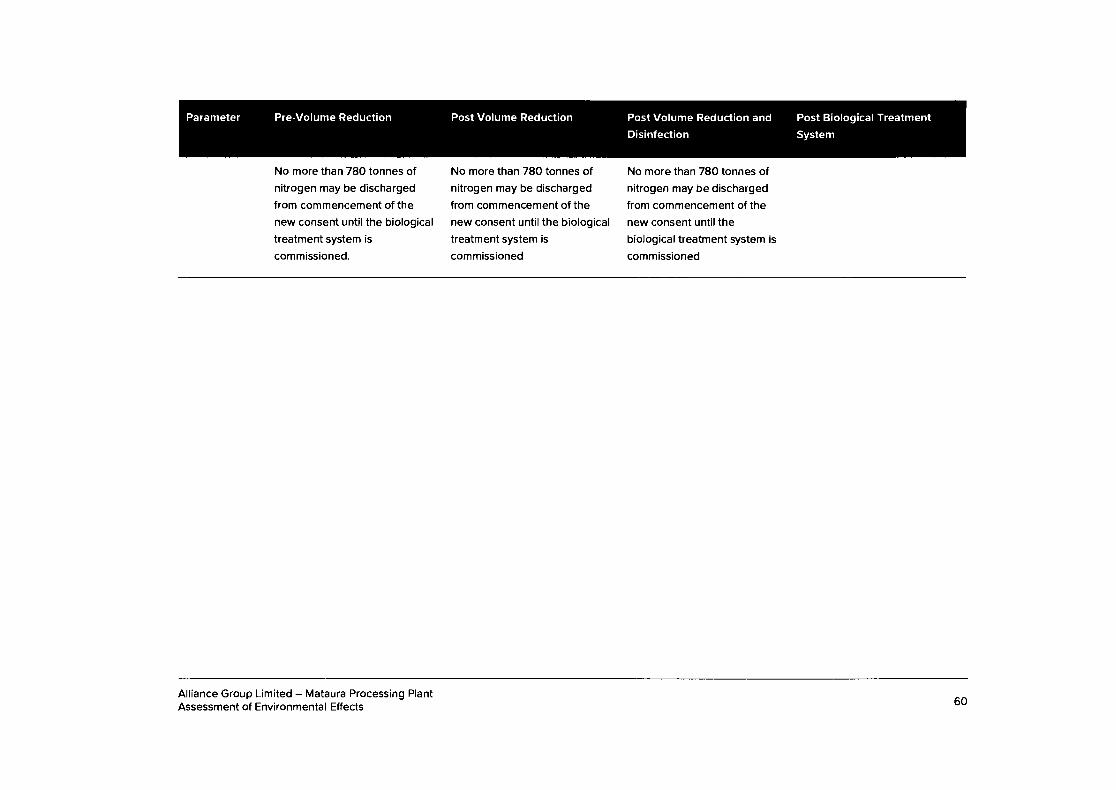
Post Volume Reduction and
Disinfection
Post Biological Treatment
System
Post Volume ReductionParameter Pre-Volume Reduction
No more than 78O tonnes ofnitrogen may be discharged
from commencement of the
new consent until the biological
treatment system is
commissioned.
No more than 780 tonnes ofnitrogen may be discharged
from commencement of the
new consent until the biological
treatment system is
commissioned
No more than 780 tonnes ofnitrogen may be discharged
from commencement of the
new consent until the
biological treatment system is
commissioned
Alliance Group Limited - Mataura Processing PlantAssessment of Environmental Effects 60
9.3.3 Monitoring
Central to the monitoring required by the proposed conditions, is the preparation and
implementation of a comprehensive new Environmental Monitoring Plan (EMP).
The purpose of the EMP is to describe the methods for monitoring the physical
characteristics and water quality parameters of the discharge, and the physical, water
quality and biological characteristics and parameters of the Mataura River receiving
waters.
The objectives of the monitoring are to:
a Confirm compliance with consent limits on discharge quality; and
Understand the effects of the discharge on Mataura River water quality and instream
ecology and confirm no unexpecled effecls are arising as a result of the exercise of
this consent.
The proposed conditions require the EMP to include but not be limited to:
o A description and maps identif,Ting the monitoring sites;
o A description of the methods and appropriate timing for undertaking the following
monitoring requirements:
o Discharge stream monitoring
o Receiving water quality monitoring
o Ecological instream monitoring
o Fish health monitoring
o Reportingrequirements.
As a minimum, the EMP is to require:
o The time and volume of treated wastewater discharged each day to be recorded;
. Representative weekly samples of treated wastewater at the point of discharge, and
of receiving water both upstream and downstream of the point of discharge, while a
discharge is occurring for the parameters set out in Table 11 below;
r Ecological monitoring to understand the effects of the discharge including by
monitoring the periphyton and benthic invertebrate communities of the Mataura River
at points above and below the point of the discharge;
o Provision for fish health monitoring.
Alliance Group Limited - Mataura Processing PlantAssessment of Environmental Effects
a
61
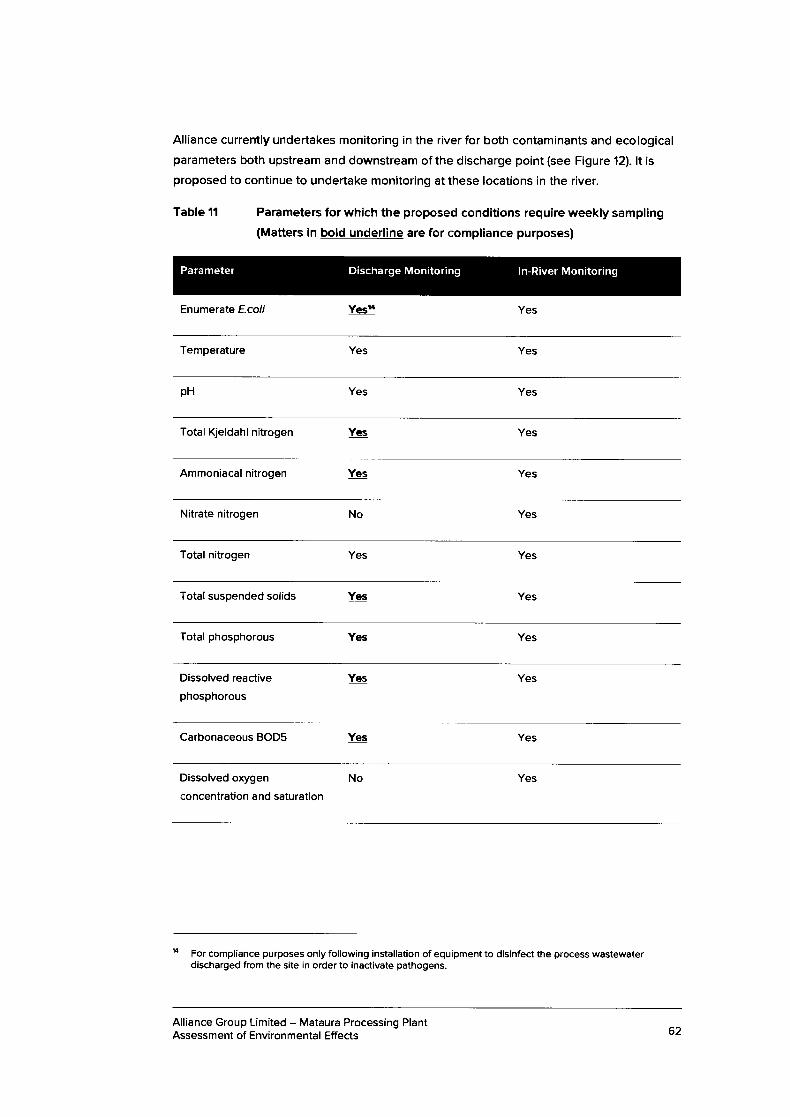
Alliance currently undertakes monitoring in the river for both contaminants and ecological
parameters both upstream and downstream of the discharge point (see Figure 12). lt is
proposed to continue to undertake monitoring at these locations in the river.
Table 11 Parameters for which the proposed conditions require weekly sampling
(Matters in bold underline are for compliance purposes)
Enumerate Ecoli Yesr Yes
Parameter Discharge Monitoring ln-River Monitoring
Temperature Yes Yes
pH Yes Yes
Total Kjeldahl nitrogen Yes Yes
Ammoniacal nitrogen Yes Yes
Nitrate nitrogen No Yes
Total nitrogen Yes Yes
Total suspended solids YCs Yes
Total phosphorous Yes Yes
Dissolved reactive
phosphorous
Yes Yes
Carbonaceous BOD5 Yes Yes
Dissolved orygen
concentration and saturation
No Yes
14 For compliance purposes only following installation of equipment to disinfect the process wastewaterdischarged from the site in orderto inactivate pathogens.
Alliance Group Limited - Mataura Processing PlantAssessment of Environmental Effects 62
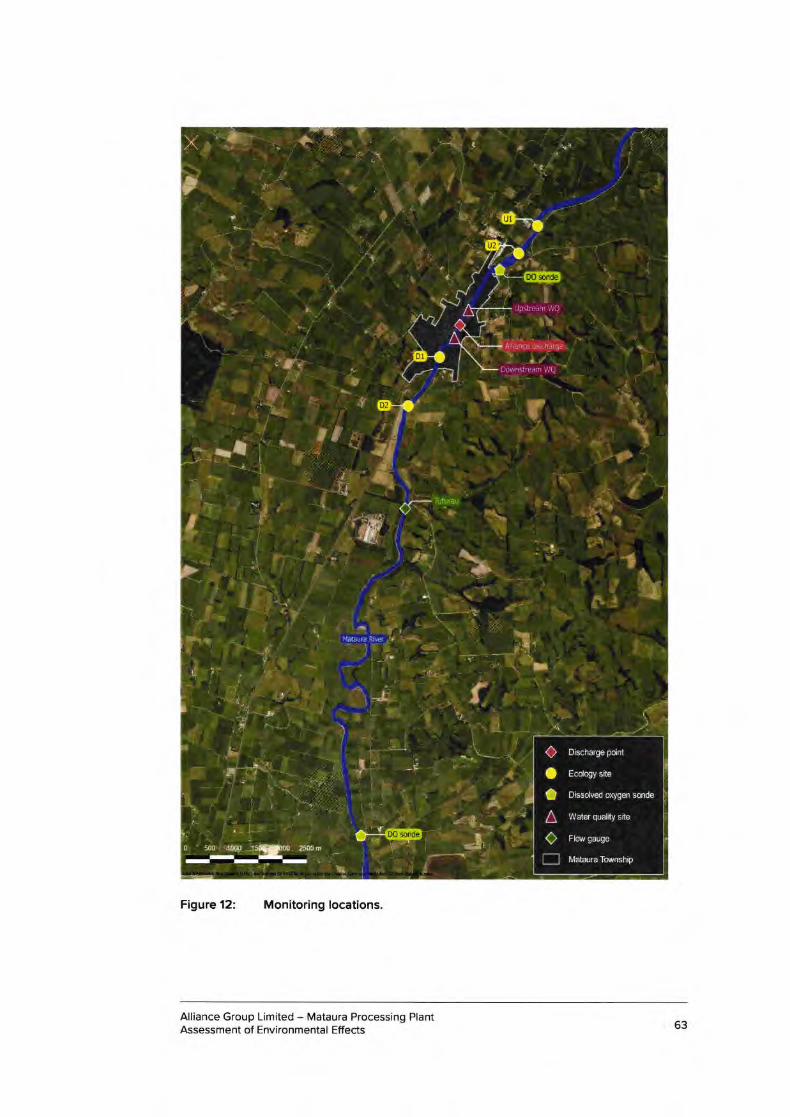
Figure 12: Monitoring locations.
Alliance Group Limited - Mataura Processing PlantAssessment of Environmental Effects 63
9.4 KAITIAK!INPUT
TAMI and Hokonui Runanga have both expressed the view that meaningful ongoing
engagement and suitably recognising the role of Hokonui Runanga as kaitiaki of the
Mataura River is important in respect of the proposed activities.
Alliance is committed to doing this and is committed to continuing to work with TAMI and
Hokonui Runanga on exactly how this should be done.
Alliance is in the process of establishing a Memorandum of Understanding with Hokonui
Runanga which is expected to incorporate these principles.
9.5 SUMMARY OF MITIGATION, MONITORING AND OTHER MEASURES FOR
MANAGING ADVERSE EFFECTS
A range of mitigation, remediation, management and monitoring measures are either
occurring at the Plant or are recommended as part of this consent process. These
measures are summarised in Table 12 below:
Alliance Group Limited - Mataura Processing PlantAssessment of Environmental Effects 64
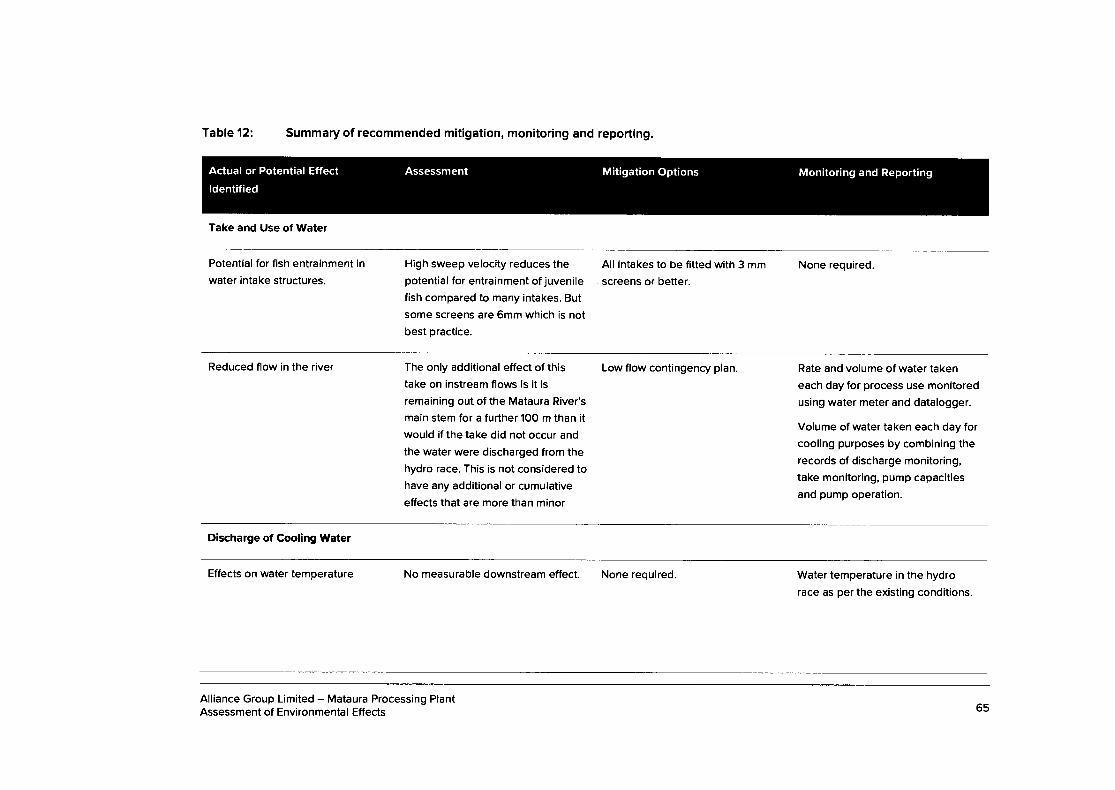
Table 12: Summary of recommended mitigation, monitoring and reporting.
Take and Use of Water
Actual or Potential Effect
ldentifiedMitigation Options Monitoring and ReportingAssessment
Potential for fish entrainment in
water intake structures.
High sweep velocity reduces thepotential for entrainment of juvenile
fish compared to many intakes. But
some screens are 6mm which is not
best practice.
All intakes to be fitted with 3 mm
screens or better.
None required
Reduced flow in the river The only additional effect of this
take on instream flows is it is
remaining out of the Mataura River's
main stem for a further 100 m than it
would if the take did not occur and
the water were discharged from the
hydro race. This is not considered to
have any additional or cumulative
effects that are more than minor
Low flow contingency plan. Rate and volume of water taken
each day for process use monitored
using water meter and datalogger.
Volume of water taken each day for
cooling purposes by combining the
records of discharge monitoring,
take monitoring, pump capacities
and pump operation.
Discharge of Coollng Water
Effects on water temperature No measurable downstream effect. None required. Water temperature in the hydro
race as per the existing conditions.
Alliance Group Limited - Mataura Processing PlantAssessment of Environmenta I Effects 65
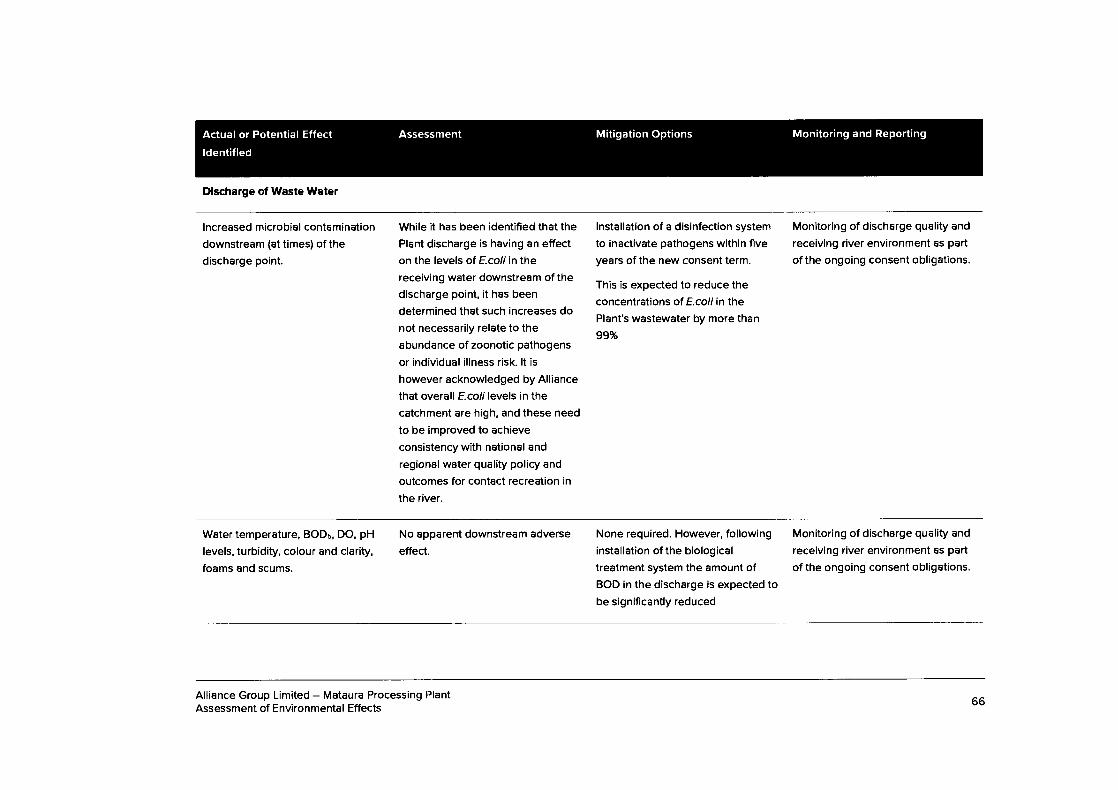
Actual or Potential Effect
ldentified
Mitigation Options Monitoring and ReportingAssessment
Dlscharge of Waste Water
lncreased microbial contamination
downstream (at times) of the
discharge point.
While it has been identified that the
Plant discharge is having an effect
on the levels of E co/l in the
receiving water downstream of the
discharge point, it has been
determined that such increases do
not necessarily relate to the
abundance of zoonotic pathogens
or individual illness risk. lt is
however acknowledged by Alliance
that overall E col levels in the
catchment are high, and these need
to be improved to achieve
consistency with national and
regional water quality policy and
outcomes for contact recreation in
the river.
lnstallation of a disinfection system
to inactivate pathogens within fiveyears of the new consent term.
This is expected to reduce the
concentrations of E coll in the
Plant's wastewater by more than
99%
Monitoring of discharge quality and
receiving river environment as part
of the ongoing consent obligations.
Water temperature, BODs, DO, pH
levels, turbidity, colour and clarity,
foams and scums.
No apparent downstream adverse
effect.
None required. However, following
installation of the biological
treatment system the amount ofBOD in the discharge is expected to
be signifi cantly reduced
Monitoring of discharge quality and
receiving river environment as part
of the ongoing consent obligations.
Alliance Group Limited - Mataura Processing PlantAssessment of Environmental Effects
66
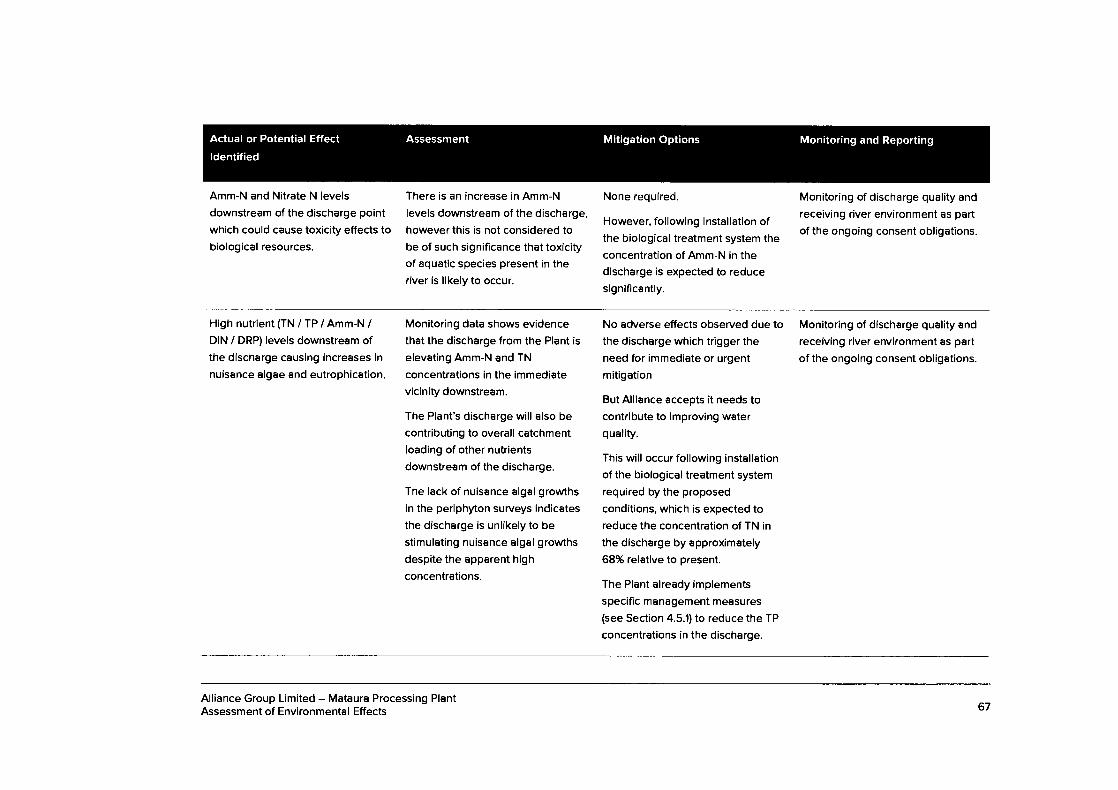
Actual or Potential Effect
ldentified
Assessment Mitigation Options Monitoring and Reporting
Amm-N and Nitrate N levels
downstream of the discharge point
which could cause toxicity effects to
biological resources.
There is an increase in Amm-N
levels downstream of the discharge,
however this is not considered tobe of such significance that toxicityof aquatic species present in the
river is likely to occur.
None required.
However, following i nstallation ofthe biological treatment system the
concentration of Amm-N in thedischarge is expected to reduce
significantly.
Monitoring of discharge quality and
receiving river environment as part
of the ongoing consent obligations.
High nutrient (TN / TP / Amm-N /DIN / DRP) levels downstream ofthe discharge causing increases in
nuisance algae and eutrophication.
Monitoring data shows evidence
that the discharge from the Plant is
elevating Amm-N and TN
concentrations in the immediate
vicinity downstream.
The Plant's discharge will also be
contributing to overall catchment
loading of other nutrients
downstream of the discharge.
The lack of nuisance algal growths
in the periphyton surveys indicates
the discharge is unlikely to be
stimulating nuisance algal growths
despite the apparent high
concentrations.
No adverse effects observed due to
the discharge which trigger the
need for immediate or urgent
mitigation
But Alliance accepts it needs tocontribute to improving waterquality.
This will occur following installation
of the biological treatment system
required by the proposed
conditions, which is expected toreduce the concentration of TN in
the discharge by approximately
68% relative to present.
Monitoring of discharge quality and
receiving river environment as part
of the ongoing consent obligations.
The Plant already implements
specifi c management measures
(see Section 4.5.1) to reduce the TP
concentrations in the discharge.
Alliance Group Limited - Mataura Processing PlantAssessment of Environmenta I Effects 67
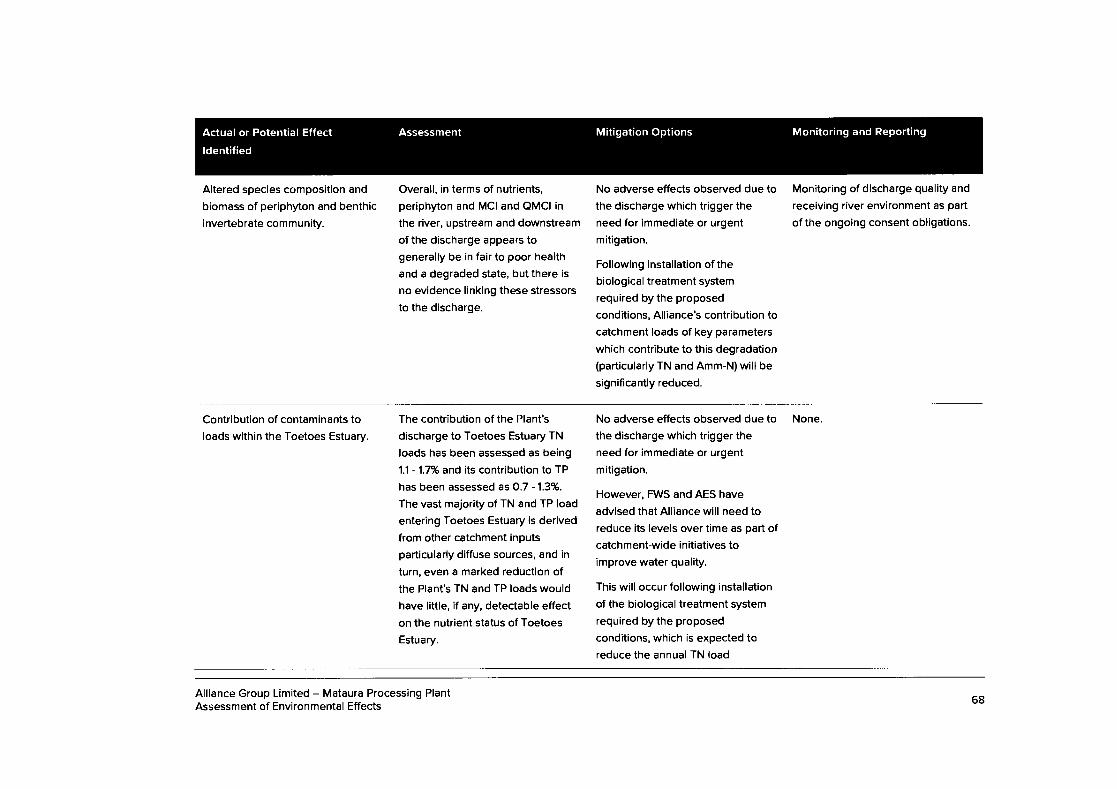
Actual or Potential Effect
ldentified
Mitigation Options Monitoring and ReportingAssessment
Altered species composition and
biomass of periphyton and benthic
invertebrate community.
Overall, in terms of nutrients,
periphyton and MCI and QMCI in
the river, upstream and downstream
ofthe discharge appears togenerally be in fair to poor health
and a degraded state, but there is
no evidence linking these stressors
to the discharge.
No adverse effects observed due to
the discharge which trigger the
need for immediate or urgent
mitigation.
Following installation of the
biological treatment system
required by the proposed
conditions, Alliance's contribution to
catchment loads of key parameters
which contribute to this degradation(particularly TN and Amm-N) will be
significantly reduced.
Monitoring of discharge quality and
receiving river environment as part
of the ongoing consent obligations.
Contribution of contaminants toloads within the Toetoes Estuary
The contribution of the Plant's
discharge to Toetoes Estuary TN
loads has been assessed as being
1.1 - 1.7% and its contribution to TP
has been assessed as 0.7 -'1.3%.
The vast majority of TN and TP load
entering Toetoes Estuary is derived
from other catchment inputs
particularly diffuse sources, and in
turn, even a marked reduction ofthe Plant's TN and TP loads would
have little, if any, detectable effect
on the nutrient status of Toetoes
Estuary.
No adverse effects observed due to
the discharge which trigger the
need for immediate or urgent
mitigation.
However, FWS and AES have
advised that Alliance will need to
reduce its levels over time as part ofcatchment-wide i nitiatives to
improve water quality.
This will occur following installation
of the biological treatment system
required by the proposed
conditions, which is expected to
reduce the annual TN load
None.
Alliance Group Limited - Mataura Processing PlantAssessment of Environmental Effects
68
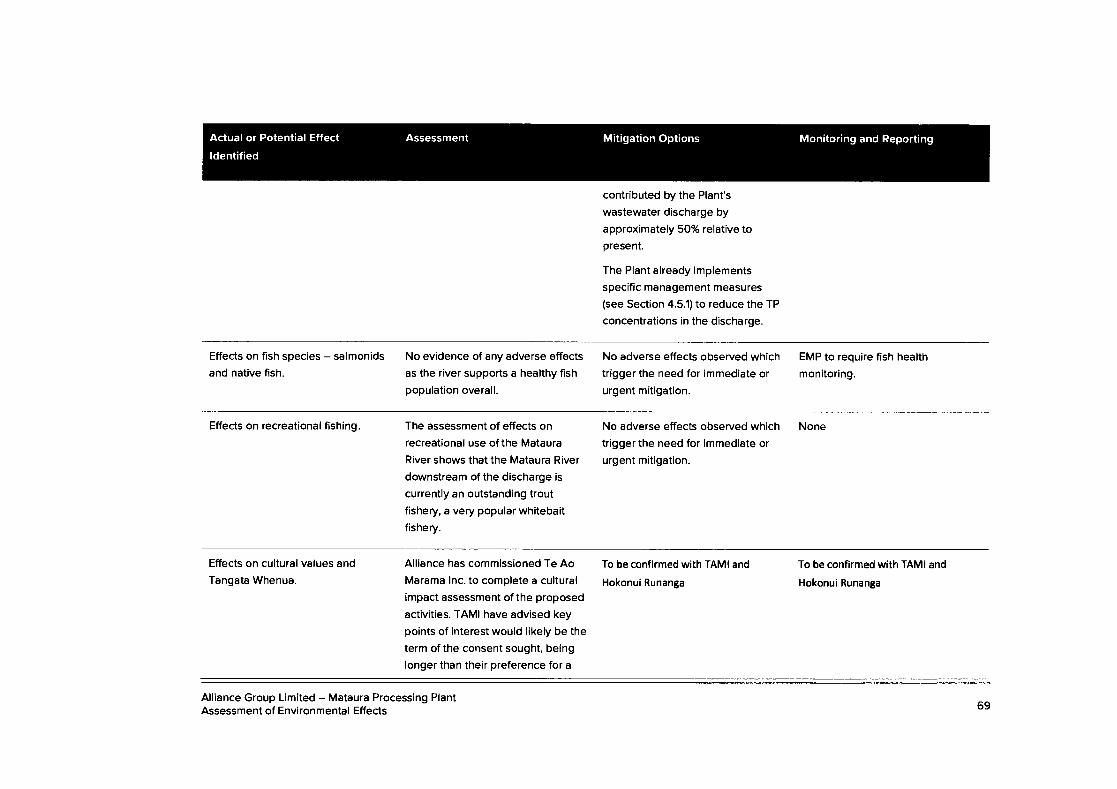
Actual or Potential Effect
ldentified
Mitigation Options Monitoring and ReportingAssessment
contributed by the Plant's
wastewater discharge by
approximately 50% relative topresent.
The Plant already implements
specific management measures
(see Section 4.5.1) to reduce the TP
concentrations in the discharge.
Effects on fish species - salmonids
and native fish.
No evidence of any adverse effects
as the river supports a healthy fish
population overall.
No adverse effects observed which
trigger the need for immediate or
urgent mitigation.
EMP to require fish health
monitoring.
Effects on recreational fishing. The assessment of effects on
recreational use of the Mataura
River shows that the Mataura River
downstream of the discharge is
currently an outstanding trout
fishery, a very popular whitebait
fishery.
No adverse effects observed which
trigger the need for immediate or
urgent mitigation.
None
Effects on cultural values and
Tangata Whenua.
Alliance has commissioned Te Ao
Marama lnc. to complete a cultural
impact assessment of the proposed
activities. TAMI have advised key
points of interest would likely be the
term ofthe consent sought, being
longer than their preference for a
To be confirmed with TAMI and
Hokonui Runanga
To be confirmed with TAMI and
Hokonui Runanga
Alliance Group Limited - Mataura Processing PlantAssessment of Environmental Effects 69
Actual or Potential Effect
ldentified
Mitigation Options Monitoring and ReportingAssessment
maximum term of 25 years, and the
decision to continue to discharge to
water rather than land.
Alliance Group Limited - Mataura Processing PlantAssessment of Environmental Effects 70
ro.
10.r
CONSIDERATION OF ALTERNATIVES AND THE BEST
PRACTICABTE OPTION
INTRODUCTION
Under the RMA, a consideration of alternative locations and methods is relevant in certain
respects:
r Schedule 4 requires an AEE to include a description of any possible alternative
locations or methods for undertaking the activity where it is likely that the activity will
have a significant adverse effect on the environment;
o Where an activity includes the discharge of a contaminant, Schedule 4 also imposes
an obligation on an applicant to provide a description of any possible alternative
methods of discharge, including discharge into any other receiving environment;
o Similarly, section 105 of the RMA requires decision makers to have regard to various
matters including "any possible alternative methods of discharge, including discharge
into any other receiving environment"; and
o Section 108 of the RMA also sets out that a condition may be imposed on a discharge
permit requiring the consent holder to adopt the best practicable option in order toprevent or minimise any actual or likely adverse effects on the environment of the
discharge.
As is set out in Section 12.7.3 below, adoption of the best practicable option is also a keypolicy directive in the Proposed Plan for managing the treatment and discharge ofcontaminants derived from industrial and trade processes.
As defined in section 2 of the RMA, the best practicable option (BPO) in relation to a
discharge of a contaminant means:
Ihe best metf,od for preventing or minimising the odverse e,Tects on theenvironment hoving regord, omong other things, to-(o) the noture of the dischorge or emission ond the sensitivity of the receiving
environment to odverse effects; ond
(b) the finonciol implicotions, ond the effects on the environment, of thot optionwhen compored with other options; ond
(c) the current stote of technicol knowledge ond the likelihood thot the optioncon be successfully opplied.
Determining what the BPO is in a given circumstance requires a decision maker to weigh
competing considerations, including the nature of the discharge, sensitivity of the
environment and practicalities of that and any other option. The use of the words namong
other things" clearly signals that other factors can also be taken into consideration.
Alliance Group Limited - Mataura Processing PlantAssessment of Environmental Effects 71
As noted in the quote below, the words'BPO' do not mean the best option, the best
technical option, the best economic option, or the best environmental option. Nor do they
require adherence to what might be considered "best praclice". A judgement needs to be
made as to what is practicable and proportionate to the risks likely from a contaminant tobe discharged. The key word is 'practicable' and this means not granting consents that
require adherence to an option that would be prohibitively expensive or involve
procedures that are unnecessarily onerous or impractical.
These considerations have been summarised by Dr Royden Somerville QC in his paper
"How to give effect in regional plans to the National Policy Statement for Freshwater
Management 2011', dated 20 January 2012:
"The words 'best procticoble option' do not meon the best option, the best technicoloption, the best economic option, or the best environmentol option. A judgement
needs to be mode os to whot is procticoble ond proportionote to the risks likely from
o contominont. The Shorter Oxford English Dictionory defines'prodicoble" os
"copoble of being corried out in oction; feosible".
ln Medicol Officer of Heolth v CRC, it wos held thot "procticoble" is the key word inthe definition of BPO, ond itwould be wrong to impose conditions which offordedthe holder no procticol meons of complionce.
The words 'omong other things" in the definition do not limit the considerotions oregionol council moy oddress, to those motters in poros (o), (b) ond (c).
The motters in porogrophs (o), (b) ond (c) ore relotive. This opprooch refrects the'principle of proportionolity" which ollows for o dilution of obsolute stondords ond isused in Europeon community low. Some oyerseos jurisdictions put more emphoslson technicol options for oddressing pollution. This is sometimes known os otechnologicolly forcing regulotory opprooch. The BPO is the optimum combinotion ofoll methods to monoge the risk of on odverse environmentol effect to the greotest
extent prodicoble. lt is necessory to consider the options ond finonciol implicotionswhen determining how best to ottoin the BPO.
Thus, whot const'tutes the BPO in ony given cose ,s o question of foct ond degree.Regord is to be hod primorily to oll three subsections (o), (b) ond (c) of the definition,ofthough one or more moy be given more weight thon others in ony given cose. If,eenvironmentol performonce torgets being ospired to by using the BPO should be setout in the documentotion."
As part of its preliminary resource consent investigations, Alliance has undertaken an
extensive assessment into the availability and practicalities of alternative methods and
technologies in order to minimise any actual or potential adverse effects arising from its
discharges to water. This section of the report summaries these investigations and
determination of the best practicable options available to be implemented now and in the
future.
Alliance Group Limited - Mataura Processing PlantAssessment of Environmenta I Effects 72
1O.2 OPTIONS ASSESSMENT
For reasons outlined in Seclion 8, a comprehensive assessment of the effects of the
discharge on the receiving environment determined that no adverse effects trigger the
need for immediate or urgent mitigation. However, it noted the Mataura River is degraded
in respect of E.coli and nutrients, and advised that Alliance should be reducing the amount
of E.coli, Amm-N and TN it contributes to catchment loading as part of long term efforts to
improve water quality in the catchment.
Alliance sought advice from PDP on what methods and technology could be potentially
employed to do this over the term of the consent to be sought.
The PDP options assessment is included as Appendix 7 to this AEE.
As an initial step, PDP developed a long-list of available alternative management options
for the Plant. Options incorporating continued discharge to the Mataura River, irrigation to
land, or a dual discharge combination, and discharge to trade waste were considered. Of
the assessed long list options, those incorporating significant risk and uncertainty, and
substantial lifecycle costs were removed from further assessment.
The options selected for further assessment included:
o Existing river discharge with biological treatment for BOD and nitrogen removal with
UV disinfection;
o Existing river discharge with filtration and UV disinfection;
o Existing river discharge with biological treatment for BOD and nitrogen removal of the
green waste stream with UV disinfection ;
o Dual discharge with the existing river discharge combined with discharge to dairy
pasture with no treatment prior to river discharge; and
o Dual discharge with the existing river discharge combined with discharge to a cut and
carry system with no treatment prior to river discharge.
Each of the short-listed options was then assessed further, considering the potential for
the option to reduce contaminant loads to the Mataura River, practical matters, option
resilience and lifecycle costs.
IO.3 PROPOSED APPROACH
After considering each option through the lens of the BPO test described in Section 1O.1
above, improved treatment via a staged upgrade of the Plant's wastewater treatment
plant, and continued disposal to the Mataura River was selected.
As outlined in Section 4.5.2, the staged upgrade of the wastewater treatment plant
includes:
Alliance Group Limited - Mataura Processing PlantAssessment of Environmental Effects 73
a
a
Year 1 - 3: lmplementing water reduction opportunities and addressing existing
resilience issues.
Year 5: Tertiary disinfection of microbial contaminants with a UV system (or
similar) to reduce E co/i concentrations.
Year 15: Biological treatment of the wastewater to reduce TN, Amm-N and BOD.
The proposed option is considered to be the BPO for the following reasons:
The technical assessments identified no adverse effects of the Alliance discharge
requiring immediate or urgent redress.
The proposed option achieves significant year-round long term reductions in the
Plant's discharge of Amm-N, TN and E.coli which are identified as the key parameters
of concern in this catchment with respect to water quality.
The most signiflcant effect of the Plant's discharge on instream water quality and
instream contaminant loads is on E.coli levels, and the preferred option achieves a
significant year-round reduction in the E coli concentrations discharged by the Plant
relatively soon.
The magnitude of the proposed long term reductions in the Plant's discharge of the
key contaminants (approximately 68% reduction in concentration and 50% reduction
in load for TN, and a greater than 99% reduclion in E.colf are expected to be more
than proportionate to the baseline reduction in these key contaminants required by
the new planning framework established for this catchment to give effect to the
Freshwater NPS (see Section 12.2).
The required timeframes for the reduclion of these key contaminants are also
expected to be more expedient than the corresponding timeframes required by that
new planning framework for achieving a meaningful reduction in the input from the
diffuse sources which contribute a significant majority of overall catchment loading.
a The costs of the upgrade option will have significant financial implications for Alliance.
However, the proposed timeframes allow the capital expenditure to be integrated into
Alliance's long term capital expenditure plan over the first 15 years of the
commencement of the new consent in a manageable way.
a The technology involved in the proposed upgrades to the wastewater treatment plant
is proven and there is a high degree of certainty it will achieve the environmental
outcomes anticipated. lt is also subject to a lower degree of operational complexity
and uncertainty than many of the other options considered, particularly options
incorporating land-based disposal.
Alliance Group Limited - Mataura Processing PlantAssessment of Environmental Effects
a
a
a
a
74
10.4 ALTERNATIVE OPTIONS
During consultation TAMI and Fish and Game both expressed an interest in why a river
rather than land based discharge is proposed.
Environment Southland also expressed the view that Alliance should demonstrate why
earlier installation of the biological treatment is not the best practicable option.
Over recent months, Alliance has given significant consideration to these alternative
options, and an overview of why Alliance does not consider they are the best praclicable
option in this case is provided below.
1o..4.1 Discharge to Land
As outlined in Section 12, the Operative and Proposed Plans, and Te Tangi a Tauira - The
Cry of the People (the relevant iwi management plan) express a preference for wastewater
being discharged to land rather than directly to water. During consultation TAMI and Fish
and Game both expressed an interest in why a river rather than land based discharge is
proposed.
10.4.1.1
Of relevance to this preference the PDP options assessment identified:
o Options for avoiding a discharge to the Mataura River completely and
o Dual discharge options which would largely confine the Mataura River discharge to
the period May to November inclusive.
An overview of why each is not considered the best practicable option for disposal of the
Plant's wastewater is provided below.
Avoiding a River Based Discharge
PDP identified two general options for avoiding any river-based discharge:
o Year-round irrigation of the Plant's wastewater on neighbouring farmland; and
Construction of a biological treatment and storage facility of sufficient capacity to
store effluent from May to September, with irrigation to neighbouring farmland
occurring exclusively between October to April.
Year-Round Irrigation
The PDP report identified two options for year-round irrigation of neighbouring farmland
o Slow rate irrigation to dairy grazing land owned by a third party; and
o Slow rate irrigation to company owned cut and carry operation.
However, it identified significant issues with each option, namely:
Alliance Group Limited - Mataura Processing PlantAssessment of Environmental Effects 75
a Operational complexities associated with irrigating in this environment during winter
and during wet summer periods;
Difficulty in finding suitable land; and
A significant increase in costs for a company owned cut and carry operation due to
the need to purchase land.
With respecl to the first matter, PDP has identified the hydraulic capacity of the soil on
farmland, and a lack of soil moisture deficit, significantly limits the ability to irrigate
wastewater to that land during winter, and during wet summer periods. lrrigation to
saturated land is particularly problematic from an environmental perspective due to the
significant runoff of nutrients that can occur.
This hydraulic limitation would be particularly difficult to manage for any option involving
irrigation of dairy grazing land owned by a third party due to the operational requirements
of the dairy farm, and the lower degree of ground saturation that can be accommodated.
The large wastewater volume generated by the Plant also means a large area of land is
needed for year-round irrigation (>160ha).The flatter land around Mataura does not have
soils with favourable properties for irrigation, and the areas with moderate to well-draining
soils are found to the east of the Plant on areas with steeper terraced topography. Due to
the prevailing land parcel size in this area:
Slow rate application to dairy grazing land would require at least 3 - 4 relatively
adjacent landowners willing to accept year-round irrigation from the Plant, including
during the problematic winter periods when soils in this area are often already
saturated; or
A company owned cut and carry operation would require at least 3- 4 relatively
adjacent landowners willing to sell their properties to Alliance.
The cut and carry option would also incur approximately $10 million in additional capital
costs relative to the preferred option due to the need to purchase land, and in turn
increased financial implications.
Winter Storage - Summer lrrigation
PDP identified winter storage as an option for avoiding the discharge of wastewater to the
river during the winter period when the hydraulic capacity of surrounding soils makes
wastewater irrigation prohibitively diffi cult.
However, it also identifled significant issues associated with this option, including:
r lt would still require Alliance to obtain access to a large area of land for irrigation (160
ha) and in turn the cooperation of 3 - 4 adjacent landowners willing to either integrate
Alliance Group Limited - Mataura Processing PlantAssessment of Environmental Effects
a
76
wastewater irrigation into their dairy farming operations, or sell their properties to
Alliance;
It would require construction of a significant new treatment and storage facility, and
involve much greater operational complexity than the preferred option; and
It would incur significant additional costs relative to the preferred option, with capital
expenditure alone being approximately $12 million higher for the irrigation of third-
party dairy farmland, and $23 million higher if Alliance were to purchase the irrigation
area and operate a cut and carry operation.
10.4.1.2 Dual DischargeOptions
PDP identified four options for a dual discharge, whereby wastewater is discharged
predominantly to land between October and April, and to the river between May and
November, namely:
Dual discharge to Mataura River (May to September) and irrigation to third party
owned dairy pasture, with no additional treatment prior to the river discharge;
As above, but with biological treatment for cBODS and nitrogen removal with UV
disinfection prior to river discharge;
Dual discharge to Mataura River (May to September), and irrigation to a cut and carry
system (October to April) on purchased land; and
As above, but with biological treatment for cBODS and nitrogen removal with UV
disinfection prior to river discharge.
However, as per the full-time land-based irrigation options outlined above, PDP identified
significant issues with each option, namely:
. Operational complexities due to the hydraulic capacity of the surrounding farmland;
o Significant difficulty in finding suitable land; and
o A signiflcant increase in costs for the three options involving a company owned cut
and carry operation and / or biological treatment prior to the Mataura River discharge.
With respect to the flrst matter, because irrigation would only occur over summer, the
operational complexities due to hydraulic capacity of the surrounding farmland are not as
prohibitive as the full-time land discharge options outlined above. However, these types of
systems are still subject to signiflcant operational complexities, particularly for the options
involving irrigation to third party owned dairy pasture. While the Plant's wastewater would
help maintain soil water conditions for pasture growth during drier periods, as seasonal
rainfall increases soil water content, farmer acceptance of irrigation generally reduces due
to the potential for soil conditions to be negatively impacted.
Alliance Group Limited - Mataura Processing PlantAssessment of Environmental Effects
a
a
a
a
77
With respect to land access, avoiding winter irrigation means the amount of irrigation land
required (135 ha) is a little less than a year round land discharge (160 ha). However, it
would still require cooperation of 3 separate (but proximate) land owners willing to either
integrate the irrigation of the Plant's wastewater into their dairy farming operations, or
willing to sell their farms to Alliance.
With respect to costs, the capital expenditure required for either of the options involving
further biological treatment of the effluent prior to the river-based discharge were
prohibitively high (more than $10 million higher than the preferred option for the dairy farm
irrigation option, and $18 million higher for the company-owned cut and carry option).
The costs associated with the two dual discharge options which do not include additional
biological treatment are not as signiflcant, and in the case of the dual discharge to third
party owned dairy pasture they are less than the preferred option.
However, if biological treatment is not included, there is no signiflcant ecological rationale
for favouring the dual discharge options, noting that Alliance has received advice from its
ecological specialists that:
a Nutriflcation is not just a summer issue, and they would not favour any option which
would not result in the Plant's long-term contribution to instream Amm-N and TN
concentrations being reduced during the winter and shoulder seasons as well as
during the summer; and
a Total annual loading of TN is important when considering impacts on Toetoes Estuary,
and in that respect, there is little difference between the reduclion in the annual load
achieved by the proposed option and the dual discharge option.
A dual discharge options involving no additional UV treatment would also not address the
microbial contamination issue in this catchment as fully as the preferred option. While the
dual discharge option would totally remove the Plant's contribution to downstream E.coli
concentrations during the summer months (relative to the more than 99% reduction that
would be achieved by the preferred option), it would not reduce the Plant's contribution at
all during the river discharge season. The Plant would continue to signiflcantly elevate
downstream E co/i levels over those months, and compromise the effectiveness of any
long term catchment-wide efforts to reduce E coli concentrations, as is directed by the
Freshwater NPS and Regional Council Planning documents (see Section 12.2).
10.4.1.3 Summary
The operational difficulties, establishment difficulties, and flnancial implications for some
options outlined above mean avoiding the discharge of wastewater to Mataura River is not
the best practicable option in this case.
Alliance Group Limited - Mataura Processing PlantAssessment of Environmental Effects 78
10.4.2 Earlier Adoption of Biological Treatment
The proposed conditions require Alliance to upgrade its wastewater treatment system to
disinfect the wastewater and inactivate pathogens within five years, and full biological
treatment within 15 years of any new consent term.
Alliance considered earlier adoption of these wastewater treatment plant upgrades,
however, it was not deemed the best practicable option because:
The relative difference in the effects on the environment from earlier adoption of
biological treatment do not provide a strong justiflcation for this alternative; and
The financial implications of adopting the biological treatment system earlier are
significant.
The main difference in the adverse effects of the discharge pre and post the biological
treatment system upgrade will be a reduction in the Plant's contribution to cumulative
catchment degradation from mass loadings of Amm-N and TN. There are no toxicity
effects associated with the current discharge quality, or any other adverse effects that
trigger the need for immediate or urgent mitigation.
The reduction in the annual TN load contributed to the catchment equates to
approximately a17o reduction in the total catchment loading of this contaminant in Toetoes
Estuary, with a majority of the catchment's TN load coming from diffuse sources (i.e. farms)
Therefore, the main change in adverse effects achieved by earlier adoption of the
biological treatment system would be to reduce TN loads in the Mataura River and
Toetoes Estuary by approximately 1 % several years earlier than is proposed.
This reduction will have little, if any, detectable effect on the nutrient status of Toetoes
Estuary. A meaningful improvement in environmental quality in the lower Mataura River
and Toetoes Estuary, due to lower nutrient levels, will only be realised when a meaningful
reduction is achieved in the nutrients contributed by the diffuse sources which contribute
the majority of the catchment nutrient load. Experience from other catchments elsewhere
in New Zealand suggests this is unlikely to be achieved in advance of the proposed 15-
year timeframe proposed by Alliance.
With respect to financial implications, the expected capital cost of upgrading to a biological
treatment system is signiflcant, both in terms of capital expenditure (approximately $13.98
million) and annual operating costs ($1,060 million). lt represents a major project, and the
funds need to be budgeted and provided for alongside other capital and environmental
projects Alliance needs to undertake across all its plants.
To put the required spend into perspective, Alliance typically spends approximately $'15
million per year, across the business (including all seven processing plants), on safety and
a
a
Alliance Group Limited - Mataura Processing PlantAssessment of Environmental Effects 79
sustainability capital projects. This is split between projects to address health and safety
requirements, food safety changes and environmental improvements, among other things.
A review of the forward picture for Alliance indicates that both forecast health and safety
and environmental capital requirements are significant. Recent health and safety changes
have brought more focus to managing ammonia on site (which is also an environmental
issue). There are also legacy asbestos and machine guarding improvements to be made.
A risk assessment indicates Alliance is required to spend approximately $12 million across
all its plants to address 'intolerable' risks (e.9. a building rated at less than 3O% of building
code which houses hazardous gases), an additional $68 million on 'substantial' risks (e.g.
upgrading aged refrigeration plant (which contains hazardous gases) to meet current
standards) and $100 million on marginal risks (e.9. developing inspection and detection
process for corrosion, and rectification of defective plant containing hazardous gases) for
Health and Safety alone .
Based on Alliance risk category definitions, the impacts that will be addressed by the
biological upgrade would sit in the 'marginal' risk category (i.e. there is an emission (which
you can measure) which is almost certain (the highest likelihood rating), but it has no
observable impact on the environment). lt is known from measurements that the plant is
emitting nitrogen, but investigations indicate that there is no observable effect (on its own)
and thus this constitutes a marginal environmental risk.
As part of this consent processing Alliance is committing to spending between $4 - 5
million on capital in the first five years of the consent improving wastewater resilience,
water reduction and disinfection. Early indications suggest that Alliance will also be
required to spend approximately $S-+ million to upgrade the Mataura boiler early in the
upcoming air consent renewal application. Work will also be undertaken and completed on
a $20 million plus upgrade of the Lorneville treatment plant in the intervening period
between Year 5 and Year 12 of this consent applied for.
It is important to note that work will not start at Year 15 on the biological treatment plant,
but the upgrade will be completed, operational and compliant by Year 15. This means work
will be required to commence several years before this date, overlapping with the
Lorneville upgrades. The challenge this represents for Alliance cannot be underestimated.
Should this upgrade be pulled forward, other projects have to be delayed or farmer
payments for stock would need to be reduced, affecting the competitiveness of the
business.
The cooperative nature of the company is important in this regard. Money that is set aside
for this project is money which cannot be returned back to farmers and subsequently
invested by them to improve on-farm environmental management, and for that reason,
also needs to be approached with care. Diffuse sources of contamination contribute to the
Alliance Group Limited - Mataura Processing PlantAssessment of Environmental Effects 80
majority of the nutrient loads in this catchment and addressing that will require farmers to
invest in on-farm methods to reduce nutrient runoff. That in turn relies on them having
adequate access to capital which will be constrained if prices for meat and dividends
received from Alliance are suppressed due to higher than anticipated capital upgrades
being required at the Plant.
It is also worthwhile noting that no dividend has been paid to shareholders since the
2O1Ol2Ol1season. The operating result was a relatively small operating profit of $8 million
in 2018, $20.2 million in2017, $10.1 million in 2016 and $7.9 million in 2O15.
It is also worth adding in that at this stage there are no meaningful and practical
opportunities available for staging of the wastewater treatment plant upgrade.
Alliance Group Limited - Mataura Processing PlantAssessment of Environmental Effects 81
fi.t
11. CONSUTTATION
11.2
INTRODUCTION
Alliance initiated consultation on these consents in October 2017.ll commenced with
meetings with the Technical Working Party and representatives of Environment Southland.
As technical work and preparation of the AEE was nearing completion, individual meetings
were held with key stakeholders to share findings of the technical assessment and details
of the proposed application and to receive feedback.
ln addition, surveys of recreational users of the Mataura River were undertaken.
Details of this consultation is provided below.
TECHNICAL WORKING PARTY
11.2.1 Background
The Technical Working Party (TWP) was established a number of years prior to the current
consent being granted.
The Technical Working Party is made up of representatives from the following
organisations:
o AGL;
o Southland Fish and Game;
. Department of Conservation;
o Te Ao Marama lncorporated;
o Hokonui Runanga lncorporated;
o Public Health South;
o Southland District Council;
o Gore District Council; and
r EnvironmentSouthland.
An annual report is distributed to the TWP members every year. This report details:
o All wastewater and receiving water monitoring results, including biological monitoring
results;
o ldentification of non-compliances and measures taken to address the non-
compliances;
Alliance Group Limited - Mataura Processing PlantAssessment of Environmenta I Effects a2
a
a
An assessment of the effects of the discharge on river water quality, periphyton and
benthic communities; and
A progress report on projects and investigations being undertaken.
Following this, Alliance invites all members of the TWP to an annual meeting to take them
through the report, providing an opportunity to discuss the results. lt also provides an
opportunity for the TWP to recommend reviews of consent conditions, if necessary.
Alliance prepares meeting minutes which are distributed to all members.
This meeting is generally well attended with most organisations represented
ln the years since sheep and lamb processing ceased, the results shared in the annual
reports have generally been considered acceptable regarding Alliance's impact on the
Mataura River, in particular, comparing upstream with downstream. Based on this, there
have been minimal issues raised, with discussion generally centred on any non-
compliances or general maters. The exception to this is E.coli concentrations which are
discussed most years, including whether Alliance has any plans to improve the discharge.
ln November 2017, the Wyndham Angling Club resigned from the Technical Working Party
They advised that the decision was not reached lightly, but it was reached after a lengthy
discussion at one of their monthly meetings.
The Wyndham Angling Club advised that they were not providing the input they should to
remain a member. They advised that Fish and Game would look out for their interests in
the future, but because of the excellent results the Plant was achieving in regard to itswastewater discharge, they were confident the Plant was on track as far as the wellbeing
of the Mataura River was concerned. A representative of the Wyndham Angling Club
recently at a public forum meeting held in Gore commended Alliance for the steps it has
taken to improve its discharge of treated wastewater to the Mataura River.
Re-Consenting
Meeting 1
At the October 2017 TWP, the consultation process was initiated for the re-consenting.
This meeting provided details regarding the consents being reapplied for, including
Alliance's intention to apply for long term consents. Alliance provided:
r An overview of Alliance;
o An overview of the Mataura Plant;
o An overview of the full length of the Mataura River;
r An overview of the Mataura Plant resource consents;
Alliance Group Limited - Mataura Processing PlantAssessment of Environmental Effects
11.2.2
11.2.2.1
83
11.2.2.2
. Details of the Mataura Plant's wastewater treatment, including how it works and the
changes that have been made over the life of the existing consent;
o Details of compliance monitoring locations and compliance performance;
o Details of the condition of the receiving environment;
. A project plan and the members of the project team; and
. Key considerations for the applications.
Queries raised included questions on monitoring of the DO sag, the consent term to be
applied for, and if Alliance was considering disinfection and alternative discharge receiving
environments. These items are addressed in this application.
Meeting 2
A second meeting was held with members of the TWP in November 2O'17. This included a
visit to the external areas of the Mataura Plant, including the routine river sampling
monitoring sites, the cooling water and treated wastewater discharge sites, and some of
the biological monitoring sites. Dr Mark James provided an overview of what is done
during biological monitoring and identified some of the invertebrates present.
Following the visit, the TWP met back at the Mataura Plant to discuss the proposed
Discharge and River Monitoring Plan for the coming year. This included a continuation of
historical monitoring, and monitoring specific to the consent application.
Dr James provided the following details:
r A summary of the issues to be addressed by the AEE;
o A summary of the existing monitoring programme for the receiving environment;
o A summary of the existing monitoring regime for the wastewater discharge and
proposed additional monitoring parameters; and
o Proposed additional monitoring parameters for the receiving environment.
This was followed by a discussion where the TWP were asked for input into the proposed
monitoring plan. Members of the TWP indicated that they were happy with the proposed
monitoring plan, including the Fish and Game representative, who commented that the
proposed monitoring programme was very comprehensive.
The Public Health South representative asked if Alliance planned to test for
cryptosporidium, as there had been recent outbreaks of people becoming ill with
cryptosporidium. Cryptosporidium has been addressed as part of this application.
Fish and Game asked about timing of monitoring and consideration of the mixing zone.
Both of these things are addressed in the AEE.
Alliance Group Limited - Mataura Processing PlantAssessment of Environmenta I Effects 84
11.2.2.3 Meeting 3
The third TWP meeting for the re-consenting was held in October 2018. Alliance provided
an overview of the routine monitoring results and discussion, while Dr James provided asummary of the additional information collected from monitoring the treated wastewater
discharge and receiving environment for re-consenting.
Ecoli, and ammonia were the key items for discussion.
It was noted that ammonia concentrations increase downstream of the discharge.
With respect lo E.coli, the intricacies associated with it only being a faecal indicator
bacteria were discussed, and Alliance outlined that further work was being undertaken forpathogens of concern. lt was highlighted during this discussion that early QMRA work
identified that the data suggested a low risk for recreation, which didn't reflect the high
E.coli concentrations in the discharge.
One question was asked regarding the lower concentrations of E coll observed that year,
and whether that was the result of any changes on the Plant. Alliance staff responded thatthey did not consider this to be the case.
II.3 INDIVIDUAL CONSULTATION WITH TECHNICAL WORKING GROUP MEMBERS
ln addition to the TWP consultation outlined above, individual consultation was undertaken
with TWP members in early May 2O19 to provide a summary of the pending resource
consent application and assessment of environmental effects (Summary AEE). This
Summary AEE can be found in Appendix 9.
The Summary AEE provided a high level overview of the technical assessments
undertaken to suppon these resource consent applications, their key findings, and howAlliance was intending on responding to those findings.
It included a preferred option to manage the environmental effects consistent with what isproposed in this application.
Attendees and key points from these meetings are described below
11.3.1 Te Ao Marama and Hokonui Runanga
On 7 May 2019,key Alliance staff met with Stevie-Rae Blair (lwi Environmental Officer).
Penny Nicholas (Hokonui Runanga Representative) was unable to attend.
Stevie indicated that she was not able to provide comment on behalf of the Hokonui
Runanga until she had reviewed the Summary AEE, and provided a draft Cultural lmpact
Assessment to the Hokonui Runanga for consideration.
Alliance Group Limited - Mataura Processing PlantAssessment of Environmental Effects 85

Stevie did note that the key points of interest would likely be the term of the consent
sought, being longer than their preference for a maximum term of 25 years, and the
decision to continue to discharge to water rather than land. Stevie acknowledged that
discharge to land may not be practicable at the Mataura Plant.
Cultural Monitoring was discussed, and Stevie advised many of the indicators of Cultural
Monitoring would likely be addressed by typical monitoring that accompanies the types of
activities being applied for, e.g. temperature, however the Cultural lmpact Assessment
would advise on this.
Alliance expressed a willingness to meet with Hokonui Runanga to discuss the application
if needed.
Key Alliance staff also met with key Te Ao Marama and Hokonui Runanga on 23 May 2019
to discuss the development of a Memorandum of Understanding (MoU) between the two
parties, separate from this consent process. There was mutual agreement that such an
agreement would be appropriate given the importance of the Mataura River to each of the
parties. Alliance committed to preparing a Draft MoU to be discussed in late June. Alliance
took the opportunity to invite Hokonui Runanga to meet again regarding this consent
application.
Alliance has expressed a desire to continue to consult with TAMI and Hokonui Runanga
during processing of this consent application.
11.3.2 EnvironmentSouthland
Three meetings have been held with Environment Southland in preparation of this consent
application.
The flrst was in October 2017, when Alliance met with key ES planning staff (Stephen West
and Alex King). A number of items were identified for Alliance to address as part of the
consent application. Refer to meeting notes in Appendix 1O. Where required, these items
have been addressed in this application.
The second meeting was attended by ES science staff (Karen Wilson and Roger Hodson),
key Alliance staff and Dr James.
Dr James provided an overview of the proposed monitoring programme similar to that
provided at the second TWP meeting.
Again, a number of items were identified for Alliance to address. Where required, Alliance
has addressed these items in the application, including additional monitoring. Refer to
meeting notes in Appendix 1O.
Alliance Group Limited - Mataura Processing PlantAssessment of Environmental Effects 86
ln early May 2019, key Alliance staff and John Kyle (Mitchell Daysh Ltd) met with key ES
staff (Michael Durand - Consents Manager, Lydia Hayward - Consents Team Leader, and
Alex King - Consents Officer) to discuss the Summary AEE.
ES asked why water savings had been identifled as a priority over disinfection and
biological treatment. Alliance responded it was mainly so that capital upgrades could be
appropriately sized, rather than sizing them for a larger volume of water, only to reduce
that volume of water in the future.
Key feedback included the need to provide information on any financial reasons toundertake the biological treatment upgrade earlier as opposed to the proposed 15 years.
Reasons have been provided in this application.
11.3.3 Department of Conservation
The Summary AEE was provided to the Department of Conservation on 13 May 2019.
Receipt of the document was acknowledged, and Alliance was advised that it has been
provided to the National RMA team who will assign a DoC planner to consider the
document. No further communication has been received at the time of writing.
11.3.4 Public Health South
On 10 May 2019, key Alliance staff and John Kyle (Mitchell Daysh Ltd) met with Kate
Marshall (Team Leader - Health Protection Officer) and Renee Cubitt (Health Protection
Officer) from Public Health South. ln a subsequent follow up email, Public Health South
expressed support for all aspects of the application, including the proposed staged
programme for upgrading the wastewater treatment plant.
11.3.5 Fish and Game
On 13 May 2O'19, key Alliance staff met with Jacob Smyth (Resource Management Officer)
from Fish and Game. Mr Smyth indicated that the particular points of interest in the
application would be the timeframes proposed before upgrades, the consent term and the
decision to continue a discharge to water. Each of these items are addressed in this
application. Mr Smyth could not comment on Fish and Game's likely position of the
application until after the complete application was reviewed by Fish and Game.
fi.3.6 Gore District Council
On 8 May 2019, key Alliance staff met with Matt Bayliss (Three Waters Manager) to discuss
the consultation document. An apology was received by Ramesh Sharma (General
Manager - lnfrastructure), who was unable to attend the meeting.
GDC indicated that they were supportive of the application and did not have speciflc
concerns.
Alliance Group Limited - Mataura Processing PlantAssessment of Environmental Effects 87
11.4 LOCAL RESIDENTS
A leaflet (refer to Appendix 11) was posted to all letter boxes (approximately 70O leaflets)
in the Mataura Township on 20 May 2O19, inviting Mataura residents to a meeting at 7pm
on the 23 May at the Mataura Community Centre to hear about the work being undertaken
to re-consent key activities at the Plant.
An Attendance Register was completed by 16 Attendees.
A slideshow presentation was provided by key Alliance staff with details of the Summary
AEE and the preferred wastewater upgrade option included.
Key issues raised included:
The need for 15 years before the ultimate upgrade is complete. The response from
Alliance was consistent with the details provided in this application.
Whether there may be other opportunities to improve the discharge between the
disinfedion upgrade and the biological treatment upgrade. Alliance staff advised that
there are only minor opportunities for optimisation of the existing wastewater
treatment process, and that the neld practical step for improvement is biological
treatment.
Further to the above, it was requested that Alliance consider new technology that may
become available between the disinfection stage and the biological treatment stage.
Alliance responded that Environment Southland have the opportunity to review the
consent, should new technology become available, which may present an updated
best practicable option for treating the wastewater discharge.
a Other issues were also raised that were not relevant to this application
Many of the attendees expressed general suppon for the continued operation of the
Mataura Plant, acknowledged the improvements made over recent years, and confirmed
they supported the proposed improvements.
Mataura residents were also invited to contact Alliance if that had any questions about the
application. To dateSo phone calls have been received.
II.5 REGIONAL FORUM
Key Alliance staff attended the Regional Forum at a public meeting held in Gore on 10 May
2019. Mr Richardson provided a brief presentation at the meeting. This included a
summary of the Plant's upcoming resource consent applications. lt was identified that
Alliance was proposing to'play its patt in addressing catchment-wide issues. One
question regarding the term of the consent being applied for received. Mr Richardson
responded that the term being applied for was 35 years, with accompanying reasons
consistent with this application.
a
a
Alliance Group Limited - Mataura Processing PlantAssessment of Environmental Effects 88
11.6 RECREATIONAL USERS
ln was recognised early in the process of preparing this AEE that the recreation values ofthe Mataura River are high, particularly in respect of its fishery. As such, Alliance
commissioned Rob Greenaway to complete a detailed assessment of the effects of the
activity on those values, including interviews and engagement with key recreational users.
The results of that assessment are summarised in Section 8.6, and detailed records of the
interviews are set out in Appendix 5.
Alliance Group Limited - Mataura Processing PlantAssessment of Environmental Effects 89
12. PROVISIONS OF THE RELEVANT PLANN!NG DOCUMENTS
12.1 RELEVANT STATUTORY PLANNING DOCUMENTS
When considering these applications for resource consents, the consent authority must,
subject to Part 2, have regard to any relevant provisions of the following planning
documents:
r The National Policy Statement for Freshwater Management 2014 ("Freshwater NPS")
o Resource Management (Measurement and Reporting of Water Takes) Regulations
2010 ("Water Measurement Regulations").
o The Southland Regional Poliry Statement ("RPS").
o The Operative Regional Water Plan ('Operative Plan").
o The Proposed Southland Water and Land Plan ("Proposed Plan").
The relevant provisions of these planning documents were considered when assessing
the effects of the proposed activities, and in determining how the effects of the activities
could best be avoided, remedied or mitigated through the proposed conditions.
An assessment of those provisions, and how the proposed activities sit in relation to them
is provided below.
ln our view an analysis of the NgEi Tahu ki Murihiku Natural Resource and Environmental
lwi Management Plan 2008: Ie Tongi o Touiro - The Cry of The People ("Te Tangi a
TauiraJ is also reasonably necessary as the river is clearly of importance to iwi, and the
plan's provisions touch directly on the issues under consideration. Therefore, we have
provided an analysis of how the iwi management plan speaks to the proposal under
consideration
12.2 NATIONAL POLICY STATEMENT FOR FRESHWATER MANAGEMENT 2OI4
12.2.1 Synopsis
The Freshwater NPS provides national direction for the management of freshwater under
the RMA.
It has sections relating to the following:
o Te Mana te Wai;
o Water quality;
o Water quantity;
o lntegratedmanagement;
Alliance Group Limited - Mataura Processing PlantAssessment of Environmental Effects 90
. National Objedives Framework;
o Monitoring Plans;
o Accounting for freshwater takes and contaminants;
o The role and interests of tangata whenua; and
o Progressiveimplementationprogramme.
Environment Southland has given public notice of its revised Progressive lmplementation
Programme to fully implement the Freshwater NPS by 31 December 2025.
There are two general parts to this programme
The Proposed Southland Water and Land Plan: This is intended to prevent further
degradation of freshwater quality in Southland while the process for setting formal
objectives, limits and targets in accordance with the collaborative planning
methodology specified by the Freshwater NPS is completed. Appeals on the
Proposed Plan are currently being heard by the Environment Court.
The freshwater objective, limit and target settang exercise: This comprises a
collaborative planning exercise whereby objectives, limits and targets are developed
for the Mataura Catchment. The freshwater objeclives, limits and targets developed
through the collaborative planning process will then be inserted into the Water and
Land Plan via a Schedule 1 plan change process. lt is currently intended this plan
change be notified by 2022 and be operative by 2025.
a
a
While the new framework to give effect to Freshwater NPS objectives in the Mataura
Catchment has not yet been established, as per the above timeframes, it will be within the
life of the consents Alliance is seeking for its wastewater and cooling water discharges.
Therefore, while a direct assessment of the proposed discharge regime against the future
framework is not possible, Alliance has had regard to the requirements of that framework
when developing its proposed discharge regime.
ln particular, that has included consideration of:
The Freshwater NPS water quality objectives the new framework is required to give
effecl to;
The compulsory values the Freshwater NPS requires that management framework
include;
The various attributes which the management framework is required to manage in
respect of those values; and
The suite of provisions inserted into the Freshwater NPS in 2017 focussed on
managing water quality, so it is suitable for swimming more often.
a
Alliance Group Limited - Mataura Processing PlantAssessment of Environmental Effects 9'l
Each is described below.
The Water Quality Objectives
The relevant water quality objectives state:
ObjeditcAt
To sofeguord:
o) the life-supporting copocity, ecosystem processes ond indigenousspecies including their ossocioted ecosystems, of fresh woter; ond
b) the heofth of people ond communities, os offected by contoct with fresh
woter;
in sustoinobly monoging t/,e use ond development of lond, ond of dischorges ofcontominonts.
Objective A2
The overoll quolity of fresh woter within o freshwoter monogement unit is
mointoined or improved while:
o) protecting the significont volues of outstonding freshwoter bodies;
b) protecting the significont volues of wetlonds; ond
c) improving the quolity of fresh woter in woter bodies thot hove been
degroded by humon octivities to the point of being over-ollocoted.
ObjedircA3
The quolity of fresh woter within o freshwoter monogement unit is improved so it is
suitoble for primory contoct more ofte4 unless.'
o) regionol torgets estob/lshed under Policy A6(b) hove been ochieved; or
b) noturolly occurring processes meon further improvement is not possible.
Objec:tiwA4
To enoble communities to provide for their economic well-being, includingproductive economic opportunities, in sustoinobly monoging freshwoter quolity,
within limits.
The Compulsory Values and Attributes
The two compulsory values which the Council is required to manage the Mataura River for,
'ecosysfem heolth' and'humon heolth for recreotion', and the compulsory attributes it is
required to set limits for in respect of each of those values, are set out below.
Alliance Group Limited - Mataura Processing PlantAssessment of Environmental Effects 92
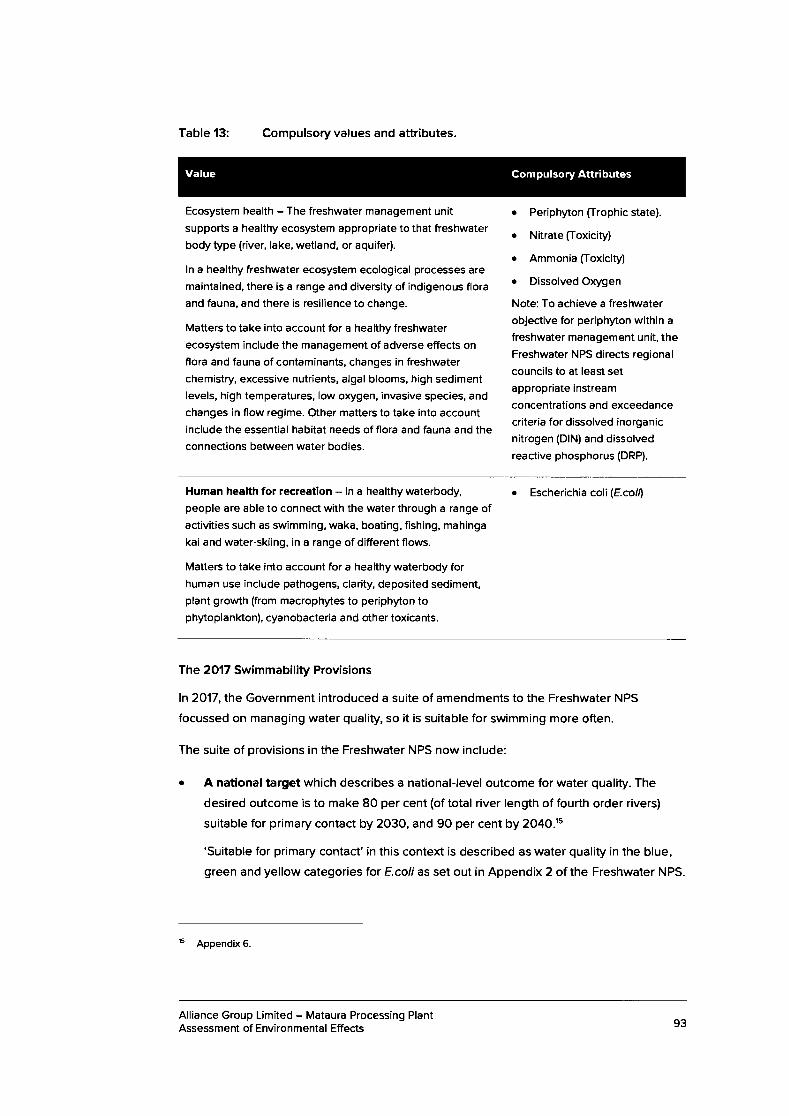
Table 13: Compulsory values and attributes.
Ecosystem health - The freshwater management unit
supports a healthy ecosystem appropriate to that freshwater
body type (river, lake, wetland, or aquifer).
ln a healthy freshwater ecosystem ecological processes are
maintained, there is a range and diversity of indigenous flora
and fauna, and there is resilience to change.
Matters to take into account for a healthy freshwater
ecosystem include the management of adverse effects on
flora and fauna of contaminants, changes in freshwater
chemistry, excessive nutrients, algal blooms, high sediment
levels, high temperatures, low orygen, invasive species, and
changes in flow regime. Other matters to take into account
include the essential habitat needs of flora and fauna and the
connections between water bodies.
e Periphyton (Irophic state).
. Nitrate (foxicity)
o Ammonia fioxicity)
o Dissolved Oxygen
Note: To achieve a freshwater
objective for periphyton within a
freshwater management unit, the
Freshwater NPS directs regional
councils to at least set
appropriate instream
concentrations and exceedance
criteria for dissolved inorganic
nitrogen (DlN) and dissolved
reactive phosphorus (DRP).
Compulsory AttributesValue
Human health for recreation - ln a healthy waterbody,people are able to connect with the water through a range ofactivities such as swimming, waka, boating, fishing, mahinga
kai and water-skiing, in a range of different flows.
Matters to take into account for a healthy waterbody for
human use include pathogens, clarity, deposited sediment,
plant growth (from macrophytes to periphyton tophytoplankton), cyanobacteria and other toxicants.
a Escherichia coli (Ecol)
a
The 2017 Swi mmability Provisions
ln 2017, the Government introduced a suite of amendments to the Freshwater NPS
focussed on managing water quality, so it is suitable for swimming more often.
The suite of provisions in the Freshwater NPS now include:
A national target which describes a national-level outcome for water quality. The
desired outcome is to make 80 per cent (of total river length of fourth order rivers)
suitable for primary contact by 2030, and 90 per cent by 2040.15
'Suitable for primary contact' in this context is described as water quality in the blue,
green and yellow categories for E.coli as set out in Appendix 2 of the Freshwater NPS
Appendix 6.
Alliance Group Limited - Mataura Processing PlantAssessment of Environmental Effects 93
a A reguirement to develop regional targets that describe regional outcomes, aimed
at contributing to the national target.16 Environment Southland did this in December
2018, setting minimum primary contact targets for its region ol 65.7"/o and 80% ofrivers being suitable for primary contacl by 2030 and 2040 respectively.
An objective to improve (not maintain) freshwater management units so they are
'suitoble for primory contoct more often' which the Freshwater NPS defines as
meaning 'reducing the percentoge ond magnitude of E. coli exceedonces for rivers ...
occording to the ottribute fobles in Appendix 2'. This means improving water quality
across all attribute states, even those that are already considered suitable for
swimming (Objective A3).
Attribute states which comprise a series of bands (A - E) which classiff a waterbody
according to how often a water body is suitable for swimming.
Policies requiring more specific plan content, stating how specifled rivers and lakes
and primary contact sites will be improved. Councils have discretion around
timeframes for achieving improvements, and where they focus their efforts (Policy A5).
Reporting requirements to track efficacy of planning and progress toward regional
targets over time (Policy E1(g)).
Surveillance monitoring requirements at primary contact sites (Appendix 5 of the
NPS).
Together these provisions place an obligation on Environment Southland to set policy and
methods to improve water quality so that it is suitable for primary contact more often, and
the key indicator for how that is being achieved is also instream E.coli concentrations.
2030 and 2040 are the key reporting timeframes for measuring progress.
12.2.2 Ecosystem Health
As outlined in Section 8, the technical assessments have concluded that there is no
evidence the discharge itself is having an adverse effect on downstream water quality
such that life supporting capacity or ecological values are compromised.
However, those technical assessments do identify that a cumulative catchment
degradation issue is present due to nutrient enrichment to which the Alliance discharge
makes a contribution. And the cumulative impact of nutrient discharges throughout the
catchment may be having an adverse effect on ecosystem health. This includes high DIN
and DRP concentrations in the main stem of the Mataura River, and Toetoes Estuary
experiencing eutrophication symptoms due to excessive nutrient inputs, particularly TN.
16 Policy 46.
a
a
a
a
Alliance Group Limited - Mataura Processing PlantAssessment of Environmental Effects 94
It would therefore seem inevitable that the freshwater objective and limits. which are
ultimately set for the Mataura River through the Freshwater Management Unit (FMU)
process. will require an improvement in the quality of freshwater in this catchment, with a
focus on periphyton levels and DIN and DRP concentrations in the river, and TN in Toetoes
Estuary.
Most of the nutrients discharged into this catchment come from diffuse sources and
reducing this contribution will require different farm mitigation practices and / or land use
change. However, point source discharges will also need to be better managed.
Alliance acknowledges this, and that acknowledgement has influenced the decision to
include in these consent applications an upgrade to the wastewater treatment plant to
signiflcantly reduce Amm-N and TN in the wastewater discharge within the first 15 years of
any new consent term. Alliance expects this proffered contribution to be more than
proportional to the wider catchment reduction in nutrients achieved by the diffuse sources,
and is also comparatively expedient. Noting that experience from similar catchments in
other parts of New Zealand (i.e. catchments with a high proportion of pastoral farming and
nutrient enrichment). suggests any signiflcant reduction in the contribution from diffuse
sources will take some time.
12.2.3 Human health for Recreation
As set out in Section 3, the Mataura River, upstream, and downstream of the Plant's
discharge is Attribute State Red, and the Plant's discharge signiflcantly increases
downstream E coli concentrations. The Freshwater NPS attribute state considered suitable
for swimming is Attribute State Yellow. Streamlined Environmental 2019 (see Appendix 3)
has calculated moving Mataura River water quality to Attribute State Yellow absent any
contribution from the Plant will require a777" redudion in instream E.coli concentrations.
This magnitude of reduclion will be exceedingly difficult to achieve in this catchment, and
potentially difficult to justifl7, based on the existing Environment Southland and Streamlined
Environmental studies that suggest E coli levels may signiflcantly overestimate the human
health risk posed by water quality in this catchment when the dose / response relationship
which underpins the Freshwater NPS attribute states is used.
It is also important to note in that regard that there is no 'national bottom line' for E coli
levels that Environment Southland must manage the Mataura River to achieve. lnstead, the
requirement is that the river be managed so it is suitable for primary contact more often.
The Environment Southland commitment to make only 65.7% of rivers swimmable by 2O30
is also relevant in this context and perhaps reflects the management challenges that will
be faced in catchments such as the Mataura.
lrrespective of this, Alliance acknowledges that a reduction in E.coli concentrations needs
to be achieved in this catchment, and that its discharge contributes significantly to the
Alliance Group Limited - Mataura Processing PlantAssessment of Environmental Effects 95
current E coli levels downstream of the Plant. ln that conteld, the proposed conditions
commit Alliance to wastewater treatment plant upgrades which will yield more than a 99"/o
reduction in the E.coli levels discharged by the Plant in the first five years of any new
consent issued.
12.2.4 Conclusion
It is readily apparent that implementing the Freshwater NPS is going to require an
improvement in Mataura River water quality for some key contaminants, particularly
nutrients and E co/i.
The extent of the required improvement, how it will be achieved and the timeframes for
achieving it, will be developed through the upcoming collaborative planning exercise
required by the Freshwater NPS, and which Environment Southland expects to be
completed by 2025.
Alliance expect that as a consequence of the measures it is proposed in this application,
its contribution to catchment reductions in these key contaminants will be more than
proportional to the wider reduction achieved in the catchment, and also comparatively
expedient. Noting that experience from similar catchments in other parts of New Zealand
(i.e. catchments with a high proportion of pastoral farming and nutrient enrichment),
suggests any significant reduction in the contribution from diffuse sources will take some
time.
The proposed activities undertaken in accordance with the proposed conditions are
therefore consistent with the requirements of the Freshwater NPS.
RESOURCE MANAGEMENT (MEASUREMENT AND REPORTING OF WATER TAKES)
REGUL/ATIONS 2OlO
Water measurement requirements were recently addressed in detail in respect of these
takes, with the conclusion being that:
The take and use of water for Plant processing aclivities, including water that is used
for cleaning, potable water supply, wastewater processing and truck washing, should
be subject to water metering in accordance with the Water Measuring Regulations;
but
12.3
a
a The take and use of water for engine room cooling water and condenser water is tobe estimated and reported by combining the records of discharge monitoring, take
monitoring, pump capacities and pump operation.
No changes to this approach are proposed. The proposed conditions ofconsent reflect
that.
Alliance Group Limited - Mataura Processing PlantAssessment of Environmental Effects 96
12.4 NEW ZEAL/AND COASTAL POLICYSTATEMENT 2OlO
The NZCPS is a relevant consideration on the basis that the ultimate receiving
environment of the Plant's discharge to the Mataura River includes the Toetoes Estuary.
The quality of the Toetoes Estuary is being affected by the cumulative impacts of non-
point and point source discharges throughout the catchment, and this is influencing the
estuary's ecosystem values. The most relevant policy in the NZCPS when considering this
matter in the context of these resource consent applications is Policy 21, which directs that:
priority be given to improving water quality where the quality of water in the coastal
environment has deteriorated so that it is having a signiflcant adverse effect on
ecosystems; and
where practicable, water quality be restored to at least a state that can suppon such
ecosystems and natural habitats.
ln order to see an improvement in the quality of the Toetoes Estuary in the manner sought
by Policy 21, a whole-of-catchment response will be required. The proposed conditions
respond to this policy direction by requiring a substantial reduction in the TN load from the
Plant within the first 15 years of the new consent.
12.5 SOUTHL,/ANDREGIONALPOLICYSTATEMENT
The RPS was made operative on 9 October 2017.lt outlines objectives, policies and
methods, which guide the management of Southland's natural resources. lt is required to
give effect to the Freshwater NPS and postdates it (although not the most recent update in
2O17l.ln turn, its water related provisions prescribe the overarching framework for how the
Freshwater NPS framework is to be implemented in Southland.
When considering the proposed take and discharge activities, the most relevant provisions
are contained in:
12.5.1
r Chapter 3: Tangata Whenua;
o Chapter 4: Part A Water Quality; and
o Chapter 4: Part B Water Quantity.
Each is addressed below.
Tangata Whenua
Chapter 3 of the RPS sets out the resource management issues of significance to Ngdi
Tahu; and sets out the objectives, policies and methods to address those issues.
The objectives and policies that are relevant to the proposed activities state:
Alliance Group Limited - Mataura Processing PlantAssessment of Environmental Effects
a
a
97
Objective TW.2 - Proision for iwi monogement plons
All locol outhority resource monogement processes ond decisions toke into
occount iwi monogement plons.
Objedilre TW.3 - Tongoto whenuo spirituol volues ond customoty resources
Mouri ond woiruo ore sustoined or improved where degroded, ond mohingo koiond customory resources ore heolthy, obundont ond occesslb/e to tongoto
whenuo.
Objedive TW.4 - Sites of culturol significonce
Wdhi topu, wdhi toongo ond sites of significonce dre oppropriotely monoged ondprotected.
Poliq TW.l - Treoty of Woitongi
Consult with, ond enhonce tongoto whenuo involvement in locol outhority
resource monogement decision-moking processes, in o monner thot is consrstent
with the principles of the Treoty of Woitongi/Te Tiriti o Woitongi.
Poliq TW.3 - lwi monogement plo,ns
Toke iwi monogement plons into occount within locol outhority resource
monogement decision moking processes.
PoliqTW.4 - Decision moking
When moking resource monogement declsions, ensure thot locol outhority
functions ond powers ore exercised in o monner thot:
(o) recognr3es ond provides for:
(i) troditionol Mdori uses ond proctices reloting to noturol resources(e.9. mdto ito i, ko itio k ito n go, m o n ook ito n go, m oto u ro ngo, rd h u i, wd h itopu, toongo rorongo);
(ii) the ohi kd (monowhenuo) relotionship of tongoto whenuo with ondtheir role os koitioki of noturol resources;
(iii) mohingo koi ond occess to oreos of noturol resources used forcustomory purposes,'
(iv) mouri ond woiruo of noturol resources;
(v) ploces, sltes ond oreos with significont spirituol or culturol historicheritoge volue to tongoto whenuo;
(vi) Mdori environmentol heolth ond culturol wellbeing.
(b) recognises thot only tongoto whenuo con identify their relotionship ondthot of their culture ond trqditions with their oncestrol londs, woter, sites,
wdhi topu ond other toongo.
lwi have a long association and strong traditional relationship with the Mataura River, and
mahinga kai resources, nohoanga and metaitai are all important and relevant values here.
Alliance Group Limited - Mataura Processing PlantAssessment of Environmental Effects 98
And in accordance with the overarching direction in the above provisions, Alliance has,
and continues to consult with Te Ao Marama and Hokonui Runanga on how the proposed
take and discharge activities may adversely affecl these values, and how those adverse
effects can be avoided, remedied or mitigated.
12.5.2 Water Quality
Chapter 4, Part A of the RPS contains overarching direction for managing water quality in
the Region. The objectives and policies most relevant to the proposed discharge activities
state:
Objectiw WQUAL.I - Woter quolity goots
Woter quolity in the region:
(o) sofeguords the life-supporting copocity of woter ond reloted ecosystems;
(b) sofeguords the heolth of people ond communities;
(c) is mointoined, or improved in occordonce with freshwoter objectivesformuloted under the Notionol Policy Stotement for FreshwoterMonogement 2014;
(d) is monoged to meet the reosonobly foreseeoble sociol, economic ondculturol needs of future Generotions
Objecti,n WQUAL.2 - Lowlond woter bodies
Holtthe decline ond improve woter quolity in lowlond woter bodies ond coostollokes, logoons, tidol estuories, so/t morsf,es ond coostol wetlonds in occordoncewith freshwoter objectives formuloted in occordonce with the Notionol PolicyStotement for Freshwoter Monogement 2014.
Poliq WQUAL.T - Overoll monogement of woter quolilyr
(o) ldentity volues of surfoce woter, groundwoter, ond woter in coostol lokes,logoons, tidol estuories, solt morshes ond coostolwetlonds, ondformuldte freshwoter objectiyes in occordonce with the Notionol PolicyStotement for Freshwoter Monogement 2014; ond
(b) Monoge dischorges ond lond use octivities to mointoin or improve woterquolity to ensure freshwoter objectives in freshwoter monogement unitsqre met.
Poliq WQUAL2 - All vwterbodies
Mointoin or improve woter quolity, hoving porticulor regord to the followingcontominonts:
(o) nitrogen;
(b) phosphorus;
(c) sediment;
(d) microbiologicol contominonts.
Alliance Group Limited - Mataura Processing PlantAssessment of Environmental Effects 99
Pol iq WQUALS - lmprove cotchm ent woter quolityr
lmprove woter quolity by:
(o) identifying woter bodies thot ore not meeting freshwoter objectives,including identifying priority freshwoter monogement units;
(b) specifying torgets to improve woter quolity within those woter bodieswith in d efi n ed ti m efro m es ;
(c) implementing monogement fromeworks to meet tf,e to,.gets toking intooccount;
(i) the volues supported by the woter body/ies;
(ii) notionol or legislotive stondords ond requirements;
(iii) the benefits ond costs ossocioted with ochieving improvement inwoter quolity.
Maintaining or improving water quality through FMU processes is an overarching theme of
these provisions. A particular focus is placed on nitrogen, phosphorus, sediment and
microbial contaminants.
The Mataura Catchment FMU process has not yet occurred, and it is therefore uncertain
what the freshwater objeclives, limits and timeframes for the Mataura FMU will be.
However, as set out in Sections 8 and 9.3 of this AEE, the technical assessments have
identifled high nutrient and E co/i levels in the catchment and it would seem highly likely
that the planning framework stemming from the FMU process will require a significant
reduction in these contaminants in the Mataura catchment over time. This is consistent
with Poliry WQUAL.2. Diffuse runoff from pastoral land use contributes considerably to this
degraded state, and any significant improvement in water quality for these parameters will
require a significant change to how this activity occurs in the catchment. This will likely
take some time. However, the Plant also contributes to instream concentrations of these
key contaminants downstream of Mataura, and the wastewater treatment plant upgrades
required by the proposed conditions of consent will ensure Alliance does its part in
improving the quality of Mataura River water. This aligns with the expectations of the
above provisions.
Other relevant provisions in Chapter 4 Part A are:
Policy WQUAL.S - Preference for dischorge to lond
Prefer dischorges of contominonts to lond over dischorges of contominonts towoter, where:
(o) o dischorge to lond is procticoble;
(b) the odverse effects ossocioted with o dischorge to lond ore less thon odischorge to woter.
Alliance Group Limited - Mataura Processing PlantAssessment of Environmental Effects 100
PolicyWQUAL.9 - Untreoted humon ond onimol lyostes
Avoid the direct dischorge oFsewogq wostewoter, industriol ond trode woste ondogriculturol effluent to woter unless these dischorges /,oye undergone treotment.
The proposed discharge regime sits comfortably with these provisions noting that:
r For reasons set out in Section 10 of this AEE, the discharge of Plant wastewater to
land is not practicable; and
o The wastewater discharge will undergo treatment prior to being discharged to the
Mataura River.
12.5.3 Water Quantity
The RPS contains two objectives for water quantity:
Objeclive WQUAN.I - Sustoinobly monoging the region's woterresources
Flows, levels ond ollocotion regimes of surfoce woter ond groundwoter in theregion ore developed in occordonce with the Notionol Policy for FreshwoterMonogement 2014 to:
(o) sofeguord the life-supporting copocity of woter, cotchments ond relotedecosystems,'
(b) support the mointenonce or improvement of woter quolity in occordoncewith Policy WQUAL.I;
(c) meet the needs of o ronge of uses, including the reosonobly foreseeoblesociol, economic ond culturol needs of future generotions;
(d) comply with limits or torgets set to ochieve freshwoter objectives.
Objedive WQUAN.2 - The efficient ollocotion ond use of woter
The ollocotion ond use of Southlond's woter resources:
(o) is efficient;
(b) recognises ond mokes provision for the Monowoi ond notionollysignificont Monopduri hydroelectric generotion schemes in the Woioucotchment ond the resultont modified flows ond levels.
The associated policies contain various directions for achieving these objectives in the
Region, most of which are targeted at future regional plan processes and establishing
Freshwater NPS compliant flow and allocation regimes through the upcoming FMU
processes.
These provisions are not directly relevant to activities entailing the proposed take and use
of water. However, the activity will be undertaken in accordance with the flow and
allocation regime set by the Mataura WCO, which will achieve Objective WQUAN.1.
lmproving water efficiency is also an important aspect of the proposed activities, and the
Alliance Group Limited - Mataura Processing PlantAssessment of Environmental Effects 101
Plant's allocation and use will be consistent with the associated outcome sought by
Objective WQUAN.2.
12.5.4 Summary
The proposed activities are broadly consistent with the RPS, and will help, rather than
hinder, Environment Southland's efforts to implement it, particularly in respect of improving
water quality.
12.6 OPERATIVEWATERPLAN
The Operative Water Plan was made operative in April 2010. ln that respect, it predates
both the Freshwater NPS and the RPS. Of most relevance to the proposed aclivities are its
objectives and policies which address water quality and water quantity. An assessment of
the proposed take and discharge activities against those provisions is provided below.
12.6.1 Water Quality
The planning framework for water quality matters in the Operative Plan is relevant when
considering the proposed discharge of cooling water and wastewater.
Objectives
The water quality objectives most relevant to the proposed activities state:
Objedive 2 - Mointoin woter quolity
To monoge woter quolity so thotthere is no reduction in the quolity of the woter in
ony surfoce woter body, beyond the zone of reosonoble mixing for dischorges,
below thot of the dote this Plon become operotive (Jonuory 2O1O).
Objedive 3 - Surtbce woter bodies other thon in Noturol Stotc Woterc
To mointoin ond enhonce the quolity of surfoce woter bodr'es so thot the followingvolues ore protected where woter quolity is olreody suitoble for them, ond wherewoter quolity is currently not suitoble, meosuroble progress is ochieved towordsmoking it suitoble for them.
ln surfoce woter bodies c/ossifed os ... Motouro 3:
(o) bothing, in those sites where bothing is populor;
(b) trout where present, otherwise notive fish;
(c) stock drinking woter;
(d) Ngdi Tohu culturol volues, including mohingo koi;
(e) noturol choroder including oesthetics.
Objective 4 - Groduol improvement in sufioce woter quolity porometers
To monoge the dischorge of contominonts ond encouroge best environmentolproctice to improve the woter quolity in sud,oce woter bodies clossified os hill,
Alliance Group Limited - Mataura Processing PlantAssessment of Environmental Effects 102
a
lowlond (hord bed), lowlond (soft bed) ond spring fed, ond in poniculor to ochieveo minimum of 10 percent improvement in levels of the following woter quolityporometers over 10 yeors from the dote this Plon become operotive (Jonuory
2O1O):
(o) microbiologicol contominonts
(b) nitrote
(c) phosphorus
(d) clonty
Key matters to note in respect of these objectives are:
Environment Southland water quality data suggests that while Objective 2 has been
largely achieved in the Mataura River at Mataura (as per Table 2 - Environment
Southland monitoring data shows no statistical change in water quality for key
parameters at its monitoring site 200m downstream of Mataura Bridge since the Plan
became operative in 2010), and over this period the quality of the Plant's discharge
has also not degraded.
That same Environment Southland water quality data suggests the 10 percent
improvement in certain water quality parameters sought by Objective 4 has not been
achieved. However, when considering the Plant's wastewater discharge the following
is relevant:
The contribution of the Plant to instream phosphorus concentrations has been
signiflcantly reduced since 2O10;
While no change to the microbial contaminants discharged from the Plant has
occurred since 201O, a signiflcant reduction in the concentration of E coli is
required by the proposed conditions; and
Nitrate concentrations in the Plant's discharge are very low, and nitrate and clarity
do not appear to be in a degraded state in the Mataura River at Mataura.
a With respect to Objective 3(a), while the Mataura River downstream of the Plant may
be un-swimmable at times, the risk of a person swimming below the Plant becoming ill
due to the Plant's discharge is well below 1%, which is considered an acceptable level.
The risk due to the Plant's discharge will also be further reduced following the
installation of the UV disinfection required by the proposed conditions, although this
will have limited effecl on reducing the baseline risk in the river as it is mainly affecled
by upstream land use.
As described in FWS (2019), water quality in Mataura River downstream of the
discharge is suitable for trout and native fish, as sought by Objeclive 3(b).
As described in FWS (2019), water quality in Mataura River downstream of the
discharge is suitable for stockwater, as sought by Objective 3(c).
a
o
o
a
a
Alliance Group Limited - Mataura Processing PlantAssessment of Environmental Effects 103
a With respecl to aesthetic and natural character values (Objective 3(d)), key matters of
concern for this type of discharge would include any changes to the natural colour
and clarity of the water, and the formation of bacterial or fungal slime growths visible
to the naked eye as obvious plumose groMhs or mats. ln respect of these matters:
Environment Southland monitoring data shows clarity at Mataura is better than
the relevant ANZECC 2O00 guideline, and FWS (2019) conclude the discharge
does not cause a conspicuous change in clarity;
FWS (2019) concludes the discharge does not appear to result in the generation
of conspicuous foams, scums or heterotrophic groMh; and
Periphyton growths, which are reflective of moderate to high enrichment, occur
during long accrual periods, however this occurs upstream and downstream of
the discharge. Addressing this effect will require a whole-of-catchment response
to reduce nutrient loads, and the Plant's contribution to that is included in the
proposed conditions.
Policies
Central to the Plan's provisions for managing water quality are the following policies which
set out how the effecls of the discharge are to be managed, relative to upstream water
quality, and a suite of specified water quality standards (noting that the Plant is located in
the Mataura 3 water body class):
Policyi - Surfoce woter body closses
(o) Recognise the different choroderistics of the following surfoce woterbody closses when monoging dischorges:
(x) Motouro 3
(b) Apply woter quolity stondords estob/lshed under ony Woter Conseruotion
Order.
Poliq 3 - No reduction in woEr quolity
Notwithstonding ony other policy or objedive in this plon, ollow no dischorges to
surfoce woter bodies thot will result in o reduction of woter quolity beyond the
zone of reosonoble mixing, unless ,T is cons,stent with the promotion of the
sustoinoble monogement of noturol ond physicol resources, os set out in Poft 2 ofthe Resource Monogement Act 1991, to do so.
Policy 4 - Surfoce woter bodies outside Alotulol Stote Wdters
For surtoce woter bodies outside Noturol Stote Woters, monoge point source ondnon-point source dischorges to meet or exceed the woter quolity stondordsreferred to in Rule 1 ond specified in Appendix G "Woter Quolity Stondords",
unless ,t ,s cons,sfent with the promotion of the sustoinoble monogement ofnoturol ond physicol resources, os set out,n Port 2 ofthe Resource Monogement
Act 1991, to do so ond so ovoid levels of contominonts in woter ond sediments thot
o
Alliance Group Limited - Mataura Processing PlantAssessment of Environmental Effects 104
a
could horm the heolth of humons, domestic onimols including stock ond/oroquotic life.
Poliq 9 Zone of reosonoble mixing
When determining the size of the zone of reosonoble mixing, minimise the size ofthe oreo where the relevont woter quolity stondords ore breoched. Considerotionshould be given to, but not be limited to, the following motters:
(o) the oquotic ecosystem volues in the offected reoch;
(b) the need for fish possoge,'
(c) the uses of the woter body odjocent to ond downstreom of the point ofdischorge
The proposed discharge activities undertaken in accordance with the proposed conditions
sit comfortably with these policies for the following reasons:
As set out in Section 8.2.2, the zone of reasonable mixing for the wastewater
discharge is currently set at 25O m below the outfall. Having considered the matters
listed in Policy 9, this remains appropriate.
The discharge is subject to the Mataura WCO and complies with all the water quality
standards set in the Mataura WCO.
The discharge is within the Mataura 3 surface water body class, and the onlyparameter in Appendix G for that class, which will not be achieved below the zone ofreasonable mixing, is E.coli.
The only parameters for which the discharge causes a reduclion in water quality
below the zone of reasonable mixing are E.coli, Amm-N and TN.
Policies 3 and 4 direct, that in the above circumstances, discharges only be allowed
where it is consistent with the promotion of the sustainable management of natural
and physical resources, as set out in Part 2 of the RMA to do so.
For reasons set out in Section 13.3.5, granting the applications as sought would be
consistent with Part 2 of the RMA.
The Operative Plan also includes the following relevant provisions which express
preference for certain methods of discharge:
Poliq 7 Preter dischorges to lond
Prefer dischorges to lond over dischorges to woter where thls is procticoble ondtf,e er7ects ore /ess odverse.
Policy 8 Dischdrges to woter
Prefer point source dischorges of contominonts to woter ot times of high flow overdischorges ot normol or low flows, ond ensure thot where dischorging does tokeploce ot low flows, the effects thot could not be procticolly ovoided ore minimised.
a
a
a
a
a
Alliance Group Limited - Mataura Processing PlantAssessment of Environmental Effects 105
12.6.2
The analysis completed by PDP on options for discharging the Plant's wastewater to land
was partially in response to the expressed preference for a land-based discharge in these
policies. However, for the operational, establishment, financial and environmental reasons
set out in Section 10.4.1, a full time or partial discharge to land does not represent the best
practicable option in this case. Therefore, as Policies 7 or 8 express a preference rather
than a requirement, they do not represent a barrier to granting the consents sought.
Water Quantity
As outlined in Section 7.3, two water takes are proposed:
o A take and use of water for engine room cooling water and condenser water, whereby
all the water taken is returned back to the hydro race from which it was abstracted.
o A take for various Plant processing activities, in which falmost] all the water taken is
returned back to the river via the Plant's wastewater discharge 100 m downstream of
the hydro race discharge.
Of most relevance when considering these activities are the Operative Plan provisions
which address:
o Water allocation and environmental flow regimes;
r Efficient water use;
o Water metering; and
o Consent term.
Each is addressed below.
Water allocation and environmental flow regimes
The Operative Plan contains the following overarching objective addressing the allocation
of water to instream and out of stream uses:
Objective 5 - Sufficient woter ovoilobility
To hove sufficient woter to support the reosondbly foreseeoble needs of current
ond future generotions ond enoble people ond communities to provide for theirsociol, economic ond culturol wellbeing while protecting oquotic ecosystem
heolth, life suppofting copocity, noturol chorocter ond historic heritoge volues ofsurfoce woter bodies.
When considering how this objective is to be achieved the policies of most relevance
state:
Policy 14 - Monoge the toking, use, domming or divercion of surfoce woWWhile recognising the positive effects resufting from the use ond development ofwoter resources, monoge the toking, use, domming or diversion of suttoce woter
Alliance Group Limited - Mataura Processing PlantAssessment of Environmental Effects
'to6
Vt o a an o a 5 d E o d D a o o o o o '- o 3 o .a \ o 3 (E' a o U
I(o f =
r o o : a o. 6 a o o il o 6
ssos
oe
o oo
3
Iits*
gE$t
l$E
t i s
s B
'$ E
$ c
!*.iq
s E
ig
cBE
E P
It*\
!':s[
E
-E
te$
$3
$D
:3.i
qig
Srn
-&
EB
=is
8Yo
ead. S*S
3Xa
\+ s3
3 e l,l I Ut c $ n o E o rd o r 6 s o E. t a :r S S. F a ID a o I a l a. c Vt o
oA
L_5
bxb E
x-Q
Oni
x \x oo o !!.
:o (/, f,
Qo
<f
QO
o3 f5.
o5'
BS
:r-
:5 o { a f a. o I d Q s' o lU o l^ o g t, > o a c 5 a o
oa3
B83
8ib
e9B
E Po
Sa.
,d!
=.O
J< EB
+.
o'<
\O
(a oS ild *rd
oI ax iB i3 oo oaL
(,o
9"i
E$
dS dsa o 6 o f,
s+
arxo
oxt
ooi
\ 3Sd
gFE
8A8
a3g
!to
5
saE
oc:i
5Es
iaE
*r$
$Ei
;qs
oE:l'
o\H
fao
\.oa
ci<
o:e
.6S
a\ eir
$i$
t$s
S
o=rn
B€-
d
$*g
3qi
_oa;
aQ-c
e-'5
tsB
6S
'os
Qfd sI$
a5q
$E$
6or)
0';E
.d il
-;S
Es
\-.i
o'f *3
S.!.
e sq gs 3Q +3 *3 !s. =
fro
o*5
'dY
ml, 3;i
d E
sqd
!'n
Pd' e& x5 oui
oo 5(D
g3 Qd'
de EA
:.o :il =o
oui
h> gE SQ a3 3o 5' S
'=
.o xo \o 5(, o
ooo x9 E
€J\ (o
O cf ER
O+
o a $ o o e a f a. d o g q o { o o ln c b p x d
oor
O=
|,gS {i+ o; 3S
=t o a : a a 5 a o o il o G o : o l o o a 6 o a. 5 t g e
S
3 $T
o=o
BS
Eo9
3is
Sdd
6
ig.E
as:
TB
E,ta q; de 8* 3a Q
\Itq 9* =
.) oo PE
e.E
q, I }H t.t qIo .l
a= Eq
ol Eid do fa e,€
mr
<J ='=
oo fo.
3l g< d9 -o mtr
ad Q! 6Ao o o o. l (.t 'o o f,
o {
a
Poliql6 - Environmentol flow ond level rqimes
(o) When gronting resource consents for suioce woter obstroction, domming,diversion ond use, the Council where oppropriote will opply by woy ofconsent conditions environmentol flow ond level regimes estob/ishedunder:
(ii) ony Woter Conservotion Order
The proposed take and use of cooling water, and process water sit comfortably with theseprovisions for the following reasons:
The sustainable flow regime in this catchment is set by the Mataura WCO, and in
accordance with Policy 15(c) and Policy 16(a)(ii), the proposed abstraction will take
water in accordance with that flow regime;
The take and use of water for cooling and process use will result in no net loss ofwater in the catchment, and in turn, these are a type of abstraction that Poliry 15(e)
directs be recognised and provided for.
Because the proposed take and use of water will only reduce flows for a short 10O m
section of the Mataura River, and the Mataura WCO will ensure that baseflows
through that reach are maintained at 95% of the naturalised flow, the take and use ofwater does not have a high risk of adverse environmental effects (Policy 15(i)), nor will
it result in any of the effects of concern in Policy 15(i)(a) - (c).
Monitoring of the water take is limited to recording the volume (cooling water) and
rate (process water) of take, and this reflecls the minimal risk of adverse
environ mental effects.
Efficiency of use
Efficiency of water use is an important part of the Operative Plan, a nd it includes the
following provisions:
Objective 7 - Efficient Woter Use
To moximise the efficiency of woter use.
Policy2l- ReosonoDle useof woter
To ensure thotthe rote of obstrodion ond obstroction volumes specified on woterpermits to toke ond use woter ore no more thon reosonoble for the intended enduse.
The proposed rate and volume of abstraction is no more than reasonable for the intended
end use and is considered to represent efficient use of water. ln accordance with theseprovisions, Alliance commissioned PDP (see Appendix 8) to assess the efficiency of water
use on-site. For reasons outlined in Section 9.2.2, that assessment identified the use ofraw river water for generation of white-water as a potential area where water use could be
a
Alliance Group Limited - Mataura Processing PlantAssessment of Environmental Effects 108
a
reduced (by approximately 2,000 m3/day). Alliance has also determined that some of the
water currently allocated to it is unnecessary for the proposed use. This is reflected in the
proposed conditions allowing a significantly lower daily volume of water to be taken than
the current consents.
Measurement
ln 2018 Alliance applied for amendment to the water metering conditions on the existing
consent to take and use water at the Plant (Resource Consent AUTH-2O41261, in order to
bring those conditions into line with the Resource Management (Measurement and
Reporting of Water Takes) Regulations 2010.
The outcome of that process is that:
The take and use of water for Plant processing activities, including water that is used
for cleaning, potable water supply, wastewater processing and truck washing, should
be subject to water metering in accordance with the Water Measurement Regulations;
but
The take and use of water for engine room cooling water and condenser water is to
be estimated and reported by combining the records of discharge monitoring, take
monitoring, pump capacities and pump operation.
No changes to this approach are proposed, and it is considered the proposed water
measurement aligns with the expectations of the Operative Plan.
Consent Term
As set out in Section 1 of this AEE, Alliance has sought a term of 35 years for all the
resource consents sought.
The Proposed Plan includes the following poliry which is relevant when determining
whether this consent term is appropriate:
Poliq 14A- Determining l,,,e term of o wotet permit
To determine the term of o woter permit considerotion will be given, but not
limited, to:
(o) the degree of certointy regording the noture, scole, durotion ondfrequenq of odverse e,Tects from the octivity;
(b) the level of knowledge of the resource;
(c) relevont tongoto whenuo volues
(d) the ollocotion sought, porticularly the proportion of the resource sought;
(e) the durotion sought by the opplicont, plus moteriol to support thedurotion sought;
(0 the permonence ond economic life of the octivity;
Alliance Group Limited - Mataura Processing PlantAssessment of Environmental Effects 109
@) copitol investment in the octivity;
(h) monitoring ond review requirement in permit conditions;
(i) the desirobility of opplying o common expity dote for woter permits thotollocote woter from the some resource; ond
0) the opplicont's complionce with the conditions of the previous permit(where o new woter permit is sought for o previously outhorised octivity).
ln the conte( of Policy 14A, the following matters would support the 35 year consent term
sought:
The activity is existing, and there is a high degree of certainty on the nature, scale,
duration and frequency of its adverse effects on the environment (clauses (a) and (b)).
The take only reduces instream flows for approximately 10O m (clause (d)).
The Plant is a significant permanent asset with an insured value of $225 million
(clauses (0 and (g)).
The proposed conditions include provision for Environment Southland to review the
consent for the purpose of changing the monitoring conditions, dealing with any
unexpected adverse effects that arise from the exercise of the resource consent, or to
comply with the requirement of a regional plan (which would include any new flow
and allocation regime set for the Mataura River) (clause (m) and (i)).
Alliance has historically had an excellent compliance record with the conditions of its
existing consent to take and use water at the Plant (clause 0)).
With respect to clause (c), Hokonui Runanga and TAMI have expressed a preference for
the term of consent to be no more than 25 years.
12.6.3 Conclusion
Water quality downstream of the discharge will achieve the Operative Plan's objectives for
water quality in this part of the Mataura River.
The discharge causes levels of E.co/i, Amm-N and TN to increase downstream of the
mixing zone, and in the case of E.coli, to also not meet the relevant water quality standards
in Appendix G of the Operative Plan. The Plan directs this type of discharge only be
allowed where it is consistent with Part 2 of the RMA to do so, which, for reasons set out in
Seclion 13.3.5, is the case here.
The proposed discharge will not be contrary to the objectives and policies of the
Operative Plan, and there is nothing in the Operative Plan which means the discharge
applications cannot be granted on the terms sought.
Alliance Group Limited - Mataura Processing PlantAssessment of Environmenta I Effects
a
a
a
a
't'to
12.7 PROPOSED WATER AND LAND PLAN
The Proposed Plan is intended to provide direction and guidance regarding the
sustainable use, development and protection of water and land resources in the Southland
region.
The Proposed Plan was notified on 3 June 20'16, and the submissions and hearing process
was completed in October 2017. A decisions version of the Proposed Plan was released
on 4 April 20'18. lt is this decisions version of the Proposed Plan that is the relevant
version when considering these consent applications.
However, many of the key provisions are subject to Environment Court appeals and may
change. This needs to be acknowledged when having regard to them in respect of these
consent applications.
When considering these applications for resource consents, the most relevant provisions
in the Proposed Plan are contained in the following sections:
o Region-wideObjectives;
o Ngai Tahu policies;
o Water Qualitf and
o Water Ouantity policies.
12.7.1 Region-WideObjectives
The Proposed Plan includes the following region-wide objectives which are relevant when
considering the proposed take and discharge activities:
Objective 1
Lond ond woter ond ossocioted ecosystems ore sustoinobly monoged os
integroted noturol resources, recognising the connectivity between surtoce woter
ond groundwoter, ond between freshwoter, lond ond the coost.
Objedive2
Woter ond lond is recognised os on enobler of primoty produdion ond the
economic, sociol ond culturol wellbeing of the region.
Objectira 3
The mouri of woterbodies provide for te houoro o te tongoto (heolth ond mouri ofthe people), te houoro o te toioo (heolth ond mouri of the environment) ond te
houoro o te woi (heolth ond mouri of the woterbody).
Objedive4
Tongoto whenuo volues ond interests ore identified ond refleded in the
monogement of freshwoter ond ossocloted ecosystems.
Alliance Group Limited - Mataura Processing PlantAssessment of Environmental Effects 111
N
E(o
do)caoou9oo_usgfuJ(o-E
g>
5rEE
troo'E
'5-:CJ
I.IJ
9b9EoogH=
6E
g=
o
bo6co)oUEoouio.!ooEooEDcos.xDcq,a.a.
:footat4o-uE
AP
EE
! B
B.F
bo
-E B
.A6 P
S
e9p
E$
o?E
,pE
b\.cE
;;E$gtsootrQ
.\geoU
)
3EE
gEE
buiccooE
Et
rEE
g,o.s
€EE
EE
Eo.o
$s$ocoS
urOF
-OU
ItgUob\o
ocoUl!.EO)
tno>>
iE
8E
gi:oE
EbeiS!EE
EeEi2sS
s.\oC
UE
EbqruoLy)obo\
H E
E}.E
ooc>>
oEE
*€o-:l
B S
5
olu5boDcoc6oooocotaoEooo:5:EetIEEEoo
EE
P;
bEooO
6bs9(JlobE
Fc'<g
BE
'rFo
tJ=>
.E;;
6 f E
oIooO)
sCo'660
EE
$E6u8Eooo.9cFT
ARE
Q-O
ir'€H$iE
rE
Q
$$.s9p6.9otn6.e .ELF
oit5s
IEE
EE
o 66
Euo::(aoobEooG
.op:E
Po:{E8,Po.\
EE
E.e€bE
dBE
$toY
o*ss>
UrO
9.SE
abx5
)sC(4l+
u.sdiE
EE
Y.C
cbE
E\c
-
Er$
r aEs8E
otgEob\o
bD
E9qi.Y
O.c
9EE
E6t
Bg t
EE
:5-oloo.cB
Efi
gEI
r.iSgE
$irs*E
E
EgE
bE.r'n
ES
sHssE
$$ P
5 SiE
E.E
s $$ $i E
aq.Eqoot
t\EUob\o
(4-.E
pgE
ffE
).,t
o1;8.\cxrE
XgoEtro:
Ep $a
I T
5 E
E
; ;E
EE
E E
$ tEb
gt *i'
n i3
xEO
uOcb
* gE
IP
; 3+
EE
Q
bE i:
5 i.e
9Et.
E i R
tc a
ot X
>':{-
oo dP
€E B
E eE
fr $ .E;- P
;.o:;
EE
dEg E
H P
$ F$
q rg6 ss o
o
r(PA
orotroE
p:b\.-6Sa'6b'Ests3sS
Ecoets6C5-
!go\9dE
Pla '-f,oo\boC
OI
ocoEro(4tr0<gEgP9E
lo:6oJ!,
E E
Ebq'gio
2'E
a
Objec'tive 17
The noturol chorocter volues of wetlonds, rivers ond lokes ond their morgins,
including chonnel ond bed form, ropidt seosonobly vorioble flows ond noturol
hobitots, ore proteded from inopproprlote use ond development.
Objedive 18
All octivities operote in occordonce with "good monogement prodice" or better tooptimise efficient resource use, sofeguord the life suppofting copocity of theregion's lond ond soils, ond mointoin or improve the quolity ond guontity of thereg ion's woter resources.
When considering the proposed activities in the context of these objectives, key matters
include:
a ln accordance with Objective 1, the integrated nature of the land, water and
ecosystems in the Mataura catchment has been recognised and incorporated into the
assessment of effects undertaken for the proposed activities, and into the proposed
means for avoiding, remedying or mitigating effects.
Objectives 2 and 9 recognise the role of water as an enabler of economic, social and
cultural wellbeing of the region, and seek it be managed to support and provide for
the reasonable needs of people and their social, economic and cultural wellbeing.
Enabling the Mataura Plant to continue utilising the Mataura River for water supply,
and as a discharge medium to deliver the social and economic benefits outlined
Section 6 of this AEE, would do this.
With respect to Objectives 3, 4 and 5, iwi have a long association and strong
traditional relationship with the Mataura River, and mahinga kai resources, nohoanga
and mdtaitai are all important and relevant values here. Alliance has, and continues to
consult with Te Ao Marama and Hokonui Runanga on how the proposed take and
discharge activities effect these values, and how those effects can be avoided,
remedied or mitigated. And a new condition is proposed to ensure ongoing,
meaningful engagement with, and input from Hokonui Runanga regarding the
ongoing monitoring of the effects of the Plant's activities on the surrounding
environment.
With respect to Objectives 6 and 7, water quality in the Mataura River and Toetoes
Estuary has been degraded by human activities for certain parameters. The FMU
process which is intended to manage this issue has not yet occurred, and it is
therefore uncertain what the freshwater objectives, limits and timeframes for the
Mataura FMU will be. However, key issues identified by FWS and AES are its high
nutrient and E coli levels, and it would seem inevitable that the planning framework
stemming from the FMU process will require a significant reduction in these
contaminants in the Mataura catchment over time. Diffuse runoff from pastoral land
use contributes considerably to this degraded state, and the improvement of water
Alliance Group Limited - Mataura Processing PlantAssessment of Environmental Effects
a
113
a
quality sought by Objective 6 will require a significant change to how this aclivity
occurs in the catchment. This will likely take some time. However, the Plant also
contributes to instream concentrations of these key contaminants downstream of
Mataura, and the wastewater treatment plant upgrades required by the proposed
conditions of consent will ensure Alliance does its part in improving the quality of
Mataura River water in respect of these key parameters.
The Mataura WCO specifies the environmental flow and allocation regime to achieve
Objective 9 in the Mataura River. The Plant's take of water is in accordance with that
flow regime.
An independent assessment by PDP (see Appendix 8) has shown there are some
inefficiencies in the current use of water on-site. The proposed conditions require this
to be addressed over the first three years of the new consent term via implementation
of a Resilience and Water Saving Strategy. ln accordance with Objective 11, this means
the amount of water abstracted will be reasonable for the intended use and will be
used efficiently.
The Streamlined Environmental (2019) QMRA has shown the Plant's discharge does
not have significant adverse effects on human health and therefore aligns with
Objective 13B. Environment Southland and Streamlined Environmental studies also
show the baseline health risk in this catchment is not as significant as measured E.coli
levels would suggest.
The outcome sought by Objective14 is influenced by water quantity, quality and land
use. With respect to water quantity, the Mataura WCO specifies the environmental
flow and allocation regime to achieve Objective14 in the Mataura River. With respect
to water quality, it is apparent that the Mataura River and Toetoes Estuary has
degraded water quality for some parameters, and this may be impacting on its life-
supporting capacity. The proposed consent conditions set out how the Plant will
contribute to maintaining, and then enhancing water quality and life-supporting
capacity over the first 15 years of the new consent.
The only direct effect of concern on a taonga species that Objective 15 seeks to be
recognised and provided for is entrainment of native fish in the Plant's water pumps.
To address this concern, the proposed conditions require installation of fish screens
which meet recognised standards.
ln accordance with Objective 17, the proposed take and discharge activities are not an
inappropriate use and development when considering effects on natural character
values. The Mataura River is a highly modified river with significantly reduced natural
character values, particularly in the vicinity of the take and discharge. The proposed
discharges to water will maintain the quality of the existing riverine environment and
are not considered to cause any conspicuous change in the colour or clarity of the
receiving water, or generation of foams or scums. Likewise, the take and use of water
Alliance Group Limited - Mataura Processing PlantAssessment of Environmental Effects
a
a
a
't14
12.7.2
will have minimal effects on instream flows and will abide by the environmental flow
regime set for this river by the Mataura WCO.
NgaiTahu Policies
The relevant Ngai Tahu policies state:
Poliq 2 - Toke into occount iwi monogement plons
Any ossessment of on octivity covered by this Plon must
1. toke into occount ony relevont iwi monogement plon; ond
2. ossess woter quolity ond quontity, toking into occount Ngdi Tohuindicotors of heolth.
Poliq 3 - Ngdi Tohu ki Murihiku toongo speoes
To monoge octivities thot odversely offecttoongo species, identified in AppendixM.
With respect to Policy 2(1), the relevant provisions of Te Tongi o Touira - The Cry of the
People are addressed in Section 12.8 of this AEE. And with respect to Poliry 3 as outlined
above, the only direct effect of concern on a taonga species is entrainment of native flsh in
the Plant's water pumps. To address this concern, the proposed conditions require
installation of fish screens which meet recognised standards.
12.7.3 Water Quality Policies
As required of it by the Freshwater NPS, the Proposed Plan includes the following poliry
which specifies certain matters to which regard must be had when considering an
application for a discharge:
Policy A4 of the Notionol Policy Stotement for Freshwoter Monogement 2014(os omended in 2017)
When considering ony opplicotion for o dischorge the consent outhoritymust hove regord to the following motters:
(o) the extentto which the dischorge would ovoid contominotion thotwill hove on odverse effec't on the life-suppofting copocity offreshwoter including on ony ecosystern ossocioted with freshwoter;ond
(b) the extent to which it is feosible ond dependoble thot ony morethon minor odverse effect on freshwoter, ond on ony ecosystemossocioted with freshwoter, resulting from the dischorge would beovoided-
2. When considering ony opplicotion for o dischorge the consent outhoritymust hove regord to the following motters:
(o) the extent to which the dischorge would ovoid contominotion thot
1.
Alliance Group Limited - Mataura Processing PlantAssessment of Environmental Effects 115
(o
codo)c6qoo9oO
- trE
Cf
LlJo-6s>
5lEEltr
oo'E
'5.=
cJ
I.IJ
3:b9Eo9arEY
,A=
o.E
E=
O
FEOE
5(I,,oulr(Jg9s$uJ<*eE
€.&
R3=
o*:9a'obo)O
!CE
EE
otsE,-o.=8sFbboi.p
B
EE
ebE
iE
fiE9,5
gsb.s$rpE
8toqEco'=s(4o)
oEoEooItt
EoEcoaooo:boIBoEtoea.s
I
otobI
tEbuoQ
.Oc
o.!lxP
9E
EE
EH
s$B:
$E b E
-eoc;ocoisR
:IbgEE
flEa
EesS
E$$H
:E:E
Ee;t
XiH
SsE
ES
sE!!
s''tEE
iEE
Ioooc
spoHo
E8ihobcc
bB€g$t=$ $;btrtroooE
EE
96 o
EE
EE
bglo=o6=U
tNo
.seEB
TE
q $sO
IO
c
EE
8o€D883
3"E
EE
etn6\oE
idEb9S
Ers.xoE
oE!i
=eNgtE
6g>osO
Ytro.E
&E
c\5(lJ43s pE
E.E
oo5i
Eb
PE
S
rsEooY
sEt
oEoo6EtrEEoaaooIboicroDlo.=E-I
tboq.
Eo+c8 c.i
uPSp
obS
mosu).*{C
!.i
8EOU
o\P^o
ptbo€EB
Eo.Q
€EEs
otqEE
BQ
o$ssd<(a
EP
p'ds.o
=5r3boEE
TE
6O5
IOU
E qr
SE
S
EH
EoioE
.s8H
is3[aE
FP
E [E
EE
8ipBLba.r5n
EE
;8E
FB
s=E
EE
anoPo€uoEEcooo'stoooIEtroooEt
trtr=I
I\.9'oq.
!oomv
tP€
EfE
Sr'ta
>-=
o@(o
.q.9*.9.9:o
o.Eo-()-
ioho36;<
oE.=
.9oth
-e .=
OO
lr,>
P! E
;9tE
gg,o_oyE
EE
FH
gl-
;;3[E9 E
ET
f I E
ILO
OO
-oP
.oOo9tnn-
E; $e
?Ot(oP
neSb
5-3*.(,U
vXE
.9TE
-Eotr
!b+8.
Lut -O
.E
Et<
E#E
:s-etsHoloE-cocoF
.C(oU
o-c,oe;O
E-c5PU
EooitrE
Uoc0)oooIr
g,1ro9:.T
E*
PE
,9E'=
drPia
frP b g
=Ltru
;o;(oE
E g
E.ofi
9l$E
=g
6;E6
€ fr P;
€; E
E
gf =
E83.:Ec.Y
-O:
SH
HB
>xo_o
v(JtD6
Pp
E;
,n:E-yC
lE
E €E
oo-ollF
Ut_}_E
'
@oFoEoEoD(oo)oo,c'to-cco.c= [email protected]>'-tn .9foU
Ofi.oo!-C€EooO
-rtro=
a
EoceE
e>
b E
!uo
EE
E
$HE
[:rpuE:\teo^orb
Eslu
$$EE
rE;8
:fiBE
1'rb>E
OO
Ob.S
EP
,E
:88sE
I.Ettob
o
Eco\'-ocooiocE
Eo.Sb':E
UE
Poc€oou!0JccU
Q8ubsfiEooE
es.uocdPE
E
NF
:N
aa
ovoiding where proc'ticoble ond otherwise remedying or mitigoting onyodverse e,Tecfs of new dischorges on woter quolity or sediment quolitythot would exocerbote the exceedonce of those stondords or sedimentguidelines beyond the zone of reosonoble mixing; ond
2. requiring ony opplicotion for replocement of on expiring dischorge permitto demonstrote how ond by when odverse effecfs will be ovoided whereprodicoble ond otherwise remedied or mitigoted, so thot beyond thezone of reosonoble mixing woter quolity will be improved to ossist withmeeting tf,ose stondords or sediment guidelines.
Poliq 15C - Mointoining ond imprcving woter quality ofter FMU processes
Following the estoblishment of freshwoter objectives ond limits under FreshwoterMonogement Unit processes, ond including through implementotion of non-regulotory methods, improve woter quolity where it,s degroded to the point wherefreshwoter objectives ore not being met ond otherwise mointoin woter quolity
where freshwoter objectives ore being met.
The only parameters which do not meet the Appendix E Water Quality Standards or
Appendix C ANZECC sediment guidelines downstream of the discharge, are faecal
coliforms and E col/.
ln turn, Poliry 158(2) requires Alliance demonstrate how, and by when adverse effects will
be avoided, where practicable, and otherwise remedied or mitigated so that beyond the
zone of reasonable mixing, water quality will be improved to assist with meeting the
relevant standards in Appendix E. The proposed conditions do this by requiring a three
stage upgrade to the wastewater treatment plant which will significantly reduce the E coli
and faecal coliform concentrations in the discharge. This will improve the water quality
beyond the zone of reasonable mixing and assist with meeting the Appendix E water
quality standards for those parameters.
Because the FMU process has not yet occurred, it is uncertain what the freshwater
objectives, limits and timeframes for the Mataura FMU will be, and in turn, how Policy 15C
will apply to this catchment. However, as outlined in Section 12.2.4, Alliance expects its
contribution to catchment reductions in key contaminants to be more than proportional to
the wider reduction achieved in the catchment, and also comparatively expedient.
Other policies which are particularly relevant to the Plant's discharges are Policies 14 and
164 which state:
Poliq 14 - Preference for dischorges to lond
Prefer dischorges of contominonts to lond over dischorges of contominonts towoter, unless odverse effects ossocroted with o dischorge to lond ore greoter thono dischorge to woter. Porticulor regord sholl be given to ony odverse effects on
culturol volues ossocroted with o dischorge to woter.
1.
Alliance Group Limited - Mataura Processing PlantAssessment of Environmental Effects 117
Poliq 16A - lndustriol ond trode processes thot moy offect y@ter quol@
Minimise the odverse environmentol effects (including on the quolity of woter inlokes, rivers, ottificiol wotercourses, modified wotercourses, wetlonds, tidolestuoriet so/t morshes ond groundwoter) by requiring the odoption of the bestprocticoble option to monoge the treotment ond dischorge of contominonts
derived from industriol ond trode processes.
The directives in these policies are addressed in detail in Section 1O of this AEE, which
addresses alternative methods for discharging the Plant's wastewater. For the reasons set
out in Section 1O, the continued discharge of wastewater to the Mataura River, but with
significant treatment plant upgrade milestones within five and 15 years, is considered the
best practicable option for managing the treatment and discharge of contaminants from
the Plant. And in accordance with Policy 164, the proposed conditions require this BPO to
be adopted by the consent holder.
The expressed preference in Policy 14 for a discharge to land was considered in this
options assessment process. However, for financial, practical and environmental reasons,
neither a full nor partial discharge to land option was considered practicable.
12.7.4 Water Gluantity
As required of it by the Freshwater NPS the Proposed Plan includes the following policy:
Policy 87 of the Notionol Policy Stotement rbr Freshwoter Monogement 2oi4(os omended in 2017)
When considering ony opplicotion, the consent outhority must hoveregord to the following motters:
(o) the ertent to which the chonge would odversely offect sofeguordingthe life-suppofting copocity of freshwoter ond of ony ossociotedecosystem; ond
(b) the extent to which it is feosible ond dependoble thot ony odverseeffect on the life-suppofting copocity of freshwoter ond of onyossocroted ecosystem resulting from the chonge would be ovoided.
The key point to note in respect of this policy is the conclusion in Section 7.3, that the
effects of the proposed takes on instream flows will be limited to a minimal reduction in
flows over a 10O m stretch of river, and in turn, that adverse effecls on the life-supporting
capacity of the Mataura River would be avoided.
The Proposed Plan also contains a relatively comprehensive suite of policies for managing
the take and use of water. Those which are most relevant when considering the proposed
take and use of water state:
Policy20 - Mondgement of yvuterresourres
Monoge the toking, obstrodion, use, domming or diversion of surloce woter ondgroundwoter so os to.'
1.
Alliance Group Limited - Mataura Processing PlantAssessment of Environmental Effects
't18
ss
asoe
o
o oi
gmB
;
llggg
itelli
l.*
d.E
{
.ts
o o
iBiE
\\\\
=;o
o
EiiE
6ll6
'
*ssa
3;$$
t8*3
BS
Ex=
**d3
odsd
e\{Q
.53E
Kqo
O<
B:Q
$E
HE
Ex'
oi'a
!-e;
Qa:
o\.
'f aS
'(,
x(o
oo;
qSil
Oq+ sE
d,d
odo
=!
==
60 Bi,
5t 9; S=
ex 89.
6'9
9"q
EE *q o { o o a 5 a. a d c 5 a. E o o o x
asQ
-oA
o+
:iF s.eq
tci
!(,
=5
i. IE
]Jq
ods
g,E
tssl
o 3ets d\a
5-. dF t4
.=ox S
o cF gB u, Q
.
$; S:
ooil
Q6
3a rs3 o q
ot=
Ioo F= oo \xj' c 5 a l o c f, a 3 o \ o o o o o a o a c f a o o E o ln o v1
o S o D d 6: o : ln o a f, \ E o o o 5 l4 o t o o 5 o d o j':
:E$S
$Ses
&dq
8s3
:daI
ia.
P;;E
B€S
E_
i3il
s;h*
!ll(,
s!
BE
*$iS
S n
\*o
o 5(
ooo
5=
(,(,
BS
&to
da9
:=
3o rte
rJ+
r+O EQ
st:9
qh go
lrJN
5
@:
EE
o) qid
Bo
3d qE m-
<=
='=
'oo fo 3r E
<d9 -o m
tr ild Q!
6',6 o o o @
,f to ! o J
(o
Poliq 42 - Considerotion of woter permit opplicotions
When considering resource consent opplicotions for woter permits to toke onduse woter:
except for non-consumptive uses, consent will not be gronted if o woterbody is over ollocoted or fully ollocoted; or to gront consent would resultin o woter body becoming over ollocoted or would not ollow onollocotion torget for o woter body to be ochieved within o time period
defined in this Plon; ond
except for non-consumptive uses, consents replocing on expiringresource consent for on obstroction from on over-ollocoted woter bodywill generolly only be gronted ot o reduced rote, the reduction beingproportionol to the omount of over-ollocotion ond previous use, using themethod set out in Appendix O; ond
instollotion of woter meosuring deices will be required on oll newpermits to toke ond use woter ond on existing permits in occordonce with
the Resource Monogement (Meosurement ond Reporting of Woter
Tokes) Regulotions 2O1O; ond
5. conditions will be specified reloting to o minimum flow or level, orenvironmentol flow or level regime (which moy include flow shoring), in
occordonce with Appendix K, for oll new or replocement resourceconsentg (except for woter permits for non-consumptive uses, communitywoter supplies ond woter bodies sub./'ect to minimum flow ond level
regimes estoblished under ony woter conseruotion order) for:
(o) surfoce woter obstroction, domming, diversion ond use; ond
(b) groundwoter obstroction in occordonce with Policy 23.
Policy 4l - Motching monitoring to risk
Consider the risk of odverse environmentol effects occurring ond their likelymognitude when determining requirements for ouditing ond supply of monitoring
informotion on resource consents.
It is considered the proposed take and use of water at the Plant, in accordance with the
proposed conditions set out in Appendix 1, sits comfortably with these provisions, noting
that:
. As set out in Section 6, the take and use of water at the Plant facilitates significant
positive benefiG for the local community, and in accordance with Policy 20(1A), these
are to be recognised when managing the take and use of surface water.
o The flow and allocation regime for the Mataura River is set in the Mataura WCO.
o The effects of the take on the matters in Policy 2O(1) will be mitigated by the Plant
returning almost all the water taken back to the Mataura River 1O0 m downstream of
the hydro race discharge.
Alliance Group Limited - Mataura Processing PlantAssessment of Environmental Effects
1.
2
3.
't20
a
ln accordance with Policy 20(3) and Appendix O, Alliance commissioned an
independent audit of its existing use of water at the Plant, and whether it is in
accordance with rates and volumes sought and does not result in wastage or
inefficient use of water. That assessment identified the use of raw river water for
generation of white-water as a potential area where water use could be reduced (by
approximately 2,000 m3/day. The proposed conditions require this to be addressed
over the first three years of the new consent term via implementation of a Resilience
and Water Saving Strategy. This means the amount of water abstracted will be
reasonable for the intended use and will be used efficiently.
Alliance has not been able to obtain any information from Environment Southland
conflrming the allocation status of the Mataura River, and in turn it has assumed the
River is not overallocated and that Poliry 42(1) and (2) do not apply.
ln accordance with Policy a2(3), the current water measuring methodology is in
accordance with the Resource Management (Measurement and Reporting of Water
Takes) Regulations 2010.
The Mataura River is subject to a minimum flow and level regime in the Mataura WCO,
and in turn, no condition specif,Ting a minimum flow or level is required in accordance
with Policy 42(5). However, the proposed conditions do require Alliance to prepare
and implement a low flow contingency plan to describe the practicable measures to
be taken to minimise the abstraction of water during times when the flow of the
Mataura River at the Tuturau recording site is less than 20 cubic metres per second.
Monitoring of the water take is limited to the volume (cooling water) and rate (process
water) of take which reflects the minimal risk of adverse environmental effects.
a
a
a
12.7.5 Consent Term
As set out in Section 1 of this AEE, Alliance has sought a term of 35 years for all the
resource consents sought.
The Proposed Plan includes the following poliry which is relevant when determining
whether this consent term is appropriate:
Policy 40 - Dehrmining the term of resource consents
When determining the term of o resource consent considerotion will be given, butnot limited, to:
1. gronting o shorter durotion thon thot sought by the opplicont when thereis unceftointy regording the noture, scole, durotion ond frequency ofodverse effects from the octivity or the cqpocity of the resource,'
2. relevont tongoto whenuo volues ond Ngdi Tohu indicotors of heolth;
3. the durqtion sought by the opplicont ond reosons for the durotion sought;
4. the permonence ond economic life of ony copitol investment;
Alliance Group Limited - Mataura Processing PlantAssessment of Environmenta I Effects 121
the desirobility of opplying o common expiry dote for woter permits thotollocote woter from the some resource or lond use ond dischorges thotmoy offect the quolity of the sorne resource;
the opplicont's complionce with the conditions of ony previous resourceconsent, ond the opplicont's odoption, porticulorly voluntorily, of goodmonogement proctices; ond
the timing of development of FMU sec'tions of this Plon, ond whethergronting o shorter or longer durotion will better enoble implementotion ofthe revised fromeworks estoblished in tf,ose sections.
ln the context of Policy 40, the following matters would support the 35 year consent term
sought:
The activity is existing, and there is a high degree of certainty on the nature, scale,
duration and frequency of its adverse effects on the environment (which are minimal)
(clause 1).
The significant capital investment involved in the proposed wastewater treatment
plant upgrade will require and be contingent on securing a long consent term in order
to enable the upgrades to be progressively implemented and allow the financial
investment to be justified and secured over an appropriate timeframe (clauses 3 and
41,.
The Plant is a significant permanent asset with an insured value of $225 million
(clause 4).
Alliance has an excellent compliance record with the conditions of its existing consent
to take and use water at the Plant (clause 6).
The proferred conditions impose a requirement to make progressive upgrades to
water use and treatment methods in a programmed way over the life of the consent,
structured to be in step with the FMU process. A long-term consent which requires
this long term and certain framework (and the significant improvements it requires)
benefits Alliance and the wider community due to the certainty it provides. The
proposed conditions also include provision for Environment Southland to review the
consent for the purpose of complying with the requirement of a regional plan (which
would include any new flow and allocation regime set for the Mataura River) (clause 5
and 7).
With respect to clause 2, Hokonui Runanga and TAMI have expressed a preference for the
term of consent to be no more than 25 years.
5.
6.
7.
a
a
a
Alliance Group Limited - Mataura Processing PlantAssessment of Environmental Effects 122
12.7,6 Conclusion
Water quality downstream of the discharge will achieve the Proposed Plan's objectives.
The discharge causes levels of Ecol/, Amm-N and TN to increase downstream of the
mixing zone, and in the case of E.coli lo also not meet the relevant water quality standards
in Appendix E of the Proposed Plan. The Proposed Plan requires this application
demonstrate how, and by when adverse effects will be avoided, where practicable, and
otherwise remedied or mitigated so that beyond the zone of reasonable mixing water
quality, will be improved to assist with meeting the relevant standards in Appendix E. The
proposed conditions do this by requiring a three stage upgrade to the wastewater
treatment plant which will significantly reduce the E coli and faecal coliform concentrations
in the discharge. This will improve the water quality beyond the zone of reasonable mixing
and assist with meeting the Appendix E water quality standards for those parameters
The proposed discharge will be not contrary to the objectives and policies of the Proposed
Plan, and there is nothing in the Proposed Plan which means the discharge applications
cannot be granted on the terms sought.
12.8 TE TANGIA TAUIRA. THE CRY OF THE PEOPLE
ln 2OO8, Te Tangi a Tauira: Ngdi Tahu ki Murihiku Natural Resource and Environmental lwi
Management Plan was published. This lwi Management Plan consolidates Ng6i Tahu ki
Murihiku values, knowledge and perspeclives on natural resource and environmental
management issues.
Of particular relevance when considering these consent applications are Ng6 Kaupapa -policy in Te Tangi a Tauira which address:
12.A.1
o Wastewater disposal;
o Discharges to water;
o Water quality; and
o Water quantity.
Wastewater Disposal
Te Tangi a Tauira includes the following Nge Kaupapa on wastewater disposal which are
relevant to the proposed discharge of wastewater and cooling water:
2. Ensure thot Ngdi Tohu ki Murihiku ore provided with the oppoftunity toporticipote through pre heoring meetings or other processes in the
development of oppropriote consent conditions for dischorge consents,
including monitoring conditions.
3. Require thot sufficient ond oppropriote informotion is provided with
opplicotions to ollow tongoto whenuo to ossess culturol effects (e.9.
Alliance Group Limited - Mataura Processing PlantAssessment of Environmental Effects 't23
sfNc(o
dO)
E,otnoUOa
O- tJ
egf LIJ
(o-6g>
5lEE
trd,o3.!c>.=
cJ
I.JJ
=ob
9EoqsiH=
6.E
3:6
ob'soa.bcoolnco)oUotn5Eotnoal^booiolnoiacotncoUocoo5oN
oU
i\oo
S=
"is
s$i:E
FS
sE
ES
Ed-b&
<E
Eiq
6.'S c
Q€6S
*r$$Egeg:
:EE
E8E
b,;(4'\ctrI,s$EE
EE
gE
aoro's gs
E50Y
o
SiE
€s
slsO
JUb
EP
EspFbE
sb.E
eoegtrq.oE
er5P
EE
6F
EE
Es
i 8 pIoE
'i.trse:{; B
: iE
EE
h$E
gt
t;s$g€H
tIE
I eq.\tsorri
Eoo\co8EolboE
P&
aO
oE
ToE€EbtrE
ES
Ff;teE
g,i'E
Eg
o*L's,e:cocooobss$scE
EE
E3E
boxo*bLv!'\.9(a
EE
Ug
Db
ccoo-oQ
cioE
*ls9.pb
reeEs
$fr g pE
E*tti
SE
sslco,9P
F5 3 E
8,E
ittEH
8E:iE
.SE
o€uE
E&
EE
ee,$ i*gH
esET
3 E dE
fi:sEs
bt H
r'sE
r$r;
ffiiiiE$
gEE
Esgt
$E$giE
$qi
t4f,Uaoci.itnoaolh.
B3
a€EE
Ur
:ioo€€(,colr8paEo0ias'sOvceS€S>-oOO
Uoor/t
Cqo
SE
o.o
;E$
osra.\tot.eUss8E
Es
!9h
E€5
\oEbS
9t;E
S:
pfr 3.t'sdoo
sEi€
;Eis
frEIB
oooPiobtbP
BS
u€Er
e€Es
* d8
e
E;$s
(j
utoD>ctoO
Es8gP
* sE
o o
psE
E H
. :E
s E
H
a e;
H
.s S
X
Ee
E E
:€* flF
I E
gR
: sa
E g ,, E
t i c iEt*E
Es:gggfig
$E g t E
; B s E
$ stg $S
E E
E E
E$ E
E
sE H
s ! E
out4
rdot
N
for the future growth ond development of the industry or community, ondthe obility of the existing operotions to occommodote sucF, grov/th ordevelopment.
18. Recommend o durotion not exceeding 25 yeors, for dischorge consents
reloting to wostewoter disposol, with on ossumption thot upon expiry (tnot before), the quolity of the system will be improved os technologicolimprovements become ovoiloble. ln some rnsfonces, o lesser term moybe oppropriote, with o condition requiring the system is upgroded within
o specified time period.
19. Require conditions of consent thot ollow for o S-yeor review ofwostewoter disposol octivities. During review, consent holders should berequired to consider technologicol improvements. lf improvements ore
ovoiloble, but not odopted, the consent holder should provide reosons
why.
20. Encouroge developers ond consent oppliconts to provide srte yisits fortongoto whenuo representotives to obserue proposed wostewotertreotment systems. Sfte visits enoble ngd rlnongo representotves to seewhot is proposed 'on the ground".
The key directives in these provisions were had regard to when assessing the effects of
the proposed activities, and in determining how the effects of the activities should be
avoided, remedied or mitigated through the proposed conditions.
ln respecl of these provisions, the following is noted:
ln accordance with Poliry 2, Alliance has and continues to engage with TAMI and
Hokonui Runanga on the development of appropriate, speciflc consent conditions for
the discharge, including monitoring.
ln accordance with Poliry 3, this AEE includes information on the nature of the
discharge, treatment provisions, assessment of alternatives and actual and potential
effects.
All the matters listed in Poliry 5 have been considered by Alliance in preparing this
AEE, and in shaping the nature of the activities for which consent will be sought,
including the mitigation measures set out in the proposed conditions.
With respect to Policy 6, various options for discharging the Plant's wastewater were
investigated but none is considered practicable here. The reasons for this include
local circumstances regarding the suitability and availability of land which is
recognised by Policy 7.
a Alliance recognises the role of Hokonui Runanga as tangata whenua and kaitiaki of
the Mataura River and has, and continues to engage with Te Ao Marama and Hokonui
Runanga in respect of the applications and how the effects of the aclivity should be
managed (Policy 8).
a
a
a
a
Alliance Group Limited - Mataura Processing PlantAssessment of Environmental Effects 125
With respect to Policy 9, a robust assessment of alternative discharge options has
been completed.
ln accordance with Policy'15, robust monitoring and reporting is required by theproposed conditions.
ln accordance with Policy 16, Alliance holds and will continue to hold various
environmental management systems certifications.
ln accordance with Policy 18, the quality of the wastewater treatment system will be
improved and the preference for a consent duration no more than 25 years is
acknowledged. However, Alliance considers a longer consent duration is required
here to allow the financial investment involved in the proposed wastewater treatment
plant upgrade to be justified and secured over an appropriate timeframe. lt is also
relevant that a proposed upgrade timeline is structured to be in step with the FMU
process for improving water quality in this catchment, and a long term consent which
includes the long term and ceftain framework contained in the proposed condition
(and the significant improvements it requires) beneflts Alliance and the wider
community due to the certainty of benefit it provides.
ln accordance with Poliry 20, and as part of its ongoing engagement process, Alliance
has invited representatives of TAMI and Hokonui Runanga on-site to observe the
wastewater treatment system.
12.8.2 Discharges to Water
Te Tangi a Tauira includes the following Nga Kaupapa on discharges to water:
Avoid the use of woter os o receiving environment for the direct, or pointsource, dischorge of contominonts. Even if the dischorge is treoted ondtherefore considered "cleon", it moy stiil be culturolly unocceptoble.Generolly, oll dischorge must first be to lond. This generol policy is oboseline or storting point. From this point, the Rlndngo con ossessopplicotions on o cose by cose bos,s.
.Assess dischorge to woter proposols on o cose by cose bosis, with ofocus on locol circumstonces ond finding locol solutions.
Consider ony proposed dischorge octivity in terms of the noture of thedischorge, ond the sensitiity of the receiving environment
When existing rights to dischorge to woter come up for renewol, theymust be considered in terms of olternotive dischorge options.
5. When ossessing the olternotives to dischorge to woter, o ronge ofvolues, including environmentol, culturol ond sociol, must be consideredin oddition to economic volues.
6. Encouroge the estoblishment of wetlond oreos, where procticol, os onolternotive to the direct dischorge to woter. Dischorge to o wetlond oreoollows PopotEdnuku the oppoftunity to filter ond clean ony impurities.
a
a
a
a
a
1.
2
3.
4.
Alliance Group Limited - Mataura Processing PlantAssessment of Environmental Effects 126
Any dischorge octivity must include o robust monitoring progromme thotincludes regulor monitoring of the dischorge ond the potentiol effects on
the receiving environ ment.
Require robust monitoring of dischorge permits, to detect non-complionce with consent conditions. Noncomplionce must result in
o p pro p ri ote e nforce me nt o ctio n to d i scou rog e fu fth e r n o n-co m p I io n ce.
Promote the use of the Culturol Heolth lndex (CHI) os o tool to focilitotemonitoring of streom heolth, ond to provide long term doto thot con beused to ossess river heolth over time.
10. Ngdi Tohu ki Murihiku consider octivities involving the dischorge ofcontominonts to woter o community issue. For this reoson, ngd ranongomoy, where seen os oppropriote, recommend thot o consent opplicotionbe notified.
Particular regard was had to the key directives in these provisions when assessing the
effects of the proposed activities, and in determining how the effecG of the activities
should be avoided, remedied or mitigated through the proposed conditions.
ln respect of these provisions, the following is noted:
ln accordance with Policy 4, a robust assessment of alternative discharge options has
been completed by PDP (2019) and an assessment of the best praclicable option for
treating and discharging wastewater from the Plant is contained in Seclion 10 of this
AEE.
ln accordance with Policy 5, that assessment considered a range of values, including
environmental, cultural and social values, in addition to economic values. As directed
by Policy 3, it also considered the nature of the discharge, and the sensitivity of the
receiving environment.
With respect to Policy'1, various options for discharging the Plant's wastewater were
investigated but none is considered practicable here.
ln accordance with Policies 7 and 8, robust monitoring and reporting is required by
the proposed conditions.
With respect to Policy 10, Alliance has consulted with the local community, including
Te Ao Marama and Hokonui Runanga, on the proposed discharge activities and
expects the applications to be publicly notifled.
12.8.3 Water Quality
Te Tangi a Tauira includes the following Nga Kaupapa on water quality which are relevant
to the proposed activities:
The role of Ngdi Tohu ki Murihiku os tongoto whenuo ond koitioki ofwoter must be recognised ond provided for in oll woter quolity
7.
a.
9.
a
a
a
a
a
1.
Alliance Group Limited - Mataura Processing PlantAssessment of Environmental Effects 127
monogement
Strive for the highest possible stondord of woter quolity thot ischorocteristic of o porticulor ploce/woterwoy, recognising principles ofochievobility. This meons thot we strive for drinking woter quolity in woterwe once dronk from, contoct recreotion in woter we once used forbothing or swimming, woter quolity copoble of sustoining heolthymohingo koi in woters we use for providing koi.
3. Require cumulotive e,Tecfs ossessments for ony octivity thot moy hoveodverse effects of woter quolity.
5. Avoid the use of woter os o receiving environment for the direct, or pointsource, dischorge of contominonts. Generolly, oll dischorge must first beto lond.
l^lhen ossessing the effects of on octivity on woter guolity, where thewoter source is in o degroded stote, the e,Tects should be meosuredogoinst the condition thot the woter source should be, ond not theexisting condition of the woter source (see text box on this poge).
10. Woter quolity definitions, cotegories, ond stondords must be determined,meosured, ond ossessed with culturol volues ond indicotors olongsidescientific informotion. Such indicotors ond volues centre on the obility ofthe woterwoy to support life, ond the ,Ttness of woter for culturol uses.
11. Require robust monitoring of dischorge permits, to detect non-complionce with consent conditions. Noncomplionce must result in
oppropriote enforce ment oction to discou roge fufther non-complio n ce.
Particular regard was had to the key direclives in these provisions when assessing the
effects of the proposed activities, and in determining how the effects of the activities
should be avoided, remedied or mitigated through the proposed conditions.
ln respect of these provisions, the following is noted:
Alliance recognises the role of Hokonui Runanga as tangata whenua and kaitiaki of
the Mataura River and has, and continues to engage with Te Ao Marama and Hokonui
Runanga in respect of the applications (Policy 1).
The preference in Poliry 5 for a discharge to land is acknowledged, however for
reasons outlined in Section 10 of this AEE, it is not practicable to do so here.
With respect to Policies 2, 3 and 7, the technical assessments have identifled that
water quality in the Mataura River is degraded in respect of certain parameters, and
the proposed conditions require a significant reduction in the Plant's contribution to
the cumulative loading of key contaminants over the first 15 years of the new consent
term.
ln accordance with Poliry 11, robust monitoring and reporting is required by the
proposed conditions.
2
7.
a
a
a
a
Alliance Group Limited - Mataura Processing PlantAssessment of Environmental Effects 128
12.8.4 Water Ouantity
Te Tangi a Tauira includes the following Nge Kaupapa on water quantity and abstradions
which are relevant to the proposed activities:
Adopt the precoutionory principle when moking decisions on woterobstrodion resource consent opplicotions, with respect to the noture ondextent of knowledge ond understonding of the resource.
Require thot scientificolly sound, understondoble, ond culturolly relevontinformotion is provided with resource consent opplicotions for woterobstrodions, to ollow Ngdi Tohu ki Murihiku to fully ond effectivelyossess cu ltu ro I erfects.
6. Encouroge woter users to be prooctive ond use woter wisely. To
encouroge best proc'tice ond efficient use of woter, porticulorly in termsof:
sustoinoble irrigotion design, delivery ond monogement;
moking best use of ovoiloble woter before woter levels get too low;
- reducing the omount of woter lost through evoporotion by ovoidingirrigoting on hot windy doys.
7. Considerotion of consent opplicotions for woter obstroctions should hoveporticulor regord to questions of:
o. how well do we understond the noture ond extent of the woterresource;
b. how well con we monitor the omount of woter obstrocted:
c. whether lond copobility (e.9. soil type, vulnerobility of underlyinggroundwoter resources,f motches the lond use enobled by irrigotion;
d. whot might hoppen in the future (e.9. roinfoil ond rechorge ofoquifers, climote chonge).
9. Applicotions for woter obstrodions moy be required to justify thequontities of woter requested. lnformotion moy need to be provided toTe Ao Mdromo lnc. regording the proposed woter use per hectore,
estimoted woter /osses, stocking rotes, ond the level of efficiency for thescheme. This will enoble iwi to put the quontity of woter sought in
context, ond ensure thof o fesf of reosonobleness con be opplied to
consents.
10. Require cotchment bosed cumulotive effects ossessments for octivitiesinvolving the obstroction of woter.
16. Encouroge the instollotion of oppropriote meosuring devices (e.9. wotermeters) on oll existing ond future woter obstroctions, to dccurotelymeosure, report, ond monitor volumes of woter being obstrocted, ondenoble better monogement of woter resources.
17. Advocote for durotions not exceeding 25 yeors on resource consentsreloted to woter obstroctions.
1.
3.
Alliance Group Limited - Mataura Processing PlantAssessment of Environmental Effects 129
a
19. Require thot Ngdi Tohu ore provided with the oppoftunity to porticipote
through pre heoring meetings or other processes ,n the development ofoppropriote consent conditions including monitoring conditions tooddress our concerns.
20. Avoid odverse e,7ec8 on the bose flow of ony woterwoy, ond thus on themouri of thot woterwoy ond on mohingo koi or toongo species.
Particular regard was had to the key directives in these provisions when assessing the
effects of the proposed activities, and in determining how the effects of the activities
should be avoided, remedied or mitigated through the proposed conditions.
ln respect of these provisions, the following is noted:
The proposed take and use of water is a re-consenting of an existlng activity and
there is a high degree of ceftainty about the nature and scale of the resultant effects
on the environment. The effects insofar as these matters are concerned will be
negligible. Therefore, there is no need to apply the precautionary principle here
(Policy 1).
ln accordance with Policy 3, this AEE includes scientifically sound and understandable
information on the proposed activity and its effects (Poliry 2).
Of relevance to Policies 6 and 9 is the PDP audit of existing use of water at the Plant,
which identifled opportunities for further water saving. The proposed conditions
require this to be addressed over the first three years of the new consent term via
implementation of a Resilience and Water Saving Strategy. This means the amount of
water abstracted will be reasonable for the intended use and will be used efficiently.
Of relevance to Policies 7,1O and 20, the cumulative effects of abstraction in the
Mataura River, and effects on the base flow of the River, is managed by the flow
regime set down in the Mataura WCO.
The measuring devices appropriate for the water abstractions were recently deemed
appropriate considering the nature of those activities (Poliry 16).
The preference in Poliry 17 for a consent duration of no more than 25 years is
acknowledged. However, Alliance considers a longer consent duration is required
here to allow the financial investment involved in the proposed wastewater treatment
plant upgrade to be justifled and secured over an appropriate timeframe. lt is also
relevant that a proposed upgrade timeline is structured to be in step with the FMU
process for improving water quality in this catchment, and a long term consent which
includes the long term and certain framework contained in the proposed condition
(and the signiflcant improvements it requires) benefits Alliance and the wider
community due to the certainty of benefit it provides.
Alliance Group Limited - Mataura Processing PlantAssessment of Environmental Effects
a
a
a
a
a
130

a ln accordance with Poliry 19, Alliance has and continues to engage with TAMI and
Hokonui Runanga on the development of appropriate consent conditions for the
discharge, including monitoring.
Alliance Group Limited - Mataura Processing PlantAssessment of Environmental Effects 131
t3.t
13. STATUTORY ASSESSMENT
INTRODUCTION
This section of the AEE sets out the framework under the RMA that applies to the resource
consents that are being sought from Environment Southland. lt addresses:
o Section '104D which specifies that Environment Southland can only grant a non-
complying activity consent in certain circumstances;
o Section 1O4 which specifies the matters Environment Southland must have regard to
when considering an application for resource consent;
o Section 105 which specifies additional matters which must be considered by
Environment Southland when considering the applications for discharge permits; and
o Sedion 107 which specifles that Environment Southland shall not grant a discharge
permit il after reasonable mixing, the contaminant or water discharged (either by itself
or in combination with the same, similar, or other contaminants or water) is likely to
give rise to certain effects in the receiving waters.
13.2 SECTTON lO4D
As outlined in Section 5 of this AEE, the discharge of wastewater is classified as a non-
complying activity under the Operative and Proposed Plans because of its impact on
downstream E coli concentrations.
Section 104D of the RMA establishes restrictions on the ability of a consent authority to
grant resource consents for non-complying activities. lt states:
(1) Desprte ony decision mode for the purpose of notificotion in relotion to
odverse erfecft o consent outhority moy gront o resource consent for onon-complying octivity only if it is sotisfied thot either-
(o) the odverse e,Tects of the octivity on the environment (other thonony effect to which section lo4(3)(o)(ii) opplies) will be minor; or
(b) the opplicotion is for on octivity thot will not be controty to theobjectives ond policies of-
(i) the relevont plon, if there is o plon but no proposed plon inrespect of the octivity; or
(ii) the relevont proposed plon, if there is o proposed plon but norelevont plon in respect of the odivity; or
(iii) both the relevont plon ond the relevont proposed plon, if thereis both o plon ond o proposed plon in respect of the octivity.
The objectives and policies of the relevant statutory planning documents are identified
and assessed in Sections 12.6 and 12.7 of this AEE. As is noted in those sections, the
Alliance Group Limited - Mataura Processing PlantAssessment of Environmental Effects 132
proposed activities will not be contrary to the objectives and policies of the relevant
statutory planning documents. lt is also concluded that in most circumstances the
environmental effects of the proposed activities will be appropriately managed so that
they sit comfortably with the outcomes sought by the objectives and policies in the
relevant statutory planning documents.
As such, the requirements of Section 104D(1Xb) of the RMA are met. The resource consent
applications can, therefore, be considered in the broader conteld in accordance with
Section 104 of the RMA.
ln light of the above, it is not necessary to form an overall conclusion as to whether the
adverse effects of the proposed activities on the environment will be 'more than minor' in
order to satisfy the flrst gateway test of Section 104D(1) of the RMA.
r3.3 SECTTON tO4
Section 104 of the RMA identifies the matters that a consent authority must have regard to,
subject to Part 2 of the Act, when considering an application for resource consent. lt
states:
0 When considering on opplicotion for o resource consent ond onysubm,ssions received, the consent outhority must, subject to Port 2, hoveregord to-
(o) ony octuol ond potentiol e,Tecfs on the environment of ollowing theoctivity; ond
(ob) ony meosure proposed or ogreed to by the opplicont for thepurpose of ensuring positiye e,Tects on the environment to offset orcompensote for ony odverse e,Tects on the environment thot will ormoy result from ollowing the octivity; ond
(b) ony relevont provisions of-
(i) o notionol environmentol stondord:
(ii) other regulotions:
(iii) o notionol policy stotement:
(iv) o New Zeolond coostol policy stotement'
(v) o regionol policy stotement or proposed regionol policy
stoternent'
(vi) o plon or proposed plon; ond
(c) ony other motter the consent outhority considers relevont ondreosonobly necessory to determine the opplicotion.
(2) When forming on opinion for the purposes oFsubsection (1)(o), o consentouthority moy disregord on odverse effec-t of the octivity on theenvironment if o notionol environmentol stondord or the plon permits onoctivity with thot effect.
Alliance Group Limited - Mataura Processing PlantAssessment of Environmental Effects 133
(2A) When considering on opplicotion offected by sectlon 124 or 1652H(1)(c),
the consent outhority must hove regord to the volue of the investment ofthe existing consent holder.
(28) ...
Section 104 of the RMA does not give primacy to any of the matters to which a consent
authority is required to have regard. All of the relevant matters are to be given such weight
as the consent authority deems appropriate in the circumstances, and all matters listed in
section 104(1) are subject to Part 2 of the RMA.
An assessment of the proposed activities against the relevant matters set out in Section
104 of the RMA is provided in the sections below.
13.3.1 The Actua! and Potential Effects of Allowing the Activities
The actual and potential effects of allowing the activities are set out in Sections 6, 7 and 8
of this AEE.
The granting of consents enabling the continued operation of the Plant will maintain the
economic wellbeing of people and communities within the Gore District and the Southland
region by:
o Maintaining significant direct and indirect employment opportunities for local
residents (the Plant employs approximately 5O0 people in the peak of the season);
o Maintaining significant direct and indirect wages and salaries for local residents (the
Plant contributed approximately $22 million in wages and salaries for the 2017/2018
season);
e Maintaining significant levels of dired and indirect expenditure with local businesses;
r Maintaining population and economic activity levels within local communities, thereby
maintaining the breadth and quality level of services available to local residents and
businesses;
o Providing greater employment choice for local residents; and
. Continuing Alliance's contributions to local community activities, in its role as a
responsible employer and "good corporate citizen".
Key points of relevance when considering the water takes are:
e Fish screens will be installed in all intakes which meet or exceed industry practice.
o The water taken for cooling purposes is returned to the water race immediately
downstream of where it is taken.
e The process water take only reduces flow in the Mataura River for 100 m and is not
considered to have any effect that is more than minor.
Alliance Group Limited - Mataura Processing PlantAssessment of Environmental Effects 134
Key points of relevance when considering the discharge of cooling water and wastewater
A comprehensive assessment of the effects of the discharge on the receiving
environment has determined that no adverse effects trigger the need for immediate or
urgent mitigation.
The lower Mataura River contains high levels of E.coli, and the Plant's discharge
signiflcantly increases those levels in the receiving water downstream. However,
because the level of pathogens in the discharge (which are of most concern when
considering effecls on human health) are much lower and more variable, the Plant's
discharge does not cause a significant increase in health risk, and the risk of a person
swimming below the Plant becoming ill due to the Plant's discharge is below 1%, which
is considered an acceptable level. However, Alliance accepts it will need to reduce its
levels of E.colito improve water quality. And this will occur following installation of the
UV treatment plant required by the proposed conditions, which is expected to reduce
the E coli levels in the Plant's wastewater discharge by more than 99%
The Mataura River is degraded in terms of the nitrogen levels present, periphyton
reflecls moderate to high enrichment at times, and MCI and QMCI data are generally
representative of fair to poor health. Toetoes Estuary also continues to degrade with
eltensive macroalgal growth driven by very high nutrient loads from the catchment.
While there is no evidence suggesting the Plant's discharge has a direct adverse
effect on these stressors downstream of the discharge, it does contribute a small
portion to the overall loads of Amm-N and TN present downstream of the discharge.
Alliance has acknowledged it will need to reduce its levels of Amm-N and TN over
time as part of catchment-wide initiatives to improve water quality. And this will occur
following installation of the biological treatment system required by the proposed
conditions, which is expecled to reduce the concentration of TN in the discharge by
approximately 68% relative to present.
13,3.2 Measures Proposed to Offset or Compensate for Any Adverse Effects on the
Environment
No measures are proposed to offset or compensate for any adverse effects on the
environment. All adverse effects are addressed via avoidance, remediation and mitigation.
13.3.3 Relevant Provisions of the Planning Documents
The provisions of the relevant planning documents, and an assessment of how the
proposed activities sit in relation to them is provided in Section 12 of this AEE.
are:
a
a
Alliance Group Limited - Mataura Processing PlantAssessment of Environmental Effects 135
a
Key points of relevance are:
It is evident that implementing the Freshwater NPS is going to require an
improvement in Mataura River water quality for some key contaminants, pafticularly
nutrients and E.coli. The extent of the required improvement, how it will be achieved
and the timeframes for achieving it, will be developed through the upcoming
collaborative planning exercise required by the Freshwater NPS, and which
Environment Southland expects to be completed by 2O25.
Alliance expect its contribution to catchment reductions in these key contaminants to
be more than proportional to the wider reduction achieved in the catchment, and also
comparatively expedient. Noting that experience from similar catchments in other
parts of New Zealand (i.e. catchments with a high proportion of pastoral farming and
nutrient enrichment), suggests any significant reduction in the contribution from
diffuse sources will take some time.
The discharge causes levels of E co/r, Amm-N and TN to increase downstream of the
mixing zone, and in the case of E.coli, to also not meet the relevant water quality
standards in Appendix G of the Operative Plan, or Appendix E of the Proposed Plan.
The Operative Plan directs this type of discharge only be allowed where it is
consistent with Paft 2 of the RMA to do so, which, for reasons set out in Section 13.3.5,
is the case here.
The Proposed Plan requires this application demonstrate how, and by when adverse
effects will be avoided, where practicable, and otherwise remedied or mitigated so
that beyond the zone of reasonable mixing, water quality will be improved to assist
with meeting the relevant standards in Appendix E. The proposed conditions do this
by requiring a three stage upgrade to the wastewater treatment plant which will
significantly reduce the E.coli and faecal coliform concentrations in the discharge. This
will improve the water quality beyond the zone of reasonable mixing and assist with
meeting the Appendix E water quality standards for those parameters.
ln summary, the proposed activities undertaken in accordance with the proposed
conditions are:
Consistent with the requirements of the Freshwater NPS, and the Freshwater NPS
provisions and its obligations on Environment Southland for managing the Mataura
River do not provide a reason why the consents should not be granted as sought.
Broadly consistent with the RPS, and will assist, rather than hinder, Environment
Southland's efforts to implement it, particularly in respect of improving water quality
Not contrary to the objectives and policies of the Operative Plan or Proposed Plan,
and there is nothing in the Operative Plan or Proposed Plan which means the
discharge applications cannot be granted on the terms sought.
a
a
a
a
a
a
a
Alliance Group Limited - Mataura Processing PlantAssessment of Environmental Effects
't36
13.3.4
13.3.5 Part 2
13.3.5.1 Section 5
Value of lnvestment of the Consent Holder
When considering these applications, the consent authority must have regard to the value
of the investment of Alliance which is reliant on the proposed activities.
That investment is considerable. The latest estimate (December 2018) for the Mataura
Plant's insured value is $225 million, and much of this value is sunk - i.e. it could not be
recovered if the plant was forced to downsize, close or be relocated.
The purpose of the RMA (section 5) is to promote the sustainable management of natural
and physical resources. The Act defines "sustainable management" as:
'monoging t e use, development, ond prctection of noturol ond physicol
resources in o woy, or ot o rote, which enobles people ond communities toprovide for their sociol, economic, ond culturol wellbeing ond for their heolth ondsofety while-
(o) Sustoining the potentiol of noturol ond physicol resources (excludingminerols) to meet the reosonobly foreseeoble needs of futuregenerotions; ond
(b) Sofeguording the life-supporting copocity of oir, woter, soil, ondecosystems; ond
(c) Avoiding, remedying, or mitigoting ony odverse e,7ec8 of octivities on theenvironment.'
ln practice, there are two general elements of "sustainable management" in the context ofsection 5 that must be considered when assessing the resource consent application. They
are:
Enabling people and communities to provide for their social, economic and cultural
wellbeing; and
Safeguarding environmental quality and avoiding, remedying or mitigating adverse
effects.
Enabling people and communities to provide for their social, economic and cultural
wellbeing
With respect to the likely implications of granting the consents as sought in terms ofenabling people and communities to provide for their social and economic wellbeing, it is
clear from the economic report in Appendix 6 that the Plant plays an important role in the
local economy, and is also an important part of the local community. The Plant provides
substantial employment, both directly and indirectly, and provides important social context
to the area. The Plant is totally reliant on being able to operate under the consents sought
a
Alliance Group Limited - Mataura Processing PlantAssessment of Environmental Effects 137
in this application, including the ability to take water from the Mataura River, and use it as a
discharge medium. Not granting the resource consents as sought would place the
ongoing operation of the Plant in question.
Safeguarding Life-Supporting Capacity
As set out in Sections 7 and 8, a comprehensive assessment of the effects of the proposed
activities on the receiving environment by FWS/AES has determined that no adverse
effects on the life-supporting capacity of the Mataura River and its ecosystems trigger the
need for immediate or urgent mitigation.
The improvement in discharge quality as a result of the proposed wastewater treatmentplant upgrade will also help contribute to a long-term improvement in the life-supporting
capacity of the river, if that life-supporting capacity is currently being depressed by the
high baseload of nutrients in the catchment.
Requirement of Avoid, Remedy or Mitigate
Section 5(2)(c) of the RMA requires that adverse effects of activities on the environment
are "avoided, remedied or mitigated". lt is not required that all effects be avoided, or that
there is no net effect on the environment, or that all effects are compensated for in some
way. Rather, section 5(2Xc) is about doing what is reasonably necessary, given the
circumstances of the particular case, to lessen the severity of effects. Some flexibility is
necessary when exploring mitigation measures that can be used to reduce the impact ofadverse effects, to ensure that the mitigation itself is sustainable.
The ongoing approach used in relation to avoiding, remedying or mitigating the effects ofthe Plant, set out in Section 9 and summarised in Section 9.4, is consistent with theseprinciples.
13.3.5.2 Sections 6, 7 and 8
Sections 6, 7 and 8 of the RMA set out the principles to be applied in achieving thepurpose of the Act. With respecl to the principles contained in sections 6, 7 and 8 of the
RMA:
. They are subordinate to the overriding purpose of the Act, as set out in section 5.
o Each plays a part in the overall consideration of whether the purpose of the Act has
been achieved in a particular situation.
. They are not an end in themselves, but an accessory to the principal purpose.
With respect to section 5, which contains matters of national importance that shall be
recognised and provided for, other than section 6(e) and section 6(9) that relate to Maori
values and which are addressed below, it is considered only section 6(a), which addresses
the preseruotion of the noturol chorocter of the coostol environment (including the coostol
Alliance Group Limited - Mataura Processing PlantAssessment of Environmental Effeds 138
morine oreo), wetlonds, ond lokes ond rivers ond their morgins, ond the protection of them
from inoppropriote subdivision, use, ond development is expressly relevant.
With respect to section 6(a), the natural character of the Mataura River has been impacted
by many agricultural, industrial, urban and drainage uses. The FWS/AES report has also
concluded that the discharge does not adversely impact on water quality parameters likely
to have an aesthetic impact. The use of the Mataura River by the Plant is not considered
to be inappropriate in this context. lt is also noted that section 6(a) does not extend to the
reinstatement or enhancement of the environment relative to its current state.
Seclion 7 contains other relevant matters to which particular regard must be given.
Several of these are relevant to this application; notably section 7(b), the efficient use of
natural and physical resources; section 7(c), the maintenance and enhancement of amenity
values; section 7(d), intrinsic values of ecosystems; section 7(f), maintenance and
enhancement of the quality of the environment; and section 7(h), the proteclion of the
habitat of trout and salmon.
With respect to section 7(b), the economic assessment has identified a number of reasons
why the continued use of the Plant represents an efficient use of natural and physical
resources. The Plant is existing, and there is significant investment costs in the location
and equipment at the site; the Plant has access to a skilled labour force of sufficient scale
to ensure that it operates effectively; the Plant is appropriately located to receive livestock
that is within the immediate and surrounding area; and the Plant has appropriate
infrastruclure support including access to road and rail networks.
The continued operation of the Plant in accordance with the proposed consent conditions
would maintain amenity values and the quality of the environment, in accordance with
sections 7(c) and 7(f). The intrinsic values of the ecosystems which section 7(d) requires
particular regard be had, were considered by the various technical assessments when
assessing the effects of the proposed activities. Finally, with respect to section 7(h), it is
clear that the water quality within the Mataura River downstream of the Plant is suitable for
trout.
Maori Relationship/Kaitiakitan ga/Treaty Principles
With respect to the sections within Part 2 that relate to tangata whenua, the Mataura River
and adjacent land, including the Mataura Falls in the immediate vicinity of the Plant, has
high cultural significance for tangata whenua.
Alliance recognises and values the role of Hokonui Runanga as tangata whenua and
kaitiaki of the Mataura River and has and continues to engage with Te Ao Marama and
Hokonui Runanga in respect of the applications, and how the effects of the activity could
be avoided, remedied or mitigated.
Alliance Group Limited - Mataura Processing PlantAssessment of Environmental Effects 139
The views expressed thus far have fed into Alliance's work assessing the effects of theproposed activities and in determining how the effects of the activities should be managed
through the proposed conditions, including its consideration of alternative discharge
methods. As have the key directives in Te Tangi a Tauira - the relevant iwi management
plan.
It is intended that through this ongoing engagement process, appropriate mechanisms will
be identified which provide for seclions 6(e), 7(a) and 8 matters in relation to the ongoing
operation of the Plant.
13.3.5.3 Summary
After considering all the relevant matters under Part 2 and section 104, granting the
resource consents with appropriate conditions would promote the purpose of the Act and
would constitute sustainable management of natural and physical resources for the
following reasons:
a It allows the use of natural and physical resources in a way which enable people and
the community to provide for their social, cultural and economic wellbeing; and
It safeguards the life-supporting capacity of air, water and soil, and ensures that
adverse effects are appropriately avoided, remedied or mitigated.
a
13.4 SECTTON tos
Section 105 of the RMA sets out additional matters which must be considered by a consent
authority when considering an application for a discharge permit. Section 'lo5('l) of the RMA
states:
"lf on opplicotion is for o dischorge permit or coostol permit to do something thotwould controvene section 15 or section 158, the consent outhority must inoddition to the motters in section 104(1), hove regord to-(o) the noture of the dischorge ond the sensitivity of the receiving
environment to odverse effects; ond
(b) the opplicont's reosons for the proposed choice; ond
(c) ony possible olternotive methods of dischorge, including dischorge intoony other receiving environment.
These matters are addressed in detail in Section 10, which outlines why the proposed
discharge method represents the best practicable option.
r3.5 SECTTON rO7
Sections 107(1)(a) and (b) of the RMA specifo that the consent authority shall not grant a
discharge permit allowing the discharge of water / contaminant into water or land if, after
reasonable mixing, the contaminant or water discharged (either by itself or in combination
Alliance Group Limited - Mataura Processing PlantAssessment of Environmental Effects 140
with the same, similar, or other contaminants or water), is likely to give rise to all or any of
the following effects in the receiving waters:
o The produclion of any conspicuous oil or grease fllms, scums or foams, or floatable or
suspended materials;
. Any conspicuous change in the colour or visual clarity;
. Any emission of objectionable odour;
o The rendering of fresh water unsuitable for consumption by farm animals; and
. Any significant adverse effects on aquatic life.
As is outlined in Section 8, neither the discharge of wastewater nor cooling water gives
rise to any of these effects in the receiving waters.
Alliance Group Limited - Mataura Processing PlantAssessment of Environmental Effects 141
14 CONCLUDING STATEMENT
This AEE is in support of applications to 're-consent' the following existing activities such
that the Plant can continue to operate and contribute in a major way to the social and
economic wellbeing of the surrounding community:
o The take and use of water for cooling and processing purposes;
o The discharge of cooling water; and
o The discharge of wastewater.
The proposed conditions require a substantial staged upgrade of the Plant's wastewater
treatment plant to improve the quality of the Plant's discharge to the Mataura River, and a
reduclion in water use. These will be significant capital investments and will add significant
annual costs to the wastewater plant's operation.
Alliance is seeking a 35 year consent term for all replacement consents being sought. A
35 year consent term suitably recognises the existing asset value of the Plant and the
significant economic contribution it provides to the Southland Region. The significant
capital investment involved in the proposed wastewater treatment plant upgrade will also
require, and be contingent on, securing a long consent term in order to enable the
upgrades to be progressively implemented, and allow the flnancial investment to be
justified and secured over an appropriate timeframe.
An assessment of the potential effects of the proposal on the environment is provided in
Sections 6 to 8 of this AEE, as well as the various technical assessments commissioned by
Alliance. By way of summary, it is considered that the project can be undertaken in a
manner that appropriately avoids, remedies or mitigates adverse effects on the
environment.
With respect to the statutory planning framework that applies to the applications, it is
concluded that the development of the project in the manner proposed by Alliance will for
the most part align comfortably with the overall management intentions specified in the
relevant national and regional planning documents. The proposed activities will not be
contrary, or repugnant, to any of the relevant statutory planning documents.
Finally, it is noted that Alliance has consulted with interested / potentially affected parties
with respect to these applications. This consultation has informed the various
environmental assessments and will continue throughout the resource consent process
and during the subsequent operation of the Plant.
Alliance Group Limited - Mataura Processing PlantAssessment of Environmental Effects '142

L
-T
APPENDIX {
Proposed consent conditions
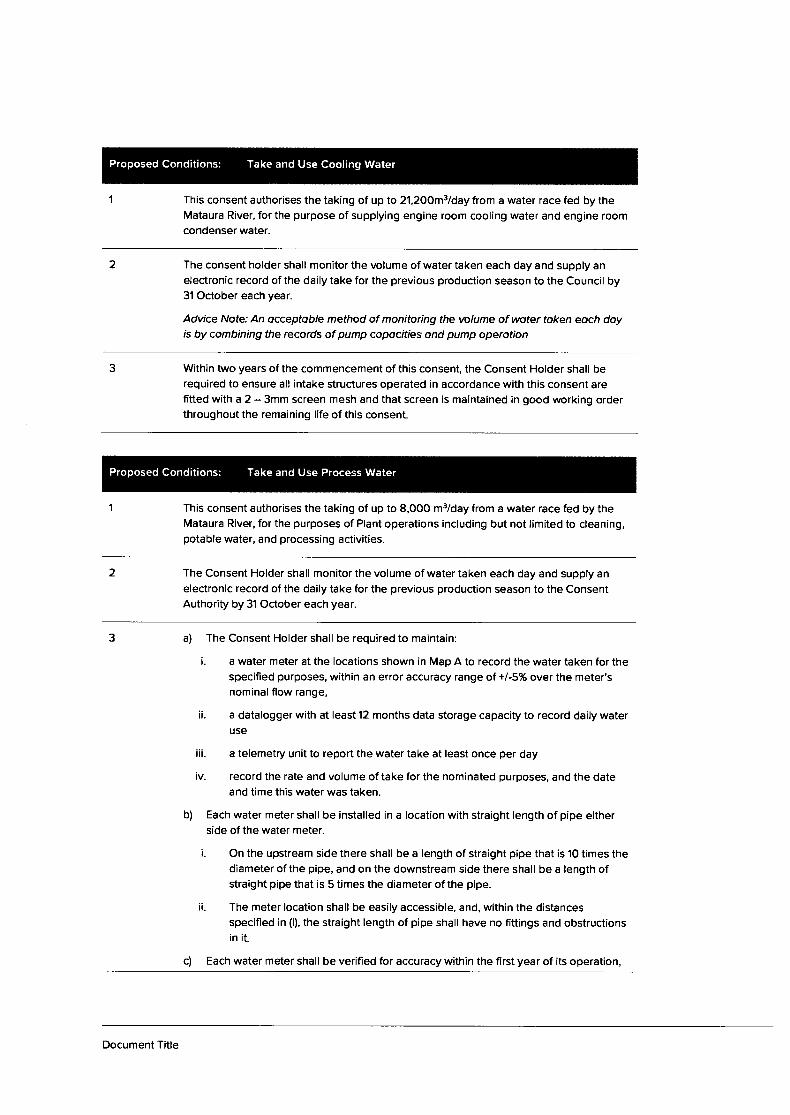
Proposed Conditions: Take and Use Cooling Water
This consent authorises the taking of up to 21,2OOm3lday from a water race fed by theMataura River, for the purpose of supplying engine room cooling water and engine roomcondenser water.
2 The consent holder shall monitor the volume of water taken each day and supply an
electronic record of the daily take for the previous production season to the Council by31 October each year.
Advice Note: An occeptoble method of monitoring the volume of woter token eoch doyis by combining the records of pump copocities ond pump operotion
3 Within two years of the commencement of this consent, the Consent Holder shall berequired to ensure all intake structures operated in accordance with this consent arefitted with a 2 - 3mm screen mesh and that screen is maintained in good working orderthroughout the remaining life of this consent.
Proposed Conditions: Take and Use Process Water
This consent authorises the taking of up to 8,OOO m3/day from a water race fed by theMataura River, for the purposes of Plant operations including but not limited to cleaning,potable water, and processing activities.
2 The Consent Holder shall monitor the volume of water taken each day and supply an
electronic record of the daily take for the previous production season to the ConsentAuthority by 31 October each year.
3 a) The Consent Holder shall be required to maintain:
i. a water meter at the locations shown in Map A to record the water taken for thespecified purposes, within an error accuracy range of +/-5% over the meter'snominal flow range,
ii. a datalogger with at least 12 months data storage capacity to record daily wateruse
a telemetry unit to report the water take at least once per day
record the rate and volume of take for the nominated purposes, and the dateand time this water was taken.
b) Each water meter shall be installed in a location with straight length of pipe eitherside of the water meter.
On the upstream side there shall be a length of straight pipe that is 10 times thediameter of the pipe, and on the downstream side there shall be a length ofstraight pipe that is 5 times the diameter of the pipe.
The meter location shall be easily accessible, and, within the distancesspecified in (i), the straight length of pipe shall have no fittings and obstructionsin it.
1il.
iv.
il
Document Title
c) Each water meter shall be verified for accuracy within the first year of its operation,
and thereafter once every five years.
Each verification shall be undertaken by a Consent Authority approvedoperator.
il. A Water Measuring Device Verification Form shall be completed and suppliedto the Consent Authority with receipts of service within five working days of theverification.
d) The Consent Holder shall ensure the full operation of the water meter anddatalogger at all times during the exercise of this consent. All malfunctions of thewater meter and/or datalogger during the exercise of this consent shall be reportedto the Consent Authority within five working days of observation and appropriaterepairs shall be performed within five working days. Once the malfunction has beenremedied, a Water Measuring Device Verification Form completed withphotographic evidence must be submitted to the Consent Authority within fiveworking days of the completion of repairs.
The Consent Holder shall record adequate data to demonstrate compliance with thiscondition. Data from the datalogger shall be provided once daily to the ConsentAuthority by means of telemetry. The Consent Holder shall ensure data is compatiblewith the Consent Authority's time-series database.
t.
3 The Consent Holder shall comply with the low flow contingenry plan included as
Attachment 1 to this consent.
Advice note: The low flow contingency plon describes the procticoble meosures to betoken by the Consent Holder to minimise the obstrodion of woter during times when theflow of the Motouro River ot the Tuturou recording site,s /ess thon 20 cubic metres persecond.
4 Within two years of the commencement of this consent, the Consent Holder shall berequired to ensure all intake structures operated in accordance with this consent arefitted with a 2 - 3mm screen mesh and that screen is maintained in good working orderthroughout the remaining life of this consent.
Proposed Conditions: Discharge of Wastewater to the Mataura River
Discharge Volume
This resource consent authorises the discharge of up to 8,000m3/day of treatedwastewater from a meat processing plant into the Mataura River at the location
specified above.
Pre Upgrade Discharge Limits
Document Title
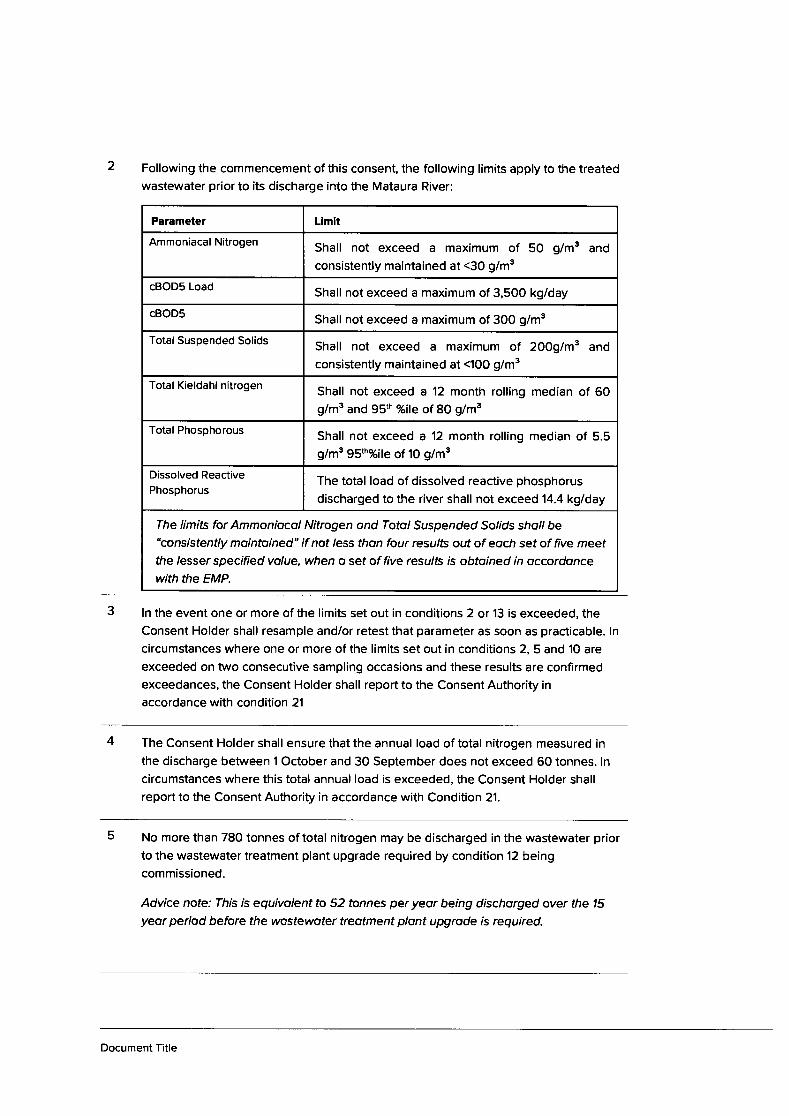
2 Following the commencement of this consent, the following limits apply to the treatedwastewater prior to its discharge into the Mataura River:
Parameter Limit
Ammoniacal Nitrogen Shall not exceed a maximum of 50 g/m3 andconsistently maintained at <30 g/m3
cBOD5 Load Shall not exceed a maximum of 3,500 kglday
cBOD5 Shall not exceed a maximum of 300 g/m3
Total Suspended Solids Shall not exceed a maximum of 2OOg/m3 andconsistently maintained at <100 g/m3
Total Kieldahl nitrogen Shall not exceed a 12 month rolling median of 60g/m3 and 95th %ile of 80 g/m3
Total Phosphorous Shall not exceed a 12 month rolling median of 5.5g/m3 9sth%ile of 1O g/m3
Dissolved ReactivePhosphorus
The total load of dissolved reactive phosphorus
discharged to the river shall not exceed 14.4 kglday
The limits for Ammoniocol Nitrogen ond Totol Suspended Solids sholl be"consistently mointoined" if not less thon four results out of eoch set of five meetfhe /esser specified volue, when a set of five resu/ts is obtoined in occordancewith the EMP.
3 ln the event one or more of the limits set out in conditions 2 or 13 is exceeded, theConsent Holder shall resample and/or retest that parameter as soon as practicable. lncircumstances where one or more of the limits set out in conditions 2, 5 and 10 are
exceeded on two consecutive sampling occasions and these results are confirmedexceedances, the Consent Holder shall report to the Consent Authority in
accordance with condition 21
4 The Consent Holder shall ensure that the annual load of total nitrogen measured in
the discharge between 1 October and 3O September does not exceed 60 tonnes. lncircumstances where this total annual load is exceeded, the Consent Holder shall
report to the Consent Authority in accordance with Condition 21.
5 No more than 78O tonnes of total nitrogen may be discharged in the wastewater priorto the wastewater treatment plant upgrade required by condition 12 beingcommissioned.
Advice note: This is equivalent to 52 tonnes per yeor being dischorged over the 15
yeor period before the wostewoter treotment plont upgrade is required.
Document Title
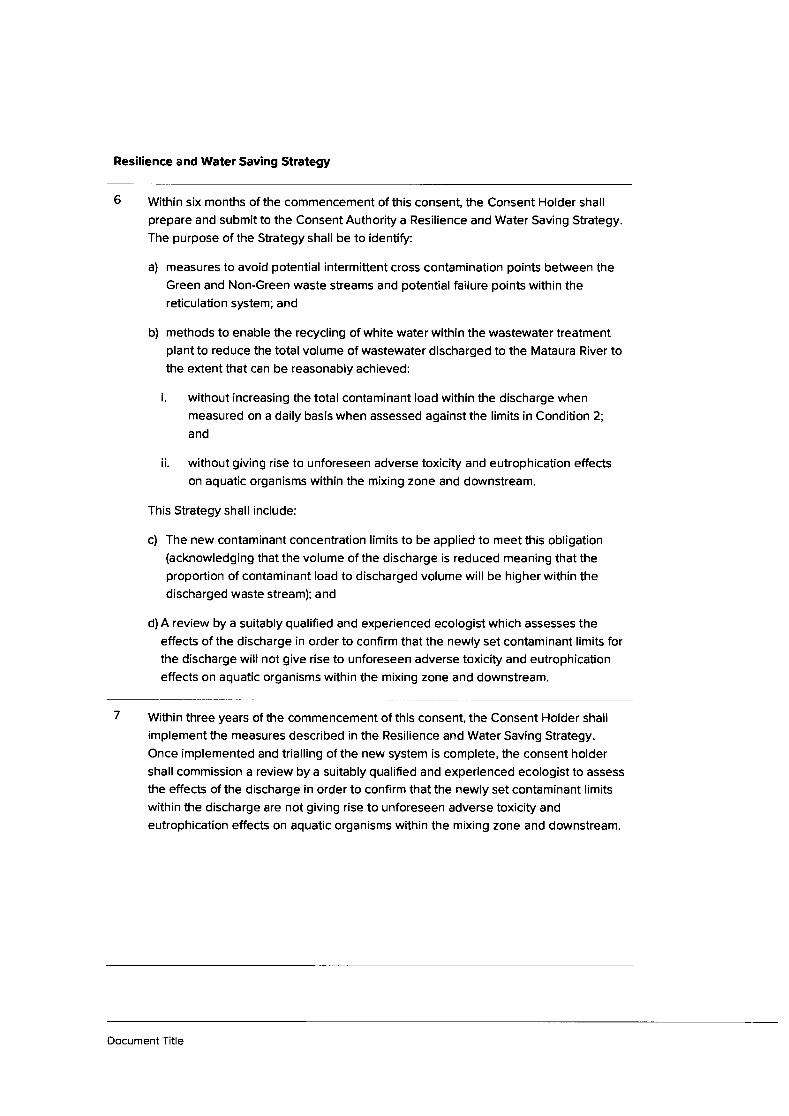
Resilience and Water Saving Strategy
6 Within six months of the commencement of this consent, the Consent Holder shall
prepare and submit to the Consent Authority a Resilience and Water Saving Strategy
The purpose of the Strategy shall be to identiry:
a) measures to avoid potential intermittent cross contamination points between theGreen and Non-Green waste streams and potential failure points within thereticulation system; and
b) methods to enable the recycling of white water within the wastewater treatmentplant to reduce the total volume of wastewater discharged to the Mataura River tothe extent that can be reasonably achieved:
without increasing the total contaminant load within the discharge whenmeasured on a daily basis when assessed against the limits in Condition 2;
and
il without giving rise to unforeseen adverse toxicity and eutrophication effeclson aquatic organisms within the mixing zone and downstream.
This Strategy shall include:
c) The new contaminant concentration limits to be applied to meet this obligation(acknowledging that the volume of the discharge is reduced meaning that theproportion of contaminant load to discharged volume will be higher within thedischarged waste stream); and
d) A review by a suitably qualified and experienced ecologist which assesses theeffects of the discharge in order to confirm that the newly set contaminant limits forthe discharge will not give rise to unforeseen adverse toxicity and eutrophicationeffects on aquatic organisms within the mixing zone and downstream.
7 Within three years of the commencement of this consent, the Consent Holder shall
implement the measures described in the Resilience and Water Saving Strategy.
Once implemented and trialling of the new system is complete, the consent holdershall commission a review by a suitably qualified and experienced ecologist to assessthe effects of the discharge in order to confirm that the newly set contaminant limits
within the discharge are not giving rise to unforeseen adverse toxicity and
eutrophication effects on aquatic organisms within the mixing zone and downstream.
Document Title
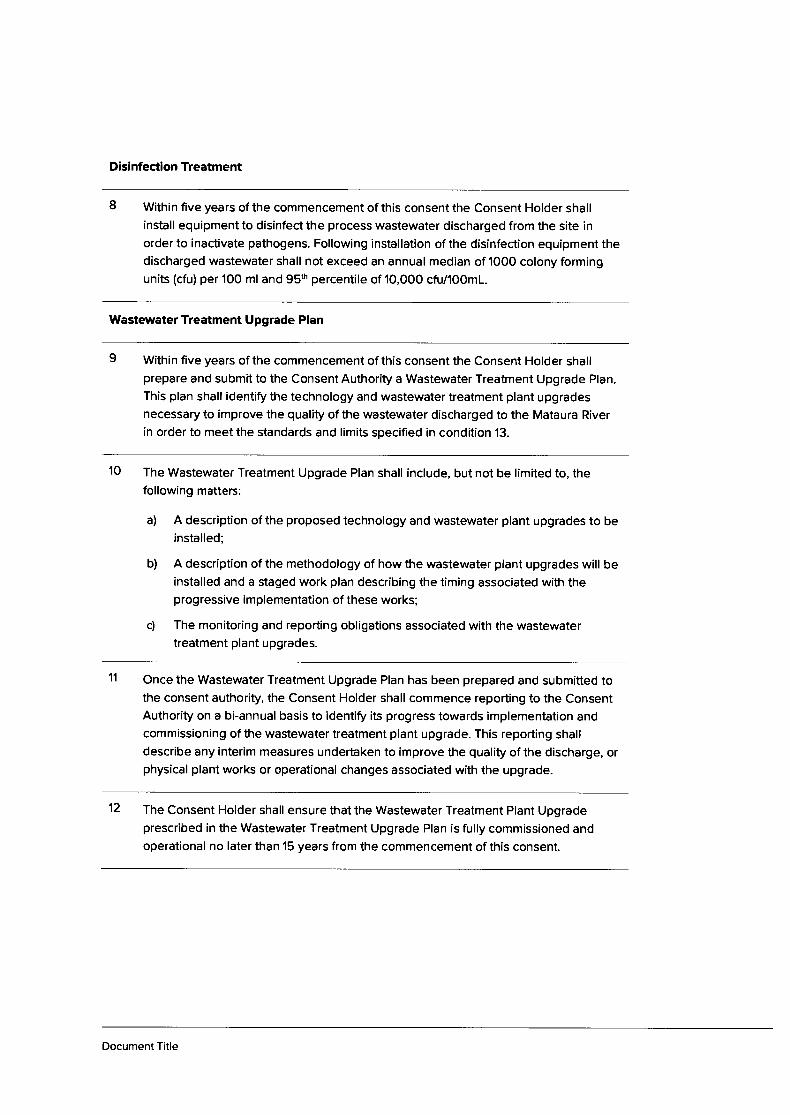
Disinfection Treatment
8 Within five years of the commencement of this consent the Consent Holder shallinstall equipment to disinfecl the process wastewater discharged from the site inorder to inactivate pathogens. Following installation of the disinfection equipment thedischarged wastewater shall not exceed an annual median of 1000 colony formingunits (cfu) per 100 ml and 95th percentile of 10,000 cfu/100m1.
Wastewater Treatment Upgrade Plan
9 Within five years of the commencement of this consent the Consent Holder shallprepare and submit to the Consent Authority a Wastewater Treatment Upgrade Plan.
This plan shall identifiT the technology and wastewater treatment plant upgradesnecessary to improve the quality of the wastewater discharged to the Mataura River
in order to meet the standards and limits specified in condition 13.
10 The Wastewater Treatment Upgrade Plan shall include, but not be limited to, thefollowing matters:
a) A description of the proposed technology and wastewater plant upgrades to beinstalled;
b) A description of the methodology of how the wastewater plant upgrades will beinstalled and a staged work plan describing the timing associated with theprogressive implementation of these works;
c) The monitoring and reporting obligations associated with the wastewatertreatment plant upgrades.
1',! Once the Wastewater Treatment Upgrade Plan has been prepared and submitted tothe consent authority, the Consent Holder shall commence reporting to the ConsentAuthority on a bi-annual basis to identiff its progress towards implementation andcommissioning of the wastewater treatment plant upgrade. This reporting shalldescribe any interim measures undertaken to improve the quality of the discharge, orphysical plant works or operational changes associated with the upgrade.
12 The Consent Holder shall ensure that the Wastewater Treatment Plant Upgradeprescribed in the Wastewater Treatment Upgrade Plan is fully commissioned andoperational no later than 15 years from the commencement of this consent.
Document Title
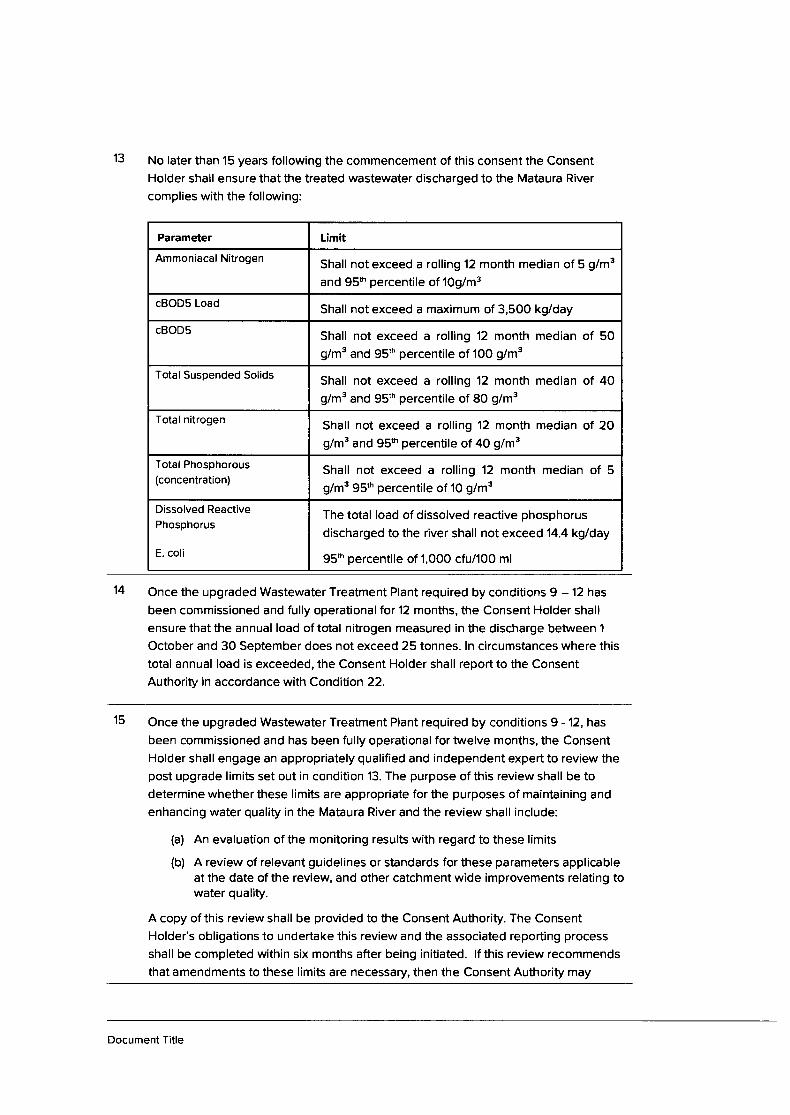
13 No later than 15 years following the commencement of this consent the ConsentHolder shall ensure that the treated wastewater discharged to the Mataura River
complies with the following:
Parameter Limit
Ammoniacal Nitrogen Shall not exceed a rolling 12 month median of 5 g/m3
and 95th percentile of 1og/m3
cBODS Load Shall not exceed a maximum of 3,500 kg/day
cBOD5 Shall not exceed a rolling 12 month median of 50g/m3 and 95s percentile of 100 g/m3
Total Suspended Solids Shall not exceed a rolling 12 month median of 4O
g/m3 and 95s percentile of 8O g/m3
Total nitrogen Shall not exceed a rolling 12 month median of 20g/m3 and 95th percentile of 40 g/m3
Total Phosphorous(concentration)
Shall not exceed a rolling 12 month median of 5g/m3 95th percentile of 10 g/m3
Dissolved ReactivePhosphorus
E. coli
The total load of dissolved reactive phosphorus
discharged to the river shall not exceed 14.4 kglday
95th percentile of '1,00O cfu/100 ml
14 Once the upgraded Wastewater Treatment Plant required by conditions 9 - 12 has
been commissioned and fully operational for 12 months, the Consent Holder shall
ensure that the annual load of total nitrogen measured in the discharge between 1
October and 30 September does not exceed 25 tonnes. ln circumstances where thistotal annual load is exceeded, the Consent Holder shall report to the ConsentAuthority in accordance with Condilion 22.
15 Once the upgraded Wastewater Treatment Plant required by conditions 9 - 12, has
been commissioned and has been fully operational for twelve months, the Consent
Holder shall engage an appropriately qualified and independent expert to review thepost upgrade limits set out in condition 13. The purpose of this review shall be todetermine whether these limits are appropriate for the purposes of maintaining and
enhancing water quality in the Mataura River and the review shall include:
(a) An evaluation of the monitoring results with regard to these limits
(b) A review of relevant guidelines or standards for these parameters applicableat the date of the review, and other catchment wide improvements relating towater quality.
A copy of this review shall be provided to the Consent Authority. The Consent
Holder's obligations to undeftake this review and the associated reporting process
shall be completed within six months after being initiated. lf this review recommends
that amendments to these limits are necessary, then the Consent Authority may
Document Title
initiate a formal review of the post upgrade limits for these parameters.
lnstream Limits
16 The discharge shall not directly result in any of the following below the zone ofreasonable mixing:
a. A change in the natural water temperature by more than 3 degrees Celsius:
b. The acidity or alkalinity of the waters as measured by the pH to not be within therange of 6.0 or 9.0:
c. The waters being tainted so as to make them unpalatable following treatment, normust they contain toxic substances to the extent that they are unsafe forconsumption by humans or farm animals, nor must they emit objectionableodours:
d. The destruction of natural aquatic life by reason of a concentration of toxicsubstances:
e. A conspicuous change in the natural colour and clarity of the waters
f. The oxygen content in solution in the waters being reduced below 5 milligramsper litre.
For the purposes of this condition the mixing zone shall extend 250 metres
downstream of the outfall
Environmental Monitoring Plan
't7 No later than six months from this consent commencing the Consent Holder shallprepare and submit to the Consent Authority an Environmental Monitoring Plan (EMP)
for certification.
The purpose the EMP shall be to describe the methods for monitoring the physical
characteristics and water quality parameters of the discharge, and the physical, waterquality and biological characteristics and parameters of the Mataura River receiving
waters as prescribed by this consent.
The objectives of the EMP are to:
a. Confirm compliance with consent limits on discharge quality;
b. Understand the effects of the discharge on Mataura River water quality and
instream ecology and confirm no unexpected effects are arising as a result of theexercise of this consent
The EMP shall include but not be limited to
Document Title
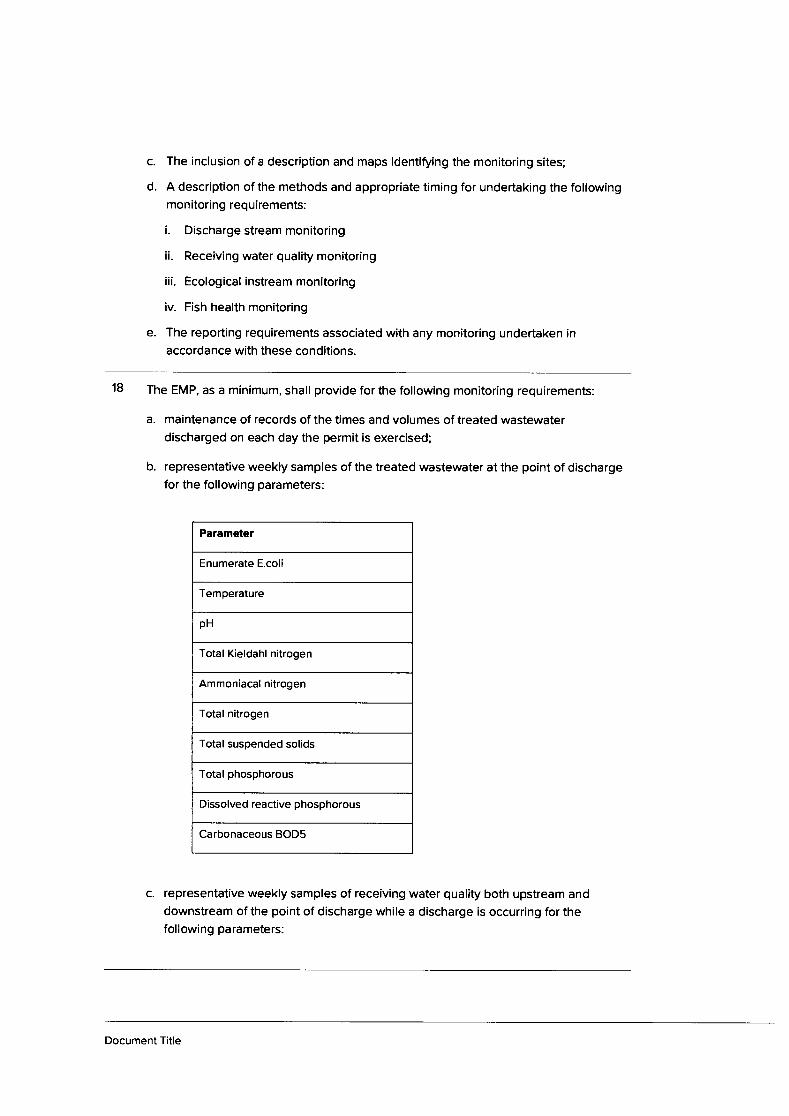
c. The inclusion of a description and maps identifuing the monitoring sites;
d. A description of the methods and appropriate timing for undertaking the followingmonitoring requirements:
i. Discharge stream monitoring
ii. Receiving water quality monitoring
iii. Ecological instream monitoring
iv. Fish health monitoring
e. The reporting requirements associated with any monitoring undertaken in
accordance with these conditions.
18 The EMP, as a minimum, shall provide for the following monitoring requirements:
a. maintenance of records of the times and volumes of treated wastewaterdischarged on each day the permit is exercised;
b. representative weekly samples of the treated wastewater at the point of dischargefor the following parameters:
Parameter
Enumerate E.coli
Temperature
pH
Total Kieldahl nitrogen
Ammoniacal nitrogen
Total nitrogen
Total suspended solids
Total phosphorous
Dissolved reactive phosphorous
Carbonaceous BODS
c. representative weekly samples of receiving water quality both upstream anddownstream of the point of discharge while a discharge is occurring for thefollowing parameters:
Document Title
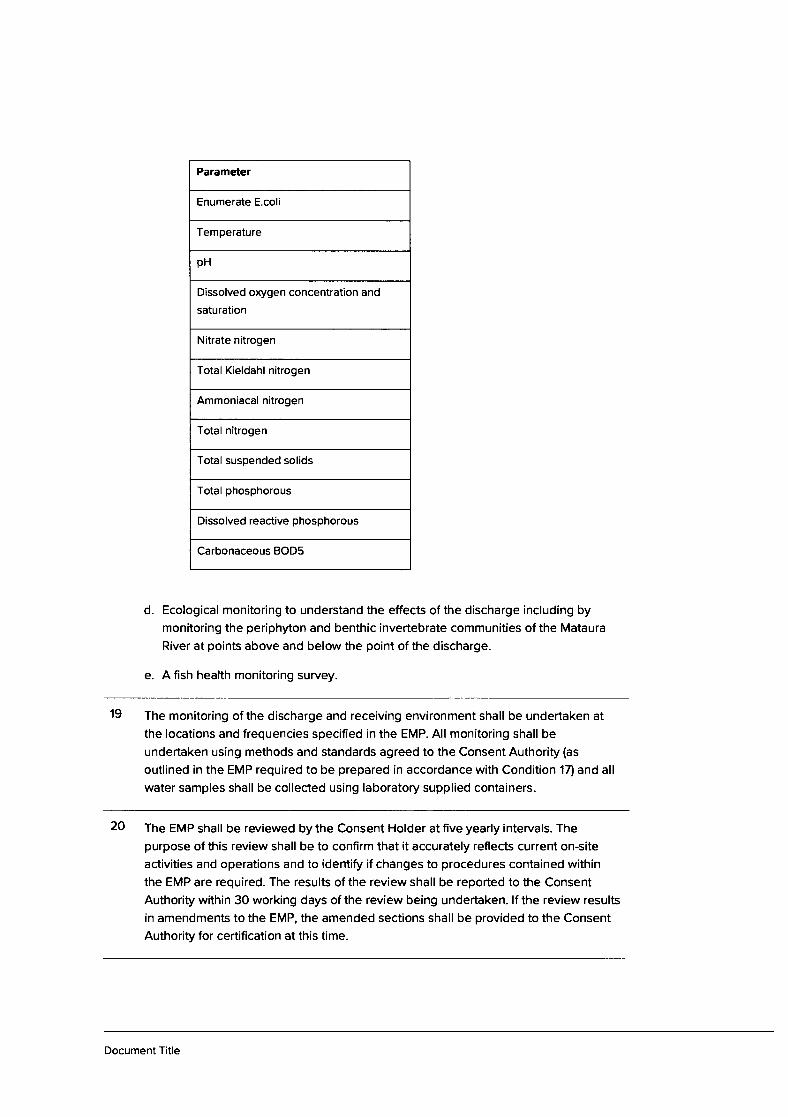
Parameter
Enumerate E.coli
Temperature
pH
Dissolved orygen concentration and
saturation
Nitrate nitrogen
Total Kieldahl nitrogen
Ammoniacal nitrogen
Total nitrogen
Total suspended solids
Total phosphorous
Dissolved reactive phosphorous
Carbonaceous BOD5
d. Ecological monitoring to understand the effects of the discharge including bymonitoring the periphyton and benthic invertebrate communities of the Mataura
River at points above and below the point of the discharge.
e. A fish health monitoring survey
19 The monitoring of the discharge and receiving environment shall be undertaken at
the locations and frequencies specified in the EMP. All monitoring shall be
undertaken using methods and standards agreed to the Consent Authority (as
outlined in the EMP required to be prepared in accordance with Condition 17) and all
water samples shall be collected using laboratory supplied containers.
20 The EMP shall be reviewed by the Consent Holder at five yearly intervals. Thepurpose of this review shall be to confirm that it accurately reflects current on-site
activities and operations and to identif,/ if changes to procedures contained within
the EMP are required. The results of the review shall be reported to the Consent
Authority within 30 working days of the review being undertaken. lf the review results
in amendments to the EMP, the amended sections shall be provided to the Consent
Authority for certification at this time.
Document Title
Reporting
21 The results of the sample analysis for each five week period shall be provided to theConsent Authority within two weeks of the receiving the all of the laboratory resultsfor that period, unless otherwise agreed with the Consent Authority.
22 When any condition of this consent requires notification of an exceedance under thiscondition, the Consent Authority shall be notified within 24 hours of the confirmationof any exceedance of a limit prescribed by the conditions of this consent. Thisnotification shall include advice of any corrective actions taken by the ConsentHolder. An incident report shall be provided to the Consent Authority within twentyworking days of the notification of the exceedance. This report shall include:
(a) ldentification of the likely cause of the limit exceedance;
(b) The resulting effects on the receiving environment likely to arise because of thelimit exceedance;
(c) The management responses undertaken or which may be necessary to preventany further limit exceedances occurring;
(d) Remedial action undertaken or which may be necessary.
23 On an annual basis the Consent Holder shall prepare and submit an AnnualMonitoring Report to the Consent Authority. The report shall cover the 'l October to30 September period and shall be provided to the Consent Authority by 30November each year. The annual report shall include, but not be limited to thefollowing information:
(a) presentation and summary of all wastewater and receiving water monitoringresults and biological monitoring as required by this consent, including anyrecommendations for improved monitorin g
(b) the identiflcation of any recorded non-compliances with consent standards andthe measures taken to ensure compliance is achieved.
(c) assessment of the effects of the discharge on river water quality and periphytonand benthic invertebrate communities.
Technica! Working Party
24 The Consent Holder shall facilitate the continuation of the Mataura WastewaterTechnical Working Party (TWP) and shall distribute the annual monitoring reportdescribed in condition 23 to the members of the working party. The purpose of theTWP shall be to receive reports, review results and initiate meetings as required.
Document Title
25 The TWP shall comprise representatives from:
a) The Consent Holder
b) The Southland Fish and Game Council
c) The Department of Conservation
d) Te Ao Marama lncorporated
e) Hokonui Runanga
f) Public Health South
S) Gore District Council
h) Consent Authority
The Consent Holder shall be responsible for convening meetings, the provision of a
venue for meetings and providing any necessary administrative support to the TWP.
Should any of the external parties referred to in this condition chose not to continue
to be part of the TWP then the Consent Holder shall not be deemed to be in breach
of these conditions.
Review
26 ln accordance with seclion 127 of the Resource Management Act 199'1, the Consent
Holder may, within two years of the commissioning of the Wastewater TreatmentPlant Upgrade undertaken pursuant to condition 12 apply to change or cancel theconditions of this consent to reflect the measured performance and ongoingmonitoring and reporting obligations associated with the Wastewater Treatment Plant
Upgrade.
27 The Consent Authority may, within three months of receiving a report required bycondition 22 of this consent, serve notice on the Consent Holder under section 128 ofthe Resource Management Act 1991 of its intention to review the conditions of thisconsent. The purpose of such a review is to assess the significance of any
exceedance of the discharge limits set out in conditions 2, 4,5,13 or'14 and/or to
determine whether the limits should be altered with particular regard had to thereporting undertaken in accordance with conditions 22 or 23, or whether theexceedance has resulted in significant adverse effects needing urgent redress.
28 The Consent Authority may, within three months of receiving the report required byCondition 23 of this consent, serve notice on the Consent Holder under section 128
of the Resource Management Act 1991 of its intention to review the conditions of thisconsent. The purpose of this review shall be to address any issues identified in theannual reporting.
Document Title
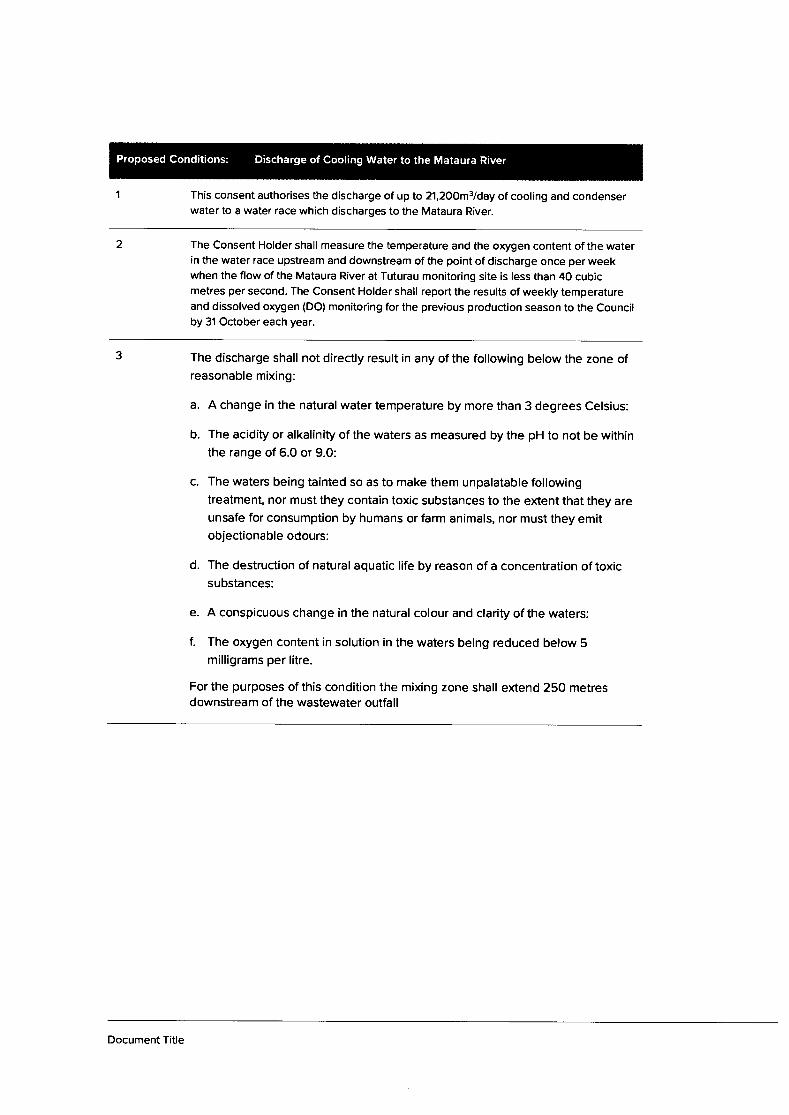
Proposed Conditions: Discharge of Cooling Water to the Mataura River
This consent authorises the discharge of up to 21,2OOm3lday of cooling and condenserwater to a water race which discharges to the Mataura River.
2 The Consent Holder shall measure the temperature and the orygen content of the waterin the water race upstream and downstream of the point of discharge once per weekwhen the flow of the Mataura River at Tuturau monitoring site is less than 40 cubicmetres per second. The Consent Holder shall report the results of weekly temperatureand dissolved orygen (DO) monitoring for the previous production season to the Councilby 31 October each year.
3 The discharge shall not directly result in any of the following below the zone ofreasonable mixing:
a. A change in the natural water temperature by more than 3 degrees Celsius:
b. The acidity or alkalinity of the waters as measured by the pH to not be withinthe range of 6.0 or 9.0:
c. The waters being tainted so as to make them unpalatable followingtreatment, nor must they contain toxic substances to the eltent that they areunsafe for consumption by humans or farm animals, nor must they emitobjectionable odours:
d. The destruction of natural aquatic life by reason of a concentration of toxicsubstances:
e. A conspicuous change in the natural colour and clarity of the waters:
f. The orygen content in solution in the waters being reduced below 5milligrams per litre.
For the purposes of this condition the mixing zone shall elilend 250 metresdownstream of the wastewater outfall
Document Title

L
-l
APPENDIX 2
Assessment of the Effects of AllianceMataura's Discharges and Water Takeon Mataura River and ToetoesEstuary,
Freshwater Solutions and AquaticEnvironmenta I Sciences, 2019.
May 201 9Alliance Mataura AEE fresh
ENT OF EFFECTS
Quality AssuranceThis report has been prepared and reviewed by the following:
Prepared by: Richard Montgomerie
Freshwater Ecologist and Director
Nick Carter
Freshwater Ecologist
Mike Fitspatdck
Environmental Scientist
Reviewed by: Mark James
Aquatic ecologist
Status: Fina! lssued: 16 May 2019
i!.eshwater solutrons
tauranga office117 Willow st tauranga 3141.po box 13507p'. 07 577L70O f:07 5771102
auckiand officelevel 1,/burlding 8, 566 great soulh road, ellerslrepo box 109640, Newmarket, AuckianO 1-149p: 09 5224492
www-f resh watersolutrons.co.nz
,'4
May 2019Alliarce Mataura AEE ftesh*'t,,,',,-."&ler
OF EFFECTS
Executive Summary
The Alliance Mataura Plant (the Plant) is located on the Mataura River at the Matauratownship approximately 44 km upstream of the Toetoes Estuary. Alliance Group Limited(Alliance) is seeking to lodge applications for the renewal of treated wastewater discharge,cooling water discharge and water take resource consents for the Plant. This reportassesses the effects of the cunent and ongoing discharges and take.
The Wastewater Characteristics
The processing season typically starts in October and ends in September with a short 'offseason' between late September and mid-late October. Removal of sheep and lambprocessing in September 2012 resulted in a significant reduction in water use and potentialcontaminant loads in the treated wastewater. Micoplasma bovis increased the number ofcattle being processed in the 2017-2018 season and cunent season (Doyle Richardsonpers. comm.) contributing to an increase in the totalvolume and total load, total suspendedsolids, biological oxygen demand, total kjeldahl nitrogen and total phosphorus loads andtotal phosphorus and dissolved reactive phosphorus concentrations in the current seasoncompared previous seasons. Changes to wastewater solids processing may have alsocontributed to changes.
OverallAlliance achieved a very high (near 100%) compliance with its treated wastewaterdischarge consent limits. One or two BOD non compliances were recorded each year andthe ammoniacal-nitrogen limit of 'consistently maintain' < 30 g/m3 was not met in one five-week period between February 2015 and March 2015.
Results reported by Dada (2019a) showed a very high concentration of E.coli, up to 107CFU/100mL in the discharge, but that the levels of the representative pathogens which areknown to cause illness were very much lower and more variable.
River Water Quality Effects
The mixing zone has been estimated as approximately 100 m from the discharge. Theexisting consent conditions set the mixing zone at Mataura Bridge (330 m downstream),where full mixing is highly likely to have occuned.
There is no apparent effect of the discharge on river temperature or dissolved orygen at theMataura Bridge Site. River water temperature both upstream and downstream of thedischarge exceeded the upper lethal temperature limit for the mayfly Deleatidium sp.(< 23'C) over a period of days in January 2018. The continuous January-March 2019 riverwater temperature record in the hydro-race was not available at the time of preparing thisreport. The upstream temperature close to Site U2 reached 21.8 "C on 6 March 2019 andwas close to the upper lethal temperature limit for Deleatidium sp.
Continuous dissolved oxygen results 13 km downstream of the discharge Chalmers Roadbetween 2013 and 2017 indicated the attribute state was B or greater. Continuousdissolved oxygen results 1 .2 km upstream and 13 km downstream of the discharge atChalmers Road in January 2018 indicated the National Policy Statement - FreshwaterManagement aftribute state was B and B upstream and downstream for the 7-day minimumand 1-day minimum respectively. Continuous dissolved o{ygen results in February andMarch 2019 indicated the attribute state was B and B upstream and A and A downstream.
The discharge does not adversely affect pH, turbidity, total suspended solids, colour, clarityor the generation of foams or scums.
ftesh-avaler
dt.rrd.rr.Mr
May 2019Alliance Mataura AEE fresh 'r ',
_dy'arcr
ESSMENT OF EFFECTS
Biological orygen demand concentrations were below the guideline of <2 g/m3 for avoidingnuisance heterotrophic growths and hence, effects on aquatic biota, or the formation ofheterotrophic growths, immediately downstream of the discharge due to biological oxygendemand are not anticipated. Regular visual observations during summer low flowconditions by Alliance staff between 2013 and 2018 have not recorded sewage fungus. Asmall amount of sewage fungus was observed at Site Dl, with the aid of an undenryaterviewer, during the March 2019 periphyton and benthic invertebrate survey but was notassessed as conspicuous
The change from ammoniacal nitrogen National Policy Statement - Freshwater attributestate A, upstream, to B, downstream, is a change from a 99% species protection level to a95% species protection level, i.e., 5o/o of the most ammoniacal nitrogen sensitive speciesmay be occasionally affected. Such species are exclusively freshwater mussels, which donot occur in the Mataura River immediately upstream or downstream of the discharge.Those ammoniacal nitrogen sensitive species that do occur in the Mataura River in thevicinity of the discharge are the mayfly Deleatidium sp. and the snail Potamopyrgusantipodarum, but these fall within the top 20% of sensitive species and are protected by theAttribute B state.
With regard to enrichment, mean monthly dissolved inorganic nitrogen and dissolvedreactive phosphorus concentrations at biological monitoring sites upstream anddownstream of the discharge exceeded the MfE periphyton guideline for protecting benthicbiodiversity (50 mg chlorophyll a/m2) across allgrowth periods (MfE 2000). The lack ofnuisance algalgroMhs in the periphyton surveys undertaken since 2013 indicate thedischarge is unlikely to be stimulating nuisance alga! growths despite the apparent highconcentrations and that either dissolved inorganic nitrogen or dissolved reactivephosphorus concentrations need to be higher than the MfE (2000) guidelines or otherfactors are controlling periphyton growth in the river.
The enriched and degrading state of the Toetoes Estuary reflects the cumulative effect ofnutrients from the Mataura River catchment. The tota! nitrogen discharge contribution to theToetoes Estuary load from the discharge is 1.1-1 .7To and the estimated total phosphorusdischarge contribution is 0.7-1.3% with the vast majority of total nitrogen and totalphosphorus load entering Toetoes Estuary being derived from other catchment inputsparticularly diffuse sour@s. Even a marked reduction of the discharge total nitrogen andtotal phosphorus loads would have little, if any, detectable effect on the nutrient status ofToetoes Estuary. However, Alliance will need to reduce its levels over time as part ofcatchment wide initiatives to improve water quality.
\A/hile the Plant discharge is having a significant effect on the levels of E. coliin thereceiving water downstream, observed increases in E. coli concentrations as a result of thetreated Plant discharge did not necessarily relate to the abundance of zoonotic pathogensneither did these increases in E. coli relate to the individual illness risk. However, Alliancewill need to investigate a reduction in bacterial levels to meet the National Policy Statement- Freshwater Management requirements
Ecological Effects
Periphyton surveys since 2013 have shown that algal cover and biomass, whilst variedbetween sites and among surveys, showed no effect from the discharge but can be highupstream and downstream which along with community composition maybe affectingMacroinvertebrate Community lndex and Quantitative Macroinvertebrate Community lndexscores.
ftesh ;
-!-ryalereiMrlcrbdtdt
May 2019Alliance Mataura AEE freshdater
6vldmt.l conr{-tB
OF EFFECTS
Deleatidium sp. abundance has been variable between sites and across surveys but hastended to be lower at downstream sites. Prior to the most recent surveys there had been ageneralincreasing trend in Deleatidium sp. abundance at Site Dl since April2013. lnFebruary 2019 Deleatidium sp. abundance at Sites D1 and D2 was lower compared to SitesU1 and U2. The decline tn Deleatidium sp. abundance at downstream sites in February2019 is not explained by periphyton cover and biomass or ammoniacal nitrogenconcentrations but could reflect high river temperatures leading up to and at the time of theFebruary 2019 survey and an increase in overal! stress that occuned some weeks later.The March 2019 survey was notable for the sharp decline in Deleatidium sp. abundance atthe upstream sites and a less pronounced decline at the downstream sites. This effect mayhave been related to the elevated river temperature and extensive late successiona! stagealgal growths at the time of the survey associated with the longest late summer - earlyautumn accrual period since 2012
Overall results indicate the treated wastewater discharge has not resulted in a consistentdecrease in Macroinvertebrate Community lndex and Quantitative MacroinvertebrateCommunity lndex scores between upstream and downstream locations over the periodbetween April 2013 and December 2017. There is no evidence or causal links that can beassociated with the discharge for the February 2019 survey and the March 2019 declinesthat occuned both upstream and downstream.
Water Take
The Mataura River Conservation Order 1997 protects the river from adverce effectsassociated with abstraction with the exception of the weir at Mataura. The small size of thetake relative to the river flow and the very minor effect of the take on minimum flow durationand flow variability will result in only negligible effects on dissolved oxygen, contaminantconcentrations and river water temperature and is not expected to alter the water quality oraffec{ fish.
The consumptive component of the take is approximately 14,400 m3/day or 167 Us. Thisrepresents <1 Yo of MALF. ln terms of river flow the effect of the take is very small and thepotential risk of water quality and ecological effects are therefore assessed as very low.
The results of the benthic invertebrate community monitoring over many years and the largepopulation of resident brown trout indicate that the water take does not adversely affect thebenthic invertebrate community (an important food source for fish), fish habitat or fishmigration. Overall, the take is very likely to have no detectable effects on ecologicalcommunities and responses.
The abstraction of water from the hydro-race has the potential to entrain juvenile fish.Despite the low risk it is recommended that all the intakes that are cunently fifted with5{ mm screen mesh be fitted with 2-3 mm screens to further reduce the potentialforentrainment and to meet best practice standards for screening intakes.
Conclusion
The lower Mataura River is enriched by nutrients and the Toetoes Estuary is in an enrichedand degrading state that reflects the cumulative effect of nutrients from the Mataura Rivercatchment. There is no evidence that the discharge from the Plant is causing adverseeffects on water quality except in the immediate vicinity downstream for ammoniacalnitrogen and total nitrogen which are elevated and for E. colilevels that are significantlyelevated.
fuesh.s-$/aler
e;ltMl:futd!
May 2019Alliance Mataura AEE
tv fresh<-water
OF EFFECTS
Observations of a decrease in the abundance of the mayfly Deleatidium sp. immediatelydownstream in February 2019 and both upstream and downstream in March 2019 andwhich were also observed afier the last long late summer - early autumn accrual period inApril 2013 are likely to be the result of a combination of stressors including higherperiphyton cover and biomass, periphyton community composition and late successionalstage algal growth and elevated river temperatures. Overall, in terms of nitrogen the rivercan be characlerised as degraded, periphyton reflects moderate to high enrichment duringlong accrual periods, and Macroinvertebrate Community lndex and QuantitativeMacroinvertebrate lndex scores reflect fair to poor health at these times but noting that thisoccurs upstream and downstream of the discharge. There is no evidence linking thesestressors to adverse effects associated with the discharge.
The discharge does contribute to increased ammoniacal nitrogen and total nitrogen whichwill contribute to higher loads and lower water quality downstream but the contribution of theloads reaching the estuary are negligible compared with the wider catchment. Thesignificant increase in E. colidownstream is not related to increased risk of illness fromcontamination based on a robust Quantitative Microbial Risk Analysis. Alliance wil! need toreduce ammoniacal nitrogen, total nitrogen and E coli levels to assist in meeting theNational Poliry Statement - Freshwater Management and the Southland Land and WaterPlan and to contribute to an improvement in water quality in the catchment.
firesh ,@!er
May 2019Alliance Mataura AEE
v fresh ,
-<water
NT OF EFFECTS
Table of Contents
2.0
1.1 Background
Discharge Quality and Characteristics...
2.1 Background
2.2 Recent Processing Seasons......
2.3 Discharge Volumes
2.4 Discharge Quality
2.5
2.6
M icrobial Characteristics
Discharge Loads............
fresh ,
-d\ater
1
I
4
4
4
5
7
17
19
3.0 Water Quality Effects ................... 21
lntroduction ....................21
Discharge Mixing ...........29
Physico-Chemical Parameters I mmediately Upstream a nd Downstream3O
Nutrients...
Longitudinal Survey Results
Nutrient Loads to Toetoes Estuary......
Effects on Colour..
Effects on Clarity
Effects from Foams and Scums
Microbial Effects
Water Take and Cooling Water Temperature Effects
Effec{s on Dissolved Oxygen and Temperature........
4.0 EcologicalEffects
4.1 Potential Effects.......
4.2 Summary of Surveys and StatisticalAnalysis
4.3 Effects on AlgalGrowths
4.4 EffectsonBenthiclnvertebrates...............
4.5 Effects on Fish......
Water Take Effects
5.1 Receiving Environment................
5.2 Water Quality.......
5.3 lnstream Habitat Quality
5.4 Entrainment and lmpingement......
3.1
3.2
3.3
3.4
3.5
3.6
3.7
3.8
3.9
3.10
3.11
3.12
33
39
43
44
45
46
47
il56
63
63
64
66
76
81
85
85
89
89
90
5.0
May 2019Alliance Mataura AEE
vl fresh ', '_d/rater

OF EFFECTS firesh ,@!er
6.0 References.....
lndex to Tables
Table 1
Table 2
Table 3
Table 4
Table 5
Table 6
Table 7
Table I
Table 9
Table 10:
Table 11:
Table 12..
Table 13:
Table 14:
Table 15:
Table 16:
Table 17:
Table 18:
Table 19:
Table 20:
Table 21:
Table22:
90
Discharge period over the past six seasons.
Summary of daily discharge volumes between October 2012 and April 2018.
Summary of discharge pH between November 2012 and March 2019.......
Summary of discharge conductivity between November 2012 andSeptember 2016. ........
Summary of discharge TSS between November 2012 and March 2019. ..
Summary of discharge oil and grease concentrations between November2012 and November 2016. ........
Summary of sulfide concentrations between November 2012 and March2019.
Summary of COD concentrations between November 2012 and March2019.
Summary of BOD concentrations between November 2012 and March
...10
2019. ........ ...........12
Summary of low molecularweight BOD concentrations between November2012 and March 2019.......... .................... 13
Summary of TKN concentrations between November 2012 and March 2019.14
Summary of Amm-N concentrations between November 2012 and March2019. ........ ...........15
Summary of TP concentrations between November 2012 and March 2019... 16
Summary of DRP concentrations between November 2012 and March2019. ...................17
Pathogen monitoring data for treated Alliance Mataura wastewater............... 19
Processing season discharge loads of TSS, BOD, TKN and TP....................20
Current River Monitoring and Water Quality Guidelines and Standards.........22
Summary of potential adverse effects associated with the discharge. ............27
Selected Amm-N toxicity data for New Zealand resident species...... .............28
Summary of temperature upstream (Hydro-race site) and downstream(Bridge site) of the Plant - November 2O12to March 2019.............................30
Summary of DO upstream of the Plant (Hydro-race site) - November 2012to March 2019.......... ..............31
Summary of turbidity upstream (Hydro-race site) and downstream (Bridgesite) of the plant - December 2017 lo February 2019. .................31
4
5
7
II
...10
...11
May 2019Alliance Mataura AEE
vil fresh rwater
OF EFFECTS
Summary of total suspended solids upstream (Hydro-race site) anddownstream (Bridge sites) of the Plant - November 2012 to March 2019.......32
Summary of pH upstream (Hydro-race site) and downstream (Bridge site) ofthe plant - November 2012 to March 2019. ................32
BOD concentrations at the Hydro-race and Bridge Sites between December2017 and March 2019.......... ....................33
NOg-N + NOz-N concentrations at the Hydro-race and Bridge Sites betweenNovember 2012 and March 2019.......... .....................34
Amm-N concentrations at the Hydro-race and Bridge Sites betweenNovember 2012 and March 2019.......... .....................35
TN concentrations at the Hydro-race and Bridge Sites between December2017 and March2019.......... ....................36
Dissolved inorganic nitrogen results between July 2018 and February 2019. 36
The MfE (2000) guideline maximum mean monthly SIN and DRPconcentrations for preventing excessive periphyton growth. ........37
TP concentrations at the Hydro-race and Bridge Sites between November2012and March 2019.......... ....................37
Dissolved reactive phosphorous between July 2018 and February 2019.......38
12 January 2018 longitudinal survey nutrient results....... .............39
23 January 2019 longitudinal survey nutrient results....... .............40
Munsell colour results between 13 December 2017 and27 March 2018. ......44
Black disc readings at sites during surveys between 2012 and 2017.............45
Timings and location of foam recorded during the 2018 processing season. .46
Attribute state of the Mataura River based on historical E. coli data. Theamended 2017 NPS was used forthe Attribute State C|assification...............48
Observed baseline and modelled Mataura River Aftribute State (E. coli ,
human health for recreation) before and afler the Alliance Plant discharge....50
Predicted Annual (A) and Summer (S) downstream Mataura River FIBconcentrations as a result of Alliance Plant discharge into an 'improved'upstream Mataura River. .......52
Summary of continuous water temperature recorded between 1 December2017 and 31 August 2018.......... ..............54
DO data sonde survey summary results for January 2018............................. 58
DO data sonde survey summary results for February - March 2019..............59
DO survey summary results between 2012and2017. .................61
Summary of the surveys and data collected since 2012. .............. 65
Thresholds for the periphyton attribute (trophic state) in the NPS-FM basedon chlorophyll-a concentrations. ..............71
Survey results in run habitat February 2019.......... .....82
firesh :
-s-waterMtr.!Mtd
Table 23:
Table 24:
Table 25:
Table 26:
Table 27:
Table 28:
Table 29:
Table 30:
Table 31
Table 32:
Table 33:
Table 34:
Table 35:
Table 36:
Table 37:
Table 38:
Table 39
Table 40
Table 41
Table 42:
Table 43:
Table 44:
Table 45:
Table 46:
Table 47:
May 2019Alliance Mataura AEE
vilr fresh<=rrater
OF EFFECTS
Survey results in rffie habitat February 2019......
Survey results in pool habitat in February 2019..
fteshdler
Table 48:
Table 49:
lndex to Figures
82
83
Figure
Figure
Figure
Figure
Figure
Figure
Figure
Figure
Figure
Figure
Figure
Figure
Figure
Figure
Figure
Figure
Figure
Figure
1:
2:
3:
4:
5:
6:
7:
8:
9:
10:
11:
12:
13:
14:
15:
16:
17.,
18:
Location of Environment Southland monitoring sites...... ................2
Location of Alliance monitoring sites. ......... .................. 3
Discharge volumes between October 2012 and March 201 9. ...................... .... 6
Discharge pH between November 2012 and March 2019................................7
Discharge conductivity between November 2012 and September 2016...........8
Discharge TSS concentrations between November 2012 and March 2019...... IDischarge sutfide concentrations between November 2012 and March 2019.10
Discharge COD concentrations between November 2012 and March 2019...11
Discharge BOD concentrations between November 2012 and March 2019...12
Discharge low molecular weight BOD concentrations between November2012 and November 2016. ......................13
Discharge TKN concentrations between November 2012 and March 2019....14
Discharge Amm-N concentrations between November 2012 and March2019. ........ ...........15
Discharge TP concentrations between November 2012 and March 2019...... 16
Discharge DRP concentrations between November 2012 and March 2019...17
(a) Box plot analysis and (b) Lowess-fitted trend analysis of historical E. coliconcentrations in the Alliance Mataura \ /WTP discharge. Blue lines are themeans....... ...........18
Water temperature at the Hydro-race and Bridge Sites between November2012 and March 2019. ...........30
River TSS at the Hydro-race and Bridge Sites between November 2012 andMarch 2019.......... ..................32
River pH at the Hydro-race and Bridge Sites between November 2012 andMarch 2019.......... ..................33
37
Figure 19: NOrN + NOz-N concentrations at the Hydro-race and Bridge Sites betweenNovember 2012 and March 2019.......... .....................34
Figure 20: Amm-N concentrations at the Hydro-race and Bridge Sites betweenNovember 2012 and March 2019..........
Figure 21: TP concentrations at the Hydro-race and Bridge Sites between November2012 and March 2019.
Figure 22: DRP concentrations at the Hydro-race and Bridge Sites between November2012 and March 2019. ...........38
35
May 2019Alliance Mataura AEE
tx fresh .
-water
OF EFFECTS
12 January 2018 longitudinal survey sampling locations and results.
23 January 20l9longitudinal survey sampling locations and results.
Figure 26
A conceptual model of existing monitoring sites on the Mataura River andtributaries.. ...........47
Linear conelation between water column E. coliconcentrations versusclarity and discharge conditions in the Mataura River. .................49
Continuous temperature in the Mataura River upstream and downstream ofPlant during summer 2017118, autumn 2018 and winter 2018.......................55
January 2018 longitudinal survey showing dissolved orygen concentrationand temperature. .......... .........56
January 2018 longitudinal survey sampling locations showing temperatureand dissolved oxygen data. ......... ............57
Temperature and dissolved oxygen data recorded upstream of the Plantbetween 12and24 January 2018.......... ....................58
Temperature and dissolved o{ygen data recorded downstream of the Plantat Chalmers Road between 12 and24 January 2018. ........ .........59
Figure 27
Figure 28
Figure 29
Figure 30
Figure 31:
Figure 32: Temperature and dissolved orygen data recorded upstream of the Plantbetween 25 February - 19 March 2019.
Figure 33: Temperature and dissolved oxygen data recorded downstream of the Plantat Chalmers Road between 25 February - 19 March 2019.
fiesh ,dler
Figure 23
Figure 24
Figure 25
Figure 34:
Figure 35:
Figure 36:
Figure 37:
Figure 38:
Habitat characteristics at upstream compliance biomonitoring sites.....
Habitat characteristics at downstream compliance biomonitoring sites.
Thick algal mat cover between January 2012 and March 2019............
nMDS of periphyton cover between April 2013 and March 2019.
41
42
74
60
60
66
67
68
69
70nMDS bubble plot showing pattem in periphyton cover between April 2013and February 2019.
Figure 39: Mean chlorophyll-a concentrations for upstream and downstream sitesbetween 2012 and 2019 (numbers in brackets = days in accrual period priorto each survey). .....................72
Figure 40: Mean AFDW for upstream and downstream monitoring sites between 2012and 2019. ............72
Figure 41: Mean Autotrophic lndex values for upstream and downstream monitoringsites between 2012 and 2019. 73
Figure 42: nMDS bubble plot showing the pattem in chlorophyll-a and AFDW for sitesbetween 20'12 and February 2019.
Figure 43: nMDS ordinations showing the time series pattem in chlorophyll-a andAFDW for each site separately between2012 and February 2019.Correlated (r. >0.5) variables are shown as vectors and vectors (anows)indicating time series.
fresh ". ,
---vvaler
75
May 2019Alliance Mataura AEE
x
OF EFFECTS
Mean taxa number for upstream and downstream sites between January2012 and March 2019.
Mean %EPT for upstream and downstream sites between January 2012and Mach 201 9..........
Mean Deleatidium sp abundance for upstream and downstream sitesbetween January 2012 and Mach 2019
Mean MCI score for upstream and downstream sites between January 2012and March 2019..........
Mean QMCI score for upstream and downstream sites between January2012 and March 2019.
Mew of Mataura Falls and immediate downstream environment....................
View of Mataura River between the Mataura Township Bridge and weir........
View of the weir and river environment immediately downstream. .................
View of hydro-race looking back to the weir.
View of the intake pumps located within the hydro-raoe..............
firesh .rwarcrffiffi
Figure 44
Figure 46
Figure 47
Figure 48
Figure 49
Figure 50
Figure 51
Figure 52
Figure 53
Figure 5.4
76
77
78
79
80
85
86
87
88
88
List of Appendices
Appendix 1: Dada 2019 - Mixing report.
Appendix 2: Dada 2019 - QMRA report.
May 2019Alliance Mataura AEE
x fresh '. ,
water
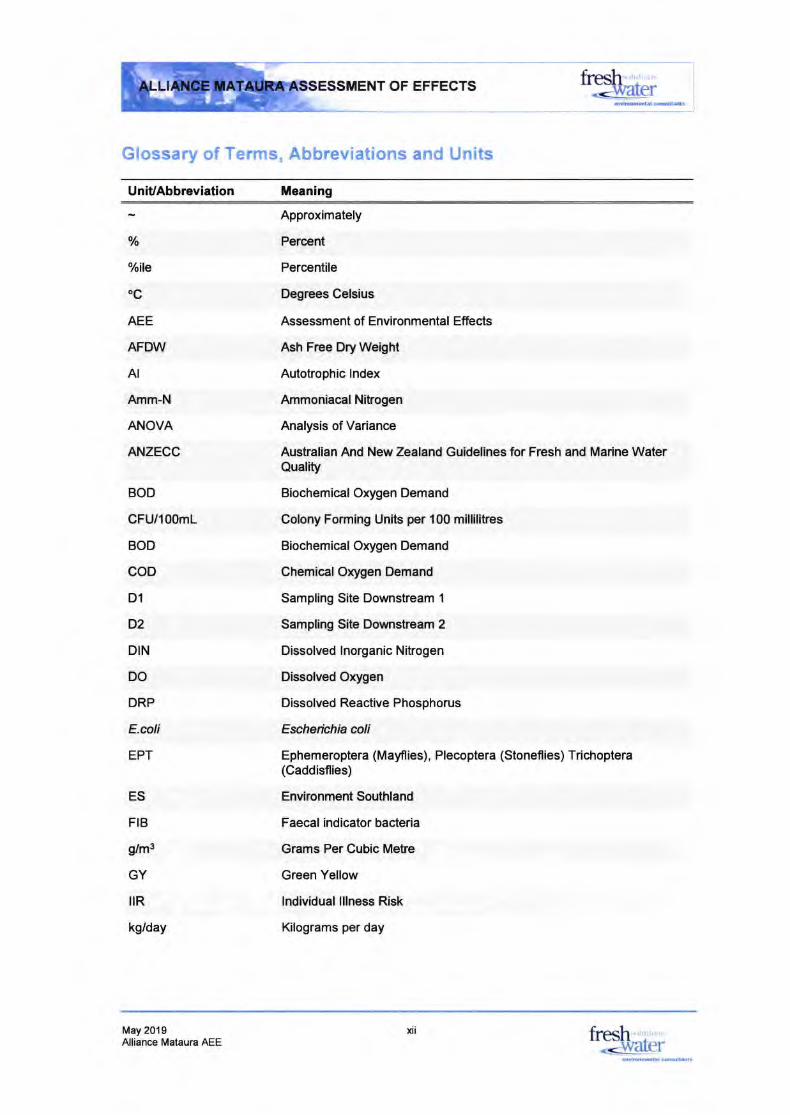
firesh ',d[€rOF EFFECTSf -F"'-:
h.,#
Glossary of Terms, Abbreviations and Units
UniUAbbreviation Meaning
o/o
o/oile
oc
AEE
AFDW
AI
Amm-N
ANOVA
ANZECC
Approximately
Percent
Percentile
Degrees Celsius
Assessment of Environmental Effects
Ash Free DryWeight
Autotrophic lndex
Ammoniacal Nitrogen
Analysis of Variance
Australian And New Zealand Guidelines for Fresh and Marine WaterQuality
Biochemical Orygen Demand
Colony Forming Units per 100 millilitres
Biochemical Orygen Demand
ChemicalOrygen Demand
Sampling Site Downstream 1
Sampling Site Downstream 2
Dissolved lnorganic Nitrogen
Dissolved Orygen
Dissolved Reactive Phosphorus
Escherichia coli
Ephemeroptera (Mayflies), Plecoptera (Stoneflies) Trichoptera(Caddisflies)
Environment Southland
Faecal indicator bacteria
Grams Per Cubic Metre
Green Yellow
lndividual lllness Risk
Kilograms per day
BOD
CFU/l00mL
BOD
coD
D1
D2
DIN
DO
DRP
E.coli
EPT
ES
FIB
g/m3
GY
ltR
kg/day
May 2019Alliance Mataura AEE
rt fresh :.".-s/la[€r
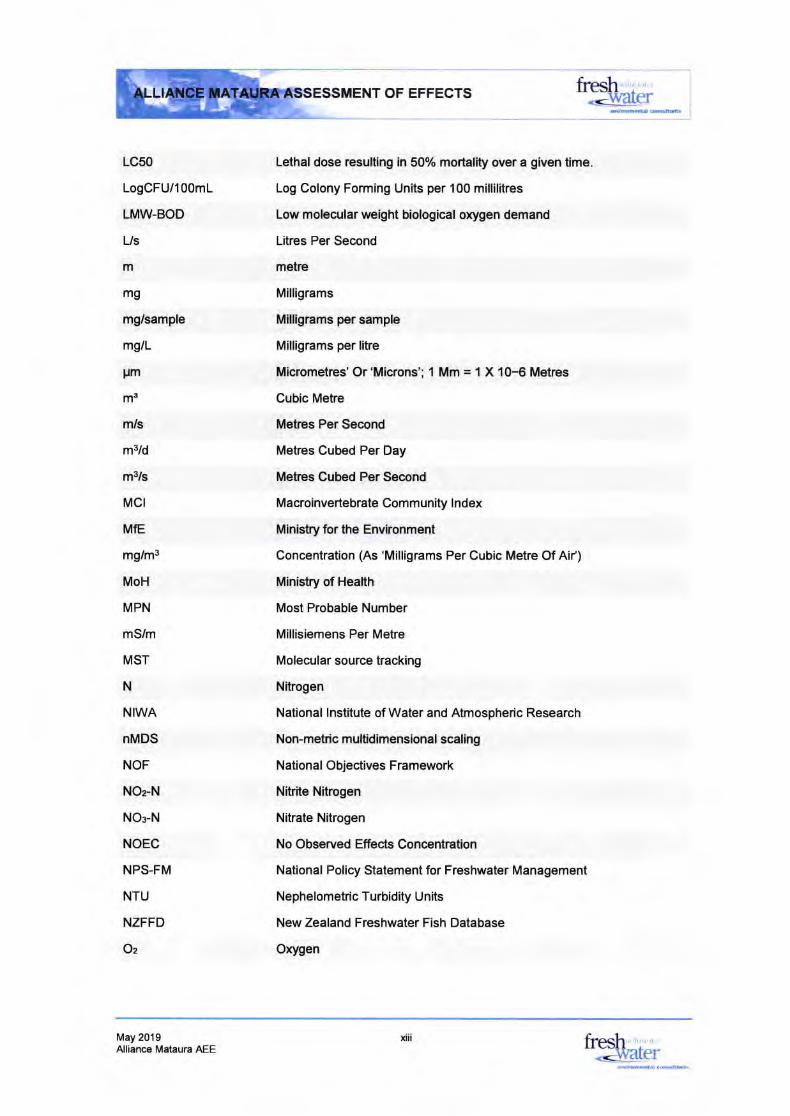
OF EFFECTS
Lethal dose resulting in 50% mortality over a given time.
Log Colony Forming Units per 100 millilitres
Low molec,ularweight biological orygen demand
Litres Per Second
metre
Milligrams
Milligrams per sample
Milligrams per litre
Micrometres' Or'Microns'; 1 Mm = 1 X 10⁻⁶ Metres
Cubic Metre
Metres Per Second
Metres Cubed Per Day
Metres Cubed Per Second
Macroinvertebrate Community lndex
Ministry for the Environment
Concentration (As 'Milligrams Per Cubic Metre Of Aif)
Ministry of Health
Most Probable Number
Millisiemens Per Metre
Molecular souroe tracking
Nitrogen
National lnstitute of Water and Atmospheric Research
Non-metric multidimensional scaling
National Objectives Framework
Nitrite Nitrogen
Nitrate Nitrogen
No Observed Effects Concentration
National Policy Statement for Freshwater Management
Nephelometric Turbidity Units
New Zealand Freshwater Fish Database
Orygen
firesh ,.d!erffi.da
LC50
LogCFU/l00m1
LMW-BOD
Us
m
mg
mg/sample
mg/L
um
mt
m/s
m3/d
m3/s
MCr
MfE
mg/m3
MoH
MPN
mS/m
MST
N
NIWA
nMDS
NOF
NOrN
NOs-N
NOEC
NPS-FM
NTU
NZFFD
Oz
May 2019Alliance Mataura AEE
xI fresh '' '
.<=waler
rudOF EFFECTSffi&
..*,F
q*"{ !,'d{rf
P Phosphorus
Probabifity
Southland Water and Land Plan
&rnlitative Macroiinnrcrbbnate Cornmtnrity lndex '.,
Qualitative Microbial Risk Assessment
p
SWLP
QMCI
QMRA
RMA
S!N
8p.
SRC
tlyr
TKN
TN
TP
TSS
U1
U2
Y
Resotnce Marngernent Act
Soluble inorganic nitrogen
, $pecies
Southland Regional Counci!
SerntQtnnlitatiue
Tonnes per year
Totall$eldafil Nibogen
TotalNitrogen
Totat Phosphonrs
TotalSuspended Solids
Sam$ng Site Upstream 1
Sampling Site Upstream 2
Yellow
Macrolnverbbrate Commurilty lndex
May 2019Alliance Mataura AEE
xv
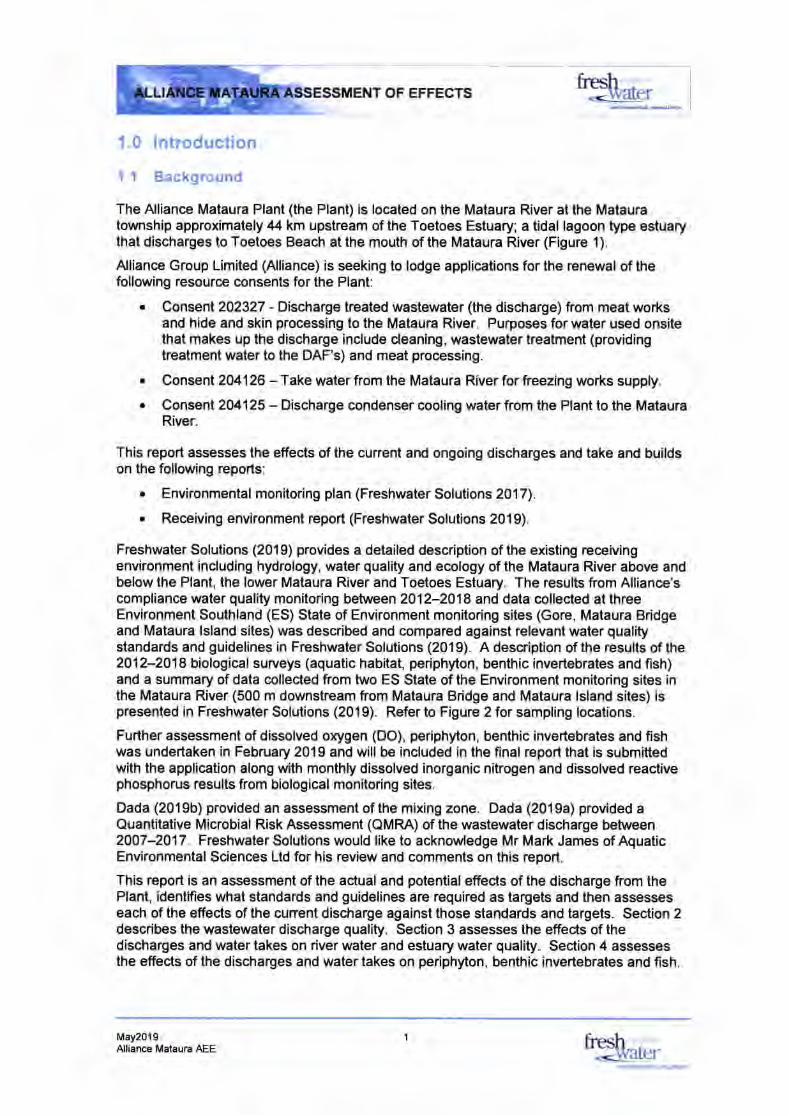
ffii=***oFEFFEcrs fiash ,
---ryarerffi.Mr
1.0 lntroduction
1.1 Background
The Alliance Mataura Plant (the Plant) is located on the Mataura River at the Matauratownship approximately 44 km upstream of the Toetoes Estuary; a tidal lagoon type estuarythat discharges to Toetoes Beach at the mouth of the Mataura River (Figure 1).
Alliance Group Limited (Alliance) is seeking to lodge applications for the renewal of thefollowing resource consents for the Plant:
. Consent202327 - Discharge treated wastewater (the discharge) from meat worksand hide and skin processing to the Mataura River. Purposes for water used onsitethat makes up the discharge include cleaning, wastewater treatment (providingtreatment water to the DAF's) and meat processing.
. Consent204126 - Take water from the Mataura River for freezing works supply.
. Consenl204l25 - Discharge condenser cooling water from the Plant to the MatauraRiver.
This report assesses the effects of the cunent and ongoing discharges and take and buildson the following reports:
. Environmental monitoring plan (Freshwater Solutions 2017).
o Receiving environment report (Freshwater Solutions 2019).
Freshwater Solutions (2019) provides a detailed description of the existing receivingenvironment including hydrology, water quality and ecology of the Mataura River above andbelow the Plant, the lower Mataura River and Toetoes Estuary. The results from Alliance'scompliance water quality monitoring between 2012-2018 and data collected at threeEnvironment Southland (ES) State of Environment monitoring sites (Gore, Mataura Bridgeand Mataura lsland sites) was described and compared against relevant water qualitystandards and guidelines in Freshwater Solutions (2019). A description of the results of the2012-2018 biological surveys (aquatic habitat, periphyton, benthic invertebrates and fish)and a summary of data collected from two ES State of the Environment monitoring sites inthe Mataura River (500 m downstream from Mataura Bridge and Mataura lsland sites) ispresented in Freshwater Solutions (2019). Refer to Figure 2 for sampling locations.
Further assessment of dissolved oxygen (DO), periphyton, benthic invertebrates and fishwas undertaken in February 2019 and will be included in the final report that is submittedwith the application along with monthly dissolved inorganic nitrogen and dissolved reactivephosphorus results from biological monitoring sites.
Dada (2019b) provided an assessment of the mixing zone. Dada (2019a) provided aQuantitative Microbial Risk Assessment (OMRA) of the wastewater discharge between2007-2017. Freshwater Solutions would like to acknowledge Mr Mark James of AquaticEnvironmental Sciences Ltd for his review and comments on this report.
This report is an assessment of the actual and potential effects of the discharge from thePlant, identifies what standards and guidelines are required as targets and then assesseseach of the effects of the cunent discharge against those standards and targets. Section 2describes the wastewater discharge quality. Section 3 assesses the effects of thedischarges and water takes on river water and estuary water quality. Section 4 assessesthe effects of the discharges and water takes on periphyton, benthic invertebrates and fish.
May2019Alliance Mataura AEE
1 fresh 'r '
-<-\ xater
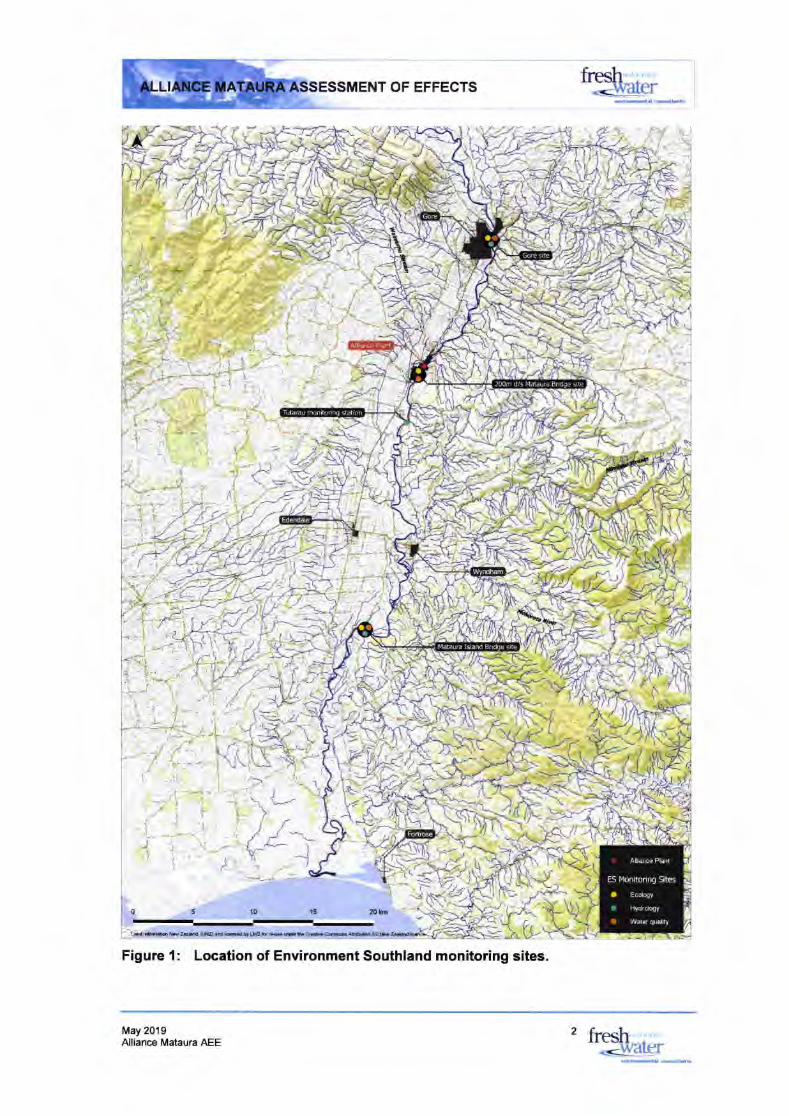
ENT OF EFFECTS
Figure 1: Location of Environment Southland monitoring sites.
lo 2obi
ES Nlorrtorrng Sites
May 2019Alliance Mataura AEE
2 fresh*<xaler
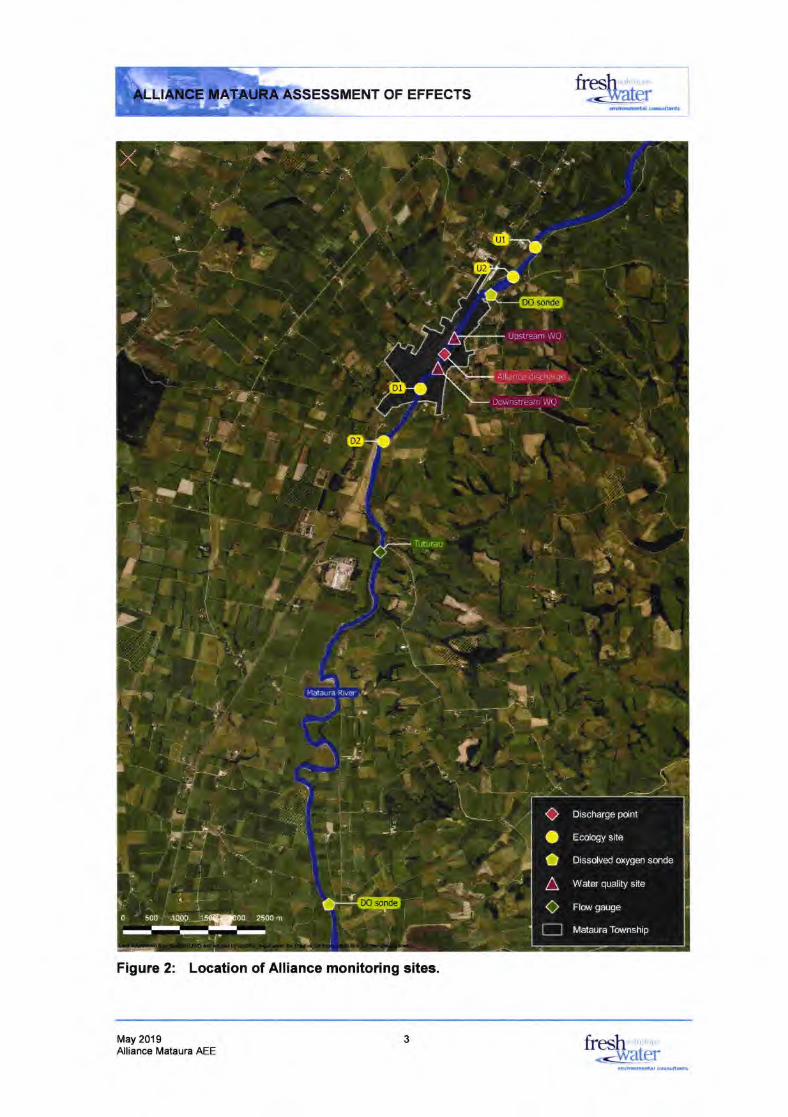
fresh-!-walerOF EFFECTS
Figure 2: Location of Alliance monitoring sites.
May 201 9Alliance Mataura AEE
3 fresh-<l!'ittel-
!.\rrD,n.ntil r.!r{ilrn,1
ENT OF EFFECTS
2.4 Discharge Quality and Characteristics
2.1 Background
Prior to 26 September 2012 the Mataura Plant processed 10,000 sheep and lambs per dayalong with cattle and calves. Extensive work was undertaken in the mid 2000's to separatehigh phosphorus wastewater streams and apply targeted dissolved reactive phosphorustreatment to those streams. However, some cross contamination issues remained,meaning not all high phosphorus streams were treated as intended. The sheep and lamboperation closed on 26 September 2012wtn remaining capacity shifted to Lomeville.Removing sheep and lamb processing had a number of environmental benefits includingchanging the processing peak for the plant from the height of summer, to autumn/earlywinter (Doyle Richardson pers. comm.).
Removal of sheep and lamb processing resulted in a significant reduction in water use andpotential contaminant loads in the treated wastewater including reducing low molecularweight BOD, which can cause sewage fungus, sulphide and remaining issues with targeteddissolved reactive phosphorus treatment. Calf processing ceased in November 2013 andrendering ceased in January 2014 leading to further improvements in wastewater quality.
This section presents the discharge volume and water quality data for the period betweenOctober 2012 and 12 March 2019. Typical data values and distributions of the parametersin such a large data set are best understood in terms of the 50h percentile, 5h percentilesand 95h percentiles. The medians and ranges discussed in the fotlowing sections refer tothese statistics although minima and maxima are also presented for reasons ofcompleteness and to compare to compliance requirements.
2.2 Recent Processing Seasons
The processing season typically starts in October and ends in September with a short'offseason' between late September and mid-late October (Table 1).
Table 1: Discharge period over the past sir seasons.
ftesh .-<\ iarcr
Season Start End
2012t13*
2013t14
2014t15
2015t16
2016t17
2017t18
2018t19
1 November 2012
3 October 2013
23 October 2014
1October2015
25 Oc,tober 2016
26 Odober 2017
2 October 2018
25 September 2013
26 August 2014
23 September 2015
19 September 2016
26 September 2017
30 September 20'18
Not complete
Note: * sheep and lamb processing ceased on 26 September 20'12.
May 2019Alliancp Mataura AEE
4 fresh r
-&[er
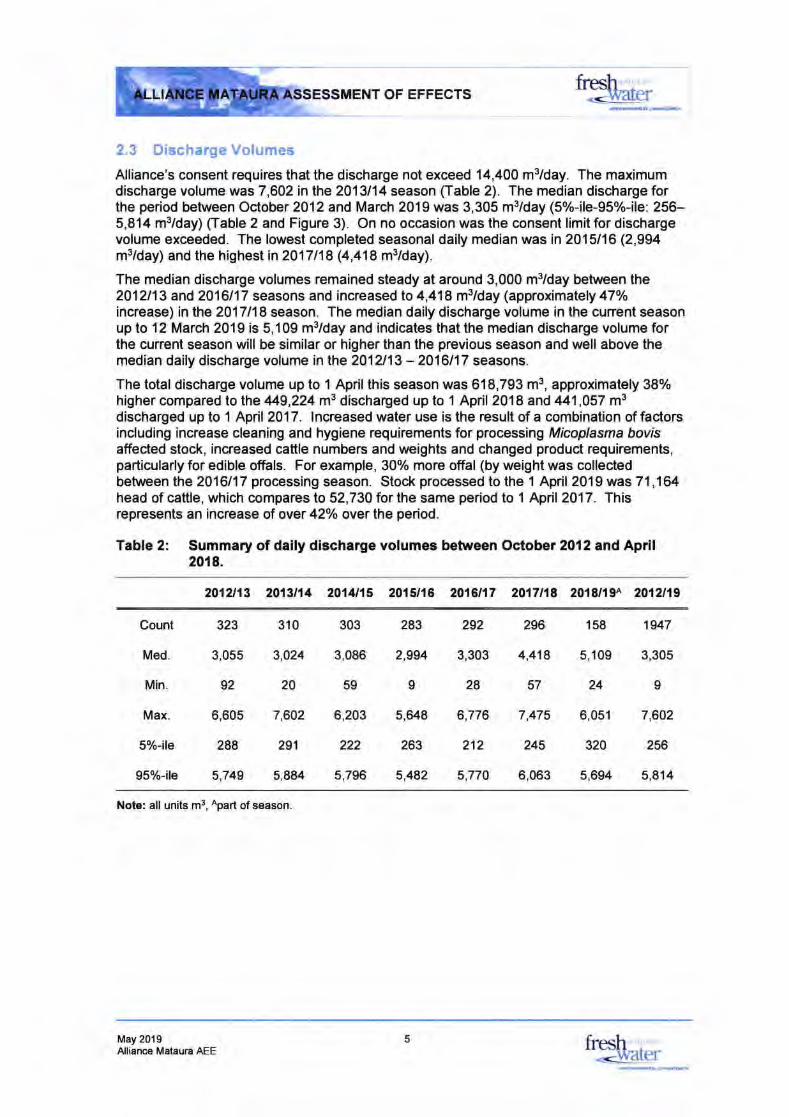
.SSMENT OF EFFECTSfresh ;.J Arcr
2.3 Discharge Volumes
Alliance's consent requires that the discharge not exceed 14,400 m3/day. The maximumdischarge volume was 7,602 in the 2013/14 season (Iable 2). The median discharge forthe period between October 2012 and March 2019 was 3,305 m3/day (5%-ile-95%-ile: 256-5,814 m3/day) (Table 2 and Figure 3). On no occasion was the consent limit for dischargevolume exceeded. The lowest completed seasonal daily median was in 2015/16 (2,994m3/day) and the highest in2017118 (4,418 m3/day).
The median discharge volumes remained steady at around 3,000 m3/day between the2012113 and 2Q16117 seasons and increased to 4,418 m3/day (approximalely 47o/o
increase) in the 2017l18 season. The median daily discharge volume in the cunent seasonup to 12 March 2019 is 5,109 m3/day and indicates that the median discharge volume forthe current season will be similar or higher than the previous season and well above themedian daily discharge volume in the 2012113 - 2016117 seasons.
The total discharge volume up to 1 Aprilthis season was 618,793 m3, approximately 38%higher compared to the 49,224 m3 discharged up to 1 April2018 and 441,057 m3discharged up to 1 April2017. lncreased water use is the result of a combination of factorsincluding increase cleaning and hygiene requirements for processing Micoplasma bovisaffected stock, increased cattle numbers and weights and changed product requirements,particularly for edible offals. For example, 307o more offal (by weight was collectedbetween the 2016117 processing season. Stock processed to the 1 April 2019 was 71,164head of cattle, which compares to 52,730 for the same period to 1 April 2017. Thisrepresents an increase of over 42o/o ovar the period.
Table 2: Summary of daily discharge volumes between October 2012 and April2018.
2012t13 2013t14 2014t15 2015t16 2016t17 2017t18 2018/{94 2012t19
Count
Med.
Min.
Max.
5%-ile
95%-ile
323
3,055
92
6,605
288
5,749
310
3,024
20
7,602
291
5,884
303
3,086
59
6,203
222
5,796
283
2,994
o
5,448
263
5,482
292
3,303
28
6,776
212
5,770
296
4,418
57
7,475
245
6,063
158
s,109
24
6,0s1
320
s,694
1947
3,30s
I
7,602
256
5,814
Note: all units m3, Apart of season.
May 2019Alliance Mataura AEE
5 fresh ,water
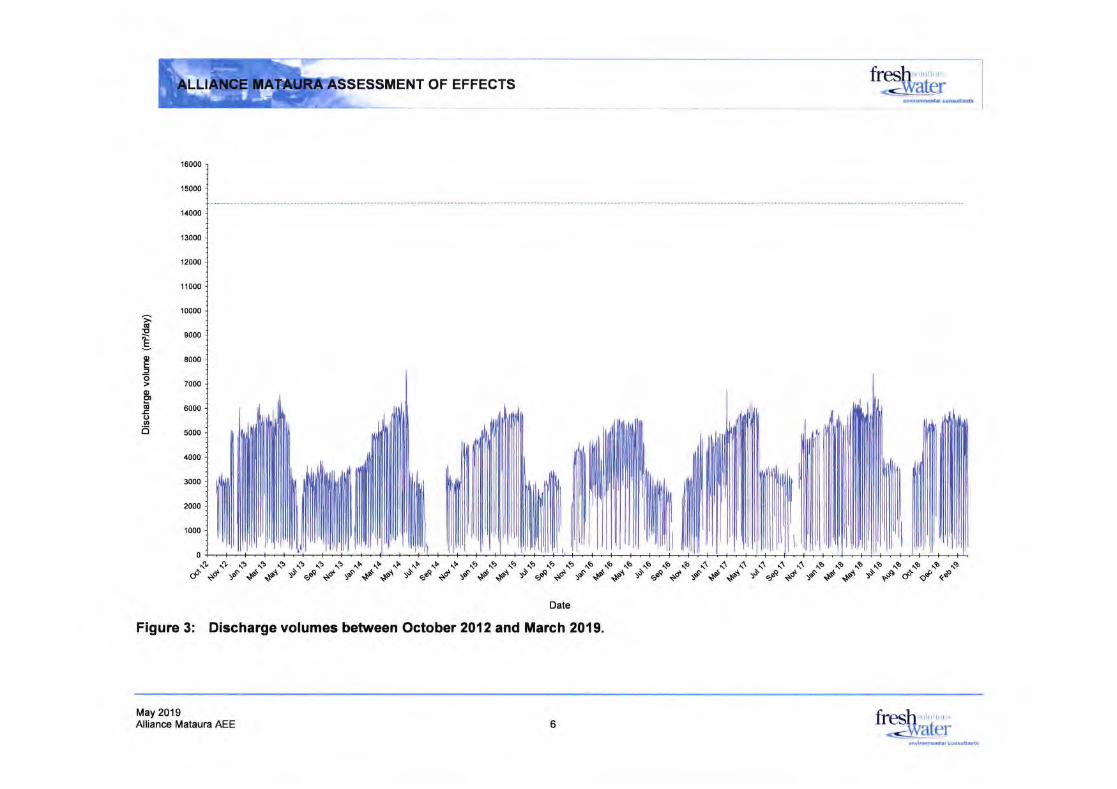
ENT OF EFFECTS fitestr'',,i,""'.&Er
;6!,E
Eo
sEo.!2o
't6000
15000
14000
13000
12000
't 1000
't0000
9000
8(x)0
7000
6000
5000
4000
3000
2000
'r000
0& & \s \t "9-\t s \t \L \u \L-\r \u \i s s 16.16 $ $ 16 \6 \6 \6 16 r5 d $ $ (\ $ $ \$ \$ \$ \$ r$ rt \$ \9
d+d roo{9'*gl s'ed+d 9o*r*pr s'qPa+d:d.$.$1 :sd+d 5o"{Ptqd 9'ePa+d:trg1cr s'ed+d $$11lt $1196toc.a
Date
Figure 3: Dischargevolumes between October 2O12and March 2019.
May 20196Alliance Mataura AEE fr(:str ',,'-.dater

ENT OF EFFECTS
2.4 Discharge Quality
This section presents discharge quality for physico-chemical parameters, nutrients andmicrobia! characteristics, most of which were monitored during the discharge season on anapproximately weekly basis from 1 November 2012 to 12 March 2019.
pH
The overall median pH of the discharge was 8.5 (S%-ile - 95%-ile: 6.8-9.3). The minimumseasonal median occuned in 2012113 (pH = 7.2), which was notably lower than insubsequent seasons and the highest seasonal median was in 201412015 (pH = 8.8) (Table3 and Figure 4).
Table 3: Summary of discharge pH between November 2012 and March 2019.
2012i13 2013t14 2014t15 2015t16 2016t17 2017t18 2018t19 201A'a
ftesh .
=-. waE)r
N
Med.
Min.
Max.
5%-ile
95%-ile
4
7.2
5.5
9.6
6.5
9.2
43
8.6
6.1
9.6
7.0
9.3
48
8.8
6.7
9.3
7.1
9.2
45
8.6
7.2
9.6
7.8
9.3
47
8.5
6.9
9.5
7.5
9.1
43
8.2
6.2
9.2
7.0
8.7
18
8.6
7.7
8.9
8.2
8.8
288
8.5
5.5
9.6
6.8
9.3
Note: pH units
A
A
1raA
-o-
10.0
9.0
8.0
7.0
6.0
5.0
4.0
^l^I ar ^Al aal
^ ^ l^^'^t^-i
ar rla?"^^i+'^^
^ f^^' A
^a
a
^ al^A
u erA
^:t{r"rla
^^
ArlAL" ^.-t?i.pr.^j
A1
^*ti^i:'.3'r^^i - at
^^^ lle,l
A
A I
el
^tl^t.l
aat^^
AA.lA
AA
2013 2011 20r5 2016 2017 20r8
Date
Figure 4: Discharge pH between November 2012 and March 2019.
Aa
A
A
2012 2019 2020
May 2019Alliance Mataura AEE
7 fresh 'r ''
<-water
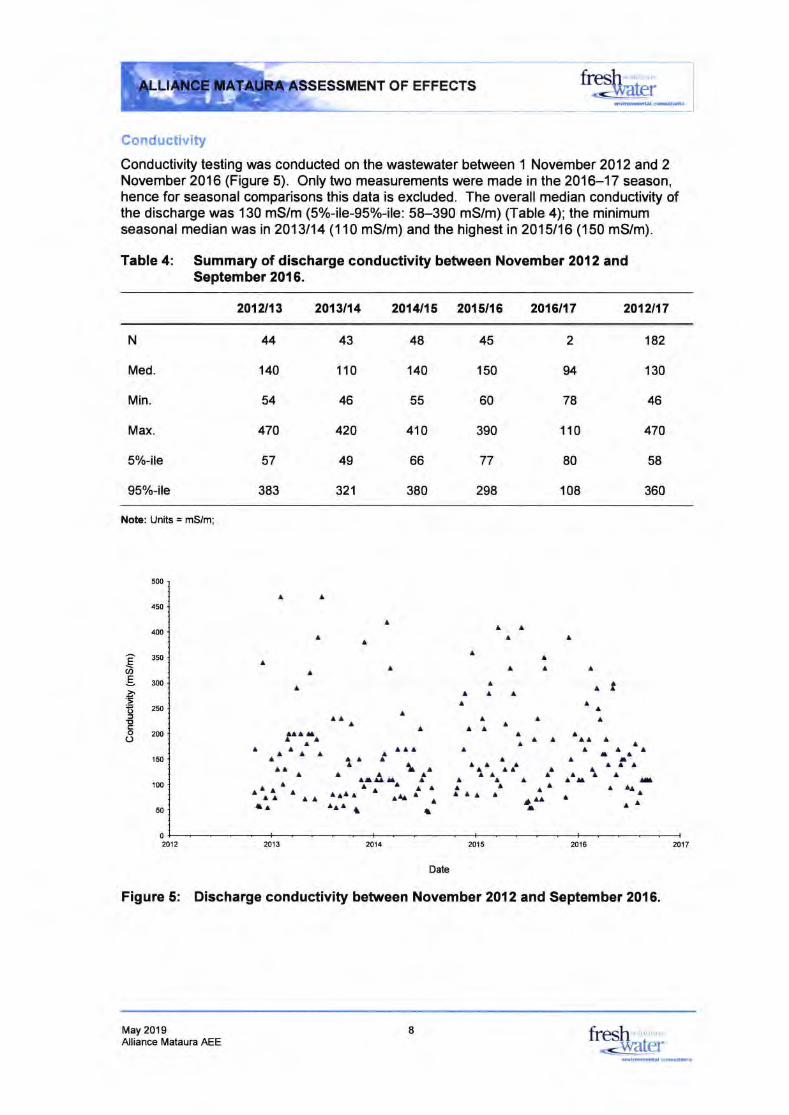
ESSMENT OF EFFECTS
Conductivity
Conductivity testing was conducted on the wastewater between 1 November 2012 and 2November 2016 (Figure 5). Only two measurements were made in the 2016-17 season,hence for seasonal comparisons this data is excluded. The overall median conductivity ofthe discharge was 130 mS/m (5%-ile-95%-ile: 58-390 mS/m) (Table 4); the minimumseasonal median was in 2013114 (1 1 0 mS/m) and the highest in 2015/16 (150 mS/m).
Table 4: Summary of discharge conductivity between November 2012 andSeptember 2016.
firesh.--W?I€f
2012i13 2013114 2014115 2015116 2016117 2012t17
N
Med.
Min.
Max.
5Yo-ile
95%-ile
44
140
54
470
57
383
43
110
46
420
49
321
48
140
55
410
66
380
45
150
60
390
77
298
2
94
78
110
80
108
182
130
46
470
58
360
Note: Units = mS/m;
500
450
/O0
350
3{X}
250
2@
150
100
50
0
EU>
E
=o3!,tro()
A A
AA
A a A
AA
aA/l A
^ AAl
AA
AA
AA
A
A I
AAA
A
A
l
A' IA A
AAA
A
A].l l
AA Ataa
A
]l t
^ a^ at 'AA
AAA
AAAAAa ^r aaa aA
A l
A
l
201620152012
A AA/I Alr l
Aa
a
AA
A ^A
A
A
A
A
i ^ ^^ ,lt'lt
^{ ^ {^tea I AA
20'13 2011
Date
Figure 5: Discharge conductivity between November 2O12 and September 2016.
May 2019
tAA
l1 I
2017
IAlliance Mataura AEE fresh
d,vater
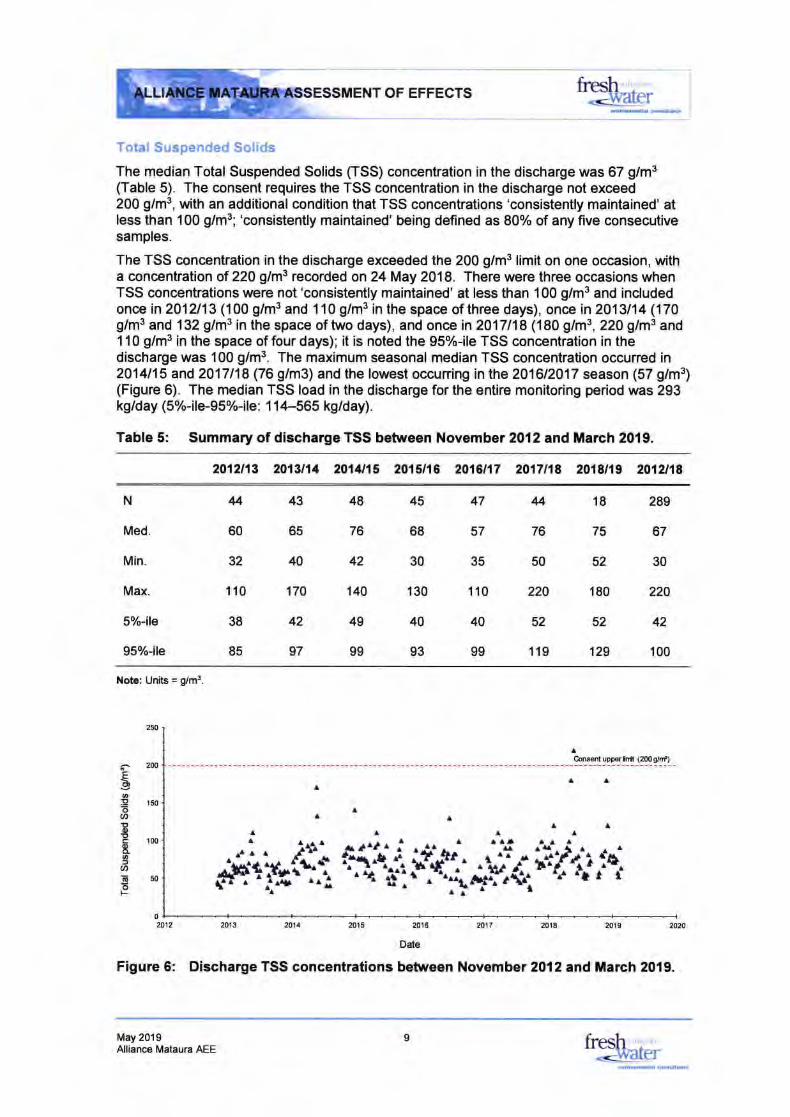
OF EFFECTS
Total Suspended Solids
The median Total Suspended Solids (TSS) concentration in the discharge was 67 g/m3(Table 5). The consent requires the TSS concentration in the discharge not exceed200 g/m3, with an additional condition that TSS concentrations 'consistently maintained' atless than 100 g/m3; 'consistently maintained' being defined as 80% of any five consecutivesamples.
The TSS concentration in the discharge exceeded the 200 g/m3 limit on one occasion, witha concentration of 220 glm3 recorded on24 May 2018. There were three occasions whenTSS concentrations were not 'consistently maintained' at less than 100 g/m3 and includedonce in 201U13 (1 00 g/m3 and 1 10 g/m3 in the space of three days), once in 2013114 (170g/m3 and 132glm3 in the space of two days), and once in2017118 (180 g/m3, 22Oglms and110 g/m3 in the space of four days); it is noted the 95%-ile TSS concentration in thedischarge was 100 g/m3. The maximum seasonal median TSS concentration occurred in2014115 and2017118 (76 g/m3) and the lowest occurring in the 2016120'17 season (57 g/m3)(Figure 6). The median TSS load in the discharge for the entire monitoring period was 293kg/day (5%-ile-95%-ile: 1 1 4-565 kg/day).
Table 5: Summary of discharge TSS between November 2012 and March 2019.
2012113 2013114 2014116 2015/16 2016t17 2017t18 2018t19 2012t18
firestr ,warcrsvi-i*cdrdt
N
Med.
Min.
Max.
5%-ile
95%-ile
460
32
110
38
85
43
65
40
170
42
97
48
76
42
140
49
99
45
68
30
130
40
93
47
57
35
110
40
99
18
75
52
180
52
129
289
67
30
220
42
100
4
76
50
220
52
119
Note: Units = gy'm3
Oonsilt upps H
EED
oE'6oEstr8.of.tt6oF
A
250
2@
15(,
100
50
2012 2013 2011
A
2015 2017 2018
A
2019 2020
A
ll^^/{r {o^'r^^ll I
^^^aLr ^^ J.
4ntrl^i^
^^li?-T.$i^,of*^t ."-^"^t
A
m16
Dde
Figure 6: Discharge TSS concentrations between November 2012and iiarch 2019.
May 2019 IAlliance Mataura AEE fresh ,
-water
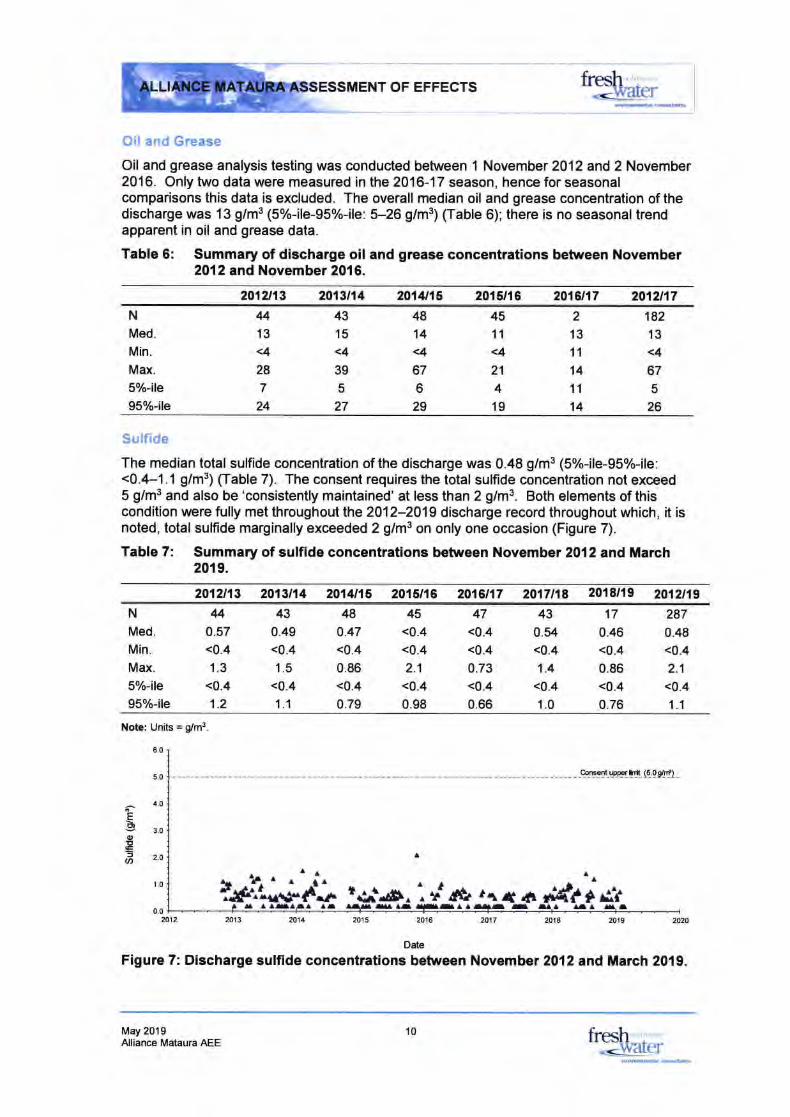
ENT OF EFFECTS
Oil and Grease
Oil and grease analysis testing was conducted between 1 November 2012 and 2 November2016. Only two data were measured in the 2016-17 season, hen@ for seasonalcomparisons this data is excluded. The overall median oil and grease concentration of thedischarge was 13 g/m3 (5%-ile-95%-ile: 5-26 g/m3) (table 6); there is no seasonaltrendapparent in oil and grease data.
Table 6: Summary of discharge oil and grease concentrations between November2012 and November 2016.
201211t 2013114 2014t15 2015t16 2016t17 2012t17
firestr 'r
-darcr
N
Med.
Min.
Max.
5%-ile
95o/o-ile
4814
<4
67
6
29
4315
<4
39
5
27
413
<4
28
7
24
4511
<4
21
419
2
13
11
14
11
14
'182
13
<4
67
5
26
Sulfide
The median total sulfide concentration of the discharge was 0.48 g/m3 (5%-ile-95%-ile:<0.4-1.1 g/m3) (Iable 7). The consent requires the total sulfide concentration not exceed5 g/m3 and also be 'consistently maintained' at less than 2 glm3. Both elements of thiscondition were fully met throughout the 2012-2019 discharge record throughout which, it isnoted, total sulfide marginally exceeded 2 glm3 on only one occasion (Figure 7).
Table 7: Summary of sulfide concentrations between November 2012 and March2019.
2012113 2013114 2014t15 2015nA 201.6t17 2017t18 2018119 2012t19
N
Med.
Min.
Max.
5%-ile
95%-ile
40.57<0.4
1.3
<0.4
1.2
430.49<0.4
1.5
<0.4
1.1
48
0.47<0.4
0.86<0.4
0.79
45<0.4
<0.4
2.1
<0.4
0.98
47<0.4
<0.4
0.73<0.4
0.66
43
0.54<0.4
1.4
<0.4
1.0
17
0.46<0.4
0.86<0.4
0.76
287
0.48<0.4
2.1
<0.4
1.1
Nob: Units = dm3
EboE3a
6.0
5.0
1.O
3.0
2.O
1.0
0.0
_ _99lr!9!t_url9[Er_ (5-qg]r-r) _
AA
A AI2013
aa A
t i*t&.. d?IA
2012 m11 2015 2016
Dde
2017 20't8 2019 20?o
Figure 7: Discharge sulfide concentrations between November 2012 and March 2019
May 2019Alliance Mataura AEE
10 fresh'"1 ,'
---ryaEr
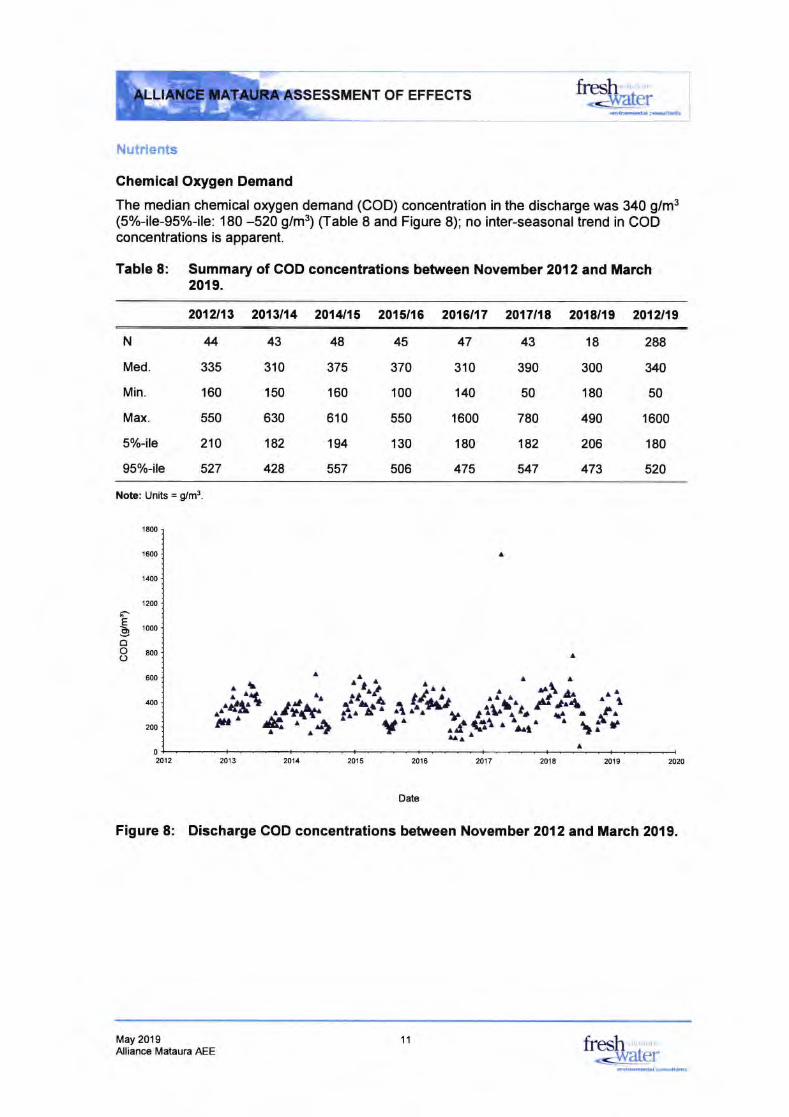
OF EFFECTS
Nutrients
ChemicalOrygen Demand
The median chemical oxygen demand (COD) concentration in the discharge was 340 g/m3(5%-ile-95%-ile: 180 -520 g/m3) (l-able I and Figure 8); no inter-seasonaltrend in CODconcentrations is apparent.
Table 8: Summary of COD concentrations between November 2012 and March20,l9.
2012119 2013t14 2014t15 2015t16 2016t17 2017t18 2018t19 2012119
tush ;<{ilarcr
N
Med.
Min.
Max.
5%jle
95%-ile
4335
160
550
210
527
43
310
150
630
182
428
48
375
160
610
194
557
45
370
100
5s0
130
506
47
310
140
1600
180
475
43
390
50
780
182
il7
18
300
180
490
206
473
288
340
50
1600
180
520
Note: Units = gy'm3
a
1800
16{X'
1/O0
1200
5 in)o
ov 800(J
600
4{Xt
2@
A
A
^lIt'a
^tj
.l;13 j^{
rlla all
^arr;rt ^-^.t.^' a ia^+i-^ ^^i
^ .,L. .ii^l+"+r.da::'^+
02012 2013 m11 2015 2018 2017 2018 2019 m20
Date
Figure 8: Discharge COD concentrations between November 2012 and March 2019.
May 2019Alliance Mataura AEE
11 fresh ,
-dvater'--tlffir.--n-r.
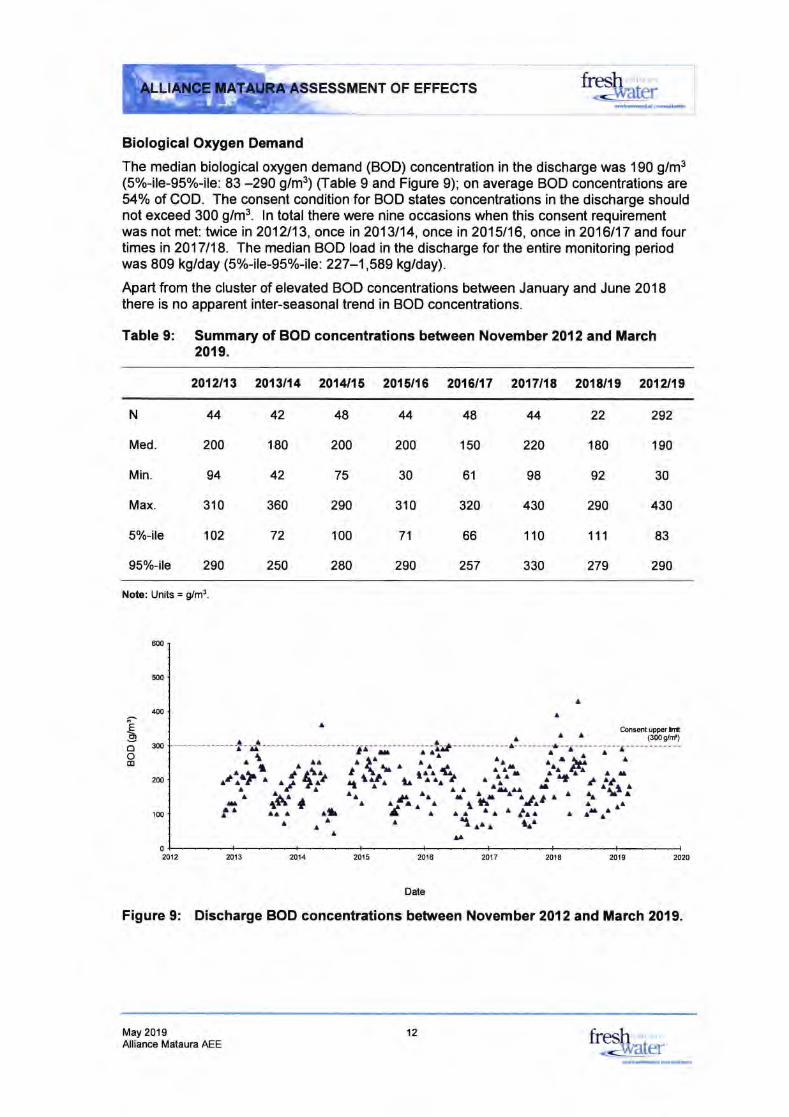
t
Biological Oxygen Demand
The median biologica! oxygen demand (BOD) concentration in the discharge was 190 g/m3(5%-ile-95%-ile: 83 -290 g/m3) (Iable 9 and Figure 9); on average BOD concentrations are54o/o of COD. The consent condition for BOD states concentrations in the discharge shouldnot exceed 300 g/m3. ln totalthere were nine occasions when this consent requirementwas not met: twice in2012113, once in 2013114, once in 2015116, once in 2016117 and fourtimes in 2017118. The median BOD load in the discharge for the entire monitoring periodwas 809 kg/day (5%-ile-95% -ile: 227 -1,589 kg/day).
Apart from the cluster of elevated BOD concentrations between January and June 2018there is no apparent inter-seasonaltrend in BOD concentrations.
Table 9: Summary of BOD concentrations between November 2012 and March2019.
2012t1t 201u14 2014t15 2015t16 2016t17 2017t18 2018t19 2012n9
N
Med.
Min.
Max.
5%jle
95%-ile
44
200
94
310
102
290
42
180
42
360
72
250
48
200
75
290
100
280
4200
30
310
71
290
48
150
61
320
66
257
44
220
98
430
110
330
22
180
92
290
111
279
292
190
30
430
83
290
Note: Units = dm3
6{D
500
.(l0
EED
O 3{x}
oo2,0
100
A
Aa Oom{tupFrH
(3qrg/if)A T--8-- --az-
I
^,\.. - aa
"i+'^ ^f lir.r:^ i-^i.
^o
ijh^"AA f-A
a/r
2412 2011 2ol 5 2014 ml8 20r9 2020
Date
Figure 9: Discharge BOD concentrations between November 2012and March 2019.
May 2019
0
A
20172013
Alliance Mataura AEE12 fresh ',,",
s: watgr
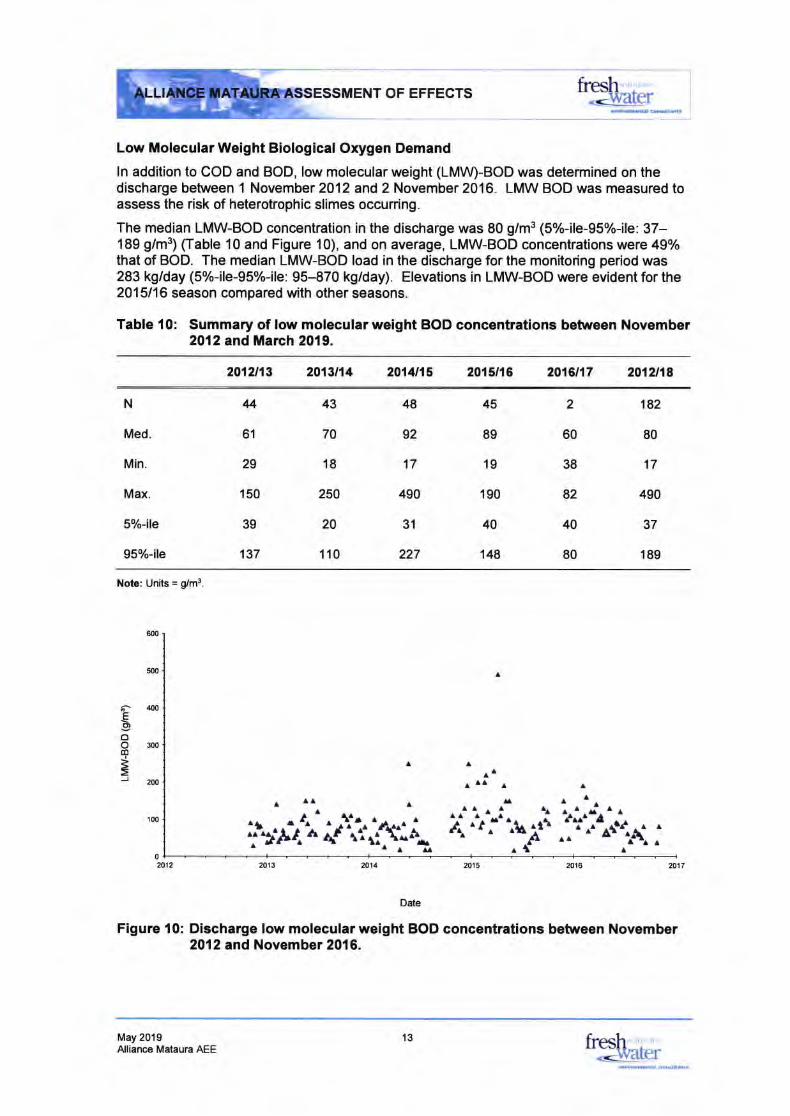
ENT OF EFFECTS
Low Molecular Weight Biological Orygen Demand
ln addition to COD and BOD, low molecular weight (LMW-BOD was determined on thedischarge between 1 November 2012 and2 November 2016. LMW BOD was measured toassess the risk of heterotrophic slimes occuning.
The median LMW-BOD concentration in the discharge was 80 g/m3 (5%-ile-95%-ite: 37-189 g/m3) (Iable 10 and Figure 10), and on average, LMW-BOD concentrations were 497othat of BOD. The median LMW-BOD load in the discharge for the monitoring period was283 kg/day (5%-ile-95%-ile: 95-870 kg/day). Elevations in LMW-BOD were evident for the2015116 season compared with other seasons.
Table 10: Summary of low molecular weight BOD concentrations between November2012 and March 2019.
2012113 2013t14 2014t15 2015t16 2016t17 2012t18
fuesh_4rerffirirdfr
N
Med.
Min.
Max.
5%-ile
95%-ile
43
70
18
250
20
110
48
92
17
490
31
227
4
61
29
150
39
137
45
89
19
190
40
148
182
80
17
490
37
189
2
60
38
82
40
80
Note: Units = gy'm3
600
5fl1
^
t ,o0EDoO3(,0dl
=J ax)
100
0
r ll
:lr.af^ i.'*
A A AA
r AA A A
I r^ ^t
a. 1^t.-^ ^
.r,.-i\ ii ii^ ^:.A" ;t^.i.'..a ;2012 2013 ?o11 2016 2017
Date
Figure 10: Discharge low molecular weight BOD concentrations between November2012 and November 2016.
May 2019
2015
Alliance Mataura AEE13 fresh ;water
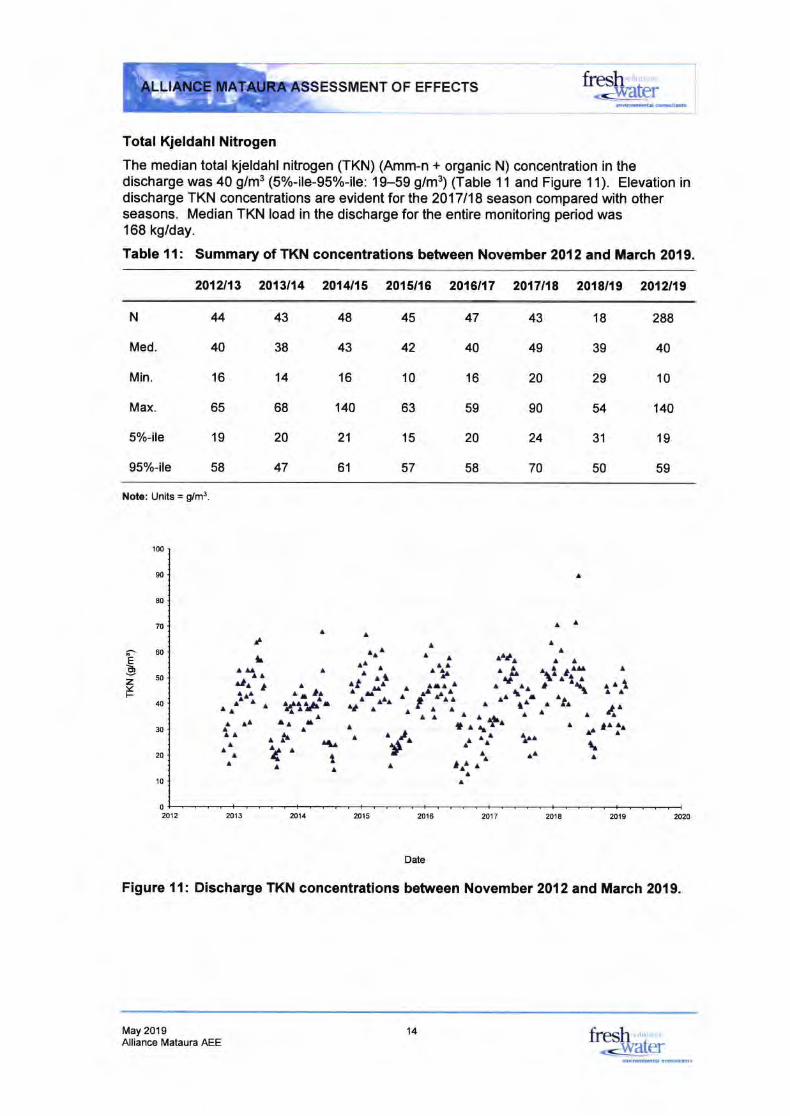
ESSMENT OF EFFECTS-<!vzl[er.nrtffirt.!t,dt*
Total Kjeldahl Nitrogen
The median total kjeldahl nitrogen (TKN) (Amm-n + organic N) concentration in thedischarge was 40 g/m3 (5%-ile-95%-ile: 19-59 g/m3) (Table 1 1 and Figure 1 1). Elevation indischarge TKN concentrations are evident for the 2017118 season compared with otherseasons. Median TKN load in the discharge for the entire monitoring period was168 kg/day.
Table 11 : Summary of TKN concentrations between November 2012 and March 2019
2012J13 2013t14 2014t15 2015t16 2016t17 2017t18 2018t19 2012119
N
Med.
Min.
Max.
5%-ile
95%jle
44
40
16
65
19
58
43
38
14
68
20
47
48
43
16
'140
21
61
45
42
10
63
15
57
47
40
16
59
20
58
18
39
29
54
31
50
288
40
10
140
19
59
43
49
20
90
24
70
Note: Units = gy'm3
100
9n
80
70
60
50
40
30
20
10
0
A
A
2013 2014 2014 2017
2014 2019 2020
^a A.1.
^3{^attl
AAAA
AA
EE,zYF
II
^^l^. aa aaa
^ ifiiA'AA1 r
A
atAlla^a rl
lt-' a'lt^a^ Ialaa
^^i ^nAAr ^ i^
^a-^^ ^{^^fi+ ^ .1i'
a a t^^ ^a$^ ^
^^ ^a^
AaPl
^^ aal^t a
a^
la
^ar.i e^a a
e" 'ri i^^lAa
I AA AaGLa ^ laaaE
|. .{.tl
^^i?^
l bt
20152012
Date
Figure 1l: Discharge TKN concentrations between November 2012 and March 2019.
May 2019Alliance Mataura AEE
14 fresh .
<-water
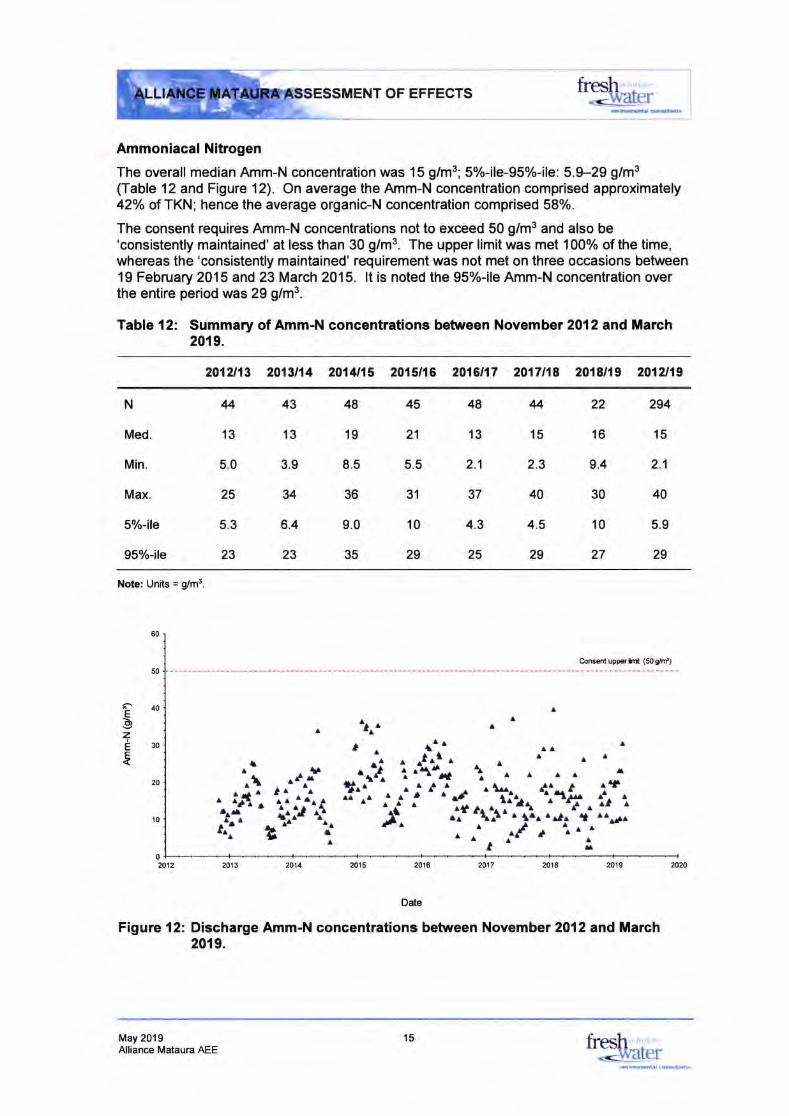
H*re'OF EFFECTS
Ammoniacal Nitrogen
The overall median Amm-N concentration was 15 g/m3; 5%-ite-95%-ile: 5.9-29 g/m3(Table 12 and Figure 12). On average the Amm-N concentration comprised approximately42% of TKN; hence the average organic-N concentration comprised 58%.
The consent requires Amm-N concentrations not to exceed 50 g/m3 and also be'consistently maintained' at less than 30 g/m3. The upper limit was met 100% of the time,whereas the'consistently maintained' requirement was not met on three occasions between19 February 2015 and 23 March 2015. lt is noted the 95%-ile Amm-N concentration overthe entire period was 29 g/m3.
Table {2: Summary of Amm-ltl concentrations between November 2O12 and March2019.
201A13 201u14 2014t15 2015t18 2016117 2017118 2018119 2012119
N
Med.
Min.
Max.
5%-ile
957o-ile
413
5.0
25
5.3
23
43
13
3.9
u6.4
23
48
19
8.5
36
9.0
35
45
21
5.5
31
10
29
48
13
2.1
37
4.3
25
4
15
2.3
40
4.5
29
22
16
9.4
30
10
27
294
15
2.1
40
5.9
29
Note' Units = gy'm3
Co.EqtupperH (509ffi)
A
8o
50
40
30
EBzE
E I.$
^i| ^f^'
iif^. -ilri,i' a" i
Iel^
.^'$ ia -a a a'aA rll^
r^^
^t^t^^A. a^^,.aa
i^^i^?*:^i".'^q^.l t Atr
^.-aalr
AA
A
2011 2015 2016
2019 m20
A^ /l
ellI rla^A.a'
AAaLa
ar;fef
lr
02412 20r820172013
Dde
Figure 12: Discharge Amm-N concentrations between November 2012 and March2019.
May 2019Alliance Mataura AEE
15 ftesh ,"'..:.\^/laler
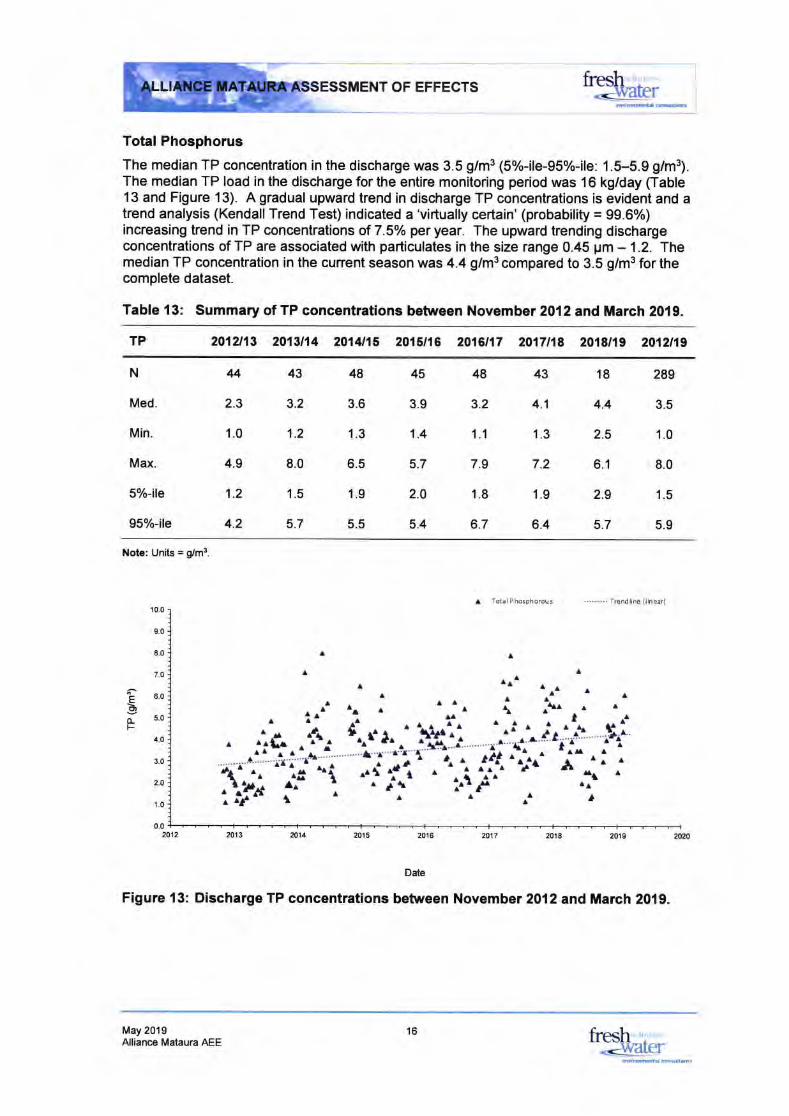
ESSMENT OF EFFECTS
Total Phosphorus
The median TP concentration in the discharge was 3.5 g/m3 (5o/o-ile-95o/o-ile: 1.5-5.9 g/m3).The median TP load in the discharge for the entire monitoring period was 16 kg/day (Iable13 and Figure 13). A gradual upward trend in discharge TP concentrations is evident and atrend analysis (KendallTrend Test) indicated a'virtually certain' (probability = 99.6%)increasing trend in TP concentrations of 7.5o/o per year. The upward trending dischargeconcentrations of TP are associated with particulates in the size range 0.45 pm - 1.2. Themedian TP concentration in the cunent season was 4.4 g/m3 compared to 3.5 g/m3 for thecomplete dataset.
Table 13: Summary of TP concentrations between November 2012 and March 2019.
TP 201211t 2013114 2014t15 2016t16 2016t17 2017t18 2018/19 2012t19
flesh I@!er
N
Med.
Min.
Max.
5%-ile
95%{le
4
2.3
1.0
4.9
1.2
4.2
43
3.2
1.2
8.0
1.5
5.7
48
3.6
1.3
6.5
1.9
5.5
45
3.9
1.4
5.7
2.0
5.4
48
3.2
'|..1
7.9
1.8
6.7
43
4.1
1.3
7.2
1.9
6.4
18
4.4
2.5
6.1
2.9
5.7
289
3.5
1.0
8.0
1.5
5.9
Note. Units = gy'm3
A Total Phosphorous .....-... Trendlihe (linear)10.0
s.0
8.0
7.O
6.0
5.0
4.0
3.0
2.O
1.0
0.0
A
^AA^
ILa
^ A1 f..
A.
AAt^aa
lorlr^^^ ^.*I:....
"T;ij' ^';'
. t-^ a-^^ ^ ^
,^d:'. 'f1^A1^^a
^il
Eb(LF A
A
aA
a,l
A
.AaaA1I
AA ta rAt
2o12 2011 2015 2016 2017 2014 20r9
Date
Figure 13: Discharge TP concentrations between November 2012 and March 2019.
20't3 2020
May 2019Alliance Mataura AEE
16 fresh ': ,
-=-water
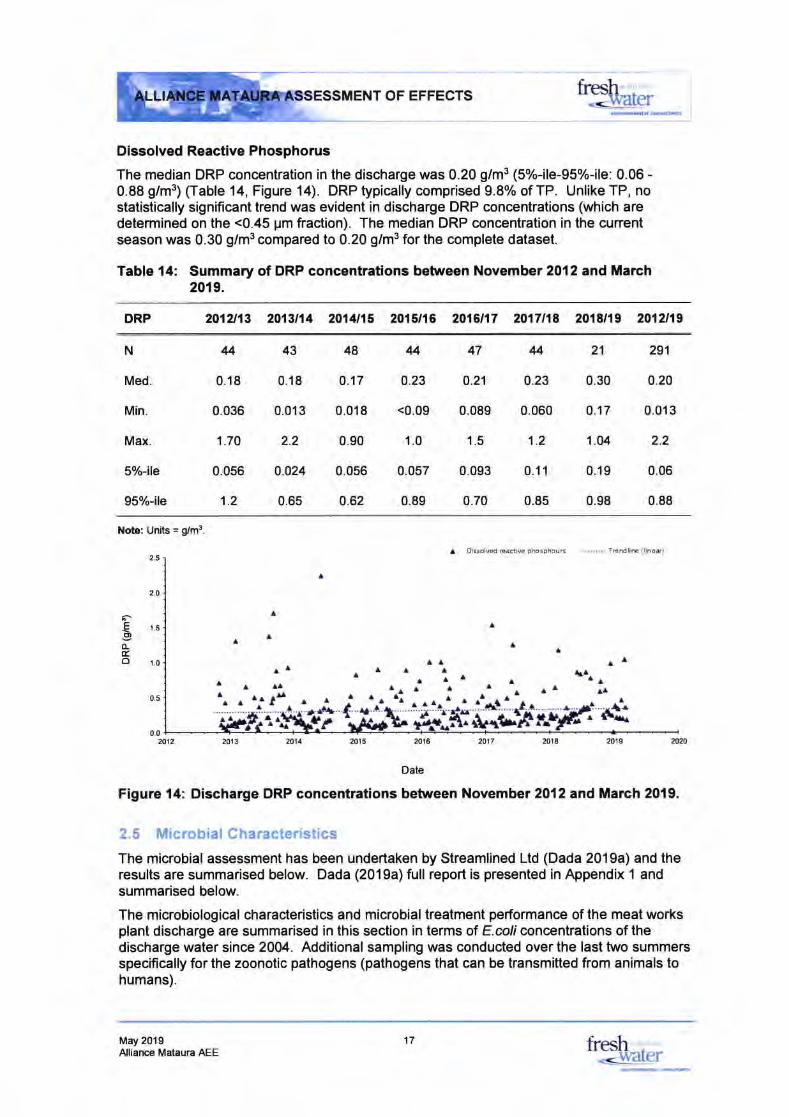
B.rc'OF EFFECTS
Dissolved Reactive Phosphorus
The median DRP concentration in the discharge was 0.20 g/m3 (5%-ite-95%-ile: 0.06 -0.88 g/m3) (Iable 14, Figure 14). DRP typically comprised 9.8% of TP. Unlike TP, nostatistically significant trend was evident in discharge DRP concentrations (which aredetermined on the <0.45 pm ftaction). The median DRP concentration in the cunentseason was 0.30 g/m3 compared to 0.20 g/m3 for the complete dataset.
Table 14: Summary of DRP concentrations between November 2012 and March2019.
DRP 201A1t 2013t14 2014t15 2015116 2016117 2017118 2018119 201419
N
Med.
Min.
Max.
5%-ile
95%jle
4
0.18
0.036
1.70
0.056
1.2
43
0.18
0.013
2.2
0.024
0.65
48
0.17
0.018
0.90
0.056
0.62
40.23
<0.09
1.0
0.057
0.89
47
0.21
0.089
1.5
0.093
0.70
40.23
0.060
1.2
0.11
0.85
21
0.30
0.17
1.04
0.19
0.98
291
0.20
0.013
2.2
0.06
0.88
Note: Units = gy'm3
2012
A Dissolved reactive phosphou6 ......... TEndlire (line*)
A
A
A
A
2.5
2.0
1.5
1.0
0.5
0.0
EED
o-to
A
A
aa
A
AralAA
A
AA
AAA
AA
^^
2017
la-'a
^^ ^ ^fl-a
mr3
ArAr
^ aa ^ trA
2016
Date
r aA
20't8
A^A A
A
m11 2015 mt9 2020
Figure 14: Discharge DRP concentrations between November 2O12 and March 2019.
2.5 Microbial Characteristics
The microbial assessment has been undertaken by Streamlined Ltd (Dada 2019a) and theresults are summarised below. Dada (2019a) full report is presented in Appendix 1 andsummarised below.
The microbiological characteristics and microbial treatment peilormance of the meat worksplant discharge are summarised in this section in terms of E.coliconcentrations of thedischarge water since 2004. Additional sampling was conducted over the last two summersspecifically for the zoonotic pathogens (pathogens that can be transmitted from animals tohumans).
May 2019Alliance Mataura AEE
17 fresh ","'"water
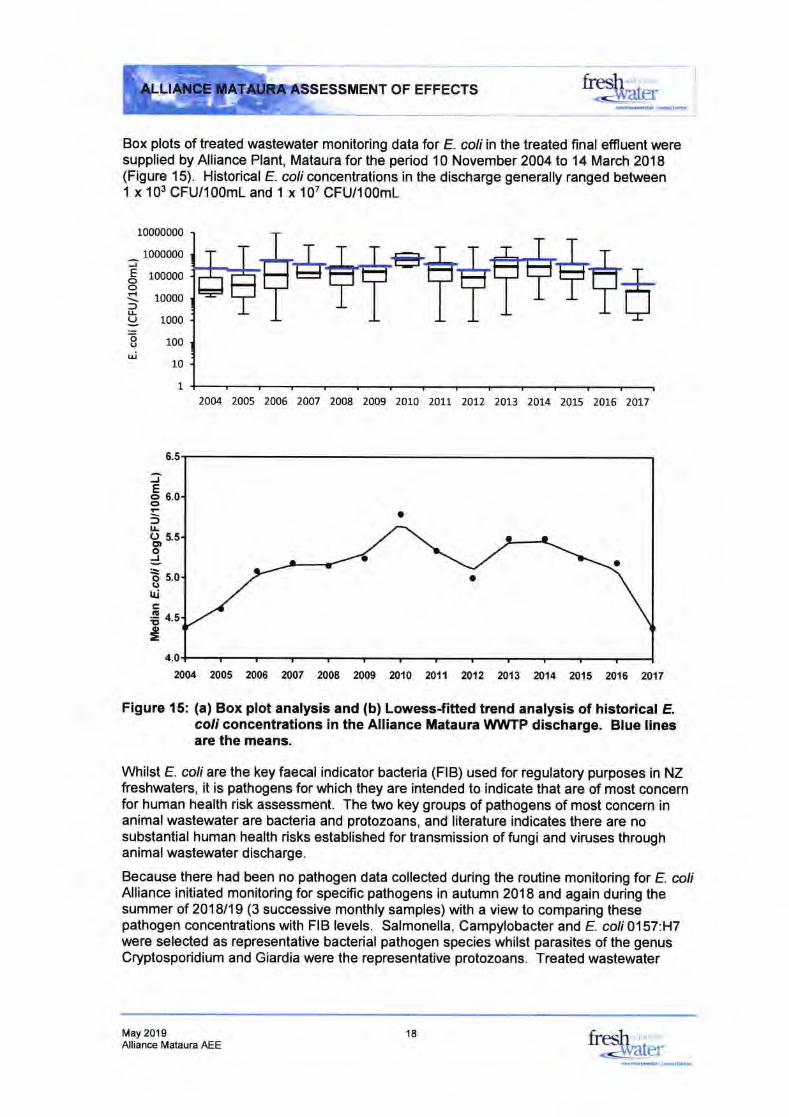
OF EFFECTS
Box plots of treated wastewater monitoring data for E. coli in the treated final effluent weresupplied by Alliance Plant, Mataura for the period 10 November 2004 to 14 March 2018(Figure 15). Historical E coli concentrations in the discharge generally ranged between1 x 103 CFU/100m1and 1 x 10⁷ CFU/100m1
10000000
2004 2005 2006 2007 2008 2009 2010 2011 20L2 2013 20]^4 20L5 20t5 20\7
mu 2005 2006 2007 2008 2009 2010 2011 m12 2013 m14 2015 2016 2017
Figure 15: (a) Box plot analysis and (b) Lowess-fitted trend analysis of historical Ecoli concentrations in the Alliance Mataura WWTP discharge. Blue linesare the means.
\A/hilst E. coli are the key faecal indicator bacteria (FlB) used for regulatory purposes in NZfreshwaters, it is pathogens for which they are intended to indicate that are of most concemfor human health risk assessment. The two key groups of pathogens of most concern inanimalwastewater are bacteria and protozoans, and literature indicates there are nosubstantial human health risks established for transmission of fungi and viruses throughanimal wastewater discharge.
Because there had been no pathogen data collected during the routine monitoring for E. coliAlliance initiated monitoring for specific pathogens in autumn 2018 and again during thesummer of 2018119 (3 successive monthly samples) with a view to comparing thesepathogen concentrations with FIB levels. Salmonella, Campylobacter and E. coli0157:H7were selected as representative bacterial pathogen species whilst parasites of the genusCryptosporidium and Giardia were the representative protozoans. Treated wastewater
ftesh<- waler
1000000
100000
10000
1000
100
10
1
JEooft!(J
oclrri
oollroEDo
ooui
.EEE
6.5
May 2019Alliance Mataura AEE
II
18 fresh '. ,
.!-waler
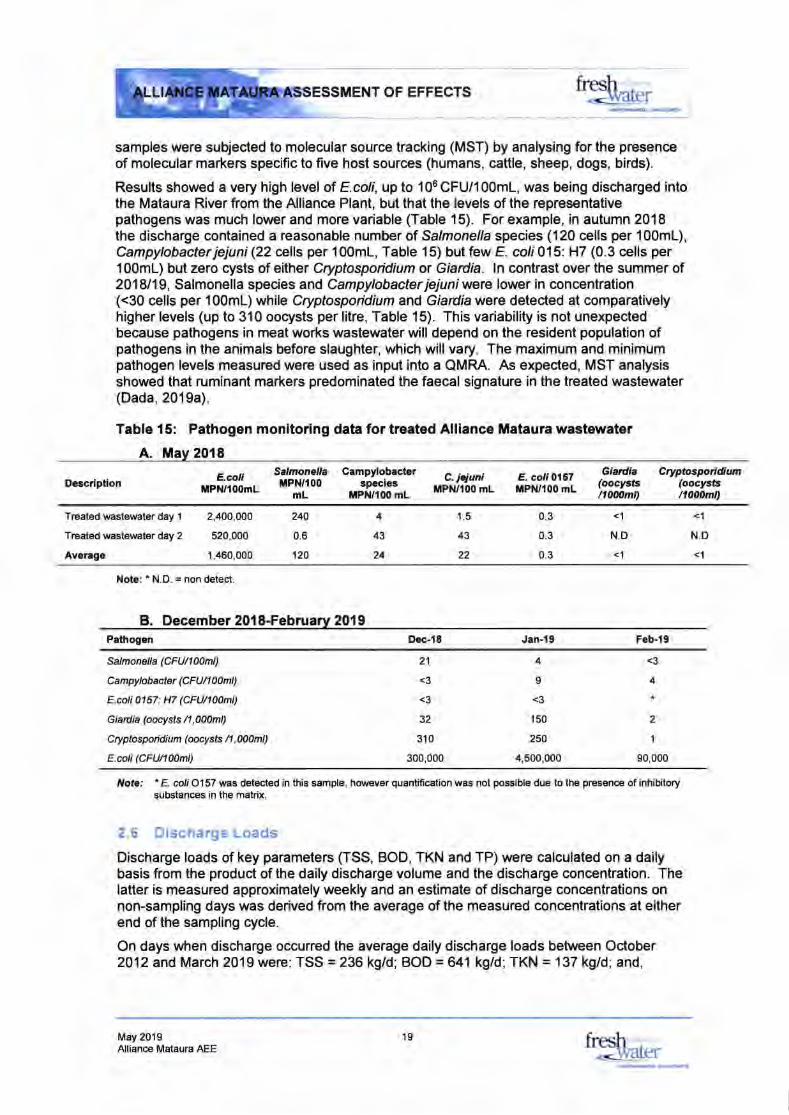
ENT OF EFFECTS
samples were subjected to molecular source tracking (MST) by analysing for the presen@of molecular markers specific to five host sources (humans, cattle, sheep, dogs, birds).
Results showed a very high level of E.coli, up to 106 CFU/100mL, was being discharged intothe Mataura River from the Alliance Plant, but that the levels of the representativepathogens was much lower and more variable (Table 15). For example, in autumn 2018the discharge contained a reasonable number of Salmonella species (120 cells per 100mL),Campylobacter jejuni (22 cells per 100mL, Table 15) but few E. coli015: H7 (0.3 cells per100mL) but zero rysts of either Cryptosporidium or Giadia. ln contrast over the summer of2018119, Salmonella species and Campylobacter jejuniwere lower in concentration(<30 cells per 100mL) while Cryptosporidium and Giadia were detected at comparativelyhigher levels (up to 310 oocysts per litre, Table 15). This variability is not unexpectedbecause pathogens in meat works wastewater will depend on the resident population ofpathogens in the animals before slaughter, which willvary. The maximum and minimumpathogen levels measured were used as input into a QMRA. As expected, MST analysisshowed that ruminant markers predominated the faecal signature in the treated wastewater(Dada,2019a).
Table l5: Pathogen monitoring data for treated Alliance Mataura wastewater
A. May 2018
fuesh-<lMatrr
De*ription E.coliXlPNrl00mL
SalmonellaMPN/IOO
mL
Campylobacterspecier
trlPN/100 mL
C. jeiuntllPN/100 mL
E. coli 0157f,lPlUl00 mL
Gia'dia(oocl6tsn0@m0
Cty,p.tospotidum@ocysfsnO@m0
Treated wastewater day'l
Treated wastewater day 2
Average
2,400,000
52o,OOO
1,460,000
240
0.6
120
1.5
43
22
4
43
24
0.3
0.3
0.3
<,1
N.D
<1
<,|
N.D
<'l
Note: 'N.D. = non detect.
B. December 2Ol8-February 2019Pathogen Dec-i8 Jan-19 Feb-i9
Salmonella (CFU/100m1)
Ca mpylobacte r (CF U /1 00ml)
E.ali 0157: H7 (CFU/100m1)
Giadia (oooysts /1,000m0
Cry ptospoidi u m (oocy sts /1, 000n1)
E.coli (CFU/I00m1)
21
<3
<3
32
310
4
I<3
150
250
4,500,000
<3
4
2
1
90,000300,000
ilote.' ' E. cp/li 0157 was detected in this sample, however quantification was not possible due to the presenoe of inhititorysubstances in the matrix.
2.6 Discharge Loads
Discharge loads of key parameters (TSS, BOD, TKN and TP) were calculated on a dailybasis from the product of the daily discharge volume and the discharge concentration. Thelatter is measured approximately weekly and an estimate of discharge concentrations onnon-sampling days was derived from the average of the measured concentrations at eitherend of the sampling rycle.
On days when discharge occurred the average daily discharge loads between October2012 and March 2019 were: TSS = 236 kg/d; BOD = 641 kg/d; TKN = 137 kg/d; and,
May 2019Alliance Mataura AEE
19 fresh_-vrarcr
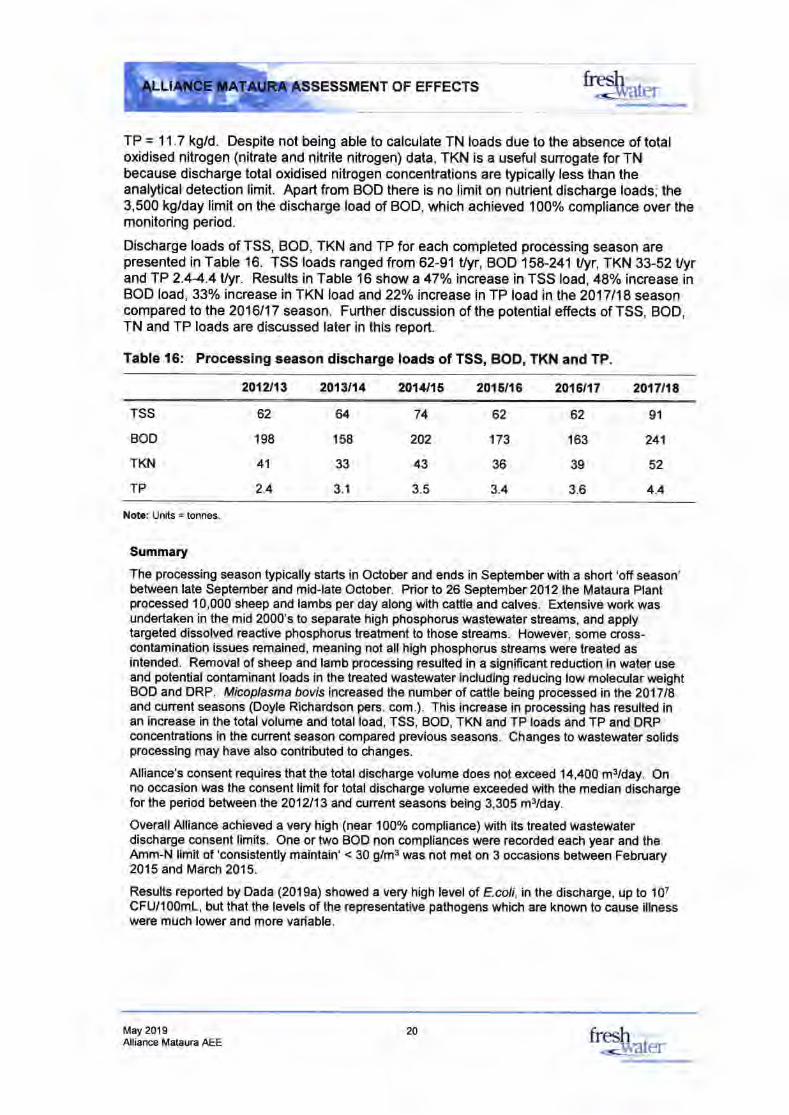
NT OF EFFECTS
TP = 11.7 kg/d. Despite not being able to calculate TN loads due to the absence of totaloxidised nitrogen (nitrate and nitrite nitrogen) data, TKN is a useful surrogate for TNbecause discharge total oxidised nitrogen concentrations are typically less than theanalytical detection limit. Apart from BOD there is no limit on nutrient discharge loads; the3,500 kg/day limit on the discharge load of BOD, which achieved 100o/o compliance over themonitoring period.
Discharge loads of TSS, BOD, TKN and TP for each completed processing season arepresented in Table 16. TSS loads ranged from 62-91llyr, BOD 158-241Uyr, TKN 33-52 Uyrand TP 2.44.4 Uyr. Results in Table 16 show a 47o/o increase in TSS load, 48o/o increase inBOD load, 33% increase in TKN load and 22o/oincrease in TP load in hhe2017118 seasoncompared to the 2016117 season. Further discussion of the potential effects of TSS, BOD,TN and TP loads are discussed later in this report.
Table 16: Processing season discharge loads of TSS, BOD, TKN and TP.
firesh ,.
<rwaler
2012t13 2013t14 2014t15 2015t16 2016t17 2017t18
TSS
BOD
TKN
TP
62
198
41
2.4
a4
158
33
3.1
74
202
43
3.5
62
173
36
3.4
62
163
39
3.6
91
241
52
4.4
Note: Units = tonnes.
Summary
The processing season typically starts in October and ends in September with a short 'off season'between late September and mid-late October. Prior to 26 September 2012 the Mataura Plantprocessed 10,000 sheep and lambs per day along with cattle and calves. Extensive work wasundertaken in the mid 2000's to separate high phosphorus wastewater streams, and applytargeted dissolved reactive phosphorus treatment to those streams. However, some cross-contamination issues remained, meaning not all high phosphorus streams were treated asintended. Removal of sheep and lamb processing resulted in a significant reduction in water useand potential contaminant loads in the treated wastewater including reducing low molecular weightBOD and DRP. Micoplasma bovis increased the number of caftle being processed in the 20'1718and cunent seasons (Doyle Richardson pers. com.). This increase in processing has resulted inan increase in the totalvolume and totalload, TSS, BOD, TKN and TP loads and TP and DRPconcentrations in the cunent season compared previous seasons. Changes to wastewater solidsprocessing may have also contributed to changes.
Alliance's consent requires that the total discharge volume does not exceed 14,400 m3/day. Onno occasion was the consent limit for total discharge volume exceeded with the median dischargefor the period between lhe 2012113 and cunent seasons being 3,305 m3/day.
OverallAlliance achieved a very high (near 100% compliance) with its treated wastewaterdischarge consent limits. One or two BOD non compliances were recorded each year and theAmm-N limit of 'consistently maintain' < 30 g/m3 was not met on 3 occasions between February2015 and March 2015.
Results reported by Dada (2019a) showed a very high level of E.coli, in the discharge, up to 107CFU/100mL, but that the levels of the representative pathogens which are known to cause illnesswere much lower and more variable.
May 2019Alliance Mataura AEE
20 freshwater
ENT OF EFFECTS
3.0 Water Quality Effects
3.1 lntroduction
The following assessment draws on a comparison of monitoring data at the upstream site(Hydro-race) and downstream site (Bridge) between 1 November 2012 and 12 March 2019,continuous dissolved orygen and temperature surveys upstream and downstream of thedischarge, site specific monitoring at Sites U1, U2, Dl and D2, continuous temperaturemonitoring upstream and downstream of the take and longitudinal water quality surueyresults.
The water quality parameters are compared with the relevant water quality standards andguidelines in the SWLP for the Mataura River, NPS-FM (2017) limits, various MfEguidelines and ANZECC (2000) guidelines for fresh and marine water (Iable 17). The Plantlies within the Mataura 3 classification in the SWLP which are the Prctected Waterc otherthan those pafts classified as Mataun 1 (NZMS 260 F45:967-503 to F45:963-fi8) andMataura 2 (between map rcfercnces NZMS 260 F45:894-581 to F45:88*584 and NZMS260 F46:917-391 to F46:924-396).
A healthy river is a river that meets the NPS-FM, SWLP, MfE and ANZECC guidelines.
The potential and in some cases actual effects of the discharge on the receiving waterquality that are assessed in this report are presented in Table 18 and include:
. Ammoniacal-N (Amm-N) toxicity.
o lncreased nutrientconcentrations.
r Increased bacteria concentrations.
o Reduced dissolved orygen (DO) concentrations.
r Altered colour and clarity.
o Generation of foams and scums.
The potentialeffects assessed in this report and summarised in Table 18 were identifiedthrough analysis of the available discharge and receiving environment data. A briefsummary of the nature and extent of these potential effec{s is set out below and is followedby a detailed assessment.
May 2019
ftrestr ,warcr
Alliance Mataura AEE21 fresh l
water
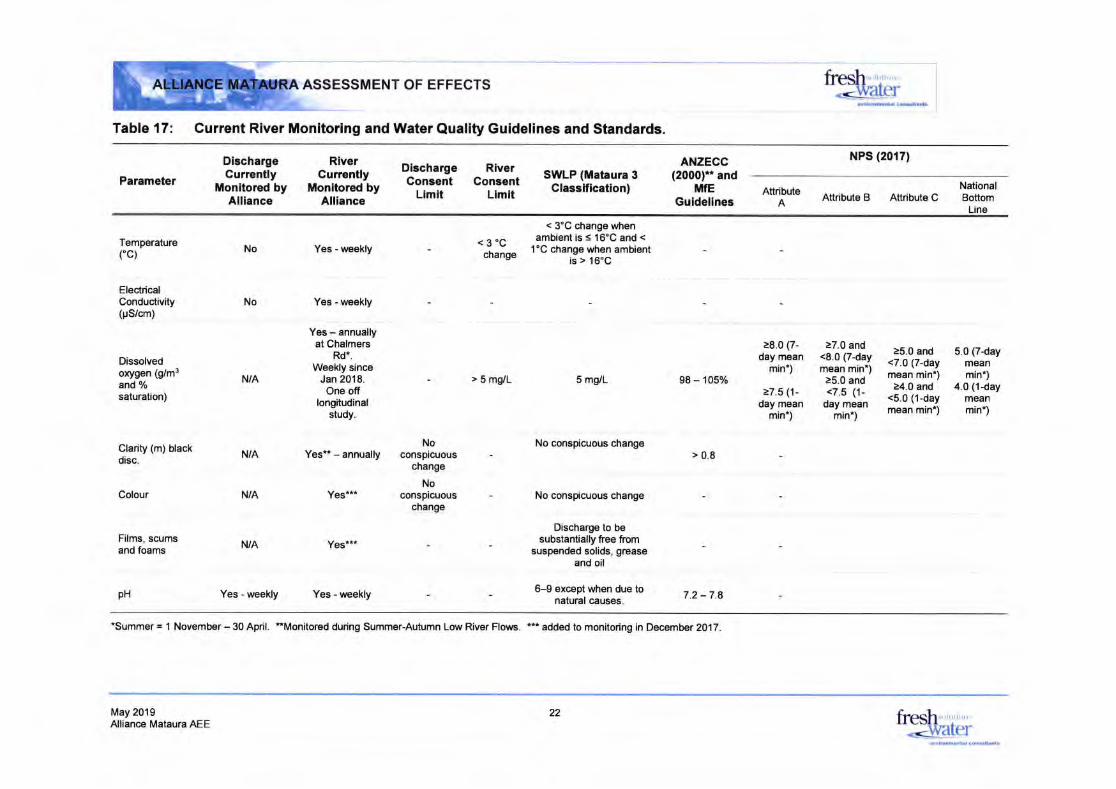
ASSESSMENT OF EFFECTS
Table 17: Current River Monitoring and Water Quality Guidelines and Standards.
fresh.<wutler
..vroo6rt.r !on!!lrrtrb
Parameter
DlschargeCurrently
Monitored byAlllance
RiverCurrently
Monitored byAlliance
ANZECC(2000)* and
tUTfE
Guldellnes
NPS (2017)DischargeConsent
Llmlt
RiverConsent
Limit
SWLP (Mataura 3Classlflcation) Attribute National
BottomLine
Attribute B Attribute CA
('c)Temperature
EleclricalConductivity(!S/cm)
Dissolvedorygen (g/m3and o/o
saturation)
Clarity (m) blackdisc.
Colour
Films, scumsand foams
pH
No Yes - weekly
No Yes - weekly
< 3'Cchange
< 3"C change whenambient is s '16'C and <
1"C change when ambientis > 16"C
N/A
Yes - annuallyat Chalmers
Rd*.Weekly since
Jan 2018.One off
longitudinalstudy.
Yes** - annually
Ygst**
> 5 mg/L 98 - 105%
> 0.8
7.2 -7.8
>8.0 (7-day mean
min*)
>7.5 (1-day mean
min')
>7.0 and<8.0 (7-daymean min'):5.0 and<7.5 (1-
day meanmin-)
>5.0 and<7.O (7-daymean min*)
>4.0 and<5.0 (1-daymean mint)
5.0 (7-daymeanmin*)
4.0 (1-daymeanmin*)
5 mg/L
No conspicuous change
No conspricuous change
Discharge to besubstantially free from
suspended solids, greaseand oil
6-9 except when due tonatural causes.
N/A
N/A
N/A
Noconspicuous
change
Noconspicuous
change
Yes***
Yes - weekly Yes - weekly
'Summer = 'l November - 30 April. *Monitored during Summer-Autumn Low River Flows. '** added to monitoring in December 2017
May 2019Alliance Mataura AEE
22 fresh-<\A/Atef
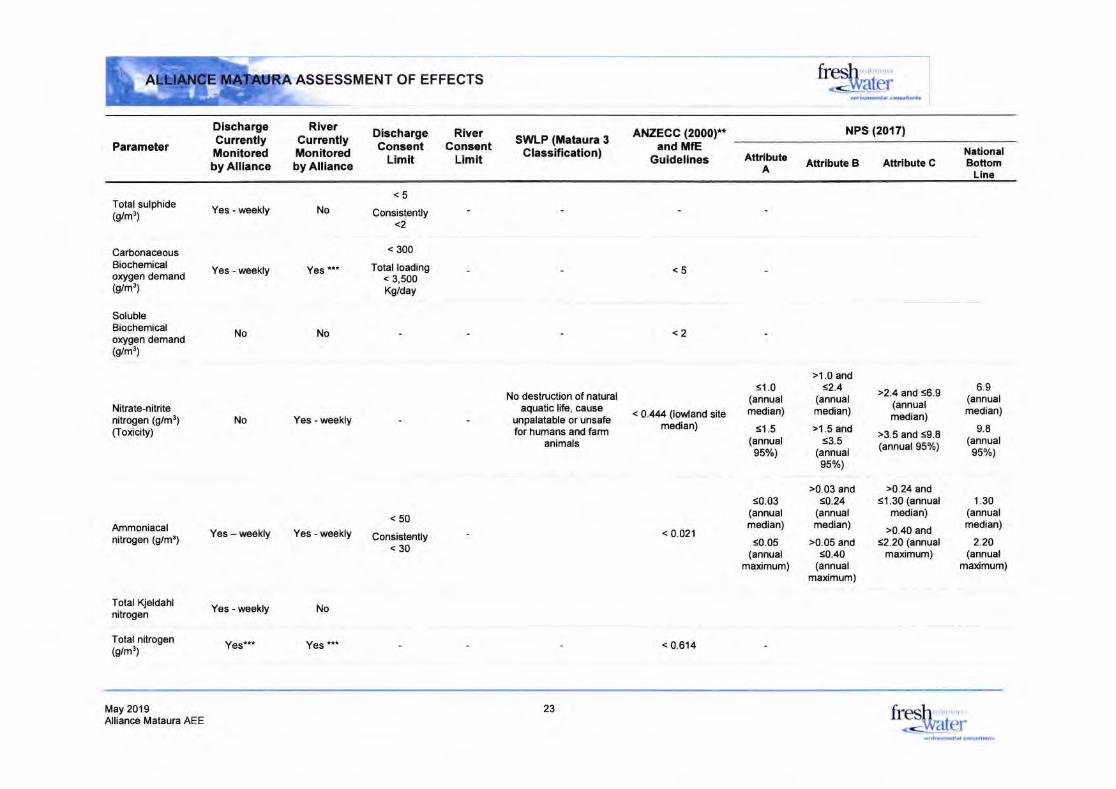
ASSESSMENT OF EFFECTS frestr.<llaler
[email protected] Ldtrrutt!.b
DischargeCurrentlyMonitoredby Alliance
RiverCurrentlyMonitoredby Alllance
DlschargeConsent
Limit
RiverConsent
Limit
SWLP (Mataura 3Classlfication)
ANZECC (2000)Hand MfE
Guidelines
NPS (2017)
ParameterAftribute National
BottomLine
Attribute B Attribute CA
Total sulphide(g/m')
CarbonaceousBiochemicalorygen demand(s/m')
SolubleBiochemicalorygen demand(s/m3)
Nitrate-nitritenitrogen (g/m3)
Ooxicity)
Ammoniacalnitrogen (g/m!)
Total Kjeldahlnitrogen
Total nitrogen(dm')
Yes - weekly No
Yes - weekly Yes **'
No Yes - weekly
Yes - weekly Yes - weekly
NoNo
<5
Consistently<2
< 300
Total loading< 3,500Kg/day
<50
Consistently<30
No destruciion of naturalaquatic life, cause
unpalatable or unsafefor humans and farm
animals
<5
<2
< 0.194 (lowland sitemedian)
< 0.021
<1.0(annualmedian)
<1.5(annual95%)
s0.03(annualmedian)
s0.05(annual
maximum)
>1.0 ands2.4
(annualmedian)
>1.5 and<3.5
(annual95%)
>0.03 andso.24
(annualmedian)
>0.05 ands0.40
(annualmaximum)
>2.4 and <6.9(annualmedian)
>3.5 and s9.8(annual 95%)
>O.24 ands1.30 (annual
median)
>0.40 and<2.20 (annual
maximum)
6.9(annualmedian)
9.8(annual
957o)
1.30(annualmedian)
2.20(annual
maximum)
Yes - weekly No
Yes*** Ygs t**
23
< 0.614
eilvrrdm..lrl.oirutrdt!
May 2019Alliance Mataura AEE fresh
-<vyAter
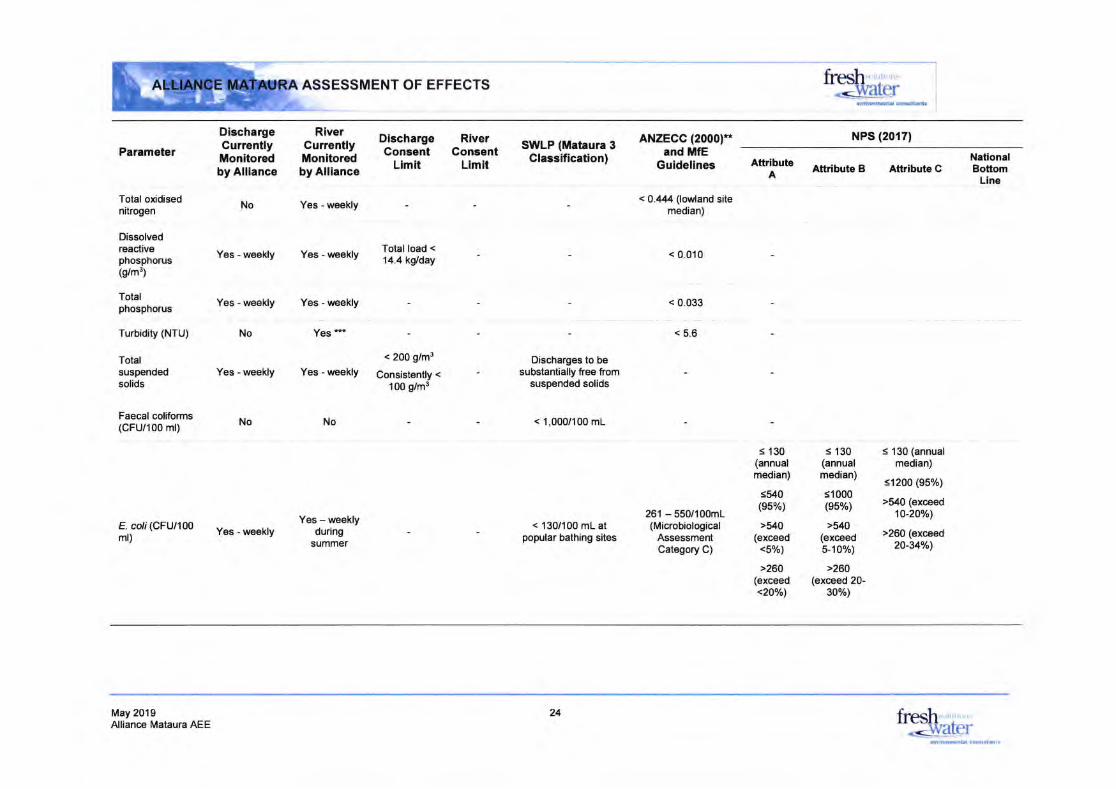
ASSESSMENT OF EFFECTS fi'.,esh .
.<l&ILer.n{E..l$td .sili.rb
DischargeCurrentlyMonitoredby Alliance
RiverCurrentlyMonitoredby Alllance
DischargeConsent
Limit
RiverGonsent
Limit
SWLP (Mataura 3Classification)
Discharges to besubstantially free fiom
suspended solids
< 1,000/100 mL
< 130/100 mL atpopular bathing sites
ANZECC (2000)*and lrlfE
Guidellnes
< 0.444 (lo,Y,land sitemedian)
< 0.010
< 0.033
< 5.6
261 - 550/100mL(Microbiological
AssessmentCategory C)
NPS (2017)Parameter
Total oxidisednitrogen
Dissolvedreactivephosphorus(dm3)
Totalphosphorus
Turbidity (NTU)
Totalsuspendedsolids
Faecal coliforms(CFU/I00 ml)
E. coll (CFU/100ml)
Attribute
s 130(annualmedian)
<540(s5%)
>540(exceed
<5o/ol
>260(exceed<2oo/o)
Attribute B Attribute CNationalBottom
LineA
No Yes - weekly
Yes - weekly Yes - weekly Total load <14.4 kglday
Yes - weekly Yes - weekly
No Yes ***
< 200 g/m3
Yes - weekly Yes - weekly Consistenly <
100 g/m3
No
Yes - weeklyYes - weekly
duringsummer
No
s 130(annualmedian)
<1000(e5%)
>540(exceed5-10Yol
>260(exceed 20-
30%o)
< 1 30 (annualmedian)
s1200 (95o/o)
>t40 (exceed10-20%l
>260 (exceed20-34o/o)
May 2019Alliance Mataura AEE
24 fresh.<\ /ater
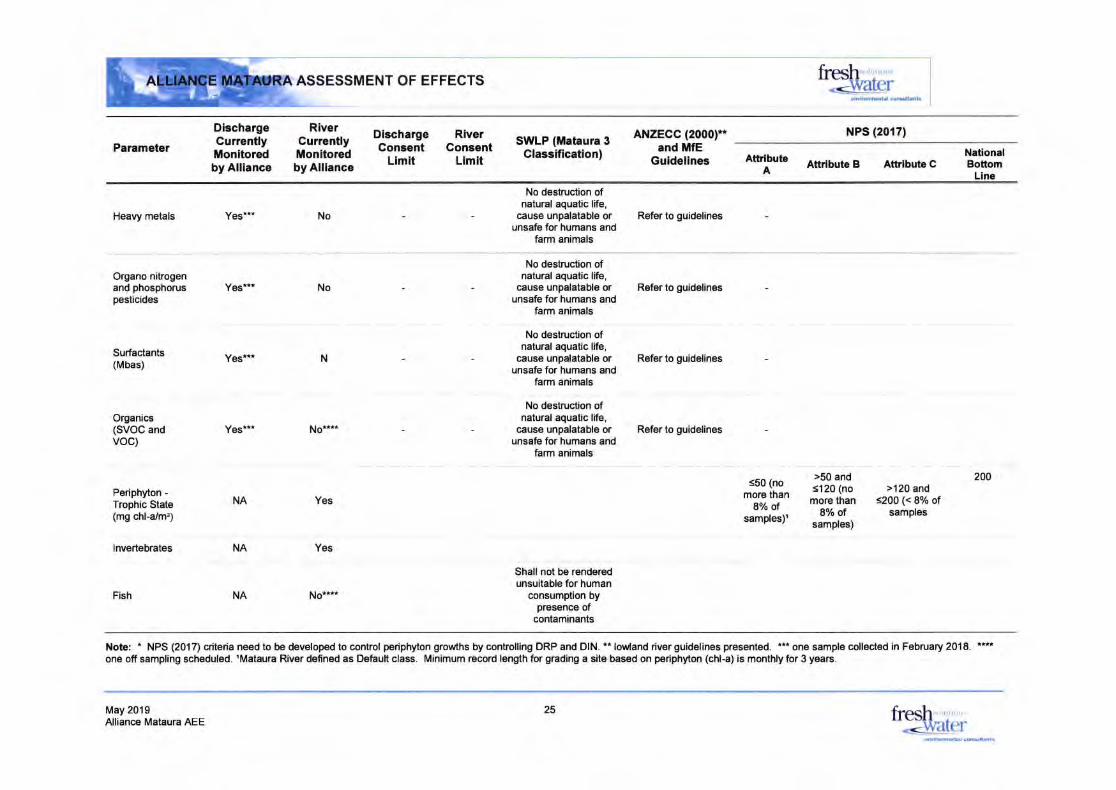
ASSESSMENT OF EFFECTS fresh*-wil!er
envnontrE.t.l con.ut.nb
DischargeCurrentlyMonitoredby Alliance
RiverCurrentlyMonltoredby Alllance
DischargeConsent
Llmit
RiverConsent
Limit
SWLP (Mataura 3Classification)
ANZECC (2000)sand MfE
Guldellnes
NPS (2017)
ParameterAttribute National
BottomLine
Attribute B Attribute CA
Heavy metals
Organo nitrogenand phosphoruspesticides
Surfactants(Mbas)
Organics(SVOC andvoc)
Periphyton -Trophic State(mg chl-a/m,)
Ygst*'
Ygs*t*
No
N
No
No destruction ofnatural aquatic life,
cause unpalatable orunsafe for humans and
farm animals
No destruction ofnatural aquatic life,
cause unpalatable orunsafe for humans and
farm animals
No destruction ofnatural aquatic life,
cause unpalatable orunsafe for humans and
farm animals
No destruction ofnatural aquatic life,
cause unpalatable orunsafe for humans and
farm animals
Refer to guidelines
Refer to guidelines
Refer to guidelines
Refer to guidelines
s50 (nomore than
8%olsamples)'
>50 and<120 (nomore than
8o/o olsamples)
>120 and<200 (< 8% of
samples
200
NA
NA
NA
Yes
lnvertebrates Yes
Fish No**r
Shall not be renderedunsuitable for human
consumption bypresence of
contaminants
oll olt.mdlng lchldul.d. r rlllr. FiE&fn.d.s [r.hu[ cla... Minimuh Ecod l.ngth ior gEding !.it !€..d or Fiptr (ci{{) i! mcfily E 3 F.ll.
May 2019 fresh.<lvAterAlliance Mataura AEE
25
.nrrsm!{,tdl (o..uhanr!
l-l} -: ESSMENT OF EFFECTS
Amm-N
Elevated Amm-N has the potential to be toxic to a range of aquatic organisms and cancontribute significantly to nitrogen enrichment (Richardson 1997). Table 19 provides asummary of acute toxicity mortality data for short-term experiments for a number of NewZealand species (Richardson 1997; Hickey and Vickers, 1994), including eels and othernative fish, and a range of macroinvertebrates. The most sensitive species areinvertebrates including the mayflies Deleatidium and Zephlebia dentata, the amphipodParccalliope fluviatilis, the stonefly Zelandobius furcillatus and the clam Sphaeiumnovaezelandiae, and the caddisfly Pycnocentia evecta.
ln a recent paper, Cleanrater et al. (2013) also provided results of acute toxicity tests withglochidia (early larval stage that is parasitic on a host fish) of the New Zealand freshwatermussel Echyidella menziesii, which showed they were relatively sensitive with a 48-hrNOEC (No Observed Effect Concentration) of 8-10 mg total Amm-N-1 (pH 7.8).
Freshwater Solutions (2014) provides chronic Amm-N levels for various species from anumber of studies. Data has also been reported for Deleatidium, which is a ubiquitousmayfly throughout the Mataura River, where the No Observed Effects Concentration(NOEC) levels over a 29-day period were 1.3 mg/L at pH=8/20oC (Hickey et al. 1999) andthe clam Sphaerium novaezelandrae, which was more sensitive with a chronic level over 60days of 0.57 mg/L (Hickey and Martin 1999).
Hence, depending on concentrations the Amm-N concentration in the discharge has thepotentialto cause adverse effects in the mixing zone through chronic and acute toxicity, aswell as result in non-toxic effects such as adversely affecting fish migration in the mixingzone. !n addition, discharge Amm-N contributes to nitrogen loadings in the lower MatauraRiver and Toetoes Estuary.
Nutrients
Dissolved nitrogen and phosphorus can cause nuisance algalgrowths in some rivers (MFE2000) while total phosphorus (IP) and total nitrogen (TN) can result in eutrophicationeffec{s such as nuisance macrophyte and macroalgal growths in the lower reaches of riversand in estuaries (NIWA 2007, NIWA 2012).
The nitrogen and phosphorus load in the discharge has the potential to contribute toadverse cumulative effects as a result of elevated background nutrient concentrations in theMataura River and the Toetoes Estuary. These effects are a result of point source as wellas the input of nutrients from the wider catchment which will impact on the lower MatauraRiver (e.9., cyanobacteria blooms) and the Toetoes Estuary (e.9., macroalgaeproliferations).
Microbial
Bacteria have the potentialto cause human health issues (MFUMoH 2003) directly throughcontact recreation and indirectly through contamination of fish and shellflsh. MfE (2017) setout the following E. colilevels across various swimming categories:
o Excellent: < 5% exceedance of > 540 E coli/100 mL.
o Good: 5 - 10 % exceedance of > 540 E. colil100 mL.
. Fair: 10 - 20 % exceedance of > 540 E cof7100 mL.
e lntermittent: 20 - 30 o/o exceedance of > 540 E. colill0O mL.
o Poor: > 30 o/o exceedance of > 540 E. colill00 mL.
May 2019Alliance Mataura AEE
26 fresh ,'- .\ /zrcr
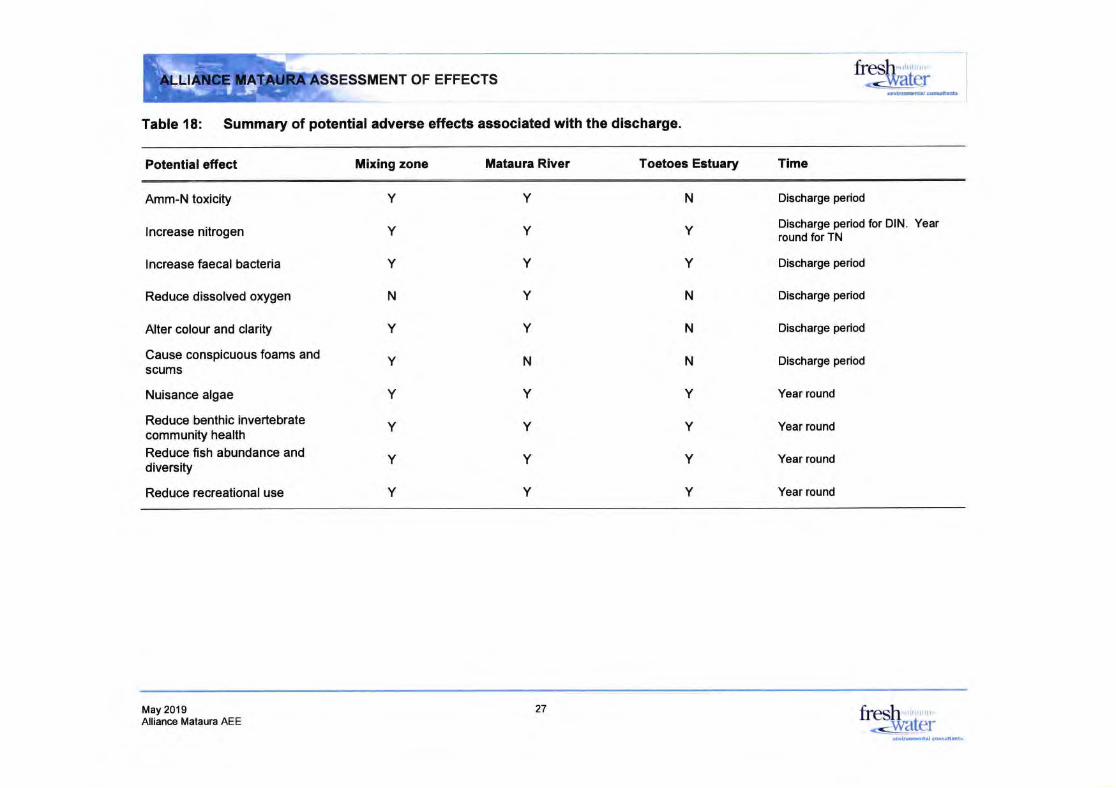
J -lr-.: ESSMENT OF EFFECTS
Table 18: Summary of potential adverse effects associated with the discharge.
H&'
Potentialeffect Mixing zone Mataura River Toetoes Estuary Time
Amm-N toxicity
lncrease nitrogen
lncrease faecal bacteria
Reduce dissolved oxygen
Alter colour and clarity
Cause conspicuous foams andscums
Nuisance algae
Reduce benthic invertebratecommunity health
Reduce fish abundance anddiversity
Reduce recreational use
N
Y
Y
N
N
N
Y
Y
Y
Y
Y
Y
Y
Y
Y
N
Y
Y
Y
Y
Y
Y
Y
N
Y
Y
Y
Y
Y
Y
Discharge period
Discharge period for DlN. Yearround for TN
Discharge period
Discharge period
Discharge period
Discharge period
Year round
Year round
Year round
Year round
May 2019Alliance Mataura AEE
27 fresh<lvater
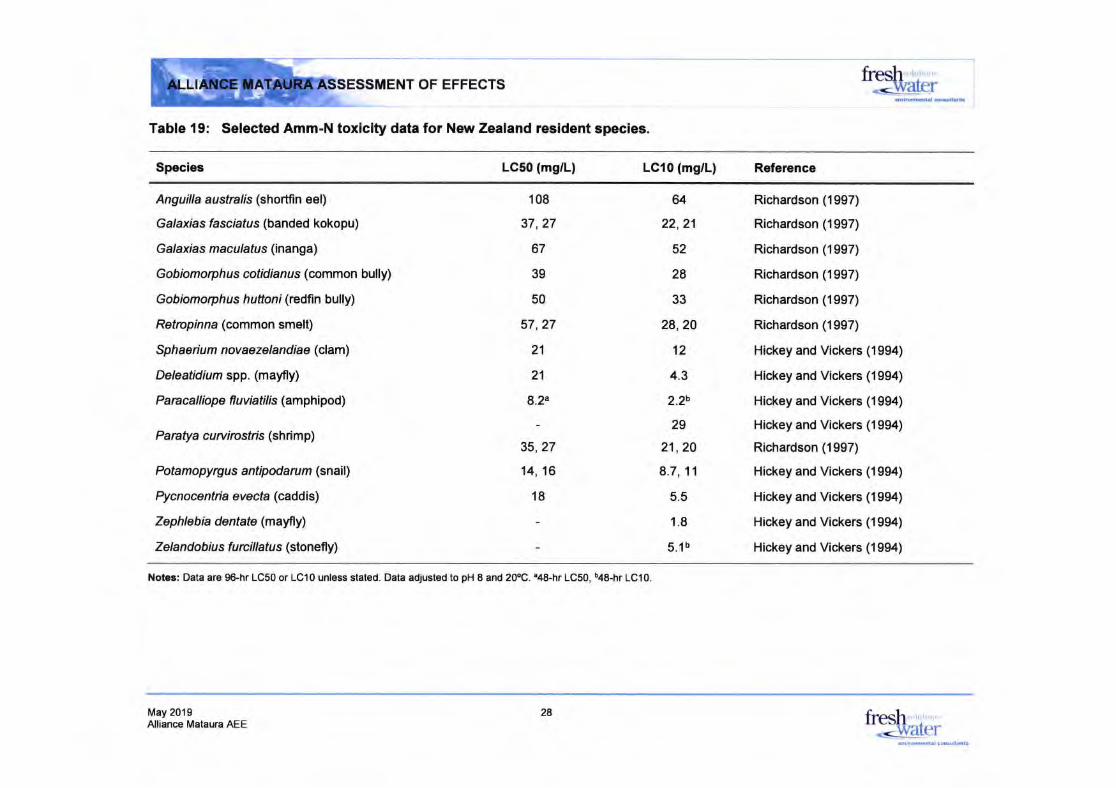
ESSMENT OF EFFECTS
Table l9: Selected Amm-N toxicity data for New Zealand resident species.
Wat"i
Species LC50 (mg/L) LCl0 (mg/L) Reference
Anguilla austnlis (shortfin eel)
G al axias fasc iatu s (banded kokopu)
G alaxia s m ac ulatu s (inanga)
Gobiomoryhus cotidianus (common bully)
Gobiomoryh u s h utton i (redfi n bully)
Retrcpinna (common smelt)
Sph ae i u m novaeze I an di ae (clam)
Dele atid i u m spp. (mayfly)
Pa ncall iope fl uviatil is (amphipod)
Pantya curuircstris (shrimp)
Pota mopyrg u s antipoda rum (snail)
Pycnocenti a evecta (caddis)
Zephlebia dentate (mayfly)
Zelandobi u s f u rcillatu s (stonefl y)
108
37,27
67
39
50
57,27
21
21
8.2a
64
22,2',1
52
28
33
28,20
't2
4.3
2.2b
29
21,20
8.7, 11
5.5
1.8
5.1b
35,27
14,16
18
Richardson (1997)
Richardson (1997)
Richardson (1997)
Richardson (1997)
Richardson (1997)
Richardson (1997)
Hickey and Vickers (1994)
Hickey and Vickers (1994)
Hickey and Vickers (1994)
Hickey and Vickers (1994)
Richardson (1997)
Hickey and Vickers (1994)
Hickey and Vickers (1994)
Hickey and Vickers (1994)
Hickey and Vickers (1994)
Notee: Data are 96-hr LC50 or LC10 unless stated. Data adjusted to pH I and 20oC. %8-hr 1C50, b48-hr 1C10.
May 2019Alliance Mataura AEE fresh .
-<l&'a[er
28
..!trhfi .nt.l .onru(..1!
\rtq* J _Ir=:ENT OF EFFECTS
The background faecal indicator bacteria concentrations in the Mataura River and theToetoes Estuary are elevated. There are a number of designated bathing areas in thelower Mataura River and contact recreation in the form of trout fishing, salmon fishing, whitebaiting, eelfishing and game bird hunting is common. The Toetoes Estuary is an importantarea for fishing and contact recreation and as a consequence the faecal indicator bacteriaload in the discharge has the potential to adversely affect humans. Refer to Section 3 andAppendix 1 for the assessment of microbial related effects of the discharge.
Dissolved Oxygen
Dissolved orygen is criticalto supporting healthy aquatic ecosystems with concentrationsneeding to be above 5 g/m3 as a minimum over 7 days and above 4 g/m3 as a one dayminimum to avoid adverse effects (NPS-FM 2017\. The discharge has the potentialtocontribute to low summertime DO concentrations in the lower Mataura River that has thepotentialto have an adverse effect on aquatic biota.
Colour, Clarity, Foams and Scums
Wastewater discharges have the potential to have aesthetic effec{s by altering colour andclarity and generating foams and scums (MFE 1994). The Mataura River is heavily used byfishermen and for other recreational purposes including the section of river between theMataura Bridge and Mataura Falls. The amount of recreational use increases the potentialfor the discharge to receive more attention due to potential adverse effects through alteringcolour and clarity and causing the generation of foams and scums.
3.2 Discharge Mixing
The full mixing zone assessment report by Streamlined Ltd (Dada 2019b) is presented inAppendix 2 and summarised below. To define the mixing zone extent, a hydrodynamicmixing model of the Alliance Plant discharge into the Mataura River was constructed andused to simulate river mixing of E coli, which had previously (Dada, 2019) been shown tobe present at elevated concentrations below the Alliance discharge. Over the 200 m-1 kmdistance below the discharge point it was assumed E coliwas conservative (i.e. no die-off).
The EFDC model dilution maps for the Alliance Plant discharge show, as expected, thatwhen the treated effluent is discharged into the river, it does not instantaneously mix withthe receiving water. lnstead, what forms is an effluent plume starting at the outfall aseffluent begins to mix with the Mataura River water. The mixing zone is thus a transitionalarea within the Mataura River in which the treated effluent discharge is graduallyassimilated into the Mataura River.
Because of the high receiving water to Alliance Plant wastewater ratio, the hydrodynamicsof the river and the bank-side discharge mechanism, the discharged water is well mixed inthe receiving environment. The plume does not travel along the river bank or accumulatealong the river bank regardless of the hydrological and wind conditions.
The effect of the discharge is felt at the opposite stream bank within a longitudinal distanceof approximately 50 m from the discharge point, where concentrations gradually begin toincrease as a result of the plume extension.
At a longitudinal distance of approximately 100 m from the discharge point, no furtheranalyte dilution takes place. At sites beyond this 100 m distance, analyte concentrationsdownstream of the discharge remain the same (i.e. more or less the same concentrationsdownstream). This is the point of full mixing.
These results were verified using TP analyte concentrations and similar results wereobtained for the mixing zone - no further analyte dilution takes place at a longitudinaldistance of approximately 100 m from the discharge point.
firesh ,dlertur.dbdltd
May 2019Alliance Mataura AEE fresh lwater
29
frl.lMlco.{(et,
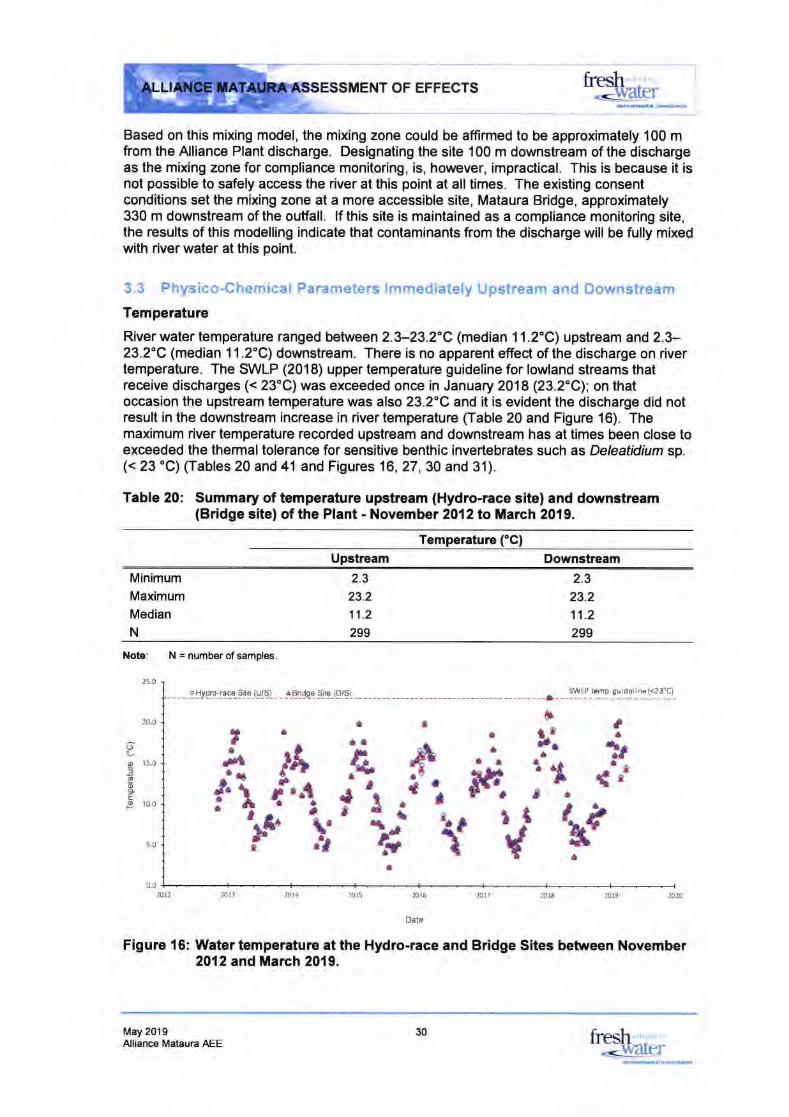
OF EFFECTS
Based on this mixing model, the mixing zone could be affirmed to be approximately 100 mfrom the Alliance Plant discharge. Designating the site '100 m downstream of the dischargeas the mixing zone for compliance monitoring, is, however, impractical. This is because it isnot possible to safely access the river at this point at alltimes. The existing consentconditions set the mixing zone at a more accessible site, Mataura Bridge, approximately330 m downstream of the outfall. lf this site is maintained as a compliance monitoring site,the results of this modelling indicate that contaminants from the discharge will be fully mixedwith river water at this point.
3.3 Physico-Chemical Parameters lmmediately Upstream and Downstream
Temperature
Riverwatertemperature ranged between 2.3-23.2"C (median 11.2"C) upstream and 2.3-23.2"C (median 11.2"C) downstream. There is no apparent effect of the discharge on rivertemperature. The SWLP (2018) upper temperature guideline for lowland streams thatreceive discharges (< 23'C) was exceeded once in January 2018 (23.2"C); on thatoccasion the upstream temperature was also 23.2'C and it is evident the discharge did notresult in the downstream increase in river temperature (Table 20 and Figure 16). Themaximum river temperature recorded upstream and downstream has at times been close toexceeded the thermaltolerance for sensitive benthic invertebrates such as Deleatidium sp.(< 23 "C) flables 20 and 41 and Figures 16,27,30 and 31).
Table 20: Summary of temperature upstream (Hydro-race site) and downstream(Bridge site) of the Plant - November 2012 to March 2019.
Temperature (oC)
Upstream Downstream
firesh ,&!er;;sa*i.M
Minimum
Maximum
Median
N
2.3
23.2
11.2
299
2.3
23.2
11.2
299
Note:
25.0
0.0
a
aa
2015
01nO1a
'r rlat.
N = number of samples.
,a
t20.0
C)
p 1s.0ldooE.o 10.0
.6'fiitr
'lr.n a
la
$r.#i"i
1t{
\ri
?ra-
{f
5.0 !ia
20D 2013 2014 2016 2071 2018 m8 2020
Dale
Figure 16: Water temperature at the Hydro-race and Bridge Sites between November2012 and March 20{9.
May 2019Alliance Mataura AEE
30 fresh 'r ,
.<war€r
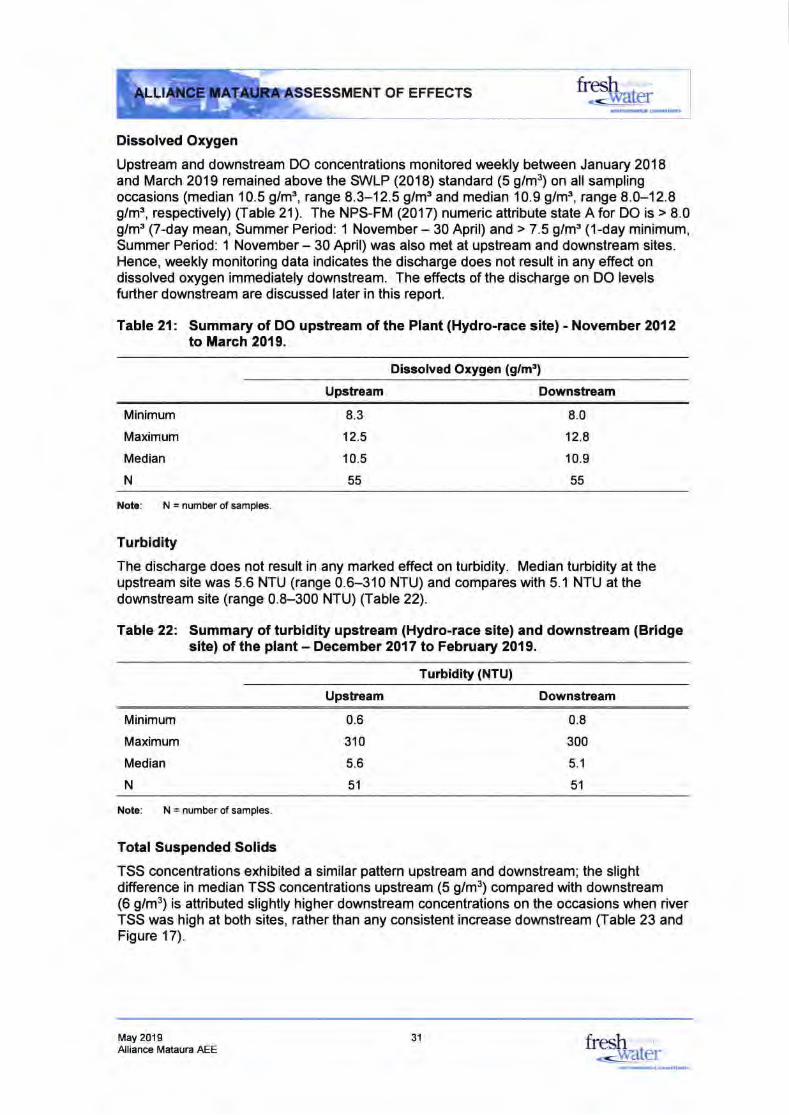
ENT OF EFFECTS
Dissolved Orygen
Upstream and downstream DO concentrations monitored weekly between January 2018and March 2019 remained above the SWLP (2018) standard (5 g/m3) on all samplingoccasions (median 10.5 g/m", range 8.3-12.5 g/ms and median 10.9 g/ms, range 8.0-12.8g/ms, respectively) (Iable 21). The NPS-FM (2017) numeric attribute state A for DO is > 8.0g/ms (7-day mean, Summer Period: 1 November- 30 April) and > 7.5 g/ms (1-day minimum,Summer Period: 1 November - 30 April) was also met at upstream and downstream sites.Hence, weekly monitoring data indicates the discharge does not result in any effecl ondissolved orygen immediately downstream. The effects of the discharge on DO levelsfurther downstream are discussed later in this report.
Table 21: Summary of DO upstream of the PIant (Hydro-race site) - November 2012to March 2019.
Dissolved Oxygen (g/m')
Upstream Downstream
firestr' ,r
.--lilarcr
Minimum
Maximum
Median
N
8.3
12.5
10.5
55
8.0
12.8
10.9
55
Note: N = number of samples.
Turbidity
The discharge does not result in any marked effect on turbidity. Median turbidity at theupstream site was 5.6 NTU (range 0.6-310 NTU) and compares with 5.1 NTU at thedownstream site (range 0.8-300 NTU) (Iable22).
Table22:. Summary of turbidity upstream (Hydro-race site) and downstream (Bridgesite) of the plant - December 2017 to February 2019.
Turbidity (NTU)
Upstream Downstream
Minimum
Maximum
Median
N
0.6
310
5.6
51
0.8
300
5.1
51
Note: N = number of samples.
TotalSuspended Solids
TSS concentrations exhibited a similar pattem upstream and downstream; the slightdifference in median TSS concentrations upstream (5 g/m3) compared with downstream(6 g/m3) is attributed slightly higher downstream concentrations on the occasions when riverTSS was high at both sites, rather than any consistent increase downstream fiable 23 andFigure 17).
May 2019Alliance Mataura AEE
31 fresh , ,
_=+varer
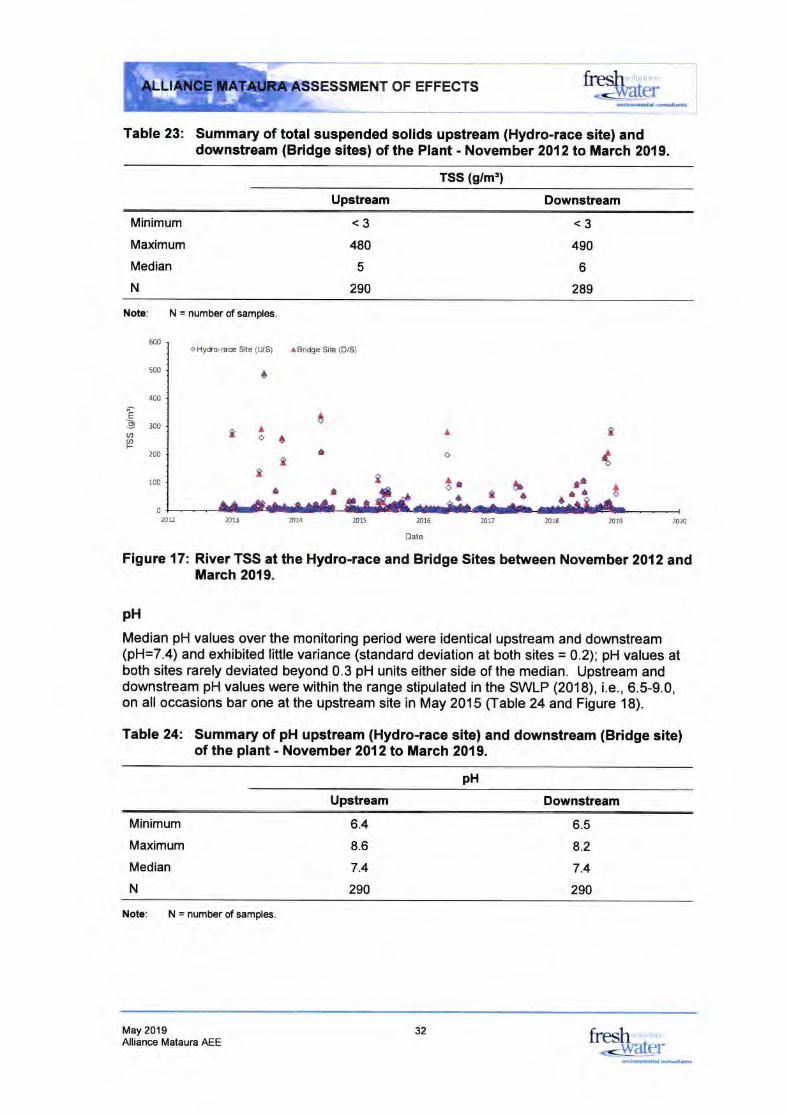
OF EFFECTS
Table 23: Summary of totalsuspended solids upstream (Hydro-race site) anddownstream (Bridge sites) of the Plant - November 2O12to March 2019.
TSS (g/mr)
Upstream Downstream
firesh r '
-darertu.:aM*f_I} -:
\ri,{o
Minimum
Maximum
Median
N
<3
490
6
289
<3
480
5
290
Ao
t
EooaF
Note: N = number of samples.
oHy(ro-rae Site (U/S) ^Bridge
SitB (D/S)
c
It
?o12 20!3 2014 2or_5 2016 ,ot7 2018 2019 2o2o
Date
Figure {7: River TSS at the Hydro-race and Bridge Sites between November 2012 andMarch 2019.
pH
Median pH values over the monitoring period were identical upstream and downstream(pH=7.4) and exhibited little variance (standard deviation at both sites = 0.2); pH values atboth sites rarely deviated beyond 0.3 pH units either side of the median. Upstream anddownstream pH values were within the range stipulated in the SWLP (2018), i.e., 6.5-9.0,on al! occasions bar one at the upstream site in May 2015 (Iable 24 and Figure 18).
Table 24: Summary of pH upstream (Hydro-race site) and downstream (Bridge site)of the plant - November 2O12to March 2019.
pH
Upstream Downstream
600
5m
400
300
200
100
c
t a
A
o
llo
I
tAo
i.ta a
a aN
aI
Minimum
Maximum
Median
N
6.4
8.6
7.4
290
6.5
8.2
7.4
290
Note: N = number of samples.
May 2019Alliance Mataura AEE
32 fresh ''r""".@[er
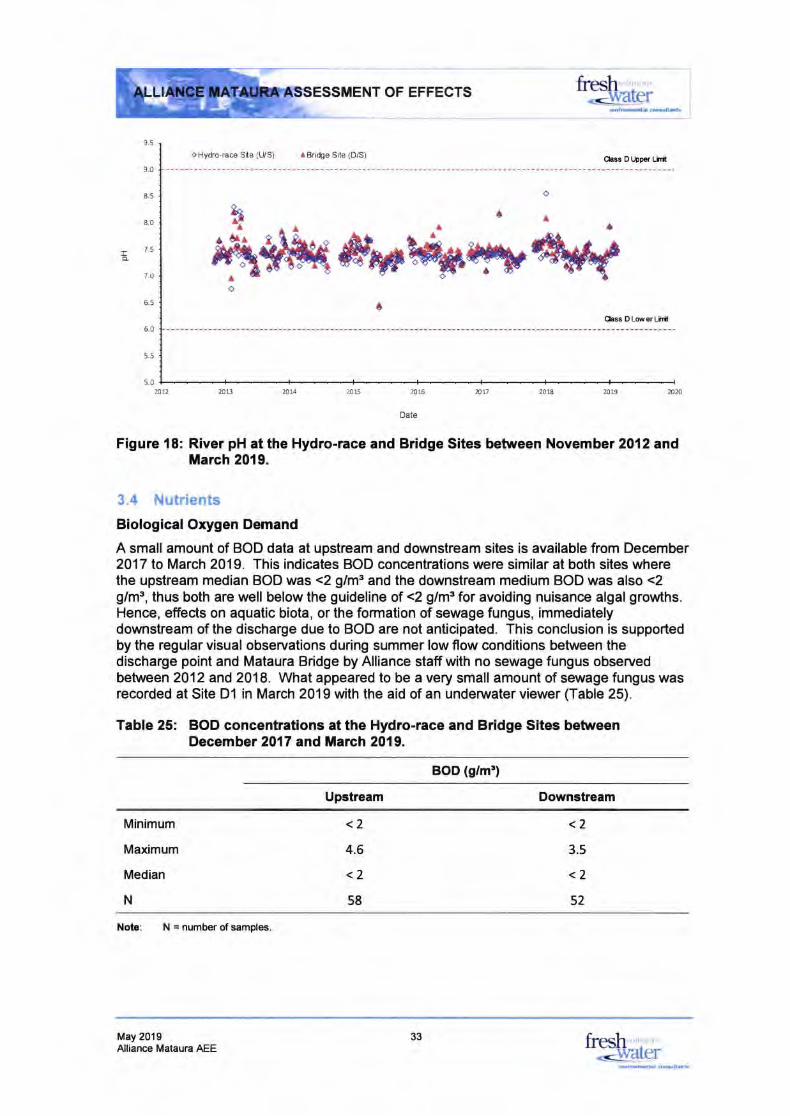
OF EFFECTS fresh--water
dMr.d*dtfr
o Hydro-Ece Site (U/S) ^
Bridge Site (D/S)Chss DthporLht
9.5
9.0
8.0
7.5
7.0
6.5
5.0
5.5
5.0
o
Io
h'^&*\*e#ryt*p&ru,aga6
o
cO$rOLry*Lm
70D 208 zD14 2015 2016 20l7 201E 2019 2020
Date
Figure 18: River pH at the Hydro-race and Bridge Sites between November 2012 andMarch 2019.
3.4 Nutrients
Biological Orygen Demand
A small amount of BOD data at upstream and downstream sites is available from December2017 to March 2019. This indicates BOD concentrations were similar at both sites wherethe upstream median BOD was <2 g/m3 and the downstream medium BOD was also <2g/m3, thus both are wel! below the guideline of <2 g/m3 for avoiding nuisance algal growths.Hence, effects on aquatic biota, or the formation of sewage fungus, immediatelydownstream of the discharge due to BOD are not anticipated. This conclusion is supportedby the regular visual observations during summer low flow conditions between thedischarge point and Mataura Bridge by Alliance staff with no sewage fungus observedbetween 2012 and 2018. What appeared to be a very small amount of sewage fungus wasrecorded at Site Dl in March 2019 with the aid of an undenarater viewer (Table 25).
Table 25: BOD concentrations at the Hydro-race and Bridge Sites betweenDecember 2O17 and March 2019.
BOD (g/mr)
Upstream Downstream
Minimum
Maximum
Median
N
<2
4.6
<2
58
<2
3.5
<2
52
Note: N = number of samples.
May 201 9Alliance Mataura AEE fresh
-<!vater33
evlrdnd.l .o.Nl<
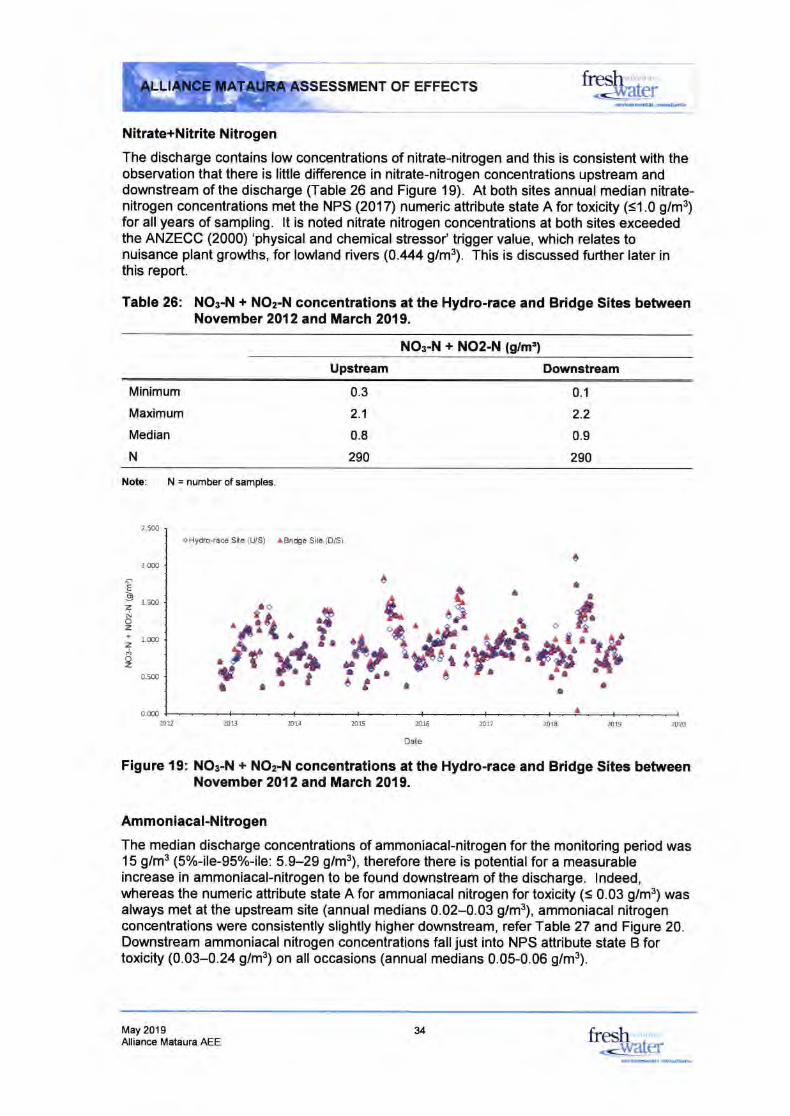
OF EFFECTS
Nitrate+Nitrite Nitrogen
The discharge contains low concentrations of nitrate-nitrogen and this is consistent with theobservation that there is little difference in nitrate-nitrogen concentrations upstream anddownstream of the discharge (Table 26 and Figure 19). At both sites annual median nitrate-nitrogen concentrations met the NPS (2017) numeric attribute state A for toxicity (<1.0 g/m3)for all years of sampling. lt is noted nitrate nitrogen concentrations at both sites exceededthe ANZECC (2000) 'physical and chemical stressol'trigger value, which relates tonuisance plant growths, for lowland rivers (0.444 g/m3). This is discussed further later inthis report.
Table 26: NOo-N + NOz-N concentrations at the Hydro-race and Bridge Sites betweenNovember 2012 and March 2019.
NOc-N + NO2-N (g/m')
Upstream Downstream
firesh' .
-=-waler;rmdicm
Minimum
Maximum
Median
N
0.3
2.1
0.8
290
0.1
2.2
0.9
290
Note: N = number of samples.
oHydro-rae Sfre (US) ^Bridga
Site (D/S)
2_500
2.000
1.500
1.000
0.500
0.000
a"f4'k{
$"
".Tl^rt. it'fllt't'
EIzNoztz
z
c
ac
--:l*la
2012 2013 2074 2015 2016 2!l7 2018 2019 2020
Date
Figure {9: NOr-N + NOz-N concentrations at the Hydro-race and Bridge Sites betweenNovember 2O12 and March 2019.
Ammoniacal-Nitrogen
The median discharge concentrations of ammoniacal-nitrogen for the monitoring period was15 g/m3 (5%-ile-95%-ile: 5.9-29 g/m1, therefore there is potentialfor a measurableincrease in ammoniacal-nitrogen to be found downstream of the discharge. lndeed,whereas the numeric attribute state A for ammoniacal nitrogen for toxicity (< 0.03 g/m3) wasalways met at the upstream site (annual medians 0.02-0.03 g/m3), ammoniacal nitrogenconcentrations were consistently slightly higher downstream, refer Table 27 and Figure 20.Downstream ammoniacal nitrogen concentrations falljust into NPS attribute state B fortoxicity (0.03-0.24 g/m3) on all occasions (annual medians 0.05-0.06 g/m3).
May 2019Alliance Mataura AEE
v fresh 'r "
-_warcr
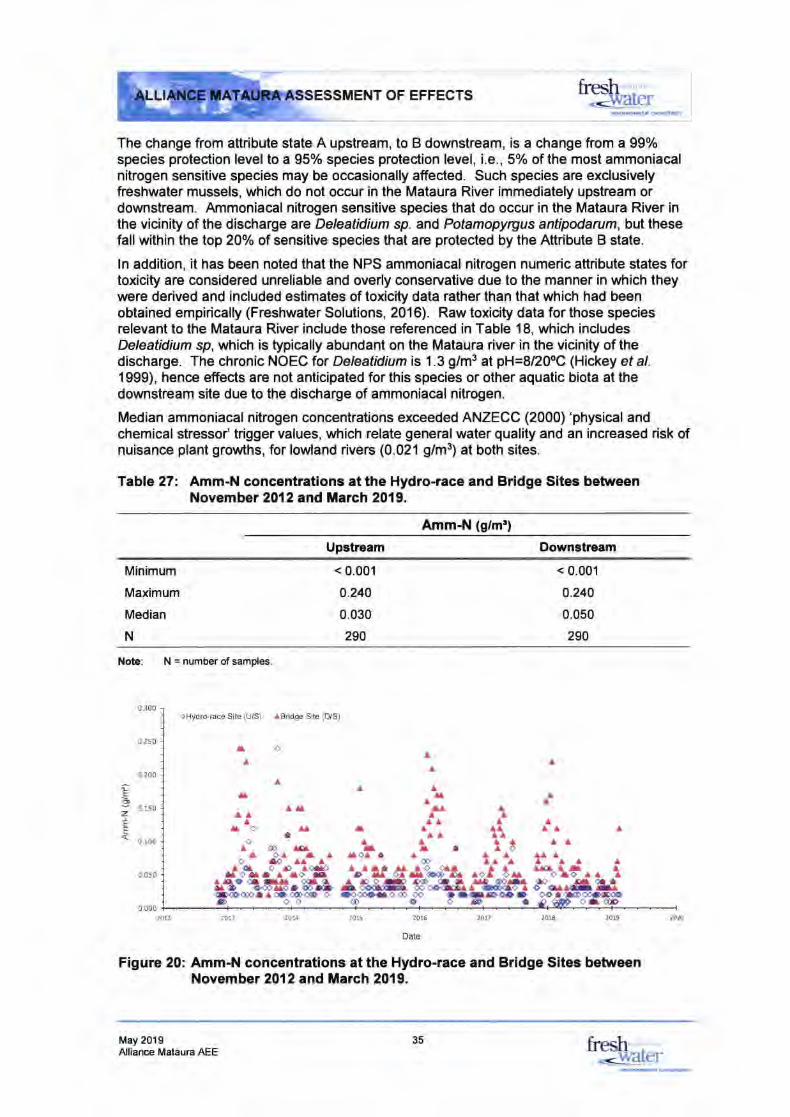
OF EFFECTS
The change from attribute state A upstream, to B downstream, is a change from a 99%species protection level to a 95o/, species protection level, i.e., 5o/o of the most ammoniaca!nitrogen sensitive species may be occasionally affected. Such species are exclusivelyfreshwater mussels, which do not occur in the Mataura River immediately upstream ordownstream. Ammoniacal nitrogen sensitive species that do occur in the Mataura River inthe vicinity of the discharge are Deleatidium sp. and Potamopyrgus antipodarum, but thesefall within the top 2Oo/o of sensitive species that are protected by the Attribute B state.
ln addition, it has been noted that the NPS ammoniacal nitrogen numeric attribute states fortoxicity are considered unreliable and overly conservative due to the manner in which theywere derived and included estimates of toxicity data rather than that which had beenobtained empirically (Freshwater Solutions, 2016). Raw toxicity data for those speciesrelevant to the Mataura River include those referenced in Table 18, which includesDeleatidium sp, which is typically abundant on the Mataura river in the vicinity of thedischarge. The chronic NOEC lor Deleatidium is 1.3 g/m3 at pH=8/20oC (Hickey ef al.1999), hence effects are not anticipated for this species or other aquatic biota at thedownstream site due to the discharge of ammoniacal nitrogen.
Median ammoniacal nitrogen concentrations exceeded ANZECC (2000)'physical andchemical stressol' trigger values, which relate general water quality and an increased risk ofnuisance plant growths, for lowland rivers (0.021 g/m3) at both sites.
Table 27: Amm-N concentrations at the Hydro-race and Bridge Sites betweenNovember 2O12and March 2019.
Amm-N (g/m')
Upstream Downstream
firesh .
-<waler
Minimum
Maximum
Median
N
< 0.001
0.240
0.030
290
< 0.001
0.240
0.050
290
Note: N = number of samples.
oHydro{ace Site (U/S) ^Bndge
Site (D/S)0.300
0.250
0.200
0.150
0.100
0.050
0.000
A
o
A
At A
A
o
A AAA
A
AA I
A Alt
(bo
@AA AO SA A ao(D &a ao^ olaD<t oa a lta <DoEAooooftlaa <Do<lo aoo (DitO&@-<ooDa
,l-trd
zEF
A
/lAAtoo a0/n/lO /lAO/IO A
q O D Otrcaoa^ a ao 3aao ot aa o(l oA(D (}@AOa OrO<Daooootaoooooo o/ID OO
/l Iloa
AD
AA A A Iolo
2011201570a420820D 2016
Date
20u 208
Figure 20: Amm-N concentrations at the Hydro-race and Bridge Sites betweenNovember 2012and March 2019.
Alliance Mataura AEE35 fresh
-<IilA[ T
20n
May 2019
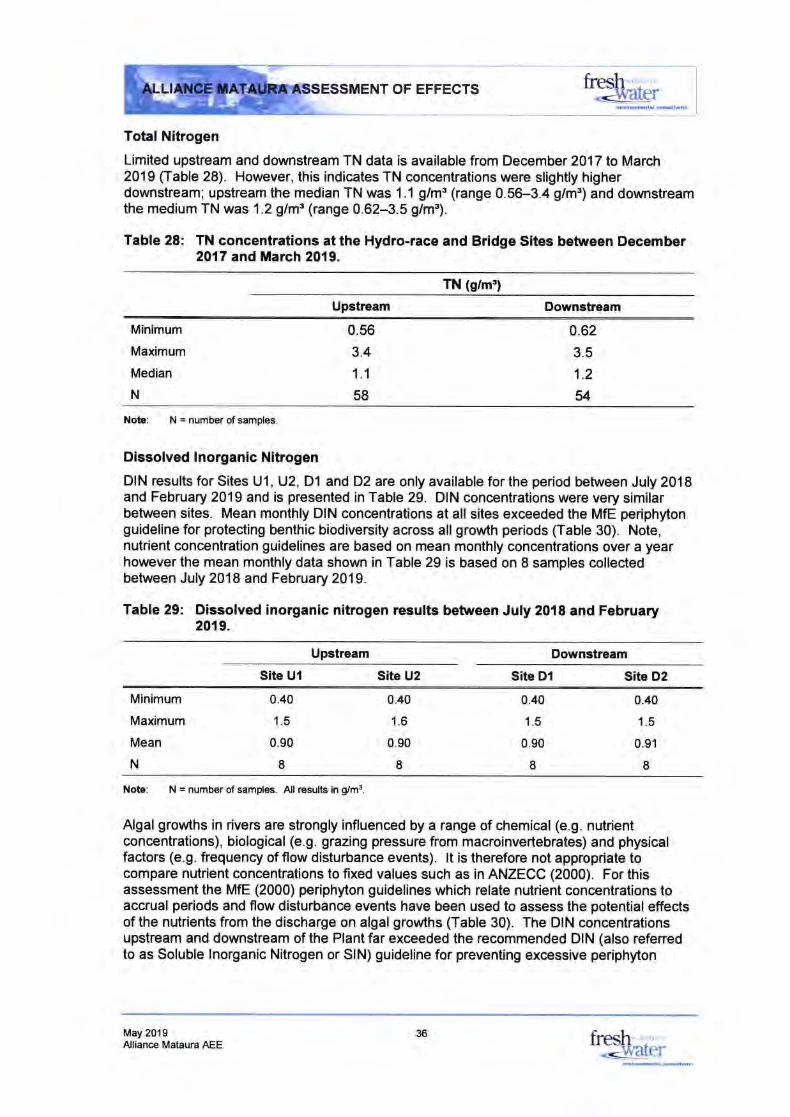
NT OF EFFECTS
Total Nitrogen
Limited upstream and downstream TN data is available from December 2017 to March2019 fiable 28). However, this indicates TN concentrations were slightly higherdownstream; upstream the median TN was 1.1 g/m3 (range 0.56-3.4 g/ms) and downstreamthe medium TN was 1.2 glms (range 0.62-3.5 g/m").
Table 28: TN concentrations at the Hydro-race and Bridge Sites between December2017 and March 2019.
TN (g/m!)
Upstream Downstream
firesh ',dler
Minimum
Maximum
Median
N
0.56
3.4
1.1
58
0.62
3.5
'1.2
ilNote: N = number of samples.
Dissolved lnorganic Nitrogen
Df N results for Sites Ul, U2, Dl and D2 are only available for the period between July 2018and February 2019 and is presented in Table 29. DIN concentrations were very similarbetween sites. Mean monthly DIN concentrations at allsites exceeded the MfE periphytonguideline for protecting benthic biodiversity across all growth periods (Table 30). Note,nutrient concentration guidelines are based on mean monthly concentrations over a yearhowever the mean monthly data shown in Table 29 is based on 8 samples collectedbetween July 2018 and February 2019.
Table 29: Dissolved inorganic nitrogen results between July 2018 and February20.t9.
Upstream Downstream
Site Ui Site U2 Site Dl Site D2
Minimum
Maximum
Mean
N
0.40
1.5
0.90
I
0.40
1.6
0.90
I
0.40
1.5
0.90
I
0.40
1.5
0.91
INote: N = number of samples. All results in g/m3
Algal growths in rivers are strongly influenced by a range of chemical (e.9. nutrientconcentrations), biological (e.9. grazing pressure from macroinvertebrates) and physicalfactors (e.9. frequency of flow disturbance events). lt is therefore not appropriate tocompare nutrient concentrations to fixed values such as in ANZECC (2000). For thisassessment the MfE (2000) periphyton guidelines which relate nutrient concentrations toaccrual periods and flow disturbance events have been used to assess the potential effectsof the nutrients from the discharge on algal growths (Table 30). The DIN concentrationsupstream and downstream of the Plant far exceeded the recommended DIN (also refenedto as Soluble lnorganic Nitrogen or SIN) guideline for preventing excessive periphyton
May 20'19Alliance Mataura AEE
36 fresh r '
--ryvarcr
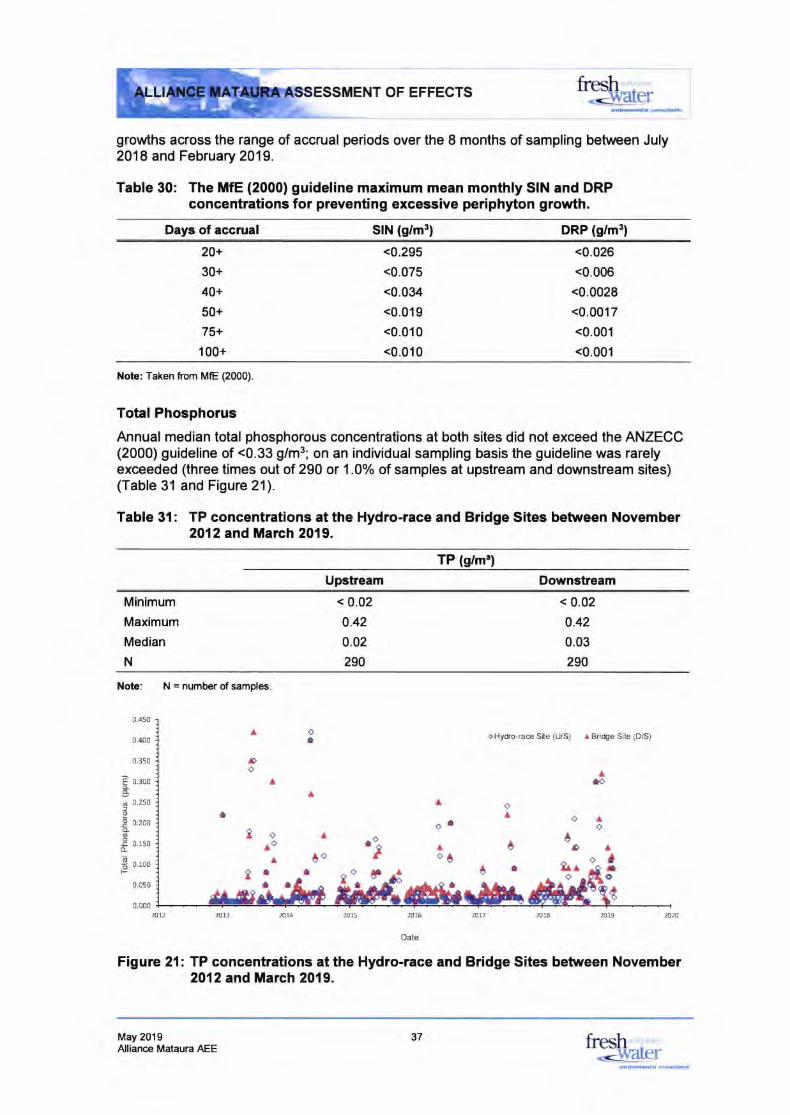
ENT OF EFFECTS
growths across the range of accrual periods over the I months of sampling between July2018 and February 2019.
Table 30: The MfE (2000) guideline maximum mean monthly SIN and DRPconcentrations for preventing excessive periphyton growth.
firesh ,
-..+varcrffi.dfr
I
I
'
I
Days of accrual SIN (g/m3) DRP (g/mt)
20+
30+
40+
50+
75+
100+
<0.295
<0.075
<0.034
<0.019
<0.010
<0.010
<0.026
<0.006
<0.0028
<0.0017
<0.001
<0.001
Note: Taken trom ME (2000).
Total Phosphorus
Annual median total phosphorous concentrations at both sites did not exceed the ANZECC(2000) guideline of <0.33 g/m3; on an individual sampling basis the guideline was rarelyexceeded (three times out of 290 or 1.0o/o of samples at upstream and downstream sites)(Table 31 and Figure 21).
Table 3l: TP concentrations at the Hydro-race and Bridge Sites between November2012 and March 2019.
TP (g/mr)
Upstream Downstream
Minimum
Maximum
Median
N
<0.02
0.42
0.02
290
< 0.02
0.42
0.03
290
Note: N = numberofsamdes.
Eoq
0.450
0.400
0.350
0.300
0.250
0.200
0.150
0.100
0.050
0.000
oa oHydro-rae Site (l/S)
^ Bridge Site (D/S)
cD
Le o
o
oao
Aaa
Do
8
8
ao
o
A
aooEo
o-
ooA
c
a
a
AI/lo
ocoa
A
oA
o.o
co Tta c
a
2012 2013 2014 2015 2016 20L7 m792014 2020
Date
Figure 21: TP concentrations at the Hydro-race and Bridge Sites between November2O12 and March 2019.
May 2019Alliance Mataura AEE fresh ,r
..{^/laler
ja.L
37
dffilco@i-6
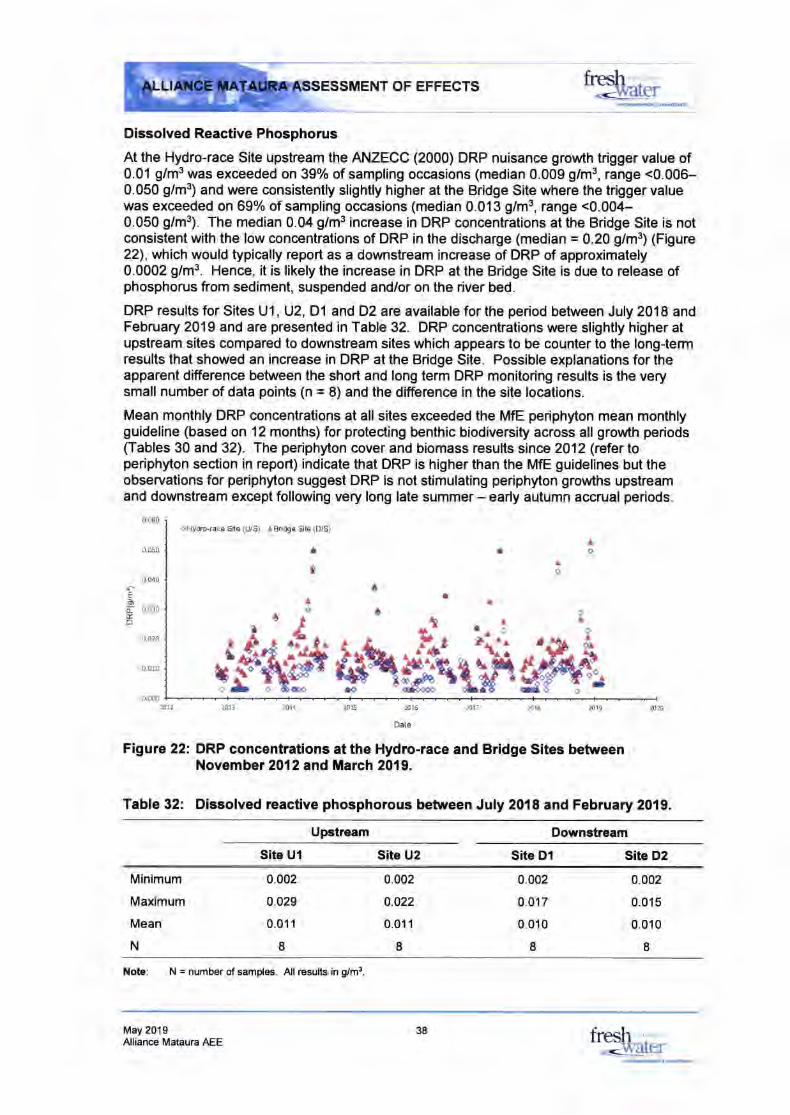
NT OF EFFECTS
Dissolved Reactive Phosphorus
At the Hydro-race Site upstream the ANZECC (2000) DRP nuisance growth trigger value of0.01 g/m3 was exceeded on 39% of sampling occasions (median 0.009 g/m3, range <0.006-0.050 g/m3) and were consistentty slightly higher at the Bridge Site where the trigger valuewas exceeded on 69% of sampling occasions (median 0.013 g/m3, range <0.004-0.050 g/m3). The median 0.04 g/m3 increase in DRP concentrations at the Bridge Site is notconsistent with the low concentrations of DRP in the discharge (median = 0.20 g/m3) (Figure22), which would typically report as a downstream increase of DRP of approximately0.0002 g/m3. Hence, it is likely the increase in DRP at the Bridge Site is due to release ofphosphorus from sediment, suspended and/or on the river bed.
DRP results for Sites U1, U2, D1 and D2 are available for the period between July 2018 andFebruary 2019 and are presented in Table 32. DRP concentrations were slightly higher atupstream sites compared to downstream sites which appears to be counter to the long-termresults that showed an increase in DRP at the Bridge Site. Possible explanations for theapparent difference between the short and long term DRP monitoring results is the verysmall number of data points (n = 8) and the difference in the site locations.
Mean monthly DRP concentrations at all sites exceeded the MfE periphyton mean monthlyguideline (based on 12 months) for protecting benthic biodiversity across al! growth periods(Tables 30 and 32). The periphyton cover and biomass results since 2012 (refer toperiphyton section in report) indicate that DRP is higher than the MfE guidelines but theobservations for periphyton suggest DRP is not stimulating periphyton growths upstreamand downstream except following very long late summer - early autumn accrual periods.
oHydo-Ee Site (U/S) ^
Bridge Site (O/S)
c t
firesh ,dler
a
I
Ao
0.060
0.050
0.040
0.030
0.020
0.010
0.000
6-EDIto
aAo
o
tD^it' a ^ o o
^r- r ti.^^ ..;3^ i#qrp#a*&
c
-
20172016201520u
Daie
208 2014 20ta 2019 NN
Figure 22: DRP concentrations at the Hydro-race and Bridge Sites betweenNovember 2O12and March 2019.
Table 32: Dissolved reactive phosphorous between July 2018 and February 2019.
Upstream Downstream
Site Ul Site U2 Site Di Site D2
Minimum
Maximum
Mean
N
0.002
0.029
0.011
8
0.002
0.022
0.011
8
0.002
0.017
0.010
8
0.002
0.015
0.010
INote: N = number of samples. All results in g/m3
May 2019Alliance Mataura AEE fresh 'r''
-warcrni'a6dlc@nib
38
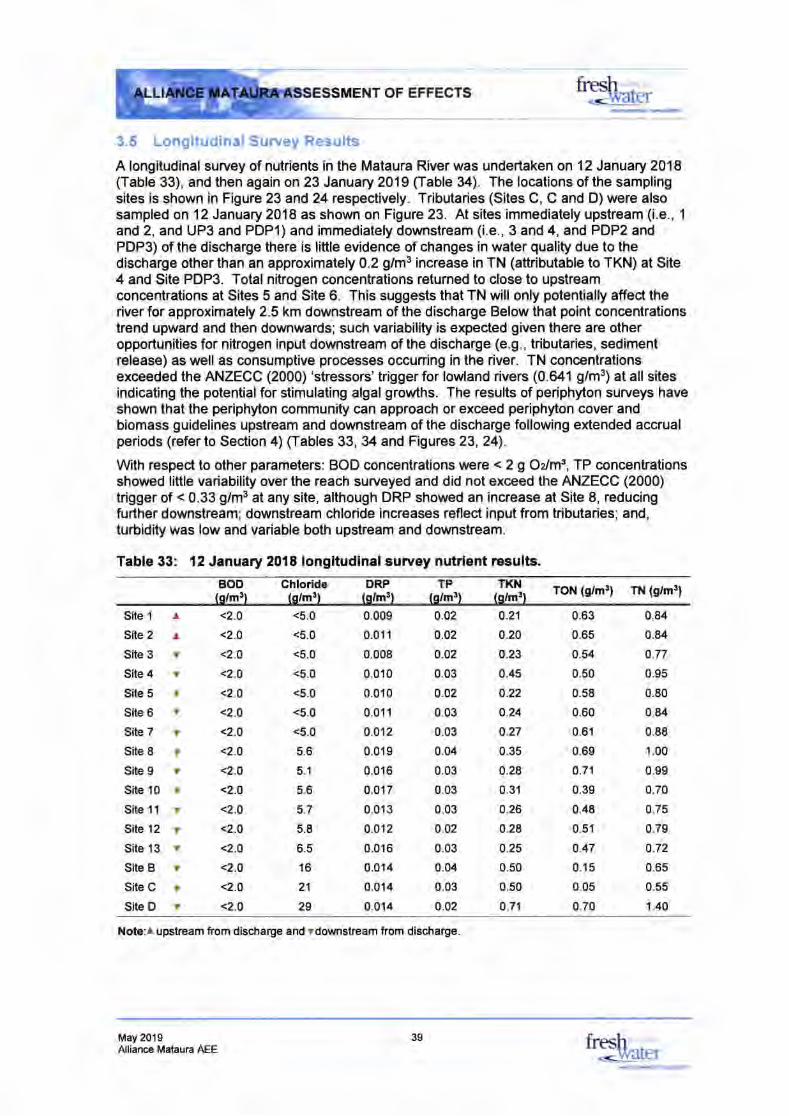
ESSMENT OF EFFECTS
3.5 Longitudinal Survey Results
A longitudinal survey of nutrients in the Mataura River was undertaken on 12 January 2018(Table 33), and then again on 23 January 2019 (Table 34). The locations of the samplingsites is shown in Figure 23 and 24 respectively. Tributaries (Sites C, C and D) were alsosampled on 12 January 2018 as shown on Figure 23. At sites immediately upstream (i.e., 1
and 2, and UP3 and PDPI) and immediately downstream (i.e., 3 and 4, and PDP2 andPDP3) of the discharge there is little evidence of changes in water quality due to thedischarge other than an approximately 0.2 g/m3 increase in TN (attributable to TKN) at Site4 and Site PDP3. Total nitrogen concentrations returned to close to upstreamconcentrations at Sites 5 and Site 6. This suggests that TN will only potentially affect theriver for approximately 2.5 km downstream of the discharge Below that point concentrationstrend upward and then downwards; such variability is expected given there are otheropportunities for nitrogen input downstream of the discharge (e.9., tributaries, sedimentrelease) as well as consumptive processes occuning in the river. TN concentrationsexceeded the ANZECC (2000) 'stressors' trigger for lowland rivers (0.641 g/m3) at all sitesindicating the potentialfor stimulating alga! growths. The results of periphyton surveys haveshown that the periphyton community can approach or exceed periphyton cover andbiomass guidelines upstream and downstream of the discharge following extended accrualperiods (refer to Section 4) (Tables 33, 34 and Figures 23,24).
With respect to other parameters: BOD concentrations were < 2 g Ozlms, TP concentrationsshowed little variability over the reach surveyed and did not exceed the ANZECC (2000)trigger of < 0.33 g/m3 at any site, although DRP showed an increase at Site 8, reducingfurther downstream; downstream chloride increases reflect input from tributaries; and,turbidity was low and variable both upstream and downstream.
Table 33: l2 January 2018 longitudinalsurvey nutrient results.
firesh ,
=-waler
BOD(s/m3)
Chloride(s/mt)
DRP(s/mr)
TP(g/mr)
TKN(g/m3) TON (g/mr) TN (g/mr)
Site 1 a
Site 2 a
Site 3 vSite 4 v
Site 5 v
Site 6 v
Site 7 v
Site I vSite 9 vSite 10 vSite 11 vSite 12 vSite 13 vSite B v
Site C vSite D v
0.009
0.011
0.008
0.010
0.010
0.011
0.012
0.019
0.016
0.017
0.013
0.012
0.016
0.014
0.014
0.014
<5.0
<5.0
<5.0
<5.0
<5.0
<5.0
<5.0
5.6
5.1
5.6
5.7
5.8
6.5
16
21
29
<2.0
<2.0
<2.0
<2.0
<2.0
<2.0
<2.0
<2.0
<2.0
<2.0
<2.0
<2.0
<2.0
<2.0
<2.0
<2-0
0.02
0.02
0.02
0.03
0.o2
0.03
0.03
0.04
0.03
0.03
0.03
0.02
0.03
0.04
0.03
0.02
0.21
o.20
0.23
0.45
o.22
o.24
0.27
0.35
0.28
0.31
o.26
0.28
0.25
0.50
0.50
o.7'l
0.63
0.65
0.54
0.50
0.58
0.60
0.61
0.69
0.71
0.39
0.48
0.51
0.47
0.15
0.05
0.70
0.84
0.84
0.77
0.95
0.80
0.84
0.88
1.00
0.99
0.70
0.75
0.79
0.72
0.65
0.55
1.40
Note:a upstream ftom discharge and vdownstream from discharge
May 2019Alliance Mataura AEE
39 fresh ,
-d/ater
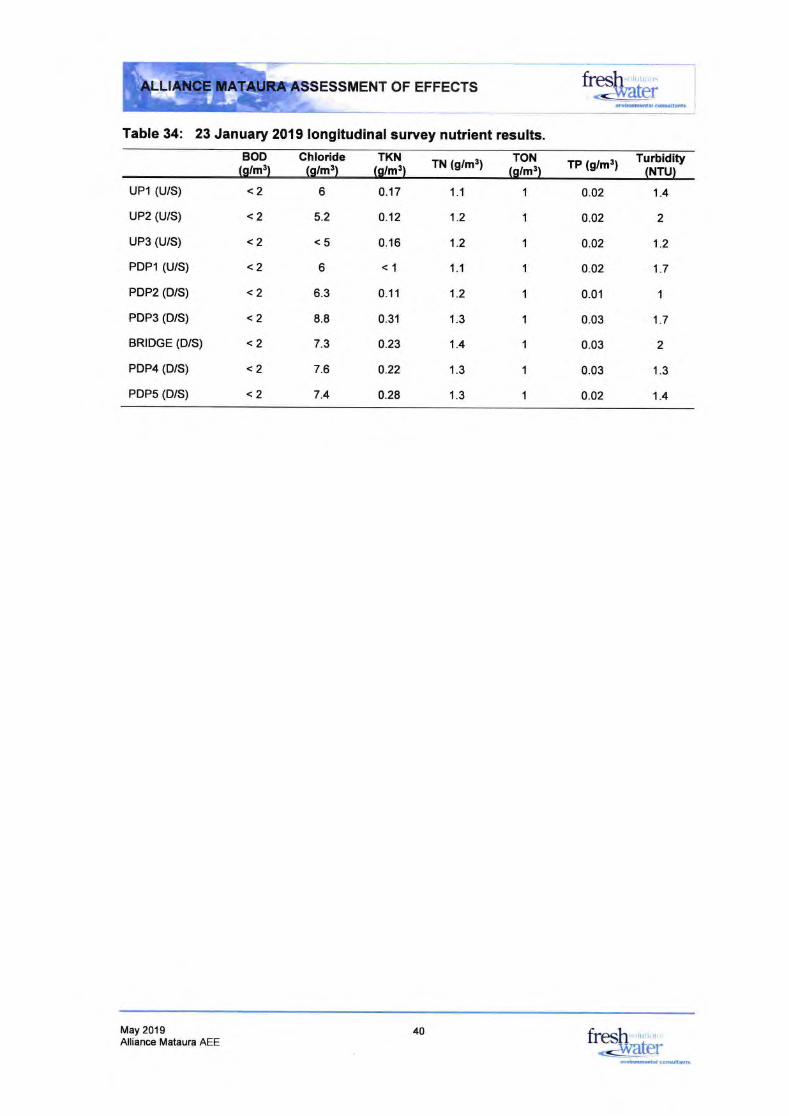
fitsh'',',,'",'dlcrOF EFFECTSr.F''E*r#
Table 34: 23 January 2019 longitudinalsurvey nutrient results.BOD Ghloride
(s/mtlTKN
(q/m!lTON
(o/mtlTN (g/mt) TP (g/ms) Turbidity(NTU}
uP1 (U/S)
uP2 (U/S)
uP3 (U/S)
PDP1 (U/S)
PDP2 (D/S)
PDP3 (D/S)
BRTDGE (D/S)
PDP4 (D/S)
PDPs (D/S)
<2
<2
<2
<2
<2
<2
<2
<2
<2
1.1
1.2
1.2
't.1
1.2
1.3
1.4
1.3
1.3
6
5.2
<5
6
6.3
8.8
7.3
7.6
7.4
0.17
0.12
0.16
<1
0.11
0.31
0.23
0.22
o.28
0.02
0.02
0.02
0.02
0.01
0.03
0.03
0.03
o.02
1.4
2
1.2
1.7
1
1.7
2
1.3
1.4
1
1
1
1
1
May 2019Alliance Mataura AEE
40fi'ggfu'",,,"",,-@!er
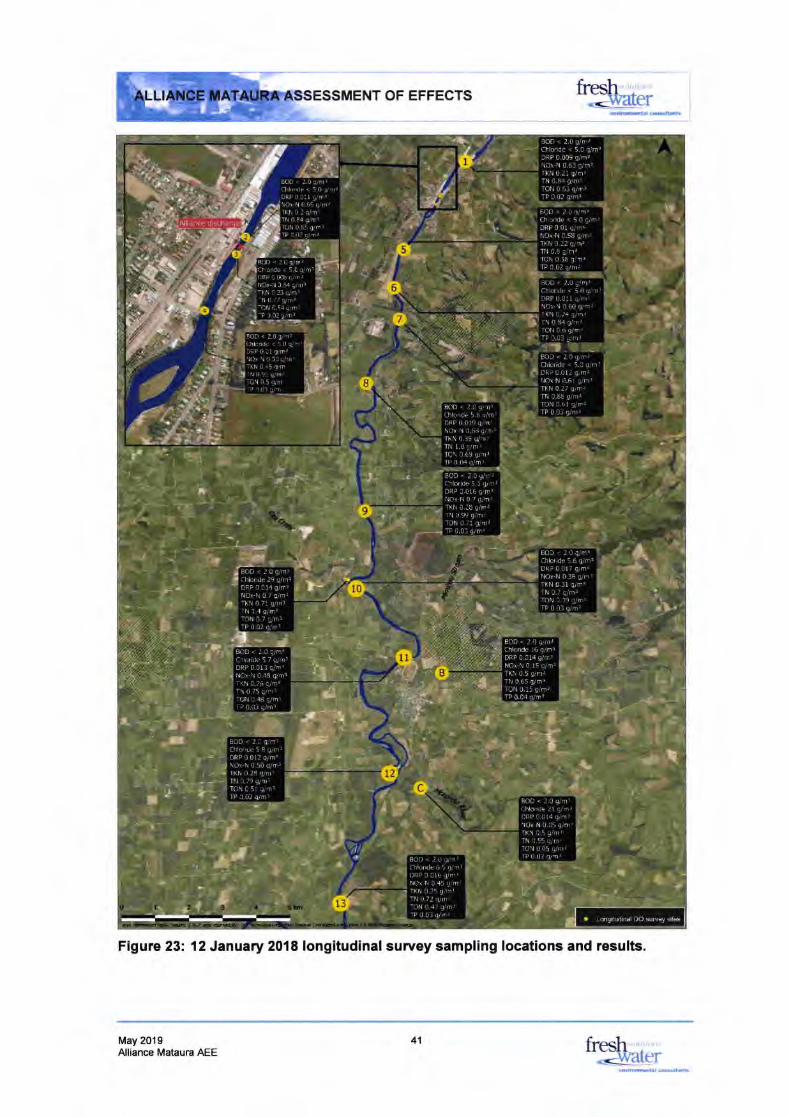
t'r'r'sltALLIANCE MATAURA ASSESSMENT OF EFFECTS
I A
5
II
"1I,
/
t.' '
1
'.,,'B
a-.,
')
"9?
5ts
,\*ir*.'I
i't"r '..i 1
1r.
nr. tu ro1/Ai r#r I [ai. e.-rit
Figure 23:. 12 January 2018 longitudinal survey sampling locations and results
May 2019Alliance Mataura AEE
8OD < 2.0 9um,Chlqde 2 t q/m,oRP 0.014 glnrflOr'N 0.05 gim,IKfl 0.5 glmrTN 0.55 s/mlrON 0.05 q/m,rP 0.03 g/mr
BOD < 2.0 g,lmt(hldidP 5 8 g/mrDRP 0.012 qim!llox-il 0.50 q,rm3
TkN 0.29 qrmrTN 0-79TON 0.5rP 0.02
TP
BOD < 2.0 gim:Cnbk& 5 7 q/mlDRP 0-013 q,/mr
8OD < 2,0 g,lmlCtloiJe t6 qy'dlDRP 0.014 g/mltlorN 0.15 q/mlTKil 0.5 g,/mrTN 0.65 g/m3TON 0.15 Oh,TP 0.04 q/m!
BOD < 2.0 glmrChh.de 29 g/mlDRP 0.014 g/r3NOX-N 0.7 g/m:TKN 0.71 qim:TN 1.4 9m:'Ttlil 0.7 9'm3TP 0.02 q/n:
T(N 0,31 &lm3TI 0.7 9,m,TON 0.39 gih:TP 0.03 g/ml
(}rloride 5,1 g/mrDRP C.016 q/m!NOx-N 0.7 9/m:TXtl 0,28 g/arTN 0,99 qU'mJ
TON 0.71 gimrTP 0,03 oy'm'
< 2,0 glitt
BOD < 2.0 glmlChlonde 9.6 q/firDRp 0.0r9 0/mr(Or-N 0.6f3 9/6tIKN 0,35 g/ol
10hIN 1.0
TONTll 0.84
TP 0.02
8OO < 2.0 Em3Chloride < 5,0 EhrDRP 0.009 Elm,Nox-il 0.63 q,inrIXN 0.21 grlm'
BOD < 2.0 q,h,chloride < 5.0 q/mrDRP 0,01 9/m1llox-N 0.58 g7m:TXN 0.22 9im3TN D.8 gjnrTON 0,58 g/m,
Chloride < 5.0 glmrDRP 0.011 trnrNox-lt 0.({ gdmrTKN 0.24 q./frrTrl0,84 g/n,TON 0.6 s,/m,
Chloride < 5,0 9/m,DRe 0,012 Srm,NOX-N 0-61 g/nrT(N 0.27 O,mlTl'l 0.8t g/mrTON C.6l g/rrTP
TP 0.02
a L6!t!&C OO flr!, liht
41
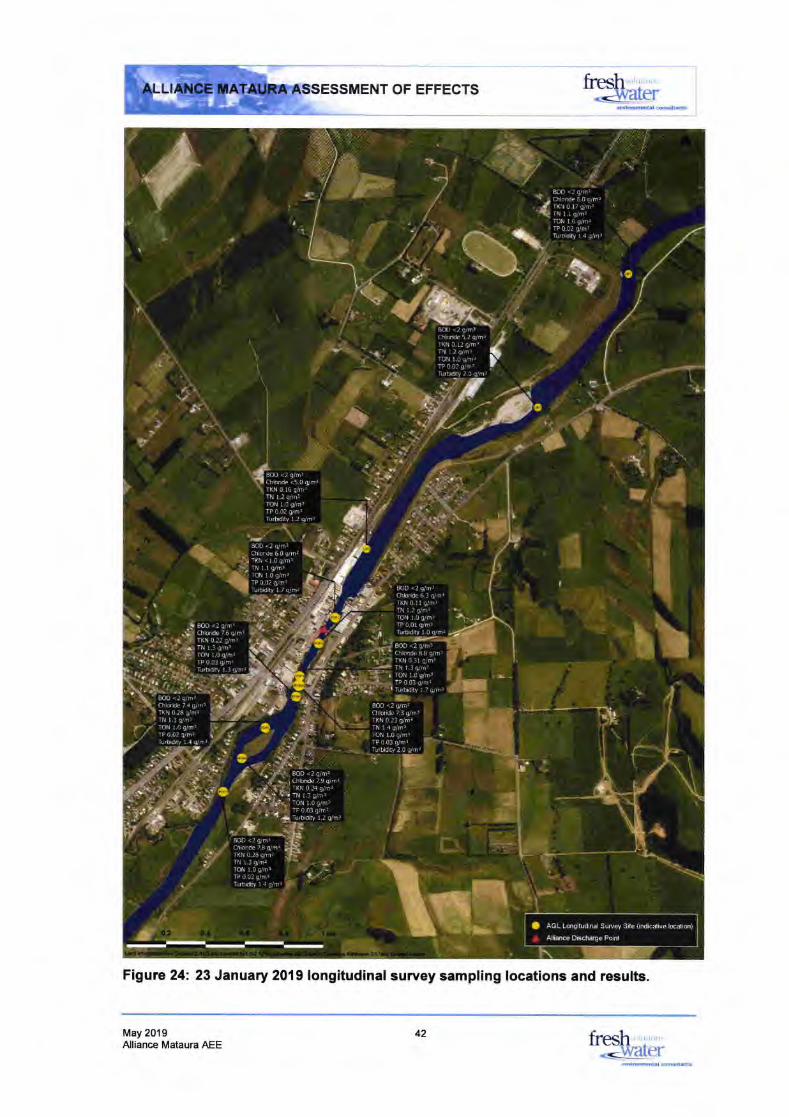
NT OF EFFECTS
Figure 24: 23 January 2019 longitudinal survey sampling locations and results.
May 2019Alliance Mataura AEE
fresh*dyaler
42
\n+ J-F-: t NT OF EFFECTS
3.6 Nutrient Loads to Toetoes Estuary
The cunent water quality and ecological health of Toetoes Estuary was described inFreshwater Solutions (2019). Freshwater Solutions (2019) reported:
Stevens and Robertson (2012 and 2017) repofied that the extensive subtidal grcwthprcsent in the estuary is driven by the very high nutrient loads entering the estuary(estimated N load based on NIWA's CTUES modelwith 2002land cover is 2,450 fonnes Nyear, thercfore based on cunent land use is tikely to be >4,000 tonnes N year). Becausethe estuary is relatively small in comparison to the very large fteshwater inflow (mean flow76m3/s), most of the N inflow is npidly flushed out to sea. However, the high N inputssupport excessiye grcwths of nuisance macrcalgae in arcas exposed to elevated nutientconcentrations and low salinity conditions.
Stevens (2018) reported the results of the 2018 broad scale intertidalhabitat mapping ofToetoes Estuary describing the estuary a medium-sized, short residence, tidal river typeestuary with a lagoon that discharges to Toetoes Beach at the mouth of the Mataura Riverand Titiroa Stream. Toetoes Estuary drains a large and primarily high productivityagricultural catchment and has a large freshwater influence because the estuary is small inrelation to the freshwater input. Stevens (2018) concluded that the results indicate thatalthough large sections of the lower estuary remain in good condition, sheltered upperestuary embayments, have developed stable nuisance macroalgal growths with poorlyorygenated sediments since 2013. Stevens (2018) went on to state:
These gross eutrcphic zones are displacing high value seagruss beds and sfressrngsaltmarsh and benthic habitat. Elsewhere, extensive subtidalgrcwths of macrcalgae, andlow sediment oxygenation within unvegetated inteftidal sediments highlights degradationthat is likely to be causing significant ecological sfress to the macroinveftebratecommunities. Such conditions limit food availability for fish and birdlife, and show theestuary is in a "MODERATE'but declining condition in rclation to eutrophication. Theongoing drainage and loss of saltmarch and densely vegetated tenestrial margins is alsoplacing the estuary under prcssurc. Excessive nutrient inputs arc the primary driver of theeutrophication symptoms being expressed the estimated -1700 mgN/m2/d close fo whercnuisance growths are expected (> 2,000 mgN/m2/d), and well above the thrcsholds for SIDEesfuanes (>100mgtAm2 /d). These high loads arc well above natunl inputs and highlighttherc arc sufficient nutrients to fuel algal grovvths in the estuary.
Stevens (2018) reports NIWA's Coastal Explorer database and CLUES model outputs fromOctober 2018, which estimates a catchment load of 3,110 tonnes N per Year - significantlylower than the previous estimate of >4,000 tonnes N per year. The estimated catchmentload of phosphorus is 345 tonnes per year.
Based on data from the five seasons from 2012113 to 2017118, the Plant discharge loads ofTN (estimated from TKN) have ranged from 33-52 tonnes N per year. Hence the TNdischarge contribution to the Toetoes Estuary load is 1.1-1.7o/o (based on 3,110 tonnes).Likewise, the seasonalTP loads have ranged ftom 2.44.4 tonnes P peryear and,therefore, the estimated TP discharge contribution to the Toetoes Estuary load is 0.7-1.3o/o.
There is limited TN and TP data for the Mataura River, however based on data collectedweekly from 1 January 2018 to 31 December 2018 the annual river load estimates of TNare 4,400 tonnes at both the downstream and upstream site. This load is more aligned withprevious estimates of TN to Toetoes Estuary (>4,000 tonnes per year) than that estimatedby the 2018 CLUES model, although it is acknowledged by Stevens (2018) that pointsource estimates of TN in the 2018 CLUES modelare likely underestimated. Regardless, itis evident the vast majority of TN to Toetoes Estuary is derived from inputs upstream of thePlant's discharge.
fireshdler
May 2019Alliance Mataura AEE
43 fresh .water
firesh,r.&lerOF EFFECTS
Likewise, the annua! river load estimates of TP at the downstream and upstream sites are390 tonnes and 360 tonnes, respectively. This compares reasonably wellwith the CLUESestimate of 345 tonnes from the Toetoes Estuary and infers the vast bulk of the TP load tothe Toetoes estuary is from the Mataura River upstream of the discharge.
BOD loads to Toetoes Estuary have not been subject to CLUES modelling. Based on theBOD data presented in this report, seasonal discharge loads ranged from 158-241tonnesper year (as Oz). Mataura River BOD concentrations in the monitoring period were usuallyless than the analytical detection limit (< 2lglm3) at the upstream and downstream sites. Onthat basis BOD loads are best estimated as 'less than' limits of <510 tonnes per year and<470 tonnes per year, respectively for upstream and downstream sites. On first sight thereis a disconnect between the upstream and downstream BOD load estimates and thedischarge loads but, analyticalfactors aside (i.e., loads being inaccurate because manyBOD results are less than the detec{ion limit), this difference is most likely due to BODconsumption occurring between upstream and downstream sites.
The discharge load is high compared with the downstream load (34-48%), but withoutdetailed BOD fate investigations continual consumptive processes make it impossible toaccurately assess the effects of discharge BOD loads. lt is likely that BOD loads reportingto Toetoes Estuary are significantly less than those estimated at the downstream site. Theresults of DO monitoring using sondes at Chalmers Road (13 Km downstream) indicate thatthe BOD load does not cause DO depletion.
ln summary, it is considered the far-field effects, i.e., to lower Mataura River and ToetoesEstuary, of TN and TP in the discharge, are no more than minor. Even a marked reductionof the discharge loads of TN and TP would have little, if any, effect on the nutrient status ofToetoes Estuary.
3.7 Effects on ColourHue and brightness are the main attributes used to describe water colour (MfE 1994), whichis wel! characterized by the Munsell system (Davies-Colley and Nagels 1999). Allianceconducted a series of Munsell colour measurements at the Hydro-race and Bridge Sitebetween 13 December 2017 and27 March 2018. The results are presented in Table 35.The water colour at both sites was predominantly 2.SGY (32.5) 812 (pale greenish yellow)and only differed marginally between upstream and downstream sites on two occasions.The results indicate that the discharges from the Plant do not adversely affect colour.
Table 35: Munsell colour results between 13 December 2017 and 27 March 2018.
Date Upstream Hydro-race Site Downstream Bridge Site
, -r '-;tlr,q-
13t12t2017
2101t2018*
8t01t201816t01t2018
7t02t2018't5t02t201819t02t201827t02t20182t03t2018*7t03t201814t03t201819/03/2018
27t03t2018
10Y (30) 8/2
5Y (25) 8t210Y (30) 4/2
sGY (35) 7/6
2.5GY (32.5) 8t22.5GY (32.5) 8t22.5GY (32.5) 8t2
5Y (25)7t62.5 GY (32.5) 8t22.5 GY (32.5) 8t22.5 GY (32.5) 8t22.5 GY (42.5) 8t22.5 GY (42.5) 8t2
10Y (30) 8/2
5Y (25)8t25Y (25) 4t2
7.5Y (27.5)7t62.5GY (32.5) 8t22.5GY (32.5) 8t22.5GY (32.s) 8t2
sY (25) 7/6
2.5 GY (32.5) 8t22.5 GY (32.5) 8t22.5 GY (32.5) 8t22.5 GY (42.5) 8t22.5 GY (42.5) 8t2
Note: 'No processing onsite.
May 2019Alliance Mataura AEE
4 fresh ', ,
<-rilaler
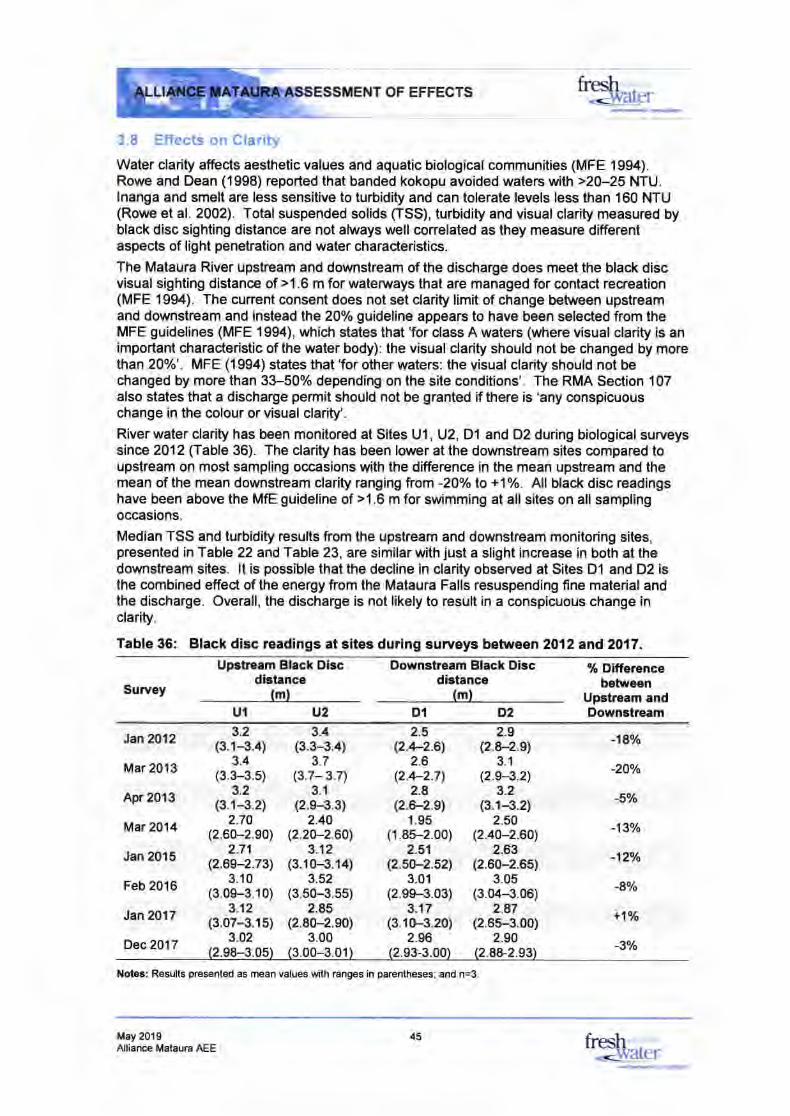
$Jp-:\m,t{* ESSMENT OF EFFECTS fresh
_.c@rcr
3"8 Effects on Clarity
Water clarity affects aesthetic values and aquatic biological communities (MFE 1994).Rowe and Dean (1998) reported that banded kokopu avoided waters with >20-25 NTU.lnanga and smelt are less sensitive to turbidity and can tolerate levels less than 160 NTU(Rowe et al. 2002). Totalsuspended solids OSS), turbidity and visual clarity measured byblack disc sighting distance are not always well correlated as they measure differentaspects of light penetration and water characteristics.
The Mataura River upstream and downstream of the discharge does meet the black discvisual sighting distance of >1.6 m for watenarays that are managed for contact recreation(MFE 1994). The current consent does not set clarity limit of change between upstreamand downstream and instead lhe 2Oo/o guideline appears to have been selected from theMFE guidelines (MFE 1994), which states that'for class A waters (where visual clarity is animportant characteristic of the water body): the visual clarity should not be changed by morethan 20o/o'. MFE (1994) states that 'for other waters: the visual clarity should not bechanged by more than 33-50% depending on the site conditions'. The RMA Section 107also states that a discharge permit should not be granted if there is 'any conspicuouschange in the colour or visual clarity'.
River water clarity has been monitored at Sites U1, U2, D1 and D2 during biological surveyssince 2012 (Table 36). The clarity has been lower at the downstream sites compared toupstream on most sampling occasions with the difference in the mean upstream and themean of the mean downstream clarity ranging trom -2Oo/o lo +1o/o. All black disc readingshave been above the MfE guideline of >1.6 m for swimming at all sites on all samplingoccasions.
Median TSS and turbidity results from the upstream and downstream monitoring sites,presented in Table 22 and Table 23, are similar with just a slight increase in both at thedownstream sites. lt is possible that the decline in clarity observed at Sites Dl and D2 isthe combined effect of the energy from the Mataura Falls resuspending fine material andthe discharge. Overall, the discharge is not likely to result in a conspicuous change inclarity.
Table 36: Black disc readings at sites during surveys between 2012 and2017.
Survey
Upstream Black Discdistance
(m)
Downstream Black Discdistance
(m)
% Differencebetween
Upstream andDownstreamU1 U2 DI D2
lan2olz rs.13i.+l ts.ll.al ,r.LZ.r, ,r.,-?r.r,Mar 2013 ts.;-1.s1 tg.l-7g.tt rz.fz.tl ,r.ll.r,Apr2013 rs.13i.zl rz 8-l.sl ,r.LZ.r, rs.13i.zlMar2014,r{o!3.rq rzifS.aot 1',.#iooy e4t..t.60)Jan 2015 ,r.in!l.rq ra.rt]s2.rnl ,r.ffi.ur1 1r ut5.u,Feb 2016
,, #3',0, 1..u3lr1uu, 1r.r3$.ory 1, 0113.0.1
lan2017 rs.o?]s2.rsl ,r.#5n0, rs.rilJ.zol 12.#Loo1
oeczorT (zg3j32o5) reoSlS.orr rr#-1lool tr.r?-tlg.l
-18o/o
-20o/o
-5o/o
-13%
-12o/o
-8%
+1o/o
'3o/o
Notes: Results presented as rnean values with ranges in parentheses; and n=3.
May 2019Alliance Mataura AEE
45 fresh ,_<\ ialer
-A-mr.--t-n
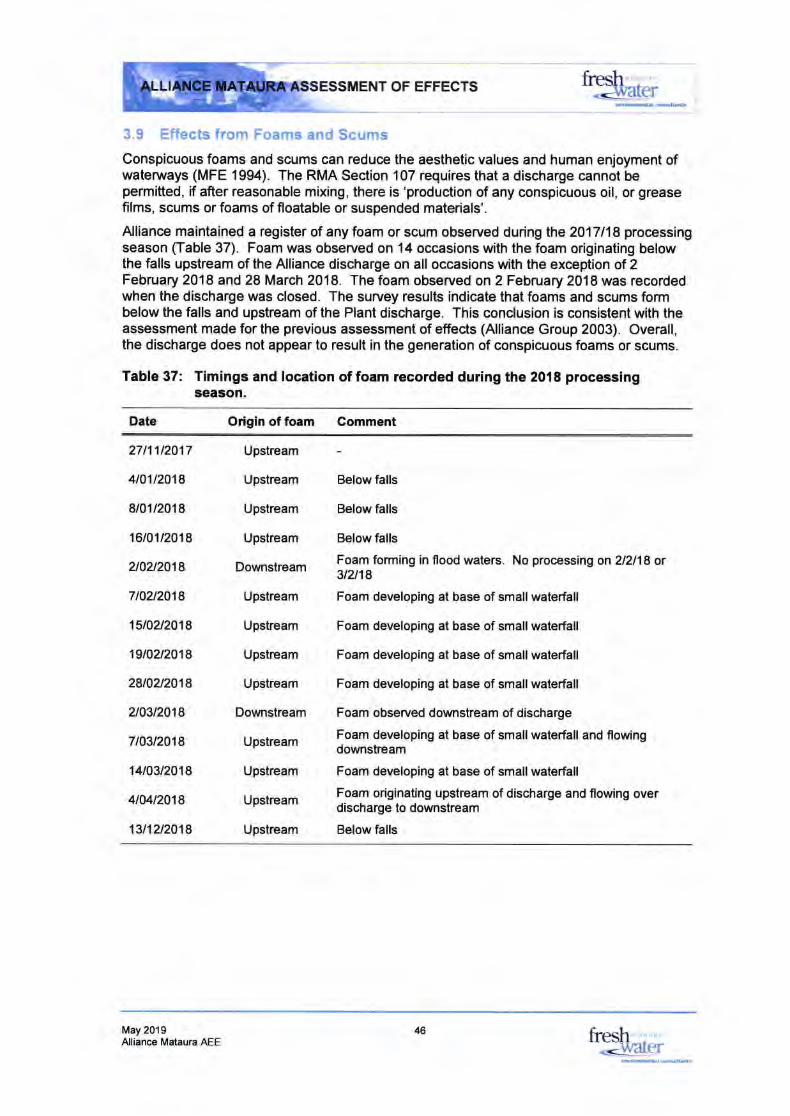
firesh' ,-4rcrffi^d*
OF EFFECTS
3.9 Effects from Foams and Scums
Conspicuous foams and scums can reduce the aesthetic values and human enjoyment ofwatenrays (MFE 1994). The RMA Section 107 requires that a discharge cannot bepermitted, if after reasonable mixing, there is 'production of any conspicuous oil, or greasefilms, scums or foams of floatable or suspended materials'.
Alliance maintained a register of any foam or scum observed during lhe 2017118 processingseason (Table 37). Foam was observed on 14 occasions with the foam originating belowthe falls upstream of the Alliance discharge on all occasions with the exception of 2February 2018 and 28 March 2018. The foam observed on 2 February 2018 was recordedwhen the discharge was closed. The survey results indicate that foams and scums formbelow the falls and upstream of the Plant discharge. This conclusion is consistent with theassessment made for the previous assessment of effects (Alliance Group 2003). Overall,the discharge does not appear to result in the generation of conspicuous foams or scums.
Table 37: Timings and location of foam recorded during the 2018 processingseason.
Date Odgin of foam Comment
27t11t2017
4t01t2018
8t01t2018
16t01t2018
2102t2018
7t02t2018
15t02t2018
19t02t2018
28t02t2018
2t03t2018
7t03t2018
't4t03t2018
4t0/,12018
13t12t2018
Upstream
Upstream
Upstream
Upstream
Downstream
Upstream
Upstream
Upstream
Upstream
Downstream
Upstream
Upstream
Upstream
Upstream
Below falls
Below falls
Belowfalls
Foam forming in flood waters. No processing on 212118 or3t2t18
Foam developing at base of small waterfal!
Foam developing at base of small waterfall
Foam developing at base of smallwaterfall
Foam developing at base of small waterfal!
Foam observed downstream of discharge
Foam developing at base of small waterfall and flowingdownstream
Foam developing at base of small waterfall
Foam originating upstream of discharge and flowing overdischarge to downstream
Below falls
May 2019Alliance Mataura AEE
46 fiesh 'r ,'
_dilrarcr
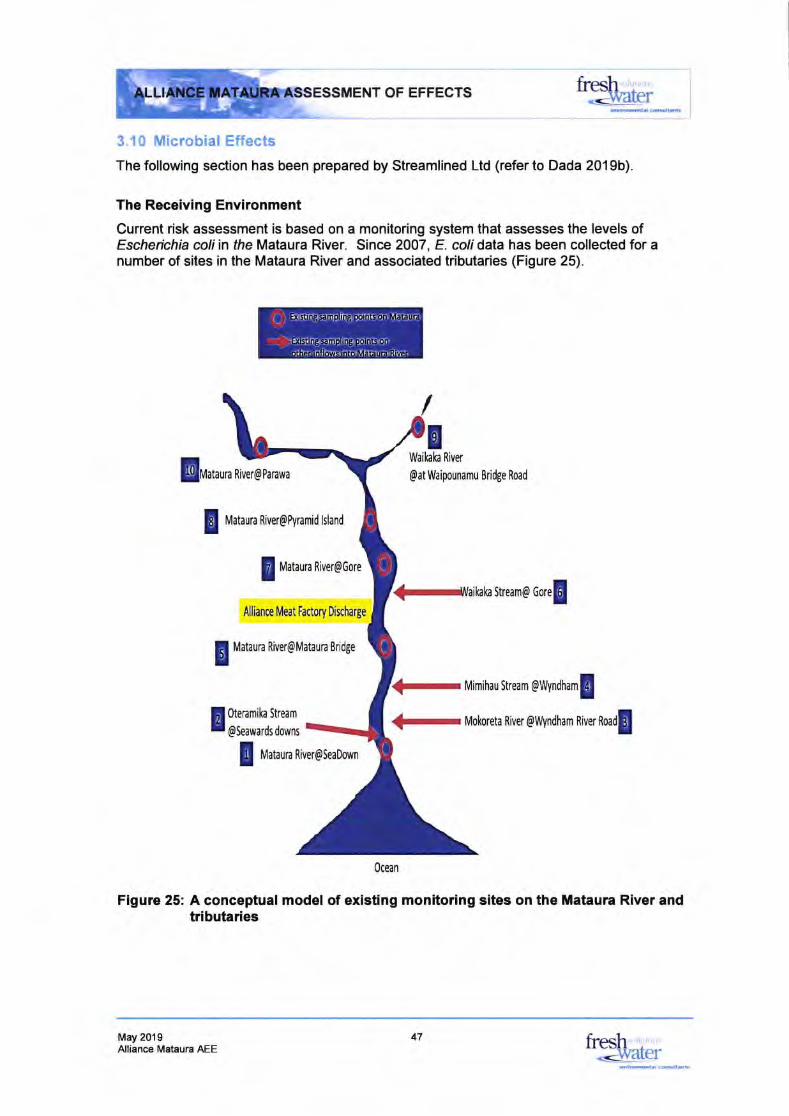
, *r--:M[['\h&r
ili* NT OF EFFECTS firesh-+varcrtudcdtdr
3,10 Microbial Effects
The following section has been prepared by Streamlined Ltd (refer to Dada 2019b)
The Receiving Environment
Current risk assessment is based on a monitoring system that assesses the levels ofEscheichia coliin fhe Mataura River. Since 2007, E. coli dala has been collected for anumber of sites in the Mataura River and associated tributaries (Figure 25).
EWaikah River
@at Waipounamu Bridge Road[rn,uo River@Parawa
E Mataura River@Pyramid lsland
Mataun River@Gore
Alliance Meat Factory Discharge
Mataun River@Mataun Bridge
0tenmih Stream
@Seawards downs
Stream@ coel
Mimihau Stream @lWndham
-
Mokoreta River @rrflndham River Road!
t nrt ro River@SeaDown
Ocean
Figure 25: A conceptua! model of existing monitoring sites on the Mataura River andtributaries
May 2019Alliance Mataura AEE
rr!'i !': :it,l.'li'i: ,:.i,rr .'' :tlrl,rr
i,ii ': :l,, ,lrrt': .ii' r'r '1,
.ti;', !,,i'.,,,,s,.r. r,Llil,.r,il',;J
47 fresh-darcr
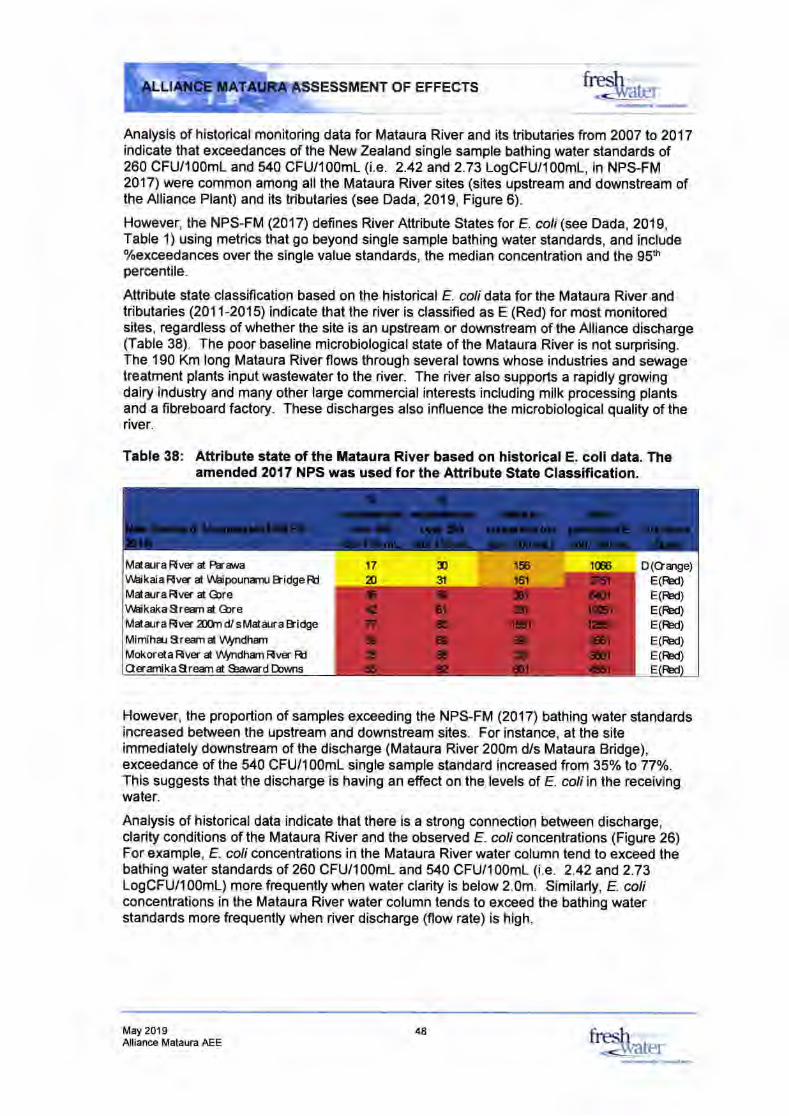
OF EFFEGTS
Analysis of historical monitoring data for Mataura River and its tributaries from 2007 lo 2017indicate that exceedances of the New Zealand single sample bathing water standards of260 CFU/100m1 and 540 CFU/100m1(i.e. 2.42 and 2.73 LogCFU/l00m1, in NPS-FM2017) were common among allthe Mataura River sites (sites upstream and downstream ofthe Alliance Plant) and its tributaries (see Dada, 2019, Figure 6).
However, the NPS-FM (2017) defines RiverAftribute States for E. coli(see Dada,2019,Table 1) using metrics that go beyond single sample bathing water standards, and includeToexceedanoes over the single value standards, the median concentration and the g5th
percentile.
Attribute state classification based on the historical E. colidata for the Mataura River andtributaries (2011-2015) indicate that the river is classified as E (Red) for most monitoredsites, regardless of whether the site is an upstream or downstream of the Alliance discharge(Table 38). The poor baseline microbiological state of the Mataura River is not surprising.The 190 Km long Mataura River flows through several towns whose industries and sewagetreatment plants input wastewater to the river. The river also supports a rapidly growingdairy industry and many other large commercia! interests including mitk processing plantsand a fibreboard factory. These discharges also influence the microbiological quality of theriver.
Table 38: Attribute state of the Mataura River based on historical E. coli data. Theamended 2017 NPS was used forthe Attribute State Classification.
However, the proportion of samples exceeding the NPS-FM (2017) bathing water standardsincreased between the upstream and downstream sites. For instance, at the siteimmediately downstream of the discharge (Mataura River 200m d/s Mataura Bridge),exceedance of the 540 CFU/100mL single sample standard increased from 35% to77o/o.This suggests that the discharge is having an effect on the levels of E. coli in the receivingwater.
Analysis of historica! data indicate that there is a strong connection between discharge,clarity conditions of the Mataura River and the observed E. coli concentrations (Figure 26)For example, E. coli concentrations in the Mataura River water column tend to exceed thebathing water standards of 260 CFU/100mL and 540 CFU/100mL (i.e. 2.42 and 2.73LogCFU/100mL) more frequently when water clarity is below 2.0m. Similarly, E. coliconcentrations in the Mataura River water column tends to exceed the bathing waterstandards more frequently when river discharge (flow rate) is high.
ftesh .
-<wat€rd'tM,l:ffi
May 2019Alliance Mataura AEE fresh .
-dvarcr
MdanraFlver d.Eaua\Atsikaia Rver d \AAipounaml Bidge FU
Mdanra Rver d @reVlAikaka Srern d OreMdanra Rver ZXfn d/sMdaura &idgeMinihar 9rean d \ltyndhanr
Mokoreta Rver d W!,ndhan Ftrver FU
17
no
ka Dorvns
D(Oilge)E(rud)E(ftd)E(tud)E(tud)E(ftd)E(rud)
tm
48
Ertoodl co@tatt

SMENT OF EFFECTS
Figure 26: Linear correlation between water column E. coli concentrations versusclarity and discharge conditions in the Mataura River.
The conelations shown in Figure 26 between river water E.coli, river flow and water claritygive credence to the influence of a combination of high faecal contenUfaecal bacterialoadings from pastoral catchment overland flows and in-stream processes. Generally,inflows dominated by overland flow will contain elevated loads of suspended particles andbacteria. Once delivered to the river, sediment and bacteria can then accumulate onriverbeds before being re-suspended after an increase in river discharge. Highly erosivestormflow results in the resuspension of particles as a function of flow, which leads toresuspension of bacteria into the water column (often several orders of magnitude higherthan baseflow).
The monitoring data of May 2018 (Table 39) showed that high FIB concentrations did notresult in high levels of pathogens in the treated wastewater or receiving water. BothCampylobacferand Salmonella were detected in very low concentrations in the treatedwastewater samples despite the high FIB levels in the treated effluent. Similarly, E.coli0157: H7 was also rarely detected despite the high levels of E.coliconcentrations in thereceiving water and treated wastewater. Whilst no Giardia or Cryptospoidium analysis wasundertaken in receiving waters, their oocysts could not be detected in treated wastewatersamples from May 2018 (Dada , 2019 Table 4) and were low in the summer 201 8/1 9
firesh<rilarcr
May 2019Alliance Mataura AEE
R2= 0.35193EoolL(JEO
.9
oq
o.5
River Discha rge(lr3rt3ldl
5
4 o
2
1
o0.0 1.0 1.5 z0 2.5 3.0
Ja-.
oo
-T
I
I
oqEI
Stom llryDischarge condition
5
4
T
3
2 l-J.
besefldv
aa Rz = O!1O65
)Eoolr(JEOIouui
ttlat€r Clarity{m}
s
I
3
2
1
0
0 2 4 5 7
Ooaooo.r.
a
TI
=o(.1
toI
€larity class
4
3
2
I1
<-2m >-2m
Tl-rJ.
49 fresh r
=-waler
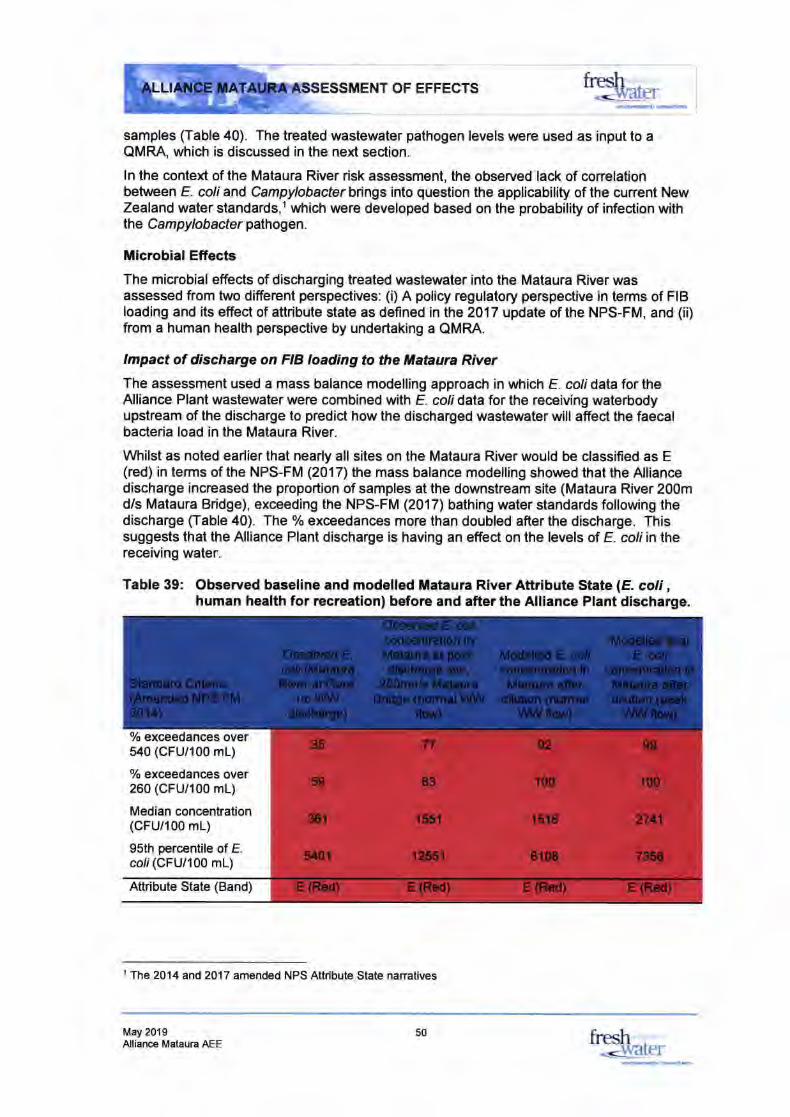
OF EFFECTS
samples (Table 40). The treated wastewater pathogen levels were used as input to aQMRA, which is discussed in the next section.
ln the context of the Mataura River risk assessment, the observed lack of conelationbetween E. coliand Campylobacter brings into question the applicability of the cunent NewZealand water standards,l which were developed based on the probability of infection withthe Cam pylobacter pathogen.
Microbial Effects
The microbial effects of discharging treated wastewater into the Mataura River wasassessed from two different perspectives: (i) A poliry regulatory perspective in terms of FIBloading and its effect of attribute state as defined in the 2017 update of the NPS-FM, and (ii)from a human health perspective by undertaking a QMRA.
lmpact of discharge on FIB loading to the Mabura Frver
The assessment used a mass balance modelling approach in which E. colidata for theAlliance Plant wastewater were combined with E. colidata for the receiving waterbodyupstream of the discharge to predict how the discharged wastewater will affect the faecalbacteria load in the Mataura River.
\A/hilst as noted earlier that nearly all sites on the Mataura River would be classified as E(red) in terms of the NPS-FM (2017) the mass balance modelling showed that the Alliancedischarge increased the proportion of samples at the downstream site (Mataura River 200md/s Mataura Bridge), exceeding the NPS-FM (2017) bathing water standards following thedischarge (Iable 40). The % exceedances more than doubled after the discharge. Thissuggests that the Alliance Plant discharge is having an effect on the levels of E. coliin thereceiving water.
Table 39: Observed baseline and modelled Mataura River Aftribute State lE. coli ,
human health for recreation) before and after the Alliance Plant discharge.
% exceedances over540 (CFU/I00 mL)
% exceedanoes over260 (CFU/I00 mL)
Median concentration(CFU/I00 mL)
95th percentile of Ecoli (CFU/100 mL)
Attribute State (Band)
1 The 2014 and2017 amended NPS Attribute State nanatives
firesh ._s-lvaE)r
May 2019Alliance Mataura AEE fresh ..eter
50
rdd.l.oruh-h
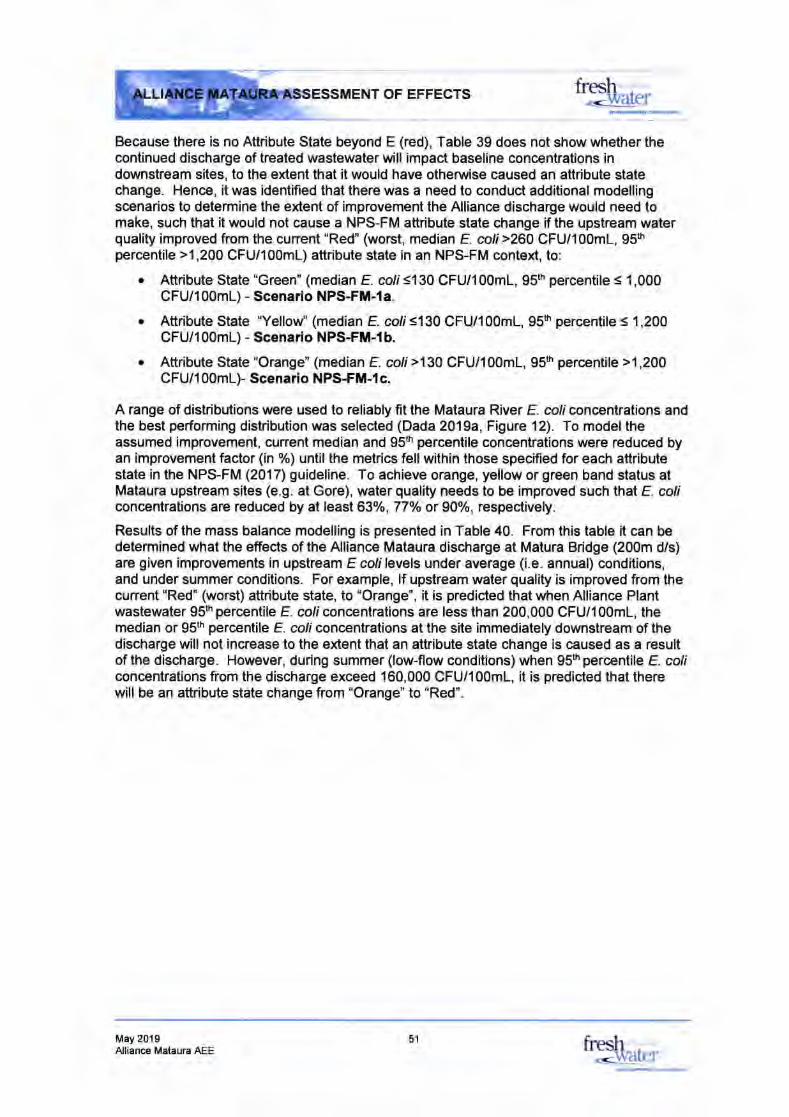
OF EFFECTS
Because there is no Attribute State beyond E (red), Table 39 does not show whether thecontinued discharge of treated wastewater will impact baseline concentrations indownstream sites, to the extent that it would have otherwise caused an attribute statechange. Hence, it was identified that there was a need to conduct additional modellingscenarios to determine the extent of improvement the Alliance discharge would need tomake, such that it would not cause a NPS-FM attribute state change if the upstream waterquality improved from the cunent "Red" (worst, median E. coli >260 CFU/100mL, 95thpercentile >1,200 CFU/100mL) aftribute state in an NPS-FM context, to:
o Attribute State "Green" (median E. coli<130 CFU/100mL, 95th percentile s 1,000CFU/100m1) - Scenario NPS-FM-Ia.
o Attribute State 'Yellou/' (median E. colis130 CFU/100mL, 95h percentile s 1,200CFU/100m1) - Scenario NPS-FM-Ib.
o Attribute State "Orange" (median E. coli>130 CFU/100mL,95s percentile >1,200CFU/1 00mL)- Scenario NPS-FM-{ c.
A range of distributions were used to reliably fit the Mataura River E coli concentrations andthe best performing distribution was selected (Dada 2019a, Figure 12). To model theassumed improvement, cunent median and 95h percentile concentrations were reduced byan improvement factor (in %) until the metrics fellwithin those specified for each attributestate in the NPS-FM (2017) guideline. To achieve orange, yellow or green band status atMataura upstream sites (e.9. at Gore), water quality needs to be improved such that E coliconcentrations are reduced by at least 630/o,77o/o or g0%, respectively.
Results of the mass balance modelling is presented in Table 40. From this table it can bedetermined what the effects of the Alliance Mataura discharge at Matura Bridge (200m d/s)are given improvements in upstream E coli levels under average (i.e. annual) conditions,and under summer conditions. For example, lf upstream water quality is improved from thecurrent "Red" (worst) attribute state, to "Orange", it is predicted that when Alliance Plantwastewater 95h percentile E. coliconcentrations are less than 200,000 CFU/100mL, themedian or 95th percentile E. coliconcentrations at the site immediately downstream of thedischarge will not increase to the extent that an attribute state change is caused as a resultof the discharge. However, during summer (low-flow conditions) when gSth percentile E. coliconcentrations from the discharge exceed 160,000 CFU/100mL, it is predicted that therewill be an attribute state change from "Orange" to "Red".
May 2019
ftesh-eEr
fresh .
<dryarcrAlliance Mataura AEE51
dilrffi6l.@eleb
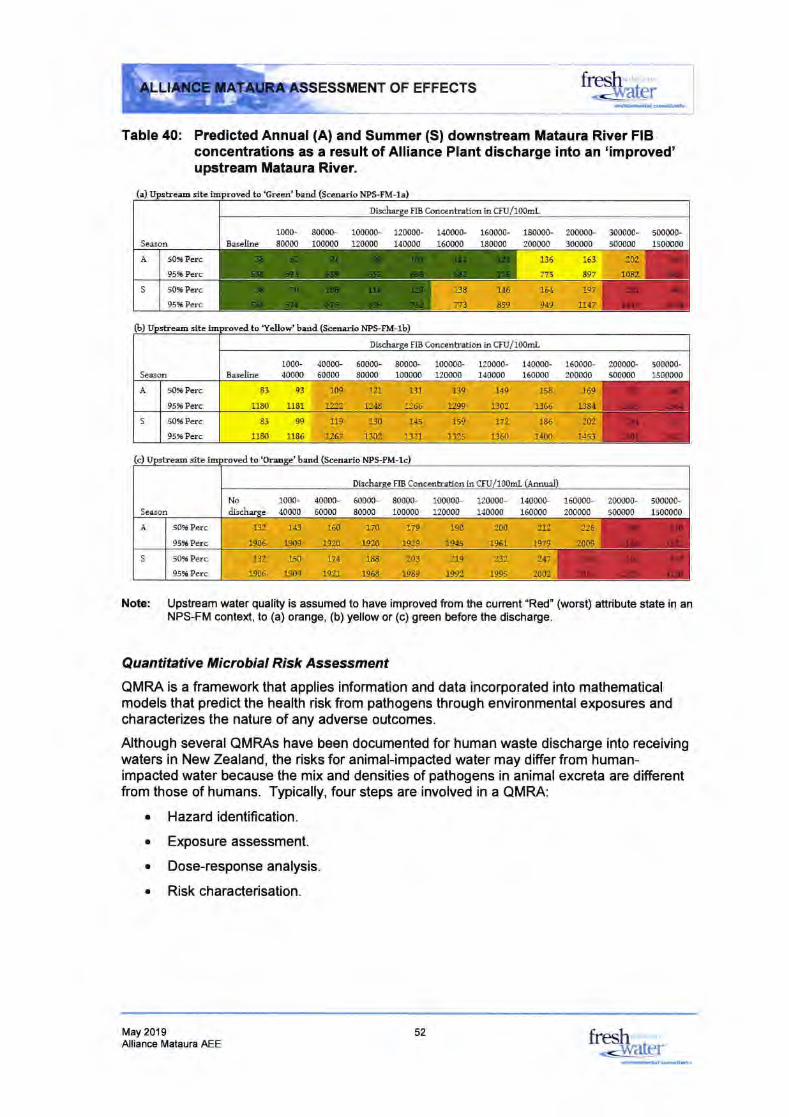
firesh" i,' r" 'dlerOF EFFECTS
Table 40: Predicted Annual (A) and Summer (S) downstream Mataura River FIBconcentrations as a result of Alliance Plant discharge into an 'improved'upstream Mataura River.
sitc to'Geeo'bad
sitc to'Ycllm'brd
sib to bud(scmio
Note: Upstream water quality is assumed to have improved from the cunent'Red'(wors$ attribute state in anNPS-FM context, to (a) orange, (b) yellow or (c) green beforE the discharge.
Quantitative Microbial Rlsk Assess ment
QMRA is a framework that applies information and data incorporated into mathematicalmodels that predict the health risk from pathogens through environmentalexposures andcharacterizes the nature of any adverse outcomes.
Although several QMRAs have been documented for human waste discharge into receivingwaters in New Zealand, the risks for animal-impacted water may differfrom human-impacted water because the mix and densities of pathogens in animal excreta are differentftom those of humans. Typically, four steps are involved in a QMRA:
r Hazardidentification.
. Exposure assessment.
. Dose-response analysis.
o Riskcharacterisation.
May 2019Alliance Mataura AEE
Dischsgc FIB Cmcsntratim ia Czu/1008L
Seasm1000-80000
8000G100(n0
100000-120000
120(DG140000
1t1000G.
lAXX)o160000-18{n00
$0m0-2m,000
200000-300fl)0
300000-5000m
s00000-15{Xn00BercInc
A 5016Perc
95,. Psc135
7t5
1(t*t
s 50rPm9596 Psc
Dischusc FIB Caccnbaffnin Czu/10OmL
Scem1000-{00(n
4000()-60000
60000-800(n
8000G100000
100000-u0000
12000G1,()000
140(n0-160000
160000-200000
200000-s00000
s00000-1500000Baselirc
A 50!6Puc
95tiPsc83 9'
um 1181
s 5096Pm
95rPscI 99
1l$t 1186
Dischme FIB Cmenhation in CFU/1008L (Amud)
5ermNo 1000-dischssr 40000
4000G.
60000
6000&80000
8000G100000
10000G12000{)
ufino-1d{,ooo
1t10000-
160000
160000-200fi)o
200000-so0000
500000-1s00000
A 50t6 Psc
95rPffis 50!6 Psc
95%Pcrc
52 fresh ," ""'- waEr
-H'trh+t ENT OF EFFECTS
dffil.dsh*
As noted in the section of pathogens in the wastewater, this work identified bacteria andprotozoa as being the most critical microbiological groups in meat processing wastewaterthat may present ahazard to human health. The representative pathogens chosen for thisQMRA were:
. Campylobacferspp., particularly C. jejuni.
o E. coli0157:H7.
o Salmonella spp.
. Cryptospoidium and Giardra spp.
The exposure site chosen was the Mataura River -330m d/s of the discharge which is adesignated recreational site and is routinely monitored by Environment Southland.Exposure pathways are given in Dada (2019a). Treated wastewater pathogenconcentrations were derived from minimum and maximum concentrations from the datasummarised in Table 40. Similarly, the maximum and minimum wastewater discharge ratesare given in Dada (2019a) and derived from 2015-2018 data as were Mataura River flowrates and dilutions.
Methods for predicting exposure doses and dose-response relationships are documented inDada (2019a) as are the methods used in risk characterization. Risk is reported as thelndividual lllness Risk (llR), calculated as the total number of infection cases divided by thetotal number of exposures, expressed as a percentage. The llR are then compared withrelevant guidelines, with 1% being the threshold for a significant risk.
Regardless of the QMRA reference pathogen used, some conclusions were the same. Theresults generally show:
o No treatment, normal discharge scenario - Very large dilution of the dischargedwastewater occuned in the receiving environment even in instances when there wasno treatment or an assumed treatment failure of the entire wastewater plant. Despitethe dilutions, the llR was still above the 1o/o threshold in winter and summer forchildren and adults.
o No treatment, peak discharge scenario - Risks were higher than in the normaldischarge scenario. llRs were also higher than the 1% threshold in winter andsummer for children and adults.
o Treatment applied, normal discharge scenario - A combination of wastewatertreatment and the effect of dilution of the discharged wastewater in the receivingenvironment produced significant reductions of risks associated with swimming tolow levels. During normalflow discharge conditions, the llR was below the 1o/o
threshold for both adults and children.
. Treatnent applied, peak discharge scenario - Risks associated with swimming atthe study site was below lhe 1% threshold for both adults and children. Thus, thereis no identifiable microbial health risk associated with swimming at the study site.Therefore, the cunent wastewater treatment applied at Alliance Plant is sufficient toreduce zoonotic pathogen concentrations and ensure health risks associated withswimming at the study site, are acceptable, even at maximum discharge of14,400 m3/d.
While the Plant discharge is having an effect on the levels of E. coli in the receiving water,observed increases in E. coliconcentrations as a result of the treated Plant discharge didnot necessarily relate to the abundance of zoonotic pathogens neither did these increasesin E. colirelate to the individual illness risk.
May 2019Alliance Mataura AEE
fresh-.JMZI[{]r
53 fresh .
<-waler
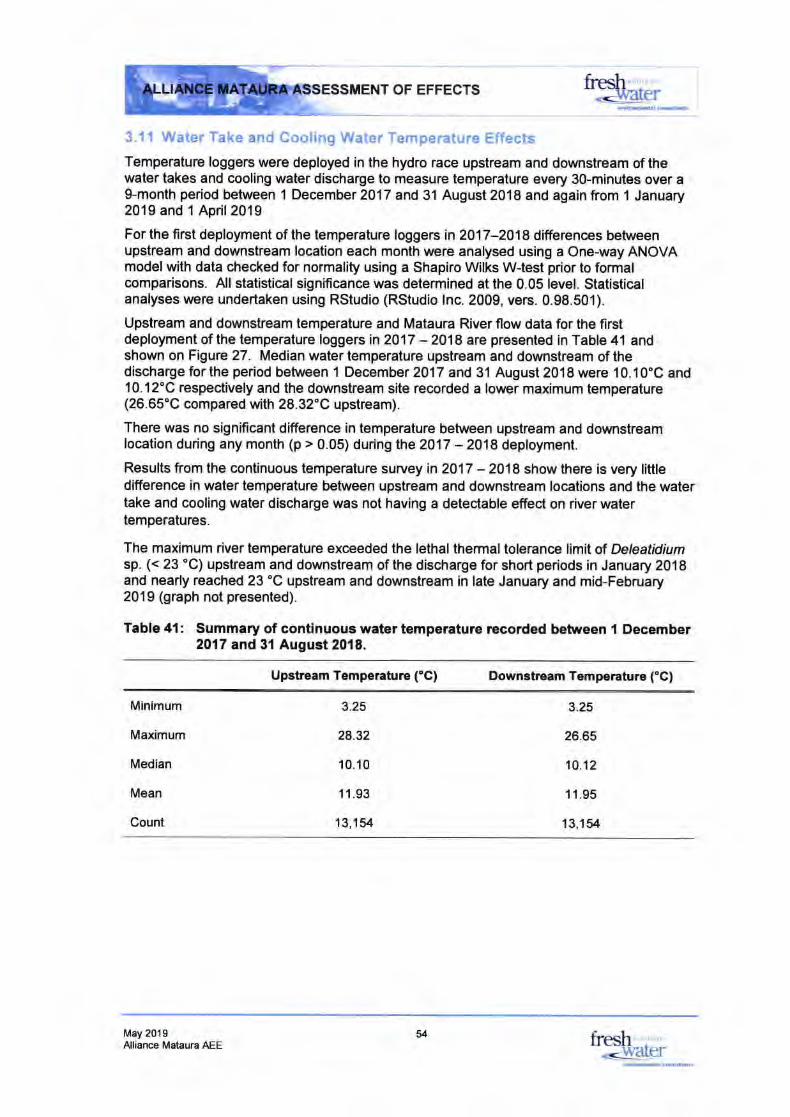
ESSMENT OF EFFECTS
3.11 Water Take and Cooling Water Temperature Effects
Temperature loggers were deployed in the hydro race upstream and downstream of thewater takes and cooling water discharge to measure temperature every 3O-minutes over a9-month period between 1 December 2017 and 31 August 2018 and again from 1 January2019 and 1 April2019
For the first deployment of the temperature loggers in2017-2018 differences betweenupstream and downstream location each month were analysed using a One-way ANOVAmodel with data checked for normality using a Shapiro Wilks W-test prior to formalcomparisons. All statistical significanoe was determined at the 0.05 level. Statistica!analyses were undertaken using RStudio (RStudio lnc. 2009, vers. 0.98.501).
Upstream and downstream temperature and Mataura River flow data for the firstdeployment of the temperature loggers in 2017 - 2018 are presented in Table 41 andshown on Figure 27. Median water temperature upstream and downstream of thedischarge for the period between 1 December 2017 and 31 August 2018 were 10.1 0"C and10.12"C respectively and the downstream site recorded a lower maximum temperature(26.65'C compared with 28.32"C upstream).
There was no significant difference in temperature between upstream and downstreamlocation during any month (p > 0.05) during lhe2017 -2018 deployment.
Results from the continuous temperature survey in 2017 - 20'18 show there is very littledifference in water temperature between upstream and downstream locations and the watertake and cooling water discharge was not having a detectable effect on river watertemperatures.
The maximum river temperature exceeded the lethal thermal tolerance limit of Deleatidiumsp. (< 23 "C) upstream and downstream of the discharge for short periods in January 2018and nearly reached 23 "C upstream and downstream in late January and mid-February2019 (graph not presented).
Table 41: Summary of continuous water temperature recorded between I December2017 and 31 August 2018.
Upstream Temperature ('C) Downstream Temperature ('C)
firesh ,dler\i,riL
Minimum
Maximum
Median
Mean
Count
3.25
28.32
10.10
11.93
13,1il
3.25
26.65
10.12
1't.95
13,154
May 2019Alliance Mataura AEE
54 fresh 'r '
---warcr
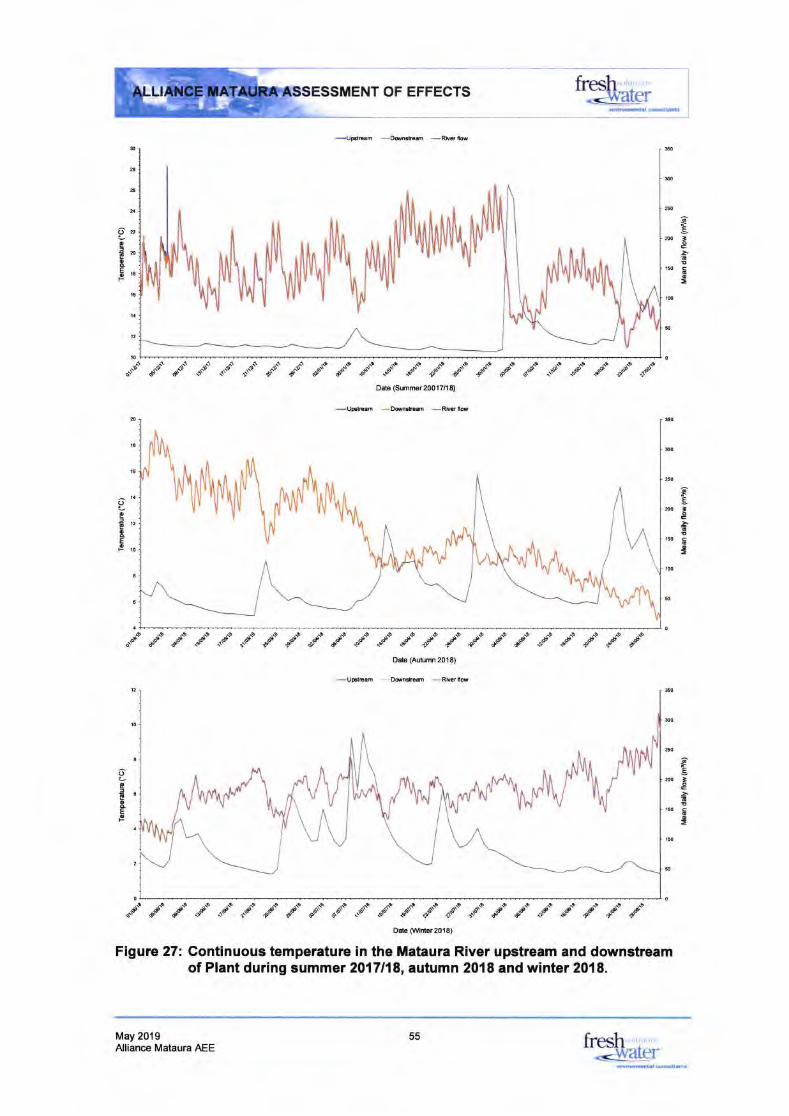
tllr*t* f -r'-:s
$
s
OF EFFECTS
-upd,m -Dqnatrn -Rk, im
Drb (Smmr200l7/18)
-uFhm -DM&.rn -Rhrid
Date (Autnn 2018)
-uFtEm -Dm*.m -Rhriil
ftrestr' ,
-sf/Varcf
o
EoE,o
&
Edll
-9.}iE
i&e
*ta
I
12
to
t0
l@
t
-d d d .d "d .d od d" ds 3so ."d' "S' ..d" tr* d* 6os df' "d"
sf' ..e'' ."d" C .s'
8
ta
tt
12
i0
s
!0
50
ot-o
EtEP
6o
IIEF
6o
tE.ofII!r.o 5*
t@
$
"e- d- d' ^e' "d' ,.d' -c'' C "r'' C' .$- .g'' ^.*f ,p'' "d"
d" .d- C- "f- .Jtr "d' ,a"' ,e''
s
6o
;E
e'
t!
160 tIt@
@
"d' C" .d'' .e" "d" C d" ,e- ds u-.s .so .s* ..Bs ds ,"- ,.-- -e'' .e'' "p'' .d'' C .d' d"Dab (Winbr20tB)
Figure 27: Continuous temperature in the Mataura River upstream and downstreamof Plant during summer 2017118, autumn 2018 and winter 2018.
May 2019Alliance Mataura AEE
55 fresh ;.e[gr
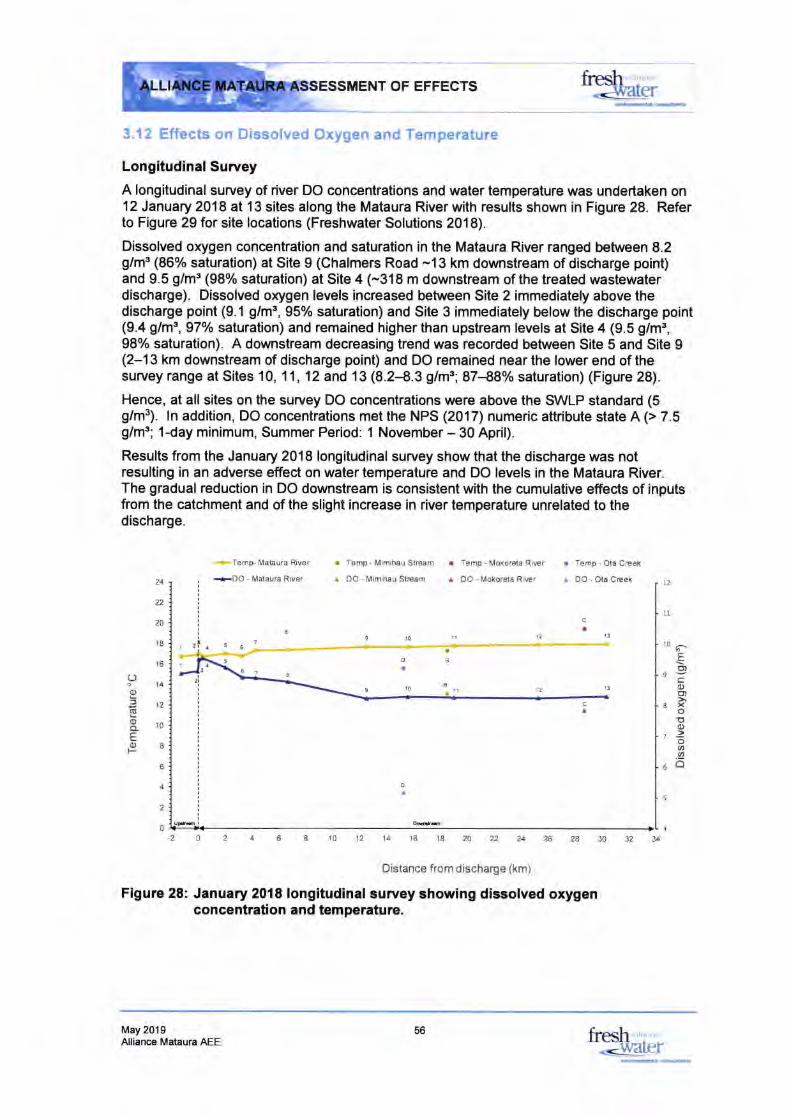
ESSMENT OF EFFECTS
3.12 Effects on Dissolved Oxygen and Temperature
Longitudinal Survey
A longitudinal survey of river DO concentrations and water temperature was undertaken on12 January 2018 al l3 sites along the Mataura River with results shown in Figure 28. Referto Figure 29 for site locations (Freshwater Solutions 2018).
Dissolved oxygen concentration and saturation in the Mataura River ranged between 8.2g/m3 (86% saturation) at Site 9 (Chalmers Road -13 km downstream of discharge point)and 9.5 g/ms (98% saturation) at Site 4 (-318 m downstream of the treated wastewaterdischarge). Dissolved oxygen levels increased between Site 2 immediately above thedischarge point (9.1 g/m3, 95% saturation) and Site 3 immediately below the discharge point(9.4 g/mt, 97% saturation) and remained higher than upstream levels at Site 4 (9.5 g/m!,98% saturation). A downstream decreasing trend was recorded between Site 5 and Site 9(2-'13 km downstream of discharge point) and DO remained near the lower end of thesurvey range at Sites 10, 11 , 12 and 13 (8.2-8.3 g/m3; 87-88% saturation) (Figure 28).
Hence, at all sites on the survey DO concentrations were above the SWLP standard (5g/m1. ln addition, DO concentrations met the NPS (2017) numeric attribute state A (> 7.5g/ms; 1-day minimum, Summer Period: 1 November - 30 April).
Results from the January 2018 longitudinal survey show that the discharge was notresulting in an adverse effect on water temperature and DO levels in the Mataura River.The gradual reduction in DO downstream is consistent with the cumulative effects of inputsfrom the catchment and of the slight increase in river temperature unrelated to thedischarge.
+Temp Mabura River . Temp - Ota CEek
. DO - Ota Ccek
fiiesh "r ''dler
O
Ef
Eoo-EOJF
24
22
20
18
16
14
12
't0
8
6
4
2
0
+DO - Malaura River
. Temp - Mimihau StDam . Temp - Mokocta Rirer
^ DO - Mimihau StEam ^
DO - Mokoreta Ri\€r
10
1Z
-2 0 2 4 6 8 10 12 14 16 18 20 22 24 26 2A 30 32 U
L2
11
1013
ca
12
Eo)Eoo,xoE(,2oo.ao
9
8
,3
c
^
11
aBD
o
10
2t
DA
4
Distance from discharge (km)
Figure 28: January 2018 longitudinal suruey showing dissolved oxygenconcentration and temperature.
May 20'19Alliance Mataura AEE
56 fresh '1"',water
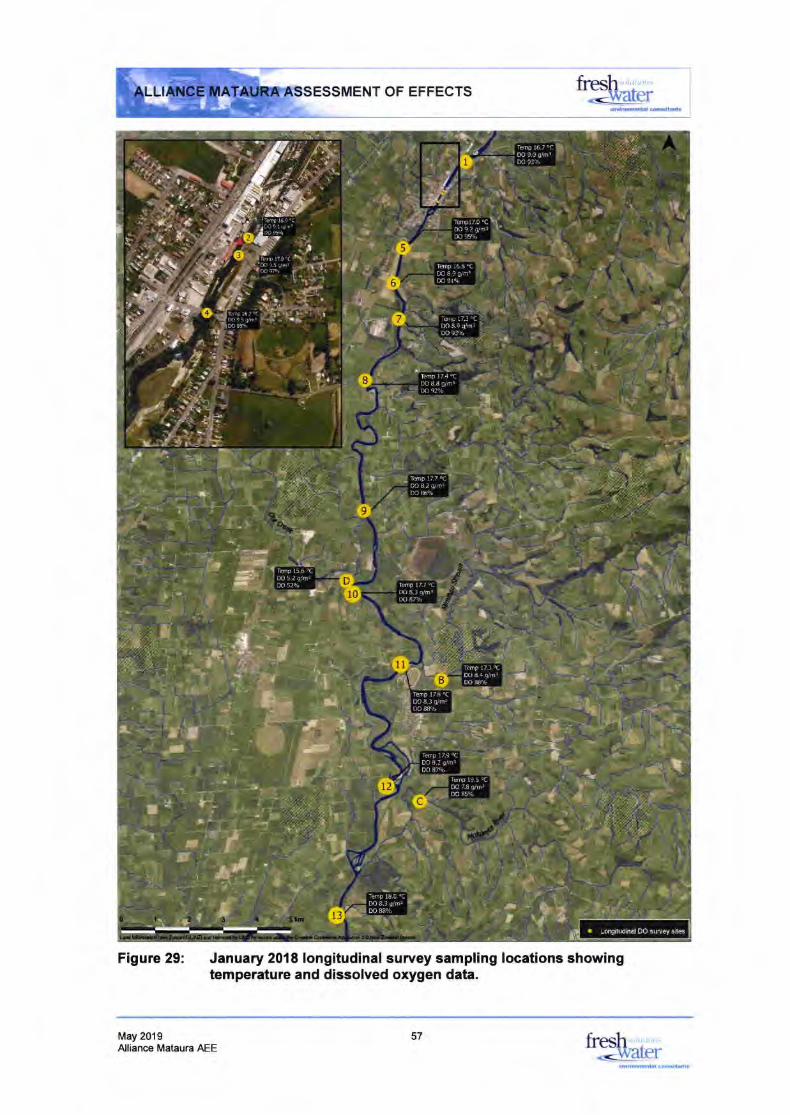
freshALLIANCE MATAURA ASSESSMENT OF EFFECTS.
<:,
Temp 16.7 'CDO 9.0 gLlmrm slj6
Ifip i6.8 'CDO 8.9 g/mrDO 91q,
Temp 174 6C
DO 8.8 g/miDO gty.
TmpDO 8.2 9/nrm ffio4
DO 5.2Itmrm 52%
kmp :29 TDO 8.1 g/mrDO 87'v"
T6p 19.5 oC
0O Z8 g/mrm 859a
. LqgitudinelDOsurueys(6
Figure 29: January 20l8longitudinal survey sampling locations showingtemperature and dissolved oxygen data.
May 201 9 freshAlliance Mataura AEE57
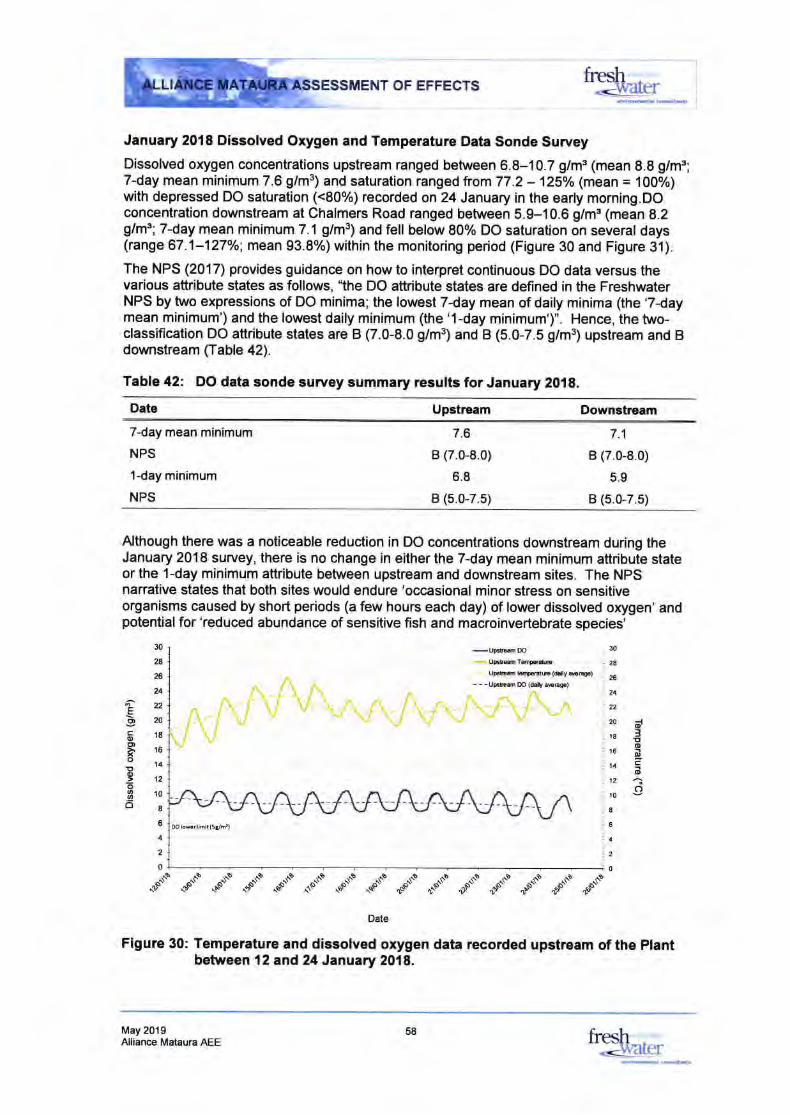
NT OF EFFECTS
January 2018 Dissolved Orygen and Temperature Data Sonde Survey
Dissolved orygen concentrations upstream ranged between 6.8-10.7 g/m3 (mean 8.8 g/m3;7-day mean minimum 7.6 g/ms) and saturation ranged from77.2 - 125o/o (mean = 100%)with depressed DO saturation (<80%) recorded on24 January in the early morning.DOconcentration downstream at Chalmers Road ranged between 5.9-10.6 g/m3 (mean 8.2g/m3; 7-day mean minimum 7.1 g/m3) and fell below 80% DO saturation on several days(range 67.1-127o/o; mean 93.8%) within the monitoring period (Figure 30 and Figure 31).
The NPS (2017) provides guidance on how to interpret continuous DO data versus thevarious attribute states as follows, "the DO attribute states are defined in the FreshwaterNPS by two expressions of DO minima; the lowest 7-day mean of daily minima (the '7-daymean minimum') and the lowest daily minimum (the '1-day minimum')". Hence, the two-classification DO attribute states are B (7.0-8.0 g/m3) and B (5.0-7.5 g/m3) upstream and Bdownstream (Iable 42).
Table 42: DO data sonde suruey summary results for January 2019.
Date Upstream Downstream
7-day mean minimum
NPS
1-day minimum
NPS
7.6
B (7.0-8.0)
6.8
B (5.0-7.5)
7.1
B (7.0-8.0)
5.9
B (5.0-7.5)
Although there was a noticeable reduction in DO concentrations downstream during theJanuary 2018 survey, there is no change in either the 7-day mean minimum attribute stateor the 1-day minimum attribute between upstream and downstream sites. The NPSnarrative states that both sites would endure 'occasional minor stress on sensitiveorganisms caused by short periods (a few hours each day) of lower dissolved orygen' andpotential for 'reduced abundance of sensitive fish and macroinvertebrate species'
30
2A
26
21
22
20 6{f16€o16 d
11 =(D12 'io
10
E
6
1
2
0
30
2E
624
EzE2051ES16:u312o.8 10
o86
4
2
0
-UFtlmOO. - UpaEmTaniddraUpds.m bnp.dE (d.ly eng.)
- - -Updrem m (d.ly m6g.)
low.rllmtr(5alm')
*As *s* C C .$-' *st' "."- .C ""* ""* ".p* ,oo* "s* os* d*
Date
Figure 30: Temperature and dissolved orygen data recorded upstream of the Plantbetween 12 and 24 January 2018.
May 2019Alliance Mataura AEE
58 fresh.<M[er
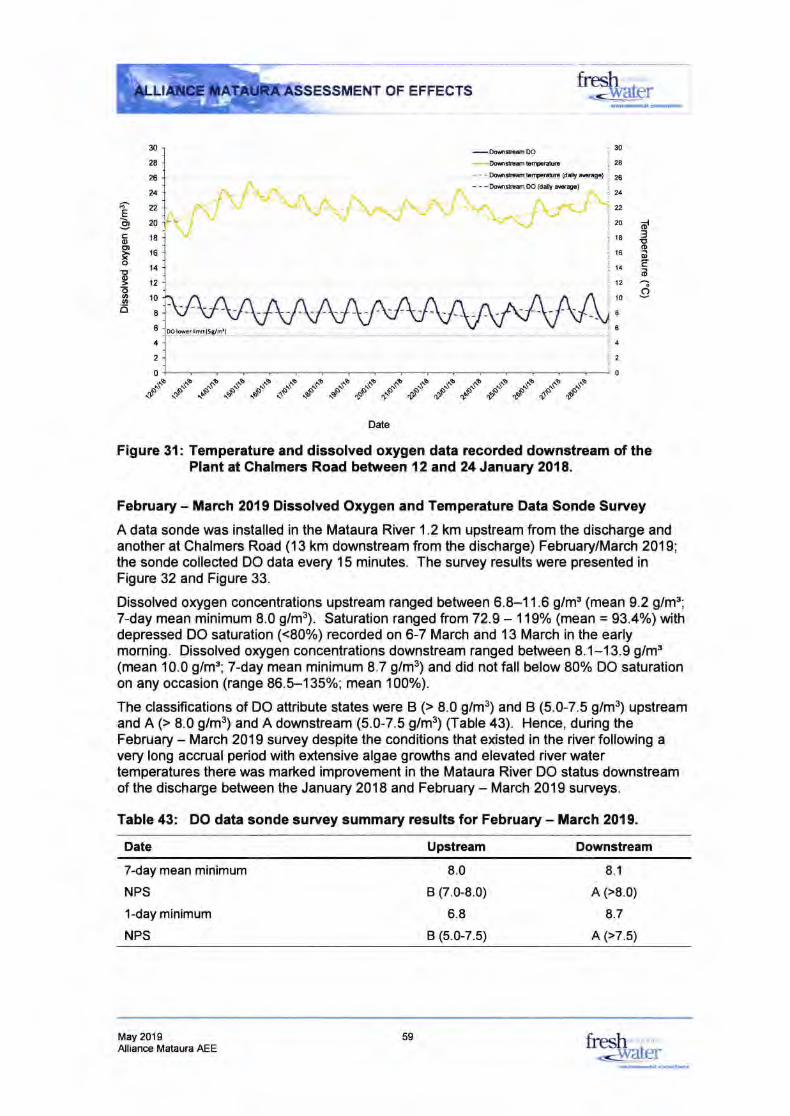
OF EFFECTSfoesh-&ter
30
2A
28
21
2.
20 61
16:o16il
uE d124
o't0
E
6
1
2
0
30
28
23
24
EzE205lE318x:n9e681068
6
1
2
0
-Dom.tm 0O
Od[tmbrFratm- - - Oflfif.s brFEtm (d!fy sreg.I- - -Owr$!hDO(ddly M.g.)
.rt .tt .rt .r,b .rt .r$ .rt ,rt .r$ ,r$ .r$ ,r$ .rt .rt .r,b ,r$ .r9
{A' -$' .$' ^.$' .$' (\S' C ""$' d' .f$' .d' d' "$' ".$' ,$' 4S' ,$'
Figure 3l: Temperature and dissolved orygen data recorded downstream of thePlant at Chalmerc Road between 12 and 24 January 2018.
February - March 2019 Dissolved Orygen and Temperature Data Sonde Survey
A data sonde was installed in the Mataura River 1.2 km upstream from the discharge andanother at Chalmers Road (13 km downstream from the discharge) February/March 2019;the sonde collected DO data every 15 minutes. The survey results were presented inFigure 32 and Figure 33.
Dissolved oxygen concentrations upstream ranged between 6.8-11.6 g/m3 (mean 9.2 g/m3;7-day mean minimum 8.0 g/m3). Saturation ranged from72.9 - 119% (mean = 93.4%) withdepressed DO saturation (<80%) recorded on 6-7 March and 13 March in the earlymoming. Dissolved o{ygen concentrations downstream ranged between 8.1-13.9 g/ms(mean 10.0 g/m"; 7-day mean minimum 8.7 g/m3) and did not fall below 80% DO saturationon any occasion (range 86.5-135%; mean 100%).
The classifications of DO attribute states were B (> 8.0 g/m3) and B (5.0-7.5 g/m3) upstreamand A (> 8.0 g/m3) and A downstream (5.0-7.5 glm3l 6able 43). Hence, during theFebruary - March 2019 survey despite the conditions that existed in the river following avery long accrual period with extensive algae growths and elevated river watertemperatures there was marked improvement in the Mataura River DO status downstreamof the discharge between the January 2018 and February - March 2019 surveys.
Table 43: DO data sonde survey summary results for February - March 2019.
Date Upstream Downstream
Date
7-day mean minimum
NPS
1-day minimum
NPS
8.0
B (7.0-8.0)
6.8
B (5.0-7.5)
8.1
A (>8.0)
8.7
A (>7.5)
May 201 9Alliance Mataura AEE fresh
_dvaler59
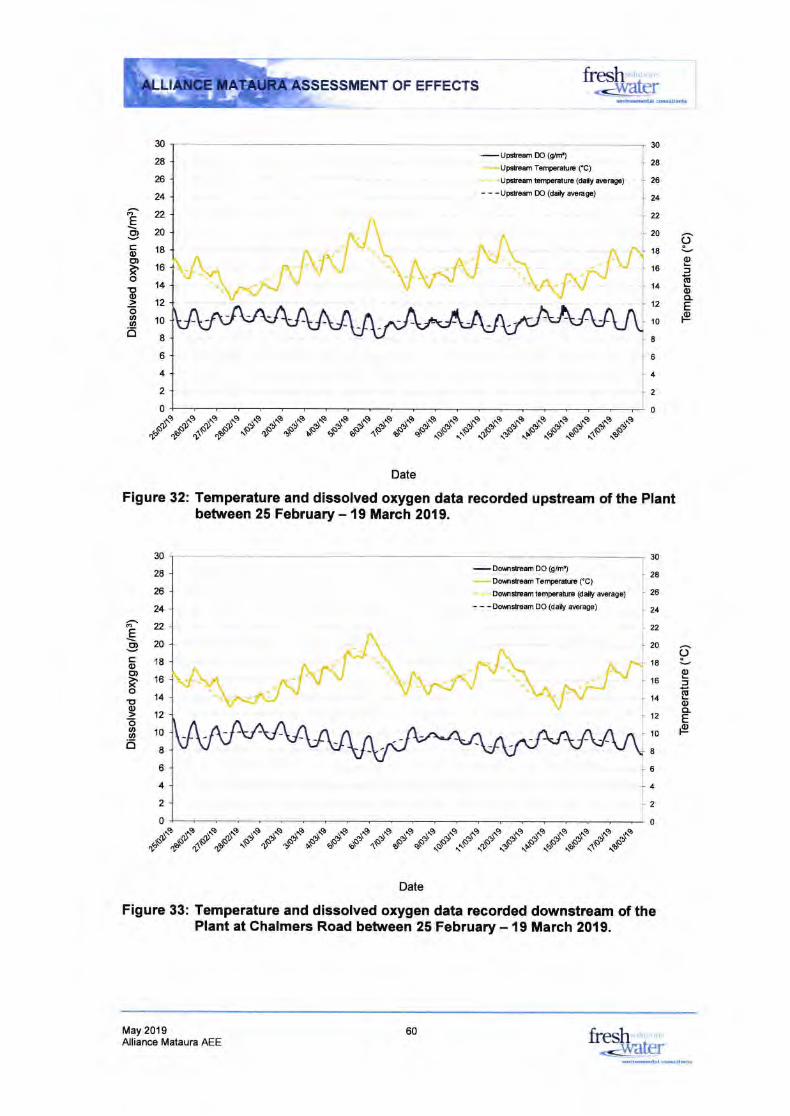
OF EFFECTS
".s1"""+""o""o'"s'Cd"Cd"d^s'C"d'."d""dC"$'.,$-S"..d'-d""C
Date
Figure 32: Temperature and dissolved orygen data recorded upstream of the Plantbetween 25 February - {9 March 2019.
,.eod"oi.o"CCd'Cd"SCCp'""o'"ooop"^-oao"^-o""o""C
Date
Figure 33: Temperature and dissolved orygen data recorded downstream of thePlant at Chalmerc Road between 25 February - 19 March 2019.
fiesh'','l',,,,.4!gr
30
28
26
21
x2
20 orE s-oro=(!11 bo-12E.o
10F
8
6
1
2
0
30
28
26
24
CD.EU205 18
$i6o!, 14
9 'rz6., 10
o86
4
2
0
3{t
28
2e
21
22
20 orE l-o
,6=
11 E129
.o10F
E
o
1
2
0
30
28
624
E
D20518916xo.cr 14
912E.8 ioo8
6
I2
0
May 2019Alliance Mataura AEE fi1ssfu ",,, ",,.@[er
fficorlbb
r-S'-k-UFr..n
OO (e,id)
-Upd3m TmFretuE (rC)
- - -tEt mlcnpmtm(d8lyurag.)- - -Updrrr OO (daily m]agc)
-DmS!8mDOG/rf)-
Doul3tra.m T.mFratn (.C)
- - -DmltlmErE returo(dafyatragr)
- - :Dqrnstm DO (dafy a|Ua0c)
60
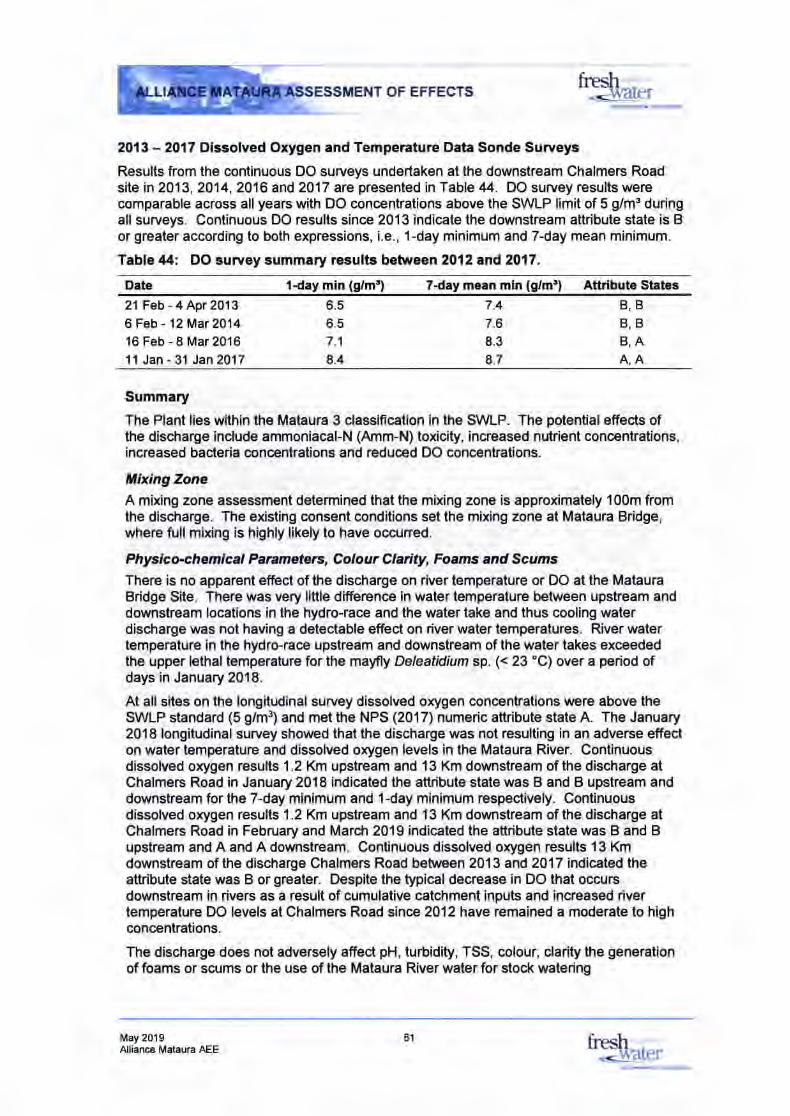
OF EFFECTSdrtuxffiulthi
2013 - 2017 Dissolved Oxygen and Temperature Data Sonde Surveys
Results from the continuous DO surveys undertaken at the downstream Chalmers Roadsite in 2013,2014,2016 and 2Q17 are presented in Table 44. DO survey results werecomparable across all years with DO concentrations above the SWLP limit of 5 g/m3 duringallsurveys. Continuous DO results since 2013 indicate the downstream attribute state is Bor greater according to both expressions, i.e., 1-day minimum and 7-day mean minimum.
Table 44: DO survey summary results between 2012 and 2017.
Date l-day min (g/m') Tday mean min (g/m!) Attribute States
21 Feb - 4 Apr 2013
6 Feb - 12Mar 201416 Feb - 8 Mar 2016
11 Jan -31 Jan2O17
6.5
6.5
7.1
8.4
7.4
7.6
8.3
8.7
B,BB,BB,AA,A
Summary
The Plant lies within the Mataura 3 classification in the SWLP. The potential effects ofthe discharge include ammoniacal-N (Amm-N) toxicity, increased nutrient concentrations,increased bacteria concentrations and reduced DO concentrations.
Mixing ZoneA mixing zone assessment determined that the mixing zone is approximately 100m fromthe discharge. The existing consent conditions set the mixing zone at Mataura Bridge,where full mixing is highly likely to have occuned.
Physico-chemical Parameters, Colour Clarity, Foams and Scums
There is no apparent effect of the discharge on river temperature or DO at the MatauraBridge Site. There was very little difference in water temperature between upstream anddownstream Iocations in the hydro-race and the water take and thus cooling waterdischarge was not having a detectable effect on river water temperatures. River watertemperature in the hydro-race upstream and downstream of the water takes exceededthe upper fethal temperature for the mayfly Deleatidium sp. (< 23 "C) over a period ofdays in January 2018.
At all sites on the longitudinal survey dissolved oxygen concentrations were above theSWLP standard (5 g/m3) and met the NPS (2017) numeric attribute state A. The January2018 longitudinal survey showed that the discharge was not resulting in an adverse effecton water temperature and dissolved orygen levels in the Mataura River. Continuousdissolved oxygen results 1 .2 Km upstream and 13 Km downstream of the discharge atChalmers Road in January 2018 indicated the attribute state was B and B upstream anddownstream for the 7-day minimum and 1-day minimum respectively. Continuousdissolved orygen results 1.2Km upstream and 13 Km downstream of the discharge atChalmers Road in February and March 2019 indicated the attribute state was B and Bupstream and A and A downstream. Continuous dissolved oxygen results 13 Kmdownstream of the discharge Chalmers Road between 2013 and 2017 indicated theattribute state was B or greater. Despite the typical decrease in DO that occursdownstream in rivers as a result of cumulative catchment inputs and increased rivertemperature DO levels at Chalmers Road since 2012 have remained a moderate to highconcentrations.
The discharge does not adversely affect pH, turbidity, TSS, colour, clarity the generationof foams or scums or the use of the Mataura River water for stock watering
May 2019Alliance Mataura AEE
61 fresh.!-water
ESSMENT OF EFFECTS
Nutrienb
BOD concentrations were similar at the Hydro-race Site and Mataura Bridge Sites andbelow the guideline of <2 g/ms for avoiding nuisance heterotrophic growths. Hence,effects on aquatic biota, or the formation of heterotrophic growths, immediatelydownstream of the discharge due to BOD are not anticipated. Regular visualobservations during summer low flow conditions by Alliance staff between 2013 and 2018have not recorded sewage fungus. A small amount of sewage fungus was observed atSite D1 during the March 2019 periphyton and benthic invertebrate survey with the aid ofa viewer. The sewage fungus or heterotrophic growths were not visible to the naked eyeand were not assessed as a conspicuous heterotrophic growth.
Annual median nitrate-nitrogen concentrations met the NPS (2017) numeric attributestate A for toxicity at the Hydro-race Site and Mataura Bridge Sites across the samplingperiod.
The change from Amm-N attribute state A, upstream, to B, downstream, is a change froma99o/o species protection levelto agSo/o species protection level, i.e., 5o/o of the mostammoniacal nitrogen sensitive species may be occasionally affected. The only species inthe upper 5% most Amm-N sensitive species are freshwater mussels, which do not occurin the Mataura River upstream and downstream the discharge. Those ammoniacalnitrogen sensitive species that do occur in the Mataura River in the vicinity of thedischarge are the mayfly Deleatidium sp. and the snail Potamopyrgus antipodarum, butthese fall within the top 20o/o of sensitive species that are protected by the Attribute Bstate.
TN concentrations were similar at the Hydro-race Site and Mataura Bridge Site betweenDecember 2017 andAugust 2018.
Mean monthly DIN concentrations at biological monitoring sites upstream anddownstream of the discharge exceeded the MfE periphyton guideline for protectingbenthic biodiversity (50 mg chlorophyll a/m2) across allgrowth periods (MfE 2000).
DRP concentrations were slightly higher at biological monitoring sites upstreamcompared to biologica! monitoring downstream sites with the mean monthly DRPconcentrations exceeding the MfE periphyton guideline for protecting benthic biodiversity(50 mg chlorophyll a/m2) at all sites. However, the periphyton cover and biomass surveyresults since 2012 suggest that DIN and DRP are not causing nuisance levels ofperiphyton.
The TN discharge contribution to the Toetoes Estuary load from the discharge is 1.1-1.7o/o and the estimated TP discharge contribution is 0.7-1.3o/o with the vast majority ofTN and TP load entering Toetoes Estuary being derived from other catchment inputsparticularly diffuse sources. Even a marked reduction of the discharge TN and TP loadswould have little, if any, detectable effect on the nutrient status of the lower Mataura Riverand Toetoes Estuary but it is acknowledged that Alliance will need to reduce its levelsover time as part of catchment wide initiatives to improve water quality.
lOicrobes
While the Plant discharge is having an effect on the levels ot E. coliin the receiving water,observed increases in E. coliconcentrations as a result of the treated Plant discharge didnot necessarily relate to the abundance of zoonotic pathogens neither did theseincreases in E. colirelate to the individual illness risk. However, Alliance will need toinvestigate a reduc{ion in bacterial levels to meet the NPS-FM.
May 2019Alliance Mataura AEE
62 fresh-=-Watef
OF EFFECTS
4.0 Ecological Effects
4.1 Potential Effects
The potential adverse ecological effects associated with the Plant discharges are:
. Proliferation of nuisance algal growths including thick mats of periphyton (e.9.,Phormidium) and filamentous green algae.
. Reduced benthic invertebrate community health.
. Reduced fish abundance, diversity and health.
. Recreationaleffects.
The potential ecologicaleffects assessed in this report and summarised in Table 18. A briefsummary of the nature and extent of these potential effects is set out below and is followedby a detailed assessment of each effect.
Nuisance Algal Growths
Nuisance algal growths include sewage fungus (MFE 1992) and periphyton (MFE 2000).The discharge location and elevated nutrient concentrations in the discharge and receivingenvironment have the potentialto elevate nutrient levels leading to the proliferation ofperiphyton that in tum can alter pH and DO levels and affect a range of aquatic biota (MfE2000). Algal growths are the most direct indicator of nutrient related effects on rivers andhave been monitored at least annually since 2012. The existing periphyton data settherefore provides a sound basis on which to assess the potential effects of the cunentdischarges and take.
Benthic lnvertebrate Community
Benthic invertebrates have been monitored at least annually since the early 1990s. Theexisting benthic invertebrate data set therefore provides a sound basis on which to assessthe potential effects of the cunent discharges and take. The benthic macroinvertebratecommunity in the Mataura River reflects the location, land use and modification throughoutthe catchment. The benthic community is dominated by the water and habitat sensitivemafly Deleatidium sp. The invertebrate community is an important component of theecosystem (e.9. through grazing pressure controlling algal growths and as a food source fornative fish and trout). There is potential for the discharge to result in adverse effectsindirectly through stimulating algal growths or directly through toxicity (e.9., Amm-N effects).
Fish
The Mataura River supports significant native fish and trout populations and providesseasonal adult habitat and feeding areas for inanga, brown trout and salmon. Thedischarge has the potentialto have direct effects (e.9., through Amm-N toxicity) on fishdiversity and abundance within the mixing zone and the lower Mataura River downstream ofthe discharge and indirect effects through altered habitat (e.9., periphyton growths) andaltered food sources (e.9., benthic invertebrate community composition) in the mixing zone,lower Mataura River and Toetoes Estuary.
The lower Mataura River is a migratory pathway for a range of whitebait species, browntrout and salmon. The Amm-N concentrations within the discharge have the potentialtoaffect fish migration and resident fish within the mixing zone.
firesh rdlgr
May 2019Alliance Mataura AEE
63 fresh 'r "warcr
NT OF EFFECTS
Fish abundance and health can be influenced by a wide range of factors including proximityto the coast, barriers such as the Mataura Falls, habitat quality and water quality. Fish aretherefore not the best indicators of the potential effects associated with the Plant. A fishsurvey using an electric fishing machine was undertaken at the routine biological monitoringsites (Ul , U2, D1 and D2) on 25 and 26 February 2019. A fish survey was also undertakenbetween the Mataura Bridge and Mataura Falls by setting baited fine mesh fyke netsovernight on 25 February 2019.
Recreational Use and Value
The lower Mataura is used for a range of activities with the main ones being trout fishing,white baiting and game bird hunting. Toetoes Estuary is an important area for non-contact(walking, fishing, bird watching, picnicking etc.) and contact recreation and as aconsequence the faecal indicator bacteria load and nitrogen concentrations in the dischargehas the potential to adversely affect humans. The discharge has the potential to contributeto the cumulative negative effects of the wider catchment on the recreational values byaltering water quality and biological communities.
4.2 Summary of Surveys and Statistical Analysis
Surveys and Data Collection
A summary of the surveys and data collected is presented in Table 45. Refer to compliancemonitoring reports for detailed description of sampling methodology. All ecologicalsampling has been canied out in accordance with standard national guidelines.
Un ivariate Statistical Analysis
Univariate statistical analysis was carried out on invertebrate and periphyton variablesbetween 2012-2017 and2012-2018 respectively. Variables from the invertebrate datasetincluded the number of taxa, total abundance, number of EPT individuals, percent EPTabundance, MCI and QMCI scores and abundance of Deleatidium. Periphyton variablesincluded are chlorophyll-a (mg/sample and mg/m2), AFDW (mg/sample and mg/m2) andAutotrophic lndex (A!).
The sampling design for invertebrates and periphyton was such that there were twolocations for comparison (i.e., upstream and downstream). Within each location there weretwo sites nested within each location (i.e., upstream 1, upstream 2, downstream 1 anddownstream 2 respectively). Each of the sites had five independent replicate samples.
Allvariables were checked for normality using a Shapiro Wilks W-test prior to formalcomparisons. Where data was determined to depart from expected normality they werechecked for lognormaldistribution. For invertebrates, taxa and MCI were normallydistributed. The remaining data was natural tog(x+1) transformed to improve normality.Only EPT and percent EPT failed to improve in normality. For Periphyton, all data acrossyears was deemed non-normally distributed. A log transformation improved chlorophyll-aand Autotrophic index; however, the data was not lognormally distributed either (using KSLtests). Only AFDW variables were determined to be lognormally distributed.
For normal, lognormal, and natural log(x+1) transformed data standard two-way crossedANOVA techniques were used to determine differences between upstream/downstreamlocations across time. Periphyton data was analysed on the lognormal scale but alsocorreclly analysed using nonparametric methods (e.9., Wilcoxon/KruskalWallis tests).
firesh ,
-daler
May 2019Alliance Mataura AEE
64 fresh "; ,
-water
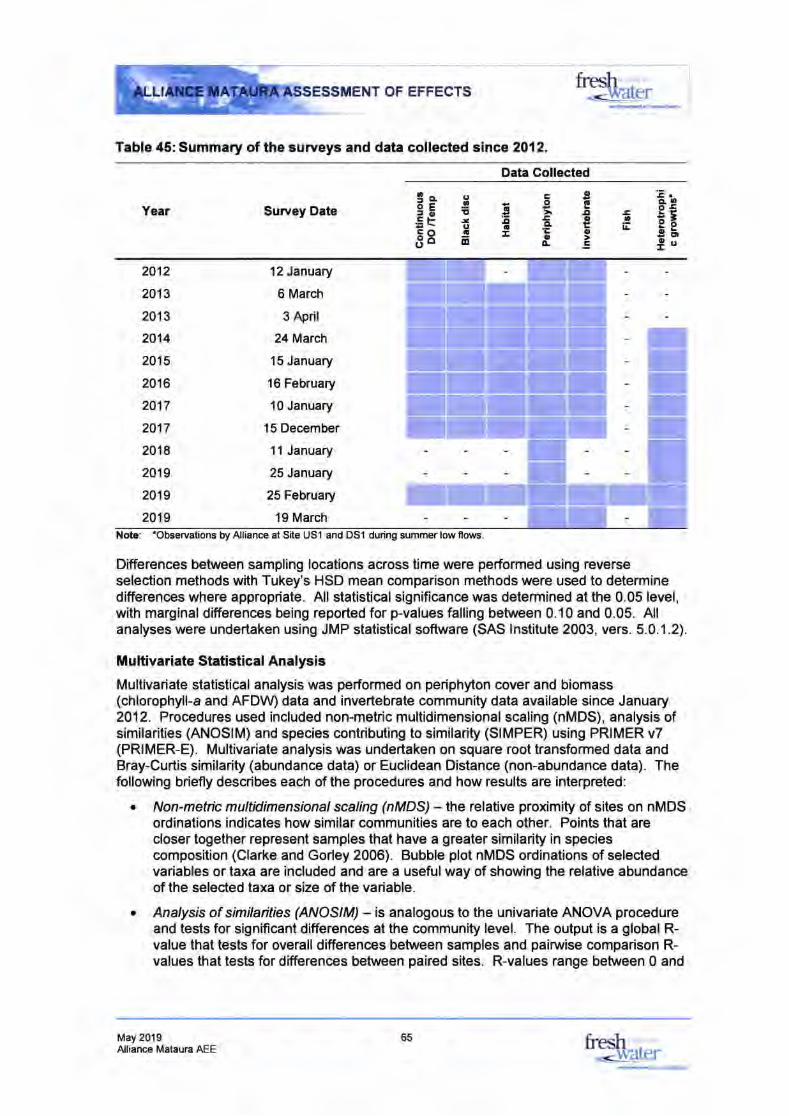
OF EFFECTS
Table 45: Summary of the suryeys and data collected since 2012.
%il#
Data Collected
Year
2012
2013
2013
2014
2015
2016
2017
2017
2018
2019
2019
2019
Survey Date
12 January
6 March
3 April
24 March
15 January
16 February
10 January
15 December
11 January
25 January
25 February
19 March
CeE8
Eo
coo.
aECI
(,,E!a,ao
oaooEoE
E!IL
tr
t'Ee5aeI.
Nob: 'Observations by Alliance at Site US1 and DSI during summer low forvs.
Differences between sampling locations across time were performed using reverseselection methods with Tukey's HSD mean comparison methods were used to determinedifferences where appropriate. All statistical significan@ was determined at the 0.05 level,with marginal differences being reported for pvalues falling betureen 0.10 and 0.05. Allanalyses were undertaken using JMP statistical sofhrvare (SAS lnstitute 2003, vers. 5.0.1.2).
Mu ltivariate Statistical Analysis
Multivariate statistical analysis was performed on periphyton cover and biomass(chlorophyll-a and AFDW) data and invertebrate community data available since January2012. Procedures used included non-metric multidimensionalscaling (nMDS), analysis ofsimilarities (ANOSIM) and species contributing to similarity (SIMPER) using PRIMER v7(PRIMER-E). Multivariate analysis was undertaken on square root transformed data andBray-Curtis similarity (abundance data) or Euclidean Distance (non-abundance data). Thefollowing briefly desoibes each of the procedures and how results are interpreted:
o Non-metric multidimensional scaling (nMDS) - the relative proximity of sites on nMDSordinations indicates how similar communities are to each other. Points that arecloser together represent samples that have a greater similarity in speciescomposition (Clarke and Gorley 2006). Bubble plot nMDS ordinations of selectedvariables or taxa are included and are a useful way of showing the relative abundanceof the selected taxa or size of the variable.
t Analysis of similarities (ANOSTM) - is analogous to the univariate ANOVA procedureand tests for significant differences at the community level. The output is a global R-value that tests for overall differences between samples and painrise comparison R-values that tests for differences between paired sites. R-values range between 0 and
May 2019Alliance Mataura AEE
65 fipgfu ",,,',''ler
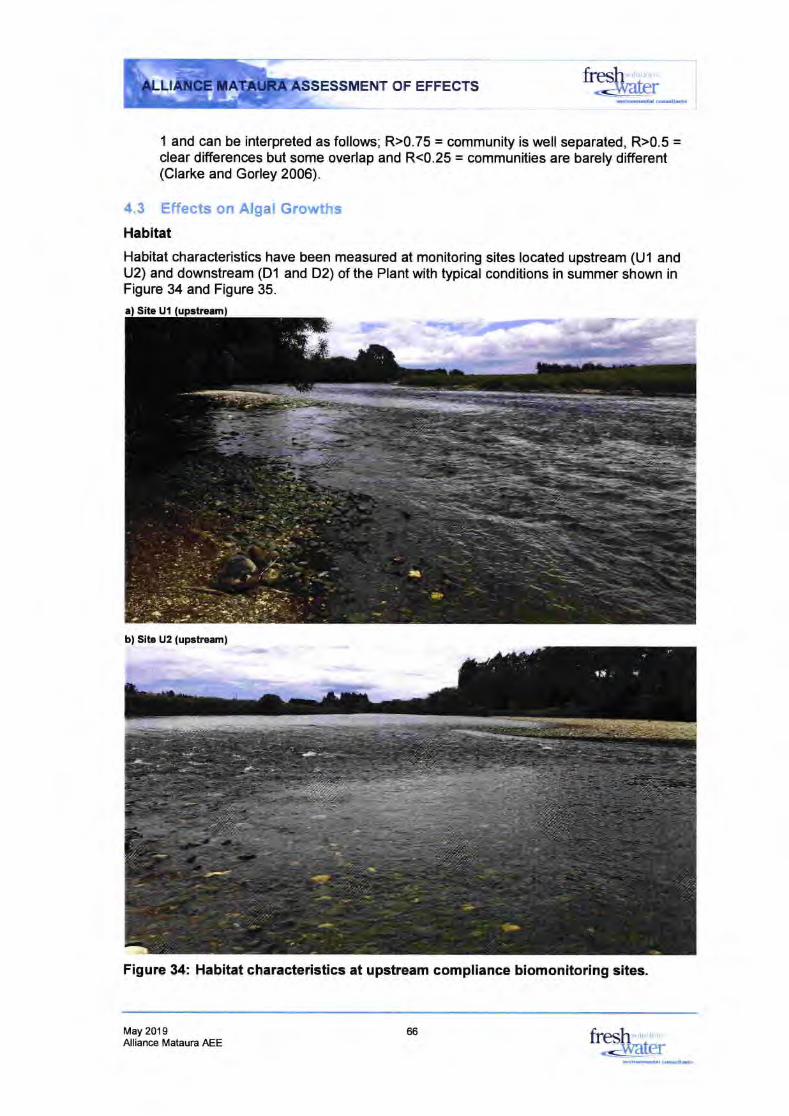
OF EFFECTSfresh
-<!ryalerdvtrffifitrl cl*dtdc
1 and can be interpreted as follows; R>0.75 = community is well separated, R>0.5 =clear differences but some overlap and R<0.25 = communities are barely different(Clarke and Gorley 2006).
4.3 Effects on Algal Growths
Habitat
Habitat characteristics have been measured at monitoring sites located upstream (Ul andU2) and downstream (D1 and D2) of the Plant with typical conditions in summer shown inFigure 34 and Figure 35.
Site Ul
b) Site U2 (upetream)
Figure 34: Habitat characteristics at upstream compliance biomonitoring sites.
May 201 9Alliance Mataura AEE
66 fresh.da[er
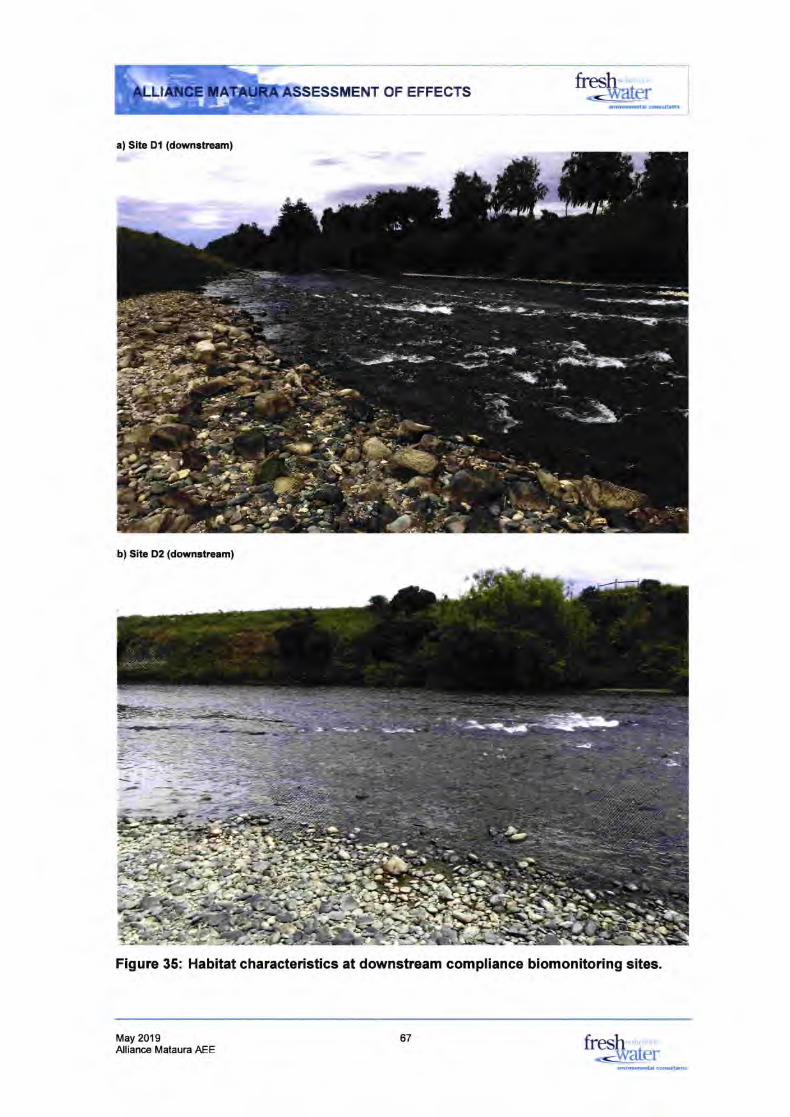
OF EFFECTS
a) Site Dl (downstream)
b) Sato D2 (downrtream)
Figure 35: Habitat characteristics at downstream compliance biomonitoring sites.
fresh-<lryaler
May 201 9Alliance Mataura AEE fresh
---willer67
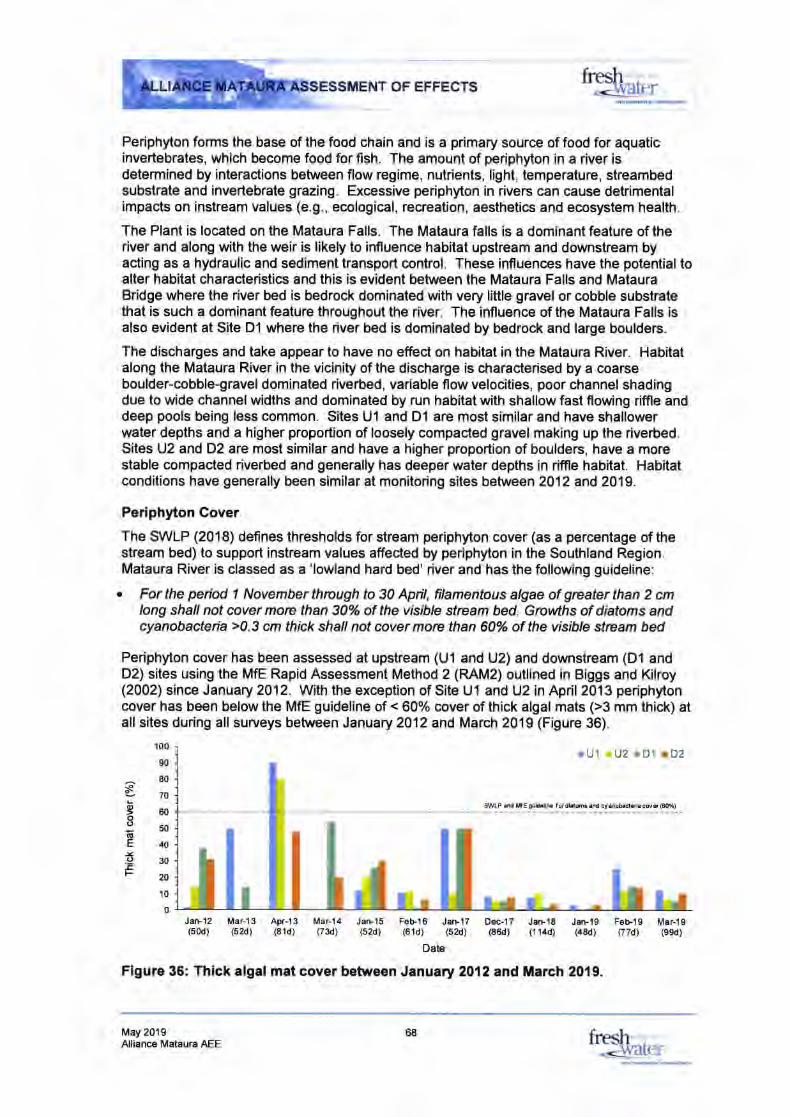
OF EFFECTS
Periphyton forms the base of the food chain and is a primary source of food for aquaticinvertebrates, which become food for fish. The amount of periphyton in a river isdetermined by interactions between flow regime, nutrients, light, temperature, streambedsubstrate and invertebrate grazing. Excessive periphyton in rivers can cause detrimentalimpacts on instream values (e.9., ecological, recreation, aesthetics and ecosystem health.
The Plant is located on the Mataura Falls. The Mataura falls is a dominant feature of theriver and along with the weir is likely to influence habitat upstream and downstream byacting as a hydraulic and sediment transport control. These influences have the potential toalter habitat charac{eristics and this is evident between the Mataura Falls and MatauraBridge where the river bed is bedrock dominated with very little gravel or cobble substratethat is such a dominant feature throughout the river. The influence of the Mataura Falls isalso evident at Site D1 where the river bed is dominated by bedrock and large boulders.
The discharges and take appear to have no effect on habitat in the Mataura River. Habitatalong the Mataura River in the vicinity of the discharge is characterised by a coarseboulder-cobble-gravel dominated riverbed, variable flow velocities, poor channel shadingdue to wide channe! widths and dominated by run habitat with shallow fast flowing riffle anddeep pools being less common. Sites Ul and Dl are most similar and have shallowerwater depths and a higher proportion of loosely compacted gravel making up the riverbed.Sites U2 and D2 are most similar and have a higher proportion of boulders, have a morestable compacted riverbed and generally has deeper water depths in riffle habitat. Habitatconditions have generally been similar at monitoring sites between 2012 and 2019.
Periphyton Cover
The SWLP (2018) defines thresholds for stream periphyton cover (as a percentage of thestream bed) to support instream values affected by periphyton in the Southland Region.Mataura River is classed as a'lowland hard bed' river and has the following guideline:
c Forthe period 1 Novemberthrcugh to 30 April, filamentous algae of grcaterthan 2 cmlong shall not cover morc than 30% of the visible strcam bed. Growths of diatoms andcyanobacteia >0.3 cm thick shall not cover mote than 60% of the visible strcam bed
Periphyton cover has been assessed at upstream (U1 and U2) and downstream (Dl andD2) sites using the MfE Rapid Assessment Method 2 (RAM2) outlined in Biggs and Kilroy(2002) since January 2012. With the exception of Site U1 and U2 in Apri! 2013 periphytoncover has been below the MfE guideline of < 60% cover of thick algal mats (>3 mm thick) atall sites during all surveys between January 2012 and March 2019 (Figure 36).
.U1 ,U2 rD1 rD2
SrlrLP rld ,,, E elldCm fd dl6. drd cy .nobd.d. cov d (60%)
.t00
90
80
t709eoo:50GE40.Y.9 30EL'20
10
0JaG12(50d)
Mar-13(52d)
Apr-1 3(81d)
Jan-19(48d)
Feb19o7d\
Mar-19(9sd)
Mar-14 JarF1so3d) (s2d)
Feb-16 Jeft17(61d) (s2d)
Date
Dec-17 JarF18(86d) (114d)
Figure 36: Thick algal mat cover between January 2012 and March 2019.
May 2019Alliance Mataura AEE
68 fresh .
<-walermdr!.rtB6l6or!hi.
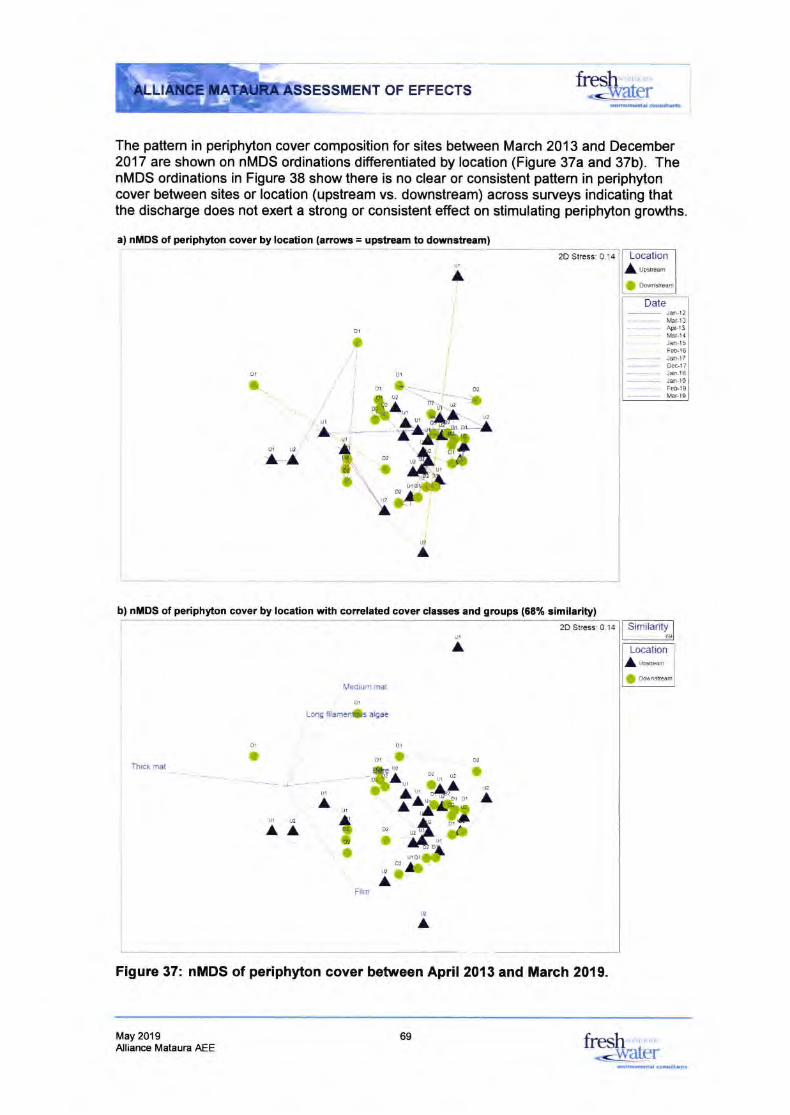
,fu'{L. i-.,t-r.
ftesh!-waterESSMENT OF EFFECTS
The pattem in periphyton cover composition for sites between March 2013 and December2017 are shown on nMDS ordinations differentiated by location (Figure 37a and 37b). ThenMDS ordinations in Figure 38 show there is no clear or consistent pattern in periphytoncover between sites or location (upstream vs. downstream) across surveys indicating thatthe discharge does not exert a strong or consistent effect on stimulating periphyton growths.
a) nt$DS of periphyton cover by location (arrowc = upsfeam to down3beam)
2D Stress: 0.14 Location
I uo*"r,
I ownsream
02.lo2*,:-l
Date*.. - Jan-12
Mar-1 3Ag-13krr4Jen-15FeEl6
- Jan-17D*-17
- Jan-18- Janlo
Febl9kr-r0
A
a.
,l tII
U1 U2.lAil
b) ntrlDS of periphyton cover by location with corrclated cover classos and groups (68% similarity)2D Str*s: 0.'14
Medrum mto1
Long filamenfs algae
Thick mal
Film
ol
a
Sii,'#i ^Jlrli'; ih*b
^^ u-roraf
L;-
ol
ol
,
U1
o2
I
\12l'
D1
to1
a
UI
A
A Location
A urn u.
I Down*eam
c2
a02
A!l
A iIa
AA
ti
^'
Figure 37: nMDS of periphyton cover between April 2013 and March 2019.
May 2019Alliance Mataura AEE fresh
-waler69
6vr.il6drl co..(hffrr
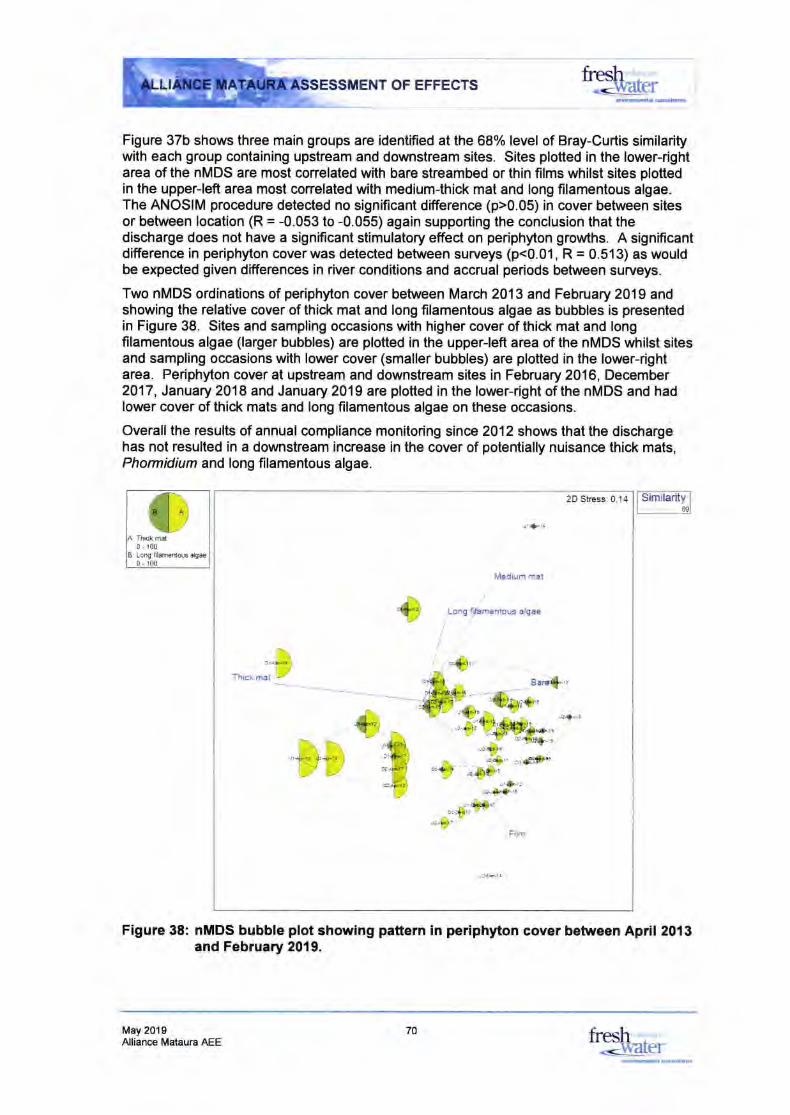
NT OF EFFECTSfresh
*<-!vielersvrrmn*trl .a.ultrnlr
Figure 37b shows three main groups are identified at the 68% level of Bray-Curtis similaritywith each group containing upstream and downstream sites. Sites plotted in the lower-rightarea of the nMDS are most correlated with bare streambed or thin films whilst sites plottedin the upper-lefi area most correlated with medium-thick mat and long fllamentous algae.The ANOSIM procedure detected no significant difference (p>0.05) in cover between sitesor between location (R = -0.053 to -0.055) again supporting the conclusion that thedischarge does not have a significant stimulatory effect on periphyton growths. A significantdifference in periphyton cover was detected between surveys (p<0.01, R = 0.513) as wouldbe expected given differences in river conditions and accrual periods between surveys.
Two nMDS ordinations of periphyton cover between March 2013 and February 2019 andshowing the relative cover of thick mat and long filamentous algae as bubbles is presentedin Figure 38. Sites and sampling occasions with higher cover of thick mat and longfilamentous algae (larger bubbles) are plotted in the upper-left area of the nMDS whilst sitesand sampling occasions with lower cover (smaller bubbles) are plotted in the lower-rightarea. Periphyton cover at upstream and downstream sites in February 2016, December2017 , January 2018 and January 2019 are plotted in the lower-right of the nMDS and hadlower cover of thick mats and long filamentous algae on these occasions.
Overall the results of annual compliance monitoring since 2012 shows that the dischargehas not resulted in a downstream increase in the cover of potentially nuisance thick mats,Phormidium and long filamentous algae.
Irq Thrck md
0-1003 Long ilarentous dge
0-100
20 Stress: 0.1 4
,.+..1.
\4edrum mat
o Lcng iilamentous algae
"hrck mal J-.5i"
=& -. aard-'
.ffifl,,-Gi+;+'Y .i;a:'!$tpir,- , '. '
l. jj=iq-f+.,-]1'),,r-6,- .,.1gP'*=,t, ""&&;
fi..r).':
o: -{}} 'r
. a4}'
Fn
Similanty
Figure 38: nMDS bubble plot showing pattern in periphyton cover between Apri! 2013and February 2019.
May 2019Alliance Mataura AEE
70 fresh-<yiater
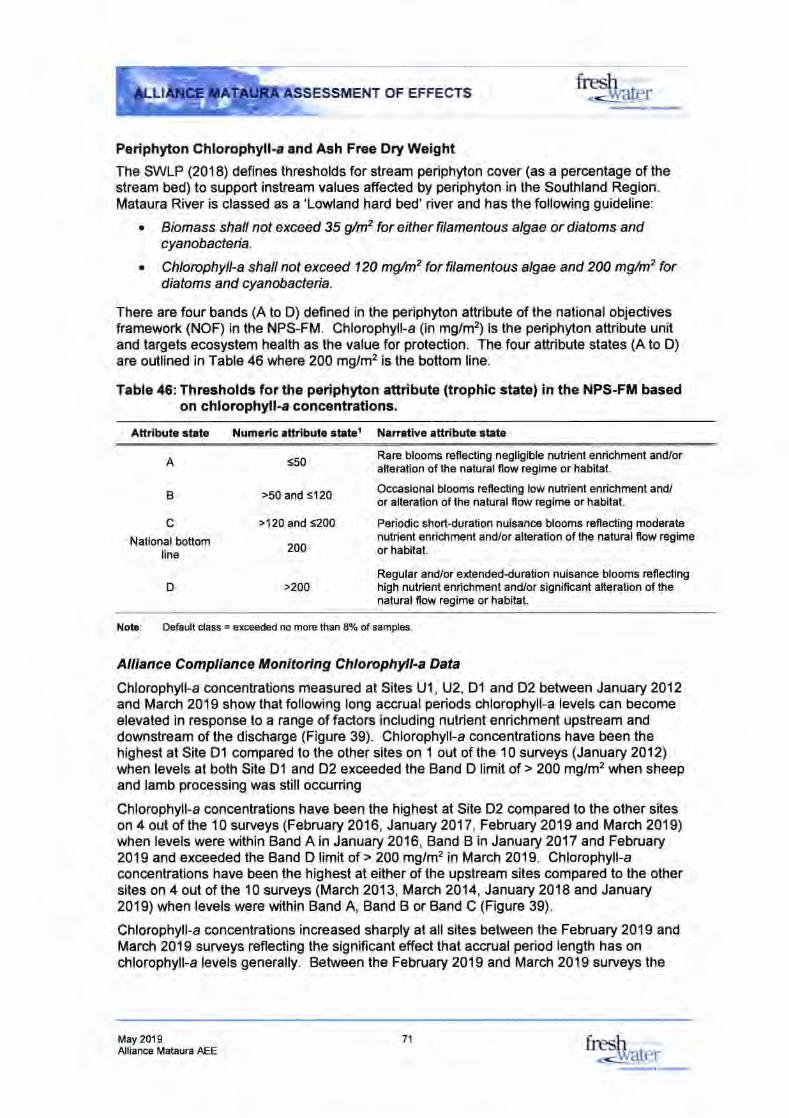
ESSMENT OF EFFECTS
Periphyton Chlorophyl!-a and Ash Free Dry Weight
The SWLP (2018) defines thresholds for stream periphyton cover (as a percentage of thestream bed) to support instream values affected by periphyton in the Southland Region.Mataura River is classed as a'Lowland hard bed' river and has the following guideline:
c Biomass sha/l not exceed 35 g/mz for eitherfilamentous algae or diatoms andcyanobacteria.
o Chtontphylt-a shall not exceed 120 mglm2 forfilamentous algae and 200 mglm2 fordiatom s and cyanobacteria.
There are four bands (A to D) defined in the periphyton attribute of the national objectivesframework (NOF) in the NPS-FM. Chlorophyll-a (in mg/m2) is the periphyton attribute unitand targets ecosystem health as the value for protection. The four attribute states (A to D)are outlined in Table 46 where 200 mg/m2 is the bottom line.
Table 46: Thresholds for the periphyton attribute (trophic state) in the NPS-FM basedon chlorophyll-a concentrations.
Aftribute state Numeric attribute stater Narrative attribute state
fresh_-warcr
B
cNational bottom
line
<50
>50 and <120
>120 and <200
200
>200
ARare blooms reflecting negligible nutrient enrichment and/oralteration of the natural flow regime or habitat.
Occasional blooms reflecting low nutrient enrichment and/or alteration of the natural flow regime or habitat.
Periodic short{uration nuisance blooms reflecting moderatenutrient enrichment and/or alteration of the natural flow regimeor habitat.
Regular and/or extended{uration nuisance blooms reflectinghigh nutrient enrichment and/or significant alteration of thenatural fiow regime or habitat.
D
Note: Default class = exceeded no more than 8% of samples.
All iance Com pl iance Monitoring Chlorophyll-a Data
Chlorophyll-a concentrations measured at Sites U1 , U2, Dl and D2 between January 2012and March 2019 show that following long accrual periods chlorophyll-a levels can becomeelevated in response to a range of factors including nutrient enrichment upstream anddownstream of the discharge (Figure 39). Chlorophyll-a concentrations have been thehighest at Site Dl compared to the other sites on 1 out of the 10 surveys (January 2012)when levels at both Site Dl and D2 exceeded the Band D limit of > 200 mg/m2 when sheepand lamb processing was still occurring
Chlorophyll-a concentrations have been the highest at Site D2 compared to the other siteson 4 out ofthe 10 surveys (February 2016, January 2017, February 2019 and March 2019)when levels were within Band A in January 2016, Band B in January 2017 and February2019 and exceeded the Band D limit of > 200 mg/m2 in March 2019. Chlorophyll-aconcentrations have been the highest at either of the upstream sites compared to the othersites on 4 out of the 10 surveys (March 2013, March2014, January 2018 and January2019) when levels were within Band A, Band B or Band C (Figure 39).
Chlorophyll-a concentrations increased sharply at all sites between the February 2019 andMarch 2019 surveys reflec{ing the significant effect that accrual period length has onchlorophyll-a levels generally. Between the February 2019 and March 2019 surveys the
May 2019Alliance Mataura AEE
71 fresh ,
_<!vater
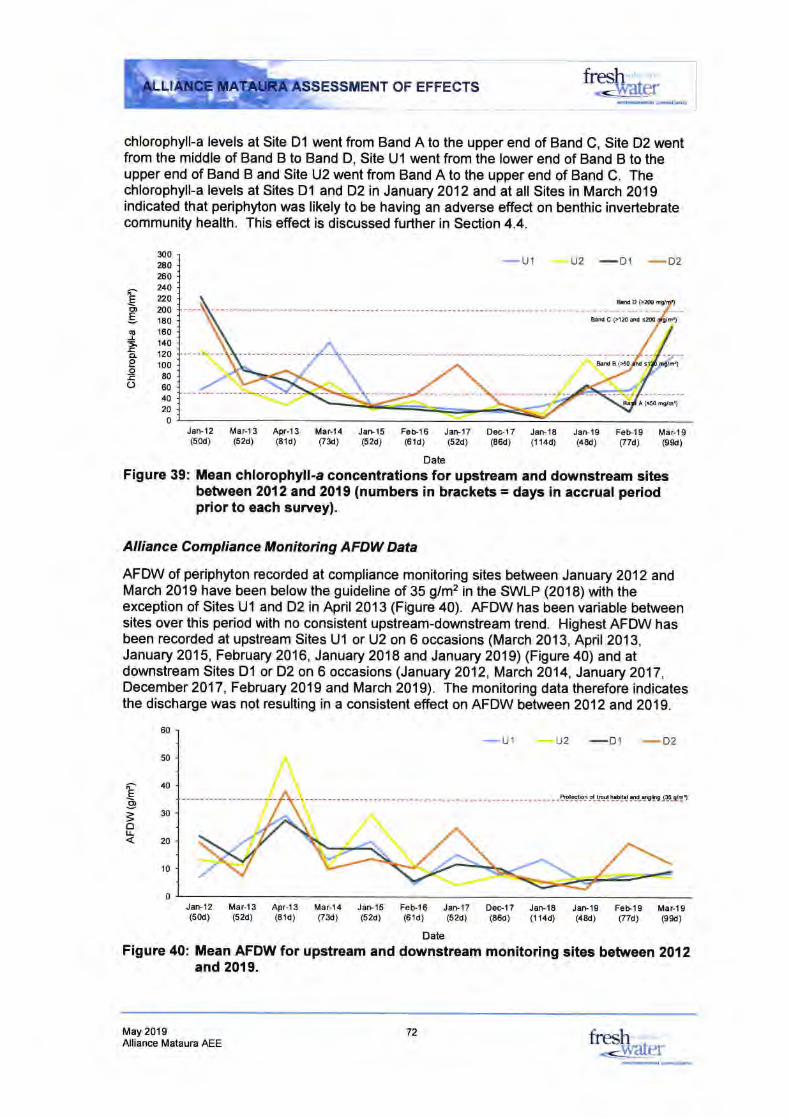
OF EFFECTS
chlorophyll-a levels at Site Dl went from Band A to the upper end of Band C, Site D2 wentfrom the middle of Band B to Band D, Site Ul went from the lower end of Band B to theupper end of Band B and Site U2 went from Band A to the upper end of Band C. Thechlorophyll-a levels at Sites Dl and D2 in January 2012 and at all Sites in March 2019indicated that periphyton was likely to be having an adverse effect on benthic invertebratecommunity health. This effect is discussed further in Section 4.4.
u2 -D1 -D2
bd o (>2o
B.dC(>14d5200
MA
A(sq/m')
fiesh ,.
-<:walersia.'6d..uh.
300280260240
E 2.0
E 2oo5 180(o 160
*uo=- 120I rooEBoo60
1020
0Jan-12(50d)
Mar-l 3 Aprl3(52d) (81d)
Mar-19(eed)
Oec-17(86d)
Mar-l4 Jan-15o3d) (s2d)
Feb.,l6(61d)
Jan-17(s2d)
JarlS Jan-19(48d)
FeFl9o7d)0 14d)
Date
Figure 39: Mean chlorophyll-a concentrations for upstream and downstream sitesbetween 2012 and 20{9 (numbers in brackets = days in accrua! periodprior to each survey).
Alliance Compliance Monitoring AFDW Data
AFDW of periphyton recorded at compliance monitoring sites between January 2012 andMarch 2019 have been below the guideline of 35 g/m2 in the SWLP (2018) with theexception of Sites Ul and D2 in April 2013 (Figure 40). AFDW has been variable betweensites over this period with no consistent upstream-downstream trend. Highest AFDW hasbeen recorded at upstream Sites Ul or U2 on 6 occasions (March 2013, April 2013,January 2015, February2016, January2018 and January2019) (Figure40) and atdownstream Sites Dl or D2 on 6 occasions (January 2012, March 2014, January 2017,December 2017, February 2019 and March 2019). The monitoring data therefore indicatesthe discharge was not resulting in a consistent effect on AFDW between 2012 and 2019.
u2 -ol -D2
Jan-12 Mar-13 Aprl3 Mar-14 JaF15 Feb-16 Jan-17 Dec-17 Jan-'18 Jan-19 FeFlg Mar-19(50d) (52d) (81d) O3d) (52d) (61d) (52d) (8e) (114d) (48d) (77d) (eed)
Date
Figure 40: Mean AFDW for upstream and downstream monitoring sites between 2012and 2019.
EI=ol!
60
50
tm
30
20
10
0
May 2019Alliance Mataura AEE fresh .
-<yyater72
.wlffid.l c@.!nFt.
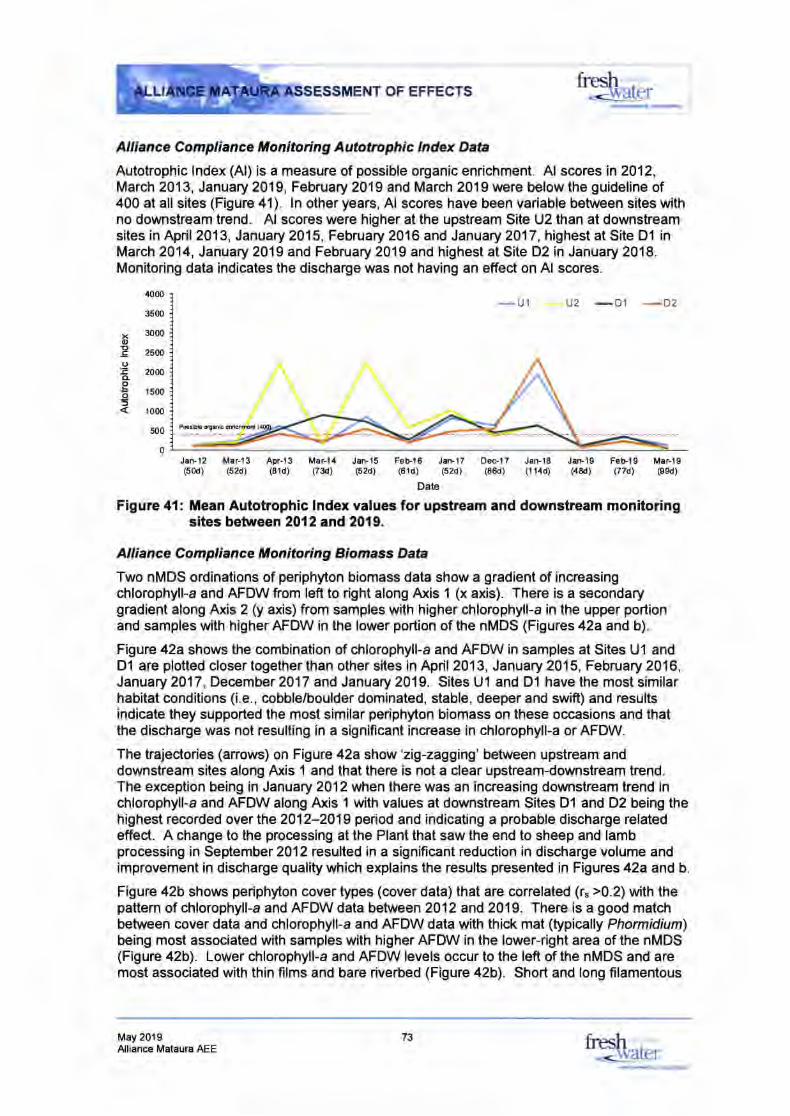
''f5.{t- J .lr--:. OF EFFECTS
Alliance Compliance Monitoring Autotrophic lndex Data
Autotrophic lndex (Al) is a measure of possible organic enrichment. Al scores in 2012,March 2013, January 2019, February 2019 and March 2019 were below the guideline of400 at all sites (Figure 41). ln other years, Al scores have been variable between sites withno downstream trend. Al scores were higher at the upstream Site U2 than at downstreamsites in April2013, January 2015, February 2016 and January 2017, highest at Site D1 inMarch 2014, January 2019 and February 2019 and highest at Site D2 in January 2018.Monitoring data indicates the discharge was not having an effect on Al scores.
u2 -D1 -O2
Podbh @*.*hd.d
fresh-<{ilau}r
4000
3500
3000
2500
2000
1500
1000
500
xoIloo.oo=
0Jaw12 Mar-13
(52d)Apr-l3 Mar-14 Jan-15(81d) O3d) (52d)
FeFl6 Jan-17(61d) (s2d)
Date
Dec-l 7(86d)
Jan-18(1 14d)
Jar}l9(48d)
Fets19(t7d)
Mar-19(esd)(50d)
Figure 41: Mean Autotrophic lndex values for upstream and downstream monitoringsites between2Ol2 and 2019.
Alliance Compliance Monitoring Biomass Data
Two nMDS ordinations of periphyton biomass data show a gradient of increasingchlorophyll-a and AFDW fiom left to right along Axis 1 (x axis). There is a secondarygradient along Axis 2 (y axis) from samples with higher chlorophyll-a in the upper portionand samples with higher AFDW in the lower portion of the nMDS (Figures 42a and b).
Figure 42a shows the combination of chlorophyll-a and AFDW in samples at Sites U1 andDl are plotted closer together than other sites in April 2013, January 2015, February 2016,January 2017, December 2017 and January 2019. Sites U1 and Dl have the most similarhabitat conditions (i.e., cobble/boulder dominated, stable, deeper and swifi) and resultsindicate they supported the most similar periphyton biomass on these occasions and thatthe discharge was not resulting in a significant increase in chlorophyll-a or AFDW.
The trajectories (arrows) on Figure 42a show'zig-zagging' between upstream anddownstream sites along lu<is 1 and that there is not a clear upstream-downstream trend.The exception being in January 2012when there was an increasing downstream trend inchlorophyll-a and AFDW along Axis 1 with values at downstream Sites Dl and D2 being thehighest recorded over the 2012-2019 period and indicating a probable discharge relatedeffect. A change to the processing at the Plant that saw the end to sheep and lambprocessing in September 2012 resulted in a signiflcant reduction in discharge volume andimprovement in discharge quality which explains the results presented in Figures 42a andb.
Figure 42b shows periphyton cover types (cover data) that are correlated (r. >0.2) with thepattern of chlorophyll-a and AFDW data between 2012 and 2019. There is a good matchbetween cover data and chlorophyll-a and AFDW data with thick mat (typically Phormidium)being most associated with samples with higher AFDW in the lower-right area of the nMDS(Figure 42b). Lower chlorophyll-a and AFDW levels occur to the left of the nMDS and aremost associated with thin films and bare riverbed (Figure 42b). Short and long filamentous
May 2019Alliance Mataura AEE
73 fresh r '
<yyater
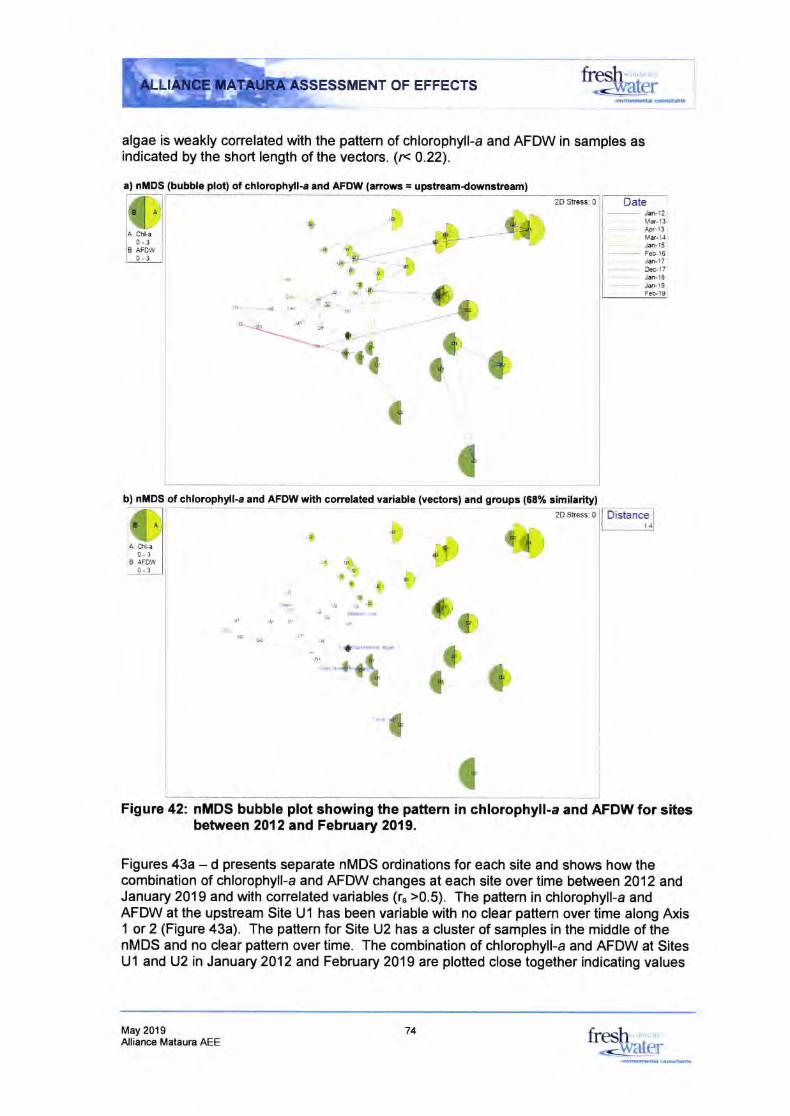
ESSMENT OF EFFECTS
algae is weakly corelated with the pattern of chlorophyll-a and AFDW in samples asindicated by the short length of the vectors. (r< 0.22).
a) ntrlDS (bubble plot) of chlorophyll-a and AFDW (anowr = upstreamdownstream)20 Stress: 0 Date
-!-waler
T.
+-- ---- Je12
Ma-13- - Apr-13
M{.14li
elGr,
.,..'**-n
st't-
*- G
Je15Feb-16J+'17Oec-17J+18Je19Febl9
{';
C{ [,,
tb) nillDS of chlorophyll-a and AFDW with contlated variable (vectort) and grcups (88% similarity)
{^,1A Cr*a I
0.3 |
a nrDw I
o- 3 I
tnrt
t
2D Sress: 0 Distance1A
a)'r; tli
'4il)
-aldnj
1, h;o)
,{t"",-, ^ ,,,*
4 .F
nrt
$i Ii{,I f,
*
IFigure 42: nMDS bubble plot showing the pattern in chlorophyll-a and AFDW for sites
between 2O12and February 2019.
Figures 43a - d presents separate nMDS ordinations for each site and shows how thecombination of chlorophyll-a and AFDW changes at each site over time between 2012 andJanuary 2019 and with correlated variables (rs >0.5). The pattern in chlorophyll-a andAFDW at the upstream Site Ul has been variable with no clear pattem over time along Axis1 or 2 (Figure 43a). The pattern for Site U2 has a cluster of samples in the middle of thenMDS and no clear pattern over time. The combination of chlorophyll-a and AFDW at SitesUl and U2 in January 2012 and February 2019 are plotted close together indicating values
May 2019Alliance Mataura AEE
A
chl.0-3AFOW
74 fresh-water
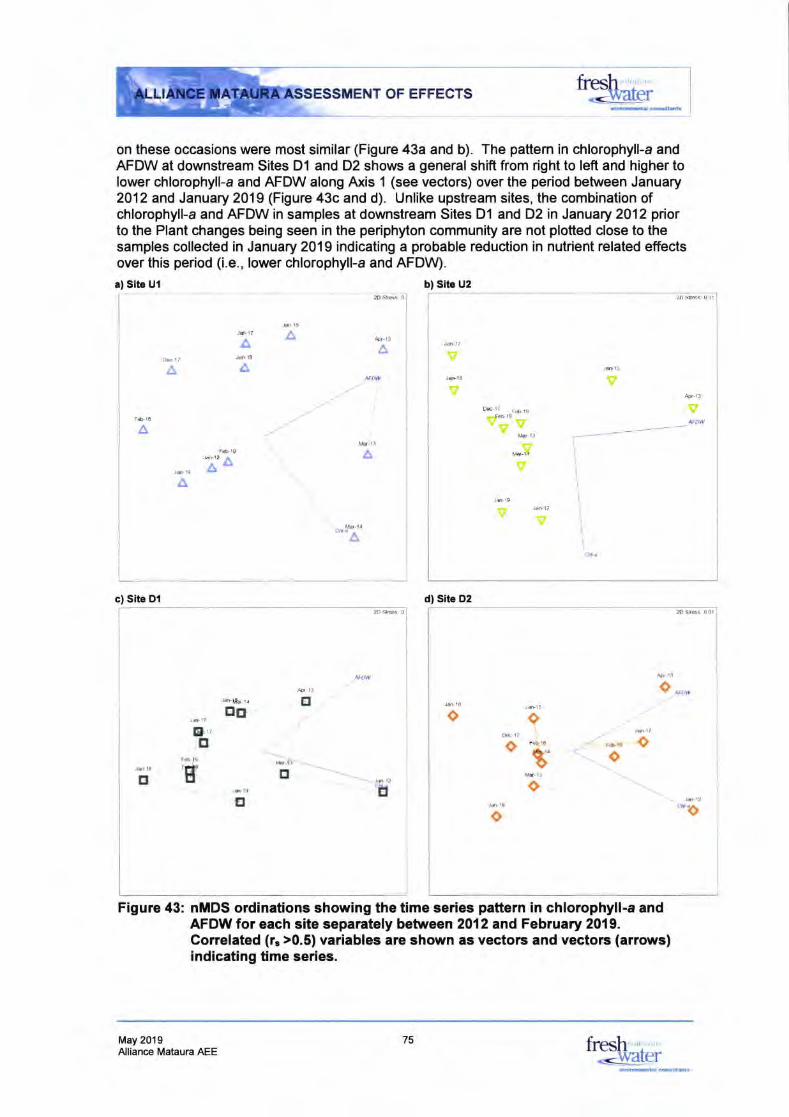
ENT OF EFFECTS
on these occasions were most similar (Figure 43a and b). The pattem in chlorophyll-a andAFDW at downstream Sites D1 and D2 shows a general shifi from right to left and higher tolower chlorophyll-a and AFDW along Axis 1 (see vectors) over the period between January2012 and January 2019 (Figure 43c and d). Unlike upstream sites, the combination ofchlorophyll-a and AFDW in samples at downstream Sites D1 and D2 in January 2012 pnorto the Plant changes being seen in the periphyton community are not plofted close to thesamples collected in January 2019 indicating a probable reduction in nutrient related effectsover this period (i.e., lower chlorophyll-a and AFDW).
a) Site Ul b) Sib U2
-darcr
A
AA
ffow
AAA
A
c) Site Dl d) Sate D2
Q *,,n,U
B.o
o
oo
Figure 43: nMDS ordinations showing the time series pattern in chlorophyl!-a andAFDW for each site separately between 2012 and February 2019.Correlated (r, >0.5) variables are shown as vectors and vectorc (arrows)indicating time series.
o
o '"o
May 2019Alliance Mataura AEE
'H
Jelf,x ra
trII
E
8,,tr
'tfII E
75 fresh<<wa[er
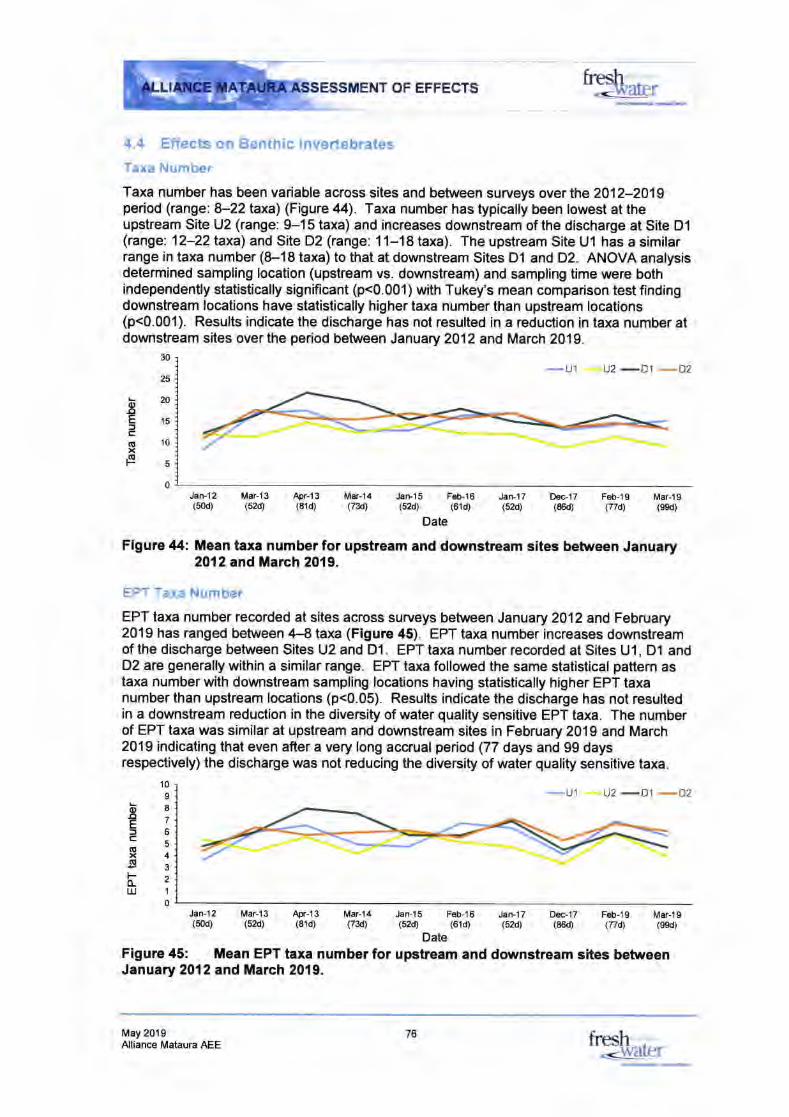
hq* f -F-': ESSMENT OF EFFECTS
4.4 Effects on Benthic lnvertebrates
Taxa Number
Taxa number has been variable across sites and between surveys over the 2012-2019period (range: 8-22taxa) (Figure 44). Taxa number has typically been lowest at theupstream Site U2 (range: 9-15 taxa) and increases downstream of the discharge at Site D1(range: 12-22 taxa) and Site D2 (range: 11-18 taxa). The upstream Site Ul has a similarrange in taxa number (8-18 taxa) to that at downstream Sites Dl and D2. ANOVA analysisdetermined sampling location (upstream vs. downstream) and sampling time were bothindependently statistically significant (p<0.001) with Tukey's mean comparison test findingdownstream locations have statistically higher taxa number than upstream locations(p<0.001). Results indicate the discharge has not resulted in a reduction in taxa number atdownstream sites over the period between January 2012 and March 2019.
30
25
20
15
10
5
0Jan]12 Mar-13 Aprl3 Mar-14 Jar}ls F6b-16 Jen-17 D6c-17 Feb-19 Mar-19(50o (s2d) (81o (73d) (52d) (610 (52O (86d) (nd) (ged)
Date
Figure 44: Mean taxa numberfor upstream and downstream sites between January2012 and March 2019.
EPT Taxa Number
EPT taxa number recorded at sites across surveys between January 2012 and February2019 has ranged between 4-8 taxa (Figure 45). EPT taxa number increases downstreamof the discharge between Sites U2 and D1. EPT taxa number recorded at Sites Ul, D1 andD2 are generally within a similar range. EPT taxa followed the same statistical pattern astaxa number with downstream sampling locations having statistically higher EPT taxanumber than upstream locations (p<0.05). Results indicate the discharge has not resultedin a downstream reduction in the diversity of water quality sensitive EPT taxa. The numberof EPT taxa was similar at upstream and downstream sites in February 2019 and March2019 indicating that even afier a very long accrual period (77 days and 99 daysrespectively) the discharge was not reducing the diversity of water quality sensitive taxa.
-u1 u2
-D1 -D2
Jan-12 Mar-13 Apr-13 Marl4 JaF.15 Feb-16 JerF17 Dec-17 F6b-19 Mar-19(sod) (52d) (81d) (73d) (s2o (610 (52O (86d) (nq (ssd)
Date
Figure 45: Mean EPT taxa number for upstream and downstream sites betweenJanuary 2012 and March 2019.
fresh .
--lilarerm*didr.:dt*
-u1 u2
-D1 -O2
IEaE(Ex
.(uF
IEfc(Ex(E
F&I,IJ
10
98
7
o5
43
2
1
0
May 2019Alliance Mataura AEE
76 fresh ,
-d\rarcr
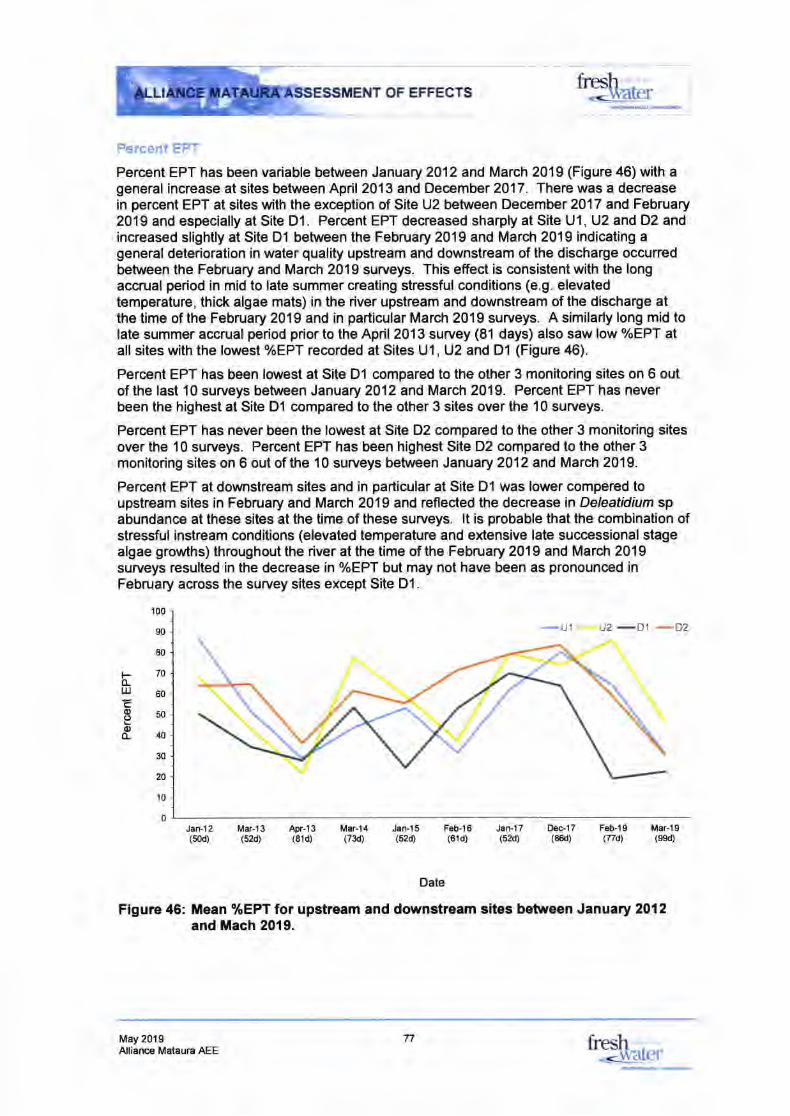
OF EFFECTSflresh .@Er
Percent EPT
Percent EPT has been variable between January 2012 and March 2019 (Figure 46) with ageneraf increase at sites between April 2013 and December 2017. There was a decreasein percent EPT at sites with the exception of Site U2 between December 2017 and February2019 and especially at Site D1. Percent EPT decreased sharply at Site U1, U2 and D2 andincreased slightly at Site Dl between the February 2019 and March 2019 indicating ageneral deterioration in water quality upstream and downstream of the discharge occunedbetween the February and March 2019 surveys. This effect is consistent with the longaccrual period in mid to late summer creating stressful conditions (e.9. elevatedtemperature, thick algae mats) in the river upstream and downstream of the discharge atthe time of the February 2019 and in particular March 2019 surveys. A similarly long mid tolate summer accrual period prior to the April 2013 survey (81 days) also saw low %EPT atall sites with the lowest o/oEPT recorded at Sites Ul, U2 and D1 (Figure 46).
Percent EPT has been lowest at Site Dl compared to the other 3 monitoring sites on 6 outof the last 10 surveys between January 2012and March 2019. Percent EPT has neverbeen the highest at Site D1 compared to the other 3 sites over the 10 surveys.
Percent EPT has never been the lowest at Site D2 compared to the other 3 monitoring sitesover the 10 surveys. Percent EPT has been highest Site D2 compared to the other 3monitoring sites on 6 out of the 10 surveys between January 2012 and March 2019.
Percent EPT at downstream sites and in particular at Site Dl was lower compered toupstream sites in February and March 2019 and reflected the decreasein Deleatidium spabundance at these sites at the time of these surveys. lt is probable that the combination ofstressful instream conditions (elevated temperature and extensive late successionalstagealgae growths) throughout the river at the time of the February 2019 and March 2019surveys resulted in the decrease in o/oEPT but may not have been as pronounced inFebruary across the survey sites except Site D1.
-u1 u2
-D1 -D2
Jan-12
100
90
80
F70(LtlJ 60cgs0E/rc
30
20
10
0Mar-13(s2d)
Apr-l 3(81d)
Jan-l 7(52d)
Dec-l7(86d)
Feb-l I(77d)
Mar-19(ssd)
Feb-l6(61d)
Jan-1 5(52d)
Mar-'|4(73d)(sod)
Date
Figure 46: Mean oloEPT for upstream and downstream sites between January 2012and Mach 2019.
May 2019 fresh ,
<-waterAlliance Mataura AEETI
tul'ffilco.gifr
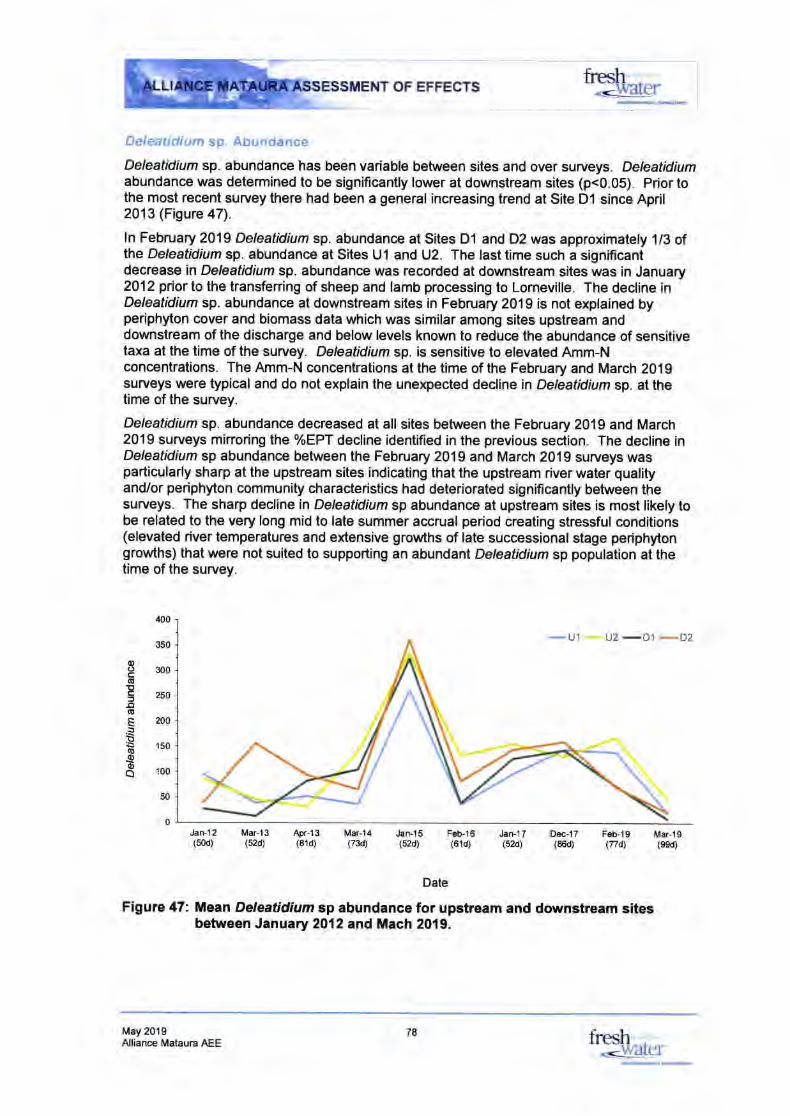
ESSMENT OF EFFECTS
Deleati di um sp. Abundance
Deleatidium sp. abundance has been variable between sites and over surveys. Deleatidiumabundance was determined to be signiflcantly lower at downstream sites (p<0.05). Prior tothe most recent survey there had been a general increasing trend at Site Dl since April2013 (Figure 47).
ln February 2019 Deleatidium sp. abundance at Sites D1 and D2 was approximately 1t3 ofthe Deleatidium sp. abundance at Sites Ul and U2. The last time such a significantdecrease in Deleatidium sp. abundance was recorded at downstream sites was in January2012 prior to the transfening of sheep and lamb processing to Lorneville. The decline inDeleatidium sp. abundance at downstream sites in February 2019 is not explained byperiphyton cover and biomass data which was similar among sites upstream anddownstream of the discharge and below levels known to reduce the abundance of sensitivetaxa at the time of the survey. Deleatidium sp. is sensitive to elevated Amm-Nconcentrations. The Amm-N concentrations at the time of the February and March 2019surveys were typical and do not explain the unexpected decline in Deleatidium sp. at thetime of the survey.
Deleatidium sp. abundance decreased at all sites between the February 2019 and March2019 surveys minoring the %EPT decline identified in the previous section. The decline inDeleatidium sp abundance between the February 2019 and March 2019 surveys wasparticularly sharp at the upstream sites indicating that the upstream river water qualityand/or periphyton community characteristics had deteriorated significantly between thesurveys. The sharp decline in Deleatidium sp abundance at upstream sites is most likely tobe related to the very long mid to late summer accrual period creating stressful conditions(elevated river temperatures and extensive growths of late successional stage periphytongrowths) that were not suited to supporting an abundant Deleatidium sp population at thetime of the survey.
-u1 u2
-o1 -D2
firesh r
-.{arcr.;;tmd{Mtd*
400
350
300
250
200
150
100
50
0
ooc(!E,tt(!
EGeoo
DeclT Feb-,lg(sod) (86d)
Date
Figure 47: Mean Deleatidium sp abundance for upstream and downstream sitesbetween January 2012 and Mach 2019.
Jatu12 Mar-13(52d)
Apr-13(81d)
Mar-14(73d)
Jan-1 5(s2d)
Feb-16(61d)
Jan-l 7(52d)
Mar-19(ssd)(nd)
May 2019Alliance Mataura AEE
78 fresh r
warcr
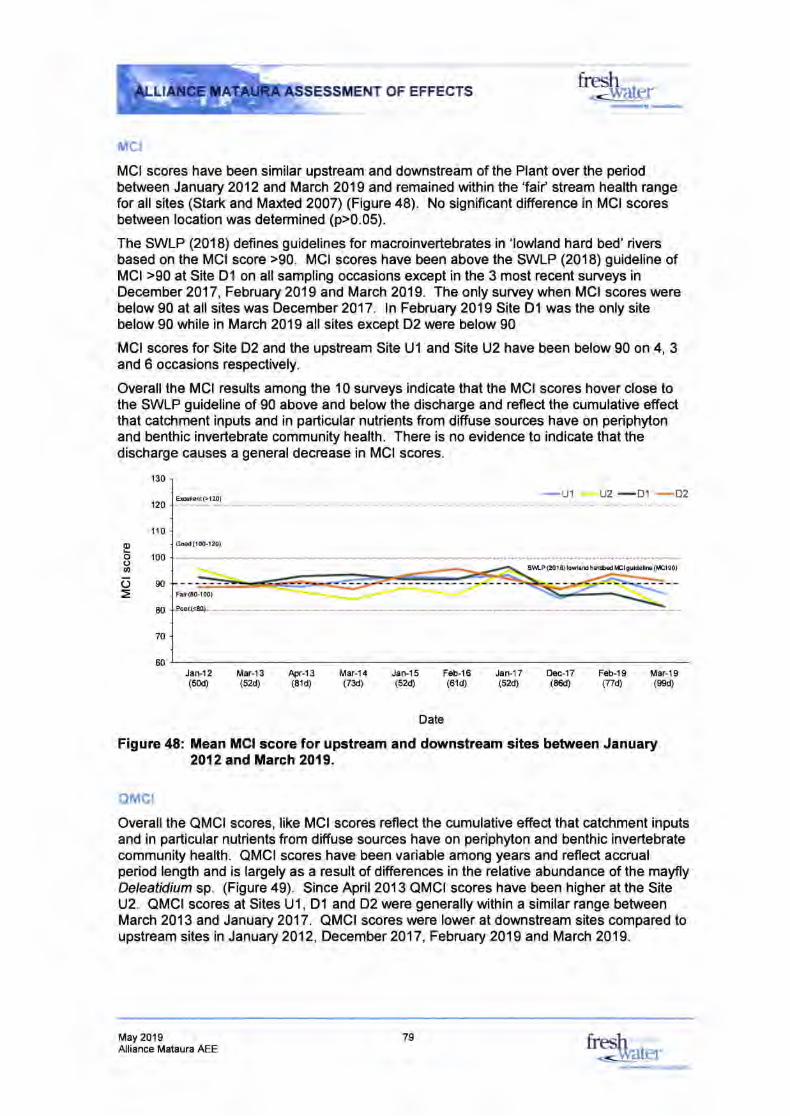
ESSMENT OF EFFECTS
MCt
MCI scores have been similar upstream and downstream of the Plant over the periodbetween January 2012 and March 2019 and remained within the 'fai/ stream health rangefor all sites (Stark and Maxted 2007) (Figure 48). No signfficant difference in MCI scoresbetween location was determined (p>0.05).
The SWLP (2018) defines guidelines for macroinvertebrates in 'lowland hard bed' riversbased on the MCI score >90. MCI scores have been above the SWLP (2018) guideline ofMCI >90 at Site Dl on allsampling occasions except in the 3 most recent surveys inDecember 2017, February 2019 and March 2019. The only survey when MCI scores werebelow 90 at all sites was December 2017. In February 2019 Site D1 was the only sitebelow 90 while in March 2019 allsites except D2 were below g0
MCI scores for Site D2 and the upstream Site U1 and Site U2 have been below 90 on 4, 3and 6 occasions respectively.
Overallthe MCI results among the 10 surveys indicate that the MCI scores hover close tothe SWLP guideline of 90 above and below the discharge and reflect the cumulative effectthat catchment inputs and in particular nutrients from diffuse sources have on periphytonand benthic invertebrate community health. There is no evidence to indicate that thedischarge causes a generaldecrease in MCI scores.
ooooo=
130
120
110
100
90
80
70
60
EioLnt(>l20)
Good (l O0-l 20)
F.ir(6GlO0)
Jan-12(sod)
Mar-13 Apr-l 3(810
Jan-l 5(520
Feb-16(61d)
-u1 u2
-Dl -D2
Sl,\r-P (2Ol 6) ldl.rd h.r6.d lic I e uid.llE (i,Gl 90)
Jan-1 7(s2d) (86d) (nd) (ssd)
Dec-17 Feb-19 Mar-19(52d)
Date
Figure 48: Mean MCI score for upstream and downstream sites between January2012 and March 2019.
QMCI
Overall the QMCI scores, like MCI scores reflect the cumulative effect that catchment inputsand in particular nutrients from diffuse souroes have on periphyton and benthic invertebratecommunity health. QMCI scores have been variable among years and reflect accrualperiod length and is largely as a result of differences in the relative abundance of the mayflyDeleatidium sp. (Figure 49). Since April 2013 QMCI scores have been higher at the SiteU2. QMCI scores at Sites U1, D1 and D2 were generally within a similar range betweenMarch 2013 and January 2017. QMCI scores were lower at downstream sites compared toupstream sites in January 2012, December 2017, February 2019 and March 2019.
Mar-l4(73d)
May 2019Alliance Mataura AEE
79 fresh .
, water
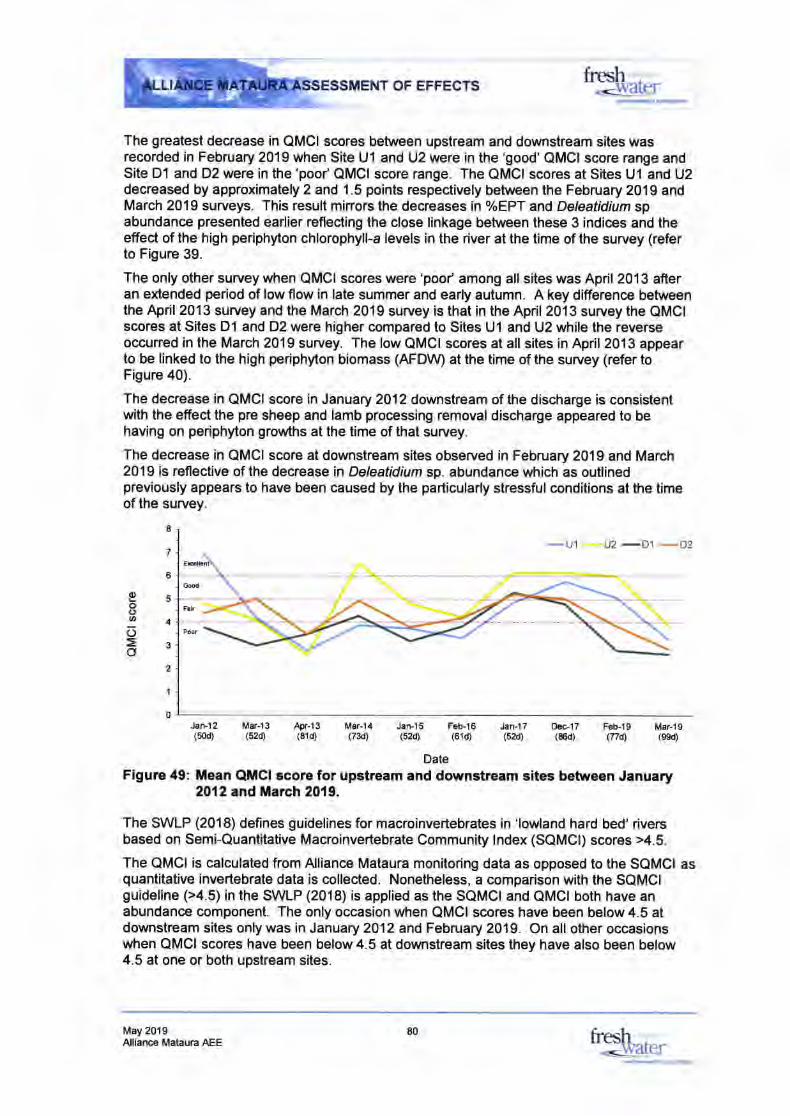
OF EFFECTS
The greatest decrease in QMCI scores between upstream and downstream sites wasrecorded in February 2019 when Site Ul and U2 were in the'good' QMCI score range andSite D1 and D2 were in the 'pool' QMCI score range. The QMCI scores at Sites Ul and U2decreased by approximalely 2 and 1.5 points respectively between the February 2019 andMarch 2019 surveys. This result minors the decreases in %EPT and Deleatidium spabundance presented earlier reflecting the close linkage between these 3 indices and theeffect of the high periphyton chlorophyll-a levels in the river at the time of the survey (referto Figure 39.
The only other survey when QMCI scores were 'poor' among all sites was April 2013 afteran extended period of low flow in late summer and early autumn. A key difference betweenthe April 2013 survey and the March 2019 survey is that in the April 20'13 survey the QMCIscores at Sites Dl and D2 were higher compared to Sites Ul and U2 white the reverseoccurred in the March 2019 survey. The low QMCI scores at all sites in April2013 appearto be linked to the high periphyton biomass (AFDW) at the time of the survey (refer toFigure 40).
The decrease in QMCI score in January 2012 downstream of the discharge is consistentwith the effect the pre sheep and lamb processing removal discharge appeared to behaving on periphyton growths at the time of that survey.
The decrease in QMCI score at downstream sites observed in February 2019 and March2019 is reflective of the decrease in Deleatidium sp. abundance which as outlinedpreviously appears to have been caused by the particularly stressful conditions at the timeof the survey.
-u1 u2
-D1 -D2Good
Falr
Jart.12
ftesh-s=warcr
ffiAcddd.
8
7
oLooo(J
=o
4
3
2
0Dec-l7(86d)(50d)
Mar-13(520
Apr-1 3(810
Mar-14(73d)
Jan-l 5(520
Feb-l 6(61d)
Jan-l 7(s2d)
Feb-'!9 Marl9(sed)(nd')
DateFigure 49: Mean QMCI score for upstream and downstream sites between January
2012and March 2019.
The SWLP (2018) defines guidelines for macroinvertebrates in 'lowland hard bed' riversbased on Semi-Quantitative Macroinvertebrate Community lndex (SQMCI) scores >4.5.
The QMCI is calculated from Alliance Mataura monitoring data as opposed to the SQMCI asquantitative invertebrate data is collected. Nonetheless, a comparison with the SQMCIguideline (>4.5) in the SWLP (2018) is applied as the SQMCI and QMCI both have anabundance component. The only occasion when QMCI scores have been below 4.5 atdownstream sites only was in January 2012 and February 2019. On all other occasionswhen QMCI scores have been below 4.5 at downstream sites they have also been below4.5 at one or both upstream sites.
May 2019Alliance Mataura AEE
80 fresh '; "-waIer
NT OF EFFECTS
As outlined previously the decrease in QMCI identified in February 2019 and March 2019 isdriven by a decline in Deleatidium sp abundance. The cause of the decline in February2019 is not able to be explained by periphyton cover and biomass results although it ispossible that there were differences in periphyton chlorophyll-a or AFDW at the upstreamand downstream sites that were not detected by the survey. The cause of the generaldecline in QMCI scores at sites upstream and downstream of the discharge in March 2019appears to be linked to the high periphyton chlorophyll-a levels that existed in the river atthe time of the survey and possibly elevated river water temperature.
Results indicate the treated wastewater discharge has not resulted in a consistent decreasein QMCI scores between upstream and downstream locations over the period between April2013 and March 2019. Taking into account allof the survey results since 2012 thedischarge does not appear to have had a significant effect on QMCI scores. ln long mid tolate summer accrual periods stressful conditions in the river do appear to occur earlierdownstream of the discharge compared to upstream and this appears to a result in adecrease in QMCI score at downstream sites 2-3 weeks before a similar decrease occursupstream of the discharge. There is no clear evidence from the available water quality andperiphyton data of a causal link between water quality, periphyton and benthic invertebratecommunity health associated with the characteristics of the discharge at the time.
4.5 Effects on Fish
The treated wastewater discharge has the potential to directly affect fish through elevatedAmm-N concentrations or indirectly through nutrient enrichment altering the benthicinvertebrate community (a key food source for native fish and trout). The benthicinvertebrate survey results indicate that any effect from the discharge is likely to be limitedto infrequent periods when very long accrual periods occur. Survey results also indicatethat any effects of the discharge on the benthic invertebrate community, if they occur, arelikely to be limited to a short section of river relative to the extent of productive benthicinvertebrate habitat available suggesting that any food related effects on fish are likely to besmall. The downstream Amm-N concentrations do not reach levels that are likely to affectfish living in or migrating through the mixing zone.
Fish survey results from electric fishing and fyke net surveys on 25-26 February 2019 arepresented in Table 47-Table 49. The electric fishing survey results indicate the fishcommunity in run habitat is dominated by a small number of common species - longfin andshortfin eel elvers and upland bully. A single juvenile lamprey was recorded at Site U1.Elvers were more abundant at downstream sites compared to upstream sites and could bethe result of differences in habitat suitability or simply the timing of the upstream migrationby a particular group of new recruits into the river. The highest total density of run dwellingfish was recorded at Site Dl (0.36 fish/m2) followed by Site U2 (0.25 fish/m2).
The electric fishing survey results indicate the fish community in riffle habitat is dominatedby elvers with upland bully and unidentified galaxiids recorded in low numbers. The highesttotal density of rffie dwelling fish was recorded at Site Dl (0.38 fish/m2) followed by Site Ul(0.23 fish/m2) (
Table 48).
The fish community in the reach between the Mataura Falls and Mataura Bridge based on
ffke net survey results indicates that the Mataura River immediately upstream anddownstream of the discharge supports a healthy longfin eel population including severalvery large fish (+5 kg) (Iable 49). Based on an external visual assessment all of the fishcaptured using nets and by electric fishing appeared to be in a healthy condition.
ftesh ,
^darer
May 2019Alliance Mataura AEE
81 fresh .dater
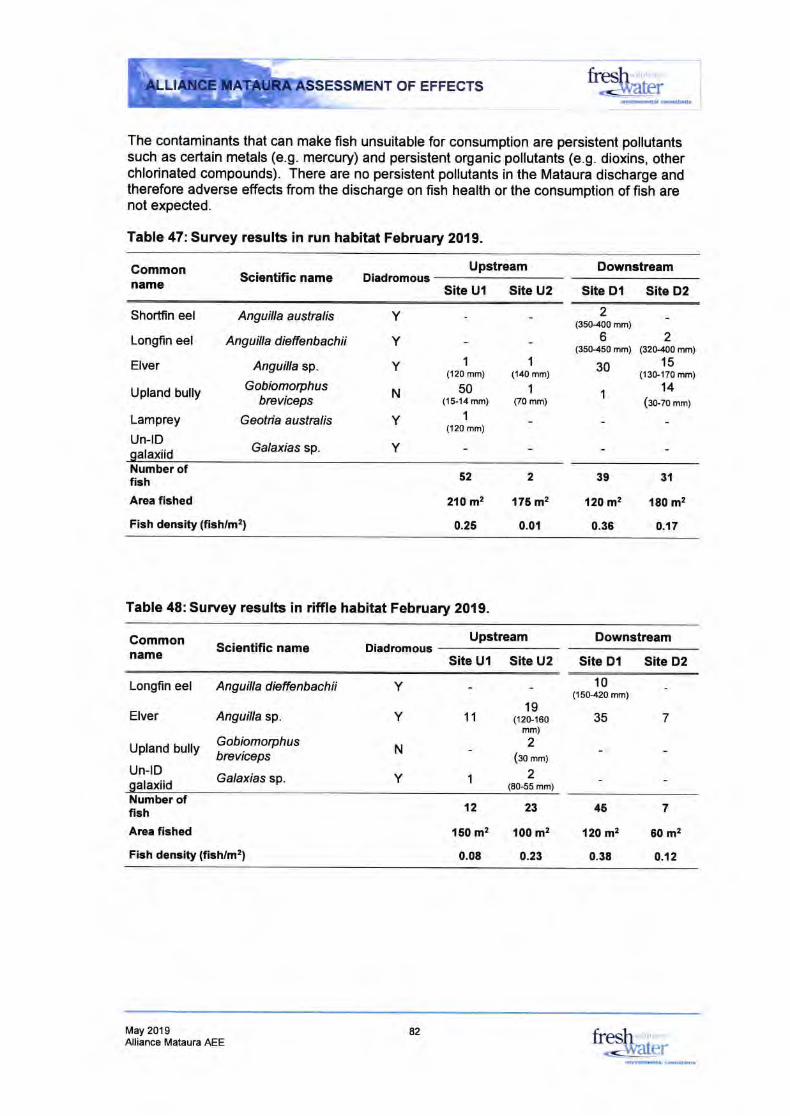
OF EFFECTS
The contaminants that can make fish unsuitable for consumption are persistent pollutantssuch as certain metals (e.9. mercury) and persistent organic pollutants (e.9. dioxins, otherchlorinated compounds). There are no persistent pollutants in the Mataura discharge andtherefore adverse effects from the discharge on fish health or the consumption of fish arenot expected.
Table 47: Survey results in run habitat February 2019.
Commonname
Upstream DownstreamScientific name Diadromous
Site Ul Site U2 Site Dl Site D2
firesh ,@ner
Shoffin eel
Longfin eel
Elver
Upland bully
Lamprey
Un-lDoalaxiid
Anguilla ausfralrc
Anguilla dieffenbachii
Anguilla sp.
Gobiomoryhusbrcviceps
Geotria austnlis
Galaxlas sp.
Y
Y
Y
N
Y
Y
1(120 mm)
50(15-14 mm)
1
(120 mm)
1
(140 mm)
1
C70 mm)
2_(350-100 mm)
62(350.450 mm) (320'100 mm)
30 u.*Ii,,,114
(3&70 mm)
Number offish
Area fished
Fish density (fish/m2)
52
21O m2
0.25
2
175m2
0.01
39
120m2
0.36
31
1E0 m2
0.17
Table 48: Survey results in riffle habitat February 2019
Commonname Scientific name Diadromous
Upstream Downstream
Site Ul Site U2 Site Di Site D2
Longfin eel
Elver
Upland bully
Un-lDoalaxiid
Ang u illa d ieffenbach i i
Anguilla sp.
Gobiomorphusbreviceps
Galaxias sp. 1
Y
Y
N
Y
1119
(12Gr60mm)
2(ao mm1
2(80-55 mm)
10(150.420 mm)
35 7
Number offishArea flshed
Fish denclty (flsh/m2)
12
150 m2
0.08
23
100 m2
0.23
45
12O mz
0.3E
7
60 m2
o.12
May 2019Alliancs Mataura AEE
82 fresh ':rwater
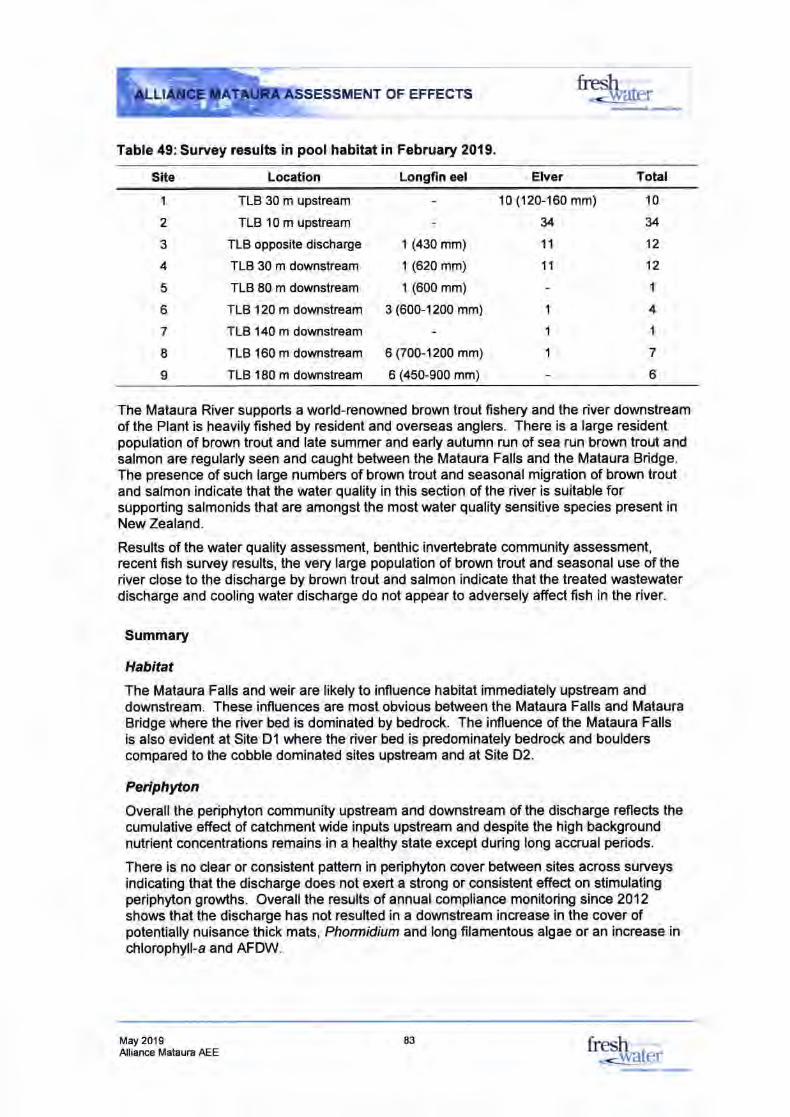
ESSMENT OF EFFECTS
Table 49: Survey results in pool habitat in February 2019.
ftesh-dyarcr
Site Location Longfin eel Elver Total
1
2
3
4
5
6
7
8
9
TLB 30 m upstream
TLB 10 m upstream
TLB opposite discharge
TLB 30 m downstream
TLB 80 m downstream
TLB 120 m downstream
TLB 140 m downstream
TLB 160 m downstream
TLB 180 m downstream
1 (430 mm)
1 (620 mm)
1 (600 mm)
3 (600-1200 mm)
6 (700-1200 mm)
6 (450-900 mm)
10 (120-160 mm)
u11
11
1
1
1
10
u't2
12
1
4
1
7
b
The Mataura River supports a world-renowned brown trout fishery and the river downstreamof the Plant is heavily fished by resident and overseas anglers. There is a large residentpopulation of brown trout and late summer and early autumn run of sea run brown trout andsalmon are regularly seen and caught between the Mataura Falls and the Mataura Bridge.The presence of such large numbers of brown trout and seasonal migration of brown troutand salmon indicate that the water quality in this section of the river is suitable forsupporting salmonids that are amongst the most water quality sensitive species present inNew Zealand.
Results of the water quality assessment, benthic invertebrate community assessment,recent fish survey results, the very large population of brown trout and seasonal use of theriver close to the discharge by brown trout and salmon indicate that the treated wastewaterdischarge and cooling water discharge do not appear to adversely affect fish in the river.
Summary
Habitat
The Mataura Falls and weir are likely to influence habitat immediately upstream anddownstream. These influences are most obvious between the Mataura Falls and MatauraBridge where the river bed is dominated by bedrock. The influence of the Mataura Fallsis also evident at Site Dl where the river bed is predominately bedrock and boulderscompared to the cobble dominated sites upstream and at Site D2.
Periphyton
Overall the periphyton community upstream and downstream of the discharge reflects thecumulative effect of catchment wide inputs upstream and despite the high backgroundnutrient concentrations remains in a healthy state except during long accrual periods.
There is no clear or consistent paftem in periphyton cover between sites across surveysindicating that the discharge does not exert a strong or consistent effect on stimulatingperiphyton growths. Overall the results of annual compliance monitoring since 2012shows that the discharge has not resulted in a downstream increase in the cover ofpotentially nuisance thick mats, Phomidium and long filamentous algae or an increase inchlorophyll-a and AFDW.
May 2019Alliance Mataura AEE
83 fresh ,
-dvater
J -fr'-:.
"ry*') ESSMENT OF EFFECTS
Benthic lnvertebrates
Overall the benthic invertebrate community upstream and downstream of the dischargereflects the cumulative effect of catchment wide inputs upstream and is in fair to poorhealth across most benthic invertebrate indices. Totaltaxa number and EPT taxanumber have been variable across sites and between surveys over the 2012-2019 periodwith no clear evidence that the discharge causes a reduction in total diversity or thediversity of water quality sensitive taxa.
Deleatidium abundance whlch has been variable between sites and among surveys buthas tended to be lower at downstream sites. Prior to the most recent surveys there hadbeen a general increasing trend in Deleatidium abundance at Site D1 since April2013. lnFebruary 2019 Deleatidium sp. abundance at Sites Dl and D2 was approximately 113 ofthe Deleatidium sp. abundance at Sites U1 and U2 reflecting the very stressful conditions(elevated river temperature and extensive late successional algal growths) that existed inthe river at the time of the survey. The decline in Deleatidium sp. abundance atdownstream sites in February 2019 is not explained by periphyton cover and biomass orAmm-N concentrations but could reflect elevated river temperatures with overallconditions affecting this site before upstream sites. The March 2019 survey was notablefor the sharp decline in Deleatidium sp abundance at the upstream sites. This declinethat may have been caused by the elevated river temperature and extensive algalgrowths leading up to the survey.
MCI scores have been similar upstream and downstream of the Plant over the periodbetween January 2012 and March 2019 and remained within the'faif stream healthrange for al! sites. MCI scores have been above the SWLP (2018) guideline of MCI >90at Site Dl on all sampling occasions except in the December 2017 when scores werebelow 90 at allsites and in February 2019 when Site D1 was the only site with an MCIscore of < 90 and most recently in March 2019 when al! sites upstream and downstreamexcept Site D2 were < 90.
QMCI scores have been variable across years largely as a result of differences in therelative abundance ot Deleatidium. QMCI scores have typically been higher at theupstream Site U2 whereas QMCI scores for Site Ul and downstream Sites Dl and D2have generally been within a similar range. The decrease in QMCI score in January 2012downstream of the discharge is consistent with the effect the pre sheep and lambprocessing removal discharge appeared to be having on periphyton growths at the time ofthat survey. The decrease in QMCI score at downstream sites observed in February2019 is reflective of the decrease in Deleatidium sp. abundance. The only occasion whenQMCI scores have been below SWLP (2018) SQMC! score of 4.5 at downstream sitesonly was in January 2012 and again in February 2019. The QMCI score was < 4 at allsites during the March 2019 survey and was reflective of the stressful conditions in theriver upstream and downstream of the discharge at the time of the survey. As outlinedpreviously the decrease in QMCI is driven by a decline in Deleatidium sp abundance.The cause of the decline is not able to be explained by periphyton cover and biomassresults or Amm-N concentrations in the river and appears to have been driven by riverconditions (e.9. elevated temperature) at the time of the survey.
Overall results indicate the treated wastewater discharge has not resulted in a consistentdecrease in MCI and QMCI scores between upstream and downstream locations over arange of accrual periods between April 2013 and December 2017. The February andMarch 2019 surveys stand out as differing from the pattern of similar results at upstreamand downstream sites since 2013 but there is no clear evidence for possible effects of thedischarge or how that would reduce MCI and QMCI scores. The lower scores are likely
May 201 9Alliance Mataura AEE
fiesh-srcr
fresh-waler
u
drlrffmdrl c6.r!narr
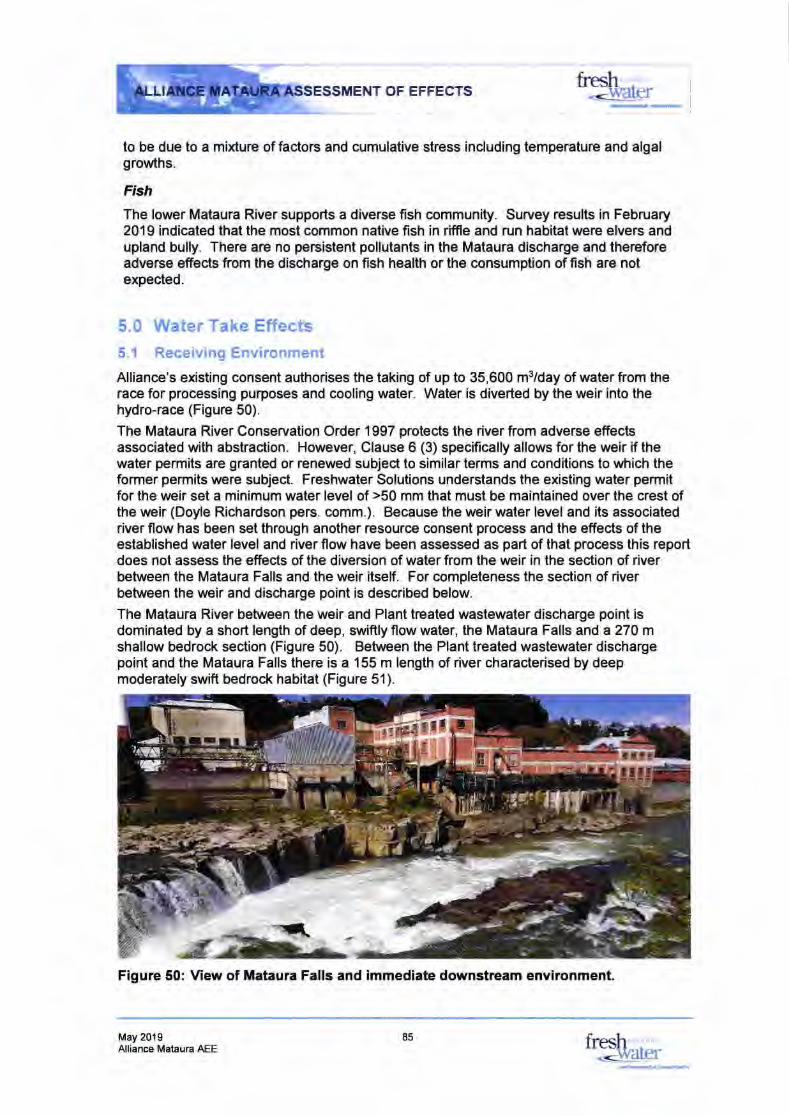
=*iiENT OF EFFECTSfiresh ,@!er
to be due to a mixture of factors and cumulative stress including temperature and algalgrowths.
Fish
The lower Mataura River supports a diverse fish community. Survey results in February2019 indicated that the most common native fish in riffle and run habitat were elvers andupland bully. There are no persistent pollutants in the Mataura discharge and thereforeadverse effects from the discharge on fish health or the consumption of fish are notexpected.
5.0 Water Take Effects5.1 ReceivingEnvironment
Alliance's existing consent authorises the taking of up to 35,600 m3/day of water from therace for processing purposes and cooling water. Water is diverted by the weir into thehydro-race (Figure 50).
The Mataura River Conservation Order 1997 protects the river from adverse effectrsassociated with abstraciion. However, Clause 6 (3) specifically allows for the weir if thewater permits are granted or renewed subject to similar terms and conditions to which theformer permits were subject. Freshwater Solutions understands the existing water permitfor the weir set a minimum water level of >50 mm that must be maintained over the crest ofthe weir (Doyle Richardson pers. comm.). Because the weir water level and its associatedriver flow has been set through another resour@ consent process and the effects of theestablished water level and river flow have been assessed as part of that process this reportdoes not assess the effec{s of the diversion of water from the weir in the section of riverbetween the Mataura Falls and the weir itself. For completeness the section of riverbetween the weir and discharge point is described below.
The Mataura River between the weir and Plant treated wastewater discharge point isdominated by a short length of deep, swiftly flow water, the Mataura Falls and a 270 mshallow bedrock section (Figure 50). Between the Plant treated wastewater dischargepoint and the Mataura Falls there is a 155 m length of river characterised by deepmoderately swift bedrock habitat (Figure 51).
Figure 50: View of Mataura Falls and immediate downstrcam environment.
May 2019Alliance Mataura AEE
85 fresh 't',-draler
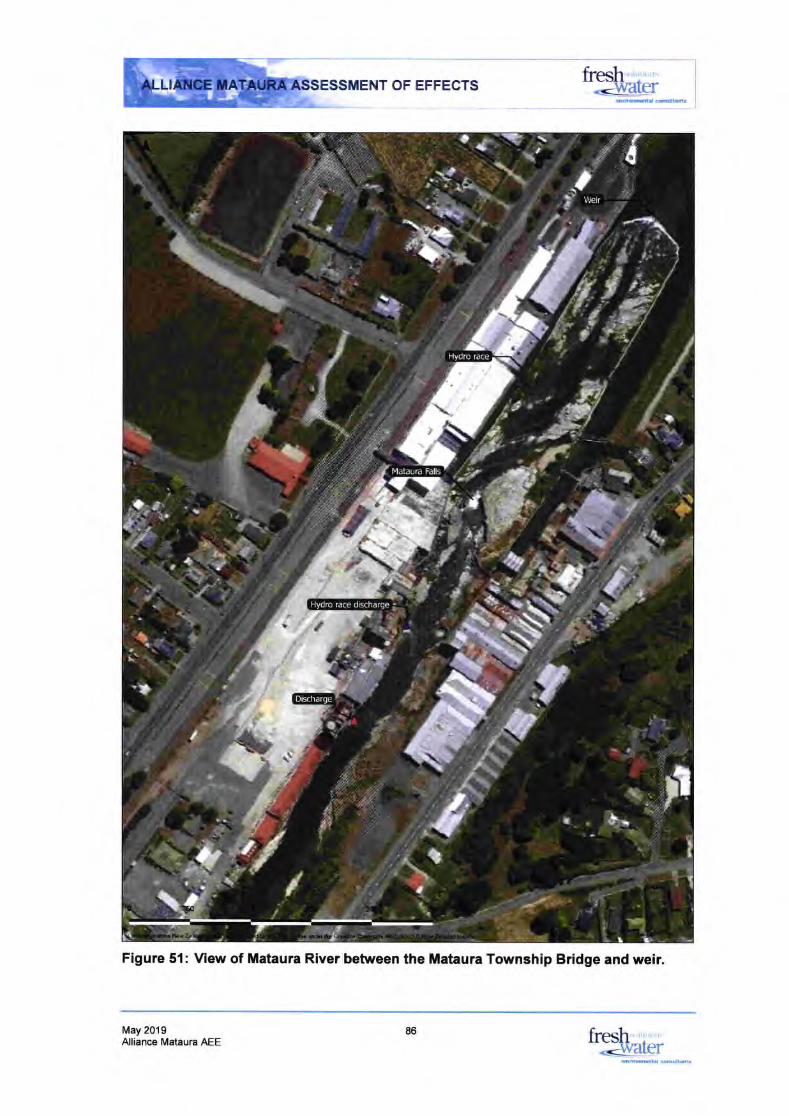
ESSMENT OF EFFECTSeYlffitd.rrulitffi!
Figure 5{: View of Mataura River between the Mataura Township Bridge and weir.
May 2019Alliance Mataura AEE
86 fresh*<\ ratef
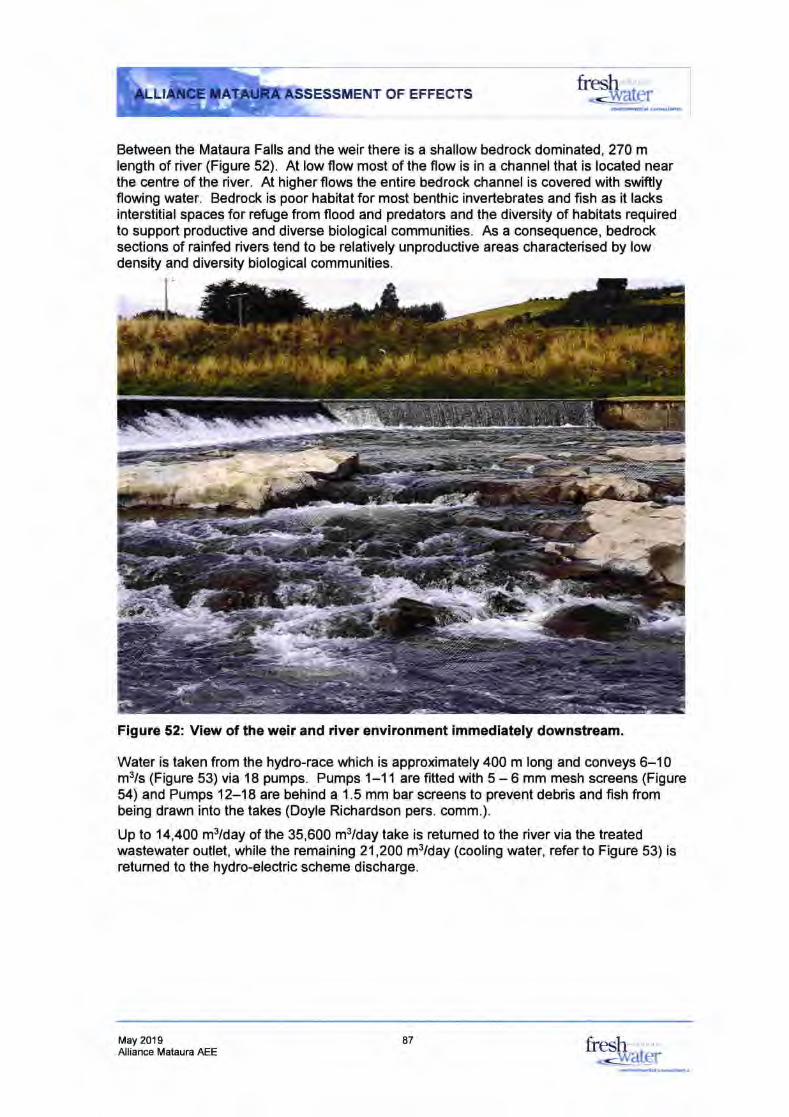
iiENT OF EFFECTS
Between the Mataura Falls and the weir there is a shallow bedrock dominated, 270 mlength of river (Figure 52). At low flow most of the flow is in a channel that is located nearthe centre of the river. At higher flows the entire bedrock channel is covered with swiftlyflowing water. Bedrock is poor habitat for most benthic invertebrates and fish as it lacksinterstitial spaces for refuge from flood and predators and the diversity of habitats requiredto support productive and diverse biological communities. As a consequence, bedrocksections of rainfed rivers tend to be relatively unproductive areas characterised by lowdensity and diversity biological communities.
Figure 52: View of the weir and river environment immediately downstream.
Water is taken from the hydro-race which is approximately 400 m long and conveys 6-10ms/s (Figure 53) via 18 pumps. Pumps 1-11 are fitted with 5 - 6 mm mesh screens (Figure5,4) and Pumps 12-18 are behind a 1.5 mm bar screens to prevent debris and fish frombeing drawn into the takes (Doyle Richardson pers. comm.).
Up to 14,400 m3/day of the 35,600 m3/day take is retumed to the river via the treatedwastewater outlet, while the remaining 21,200 m3/day (cooling water, refer to Figure 53) isretumed to the hydro-electric scheme discharge.
May 2019Alliance Mataura AEE
a7 fresh ; '
-<-vrater
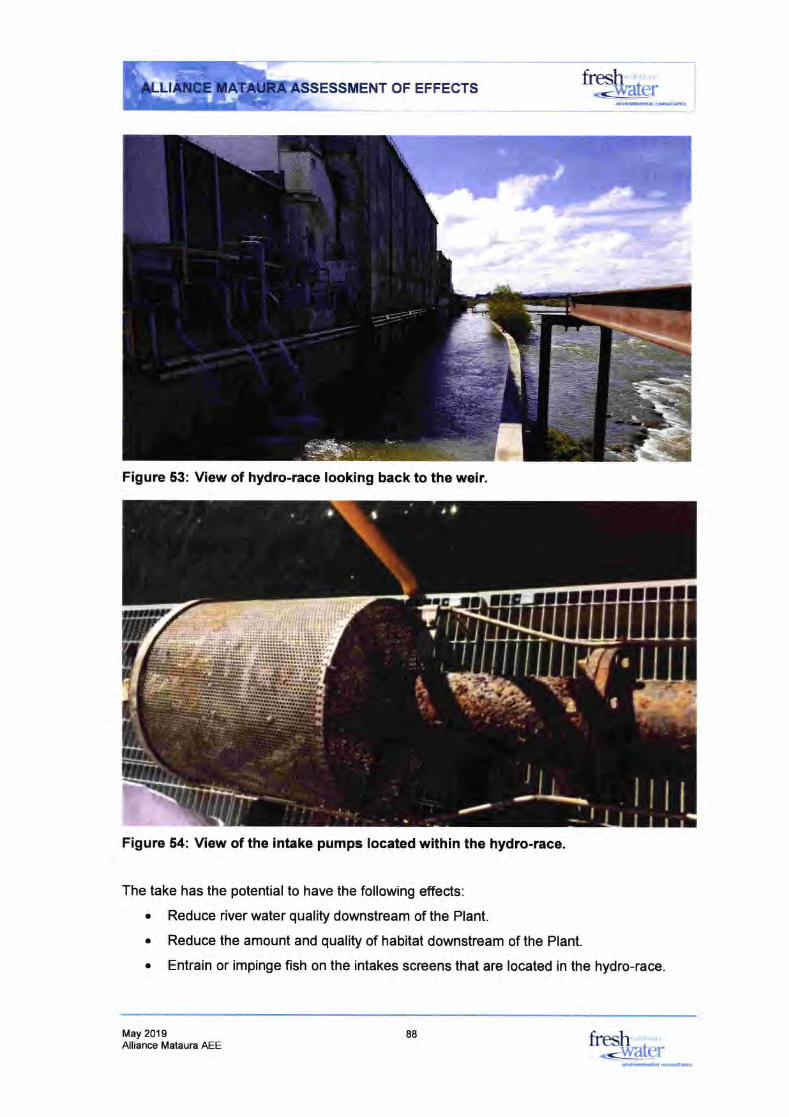
NT OF EFFECTS
Figure 53: View of hydro-race looking back to the weir.
Figure 54: View of the intake pumps located within the hydro-race.
The take has the potential to have the following effects:
o Reduce river water quality downstream of the Plant.
o Reduce the amount and quality of habitat downstream of the Plant.
o Entrain or impinge fish on the intakes screens that are located in the hydro-race.
May 2019Alliance Mataura AEE
88 fresh-dater
OF EFFECTS
5.2 Water Quality
Abstracting water from rivers can result in a range of water quality effects includingincreasing the concentration of contaminants through reduced assimilative capacity,reducing dissolved orygen concentrations through reduced re-aeration, and increasedwater temperatures due to decreased thermal buffering.
The small size of the take relative to the river flow and the very minor effect of the take onminimum flow duration and flow variability will result in only very minor effects on dissolvedorygen, contaminant concentrations and river water temperature and is not expected tosignificantly alter the water quality. The results of all the water quality monitoring to datesupport this conclusion.
5.3 lnstream Habitat Quality
The focus of this assessment is on assessing the potential effects that the maximum totaldaily abstracfion has on low flow, accrual period length, flow variability and the consequenteffects on water quality and biological communities downstream between the take at the topof the hydro-race and the two discharge points where 21,600 m3/day of the total take isretumed to the river with the remaining 14,400 m3/day of the 35,600 m3/day take is retumedto the river in the wastewater discharge, just downstream of the hydro-electric plant outfall
Low or minimum flows set the amount of habitat potentially available for use by biologicalcommunities while flow variability can be critical in determining water quality, periphyton andbenthic invertebrate community health, as well as potentially influencing native fish and troutpopulations.
The consumptive component of the take is approximately 14,400 m3/day or 167 Us. Thisrepresents < 2o/o of the minimum flow of 10.1 m3/s recorded at the Tuturau flow gauge and <1 o/o of the Mean Annual Low Flow (MALF) of 19 m3/s. Refer to Freshwater Solutions(2019) for a description of the Mataura River hydrology using data from the Tuturau flowgauge. The biologically relevant flow statistics with and without the 167 Us take are almostexactly the same. ln terms of river flow the effect of the take is very small and the potentialrisk of water quality and ecological effects are therefore assessed as very low.
The results of the benthic invertebrate community monitoring over many years and the largepopulation of resident brown trout (personal observation) indicate that the water take doesnot adversely affect the benthic invertebrate community (an important food source for fish),fish habitat or fish migration. Overall the take is very likely to have no detectable effects onecological communities and responses including:
r Periphyton growth and cover.
o Benthic invertebrate community habitat and health.
. Fish spawning and rearing habitat.
o Fish migration.
o Adult fish habitat and production.
May 2019Allianca Mataura AEE
89 fresh ': '
<c&El_rer
OF EFFECTSfresh
-jlvarcrsMacmltd.
5.4 Entrainment and lmpingement
The abstraction of water from the hydro-race has the potential to entrain juvenile fish. Thetakes and intake screens are located on the true Ieft side of the hydro-race.
The water velocity within the hydro-race is high creating a high sweep velocity across theface of the intake at the screen faces. The potential for entrainment is thereforeconsiderably reduced compared to many water takes in Southland and around NewZealand. Despite the low risk it is recommended that allthe intakes be fitted with 2 - 3 mmscreens to further reduce the potentialfor entrainment (NIWA 2007).
Summary
The Mataura River Conservation Order 1997 protects the riverfrom adverse effectsassociated with abstraction, except at the weir. The small size of the take relative to theriver flow and the very minor effec{ of the take on minimum flow duration and flowvariability will result in only very minor effects on dissolved oxygen, contaminantconcentrations and river water temperature and is not expected to alter the water qualityor affect fish.
The consumptive component of the take is approximately 14,400 m3/day or 167 L/s. Thisrepresents <1 o/o of MALF. ln terms of river flow the effect of the take is very small andthe potential risk of water quality and ecological effects are therefore assessed as very!ow.
The results of the benthic invertebrate community monitoring over many years and thelarge population of resident brown trout indicate that the water take does a not adverselyaffect the benthic invertebrate community (an important food source for fish), fish habitator fish migration. Overal! the take is very likely to have no detectable effects onecological communities and responses.
The abstraction of water from the hydro-race has the potential to entrain juvenile fish.Despite the low risk it is recommended that allthe intakes that are currently fifted with 5 -6 mm screen mesh be fitted with 2 - 3 mm screens to further reduce the potentialforentrainment and to meet best practice standards for screening intakes.
6.0 References
Alliance Group 2004. Alliance Group Limited Mataura Plant. Application for resourceconsent to discharge treated wastewater to the Mataura River. Volume 3: Furtherlnformation in Support of Application. 6 August 2004.
ANZECC 2000. Australia and New Zealand Guidelines for Fresh and Marine Water Quality.
Biggs and Kilroy 2002. Stream Periphyton Monitoring Manual. Prepared for The NewZealand Ministry for the Environment.
Clarke K.R. and Gorley R.N. 2006 - PRIMER V6: User Manual/Tutorial. PRIMER-E.Plymouth, 192p.
Clearwater, S.J.; Thompson, K.A.; Hickey, C.W. (2014). Acute toxicity if copper, zinc andammonia to larvae (glochidia) of a native freshwater mussel Echyridella menziesii inNew Zealand. Archives of Environmental Toxicology and Chemistry (in press).
May 2019Alliance Mataura AEE
90 fresh ,
-dra[er
d**'--. .
\tt.fiai* ESSMENT OF EFFECTS
Dada, 2019a. Determination of mixing of treated wastewater from Alliance Matauradischarged into the Mataura River: A mixing modelling approach using contaminanttracers. Prepared for Alliance Group/Aquatic Environmental Services Limited.March 2019.
Dada, 2019b. Quantitative Microbial Risk Assessment for the discharge of treated meatprocessing factory wastewater into the Mataura River. Report AES1704. Preparedfor Alliance G roup/Aquatic Environmental Services Limited.
Davies-Colley, R. & Nagels, J. 1999: Specifying the colour of naturalwaters. Water andAtmosphere ,6: 14-17. Freshwater Solutions 2017. Alliance Group Ltd Dischargeand Mataura River Monitoring Plan. Submitted to Alliance Group Ltd. November2017.
Environment Southland 2018. Assessing the State of Periphyton in Southland Streams andRivers. Environment Southland Technical Report. September 2018.
Freshwater Solutions Ltd. 2014. Makarewa River Site Specific Ammonia Receiving WaterEvaluation. Report prepared for Alliance Group Ltd. October 2013.
Freshwater Solutions Lld. 2017. Alliance Group Ltd Discharge and Mataura RiverMonitoring Plan. November 2017.
Freshwater Solutions Ltd 2018. Mataura River Description of the Receiving Environment.Submitted to Alliance Group Ltd. December 2018.
Hickey, C.W., Golding, L.A., Martin, M.L. and Croker, G.F. (1999). Chronic toxicity ofammonia to New Zealand freshwater invertebrates: A mesocosm study. Archives ofEnvironmental Contamination and Toxicology 37 338-351.
Hickey, C.W. and Martin, M.L. (1999). Chronic toxicity of ammonia to the freshwater bivalveSphaerium novaezelandiae. Arch. Environ. Contam. Toxico!. 36: 38.46.
Hickey, C.W. and Vickerc, M.L. (1994). Toxicity of ammonia to nine native New Zealandfreshwater invertebrate species. Archives of Environmental Contamination andToxico logy 26: 292-298.
MFE (1994). Water Quality Guidelines No.2: Guidelines for the Management of WaterColour and Clarity.
MFE (2000). Stream periphyton monitoring manual. Prepared for the Ministry for theEnvironment.
MfUMoH (2003). Microbiologicalwater quality guidelines for marine and freshwaterrecreational areas. Published by the Ministry for the Environment for the Ministry forthe Environment and the Ministry of Health, Wellington. National Policy Statement(NPS) 2O14for Freshwater Management29l4. Updated August 2017 toincorporate amendments from the National Policy Statement for FreshwaterAmendment Order 2017.
MtE 2017. National Poliry Statement - Freshwater Management.
NIWA (2007). Limiting nutrients for controlling undesirable periphyton growth. NIWA clientreport: HAM2007-006. February 2007.
NIWA 2012. Review of the New Zealand instream plant and nutrient guidelines anddevelopment of an extended decision making framework: Phases 1 and 2 finalreport. Report prepared for the Ministry of Science and lnnovation Envirolink Fund.August 2012.
May 2019Alliance Mataura AEE
fiTesh ,&!er
foesh .
-dvarcr91
ftoffilconehac
i -*" ;,\r,l%. ESSMENT OF EFFECTS
NIWA 2013. National Objectives Framework - temperature, DO and pH. Proposedthresholds for discussion. Report prepared for Ministry of the Environment.November 2013.
SWLP 2018: Southland water and land plan - Decisions version. April 2018.
Richardson, J. (1997). Acute ammonia toxicity for eight New Zealand indigenous freshwaterspecies', New Zealand Journal of Marine and Freshwater Research, 31 , 185-190.
Rowe D.K. and Dean T.L. 1998. Effects of turbidity on the feeding ability of the juvenilemigrant stage of six New Zealand freshwater fish species, New Zealand. Joumal ofMarine and Freshwater Research, 32:1, 21-29, DOI:1 0. 1 080/00288330. 1 998.951 6803
Rowe D.K., Smith J. and Williams E.2002. Effects of turbidity on the feeding ability of adult,riverine smelt (Refropinna rctropinna) and inanga (Galaxias maculatus), NewZealand Journal of Marine and Freshwater Research, 36:1, 143-150, DOI:1 0. 1 080/00288330.2002.9517 077 .
Stark, J., Maxted, J.2007: A user guide for the Macroinvertebrate Community lndex.Cawthron Report No 1166. April 2007.
Stevens, L.M., and Robertson, 8.P.2012. Fortrose (Ioetoes) Estuary MacroalgalMonitoring 2011112. Report prepared by Wriggle Coastal Management forEnvironment Southland.
Stevens, L.M., and Robertson,8.P.2017. Fortrose (Toetoes) Estuary 2016: Broad ScaleSubstrate, Macroalgae and Seagrass Mapping. Report prepared by Wriggte CoastalManagement for Environment Southland. 28p. Southland Regional Counci! 2008:2007108 State of the Environment Fishery Report. Southland RegionalCouncilPublication No 2008-08.
Stevens, L.M. 2018. Fortrose (Toetoes) Estuary. Broad Scale Habitat Mapping 2018.Prepared for Environment Southland. 46p.
ftesh :
-!-water
May 2019Alliance Mataura AEE
92 fresh<dyater
rugOF EFFECTS
APPENDIX 1
Dada 2019 - Mixing Report
Appendix 1
Alliance Mataura AEE93 fuesh-'r,,i,,,-r
fi3gf1*,r,,r,,,,,.&ffd
OF EFFECTS
APPENDIX 2Dada 2019 - QMRA report
Appendix 2Alliance Mdaura AEE
94ftp5fu*,h,r,,,,_
!9r

L
.T
APPENDIX 3
Quantitative Microbia! RiskAssessment of the Mataura Plant'swastewater discharge,
Streamlined Environmental, 2019
a
edRONME
Quantitative Microbial nisk
Assessment for the discharge of
treated meat processing factory
wastewater into the Mataura River
Strea
Draft prepared by Christopher A. Dada6s August 2018
Draft reviewed by Jim Cooke 25tr August 2018
Final prepared by Christopher A. Dada zl*May 2019
Report AES1704
Prepared for Allian ce Groupf Aquatic Environmental Sciences LtdMay 2019
@ Streamlined Environmental Limite d. zotg
Dada, A.C (2019) Quantitative Microbial Risk Assessment for the discharge of treatedmeat processing fadory wastewater into the Mataura River. Report AES1704,
Streamlined Environmental, Hamilton, 105 pp.
Streamlined Environmental LtdHamilton, New Zealand
www.streamlined.co.nz [email protected]
Contents
Summary of microbial pathogens in the discharge water 7
Summary of microbiological quality of the receiving environment 8
Summary of the impact of wastewater discharge on faecal bacteria loadings in MatauraRiver 9
Summary of quantitative microbial risk assessment 11
2. Water Qualify Standards: Existing approaches to managrng water quality in New
2.1 Background 74
2.2 Limitations to current approaches to managing water quality receiving animal-related waste in New Zealand 15
2.3 Approaches to standard setting.... .......................76
2.3.1. National Poliry Statement on Freshwater Management............16
2.3.2 Proposed Environment Southland (ES) Water and tand Plan ,..19
3. trrticrobial Pathogens in the discharge water 23
3.1 Compliance Monitoring ...................,23
3.2 PathogenMonitoring 25
4. Microbiological quality of the receiving environment 29
4.1 Historical monitoring (zool-zotz) ......................29
4.2 Recent monitoring (zott-zon) 33
5. tmpact of wastewater discharge on faecal bacteria loadings in Mataura River ..............40
5.1 National Poliry Statement for Freshwater Management.......... ..............40
5.2 Environment Southland Water and Land P1an............ ..........45
6. Quantitative Microbial Risk Assessment (QUne) 48
6.r.
6.2
6.3
Hazardanalysis..... ..........48
Overview 48
8
9
7. Results and Discussion 55
Conclusion.. 59
References 59
Appendix 1. Summary, yearly data of Alliance Plant wastewater discharge E. coliconcentrations............ ................66
Appendix z. Additional notes on zoonotic pathogens in animal wastewater ......................67
Appendix 3. Important bacteria potentially present in animals and their wastes (Source:
Sobsey et al zooo) .......................T0
Appendix 4. Important viral pathogens associated with animal waste (Source: Sobsey et al2006) 77
Appendix 5. Quantitative PCR markers used to identifr sources of faecal contamination inthis 72
Appendix 6. Raw data of results from laboratory analysis ..............73
Appendix 7. Distribution fitting for upstream Mataura River E coli concentrations..........88
Appendix s. A.dditional notes on dose-response charactenzatron 97
Appendix 9. Plots of individual dose response curve fitted for animal waste relatedpathogens in this QMRA......... .......................99
Appendix 10. Proportion of infections that progress to a symptomatic response (illness)
100
Appendix 11. Individual's lllness Risk (x) and predicted number of illness cases per 100
swimmers who are exposed to Mataura River water that potentially containsCryptosporidium followingAlliance PlantWW discharge ............,..101
Appendix 12. Individual's Illness nisk (x) and predicted number of illness cases per 100
swimmers who are exposed to Mataura River water that potentially contains Giardia
oorysts following Alliance Plant WW discharge .........102

Appendix 13. Individual's lllness nisk (x) and predicted number of illness cases per 100
swimmers who are exposed to Mataura River water that potentially contains E. coliol57:H7 following Alliance Plant WW discharge.. 103
Appendix 14. Individual's Illness Risk (x) and predicted number of illness cases per 100
swimmers who are exposed to Mataura River water that potentially contains Salmonella
following Alliance Plant WW discharge .......................1.04
Appendix ts. tndividual's Illness nisk (x) and predicted number of illness cases per 100
swimmers who are exposed to Mataura River water that potentially containsCampylobacter following llliance Plant WW discharge L0s
Fr<ecutive Summary
Alliance Group is seeking renewal of consents to continue discharging treated meatworkswastewater into the Mataura River. To support the new discharge consent application,Alliance Group has contracted Aquatic Environmental Sciences (ers) Ltd to provide an
assessment of ecologicd effects (err). Microbial contamination will be a key issue forsubmitters and Streamlined Environmental (srl) md) have been commissioned to collateand analyse the 20L7 /tg microbid data from the Mataura River, and assess the potentialeffects of the meatworks discharges on the receiving environment. The sfudy sought toprovide a scientifically-robust assessment as to whether or not the Alliance Plant Matauradischarges have a 'more than minor' effect on the state of the receiving environment forrecreational uses .
The project proceeded in the following phases.
Collation of existing information on microbial contaminants from the AlliancePlant and the wider receiving environment (the Mataura River). This data, as wellas data generated from an additional targeted monitoring of the receivingenvironmentin2O]-T andzota was used to describe the current microbial status ofthe elliance discharge and the Mataura River receiving environment. Baseline(upstream) and post-discharge river concentrations (downstream) were assessed
against relevant water qudity guidelines for recreational waters (i.e. the revised2017 Nationd toliry Statement for Freshwater Management and EnvironmentSouthland water and tand Plan).
Assessment of potential effects of the Alliance Plant discharge(s) in terms of theimpacts on faecal indicatorbacteia (nf)'loadings into the Mataura River.
Completion of a quantitative microbial risk assessment modeling (qune) using
@RISK software utilizing predefined dose-response functions for zoonotic bacterialand protozoan pathogens relevant to human health (Salmonella, Campylobacter, E.
coli olsl : H7, Giardia, Cryptosporidium) .
Summary of microbial pathogens in the discharge water
The current discharge consent does not specifr a limit for the allowable number ofFIB in the discharge.
Historical E. coli concentrations in the discharge wastewater ranged between L x103 cFu/loomt (in 2006andzotz) and 1x 10⁷ cFu/looml- (in 2016). An analysis of
1 E coli being the faecal indicator bacteria of choice for freshwaters
a
a
O
a
a
7
a
a
historicd monitoring data at the plant indicates considerable variability over theyears. while an apparent increasing trend in E. coli concentrations were observedin2OO4 to 2010, adecreasingtrend inE.coliconcentrations is noticeable from2013-2017.
Results showed a very high level of r.coli , up to 106 cFu/looml, was beingdischarged into the Mataura River from the elliance Plant, but that the levels ofthe representative pathogens were very much lower and more variable. Inaufumn 2018, the discharge contained a reasonable number of Salmonella species(rzo cells per 100mL), Campylobacter jejuni (zz cells per 100mL) but few E. coli 015:
H7 (03 cells per 100mL) but zero rysts of either Cryptosporidium or Giardia.
In contrast, over the summer of zo18/t9, Salmonella species and Campylobacterjejuni were lower in concentration (.30 cells per 100mL) while Cryptosporidiumand Giardia were detected at comparatively higher levels (up to 310 oorysts perlitre). This variability is not unexpected because pathogens in meat workswastewater will depend on the resident population of pathogens in the animalsbefore slaughter, which will vary.
Summary of microbiological quality of the receiving environment
Monitoring data for the Mataura River and its tributaries from2007 to 2077 were analysedin relation to the revised NPS-FM (zotl), a poliry document which defines River AttributeStates for E. colibased on S-year median and 96th percentile concentrations, as well as theproportions of exceedances of the 260 CFU/loomL and 540 CFU/1o0mL single bathingwater standards. Exceedances of the New Zealand single sample bathing water standardsof zoo CFU/1oomL and sao CFU/1oomt were common among within the Matauracatchment. Attribute state classification based on the historicd E. coli datafor the MatauraRiver and tributaries (zott-zots) indicate that the river is classified as E (Red) for most ofthe monitored sites, regardless of whether the site considered is upstream or downstreamfrom the Alliance discharge.
Historical monitoring data indicate that there is a strong connection between river flow,water clarity and the observed E. coli concentrations in the entire Mataura River. E. coliconcentrations in the Mataura River water column tend to exceed the bathing waterstandards of zoo cFu/looml and s+o cFu/looml- more frequently, when water clarity isbelow 2.0m. Similarly, E. coli concentrations more frequently tends to exceed the bathingwater standards when river flows are elevated (stormflow). rhe observed correlationsbetween river water E.coli, discharge and water clarity give credence to the influence of acombination of faecal contentffaecal bacteria loadings from pastoral catchment overlandflows and in-stream processes.
8
Recent monitoring (zott-zon) indicate that:
E. coli concentrations increase significantly following discharge of the AlliancePlant wastewater. Also, E coli concentrations reduce gradually downstream i.e.
with increasing distance away from the discharge pointRelationships between E. coli and Mataura River flow varies depending on the flowconditions. The impact of the Alliance Plant discharge on downstream sites
increases during low flow conditions
There is no relationship between water temperafure and r. coli concentration atthe upstream sites, before the discharge point.
dthough elevated E. coli in the treated discharge water and receMng water body appears
to be a concem, discharged wastewater E. coli level or high instream E. colf levels do notnecessarily equate to high pathogenic risk. uigh E. coli levels above the NZ bathing waterstandards did not correlate with the levels of campylobacter species and C. jejuni, thepathogens, whichform the basis for the current New Zealand water standards.
Ruminant markers were present both in the treated wastewater and the receiving river.Apart from the Alliance Plant discharge, the Mataura River also receives input from otherprimary productive lands in the Mataura catchment. While an application of MST in thisstudy has identified ruminants as the predominantfaecd, signature in the Mataura River,it fails to distinguish between faecal, signature from cattle in the meat processing factory(Alliance Mataura plant) versus cows/cattle on the farms in the same catchment.
Avian GFD faecal marker were detected in the receiving water environment indicatingthat avian sources are another important contributor of faecal loading to the MatauraRiver.
Summary of the impact of wastewater discharge on faecal bacteria loadings in Mataura
River
Mass bdance modelling show significant increases in the proportion of samples, at thedownstream site (Mataura River zOOm d/s Mataura Bridge), exceeding the NPS-FM (zotl)bathing water standards following the discharge. This suggests that the Alliance Plantdischarge is having an effect on the levels of E coli in the receiving water. However, theobserved increase in FIB concentrations as a result ofthe treated Alliance Plant dischargedid not necessarily relate to the abundance of pathogens, as reflected in pathogenmonitoring data collected at the receiving environment and the QMRA results.
Results from mass balance modelling presents considerable evidence that othercatchment sources e.g. overland flows contribute about 4l% of E. coli loading into theMataura River during storm-related or extreme rainfall events. Efforts to improve the
a
a
9
bacteriological water quality in the Mataura River should also include considerations forcatchment management of faecal pollution sources other than the llliance Plant.
Five scenarios of mass balance modelling were also used to determine the extent ofimprovement the Alliance discharge would need to make, such that it would not cause:
1) A NPS-FM attribute state change of the downstream site, if the upstream waterquality improved from the current "Red" (worst, median E. coli.260 CFU/lo0mL,95m percentile '1200 CFU/1OOmL) attribute state to:o Attribute state "Green" (median E. coli <130 cFU/100mL, 95th percentile < 1000
CFU/1oomL) - Scenario NPS-FM-Ia (rable rr).o Attribute State 'Yellow" (median E. coli<tso cFU/100mL, 95tr percentile < 1200
CFU/1OOmL) - Scenario NPS-FM-Ib,o Attribute State "Orange" (median E. coli,1:o CFU/100mL, 95th percentile ,1200
CFU/1OOmI)- Scenario NPS-FM-1c;2) A downstream site exceedance of:
. the microbiological standard in the proposed ts water and Land tlan (i.e. rsoCFU/1oomL median E.coli concentration), if the upstream water qualityimproved from the current S-year median of sot cFU/1oomL to < 130
CFU/1oomL (Scenario ES Water and tand plan-r),. a hypothetical threshold (i.e. looo cFU/1oomL 95th percentile E.coli
concentration), if the upstream water quality improved from the current 5-year 95n percentile of saot CFU/100mL to . 1000 CFU/loomL (ScenarioHypothetical-r).
If upskeam water qudity is improved in an NPS-FW context from the current "Red"(worst) attribute state, to:
(a) "Green" (Scenario NPS-FM-1a),. Alliance Plant wastewater g5trpercentile E coli concentrations less than 140,000
CFU/1oomL would not cause an attribute state change at the site immediatelydownstream of the discharge regardless of the season and flow condition.
o If wastewater 95tr percentile E coli concentration exceeds 14o,ooo CFU/100mL,then an attribute state change downstream from "Green" to "Orange" ispredicted.
o If wastewater 95th percentile E. coli concentration exceed 300,000 cFu/looml,then a further attribute state change downstream from "Orange" to "Red" ispredicted.
(b) "Yellow" (Scenario NPS-FM-1b),o Because of the marginal difference in 95ft percentile limits between Green-
Yellow-orange attribute states, when Alliance Plant wastewater 95tr percentileE. coli concentrations exceed +0,000 CFU/loomL, an attribute state changedownstream from "Yellow" to "orange" is predicted as a result of thedischarge.
10
When Alliance Plant wastewater 95tr percentile E coli concentrations exceed200,000 CFU/1oomL, it is predicted that the attribute state at the downstreamsite would change further from "orange" to "Red".
(c) "Orange" (Scenario NPS-FM-1c),o It is predicted that Alliance Plant wastewater 95th percentile E. coli
concentrations less than 160,000 CFU/100mL would not cause an attribute state
change at the downstream site discharge regardless of the season and flowcondition.
o If wastewater 95s percentile E. coli concentration exceed 15o,oo0 CFU/loOmtduring summer conditions, then an attribute state change downstream from"orange" to "Red" is predicted.
Aspects of the proposed ES water and tand Plan converge with NPS-FM (zorz). rorinstance, a scenario of median concentration <130 CFU/1O0mL in the ES Water and tandPlan coincides with the NPS-FM attribute states "Yellow" (Scenario NPS-FM-1b) and"Green" (Scenario NPS-FM-1a). Similarly, a suggested hypothetical 95ft percentileconcentration <1000 Cfu/l0omt coincides with the NPS-FM attribute state "Green"(scenario NPS-FM-Ia), and hence the same modelling results.
Summary of quantitative microbial risk assessment
Quantitative microbial risk assessment (QunR) was used to evaluate the risk to swimmers
ftoth adults and children) in the Mataura River, at the Bridge, -300m downstream of thealliance discharge. where the risk to an individual (un) is greater than 1% (the acceptedthreshold for contact recreation), further simulations can be done to determine thedegree of treatment required for the IIR to drop below the 1% threshold. This studyassessed the hedth risk from the Alliance discharge with no treatment and with theexisting treatment.
The results of QuRe analysis showed:
No treatment, normal flow scenario - children and adults' recreational healthrisk fall above the 7% threshold in winter and summer for all zoonotic pathogens
No treatment, peak flow scenario - children and adults'recreational hedth riskfall above the 1% threshold in winter and summer for all zoonotic pathogens
Treatment applied normal flow scenario - children and adults' recreationalhedth risk fall below the 1% threshold in winter and summer for all zoonotic
o
o
a
a
11
pathogens. Thus, there is less thanT% probability of an individual becoming ill dueto swimming at the study site.
Treatment applied, peak flow scenario - children and adults' recreationalhealth risk fall below the l% threshold in winter and summer for all zoonoticpathogens.
Therefore, it is concluded that the current wastewater treatment applied at AlliancePlant is sufficient to reduce health risks associated with swimming below thedischarge to levels below 'the NZ threshold for tolerable risk', even at maximumdischarge of 14,400 m'/d.'
while the Alliance Plant discharge is having'more than aminor' effect on the levels ofE. coli in the receiving water (Section 5), observed increases in E. coli concentrations as
a result of the treated Alliance Plant discharge did not necessarily relate to theabundance of zoonotic pathogens (Section 3.2) neither did these increases in E colirelate to the individual illness risk (Section z).
Results in the current QMRA study generally agree with a recent ESR study (Cressey,
Hodson, Ward, & Moriarty, 2077) which adopted a combination of faecd, sourcetracking genotypic analysis and QuRe to assess human health risk of the MatauraRiver, Southland. Results from the ESR-led investigation affirmed that:
a "Effluent discharged from the Gore WWTP and the meat processing plantcontribute a relatively small proportion of the overall Campylobacter risk. This isconsistent with other work that indicated that Campylobacter contamination inthis region of the Mataura River was predominantly of wild fowl origin".The first two modelled Qune scenarios produced very low risk of Campylobacterinfection (.0.7o/o),thatis, avery lowrisk of Campylobacterinfectionundereithertheold or updated guidelines. (i.e. NpSFM,2ol4,2ot7).The third ESR QMRA scenario would result in a lower water quality categorisation(estimated IIR values of between t.7 and 2.8%), depending on whether high riverflows'are excluded from the estimate, as representing'unswimmable' conditions.rhis literally translates into a maximum of z to 3 cases of campylobacter infectionin 100 individuals. It is important to note that the third scenario in the ESR QMRAconsiders background Mataura River concentrations with inputs from the GoreWWTP, Alliance Plant discharge and other diffrrse sources (e.g. during high riverflows) in the estimation of recreational health risks. However, in this sfudy, todistinguish the effect of the Alliance Plant discharge alone, an approach that
'z It is important to note that the discharge in future consent applications could be less than t4,40o m3 /d,3 During high river flows, overland flows and diffirse source pollution from other sources contribute to the
Campylobacter infection risk
a
a
72

assumes no background concentration in the Mataura River was used. this QMRAtherefore assessed if the Alliance Plant discharge (only) will cause the IIR toincrease beyond an acceptable threshold of tN.It has been shown from the QMRAusing Campylobaaer concentrations from multiple Alliance Plant discharge samples
that the resulting IIR due to the discharge does not exceed 1% and were in mostcases below 0.1%.
13
l. lntroduction
Alliance is New Zealand's only wholly farmer-owned red meat co-operative with plantslocated at varying locations in New Zealand including Mataura, Southland. The AlliancePlant at Mataura produces several waste streams, including slaughter floor, boning room,edible by-products processing, stockyards and truckwash, water treatment plantbackwash and domestic waste (which goes to the Mataura Wastewater Treatment Plant).Meat processing wastewater generated in the factory is keated onsite via physicaltreatments prior to being discharged to the Mataura River, which is the receivingwaterway.
The Alliance Group is seeking renewal of consents to continue discharging treatedmeatworks wastewater into the Mataura River. To support the new discharge consentapplication, Alliance Group contracted Aquatic Environmentd Sciences (efS) Ltd toprovide an assessment of ecological effects (eff). vticrobial contamination will be a keyissue for submitters and ArS has contracted SrL to collate and analyse the 2oll/78microbial data from the Mataura River, and assess the potential effects of the meatworksdischarges on the receiving environment. The study sought to provide a scientifically-robust assessment, as to whether or not the Alliance Plant discharges have a 'more thanminor' effect on the state of the receiving environment for recreational uses.
2. water Quality Standards: Fxisting approaches to rnanaging water qualfty in New
Zegrlatvd
2.1 Background
Surface waters are prone to contamination by pathogens from various point and nonpointsources as a result of faecal wastes from animal processing factories (e.g. wastewater fromRlliance Plant) and intensive agriculture-related practices on primary productive lands(e.g. animal waste from pastoral lands in the Mataura catchment). These pathogens aretechnically referred to as zoonotic -i.e. originate from animals and cause disease inhumans. In New Zealand the most significant micro-organisms causing zoonotic diseases
are the bacteria Campylobacter spp., some strains of Eschqbhis colL Salmonella spp., andthe protozoa Giardia and Cryptosporidium (MoH, n.d.). oetails of pathogens associated withanimal related wastewater are presented in eppendtxz -q.
Enteric zoonotic diseases constitute about 80% of the total notifiable illnesses in NewZealandn. Hence, to protect New Zealanders, risks assessment and management systems
ahttps://thewaternetwork.com/ /climate-change-and-the-environment/blog-ll5/zoonoses-in-new-zealand-lNbgfol psWDbvKpovPwoWw.
14
are in place to potentially reduce exposure of water users to these pathogens. In New
Zealand, current risk assessment is based on a monitoring system that assesses the levels
of Escherichia coli (NpS-fu 2oL7). E. coli is typically used an indicator of the presence ofpotential enteric pathogens given that it is commonly present at high concentrations inthe intestinal tracts and faeces of animals, including humans (cabrd, 2o7o; Payment &Locas,2011).
2.2 Limitations to current approaches to managing water quality receiving animal-
related waste in New Zealand
Despite the widespread use as of E coli as an indicator organism, it is debatable as towhether the levels of rn adequately predict the presence of all types of pathogens,
Zoonotic pathogens from primary productive land are not reliably detected using the E
coli prory. this is because there is often no good correlation between E. coli and zoonotic
pathogenss. Hence, merely measuring E. coli as an indicator of risk on streams receivinginput from animal-waste dominated sources may fail to protect the public from exposure
to zoonotic pathogens. These concerns are well documented (ehmed, Sawant, Huygens,
Goonetilleke, & Gardner, 2009; Payment & Locas, 2011; Savichtcheva & Okabe, 2006;
Sobsey, Khatib, Hill, Alocilja, & Pillai,2006; Wu, Long, Das, & Dorner, 2}1-1-). For streams
receiving input from animal-waste dominated sources, a more robust risk management
appoach would focus on in-depth site-specific assessments that includes a considerationfor speciftc zoonotic pathogens associated with this form of waste. For instance, reliance
on quantitative methodsu with a focus on animal factory wastewater pathogens willprovide a more scientifically defensible mechanism to characterize risks from animal-based wastewater sources.
Another limitation to the current risk assessment system, which relies on E.coli as
indicator bacteria, is that E.coli can survive and proliferate outside of animal intestines, intropical and temperate habitats. this calls into question their reliability as indicators inthese habitats. Also, the processes that control the survival and removal of microbes inwater, such as competition, ultraviolet radiation, temperafure, predation, and transportdiffer among pathogenic species. Thus, monitoring FIB alone is not sufficient to assess
human health risk.
s National Research Council (US) Committee on Indicators for Waterborne Pathogens. Indicators for WaterbornePathogens. Washington (DC): Nationd Academies Press (US); 2004. 4, Attributes and Application of Indicators.6
QN,IRA
15
In New zealand,levels of. E.coli in water is used to determine whether the water intendedfor drinking or recreational purposes are free of zoonotic pathogens. For contactrecreation, in the case of single samples, less than 540 CFU/:.:0O mL of E. coli arerecommended by the NPS -FM and warnings (advisories) are usually issued to the publicwhen contaminant levels exceed these concentrations. However, such advisories do notpresent an accurate assessments of health risk associated with contact recreation,particularly because of the low-frequency monitoring that usually miss pollution eventsover shorter timescales. Another key challenge is the delay between measurement andreporting. Routine bacteriological culture requires 24-48 hours before results can guiderisk assessment. Invariably, this means that swimming advisories, when issued indicatethat'it may have been safe/unsafe to swim in the past (oada & Hamilton,2ot6)'.
Existing approaches to monitoringE. coli levels as a prory for the presence of zoonoticpathogens does not seem to distinguish between concentrations during different flowconditions. Considerations for flow conditions may warrant the establishment of morestringent limits for E. coli during the "swimming season" (typically during base and lowflows) and less stringent limits for all other times (storm flows). A conservative thresholdset at 540 CFUh00mL regardless of the season may actually mean that health risksassociated with exposure to pathogens are over-estimated, particularly during non-swimming periods when the E coli population are largely driven by periods of high flow.
2.3
2.3.1
Approaches to standard setting
National Policy Statement on Freshwater Management
The National loliry Statement for Freshwater Management 2Ol4 (ttps-ru, see Table 1)
sets out the objectives and policies for freshwater management under the ResourceManagement Act 1991. These objectives and policies direct local government to managewater in an integrated and sustainable way, while providing for economic growth withinset water quantity and quality limits. The primary responsibility for implementing theNPSFM lies with regional and unitary councilsT, who are required to effect to the NPS-FM
in planning documents, report on their progress, and fully implement the NPSFM no laterthan 3l December 2O25.TheNPS-FM came into effect on 1Augustz}74.
Recent revisionss were made to the NPS-FM in August 2017. Based on these revisions, toassess swimmability, four metrics are considered namely % exceedance of the 540 E. coli
7 The Resource Managrcment Act 1991 requires Regional Councils to give effect to national policy statements in regionalpolicy statements and regional plans (Sections 62 and d5 respectively).8www.mfe.govt.nz/fresh-water/acts-and-regulations/national-policy-statement-freshwater-management/2017-changes
t6
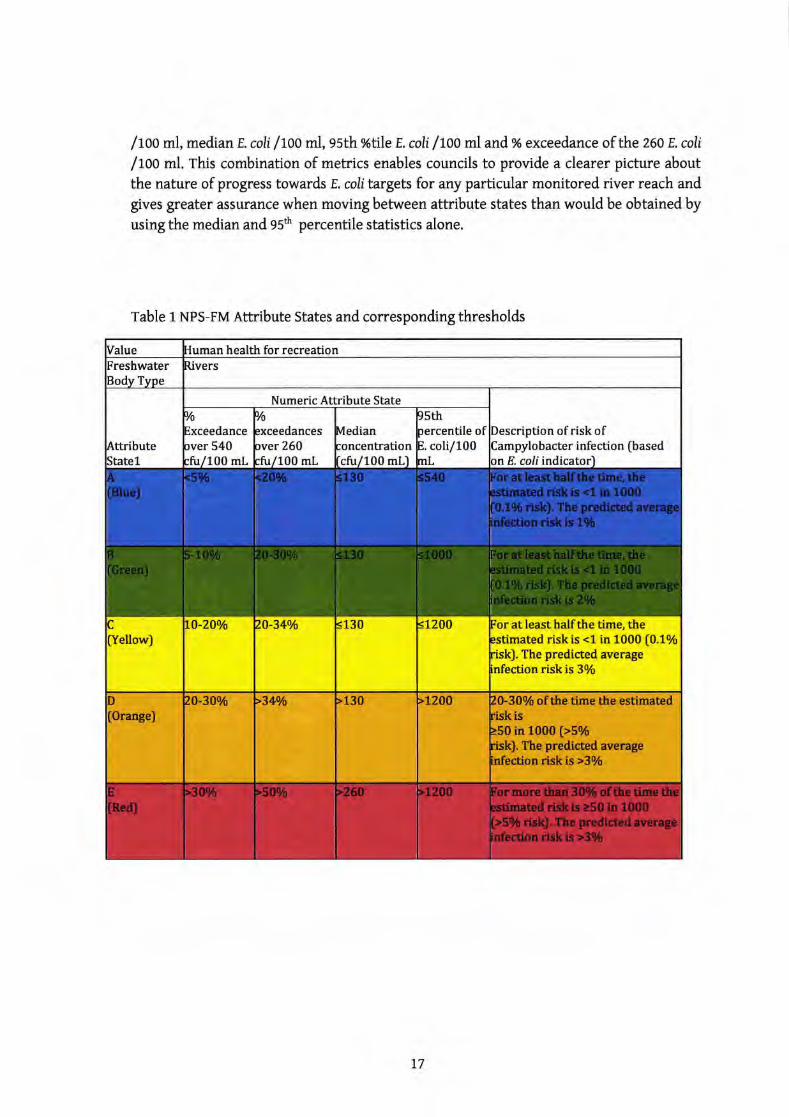
/too ml, median E. coli /too ml, gsth %tile E coli /too ml and % exceedance of the 260 E. coli
/roo ml. this combination of metrics enables councils to provide a clearer picture about
the nature of progress towards E. coli targets for any particular monitored river reach andgives greater assurance when moving between attribute states than would be obtained byusing the median and 95tr percentile statistics alone.
Table 1 NPS-FM Attribute States and correspondingthresholds
[/alue Iuman health for recreationFreshwaterBody Type
Uvers
AttributeStatel
Numeric Attribute State
E. colimLcoli/100
of of risk ofinfection (based
100 mL260540
00 mL
[Yellow)
LO-20% <1302O-34Vo s1200 ior atleast hdf the time, the:stimatnd riskis <1 in 1000 [0.1%:isk). The predicted average,nfection riskis 3%
t7
Concerns about the gradings outlined in the revised national swimming standards have,however, been raised in previous New Zealand literafure (e.g. submissionse to the Ministry
A rapid analysis of Auckland Council's State of the Environment (SoE)
fruhwater sites using the four proposed E.coli statbtics (for a S-year data
period) identified that often the bands for a particttlar attribute state were
not consistently met for each of the four proposed statistics. This contradictsMfEs statmrent that "there is a high correlation between the tests. If youmeet one itish@hly likely that all othq tutswillbemet".
for the Environment). rhe new attribute states and numeric classifications may makesense statistically, but is likely to create confusion among stakeholders, particularlyamong regional councils tasked with managing water qudity, and the general public. forinstance, under the revised classification scheme, it is difficult to classifr some rivers intoattribute states specified in the revised attribute tables. According to Auckland Council:
To provide an approach to monitor progress towards the achievement of freshwaterobjectives, Policy CB1 in the revised NPS-FM requires that every regional council developa monitoring plan that:. establishes monitoring methods which include surveillance monitoring of microbial
health risks to people at primary contact sites (Poliqr CB1-aa),
o identiftes a site or sites at which monitoring will be undertaken that arerepresentative for each freshwater management unit (Policy CB1-b); and,
o recognises the importance of long-term trends in monitoring results and therelationship between results and the overall state of fresh water in a freshwatermanagement unit (foliry CBl-c).
It is unclear where this sampling described in this Poliry CB1 should occur - at allswimming sites, for all large rivers, or at sites representing a FMU? The poliry documentdoes not speciff considerations when t}re presence of a point source discharge influencesthe selection of an appropriate FMU for which the poliry may be applied for E. colimonitoring. In these instances, regional councils need to, in the context of local realities,determine appropriate FMUs to which the poliry may be applied.
https://www.mfe.govt.nzlsites/default/files/media/Streamlined%zoEnvironmenta].pdf
18
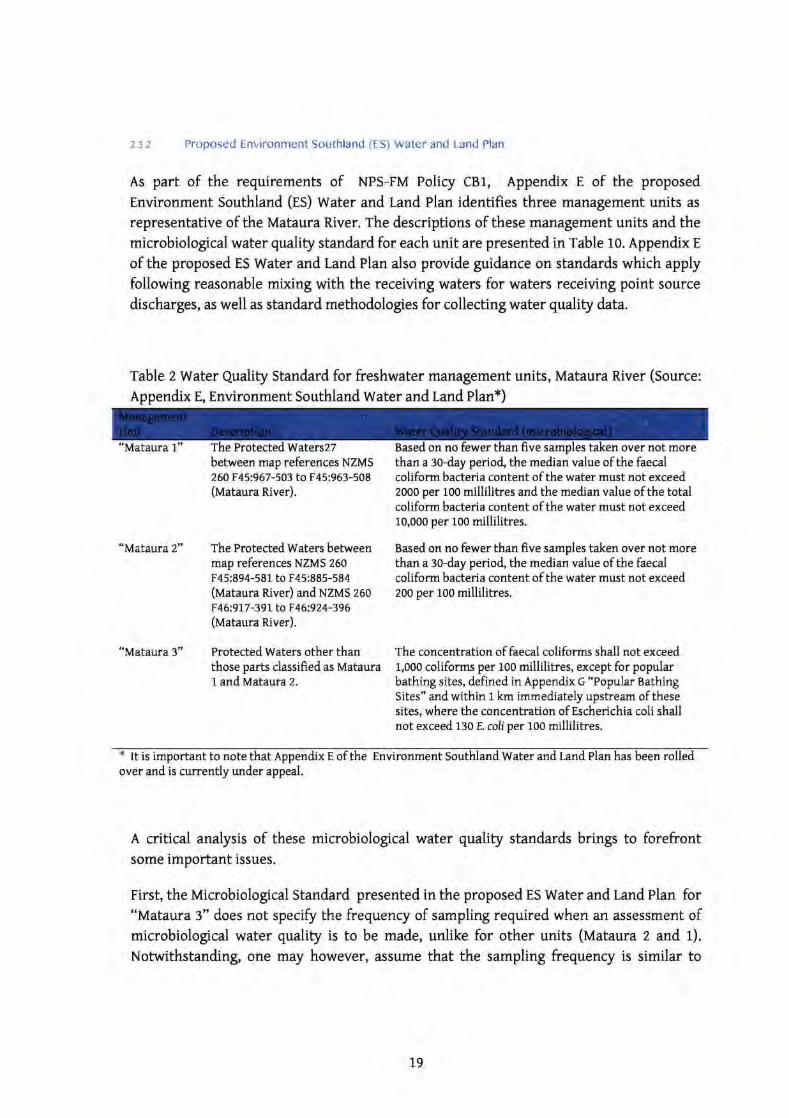
2.3.2 Proposed Environment Southland (ES) Water and Land Plan
As part of the requirements of NPS-FM toliry cnt, Appendix E of the proposed
Environment Southland (ES) Water and tand Plan identifies three management units as
representative of the Mataura River. The descriptions of these management units and themicrobiologicd water quality standard for each unit are presented in Table 10. Appendix E
of the proposed ES Water and Land Plan also provide guidance on standards which applyfollowing reasonable mixing with the receiving waters for waters receiving point source
discharges, as well as standard methodologies for collecting water quality data.
Table 2Water Qudity Standard for freshwater management units, Mataura River (Source:
Appendix E, Environment Southland water and Land Plan*)
Waters2T on no over not more
"Matauta2"
"Mataura 3"
between map references NZMS260 E 45:,967 -503 to F45:963-508(Mataura River).
The Protected waters betweenmap references NZMS 260
F45;894-581 to F45:885-584(Mataura River) and NzMs 250F 45:917 -391 to E 462924-396(Mataura River).
Protected waters other thanthose parts classified as Mataura1 and Mataura 2.
than a 30-day period, the median value ofthe faecalcoliform bacteria content of the water must not exceed2o0o per 100 millilitres and the median value of the totalcoliform bacteria content ofthe water must not exceed1o,oo0 per 100 millilitres.
Based on no fewer than five samples taken over not morethan a 30-day period, the me&an value of the faecalcoliform bacteria content ofthe water must not exceed2oo per 100 millilitres.
The concentration offaecal coliforms shall not exceed1,000 coliforms per 1oo millilitres, except for popularbathing sites, defined in Appendix G "Popular BathingSites" and within I km immediately upstream of thesesites, where the concentration ofEscherichia coli shallnot exceed 130 E colf per roo millilitres.
* It is important to note that Appendix E of the Environment Southland Water and Land Plan has been rolledover and is currently under appeal.
A critical analysis of these microbiological water qudity standards brings to forefrontsome important issues.
First, the tvticrobiological standard presented in the proposed ES Water and rand Plan for"Matarra 3" does not speciff the frequency of sampling required when an assessment ofmicrobiological water qudity is to be made, unlike for other units (Mataura 2 and r).Notwithstanding, one may however, assume that the sampling frequenry is similar to
t9
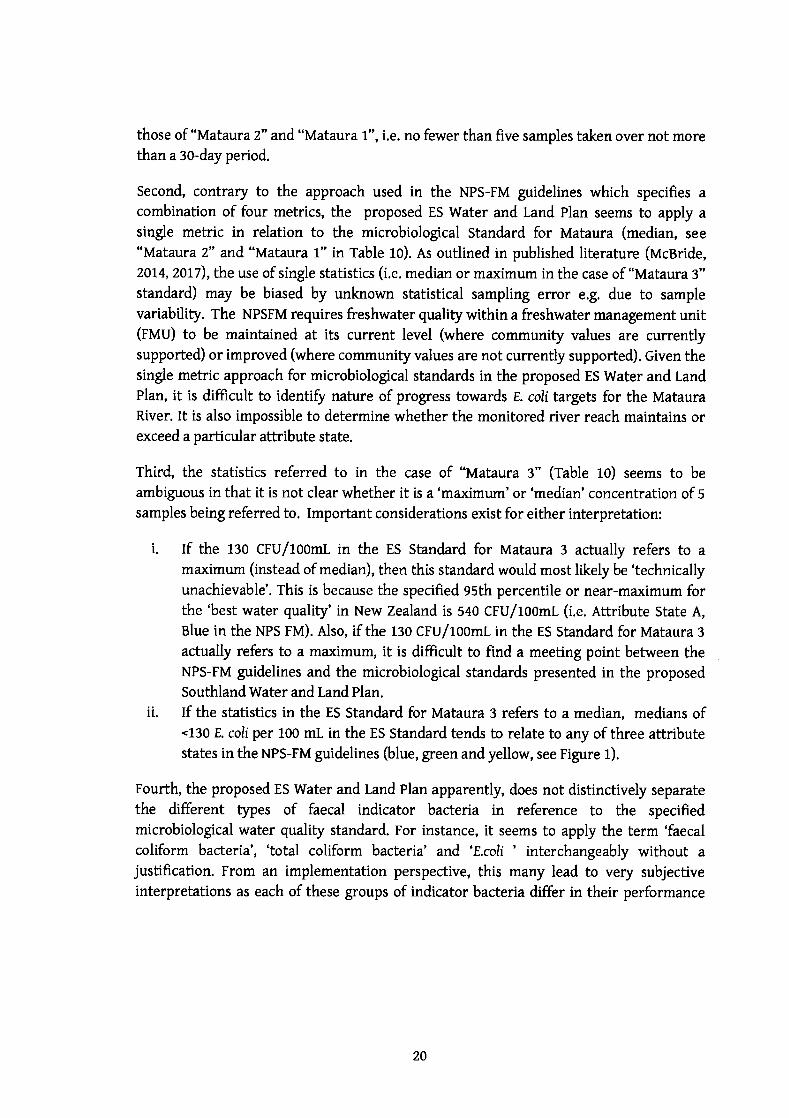
those of "Matauta2" and"Mataura 1", i.e. no fewer than five samples taken over not morethan a 30-day period.
Second, contrary to the approach used in the NPS-FM guidelines which specifies acombination of four metrics, the proposed ES Water and Land Plan seems to apply a
single metric in relation to the microbiological standard for Mataura (median, see"Mataura 2" artd "Mataura 1" in Table 1o). As outlined in published literature (tvtcBride,
2014, 2Ol7), the use of single statistics (i.e. median or maximum in the case of "Matavra 3"standard) may be biased by unknown statistical sampling error e.g. due to samplevariability. The NPSFM requires freshwater quality within a freshwater management unit(ruu) to be maintained at its current level (where communi[r values are currentlysupported) or improved (where communit;r values are not currently supported). Given thesingle metric approach for microbiological standards in the proposed ES Water and LandPlan, it is difficult to identi$r nature of progress towards E. coli targets for the MatauraRiver. It is also impossible to determine whether the monitored river reach maintains orexceed a particular attribute state.
Third, the statistics referred to in the case of "Mataura 3" (Table 10) seems to beambiguous in that it is not clear whether it is a 'maximum' or 'median' concentration of 5samples being referred to. Important considerations exist for either interpretation:
l. lf the 130 CFU/100mL in the ES Standard for Mataura 3 actually refers to a
maximum (instead of median), then this standard would most likely be 'technicallyunachievable'. This is because the specified gsth percentile or near-m;ximum forthe 'best water quality' in New Zealand is 540 CFU/1oomL (i.e. Rttribute State A,Blue in the NPS EM). Also, if the 130 CFU/1oomL in the ES Standard for Mataura 3
actually refers to a maximum, it is difficult to find a meeting point between theNPS-FM guidelines and the microbiological standards presented in the proposedSouthland Water and Land Plan.
tf the statistics in the ES Standard for Mataura 3 refers to a median, medians of<130 E coli per 100 mL in the ES Standard tends to relate to any of three attributestates in the NPS-FM guidelines (blue, green and yeIlow, see Figure 1).
11.
Fourth, the proposed rS water and tand Plan apparently, does not distinctively separatethe different types of faecal indicator bacteria in reference to the specifiedmicrobiological water quality standard. For instance, it seems to apply the term 'faecalcoliform bacteria','total coliform bacteria' and 'E.coli'interchangeably without ajustification. From an implementation perspective, this many lead to very subjectiveinterpretations as each of these groups of indicator bacteria differ in their performance
20
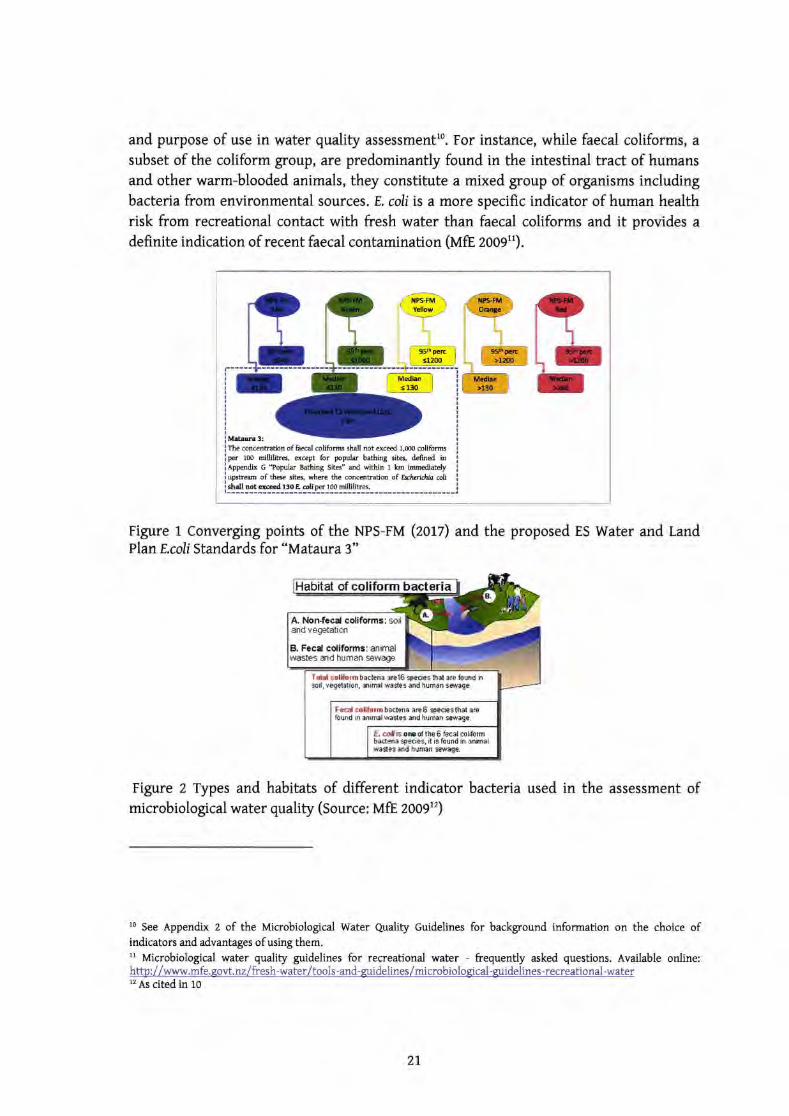
and purpose of use in water quality assessment'o. For instance, while faecal. coliforms, a
subset of the coliform group, are predominantly found in the intestinal tract of humansand other warm-blooded animals, they constitute a mixed group of organisms includingbacteria from environmental sources. E. coli is a more specific indicator of human hedthrisk from recreational contact with fresh water than faecd coliforms and it provides a
definite indication of recent faecalcontamination (ufr 200911).
IP9FMYrllox
31200Fr
MrdLr< l:It
3:concentratbn of &eal colifom shall not weed 1,mO coltfom
millilitr€+ qcept for popular bathinS dt€s, deaned InG ?opula Bathing Sit6" ad within 1 km immdiatelyof th* site., wh6€ the concdtratia of f-yhql&ia dt
Dot do.d t3oE 1oo millilih6.
Figure 1 Converging points of the NPS-FM (zotl) and the proposed ES Water and LandPlanE.coli Standards for "Mataura 3"
Figure 2 Types and habitats of different indicator bacteria used in the assessment ofmicrobiological water quality (Source: trlfr zoog")
10 See Appendix z of the Microbiological water Quality Guidelines for background information on the choice ofindicators and advantages ofusing them.11 Microbiological water quality guidelines for recreational water - frequently asked questions. Available online:http://www.mfe.govt.nz/fresh-water/tools-and-guidelines/microbiological-guidelines-recreational-water1'zAs cited in 10
A l,lon-facd coliforms: $oiland vsggtatim
B. Fccd colifqrna: anmalwasles ard humafi SewagB
TdC colaombacleri. are16 geciss &alsoil, yegalalioil. aiml ffi*ss and human
ars found irsmg€.
Feea c6lforilb.clana arrS sreaiegthal 6Efouod in .nmlvades and hum 6tmgo.
€. co, is om of the 6 &€al colifombadeia 6pscies. ,t i8 foqnd in aninalHsles aod hmn ,affiga
27
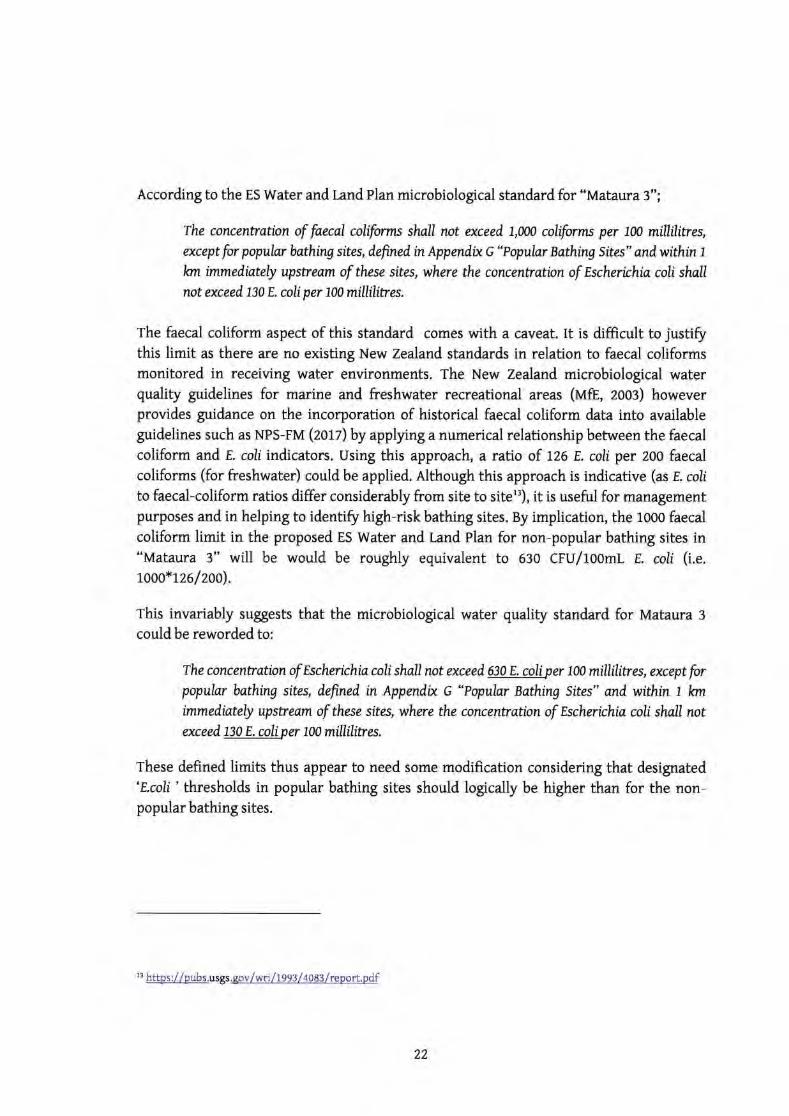
According to the ES Water and tand Plan microbiological standard for "Mataura3";
The concentration of faecal coliforms shall not anceed 1,N0 coliforms per 100 millilitres,exceptfor popular bathing sites, d,efined, in Appendix G "Popular Bathing Situ" andwithin 1
lon immedittely upstream of these sites, where the concentration of Escherichia coli shall
not exceed fiO E. coliper 1N millilitres.
The faecal coliform aspect of this standard comes with a caveat. It is difficult to justi$rthis limit as there are no existing New Zealand standards in relation to faecal coliformsmonitored in receiving water environments. The New Zealand microbiological waterquality guidelines for marine and freshwater recreational areas (tvtft, 2oo3) howeverprovides guidance on the incorporation of historical faecal, coliform data into availableguidelines such as NPS-FM (zotz) by applying a numerical relationship between the faecal
coliform and t. coli indicators. Using this approach, a ratio of tzO E. coli per 200 faecd,coliforms (for freshwater) could be applied. dthough this approach is indicative (as E. coli
to faecal-coliform ratios differ considerably from site to site13), it is useful for managementpurposes and in helping to identi$r high-risk bathing sites. By implication, the 1000 faecd,
coliform limit in the proposed rs water and Land Plan for non-popular bathing sites in"Mataura 3" will be would be roughly equivalent to 630 CFU/100mL E. coli (i.e.
TOOO*',t26/2OO).
this invariably suggests that the microbiological water quality standard for Mataura 3
could be reworded to:
The concentration of Escherichia coli shall not exceed. 630 E. colipu 1N millilitru, except forpopular bathing sites, defined in Appendix G "Popular Bathing Sites" and within I l<rn
immediately upstream of these sites, whue the concenffation of Eschqichia colt shall notqceed,130 E. coli l00millilitru.
These deftned limits thus appear to need some modification considering that designated'E.coli'thresholds in popular bathing sites should logically be higher than for the non-popular bathing sites.
l3 https://pubs.u sgs.gov / wi / tggz / qoas / report.pdf
22
3. Microbial Pathogens in the discharge water
The treatment performance of Alliance Plant WWTP was reviewed in terms of E.coli
concentrations of the discharge water. Additional sampling was conducted specifically forthe zoonotic pathogens (details of relevant zoonotic pathogens are described inAppendices 1-3. In this section, the Alliance Plant WWTP compliance monitoring andzoonotic pathogens dataare reviewed to assess the:
o microbiological qudity of Rlliance Plant raw and treated wastewaters and efficacyofcurrent treatment process, and
o microbial contaminants in Alliance Plant discharged wastewaters that couldpresent a human health risk.
3.1 Compliance Monitoring
Two forms of wastewater are generated by Alliance Factory, human waste and animalrelated wastewater. Human sewage is reticulated separately from meat processing
wastewater and conveyed to the Gore District Council Mataura wastewater treatmentplant from which treated wastewater is discharged via ponds about 1.5 km south ofMataura (rigure e). Treated meat processing wastewater is however, discharged throughpipes into the Mataura River.
23
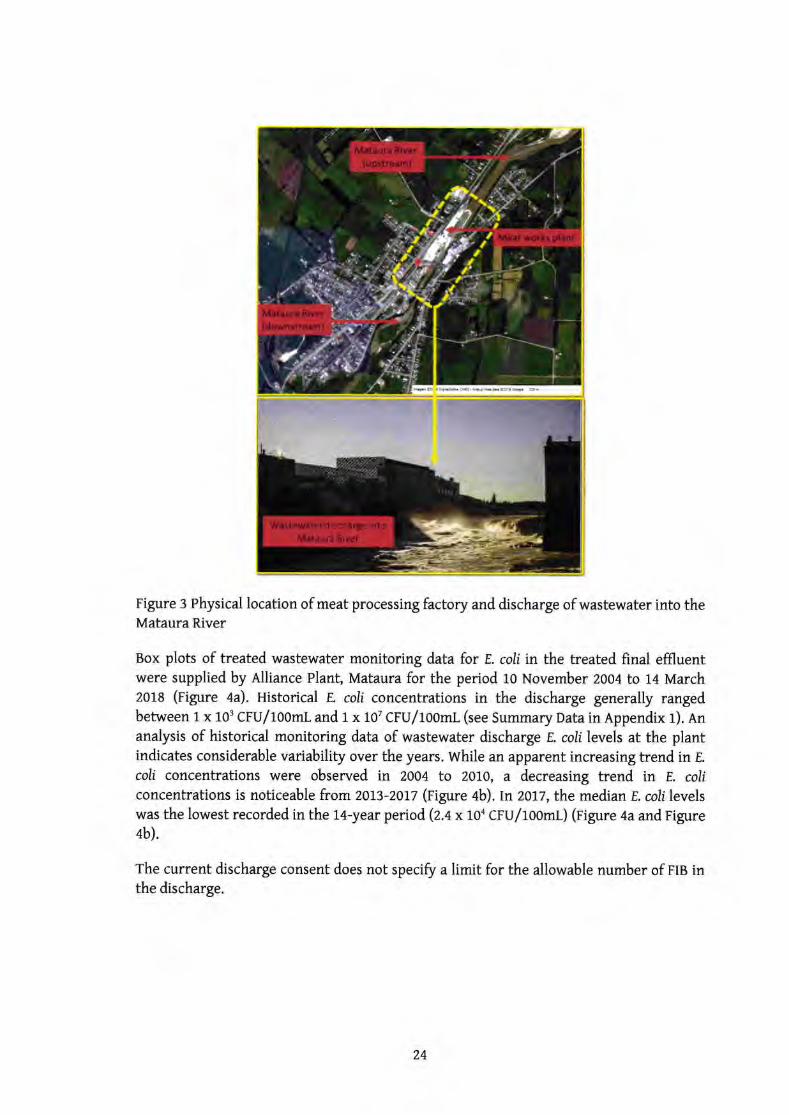
Figure 3 Physical location of meat processing factory and discharge of wastewater into theMataura River
Box plots of treated wastewater monitoring data for E. coli in the treated final effluentwere supplied by Alliance Plant, Mataura for the period 10 November 2OO4 to L4 March2018 (Figure 4a). Historical E. coli concentrations in the discharge generally rangedbetween 1x 10³ CFU/100mL and 1x 10? CFU/1o0mL (see Summary Data in Appendix r). Ananalysis of historical monitoring data of wastewater discharge E. coli levels at the plantindicates considerable variability over the years. while an apparent increasing trend in r.coli concentrations were observed in 2oo4 to 2oto, a decreasing trend in E. coliconcentrations is noticeable from 2013-2017 (Figare ab). ln 2017, the median E. coli levelswas the lowest recorded in the L4-year period (z.t x lo'CFU/100mL) (rigure 4a and Figure4b).
The current discharge consent does not speci$r a limit for the allowable number of rIg inthe discharge.
24
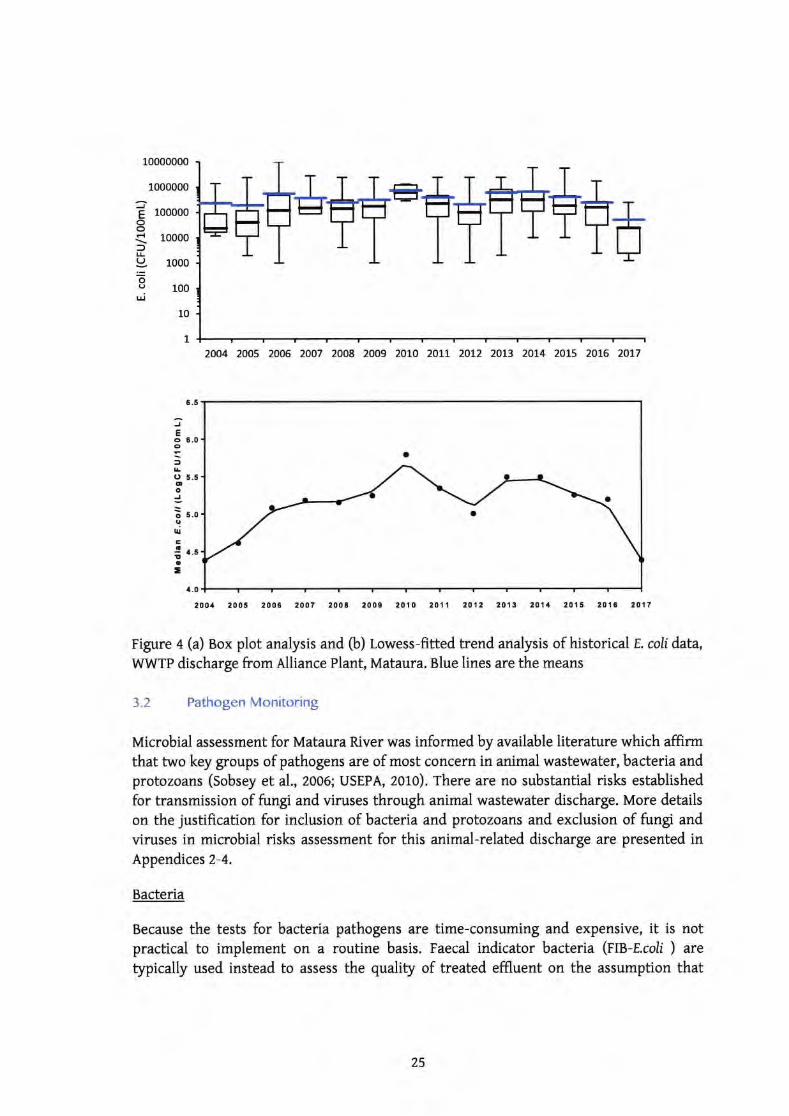
1000000
100000
10000
1000
100
10
JEoot{
:)l!(J
o(J
'ti
Eo 6.0o
,o 5.5aoJ
E s.oIurc! e.sEa.
/t.0
10000000
2004 2005 2006 2007 2008 2009 20LO 20tt 2012 2013 2014 2015 2016 20L7
200a 2005 200t 2007 200t 200e 2010 2011 2012 2013 2011 2015 2016 2017
Figure + (a) Box plot analysis and (b) Lowess-fitted trend analysis of historical E. coli data,wwTP discharge from Alliance Plant, Mataura. Blue lines are the means
3.2 Pathogen Monitoring
Microbial assessment for Mataura River was informed by available literature which affirmthat two key groups of pathogens are of most concern in animal wastewater, bacteria andprotozoans (sobsey et al., 2006; USEPA, 2010). There are no substantial risks establishedfor transmission of fungi and viruses through animal wastewater discharge. More details
on the justification for inclusion of bacteria and protozoans and exclusion of fungi andviruses in microbial risks assessment for this animd-related discharge are presented inAppendices 2-4.
Bacteria
Because the tests for bacteria pathogens are time-consuming and expensive, it is notpractical to implement on a routine basis. Faecal indicator bacteria (rB-r.coli ) are
typically used instead to assess the quality of treated effluent on the assumption that
L
.5
a
ao
25
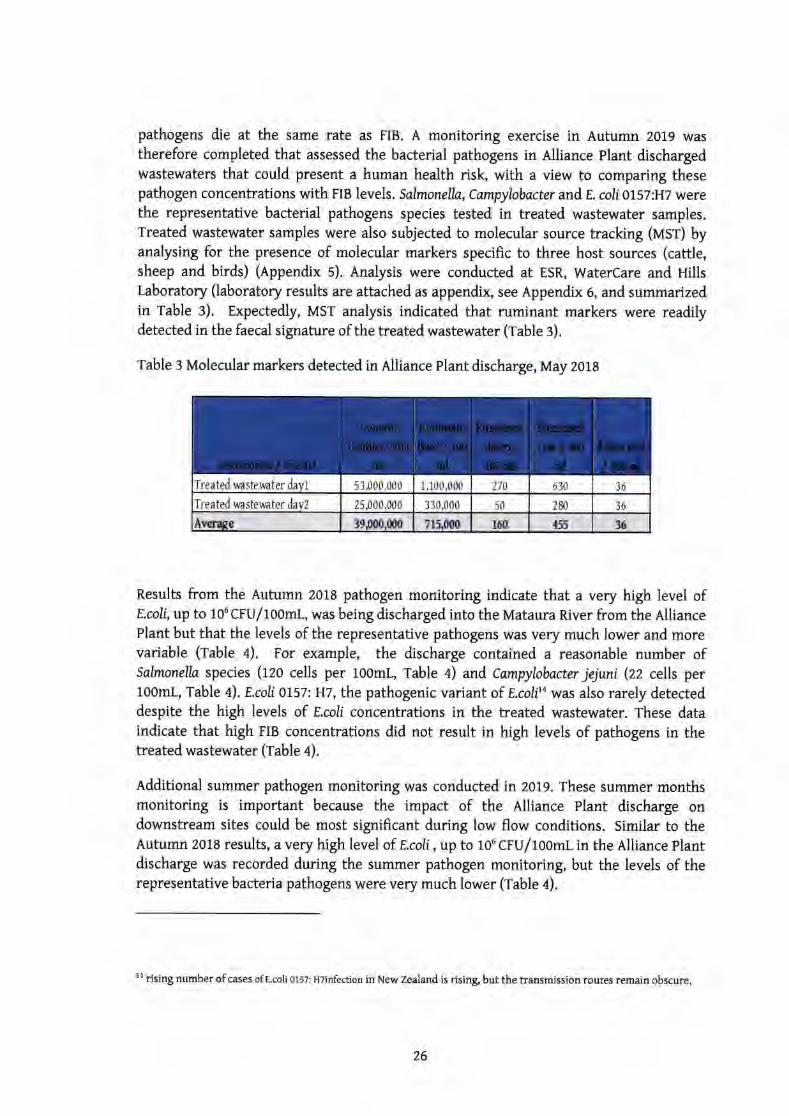
pathogens die at the same rate as FIB. A monitoring exercise in Autumn 2019 wastherefore completed that assessed the bacterial pathogens in Alliance Plant dischargedwastewaters that could present a human hedth risk, with a view to comparing thesepathogen concentrations with FIB levels. Salmonella, Campylobacter andE, coliotsT:H7 werethe representative bacterial pathogens species tested in treated wastewater samples.Treated wastewater samples were also sublected to molecular source trachng (usr) byanalysing for the presence of molecular markers speciftc to three host sources (cattle,sheep and birds) (Appendix s). Analysis were conducted at ESR, WaterCare and HillsLaboratory (laboratory results are attached as appendix, see Appendix 6, andsummarizedin Table 3). Expectedly, MST analysis indicated that ruminant markers were readilydetected in the faecd, signature of the treated wastewater (rable :).
Table 3 Molecular markers detected in Alliance Plant discharge,May 2ot8
Results from the Autumn 2018 pathogen monitoring indicate that a very high level ofE.coli,up to 1o5cFU/100mL, was being discharged into the Mataura River from the AlliancePlant but that the levels of the representative pathogens was very much lower and morevariable (rable a). For example, the discharge contained a reasonable number ofSalmonella species (rzo cells per 100mL, Table a) and Campylobacter jejuni (zz cells per100mL, Table 4).E.coli01^57zH7, the pathogenic variant of E.coli'n was also rarely detecteddespite the high levels of E.coli concentrations in the treated wastewater. These dataindicate that high FIB concentrations did not result in high levels of pathogens in thetreated wastewater (fable +).
ldditional summer pathogen monitoring was conducted in 2019. These summer monthsmonitoring is important because the impact of the Alliance Plant discharge ondownstream sites could be most significant during low flow conditions. Similar to theAutumn 2018 results, a very high level of E.coli, up to 106 cFU/1o0mL in the Alliance plantdischarge was recorded during the summer pathogen monitoring, but the levels of therepresentative bacteria pathogens were very much lower (fable a).
1a rising number of cases of E.coli 0157: HTinfection in New Zealand is rising, but the transmission routes remain obscure.
Ireated wastewater &vt 53,000,000 1,100,000 270 630 36
Ireated wa stewa ter dayl 25000,000 330,000 50 zffi 36
Avemce 3rm.m0 atlloo lCI ffi %
26
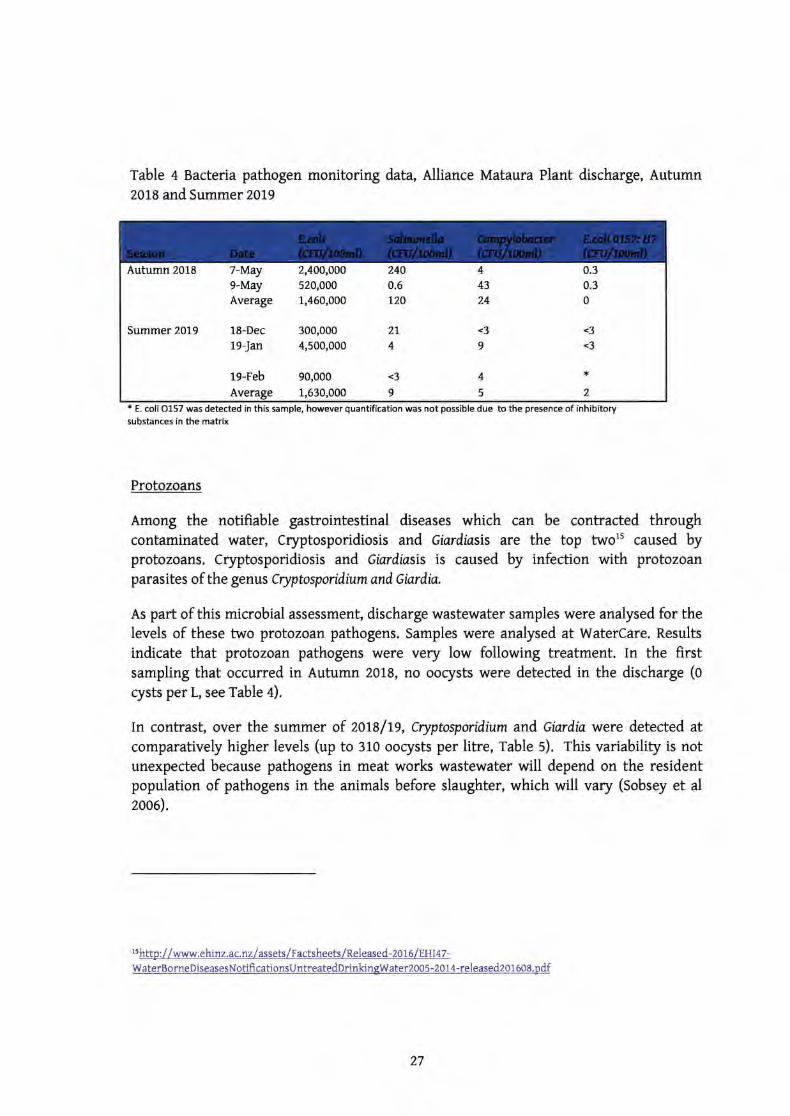
Table 4 Bacteria pathogen monitoring data, Alliance Mataura Plant discharge, Autumn2018 and Summer 2019
r E. coli 0157 was detected in this samplq however quantification was not possible due to the presence of inhibitorysubstances in the matrix
Protozoans
Among the notiftable gastrointestinal diseases which can be contracted throughcontaminated water, Cryptosporidiosis and Giardiasis are the top two15 caused byprotozoans. Cryptosporidiosis and eisrdiasis is caused by infection with protozoanparasites of the genus Cryptosporidium and Giardin
As part of this microbial assessment, discharge wastewater samples were analysed for thelevels of these two protozoan pathogens. Samples were analysed at WaterCare. Results
indicate that protozoan pathogens were very low following treatment. In the firstsampling that occurred in Autumn 2018, no oocysts were detected in the discharge (o
rysts per L, see Table a).
In contrast, over the summer of zorc/O, Cryptosporidium and Giardif, were detected atcomparatively higher levels (up to 310 oocysts per litre, rable s). rhis variability is notunexpected because pathogens in meat works wastewater will depend on the residentpopulation of pathogens in the animals before slaughter, which will vary (Sobsey et al
2006).
15http://www.ehinz.ac.nzlassets/Factsheets/Released-2016/EHI47-
waterBorneDiseasesNotificationsuntreatedDrinkingwater2oo5-2014-release&o1608.pdf
240
0.6
120
2L
4
<3
9
443
24
.39
0.3
0.3
0
.3<3
Autumn 2018
Summer 2019
4
5
*
2
2,4oo,ooo520,000
1,460,000
300,0004,500,000
90,000
1,630,000
7-May9-MayAverage
18-Dec19-Ian
ts-rebAverage
27
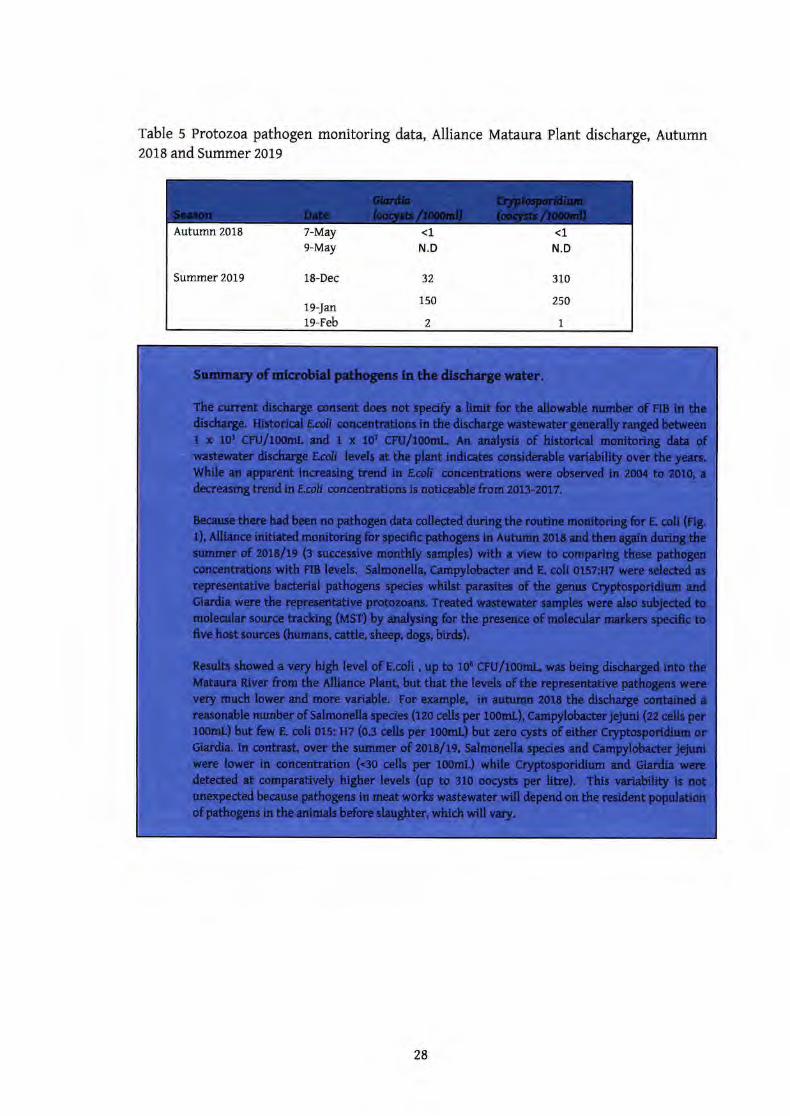
Table 5 Protozoa pathogen monitoring data, Alliance Mataura Plant discharge, Autumn2Ol8 andSummer 2019
<1
N.D
32
150
?,
310
250
1
Autumn 2018
Summer 2019 18-Dec
<1
N.D
7 May9 May
19-Jan
19 Feb
Summary of microbial pathogens in the discharge water.
The current discharge consent does not specifo a limit for the allowable number of FIB in thedischarge. Historical E colf concentrations in the discharge wastewater generally ranged between1 x 103 CFU/L0omL and 1 x 10? CFU/100mL. An analysis of historical monitoring data ofwastewater discharge Ecoli levels at the plant indicates considerable variability over the years.While an apparent increasing trend in E.coli concentrations were observedin2oo4 to 2010, a
decreasing trend in E coli concentrations is noticeable from zOt3-ZOlZ.
Because there had been no pathogen data collected during the routine monitoring for E. coli (Fig.
1), Alliance initiated monitoring for specific pathogens in Autumn 2018 and then again during thesnmmer of zott/ts (3 successive monthly samples) with a view to comparing these pathogenconcentrations with FIB levels. Salmonella, Campylobacter and E. coli ol57i[7 were selected as
representative bacterial pathogens species whilst parasites of the genus Cryptosporidium andGiardia were the representative protozoans. Treated wastewater samples were also subjected tomolecular source tracking (usr) by analysing for the presence of molecular markers specific tofive host sources (humans, cattle, sheep, dogs, birds).
Results showed a very high level of E.coli , up to 106 cFU/10omL, was being discharged into theMataura River from the Alliance Plant, but that the levels of the representative pathogens werevery much lower and more variable. For example, in autumn 2018 the discharge contained a
reasonable number of Salmonella species (rzo cells per 100mL), Campylobacterjejuni (zz cells perL00ml) but few E. coli 015: H7 (03 cells per 100mL) but zero cysts of either Cryptosporidium orGiardia. In contrast, over the suurmer of zo18fts, Salmonella species and campylobacter jejuniwere lower in concentration (.30 cells per 100mL) while Cryptosporidium and Giardia weredetected at comparatively higher levels (up to 310 oocysts per litre). This variability is notunexpected because pathogens in meat works wastewater will depend on the resident populationof pathogens in the animals before slaughter, which wlll vary.
28
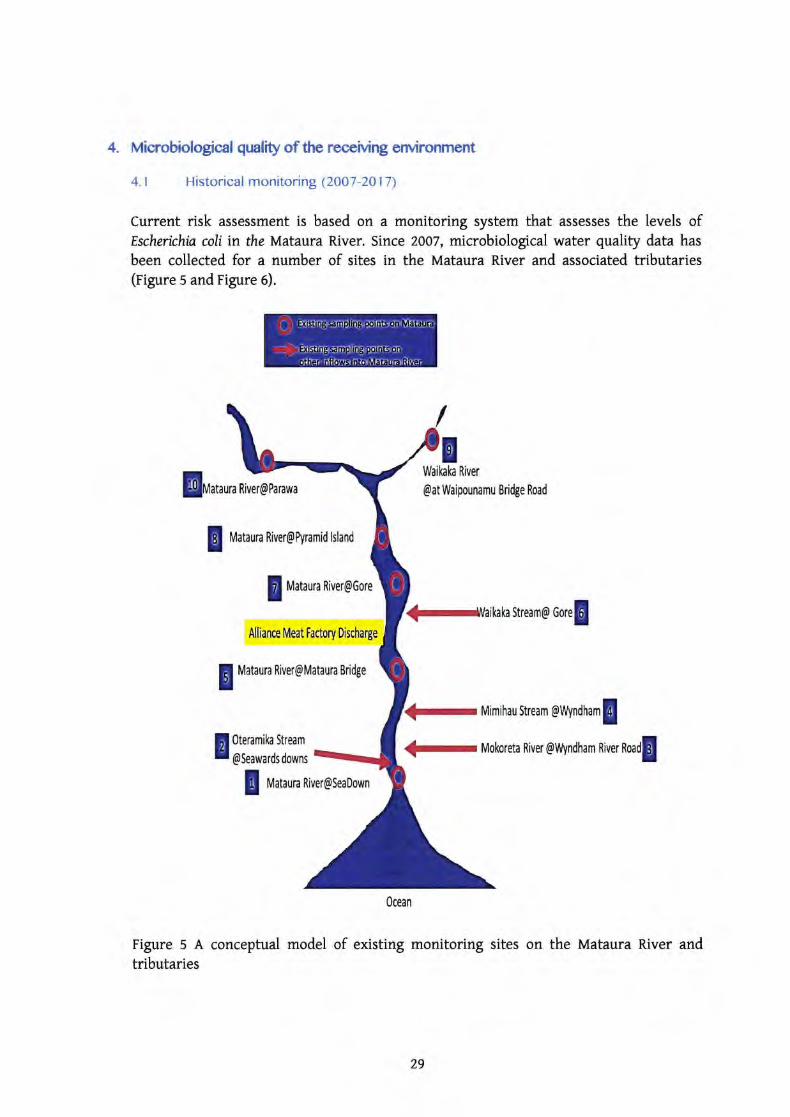
4. Microbiological qural'rty of the receMng errvironment
4.1 Historical monitoring (2007-2017)
Current risk assessment is based on a monitoring system that assesses the levels ofEscherichia coli in the Matawa River. Since 2007, microbiological water quality data has
been collected for a number of sites in the Mataura River and associated tributaries(rigure 5 and Figure 6).
!rn,,o River@Parawa
Mataura Rirler@Pyramid lsland
Mataura friver@Gore
Alliance Meat tactory Discharge
Mataun River@Mataura Bridge
Waikah River
@at Waipounamu Bridge Road
kaStream@ corel
Mimihau Stream @u'fynafram !Mokoreta River @llllndham Rivu Road!
0teramika Stream
@Seawardsdowns
Mataun River@SeaDown
Ocean
Figure 5 A conceptual model of existing monitoring sites on the Mataura River andtributaries
:r(rrr,'..ilr,l,'i!,ir ..1l,iL .lr ,r,LirI r
i iL'rrrr! .-lr' tlr,i : .;.r, r rrr
.rl::J rrt;ir,',,i- r, r. ,rrLlr.!ri ir',i-
29
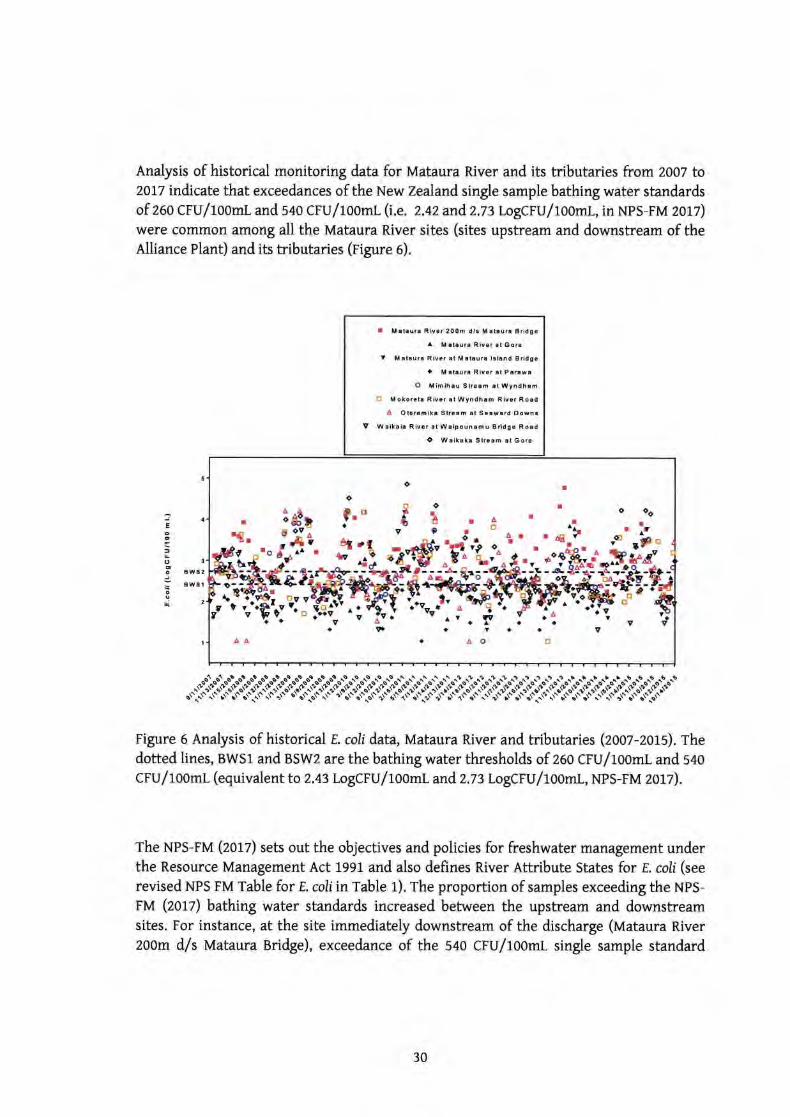
Analysis of historical monitoring data for Mataura River and its tributaries from 2Oo7 to2077 indicate that exceedances of the New Zealand single sample bathing water standardsof z0o cFU/1oomL and sao cFu/100mt (i.e. 2.42 andz.tl LogcFU/1o0mL, in Nps-FM 2017)
were common among dl the Mataura River sites (sites upstream and downstream of theelliance Plant) and its tributaries (rigure o).
Figure 6 Analysis of historical t. coli data, Mataura River and tributaries (zoot-zo1s). rhedotted lines, BWS1 and trSwz are the bathing water thresholds of zoo cFu/loomt- and saoCFU/1oomL (equivalent to2.43 LogCFU/1O0mL and 2l3LogCFU/toomL, NPS-FM zOtz).
The NPS-FM (zotl) sets out the objectives and policies for freshwater management underthe Resource Management Act 1991, and, also defines River Attribute States for E coli (see
revised NPs FM Table for r. coliin Table r). rhe proportion of samples exceeding the NPS-FM (2017) bathing water standards increased between the upstream and downstreamsites. For instance, at the site immediately downstream of the discharge (Mataura River2oom d/s Mataura Bridge), exceedance of the 540 CFU/100mL single sample standard
JE
,IoocJ
ctlu
tw32lwa t
I tatrurr Rlv.r 200m dr! M.l.ur. Brld!a
V Mlt.uru Rivar.t L.laura laland Bridgr
a M ataura Rlvaa at P.r.w.
O Mokorctr Riv.. rt Wyndh.m Riv.r Road
A Ol.r.mika Staaam at S..w.rd Oown.
V W.ik.i. River tt Waipoun.mu B.ldg. Ro.d
O W.ik.k! Str..m al Go.G
o
o
fa
ooItf
tryt a
vtr t9
Av
oAA
a
oo
vIq
r0
t .ovvvvv aa
aa
Avt v
AV
I
^|agr&
o
1A.t '4It.
I
t
lo
A
Ia
Ao
I
Aa€
Itl oo
trv
aaY
o
Ft
Ira
A
a
30
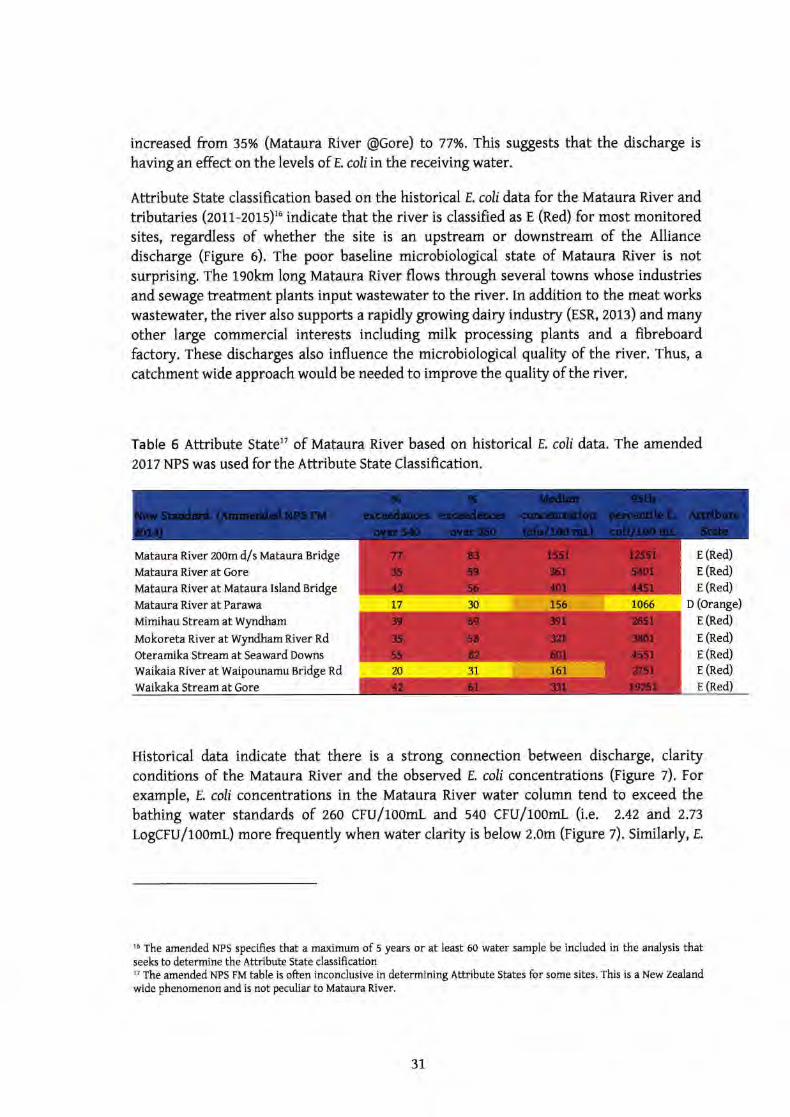
increased from 35% (Mataura River @Gore) to 77%. This suggests that the discharge is
having an effect on the levels of. E. coliin the receiving water.
Attribute State classification based on the historicd E. coli data for the Mataura River and
tributaries (zorr-zors)16 indicate that the river is classified as E (Red) for most monitoredsites, regardless of whether the site is an upstream or downstream of the Alliance
discharge (rigure 0). rhe poor baseline microbiological state of Mataura River is notsurprising. The 190km long Mataura River flows through several towns whose industries
and sewage treatment plants input wastewater to the river. In addition to the meat workswastewater, the river also supports a rapidly growing dairy industry (ESR, 2013) and many
other large commercial interests including milk processing plants and a fibreboardfactory. These discharges also influence t'he microbiological quality of the river. Thus, a
catchment wide approach would be needed to improve the quality of the river.
Table 6 Attribute StatelT of Mataura River based on historicalr,. coli data. The amended2017 NPS was used for the Attribute State Classification.
Mataura River 200m d/s Mataura Bridge
Mataura River at Gore
Mataura River at Mataura Island Bridge
Mataura River at Parawa
Mimihau Stream at Wyrdham
Mokoreta River at Wyrdham River Rd
Oteramika Stream at Seaward Downs
Waikaia River at Waipounamu Bridge Rd
Waikaka Stream at Gore
r (Red)
E (Red)
E (Red)
o (orange)
E (Red)
E (Red)
r (Red)
E (Red)
Historical data indicate that there is a strong connection between discharge, clarityconditions of the Mataura River and the observed E. coli concentrations (rigure 7). For
example, r,. coli concentrations in the Mataura River water column tend to exceed thebathing water standards of zoo cFu/1oomt and sao cFu/100mt (i.e. 2.42 and 2l3LogcFu/looml) more frequently when water clarity is below z.om (Figure 7). Similarly,E
16 The amended NPS speciffes that a maximum of 5 years or at least 60 water sample be included in the analysis thatseeks to determine the Attribute State classification17 The amended NPS FM table is often inconclusive in determining Attribute States for some sites. This is a New Zealandwide phenomenon and is not peculiar to Mataura River,
31
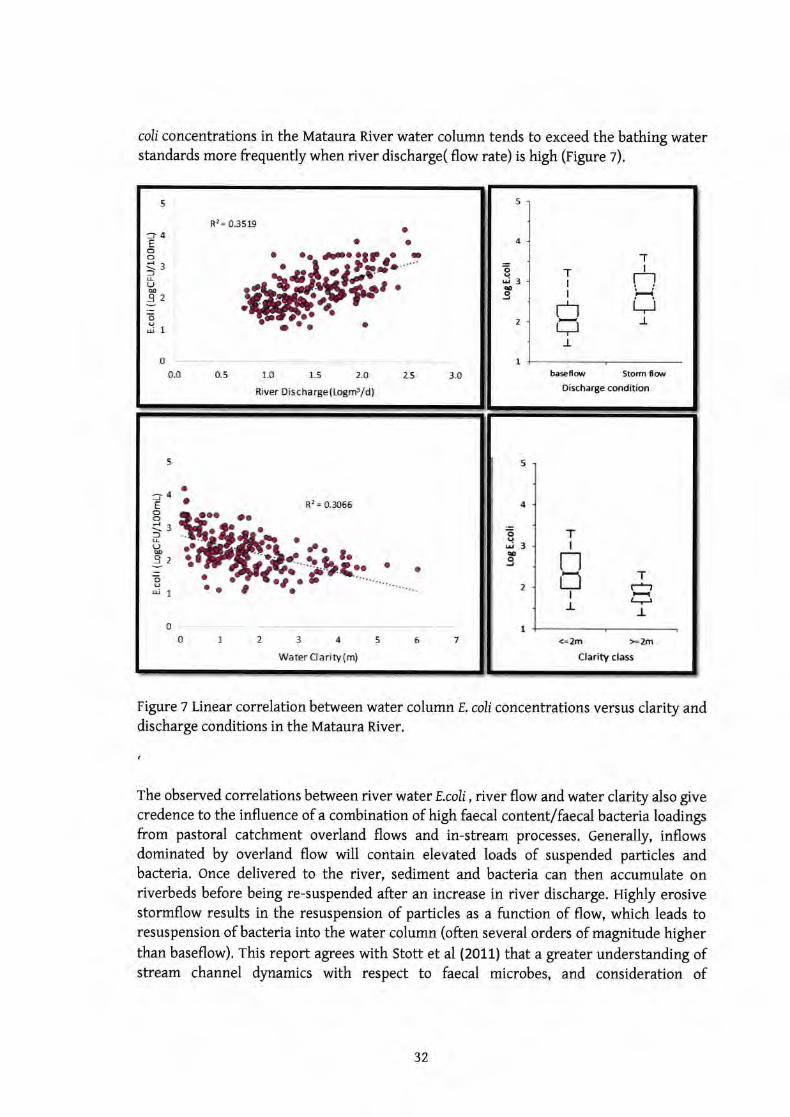
R2= 0.3511)
EoofuuEOIoqU
River Discharye (logrrP/d)
o
o0.0 o5 1.0 1.5 2.O LS 3.0
5
4
3
I
alP.
aa
-T
I
I
ogaa
Storm rol,Discharge condition
5
4
T
3
2 -tJ-
1
baseflor
ao R2 = O3056
[*rt:
J
Eoofr(JEOIo.gui
WaterOarity{m}
5
I
1
o0 2 3 1 5 6 7
3
2 oa
TI
oouieo.9
Clarity class
5
4
3
2
I1
<'2m >-2m
T(*,-tJ.
colf concentrations in the Mataura River water column tends to exceed the bathing waterstandards more frequently when river discharge( flow rate) is high (rigure z).
Figure 7 Linear correlation between water column E. coli concentrations versus clarity anddischarge conditions in the Mataura River.
The observed correlations between river water E.coli, river flow and water clarity also givecredence to the influence of a combination of high faecd, contentffaecal bacteria loadingsfrom pastoral catchment overland flows and in-stream processes. Generally, inflowsdominated by overland flow will contain elevated loads of suspended particles andbacteria. once delivered to the river, sediment and bacteria can then accumulate onriverbeds before being re-suspended after an increase in river discharge. Highly erosivestormflow results in the resuspension of particles as a function of flow, which leads toresuspension of bacteria into the water column (often several orders of magnitude higherthan baseflow). rhis report agrees with Stott et al (2011) that a greater understanding ofstream channel dynamics with respect to faecal microbes, and consideration of
32
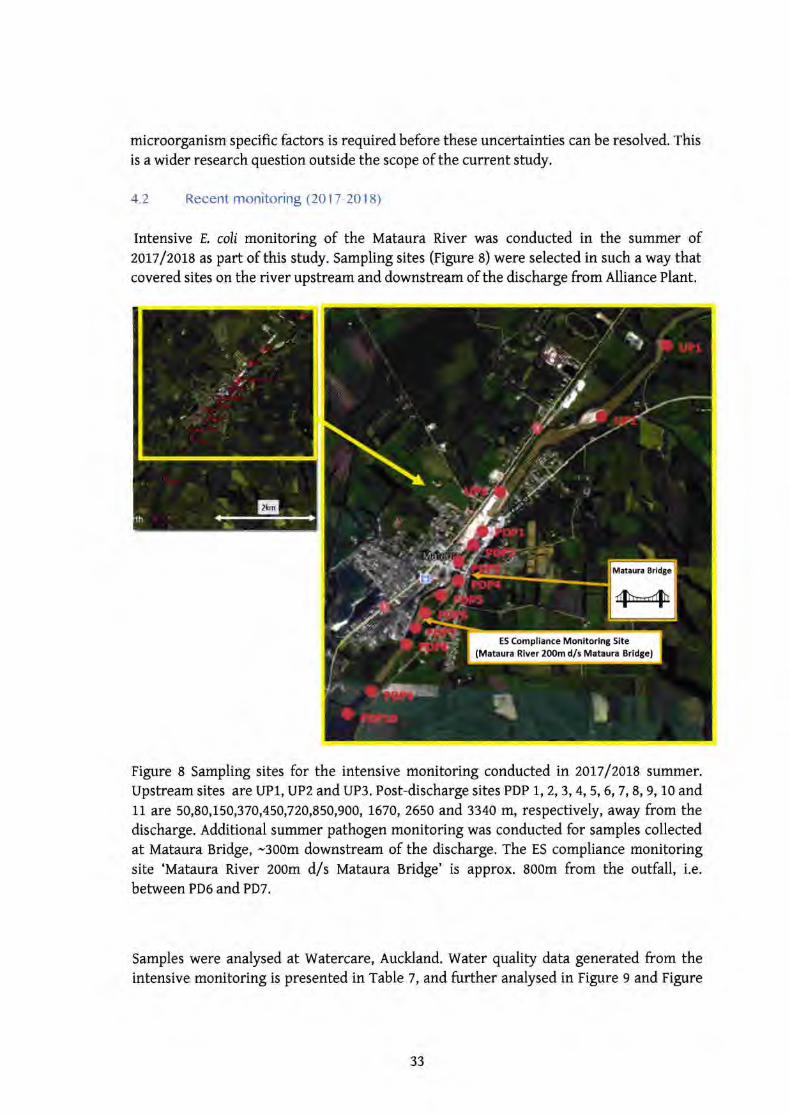
microorganism specific factors is required before these uncertainties can be resolved. thisis a wider research question outside the scope of the current study.
4.2 Recent monitoring (2017-2018)
Intensive E. coli monitoring of the Mataura River was conducted in the summer of2017/2018 as part of this study. Sampling sites (Figure 8) were selected in such away thatcovered sites on the river upstream and downstream of the discharge from Alliance Plant.
Figure 8 Sampling sites for the intensive monitoring conducted in 2017/2018 summer.Upstream sites are UP1, UP2 and Upg. Post-discharge sites PDP 1, 2, 3, 4, 5, 6,7 ,8, 9, 10 and11 are 50,80,150,370,450,720,850,900, 1670, 2650 and llAO m, respectively, away from thedischarge. Additional summer pathogen monitoring was conducted for samples collectedat Mataura Bridge, -300m downstream of the discharge. The ES compliance monitoringsite 'Mataura River 200m d/s Mataura Bridge' is approx. 800m from the outfall, i.e.
between PD6 and PD7.
Samples were analysed at watercare, Auckland. Water quality data generated from theintensive monitoring is presented in Table 7, and further analysed in Figure 9 and Figure
Bddgc
MES Compllance Monitoring Slte
{Mataura Rlver 2fi)m d/s Mataura Brldgel
.8,
33
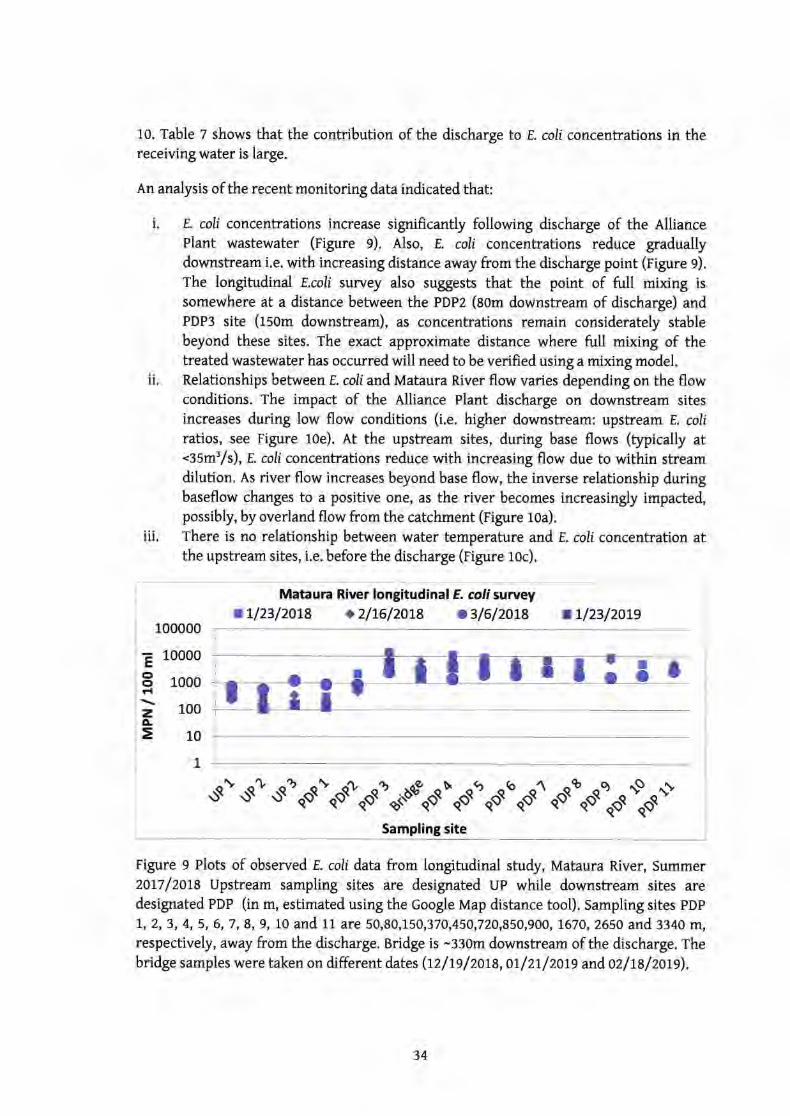
10. Table 7 shows that the contribution of the discharge to E coli concentrations in thereceiving water is large.
An analysis of the recent monitoring data indicated that:
i. E. coli concentrations increase significantly following discharge of the AlliancePlant wastewater (figure 9). Also, E. coli concentrations reduce graduallydownstream i.e. with increasing distance away from the discharge point (Figure 9).
The longitudinal r.colf survey also suggests that the point of full mixing is
somewhere at a distance between the PDP2 (aom downstream of discharge) andPDP3 site (rsom downstream), as concentrations remain considerately stablebeyond these sites. rhe exact approximate distance where full mixing of thetreated wastewater has occurred will need to be verified using a mixing model.
ii. Relationships between E. coli and Mataura River flow varies depending on the flowconditions. The impact of the Alliance Plant discharge on downstream sitesincreases during low flow conditions (i.e. higher downstream: upstream E. coliratios, see Figure 1oe). At the upstream sites, during base flows (typically at.35m3/s), E. coli concentrations reduce with increasing flow due to within streamdilution. As river flow increases beyond base flow, the inverse relationship duringbaseflow changes to a positive one, as the river becomes increasingly impacted,possibly, by overland flow from the catchment (Figure 10a).
iii. There is no relationship between water temperafure and E. coli concentration atthe upstream sites, i.e. before the discharge (Figure 10c).
Mataura River longitudina! E. coli survey.t123120L8 .2lL6l2OL8 .316/2OL8 .Ll23l20Le
100000
10000
1000
100
10
1
Sampling site
Figure 9 Plots of observed E. coli data from longitudinal study, Mataura River, Summer2017/2018 Upstream sampling sites are designated UP while downstream sites aredesignated PDP (in m, estimated using the Google Map distance tool). Sampling sites PDP
l, 2, 3, 4, 5, 6, 7, 8, 9,10 and 11 are 50,80,150,370,450,720,850,900, 16Z0, 2650 and 3340 m,respectively, away from the discharge. Bridge is -330m downstream of the discharge. thebridge samples were taken on different dates (tz/tg/zota,07/27/2019 ando2/tl/20t9).
aEG'G'c{
z4=
..)a\..Sasla.elloo*qoaae..ds"qaqoosee.ol6t^.S".e]o.loo*
34
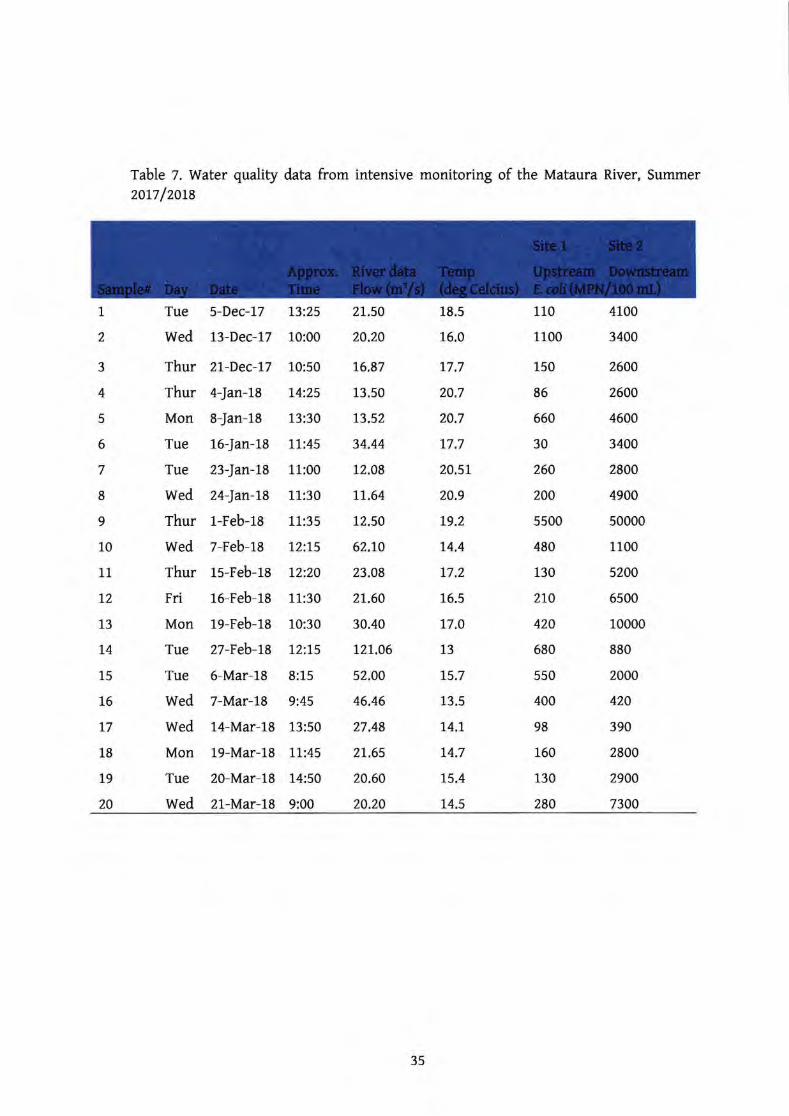
Table 7. Water qudity data from intensive monitoring of the Mataura River, Summer2OL7/2018
1
2
3
4
5
6
7
8
9
10
11
t2
13
14
15
15
L7
18
19
20
Tue
Wed
Thur
Thur
Mon
Tue
Tue
wed
Thur
Wed
I nur
Fri
Mon
Tue
Tue
Wed
Wed
Mon
Tue
Wed
5-Dec-17
13-Dec-\7
2l-Dec-17
4-Jan-78
8-Jan-18
16-Jan-18
23-Jan-L$
24-Jan-LB
1-Feb-18
7-Feb-18
15-Feb-18
16-Feb-18
1g-Feb-18
27-Feb-rg
6-Mar-18
7-Mar-18
14-Mar-18
19-Mar-18
20-Mar-18
21-Mar-18
L3:25
10:00
10:50
l4:25
13:30
11:45
11:00
11:30
11:35
12:15
72:20
11:30
10:30
12:L5
8:15
9:45
13:50
11:45
14:50
9:00
2L.50
20.20
1,6.87
13.50
13.52
34.44
t2.08
t7.64
t2.50
62.I0
23.08
2t.60
30.40
t27.06
52.00
46.46
27.48
2t.6s
20.60
20.20
18.s
16.0
t7.7
20.7
20.7
17.7
20.51
20.9
79.2
L4.4
t7.2
16.5
17.o
13
L5.7
13.5
t4.L
t4.7
75.4
74.5
110
1100
150
86
560
30
260
200
5500
480
130
2L0
420
680
550
400
98
160
130
280
4100
3400
2600
2600
4500
3400
2800
4900
50000
1100
5200
6s00
10000
880
2000
420
390
2800
2900
7300
35
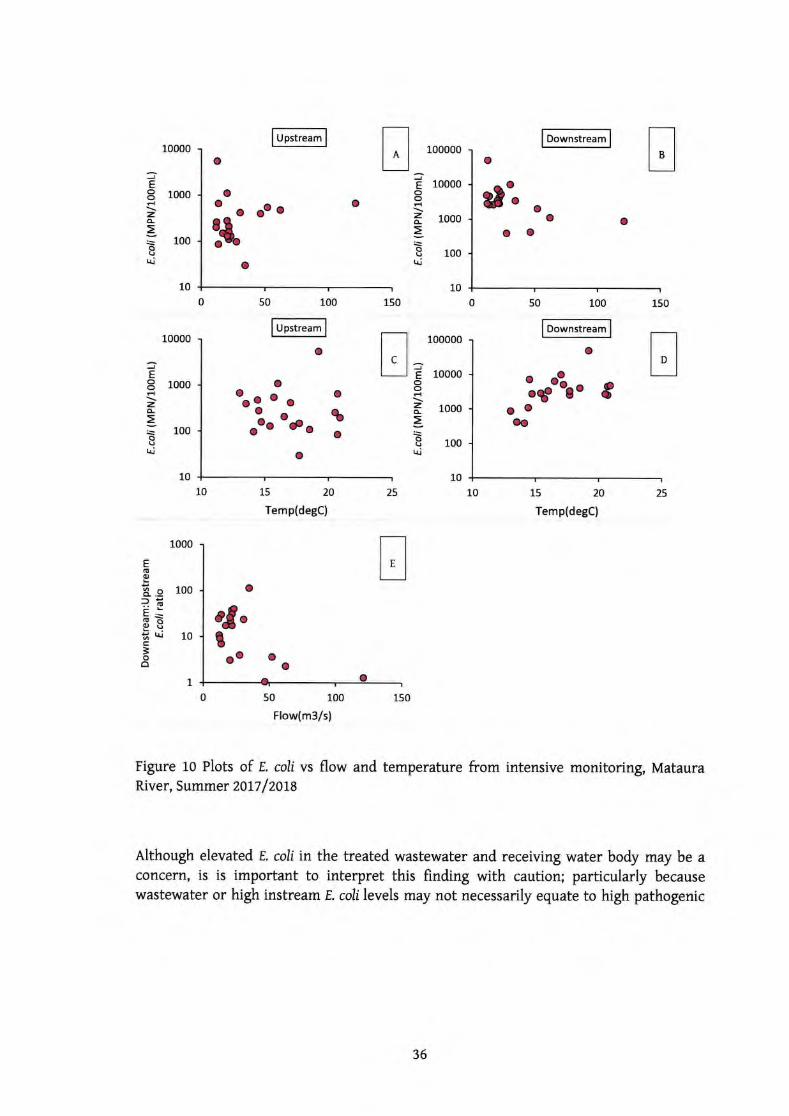
a
0
100000
10000
1000
100
10
100000
10000
1000
100
10
J
Eoozo-
=oIJ
tr,i
JEoo
H
zCL
oUt{j
a
a
0
10000
1000
100
10
10000
1000
100
10
J
Eood
zCL
=og
tr,i
JEooH
zCL
oUrri
o
oo
o
Upstream
ooa
50 100
Upstream
a t st3a
o
A
150
150
I, ao
aa
Downstream
a
Downstream
a
a
100 150
a
:ra
ao
50
oooa aat' o.
15 20
Temp(degC)
ao a
o
to
a(ra
o
a aa
15 20
Temp(degC)
D
25102510
a
o
Eog
8..ei6cLo=oxL:;1!c
'o6
1000
100
10
ot.I
I0 50 100
Flow(m3ls)
Figure 10 Plots of r,. coli vs flow and temperature from intensive monitoring, MatauraRiver, Summer 2ot7 / 2018
Although elevated E. coli in the treated wastewater and receiving water body may be aconcem, is is important to interpret this finding with caution; particularly becausewastewater or high instream E. coli levels may not necessarily equate to high pathogenic
B
c
E
36
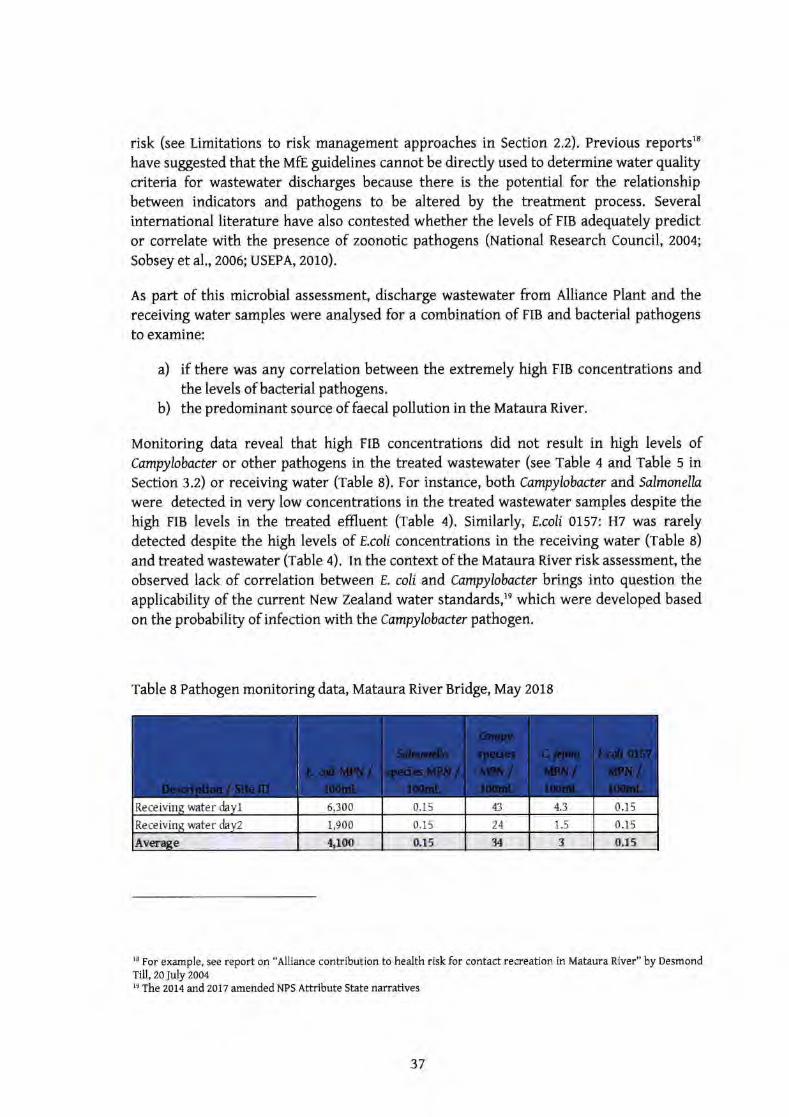
risk (see Limitations to risk management approaches in Section 2.2). Previous reports"have suggested that the MfE guidelines cannot be directly used to determine water quditycriteria for wastewater discharges because there is the potential for the relationshipbetween indicators and pathogens to be altered by the treatment process. Several
international literature have also contested whether the levels of rIB adequately predictor correlate with the presence of zoonotic pathogens (NaUonal Research Council, 2oo4;
sobsey et al., z006; USEPA, 2o1o).
As part of this microbial assessment, discharge wastewater from elliance Plant and thereceiving water samples were analysed for a combination of FIB and bacterial pathogens
to examine:
a) if there was any correlation between the extremely high FIB concentrations and
the levels ofbacterial pathogens.
b) the predominant source of faecal, pollution in the Mataura River.
Monitoring data reveal that high FIB concentrations did not result in high levels ofCampylobacter or other pathogens in the treated wastewater (see rable 4 and Table 5 inSection 3.2) or receiving water (rable a). For instance, both Campylobaaer and salmonella
were detected in very low concentrations in the treated wastewater samples despite thehigh FIB levels in the treated effluent (rable 4). Similarly, E.coli oL57: H7 was rarelydetected despite the high levels of E.coli concentrations in the receiving water (rable g)
and treated wastewater (rable a). tn the context of the Mataura River risk assessment, theobserved lack of correlation between E. coli and campylobactq brings into question theapplicability of the current New Zealand water standards,l' which were developed based
on the probability of infection with the Campylobacter pathogen.
Table 8 Pathogen monitoring data, Mataura River Bridge, May 2018
1E For example, see report on "Alliance contribution to health risk for contact recreation in Mataura River" by Desmondrill,2oJuly 2oo4le The 2014 and2olT anended NPS Attribute state narratives
0.15 43 4.3 0.15Receivins water &yl 6,300
1,900 0.15 24 1.5 0.15Receiving water day2
Avcrace +100 o15 v 3 o"15
37
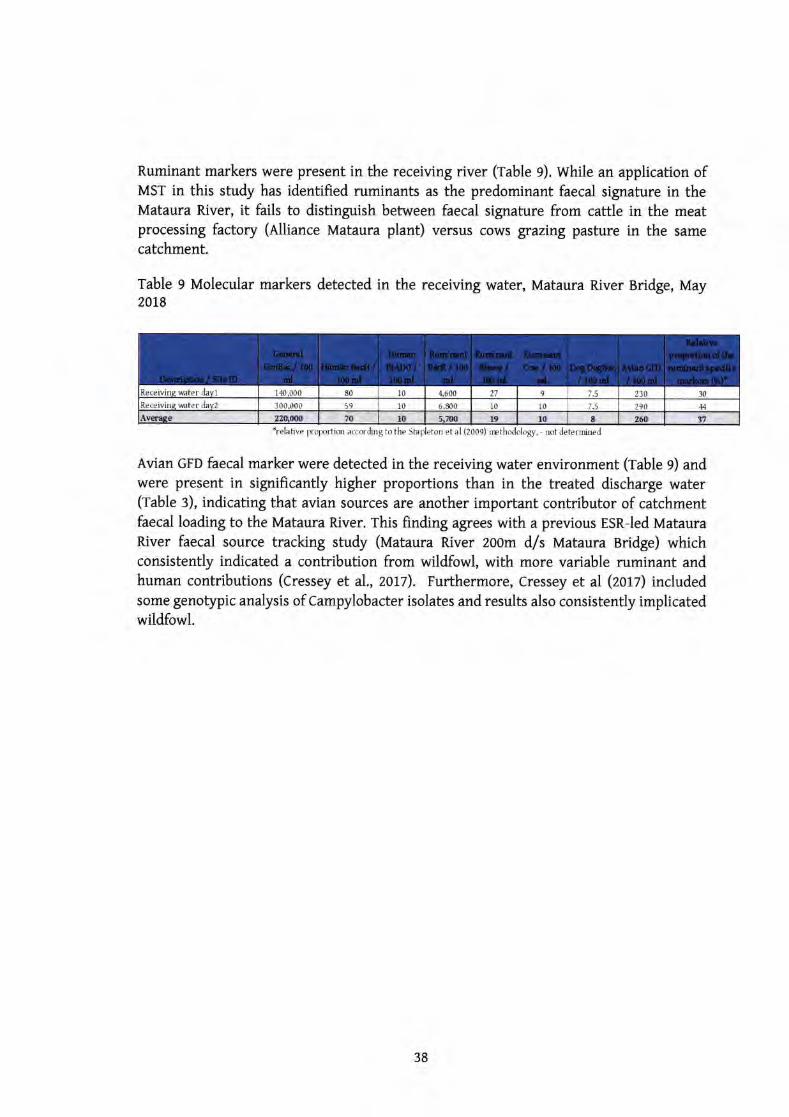
Ruminant markers were present in the receiving river (rable g). while an application ofMST in this study has identified ruminants as the predominant faecal signature in theMataura River, it fails to distinguish between faecal signature from cattle in the meatprocessing factory (Alliance Mataura plant) versus cows grazing pasture in the samecatchment.
Table 9 Molecular markers detected in the receMng water, Mataura River Bridge, May2018
*relative prolnrtim according to the Statleton et al (200e) mthodology, - not determined
Avian GFD faecal marker were detected in the receiving water environment (rable g) andwere present in signiftcantly higher proportions than in the treated discharge water(rable 3), indicating that avian sources are another important contributor of catchmentfaecd,loading to the Mataura River. This finding agrees with a previous ESR-led MatauraRiver faecal source tracking study (Mataura fuver 200m d/s Mataura Bridge) whichconsistently indicated a contribution from wildfowl, with more variable ruminant andhuman contributions (cressey et al., 2oL7). Furthermore, Cressey et al (zott) includedsome genotSrpic analysis of Campylobacter isolates and results also consistently implicatedwildfowl.
Receivins Mter devl l,m.aX)o 80 10 4.600 27 9 7.t ?_10 10
Receivins mter drvz '100 000 qg 10 6.800 10 10 7.5 290 44
Aw. *bfi ID t-as t9 lo t tu fi
38
o\co
tr(t(!!(6!botr!(!UEi#cEr
(urtr:tlortr:0)i,tgjdl3.iboa
O)r
(Jrq)rli,o!iirtrl(l.)Jtit31Q
)(tl
t
o.lLI(u(31ol-vts';
_J*'i(u!e:orLru)'E
rdl>
i<
i
P
>.o
o (B
rrL'd+Jfr
3"Es - t
-1 [gE
E.iru'*gL*.3cEbo x -q in .:::: E
.E.E
3H
dr-sbY
*9i-B
!+€E
sE
9 ES
;ilgE
;Ha;E
gs;q=
, l,
(u E
5; E H
5€E
.t*'d6EE
EE
T:E
lSr.E
Es
E E
E E
qE'-
o)-ii g
o.=fsE
x*cf$rE
Ee
tr=3=
(no.)0.) =
6
-trrgE
s # *'Fo)
g 0)
o ()-i9
!C-E
c(uJJor!6€>
j6qG-A
.F!-9
C o'-
H lt
s,-;i
rr o
H
v 2
TE
E E
E 9
-(o--g,--
E+
iE ai
EE
EE
;Hd rtr P
..Y 'O
g.
.d _>:
.99.E
i H
7 Sos
H U
;Ee;-sEt
tr H-c
-}.oH.9
o "
l.'<-.oaO
F-P
Lo(tr'igB
38x-
@bo
>tro
90€ E f
.i,:E3.
$s>g
-oJ-..j
E E
# 56 .E
0., .{
U=
Bu'
Eg:E
YobE
3
:rt H
.ra,
q s€E
E:E
EE
Ii .gp'B 3
E.
Ets.d
i ! r s.i.E
#.:tEE
5 il#Tte€*if; E
]E 7
AgB
E
86E
s 3 t
-<-Q
o.rI
E'E
sts!>
/HL
e I r8€
EE
EH
:Ld
8oi E
H
trt6-io5
=E
og
s<
hi bo';
9q)ji
.! c
q)
:= E
E
HO
€ B
E8o
'r5 ! ^3
9qhuS
-h .9t
tiE
E B
S
E"H
>q).!
yro sH
q3o:.S
Eo9:6H
;:
EE
iE:
$a_
Bog H
.9
EE
EE
I EE
EE
E:H
S
H.
*uE=
€ n $sE
E''c
X€
g',EE
= -3€
HreiiE
+-B
ITB
g$xs€H
9E6.=
ut3E
1g?EE
IEgb;o=
o=E
'EsE
Ea.ci:E
;sr:9:-d.!.-tsI 3 U
ti X !3
3,Iri3.=
dUtF
=
.j :j
,j
!(!-g0)!(!()E6N
I
F.
doNb0Lo#trog!(uu0)&
r;;EE
"EP
E;€t+
* uEi
€Es€iE
t:g E
E; $:E
:E
;$5gEE
EE
;EE
fEE
EE
€*E;E
qgE
ET
:E3E
EE
B8flg;r€
9p"gt;tr8t5H
a 6
9i "
IieEE
ifBE
! E=
r€ tcE
#; E E
y"F a
EE
EE
IiEt
EH
;gg:EE
Hs:E
8t t's-9qc-.E
-t.ser 5 E
=E
.Hb
Or*-O
Xkivi
jpiSE
EE
E;
g.E*aE
s,:89
EE
E;E
EE
$[
ER
FE
S:
s: Bg t I
sE*E
!€a
I .t
v''ln- 3
stusl:3 uoE
! i E
E.E
rrSE
ii*E.i f
!E=
EE
;P
",tegE;B
g.x !E
oso,a6.'E
E
Lo
z c
g @
- *
a
#t g# 388,E
!E€5:X
d(l)(u=LiaE
frzbk€9.EE
elEs:=
.F:E
Y€C
gE
68.Eqef,
E H
ST
Ie;!(6ii-c(!H
(I)
ET
s E i
m E
E iE
F*E
E*G
,n:6L(!-d=
t+do
acE€iE
g
tr0)EtrotitrQ)
b0tro)uo)tr6)
.EoEdrt(nt,b0oo.ooLt).Eot6EE,?,,
5. lmpact of wastewater discharge on faecal bacteria loadings in Mataura River
In a mass balance modelling approach, treated wastewater concentrations of E. coli inAlliance Plant wastewater (Section 2) were combined with r. coli data for receivingwaterbody upstream of the discharge (Section o) to predict how the dischargedwastewater will affect the faecal bacteria load in the Mataura river.
Projected concentrations of analytes following the wastewater discharge to the Mataurariver were estimated as follows:
vFlB,Fina.lconc -(C p B, o as e tine' Q o * e tane) + (C p B,ww' Qww)
Qbasetine*QwwEqn. (r)
where: Crrc,rinatcor" is daily projected concentration of FIB in the Mataura River;Cpg,basetin, is the baseline concentration of E coli (in the immediate upstream site on theriver, i.e. no discharge of raw wastewater)i Cpra,ww, is concentration of rIB in thedischarged Alliance Plant wastewater; Qww is the discharge of raw wastewater during twodifferent scenarios (o,6sa cubic meters per day or 0.0768 m' s-t during normal flow and14,400 cubic meters per day or 0.1667 m3 s{ during peak flow conditions,o); and Qoasetine isdischarge (flow rate) of the Mataura River.
This mass balance modelling approach assumes: 1) conservation of mass; z) completemidng and; l) that water quality measurements and projections are accurate andrepresentative. Concentrations were expressed as CFU/100mL.
5.1 National Policy Statement for Freshwater Management
FIB predictions were compared with the Attribute States in the National Policy Statementfor Freshwater Management, with consideration of updates made inZott (NfS-fU z)tt).
Results of a 5-year mass balance modelling (2ott-2016) shows that the release of treatedwastewater at normal and peak discharge conditions produced increases in the E. coliconcentrations in the receiving Mataura River water (figure 11). During baselineconditions (i.e. vtataura River at Gore), the E. coli concentrations correspond to theAttribute State designated as r (red). Modelling results show increases in the proportionof samples at the downstream site (Mataura River 2OOm d/s Mataura Bridge), exceedingthe NPS-FM (zott) bathing water standards following the discharge (rable ro). Forinstance, % exceedances more than doubled after the discharge (rable ro). This suggeststhat the Alliance Plant discharge is having an effect on the levels of r.. coliin the receivingwater. the modelled r. coli x exceedances and median concentrations generally agree
20 See Section 5.3, discharge volumes oftreated wastewater effluent
40
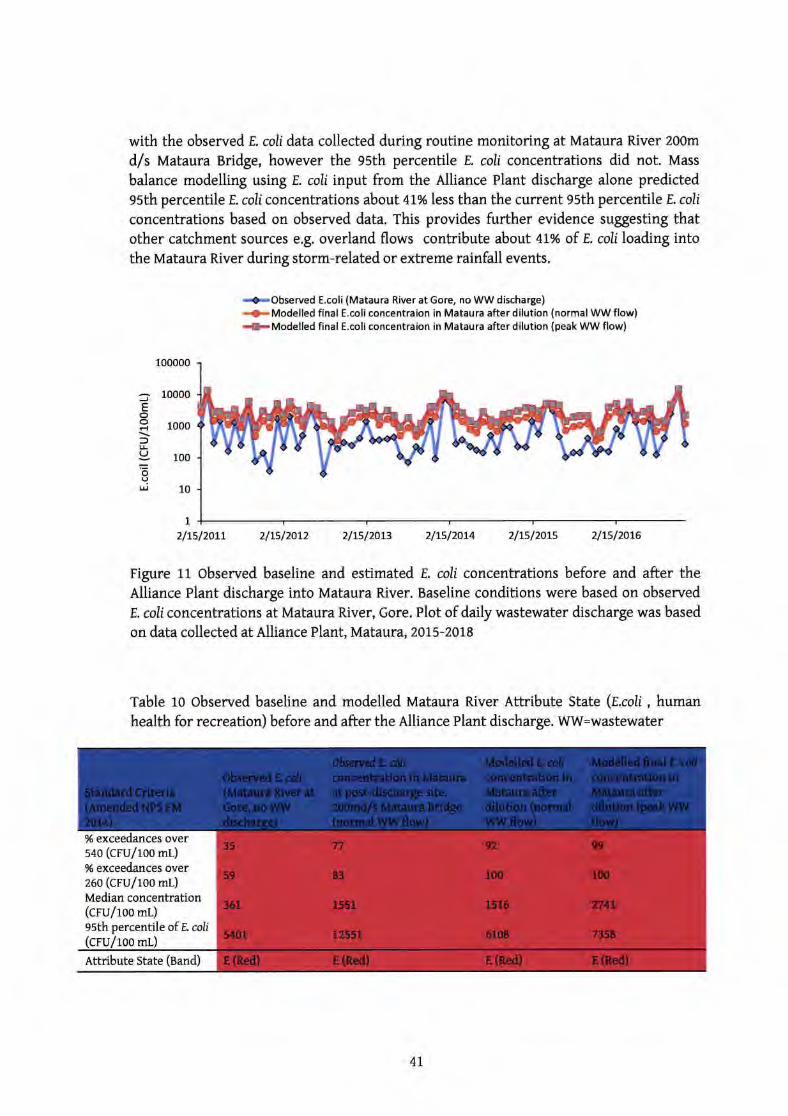
100000
10000
1000
100
10
JEoor-{
fl!(J
oqIJJ
with the observed E. coli data collected during routine monitoring at Mataura River 200m
d/s Mataura Bridge, however the 95th percentile E. coli concentrations did not. Mass
balance modelling using t. coli input from the Alliance plant discharge alone predicted95th percentile f. coli concentrations about 41% less than the current 95th percentile E. coli
concentrations based on observed data. This provides further evidence suggesting thatother catchment sources e.g. overland flows contribute about 4L% of E. coli loading intothe Mataura River during storm-related or extreme rainfall events.
f Q!5grvgd E.coli (Mataura River at Gore, no WW discharge)*Modelled final E.coli concentraion in Mataura after dilution (normal WW flow)*Modelled final E.coli concentraion in Mataura after dilution (peak WW flow)
zllsl20Lt 2lLslzOL2 2ltsl20t3 2lLSlzOL4 zlLSl2OLs 2ltsl20r6
Figure 11 observed baseline and estimated t. coli concentrations before and after theAlliance Plant discharge into Mataura River. Baseline conditions were based on observed
E. coliconcentrations at Mataura River, Gore. Plot of daily wastewater discharge was based
on data collected at Alliance Plant, Mataura, 2015-20L8
Table 10 observed baseline and modelled Mataura River Attribute State (t.colt, humanhealth for recreation) before and after the Alliance Plant discharge. ww=wastewater
1
seo (crulroo mt )% exceedances overzoo (cru/roo mr)Median concentration(cru/roo mr)95th percentile ofr. coli
Attribute State (Band)
4L
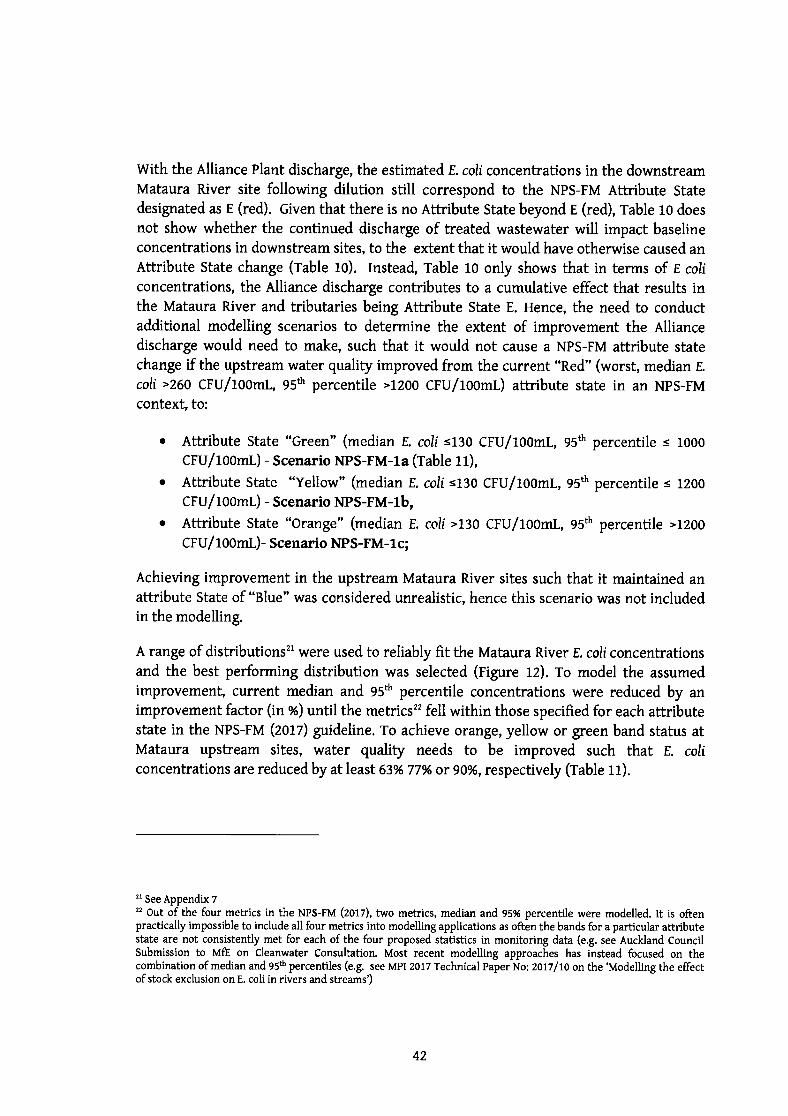
with the Alliance Plant discharge, the estimated t. coli concentrations in the downstreamMataura River site following dilution still correspond to the NPS-FM Attribute Statedesignated as E (red). Given that there is no Attribute State beyond E (red), Table 10 doesnot show whether the continued discharge of treated wastewater will impact baselineconcentrations in downstream sites, to the extent that it would have otherwise caused anAttribute State change (rable ro). Instead, Table 10 only shows that in terms of E coliconcentrations, the Alliance discharge contributes to a cumulative effect that results inthe Mataura River and tributaries being Attribute State E. Hence, the need to conductadditional modelling scenarios to determine the e*ent of improvement the Alliancedischarge would need to make, such that it would not cause a NPS-FM attribute statechange if the upstream water quality improved from the current "Red" (worst, median r.coli ,260 CFU/1oomL, 95e percentile >l2oo CFU/1oomL) attribute state in an NpS-FMcontexf to:
Attribute State "Green" (median E. coli <l3o CEUh00mL, 95e percentile < 1000
CFU/1oomL)- Scenario NPS-FM-Ia (rable u),Attribute State "Yellow" (median E. coli <130 CFU/100mL, 95th percentile < 1200
CFU/100mL) - Scenario NPS-FM-1b,
Attribute State "Orange" (median E. coli,130 CFU/100mL, 95th percentile ,1200
CFU/1oomt)- Scenario NPS-FM-Ic;
Achieving improvement in the upstream Mataura River sites such that it maintained anattribute State of "Blue" was considered unrealistic, hence this scenario was not includedin the modelling.
A range of distributions2l were used to reliably fit the Mataura River E coll concentrationsand the best performing distribution was selected (rigure t2). To model the assumedimprovemenf current median and 95e percentile concentrations were reduced by animprovement factor (in%) until the metrics" fell within those specifted for each attributestate in the NPS-FM (zotl) guideline. To achieve orange, yellow or green band status atMataura upstream sites, water quality needs to be improved such that E. coliconcentrations are reduced by at least 630/0 77% or 9O%o, respectively (fable f f).
'zl See Appendix 722 out of the four metrics in the NPS-FM (zotl), two metrics, median and 95% percentile were modelled. It is oftenpractically impossible to include dl four metrics into modelling applications as often the bands for a particular attributestate are not consistently met for each of the four proposed statistics in monitoring data (e,g. see Auckland CouncilSubmission to MfE on Cleanwater Consultation, Most recent modelling approaches has instead focused on thecombination of median and 95th percentiles (e.g. see MPI 2017 Technical Paper No: zotl/tO on the'Modelling the effectof stock exclusion on E. coli in rivers and streams')
a
a
a
42
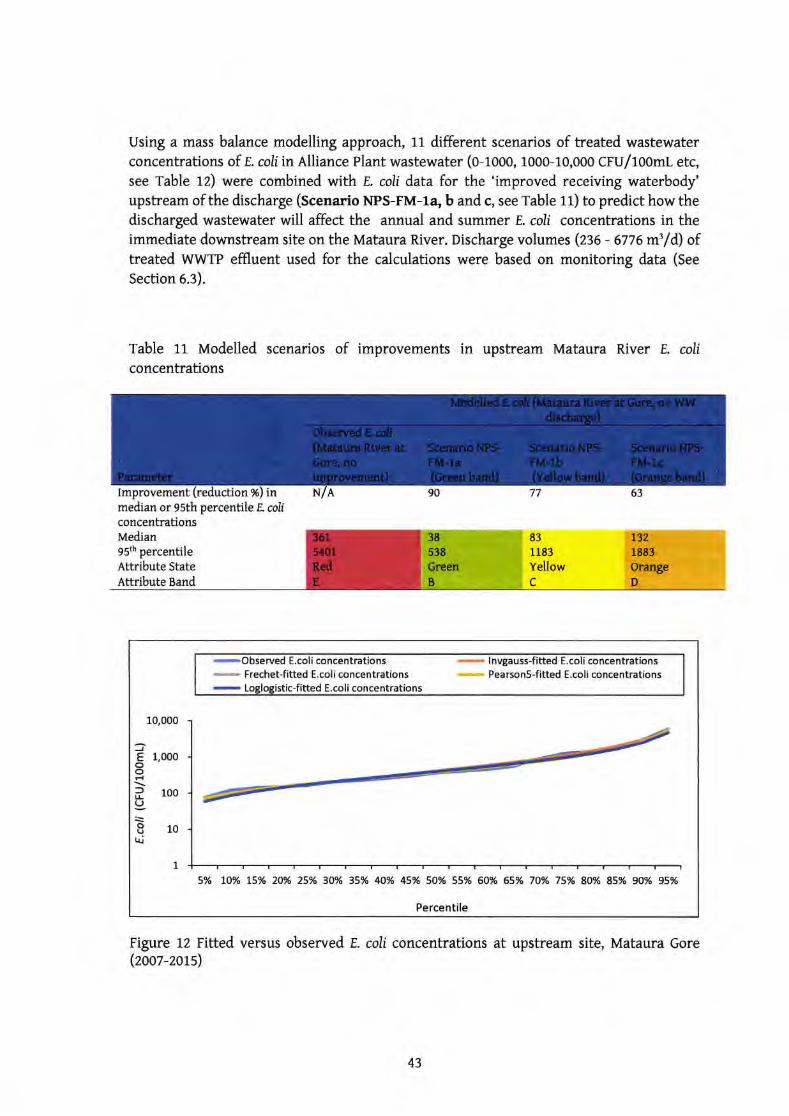
Using a mass balance modelling approach, 11 different scenarios of treated wastewaterconcentrations of E coliinAlliance Plant wastewater (o-tooo, 1000-10,000 cFU/1oomL etc,see Table 12) were combined with E rnli data for the 'improved receiving waterbody'upstream of the discharge (Scenario NPS-FM-Iq b and c, see Table 11) to predict how thedischarged wastewater will affect the annual and summer E. coli concentrations in theimmediate downstream site on the Mataura River. Discharge volumes (zz0 - 6776 m3/d) oftreated WWTP effluent used for the calculations were based on monitoring data (See
Section 6.3).
Table 11 Modelled scenarios of improvements in upstream Mataura River E coliconcentrations
Improvementmedian or 95th percentile E coliconcentrationsMedian9str percentileAttribute StateAttribute Band
Figure 12 Fitted versus observed E. coli concentrations at upstream site, Mataura Gore(zoot-zots)
831183
Yellowc
10,000
3E 1,000oo
F{
? 1oos,
8ro'ri
-Observed
E.coli concentrations
- Frechet-fitted E.coli concentrations
- l6gl6gistic-fitted E.coli concentrations -
| nygsrrs5-fitted E.coli concentrations
-
pgslsons-fitted E.coli concentrations
s% to% ts% 20% 25% 30% 35% N% 45% 50% 55% 60% 65% 70% 75% 80% 85% 90% 95%
Percentile
1
43
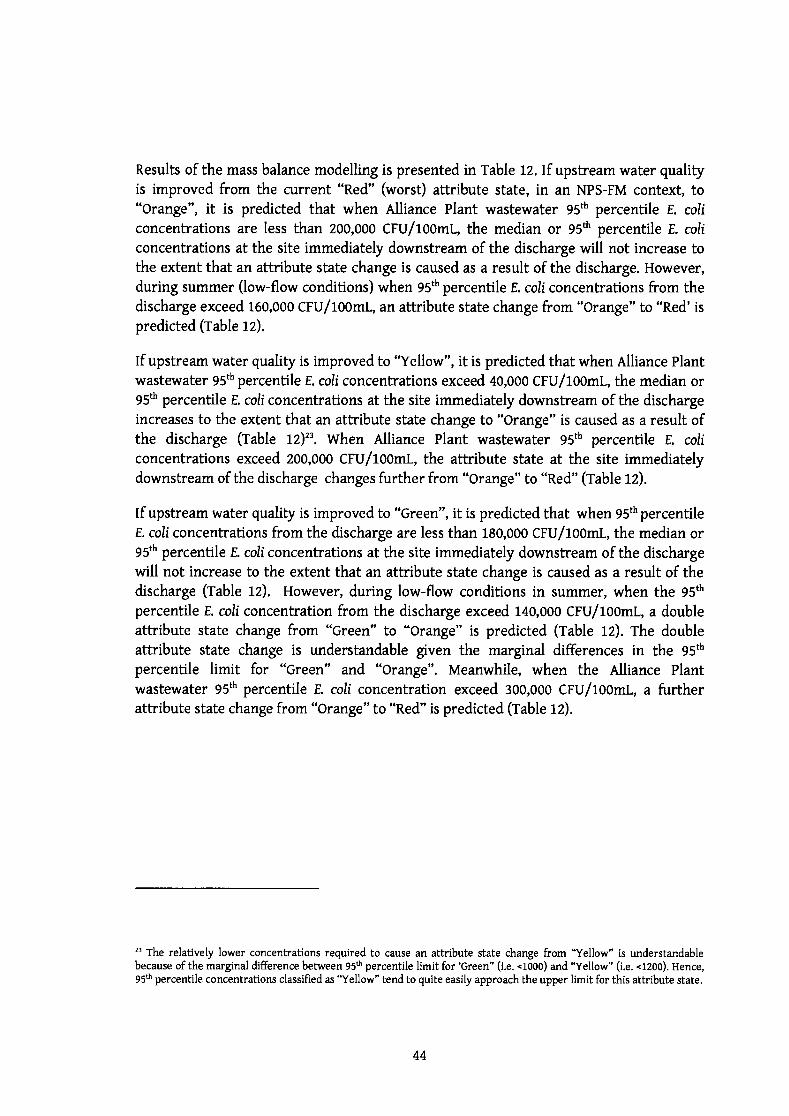
Results of the mass balance modelling is presented in Table 12. If upstream water qualityis improved from the current "Red" (worst) attribute state, in an NPS-FM context, to"Orar1ge", it is predicted that when Alliance Plant wastewater 95tr percentlle E. coliconcentrations are less than 2OO,0O0 CFU/10OmL, the median or 95s percentile E. coliconcentrations at the site immediately downstream of the discharge will not increase tothe extent that an attribute state change is caused as a result of the discharge. However,during summer (low-flow conditions) when 95th percentile E. coli concentrations from thedischarge exceed 160,000 CFU/1oomL, an attribute state change from "Orange" to "Red' ispredicted (rable rz).
If upstream water quality is improved to "Yellow", it is predicted that when Alliance Plantwastewater 95th percentile E. coli concentrations exceed 40,000 CFU/1oomL, the median or95s percentile E coli concentrations at the site immediately downstream of the dischargeincreases to the extent that an attribute state change to "Orange" is caused as a result ofthe discharge (rable tz)'3. when Alliance Plant wastewater 95tr percentile E coli
concentrations exceed 200,000 CFU/1oomL, the attribute state at the site immediatelydownstream of the discharge changes further from "Orange" to "Red" (rable rz).
If upstream water quality is improved to "Green", it is predicted that when g5epercentile
E. coli concentrations from the discharge are less than 180,000 CFU/loOmt, the median or95s percentile E coli concentrations at the site immediately downstream of the dischargewill not increase to the extent that an attribute state change is caused as a result of thedischarge (rable rz). However, during low-flow conditions in summer, when the 95trpercentile E. coli concentration from the discharge exceed 140,ooo CFU/1oomL, a doubleattribute state change from "Green" to "orange" is predicted (rable rz). rhe doubleattribute state change is understandable given the marginal differences in the 95epercentile limit for "Green" and "Orange". Meanwhile, when the Alliance Plantwastewater 95th percentile E. coli concentration exceed 3O0,Ooo CFU/1oomL, a furtherattribute state change from "Orange" to "Red" is predicted (rable rz).
23 The relatively lower concentrations required to cause an attribute state change from 'Yellow" is understandablebecause of the marginal difference between 95n percentile limit for'Green" (i.e. .1OOO) and "Yellow" (i.e. .t2OO). Hence,95ff percentile concentrations classified as'Yellow" tend to quite easily approach the upper limit for this attribute state.
44
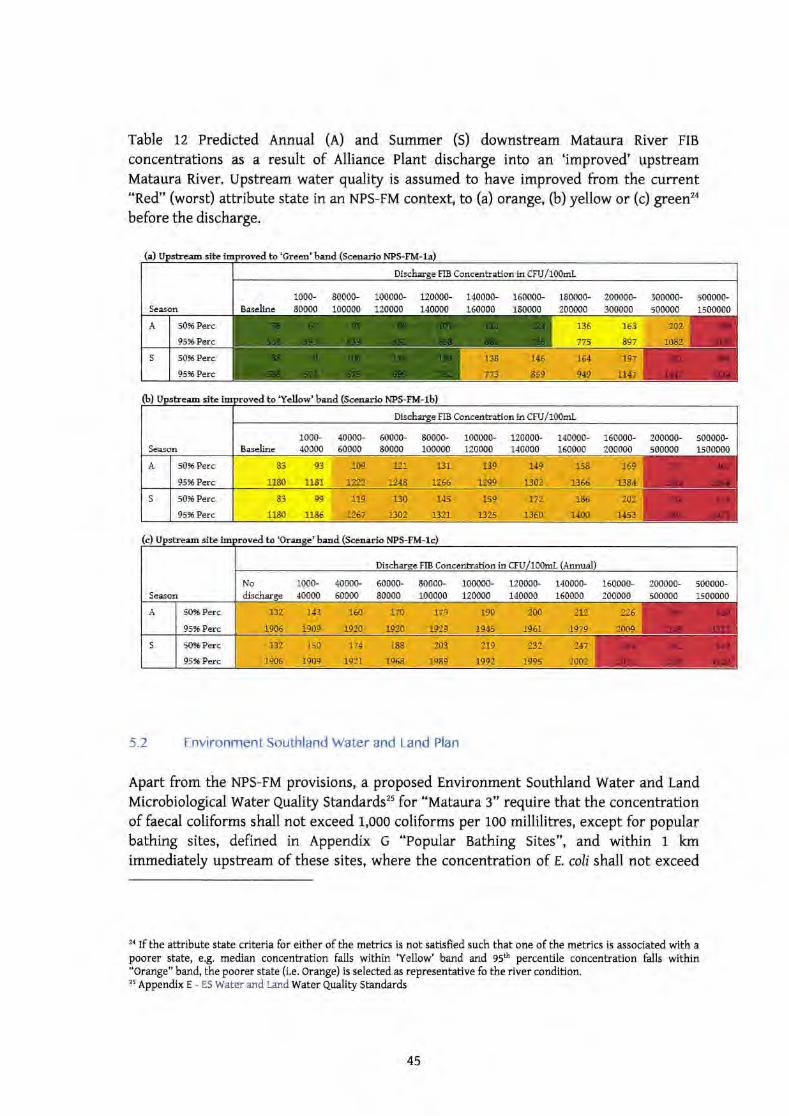
Table 12 predicted Annual (A) and Summer (S) downstream Mataura River FIB
concentrations as a result of Alliance Plant discharge into an 'improved' upstreamMataura River. Upstream water quality is assumed to have improved from the current"Red" (worst) attribute state in an NPS-FM context, to (a) orange, O) yellow or (c) green"before the discharge.
rite to'Grccm'band NPS-FM-
site to'Yellod band
rite to Lud NPS-FM-1c)
5.2 Environment Southland Water and Land Plan
Apart from the NPS-FM provisions, a proposed Environment Southland Water and LandMicrobiological water Qudity Standards25 for "Mataura 3" require that the concentrationof faecd coliforms shall not exceed 1,ooo coliforms per roo millilitres, except for popularbathing sites, defined in Appendix G "Popular Bathing Sites", and within 1 kmimmediately upstream of these sites, where the concentration of. r. coli shall not exceed
2a If the attribute state criteria for either of the metrics is not satisfted such that one of the metrics is associated witfi apoorer state, e.g. median concentration falls within 'Yellow' band and 95tr percentile concentration falls within"orange" band" the poorer state (i.e. orange) is selected as representative fo the river condition.
'zs Appendix E - ES Water and Land Water Quality Standards
Dischqree FIB Concentration in CFU/100mL
Scm1000-8flno
8000G.
1000m10000{-uo(m
120000-140000
1,t0000-1600m
1600m-180m0
180000-
200flx)2Un00-300000
300000-500000
s00fi)0-150(m0Barclire
L 5096 Perc
9596Perc
136
775
163
EN
S 50%Psc
9596Psc
Discharec FIB Concentntion in CFU/1O0mL
Seam1000-40000
40000-60000
50000.80000
8000(}-
100000
100000-
1200001200uF1{0000
140000-160{n0
160{X}0-200{n0
200{n0-s00{x}0
s00000-1500000Beseline
A 5016 Perc
9596 Perc
99
1161
83
u80
s g)96 P.trc
95XPsc&t 99
1180 1186
Discharsc FIB CoaccntraHon in CFUA0OnL (AffiurD
SeamNo 1000-dischsse {0000
4000s-60000
50000-80000
80000-100000
100000-120000
12000,0-
litfiX)0140000-
160000
16(xno-2000G)
200000-s00000
s0,0000-
u0{n00
A 5096 Perc
9596Psc
s 5096Psc
95XPerc
45
130 coliforms per roo millilitres. The 'Mataura River 200m d/s Mataura Bridge' site is adesignated "Popular Bathing Site", hence the 130 E. coli per 1oo millilitres reference pointapplies.
Two scenarios of mass balance modelling were used to determine the extent ofimprovement the Alliance discharge would need to make, such that it would not cause adownstream site exceedance of:
a
a
the microbiological standard in the proposed ES water and Land tlan (i.e. rtoCFU/1oomL median t.coli concentration), if the upstream water qudityimproved from the current S-year median of :ot cFu/looml to . 130
CFU/10omL (Scenario ES Water and tand Plan-r),an hypothetical threshold (i.e. 1000 cFU/1oomL 95d' percentile E.coliconcentration), if the upstream water quality improved from the current 5-year 95th percentile of saot cFU/1oomL to < 1000 CFU/1oomL (Scenario
Hypothetical-r).
Aspects of the proposed ES Water and tand Plan converge with NPS-FM (zotz) (see Figure1). For instance, a scenario of median concentration <130 CFU/1OOmL in the ES Water andLand Plan coincides with the NPS-FM attribute states "Yellow" (Scenario NPS-FM-Ib)and "Green" (Scenario NPS-FM-1a) already modelled and reported in Section 5.1.
Similarly, a suggested hypothetical 95tr percentile concentration .1000 CFU/100mLcoincides with the NPS-FM attribute state "Green", and hence the same modelling result(rable tzaandb).
46
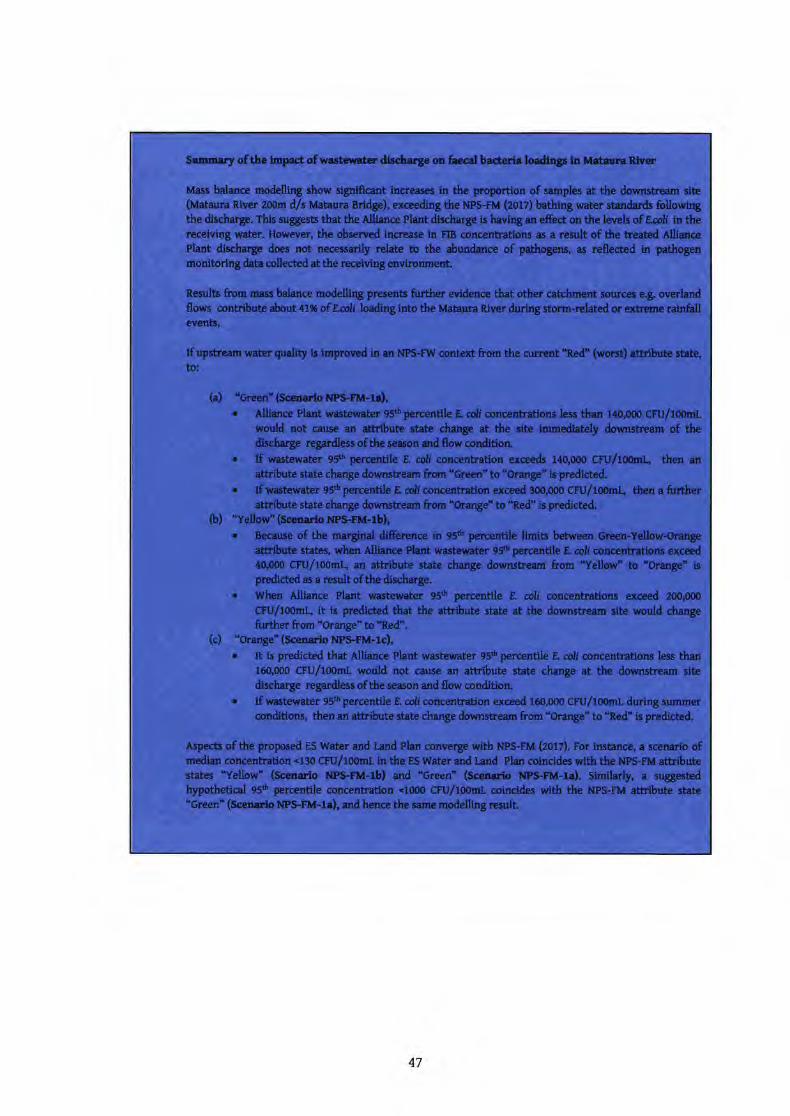
t--$
!gE-H
EE
$;oc=
33>
-*cI|<
tJlsi8 *,taau>
,6
o-E
ilE
€Er
'=8.'.2
8'E-rc
. o
(ljJR
^9 f -
E.E
>E
sr.E t
3>
8Er
+.,2n
3# " g.iZ
;'E s F
EsE
r$E
^Es8E
=G
. -H
-dou'F
loE
gildEgs,irgE
[:E
qo e E
V-E
nAG
!
-E sa€
E
EE
EE
tE
HE
ET
H$E
EH
@iO
aO.
&.9 3 8_z
o:=v
o
rf it E
E E
iEg
- J!
9.-E
E T
E
H
A E
E S
,5
gt i € F
I [ 3c E# e=
Es d E
iti t! IE gE
aE e d frE
; I+ E
I Ee
!; Ie*n ;lf €E E
, siIi $E
gt Els E
: r$ gF
EIU
I$!fEtE
IIFIU
iEiB
EE
EE
$iE$If;E
EE
Ei
EIE
;cle 3il$;i,
Eltgliiiaiiltigla i- t-
gg Iggi:*l E
r *{= *=
?iB$E
i;'
' '
;' ;o
o
ql(dI0)
sL((!o3ato&trok!3Uo-qoq*(,ioo3l!v>Or
zgGtr"6(uoLa>
\
dCI
!0)I6;(!q)Ho.uO
c.(n(!=
9Eoq)*EotE
XLK30O
do6c16P
E-tcai609P
Ig'ts'EP
EI
6-t]g8';E
e-u3'i
-soi!b>-c
0)l:r -EE
gg.EE
qoE
€o"3E
o--oE
,iouiosa(!lj6i-o56G
,2oH
EE
!o!
9of,a,;.=
62
dBE
dd A
)
o boo
o c
;.E5
H 80
-{H.go
Ee'-=
+(?=
{ii
i E
ES
C;
E ftE
iss -E
s::.E
3 l8;
."-
I' IFt Ig
.E I B
ro.E.*
6 E
sr'= tE
{ $etstt ;B
E:;c
$ grt s; E
: E
gEt e
E"
E gtE
JfF
i ;sii:rH
g"S
hHE
fl$ :E
EE
E€I
-E E
:tr * e^s
E f ii.F
EE
E
SS
or3Hd
,5 >
C€ gE
E
6. Quantitative Microbial Risk Assessmeril (QMRA)
6.1 Overview
In line with available literature (uSEPA, 2o1o), current monitoring at Mataura River has
highlighted considerations of the inadequacies of the FIB to assess risk. Also, multiplestressors contribute to the faecal loading in the Mataura River. Hence, a better approachto safeguarding public hedth is to assess risks to hedth as a result of the discharge fromthe Alliance Mataura plant using a quantitative approach. Quantitative microbial riskassessment (qMRA) is a framework that applies information and data incorporated intomathematicd models that predict the health risk from pathogens through environmentalexposures and characterizes the nafure of any adverse outcomes.
elthough several QMRAs have been documented for human waste discharge intoreceiving waters in New Zealand, a QMRA study that assesses the effect of discharge fromanimal factory wastewater discharge is comparatively rare. At a given level of FIB, risksfor animal-impacted water may dlffer from human-impacted water because the mix anddensities of pathogens in animal manure are different from those in human excreta. As
argued in Section 2.2, QMRA with a focus on animal factory wastewater thus provides a
scientifically defensible mechanism to charactenze risks from animal-based wastewater.This QMRA employs peer-reviewed microbial risk assessment tools and approaches(usrp.A.,2o1o).
Typically, four steps are involved in a QMRA (Haas, Rose, & Gerba, 1999a):
. hazardidentification;
. exposure assessmenB
. dose-response analysis, an{
. risk characterization.
6.2 Hazard analysis
Wastewater from the Mataura Plant can pose potential risks to human health if the wastes
are not adequately treated or contained. tn line with published literature. The mostcritical microbial groups in terms of public health risk from such wastewaters are bacteriaand protozoans (courault et al., zolTiPrevost et al., zots)
Factors taken into consideration for the selection of representative pathogens for this
QMRA are summarized below:
Campylobacter:
Campylobaaer spp. is prevalent in livestoch particularly poultry and sheepa
48
Several dose-response relationships for c. jejuni have been published (Medema,
Teunis, Havelaar, & Haas, 1996; Teunis et al., 2005; USEPA, 2o1o).
t. coliotsz:ttz
o It is representative of Shiga toxin producing E coli (Srrc), which potentially causes
serious adverse health outcomes, and has been implicated in waterborneoutbreaks.
o It is frequently isolated from cattle manure, often in very high densitieso It can potentially grow in soil, sedimen! water, and possibly other environmental
matrices-all of which emphasize its potential to be found in animal factorywastewater-impacted waters (uSrpa, 2o1o).
Salmonella
It is very heterogeneous as its serotlrpes have adapted to a wide variety of host-speciftc environments including humans.
It can persist in environmental median for up to 180 days or longer (uolley, Arrus,ominski, Tenut4 & Blank 2006).
Salmonelb can be detected throughout the year, with densities and serotSrpe
diversity typically higher during summer months than winter months (Haley, Cole,
&Lipp,aooe).
Crypto oridium and Giardia spp.
These species have been implicated in many waterborne disease outbreaks both inNew Zealand and globally
Dose-response models are available for both protozoa, and both parasites can
infect a significant proportion of the exposed population at low doses (tvtedema etd.,L996;Teunis et d., zoo5; USEPA, 2010).
Cryptosporidiumand ciardio.spp. are frequently isolated from livestock manure, andtheir respective oorysts and rysts can survive for extended periods of time in theenvironment (usrPA, 2o1o).
6.3 Exposure Assessment
Exposure assessment involves identification of populations that could be affected bypathogens. The main individuals at risk of exposure to pathogens from the Mataura Plantwastewater discharge are those that engage in contact recreation sites potentiallyimpacted by this discharge. In order to assess the potential level of exposure, thefollowing considerations are necessary:
a
a
a
a
a
a
a
a proximity of site to the discharge
49
. the possible exposure pathways that allow the pathogen to reach people and causeinfection (through ingesting polluted water, etc.);
o r?ng€ (minimum, maximum and median) of zoonotic pathogen concentrations intreated effluent;
. discharge volumes of the treated wastewatero the environmental fate of the zoonotic pathogens in the receiving environment
e.g. dilution, and die-offfrom UV irradiation. how much water a child/adult will ingest over a period of time during a particular
recreational activity;o estimation of the amount, frequenry, length of time of exposure, and doses for an
exposure.
Exposure Assessment site
Treated wastewater from Alliance Plant is discharged directly into the Mataura River.Selection of the exposure site was guided by the direction of the plume following dilution.It was thus logical to select an exposure site on the Mataura River that is immediatelydownstream of the discharge point. The selected assessment site (Mataura River bridge) isapproximately 330m downstream of the discharge. It is also more proximate to thedischarge, compared to the ES designated compliance monitoring site ('Mataura River2OOm d/s Mataura Bridge'), which is approximately 880 metres downstream of the outfall.
WWTP treated effluent pathogen concentrations
Effluent concentrations used in this QMRA were based on laboratory-analysed monitoringdata collected at the Alliance Plant. To adequately estimate potential health risk, it isimportant to estimate the proportion of human-infectious strains of each referencepathogen in each animal source. tn this QMRA, avery conservative approach was applied,which assumed that all strains of each reference pathogen from the animal wastewaterare human-infectious strains.
Pathogen concentrations fed into the model were based on treated wastewatermonitoring. Untreated wastewater concentrations were either based on monitoring or 100
multiplied by the concentrations in the treated wastewater; whichever was higher (rable13).
50
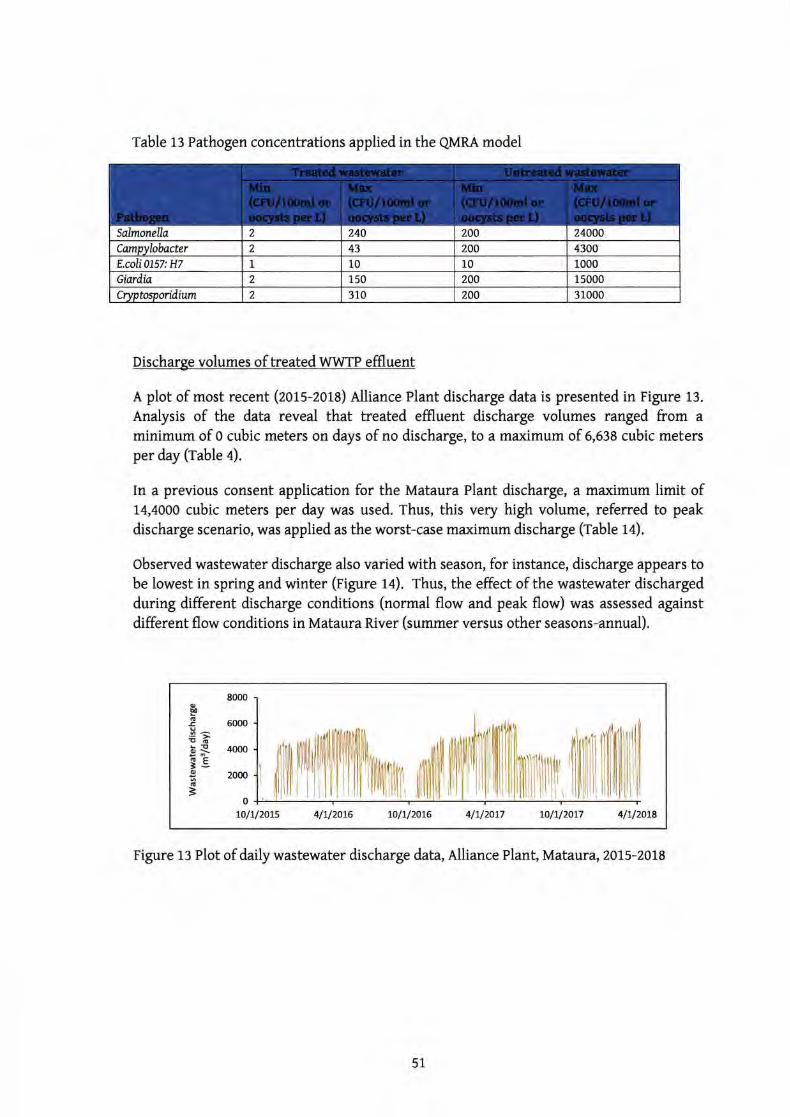
Salmonella 2 240 200 24000
Conpylobacter 2 43 200 4300
E.ali0157:H7 1 10 10 1000
2 150 15000Gior:dia 200
2 31000Crwtosporidium 310 200
Table 13 Pathogen concentrations applied in the QlvlRA model
Discharge volumes of treated wwT? effluent
A plot of most recent (zors-zora) Alliance Plant discharge data is presented in Figure 13.
Analysis of the data reveal that treated effluent discharge volumes ranged from a
minimum of o cubic meters on days of no discharge, to a maximum of 6,638 cubic metersper day (rable a).
In a previous consent application for the Mataura Plant dischatge, a maximum limit of14,4000 cubic meters per day was used. Thus, this very high volume, referred to peak
discharge scenario, was applied as the worst-case maximum discharge (rable ra).
observed wastewater discharge dso varied with season, for instance, discharge appears tobe lowest in spring and winter (figure ta). thus, the effect of the wastewater dischargedduring different discharge conditions (normal flow and peak flow) was assessed againstdifferent flow conditions in Mataura River (summer versus other seasons-annual).
Figure 13 Plot of daily wastewater discharge data, .Alliance Plant, Mataura, 2}t5-20t8
ffi1l{lflflflflflflflf\rmulu,
8000
50(x)
4000
2m0
0
oE63oEELEo\6q}|5oo
=toll.lzoLs 4lu2o\6 roltl2ot6 4lv2ot7 tolrl2otT 4hl2o].8
51
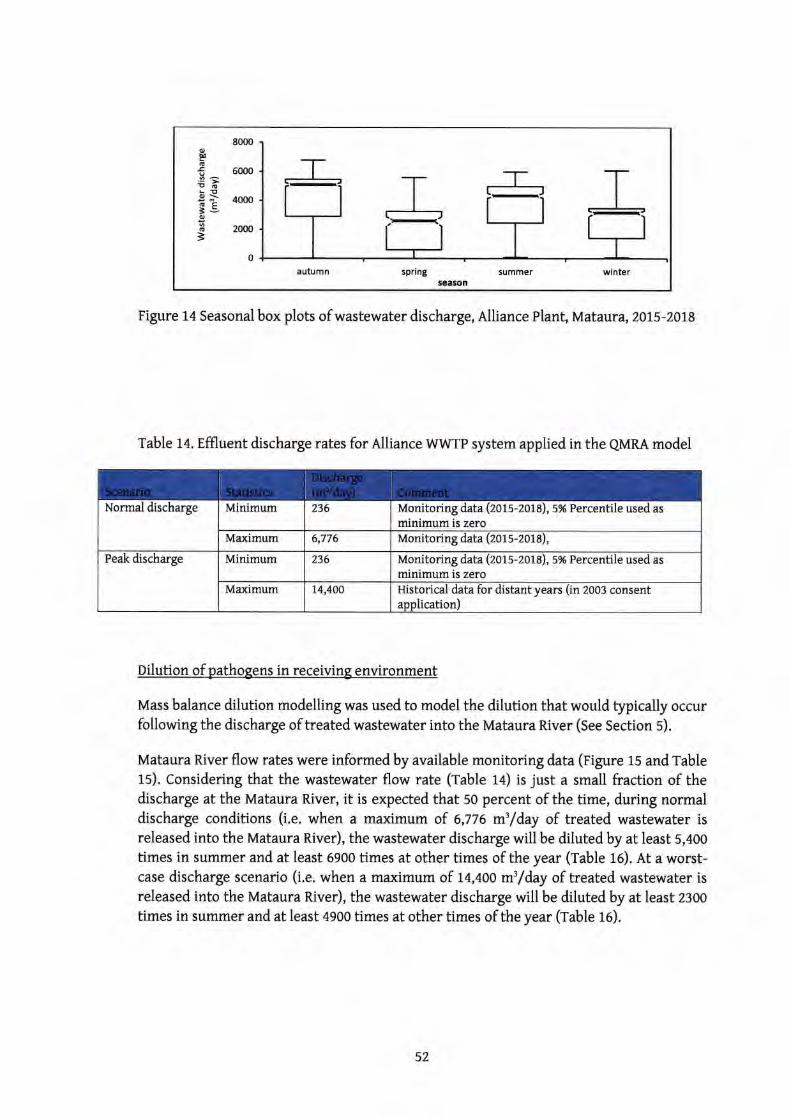
8000
5m0
4fi)o
2000
o
oEG
EI€FLEo\cc]-=oo
=
autumn spnnE wintersummerseason
Frgure 14 Seasonal box plots of wastewater discharge, Alliance Plant, Mataura, 2Ot5-20L8
Table 14. Effluent discharge rates for Alliance WWTP system applied in the QMRA model
Dilution of pathogens in receiving environment
Mass balance dilution modelling was used to model the dilution that would typically occurfollowing the discharge of treated wastewater into the Mataura River (See Section 5).
Mataura River flow rates were informed by available monitoring data (rigure 15 and Table1s). Considering that the wastewater flow rate (table 14) is just a small fraction of thedischarge at the Mataura River, it is expected that 50 percent of the time, during normaldischarge conditions (i.e. when a maximum of 6,776 m'/day of treated wastewater isreleased into the Mataura River), the wastewater discharge will be diluted by at least 5,400
times in summer and at least 6900 times at other times of the year (table 16). At a worst-case discharge scenario (i.e. when a maximum of 14,400 m'/day of treated wastewater is
released into the Mataura River), the wastewater discharge will be diluted by at least 2300
times in summer andatleast 4900 times at other times of the year (fable fO).
Minimum 236 Monitoring data(zots-zo$), 5% Percentile used as
minimumis zeroNormal discharge
Maximum 6,776 Monito ring dat a {20L 5 - zoLB),
Minimum 236 Monitoring data(zots-zorc), 5% Percentile used as
minimumis zeroPeak discharge
Maximum 14,400 Historical data for distant years (in 2003 consentapplication)
52
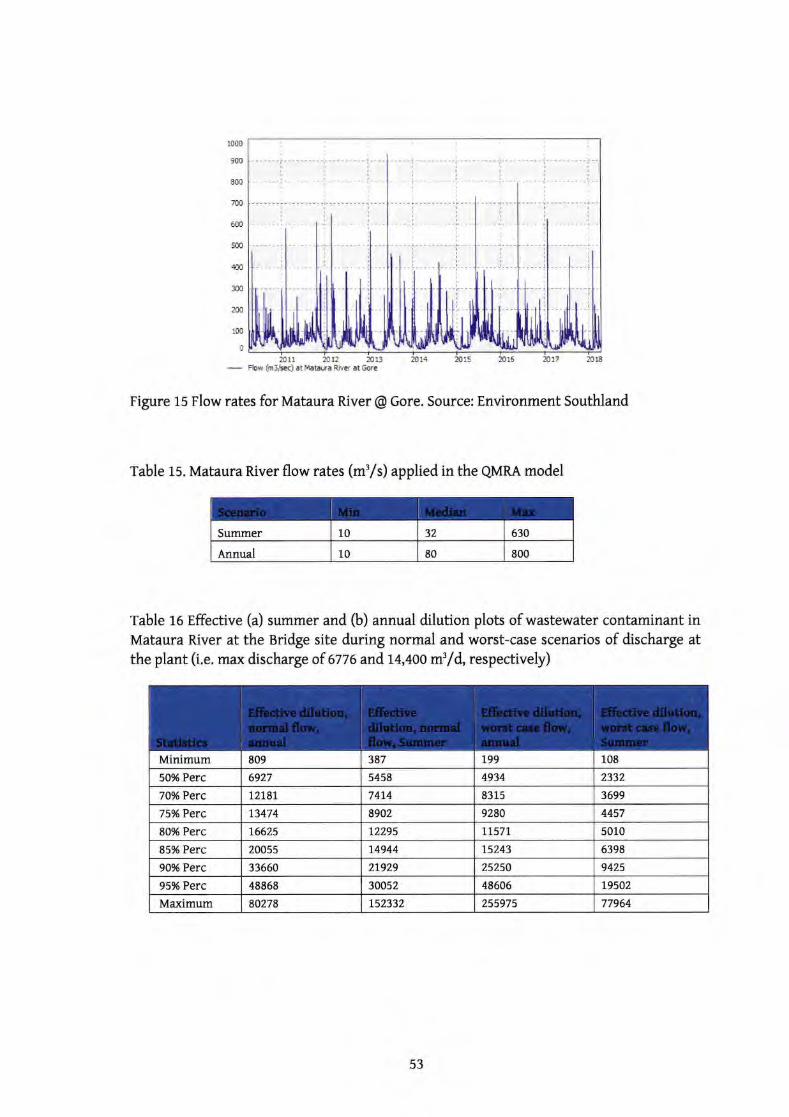
1000
900
800
ilo
6m
m.100
300
200
100
0
,2
- Eoo at M.tara R vs at Go.e
1:l 14
Figure 15 Flow rates for Mataura River @ Gore. Source: Environment Southland
Table 15. Mataura River flow rates (m3/s) applied in the QMRA model
Table 16 Effective (a) summer and (b) annual dilution plots of wastewater contaminant inMataura River at the Bridge site during normal and worst-case scenarios of discharge atthe plant (i.e. max discharge of ollo and14,4oo m'/il respectively)
:
Summer 10 32 630
10 80 800Annual
809 387 L99 108Minimum5458 4934 233250% Perc 6927
7414 8315 369970%Perc t2l8t75%Perc 13474 8902 9280 4457
80% Perc t662s 12295 t1s7L 5010
85% Perc 20055 74944 15243 6398
90% Perc 33660 21929 25250 9425
95% Perc 48858 30052 48505 L9502
Maximum 80278 152332 255975 77954
53
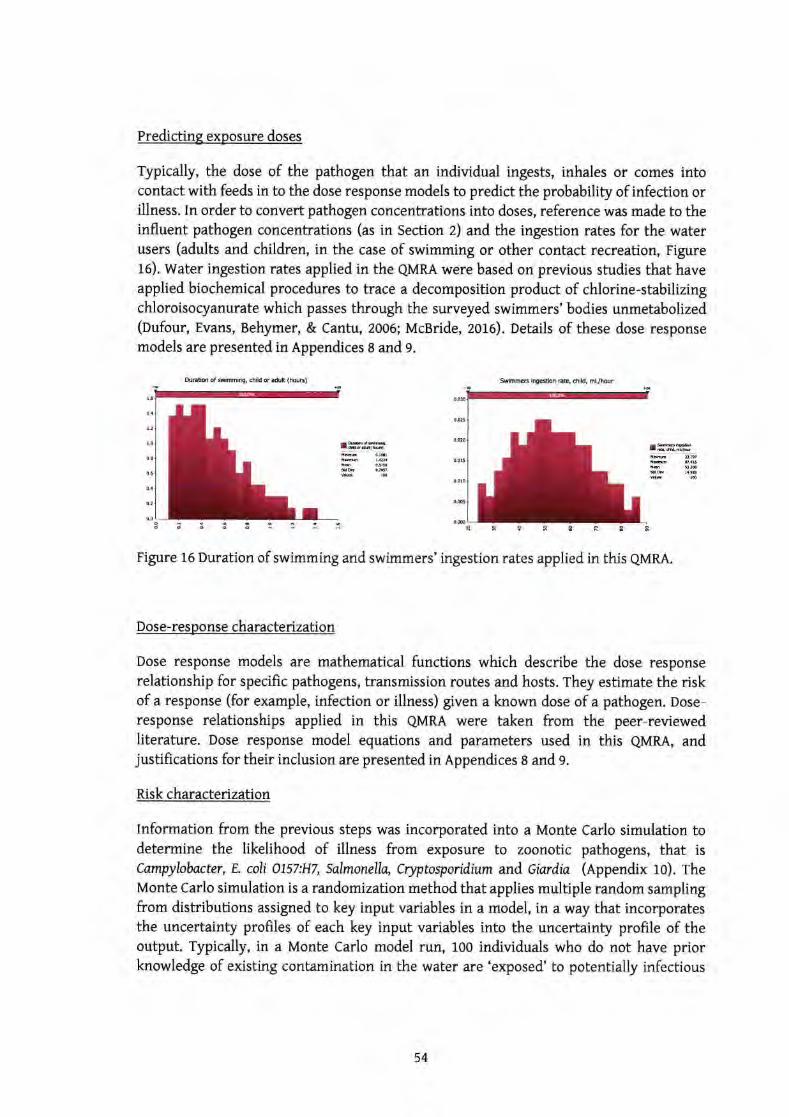
Predicting exposure doses
Typically, the dose of the pathogen that an individual ingests, inhales or comes intocontact with feeds in to the dose response models to predict the probability of infection orillness. In order to convert pathogen concentrations into doses, reference was made to theinfluent pathogen concentrations (as in Section z) and the ingestion rates for the waterusers (adults and children, in the case of swimming or other contact recreation, Figureto). water ingestion rates applied in the QMRA were based on previous studies that haveapplied biochemical procedures to trace a decomposition product of chlorine-stabilizingchloroisoryanurate which passes through the surveyed swimmers' bodies unmetabolized(Dufour, Evans, Behlrmer, & Cantu, 2006; McBride, 2015). Details of these dose responsemodels are presented in Lppendices g andg.
Duntton of sinmiig, driu a a nt Od6) 5l|Iml!6 lngEadoi rab, drlu, muhdr
!ffi{@ ril:[ffiiE; i:.;,
0.@9qt9 RStAER8A
Figure 16 Duration of swimming and swimmers' ingestion rates applied in this QMRA.
Dose-response characterization
Dose response models are mathematical functions which describe the dose responserelationship for specific pathogens, transmission routes and hosts. They estimate the riskof a response (for example, infection or illness) given a known dose of a pathogen. Dose-response relationships applied in this QMRA were taken from the peer-reviewedliterafure. Dose response model equations and parameters used in this QMRA, andjustifications for their inclusion are presented in Appendices 8 and 9.
Risk characterization
Information from the previous steps was incorporated into a Monte Carlo simulation todetermine the likelihood of illness from exposure to zoonotic pathogens, that isCampylobacter, E. coli O157:H7, Salmonella, Cryptosporidium and Giardia (Appendix ro). TheMonte Carlo simulation is arandomization method that applies multiple random samplingfrom distributions assigned to key input variables in a model, in a way that incorporatesthe uncertainty profiles of each key input variables into the uncertainfr profile of theoutput. Typically, in a Monte Carlo model run, 100 individuals who do not have priorknowledge of existing contamination in the water are 'exposed' to potentially infectious
54
water on a given day and this exposure is repeated 1,ooo times. Therefore, the totalnumber of exposures is 100,000. Monte Carlo simulations were undertaken using @Risksoftware (Palisade, try).
The result of the analysis is a full range of possible risks associated with exposure topathogens during the identified recreational activities. The predicted risk is reported as
the IIR (individual illness risk), calculated as the total number of infection cases divided bythe total number of exposures, expressed as a percentage. The IIR are then compared withrelevant guidelines. In New Zealand, the 1% tolerable risk level is the widely accepted
threshold when assessing the effect of wastewater discharge on recreational hedth risk(Oada 2otla;2018b; McBride 2OlL;2012;2007; Stewart et al 2oL7). Hence, when the IIR isgreater than L%, the discharge is predicted to be associated with some health risks. rorinstance, when IIR vdues are less than l%, this relates to an average probability of one
case of Campylobacter infection. If estimated IIR falls between 1 and 5%, this relates to amaximum of 5 cases of Campylobacter infection in 100 individuals. IIR values above 5%
present an even greater chance of Campylobacter infection (t in zo'u).
7. Results and Discussion
The results of the QMRA analysis for adults and children exposed to a range of reference
pathogens under the various discharge scenarios are presented in Appendices 11-15 and
summarised in Table t7 andTable 18.
Regardless of the QMRA reference pathogen used, some conclusions were more or less thesame, for instance, risks associated with illness is generally higher among children thanadults (rable 1z andTable 1a). This is generally understandable given that children tendto ingest a higher volume of water during recreation in potentially polluted waters. QMRAresults also generally indicate that risla increase with increasing wastewater flows. Forinstance, risks during normal flow conditions (maximum discharge of 6,776 m3/d) weregenerally lower than during worst case flow conditions (maximum discharge of l4,4oom'/d). Risks were marginally higher during summer due to low flow andcharacteristicallylower dilutions within the Mataura River, compared to other times in the year. This isbecause a conservative principle that assumes no or negligible microbial inactivation inthe Mataura River following discharge" was applied in this QMRA. For instance, duringsummer and normal flow discharge conditions from Alliance Plant, the child IIR was o.o2%
'z6 MfE (zoo3) Ministry of uealth Guideline values for microbiological quality of freshwater recreationalwaters
'z7 with the effect of microbial inactivation in the Mataura River following discharge, risks reported here would beslightly lower than is reported in this study.
55
but was O.o1% when wastewater containing Giardia cysts was discharged into the MatauraRiver during winter (rable rz).
The results of QuRe analysis generally show:
i. No treatment, normal discharge scenario - very large dilution of the dischargedwastewater occurred in the receiving environment even in instances when therewas no treatment or an assumed treatment failure of the entire wastewater plant.Despite the dilutions, the IIR was still above the t% threshold in winter andsummer for children (rable lz) andadults (rable 1e).
ii. No treatment, peak discharge scenario - Risks were higher than in the normaldischarge scenario. IIRs were also higher than the 1% threshold in winter andsummer for children (rable rt) andadults (rable rs).
iii. Treatment applied, normal discharge scenario - A combination of wastewatertreatment and the effect of dilution of the discharged wastewater in the receivingenvironment produced significant reductions of risks associated with swimming tovery low levels (below 0.1 in most cases). ror instance, during normal flowdischarge conditions, the IIR was below the 7o/o threshold for both adults and
children (Table 17 and rable 18). Thus, there is less than 1x probability of anindividual becoming ill due to swimming at the study site.
iv. Treatment applied, peak discharge scenario - Risks associated with swimmingat the study site was below the 1% tolerable threshold for both adults and children.There is thus little or no identifiable microbial health risk associated withswimming at the study site. Therefore, the current wastewater treatment appliedat Alliance Plant is sufficient to reduce health risks associated with swimmingbelow the discharge to levels below 'the NZ threshold for tolerable risk', even atmaximum discharge of 14,400 m'/d."
Understandably, there have been very few studies carried out on the effect of animalfaecal material and animal derived wastewater discharges as a source of waterborneinfections. A previous report2e by Desmond rill had earlier attempted to assess thecontribution that the discharge makes to the health risk associated with contactrecreation downstream in the river and esfuary. The report concluded that there isinsufficient microbiological data to fully assess the downstream health risk associatedwith the discharge from the Alliance Mataura plant. The current study thus fills somevery crucial study gaps in the animal wastewater risk assessment terrain, as it shows usinga robust microbiological monitoring program and quantitative risk assessment that thecontribution that the discharge makes to the health risk associated with contactrecreation downstream in the river and estuary is negligible.
'z6 It is important to note that the discharge in future consent applications could be less than 14,400 m3 / d,2e Alliance contribution to health risk for contact recreation in Mataura River. Desmond Till, 2oJuly 2oo4
56
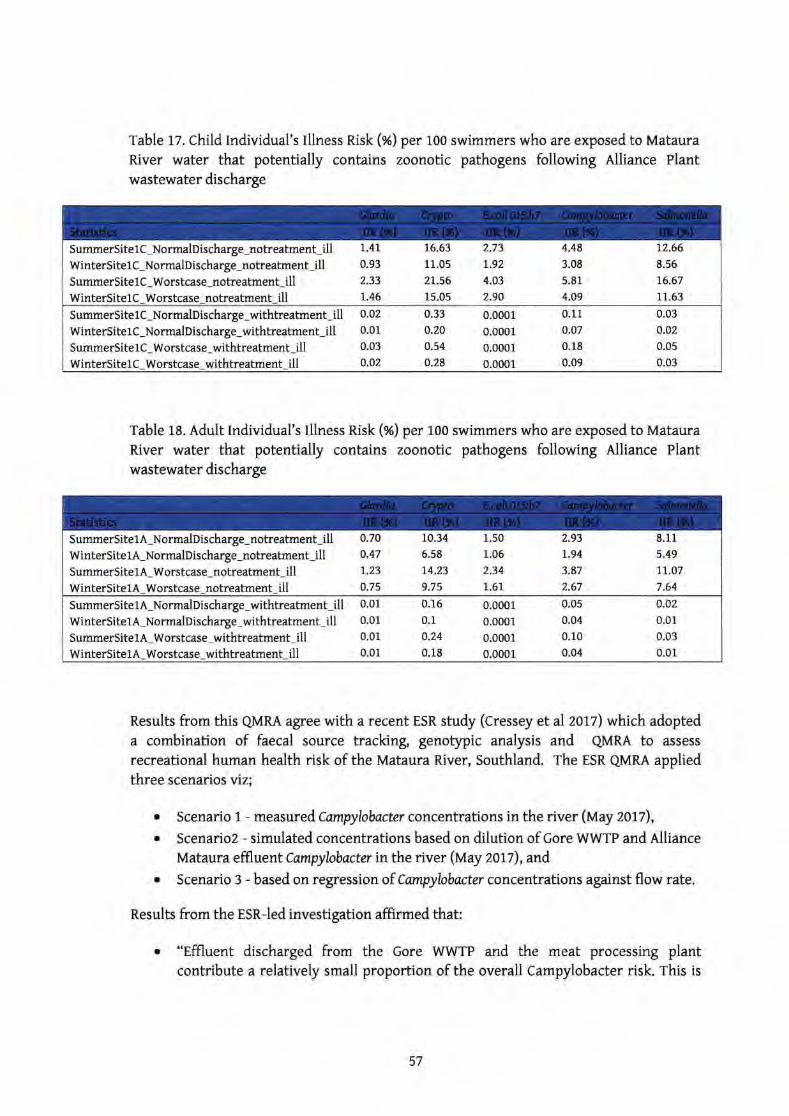
Table 17. Child Individual's Illness nisk (x) per 100 swimmers who are exposed to MatauraRiver water that potentially contains zoonotic pathogens following Alliance Plantwastewater discharge
Table 14. Adult Individual's Illness nisk (x) per 100 swimmers who are exposed to MatauraRiver water that potentially contains zoonotic pathogens following Alliance Plantwastewater discharge
Results from this QMRA agree with a recent ESR study (cressey et d, zotl) which adopteda combination of faecal source trachng genotypic analysis and QIvIRA to assess
recreational human health risk of the Mataura fuver, Southland. The ESR QMRA appliedthree scenarios viz;
o Scenario 1 - measuredcampylobacter concentrations in the river (May 20L7),
o Scenario2 - simulated concentrations based on dilution of Gore wwTP and AllianceMataura effluent Campylobactq in the river (tvlay 2ol7), and
o Scenario I - based on regressionof campylobactq concentrations against flow rate.
Results from the ESRled investigation affirmed that:
"Effluent discharged from the Gore WWTP and the meat processing plantcontribute a relatively small proportion of the overall Campylobacter risk. this is
a
SummerSite tC-NormalDischarge_notreatment-illWinterSitelC_NormalDischarge_notreatment_illSummerSite 1C-Worstcase-notreatment-illWinterSitelC Worstcase notreahnent-ill
1.41
0.93
2.33
1.46
16.63
11.05
2t.5615.05
2.73
1.92
4.03
2.90
4.48
3.08
5.81
4.09
L2.66
8.56
16.67
11.63
SummerSitelC-NormalDischarge-withtreabnent-illWinterSite1C_t tormalDischarge_withtreatment_illSummerSitelC-Worstcase-withtreatment-illWinterSitelC-Worstcase-withtreatment-ill
0.33
0.20
0.54
0.28
0.03
o.o2
0.05
0.03
0.02
0.01
0.03
0.02
0.0001
0.0001
0.0001
0.0001
0.11
0.07
0.18
0.09
SummerSite 1A_NormdDischarge_notreatment_illWinterSite 1A_NormdDischarge_notreatment_illSummerSite 1A-worstcase-notreatment-illWinterSitelA Worstcase notreatment ill
0.70
0.47
t.230.75
1.50
1.05
2.34
1.61
2.93
L.94
3.87
2.67
10.34
6.58
L4.23
9.7s
8.11
5.49
LL.O7
7.64
SummerSitelA-NormalDischarge-withtreatment-ill 0.01
WinterSitelA-NormalDischarge-withtreatment-ill 0.01
SummerSitelA-worstcase-withtreatment-ill 0'01
WinterSitelA-Worstcase-withtreatrnent-ill 0'01
0.16
0.1
0.24
0.18
0.05
0.04
0.10
0.04
o.o2
0.01
0.03
0.01
0.0001
0.0001
0.0001
0.0001
57
a
consistent with other work that indicated that Campylobacter contamination inthis region of the MatauraRiver was predominantly of wild fowl origin".The first two modelled QuRq, scenarios produced very low risk of Campylobacterinfection (.0.1%). The ESR QMRA predicted that these scenarios "would result inthis region of the Mataura River being classified in the highest water quditycategory for microbiological quality under either the old or updated categorisationschemes [i.e. ttpS 2OL4or NPS 2017-updated".
The ESR QMRA predicted that the third rSR scenario would result in a lower waterquality categorisation (estimated ItR values of between t.7 andz.SoA), depending onwhether high river flows'o are excluded from the estimate, as representing'unswimmable' conditions. This literally translates into a maximum of z to 3 cases
of Campylobacter infection in 100 individuals. It is important to note that only 8datapoints were used in the regression fitting for the third ESR scenario, hence,the result of this scenario may have over-estimated in-stream concentrationsbeyond what exists in the receiving environment. Additionally, the third scenarioin the ESR QMRA considers background Mataura River concentrations with inputsfrom the Gore WWTP, Alliance Plant discharge and other diffirse sources (e.g.
during high river flows) in the estimation of recreational health risks. The currentQMRA on the other hand, distinguishes the effect of the Alliance Plant dischargealone, using an approach that assumes no background campylobacter concentrationin the Mataura River. This QMRA therefore assessed if the Alliance Plant discharge(only) will cause the IIR to increase beyond an acceptable threshold of tN.It has
been shown using Campylobaaer concentrations from multiple Alliance Plantdischarge samples that the resulting IIR due to the discharge does not exceed 1%
and were in most cases below 0.1%.
30 During high river flows, overland flows and diffirse source pollution from other sources contribute to theCampylobacter infection risk
58
8. Conclusion
while the Alliance Plant discharge is having 'more than a minor' effect on the levels of r.coli in the receiving water, observed increases in E. coli concentrations as a result of thetreated Alliance Plant discharge did not necessarily relate to the abundance of zoonoticpathogens neither did these increases inE. coli relate to the individual illness risk.
9. References
Ahmed, W., Sawant, S., Huygens, F., Goonetilleke, A., & Gardner, T. (2009). Prevalence and occurrence of zoonotic
bacterial pathogens in surface waters determined by quantitative PCR. Water Reseorch, 43(19),49184928.
Baker, M. G., Kvalsvig, A.,Zhurg, J., Lake, R., Sears, A., & Wilson, N. (2012). Declining Guillain-Barr6 syndrome
after campylobacteriosis confiol, New Zealand, 1988-2010. Emerging Infectious Diseases, 18(2),226.
Banks, M., Bendall, R., Grierson, S., Heath, G., Mitchell, J., & Dalton, H. (2004). Human and porcine hepatitis E virus
strains, United Kingdom. Emerging Infectious Diseases, I0(5'),953.
Black, R. 8., Levine, M.M., Clements, M. L., Hughes, T. P., & Blaser, M. J. (1988). Experimental Campylobacter
jejuni infection in humans. Journal of Infectious Diseases, 157(3),472479.
59
Cabral, J. P. (2010). Water microbiology. Bacterial pathogens and water. International Journal of Ewironmental
Research and Public Health, 7(10), 3657 17 03.
Courault, D., Albert, I., Perelle, S., Fraisse, A., Renault, P., Salemkour, A., & Amato, P. (2017). Assessment and risk
modeling of airborne enteric viruses emitted from wastewater reused for irrigation. Science of The Totat
Erwironment, 592, 512-526.
Cressey, P., Hodson, R., Ward, R., & Moriarty,E. (2017). Cressey, P., Hodson, r. Ward, N. and Morimty, E (2017) Use
of QMRA to Assess the Human Health Risk of the Mataura River, Southland
http : //isrs2 0 I 7. c ony'image s/Cres sey _P eter. pdf.
Dada, A. C., & Hamilton, D. P. (2016). Predictive Models for Determination of E. coli Concentrations at Inland
Recreational Beaches. Water, Air, & Soil Pollution,227(9),347.
Dad4 A.C. (2018a) Quantitative Microbial Risk Assessment for the discharge of treated wastewater into Whitford
Embayment through Turanga Creek, LCL1702, Streamlined Environmental, Hamilton, 4l pp.
Dad4 A.C. (2018b) Quantitative Microbial Risk Assessment for the discharge of treated wastewater at Army Bay.
Report WSLI7Ol, Streamlined Environmental, Hamilton, 73 pp.
Dick, L. K., Simonich, M. T., & Field, K. G. (2005). Microplate subtractive hybridization to enrich for Bacteroidales
genetic markers for fecal source identification. Applied and Erwironmental Microbiologt, T l(6),3179-3183.
Dufour, A. P., Evans, O., Behymer, T. D., & Cantu, R. (2006). Water ingestion during swimming activities in a pool: a
pilot study. Journal of Water and Health,4(4),425430.
ES. (2013). Land Use Change in the Southland region Etwironment Southland Technical Report, June, Publication No
2013-13.
Glynn, J., & Bradley, D. (1992). The relationship between infecting dose and severity of disease in reported outbreaks
o f Salmonella infections. Epide mi ol o gt & Infe c ti on, I 0 9(3), 3 7 I -3 E E.
Graczyk, T. K., Fayer, R., Trout, J. M., Lewis, E. J., Farley, c. A., Sulaiman, I., & Lal, A. A. (1998). Giardia sp. cysts
and infectious Cryptosporidium parvum oocysts in the feces of migratory Canada geese (Branta canadensis).
Applied and Environmental Microbiologt, 64(7), 27 36-2738.
Green, H. C., Dick, L. K., Gilpin, B., Samadpour, M., & Field, K. G. (2012). Genetic markers for rapid PCR-based
identification of gull, Canada goose, duck, and chicken fecal contamination in water. Applied and
Envir onmental Microbi ologt, 7 8(2), 503-5 I 0.
60
Haas, C. N., Rose, J. B., & Gerb4 C. P. (1999a). Quanlitative microbial riskassessment. John Wiley & Sons.
Haas, C. N., Rose, J. B., & Gerb4 C. P. (1999b). Quantitative microbial risk assessmenr. John Wiley & Sons.
Haley, B. J., Cole, D. J., & Lipp, E. K. (2009). Distribution, diversity, and seasonality of waterborne salmonellae in a
rural watershe d. App lie d and Erw ir onmental Micr ob i o I o gt, 7 5 (5), 1248-1 25 5 .
Holley, R. A., Amrs, K. M., Ominski, K. H., Tenuta, M., & Blank, G. (2006). Salmonella survival in manure-treated
soils during simulated seasonal temperature exposure. Journal of Environmental Quality, J5(4), I 170-l 180.
Jones, P. (1976). The effect of temperature, solids content and pH on the survival of salmonellas in cattle slwry. British
Veterinary Journal, I j 2(3), 284-293.
Lake, I., Pearce, J., & Savill, M. (2008). The seasonality of human cryptosporidiosis in New Zealard. Epidemiologt &
Infection, I 3 6(10), I 3 E3- I 3 E7.
Lane, R., & Briggs, S. (2014). Campylobacteriosis in New Zealand: room for further improvement. The New Zealand
Medical Journal (Online), I 27(1391).
Learmonth, J. J., Ionas, G., Ebbett, K. A., & Kwan, E. S. (2004). Genetic characterization and transmission cycles of
Cryptosporidium species isolated from humans in New Zealand. Applied and Environmental Microbiologt,
70(7),3973-3978.
Lebeau, B., Pinel, C., Grillot, R., & Ambroise-Thomas, P. (1998). Fungal and parasitic nosocomial infections:
importance and limitations of disinfection methods. Pathologie-Biologie,46(5),335140.
Legrand-Abravanel, F., Mansuy, J.-M., Dubois, M., Kamar, N., Peron, J.-M., Rostain5,L., &lzopet, J. (2009).
Hepatitis E virus genotype 3 diversity, France. Emerging Infectious Diseases, 15(1), 110.
Leotta, G. A., Miliwebsky, E. S., Chinen, I., Espinos4 E. M., Azzopardi, K., Tennant, S. M., ... Rivas, M. (2008).
Characterisation of Shiga toxin-producing Escherichia coli Ol57 strains isolated from humans in Argentina,
Australia and New Zealand. Bmc Microbiologt, S(l),46.
Matsuki, T., Watanabe, K., Fujimoto, J., Kado, Y., Takada, T., Matsumoto, K., & Tanaka, R. (2004). Quantitative PCR
with 163 rRNA-gene-targeted species-specific primers for analysis of human intestinal bifidobacteria. Applied
and Environmental Microbiologt, 7 0(l), 167 -173.
McBride. (2014). National Objectives Frameworkfor Freshwater: Statistical considerations for assessing progress
towords objectives - with emphasis on secondary contact recreation values. Prepared for the Ministry for the
Environment, j4p.
61
McBride. (2017). National Objectives Framework - Statislical Considerations for Design and Assessment. Prepared
for the Ministryfor the Environment by NIWA. Client Report Number Ham 16022. 47p.
McBride, G. (2016). Quantitative Microbial RiskAssessmentfor the discharge of treatedwastewdter: Wmhworth
ltuastewater treatment plan. Report prepared by NWAfor Watercare Services Limited. IIAM20|6-037.
2016b Quantitative Microbial Risk Assessment for the Discharge of Treated Wastewater: Snells Beach Wastewater
Treatnent Plan. Report Prepared by NIWA for Watercare Services Limited. HAM20l6-038.
McBride, Graham 2007 Microbial Risk Assessment Modeling. Statistical Framework for Recreational Water Quality
Criteria and Monitoring: 135-151.
McBride, G.,2012. An assessment of human health effects for a quantitative approach based on Norovirus. NIWA
Client Report No: HAM2012-150, prepared for New Plymouth District Council, Project NPDl3202.
McBride, G.,2011. A quantitative microbial risk assessment forNapier City's ocean wastewater discharge.
Medem4 G., Teunis, P., Havelaar, A., & Haas, C. (1996). Assessment of the dose-response relationship of
Campylobacter j ej uni. I nternati onal Journal of F o od Micr obi ol o gt, 3 0(1_2), I 0 I - I I I .
Messner, M. J., Chappell, C. L., & Okhuysen, P. C. (2001). Risk assessment for Cryptosporidium: a hierarchical
Bayesian analysis of human dose response data. l(ater Research, S5(16), 39341940.
MfE. (2003). Microbiologicalwater quality guidelinesfor marine andfreshutater recreational areas. Ministryfor the
Environment.
Mintz, E., Cartter, M., Hadler, J., Wassell, J., Zingeser, J., & Tauxe, R. (1994). Dose-response effects in an outbreak of
Salmonella enteritidis. Epidemiologt & Infection, I l2(l), 13_23.
Mitscherlich, E., & Marth, E. (1984). Microbial survival in the environment. 19E4.
MoH. (n.d.). Enteric Zoonotic Disease Research in New Zealand.
https : //www. health. govt. nz/system/files/documents/pages/z oonosespmlt _0. pdf.
National Research Council. (2004). Committee on Indicators for Waterborne Pathogens (ed.). 200a. Indicators for
waterborne pathogens.
Newell, D. G., Koopmans, M., Verhoef, L., Duizer, E., Aidara-Kane, A., Sprong, H., ... Scheutz, F. (2010). Food-borne
diseases-the challenges of 20 years ago still persist while new ones continue to emerge. International Journal
of Food Miuobiologt,lJ9, S3-S15.
NPSFM. (2014). National Policy Statementfor Freshwater Management 2014.
62
NPSFM. (2017). National Policy Statementfor Freshwater Management 2014, updated and gazetted 2017.
Okhuysen, P. C., Rich, S. M., Chappell, C. L., Grimes, K. A., Widmer, G., Feng, X., & Tzipori, S. (2002). Infectivity of
a Cryptosporidium parvum isolate of cervine origin for healthy adults and interferon-y knockout mice. The
Journal of Infectious Diseases, 185(9), 1320-1325.
Olivieri, A. W., & Seto, E. (2007). Application of microbial risk assessment techniques to estimate risk due to exposure
to reclaimedwaters.
Payment, P., & Locas, A. (201l). Pathogens in water: value and limits of correlation with microbial indicators.
Gr oundw ater, 4 9(l), 4-l l.
Prevost, B., Lucas, F., Goncalves, A., Richard, F., Moulin, L., & Wurtzer, S. (2015). Large scale survey of enteric
viruses in river and waste water underlines the health status of the local population. Environment International,
79,42-50.
Reischer, G. H., Kasper, D. C., Steinborn, R., Farnleitner, A. H., & Mach, R. L. (2007). A quantitative real-time PCR
assay for the highly sensitive and specific detection of human faecal influence in spring water from a large
alpine catchment area. Letters in Applied Microb iologt, 4 4(4), 3 5 1{5 6.
Reischer, G. H., Kasper, D. C., Steinborn, R., Mach, R. L., & Farnleitner, A. H. (2006). Quantitative PCR method for
sensitive detection of ruminant fecal pollution in freshwater and evaluation of this method in alpine karstic
regions. Applie d and Ewir onme ntal Mic r ob i ol o gt, 7 2 (8), 5 610-5 61 4.
Rose, J. B., Haas, C. N., & Regli, S. (1991). Risk assessment and control of waterborne giardiasis. American Journal of
Public Health, 8 I (6), 7091 13.
Rutjes, S. A., Lodder, W. J., Lodder-Verschoor, F., Van den Berg, H. H., Vennem4 H., Duizer, E., ... de Roda
Husman, A. M. (2009). Sources of hepatitis E virus genotype 3 in The Netherlands. Emerging Infectious
Diseases, 15(3), 38 l.
Savichtcheva, O., & Okabe, S. (2006). Alternative indicators of fecal pollution: relations with pathogens and
conventional indicators, current methodologies for direct pathogen monitoring and futwe application
perspectives. Water Re se ar c h, 4 0(13), 2463 -247 6.
Schill, W. B., & Mathes, M. V. (2008). Real-time PCR detection and quantification of nine potential sources of fecal
contamination by analysis of mitochondrial cytochrome b targets. Ewironmental Science & Technologt,
42(14), s229-5234.
63
Shanks, o. c., Atikovic, E., Blackwood, A. D., Lu, J., Noble, R. T., santo Domingo, J., ... Haugland, R. A. (2008).
Quantitative PCR for detection and enumeration of genetic markers of bovine fecal pollution. Applied and
Environmental Microbiologt, 7 4(3), 7 45-7 52.
Shanks, O. C., Kelty, C. A., Sivaganesan, M., Varma, M., & Haugland, R. A. (2009). Quantitative PCR for genetic
markers of human fecal pollution. Applied and Emtironmental Microbiologt, T5(17),5507-5513.
Siefring, S., Varm4 M., Atikovic, E., W5rmer, L., & Haugland, R. (2008). Improved real-time PCR assays for the
detection of fecal indicator bacteria in surface waters with different instrument and reagent systems. Journal of
Ll/ater and He akh, 6(2), 225--237 .
Sinclair, R., Jones, E., & Gerb4 C. (2009). Viruses in recreational water-borne disease outbreaks: A review. Journal of
Applied Microbiologt, I 07(6), 17 69-1780.
Sobsey, M., Khatib, L., Hill, V., Alocilja, 8., & Pillai, S. (2006). Pathogens in animal wastes and the impacts of waste
management practices on their survival, transport and fate.
Stewart, M, Cooke, J, Dad4 A.C. (2017) Assessment of ecological effects on the receiving environment associated with
the discharge from the proposed membrane bioreactor wastewater treatment system. Option l: Treatnent of all
wastewater generated by Te Kauwhata (current and future), Springhill Prison (current and future) and the
Lakeside development. Report LDLlT0I-FINAL, Streamlined Environmental, Hamilton, 168 pp.
Stott, R., Davies-Colley, R., Nagels, J., Donnison, A., Ross, C., & Muirhead, R. (201l). Differential behaviour of
Escherichia coli and Campylobacter spp. in a stream draining dairy pasture. Journal of Water and Health, g(l),
59-69.
Takahashi, K., okamoto, H., Abe, N., Kawakami, M., Matsuda, H., Mochid4 s., ... Yamamoto, K. (2009). virulent
strain of hepatitis E virus genotype 3, Japan. Emerging Infectious Diseases, l5(5),704.
Teunis, P., Ogden, L, & Strachan, N. (2008). Hierarchical dose response of E. coli Ol57 H7 from human outbreaks
incorporating heterogeneity in exposure. Epidemi olog & Infection, I 3 6(6), 7 6l -77 0.
Teunis, Van den Brandhof, W., Nauta, M., Wagenaar, J., Van den Kerkhof, H., & Van Pelt, W. (2005). A
reconsideration ofthe Campylobacter dose-response relation. Epidemiologt & Infection, I 3 3(4), 583-592.
USEPA. (2006). Water supply: National primary drinking water regulations Long Term2 Enhanced Surface Water
Treatment Rtile. Federal Re gister, 67 (9), l8l l.
64

USEPA. (2010). Quantitative Microbial Risk Assessment to Estimate lllness in Freshwater Impacted by Agricultural
Animal Sources of Fecal Contamination. EPA 822-R-10-005.
Wu, J., Long, S., Das, D., & Domer, S. (201l). Are microbial indicators and pathogens correlated? A statistical analysis
of 40 years of research. Journal of Water and Health,9(2),265178.
65
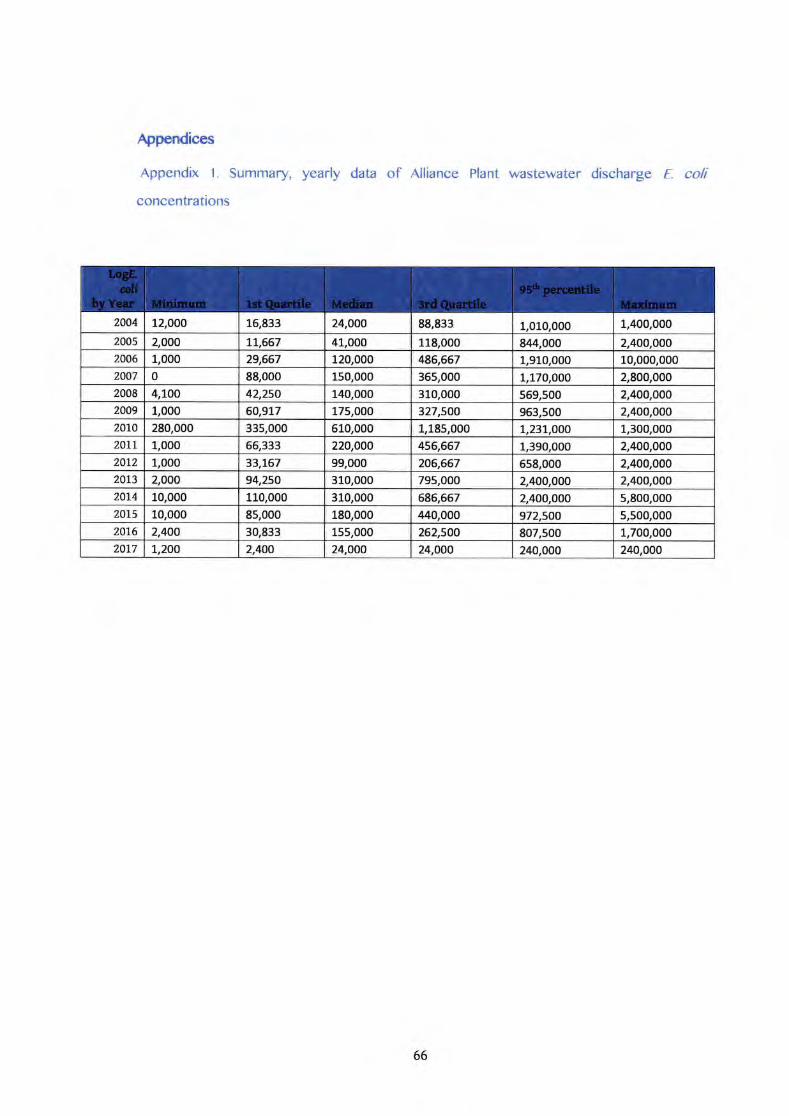
Appendices
Appendix l. Summary, yearly data of Alliance Plant wastewater discharge E. coli
concentrations
2004 1e000 15,833 24,OOO 88,833 1,010,000 1,400,000
2005 2,000 LL,667 41,000 118,000 844,000 2,400,0002006 1,000 29,667 120,000 M6,567 1,910,000 10,000,0002007 0 88,000 150,000 365,000 1.170.000 2,goo,ooo2008 4100 42,25O 140,0o0 310,000 569,500 2,400,0002009 1,000 60,9L7 175,000 327,500 963,500 2,400,00020LO 280,000 335,000 610,000 1,185,000 1,231,000 1,3oo,ooo20tt 1,000 66,333 220,O00 456,567 1.390.000 2,4oo,ooo20t2 1,000 33,167 99,000 206,667 658,000 2,400,0002013 2,000 94,250 310,000 795,000 2.400.000 2,4oo,ooo20t4 10,000 110,000 310,000 686,667 2,400,000 5,800,0002015 10,000 85,000 180,000 440,000 972,500 5,5oo,ooo2016 2,40O 30,833 155,000 262,500 807,500 1,700,00020t7 7,2OO 2,400 24,O00 24,OOO 240,OO0 240,OOO
66
Appendix 2. Additional notes on zoonotic pathogens in animal wastewater
Bacteria
Several bacteria species and genus in animal processing settings are classified as
potentially pathogenic and hence present risks to human hedth (sobsey et al., 2006). It isimportant to note that while these pathogens can cause infections in both humans and
their animal host, some are only present in their animal host as normal flora and do notcause infections in animals. However, when wastes containing these pathogens are notproperly managed, they could be transmitted through environmental media (soil andwater mainly) to human hosts where they can initiate diseases. Among these, of particularconcem are those which could be transmitted through ingestion of contaminateddrinking water, for example, Campylobacter jejuni, pathogenic E. coliand Salmonella species.
It is thus an important public health consideration for the discharge of untreated orpartially treated animal processing factory waste containing elevated amounts of thesepathogens (craczyket d., rggg).
Campylobacteriosis, caused by Campylobacter species, is the most common human bacteria-related diarrhoeal illness in New Zealand, as well as in developed and developingcountries of the world (Lane & Briggs, 2ol4). elthough seldom disease-causing in animals,Campylobacter infects most warm-blooded wild and domestic animals. Humans becomeinfected through ingestion of contaminated unpasteurized milh drinhng water, orundercooked meat. Infection rates in New Zealand have steadily increased since 1980,
peaking in2006 at over 15,000 notifications (Baker et al., 2072). While the incidence ratefor Campylobactcriosis in New Zealandhas reduced since 2016, the current incidence is still1.5 to 3 times higher than reported incidence rates in Australia, England and Wales, and
several other developed countries (tane & Briggs, 2074). nlthough previous surveillanceefforts identified poultry as the primary source of human disease, other animal sources
such as sheep and cows account for disease transmission, probably due to environmentaland occupational exposures (Lane & Briggs, 2OL4).
,l,lthough E, coli are normal intestinal flora of warm blooded organisms, pathogenicstrains of this organism, which can be present in high concentration in animal feces,
when transmitted through wastewater can cause human diseases. E. coli can bepresent in human and animal feces at concentration of about 1 x LOe organisms pergram. They are also present at high concentrations (up to 1 x 10e per 100 ml) inmanure and other animal fecal wastes. Pathogenic E. coli strains such as O157:H7 tendto predominate intestinal tracts of cattle and are fecally shed at high concentrations.This explains why they may be abundant in the manure from these animals and inenvironmental media (food and water) contanminated by them. Globally, infectionscaused by pathogenic E. coli strains are a major cause of public health concernbecause of the potential for human infection and illness from fecally contaminatedwater (tlewell et a1., 2010). In New Zealand, infections cased by Shigga-toxinproducing E. coli strains has been documented to cause infections (Leotta et al., zoog).
67
Another important human pathogen that may be associated with wastewater fromanimal processing factories is Salmonella species. The human infectious doses ofSalmonella can be as high as ,105 organisms or as low as only 10 cells depending onSalmonella species, serotype and strain (Clynn & Bradley, 1992; Mintz et al., 1994), Infeces, Salmonella can survive for up to 190 days at room temperature. In manure, at 10
c , it has been found to survive for up to 140 days (vtitscherlich & tvtarth, tgaa).Salmonella inoculated into cattle slurry were observed to survive for 2- months whenstorage temperatures were ZOaC or less (Jones, t976; USEPA, 2010). Improperlymanged wastewater could thus potentially contribute to the spread of humansalmonellosis through ingestion of fecally contaminated drinking water duringrecreational activities.
Salmonella outbreaks continue to occur in developed countries globally. In NewZealand, it is the fourth leading notifiable disease. It should be noted that not all thenotifications are necessarily due to consumption of polluted water because, unlikeother bacterial infections, Salmonella transmission may also occur between people"either directly by the faecal-oral route or indirectly via inanimate but shared objects.
Fungi
There is the possibility of sewage fungus, aquatic periphyton organisms growing thereceiving water environment as a result of the discharge. this is however, not restrictedto the sites downstream of the discharge site. Kingett Mitchell32 previously undertookquantitative sampling upstream and downstream of the discharge and confirmed thatsewage fungus was present upstream and downstream of the discharge. Fungi canproduce endotoxins that have been identifted to be key respiratory irritant (Sobsey et al.,2006), however there is a lack of information on their dose response models. Meanwhile,fungal infections or mycoses from exposure to animal waste are not usually amajor publichealth concern because most fungal infections are a result of exposure to one's ownfungal microflora on or in the body (febeau, Pinel, Grillot, & Ambroise-Thomas, 1998).
Hence in this microbial assessment, it was not logical to analyse for human fungi in thetreated wastewater from Alliance Plant as there is no substantial risks established fortransmission of animal fungal pathogens that cause infections in humans.
Viruses
A wide plethora of viruses are typically associated with animal faecal wastes and manures.These include enteroviruses, rotaviruses, adenoviruses, hepatitis E viruses, caliciviruses,reoviruses, parvoviruses and other nonenveloped viruses. While infections and diseases
31 secondary spread32 Alliance Group Limited (zooa) uataura Plant Application for resource consent to discharge treated wastewater to theMataura fuver, Volume 3: Further Information in Support of Application, ppL-221
68
caused by human enteric and respiratory viruses transmitted through the faecal-oralroute are well documented. The transmission of faecally-associated viruses of animalorigin to a human host is however, not common. Understandably, this may be as a resultof the relative specificity of the viruses to their host (Banks et al., 2OO4;Legrand-Abravanel
etal.,zoo9;Rutjes etal,zoog; Sinclair,Jones, & Gerba,2oogitakahashi etal.,zoog;USEPA,2o1o). It was thus, not logical to analyse for human viruses in the treated wastewater fromAlliance Plant as there is no substantial risks established for transmission of animal viralpathogens that cause infections in humans.
Protozoans
Among the notifiable gastrointestinal diseases which can be contracted throughcontaminated water, Cryptosporidiosis and Giardiasis are the top two caused byprotozoans (USfpA,, 2010). Cryptosporidiosis is an important cause of gastroenteritisworldwide, and New Zealand has one of the highest reported rates in the world withbetween 26'1, and 32'3 new cases per 1OO,O0O population per year (Learmonth, Ionas,
Ebbett, & Kwan, 2OO4). Cryptosporidiosis is caused by infection with protozoan parasites
of the genus Cryptosporidium. Symptoms of gastroenteritis typically last from several days
to several weeks. Routes of transmission are largely from poorly treated drinking water,swimming in swimming pools, contact with farm animals and person-to-persontransmission. In New Zealand, Lake et d (zoog) argued that human cryptosporidiosisdemonstrates spring and aufumn peaks of incidence. For instance, in spring, livestock are
most infectious due to the birth of large numbers of new, and hence highly infectiouslivestock while the autumn cryptosporidiosis peak is related to increased recreationalwater use, swimming outdoor activities and increased person-to-person spread.
69
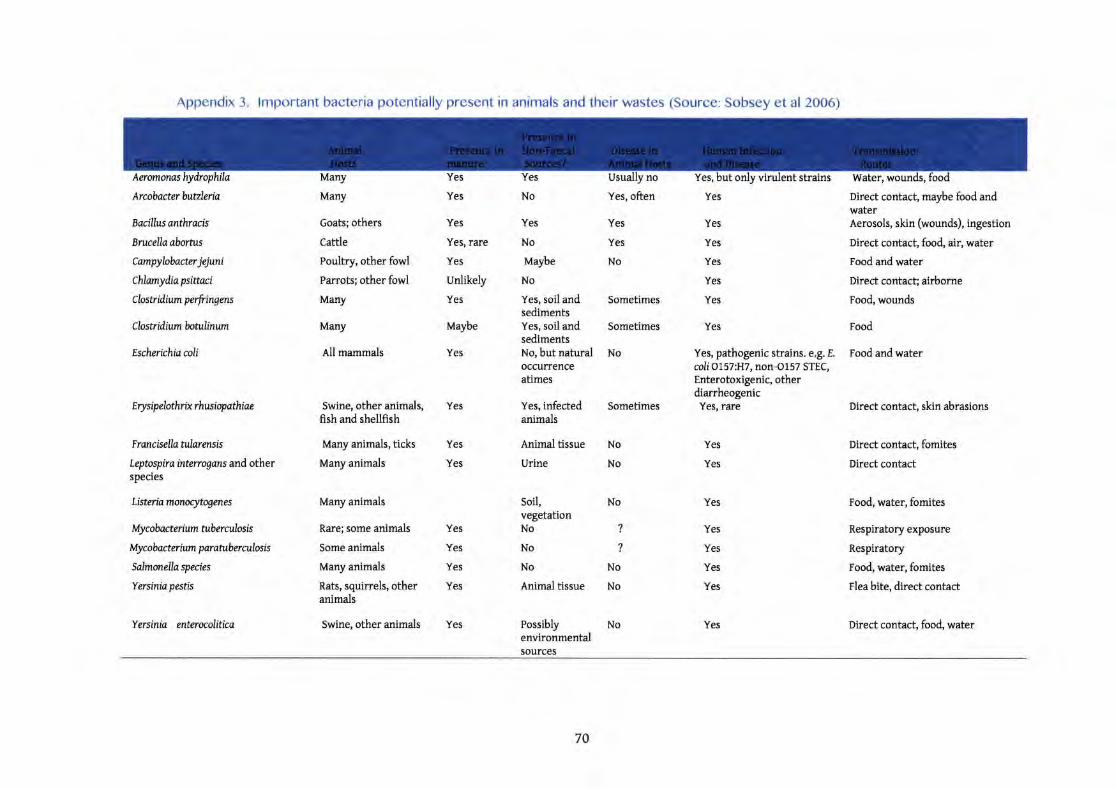
Appendix 3. lmportant bacteria potentially present in animals and their wastes (Source: Sobsey et al 2006)
Aqomonas
Arcobacterbutzleria
Bacillus anthracb
Brucellaaborats
Campybbacterjejuni
chlonydiapsittnci
Clo stridtum p *fringars
Clostidiumboatlinum
Exherbhiacoli
Erysipelothrixrhwiopathioc
Frmcixllanlarmsis
Lepto spira. intqrqans and otherspecies
Listeriamonocltqenes
My cobacteriwn tab er atlo sis
lvlycobacariumpuaubercttlosis
Salmonella speciu
Yrsiniapestb
Yersinia entqxolitica
Many
Many
Goats; others
Catde
Poultry, other fowl
Parrots; other fowl
Many
Many
A1lmammals
Swine, other animals,ffsh and shellffsh
Many animals, ticks
Many animals
Many animals
Rare; some animals
Some animals
Many animals
Rats, squirrels, otheranimals
Swine, other animals
Yes, pathogenic strains. e.g. Ecoli Ol 57 tH7, non-O 1 57 STEC,
Enterotoxigenic, otherdiarrheogenicYes, rare
Water,
Direct contact, maybe food andwaterAerosols, skin (wounds), ingestion
Direct contact, foo4 air, water
Food and water
Direct contact; airborne
Foo4 wounds
Food
Food and water
Direct contact, skin abrasions
Yes
Yes
Yes
Yes
Yes
Yes
Yes
Yes
Yes
No
No
No
?
?
No
No
No
Yes
Yes
Yes
Yes
Yes
Yes
Yes
Yes
Yes
Yes
Yes
Yes, rare
Yes
Unlikely
Yes
Maybe
Yes
Maybe
No
Yes, soil andsedimentsYes, soil andsedimentsNo, but naturaloccwTenceatimes
Yes, infectedanimals
Animal tissue
Urine
Soil,vegetationNo
No
No
Animd tissue
Possiblyenvironmentalsources
Yes, often
Yes
Yes
No
Sometimes
Sometimes
No
Sometimes
Yes
No
Yes
No
Yes
Yes
Yes
Yes
Yes
Direct contact, fomites
Direct contact
Food, water, fomites
Respiratory exposure
Respiratory
Food, water, fomites
Flea bite, direct contact
Direct contact, foo4 waterYes
70
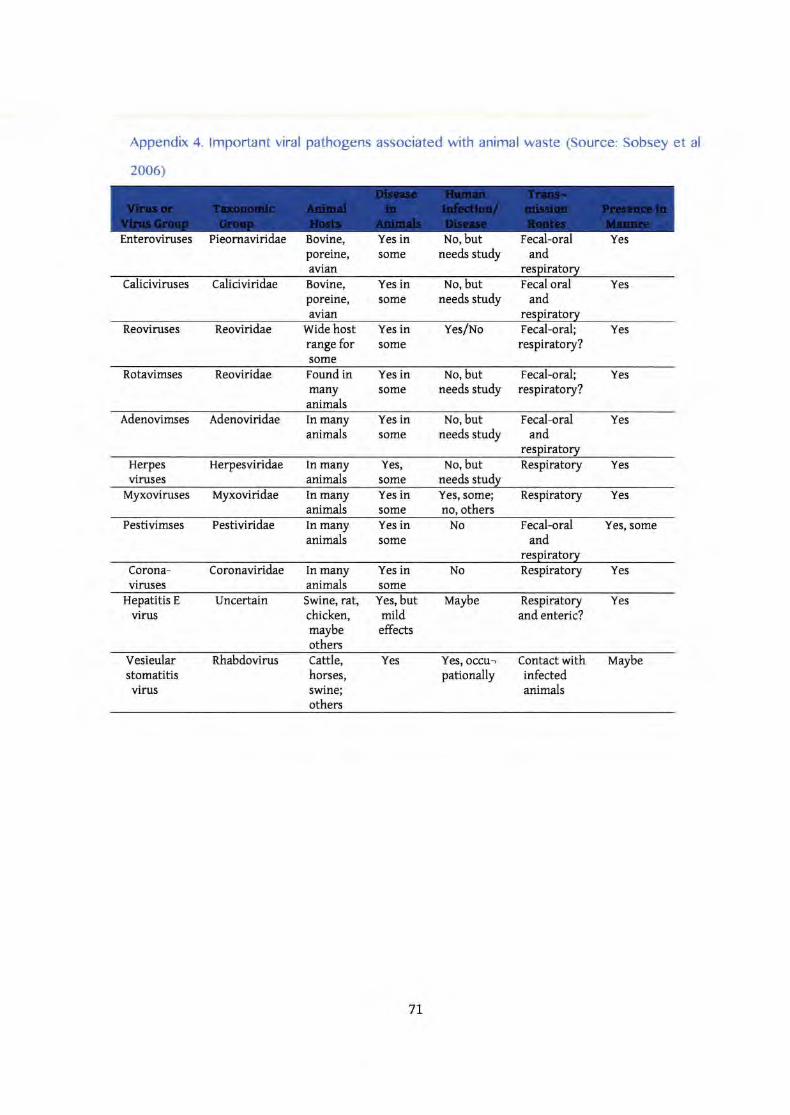
Appendix 4. lmportant viral pathogens associated with animal waste (Source: Sobsey et al
2006)
Enteroviruses YesBovine,poreine,avian
Yes insome needs study and
respiratorycaliciviruses Caliciviridae Bovine,
poreine,avian
Yes insome
No, butneeds study
Fecal oraland
respiratory
Yes
Reoviruses Reoviridae Yes in Yes/Nosome
Wide hostrange forsome
Fecd-oral;respiratory?
Yes
Rotavimses Reoviridae Found inm{tyanimals
Yes insome
No, butneeds study
Fecal-oral;respiratory?
Yes
Adenovimses Adenoviridae In manyanimals
Yes insome
No, butneeds study
Fecal-oral Yes
respiratoryand
Herpesviruses
Herpesviridae In manyanimals some
Yes, No, butneeds study
Respiratory Yes
Mlxoviruses Myxoviridae In manyanimals
Yes insome
Yes, some;no, others
Respiratory Yes
Pestivimses Pestiviridae In manyanimals
Yes in Nosome
Fecal-oral Yes, some
respiratoryand
Corona-viruses
Coronaviridae In manyanimals
Yes insome
No Respiratory Yes
Hepatitis E
virusUncertain Swine, ral
chicken,maybeothers
Yes, butmildeffects
Maybe Respiratoryand enteric?
Yes
Vesieularstomatitisvirus
Rhabdovirus Cattle,horses,swine;others
Yes, occu-pationally
Contact withinfectedanimals
MaybeYes
7l
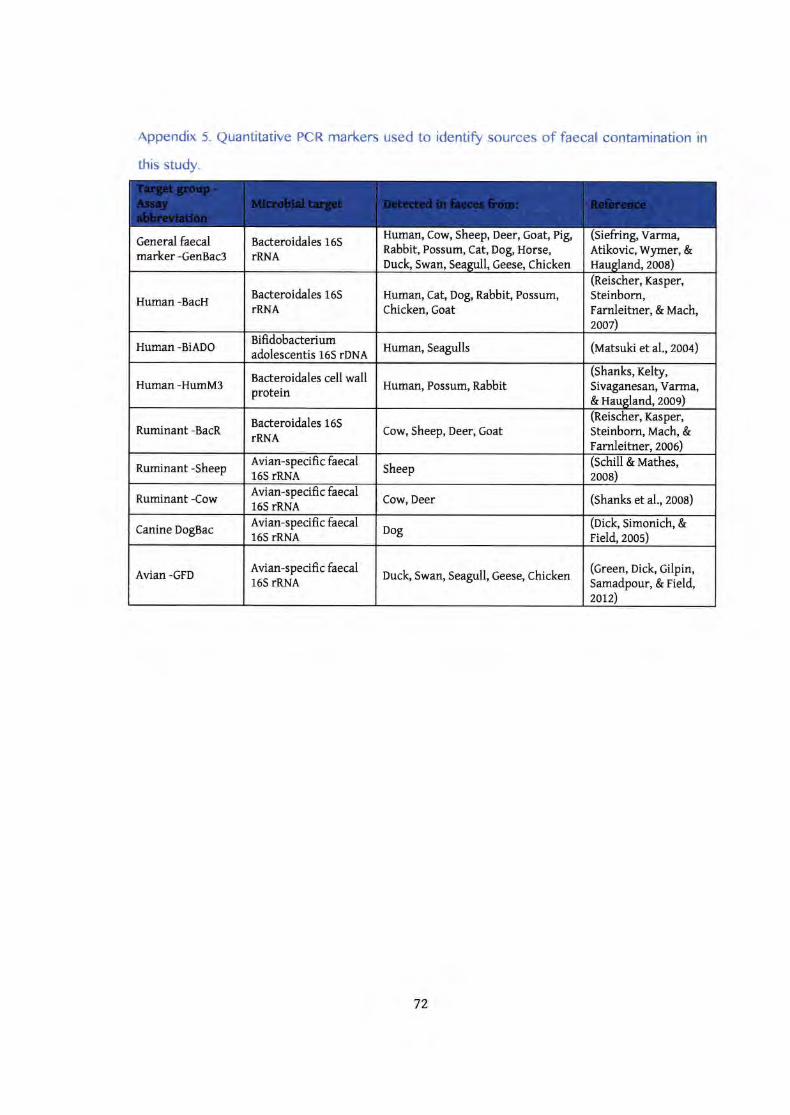
Appendix 5. Quantitative PCR markers used to identifo sources of faecal contamination in
this study.
General faecalmarker -GenBac3
Bacteroi&les 165rRNA
Human, Cow, Sheep, Deer, Goal Pig,Rabbit, Possum, Cat, Dog Horse,Duclg Swan, Seagull, Geese, Chicken
(Siefring, Varma,Atikovic, Wymer, &Hausland" zooa)
Human-BacHBacteroidales 165
rRNAHuman, Cat, Dog, Rabbit, Possum,chicken, Goat
(Reischer, Kasper,Steinborn,Farnleitner, & Mach,2007)
Human-BiADOBifidobacteriumadolescentis 165 rDNA
Human, Seagulls (uatsuki et al., zooa)
Human-HumM3Bacteroidales cell wallprotein Human, Possum, Rabbit
(Shanks, Keltlr,Sivaganesan, Vama,&Haueland, zoog)
Ruminant -BacRBacteroidales 165
rRNACow, Sheep, Deer, Goat
(Reischer, Kasper,Steinborn, Mach, &Farnleitner, 2005)
Ruminant -SheepAvian-specifi cfaecal165 rRNA
Sheep(Schill & Mathes,2OO8)
Ruminant -CowAvian-specificfaecal165 rRNA
Cow, Deer (shanks et al., zooS)
Canine DogBacAvian-specificfaecal165 rRNA
Dog(Diclg Simonich, &Field" 2oos)
Avian-GFDAvian-specifi c faecal165 rRNA
Duck, Swan, Seagull, Geese, Chicken(Green, Dick, Gilpin,Samadpour, & Field,20\2)
72
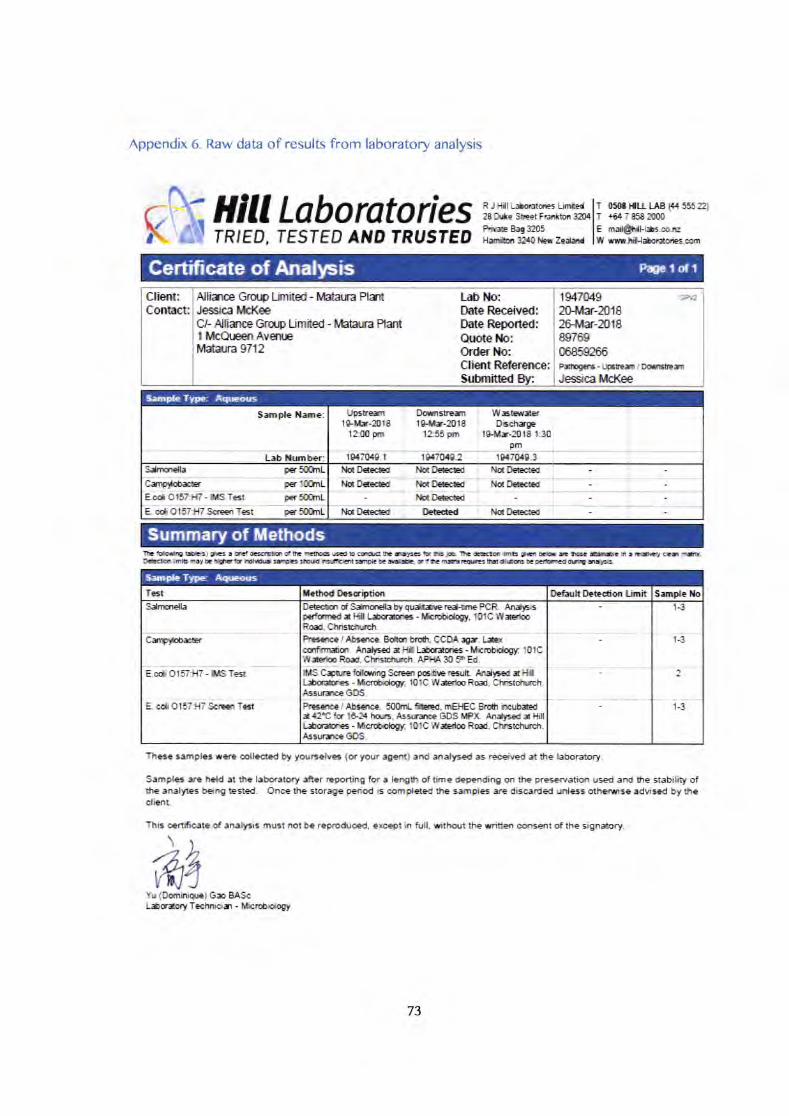
Appendix 6. Raw data of results from laboratory analysis
f\--k'..fo
Htll Labo rato ri es !,,u;trffig.TRIED, TESTED AT{O TRUSTED
Pri# S.9 3405
Hilt't H0l.hzedand
T *i$ lllt tlE t+4 555 221
T +6+78584t00mil$lFl*s-eorzrrr.l*]l*orilsEs.am
EYY
Certificate of Analysis P4plofl
Clbnt:Coiltrcc
Alimce Gru.p Linited- lvbtara PlatJ€ssica IricKeeC& AlimceGrup Limited - Mataua Pffil ilcQtnenAvenrc!ilatara 9712
LS ilo:Orte Received:Oate@orted:Qrote tao:Order tlo:0isrtReftrence:SubmitEd Er
1947I)49 etr?
2SMr-20182GiIr-20188S76Sffi85m66Fdroger[ - tJFteili Ocr6&irIJessica Mcl(ee
$ampte l{ame:
L* lluraber:
Upsf€ilrtsl/h-xlt8
1200 pm
I)*x#errlSllr-2018
1255 Fn
W=ffiDbcfrrge
t9{tr-21118 t:30
Pm1git7x8.31S470aS.t t0{7t}itc.2
Capfob*E.cdOl57:Ffl-ilAT€st -- ry_]-ry|
perStrLnL
E. cdiOl57fl7 ScregrT€3t perSlIlnL
frSlIkrLS*mncfla taaDe*c*dildDcGctdiadDeGc*d
Olts.rrdt'ldM lldD*c*d
iloDerc*dtlotDffi
taotl)etsc!€il
raDerer
Sample Type: Aqreous
Summary of Methods
T:Et fe$od ttEssi*irn Ilrfadt D.b.*ioil Lirnit Slrptc llo
E.cdi O157fl7 - nlsTed
E. cdi Ol57l{7 Sc{E€n Test
s*1wrda
Cag&latr
D€tclisr d S&alca by queiE r€d-tirle PGR' An{Eisperdcnrsd i Hn L*q-aies - msUiAory. totc l/Y#lm
Pre3c'r JAbr€ffi. Bfui Mr, CCBA ryr- L**ctnftrneior. Analfed e Hf L*.raies - if;cnfuSlogg lolCW*rloo Rod. Ctrisdrr*. Ai+{A 30 5e, kl.fitfs Carre lolqlng Screen paiti* result AnqE€o i Hflt*(I?af,= - t*cflbrtogr lOlC WdFRsd- Clristclrrch.AsruraceGOS-Pt€5€tEei A!3€nce. 5ixkrt *red- r€HEc Erdr iH,hfrdt {2'C ftr l&21 fiqm"AsqrnE GOS tt,PK AndyE d -Hillt*afrie3 - fficrilohg!1 tof g W*rl6 Rod, CbEhffir*!.AcsuaceGDS"
Roed, Chrisllrrdl"
1-3
t-3
l-3
Sample Typ+: Aqueous
lE tffif t!a*,|'i E E ! ts*l @ttr dltr 6rrEi Eql b fitd ttt DltrE E !!tDjo5' 1r rltrtil rffi 916 Eb * lt4 *ah-c n ! ct!6, rlu d-E.Ircl(lE lmll nl,E hltlEb lt,rltl rr*r ils,.l llr.f,Ettsoarlc&, r rlE m*tn[latrlt('ttc brr.rairst fE arEE
These samples rere Ellect€d by yourselve5 (or your agE rt) aTrd anil)s€d s recdved rt rh€ laboratory.
Samphs are held ar &e laborBtory aQer reporting for a length of time depending on the preserration used and th€ stabitity ofthe Bnalytes b€arE Ested- Once the stor€ge period is compl€ted Ore Bav|pl€s are ditcarded unles3 otherriEe advised by theclient-
This certificate of analysis muBt nst be reFrodi.rd, excegt ifl full, utthod tE tritrEn oofisent of the si€nEtof,y.
ffi4Yu (Oominiqe| Ga BAScL*arory Technicirl - $Ercb.oaogy
73
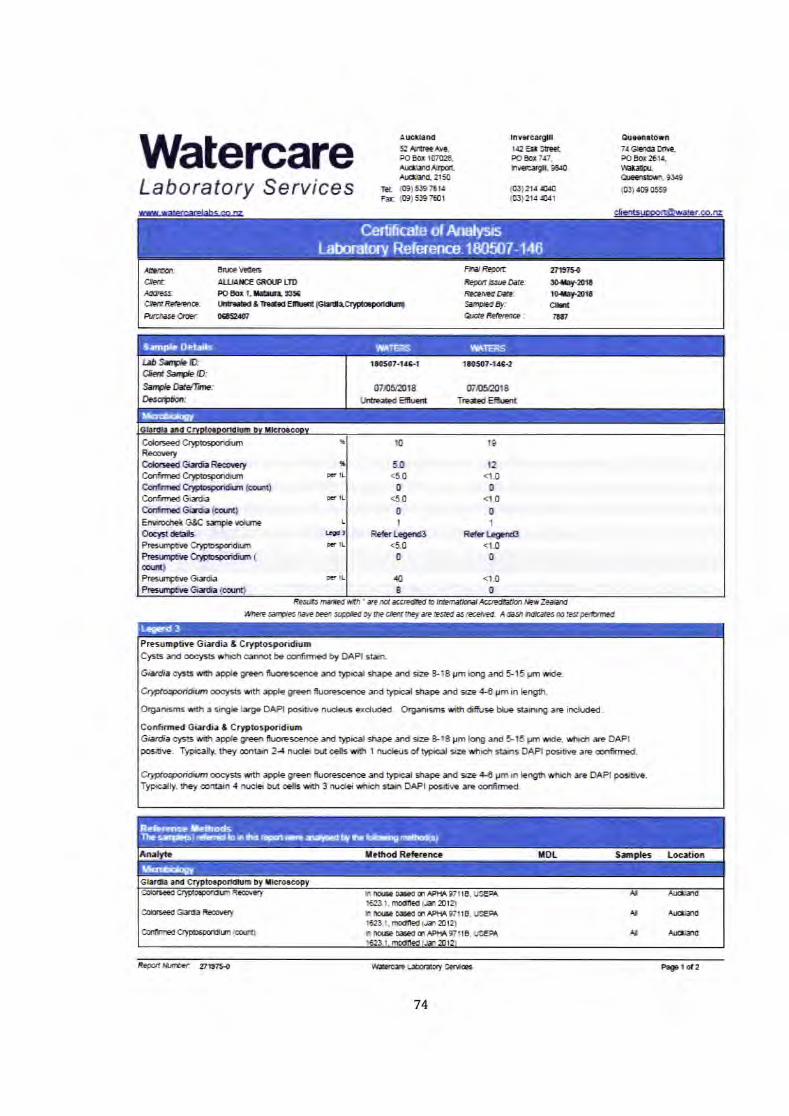
WatercareLaboratory Serylcesrecr.C#eE
A6EdI5QfiT'EEAEPOEC
'OilllaArDr6rllpatAr3Eld'et50
IEt {09)$e76r4re {09}5*7Er
Iruaacqll1t2Ea ste€trc6flZrr,iuecrra, sao
fir,l2r4{.{rSBI!r4{rill
fil.aHbrn74&!.rrfifte,908d261a,riE!*r.rEglEBLE}*ItBll{r9$o9
ArgurrCKj/kt Ers;CErlftEEfleiFtaqrtese CrlF :
mftpatIWtBrrOrElknsr*sanrpndq.q&IEErrne:
zn3r5{sai'zoraro.Gafiaffil',,t
lffidrlfhlEDnl lcm.,ffi4EEE,
ilrelEkltllArcEGENPL'DPO&t.ItG,rBS
Certificate of AnalysrsLaboratory Reference 1 80507- 146
.i9lnlD:CHSiifleDjSr*[Mrr:ncoirkn
t*ta7-ta&., !It!r-{lE{
{I/,Et?,'atttL*dElfllt
lrlIEEDTSTredElgr
Colq=eed Cq'pteporihrnR.oueryCobrrrdBdekfCorftned Cryjo:pcifitnCafl'Ucrlficpcitrn@]QCorfimed Gi*faCortndGAfe$o{Enciunet GtC rlrryle'rofrttOqlli:*Plesulrle Of'o*AAirnAslpf=ffim(6il)ft=urpinCf#iaPrreut6: Crdr {m;al
F'L
t
FIL
IL{t!FtL
IF,I
sJt€.0o
<5.0
0t
kl.rgsrd<tr00
l?<1.0
0<1.0
0'l
F*t-cgltA<1.0
0
loI
{1.0o
to r0
Sampl€ 0elnils iIAIEFS ITATENS
ftsrltsrt :ir*r'nPrHhrE? sdnFrs ,ra*E Daar s#d !y f,re ctil Arf ere E6Ed a5 ,E6g!,Ed ,i 6dr ttaH6 ,B tEtf pdtnEd
Pr*rilplive Girdie I Cryptospor*Iunq,* ardeylstiutidr carrEt beoorfttrEd by DAPI rfirrC*rd; cll5ls rith apple grecfi firoescerr rld tfad E rEpe srd dp &18 Im krg a.rd F15 lm *de.
Ca,ptlcqporrid'in mel* uith *le gr€en ilusesceooe arld $icd slt+ Jtd dze if6 ym in hngilh.
Oqerisrns rth a shgh l8rge DAPI po,dtive nuders exduded. Orgsris.rE *lh.r!ir- bf.€ stiir*U are inclded-
Confimcd Gbrdi. I Crnbsf€idtunrGailda elEE rdh apf,e glE€n firqEscere {rd typi}d ErsF ard da 8-!8 pm lang ad &!5 pr *de, {,ti.rr ere DAPIpclre. Tyf*Sf. ttey aont* 24 rlt clei h.t ccls rith 1 il.rcleus of tlt*:al dr rfii* $*rs DAPI podtii,E are qr*rned.
q?fo{fp,**n ffi.f* uith ryle gr€eBArore6sloe arrd tyfxlal sfi*e &d d= {-6 gm in bngth *ri*r re t}APl podt r/e.TypacJly, fiey 6rr:in rf il.cl€i hrt odls *fI 3 ruei€i *rl*l dai! DAPI Fosait/e sre cgrfimed.
Legend 3
f&dtodR:ftErct g)L Locethn
Ghl.8iltffislwiluruffiI
cifseedgilrb iucolgy
cml'IlEd ffylt6po,tfin! 4cofil
ll' tn,e DEBIs!PtncrllB. u3e1,6i!3.r, mdled (Jil 2o1z)h,BE led O'I AP}iA g,tlB IJBEPNI
1623.1. mo.ned 15t 2014h lflrE Bt (nptlA yiflE 1J9E9At61t l. troalts t rEt lrlir
H
AT
lt
A.ETrlO
AIl!,x'
AEild
Refurmcs lttetfiodsThe gru.tsirulgmd ls rn trE. rspft tffe *ilVi€d by freio$aHrng meatEdlgl
f,EE*Lakiof? *nfGffirrfrtto!. ,,rti?!'a
74
Pr0Dr e'2
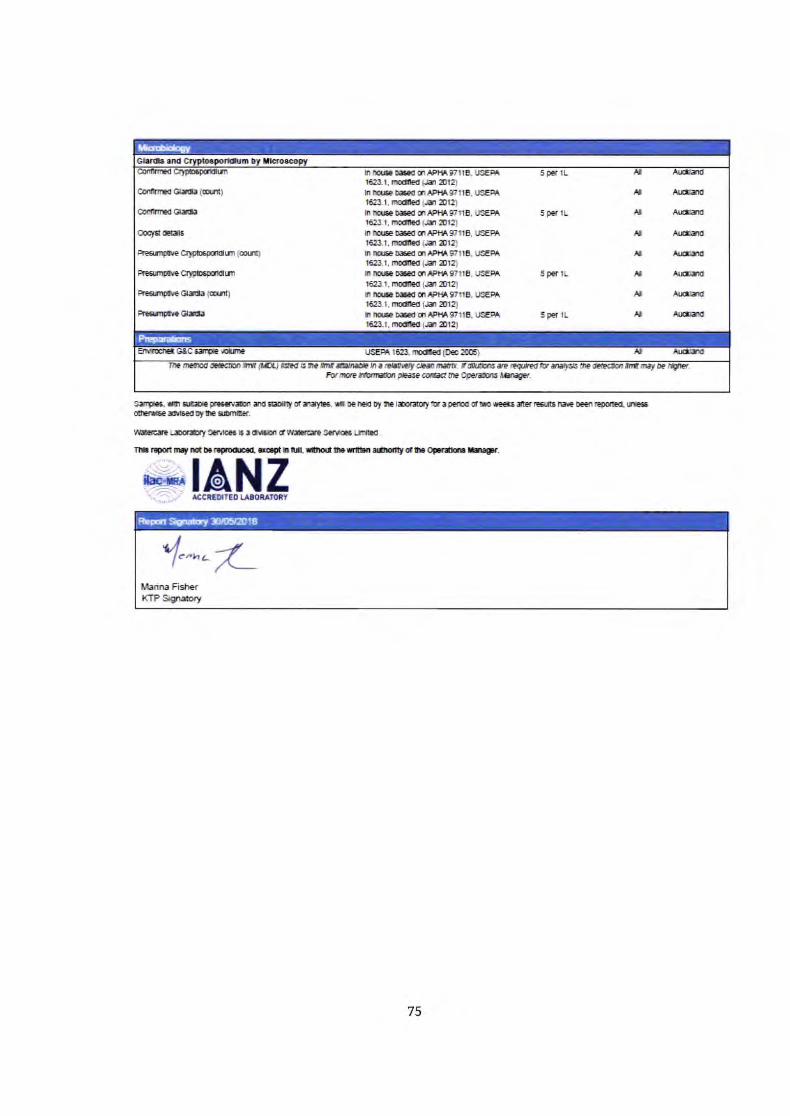
ror\
NE
z1<Erffii':
IIlfiTuTlrItTT
IiIIF
.;I
I H
I
IEI
tEi
EIiI
ffi[iriit
BtBIgfiEEIItrlI;Elr,!EilII!EEIEEtBEI IET$$,!
EIIo EIIIIE
IIttrlltttfiu8$$$
EiarddE
iciE
^BE
'hgBE
h EH
E"B
E'
H{hfh{F
IhfFfF
ititilEtitE
tr
riiilr[f; iiiiIg!E
!gIE!eIE
!E
EE
ffEsE
[[r
JlE
Jlo
)In
JB"
h
6tFIEd
FY!oI'o-
FtIbi
{.ts\
*t
-I#f,tF,E
o.
*E
*CI
(l,ilEtbEC^
Idrrt-
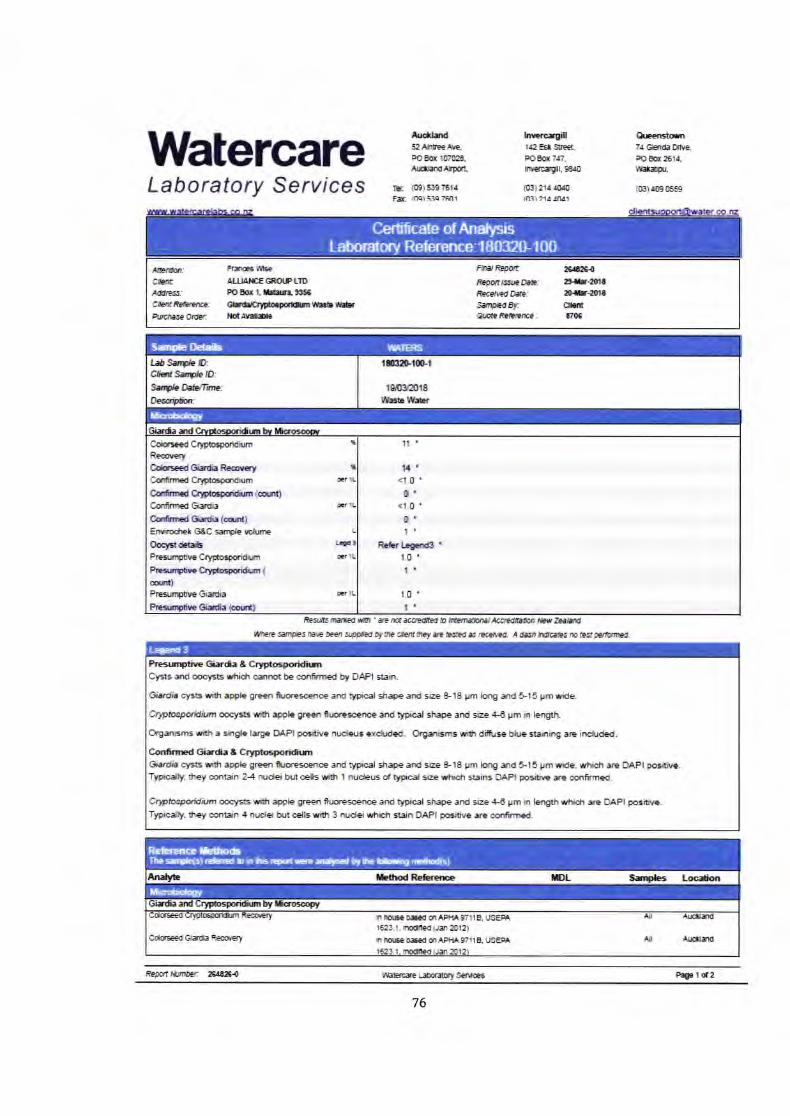
$ F; o ts gl T o
l-' o U o 0) o e h o \ s. o $ b
EH
frI
{$fif
i
AE !E
XH
HI
ufI
Bf, !E il$ 3d g I I E
$$n*
g
IiiE
*
, I
flnH
$$E
'F nlllI El'
B) (t o a^ :lo <a n> Qd
O
n'fi$
u$$r
i$$,
$$
Tl
I
$Es E I
$c
$ I 6
bA
A-E
)-C
!al
..€.8
--
r a r <8
{, n 3 It (D r D D I n1 io
E$t
EH
$[$
iltE
E$l
lfl[[l
Etf;
$}1T
* F
T E
$E[$
EE
[[ I f
, fl
iE$r
ird
c
E d
'r9
i
i I
r; $
E g
frt
f 'l
qlD
e
0
1* r
til r
o f B E. r
I'$ if, ri 3H fi. I t* *r ig ot 2d rfr rf,
Ilr sfi
BI
E{
rH IH gr il: r E t I fr B ! E !D
# e
F;E
ii [
.-'E
$f*r
lclc
fEbE
utE
$E
s.E
s:i t
.r!
CC
(o6 g9 >
! EE TI
d e t ff I $
! t E C I I
l r t !
r# 3r ril ffi r$ gil
u q t dl s l[ i B d { r I * I G 4 E. ;
I ! I I
il i a d 3 ,i t H a R a I $ I H t E
= T I i I t E f; c r $ a I I r fl I I > I $ t a E x fl
t I E s I fl { t
! q\
F\
N
NE
z1€Hrtffi
If,tI!ITItIIITITtEt
E#Etf,!,
lcTf;T5TIEEEIff,3R!IIfE[,EI
IHf,f,E
I
fI
$EIIIIIfi EE
EE
EE
FE
EIIIIIIIII?ltr?llllfifififififi
ffffff
ggggEE
E'h 0'h E
'h E"s E
s E'B
E'
A{R
fRfR
fRfR
fRqtitE
tEtItE
tqE
iEiE
ititiEit
:t:t:il:il:'fi:il:'E
:f;!UIE
!f;If;Ifi
frrg$[F[$
:!.n
)IJI
)l'f,
TfE.Jo$6EaIfEEoIEr BIII
fi:,gaE
ai{hIt !E
iE:'t:fl!fl
IFIIgt$TEstEIttlrtEIttI$IEEp }
.Y)
sf,E
I
4i(,clrJ(,b6aitra"i
qIdd
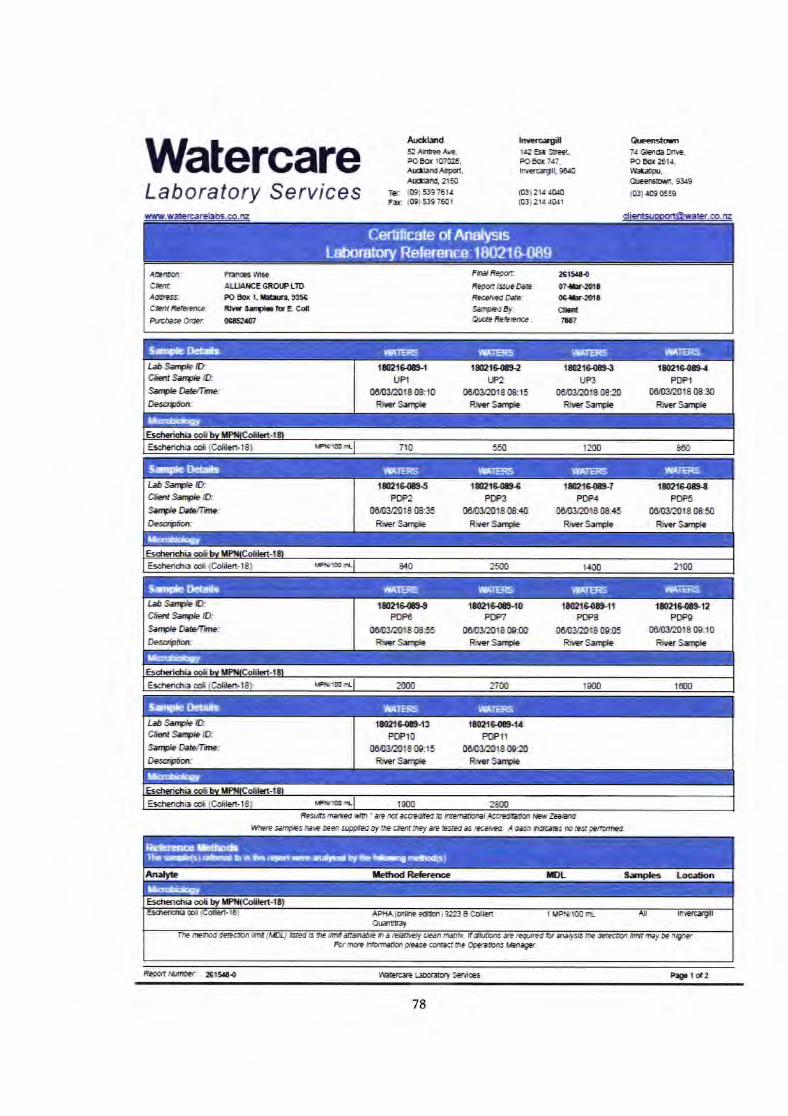
WatercareLaboratory Seryices
Ar#rd5A*riEefriqPOEq 1'I?IIEE,
ArS1i,lPalAre!(l?l5O
rEt i09,!illg?614FE fiBlSXl?60t
rrcrf,,{€ EtStE LpoEa 7aa.hralE gfl Sao
@1fi.d0a0p3)4. rorl
Q::ndrrrTlGtnrhE nE,FOM2tt4,lErryrq:crEar! sli*)
lrEl4!9658
/lllaEr'ClntIrtrnsr;cbtfidlfEtreHrrBECffi
Fliilrifta!I.I,IA'G€€ilIPLID90ur.tEr1|l153Drtlil.rtecotHt&
FErtpotfrpqtlsq,tm:EdltdDrE'Sa,rftdllr:fldEtllrlEr:
2sr5a?0rII-2'ttaI-:tttCT7lllt
Certficate of AnalysrsLaboratory Relerence 18021 &089
IsSrrpbDCHlhrybD;SalIMm:DEoiftr
fItSGttFt
ffir*r1l$BJofuSirrldE
tE SS.2lf't
S,G}!trt808:15tus.de
IEIG.G€LF3
m&HIlt8{8g}tuSi'?b
rrar6G4PTPT
00lGtf,Ol800:An
E.arSrnC.
ErcheritE cot {Cdtert-18} tflfEr* 7$ 560 r2fll gl
Srndr Detals fdATEH! ',IATERt ,llA;ER:WATER!,
lrtsctrclrgy
LJSTGItCftdSrrb[):$O*lre'OaoilCor
tp!855PDP'I
&rct&I,l8(856tuS.rdr
r&r6caPTFTI
ffi18tril1t808:il0RkSrrd"
IEIGGTffFr
06ffir!n8{E15RiErSrnpb
,Er3atttFTIPS
ffifflars08salmffS4.
Esctsidrb co6 (Cdfert-|8) lflY$ ra Br{, 25fl' t400 2100
s:I'tde De*alg 1#AT€P!'ffATEP:, iTATFRS IYA;ET:
Mrroorclogy
IrS-rytIr:CfrtSrphtr)SrybMln:mollAr
tr{9GaPDPO
{nltBtznS{EsaituSrr!ile
t&tcGloPDP'I
EnnIilr8mflhS-rde
rEt6allrP['P8
mfiHrt$oesRif,rSilpb
tefiGrzPOPS
00t$ut0180&t0nhnrSilFL
EcclE id[. col (CoE€rts|8] Itilld nt zm 27fi rgm Itrrl
SnnDae Detarls I.IATEFS WATEE5 WATER: YSAiER:,
Mruotroao€y
LiSrrFLIlCFtSileeSrSIhrc:OeiA-
lEll,G{tFTPlO
ffilEltrilll8{E:15EEr3."!e
tElSGraPtP'rt
00rBrIrI8{PA,kS-de
Es{$eridlE coi {Cdert-t8} Fr1Ert tflr) xn
$ilnpte Deta{s '.tATERs IITATEFT
Misobrdtg!
ft3rE tu-*rf l.fi ' t" tfr x@(M b rrBtraahl&rrEotildrrBBrffntcf*s1?Esila*t€rn&{preirn7&e6Enagsr.?EsrasrEEei[d. tdEnh.lEal3 ]t EsllErunr4
H I[ LrGJo.r
I [l-clErff{
Fo' inoe ltilaihr FEE! csiact Ac QG*.n tlrrtlr_e
ReErerce ktho&I|re sanrcldsr reftrreo b rn fis Epffr sE aodF€d by tllrfuil'oilalo netilodis.
ltlsob.oaogy
lstmn l-etrers.rrreGEpdrJ*nroer: 2lil.|{
78
tilr I or2
o\r\
NE
=1
@H
It#r.i+
tttIIEIITtEI
xIITfiETItEtn!FTtiIII$fiT
T$EF
'
fiilirfr x
q[r
9,'C
i!rr",t-frbb(:lrrBo0:
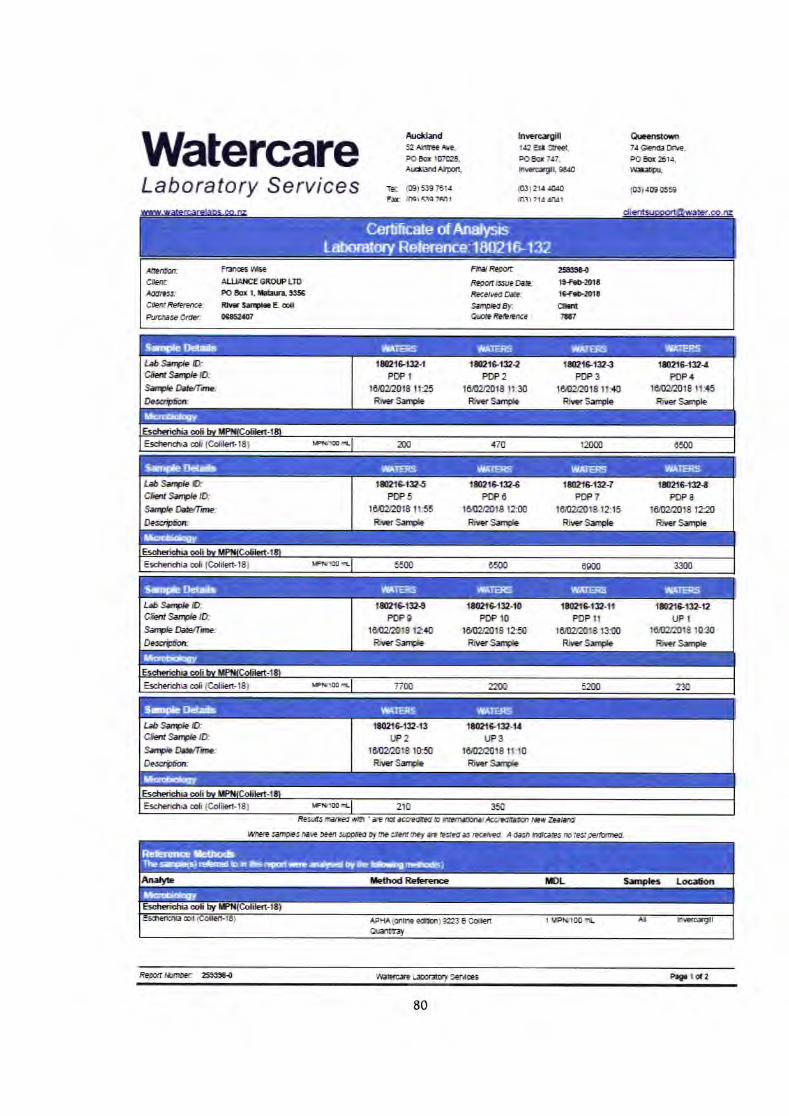
WatercareLaboratory Seryices tr {09}s}9761a
FrE ltlqr aTl ?f,nl
trc5ad52flrlleAr!.POEq rgrEArlarEAlfl,
lrrrtrgflltz Elrft€tPOBT{7.Itt,l,Erylt$a0
(0lr) !1. {O'lO
flTil fia d,ldl
fr:er*nTitGglrbtlfrre,PClE5t4.r{r*r(B)rc}6*r
luDrrarcBttrq$l!t*t'eE*ffigFrt dre*Ork
FrffiU*eATI.IA'TEGTXIPLII'POtut,ts'r'SSllr,flrrFbeorffi#
FhrlwrSEpdtArflrecrF:Hr8{lDi&-saryEd6rcOaeEffrlErElEe:
!H{t$f.o{ttt,e.F.o.ittlCH1A
Certrficate of AnalysisLaboratory Reference.'l8U?1 $- 1 32
t&t&tQ-tPTFI
rGttrutor8 rr25nirrSrtpf
rftr$te{Pr2
l6ilEU!il18 ll:$RhrSrdc
telBE.'Ptp3
IflEEilI8 I'ftuSrr7h
rrz'tgt3{PTP4
toGm018 il*6fuSil .
lJST4LD:Cb{Silfts0-3{Hre:
lrl.El rtErcr-ridE cof (CoE€rnI8l an 170 runo flim
$rnple tletadr .J'ATEP:'rrtATER! WATFPS WATEF5
llt#oh.iogv
tiSrpLllGts{SrqhD:SrptsIMru:Ocsiar
rtr$rtrsPIIP5
l8ltrlE0l8 tl:SErrS.de
rt{atn6PT'PO
,0rtrl[!0t8 t?fl}hrS.rna
tr3tt6,PtpT
t6l@tll8 i2:t5fuSrt?b
lEtB(naPTP 8
t0,tr!20r8 ra20RhErSnde
I'TETLE#{.col {Colil€rt-18) ffim Glm :i:mEm{t
$rnfle t)aa{* ,&ATEP!, '&AIEF5T,VATEP5 vl,ATEq:
i*cr*d0gv
LiSr*D:Cet{3ilFkD%hHIircOesiaar
rQBrSaPEPO
roiff;trnS t?.ill,FESIUS
Grefil-ilPTTil
ta,IEt!|n81350RhsSrdE
rEr5tt1LltPDPIT
i8@ral$t3tx,tuSil*
lEl3flA€tPl
$,EUD|8roflttuSildr
FlrEn(Escrrridua cof {Cffi-t8) TTIN zfi, 52m n$
$rnp*e fletmt.* ,ITATEE.J rIA'FR::'IYATEHS !t \TE.Cs
l,t{rfuogy
tiSilrbItCfu{SilrbeSr#lMrr:Oasifur
lEreffp-trttF2
rir$Uzor8l&50EErSrdr
trct$to-taUP3
t01tr2tr018 lt:10tuSild!
ItlStE rLEscfrridm cdi {CoHen-'8) tt0 :150
lrnpte tlaads !*VATFRS',tATERT
iftr.edogy
rE trl i.*tE(Gd b ml'nilErrr/E EE&, IEfl AaEA,flrr oagl e{Fd ryute'letmt -r md.'rEeiGd. ./t dlgrrtftlG, fir ESrarff rEd.
E. Loct'm
APtn ((,l'le Ecer! lIgt 3 6€rt
Refurencr tetho{iglhe sarr*igi rEfofiEd i0 o rh* &fwi *{s ildFec ry rrp ltr.ltr{ ,.ltEdtodls
&ffii6gy
lEErcr"t rrEf$elrtc6firyrfirloer ffi{
80
Prgt | '2
@
ItT5ilIEIitIIII
IIITITITEt,l|
!FTtb!8IfEr!f,Tlt!!TI
IFIEgt$rTBrIEIreaxI*riI)tI!ETEI
NE
=1
<E
-T,:"w..(*
tITtIrEIq
5f;E
I
LjLEaI.Edln'
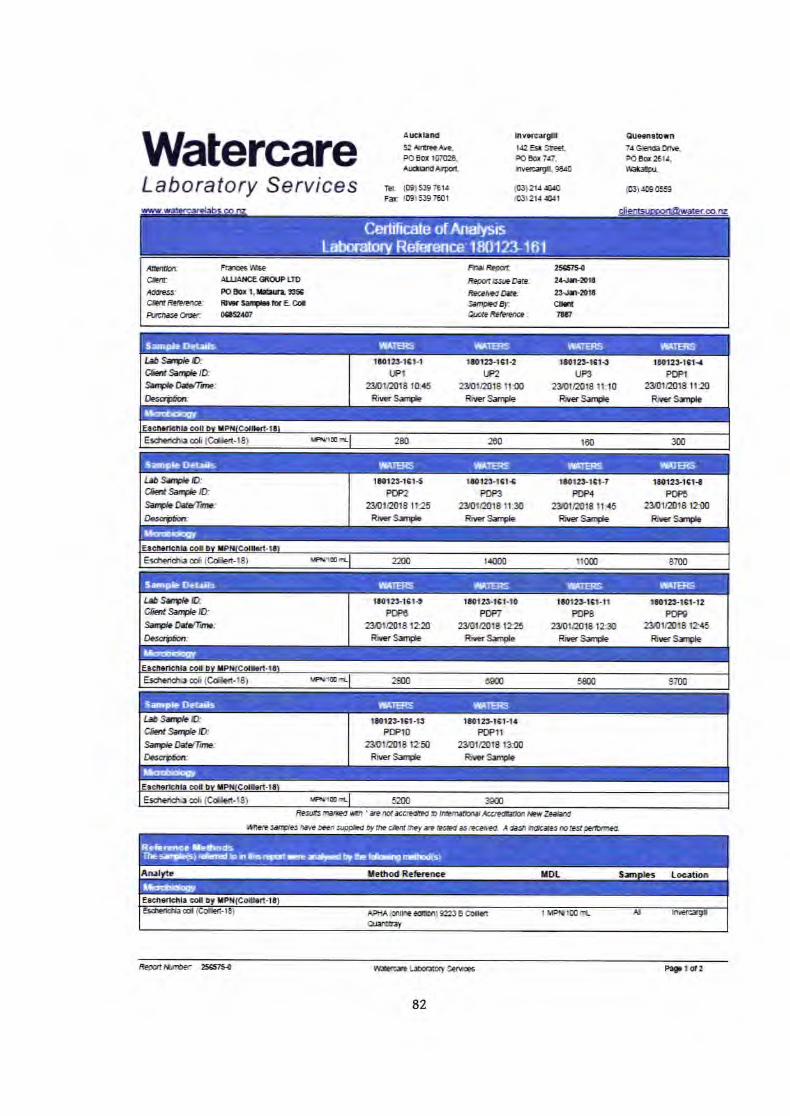
WatercareLaboratory Seryices
al,cttsnds2rtlft€napoEq flrl024Athtr}p.rf
hYrrrllt{2 Ert SfEe(FOm7ar.trlEErlf, SiO
C'riabrtrIit gEf,raOrln,FOEc26ta.ttlil+4
{lI,)trf,la}58I:r (IE)5$76!.Fa iBllii!97C01
(al214{.ol{[ll2fia41
fFssis fie,F{r lar ' lirE rd*EruH D lrirnalErJ/bsrEaElb ^IrnlaEttrnlrsirqBes rE!DGsi at trtd rs rsdrlEd, datr raft*tr rDFdpai?raEd'
/G,fiIcliflLllB6a-€Et/tlkn€Ft rrlire(xr:
FrrtE6ttteArlUlrcEffiPtrDFOBr.krffitllf trl.lrEqtEW
ffirwIEpdrri*roeftsEeltadE*ffidry:{lptfrBsE:
ISIE'2.^l*irlIhlGttcr.,lr
Certificate of AnalysisLaboratory Reference lf|CI "l2}
1 6 I
ilt*fal.tfPr
zlJorE0r6 tci5RiESrde
lrtz!-r3t{w2
zmtnot8tlfiE:rSrrlb
tlatzt-tct.tUP3
ZUlli/!il|8 l!:10RhrrrSrr1re
Et2StCt{PIPT
2EIOT/z,1A rrglRkSilHe
laDSrrplD:CHSr#tr):SryShfrn;
EsdrrirEco[ (&Ierl.l8] ET'IEGt 2Ct 200 Ttrt00
9rmplE Lletarls IIA:EE:. lrtATFRa WTi::P! WATEE:1
$qriorrogty
ttltrltcl{ilm
2g[r,r[r8 il25RiErSad.
trt2!-t3t{PTP3
ey0raotS'nflRfxrSqb
l.lltltsHPtFt
23101fiil118 lt:tl6RisSrtle
lft2tlrat{P[p!i
z3/DrIDrS UtrRiES4e
r.*SilrDCHSiqrpltrgteIMcl
Ellll! nLffiia cofi {Cderr-|8} Zfr l{m lrfln EilIJ
S.amp}? []e1]ils $dAiEP:; WA'IE"5 ,flATEF,g MAT;fi$
[Scn:ooogy
rtcrtltaltP[n0
zrcta$8rt2llRiErSde
tltl}Ll.laWI
zy&{t}r&t225tuSiltFb
t3t2l-tct-rrPIPE
,t,man$ tzf,tuSnqne
Ittatst-t2FtrE
23r0rrDr8 tt{5tuSille
L*Srl*,D:CHSatr*D-.9eSelflr-l
lfitrD il.Esduktra col (Colen-|8) zlr' HN ffi 87m
Samgte Cr+trii5 WA]ER! WATER5.JUA,IEF5 rliF.=Ps
i&cfmffigy
IJ#T}CHSil.f)gr*lbrfia:Oec.rilln
rlrt[-rct-E$PO
zltrt ilto t2gtRiE S.de
lfizltSt-taPtPlT
zlt tEot8 t3fltuSilrpb
ltt$tlll rtEsherk aa cdi {Cd€rt-lS} flm 3Cn
.Samplr Oetarls '/tA-IEei'IXA--:F!
t$trcbtd(4ry
ffi- Le*i.tn
Eaclrfrlcila calAPlt (afi:ermrls223IeaEt I mL
itp gdel5 i .eigred 'r n lhs rEful se Jahred tf tn rDlbrrln$ rtllxdl s r
Refurence tletfrooE
tt*crfridqla
tt6ErrLerit.y s.fiGwft|mler 2rsm{
82
P{rtc2
(v)@
IIItIIIIItt
$TfiIPIIuI!FTIaFlt!fEIrffi!IrI
IFTIIfrEIrIEllIEf,IE!!E!ilIlEt
ffiiEllI T5IIuIl!-u*TxI
-f-U(J)\*s')
[$'IE
:rl9:t,,1rECfhti'1,i?
=tslRPage I cl5
Science for Communities
30 tlxy 20rtg
Ckistopher DadaSfeamlned Erwimnrpntal LtlPO Bol( 7003,HAIIILTON EAST 3247
Emai[ ctrk0etrearlirB<l-coie
Frorn: ESR Chdstduttr Science CenfePO Box 29181CHRISTCIIIRCH 85,1{}
Ernail: taeehourusl$esr.cri-nz
REPORT OI{ FAECAL $OT'Rf,ETRACI(I}IG AIIALYSIS
TtE folkitg srnpbs nerc receiyed on 8! iitay ild l(F May 2()18 and were rrat6ed forfaecd sare PCR maters, ard pslhogeri emmeratin.
ESR Hrn0er Cm Oate SampledReference
Ste tlescrifiion
To:
ctffi't80934
ct8180935
Clm18{)936
ct 8180937
Cr/lts180338
cirB180s3s
7/5/1811:tlOrn
75/181125xn
7lil1811:t0an
915118 1:15pnn
95/181:459n
9r5I18 1-30prn
TW1
R\rl,1
twlTW2
RT'Y2
r,rw2
TreaEtl ltYadarder Dayl
Reeiring \IY#r Dayl
Untreabd ffitemter Dayt
Treatetl Wastarder tlay2
Reaeiving Wahr Dar2
Unfeeled wastemter Day2
ilotice of Confidefiht hformdkxr:
tf lou reeiye tis report h eror, pEse notry the sentEr immediately, The informf,tixlconLdned h this refort is legdly privileged ad csrfxhntial. thauhorised use,dissemidilf rliSibulixl or rcSroildixt of trrts report is profiibfrBtl.
t|Inun 0r ail[orHltt tctncl^tio lButct{txt[Dei!&hrirr sdftr O!nIE A C4yle pod llna Cir6L[^lr 8fi: I pS Bor ]Blil" gtrr!'*'ur.h i$a6, ]afr lr.hrrdT: rBt 3 3518010 P *6{ 3 3$ mm
84
t ,wsrFr F,
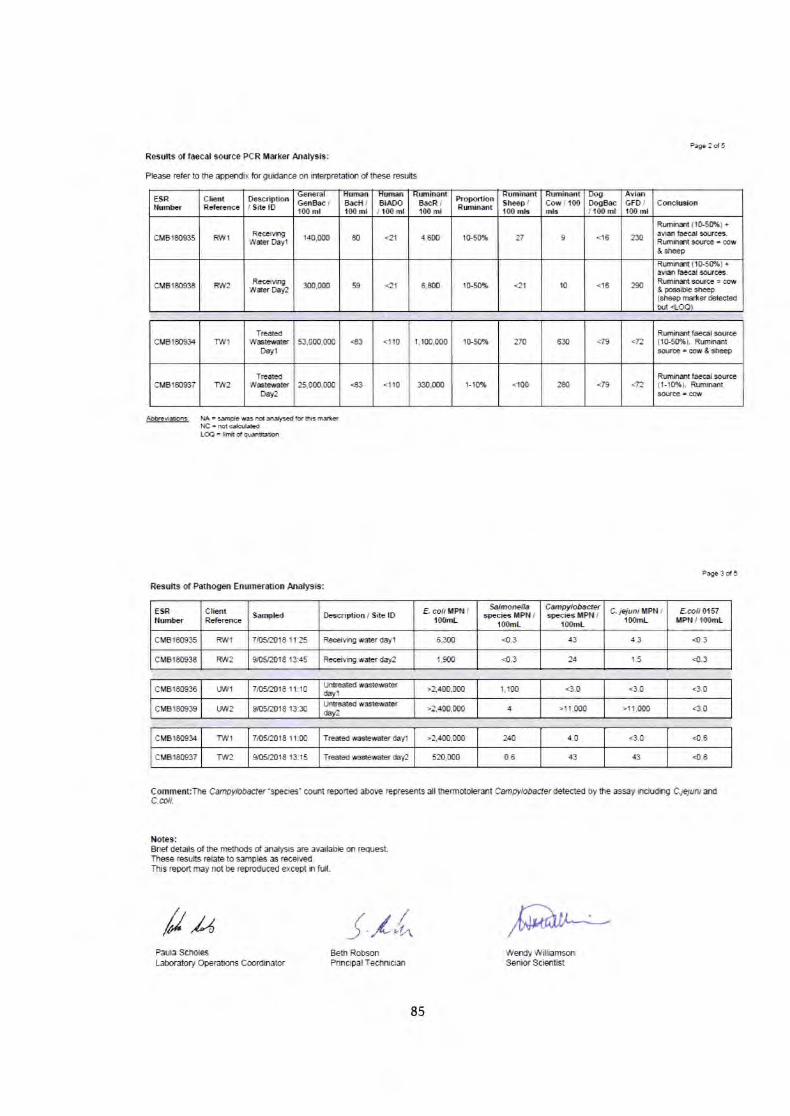
Pa€n 2 ot 5
Re3ults ol taecal solrce PCR lrrker Analysas:
Please reler to the appendix for guijance on inlerp{etation oa the6e resuls
ABar.inbnsl
P.ge 3 o,5
Re*ults of PathoqEo Errrneration Analysis:
cMBr80936 LII,Y1 7!06rfr1811:1O &y1>2,4{n.080 1.rm <30 <30 <30
cM8180939 rJ1'V2 9/05/2018 13:30 dilA >2,400,{m 4 >11.m0 -1 1,000 <3.0
C['8r8093.r T/Vl 7/09!018 1t:00 Treded ErGffiter &yl >2,,tm,tm 14 40 <30 4.6
cr!l8180937 TW2 9/05/'2018 13:15 TrEsHdffiterdai4 5:0.tDo 06 43 43 46
Conmeflt:The Carnpylobxtq"sc,.cles' co{mt reported above repreaeots allthermotolerml C€rrrytobeter@leclPnl by the assay inclul-}g C.Jelunidf,C.coli.
ilotes:Bnef details ot lh€ me&ods ct anaiygs are ayailable m equest.These results relate to samples 6 receiyed.This report may ncd b€ reproduced except h tu[-
HA = 5rnda E nd nrrsad fd t,ras mrt6rc=dc*4&dL@ = trit of qE!trrhn
frta ! /!"Parla Sciol€sL$orattry gperatons Coo{dhalor
Belh RobstrlPrinopal Terhmciao
ESRtlrmba
clicntRcrcrcn€
O&rirtim/ Sitc lD
WmlGaoB* il0O ml
'mnBicH Itoo ml
HllmBiAT}O
.i too ml
HmnffiBtrR /{00 ml
ProptrliflRmiMt
HUmlShep It0O mL
HMffiICtr1100nli
1re9DogB*I 1fl, ml
AYtMGFD /t00 tr{
Cmchrifl
cMBr80s5 R/lr1ReivrE
Wds Dayl 140.(xn 80 .21 4.600 1G50% I <16 Z8Rmisn(l$5{}'.) +
ryifirEcalffB.RmiEtsffe=ffi& slHp
cMBr80938
cME1m93r
RW2
TW-.
RffiivirEWMDey2
TEatedWaETBB
Deyl
3(x,,$o
53,{rcO,m0
59
<83
-31
<110
5"800
1,100.0fr,
1&50%
10-50% 270
10
630
<16
<79
2gl
<T?
(
&E ble3h6p(she€p mfts deteied
{1O5O96i. RataKlrc=cryEslreep
cMBlm937 T\rY2TreaEd
Watemlerwfz
25,000.000 <83 <'l l0 330.000 1-r096 <r00 280 <79Farr*El|bFcdff€(1-1095). R.niErc=ffi
ESRBnsrlcr
ClknrReterence
Srpfed Dffiiptioni Site ID €. co, llPfi rto(M_
Sdrlrorp,lnspeci= lrPt{ ;
t(m_
Cffi,,,o0.(,sspeciE XPt{ l
l0m_C. jetuot flPN I
t{rorn.-Ecoli 0167
IPtl I l(xlmL
cM818t,935 R1,YT z05r:t)18 r1:?5 REivrrq w#r dayl 6_300 <0_3 43 4.3 d.3
cMB!80938 Frw2 90512018 ,3;45 ReeiYrE rater day2 1,900 <0-3 24 t.5 <o"3
85
wendy williafiEonSenix Scientist
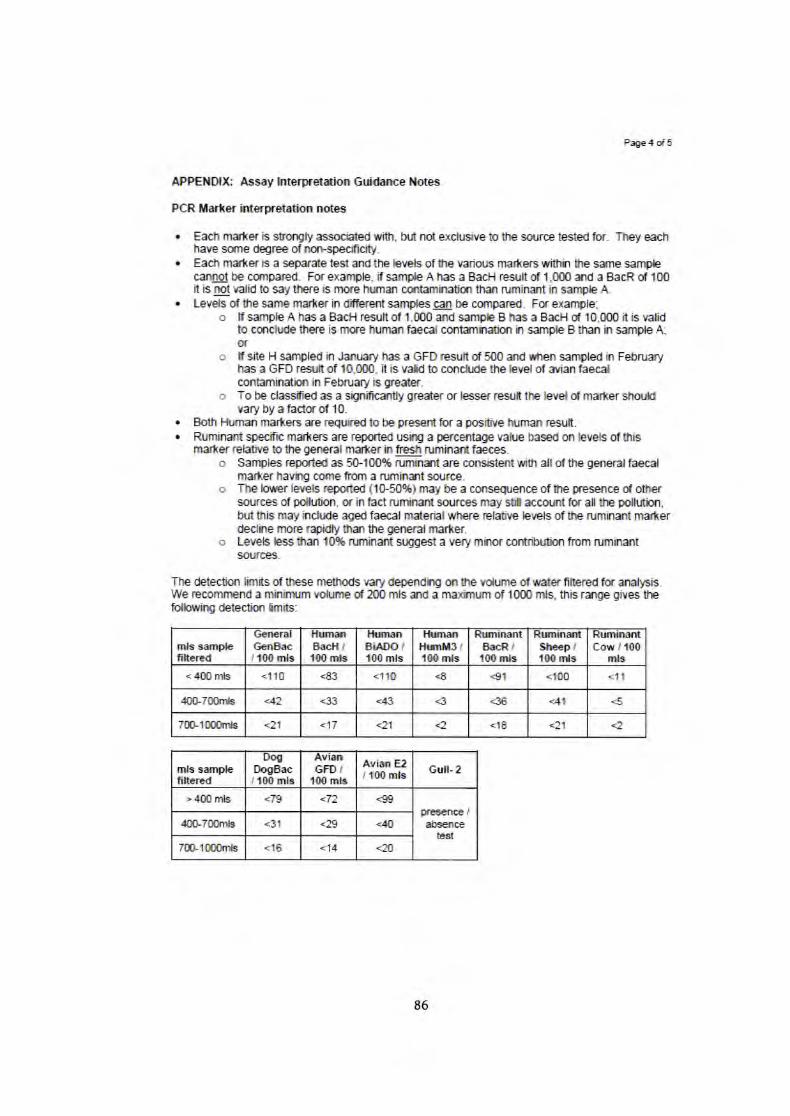
Page 4 of5
APPENDIX: Assay lnterpetatio* Gu*dance ilotes
PCR illufier intef,pretation notes
. Each mtrfier is strmgly associated with, but rd exchJsive to the soure tested for" They eachhave ssne degree of norspecificity,
. Eadt marker is a separate test and the levels of the various rnailers withal the sane samplecanno! be compared. For exanrple, if sample A has a BacH result of 1,m0 arE a BacR sf 'ltx)It b not mlil to sey thefe is more humrr contanination than ruminant in safipb A-
. Levds of the same marfter in dtbrent sampl€s can be compared- Fr example:o lf sample A has a BacH result of l,m0 and sanpb B has a BacH cf 10,m0 at is valid
to cmdude there is more lruman faeqrl cfitamhalim h san#e B than in sample A:or
o lf site H sampled h Janutry hc a GFD result cf 500 and wten sampled in Februaryhas a GFD result of 10,m0. it b valiti to cmdtde the level of ryian iaecalcontamhatixi in February Lr grealer-
o To be classifnd ffi a shnifictrltly Ereater or tssser resut the le\rel of marker shmrEvary by a fadr of 't0.
. Both Human marlters are reqlired to be preseflt for a positive human result.r Rumlnaril specific mafters are reported using a percenbqp value based on levels of this
rnarter rebtve to the general rnalter in fresh ruminrfi f*ceso Sampies r€ported as 5&100% rurninat are mosBtert with all of the generaltxal
rnarter having come trom a ruminant sorlroe.o The lower levels repoderl (1tF5{f,6) may be a oons€quence of tie pese*rce d ottner
sources of pdfution, or in tact rumhar* s(ilroes may str! accu:nt for all tfe polhrtion,hjt this may indude aqed faecal mdertrl wtrcre lelatiue leriels of the ruminant ffiarterdectine rnore rryldty fitl the gefieral marter.
o Levels less than 10% nrr*nant $lggest a very minor cortributim from ruminantsorrrces_
The detectbn lirnits of tfpse m€lfiods rrary dependhg on tfp vdunre of water filtercd fu anatyshWe recomnrend a mhirflum vc[ume cf 2{D mb md a rna{mum of 1000 mts, this rage gives thetullolrhg detecti:n limits.
mls samplefltered
Gcn€falGeaBac/ 100 rnts
HurnallBscH I
100 mle
HrmanBiAtlo r
100 mls
ItllllfltHtrmt3/100 rte
HUml]UmtBacR,rlfi) mls
RUtnmlmSheep /{00 r{s
HumsrantCow / l{Xl
mli<4{D mts <110 <83 <110 <8 41 <100 <11
4{X}-7tnrrts <42 <33 <,13 <3 <36 <41 q5
7IIL1TTIffi 421 <17 <21 z1 <18 <)1 <,,
mlt samplefltercd
lrosIlogl8acI t0O mls
AVlanGTD/
1O0 ml*Avian E2I {O0 mls Grll-2
>4{XI mk <79 <vz .€gpres€nce /abeence
E*4tD-7tIln{s <3'! <?s <40
7m-1OilHs <16 <'li[ <x)
86
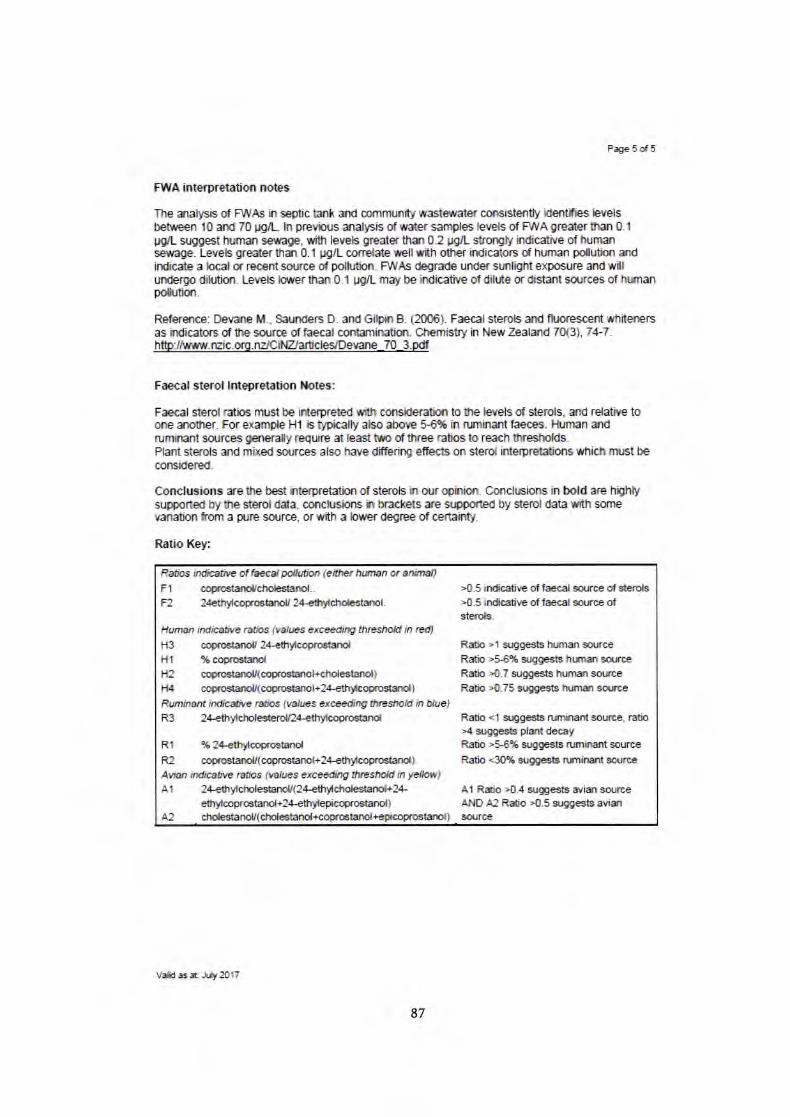
FagleS o,5
FWA anterpretatio{r fi}tes
Th€ malysis d FWAS h septic tarfi and cornrrunly wasteyyater consbtefltly ide*lfries tsvelsbetueen 10 and 70 trS/L ln prevbus anallrsis cf iyater samples levels of FWA greater thil 0-1
trgrl. suggest human sesage, with levels greder than 0-2 udl storsty hdkxtive of hurmnsesaqe- Levets greater thil 0.1 pg/L conelate uell with other hdicators d human pofdim antlirxlicate a local r recent source of pollulin- FWAS {,egrade under sunligfrt expeure ard wllurderqp dihltbn- Levets burer than 0.1 pg/L may be indil:ative of diUte or dis;tflit s(urces of hurnanpotution-
Reference: Deuane M., Samders D. ard Gilftin B. (20061. Faecal sterols and fluoresrcnt whitenersas indicators d the source of faecal contarHnatim" Cflemis[y in New Zealard 70l3l,74-7http:#vww-mic.orq.nzlCil.Izlarticles/De\rarp 70 3.pdf
F*cal sterol lr*eoretathn iloGs:
Fmcal sterol ratbs must be interpreted with corsi$ralixr to fite tsryels d sterols, trtd rdative toorle ;nottler. For exampie H1 is rypicafiy also above ffi% h rumhant faeces. ttuman andruminant souroes gcnerdty require at ba$ trc d three ratb6 b reech thresholds-Plafit sterols and mixed sources also have dlErirU efrects on sterol inlerpretatioris which must becorEidered"
Conclusions are lhe b€st hteryretatiffr of sterols in our ophbn. Conclusions in bold are htqhlysumorted bythesderol dda, condusiom h bradets te sLF@rEd by sterol data with w*evarhtirn from a plre souroB, orwith a louer @ree of certairlty.
Ratio Key:
Refios ffit rr ot fffied poil&ior, (eillrr hurlcrl w anind)Fl oopro€fianoilcffiestanoa--F2 2,lethylcofreEplr24-ehrcholGtanol.
H.lf77E,t iodl6E/tive rarbs {varues exce.edf,g ffiresfioid rfr @H3 copro€tilrcI, 2,|-efiylcoprostaolH1 % coprostanolll2 ooprosttrEt (cop.ostanol+cfioa€ttrEl)
l-t4 o+roetanou(coprostanol+24-ehykoprostanpalfuninant inr,licdiye rerbs {vaL/es exceeding llresfiold in btue}
R3 2a-ethrylcholesterd/2a-ethytcofsEnoa
R1 9|2+etlr:y'cnprctEnol
P cop.o€tdma(coprostano{+2a-etht'coprdanollAuan radrcahre ratBs fusrues exceeoftn€t threshold in ye#ur)
Al ?4dryfcholestanou{24-erycfrole*tano}+2+efi ydcopretmd+?+ethy{epiceproetanol)
A2 dnlestaml/tcfrolesHEl+coprctanol+epicoprwtarrcl)
dl.5 indicalive offaecal solrce or sfierols
dl.S inffiiw of faecal source ofst€rols,
Ratb >, srrggffiE human sarceRatio >5S% srJqge3ts hrrnflr sourceFtstb >{!.7 srrgg€88 hurnan sourceRatb d!.75 sugqe3ts hurnsfr source
Ratio <1 s{rqqE$ n ninant so{rrce, ratb>4 suqqeBts plant decayRatb >5$% suggEsts rumirtrt source
Ratic <3Il% suqEesto n ninant source
At Raio >0-4 s{]gge*s anian *ourceAI{D A2 Rdo ,0.5 In,lgigests avianliilroe
Valid.$:t ilt2At7
87
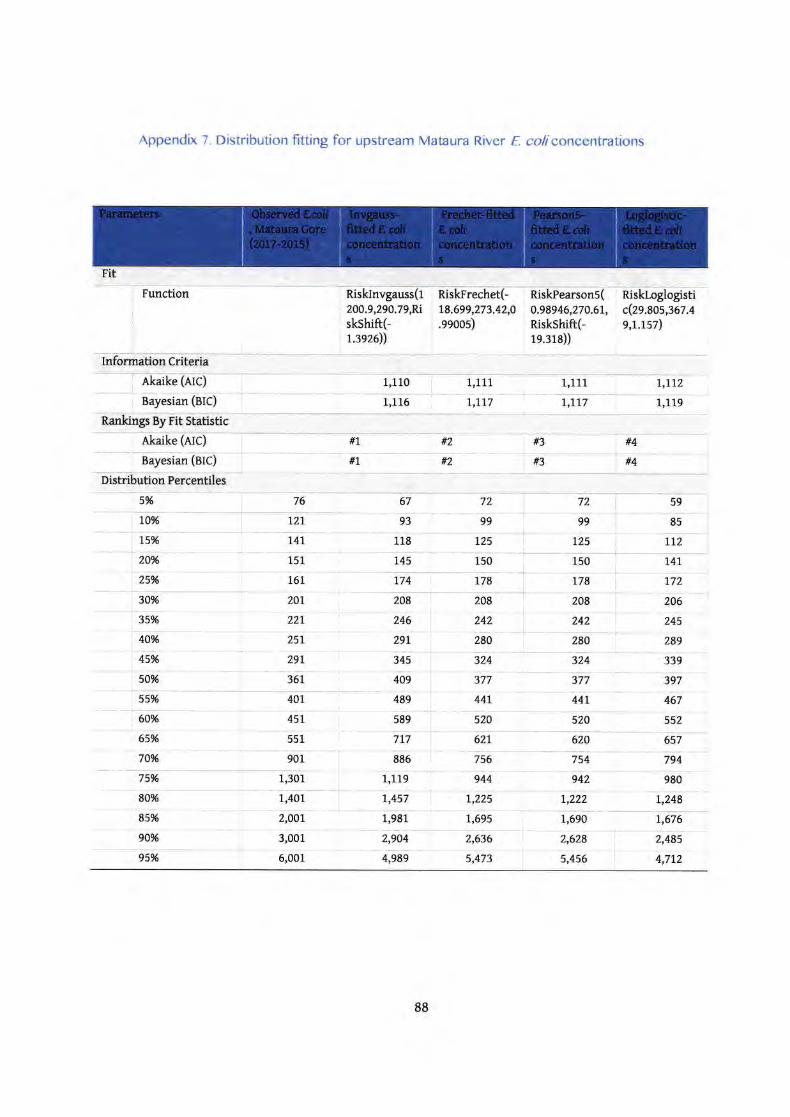
Appendix 7. Distribution fitting for upstream Mataura River E coliconcentrations
Fit
Function Risklnvgauss(1200.9,290.79,Ri
skshiftCll,e26))
tuskFrechet(-18.699,273.42,0
.eeoo5)
RiskPearsons(0.98946,270.6t,RiskshiftC1e.318))
Riskloglogistic(zs.aos,zot.te,t.rs7)
Information Criteria
ekaike (etc)
Bayesian (rIc)
Rankings By Fit Statistic
Akaike (AIc)
Bayesian (BIC)
Distribution Percentiles
5%
10%
L5%
20%
25%
30%
35%
40%
45%
50%
55%
60%
65%
70%
75%
80%
85%
90%
95%
76
tz|t4l1s1
161
20t
22L
25t
29t
361
401
4sl551
901
1,301
1,401
2,001
3,001
6,001
1,110
1,116
67
93
118
14s
174
208
246
291
345
409
489
589
717
886
1,119
1,457
1,991
2,904
4,989
1,111
7,117
72
99
t25
150
L78
208
242
280
324
377
44t
520
62t
756
944
1,225
L,695
2,636
5,473
72
99
725
150
L78
208
242
280
324
377
44t
520
620
754
942
1,222
1,690
2,628
5,456
59
85
112
t4l172
206
24s
289
339
397
467
552
657
794
980
1,248
1,676
2,495
4,772
1,111
!,117
l,ll21,119
#1
#l#4
#4
t3
t3
12
f2
88
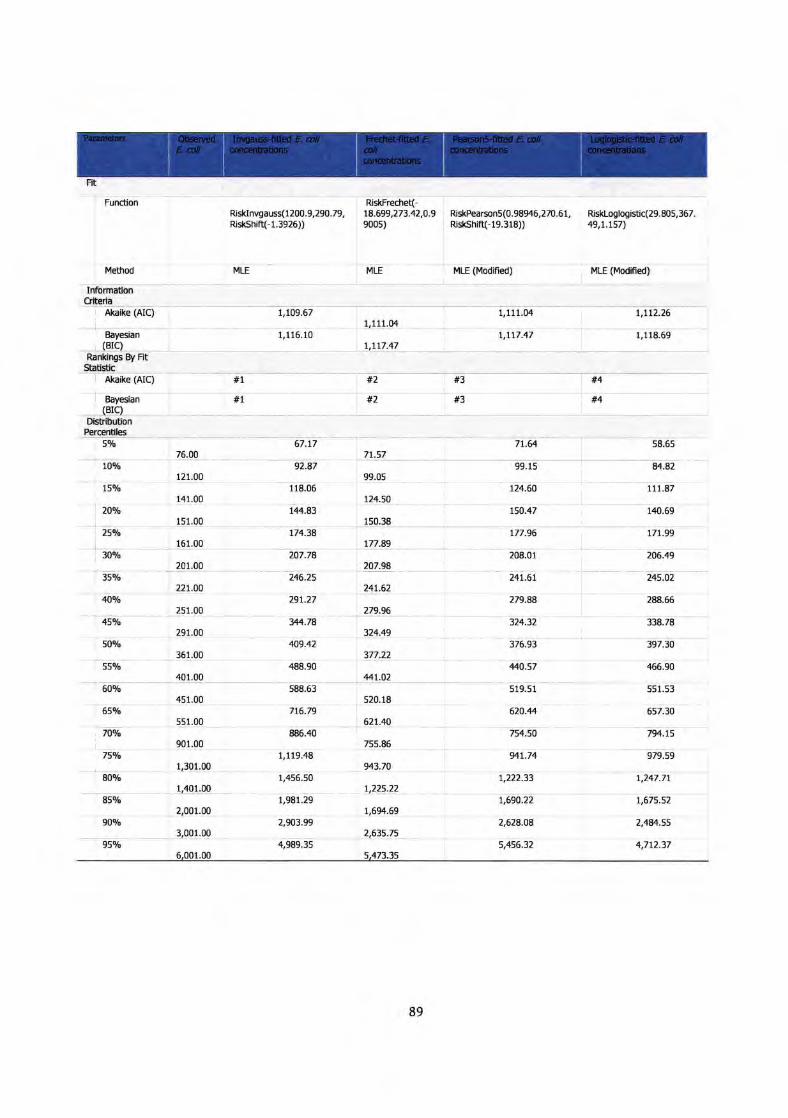
Fit
Function
Metiod
InformationCriteria
rtkaike (AIC)
Bayesian(Brc)
Rankings By FitStatistic
Akaike (AIC)
Bayesian(Brc)
DistributionPercentiles
5o/o
l0o/o
150/o
2oo/o
25Vo
3090
3s%
4oo/o
45o/o
50o/o
55o/o
600/o
650h
70o/o
75o/o
80o/o
857o
90%
950h
Risklnvgauss(120O.9,290.79,Rjskshifl{-1.3926)
MLE
1,109.67
1,1 16.10
#t
RiskFrechetc18.699,273.42,0.9900s)
RiskPearson5(0.989.6,27O.61,RiskshiftC19.318)
Riskloglogistic(29. 805,36749,1.157)
MLE
1,1 1 1.04
t,117.47
ML.E (Modified) MLE (Modified)
1,111.04
1,117.47
1,112.26
1,118.69
#4
#4
#3
#3
#2
*2
76.OO
121.00
141.00
151.00
161.00
201.00
22r.00
2sr.00
291.00
361.00
401.00
451.00
551.00
901.00
1,301.00
1,401.00
2,001.00
3,001.00
6,001.00
67.17
92.87
118.06
1214.83
174.38
207.78
246.2s
291.27
y4.78
409.42
,+88.90
s88.63
7L6.79
886.40
1,119.48
1,455.50
1,981.29
2,go3.gg
4,989.35
71.57
99.05
124.50
150.38
t77.89
207.98
24r.62
279.96
324.49
377.22
441.02
s20.18
621.40
7ss.86
943.70
r,225.22
1,694.69
2,635.75
5,473.35
7L.64
99.15
124.60
150.47
177.96
208.01
241.61
279.88
324.32
376.93
440.57
519.51
620.44
754.50
9n.74
1,222.33
t,690.2z
2,628.08
5,456.32
58.65
84.82
111.87
140.69
17t.99
205.49
245.02
288.66
338.78
397.30
2166.90
551.53
657.30
794.15
979.59
1,247.77
1,675.52
2,4U.55
4,712.37
89
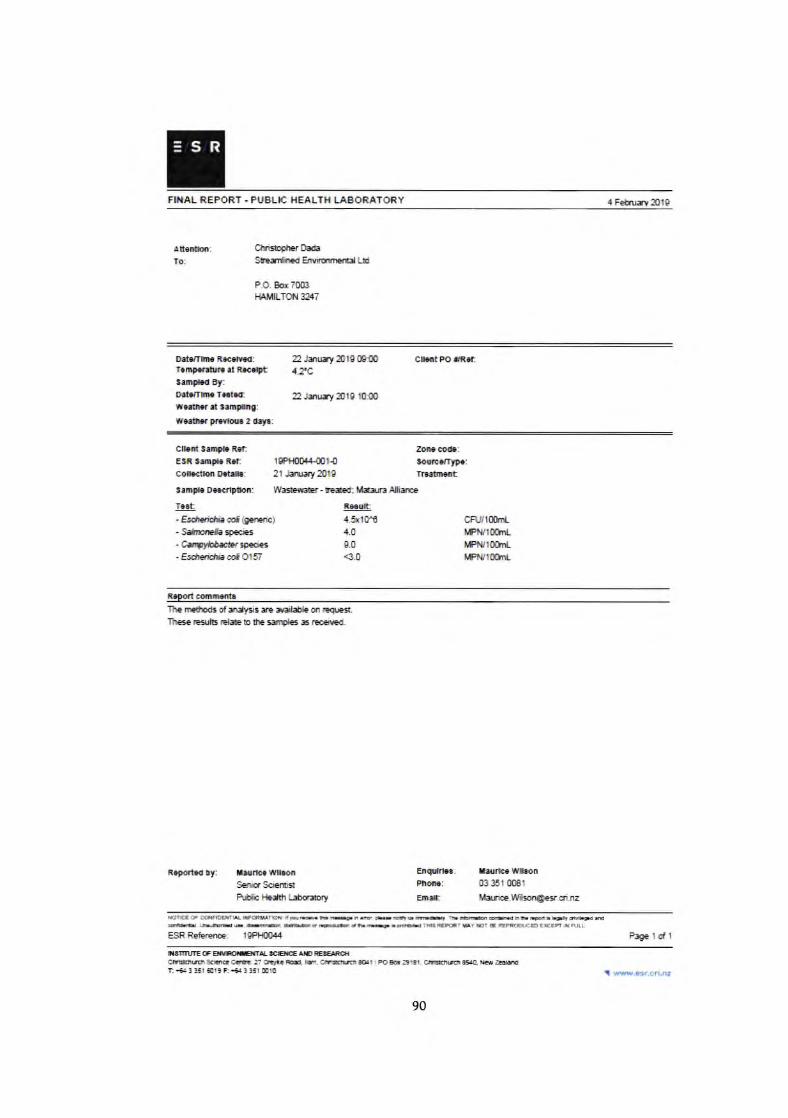
=SR
FIIAL REPO*T. PI'8LE }IEALTI{ LAAORTTOEY .l FennrvZllg
To:rlt !ah: €lrlsupmrH
S:eert:d EniumentJLS
P-S.So{maEHATITS{:}lrl
zlJrrury20tg{pfl) cr..*FtoiR.tt lll..-o.fifIcfttt.rtFaq':odltrl.dlt:ffiatrrl-t0:
1.?C
ZJrraf Alle llXll
cr-3r;Itueelnlrd.n r:co-coctD*.-:t.rtF lrrrcft{hlt:rrlt
tfHt0'E{nt{l21 .lrrtry20f0
Uorcfla:LrE*tlD.:t &mt
ET{t-&dreriJ*tdbE Eric)-Srurfegit=-Crylfra*r+eCes-EsdrgilihodOt57
4.3rr0 6 cFufl(h-ritr{ilIH-lf,ilrflH-tfilr{IH_
4.0s.0€.0
'Ihe rdrds o{l{is re *ia*.. sr trltEstlIE€ rs{B t*- b lhe srdes E rE irrt.
n ?orbdDy: k[lsrWtDnSer*rScieflistR*He#r:..*rfft
Er{tlrti.:Plmr:Ertt
Irrka tlrootB36r mllhrb-WfsmQer"ri.'lE
ffi r mi0tllqtaalfirf& tE-I.-hE a....,..rtalr.*. b-_E_rh rytllrrrFiarddff 'ry-,idffi rad-Cb!ryafl mmx$iffi ,tfrtdeESRReftrume: tSPHna{ hgE I dlntlln tEc tlEr{. E*ErE ,E-.E r€rtrsxrdt EllrcCcrtE2? EEE l, :c cil3rErE4t r FoE:9t}l . cnllurt Eao, rBa:llrr* .€a ! :!5, dll, E .fa I :r5l ltll!
90
! ffi.atr.cn.r}J
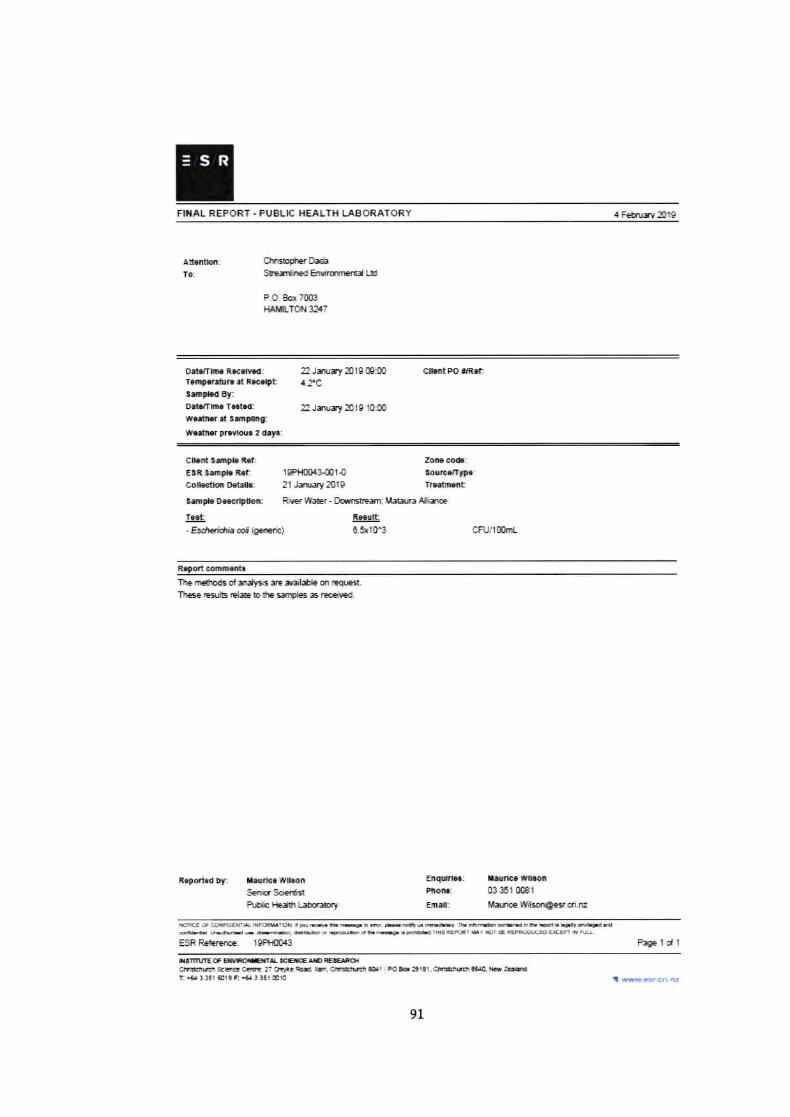
=sR
F'IAL REPO'RT. PUELIC HEALTH LABORATOflY 4 Fet.uilyn}lg
tli.r6r.i: CffiplnrO*Sh'rtEd EDrrirurnentd LE
P.O. Bor T{XB
MrflLTOit 33t7
To:
0tTr*n$ilY.d:frmp,..Srr'.rt i....,ttlrnbdffosarmTstrd:ulf{0lrtt3m!fi0:wa{fif p?lvlooa 2 orr:
22Jruryn}lB{EiEit-?c
22Jansryl0l9 rffX)
ctIItPo !!i.c
Clhd lr.pL i.t: Zolt. co(I:E Rtrtr arR t 'l$FlfiX&{tr1-tl tossc.rtD.:coa..Oo.r Ddrar: :1 Jilla y20fg rnir..tt3.rt aD..c.FOor: Rir€.l**r-DotrdEilr:UeuraAlirer€.t ng.sll-Esdt€rirtE eol EEcricl E.S(I(P3 CR/lilha
Rrto.tcm't*rIhemelk dadyis re Jdl$le m rEqFd.
R.IdMDy: I{rfha wlloirSer*rSdeflrirttuDac ltc#r L$rsry
Enqdnfl:PioDa:
EfiT[:
lrnlca wloll03 361 0081
iihriE wilsaloe6..ef i.nz
ffi t ffim l$m1il'lEffi b ry t.u F-drr ffir h ffi --i*berr lrt Fa{Ed# ffi
- Gtu,l{&rtrytffi lwtMl nt kt L-sffE..@ litulr
ESR Reftrerre: I9PFIIO{Ii Page t oa I
iftm,lE (r E*xrgra lcErcE /rf,r E-lio$clfitirrri *lne c.ilrE 17 o!|.. tud En, crrt!:lvE r o4l Fo tu :grEt , elttulrrr! !t€4q nr l*r,t* tll! s9 E g I f51 mio
9l
! www rs..er'.nt
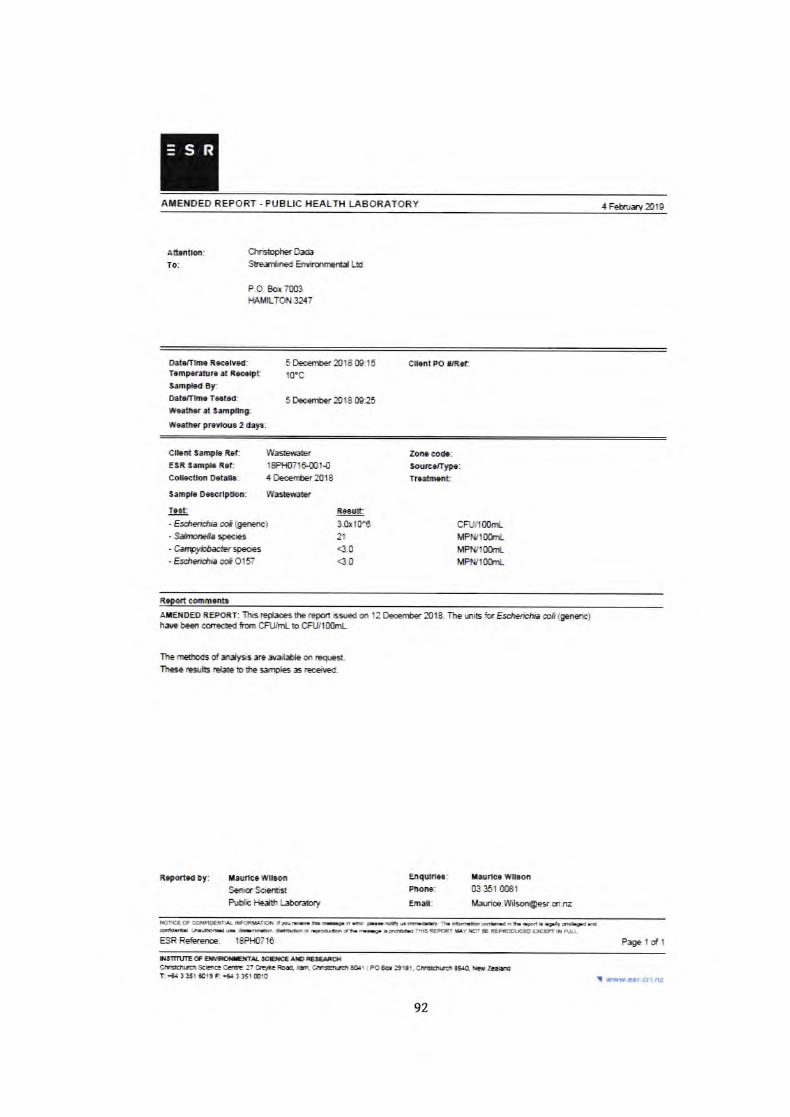
=SR
AIE'IDED REPORT - PUELIC HEALTH LASORATORY 4 FehruavAll9
Att3nlho: ffiptgthSfeertndEruirmgrd Ud
P-O.8d7mHAt[-TOt{ 33t7
To:
BTT"TETBHIT!T:Irru.r&r. a R.c.apttnil.rryDd.rTmTsbd:rr.drr.r rt tilfrBg[\rlln.rF fiot !2atrya:
5 Decen$er$18 09:15
rrc
5 Decer$er$18 tF25
ctmtP(lrfr*
G]br* t..?L Rrl:E3E tn9a. i.t:Coaaaffoo Dattlr:
ttflPL D.oert!{or:
r.ot- Erdnd*b oI lgErEncf- S*aorcia +ecies- CarydotactrspeOe:- Esdreddrh cof Ol57
W*mErtgPF[rts{at{tit 8ecester2O18
$I*r*r
Zora coo:3o.Mfrypc:Tlr&raart
Bc.{lt3.ahr0.e2t<.04.0
CFUTIqhli,t}{Ifllrl-*Pt{tflH-liPt{t{IH_
AlE loED iEpoiT: This r€dffi fhe repo.t ber€d m 12 ftcnrober !0t8. Ilre inits heEsd1,eri*ia 6di (EElt'€nclh* been emecrd frmr CFtiH- t CRI/lfiH-
the menrds drr*ys.s are ndl*le on iEqrc.lIEe es.dfsrEhtoihe silples c iecdnd.
E?qbDy: FJl{trrml..:ferLlVl'ooSersScieniqR$[cl+JtrL*q*ry
Piooc:
ETI.I:
I{rrlca Yylroll03 36't o(Bt
Ilbuie-ttfdsoa@sr. cri.nz
ffi B S&il* Nmlfr tpffi bqd c
-dt
qntflt bffi.a&Dh S-Xrr # d# tM-*G ffir'F6-rdtlryr'd*tffiffitUt$f ffilgrrrt&!ESBRekesre: 18PtO716 FegEldl]I]l'NfiE tr E *B"g'IL ICC'TETE EErcIcttrtkEn 985€ catE :' cqr. ed, E r crtr*h.dr !t {r Po E !} tl . c|'udrrt,t 8540. nd &&,t +€a 3 ]51 At 9 F: .6a 3 351 m10
92
! m p*..crr nt
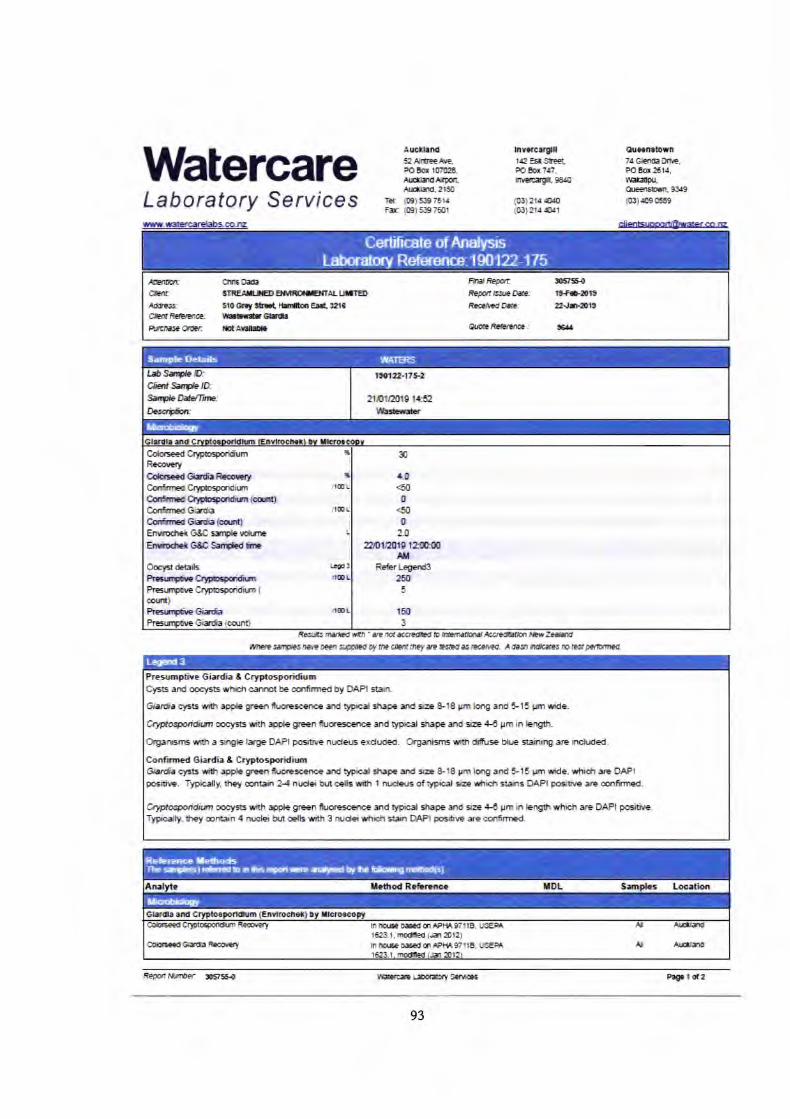
(f)
o\
Bld.IfrrIilI
,ttIoI
iIttuuddHn'fr
*BT
Eti{r6 j 6;rin!!E
!u$II$
IIli.)
ETsIor*5&TEpust;osl1Et*t:E
itEiEdt
$Et
f,EttttfifE.cCE
EI
IEHg
EEg_r
*3$Ifrf
u3#sE
Ifuuhfi4O
rIET
flrtlcfips8$rE
i1tO
F
EE
I IE
I f.t
i . I iE
.rtE
.tB
* ii $fr
ET
# EI
F fl f
5f,
m $ [
m$
E [6
EH
" t i E
8.8
fi s H E
#ir$fii
Bi
EI$ifiE
II
EH
$flilrrmtlIr
iE!tu8l$$efifrsI&btul
ItrI
EB
!F-$"=
$r$n-8.
IdtI
IEI
f,
ex[*r
fiEtBr
$fHuI
Ef,a[,r$[
HIII$If;I
6ti6!*aaI (,Itsrrlt-I
$Ib:
6T.
cgII
slllr
tusf;H il
s$E$
fl
r$ gtrrF
l
HIt
u)
(J)-}E
F
<U
E>I
E$rr$$gstl
!,
aot$rl
IIE[iffiP
,E
r4q)oaV)\oGoaa-J
oL$(,Lo3g
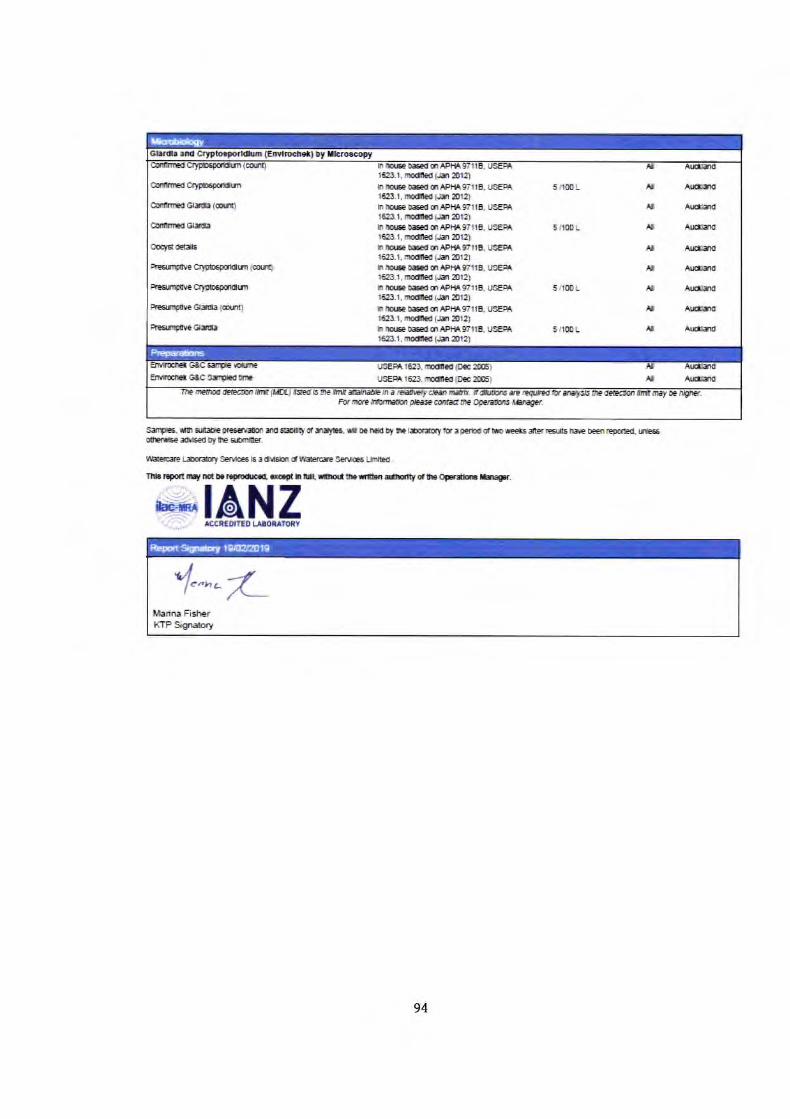
i I E I I ! B I s! tl $i $i flt }H ri { I { E $ I I I B tcc If, 'f,
T}
FE ta 88 EB
HH }I EEt f, ts tl (n I E t
n$$$
nn$i
i,E
E
II'}}
I}I'
EE
EIE
EE
IE
E t E u Jf
6 P n E c
6 I rI r
(n E -0 t r
EE
giE
f,rtr
t+
l+Ia Srg
tgE
*tsr
tsE
sEsE
t!6 fin }T
EiE
IEiE
.:I.:I
ilrilr
rr*r
f,Is
IsIe
lxr
grgr
lts
*tsI
tsT
tsE
sEsE
sEF
f;.E
fiFfi
o t t t t o d { I ! t s t g T i I T
5 a $ g
-E ,i t t) u :
I i 1 , I E i l I ,l I fr I r I { I t ! $ E E t g t il n ; r t E t
iI iE rt ir Fi TI it tfl IE t , I t I
ffi BI Etr
E= IN
IT TI
tLd
Qrr gr
6 -F I s r, N
dl ID E I tl € E 5 6 iJ B f
\o A
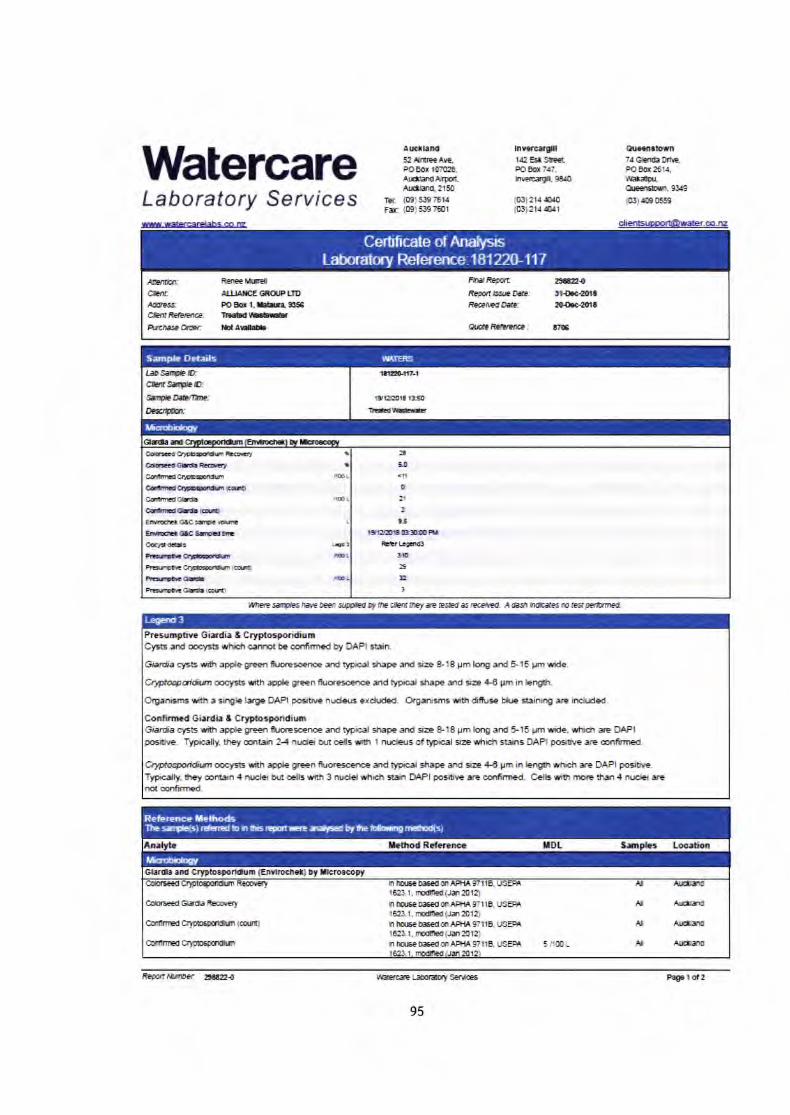
tI
roo\
ufrrxfiI$UE$
EIIoI
E!'E
EtstE
x{{{{
tttt
[[[[U
UU
UE
8ES
gedgH
sEsH
o'H
IE{E
{EE
EX
E;E
5b
ilfinftfxt:. ff:' il: t!88$E
EI
IrEB
$r$H
JI
s.EIt6c!.Et€ifitntFg€E0Et:*htL
ccI{,coeiltr
FL'f;E5
fr
II3Tt, P
.torts
Et
F$c1,
EE
TEfls
ET*[AH
Ir$,H{
t5dGAI
}TBE
c-{rlfrF
ES
BE
rdt 3,E
$EI
EE
I IE
r ft
t , I f t
T B
E F
5
* ai rfiB
T# B
fF
* r F
$
mt i
m*
E [6
EH
[f,[Ifl;u
h P d
lrc
Et fi E
fr ,fti
$fafaEti
rHrtrir$
Fn$E
EE
fifiBc&dlJ
EEx.EIfi!!$tgfr*Elri$IfIilg
nSfon^fl
i8fl.$t
TIfgIE!H
I
^rliH
ilrIu[[rI
Itr[,IIIII
itO0ga fl!,
$aIu:
r[ilr
rus$fi TI
fi
Hf,
EE
$$EH
rFf
If;ff'r
I
.- f{gNtD
r*c*
<3oooh,
Efr
E-oE
v(g
ooJ
ql8l
.{ fl-
iEE
rlHTF
flaggr$rI
EF
fiffggpE
E$H
[iqq).gou)\t-'
UodE
{bf,alsl
oLtEeoIg
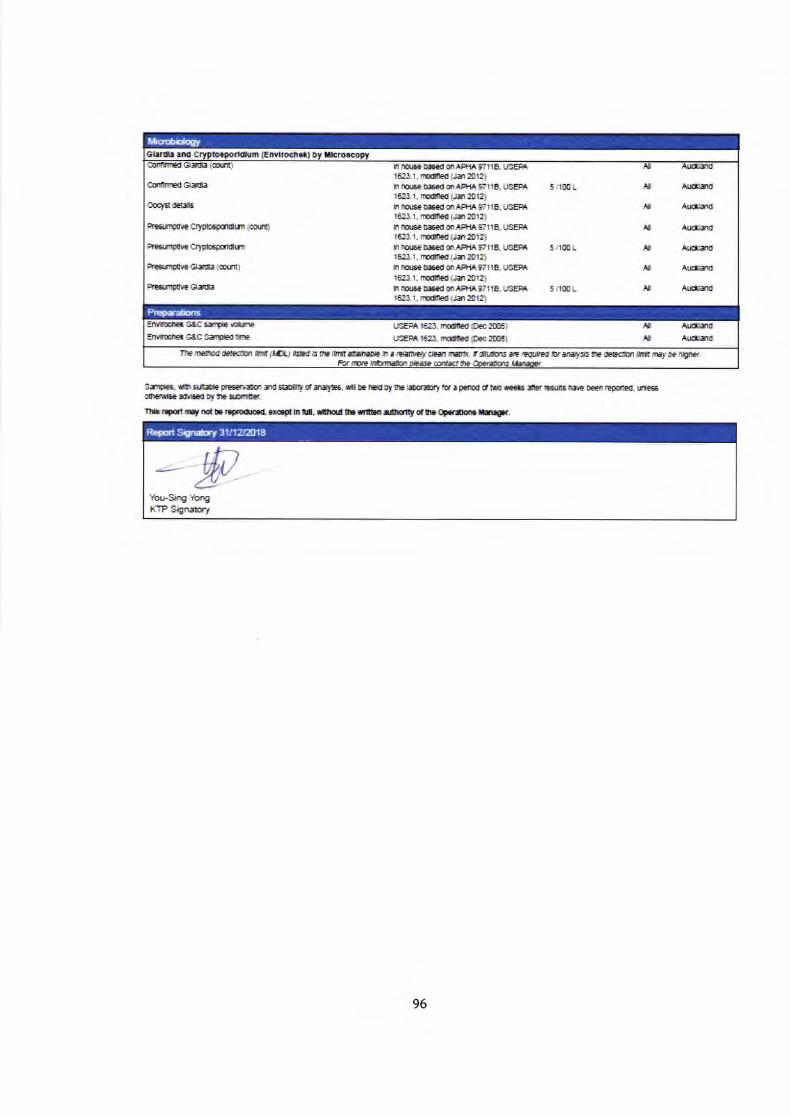
t I B I E $ t T I :l i t I I a' I lt t fl q * fl $ I rl ,& E I
4 E I t E
ni$f
innl
E !
E;E
;E;E
;E;E
;8il
i[iiil
i[iffi
iilr
FsF
eFgF
gFsF
gEs
gixi
Eig
ixiE
irlE
sEsS
s.S
sEsE
sSs
F.o
trF
trpp
E6E
86E
69E
999g
s
Ett!
tE
&
IIIII!
l [[E[[E
E
6 8 r
an I rB r
Itf,t [4 8ts
oo nt EE
al 6fin II FF ti 8E Bg
t g s t T I fi I I , t E I t i I I
.HtIS {F tl
tAE
_g E$
.o tu 6 : L,l
,n i E ,! r.l iJ d
iti IEI
!r{
IH$ ii t* rr l7 TI
[; s8 1q rt ri Iil il I ; r I { E E I
\o o\
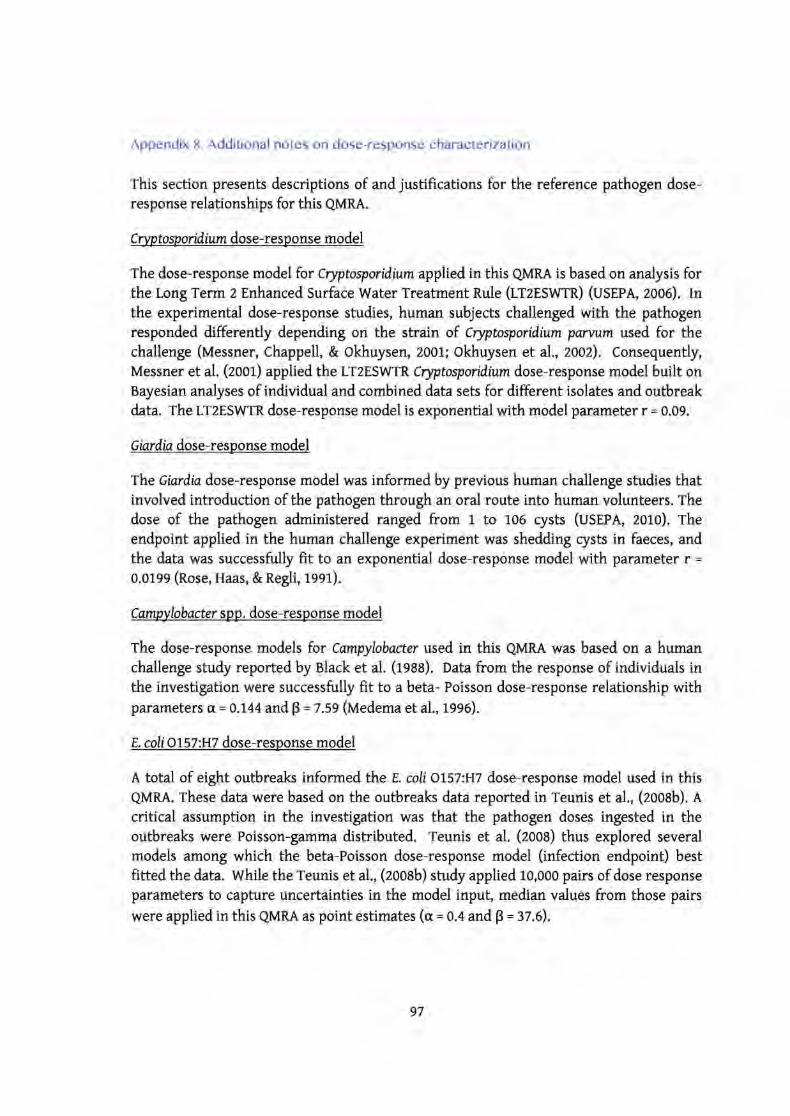
Appendix 8. Additional notes on dose-response characterization
This section presents descriptions ofandjustifications for the reference pathogen dose-response relationships for this QMRA.
Cr)rytosporidium dose-response model
The dose-response model for Cryptosporidium applied in this QMRA is based on analysis forthe Long Term 2 Enhanced Surface Water Treatment nule (rrzrswTR) (usrpe, 2006). Inthe experimental dose-response studies, human subjects challenged with the pathogenresponded differently depending on the strain of. cryptosporidium parwtm used for thechallenge (Messner, Chappell, & okhuysen,2O0L; okhuysen et al., 2oo2). Consequently,Messner et al. (zoor) applied the LT2ESWTR Cryptosporidium dose-response model built onBayesian analyses of individual and combined data sets for different isolates and outbreakdata. rhe LT2ESWTR dose-response model is exponential with model parameter r = 0.09.
Giard[a dose-response model
The Giardio. dose-response model was informed by previous human chdlenge studies thatinvolved introduction of the pathogen through an oral route into human volunteers. The
dose of the pathogen administered ranged from 1 to 106 cysts (usrPA, 2010). The
endpoint applied in the human challenge experiment was shedding rysts in faeces, andthe data was successfully fit to an exponential dose-response model with parameter r =
0.0199 (Rose, Haas, & Regli, 1991).
Campylobacter spp. dose-response model
The dose-response models for Campylobacter used in this QMRA was based on a humanchallenge study reported by Black et al. (rgae). oata from the response of individuals inthe investigation were successfully ftt to a beta- Poisson dose-response relationship withparameters u = 0.144 and p = 7 .59 (Vtedema et d., tggO).
E. coli o]^sl :H7 dose-response model
A total of eight outbreaks informed the E coli ot5z:u7 dose-response model used in this
QMRA. These data were based on the outbreaks data reported in Teunis et al., (zooab). ecritical assumption in the investigation was that the pathogen doses ingested in theoutbreaks were Poisson-gamma distributed. Teunis et al. (zooa) thus explored severalmodels among which the beta-Poisson dose-response model (infection endpoint) bestfitted the data. while the Teunis et al., (zooab) study applied 1o,ooo pairs of dose responseparameters to capture uncertainties in the model inpuf median values from those pairs
were applied in this QMRA as point estimates (c = 0.+ and p = 37.6).
97
Salmonella dose-response model
Salmonella occurrence and infectivity differs widely with serotype. Considering the rangeof serotypes that could reasonably occur in recreational water, it was thus necessary inthis QMRA to select an appropriate dose-response model which apparently represents theoverall incidence of infection among individuals who get exposed to them. For thispurpose, two published Salmonella dose response models exists that are based on infectiondue to multiple serof;rpes of Salmonella (the beta-Poisson model, as in Haas et al., (rgggb)
and the Gompertz-log model, as in olivieri and Seto (zooz). In the beta-Poisson model,parameters a= 0.3726 and p = 2884 were applied. In the log-Gompertz model (for an illnessendpoint), a range of values for the model parameters were applied consistent withprevious sfudies. These took on a range of values of dose response parameter ln (a) whichare uniformly distributed between 29 and 50, and b = zlqa. This QMRA applied the beta-Poisson model, as in Haas etd,.,t999 and ustp.A. (zoro)
98
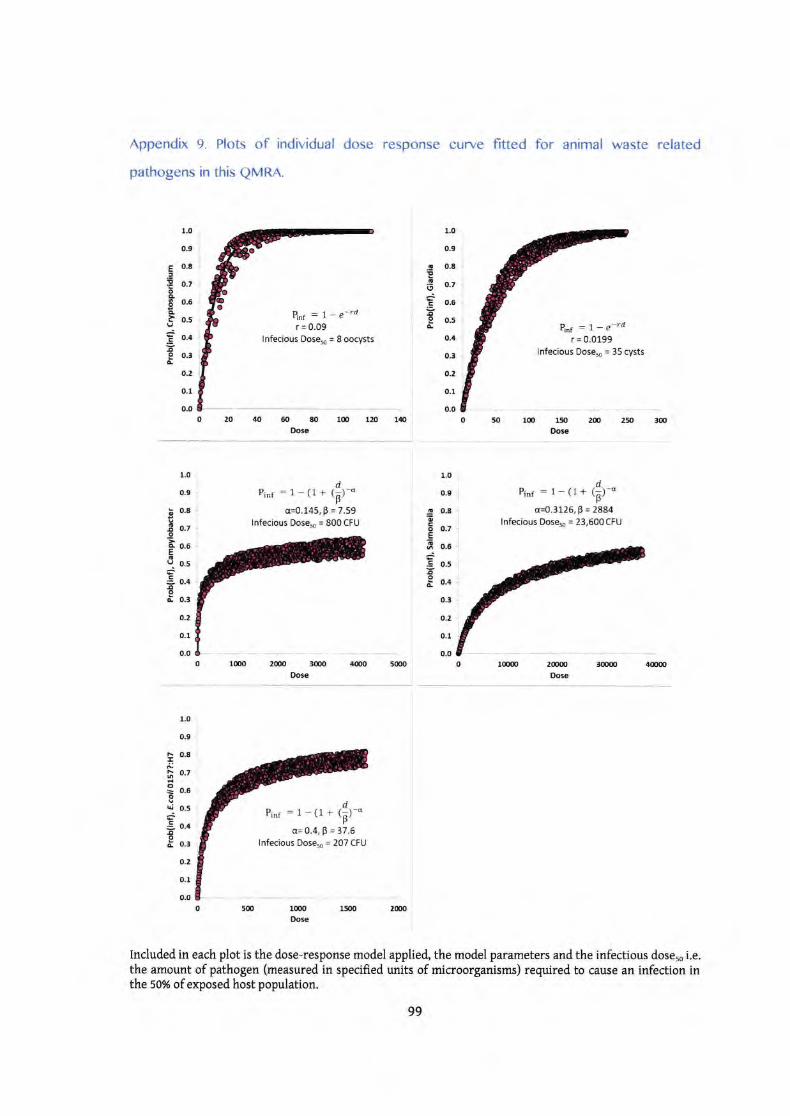
Appendix 9. Plots of individual dose response curye fitted for animal waste related
pathogens in this QMRA.
1.0
0.9
g 0.8E
6 0.,
E o.o!I o.s&
o.4
0.3
o.2
o.1
o.o
1.0
0.9
E 0.8
=E o.,oaI o'5oF o.sg
! o.4Ag o.3a
o,2
0.1
o.o
l'O
0.9
s 0.8o5 o.t
E o.e
! o-s5E o'n
o.3
o.2
o.1
o.o
B.r : 1 -e-'dr = 0.09
lnfecious Dose* = 8 666y51,
Pinr:1-e-td
o 20 /ll) 60 ao l(I) 120 14{,
Oose
r = 0.0199lnfecious Dose* = 35 6ys1.
dPi.r:1-(1+(p)-"a=0.3125,9 = 2884
lnfecious Dose, = 23,500 CFU
t(IxD
o v, ,.m $o 2@ 2* :t{rDoe
1.0
0.9
; 0.8
E o.toq 0.5EaI o.sj
5 o.r!oi o.r
o.2
0.1
0.0
dPi,r=1-(t+(p)-"o=0.145, p = 7.59
lnfecious Dose, = 369 6Pg
o 1(m 2(I,o 3(m rt{xro 5{xto
Doso 2{rxx)
Do*ixrm 4{rm
1.0
0.9
ts o.8I6J
D 0.7
3 o.ooqj o.sj
5 o.+oE 0.,
0.2
o.l
o.o
dPi.r:1-(r+(p)-"
5{Do
q=0.4,8=37.5lnfecious Dose. = 207 CFU
1(I)O
Doe1500 2(tro
Included in each plot is the dose-response model applied the model parameters and the infectious dosero i.e.the amount of pathogen (measured in specified units of microorganisms) required to cause an infection inthe 50% ofexposed host population.
99
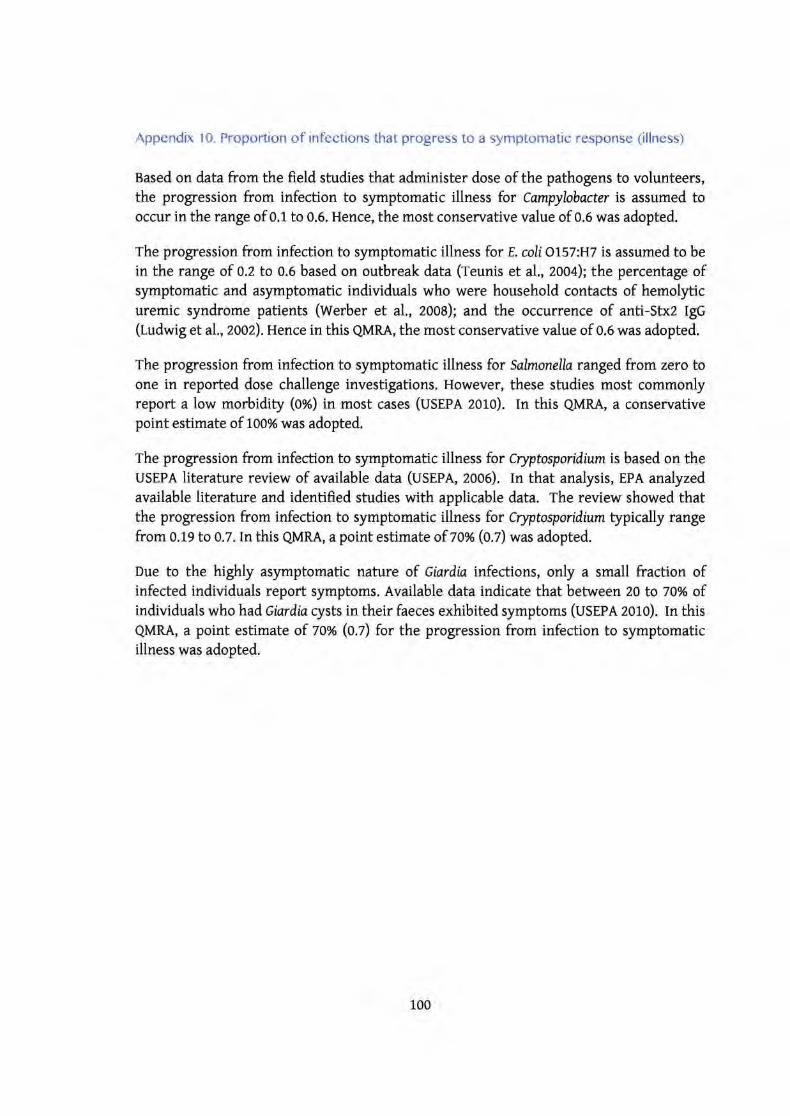
Appendix 10. Proportion of infections that progress to a symptomatic response (illness)
Based on data from the fteld studies that administer dose of the pathogens to volunteers,the progression from infection to symptomatic illness for Cantpylobacter is assumed tooccur in the range of o.t to 0.6. Hence, the most conservative value of 0.6 was adopted.
The progression from infection to symptomatic illness for E. colio757zH7 is assumed to bein the range of. o,z to 0.6 based on outbreak data (Teunis et al., 2oo4); the percentage ofsymptomatic and asymptomatic individuds who were household contacts of hemolyticuremic syndrome patients (werber et al., 2oo8); and the occurrence of anti-Sb<z lgc(I-udwig etal..,zooz). Hence in this QMRA, the most conservative value of 0.6 was adopted.
The progression from infection to symptomatic illness for Salmonella ranged from zero toone in reported dose challenge investigations. However, these sfudies most commonlyreport a low morbidity (ox) in most cases (usepe 2o1o). In this QMRA, a conservativepoint estimate of 1oo% was adopted.
The progression from infection to symptomatic illness for cryptosporidium is based on theUSEPA literature review of available data (uSrpA, 2006). In that analysis, EPA analyzedavailable literature and identified studies with applicable data. The review showed thatthe progression from infection to symptomatic illness for Cryptosporidium typically rangefrom 0.19 to 0.7. tn this QMRA, a point estimate of zox (o.z) was adopted.
Due to the highly asymptomatic nature of. ciardia infections, only a small fraction ofinfected individuals report symptoms. Available data indicate that between 20 to 70% ofindividuals who had Giardiacysts in their faeces exhibited symptoms (usrpa zolo). In this
QMRA, a point estimate of zox (o.z) for the progression from infection to symptomaticillness was adopted.
100
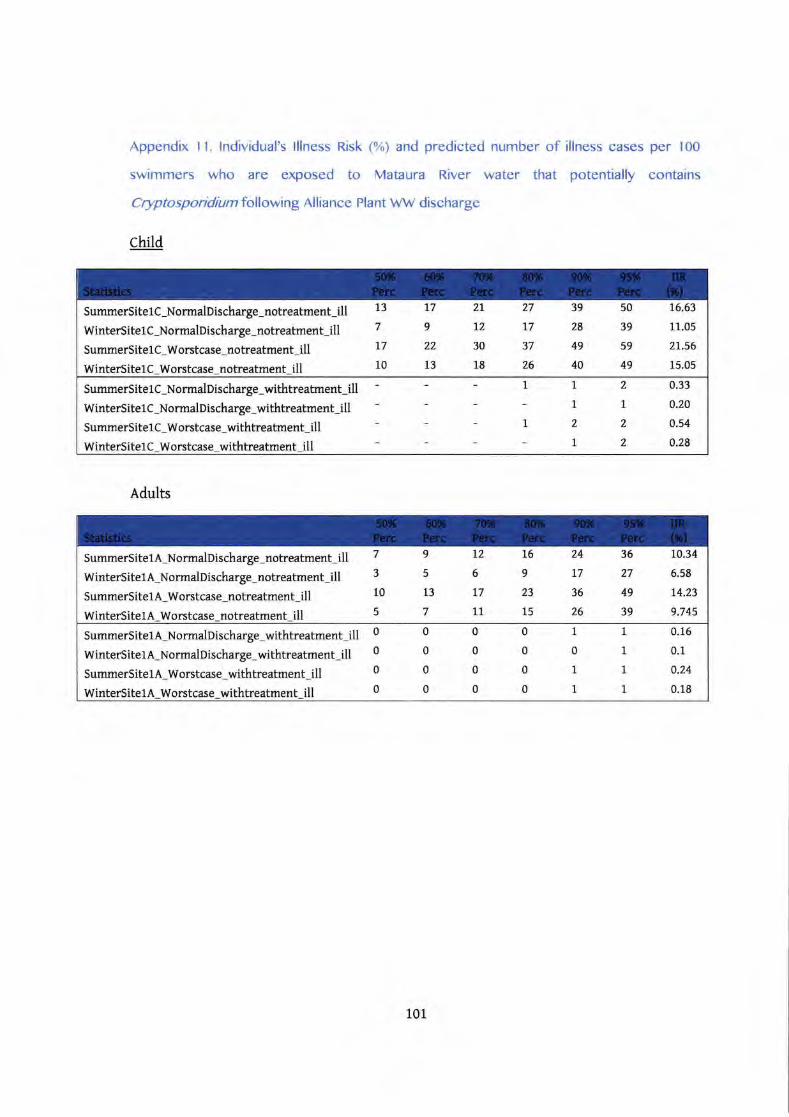
Appendix ll. lndividual's lllness Risk (%) and predicted number of illness cases per 100
swimmers who are exposed to Mataura River water that potentially contains
Ctyptosporidium following Alliance Plant WW discharge
child
Adults
SummerSite 1 C-NormalDischarge-notreatment-ill
WinterSitelC_NormdDischarge_notreatment_ill
SummerSitelC-Worstcase-notreatment-ill
WinterSitel C-Worstcase-notreatment-ill
13
7
L7
10
t7
9
22
13
50
39
59
49
2L
12
30
18
39
28
49
40
27
t737
26
t6.63
11.05
2L.56
15.05
SummerSitelC_NormalDischarge_withtreabnent_ill
WinterSiteI C-NormalDischarge-withtreatment_ill
SummerSitelC-Worstcase-withtreatment_ill
WinterSitel C-Worstcase_withtreatrnent_i1l
2
1
2
2
1
1
2
1
1
I
0.33
0.20
0.54
o.28
SummerSitelA-NormalDischarge-notreatment-ill 7
WinterSitelA-NormalDischarge-notreaknent-ill 3
SummerSitelA-Worstcase-notreatment-ill 10
WinterSitelA-Worstcase-notreatment-ill 5
12
6
t7
11
24
17
36
26
36
27
49
39
10.34
6.58
t4.23
9.745
16
9
13
7
9
5
23
15
SummerSitelA-NormalDischarge-withtreatment-ill 0
WinterSitelA-ttormalDischarge-withtreatment-ill 0
SummerSitelA-Worstcase-withtreatment-ill 0
WinterSitelA Worstcase withtreatment ill 0
0
0
0
0
1
0
1
I
0
0
0
0
0
0
0
0
0.16
0.1
0.24
0.1E
1
1
1
1
101
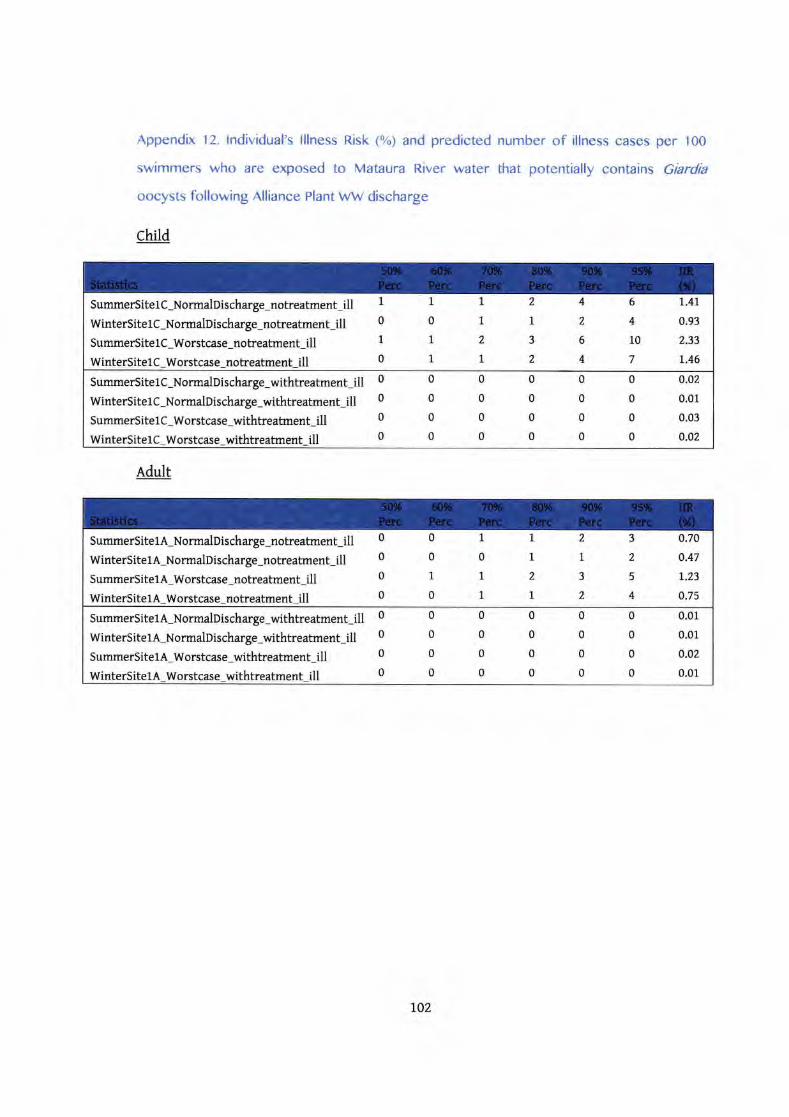
Appendix 12. lndividual's lllness Risk (%) and predicted number of illness cases per 100
swimmers who are exposed to Mataura River water that potentially contains Giardia
oocysts following Alliance Plant WW discharge
child
Adult
SummerSitelc-NormalDischarge-notreatment-il1 1
WinterSitelC-NormalDischarge-notreatment-ill 0
SummerSitelc-Worstcase-notreatment-ill 1
WinterSitelC-Worstcase-notreatment-i1 0
2
1
3
2
I1
2
1
1
0
1
1
4
2
6
4
6
4
10
1.41
0.93
2.33
t.467
SummerSitelC-NormdDischarge-withtreatment-ill 0
WinterSitelC-NormalDischarge-withtreatment-ill 0
SummerSitel.C-Worstcase-withtreatment-ill 0
WinterSitelC-Worstcase-withtreatrnent-ill 0
0
0
0
0
0
0
0
0
0
0
0
0
0
0
0
0
0
0
0
0
0.02
0.01
0.03
o.o2
SummerSitelA-NormalDischarge-notreatment-ill 0
WinterSitelA-NormalDischarge-notreatment-ill 0
SummerSiteLA-Worstcase-notreatment-ill 0
WinterSitelA-Worstcase-notreatment-i1 0
1
1
2
1
1
0
1
1
0
0
1
0
3
2
5
4
2
1
3
2
0.70
0.47
1.23
o.75
SummerSitelA-NormalDischarge-withtreatment-ill 0
WinterSiteLA-NormdDischarge-withtreatment-ill 0
SummerSitelA-Worstcase-withtreatment-i[ 0
WinterSitelA-Worstcase-withtreatment-ill 0
0
0
0
0
0
0
0
0
0
0
0
0
0
0
0
0
0
0
0
0
0.01
0.01
o.02
0.01
702
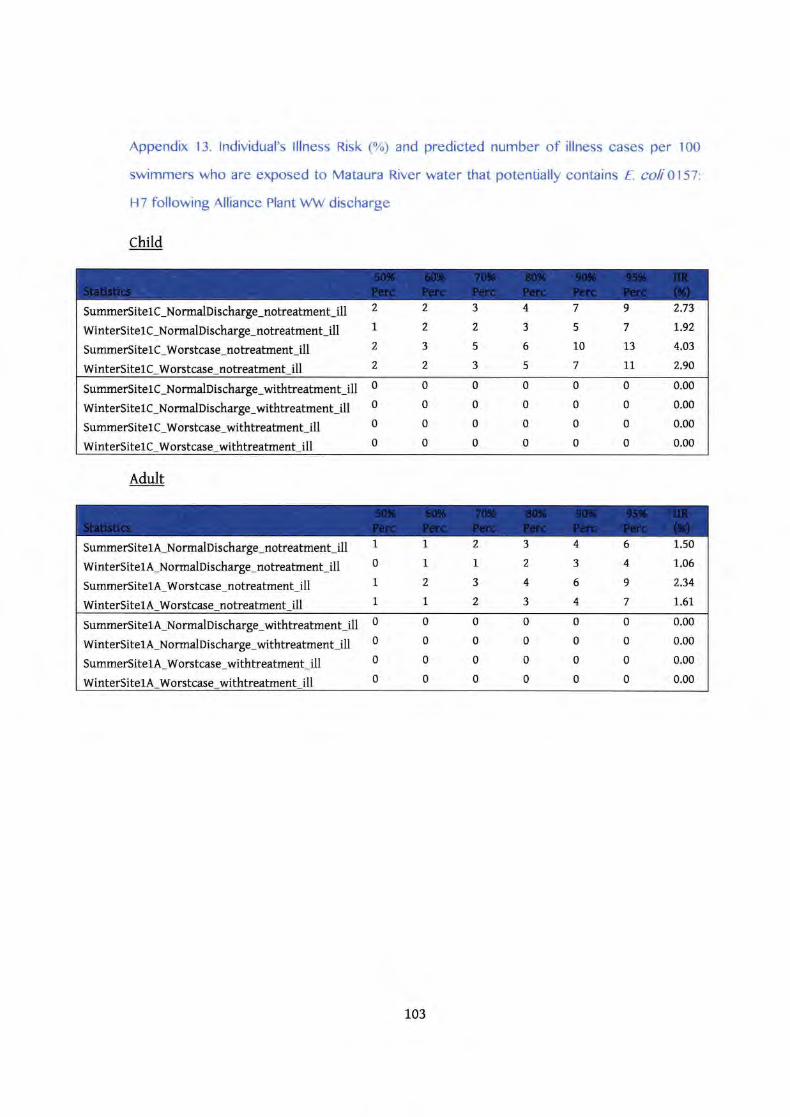
Appendix 13. lndividual's lllness Risk (%) and predicted number of illness cases per 100
swimmers who are exposed to Mataura River water that potentially contains E. coli0157:
H7 following Alliance Plant WW discharge
child
Adult
SummerSitelC-NormalDischarge-notreatment-ill 2
WinterSitelC-NormalDischarge-notreatment-ill 1
SummerSitelc-Worstcase-notreatment-ill 2
WinterSitelC-Worstcase-notreatment-ill 2
2
2
3
2
4
3
6
5
2.73
1.92
4.03
2.90
3 7
2 5
5 10
3 7
9
7
13
11
SummerSitelC-NormalDischarge-withtreatment-ill 0
WinterSitelC-NormalDischarge-withtreatment-i[ 0
SummerSitelC-Worstcase-withtreahnent-ill 0
WinterSitelC-Worstcase-withtreabnent-ill 0
0
0
0
0
0
0
0
0
0
0
0
0
0
0
0
0
0
0
0
0
0.00
0.00
0.00
0.00
SummerSitelA-NormdDischarge-notreatment-ill 1
WinterSitelA-NormdDischarge-notreatment-ill 0
SummerSitelA-worstcase-notreatrnent-ill 1
WinterSitelA-Worstcase-notreatment-i1 1
3
2
4
3
2
1
3
2
1
1
2
1
6
4
9
7
4
3
6
4
1.50
1.06
2.34
1.61
SummerSitelA-NormalDischarge-withtreatment-ill 0
WinterSitelA-NormalDischarge-withtreatment-ill 0
SummerSitelA-Worstcase-withtreatrnent-i11 0
WinterSitelA-Worstcase-withtreatment-ill 0
0
0
0
0
0
0
0
0
0
0
0
0
0
0
0
0
0
0
0
0
0.00
0.00
0.00
0.00
103
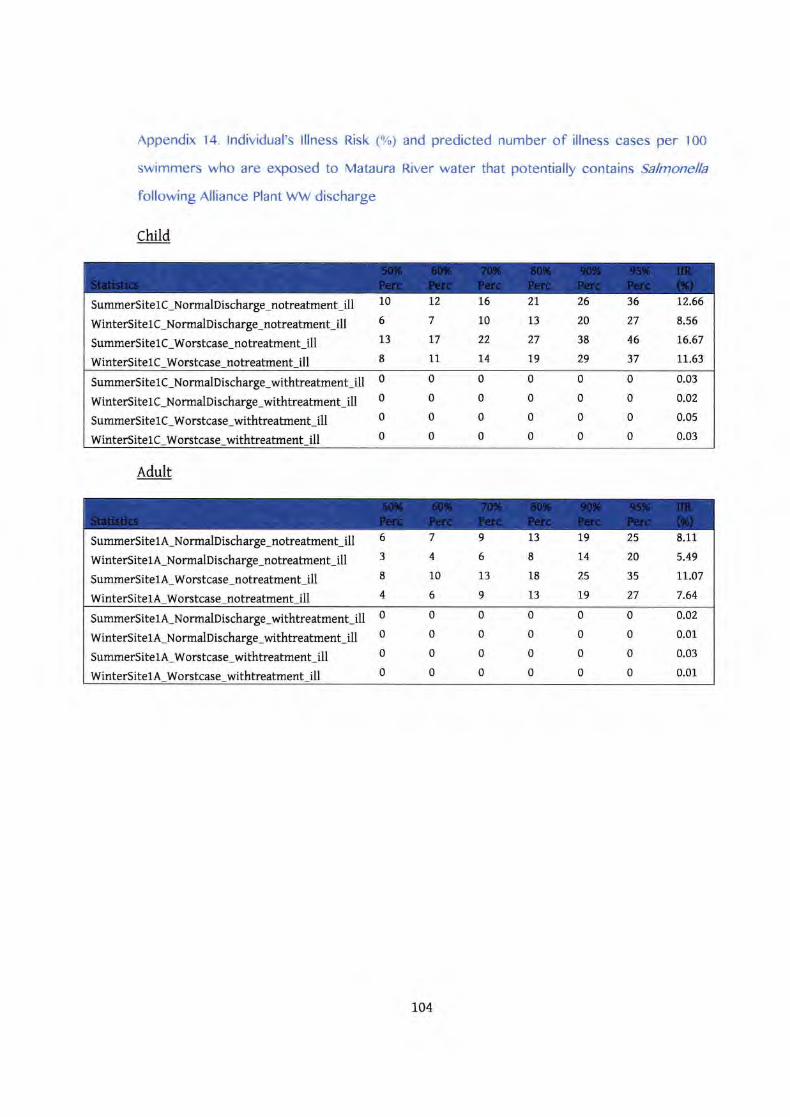
Appendix 14. lndividual's lllness Risk (%) and predicted number of illness cases per 100
swimmers who are exposed to Mataura River water that potentially contains Salmonella
following Alliance Plant WW discharge
child
Adult
SummerSitel C-NormdDischarge_notreatment_ill
WinterSitelC_NormalDischarge_notreatment_ill
SummerSitel C_Worstcase_notreatment_ill
WinterSitelC_Worstcase_notreatment_ill
L2
7
L7
11
2t
13
27
19
16
10
22
t4
26
20
38
29
36
27
46
37
t2.66
8.56
t6.67
11.63
10
6
13
8
SummerSitelC-NormdDischarge-withtreatment-ill 0
WinterSitelC-NormalDischarge-withtreatment-ill 0
SummerSitelC-Worstcase-withtreahnent-ill 0
WinterSitelC-Worstcase-withtreatment-ill 0
0
0
0
0
0
0
0
0
0
0
0
0
0
0
0
0
0
0
0
0
0.03
o.o2
0.05
0.03
SummerSitelA-NormalDischarge-notreatment-ill 6
WinterSitelA-Normaloischarge-notreatment-ill 3
SummerSitelA-Worstcase-notreatment-i1l 8
WinterSitelA-Worstcase-notreatment-i1 a
25
20
35
27
L9
L4
25
19
8.11
5.49
tt.o7
7.64
4
10
7 9 13
6 8
13
5 9
18
13
SummerSitelA-NormalDischarge-withtreatment-ill 0
WinterSitelA-NormalDischarge-withtreatment-ill 0
SummerSitelA-Worstcase-withtreatment-ill 0
WinterSitelA-Worstcase-withtreatment-ill 0
0
0
0
0
0
0
0
0
0
0
0
0
0
0
0
0
0
0
0
0
o.o2
0.01
0.03
0.01
104
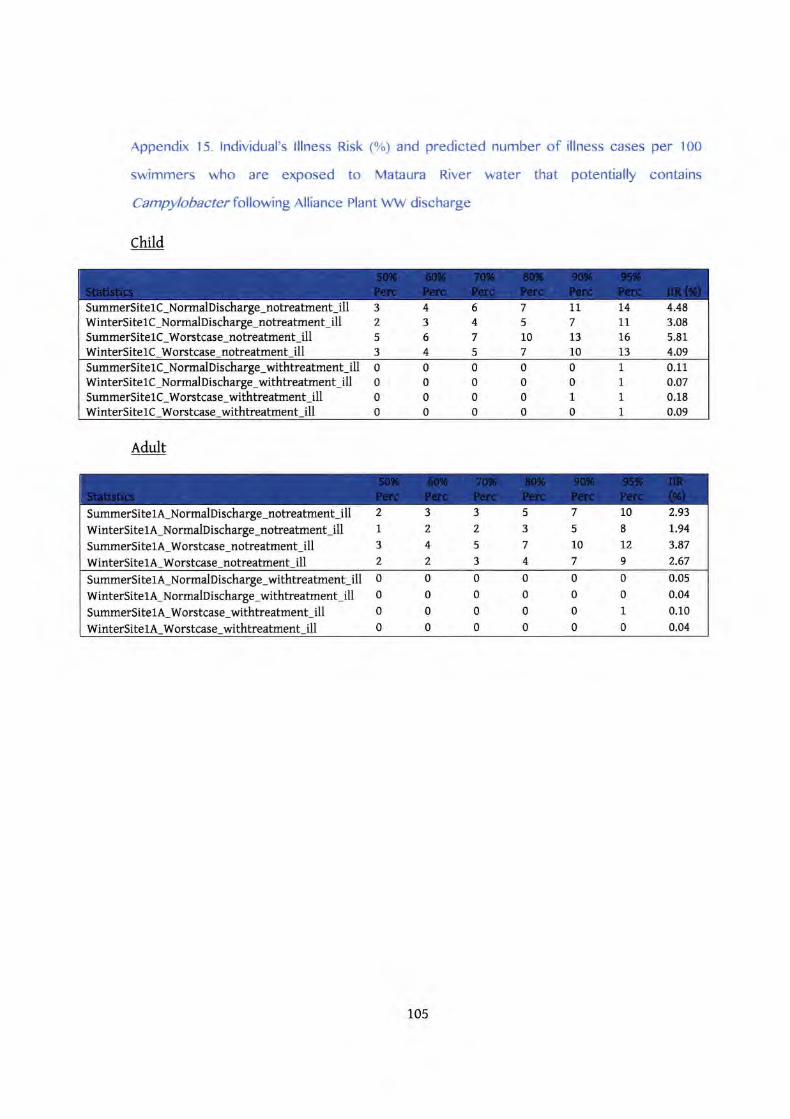
Appendix 15. lndividual's lllness Risk (%) and predicted number of illness cases per 100
swimmers who are exposed to Mataura River water that potentially contains
Ca mpyloba c te r f ollowing Allia nce Pla nt WW discha rge
child
Adult
WinterSitelC-NormalDischarge-notreatment-illSummerSitelC-Worstcase-notreatment-ill
3
2
5
3
4
3
6
4
64
7
5
7
5
10
7
11
7
13
10
L4
11
16
13
4.483.08
5.E1
4.09WinterSitel
WinterSitelC-NormalDischarge-withtreatment-illSummerSitelC-Worstcase-withtreatment-ill
0000
0
0
0
0
0
0
00
0
0
0
0
0
0
1
0
1
1
1
1
0.11
o.o70.180.09
SummerSitel
SummerSitelA-NormalDischarge-notreatment-ill 2
WinterSitelA-ttormdoischarge-notreatment-ill 1
SummerSitelA-Worstcase-notreatment-ill 3
WinterSitelA worstcase notreatrnent-ill 2
5
3
7
4
3
2
4
2
7
5
10
10
8
t29
2.93
1.94
3.87
2.677
SummerSitelA-NormalDischarge-withtreahnent-il1 0
WinterSitelA-NormalDischarge-withtreabnent-ill 0
SummerSitelA-Worstcase-withtreatment-ill 0
WinterSitelA-Worstcase-withtreatment-ill 0
0
0
0
0
0
0
0
0
0
0
0
0
0
0
1
0
0
0
0
0
0.05
0.04
0.10
0.04
105

L
-l
APPENDIX 4
Determination of mixing zone ottreated wastewater from AllianceMataura discharged into the MatauraRiver: a mixing modelling approachusing contaminant tracers,
Stream !ined E nvironmenta l, 2019.

a
edRONM
Determination of mixing zone of
treated wastewater from Alliance
Mataura discharged into the
Mataura River: a mixing modelling
approach using contaminant
tracers
Strea
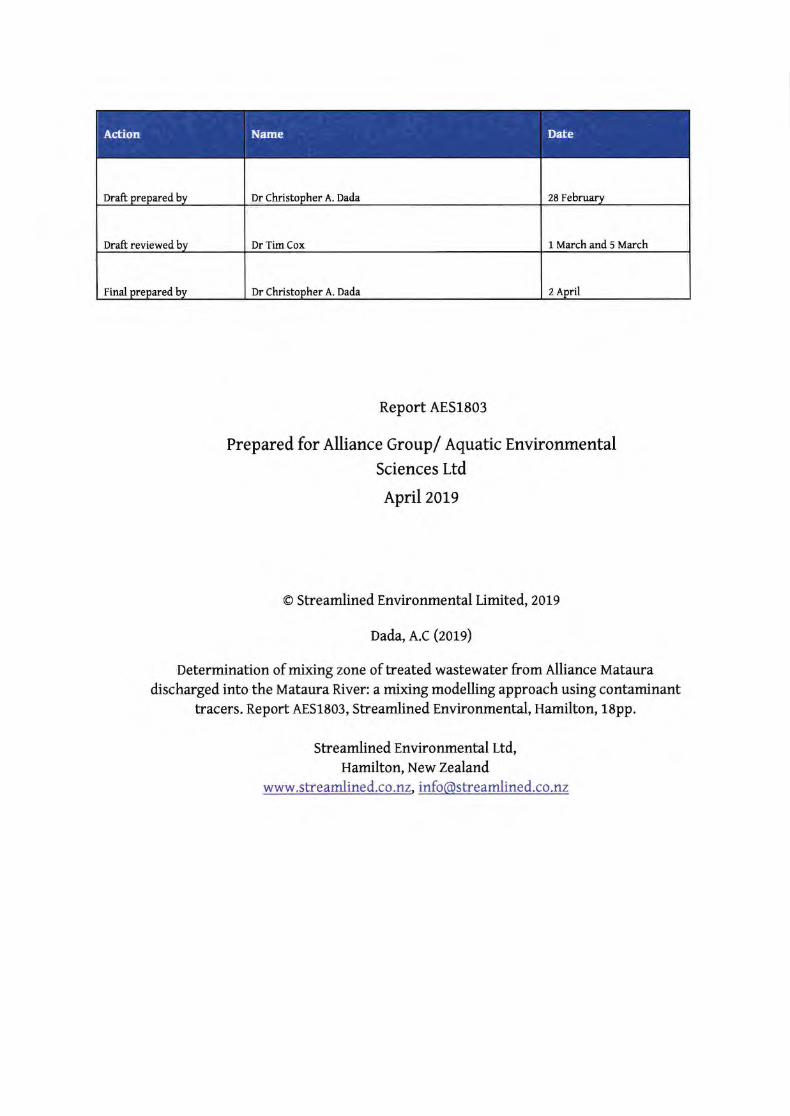
Draft prepared by Dr Christopher A. Dada 2E February
Draft reviewed by DrTim Cox l March and 5 March
Final prepared by Dr Christopher A. Dada 2 April
NameAction Date
Report AES1803
Prepared for Alliance Group/ Aquatic Environmental
Sciences Ltd
April2019
@ Streamlined Environmental Limited, 2019
Dada,A.C (2019)
Determination of mixingzone of treated wastewater from Alliance Matauradischarged into the Mataura River: a mixing modelling approach using contaminant
tracers. Report AES1803, Streamlined Environmental, Hamilton, 18pp.
Stre amlined Environmental ttd,Hamilton, New Zealand
www.streamlined.co.nz. [email protected]
Contents
Executive Summary 1.
2. Model Construction and Parameterisation......... .............4
2,2 Flow rates ...,,,,,,,4
2.3
2.4
2.5
2.6
Analyte concentrations 5
Mataura MidngModel validation ........6
Description of mixing scenarios 8
Outputting of model results 8
4, Discussion and Conclusions 13
5. References 13
Appendix l Topographic-bathymetric characteristics for the Mataura River section (Nzfvtprojection, verLical elevation in m a.s.l.).. ......15
Executive Summary
Alliance Group is seeking renewal of consents to continue discharging treated meatworkswastewater into the Mataura River. To support the new discharge consent application,llliance Group, through Aquatic Environmental Sciences (AES) Ltd has contractedStreamlined Environmental to model the midng of contaminants following discharge oftreated wastewater into the Mataura River.
The EFDC Explorer modelling suite was used to determine the spatial extent of the mixingzone. EFDC (rnvironmental Eluid Dynamics Code) is a general-purpose, state-of-the-arthydrodynamic modelling package for simulating three-dimensional flow, transport, and
biogeochemical processes in surface water systems including rivers, lakes, estuaries,
reservoirs, wetlands, and near-shore to shelf-scale coastal regions (gamrick L996). EFDC has
been applied to several water bodies (including rivers, lakes, reservoirs, wetlands, estuaries,
and coastal ocean regions) in support of environmental assessment and, management andregulatory requirements. It has evolved over the past two decades to become one of the mostwidely used and technically defensible hydrodynamic models in the world. tn addition to thefar-field transport andfate simulation capability incorporated into the EFDC's water qualityand toxic contaminant modules, the code includes a near-field discharge dilution and mixingzone module. The near-field model is based on aLagran$an buoyant jet and plume model
and allows representation of submerged single and multiple port diffi,rsers (rrick 1984; Lee
and Cheung 1990).
The model assumes that measured analyte concentrations in the site immediately upstreamofthe discharge are adequately representative of the conditions in the Mataura River.
Summary of results
To define the mixing zone extent, a hydrodynamic mixing model of the Alliance Plantdischarge into the Mataura River was constructed and used to simulate river mixingof E. coli,
which had previously (oada, 2ol9) been shown to be present at elevated concentrations
below the Alliance discharge. over the 1 km distance below the discharge point, it was
assumed thatE.coliwas conservative (i.e. no die-off).
The EFDC model dilution maps for the Alliance Plant discharge show, as expected, thatwhenthe treated effluent is discharged into the river, it does not instantaneously mix with thereceiving water. Instead, what forms is an effluent plume starting at the ouffall as effluentbegins to mix with the Mataura River water. The mixing zone is thus a transitional area withinthe Mataura River in which the treated effluent discharge is gradually assimilated into theMataura River.
Because of the high receiving water to Alliance Plant wastewater ratio, the hydrodynamicsof the river and the bank-side discharge mechanism, the discharged water is well mixed inthe receiving environment. The plume does not travel along the river bank or accumulatealong the river bank regardless of the hydrological and wind conditions.
L
The effect of the discharge is felt at the opposite stream bank within a longitudinal distance ofapproximately 50 m from the discharge poinf where concentrations gradually begin to increaseas a result of the plume extension.
At a longitudinal distance of approximately 100m from the discharge poin! no further analytedilution takes place. At sites beyond this toom distance, analyte concentrations downstream ofthe discharge remain the same (i.e. more or less the same concentrations downstream). rhis is thepoint of full mixing.
These results were verified using TP ana\rte concentrations from a longitudinal monitoring ofdownstream sites in 2017-2078 and similar results were obtained for the mixing zone - no furtheranalyte dilution takes place at a longitudinal distance of approximately 100m from the dischargepoint.
Based on this mixing model, the mixing zone could be affirmed to be approximately 100m fromtheAlliance Plantdischarge. Designatingthe site 100m downstreamofthe discharge asthe mixingzone for compliance monitoring, is, however, impractical. this is because it is not possible tosafely access the river at this point, at all times. The existing consent conditions set the mixingzone at a more accessible site,'Mataura Bridge 2}fidf s', approximately 800 metres downstreamof the outfall. tf this site is maintained as a compliance monitoring site, the results of thismodelling predict that contaminants from the discharge will be fully mixed.
1. Introduction
Alliance is New Zealand's only wholly farmer-owned red meat co-operative with plants locatedat varying locations in New Zealand, including Mataura, Southland. rhe Alliance Plant atMataura produces several waste streams, including from the slaughter floor, boning room, edibleby- products processing, stoclgrards and truckwash, water treatment plant backwash anddomestic waste (which goes to the Mataura Wastewater Treatrnent Plant). Meat processingwastewater generated in the factory is treated onsite via physical treatments prior to beingdischarged to the Mataura River.
Alliance Group is seeking renewal of consents to continue discharging treated meatworkswastewater into the Mataura River. To support the new discharge consent application, AllianceGroup, through Aquatic Environmental Sciences (erS), has contracted StreamlinedEnvironmental Limited to model the mixing of treated discharge contaminants in the MatauraRiver. The focus of this study is to establish the mixing zone, beyond which full mixing is
expected to have occurred.
Extensive literature exists that are related to the definitions of midng zones for wastewaterdischarges to surface waters (see Cooke et al., 2olo for a review of New Zealandand internationalapproaches). tn New Zealand, the Resource Management Act (rggr) and predecessor legislationrefers to'reasonable mixing zone'. this is the spatial extent of a river (in this case) below adischarge which is set aside for the mixing of contaminants, and that below which standards orguidelines must be met. For example, s107 RMA does not allow the gant of a discharge permit if
2
"after reasonable mixing" the contaminant is likely to give rise to defined effects in the receivingwaters (sroz(r) (c- g).
Reasonable mixing zone may be defined by way of a plan, or by a decision-maker based on whatis reasonable in the circumstances. The extent of full mixing needs to be known before such a
decision can be made. The focus of this study, therefore, is on the determining the extent of fulImixing.
A number of approaches are already documented in local and international literature onapproaches to address mixing and dilution of analytes in receiving waters following discharge.
For instance, in field-based sfudies, common tracers such as dyes (e.g. Rhodamine), salts, and
stable isotopes are used as tracers to characterizeriver mixing. These tracers are typically mixedwith the wastewater under consideration before discharge to the receiving water to determinemixing and flow paths of water within the receiving water,arrdto determine mixing and dilutionofcontaminants in the wastewater following discharge (see Cooke, 2Ol4for an example). the use
of various tracers was also considered; however, this would require consent approval.Alternative tracers considered were potential analytes in the discharge; this was selected as thepreferred option. In this case, the elevated and predictable concentrations of E.coli in thewastewater was utilised to fulfil the role of 'tracer'.
In this study, the EFDC Explorer modelling suite was applied as an effective approach to answerthe question related to mixing in the Mataura River. EFDC (Environmental Eluid Dynamics Code)
is a general-purpose, state-of-the-art hydrodyramic model modeling package for simulatingthree- dimensional flow, transport, and biogeochemical processes in surface water systemsincluding rivers, lakes, esfuaries, reservoirs, wetlands, and near-shore to shelf-scale coastal
regions (Hamrick L996).EFDC has been applied to many water bodies in support of environmentalassessment and management and regulatory requirements. It is widely used and technicallydefensible (Torres- Bejarano etalzots, USEPA zotr). tn addition to far-field fate and transportsimulation capability, EFDC includes a near-fteld discharge dilution and mixing zone module. The
near-field model is based on a Lagrangian buoyant jet and plume model and allowsrepresentation of submerged single and multiple port diffi,rsers (rrick 1984; Lee and Cheungleeo).
The EFDC Explorer modelling approach to mixing/dilution has number of advantages over an
actual dye release study. For instance, while a dye study requires (a) intensive consideration forhealth and safety issues, (b) extensive post-processing and skill, and (c) higher costs magnifiedby need for significant field deployment, its output and value are limited to prevailingconditions. These issues are overcome by using a contaminant dispersal modelling approach,which simulates a dye release using a conservative natural tracer. It was noted in Dada (zotg)that Alliance Plant discharge E coli levels can be as high as 400 times the level in the receivingwater. Hence, the discharge significantly raised E.coli levels in the Mataura River (but notpathogen levels or illness risks). This study therefore adopted E.coliasa preferred "tracer" and is
interchangeably referred to as analyte in this report. Results were verified using TP as an
alternate analyte. Analytes in the Alliance Plant discharge were treated as conservativeparameters in the model, i.e. no die-off, uptake, or transformations. The model was validatedwith downstream E.coli and TP analyte concentrations at the Mataura Bridge (Alliance Plantweekly monitoring data, 2Ol7 -2018).
3
2. Model Construction and P ar ameterisation
2.1 Model Setlp
The 'Dye' transport module, which is part of the EFDC hydrodynamic model, was used in this sfudy.rhe grid generation process, using a Cartesian Grid Type in the EFDC Model frame, was as
described in the EFDC guidance document (Hamrick leeo). Coordinates for the lower left andupper right coordinates that covered the outline ofthe relevant section ofthe Mataura River wereobtained from Google Earth. rhe land-boundary outlines of the relevant section of the Mataurafuver were produced using a combination of Google Earth and qCIS Desktop 2,18.t2. A total of390 active 75by 2Omgrid cells that captured the Mataura River section 300m upstream and rkmdownstream of the discharge were generated for the Mataura mixing study (Appendix r).
Environment Southland data on geological surveys related to the depth characteristics of theMataura River section (Appendix 1) were pre-processed with QGIS software (Quantum GIS,2011)and applied as bathymetry data in the EFDC.
Boundary conditions were prepared and assigned to the model cell configuration. In this case
there are three flow boundaries; one is inflow, i.e. upstream of the discharge, the second is theWWTP discharge into the Mataura River, while the third boundary is the outflow at thedownstream end of the modelled reach, at a point in the Mataura fuver which is approximately1.5km downstream of the discharge. The time series data for inflow and outflow boundariesapplied in the model are presented in Section 2.2. Data for dye concentrations applied in themodel, representing analyte concentrations for the inflow (receiving water, MatauraRiver@Gore) and the WWTP discharge, are presented in Section 2.3.
uodel calibration consisted of iterative adjustments to model parameters to match the measuredwater quality data. while most parameters in the model were kept at default values, theManning's coefficient and Courant-Friedrichs-Lewy (cFr)'number was adjusted. rhe calibratedEFDC model parameters for the Mataura River included a Manning number' of o.oz s/[m'lt] anda Courant-Friedrichs-Lewy (crr) number ofo.+. A model simulation time of 365 days and a modeltime step of 2 secs were applied.
Residual Mean Square rrror (RIraSEa), Pearson correlation and R-squared metrics were used tomeasure the goodness-of-fit of the EFDC model predictions as shown in the following equations.
2.2 Flow rates
Discharge volumes of treated wwTP effluent:
The maximum daily treated wastewater discharge of 6,638 cubic metres per day (i.e. 0.0s m3/s)was assumed in the EFDC model (rigure r). while the discharge could be as high as t4,4oo m3 f s,
I The CFL condition is a necessary condition for convergence while solvingcertain partial differential equations numerically as the inflow movesacross the discrete spatial grid. A good rule for modelling applications with spatial and temporal varying advective fields is to use a time stepon the order of 1 /s to t/z the limitiflg CFL time step (rroc guidance document). In this study a time-step of 0.2 was applied'zThe Manning constant forms part ofthe empirical formula used to estimate the average veloci[r ofa liquid flowing in a conduit that does notcompletely enclose the liquid, i.e., open channel flow. This constant is generally lower for clean, straight channels and higher for streams withvery weedy reaches, deep pools, or floodways with heavy underbrush
4
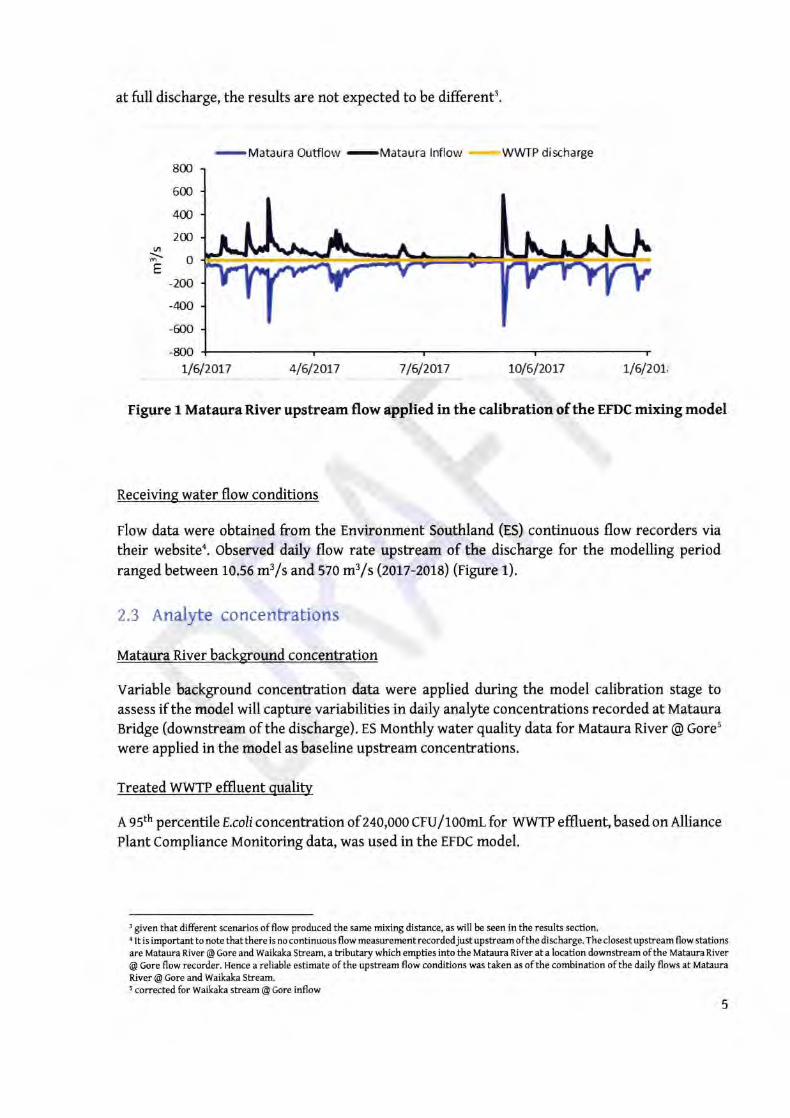
at full discharge, the results are not expected to be different3.
-[yls{391a
Outflow
-Mataura
lnflow WWTP discharge800
500
400
2nt,Eo
-200
-400
-500
-800L/612OL7 4/612OL7 7 /512017 1Ol6l2OL7 L/5/2o7,
Figure 1 Mataura River upstream flow applied in the calibration of the EFDC mixing model
Receiving water flow conditions
Flow data were obtained from the Environment Southland (ES) continuous flow recorders viatheir websitea. observed daily flow rate upstream of the discharge for the modelling periodranged between 10.56 m3/s and sto m3 /s (zott-zo1a) (Eigure l).
2.3 Analyte concentrations
Mataura River background concentration
Variable background concentration data were applied during the model calibration stage toassess if the model will capture variabilities in daily analyte concentrations recorded at MatauraBridge (downstream of the discharge). ES Monthly water quality data for Mataura River @ Gore5
were applied in the model as baseline upstream concentrations.
Treated wwTP effluent qualiW
A 95th percentile E.coli concentratronof zqo,000 CFU/Lo0mL for WWTP effluent, based on AlliancePlant Compliance Monitoring data, was used in the EFDC model.
3 given that different scenarios offlow produced the same mixing distance, as will be seen in the results section.I It is importantto note that there is no continuous flow measurementrecordedjustupstream ofthe &scharge. The closestupstream flow stationsare Mataura River @ Gore and Waikaka Streanr, a tributary which empties into the Mataura fuver at a location downstream of the Mataura River
@ Gore flow recorder. Hence a reliable estimate ofthe upstream flow conditions was taken as ofthe combination ofthe daily flows at MatauraRiver @ Gore and waikaka Stream.s corrected for Waikaka stream @ Gore inflow
5
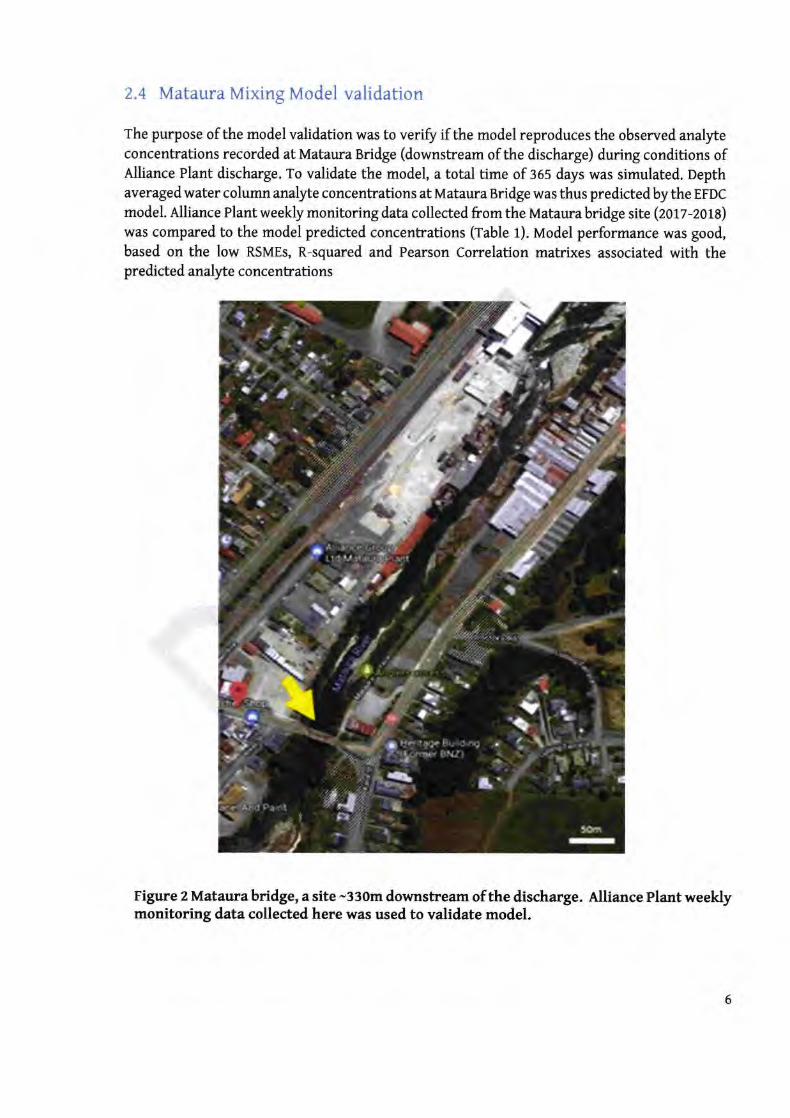
2.4 Mataura Mixing Model validation
The purpose of the model validation was to verifr if the model reproduces the observed analyteconcentrations recorded at Mataura Bridge (downstream of the discharge) during conditions ofAlliance Plant discharge. To validate the model, a total time of 365 days was simulated. Depthaveragedwater column analyte concentrations at Mataura Bridge was thus predictedbythe EFDC
model. Alliance Plant weekly monitoring data collected from the Mataura bridge site (zott-zou)rtras compared to the model predicted concentrations (rable 1). Model performance was good,based on the low RSMEs, R-squared and Pearson Correlation matrixes associated with thepredicted analyte concentrations
Figure ZMatarxabridge, a site -330m downstream of the discharge. nlliance Plant weeklymonitoringdatacollected here was used to validate model.
6
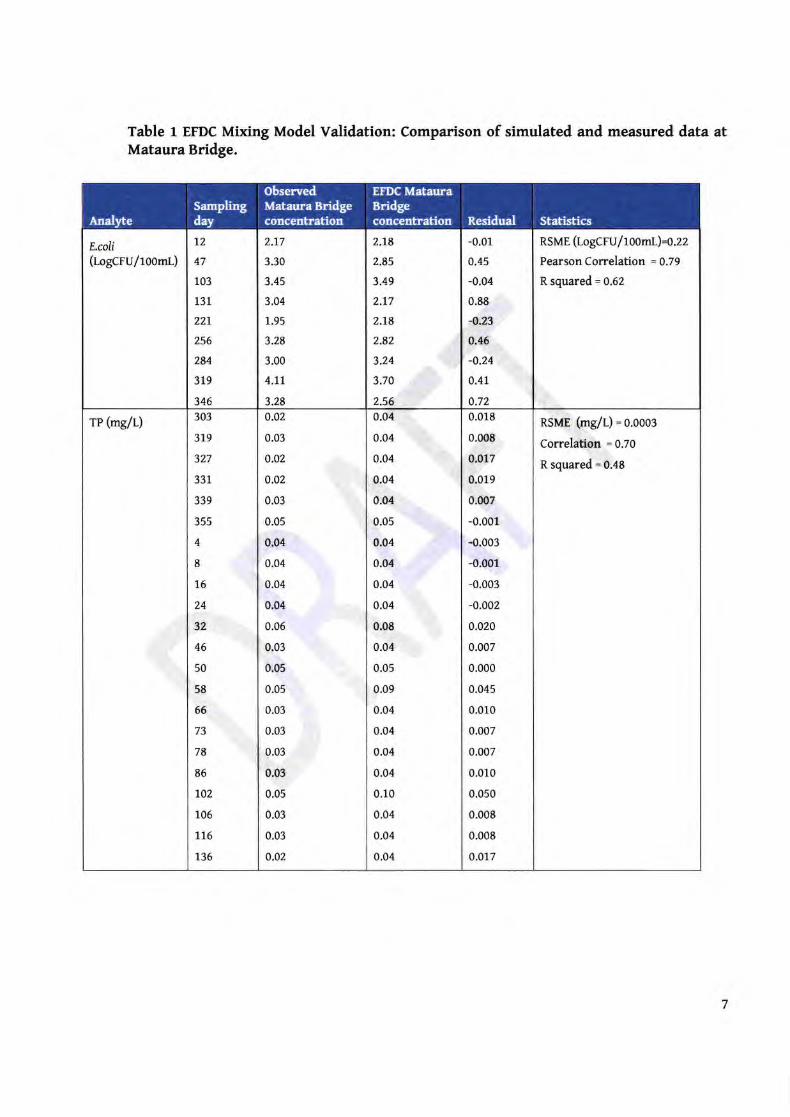
Table 1 EFDC Mixing Model Validation: Comparison of simulated and measured data atMataura Bridge.
E.coli(l-ogcru/roomr)
12
47
103
131
227
256
284
379
346
2.77
3.30
3.45
3.04
1.95
3.28
3.00
4.tt
3.28
2.18
2.85
3.49
2.17
2.18
2.82
3.24
3.70
2.56
-0.01
0.45
-0.04
0.88
-0.23
4.46
-0.24
0.41
0.72
RSME (LogcFv I toomt)=o.zz
Pearson Correlation = 0.79
R squared = 0.52
rP (mgll) 303
319
327
331
339
355
4
8
16
24
32
46
50
58
66
73
78
86
702
106
116
136
0.02
0.03
0.02
0.02
0.03
0.05
0.04
0.04
0.04
0.04
0.06
0.03
0.05
0.05
0.03
0.03
0.03
0.03
0.05
0.03
0.03
0.02
0.04
0.04
0.04
0.04
0.04
0.05
0.04
0.04
0.04
0.04
0.08
0.04
0.05
0.09
0.04
0.04
0.04
0.04
0.10
0.04
0.04
0.04
0.018
0.008
0.017
0.019
0.007
-0.001
-0.003
-0.001
-0.003
-0.002
0.020
0.007
0.000
0.045
0.010
0.007
0.007
0.010
0.050
0.008
0.008
0.017
RSME (mgll) = o.ooor
Correlation = 0.20
R squared = 0.48
observedSampling MatauraBridgeday concentration
EFDC MatauraBridgeconcentration Residual StatisticsAnalyte
7
2.5 Description of mixing scenarios
three flow scenarios were considered in the study
1. Typical flow conditions-median flow: In this scenario, the annual median flow rate (so.o m3/s)was applied in the model as t}re flow rate of the receiving Mataura River water.
2. Near worst-case flow: In this scenario, the summer median flow rate (ts.za m'/s) was appliedin the model as the flow rate of the receiving Mataura fuver water.
3. worst-case flow: In this scenario, half of the summer median flow rate (g.oqm3/s) was appliedin the model as the flow rate of the receiving Mataura River water.
The reason for including these three flow scenarios is to inform whether the mixing length isapproximately the same for higher flow rates as it is for the critical low flow rate.
2.6 Outputting of model results
Far-fi eld dilution outputs:
Far-field sites in this study were taken as sites fN away from the discharge point. Model outputwas generated by the model at one site upstream of the discharge and,lqsites downstream of thedischarge (os-Sites, see Figure g). rhe first downstream site (Ds-Site t), the immediate receivingenvironment of the Mataura River, was approximately 20 m from the discharge point. Othersubsequent downstream sites were spaced 100 m away from the previous downstream site(rigure 3). DS-Sites 6-11 were located in the part of the Mataura River where a small island,approximately eoo m downstream causes the river to split before coalescing further downstream.DS-Sites 12 and13 were approximately 900 m and 1000 m away from the first site, DS-Site f (Eigure
3).
Ana\rte concentrations generated at each of the 13 downstream sites were compared with eachother and with the baseline concentration (upstream site) to inform whether the mixing lengthis approximately the same for higher flow rates as it is for the critical low flow rate at the variousdownstream sites.
ear-field dilution
Near-field sites in this study were taken as sites near the discharge point. In order to capture near-field dilutions, a finer scale resolution of the model analyte risk map was made for the first 250
metres downstream of the discharge site (rigure s).
8
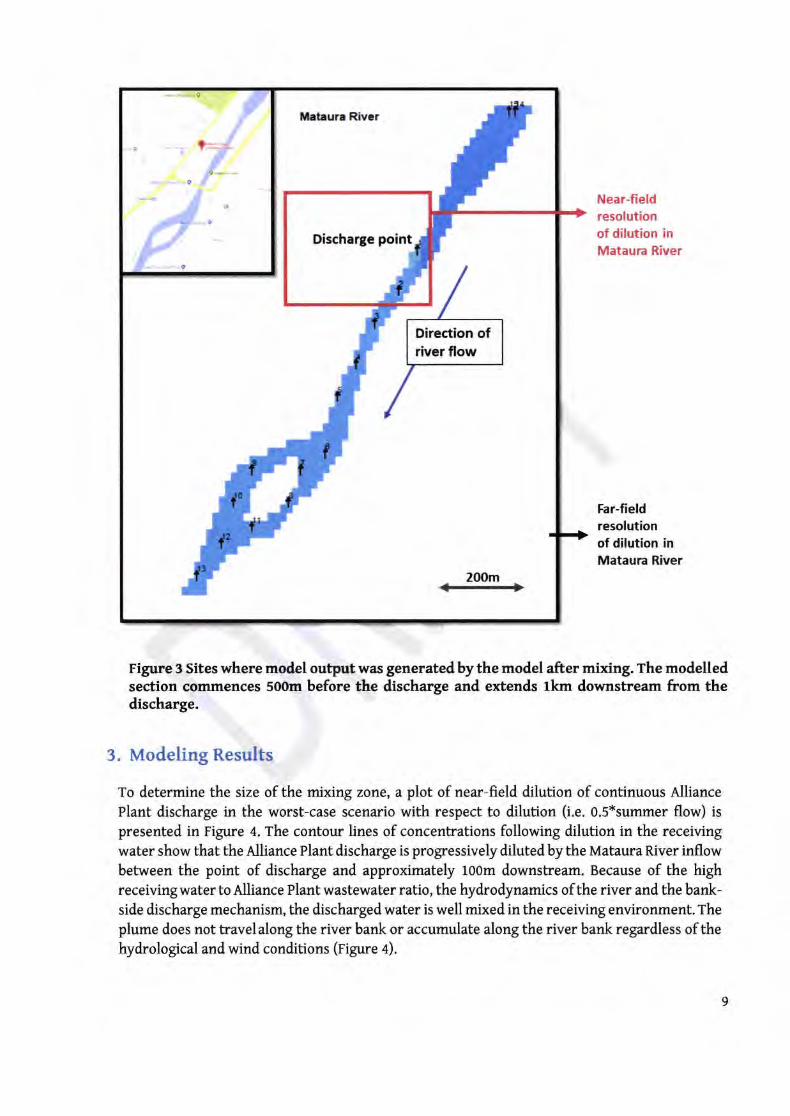
Discharge point
Direction ofriverflow
llateura Rivcr
2fi)m
Near-fieldresolutionof dilution inMataura River
Far-fieldresolutionof dilution inMataura River
Figure 3 Sites where model output was generated by the model after mixing. The modelledsection commences soom before the discharge and extends lkm downstream from thedischarge.
3. Modeling Results
To determine the size of the mixing zone, a plot of near-field dilution of continuous AlliancePlant discharge in the worst-case scenario with respect to dilution (i.e. o.5*summer flow) is
presented in Figure 4. The contour lines of concentrations following dilution in the receivingwater show that the Alliance Plant discharge is progressively diluted by the Mataura River inflowbetween the point of discharge and approximately 100m downstream. Because of the highreceiving water to Alliance Plant wastewater ratio, the hydrodynamics of the river and the bank-side discharge mechanism, the discharged water is well mixed in the receiving environment. The
plume does not travelalong the river bank or accumulate along the river bank regardless of thehydrological and wind conditions (Figure e).
9
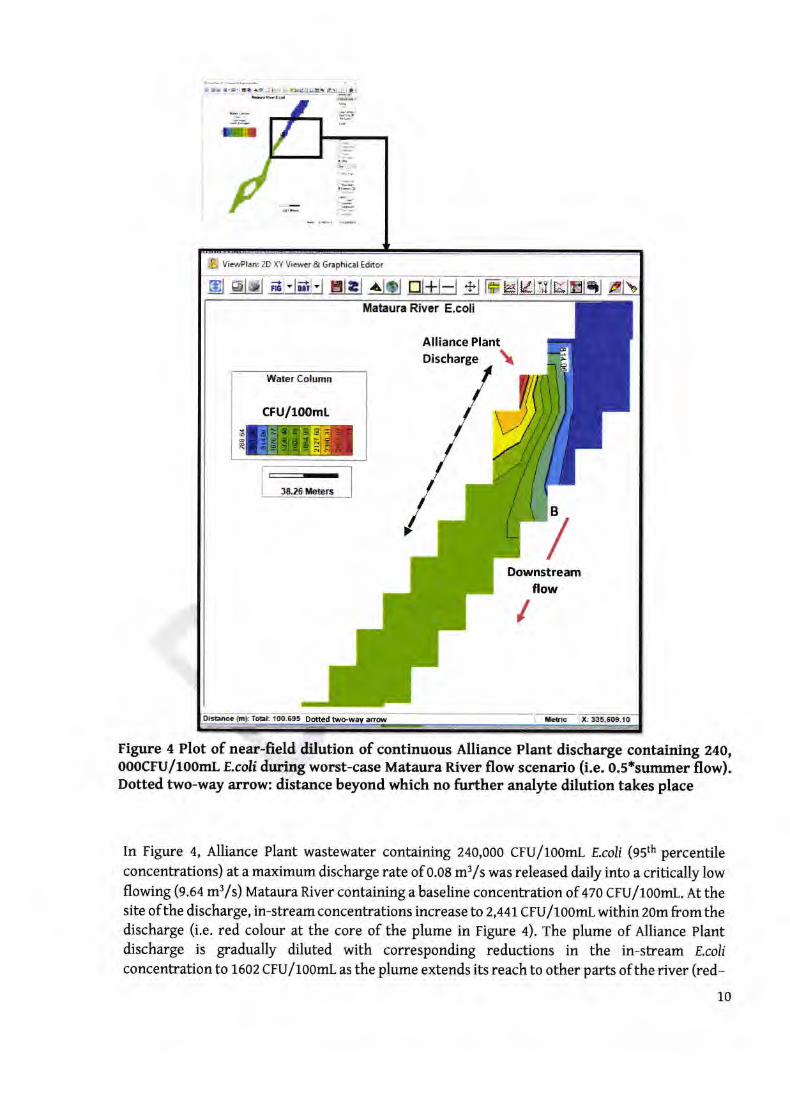
:[ L 1a:: I.] L :jb I g41!&] u.t.a-: a.,
.TT
Figure 4 Plot of near-fteld &lution of continuous Alliance Plant discharge containing 240,ooocFu/looml E colf during worst-case Mataura River flow scenario (i.e. 0.5*summer flow).Dotted two-way arrow: distance beyond which no further andyte dilution takes place
In Figure 4, Alliance Plant wastewater containing 240,000 CFU/1OOmL E.coli (95th percentileconcentrations) at a maximum discharge rate of o.oa m3/s was released daily into a critically lowflowing (e.a+m3/s) Mataura fuver containing a baseline concentrationof. qlo cFu/looml. At thesite ofthe discharge, in-streamconcentrations increase to2,44tcFu/lo0mtwithinzomfromthedischarge (i.e. red colour at the core of the plume in Figure a). rhe plume of Alliance Plantdischarge is gradually diluted with corresponding reductions in the in-stream E coliconcentration to 1602 CFU/lo0mL as the plume extends its reach to other parts of the river (red-
10
$ Vie*nbo 2D XY Viser & Graphical Editor
EJ rl*l Ei:ld:l rlrl ^lol trl+l-l c., lffiklL(lfflxlffilql 6b
hlater Column
CFU/100mtEre3826hters
f,
IXrbE {illi Td: tD-61}lt Dotted two-way anow i- kric :x33f,GsJo
E.coli
\
B
I
Alliance PlantDischarge
Downstreamflow
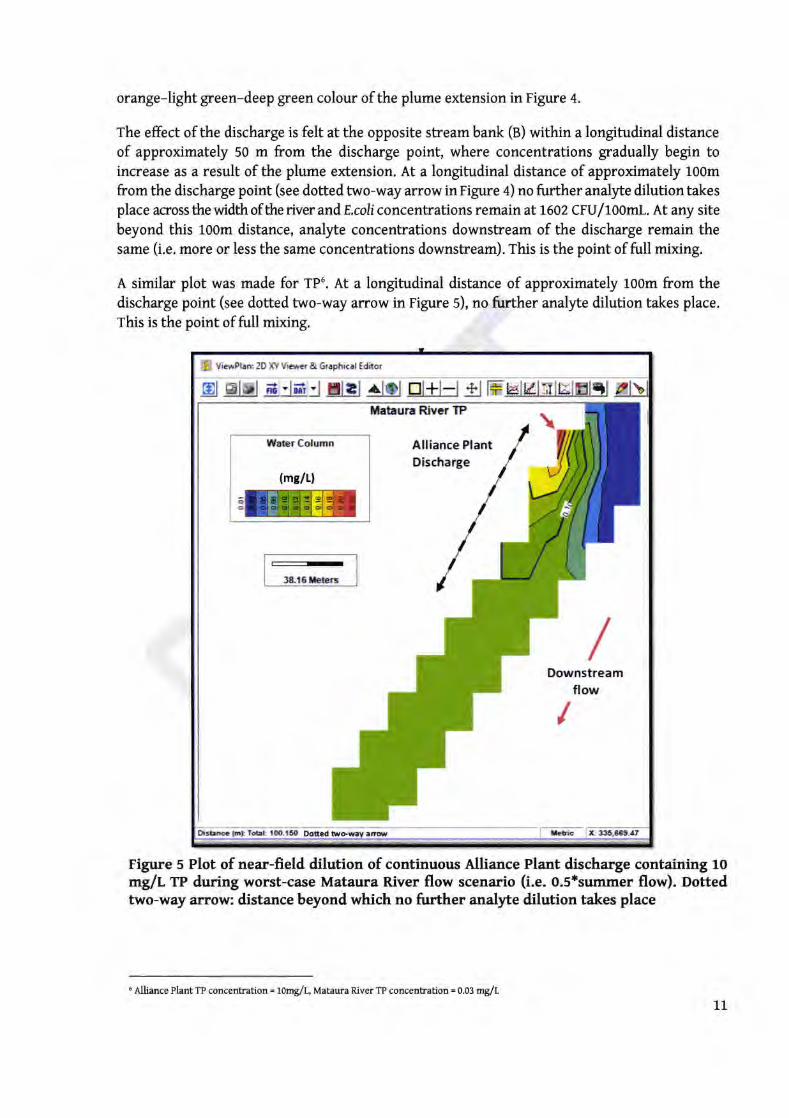
orange-light green-deep green colour of the plume extension in Figure 4.
The effect of the discharge is felt at the opposite stream bank (g) within a longitufinal distanceof approximately 50 m from the discharge point, where concentrations gradually begin toincrease as a result of the plume extension. At a longitudinal distance of approximately 100mfrom the discharge point (see dotted two-way arrow in Figure +) no further ana\rte dilution takesplace acrossthewidthoftheriverandr,.coliconcentrations remain atl602 CFU/10OmL. At any sitebeyond this 100m distance, analyte concentrations downstream of the discharge remain thesame (i.e. more or less the same concentrations downstream). rhis is the point of full mixing.
A similar plot was made for TP6. At a longitudinal distance of approximately 100m from thedischarge point (see dotted two-way arrow in Figure 5), no further analyte dilution takes place.
This is the point of full mixing.
Figure 5 Plot of near-fteld dilution of continuous Alliance Plant discharge containing 10mg/L TP during worst-case Mataura River flow scenario (i.e. 0.5*summer flow). Dottedtwo-way arrow: distance beyond which no further analyte dilution takes place
EJ rlnl E:lf':J ll.l ^l.l trl+l-l g meslealnlxlslql
3&t6h.rg
Wator Column
{melt)
=-Gil
S ViciPhft 2D XY Vim & Graphkal Ednor
Itataura River
fobl: tm.l5o
I
Liic
\Alliance PlantDischarge
Downstreamflow
I:
6 Alliance Plant TP concentration = 10mg/I. Mataura River TP concentration = 0.03 mg/L
L1
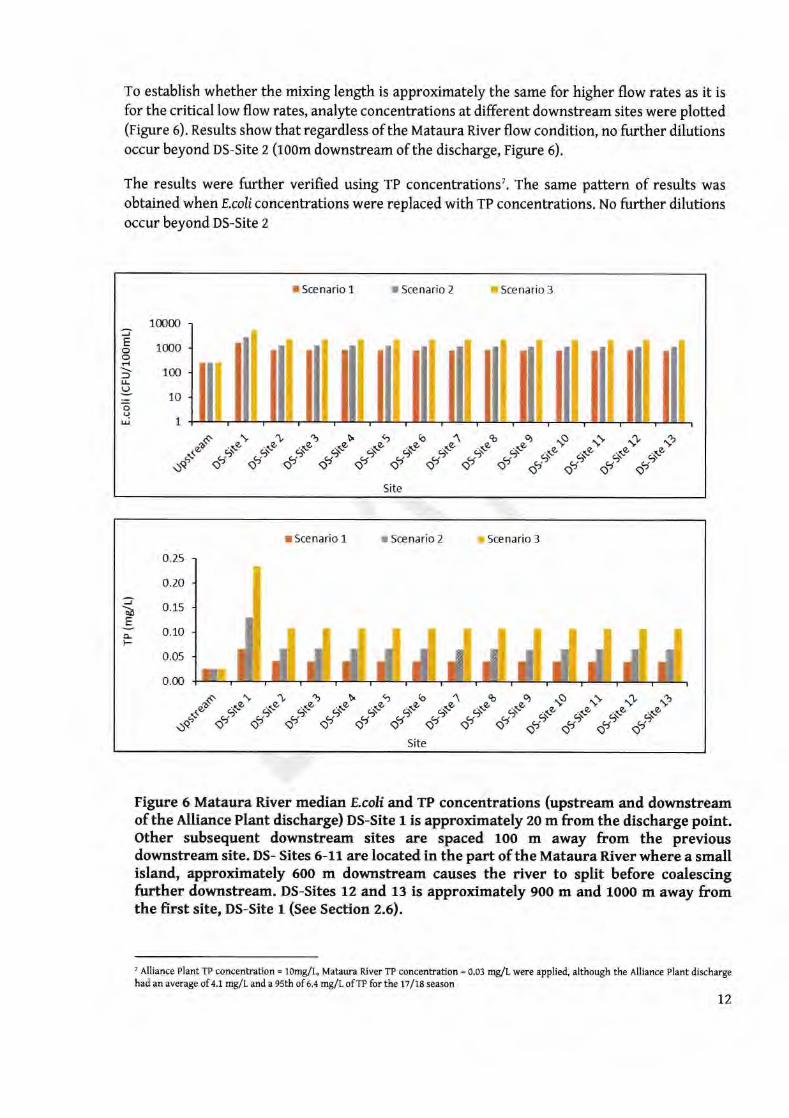
To establish whether the mifng length is approximately the same for higher flow rates as it isfor the critical low flow rates, analyte concentrations at different downstream sites were plotted(rigure s). Results show that regardless of the Mataura River flow condition, no further dilutionsocctr beyond DS-Site z (room downstream of the discharge, Figure 6).
The results were firrther verified using TP concentrationsT. The same pattern of results wasobtained when E.rnliconcentrations were replaced with TP concentrations. No further dilutionsocctr beyond DS-Site 2
Figure 6 Mataura River median E.coli and IP concentrations (upstream and downstreamof the Alliance Plant discharge) DS-Site 1 is approximately 20 m from the discharge point.Other subsequent downstrearn sites are spaced 10o m away from the previousdownstream site. DS- Sites 6-11 are located in the part of the Mataura River where a smallisland, approximately 600 m downstream causes the river to split before coalescingfurther downstream. DS-Sites 12 and 13 is approximately 900 m and rooo m away fromthe fust site, DS-Site t (See Section 2.6).
7 Alliance Plant TP concenfration = l0mgA Mataura River TP concenEation = 0.03 mg,/L were applied, although the Alliance Plant dtschargehad an average of +.trylltand,alsdr of e.l mglr ofm for the rz/r8 season
12
JEood
lrL.,
o(.1q
1moo
1000
1
Site
IScenariol rScenario2 aScenario3
100
10
.*dorodordotu*ort"'"ordoru-f o/ ",*r",o"!*d],*{,,.f
0.25
0.20
o.15
0.10
0.05
o.m
o*".'""*+*"+*"t'd"+J"+'"or0.""r"*J.ff .+*lr*d"rr{r".f
3b€6-F
rScenariol rScenarioZ .Scenario3
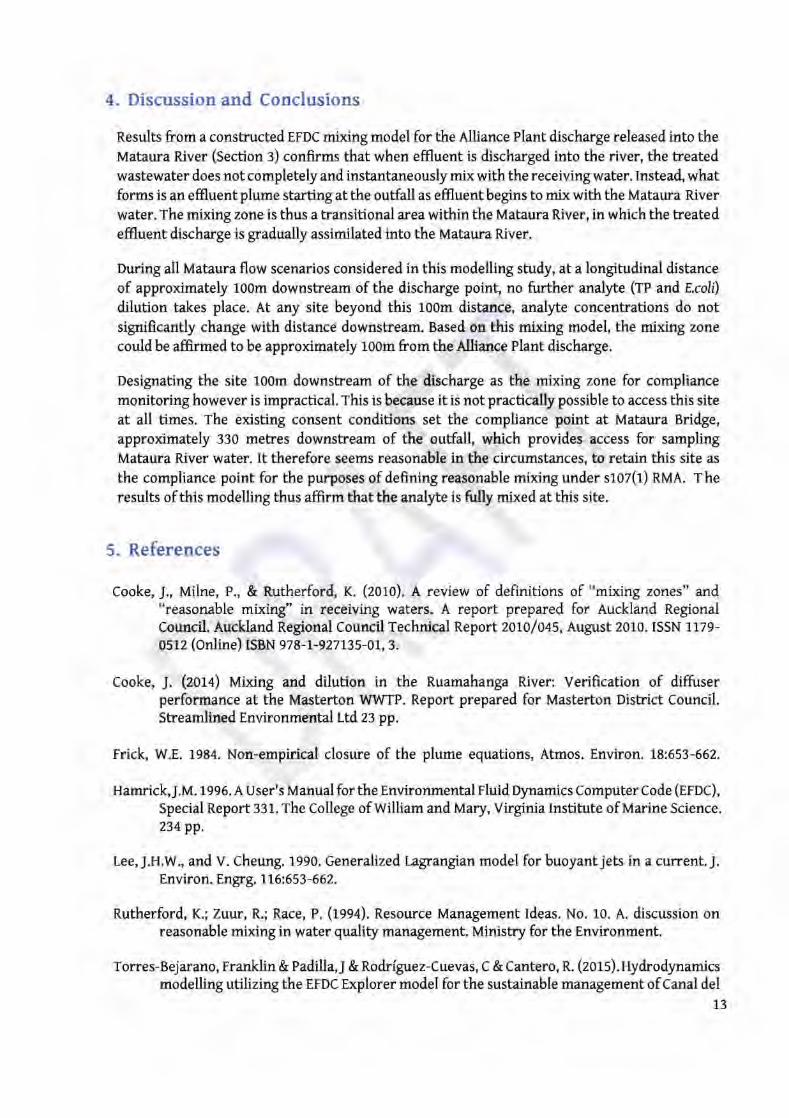
4. Discussion and Conclusions
Results from a constructed EFDC mixing model for the Alliance Plant discharge released into theMataura River (Section 3) confirms that when effluent is discharged into the river, the treatedwastewater does not completely and instantaneously mix with the receiving water. Instead, whatforms is an effluent plume starting at the outfall as effluent begins to mix with the Mataura Riverwater. The mixing zone is thus a transitional area within the Mataura River, in which the treatedeffluent discharge is gradually assimilated into the Mataura River.
During all Mataura flow scenarios considered in this modelling study, at a longitudinal distanceof approximately 100m downstream of the discharge point no further analyte (rp and E.coli)
dilution takes place. At any site beyond this toom distance, analyte concentrations do notsignificantly change with distance downstream. Based on this mixing model, the mixing zone
could be affirmed to be approximately 100m from the Alliance Plant discharge.
Designating the site 100m downstream of the discharge as the mixing zone for compliancemonitoring however is impractical. rhis is because it is not practically possible to access this siteat all times. The existing consent conditions set the compliance point at Mataura Bridge,approximately 330 metres downstream of the outfall, which provides access for samplingMataura River water. It therefore seems reasonable in the circumstances, to retain this site as
the compliance point for the purposes of deftning reasonable mixing under s10z(r) RMA. Theresults of this modelling thus affirm thatthe analyte is fully mixed at this site.
5. References
Cooke, J., Milne, P., & Rutherford, K. (2010). A review of definitions of "mixing zones" and"reasonable mixing" in receiving waters. A report prepared for Auckland RegionalCouncil. Auckland Regional Council technical Report 2OLOf045, August 2010. ISSN 1179-
0512 (Online) tSgr.r 978-t-927t35-01, 3.
Cooke, J. Qot+) Mixing and dilution in the Ruamahanga River: Verification of diffirserperformance at the Masterton WWTP. Report prepared for Masterton District Council.Streamlined Environmental I-td n pp.
Frick, w.E. 1984. Non-empirical closure of the plume equations, Atmos. Environ. 18;553-662
Hamrick,J.M. 1.996. A User's Manual for the Environmental rluid oynamics Computer Code (rroC),Special Report 331. The College of william and t"tary, Virginia Institute of Marine Science.234pp.
Lee,J.H.W., and V. Cheung. 1990. GeneralizedLagrangSan model for buoyantjets in a current.J.Environ. Engrg. 116:653-662.
Rutherford, K.; Zuur, R.; Race, p. (rqga). Resource Management Ideas. No. 10. A. discussion onreasonable mixing in water quality management. Minisbry for the Environment.
Torres-Bejarano, Franklin & Padilla,J & Rodriguez-Cuevas, C & Cantero, R. (zors).Hydrodynamicsmodelling utilizing the EFDC Explorer model for the sustainable management of Canal del
13

Dique-Guajaro hydrosystem, Colombia . Lo.z495 / 5D150371.
USEPA (tggl) EPA Region VIII Mixing Zones and pilution Policy. Denver, Co, U.S. EnvironmentalProtection Agency, Region VIII, Water Management Division.
USEPA 2017 Introduction to EFDC: Water audity Modeling Basics and Beyondhttps://www.epa.gov/sites /production/files/zot g-Or/documents/flyer webinar rr efdc Sog .pdf
t4
Appendices
Appendix 1 Topographic-bathymetric characteristics for the Mataura River
section (Nzru projection, vertical elevation in m a.s.l.).
-DX.7hr
15

L
'l
APPENDIX 5
Mataura River Alliance Discharge:ldentification of in-river recreationvalues,
Rob Greenaway & Associates, 2019.
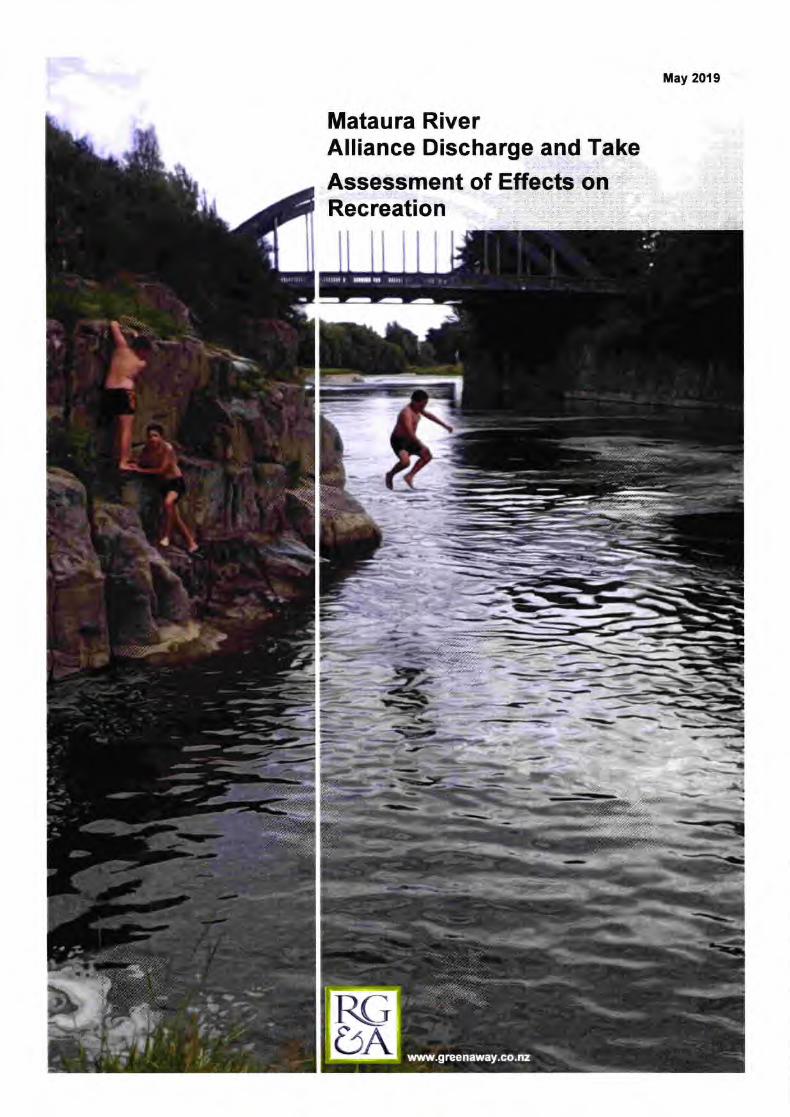
May 2019
Mataura RiverAlliance Discharge and Take
Assessment of Effects onRecreation
Mataura RiverAlliance Discharge and Take
Assessment of Effects on Recreation
May 2019Prepared forMitchell Daysh
By
Rob Greenaway & Associateswww.greenaway.co.nz
Version status
Final
llataura Rrver Ailiance Drscharge Assessment rf effects 3n recreatton?G&A icr !litcnerl ,-laysn
2
Mataura River
Alliance Discharge and Take
Assessment of Effects on Recreation
Gontents
Water Conservation Order.....Department of Conservation..Mitaitai Reserve......Southland District Council......Gore District Counci1..............Southland Regional Council ..
3 Activity specific data............
2.12.22.32.42.52.6
3.13.23.33.43.53.6
..8101011
11
13
l515
23242527
303033
35363637
Public access........Trout and salmon fishing .......Kayaking and raftingSwimmingJet boatingWhitebaiting
7.1.1 Waterbome disease7.1.2 Trout and whitebait abundance and quality7.1.3 Periphyton growths.......7.1.4 Odour and other water quality issues..........
Effects summary.....
....18
........45
......,.46
........46
........46
........47
4 Other recreation research.....4.14.24.3
4.44.54.6
Public Health South ....,.....Environment Southland Recreational Bathing SurveyNew Zealand Recreational River Use Study: specialisation, motivation and sitepreference...Water Bodies of National lmportance..New Zealand recreational river survey.National lnventory of \Mld and Scenic Rivers..........
6 lnterview summaries................. ..--...........4
7 Effects of Alliance discharge and take..... ..................45
7.2
8
9
Conclusion ...48
References ........49
Appendix l: lnterview summaries. ................519.1 David Murray-Orr, angling guide .......519.2 Barry Perkins, angling 9uide........... .......................529.3 Brendan Shields, angling 9uide........... ..................529.4 DarylPaskell, angling guide.......... ........................529.5 Julian Peters, angling guide.......... ........................539.6 Lloyd Smith, angling 9uide........... ......539.7 Zane Moss, Manager Southland Fish and Game.......... ............54
Mataura River Alliance ?ischarge : Assessmenl ci e{leets ,n .ecreationRG&A for !litcnell Daysh
Figures
Figure 1: Mdtaitai Reserve at Mataura. Source: NABIS
Figure 2: Mataura River public access example - \A/inton. Source: WAMS........
Figure 3: Lower Mataura River angler access. Source WAMS / Southland Fish and Game
Figure 4: NZ Angler days on the Mataura River by section, 1994/95 lo 2014115...
Figure 5: Angler days on the Mataura River by reach and oi1in,2014115...............
Figure 6: NZ Angler days on the Mataura River by period and reach, 2014115
Figure 7: Bathing quality monitoring sites and state (LAWA, April2019)
Figure 8: Speed uplifts on the Mataura River. Beacon online GIS (SRC)
Figure 9: Map 4 detail, GIS inset
Figure 10: Consented whitebait stands, Mataura River and Titiroa Stream
Figure 1 1 : Mataura River whitebaiter perceptions of water quality (count). ES 2013
Figure 12: Public Health South (2019) disease incidence by localauthority......
Figure 13: Public Health South (2019) disease incidence by risk factor..........
Figure 14: Public Health South (2019) water contact disease by local authority......
Figure 15: Most popular Southland river, lake and marine seftings (Ward 2015)
Figure 16: Recreation activities by number of responses (count) (Ward 2015)
Figure 17: Reasons for non-participation by number of responses (count) (Ward 2015) .....
Figure 18: Observation data by activi$ - all sites
Figure 19: Observation data by activity and above or below Mataura Falls (counts) ... .
Figure 20: Camera image example (angler) at Mataura Bridge
Figure 21. Camera data records at Mataura Bridge by hour (counts)
Figure 22. Camera data records at Mataura Bridge by day (counts)
24
25
26
28
Tables
Table 1:
Table 2:
Table 3:
Table 4:
Mataura River esplanade requirements, Southland District Plan 2018
Mataura River and relevant Southland fishing regulations 2018119.....
Values of New Zealand angling rivers - Otago. Source: Unwin (2013).
Main observation record sites (counts) .. .. .
...11
... 18
...20
...41
V{ataure liver .Ailiance )ischarge i Assessment cf effects on .ecreation?G&,.i 'or \rlitcnerl ?aysl
4
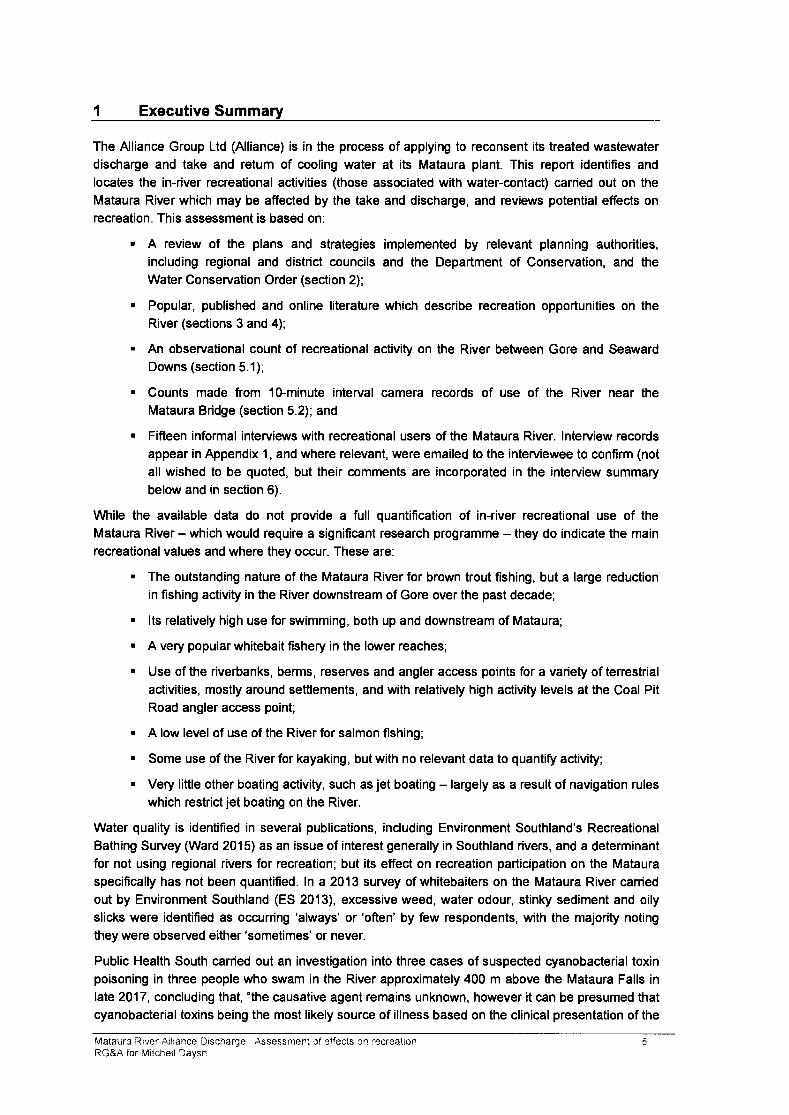
I Executive Summary
The Alliance Group Ltd (Alliance) is in the process of applying to reconsent its treated wastewaterdischarge and take and retum of cooling water at its Mataura plant. This report identifies and
locates the in-river recreational activities (those associated with water-contact) carried out on the
Mataura River which may be affected by the take and discharge, and reviews potential effects on
recreation. This assessment is based on:
. A review of the plans and strategies implemented by relevant planning authorities,
including regional and district councils and the Department of Conservation, and the
Water Conservation Order (section 2);
. Popular, published and online literature which describe recreation opportunities on the
River (sections 3 and 4);
. An observational count of recreational activity on the River between Gore and Seaward
Downs (section 5.1);
. Counts made ftom 10-minute interval camera records of use of the River near theMataura Bridge (section 5.2); and
. Fifteen informal interviews with recreational users of the Mataura River. lnterview records
appear in Appendix 1, and where relevant, were emailed to the interviewee to confirm (not
all wished to be quoted, but their comments are incorporated in the interview summarybelow and in section 6).
While the available data do not provide a full quantification of in-river recreational use of the
Mataura River - which would require a significant research programme - they do indicate the main
recreational values and where they occur. These are:
. The outstanding nature of the Mataura River for brown trout fishing, but a large reduction
in fishing activity in the River downstream of Gore over the past decade;
. lts relatively high use for swimming, both up and downstream of Mataura;
. A very popular whitebait fishery in the lower reaches;
. Use of the riverbanks, berms, reserves and angler access points for a variety of terrestrialactivities, mostly around settlements, and with relatively high activity levels at the Coal Pit
Road angler access point;
. A low level of use of the River for salmon fishing;
. Some use of the River for kayaking, but with no relevant data to quantiff activity;
. Very little other boating activity, such as jet boating - largely as a result of navigation rules
which restrict jet boating on the River.
Water quality is identified in several publications, including Environment Southland's Recreational
Bathing Survey (Ward 2015) as an issue of interest generally in Southland rivers, and a determinantfor not using regional rivers for recreation; but its effect on recreation participation on the Mataura
specifically has not been quantified. ln a 2013 survey of whitebaiters on the Mataura River carried
out by Environment Southland (ES 2013), excessive weed, water odour, stinky sediment and oilyslicks were identified as occurring 'always' or'often' by few respondents, with the majority noting
they were observed either'sometimes' or never.
Public Health South carried out an investigation into three cases of suspected cyanobacterial toxinpoisoning in three people who swam in the River approximately 400 m above the Mataura Falls in
lale 2017, concluding that, 'the causative agent remains unknown, however it can be presumed thatcyanobacterial toxins being the most likely source of illness based on the clinical presentation of the
l\rlataura Siver Aliiance )iscnarge Assessment of effects on 'ecreatior':RG&A ior \illtcieil Daysn
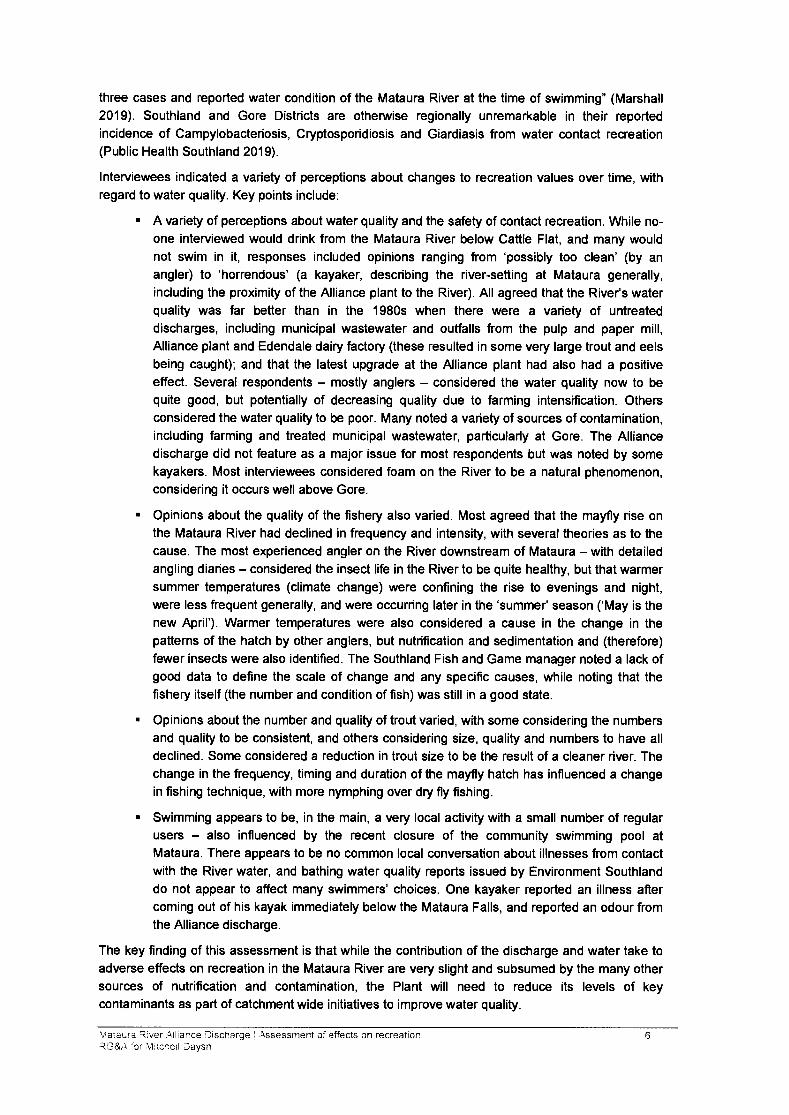
three cases and reported water condition of the Mataura River at the time of swimming" (Marshall
2019). Southland and Gore Districts are othenryise regionally unremarkable in their reportedincidence of Campylobacteriosis, Cryptosporidiosis and Giardiasis from water contact recreation(Public Health Southland 2019).
lnterviewees indicated a variety of perceptions about changes to recreation values over time, withregard to water quality. Key points include:
. A variety of perceptions about water quality and the safety of contact recreation. While no-one interviewed would drink from the Mataura River below Cattle Flat, and many wouldnot swim in it, responses included opinions ranging from 'possibly too clean' (by an
angler) to 'horrendous' (a kayaker, describing the river-setting at Mataura generally,
including the proximity of the Alliance plant to the River). All agreed that the Riveds waterquality was far better than in the 1980s when there were a variety of untreateddischarges, including municipal wastewater and outfalls from the pulp and paper mill,
Alliance plant and Edendale dairy factory (these resulted in some very large trout and eels
being caught); and that the latest upgrade at the Alliance plant had also had a positive
effect. Several respondents - mostly anglers - considered the water quality now to bequite good, but potentially of decreasing quality due to farming intensification. Othersconsidered the water quality to be poor. Many noted a variety of sources of contamination,including farming and treated municipal wastewater, particularly at Gore. The Alliancedischarge did not feature as a major issue for most respondents but was noted by somekayakers. Most interviewees considered foam on the River to be a natural phenomenon,
considering it occurs well above Gore.
. Opinions about the quality of the fishery also varied. Most agreed that the mayfly rise onthe Mataura River had declined in frequency and intensity, with several theories as to thecause. The most experienced angler on the River downstream of Mataura - with detailedangling diaries - considered the insect life in the River to be quite healthy, but that warmersummer temperatures (climate change) were confining the rise to evenings and night,were less frequent generally, and were occurring later in the 'summe/ season ('May is thenew April'). Warmer temperatures were also considered a cause in the change in thepatterns of the hatch by other anglers, but nutrification and sedimentation and (therefore)fewer insects were also identified. The Southland Fish and Game manager noted a lack ofgood data to define the scale of change and any specific causes, while noting that thefishery itself (the number and condition of fish) was still in a good state.
. Opinions about the number and quality of trout varied, with some considering the numbersand quality to be consistent, and others considering size, quality and numbers to have alldeclined. Some considered a reduction in trout size to be the result of a cleaner river. Thechange in the frequenry, timing and duration of the mayfly hatch has influenced a changein fishing technique, with more nymphing over dry fly fishing.
. Swimming appears to be, in the main, a very local activity with a small number of regularusers - also influenced by the recent closure of the community swimming pool atMataura. There appears to be no common local conversation about illnesses from contactwith the River water, and bathing water quality reports issued by Environment Southlanddo not appear to affect many swimmers' choices. One kayaker reported an illness aftercoming out of his kayak immediately below the Mataura Falls, and reported an odour fromthe Alliance discharge.
The key finding of this assessment is that while the contribution of the discharge and water take toadverse effects on recreation in the Mataura River are very slight and subsumed by the many othersources of nutrification and contamination, the Plant will need to reduce its levels of keycontaminants as part of catchment wide initiatives to improve water quality.
\'laiaLra ?rver .a.iliance lischarge I Assessment of effects cn recreationlG&,I 'cr Vlitcnerl laysn
o
Based on the findings of Dada (2018) and Montgomerie et al (2019), there appears to be no causalrelationship between the discharge and levels of periphyton, macroinvertebrates, colour, clarity orthe generation of foams or scums - and hence trout and whitebait habitat and the ability to catchthem. Odour was reported as a potential issue by two interviewees, but appears to be confined tothe area in the immediate vicinity of the Plant and within the discharge mixing zone (and so could
be from the treatment plant rather than the discharge or River). Dada (2018) found elevated levelsof E.coliassociated with the discharge, but very low and variable levels of human pathogens, andtherefore low human health risk. Nevertheless, options to further reduce these E.coli and nutrientoutputs are recommended, and while not urgent considering the existing low scale of effect onrecreation amenity (and ecological values), it is recommended that they be implemented during thelife of a renewed consent.
Public Health South has noted a lack of waming signs about water contact recreation along theMataura River; and the only swimming warning signs located beside the River in January 2019between Gore and the coast were at Fortrose (erected by Environment Southland) and 'no diving'signs at either end of the Mataura Bridge. Alliance is not responsible for regional signage of thistype, and there is no requirement to include sign installation as a consent condition (also
considering the discharge has very little influence on water quality for contact recreation). However,as recommended by Public Health South, their installation needs consideration at the regional anddistrict levels.
fulataura River A,liance Discharge Assessment cf effects ro recrealionRG&A ior \r'litcnell Daysn
2 Plans and Strategies
This section considers regional recreation planning material in relation to recreation values on theMataura River. National plans and strategies - such as the National Poliry Statement forFreshwater Management - are reviewed in the summary Assessment of Environmental Effects
accompanying the consent application and in other parallel assessments - such as Dada (2018)
and Montgomerie ef al(2019).
2.1 Water Conservation Order
The Water Conservation (Mataura River) Order 1997 relates to the Mataura River from source to
sea, as well as the Waikaia River and its tributaries, the Otamita Stream, and all other tributaries ofthe Mataura River upstream of its confluence with the Otamita Stream and the Mimihau Stream and
the Mokoreta River and each of their tributaries. The watenrays' protected 'outstanding features''indude outstanding fisheries and angling amenity features'. The Order controls the opportunity to
dam the River and its tributaries, as well as defining standards for water quali$ and quantity.
The relevant Report and Recommendation of The Planning Tribunal (July 1989, Decision C32l90)focused - in line with the application - on the Rive/s amenity for brown trout angling, finding (pp39-40):
We have very carcfully rcviewed all the evidence given by the local anglerc and the
scrbnfists, including those whose specialties arc concemed morc with iver flora andinveftebrute populations. Having done so, we have concluded that the Mataun Riversysfem does contain an outstanding fishery and an outstanding angling amenity.
As we said eadier therc is rcally liftle dispute about the angling amenity, and in this rcgadwe think it is ight to give somewhat more weight to the so-called anecdotal evidence than
the objectors would have us do. After allff goes back for neady 100 yearc and we thinkweight should be given to the fact that for pnctically the whole of that time, this iver systemhas enjoyed a rcputation both within New Zealand and overseas for high quality brcwn troutangling. Then we take into account that for some yea,s now, the system has not been
aftificially stocked and yet it has continued to provide a high catch rate by both national andintemational standads. We think, as indeed all the fshen'es scienfisfs agrced, that this isevidence that the river system supporfs a significantly larye fish population. We think it rightto say too that the outstanding angling amenity rc a conseguence of the outstanding fishery,
for without this high quality fishery one of the impoftant features of the angling amenity,
namely the high catch nte, would not exist. lt is this featurc in pafticular that distinguishesthe Mataun River fishing and angling amenity frcm, for example, the Ahuii River, a
distinction rcfened to specifically by MrWthercw.
We also give weight to the fact that the iver system prcvides for the full range of anglingexperiences.l This toq ls assocrafed with the fishery and the changes in it that arc evidentin differcnt parts of the river system, including the tibutaies.
Further detail was provided by witnesses for the applicant (pp13-14):
As we said eadier, Mr Weddell confirmed the prcsence of sea run trcut frcm Mataura lslandto the sea. He spoke about the impoftance of maintaining the quality of the fisheies in the
tributaries so thaf the mainstem does not come under incrcasing angling pressure. He saidthat there wete severa/ reasons for the Mataura River being a quality fishery. Therc is areliable flow of clean water, a rclatively shallow gradient, and inaccessrb/e areas to provide
the fish with a haven to grow. He pointed out too that Gorc ma*ets ifse/f as the brcwn trcut
1 '... including bait fishing, spinning and lty fishing." (p11)
lvlataura River Alliance Discharge I Assessment of effects on recreationRG&A for Mitchell Daysh
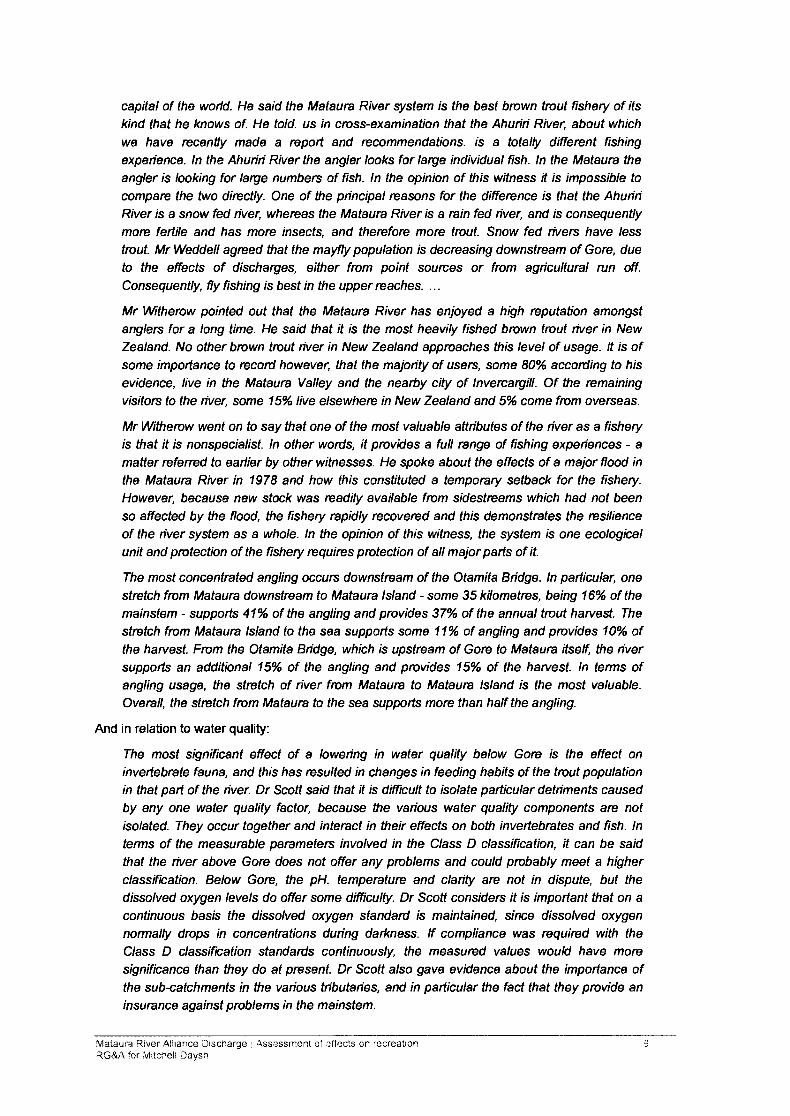
capital of the wodd. He said the Mataura River system is fhe best brown trout fishery of itskind that he knows of. He told. us ln cross-examination that the Ahurii River, about which
we have rccently made a rcpoft and recommendations. is a totally different fishingexpeience. ln the Ahurii River the angler looks for larye individual fish. ln the Mataura the
angler is looking for larye numberc of fish. ln the opinion of this r,vitness it is impossible tocompare the two dircctly. One of the pincipalreasons for the difference is that the AhuriiRiver is a snow fed river, whercas the Mataura River is a nin fed river, and is consequentlymorc feftile and has more insects, and thereforc morc trout. Snow fed nVers have /ess
trout. MrWeddell agrced that the mayfly population is decrcasing downstream of Gorc, due
to the effects of discharyes, either frcm point sources or from agicultural run off.
Consequently, fly ftshing is best in the upper rcaches. ...
Mr Wtherow pointed out that the Mataun River has enjoyed a high reputation amongstanglerc for a long time. He said that it is the most heavily fished brown trout iver in NewZealand. No other brown trout river in New Zealand approaches this level of usage. lt is ofsome impoftance to record however, that the majoity of users, some 80%io according to hisevidence, live in the Mataura Valley and the neahy city of lnvercaryill. Of the rcmainingvrsifors to the iver, some 15%o live elsewhere in New Zealand and 5% come from overseas.
Mr Witherow went on to say that one of the most valuable aftibutes of the river as a fisheryis that it is nonspecialist. ln other wods, it provides a full nnge of ftshing expeiences - amatter refened to eadier by other witnesses. He spoke about the effects of a major flood inthe Mataura River in 1978 and how this constituted a temponry setback for the fishery.
However, because new stock was readily available from sidestreams which had not been
so affected by the flood, the fishery npidly recovercd and this demonstrates the rcsilienceof the river sysfem as awhole. ln the opinion of this wifnesg the system rs one ecologicalunit and protection of the fishery rcquircs protection of all major pafts of it.
The most concentrated angling occurs downstrcam of the Otamita Bidge. ln pafticular, one
sfrefch from Mataura downstrcam to Mataura lsland - some 35 kilometres, being 16% of the
mainstem - supporfs 41% of the angling and provides 37% of the annual trcut haruest. The
strctch frcm Mataura lsland to the sea supports some 11%o of angling and prcvides 10% ofthe haruest. From the Otamita Bidge, which is upstream of Gore to Mataura itself, the iversupporfs an additional 15% of the angling and provides 15% of the haruest. ln terms ofangling usage, the stretch of iver fiom Mataun to Mataurc lsland is the most valuable.
Overall, the strctch from Mataura to the sea supporfs more than half the angling.
And in relation to water quality:
The most significant effect of a loweing in water qualtty below Gore is the effect on
invertebrate fauna, and fhrb has resulted in changes in feeding habits of the trcut population
in that paft of the iver. Dr Scott sard that it is diffrcult to isolate pafticular detiments causedby any one water quality factor, because fhe vaious water quality components arc notisolated. They occur together and interact in their effects on both invertebrates and fish. ln
terms of the measurable parameters involved in the Class D classification, it can be said
that the river above Gore does not offer any problems and could prcbably meet a higherclassification. Below Gorc, the pH. temperaturc and clarity arc not in dispute, but the
drsso/ved oxygen levels do offer some difftculty. Dr Scotf consrderc it is impoftant that on acontinuous basrc fhe disso/ved oxygen standad is maintained, since drsso/ved oxygennormally drops in concentrations duing darkness- lf compliance vvas requircd with the
C/ass D classification sfandards continuously, the measured values would have more
significance than they do at prcsent. Dr Scoft also gave evidence about the importance ofthe sub-catchments in the vaious tibutaies, and in pafticular the fact that they prcvide an
insurance against problems in the mainstem.
Maiaura River Alliance )iscaarge Assessrnent of effects on .ecreationRG&A ior klitcheil Daysh
I

Little information about other recreational uses of the Mataura River besides evidence presented bythe then chair of the Hokanui Runaka, Naina Russell (p35):
The Matauru River plays a larye paft in the lives of Mrs Russe/I and her people who supporta managed apprcach and communtty use of the River. The River is used for gathering foodand for rccrcation. The waterc of the River also play a spiitual role in the lives of MrsRusse// and her people. The inanga or whitebait fishery, is a tnditional one, as rs fhe eelfishery. Eel numberc have fallen off but the members of the runaka do not know why.
2.2 Department of Conservation
The Southland Murihiku Conservation Management Strategy (CMS) 2016 references the MatauraRiver, below Ardlussa, only in relation to the application of the Water Conservation (Mataura River)Order 1997 (discussed above) and restoration works at the freshwater Mitaitai Reserve at Mataura(discussed below). There are no other recreation data in the CMS relating to recreation on theMataura River.
2.3 MitaitaiReserve
A map of the 9 km length of the MdtaitaiReserve at Mataura is provided by theMinistry for Primary lndustry's NationalAquatic Biodivercity lnformation Sysfem(NABIS) (Figure 1, in blue with the
Reserve's northem and southern
extents indicated).
The status of the Mitaitai Reserve is
defined by the Fisheries (Declaration ofMitaitai Reserve at Mataura River and
Appointment of Tangata Tiaki/Kaitiaki)Notice 2005 (No. F329).
The notice appoints a member of Ngai
Tahu as the Tangata Tiaki/Kaitiaki forthe Reserve, bans commercial fishing
and controls customary harvesting. The
objectives of the Hokonui RUnanga fortheir management of the Mataura River Mataitai Reserve are detailed online.2
The Fisheies (Mataun River Mataitai Reserue Bylaws) Notice 2009 (No. F485) fufther controlsfishing activity:
3 (a) No percon may:
(i) take any of the following specrbs within the Mataun River Mataitai Reserue; or
(ii) possess any of the following specrbs within that arca; or
(ry' possess any of the following species taken from within that arca: Lamprcy,
Shortfin eel and Longfin eel.
(b) No person may use, sef or possess any fyke net within the Mataura River MataitaiReserue.
National amateur fishing regulations otherwise apply, including those maintained by the NZ Fishand Game Council.
2 hftps:/Arnrrru.hokonuirunanga.org.nzlprojecls/environmenUmataura-mataitai/
Mataura River Alliance Discharge i Assessment of effects cn recreationRG&A for lvlitchell Daysh
Figure 1: Mitaitai Reserve at Mataura. Source: NABIS
{n

Cultural practices such as the harvesting of lamprey can have recreation components, but as theirmanagement is primarily within a cultural context, this recreation assessment does not apply. Thereis othenrise little available published data about recreational eel and lamprey fishing on theMataura River.
2.4 Southland District Council
The Southland District Plan 2018 does not describe any particular recreation values on the Mataura
River, but defines it as a river'requiring esplanade mechanisms'. Section 5.4 defines the rationalefor this requirement, based on a schedule 'prepared by the Southland Fish & Game Council -2012'(Table 1).
Table 1: Mataura River esplanade requirements, Southland District Plan 2018 Table 16section 5.4
Waterway
MatauraRiver
MatauraRiver
MatauraRiver
MatauraRiver
Location
Nokomai River confluence to DOCestate
Nokomai River confluence toTomogalak Stream confluence
Tomogalak Stream confluence toGore District boundary
Gore District boundary to the sea
Comments
Water Conservation Order applies
Water Conservation Order applies
Access points limited, Water ConservationOrder applies
Legal acress insecure, WaterConservation Order applies
Policy SUB.10 of the Plan notes (although the referenced schedule does not define the prefened
esplanade type):
Esplanade mechanisms prcvide for the prctection of conseruation values of riparianmargins, the maintenance of water quality and aquatic habitats and the enhancement ofpublic access and recreational opportunities. ln addition, esplanade reseryes can provide
access forwaterway maintenance or bank stability works.
Esplanade requircments vary, but generally reflect the naturc and width of the waterway, its
value for public access and rccreation, ifs conseruation value and the nature of adjoiningland use. Schedule 5.4 of the District Plan lists the arcas of coastline, lakes and ivercwhere esplanade mechanisms are required and the naturc of that esplanade.
The Southland District Council Patus and Reserves (Open Spaces/ Activity Management Plan2018-2028 (2018) identifies one Council reserve on the banks of the Mataura River: the \AfndhamWildlife Refuge, noting its purpose for 'casual recreation and wildlife reserve', and the general
description: "This reserve is located on the outskirts of the town adjacent to the eastern bank of theMataura River. Provides a habitat for a large number of bird species.' 'Utilisation' is described as'unknown'.
The Council's Open Spaces Strategy 2014-2024 is generic in nature and does not identiff anyspecific activities in any setting.
2.5 Gore District Gouncil
The Gore District Plan 2014 notes that the Mataura River is (section 2.2'l) "a significant waterway,of cultural and recreational importance. Most notably, it provides the habitat for the brown troutfishery for which the District is well known," and that it is one of only two outstanding natural
features in the District. The Plan notes (2.2.2 (2)),
The Mataura River is a significant natunl featurc, however, fhaf is best protected through
the provisions of a rcgional plan. A non-regulatory rcle can be adopted by the Gore District
iVataur3 R:ver Arliance ;iscaaage Assessment rf a$ecis cn "ecreationilC&A for !lrtcnetl )aysi
11
Council in order to ensure that people arc aware of 'tts significance and the positive actionsthey can take to protect the values of the river.
The Plan also notes the status of the WCO (e.9. 2.2.6,2.4.1).
Section 2.4.2 (Margins of Rivers and Streams, lssues) states that, "The Mataura River is a
significant natural feature and some management of activities taking place on its margins is
appropriate." With the objectives Q.a3):
(1) To prcserue the natural character of the margins of the Mataura River.
(2) To provide public access along the margins of the Matauru River wherc this is pncticaland can be safely undeftaken without adversely affecting the use of adjoining land.
With the principal reasons Q.a.Q:
(1) The Mataun River is a significant natural feature and land use activities on the marginsof the River could give nse fo significant adverse effects.
(2) To enable the provision of public access to the Mataura River for the enjoyment of therecrcational, cultural and landscape values, except where this will affect public health orsafety, orwherc site security would be comprcmised.
"Public access to the Mataura River and access for licensed sports fishers to the Waikaka Streamand their margins is considered important' is described as one of five issues to be addressed in thePlan's section 8, Subdivision of Land; with the relevant poliry 8.4 (6): 'Provide public access to andalong the Mataura River by way of esplanade strips."
The Gore Distict Council Parks, Recreation and Facilities Sfiiafegy 2013 does not identiff anyspecific recreation activities on the Mataura River, but notes its role in providing the opportunity forriparian 'Linkage Parks'with development standards (2.4.3) "to provide corridors of land to provide
acoess to and along watenrays, and to provide for pedestrian and ryde activities'. No formed orsurfaced tracks or paths are proposed within the development standard for these areas ('grass
only').
The Gore Distict Council Reserue Management Plan 2016, while identiffing several river-sidereserves all upstream of Mataura (Richmond Street Community Centre, Richmond StreetRecreation Reserve, Woolwich Street Walnut Plantation), identifies only terrestrial recreation uses,including: dog exercising, freedom camping, Remotely Piloted Aircraft Systems (drones etc),picnicking, events, walking and cycling.
The Gore Distict Physical Activity Strategy 2007 identifres the Mataura River, within a review offacilities and opportunities in the District as a, 'world renowned brown trout fishing river. lt alsooffers water sport opportunities such as kayaking and opportunities for walking and picnicking onthe river bank.' A survey of residents' levels and types of recreation participation was undertaken tosupport the development of the strategy, with a 6% response rate (310 completed questionnairesfrom 5200 ratepayer households, with a 1% response rate for Mataura). The results should beconsidered as only indicative. Swimming was the most popular activity amongst respondents(n=66), but the questionnaire did not identiff if this was in a pool or natural setting. Only 6respondents named fishing as an existing activity, and 2 for kayaking. Twenty-one percent ofrespondents stated they participated in 'water based outdoor recreation', although this was notdefined further. Reasons for not participating in more physical activity were largely personal, with noenvironmental issues noted (i.e. time, cost, ability, no one to do it with, transport, don't want to,
facilities and skills / knowledge). Swimming was the main activity respondents wanted to do moreof, although the preferred setting (pool or natural setting) was not identified.
ValaLra irver Ailiance )ischarge I Assessment of effects on 'ecreationRil&A 'or llitcnerl Daysh
12
2.6 SouthlandRegionalCounci!
The Soufh/and Regional Policy Statement 2017 relerences the WCO on the Mataura River('National Water Conservation Orders on the Mataura and Oreti Rivers also reflect the national
signiflcance of these water bodies, particularly as brown trout fisheries' (1.2)), but otherwise only
references recreation values in general terms, for example (1.2):
The national pafus, rivers and lakes and wildemess arcas in Southland attmct localresrdents as well as national and intemational touisfs. Ihe rccrcational and touismoppoftunities prcvided by the trout fisheries, tramping tracks, wildlife and other natunlresources benefit both the health and wellbeing of the community and the local economy.
The Regional Water Plan for Southland 2010 defines the Mataura River as (5.1 1 (3)) a surface
water body "other than in Natural State Waters", with the objective:
To maintain and enhance the quality of suiace water bodies so that the following values
arc protected wherc water quality is alrcady suitable for them, and where water quality is
cunently not suitable, measurable progress is achieved towards making it suitable for them.
ln sufiace water bodies classified as mountain, hill, lake-fed, sping-fed, lowland (hard bed),
lowland (soft bed) and Mataura 1, Mataun 2 and Mataun 3:
(a) bathing, in those sifes wherc bathing is populaq
(b) trout where present, othervvise native fish;...
The Water Plan notes the potential for toxic cyanobacteria and nuisance algal growths to (5.2.1
Poliry 6), 'make the surface water body undesirable for swimming, clog water intakes, clog
whitebait nets, degrade benthic invertebrate communities or impair spawning habitat for native fish"
with specific reference to the Mataura River for cyanobacteria.
Policy 8 (5.2.1) in reference to discharges to water states that:
...it should also be noted that some nVers arc used for example by certain /?sh specrbs r.e.
long fin eels duing migration and by rccrcationists for kayaking at high flows, especially the
Upper Mararoa, lower Waihopai, pafts of the Mataura and parts of the Waiau. Discharyes
at high flows may thereforc conflict with some rccrcation and habitat values and may notalways be appropiate.
Appendix K of the Water Plan identifies 'popular bathing sites' to which various policies and
standards are applied to ensure (3,1 (a)):
The water quality of suiace water bodies will be maintained and enhanced so that it issuitable for bathing in popular bathing sifes, frout and native fish, stock drinking water andNgdiTahu cultunl values, including mahinga kai.
Each of the sites is defined as encompassing the waters immediately under the relevant bridge and
100 metres upstream and downstream, and includes only the Gore Bridge on the Mataura River.
The RegionalWater P/an controls the placement, use and maintenance of whitebait stands via itsRule 34. This is reviewed in section 3.6 of this report.
The Proposed Southland Water and Land Plan (Decisions Version, 4 Apfl 2018) does not provide
additional detail about specific recreational activities on the Mataura River, but does expand the list
of popular bathing sites (in Appendix G) to include:
. Mataura River at Gore Bridge
. Mataura River at Riversdale
Mataura River at Mataura River BridgeI
Maiaura Siver Alliance )ischarge ; Assessmert cf eff,ects cn iecreationRG&A .or lVitcnell Daysh
l
Mataura River at Woolwich Street Reserve
The Mataura Catchment Strategic Water Study (Hughes et a/ 2011) refers only to angling on theMataura River, in accordance with the Water Conservation Order, and contact recreation standardsin general terms; and refers to studies on other waterbodies which sought to assess the marketvalue of freshwater fishing. No additional research into other recreation values on the Mataura Riverwas undertaken.
!lataura Iiver Allia.ce Discharge i Assessment cf -.ffects cn recreationtC&A 'or tulircneil laysh
14
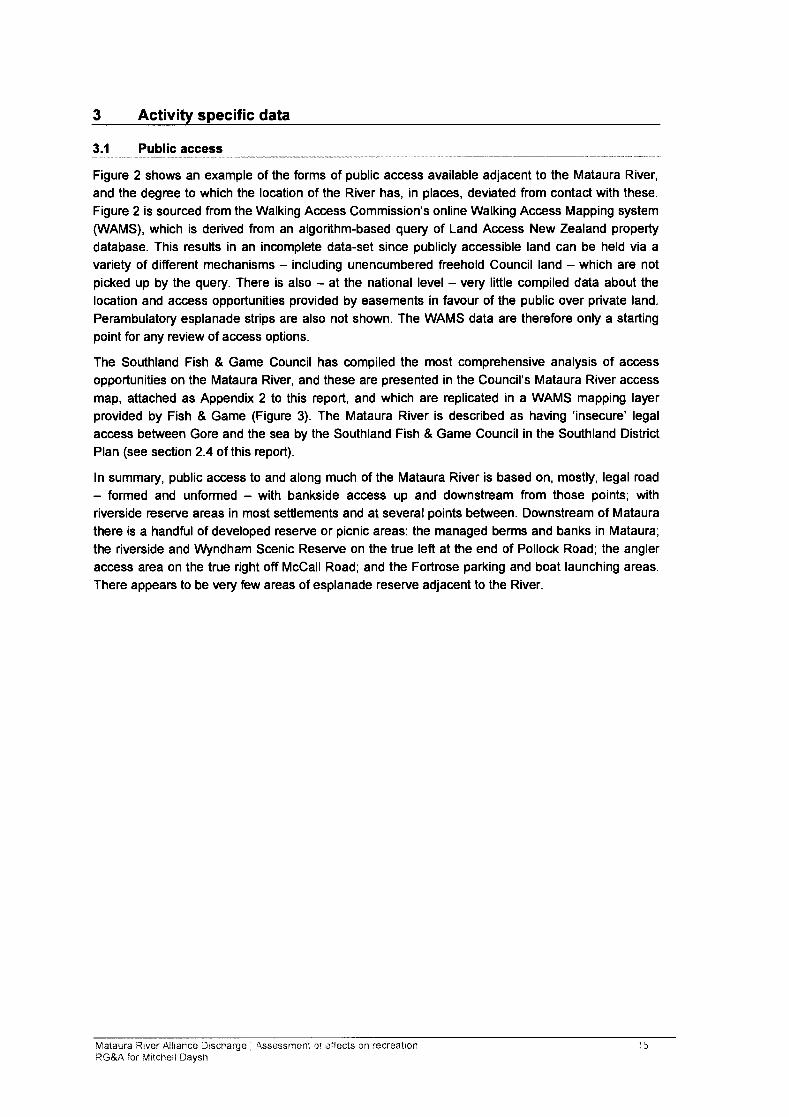
3 Activity specific data
3.1 Public access
Figure 2 shows an example of the forms of public access available adjacent to the Mataura River,
and the degree to which the location of the River has, in places, deviated from contact with these.
Figure 2 is sourced from the Walking Access Commission's online Walking Access Mapping system(WAMS), which is derived from an algorithm-based query of Land Access New Zealand property
database. This results in an incomplete data-set since publicly accessible land can be held via avariety of different mechanisms - including unencumbered freehold Council land - which are notpicked up by the query. There is also - at the national level - very little compiled data about the
location and access opportunities provided by easements in favour of the public over private land.
Perambulatory esplanade strips are also not shown. The WAMS data are therefore only a starting
point for any review of access options.
The Southland Fish & Game Council has compiled the most comprehensive analysis of accessopportunities on the Mataura River, and these are presented in the Council's Mataura River access
map, attached as Appendix 2 to this report, and which are replicated in a WAMS mapping layerprovided by Fish & Game (Figure 3). The Mataura River is described as having 'insecure' legal
ac@ss between Gore and the sea by the Southland Fish & Game Council in the Southland DistrictPlan (see section 2.4 of this report).
ln summary, public access to and along much of the Mataura River is based on, mostly, legal road
- formed and unformed - with bankside access up and downstream from those points; withriverside reserve areas in most settlements and at several points between. Downstream of Mataura
there is a handful of developed reserve or picnic areas: the managed berms and banks in Mataura;
the riverside and \Affndham Scenic Reserve on the true left at the end of Pollock Road; the angler
access area on the true right off McCall Road; and the Fortrose parking and boat launching areas.
There appears to be very few areas of esplanade reserve adjacent to the River.
Maiairra 3iver Alliance Discharge ; Assessment oi effects on recreatjonRG&A lor li'litchell Daysh
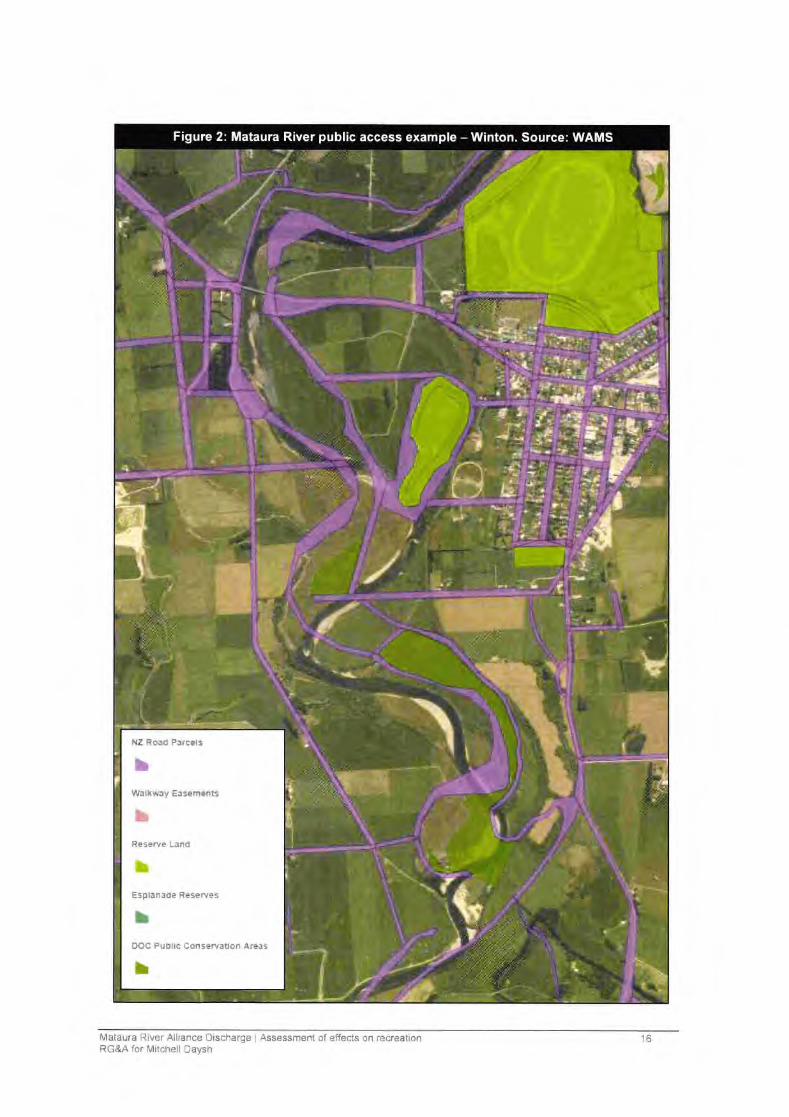
,, a.
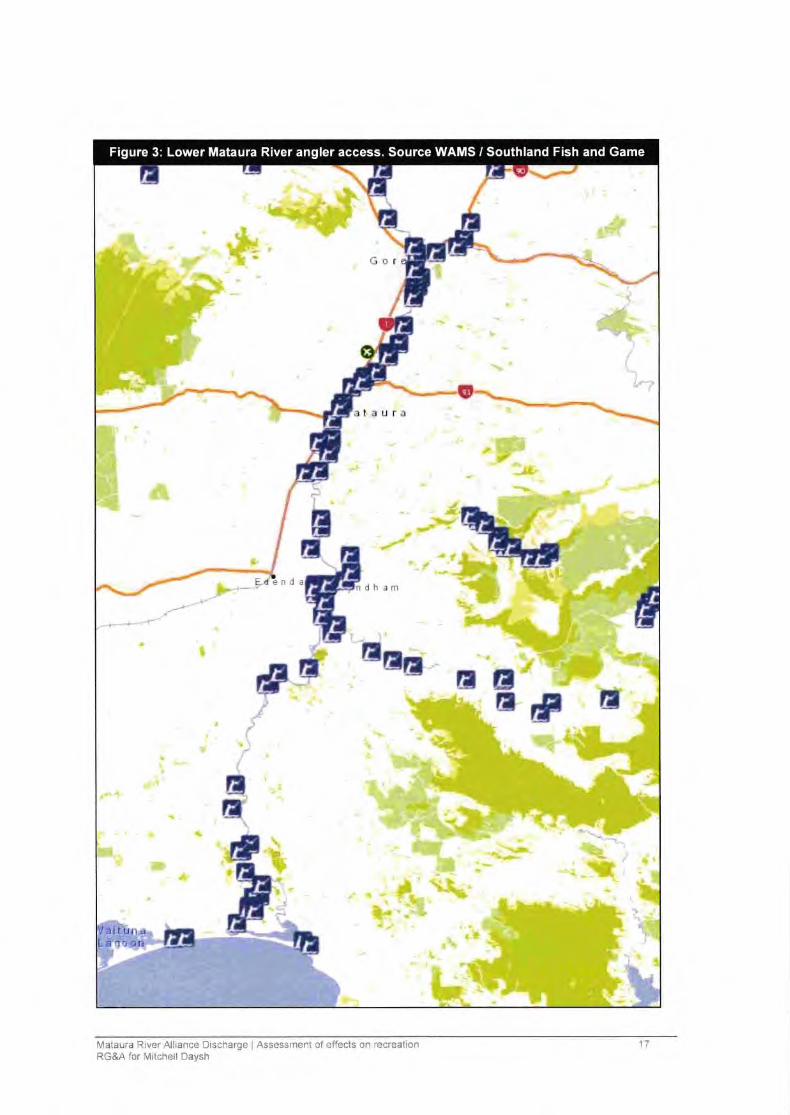
F-co(!ooo,co6o0,
tsoocoEooooo;o(!oohc0r>o(EE
9rgLOo=.z=u.-g€f<!! odiE
(,>
d
,,
Lt't.,lI
orfr'
Et€E
I
FtfI
"+-
tta
t\..r
1,i,
(
?l r,'
l.
t
4
!E
*a
dt
J
ilq
t
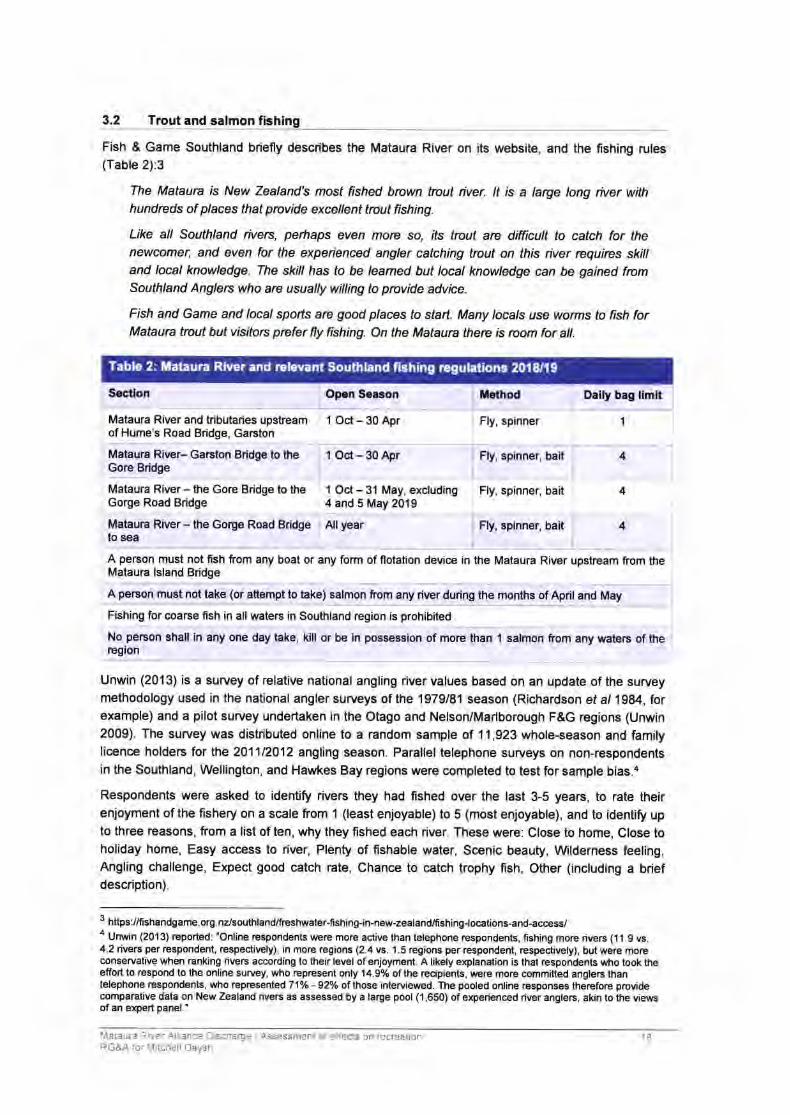
3.2 Trout and salmon fishing
Fish & Game Southland briefly describes the Mataura River on its website, and the fishing rules(Table 2):3
The Mataura r.s New Zealand's most fished brown trout iver. lt is a larye long iver withhundrcds of places that provide excellent trcut fishing.
Like all Southland rivers, perhaps even mote so, 'tts trout are difficult to catch for thenewcomer, and even for the expeienced angler catching trcut on this river requircs skilland local knowledge. The skillhas to be leamed but local knowledge can be gained frcmSouthland Anglers who are usually willing to provide advice.
Fish and Game and localsports arc good places to start. Many locals use wotrns to fish forMataura trcut but visifors prefer fly fishing. On the Mataura there is rcom for all.
Section Open Season Method Daily bag llmit
Mataura River and tributaries upstream 1 Oct - 30 Aprof Hume's Road Bridge, Garston
Mataura River- Garston Bridge to theGore Bridge
Mataura River - the Gore Bridge to theGorge Road Bridge
Mataura River - the Gorge Road Bildgeto sea
1 Ocl - 30 Apr
Fly, spinner
Fly, spinner, bait
1 Oct - 31 May, excluding Fly, spinner, bait4 and 5 May 201 9
Allyear Fly, spinner, bait
4
4
4
A person must not fish from any boat or any form of flotation device in the Mataura River upstream from theMataura lsland Bridge
A person must not take (or attempt to take) salmon ftom any river during the months of April and May
Fishing for coarse fish in all waters in Southland region is prohibited
No person shall in any one day take, kill or be in possession of more than 1 salmon from any waters of theregion
Unwin (2013) is a survey of relative nationalangling rivervalues based on an update of the surveymethodology used in the national angler surveys of the 1979/81 season (Richardson et al1984,torexample) and a pilot survey undertaken in the Otago and Nelson/Marlborough F&G regions (Unwin2009). The survey was distributed online to a random sample of 11,923 whole-season and familylicence holders for the 201112012 angling season. Parallel telephone surveys on non-respondentsin the Southland, Wellington, and Hawkes Bay regions were completed to test for sample bias.a
Respondents were asked to identiff rivers they had fished over the last 3-5 years, to rate theirenjoyment of the fishery on a scale from 1 (least enjoyable) to 5 (most enjoyable), and to identiff upto three reasons, from a list of ten, why they fished each river. These were: Close to home, Close toholiday home, Easy acoess to river, Plenty of fishable water, Scenic beauty, Wilderness feeling,Angling challenge, Expect good catch rate, Chance to catch trophy fish, Other (including a briefdescription).
3 https:/lfishandgame.org.n/southland/fieshwater-fishing-in-new-zealandlfishing-locations-and-access/a Unwin (2013) reported: 'Online respondents were more aclive than telephone respondents, fishing more rivers (1 1 .9 vs.4.2 rivers per respondent, respeclively), in more regions (2.4 vs. 1.5 regions per respondent, respectively), but were moreconseryative when ranking rivers according to their level of enjoyment. A likely explanation is that respondents wtlo took theeffort to respond to the online survey, who represent only 14.9% of the recipients, were more committed anglers thantelephone respondents, who representedTl% - 927o ofthose interviewed. The pooled online responses therefore providecomparative data on New Zealand rivers as assessed by a large pool (1,650) of experienced river anglers, akin to the viewsof an expert panel.'
IVlataura River Alliance Drscnarge Assess,xenl of effecls cn .ecreatlonRG&A ior tulitcnell Daysn
Table 2: Mataura River and relevant Southland fishing regulations 2018l1g
18
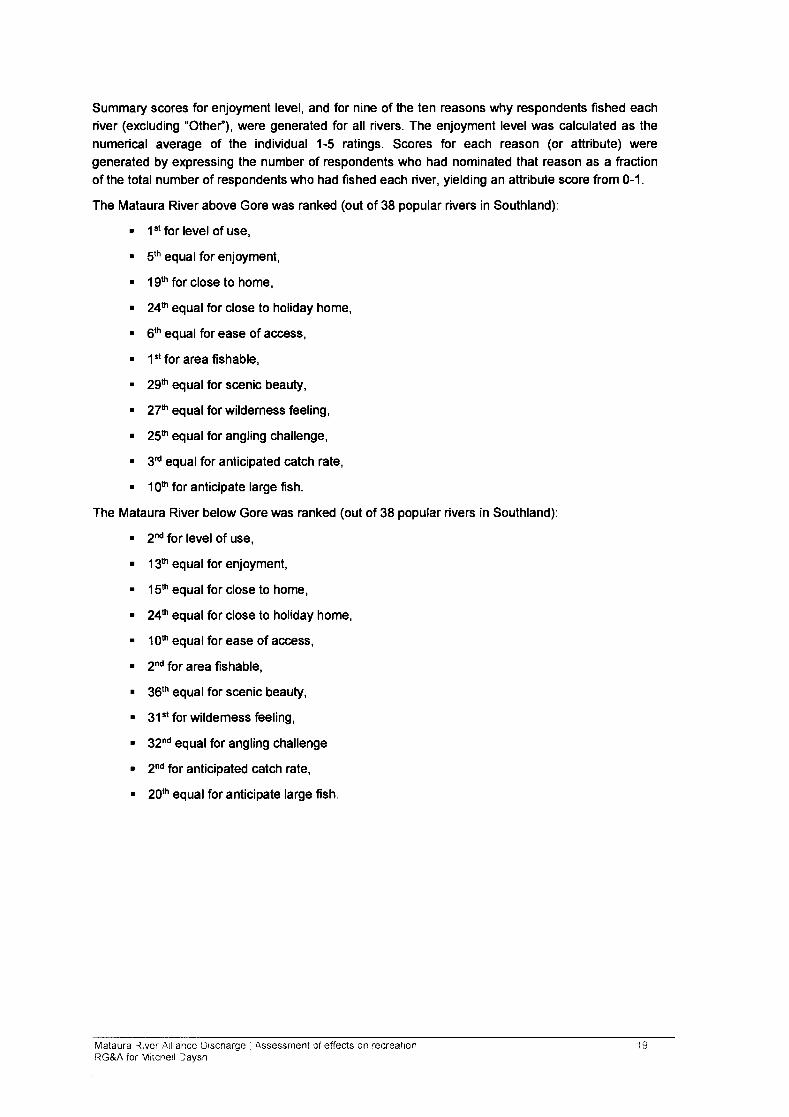
Summary scores for enjoyment level, and for nine of the ten reasons why respondents fished each
river (excluding "Othe/'), were generated for all rivers. The enjoyment level was calculated as the
numerical average of the individual 1-5 ratings. Scores for each reason (or attribute) weregenerated by expressing the number of respondents who had nominated that reason as a fractionof the total number of respondents who had fished each river, yielding an attribute score from 0-1.
The Mataura River above Gore was ranked (out of 38 popular rivers in Southland):
. 1"t for level of use,
. Sth equal for enjoyment,
. 19ft for close to home,
. 24h equal for close to holiday home,
. 6th equal forease ofaccess,
r 1st for area fishable,
. 29h equal for scenic beauty,
. 27h equal for wilderness feeling,
. 25ft equal for angling challenge,
. 3d equal for anticipated catch rate,
. 10s for anticipate large fish.
The Mataura River below Gore was ranked (out of 38 popular rivers in Southland):
. 2nd fot level of use,
t 13th equal for enjoyment,
. 15h equal for close to home,
. 24h equal for close to holiday home,
r 'lQth equal for ease of acoess,
. 2nd for area fishable,
r 36th equal for scenic beauty,
r 31st forwildemess feeling,
t tlnd equal for angling challenge
. 2nd for anticipated catch rate,
r lQth equal for anticipate large fish.
Mataura River Atliance Drscharge I Assessment Dl efFects on recreationRe&A ior \ilitcnell laysh
:,
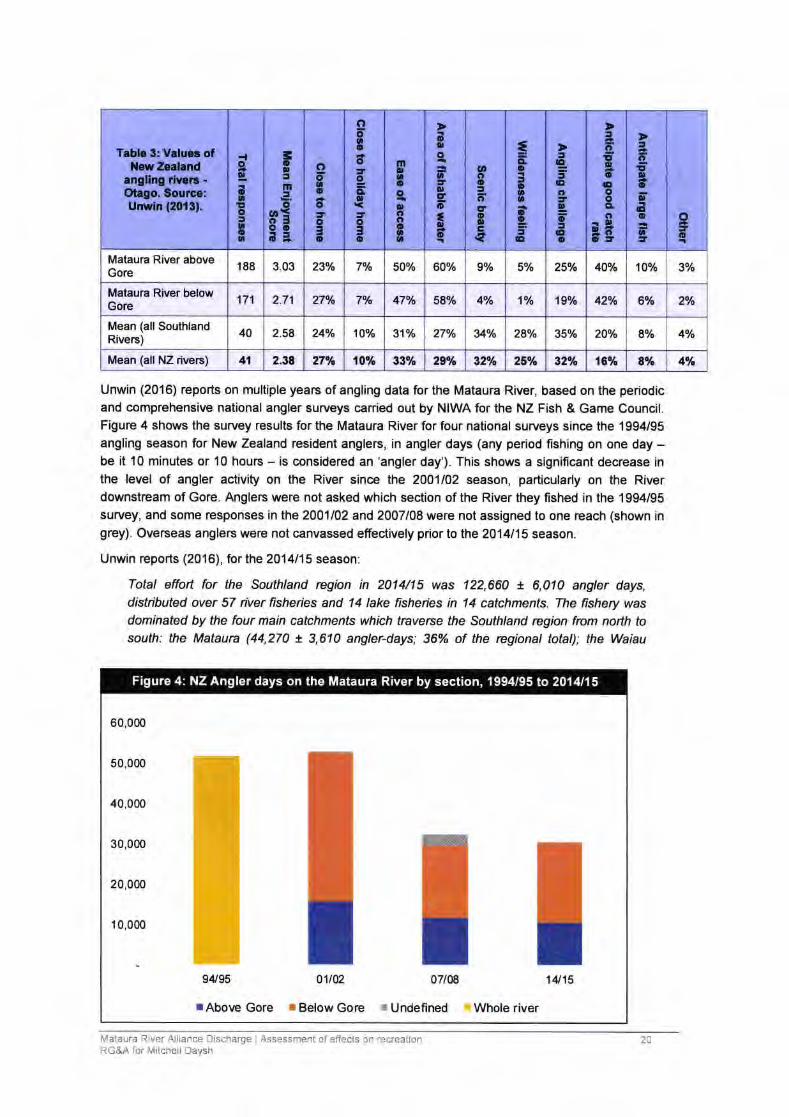
Mataura River aboveGore
188 3.03 23o/o 7% 50o/o 600/o 9% 5o/o 25o/o 4oo/o 1Oo/o 3o/o
Mataura River belowGore 171 2.71 27o/o 7olo 47o/o 58o/o 4o/o 1% 19% 42o/o 60/o 2o/o
Mean (all SouthlandRivers)
40 2.58 24o/o 10o/o 3',lo/o 27o/o 34o/o 28o/o 35o/o 20o/o 8o/o 4o/o
Mean (all NZ rivers) 41 2.38 27% 10o/o 330h 29o.h 32o,h 250h 32o/o 160/0 Bo.h 40h
Unwin (2016) reports on multiple years of angling data for the Mataura River, based on the periodicand comprehensive national angler surveys canied out by NIWA for the NZ Fish & Game Council.Figure 4 shows the survey results for the Mataura River for four national surveys since the 1994/95angling season for New Zealand resident anglers, in angler days (any period fishing on one day -be it 10 minutes or 10 hours - is considered an'anglerday'). This shows a significant decrease in
the level of angler activity on the River since the 2O01lO2 season, particularly on the Riverdownstream of Gore. Anglers were not asked which section of the River they fished in the 1994/95survey, and some responses in the 2001/02 and 2007108 were not assigned to one reach (shown ingrey). Overseas anglers were not canvassed effectively prior to lhe 2014115 season.
Unwin reports (2016), for the 2014115 season:
Total effort for the Southland region in 2014/15 was 122,660 r. 6,010 angler days,distibuted over 57 river fisheies and 14 lake fisheies in 14 catchments. The fishery wasdominated by the four main catchments which traverce the Southland region from north tosouth: the Mataun (44,270 ! 3,610 angler-days; 36% of the rcgional total); the Waiau
60,000
50,000
40,000
30,000
20,000
10,000
9lU95
rAbove Gore
01102
I Below Gore
07108 14t15
x Undefined ' Whole river
Figure 4: NZ Angler days on the Mataura River by section, 1994/95 to 2014115
l\ilataura River Alliance Discharge Assessment of effects cn recreationRG&A for l\4itchell Daysh
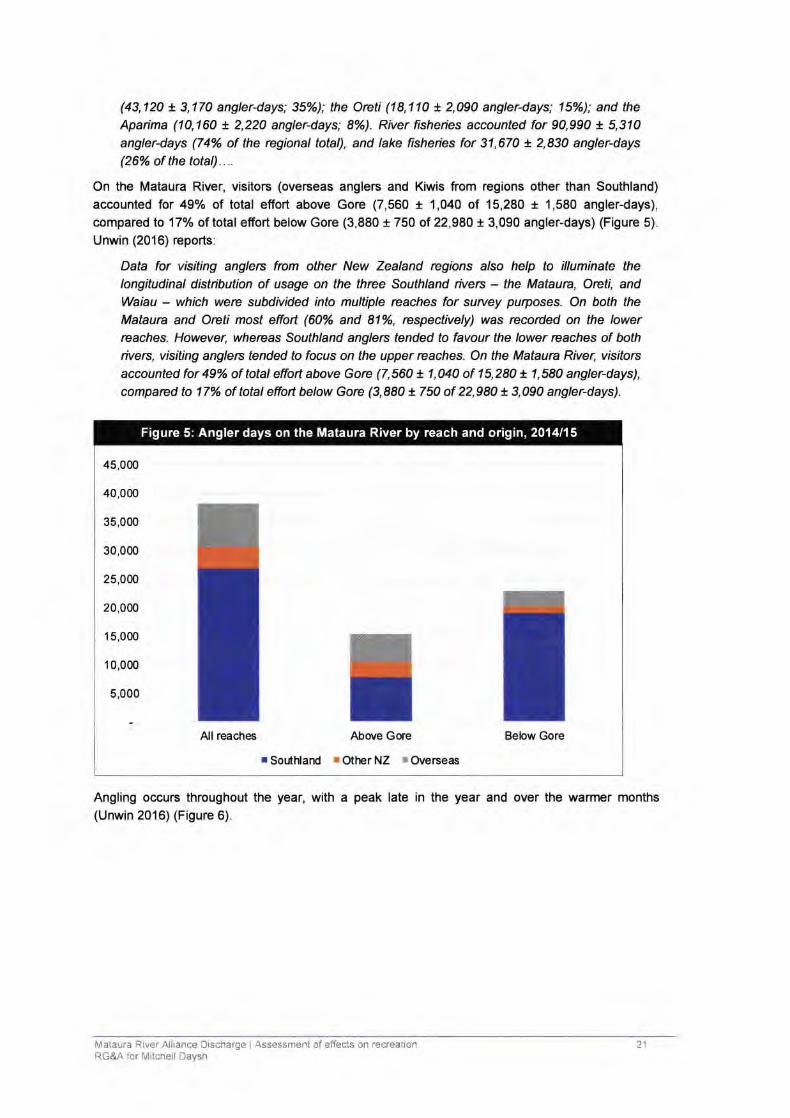
(43,120 x 3,170 angler-days; 35%); the Orcti (18,110 r.2,090 angler-days; 15%); and the
Apaima (10,160 t 2,220 angler4ays; 8%). River fishenbs accounted for 90,990 t 5,310angler-days (74% of the regional total), and lake fisheies for 31,670 r.2,830 angler-days(26% otthe total)....
On the Mataura River, visitors (overseas anglers and Kiwis fom regions other than Southland)accounted lor 49o/o of total effort above Gore (7,560 t 1,040 of 15,280 t 1,580 angler-days),
compared to 'l7o/o of total effort below Gore (3,880 t 750 of 22,980 t 3,090 angler-days) (Figure 5).
Unwin (2016) reports:
Data for visiting anglerc from other New Zealand regions also help to illuminate the
longitudinal distibution of usage on the thrce Southland riverc - the Matauru, Oreti, andWaiau - which werc subdivided into multiple reaches for suruey purposes. On both theMataun and Orcti most effoft (60% and 8104, rcspectively) was rccorded on the lowerrcaches. However, whercas Southland anglerc tended to favour the lower rcaches of both
riverc, visiting anglerc tended to focus on the upper reaches. On the Mataun River, visitorsaccounted for 49% of total effort above Gore (7,560 t 1,040 of 15,280 t 1,580 angler-days),
compared to 17% of total effoft below Gorc (3,880 *.750 of 22,980 t 3,090 angler-days).
Angling occurs throughout the year, with a peak late in the year and over the warmer months(Unwin 2016) (Figure 6).
Mataura River Alliance Dascharge I Assessment of effects on recreationRG&A for Mitchell Daysh
45,000
40,0m
35,000
30,0m
25,000
20,000
15,000
10,000
5,000
Below GoreAll rcaches Abore Gore
! SoL*lland r oher NZ r Overseas
Figure 5: Angler days on the Mataura River by reach and origin, 2014115
21
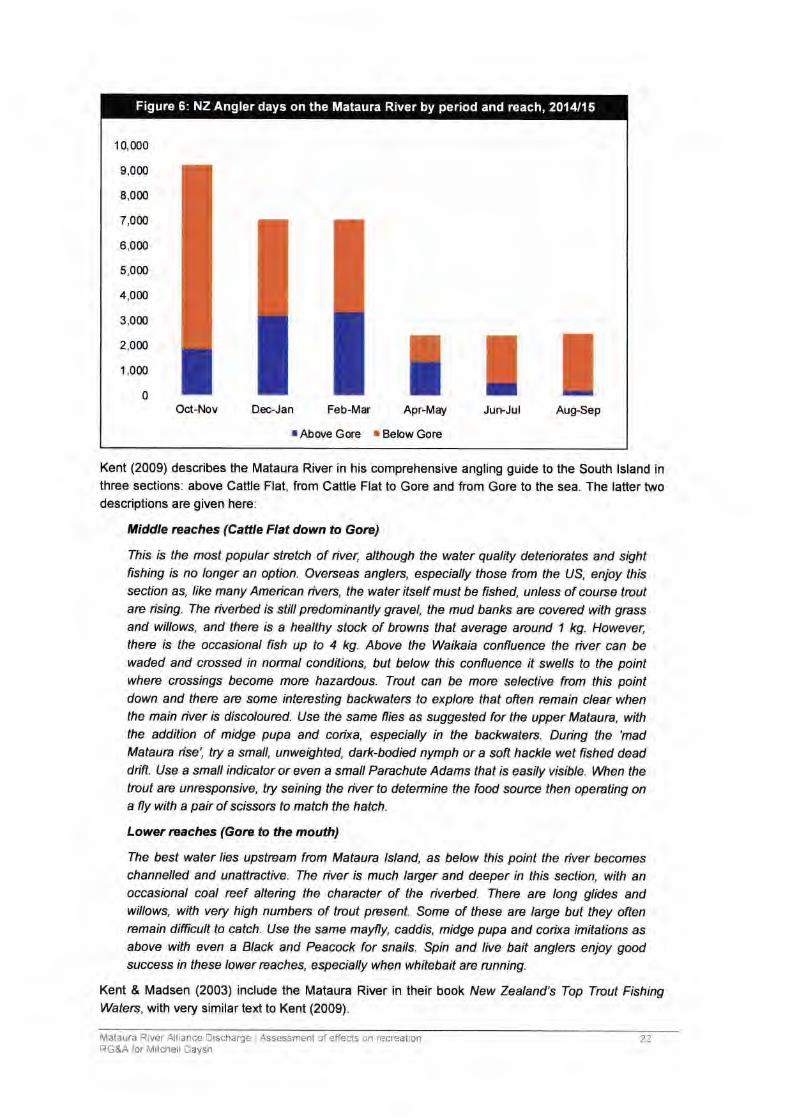
I 0,000
9,000
8,000
7,000
6,000
5,000
4,000
3,000
2,0m
1,000
0 I IOc{-Mv JurrJul AugSepDc-Jan Feb-Mar Apr-May
lAbo/e Gore r Bebw Gore
Figure 5: NZ Angler days on the Mataura River by period and reach, 2014115
Kent (2009) describes the Mataura River in his comprehensive angling guide to the South lsland inthree sec{ions: above Cattle Flat, from Cattle Flat to Gore and fom Gore to the sea. The latter twodescriptions are given here:
Middle reaches (Calfle Flat down to Gore)
Thrs ,s the most popular strefch of river, although the water qualtty deteriontes and sighttishing is no longer an option. Overseas anglerc, especially those frcm the US, enjoy thissection as, like many Ameican iverc, the water itself must be fished, unless of course trcutare rising. The rivehed is still prcdominantly gravel, the mud banks are covercd wifh grassand willows, and therc is a healthy stock of browns that average arcund 1 kg. However,therc is the occasional fish up to 4 kg. Above the Waikaia confluence the rtver can bewaded and crossed in normal conditions, but below this confluence fi swells to the pointwhere crossrhgs become more hazardous. Trout can be morc selective fiom this pointdown and there arc some intercsting bacl<wafers fo explore that often remain clear whenthe main river is discolourcd. Use the same flies as suggesfed for the upper Matauru, withthe addition of midge pupa and coixa, especially in the baclcwaterc. Dudng the 'madMataun ise', try a small, unweighted, dad<-bodied nymph or a soft hackle wet ftshed deaddrifr. Use a small indicator or even a small Panchute Adams that is easily visible. When thetrout arc unrcsponsive, try seining the river to determine the fod sourue then openting ona fly with a paft of scrssors to match the hatch.
Lower reaches (Gorc to the mouth)
Ihe best water lies upstrcam fiom Mataun lsland, as below this point the river becomeschannelled and unaftnctive. The river is much laryer and deeper in this section, with anoccasional coal reef alteing the chancter of the rivefued. Therc arc long glides andwillows, with very high numbers of trout prcsent. Some of these arc larye but they oftenrcmain ditricuft to catch. Use the same mayfly, caddis, midge pupa and corixa imitations asabove with even a Black and Peacock for snails. Spin and live bait anglerc enjoy goodsuccess in these lower rcaches, especially when whitebait are running.
Kent & Madsen (2003) include the Mataura River in their book New Zealand's Top Trout FishingWaterc, with very similar text to Kent (2009).
Mataura River Alliance Discharge I Assessment of effects on recreationRG&A for Mitchell Daysh
22
The Southland Fish & Game Council angler ac@ss map for the Mataura River (see Appendix 2, no
date) describes the River:
The Mataun is one of New Zealand's most famous fshrng nVerc. Some claim it rs fhe besffly ftshing river in the wodd, otherc would beg to differ.
The most famous feature of the Mataura is its hatches of mayfly. Whilst other New Zealand
iverc trend to have spondic hatches in the evenings the Mataun often prcduces
consrsfenf hatches that can staft at 10am and last through until nightfall!
Millichamp (2013) in his comprehensive and authoritative guide to salmon angling in New Zealand
describes the salmon fishing resource on the Mataura:
MATAURA RIVERMedian flow:71 cumecsRecent runs: 20-100 frsh
Historical maximum run: 100 ftsh
Angler daysrlear 40 260
Best fish ing : January-March
The Mataun rs one of New Zealand's best trout fisheies but has only a small salmon run,
which aftracts rnterest from local anglerc. Most of the taryeted salmon fishing takes place
immediately below the Mataun Falls at the Mataun township, which rcstict /?sh passage
when the iver is low. When the river nseg the fish run past the falls and seem todisappear. Some are caught as by-catch by trout spin anglerc, which is not surprising given
the huge number of angler days spent on the river each season.
3.3 Kayaking and rafting
The 5th edition of New Zealand lAlhitewater 180 Grcat Kayaking Runs (Charles 2013) - the onlypublished current popular guide for kayaking - does not reference kayaking on the Mataura River.
Egarr (1995) in an earlier and more comprehensive kayaking guide describes limited kayaking
options on the Mataura:
There are thrce significant rivers flowing into Foveaux Strait frcm the Southland countryside- the Apaima, the Oreti, and the Mataura. None of the tibutaies of these three ivers are ofsufficient size to attract whitewater paddlers. The Apaima and Orcti are the smaller riverc,
and are much alike in that they flow in shallow beds over alluvial shingle, bodered bywillows and man-made flood protection works, flood banks and groynes. Their channels
have been stnightened. ln summer the countryside is dry and the rivers nearty reduced to
a trickle. With nin they flood quickly with very fast cunents, and will spread out into the
willows. Gradients are low and rapids almost non-existent.
The Mataura River also lies in a shingle bed for most of its length, but being laryer than
either the Apaima or the Oreti, contains a reasonable flow of water for the whole year. lt isbest known as an excellent trout-fishing iver. Between Athol and Tomogalak (the Waikaia
Plains), the Mataun Gorye is without significant rapids. From the Tomogalak River
confluence the Mataura spreads over a wide shallow shingle bed. lt does not regain
sufficient depth for river tips until near Gorc, wherc occasional outcrops of rock appear in
the iver bed. At high flows, these have the potential to create some npids of around grade
lldifficulty.
Near the meat processing plant and papermill at Matauru there arc two notable rock
outcrops. The first creates a ruther nasty weir across the iver, with a drop of arcund ametre. Some 200m downstrcam is another rock outcrop, which crcates a sma// wateffall.
Ihese falls were used in the past for water supply and energy generation and there are
Mataura River Ailiance lischarge I Assessment of effecls cn recreationRG&A for !litcnell la,/sh
23
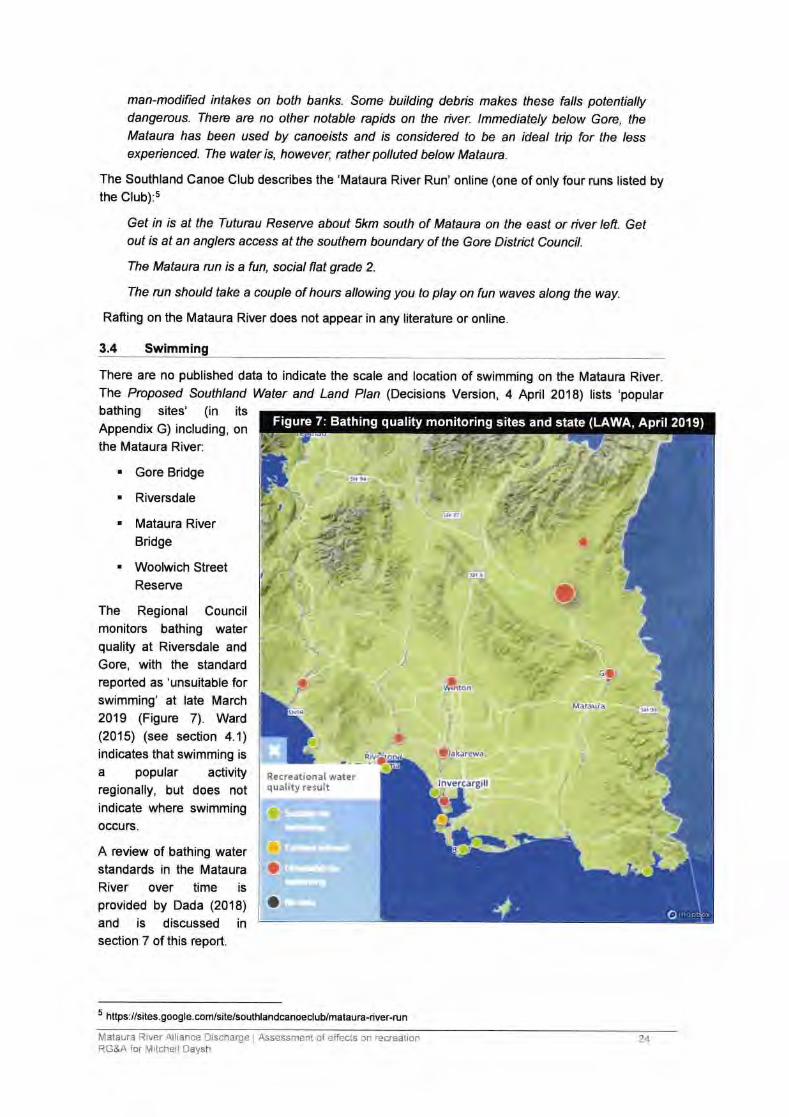
man-modified intakes on both banks. Some building debris makes these falls potentiallydangerous. There are no other notable rapids on the river. lmmediately below Gorc, theMataura has been used by canoerbts and is considered to be an ideal tip for fhe /essexpeienced. The water is, however, rather polluted below Mataura.
The Southland Canoe Club describes the 'Mataura River Run' online (one of only four runs listed bythe Club):s
Get in is at the Tuturau Reserve about Skm south of Mataura on the east or river teft. Getout is at an anglers access at the southem boundary of the Gore Distict Council.
The Mataura run is a fun, socialflat grade 2.
The run should take a couple of hours allowing you to play on fun waves along the way.
Rafting on the Mataura River does not appear in any literature or online.
3.4 Swimming
There are no published data to indicate the scale and location of swimming on the Mataura River.The Proposed Southland Water and Land P/an (Decisions Version, 4 April 2018) lists 'popularbathing sites' (in its
Appendix G) including, onthe Mataura River:
Gore Bridge
Riversdale
Mataura River
Bridge
Woolwich StreetReserve
The Regional Councilmonitors bathing waterquality at Riversdale and
Gore, with the standardreported as'unsuitable forswimming' at late March
2019 (Figure 7). Ward(2015) (see section 4.1)
indicates that swimming isa popular activityregionally, but does not
indicate where swimming
occurs.
A review of bathing waterstandards in the Mataura
River over time is
provided by Dada (2018)
and is discussed in
section 7 of this report.
s https://sites. google.com/site/southlandcanoeclub/mataura-river-run
*;
clF:I,,*
*
,
gill
*,f
*
a
*takare*ra
I
Q ec re.itronal ..,.;a!*rqu:lity re:r.rlt
I
.,t'1 . * 7ar,-*tx!>: :.. ? t"1,. t;
$7a11; t
," )2'Y'-ul.?,i'!t :'. r. a.,ttt{; ,:/\1,,* .r j -
rs')-.. -
\rlai,t -f I ? 7:1r lll;;:*;-r l,:;-:^,ii';l ,\.;;,)ji:t..,rt-! :. t+:::L; -t -a-.)2ii.."r ll,A Ci \i r r:::t)tl .;,1!tf
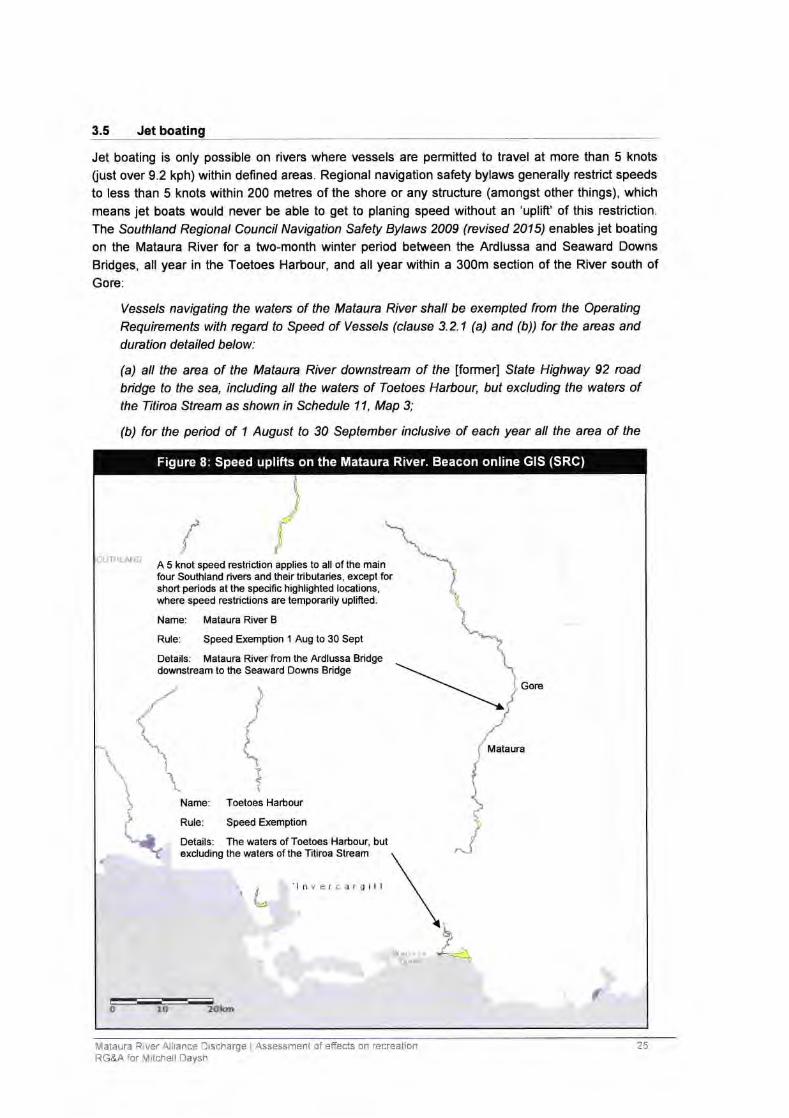
3.5 Jet boating
Jet boating is only possible on rivers where vessels are permitted to travel at more than 5 knots
(ust over 9.2 kph) within defined areas. Regional navigation safety bylaws generally restrict speeds
to less than 5 knots within 200 metres of the shore or any structure (amongst other things), which
means jet boats would never be able to get to planing speed without an 'uplift' of this restriction.
The South/a nd Regional Council Navigation Safety Bylaws 2009 (rcvised 2015) enables jet boating
on the Mataura River for a two-month winter period between the Ardlussa and Seaward Downs
Bridges, all year in the Toetoes Harbour, and all year within a 300m section of the River south ofGore:
Vesse/s navigating the waterc of the Mataun River shall be exempted from the OpentingRequirements with rcgard to Speed of Vesse/s (clause 3.2.1 (a) and (b)) for the arcas and
duration detailed below:
(a) all the area of the Mataum River downstrcam of the lformerl State Highway 92 road
bndge to the sea, including all the waterc of Toetoes Harbour, but excluding the waterc ofthe Titirca Sfream as shown in Schedule 11, Map 3;
(b) for the peiod of 1 August fo 30 September inclusive of each year all the arca of the
. i:t ti_ _.1 1iA 5 knot speed restric{ion applies to all of the mainfour Southland rivers and their tributaries, except forshort periods at the specific highlighted locations,where speed restrictions are temporarily uplifted.
Name: Mataura River B
Rule: Speed Exemption 1 Aug to 30 Sept
Details: Mataura River ftom the Ardlussa Bridgedownstream to the Seaward Downs Bridge
Gore
Mataura
Name: Toetoes Harbour
Rule: Speed Exemption
Details: The waters of Toetoes Harbour, butexduding the waters of the Titiroa Stream
-3
lnteriar,lill
O 1(} 2e'f,e{
Figure 8: Speed uplifts on the Mataura River. Beacon online GIS (SRC)
l\lataura Rrver Ailiance lischarge , Assessment of effects on ,ecreationRG&A rcr !litcnell Daysn
25
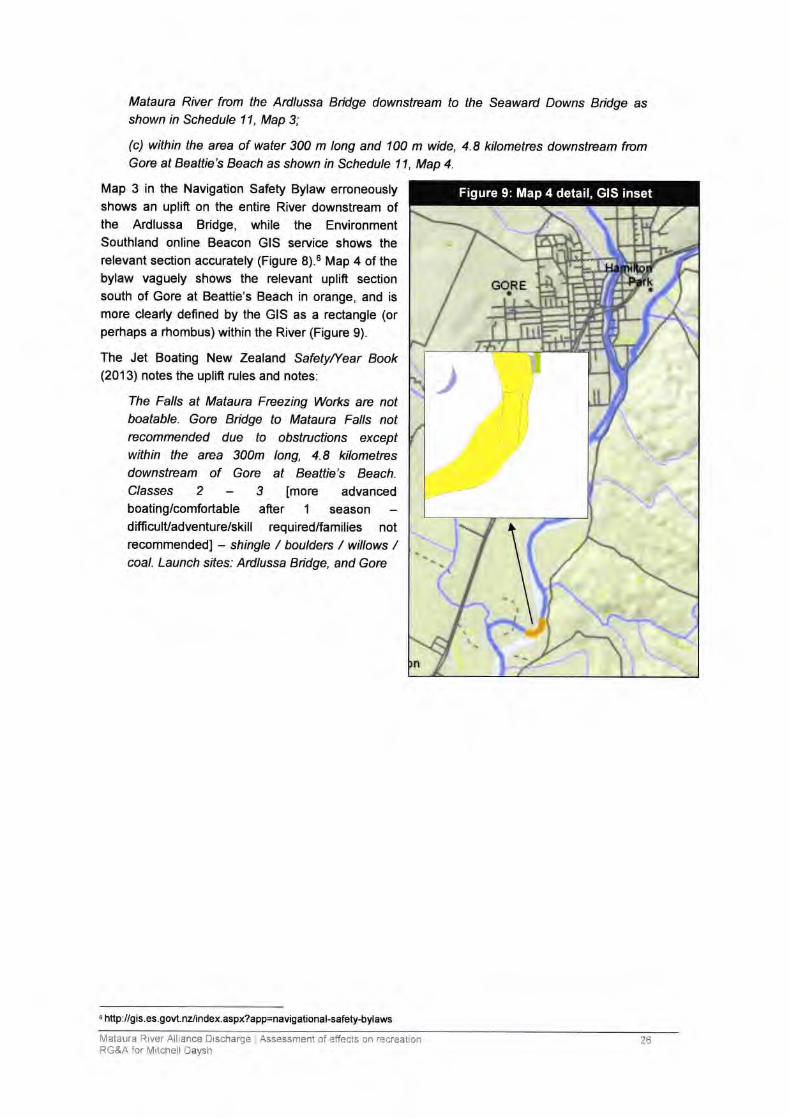
Mataura River frcm the Ardlussa Bidge downstrcam to the Seaward Downs Bridge asshown in Schedule 11, Map 3;
(c) within the arca of water 300 m long and 100 m wide, 4.8 kilometres downstream fromGore at Beattie's Beach as shown in Schedule 11, Map 4.
Map 3 in the Navigation Safety Bylaw erroneouslyshows an uplift on the entire River downstream ofthe Ardlussa Bridge, while the EnvironmentSouthland online Beacon GIS service shows therelevant section accurately (Figure 8).6 Map 4 of thebylaw vaguely shows the relevant uplift sectionsouth of Gore at Beattie's Beach in orange, and ismore cleady defined by the GIS as a rectangle (orperhaps a rhombus) within the River (Figure 9).
The Jet Boating New Zealand SafetyNear Book(2013) notes the uplift rules and notes:
The Falls at Mataura Freezing Wo*s arc notboatable. Gorc Bidge to Mataun Falls notrecommended due to obstructions exceptwithin the arca 300m long, 4.8 kilometrcsdownstrcam of Gore at Beaftie's Beach.C/asses2-3[moreadvancedboating/comfortable after 1 season
difficulUadventure/skill required/families notrecommendedl - shingle / boulderc / willows /coal. Launch sifes: Ardlussa Bidge, and Gore
E http://gis. es. govt.nlndex. aspx?app=63y;n"1;onal-safety-byl aws
:tlt
,*,.' I:TTITI:I
IL
{
I
ivlataura Rrver Alliar:ce Discharoe Assessmenl of effects f,n recreattonRG&A for \4itcnell laysh
)A
3.6 Whitebaiting
The whitebait fishing season for Southland (and most of New Zealand) opens on 15 August and
runs until 30 November. Fishing is only permifted between 5:00 am and 8:00 pm, or between 6:00
am and 9:00 pm when New Zealand Daylight Saving is being observed.T
Recreational whitebaiting is generally a poorly researched activity. Environment Southland
completed a survey of 600 registered whitebait stand holders in 2013, but this only considered
consented stand holders (with a 17% response rate) and did not include those using other methods
such as hand-held nets. The only comprehensive review of whitebaiting in the South lsland wascarried out in 1988 for MAFFish (Kelly 1988) - although those findings are likely to still hold in
general terms. Kelly described whitebaiting in Southland generally:
There is no doubt that the nvers of Southland support a recrcational whitebait fishery and asignificant commercial whitebait fishery. Commercial whitebaiterc are mostly seasona/workers and retircd people who seek to augment their income from their catch. They
usually live in a caravan or bach close to their fishing site, so can fish every day. A notablefeature of the fishery rs the use of platforms or sfands from which whitebaiterc fish. The
sfands are now registered with the Depaftment of Conseruation [now the Regional Council].
The majoity of Southland whitebaiters could be c/assed as recreational fishermen,although many sell their excess catch.
Competition for a good fishing site is fierce. The commercial operators work the besf slfeson the lower river, with the result that the recrcational fishermen who don't live on site tend
to get pushed up-iver. Witebaiters may also be found fishing beaches, iver mouths andbars. Using scoop nefs, they commence fishing just after low tide and continue till high tide.
Kelly described the Mataura River as having a large commercial component with 222 registered
stands at the time:
This iver is a/so [in addition to its 'more famous' trout fishery] the most impoftantwhitebaiting iver Southland. An average number of 200 whitebaiters per day is usual (R.A.
Johnson pers. comm.), but on the first day of the 1984 season, 300 nets were being fished
on the Mataura, with 500 people in aftendance.
The majoity of whitebaiters fishing the lower reaches of Mataura could be c/assed ascommercial operators. Many camp on sife the whole season and fish from pivate stands.
Large conical sef nefs arc used, together with screens, and arc set into the curent. The
catch rates are generally good, with lifts of up to 2.5 kg of whitebait being common.
Environment Southland controls the placement, use and maintenance of whitebait stands via itsRule &4. The Plan notes that, "Poliry 13.17 of the Regional Poliry Statement for Southland restricts
the allocation of space for whitebait stands to those stands lawfully established as of 1 October1993. The existing number of whitebait stands is considered to be sufficient to achieve the needs ofpresent and future users. Therefore, the number of existing whitebait stands will not be allowed toincrease." And:
Most whitebarf sfands in Southland are located within the coastal maine arca and are
contrclled through the provisions in the Regional Coastal Plan. Only twenty one stands arclocated outside the coastal maine area as at 1 November 2003. Ihese stands are locatedwithin the Apaima and Pourakino Rtuers and are controlled through the provisions of the
Regional Water Plan, which is consisfent with the Regional Coastal Plan....
coasU
Mataura liver Alliance Discharge Assessment Jf effects .n recreationRG&A ior ,Vlitchell taysh
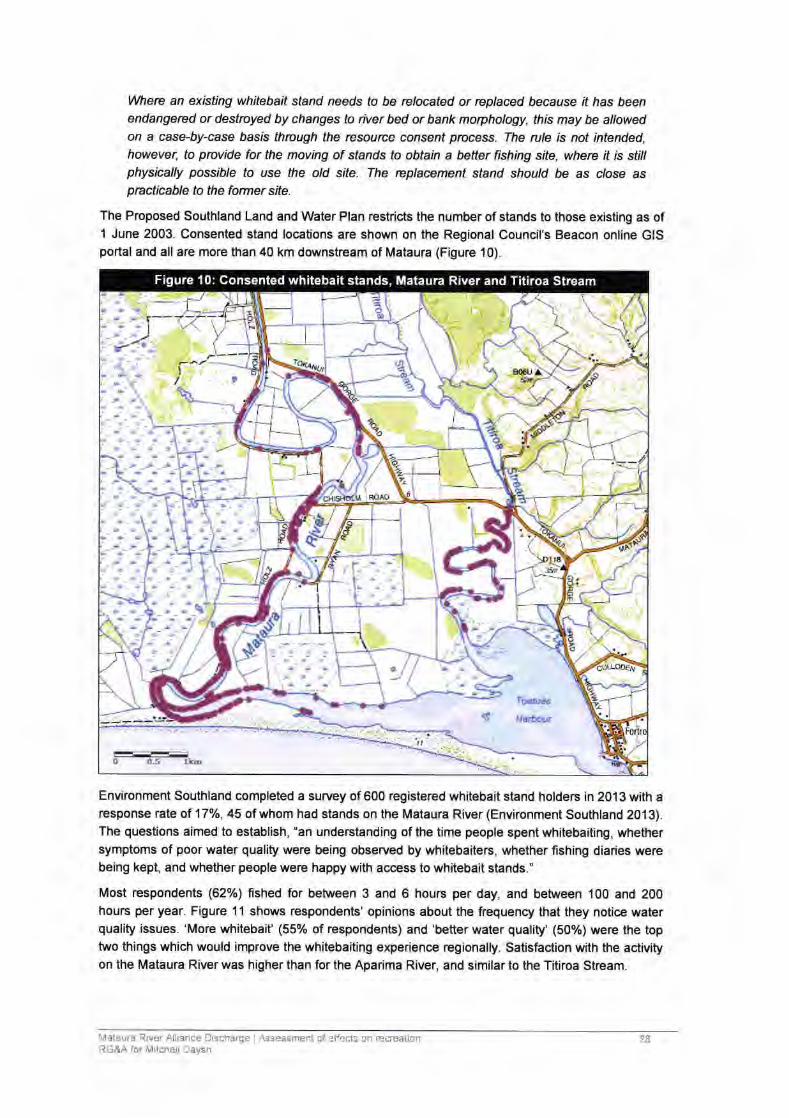
Where an existing whitebait stand needs to be relocated or replaced because it has beenendangered or destroyed by changes to iver bed or bank morphology, this may be allowedon a case-by-case basrs through the rcsource consent process. The rule is not intended,however, to provide for the moving of stands to obtain a better fishing site, where ff rs sfi//physically possrb/e to use the old site. The rcplacement stand should be as c/ose aspncticable to the former site.
The Proposed Southland Land and Water Plan restricts the number of stands to those existing as of1 June 2003. Consented stand locations are shown on the Regional Council's Beacon online GISportal and all are more than 40 km downstream of Mataura (Figure 10).
Environment Southland completed a survey of 600 registered whitebait stand holders in 2013 with aresponse rate of 17o/o, 45 of whom had stands on the Mataura River (Environment Southland 2013).The questions aimed to establish, 'an understanding of the time people spent whitebaiting, whethersymptoms of poor water quality were being observed by whitebaiters, whether fishing diaries werebeing kept, and whether people were happy with access to whitebait stands.'
Most respondents (62%) fished for between 3 and 6 hours per day, and between 100 and 200hours per year. Figure 11 shows respondents' opinions about the frequenry that they notice waterquality issues. 'More whitebait' (55% of respondents) and 'better water quality' (50%) were the toptwo things which would improve the whitebaiting experience regionally. Satisfaction with the activityon the Mataura River was higher than for the Aparima River, and similar to the Titiroa Stream.
l\ilatairra ?iver Alliance lrscharge Assessment cf effects 3n recreationRG&A for ivlitcherl laysn
o
.:''
HOAO
o
I
I
\-L
Figure 10: Consented whitebait stands, Mataura River and Titiroa Stream
28
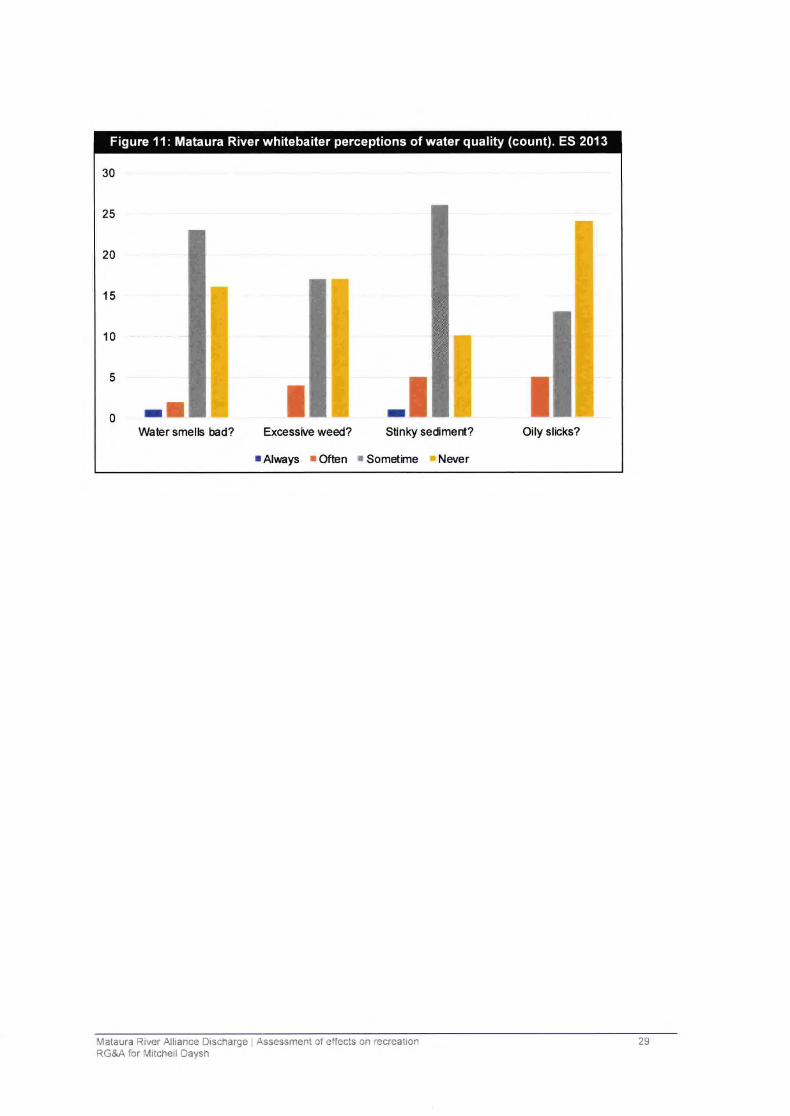
30
25
20
15
10
5
Oily slicks?
I IIWaEr smelb bad?
0rExcessive weed? Stinky sedmed?
rAlways rOften rSometine lNever
Figure 11 : Mataura River whitebaiter perceptions of water quality (count). ES 2013
Mataura River Alliance Discharge I Assessment of effects on recreationRG&A for Mitchell Daysh
29
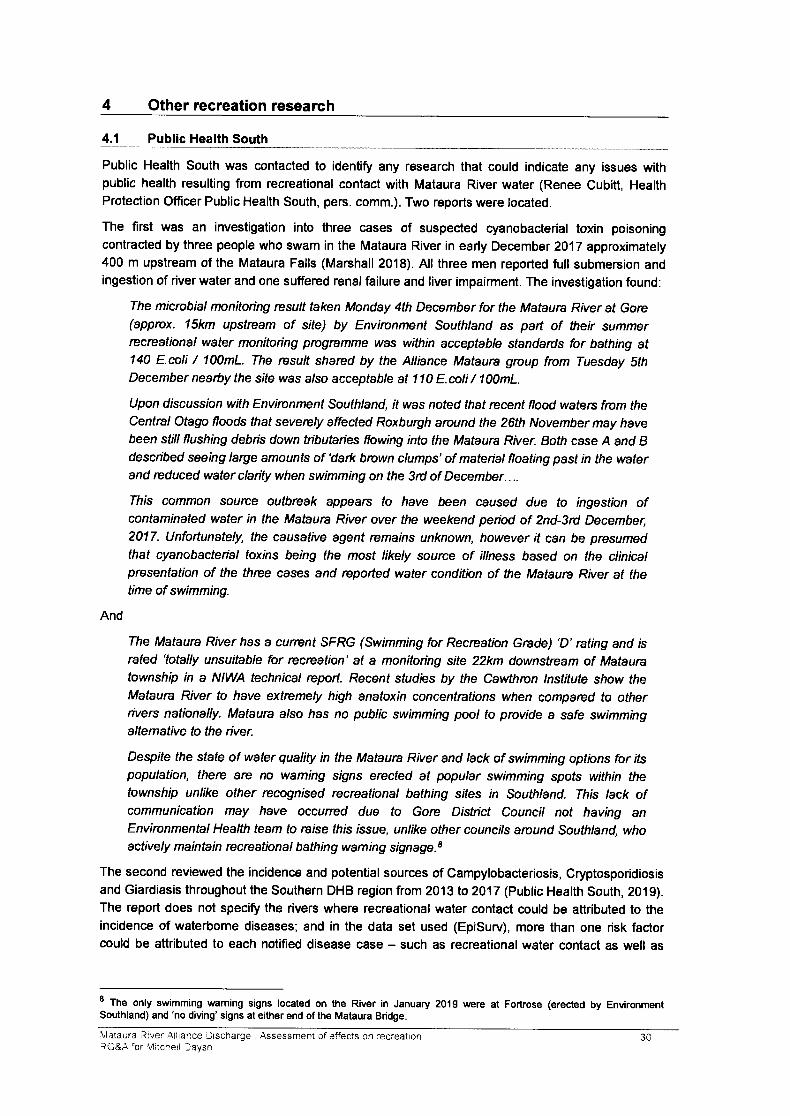
4 Other recreation research
4.1 Public Health South
Public Health South was contacted to identiff any research that could indicate any issues withpublic health resulting from recreational contact with Mataura River water (Renee Cubitt, HealthProtection Officer Public Health South, pers. comm.). Two reports were located.
The first was an investigation into three cases of suspected cyanobacterial toxin poisoningcontracted by three people who swam in the Mataura River in early December 2017 approximately400 m upstream of the Mataura Falls (Marshall 2018). All three men reported full submersion andingestion of river water and one suffered renal failure and liver impairment. The investigation found:
The microbial monitoing rcsult taken Monday 4th December for the Mataun River at Gorc(approx. 15km upstream of site) by Environment Southland as part of their summerrecreational water monitoring prcgnmme uvas within acceptable standads for bathing at140 E.coli / 100mL. The rcsult sharcd by the Alliance Mataun group from Tuesday SthDecember nearby the sife was also acceptable at 1 10 E.coli / 100mL.
Upon discussion with Environment Southland, it was noted that rccent ftood waters frcm theCentnlOtago floods that severcly affected Roxburgh around the 26th November may havebeen still flushing debis down tibutaies flowing into the Mataun River. Both case A and Bdescibed seerng large amounts of 'dark brown clumps' of mateial floating past in the waterand reduced water clarity when swimming on the 3d of December....
This common source outbreak appears to have been caused due to ingestion ofcontaminated water in the Matauru River over the weekend peiod of 2nd-3rd December,2017. Unfoftunately, the causative agent remains unknown, however it can be presumedthat cyanobacteial toxins being the most likely source of //ness based on the ctinicalpresentation of the three cases and reported water condition of the Mataura River at thetime of swimming.
And
The Mataura River has a cunent SFRG (Swimming for Recreation Grade) 'D' nting and israted 'totally unsuitable for rccreation' at a monitoing site 22km downstream of Matauratownship in a NIWA technical report. Recent studrbs by the Cav,rthrcn tnstitute show theMataum River to have extremely high anatoxin concentrutions when comparcd to otherivers nationally. Mataura a/so has no public swimming pool to provide a safe swimmingaltemative to the iver.
Despite the state of water quality in the Mataum River and lack of swimming options for itspopulation, therc are no waming signs erected at popular swimming spots within thetownship unlike other rccognised recreational bathing sifes rn Southland. This lack ofcommunication may have occuned due to Gore Distict Council not having anEnvironmental Health team to raise this issue, unlike other councils arcund Southland, whoactively maintain rccreational bathing waming signage.s
The second reviewed the incidence and potential sources of Campylobacteriosis, Cryptosporidiosisand Giardiasis throughout the Southern DHB region from 2013 to 2017 (Public Health South, 2019).The report does not speciff the rivers where recreational water contact could be attributed to theincidence of waterbome diseases; and in the data set used (EpiSurv), more than one risk factorcould be attributed to each notified disease case - such as recreational water contact as well as
I The only swimming waming signs located on the River in January 2o'lg were at Fortrose (erected by EnvironmentSouthland) and 'no diving' signs at either end of the Mataura Bridge.
xilataura Rrve,'.qlliance Discharge Assessrnent cf effects cn .ecreatlon?C&A'or \ilitci.erl laysn
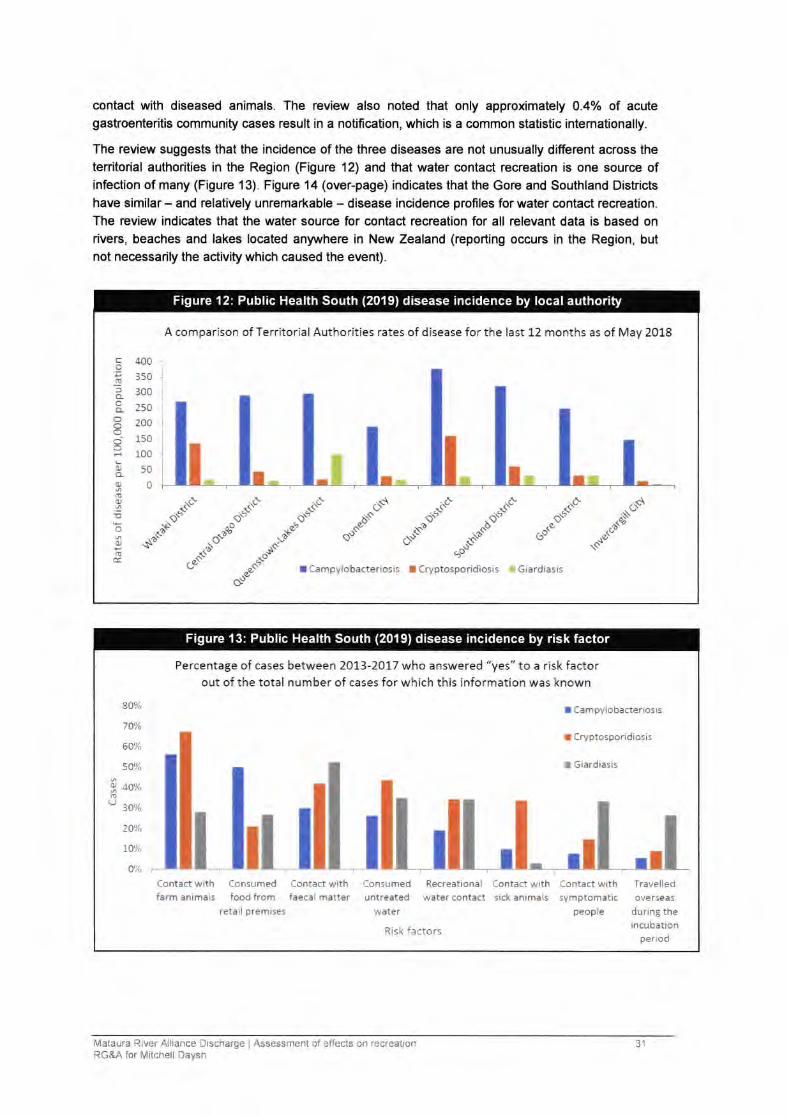
contact with diseased animals. The review also noted that only approximately O.4o/o of acutegastroenteritis community cases result in a notification, which is a common statistic intemationally.
The review suggests that the incidence of the three diseases are not unusually different across theterritorial authorities in the Region (Figure '12) and that water contact recreation is one source ofinfection of many (Figure 13). Figure 14 (over-page) indicates that the Gore and Southland Districtshave similar - and relatively unremarkable - disease incidence profiles for water contact recreation.
The review indicates that the water source for contact recreation for all relevant data is based onrivers, beaches and lakes located anyrhere in New Zealand (reporting occurs in the Region, butnot necessarily the activity which caused the event).
A comparison of Territorial Authorities rates of disease for the last 12 months as of May 2018
c.9r!
o
Ooc)ooo-oroOJ
.6
oc.)
(sd
400
350
300
250
200
150
100
50
o
I Campylobacteriosis I Cryptosporidiosis $t Giardiasrs
c,{$ c+{
.--.aa.,'
a.-t' ".at+d\'
..c.""*
tt"'
.c(,doa"""" c
Figure 12: Public Health South (2019) disease incidence by localauthority
Percentage of cases between 2O73-2AL7 who answered "yes" to a risk factorout of the total number of cases for which this information was known
I Campylobacteriosis
I Cryptosporidiosis
80%
7Oo/o
60%
50%
4A%
30%
20%
ta%
iYo
I Giardiasis
o
U
Risk factors
Contact with Consumed Contact withfarm animals food from faecal matter
retarl premises
Recreational Contact with Contact withwater contact sick animals symptomatic
people
Travelledove rseas
during theincubation
period
Consumed
untreatedwater
Figure 13: Public Health South (2019) disease incidence by risk factor
Mataura River Alliance Discharge I Assessment of effects on recreationRG&A for Mitchell Daysh
31
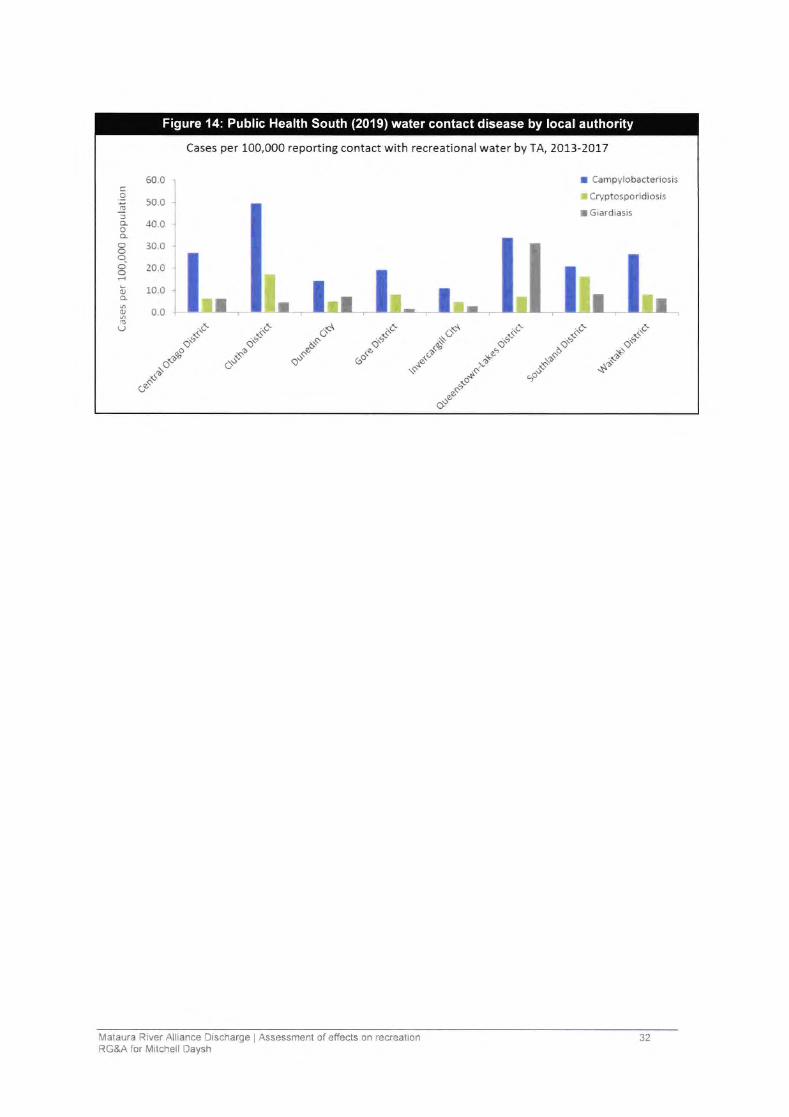
Cases per 100,000 reporting contact with recreational water byTA,2A73-2017
C
Eo5o-oo-ooo-oooo_
ru
6(J
60.0
50.0
40.0
30.0
20.0
10.0
0.0
q$ ..tI
_-$t"-.'
-*(vdv "c(roto
-aat"'dv
""""
".t. *a"o$'
.-.C -..C.6v .dv
.""" .*o.F'
.,..>t {9
""--"
I Campylobacteriosis
t Cryptosporidiosis
I6iardiasis
Figure 14: Public Health South (2019) water contact disease by local authority
Mataura River Alliance Discharge I Assessment of effects on recreationRG&A for Mitchell Daysh
32
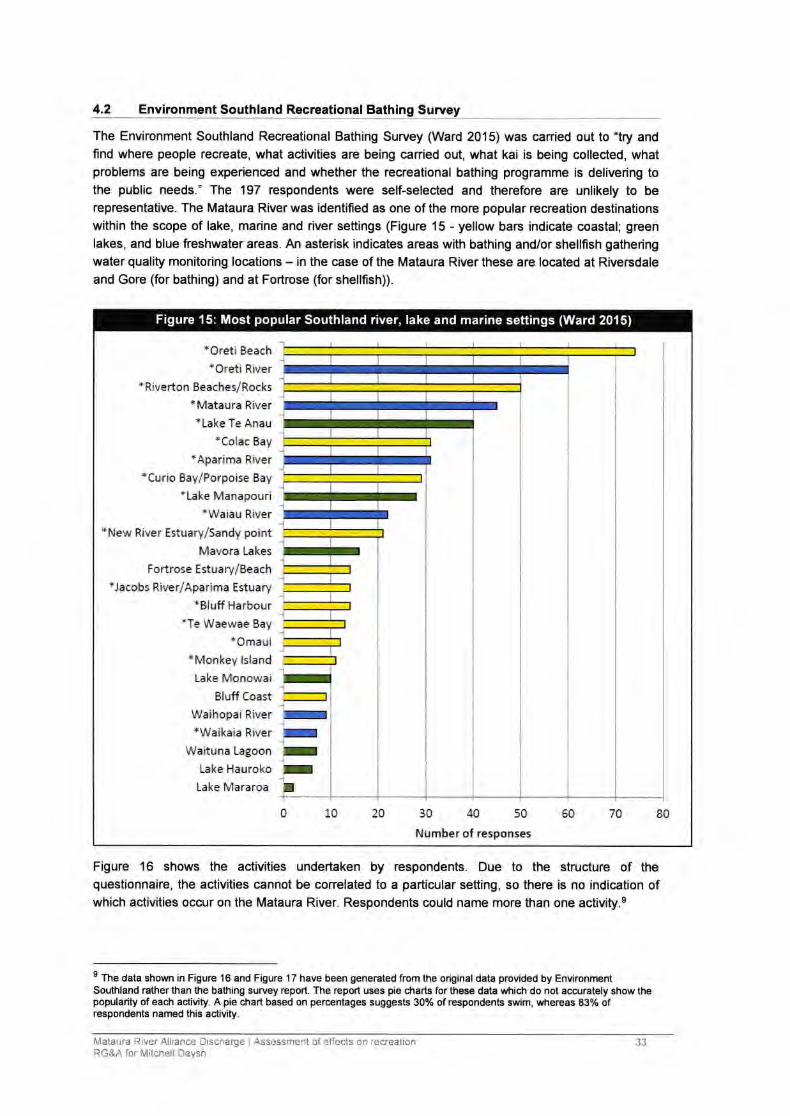
4.2 Environment Southland Recreational Bathing Survey
The Environment Southland Recreational Bathing Survey (Ward 2015) was carried out to'try andfind where people recreate, what activities are being canied out, what kai is being collected, whatproblems are being experienced and whether the recreational bathing programme is delivering tothe public needs.' The 197 respondents were self-selected and therefore are unlikely to berepresentative. The Mataura River was identified as one of the more popular recreation destinationswithin the scope of lake, marine and river seftings (Figure 15 - yellow bars indicate coastal; green
lakes, and blue freshwater areas. An asterisk indicates areas with bathing and/or shellfish gatheringwater quality monitoring locations - in the case of the Mataura River these are located at Riversdaleand Gore (for bathing) and at Fortrose (for shellfish)).
Figure 16 shows the activities undertaken by respondents. Due to the structure of thequestionnaire, the activities cannot be correlated to a particular setting, so there is no indication ofwhich activities occur on the Mataura River. Respondents could name more than one activity.e
9 The data shown in Figurc 16 and Figure 17 have been generated from the original data provided by EnvironmentSouthland rather than the bathing survey report. The report uses pie charts for these data which do not accurately show thepopularity of each activity. A pie chart based on percentages suggests 30% of respondents swim, whereas 83% ofrespondents named this aclivity.
Mataura Rlver Ailiance Discharge i Assessment of effects on recreationRG&A for Mitchell Daysh
*Oreti Beach*Oreti River
* Riverton Beaches/Rocks*Mataura River+Lake Te Anau
*Colac Bay*Aparima River
*Curio Bay/Porpoise Bay*Lake Manapouri
*Waiau River*New River Estuary/Sandy point
Mavora Lakes
Fortrose Estuary/Beach*Jacobs RiverlAparima Estuary
rBluff Harbour*Te Waewae Bay
*Omaui
*Monkey lsland
Lake Monowai
Bluff Coast
Waihopai River*Waikaia River
Waituna Lagoon
Lake Hauroko
Lake Mararoa
01020 30 40 50
Number of responses
60 70 80
Figure 15: Most popular Southland river, lake and marine settings (Ward 2015)
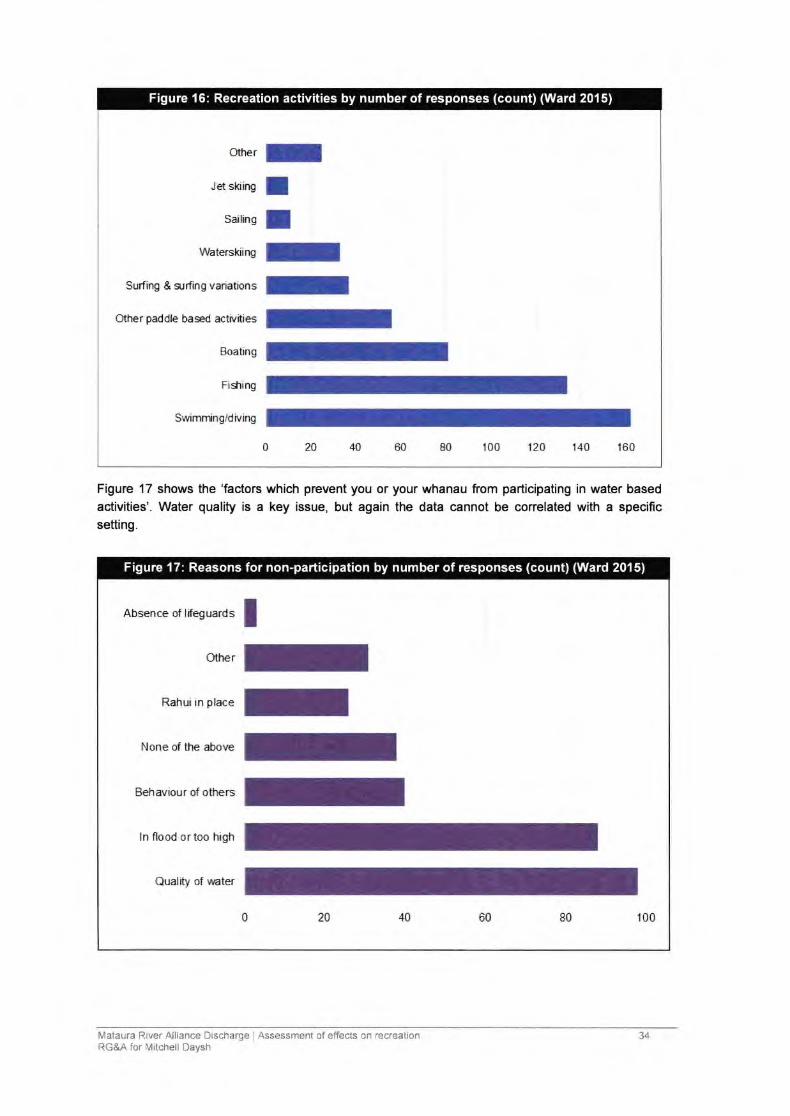
2A lm 60 80 100 120 140 160
Sr.nftr6 & srrfrng varntrons
Otter paddh baed activ*ies
Waterskiirg
Boating
Fishing
Swinrrhg/diving
0
orer fJe{srdiE I
sa'errs I
Figure 16: Recreation activities by number of responses (count) (Ward 2015)
Figurc 17 shows the 'factors which prevent you or your whanau trom participating in water basedactivities'. Water quality is a key issue, but again the data cannot be conelated with a specificsetting.
Absence of tifeguards
Rahti in place
None of the above
Behavbur of others
ln fbod or too hgh
Auality of water
100
fitrer
0 20 40 60 80
Figure 17: Reasons for non-participation by number of responses (count) (Ward 2015)
Mataura River Alliance Discharge I Assessment of effects on recreationRG&A for Mitchell Daysh
34
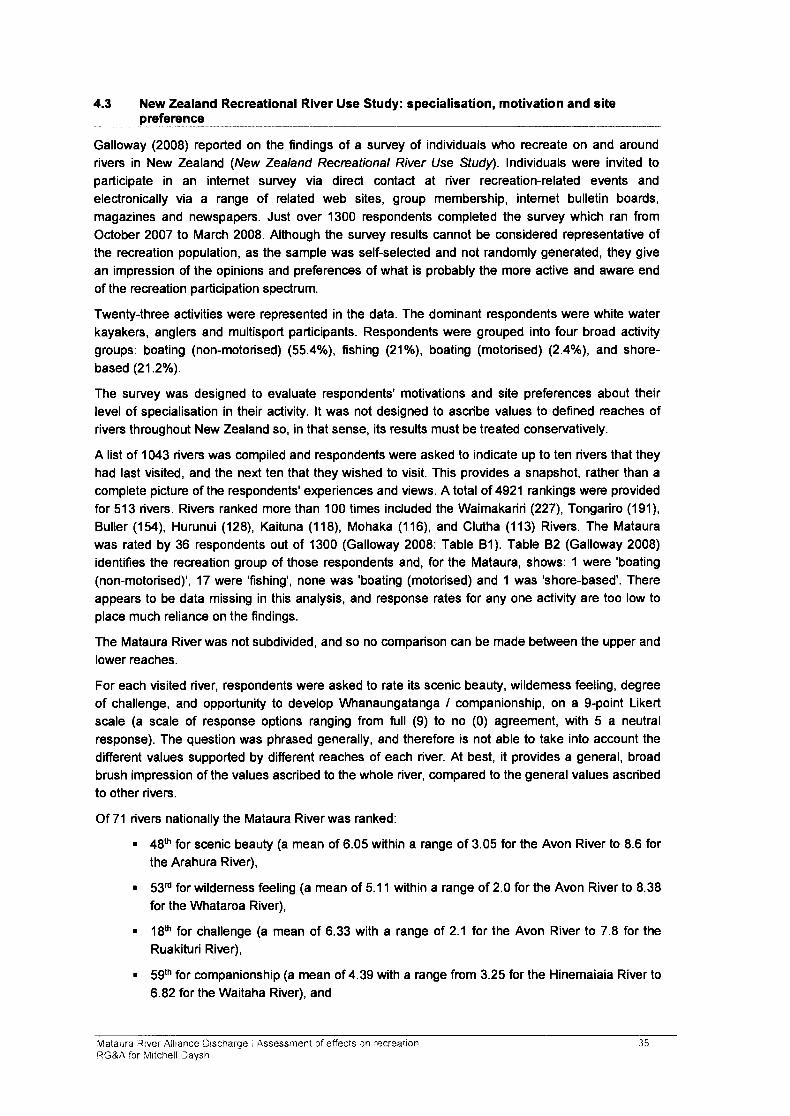
4.3 New Zealand Recreationa! River Use Study: specialisation, motivation and sitepreference
Galloway (2008) reported on the findings of a survey of individuals who recreate on and around
rivers in New Zealand (New Zealand Recrcational River Use Study). lndividuals were invited toparticipate in an internet survey via direct contact at river recreation-related events and
electronically via a range of related web sites, group membership, intemet bulletin boards,
magazines and newspapers. Just over 1300 respondents completed the survey which ran from
October 2007 lo March 2008. Although the survey results cannot be considered representative ofthe recreation population, as the sample was self-selected and not randomly generated, they give
an impression of the opinions and preferences of what is probably the more active and aware end
of the recreation participation spectrum.
Twenty-three activities were represented in the data. The dominant respondents were white waterkayakers, anglers and multisport participants. Respondents were grouped into four broad activitygroups: boating (non-motorised) (55.4%), fishing (21Yo), boating (motorised) (2.4o/o), and shore-
based (21.2o/o).
The survey was designed to evaluate respondents' motivations and site preferences about their
level of specialisation in their activity. lt was not designed to ascribe values to defined reaches ofrivers throughout New Zealand so, in that sense, its results must be treated conservatively.
A list of 1043 rivers was compiled and respondents were asked to indicate up to ten rivers that theyhad last visited, and the next ten that they wished to visit. This provides a snapshot, rather than a
complete picture of the respondents' experiences and views. A total of 4921 rankings were provided
for 513 rivers. Rivers ranked more than 100 times included the Waimakann Q27), Tongariro (191),
Buller (154), Hurunui (128), Kaituna (118), Mohaka (116), and Clutha (113) Rivers. The Mataura
was rated by 36 respondents out of 1300 (Galloway 2008: Table Bl). Table 82 (Galloway 2008)identifies the recreation group of those respondents and, for the Mataura, shows: 1 were 'boating
(non-motorised)', 17 were 'fishing', none was 'boating (motorised) and 1 was 'shore-based'. There
appears to be data missing in this analysis, and response rates for any one activity are too low toplace much reliance on the findings.
The Mataura River was not subdivided, and so no comparison can be made between the upper and
lower reaches,
For each visited river, respondents were asked to rate its scenic beauty, wildemess feeling, degreeof challenge, and opportunity to develop \Mranaungatanga / companionship, on a 9-point Likertscale (a scale of response options ranging from full (9) to no (0) agreement, with 5 a neutral
response). The question was phrased generally, and therefore is not able to take into account the
different values supported by different reaches of each river. At best, it provides a general, broad
brush impression of the values ascribed to the whole river, compared to the general values ascribed
to other rivers.
Of 71 rivers nationally the Mataura River was ranked:
. 48h for scenic beau$ (a mean of 6.05 within a range of 3.05 for the Avon River to 8.6 forthe Arahura River),
. 53d for wilderness feeling (a mean of 5.11 within a range of 2.0 for the Avon River to 8.38
for the Whataroa River),
r I gth for challenge (a mean of 6.33 with a range of 2.1 for the Avon River to 7.8 for the
Ruakituri River),
r 59th for companionship (a mean of 4.39 with a range from 3.25 for the Hinemaiaia River to
6.82 for the Waitaha River), and
lrlataura R:ver ,{lliance iischarqe I Assessment cf effects on .ecrealionRe&A ior Mitcnell Daysh
1E
. 47th overall (the 'grand mean' of 5.49 with a range of 3.22 for the Avon River to 7.69 forthe Arahura River).
4.4 Water Bodies of National lmportance
As part of the Govemment's assessment of Water Bodies of National lmportance, work has beenundertaken to identiff water bodies of value for recreation and tourism. The recreation report, titledPotential Water Bodies of National lmpoftance for Recreation Value (MfE, 2004), lists 105freshwater bodies including lakes, river and wetlands that are potentially important for recreation.Six water bodies are identified in Southland including the Mataura River. The list was derived froman internet survey of recreationists, a telephone survey of the public, a literature review anddiscussion with selected representatives of recreational groups. The report has manyinconsistencies and the base research has significant weaknesses.
The internet survey - which was based on a self-selected sample with an apparent bias to kayakersand canoeists - had the following count of activity respondents for the Mataura River:
. 1: Fishing
. 1: Walking
It was also identified as a whitebaiting river with more than 200 users.
The equivalent report for tourism (Ministry of Tourism, 2004) used activity data from thelnternational Visitor Survey and Domestic Travel Study to identiff trips associated with freshwaterbodies and included the following 'activities': scenic cruises, beaches, jet boating, glow worm caves,swimming, caving, white water rafting, black water rafting, lake fishing, river fishing, sailing, riverkayaking, water skiing and punting. The dataset identified the top eight freshwater destinations(which, in Southland, included only waterbodies near Te Anaulo) and the top ten freshwateractivities. There were no data relevant to other Southland waterbodies. A separate listing was alsogiven of freshwater bodies important for their scenic appeal rather than use value - none inSouthland.
4.5 New Zealand recreational river survey
The only comprehensive assessment of recreation potential of inland waterways was undertakenover three decades ago (Egarr & Egarr 1981). The Mataura was described in five sections: TheUpper Mataura River to Athol (with 'Low' recreation value); Mataura Gorge - Athol to Tomogalak(with 'lntermediate' recreation value); Tomogalak to Gore (with 'Low' recreation value); Gore to\Afndham (with 'lntermediate' recreation value); and \Afrndham to the Sea (with 'lntermediate'recreation value). Fishing and hunting were not considered in the analysis.
The Egarrs' descriptions of the lower three reaches are (noting again that fishing was not part of thescope):
TOMOGALAKTO GORE
Length: 66km. Averuge gradient: 1:770 1.3m/ km.
Recreational use and scenic desciption: Frcm the confluence with the Tomogalak Streamthe Mataura River sprcads out onto the Waimea Plains, becoming wider and shallower.Willows continue to line the banks and sweep the water with their branches for most of thedistance to Gorc. ln the 10km above the Waikaia River confluence the river becomesbraided and sp/ifs around grzlss-covered rs/ands. The river, in summer, becomes hopelesslyshallow for boating and is not ofren used for recreation. There are no rapids other thanshingle sha//ows until almost to Gore, wherc therc are the first srgns of hard bedrcck that
10 Lake Te Anau, Tunnelbum River, Arthur River, Clinton River, Hollyford River, Lake Hauroko, Wairarahiri River, WaiauRiver, Mavora Lakes, Lake Manapouri
\Ial3Lr, ?iver Alliance lischarge Assessmenl ci effects on .ecreation1C&A icr Vlitcneil -.aysh
36
creafes rock ledges throwing up small npids. Such rapids arc more common in the loweriver.
GORE TO WYNDHAM
Length: 36km. Avenge gradient: 1:700 1.4m/ km.
Recrcational use and scenrb desciption: Below Gore the essenfia/ nature of the Matauru, awide shingle bed riverflanked by willows, does not alter except that the shingle beaches on
either side of the iver arc smaller and therc are peiodic outcrops of a hard, smooth rockwhich crcates some mild rapids. Between the paper mill and the freezing works at Mataurutherc is a weir about 1.5 metes in height; 200 metres downstrcam therc is a natural rockweir or small wateiall. Ihese obstructions effectively prcvent the upstream navigation of jetboats and arc not run by canoeistg rafterc or other craft. Possibly the wateffall could be runbut the presence of the weir, which creates a poweiul and dangerous stopper wave close
beneath the sill of the weir, convinces most boaters to poftage this section. Below Gorcextensive willow cleaing has been canied out and this may eventually extend downstream.
However, the river is wide enough so that small craft can avoid running into the willows.
Gnvel and sandy beaches flank the river channel but they are not as exfensrVe as in the
upper river. Beneath the Wyndham Bidge lie old wooden bidge piles cut off just belownormal summer water level. These can be hazatdous. Jet boats use the iver up to Matauraand this section r.s a/so a popular, easy tip for canoeists. Other craft seldom use the iver.
WYNDHAM TO THE SEA
Length: 57km. Average gradient: Slight.
Recrcational use and scenic description: The iver below Wyndham tends to flow quietly
between low beaches and grassy banks. Large willows line the banks draping theirbnnches into the water. They become smaller and occur only occasionally below the
Seaward Downs. The iver becomes tidal and swampy, the shingle bed giving way to mud.
The iver is jet boated along this section and sometimes canoed and navigated by powerboats.
The Egans' report provides rankings of rivers/reaches for recreational and scenic value and goes
on to select the most important that deserve protection for their recreational value at a variety ofpriority levels. The Mataura below Tomogalak was not identified.
4.6 Nationallnventory of Wild and Scenic Rivers
ln 1982 the National Water and Soil Conservation Authority released a draft inventory of wild and
scenic rivers and sought submissions. A resulting document was published in 1984 (Grindel 1984),
and provides a list of what were considered to be "nationally important wild and scenic rivers.' The
final list excluded lakes because the Committee responsible for compiling the list decided that itsterms of reference did not include them. Thirteen rivers were identified in the North lsland and 40 inthe South. The Mataura River was in the draft list, but not in the final (possibly because it was not
considered 'wild'), but this significanoe assessment is now redundant considering the existing WaterConservation Order.
The Ministry of Agriculture and Fisheries made a substantial submission to the draft inventory in
relation to fteshwater angling values (Tierney et al 1982). The authors recommended that theMataura River be considered as nationally important due to the value as a brown trout fishery (p88):
The Mataura River, from source fo sea, is identified in the draft inventory as a nationallyimpoftant brown trcut fishery. Fishenes Research Division fully supports its inclusion in the
inventory, buf suggesfs that in addition to the comments should note that there is a
significant whitebait fishery at the river mouth.
Mataura River Alliance Siscnarge Assessment of effects on recreationRG&A for ivlitchell Daysh
37
ln 1986 the Protected Waters Assessment Committee released its recommendations for a,"list ofthose lakes and riverc which the committee commends as suitable for inclusion in a Schedule ofProtected Waterc" (Grindell and Guest 1986). The intention of the study was to advise the thenMinisters of Works and Development and Conservation of "those waters deseruing inclusion in aschedule of Protected Waterc that can be attached to the Water and Soil Conseruation Bill."
The committee's analysis built on lhe National lnventory of Wld and Scenic RrVers (Grindell 1984),but expanded the scope of assessment from that study's limit of wild, scenic, recreational andscientific values to include, in addition: fisheries, wildlife habitat, flora, tourism and cultural values.
ln terms of recreational values, the relevant assessment procedure for identiffing an outstandingwaterbody was well outlined (p7). This process was drawn, in the main, from the approach used inlhe National lnventory of Wld and Scenic RrVers:
'This category includes those rivers wherc the existing water regime plays an essential anddominant rcle in providing an outstanding recrcational experience or nnge of experiences.An area which has an unrcalised potential for providing an outstanding amenity may beconsidercd. While the surounding landscape may contibute significantly to thoseexpeiences the water, the iver or lake bed and possibly a naffow iparian strip are thecrucial elements for the rccreational value. The recreations arc mainly instream use(angling, jet boating, canoeing, packfloating, etc) but this commiftee rccognised thatpicnickerc, etc, also went therc because of the water, not in spite of the water. An area maybe considered outstanding because of one or more of a number of charccteistics. lt mayprovide a wide vaiety of rccreational experiences and be used often by people within and,to an extent, outside its region. Or its prcsent level of use may be low but provide anexceptional type of recreational expeience, possibly rcquiing advanced sk//s so fhafpeople from other regions or overseas travel to the arca to use it.
" Su m m aru of ch aracte i stics
a The characteristics vary and laryely reflect the recreational uses for which the river isoutstanding.
b The iver satisfies the recrcational needs of a large number of people, or consfifufes anamenity for a wide variety of rccrcational activities, or provides an outstandingrccreational expeience.
c A iver in this category may be under-utilised at present but have potential for vaied,intensive or specialised use.
d The arca may be rcadily accessrb/g frequently by road. The surounding land may showsigns of human activity and settlement.
e The water may be subject to some minor divercions and there may be somedevelopment such as bank protection works, but not to the extent that the iver regime iscontrolled.
f While there may be some waste discharyes, the water will usually be of a qualttycompatible with the recrcation activities.
"Rivers arc the focus of a great vaiety of rccrcational activities. A range of recreationalfacilities for present and futurc recreationists must be protected throughout the country.
a Wldemess and expedition type facilities: generally wild and scenrc ivers of sufficientsize to permit a range of recreational values.
b lMtite water essential for whitewater rafting, canoeing, jet boating.
c Placid wafer essential for boating activities where coastal waterc unsuited to boating.
!lataura liver Ailiance Discharge I Assessment cf effects on iecreationllG&A ior tlircnell faysh
38
d Small urban sfreams: c/ose to populated arcas for general rccrcation and picnicking.
e Roufes as access and as a form of rccrcation."
The committee developed a three-tier classification (groups one, two and three) to define an order
of importance for the waters identified as outstanding. ln terms of including the waters in a schedule
of protection (p12), "anythrng /ess than the first group would provide an inadequate rcpresentation.
lf the Schedule should be bigger, then the second group should be used for making a selection. lfthe two together arc insufficient then the third group should be used for making a selection."
The Mataura River was not listed, which is rather surprising considering its listing in the 1982
National Water and Soil Conservation Authority draft inventory and the Ministry of Agriculture and
Fisheries submission (Tiemey et al 1982).
Mataura River Alliance Discharge I Assessment of effects on recrealionRG&A for Mitchell Daysh
39
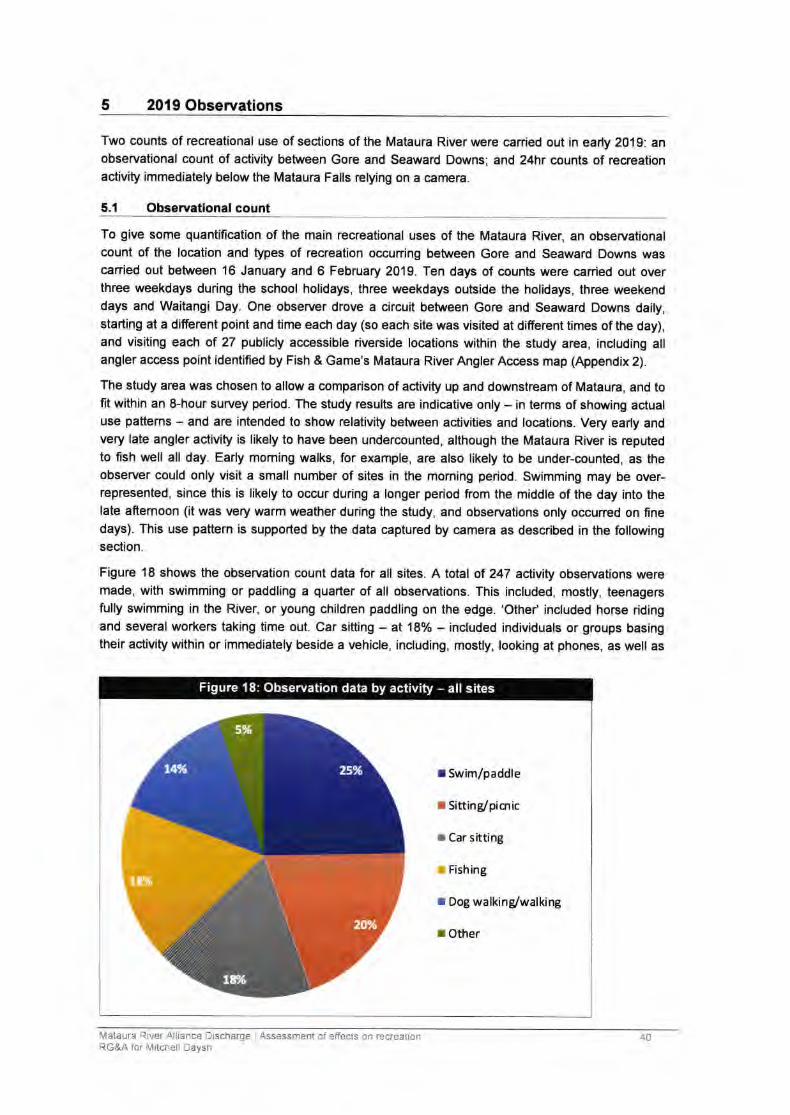
5 2019 Observations
Two counts of recreational use of sections of the Mataura River were canied out in early 2019: anobservational count of activity between Gore and Seaward Downs; and 24hr counts of recreationactivity immediately below the Mataura Falls relying on a camera.
5.1 Obseruational count
To give some quantification of the main recreational uses of the Mataura River, an observationalcount of the location and types of recreation occuning between Gore and Seaward Downs wascanied out between 16 January and 6 February 2019. Ten days of counts were canied out overthree weekdays during the school holidays, three weekdays outside the holidays, three weekenddays and Waitangi Day. One observer drove a circuit between Gore and Seaward Downs daily,starting at a difierent point and time each day (so each site was visited at difierent times of the day),and visiting each of 27 publicly accessible riverside locations within the study area, including atlangler access point identified by Fish & Game's Mataura RiverAnglerAccess map (Appendix2l.
The study area was chosen to allow a comparison of activity up and downstream of Mataura, and tofit within an 8-hour survey period. The study results are indicative only - in terms of showing actualuse pattems - and are intended to show relativity between activities and locations. Very early andvery late angler ac{ivity is likely to have been undercounted, although the Mataura River is reputedto fish well all day. Early moming walks, for example, are also tikety to be under-counted, as theobserver could only visit a small number of sites in the moming period. Swimming may be over-represented, since this is likely to occur during a longer period fom the middle of the day into thelate aftemoon (it was very warm weather during the study, and observations only occurred on finedays). This use pattern is supported by the data captured by camera as described in the followingsec{ion.
Figurc 18 shows the observation count data for all sites. A total of 247 activity observations weremade, with swimming or paddling a quarter of al! observations. This included, mostly, teenagersfully swimming in the River, or young children paddling on the edge. 'Othef included horse ridingand several workers taking time out. Car sitting - at 18o/o - included individuals or groups basingtheir activity within or immediately beside a vehicle, including, mostly, looking at phones, as we!! as
5o/o
t4% 25%
t8%
2Oo/o
1*/o
r Swim/paddle
r Sitting/picnic
r car sitting
r Fishing
I Dog walking/walking
I Other
Figure 18: Observation data by activity - all sites
Mataura River Alliance Discharge I Assessment of effects on recreatlonRG&A for Mitchell Daysh
40
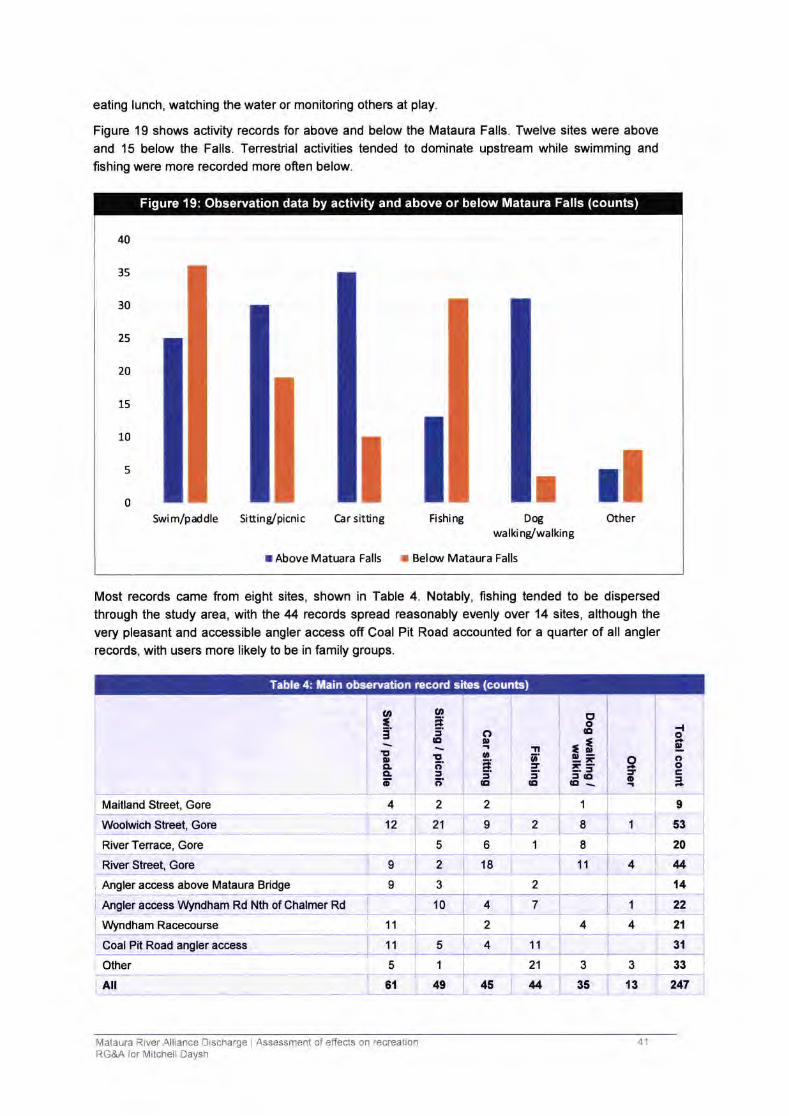
40
35
30
25
20
15
10
Swim/paddle Sitting/picnic Car sitting Fishing Dog
walking/walking
r Above Matuara Falls r Belor,rr Mataura Falls
5 I0
Other
Figure 19: Observation data by activity and above or below Mataura Falls (counts)
eating lunch, watching the water or monitoring others at play.
Figure 19 shows activity records for above and below the Mataura Falls. Twelve sites were above
and 15 below the Falls. Tenestrial activities tended to dominate upstream while swimming and
fishing were more recorded more ofren below.
Most records came from eight sites, shown in Table 4. Notably, fishing tended to be dispersedthrough the study area, with the zt4 records spread reasonably evenly over 14 sites, although the
very pleasant and accessible angler access off Coal Pit Road accounted for a quarter of all anglerrecords, with users more likely to be in family groups.
Maitland Street, Gore 2
{0o;ot=
9
oto
ooo{D
==G
l
.tlo,t5E
oD
o
IGI
to
oItoo
2
ittI3
Itocco
Woolwich Street, Gore
RiverTenace, Gore
River Street, Gore
Angler acccss above Mataura Bridge
Angler access V[ndham Rd Nth of Ghalmer Rd
12)ztisirai5618
1 53
20
414
I 2
9 3, iiil +
10 47 1122-i,
$frndham Racecourse 11 2
4 1'.|
21 3
4 4 21
3t
333Coal Pit Road angler access
Other
11
5
6t
5
1a
13 47Alt
Table 4: Main observation record sites (counts)
49 45 4
41lvlataLtra River Alliance Discharge I Assessment of effects on recreationRG&A ior ltitchell Daysh
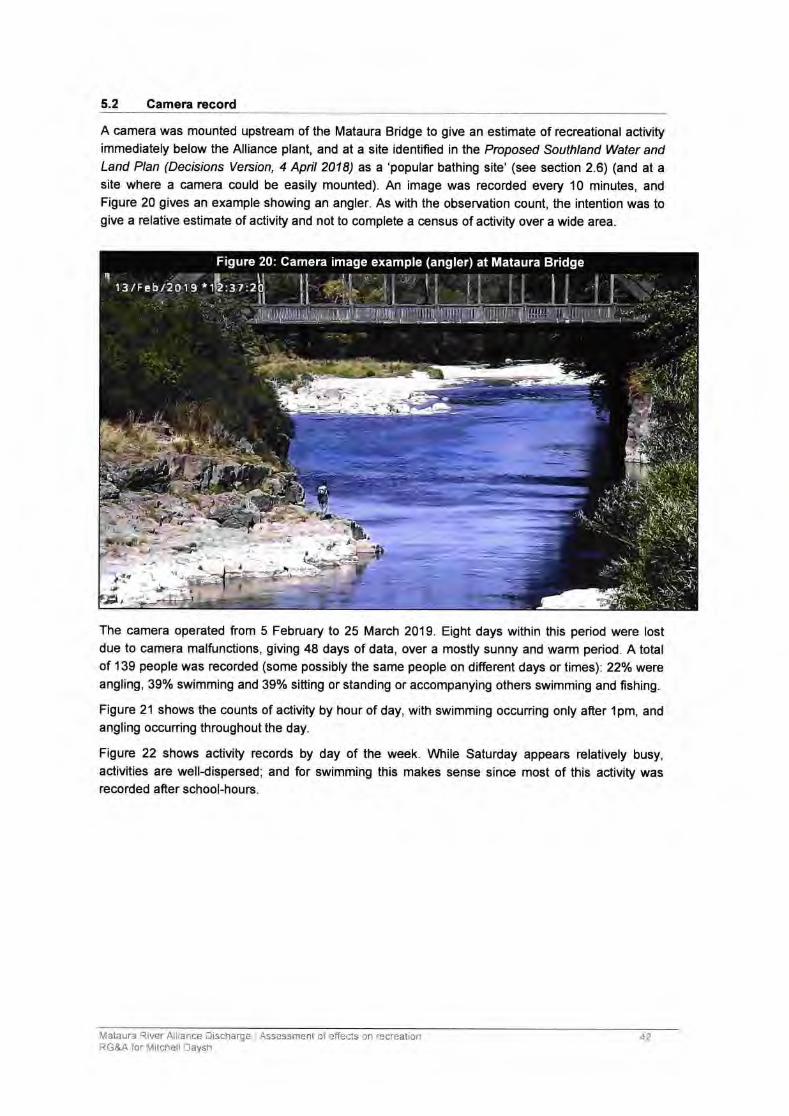
5.2 Camera record
A camera was mounted upstream of the Mataura Bridge to give an estimate of recreational activityimmediately below the Alliance plant, and at a site identified in the Proposed Southland Water andLand Plan (Decisions Vercion, 4 Apfl 2018) as a'popular bathing site'(see sec{ion 2.6) (and at asite where a camera could be easily mounted). An image was recorded every 10 minutes, andFigure 20 gives an example showing an angler. As with the observation count, the intention was togive a relative estimate of activi$ and not to complete a oensus of activity over a wide area.
The camera operated ftom 5 February to 25 March 2019. Eight days within this period were lostdue to camera malfunctions, giving 48 days of data, over a mostly sunny and warm period. A totalof 139 people was recorded (some possibly the same people on different days or times): 22o/o waraangling, 39% swimming and 39% sitting or standing or accompanying others swimming and fishing.
Figure 21 shows the counts of activity by hour of day, with swimming occuning only after 1pm, andangling occuning throughout the day.
Figure 22 shows activity records by day of the week. Wtrile Saturday appears rclatively busy,activities are well-dispersed; and for swimming this makes sense since most of this activity wasrecorded after school-hours.
Mataura River Alliance Discharge I Assessment of effects on recreationRG&A for Mitchell Daysh
42
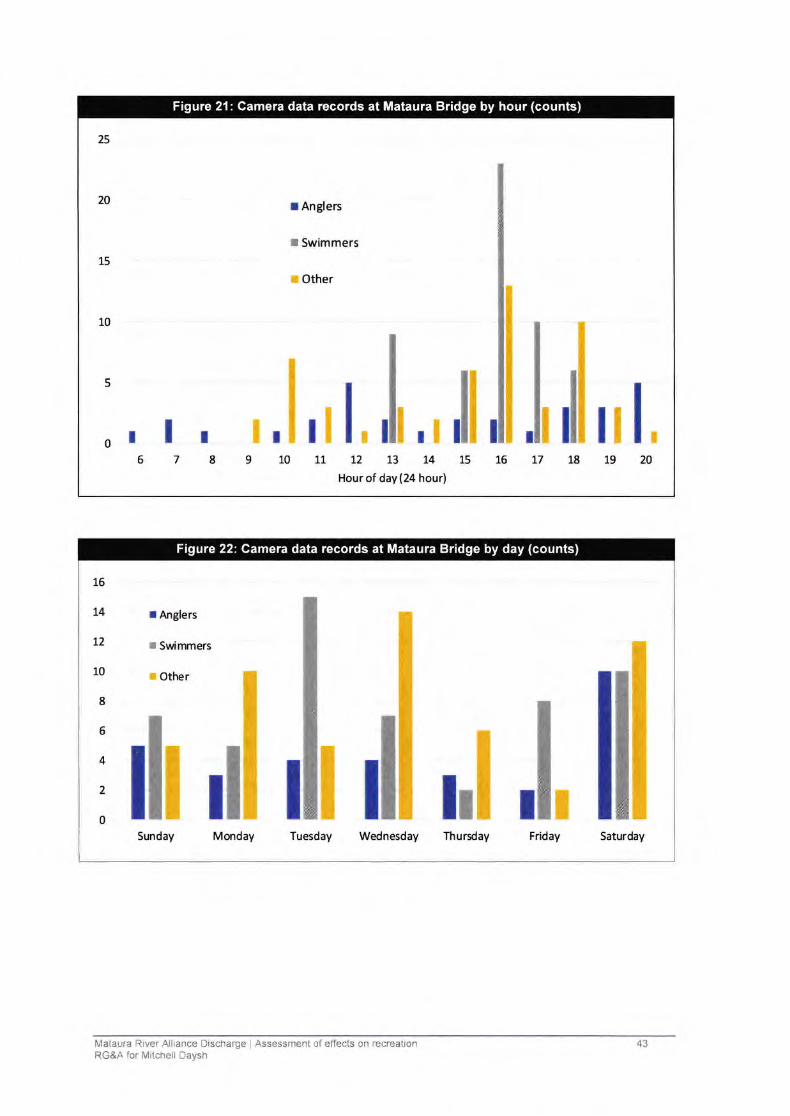
I Anglers
f Swimmers
I Other
25
20
15
10
5
,llol67891011 15 16 L7 18 19 20
,,lrll,L2 13 L4
Hour of day (24 hour)
Figure 21: Camera data records at Mataura Bridge by hour (counts)
16
t4
L2
10
8
5
4
2
0
Sunday Mmday Tuesday Wednesday Thurday Friday Saturday
III I I
I Anglerc
r Swimmers
r Other
ilr il
Figure 22'. Camera data records at Mataura Bridge by day (counts)
Mataura River Alliance Discharge I Assessment of effects on recreationRG&A for Mitchell Daysh
43
6 Interview summaries
A selection of recreational users was interviewed or contacted via email to gain an understanding ofusers' perceptions of the quality and nature of the recreational experience on the Mataura River,and the perceived effect of water quality on the experience.
Full interview summaries are provided in Appendix 1 (not all wished to be quoted). lntervieweesindicated a varie$ of perceptions about changes to recreation values over time, with regard towater quality. Key points include:
. A variety of perceptions about water quality and the safety of contact recreation. While no-one interviewed would drink ftom the Mataura River below Cattle Flat, and many would noswim in it, responses included opinions ranging from 'possibly too clean' (by an angler) to'honendous' (a kayaker, describing the river-sefting at Mataura generally, including theproximity of the Alliance plant to the River). All agreed that the Rive/s water quality wasfar better than in the 1980s when there were a variety of untreated discharges, includingmunicipal wastewater and outfalls from the pulp and paper mill, Alliance plant andEdendale dairy factory (these resulted in some very large trout and eels being caught);and that the latest upgrade at the Alliance plant had also had a positive effect. Severalrespondents - mostly anglers - considered the water quality now to be quite good, butpotentially of decreasing quality due to farming intensification. Others considered thewater quality to be poor. Many noted a variety of sources of contamination, includingfarming and treated municipal wastewater, particularly at Gore. The Alliance discharge didnot feature as a major issue for most respondents but was noted by some kayakers. Mostinterviewees considered foam on the River to be a natural phenomenon, considering itoccurs well above Gore.
. Opinions about the quality of the fishery also varied. Most agreed that the mayfly rise onthe Mataura River had declined in frequenry and intensity, with severaltheories as to thecause. The most experienced angler on the River downstream of Mataura - with detailedangling diaries - considered the insect life in the River to be quite healthy, but that warmersummer temperatures (climate change) were confining the rise to evenings and night,were less frequent generally, and were occurring later in the 'summe/ season ('May is thenew April'). Warmer temperatures were also considered a cause in the change in thepatterns of the hatch by other anglers, but nutrification and sedimentation and (therefore)
fewer insects were also identified. The Southland Fish and Game manager noted a lack ofgood data to define the scale of change and any specific causes, while noting that thefishery itself (the number and condition of fish) was still in a good state.
. Opinions about the number and quality of trout varied, with some considering the numbersand quality to be consistent, and others considering size, quality and numbers to have alldeclined. Some considered a reduction in trout size to be the result of a cleaner river. Thechange in the frequency, timing and duration of the mayfly hatch has influenced a changein fishing technique, with more nymphing over dry fly fishing.
. Swimming appears to be, in the main, a very local activity with a small number of regularusers - also influenced by the recent closure of the community swimming pool atMataura. There appears to be no common local conversation about illnesses from contactwith the River water, and bathing water quality reports issued by Environment Southlanddo not appear to affect many swimmers' choices. One kayaker reported an illness aftercoming out of his kayak immediately below the Mataura Falls, and reported an odour fromthe Alliance discharge.
\4ataLra lrver Ailiance Sischarge I Assessment cf effects on recreationiG&A rcr fulitcnerl Daysh
44
7 Effects of Alliance discha and take
Four potential issues with the Alliance discharge and take are of interest to recreation, consideringthe recreation values identified in this assessment.
. The degree to which it increases the risk of contracting a waterbome disease from watercontact recreation, including swimming, paddling and trout and whitebait fishing;
. The effect of the discharge on trout and whitebait abundance and quality, associated withwater quality and other habitat parameters, such as the health of the in-rivermacroinvertebrate community and water temperature;
. The degree to which the discharge exacerbates nuisance periphyton growths, affecting
bathing quality and the risk of anglers slipping; and
. Odour from the discharge, alterations of water colour and clarity and the generation offoams and scums, affecting water contact recreation as well as visual amenity, angling
and whitebaiting.
Each of these issues is discussed below.
7.1.1 Waterbomedrbease
Dada (2018) reviews the risk of contracting a microbial disease from contact with water affected bythe Alliance discharge. The review finds:
. That although the Alliance discharge often contains a high concentration ol E.colibacteria
- which are used in water testing to indicate the likelihood of the presence of pathogenic
organisms in a waterbody - the discharge contains relatively few human pathogens,
including Salmonella, Campylobacter, Cryptosporidium and Giardia. So, while the
discharge often contributes significantly to the exceedance of national standards forcontact recreation in the River, the increase in the real risk of disease is relatively slight.
. The Mataura River, above and below the discharge, normally fails the bathing waterstandards for cpntact recreation, particularly when water clarity is poor or when river flowsare elevated. Dada (2018) suggests that a combination of faecal loadings from pastoral
catchment overland flows, birds (particularly for Campylobacter) and in-stream processes
account for much of the bacterial load; although the Alliance discharge is also a
contributor and its effects on E.colilevels are most evident at low River flows (when there
is less dilution).
. Considering the relatively low pathogenic loading in the discharge, Dada (2018)
concludes that, 'the current wastewater treatment applied at Alliance Plant is sufficient to
reduce health risks associated with swimming at the study site (Mataura Bridge) to levels
below'the NZ threshold for tolerable risk', even at maximum discharge of 14,400 m3/d.'
This does not, of course, mean that the River is always suitable for swimming downstream ofMataura, due to the many other sources of contamination in the catchment. Relevantly, the National
Policy Statement for Freshwater Management includes provisions which place an obligation on
Environment Southland to set policy and methods to improve water quality in the Mataura
Catchment so that it is suitable for primary contact more often, and the key indicator for how that is
being achieved is also instream E.coliconentrations
It is suggested that the Plant's should contribute to catchment-wide improvements in water quality
in the Mataura River with regard to its high E,coli output - despite its low pathogen loading.
Mataura River Alliance Discharge I Assessrnent cf effects cn recreationRG&A lor lvlitcnell Daysh
45
7.1.2 Trout and whitebait abundance and quality
Montgomerie et al (2019) report that changes in: the benthic invertebrate community; the chemicalcomposition of the water; periphyton levels; and water temperature, all have the potential to affecttrout and whitebait habitat, and therefore their abundance and condition. Montgomerie et al in theirassessment of in-river ecological values and the effects of the Alliance discharge, reach similarconclusions to Dada (2018): while the contribution of the discharge to adverse environmentaleffects are slight and subsumed by the many other sources of nutrification, the Plant will need toreduce its levels of key contaminants as part of catchment wide initiatives to improve water quality.
With regard to the benthic invertebrate community, Montgomerie et alfound mayfly (Deleatidiumsp) abundance varied above and below the discharge and showed no relationship with it; but ratherwas closely aligned with variations in water temperature, associated with low flows and long, warmsummer periods. This aligns with comments made by several anglers during interviews for thisassessment (Appendix 1). Discharge water temperature - from both treated wastewater and plantcooling water - had no relevant effect on in-river water temperature; and in January 2018 riverwater temperature upstream and below the discharge exceeded the upper lethal temperature formayfly over a period of days.
Similarly, periphyton surveys showed variability above and below the discharge, with no causativerelationship with it (which accounts in part for the lack of effect on macroinvertebrates in the River).lnterestingly, while mean monthly dissolved inorganic nitrogen and dissolved reactive phosphorusconcentrations at biological monitoring sites upstream and downstream of the discharge exceededthe Ministry for the Environment (MfE) periphyton guideline for protecting benthic biodiversity, nonuisance periphyton growths were identified in surveys canied out since 2013, suggesting,according to Montgomerie et al that either dissolved inorganic nitrogen or dissolved reactivephosphorus concentrations need to be higher than the MfE (2000) guidelines, or other factors arecontrolling periphyton growth in the River.
Montgomerie et a/ also found that the total nitrogen discharge contribution to the Toetoes Estuaryload from the discharge is 1.1 - 1.7o/o, and the estimated total phosphorus discharge contribution is
0.7 - 1.3%, with most of the total nitrogen and total phosphorus load derived from other catchmentinputs, particularly diffuse sources. Even a marked reduction in the discharge of total nitrogen andphosphorus loads would have little, if any, detectable effect on the Estuary's nutrient status.
Accordingly, Montgomerie ef a/ concluded that the take and discharge are very unlikely to have anydetectable effects on ecolog ical communities.
7.1.3 Periphytongrowths
Periphyton growths in the River were reviewed by Montgomerie et al (2019\, as discussed above,with no relationship with the discharge identified.
7.1.1 Odour and other water qualityr issues
Odour was reported, via the interviews summarised in section 6 by one kayaker as having beennoted immediately at the Alliance discharge site, and was considered a potential issue by oneangler - although not necessarily a determinant of participation in that case. lt is also not clear if thereported odour came from Alliance's wastewater treatment plant or the discharge itself.
The consent conditions for the discharge set a mixing zone 250 m downstream, althoughMontgomerie et al(2019) estimate that the zone, in practice, extends 100 m ftom the discharge. ltappears, from interviews, that there are no reports of odour beyond the mixing zone, and theswimming site approximately 50 m upstream of the Mataura Bridge remains popular.
Montgomerie et al (2019) find that the discharge does not adversely affect pH, turbidity, totalsuspended solids, colour, clarity or the generation of foams or scums. Foam - which is particularlyconspicuous at the Mataura Falls - occurs equally when the discharge is in operation or is closed.
ilai3Lr'l ?'ver Ailrance Discharge Assessrnent cf effects on recreation:G&A 'cr \,litcneil Saysn
46
7.2 Effects summary
The key finding of this assessment is that while the contribution of the discharge and water take toadverse effects on recreation in the Mataura River are very slight and subsumed by the many othersouroes of nutrification and contamination, the Plant will need to reduce its levels of keycontaminants as part of catchment wide initiatives to improve water quality.
Based on the findings of Dada (2018) and Montgomerie et al (2019), there appears to be no causal
relationship between the discharge and levels of periphyton, macroinvertebrates, colour, clari$ orthe generation of foams or scums - and hence trout and whitebait habitat and the ability to catch
them. Odour was reported as a potential issue by two interviewees, but appears to be confined tothe discharge mixing zone. Dada (2018) found elevated levels of E.coli associated with the
discharge, but very low and variable levels of human pathogens, and therefore low human health
risk. Nevertheless, options to further reduce these E.coli and nutrient outputs are recommended,
and while not urgent considering the existing low scale of effect on recreation amenity (and
ecological values), it is recommended they be implemented during the life of a renewed consent.
Mataura River Alliance Discharqe I Assessment of effects on recreationRG&A ior Mitchell Daysh
8 Conclusion
The data - from popular literature, published research and primary research in the form ofobservation and camera counts - indicate:
. The outstanding nature of the Mataura River for brown trout fishing;
. lts relatively high use for swimming, both up and downstream of Mataura;
. A very popular whitebait fishery in the lower reaches;
. Use of the riverbanks, berms, reserves and angler access points for a variety of terrestrialactivities, mostly around settlements, and with relatively high activity levels at the Coal PitRoad angler access point;
. A low level of use of the River for salmon fishing;
. Some use of the River for jet boating and kayaking, but with no relevant data to quantiffthese uses;
. Water quality is of interest when assessing recreation values on the Mataura River.
Public Health South has noted a lack of warning signs about water contact recreation along theMataura River (see section 4.1); and the only swimming warning signs located beside the River inJanuary 2019 between Gore and the coast were at Fortrose (erected by Environment Southland)and 'no diving' signs at either end of the Mataura Bridge. Alliance is not responsible for regionalsignage of this type, and there is no requirement to include sign installation as a consent condition(also considering the discharge has very little influence on water quality for contact recreation).However, as recommended by Public Health South, their installation needs consideration at theregional and district levels.
!lataura River Aiilarce Discnarge r Assessment of effects on recreation'lil&A 'or Vlrichetl Daysn
48
9 References
Charles, G. 2013. New Zealand Whitewater 5. 180 Grcat Kayaking Runs. (5th edition) Graham Charles.
Cressey, P., Hodson, R., Ward, R., & Moriarty, E.2017. Use of Quantitative MicrobialRrskAssessment toAssess the Human Health Nsk of the Mataura River, Southland. Report prepared for Alliance Group Ltd.
Dada, A.C. 2018 Quantitative MicrobialRrbk Assessment for the discharye of trcated meat prccessing factorywastewater into the Mataun Rfuer. Report AES1704, Streamlined Environmental, Hamilton. Prepared forAlliance Group / Aquatic Environmental Sciences Ltd
Department of Conservation. 2016. Southland Murihiku Conseruation Management Strafegy. 2 vols.Department of Conservation Southland.
Egan, G. Egan, J. Mackay, J. 1979. 64 New Zealand Rivers. NZ Canoeing Association.
Egan, G. 1995. New Zealand's South lsland Riverc: A Guide for Canoeists, Kayakers and Rafrers. NikauPress, Nelson.
Egan, G.D. and Egan, J.H. 1981 a. New Zealand Recreational River Suruey: An lnvestigation into theRecrcational Potential of New Zealand's lnland Waterways. Paft 1: Methods and Conclusions. Water andSoil Miscellaneous Publication no. 13. Published for the New Zealand Canoeing Association by theNational Water and Soil Conservation Organisation, Wellington.
Egan, G.D. and Egan, J.H. 1981b. New Zealand Reaeational River Suruey: An lnvestigation into theRecrcational Potential of New Zealand's lnland Waterways. Paft ll: Summaies of North lsland Riverc.Water and Soil Miscellaneous Publication no. 14. Published for the New Zealand Canoeing Associationby the National Water and Soil Conservation Organisation, Wellington.
Environment Southland, 2013. Whitebait Suruey Summary of rcsu/fs. Environment Southland lnvercargill.
Fink-Jensen, K. Johnson, M. Simpson-Edwards, M. 2004a. Frcshwater rccrcational users. Survey offrcshwater use in New Zealand. BRC Marketing & Social Research for MfE.
Fink-Jensen, K. Johnson, M. Simpson-Edwards, M. 2004b. Frcshwater rccreational userc. lntemet suruey offreshwater use in New Zealand. BRC Marketing & Social Research for MfE.
Fish & Game Hawke's Bay Region, 2005. 2005 Sports Fish & Game Bird Management Plan forthe Hawkes'Bay Region
Freshwater Solutions Ltd. 2019. Assessrnenf of the Effects of Alliance Mataun's Discharyes and Water Takeon Mataun River and Toetoes Estuary. Report prepared for the Alliance Group Ltd.
Galloway, S. 2008. New Zealand Recrcational River Use Study: Specialization, Motivation and SitePrcfercnce. School of Physical Education University of Otago.
Greenaway, R. 2016. Outstanding fieshwater body assessrnent criteia and assessment methodology:Recrcation values. Prepared for Golder Associates as part of the Outstanding Freshwater Body Project.
Grindell and Guest (eds). 1986. A list of ivers and lakes deseruing inclusion in a schedule of prctected waterc.Water and soil miscellaneous publications No.97
Grindell, D.S. (ed). '1984. A national inventory of wild and scenic nvers. Water and Soil Directorate, Ministry ofWorks and Development.
Hughes, B. Hanis, S. Brown, P. 2011 . Mataun Catchment Stnafeglc Water Study. Liquid Earth, AqualincResearch and Hanis Consulting report prepared for Environment Southland.
Jet Boating New Zealand (JBNZ). 2013. Safety / year book for the subscription year lst July 2013 to June2014. JBNZlnc.
Kelly, G.R. 1988. An inventory of whitebaiting riverc in the South lsland. NZ Freshwater Fisheries Report No.101 . Freshwater Fisheries Centre, MAFFish, Christchurch.
Kent, J. 2009. Soufh lsland Trcut Fishing Guide. Reed Publishing, Auckland.
Kent, J. Magnano Madsen, P. 2003. New Zealand's Top Trout Fishing Waterc. Reed Publishing (NZ) Ltd.
Marshall, K. 2018. Mataun River Cluster- an investigation of suspected cyanobacteial toxin poisoning inSouthland, New Zealand Southem District Health Board, Public Health South. Kate Marshall, HealthProtection Officer.
Millichamp, R.2013. Salmon Fever. Ross Millichamp Environmental, Christchurch
Ministry for the Environmenl.2004. Water Bodies of National lmpoftance: Potential Water Bodies of Nationallmpoftance for Recrcation Value. Ministry for the Environment, Wellington.
Ministry of Tourism. 2004. Waterc of National lmpoftance for Touism. The Ministry of Tourism, Wellington.
MataLira lliver Alliance Discharge I Assessment of effects on recreationRG&A for Mitchell l)aysh
49
Montgomerie, R., Carter, N., and Fitzpatrick, M. 2019. Assessment of the Effects of Alliance Matauru'sDischarges and Water Take on Mataun River and Toetoes Estuary. Freshwater Solutions client reportfor Alliance Group Ltd.
Public Health South. 2019. Surueillance Repoft: Rrck facfors that may contibute to enteic drseases(Campylobacfenbsri Cryptospoidiosls and Giadiasis) 1 January 2013 - 31 December 2017. PublicHealth South - Southem District Health Board, Southem DHB region.
Teimey, L.D., Unwin, M.J., Rowe, D.K., McDowall, R.M., Grayroth, E. 1982. SuDmr.ssion on the dnft inventoryof wild and scenic riverc of national impoftance. Ministry of Agriculture and Fisheries. FisheriesEnvironmental Report No. 28.
Unwin, M.J. 20'16. Angler usage of lake and iver fisheries managed by Fish & Game New Zealand: resultsftom the 2014/15 National Angling Suruey. NIWA Christchurch
Unwin, M.J. 2013. Values of New Zealand angling nvers Resu/ts of the 2013 National Angling Suruey. NIWAChristchurch Prepared for Fish & Game New Zealand
Unwin, M.J. 2009. Angler usage of lake and iverfisheies managed by Fish & Game New Zealand: resu/fsfrcm the 2007/08 National Angling Suruey. NIWA Christchurch Prepared for Fish & Game New Zealand
Unwin, M. and Brown, S. 1998. The Geognphy of Frcshwater Angling in New Zealand: A summary of resu/fsfrcm the 1994/96 National Angling Suruey. Prepared by NIWA for Fish & Game New Zealand. NIWAClient Report: CHC98/33, Christchurch.
Unwin, M. and lmage, K. 2003. Angler usage of lake and iver fisheries managed by Fish & Game NewZealand: Resu/fs ftom the 20Un2 National Angling Suruey. Prepared by NIWA for Fish & Game NewZealand. NIWA Client Report: CHC2003-114, Christchurch.
Ward, N. 2015. Envircnment Southland Recrcational Bathing Suruey. Environment Southland, lnvercargill
!latal;ra 3.iver Atliance 3rscharge Assessment cf effects on recreationi1C&A ;or Mitcneil laysh
50
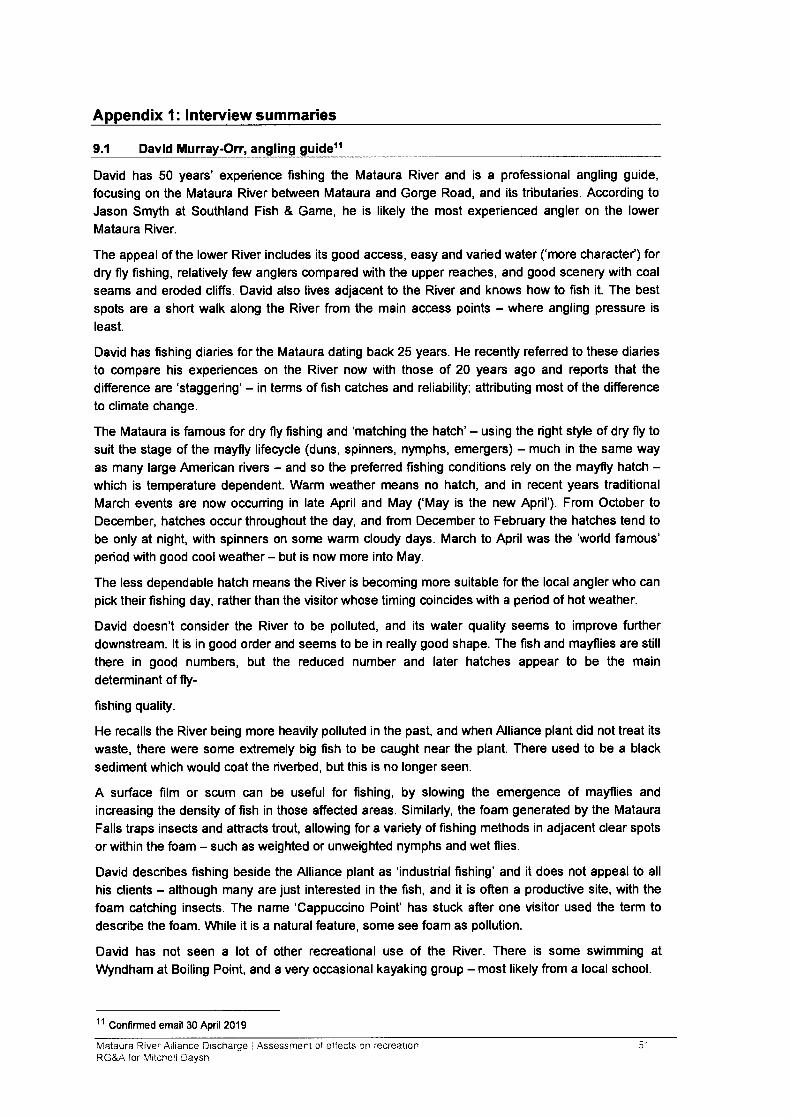
Appendix 1: lnterview summaries
9.1 David Murray-Orr, angling guide{r
David has 50 years' experience fishing the Mataura River and is a professional angling guide,
focusing on the Mataura River between Mataura and Gorge Road, and its tributaries. According to
Jason Smyth at Southland Fish & Game, he is likely the most experienced angler on the lowerMataura River.
The appeal of the lower River includes its good access, easy and varied water ('more characted) fordry fly fishing, relatively few anglers compared with the upper reaches, and good scenery with coal
seams and eroded cliffs. David also lives adjacent to the River and knows how to fish it. The best
spots are a short walk along the River from the main access points - where angling pressure is
least.
David has fishing diaries for the Mataura dating bad< 25 years. He recently referred to these diaries
to compare his experienoes on the River now with those of 20 years ago and reports that the
difference are 'staggering' - in terms of fish catches and reliabili$; attributing most of the difference
to climate change.
The Mataura is famous for dry fly fishing and 'matching the hatch' - using the right style of dry fly to
suit the stage of the mayfly lifecycle (duns, spinners, nymphs, emergerc) - much in the same way
as many large American rivers - and so the preferred fishing conditions rely on the mayfly hatch -which is temperature dependent. Warm weather means no hatch, and in recent years traditional
March events are now occuning in late April and May ('May is the new April'). From October to
December, hatches occur throughout the day, and from December to February the hatches tend to
be only at night, with spinners on some warm cloudy days. March to April was the 'world famous'period with good cool weather - but is now more into May.
The less dependable hatch means the River is becoming more suitable for the local angler who can
pick their fishing day, rather than the visitor whose timing coincides with a period of hot weather.
David doesn't consider the River to be polluted, and its water quality seems to improve further
downstream. lt is in good order and seems to be in really good shape. The fish and mayflies are still
there in good numbers, but the reduced number and later hatches appear to be the main
determinant of fly-
fishing quality.
He recalls the River being more heavily polluted in the past, and when Alliance plant did not treat its
waste, there were some extremely big fish to be caught near the plant. There used to be a black
sediment which would coat the riverbed, but this is no longer seen.
A surface film or scum can be useful for flshing, by slowing the emergence of mayflies and
increasing the density of fish in those affected areas. Similarly, the foam generated by the Mataura
Falls traps insects and attracts trout, allowing for a variety of fishing methods in adjacent clear spots
or within the foam - such as weighted or unweighted nymphs and wet flies.
David describes fishing beside the Alliance plant as 'industrial fishing' and it does not appeal to all
his clients - although many are just interested in the fish, and it is often a productive site, with the
foam catching insects. The name 'Cappuccino Point' has stuck after one visitor used the term to
describe the foam. \A/hile it is a natural feature, some see foam as pollution.
David has not seen a lot of other recreational use of the River. There is some swimming at
\Afndham at Boiling Point, and a very occasional kayaking group - most likely from a local school.
11 confirmed email 30 April 2019
Maiairra River Alliance Discharge i Assessmeni of eff€cts on 'ecreationRG&A ior ftIitcnell Daysh
c
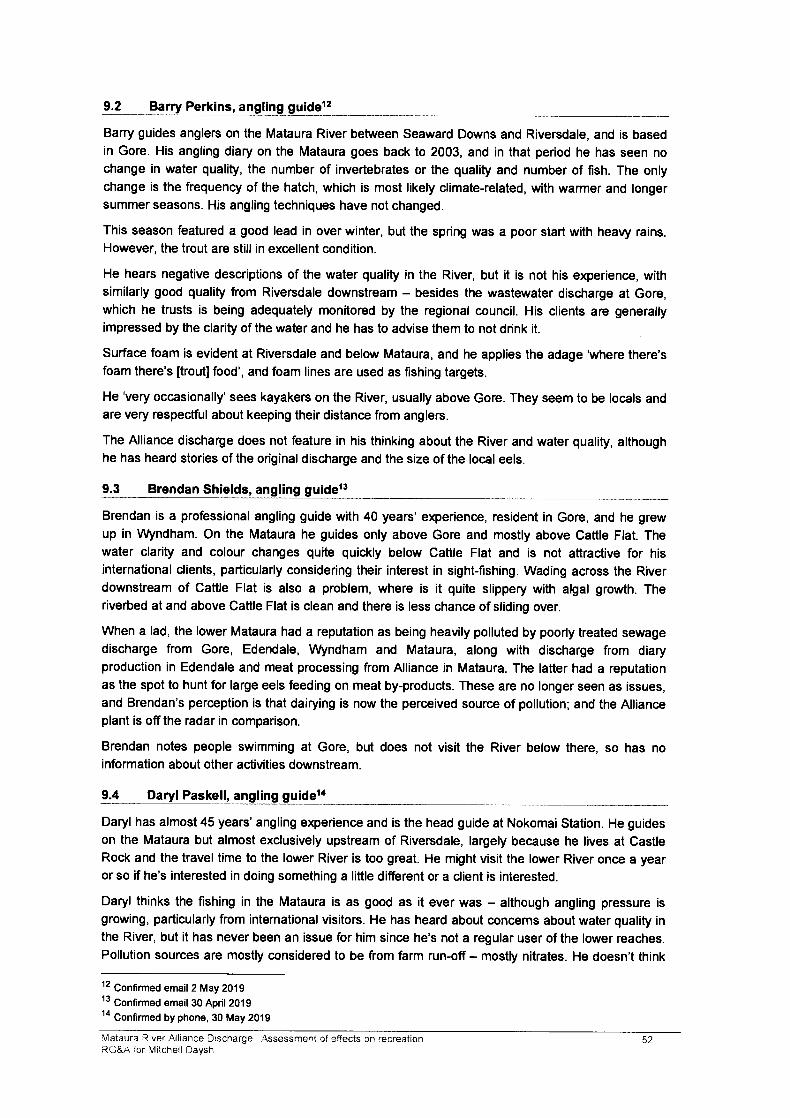
9.2 Barry Perkins, angling guidel2
Barry guides anglers on the Mataura River between Seaward Downs and Riversdale, and is basedin Gore. His angling diary on the Mataura goes back to 2003, and in that period he has seen nochange in water quality, the number of invertebrates or the quality and number of fish. The onlychange is the frequency of the hatch, which is most likely climate-related, with warmer and longersummer seasons. His angling techniques have not changed.
This season featured a good lead in over winter, but the spring was a poor start with heavy rains.However, the trout are still in excellent condition.
He hears negative descriptions of the water quality in the River, but it is not his experience, withsimilarly good quality from Riversdale downstream - besides the wastewater discharge at Gore,which he trusts is being adequately monitored by the regional council. His clients are generallyimpressed by the clarity of the water and he has to advise them to not drink it.
Surface foam is evident at Riversdale and below Mataura, and he applies the adage 'where there'sfoam there's [trout] food', and foam lines are used as fishing targets.
Helery occasionally'sees kayakers on the River, usually above Gore. They seem to be locals andare very respectful about keeping their distance from anglers.
The Alliance discharge does not feature in his thinking about the River and water quality, althoughhe has heard stories of the original discharge and the size of the local eels.
9.3 Brendan Shields, angling guider3
Brendan is a professional angling guide with 40 years' experience, resident in Gore, and he grewup in \Afrndham. On the Mataura he guides only above Gore and mostly above Cattle Flat. Thewater clarity and colour changes quite quickly below Cattle Flat and is not aftractive for hisinternational clients, particularly considering their interest in sight-fishing. Wading across the Riverdownstream of Cattle Flat is also a problem, where is it quite slippery with algal growth. Theriverbed at and above Cattle Flat is clean and there is less chance of sliding over.
When a lad, the lower Mataura had a reputation as being heavily polluted by poorly treated sewagedischarge from Gore, Edendale, \Afndham and Mataura, along with discharge from diaryproduction in Edendale and meat processing from Alliance in Mataura. The lafter had a reputationas the spot to hunt for large eels feeding on meat by-products. These are no longer seen as issues,and Brendan's perception is that dairying is now the perceived source of pollution; and the Allianceplant is off the radar in comparison.
Brendan notes people swimming at Gore, but does not visit the River below there, so has noi nformation about other activities downstream.
9.4 DarylPaskell, angling guide{a
Daryl has almost 45 years' angling experience and is the head guide at Nokomai Station. He guideson the Mataura but almost exclusively upstream of Riversdale, largely because he lives at CastleRock and the travel time to the lower River is too great. He might visit the lower River once a yearor so if he's interested in doing something a little different or a client is interested.
Daryl thinks the fishing in the Mataura is as good as it ever was - although angling pressure isgrowing, particularly from international visitors. He has heard about concerns about water quality inthe River, but it has never been an issue for him since he's not a regular user of the lower reaches.Pollution sources are mostly considered to be from farm run-off - mostly nitrates. He doesn't think
12 Confirmed email 2 May 201913 Confirmed email 30 April 20191a Confirmed by phone, 30 May 2019
\ilataLrra ?iver Alliance Discharge Assessment of effects on recreationRG&A ror i/itchell Daysh
about the Alliance plant as a source, largely as it's outside his area of interest. He certainly wouldn't
drink from the River - at least not below Fairlight, and even then, only in small quantities.
He has heard about fewer mayfly hatches in the lower River but has not associated that with waterquality issues.
Water quality in the backcountry is still looking really good.
9.5 Julian Peterc, angling guiders
Julian is based in Gore and spends most of his guiding time on the Mataura River, from Seaward
Downs upstream. He has 27 years' guiding experience and has been fishing locally for 45 years,
and lived in hfndham up to the late 1980s. His experience of the River includes the'bad old days'
when the pulp and paper mill, municipal wastewater, dairy factory and freezing works all had poorly
managed discharges, so the cunent state of the River is, relatively, a great improvement. Julian
worked at the Alliance plant in the 1990s and so had direct experience of the original discharge and
the redevelopment of the treatment system to today's standard.
However, since the turn of the Century when the various municipal and industrial discharges were
controlled, the quality of the River has steadily declined. Some years are befter than others, but ingeneral the fishing is not as good as when Julian first started guiding. Twenty years ago, he would
have been happy to drink the water above Gore, but no longer. The greatest influence has been the
increase in farming intensification and over-development of land - although so much has changed
in the region over the past 20 years, that it is hard to pinpoint any singular influence. Municipal
inputs are as much an issue as agricultural.
Changes are evidenced by an increase in the frequency and duration of algal blooms and a
reduclion in invertebrate life. The changes are most evident below Gore but are more obvious
below Mataura. Julian would not eat a fish caught in these reaches. Since his younger days in
\Afndham in the '80s, algal blooms have not improved. He perceives that there are fewer caddis
flies and mayflies, although he notes that there is no scientific benchmark to work from.
There seems to be less water in the River during dry periods - although this may just be perceptual
since the hydrographs show more average flows - but the river is certainly peakier, with faster rates
of change - both up and down. Land use changes mean there is less flow attenuation.
He has seen 'hardy souls' swimming in the River around Gore and Mataura, but would not do so
himself. The odd kayaker goes past, but the River is a bit too tame to be of much interest.
The Alliance discharge still features in his mind as a contributor to water quality issues in the
Mataura, partly because of his experience as a staff member. Although, in general terms, it is ameat processor and takes water and discharges waste, and so must be a contributor to waterquality issues.
9.6 Ltoyd Smith, angling guidero
Lloyd guides anglers throughout the Mataura River and is based in Gore, with 40 years fishing
experience. He is the past-president of the \Affndham Angling Club, which focuses on encouraging
fishing participation and contributing to relevant resource management issues.
The quality of the Mataura River is certainly a huge improvement since the control or cease ofdischarges from likes of the paper mill, dairy factory and Alliance works - although there are fewer
very large fish which fed on their outputs. Water colour and clarity is now more consistent along the
Riveds length. Water quality issues are currently more to do with water takes (water quantity),
riparian management and agricultu ral run-off.
15 Confirmed email 3 May 201916 Confirmed email 5 May 2019
\,4aiaura River Ailiance Sischarge j Assessment cf effects on i'ecreationRG&A ior Mitcnell Daysh
There appears to be more low flows and less water in the River generally, which leads to warmerwater and more algae. Fish are less active when the water warms and not interested in feeding(and are therefore harder to catch). On hot summer days, with low flows, the River often has anodour associated with farming run-off.
However, there are still plenty of healthy fish in the River and Lloyd has many happy clients whoenjoy the high catch rate and easy access below Gore. The ideal is casting to a rising or sightedfish, which they can do on anywhere on the Mataura; and not all clients want a backcountryexperience. All activity is catch and release - although this might be maintaining a high density offish, with high competition for food and so fewer large fish.
Fishing can be patchy, but this is mostly related to the weather and recent floods. Lloyd is not a fanof riparian fencing adjacent to the Mataura, which creates stable, weed-infested borders and doesnot allow the River to function naturally. He would prefer riparian grazing by sheep (there is a strongpreference amongst clients to fish adjacent to sheep farms rather than dairy or beef).
Algae is an issue - as it with most streams and rivers in the area. Lloyd didn't register algae in hisyouth but is now more aware.
lnvertebrate numbers appear to have been stable over the past seven or eight years, but there wasa gradual decline previously. There are certainly fewer evening and afternoon mayfly rises on theRiver, and the hatches are certainly not what they were when he was a teenager - although somerecent events have been good.
The Alliance plant is not a concem, although Lloyd assumes that the locals would recognise it ashaving a discharge and therefore some effect on water quality. He notes that industry has beensteadily cleaning up its act over time.
He sees kayakers and swimmers in the River, although there is a perception that it is not safe forswimming, particularly from around Gore downstream. Lloyd would not swim in the River belowCattle Flat.
9.7 Zane Moss, Manager Southland Fish and Gamel7
Water quality in the Mataura River downstream of Mataura has improved significantly over the past15 or so years, particularly associated with Alliance's last upgrade to its treatment system, with abig reduction in dissolved reactive phosphorous (DRP). Algal growth appears to be far lesssignificant, although there is a lack of good data to indicate absolute changes in ecosystem values
- and this applies to fish and invertebrates, as well as periphyton.
A notable change over the past 10 years or so has been the decline of the scale and frequency ofthe Deleatidium mayfly hatch. A decade ago a common sight would be perhaps a hundred fishrising to a major hatch in one long pool - it almost looked look like a fish farm, and would occur on adaily - aftemoon - basis, particularly through April. This is no longer an event, with rises happeningless often and in the evening or night. Angling activity below Gore has subsequently droppeddramatically as indicated by the national angler survey data. There is still a reasonable abundanceof mayflies, however - although noting a lack of empirical data. The fishing is still good, butgenerally requires a change in technique from dry fly to nymphing. Fishing to a rising fish is,
however, a peak experience for many anglers.
Causes of this change are unclear. Temperature could play a role, but might not be the primaryissue. Dairying is unlikely to be the sole cause since DRP in the River was higher prior to theAlliance plant upgrade. There needs to be more and better research.
There have been several complaints made about the discharge from the Gore wastewatertreatment plant, and it is unclear if this is coping adequately with the recent addition of waste from
17 Confirmed, and as informal, by email 30 May 2019
\llataura lver Alliance Discharge i Assessment of effects on recreation?C&A ior Liitcaell Daysn
54
Mataura Valley Milk. There is a big question-mark over whether the recent algal blooms in the
treatment plant are a consequence. The current discharge from the Alliance plant is not featuring so
much in people's minds. lt would be interesting to see the reconsenting dates for all wastewaterdischarges into the Mataura River falling due at the same time so a comprehensive analysis of all
treatment options could be considered.
Anglers are common immediately below the Mataura Falls, where trout and the occasional salmon
tend to congregate. There might be a little odour from time to time, but Zane assumes the regulars
fishing there must be accustomed to this. Foam is an ongoing discussion point, but it is generally
accepted by those anglers as being a natural river feature.
9.8 Southland Canoe Club
The Southland Canoe Club requested feedback about kayaking on the Mataura River via its ClubFacebook page, and committee member Maurice Rodway compiled advice from other Clubmembers. The River from above Gore to Seaward Downs has a nice mixture of gentle runs and
rapids including some interesting small drops where the River goes over coal seams and sandstonestructures, The Mataura Falls is 'quite a drop' and is used by only expert and experienced kayakers.
The River below Mataura to Tuturau is a gentle run for less experienced paddlers, with good waternearer the get out. The various industrial and municipal wastewater discharges into the Rivermeans kayakers are wary of ingesting any water.
Two Club members responded to the Club's Facebook query regarding perceptions of waterquality. These included:
. A report of a 'violent illness' after falling out of a kayak immediately below the Mataura
Falls 'about 6 years ago'.
. Another of never being sick, but avoiding drinking the water.
. An unpleasant odour from the Alliance discharge below the Falls.
One Club member described the setting below the Falls as 'horrendous' due to the discharge and
the proximi$ of the Alliance buildings to the River.
9.9 Swimmi
No active swimmers were tracked down for interviews. Advice was sought from Alan Taylor,
member of the Mataura Community Board, and lan Soper, Parks and Recreation Manager, GoreDistrict Council. Key points include:
. The closure of the Council-operated Mataura swimming pool in 2017 means that there is
probably more pressure on the River as a swimming destination than previously, although
the River has been a destination for a long period, particularly when kids wanted to avoid
supervision at the community pool.
. Swimming is most commonly carried out by people living near the River, with kids and
teenagers the biggest user group. There is probably a small but regular number of users.
Swimming generally occurs at a number of specific sites. Walnut Grove in Gore is
particularly popular.
. There are no common conversations about illnesses resulting from swimming in the River,
but many people would avoid it due to perceptions of poor water quality, There have been
some specific issues with the Gore and Mataura wastewater discharges, and this haspossibly coloured perceptions generally, although bathing water quality indicators are
often poor (although they do not appear to affect swimmers' behaviour much).
. At low flows the River can appear unattractive, but freshes and floods regularly flush it.Toxic algae wamings have been issued by Environment Southland, particularly in the
Mataura River Ailiance Discharge I Assessment cf effects on recreationRG&A ior |\/atchell Daysn
55

Mataura lsland Bridge area. There is a heightened sensitivity over the potential effectsfarming intensification on water quality.
\ilaraura iiver Alliance Discharue j Assessmenl of effects cn recreation3G&A for tulitchel: ilaysn
56

Appendix 2: Southland Fish & Game Mataura River access map
ivlataura Rrver Alliance Discharge I Assessment of effecls on !"ecreationRG&A for N4itchell Daysh
57
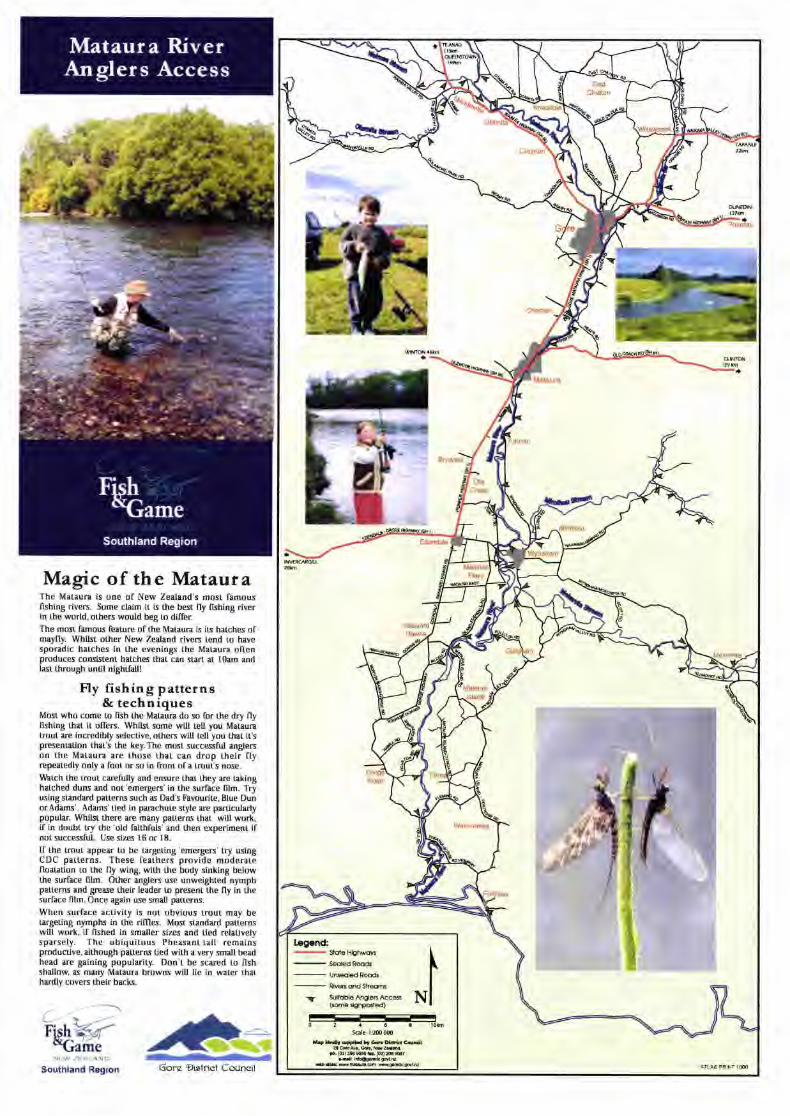
Mataura RiverAnglers Access
Magic of the MatauraThe Mataura is one o[ New Zealand's most famouslishing rivers. Some claim it is the best fly fishing riverin the world, others would beg to differ.The most l'mous feature of the Mataura is its ha(ches ofmaylly. Whilst other New Zealand rivers tend to havesporadic hatches in the evenings the Mataura oltenproduces consistent hatches that can start at 10am andlast through until nightfall!
Fly fishing patterns& techniques
Most who come t"o fish the Mataira do so for the dry flyfishin8 that it ollers. Whils( some will tetl you Malaumtrout are incredibly selectiye, others wilt tell you that it'spresentation that's the key.The most successful anglerson the Ma(aura are those tha( can drop their ftyrepeatedly only a foot or so in front of a trout's nose.
Watch the trout cilefuuy and cnsure that they are takinghatched duns and not'emergers' in the surface film. Tryusing standard patterns such 6 Dad's Favourite, Blue DunorAdams'. Adms'tied in parachute style are particularlypopular. Whilst there are many patterns that will work,if in doubt try the 'old taithluls' and then experiment il'not successful. Use sizs 16 or 18.
[[ the trou( appeil to be tarBeting 'emergers' try usingCDC patterns. These feathers provide moderatefloatation to the tly wing, with the body sinking belowthe surface [ilm. Other anglers use unweighted nymphpaLterns and grease their leader to presenl. the lly in thesurlace film. Once aBain use sma]l patterns.
When surface actiyity is not obvious trout may betar8eting nymphs in the rillles. Most standild patternswill work, il tished in smaller sizes and tied relativelysparsely. The ubiquitous Pheasant-tail remainsproductive, althouBh patterns tied with a very small beadhead are gaining popularity. Don't be scared to {ishshallow, as many Mataura browns will lie in water thathildly covers their t acks.
nu[kfl- fttr-.-..&...d
Gore 9islricl Couneil!i ! .r 1 ir!i'
Southland Region
lriiil.
.lr"P'
,ro- r'F .'
\lairu a
:l):r to l
:iieid.ie
sal€ l:2mmf+ Hy {DdH bttu Uffi<.d
A&cAE. h, kZdd.s.lB)amtu (03)2c *7
dIr@.@d
legend:
-
Stqt6 Hlghwoys
-
hldRdd
-
UMled R@ds
-
Rlve6onds-heom
\' fulloblo Anglo6 Acc6$(sm€ slgnposlod)
N
Catlle Flat
Five
Lumsden
LongridgeNodh
(Mw4b
Willow grubs are a populil sumrner food sourre for thebrowns in both the Mataura and the Waikaia. Whilsttrout leeding on willow grubs can be frustrating tocatch, with a very small imitation fished in the surfacelilrn they can be successfully outwitted.
Threadline patterns &techniques
Whilst most famous as a fly lishing river the Matauraalso olfers exciting opportunities for the threadlineangler. As with most threadlining, lighter tackle tendsto be best, and best fishing tims are following a freshin the river as the clarity improves and at dawn or dusk.The lower river provides a chance to tarBel.'sea-run'browns. Lures that simulate smelt are most productive,such as the vrious Toby patterns. Fishin8 natural bait,particularly smelt, is also popular and pmductive in thelower river.Throughout the river patterns such as the Mepps bladespinners are very good, fished in the smaller sizesupstream into the rimes. Rapalas are also effective,although somewhat pricey to throw into the willows!Natural bait is popular early in the season and when theriver is discoloured.Over the summer period threadline angters shouldexperiment with a small bubble and a nymph, castupstream into the ripples. This can be an extremelyeffective technique, much more so than traditionaloptions.
Mataura TributariesTechnlques for the maln stem of the Mataura are generallyeffectlve on th€ tributades, wlthout too much alterationin elther pattern or technique, although increiling fly sirehom l6s & 18s to 12s & l4s improves success. Trout donot rlse as coNlstenUy in the slde tributaries as they doon the Mataura below Gore. However, when thecondlttons ile sltable, these tdbutaries offer rewrdlngllshlng. Otten these trlbutarles have sllghgy bracktshwaters, whlch can llmit spotting nsh, and likely spotsshould be prospected wlth a nymph or dry fly.
RegulationsAbove the Garston bridge the Mataura and its tributariesare desi8nated "catch & release" md iltilicial baits only.Other Mataura tributaries above the Ardlussa brldgehave a two Iish per day limit, as have tributilies of theWaikaia and the Otamita mainstream above the gorgebridge. However, these re8ulations are subject tochange and anglers should always refer to thelr freeSporr Fishing Regulation Guide i[ ever unsure of a newilea's regulations.
Athol
.,r&irirs'
Greenvale
ChafronTe
Kit6roa
Downs
EastChaton
Batfour
Glenure
NEW ZEALAN DSouthland RegionP.O. Box 159, Invcrargill,
Ncw Zcaland.Phone 03-215 9117 Fax 03-2ll 0066
Email: [email protected]
Otamita

L
-l
APPENDIX 6
Assessment of Economic Benefits,
Mike Copeland - Brown, Copeland &Co, 2019
1
F!NAL
RENEWAL OF RESOURCE CONSENTS TO ENABLE CONTINUED OPERATION OF THEALLIANCE GROUP LIMITED'S MATAURA i/IEAT PROCESSING PLANT
ASSESSMENT OF ECONOMIC BENEFITS
Mike CopelandBrown, Copeland & Co Ltd
31 May,2019
2
1 INTRODUCTION
Background
1.1 The Alliance Group Limited (Alliance) is a co-operative owned and supplied by
4,340 shareholder farmers, who supply more than 85o/o of the livestock processed
at its five plants located in the South lsland and two in the North lsland.l The
Mataura plant, which accounts for approximately 17o/o of Alliance's processing
capacity, is located in the Gore District, about 50 kilometres north-east of
lnvercargill. ln 20171182, the plant processed approximately 143,000 cattle into
meat, offal, hides and other products. Livestock were purchased mostly from
Southland, Otago and Ganterbury farmers. ln addition the plant spent around $12
million per annum on goods and services supplied by local Southland businesses
(e.9. Ajax Building, Tullochs Transport, Greenbriar (coal supply) and J Harper
Contracting). The plant paid $22 million per annum in wages and salaries to
fulltime salaried staff and seasonal staff - at the peak of the season there are 500
employees at the plant.
1.2 Alliance cunently holds eight resource consents issued by the Southland Regional
Council (Environment Southland) and one issued by the Gore District Council.
These resource consents enable the operation of the Mataura plant and authorise
discharges to air, land and water, and the taking of water. Alliance is seeking
renewal of three resource consents due to expire on 6 December,2019 and one
due to expire on 15 December, 2020 to enable the continued operation of itsMataura meat processing plant for a further 35 years.
Report Objective
The objective of this report is to assess the Gore District and Southland regional
economic effects of the continued operation of the Mataura plant. The report will
form part of the Assessment of Environmental Effects to be lodged in relation to
the consents renewal applications.
I The plants are located at Stoke (Nelson), Smithfield (Timaru), Pukeuri (North Otago), Mataura(Southland), Lorneville (Southland), Levin (Horowhenua) and Dannevirke (Hawkes Bay).
2 l.e. the year ending 30 September, 2018.
1.3
3
Report Format
1.4 This report is divided into 5 parts (in addition to this introductory section). These
are:
(a)
(b)
The background to the Mataura plant operations;
A consideration of the relevance of economic effects under the Resource
ManagementAct (RMA);
A description of the Gore District and Southland regional economies;
The economic benefits from consent renewals; and
Some overall conclusions.
(c)
(d)
(e)
2. BACKGROUND TO THE iiATAURA PLANT'S OPERATTONS3
Meat exports of $7.4 billion for the calendat yeat 2018 were New Zealand's
second largest commoditf exports by value behind dairy products ($t+.2 billions)
and ahead of forest products ($6.6 billion), fruit ($3.2 million) and fish ($1.6 billion).
ln 2018, meat and edible offal and raw hides and skins ($0.4 billion) made up
13.60/o of the value of New Zealand's commodity export trade, second only to dairy
product exports which made up 25.6%.6
Trade enables New Zealand to specialise in the production of certain products in
which New Zealand has a comparative advantage enabling production surplus to
domestic consumption to be exported. The production of meat and other animal
products is an area in which New Zealand has comparative advantage. Exports of
these products provide foreign exchange, enabling New Zealand to finance the
purchase of competitively priced imported goods and services. The altemative
model of "fortress New Zealand"T would see higher priced goods and services,
reduced choice in the range of goods and services available in New Zealand and
3 Material in this section provided by Alliance, unless stated otherwise.1A distinction is made between "commodity trade' or'merchandise trade' and total trade. Commoditytrade relates to the exporting and importing of goods only, whereas total trade includes the exportingand importing of both goods and services.5 lncludes eggs and honey.
6 Trade statistics from Statistics New Zealand NZ Stat.7 l.e. a situation where New Zealand's trade with the rest of the world is constrained and it is notpossible for New Zealand to specialize in the production of those goods and services in which it has acomparative advantage, nor access cheaper goods and services from overseas.
2.1
2.2
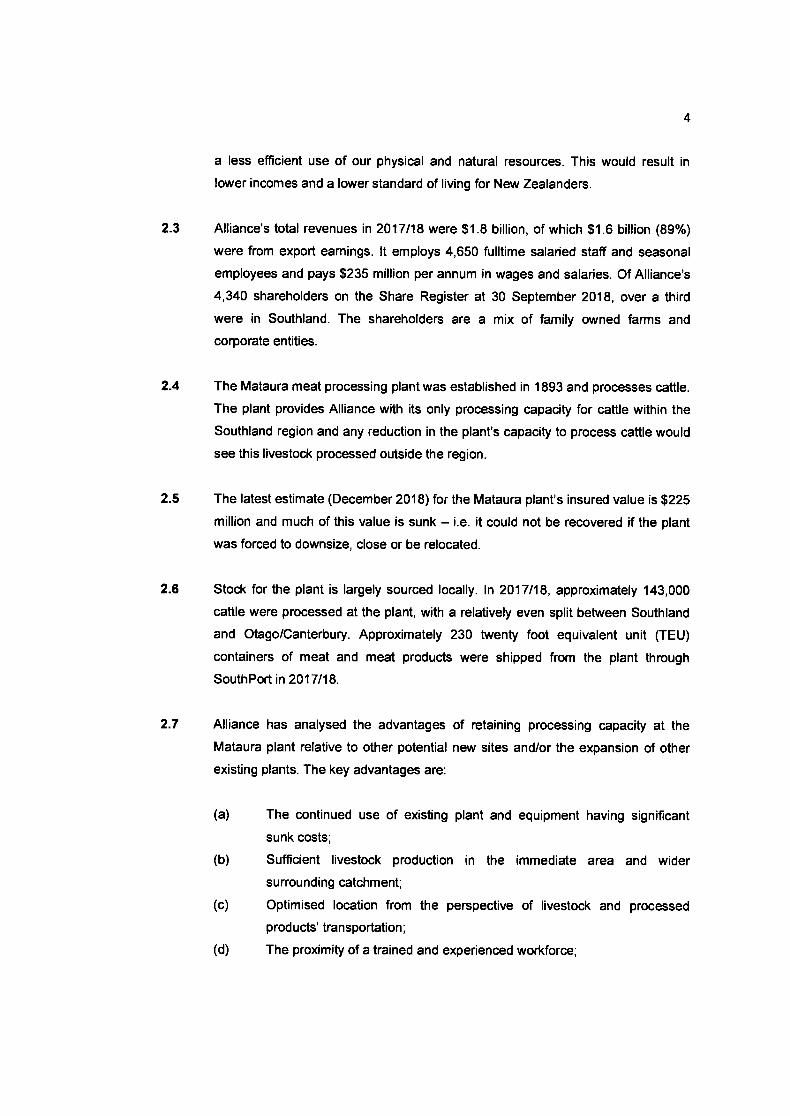
4
2.3
2-4
2.5
2-6
2.7
a less efficient use of our physical and natural resources. This would result in
lower incomes and a lower standard of living for New Zealanders.
Alliance's total revenuesin2017l18 were $1,8 billion, of which $1.6 billion (89%)
were from export earnings. lt employs 4,650 fulltime salaried staff and seasonal
employees and pays $235 million per annum in wages and salaries. Of Alliance's
4,340 shareholders on the Share Register at 30 September 2018, over a third
were in Southland. The shareholders are a mix of family owned farms and
corporate entities.
The Mataura meat processing plant was established in 1893 and processes cattle.
The plant provides Alliance with its only processing capacity for caftle within the
Southland region and any reduction in the plant's capacity to process cattle would
see this livestock processed outside the region.
The latest estimate (December 2018) for the Mataura plant's insured value is $225
million and much of this value is sunk - i.e. it could not be recovered if the plant
was forced to downsize, close or be relocated.
Stock for the plant is largely sourced locally. ln 2017118, approximately 143,000
cattle were processed at the plant, with a relatively even split between Southland
and Otago/Canterbury. Approximately 230 twenty foot equivalent unit (TEU)
containers of meat and meat products were shipped from the plant through
SouthPort in2017118.
Alliance has analysed the advantages of retaining processing capacig at the
Matiaura plant relative to other potential new sites and/or the expansion of other
existing plants. The key advantages are:
(a)
(b)
(c)
The continued use of existing plant and equipment having significant
sunk costs;
Sufficient livestock production in the immediate area and wider
surrounding catchment;
Optimised location from the perspective of livestock and processed
products' transportation ;
The proximity of a trained and experienced workforce;(d)
5
(e) The proximity of supplier businesses with appropriate expertise and
experience;
The proximity of both road and rail networks for plant inputs and outputs;
The availability of sufficient water supply from the Mataura River to
enable livestock processing operations;
The abili$ to discharge treated meat processing waste to the Mataura
River and treated wastewater solids to land;
The ability to minimise and mitigate adverse environmental effects for
neighbours and the wider community;
Few incompatible adjacent or nearby land uses;
The site is large enough for any future expansion; and
Economies of scale and scope as compared to relocating processing
capacity to a number of alternative sites.
(0
(g)
(h)
0)
(k)
(t)
(i)
2.8 Consent renewals will enable Alliance and its supplier shareholders to continue to
benefit from these economic advantages of the plant. Closure or downsizing of the
plant due to consents not being renewed or being renewed with more stringent
conditions would result in efficiency losses from reduced utilisation of existing
assets, higher costs and reduced retums for Alliance's farmer shareholders. ln
addition there will be economic costs for the broader Gore and Southland
communities. These are covered later in this report.
3. ECONOMICS AND THE RMA
Community Economic Wellbeing
Economic considerations are intertwined with the concept of the sustainable
management of natural and physical resources, which is embodied in the RMA. ln
particular, Parl 2 section 5(2) refers to enabling "people and communities to
provide for their ... economic ... well being" as a part of the meaning of
"sustainable managemenf', the promotion of which is the purpose of the RMA.
3.2 As well as indicating the relevance of economic effects in considerations under the
RMA, this section also refers lo "people and communrties" (emphasis added),
which highlights that in assessing the impacts of a proposal it is the impacts on the
community and not just the applicant or particular individuals or organisations, that
3.1
6
must be taken into account. This is underpinned by the definition of "envircnment"
which also extends to include people and communities.
3.3 The continued operation of the Mataura plant enables the residents and
businesses of Gore and the Southland region to provide for their social and
economic wellbeing by retaining employment, incomes and expenditure within the
localeconomy.
Economic Efficiency
Parl2 section 7(b) of the RMA notes that in achieving the purpose of theAct, all
persons "shall have pafticular regard to ... the efficient use and development ofnatural and physical rcsources" which include the economic concept of efficiencys.
Economic efficiency can be defined as:
"the effectiveness of tesource allocation in the economy as a whole such that
outputs of goods and seruices fully rcflect consumer prcfercnces for these goods
and seruices as wel/ as individual goods and seruices being produced at
minimum cost through appropiate mixes of factor inputs". e
More generally economic efficiency can be considered in terms oto Maximising the value of outputs divided by the cost of inputs;
o Maximising the value of outputs for a given cost of inputs;
. Minimising the cost of inputs for a given value of outputs;
. lmproving the utilisation of existing assets;and
o Minimising waste.
The continued operation of Alliance's Mataura plant is consistent with the efficient
use of resources, especially in regard to the ongoing use of significant existing
assets, transport cost savings and the economies of scale in production available
at the plant.
8 See, for example, in Madborough Ridge Ltd v Marlborough Distict Council t19981 NZRMA 73, theCourt noted that all aspects of efficiency are "economic" by definition because economics is about theuse of resources generally.e Pass, Christopher and Lowes, Bryan, 1993, Collins Dictionary of Economrbs 12no edition), HarperCollins, page 148.
3.4
3.5
3.6
7
Value of lnvestment to the Existing Consent Holder
3.7 Part 6, section 104 (2A) of the RMA requires the consent authority when
considering a renewal of an existing consent lo "have regard to the value of the
investment of the existing consent holder." The value to Alliance of its investment
in the Mataura plant can be considered in terms of either the insured value of the
plant ($225 million) or the foregone future earnings of the plant if it was forced to
close. By both of these measures, the value of the Mataura plant is significant to
the existing consents' holder.
Viewpoint
3.8 An essential first step in carrying out an evaluation of the positive and negative
economic effects of the granting of consent renewals is to define the appropriate
viewpoint that is to be adopted. This helps to define which economic effects are
relevant to the analysis. Typically a district (or city) or wider regional viewpoint is
adopted and sometimes even a nationwide viewpoint might be considered
appropriate.
3.9 The Mataura processing plant is located in the Gore District, which is part of the
Southland region. Therefore in this report the economic effects are considered in
relation to the Gore District and the Southland region.
3.{0 There are also private or financial benefits associated with the granting of consent
renewals. Generally these benefits are not relevant under the RMA and the main
focus of this report is therefore on the wider economic effects on parties other than
Alliance and its customers. Economists refer to such effects as "externalities"lo.
3.{ I However, Alliance is owned by its farmer shareholders and financial benefits to
Alliance impact on the "economic (and social) well being" of these farmer
shareholders including those within the local community - i.e. the Southland
region. lncreased returns to (or reduced costs for) farmer shareholders in
Southland will flow through to increased expenditure, employment and incomes
within the Gore and Southland economies, as a consequence of increased
10 Defined as the side effects of the production or use of a good or service, which affects third parties,other than just the buyer and seller.
8
disposable income for local farmer shareholders. Also financial benefits to Alliance
are relevant with respect to the "efficient use and development of natural and
physical resources" and New Zealand's export competitiveness, given the
Mataura plant's significant scale and the importance of meat and meat product
exports to the New Zealand economy.
4. BACKGROUND TO GORE DISTRICT AND SOUTHLAND REGION'S ECONOMTESI1
4.1 Statistics New Zealand's June 2018 population estimate for Gore District is
12,500. ln 2010 population in the District was estimated lo be '12,400, implying
growth of 0.8% overthe period 2010 to 2018, as compared to growth of 12.3o/ofor
New Zealand as whole. Statistics New Zealand's 'medium' population
projectionsl2 have Gore District's population decreasing to 11,450 in 2043 - i.e.
an average rate of decline of 0.4o/o per annum over the period 201843, compared
to an average rate of growth for New Zealand of 0.8o/o per annum.
4.2 Statistics New Zealand's June 2018 population estimate for the Southland region
is 99,100. ln 2010 population in the region was 94,700. The region's population
over the period 2010 to 2018 has grown by 4.60/o. Statistics New Zealand's
'medium' population projections have the region's population decreasing to 99,000
in 2043 - i.e. an average rate of decline of 0.01% per annum over the period
201843.
4.3 Employment data highlight the importance of the agricultural sector to the Gore
District. ln February 2018, 1,300 jobs (20.0Vo) of the District's 6,500 jobs were in
the agricultural, forestry and fishing sector with agriculture and agriculture support
services contributing 1,117 of these jobs or 17.2o/o of total employment in the
District. Manufacturing contributed 960 jobs (14.8% of total jobs in the District))
with meat and meat products manufacturing contributing 610 of these jobs. Other
significant sources of employment within the Gore District are retail trade (960 or
14.8o/o of total employment), health and social assistance (500 jobs, or 7.7o/o of
11 Data in this section from Statistics New Zealand NZ Stat.12 Statistics New Zealand prepare three sets of projections - high, medium and low - according tonatural population change (i.e. the net effect of birth and death rate assumptions) and net migrationassumptions. These projections do not explicitly incorporate assumptions about different rates ofeconomic development.
9
total employment), healthcare and social services (500 jobs or 7.7o/o of total
employment), and education and training (450 or 6.9% of total employment).
4.4 For the Southland region in February, 2018 there were 49,400 jobs. Agriculture,
forestry and fishing with 8,370 jobs (16.9% of total employment) and
manufacturing with 8,000 jobs (16.20/o of total employment) are the two largest
sectors. Within agriculture, forestry and fishing, agriculture and agriculture support
services accounts for around 7 ,141 or 85.3olo of these jobs including 2,750 in dairy
farming and 2,200 in sheep, beef caftle and grain farming. Within manufacturing,
there are 4,750 jobs in food product manufacturing including 3,600 jobs in meat
and meat products manufacturing and 630 jobs in dairy products manufacturing.
Other important sources of employment for the Southland region are retail trade
(5,100 jobs or 10.3o/o of total regional employment), health and social assistiance
(4,750 jobs or 9.6% of total regional employment), accommodation and food
services (3,450 jobs or 7.0o/o of total regional employment) and education and
training (3,350 jobs or 6.8% of total regional employment). However these service
sectors are to a large extent "driven" by the economic activity generated by the so
called "economic drivers" of the region - principally agriculture and agricultural
product processing and the Tiwai point aluminium smelter. Taken together
agriculture, food product manufacturing and the Tiwai Point aluminium smelter
directly account for about 27o/o of total employment in the region. With the
inclusion of the flow on, or "multiplie/' effects, (see next section of this report),
these industries generate around 48% of totalemployment in the region.
5. EGONOMIC BENEFITS FROM CONSENT RENEWALS
Maintaining Economic Activity within the District and Regional Economiesr3
The Mataura meat processing plant employs up to 500 full time salaried staff and
seasonal wokers at the peak. This equates to 340 full time equivalent staff
(FTEs). Alliance's Mataura plant pays out $22 million in wages and salaries per
annum and spends an estimated additional $12.3 million per annum in the
Southland region on goods and services. Goods and services to the plant
provided by local firms include transport, engineering, plumbing, electrical and
5.{
13 Unless stated otherwise data in this section provided by Alliance.
5.2
10
security contractors; packaging suppliers; utilities (electricity and
telecommunications); providers of medical services and supplies (doctors,
physiotherapists, drug testers and other healthcare service suppliers);
professional service suppliers; and providers of laboratory equipment and
materials, clothing, fuels, knives and food.
These are the direct economic impacts for the Southland region's economy from
the plant's operation.la
However in addition to these direct economic impacts there are indirect impacts
arising from:
The effects on suppliers of goods and services provided to the plant from
within the region (i.e. the "fonrvard and backward linkage" effects); and
The supply of goods and services from within the region to employees at
the plant and to those engaged in supplying goods and services to the
plant (i.e. the "induced" effects). For example, there will be additional
jobs and incomes for employees of supermarkets, restaurants and bars
as a consequence of the additional expenditure by employees directly
employed at the plant.
Multipliers can be estimated to gauge the size of these indirect effects. The size
of the multipliers is a function of the extent to which an area's economy is self-
sufficient in the provision of a full range of goods and services and the area's
proximity to alternative sources of supply. Multipliers typically fall in the range of
1.5 to 2.0 and taking the mid-point of this range (i.e. 1.75) implies total impacts
(i.e. direct plus indirect impacts) of:
. 595 FTE jobs for local Southland residents; and
. $38.5 million per annum in wages and salaries for local Southland residents.
1a No account is taken in this section of the direcl and indirect economic impacts of cattle farming withinthe region. Cattle farming will in general not be affected by whether the resource consents are renewed- i.e. livestock produced within the region are assumed to be diverted to other meat processing plants ifconsents are not renewed. However to the extent the non-renewal of consents or stricter consentconditions add costs to meat processing, farmers will be impacted as a consequence of lowerpayments for livestock.
5.3
a
b
5.4
5.6
11
5.5 The Gore District and lnvercargill City are the areas of the region that benefit most
from the additional economic activi$ generated by the ongoing operation of the
Mataura plant.
Economic Benefits from lncreased Economic Activity
As indicators of levels of economic activity, economic impacts in terms of
increased expenditure, incomes and employment within the local economy are not
in themselves measures of improvements in economic welfare or economic
wellbeing. However, there are economic welfare enhancing benefits associated
with increased levels of economic activi$. These relate to one or more of:
lncreased economies of scale. Businesses and public sector agencies
are able to provide increased amounts of outputs with lower unit costs,
hence increasing profitability or lowering prices;
lncreased competition: lncreases in the demand for goods and services
allow a greater number of providers of goods and services in markets
and there are efficiency benefits from increased levels of competition;
Reduced unemployment and underemDlovmentls of resources: To the
extent resources (including labour) would be otherwise unemployed or
underemployed, higher levels of economic activity can bring efficiency
benefits when there is a reduction in unemployment and
underemployment. The extent of such gains is of course a function of the
extent of underutilized resources within the local economy at the time and
the match of resource requirements and those resources unemployed or
underemployed within the local economy; and
lncreased quality of central oovernment provided services: Sometimes
the quality of services provided by central government such as education
and health care are a function of population levels and the breadth and
quality of such services in a community is higher with higher levels of
economic activity, particularly to the extent they lead to or maintain higher
levels of population.
15 Underemployment differs from unemployment in that resources are employed but not at theirmaximum worth; e.g. in the case of labour, it can be employed at a higher skill and/or productivity level,reflected in higher wage rates.
a.
b.
c.
d
5.7
L2
The Mataura meat processing plant gives the Gore District greater critical mass
and as a consequence the residents and businesses within the District benefit
from economies of scale, greater competition, increased resource utilisation and
better central government provided services. This is also true for the Southland
region, although to a lesser extent given the economic activity generated by the
plant is proportionately less for the region as compared to the Gore District.
Economic Efficiency Benefits from Optimising Plant Location
There are a number of economic efficiency benefits from Alliance obtaining
consents to enable the continued operation of the Mataura plant at its current site.
These have been listed earlier in section 2 of this report and include the continued
use of existing plant and equipment with an insured value of $225 million,16 the
minimisation of transport costs (and carbon footprint) for livestock and finished
product dispatch, the availability of a trained and experienced workforce and
businesses with appropriate expertise and experience within close proximity of the
plant, and economies of scale and scope as compared to re-locating processing
capability to a number of alternative sites.
5.9 The Mataura plant provides Alliance with its cattle processing capacity in
Southland and farmers would need to truck cattle out of the region for processing
if the Mataura plant's processing capacity for cattle was reduced. There isinsufficient capacity at other plants within the region to handle cattle processed at
the Matiaura plant. This would add to farmers' costs, reduce their disposable
incomes and reduce spending in the Gore District and elsewhere within the
region.
s.t0
5_8
Alliance is seeking renewal of consents for a minimum period of 35 years. There
are also economic efficiency benefits associated with consents being renewed for
a longer term as compared to short term (e.9. 10 year) consent renewals. Longer
term consent renewals not only save more frequent consent renewal costs, but
also provide greater certainty for investment in and management of the plant.
16 ln addition to the economic efficiency benefits from the continued use of plant and equipment havingan insured value of $225 million, Alliance's significant investment in the Mataura plant is also relevantin terms of Part 6, section 104 (2A) of the RMA, which requires regard to be given to value of theinvestment of the existing consent holder.
5.12
13
s.1l Maintaining these economic efficiency benefits is consistent with "fhe efficient use
and development of natural and physical resources" (Part 2, section 7(b) of the
RMA) as well as enabling "people and communities to provide for their economic
and socialwellbeing" (Parl2, section 5(2) of the RMA).
Greater Economic Resilience for the Gore District and the Southland Region
As discussed earlier in this report, both the Southland region and the Gore District
are significantly dependent upon the agricultural sector, especially sheep and beef
cattle and dairy farming. Therefore the Mataura plant helps provide greater
diversity and balance to the two economies. Although it involves the processing of
livestock, having livestock processing manufacturing capacity within the region
provides employment opportunities and incomes less dependent upon retums to
the agricultural sector. This makes the Gore District and Southland economies
more resilient to agricultural commodi$ price cycles.
Rates lncome to the Gore District Counciland Environment Southland
s.t3 The Mataura plant pays $238,000 per annum in rates to the Gore District Council
and Environment Southland.The plant also pays out $13,000 per annum in
consent fees. Whilst these payments are for services provided by the Councils
and from which Alliance and its employees benefit, economies of scale mean that
should the Councils lose this income, the range and quality of services provided
by the Councils would diminish and/or payments by other ratepayers in the District
and region would need to increase.
Gomm unity Sponsorship Programmes
5.14 ln recognition of the important role the community plays in helping Alliance realise
its potential, the company provides financial support to a number of initiatives at
the community and national level. ln the year to 30 September, 2018 the Mataura
plant made grants totalling around $11,000 to various community organisations.
6. CONCLUSTONS
6.{
(ii)
(iii)
(iv)
The granting of consents enabling the continued operation of the Mataura meat
processing plant will maintain the economic wellbeing of people and communities
within the Gore District and the Southland region by:
L4
Maintaining significant direct and indirect employment opportunities for local
residents;
Maintaining significant direct and indirect wages and salaries for local
residents;
Maintaining significant levels of direct and indirect expenditure with local
businesses;
Maintaining population and economic activity levels within local communities
thereby maintaining the breadth and quali$ level of services available to
local residents and businesses;
Providing greater employment choice for local residents;and
Continuing Alliance contributions to local community activities, in its role as
a responsible employer and "good corporate citizen".
(i)
(v)
(vi)
6.2 The granting of consents sought for the Mataura plant will maintain resource use
efficiency by enabling:
(i) The continued use of existing plant and equipment with significant sunk
costs;
The minimisation of transport costs for livestock and finished product
dispatch;
The continued utilisation of a trained and experienced workforce and
businesses with appropriate expertise and experience within close
proximity of the plant;
The continued benefits from economies of scale and scope as compared
to re-locating processing capability to a number of alternative sites; and
The maintenance of population and economic activity levels (or "critical
mass") in the Gore District and the Southland region, thereby providing
economies of scale and competition in the local provision of goods and
services,
(ii)
(iii)
(iv)
(v)

6.3
15
The Mataura plant has an insured value estimated at $225 million. Therefore its
value to Alliance (the existing consents' holder) is very significant.
L
't
APPENDIX 7
Mata ura Plant Wastewater Treatmentand Disposa! AlternativesAssessment,
Pattle Delamore Partners, 2019

PdpPATTLE DELAMORE PARTNERS LTD
Alliance Mataura PlantWastewater Treatment a nd Disposa I
Alte rn atives Assessme nt
Alliance Group Limited
Auckland Tauranga Wellington Christchurch
solutionsfor you r e nviro n me nt
Alliance Mataura PlantWastewater Treatment a nd
Disposa I Alternatives Assessment
l' Prepared for
Alliance Group Limited
l May 2019
p*PATTI.E DII.AMORT PARTNTRS LTD
Level 5, PDP House
235 Broadway, Newmarket, Auckland 1023
PO Box 9528, Auckland 1149, New Zealand
Tel +54 9 523 6900 Fax +54 I 523 6901
Website httr://www.!dr.co,nzAuckland Tauranga Wellington Christchurch
@eetOfirtiota 1..: r .i 1,., :i'.t tr..t, t i... t t
frATTIAiICE 6ROUP LIMITEO. ALIIATICE MATAUiA PLAI{T WASTEWATEi TiEATMEN' A'IOOISPOSAL AI.TEiNATIVES A55E55MEI{T
Quality Control Sheet
Alllance Mataura Plant Wastewater Treatment and Disposal Alternatlves
Assessment
TITI.E
CLIENT Alliance Group Llmlted
vERStOa{ Final
ISSUE DATE 31 May 2019
,oB REFERENce N903227
souBcE Fr.E(sl AJ903227R001.docx
DOCUMENT CONTRIBUTORS
Prepared by
SIGilATURE
L{1. Wlllin.on
Revlewed by Approved by
SIG'{ATUI
D.ryl lrvlrG Aram hen
Llmllrtloor:
Th. hbmtbn cont ln.d ln thlr deumnt p.odwld bV P.ttL D.bmn P.rtmE lJmlt d (PDP, lr eLly tor th.w of Allhm crcup Umltrd ior thr purgw ior wlich i has brn pEplBd .nd PDP uatd.ok.s m dutv to orrcrltt rny ntpon.lblhy ro rny thhd p.rty who mry nly oloo tl& &cumnt. PDP rc6!t m hulty It lh. nponb u$d lbr . dlfiaEnt purpos! oi lf lt lr u$d q rclLd @ by .ny oth.a tarson oth.t fhr fur ll! lntand.d !qt9or.et out ln tho *op.. Any *h usr c dhm wll br $Lt rt th.fr om rElc
PDP hrvr pnprred th. ct .rtlm.t for tfi. mrnlmtld $ryt or lhnt ln th& Eport POP hm m @ntpl w.rth! ort of labour, m.tad.k, .qtlpmnt I ry1c.5 [email protected] by olh.E, conF.ctor pric.r, comp.tltlv. blddlni,futuE m.rtlt condhlxE tr lnfl.tlon. Any oplnba o, stlmt d @d b PoPs opinlon b.sd fi ou. .lp.d.n6 .ndr.pr$.ntr oqr ,udt.mnt u rxpobncrd rnd qurllftrd prcf.rdon.l .ndm.ra PDP €mt 3unnt.. thrtpFpot.ls, blds or.ctulqttrutbo rut5 wll not v.ry from our a*lrr.tr,
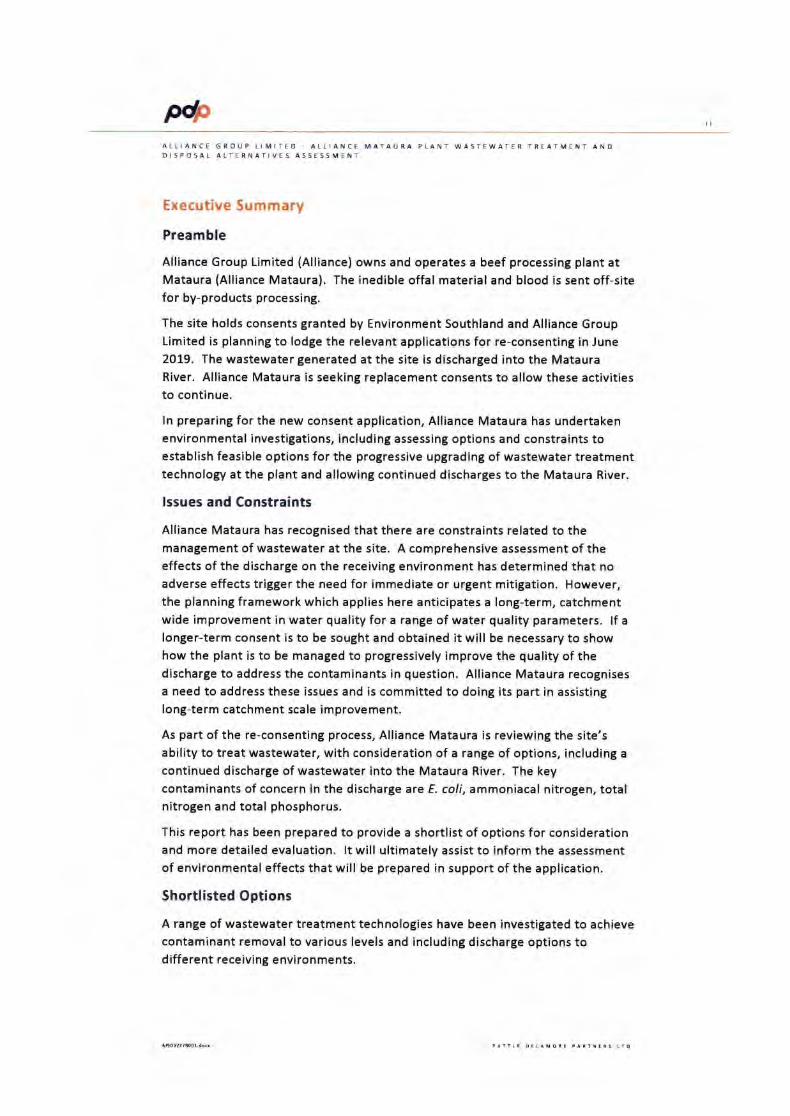
MALLIANCE GROUP LIMITEO - ALLIANCE MATAURA PLANT WASTEWATER TREATMENT ANDDISPOSAL ALTERNATIVES ASSESSMENT
Executive Summary
Preamble
Alliance Group Limited (Alliance) owns and operates a beef processing plant atMataura (Alliance Mataura). The inedible offal material and blood is sent off-sitefor by-products processing.
The site holds consents granted by Environment Southland and Alliance GroupLimited is planning to lodge the relevant applications for re-consenting in June2019. The wastewater generated at the site is discharged into the MatauraRiver. Alliance Mataura is seeking replacement consents to allow these activitiesto continue.
ln preparing for the new consent application, Alliance Mataura has undertakenenvironmental investigations, including assessing options and constraints toestablish feasible options for the progressive upgrading of wastewater treatmenttechnology at the plant and allowing continued discharges to the Mataura River.
lssues and Constraints
Alliance Mataura has recognised that there are constraints related to themanagement of wastewater at the site. A comprehensive assessment of theeffects of the discharge on the receiving environment has determined that noadverse effects trigger the need for immediate or urgent mitigation. However,the planning framework which applies here anticipates a long-term, catchmentwide improvement in water quality for a range of water quality parameters. lf alonger-term consent is to be sought and obtained it will be necessary to showhow the plant is to be managed to progressively improve the quality of thedischarge to address the contaminants in question. Alliance Mataura recognisesa need to address these issues and is committed to doing its part in assistinglong-term catchment scale improvement.
As part of the re-consenting process, Alliance Mataura is reviewing the site'sability to treat wastewater, with consideration of a range of options, including a
continued discharge of wastewater into the Mataura River. The keycontaminants of concern in the discharge are E. coli, ammoniacal nitrogen, totalnitrogen and total phosphorus.
This report has been prepared to provide a shortlist of options for considerationand more detailed evaluation. lt will ultimately assist to inform the assessmentof environmental effects that will be prepared in support of the application.
Shortlisted Options
A range of wastewater treatment technologies have been investigated to achievecontaminant removal to various levels and including discharge options todifferent receiving environments.
M ttr
ALLIANCE GROUP LIMITED. ALLIANCE MATAURA PLANT WASTEWATER TREATMENT ANDOISPOSAL ALTERNATIVES ASSESSMENT
A qualitative assessment was conducted to compare a range of short-listedoptions. This assessment has resulted in an expressed preference for continueddischarge of wastewater to the Mataura River but with a reduction of bothnitrogen and E. coli,
The treatment option ultimately selected will be based on a range ofconsiderations including existing and emergent policy directives relating to waterquality, assessment of the receiving environment and the effects of the dischargeon that environment, the feasibility of the option, and matters raised and
considered during consultation with key stakeholders. ln the event there is
tightening of contaminant limits, a biological treatment option will becomenecessary together with tertiary disinfection of microbial contaminants.
P*ALLIANCE 6ROUP LIMITED , ALLIANCE MATAURA PLANT WA5TEWATER TREATMENT ANODISPOSAL ALTERNATIVES ASSESSMENT
Table of Contents
SECTION
Executive Summary
1,0 lntroduction
2.0 Background lnformation
2.1 Eristing Wastewater Treatment and Disposal
2.2 Contaminants of Concern
2.t Existing Wastewater Treatment Plant Resilience
2.4 Wastewater Flows and Loads
2.5 Summary of l(ey Assumptions
3.0 Potentially Available Wastewater Management
Options
Assessment of Long List Options3.1
4.O Wastewater Treatment and Disposal Options
Shortlist
Assessment of Treatment Options Costs
Option 1C Biological Nitroten Removal and
UV Disinfection
Option 1D UV Disinfection
Option 1F Green Waste Biological Nitrogen Removal
and UV Disinfection
Option 4A Dual Discharge, Existing River Location
and lrrigation to Dairy Farms with No Treatment
Prior to River Discharge
Option 5A Dual Discharge, Existing River Location
and lrrigation to Cut and Carry with No Treatment
Prior to River Discharge
PAGE
ii
1
3
3
3
6
7
11
4.1
4,2
4.?
4.4
4.5
4.6
t2
13
19
19
20
24
26
30
35
38
38
40
4L
42
44
5.0
5.1
5.2
5.3
6.0
7.0
Assessment of Preferred Option
Qualitative Comparative Assessment
Summary of Preferred Option Assessment
Upgrade Approach
Conclusions and Recommendations.
References
p*ALLIANCE GROUP LIMITEO - ALLIANCE MATAURA PLANT WASTEWATER TREATMENT ANDDISPOSAL ALTERNATIVES ASSESSMENT
Table of Figures
Figure 1: Existing wastewater treatment process 3
Figure 2: Option 1C current and future BOD load to the Mataura Rivcr 22
Figure 3: Option lC current and future TN load to the Mataura River 22
Figure 4: Option 1F current and future BOD load to the Mataura River 28
Figure 5: Option 1F current and future TN load to the Mataura River 28
Figure 6: Land Suitability for Potential Land Treatment 31
Fitur. 7: Option 4A current and future BOD load to the Mataura River 32
Figurc 8: Option 4A current and future TN load to the Mataura River 33
Table of Tables
Table 1: Mataura Rivcr Water Quality lmprovemcnt Requirements
Table 2: Current Treated Wastewater Flows and Concrntrations
Table 3: Desitn Flows and Loads
Table 4: Monthly Discharged Flow and Load Distribution
Table 5: TKN Sampling Results
Table 6: Green Waste Design Flows and Loads
Table 7: Alliance Mataura Plant Wastewater Management Options:
lnitial Screening Table
Table 8: Option 1C Cost Estimate
Table 9: Option 1D Cost Estimate
Table 10: Option lF Cost Estimate
Tablc 11: Option 4A Cost Estimate
Table 12: Option 5A Cost Estimate
Table 13: Estimated Reduction in Yearly Total Wastcwater Loads
to the River
Table 14: Shortlisted Options Cost Comparison
5
8
9
9
10
10
15
23
75
29
33
36
38
40
MALLIANCE GROUP LIMITED ALLIANCE MATAURA PLANT WASTEWATER TR€ATMENT ANDOISPOSAL ALTERNATIVES ASSESSMENT
1.0 lntroduction
Alliance Group Limited (Alliance) owns and operates a beef processing plant atMataura (Alliance Mataura), processing up to 1,062 animals per day. Waterutilised in the beef processing plant is sourced from the Mataura River and allgenerated process wastewater is treated on-site as two main waste streams,green waste and non-green waste, in a chemically assisted dissolved air flotation(DAF) based system prior to being discharged back to the Mataura River. Treatedwastewater discharged to the Mataura River is allowed under EnvironmentSouthland Regional Council (ESRC) Resource Consent 202327, which is due toexpire in December 2019.
The Alliance Mataura Plant has historically processed up to 10,000 sheep per dayand 560 beef animals per day (with additional by-products processing includingcasings and rendering), with an allowable discharge rate of 14,4OO m3 of treatedwastewater per day. ln2Ol2, the processing of sheep and rendering ceased andbeef production increased to up to 1,052 beef animals per day. For theforeseeable future, it is expected that the Mataura site will continue to operatesolely as a beef processing plant.
To enable the continued discharge of treated wastewater to the Mataura River,Alliance must apply for a replacement consent by June 2019. ln examining therequirements of the re-consenting of a discharge, under Schedule 4, Clause
6(d[ii) information to be provided with the consent application needs to includea description of any possible alternotive methods of discharge, includingdischarge into any other receiving environment.
With regards to the current discharge to the Mataura River, the assessment ofenvironmental effects prepared by Freshwater Solutions Limited (2019) has
identified the key contaminants of concern in the discharge are:
:. E. coli;
r Ammoniacal-nitrogen;
i Total Nitrogen; and
I Total Phosphorus
No adverse effects of the Alliance Mataura discharge, requiring immediate orurgent mitigation, have been identified in respect of the above parameters(Freshwater Solutions 2019). However, the planning framework which appliesanticipates a long-term catchment wide improvement in water quality for eachparameter. lf a longer-term consent is to be sought and obtained, it will be
necessary to show how the plant is to be managed to progressively improve thequality of the discharge to address the contaminants in question. Therefore,Alliance has requested that this report examine options for the Alliance Matauraplant doing its part in realising that long-term catchment scale improvement.
P* 2
ALLIANCE GROUP LIMITEO - ALLIANCE MATAURA PLANT WASTEWATER TREATM€NT ANDDISPOSAL ALTERNATIVES ASSESSMENT
No detail is available yet on the extent of the catchment scale improvementanticipated for each parameter, or the timeframes and methods for achievingthat improvement, including which parameter should be afforded priority. Theplanning framework anticipates these matters will be determined via a
collaborative planning process for the Mataura Freshwater Management Unit,involving all key stakeholders, which is expected to commence soon but is notexpected to be complete until 2022.
This is reflected in the recommended process improvements set out in Section 5and 6 of this report which include:
1. A preferred option if there is no preference for the order in which eachparameter is improved;
Preferred options if it were determined that a reduction in either E. coli ornitrogen should be prioritised for environmental reasons (noting thisreport's conclusion that the wastewater system is already optimised interms of minimising its discharge of dissolved reactive phosphorus (part oftotal phosphorus).
This assessment of alternatives takes into consideration the key contaminants ofconcern with the existing discharge, potential alternative disposal optionsavailable and wastewater treatment alternatives necessary to meet therequirements of the respective disposal options.
A long-list of available alternatives was developed, and from that a shortlist ofpotential options was prepared. Each of the short-listed options was thenassessed further, considering the potential for the option to reduce contaminantloads to the Mataura River, option resilience, and lifecycle costs.
This report summarises both the long-list options assessment and assessment ofthe short-listed alternative options.
2
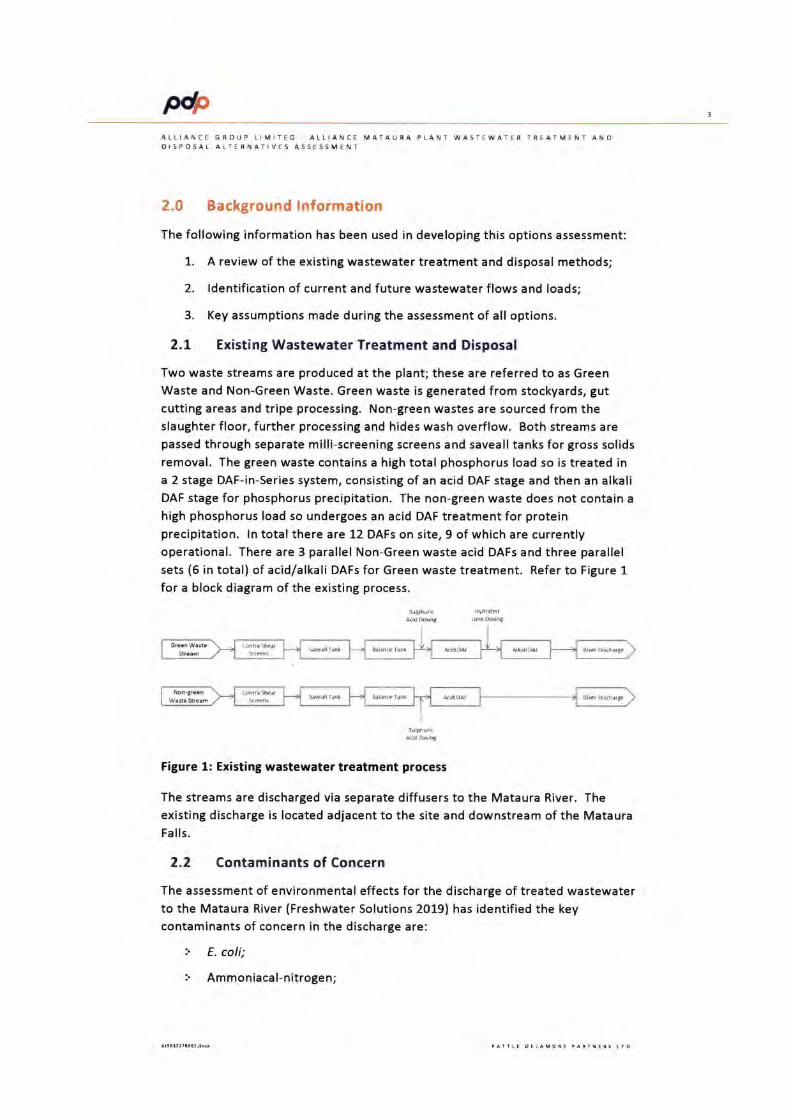
P*ALLIANCE GROUP LIMITEO ALLIANCE MATAURA PLANT WASTEWATER TREATMENT ANOOISPOSAL ALTERNATIVES ASSESSMENT
2.0 Background lnformation
The following information has been used in developing this options assessment:
1. A review of the existing wastewater treatment and disposal methods;
2, ldentification of current and future wastewater flows and loads;
3. Key assumptions made during the assessment of all options.
2.L Existing Wastewater Treatment and Disposal
Two waste streams are produced at the plant; these are referred to as GreenWaste and Non-Green Waste. Green waste is generated from stockyards, gutcutting areas and tripe processing. Non-green wastes are sourced from theslaughter floor, further processing and hides wash overflow. Both streams arepassed through separate milli-screening screens and saveall tanks for gross solidsremoval. The green waste contains a high total phosphorus load so is treated ina 2 stage DAF-in-Series system, consisting of an acid DAF stage and then an alkaliDAF stage for phosphorus precipitation. The non-green waste does not contain ahigh phosphorus load so undergoes an acid DAF treatment for proteinprecipitation. ln total there are 12 DAFs on site, 9 of which are currentlyoperational. There are 3 parallel Non-Green waste acid DAFs and three parallel
sets (5 in total) of acid/alkali DAFs for Green waste treatment. Refer to Figure 1for a block diagram of the existing process.
&H Mn8 limaba.S
Figure 1: Existing wastewater treatment process
The streams are discharged via separate diffusers to the Mataura River. Theexisting discharge is located adjacent to the site and downstream of the MatauraFalls.
2.2 Contaminants of Concern
The assessment of environmental effects for the discharge of treated wastewaterto the Mataura River (Freshwater Solutions 2019) has identified the keycontaminants of concern in the discharge are:
:. E. coli;
) Ammoniacal-nitrogen;
AltrliUf
,.ff{rin ils Oirh.rtr
NpALLIANCE GROUP LIMITEO, ALLIANCE MATAURA PLANT WASTEWATER TREATMENT ANODISPOSAL ALTERNATIVES ASSESSMENT
r Total Nitrogen; and
i Total Phosphorus
2.2.7 E. coli
E. coli levels in the Mataura River are particularly high both upstream and
downstream of the Alliance discharge and water quality in both reaches of theriver is in the Red attribute state specified in the National Policy Statement forFreshwater Management2OTT (NPSFM). The relatively high concentration ofE. coli in the wastewater also means E. coli concentrations downstream of thedischarge are elevated.
A Quantitative Microbial Risk Assessment (QRMA) has been undertaken for thedischarge which shows while the Plant causes E. coli concentrations in theMataura River to increase significantly below the Plant's discharge point, thisdoes not eguate to a significant increase in health risk, and the risk of a person
swimming below the Plant becoming ill due to the Plant's discharge is well below1% (Streamlined Environmental 2019).
However, Southland Regional Council is obliged to set policy and methods toimprove water quality in the Mataura River so it is suitable for primary contactmore often and the indicator used by the NPSFM for how this is being achieved is
instream E. coli concentrations. Alliance has requested that this report stillexamine options for reducing the concentration of E. coli in its discharge such
that it does it's part in reducing the in-stream concentrations of this parameter.
A timeframe for improvin g E. coli concentrations in the Mataura River has not yetbeen developed and is dependent on the impending collaborative planningprocess referred to above. However, as shown in Table 1, a substantialimprovement in water quality is required for the Mataura River to improve itsattribute state from its current Red status. Streamlined Environmental has also
completed modelling which identifies the 95th percentile concentration of E. colithe Alliance Mataura discharge would need to achieve so as to maintain thatimproved attribute state downstream of the discharge.
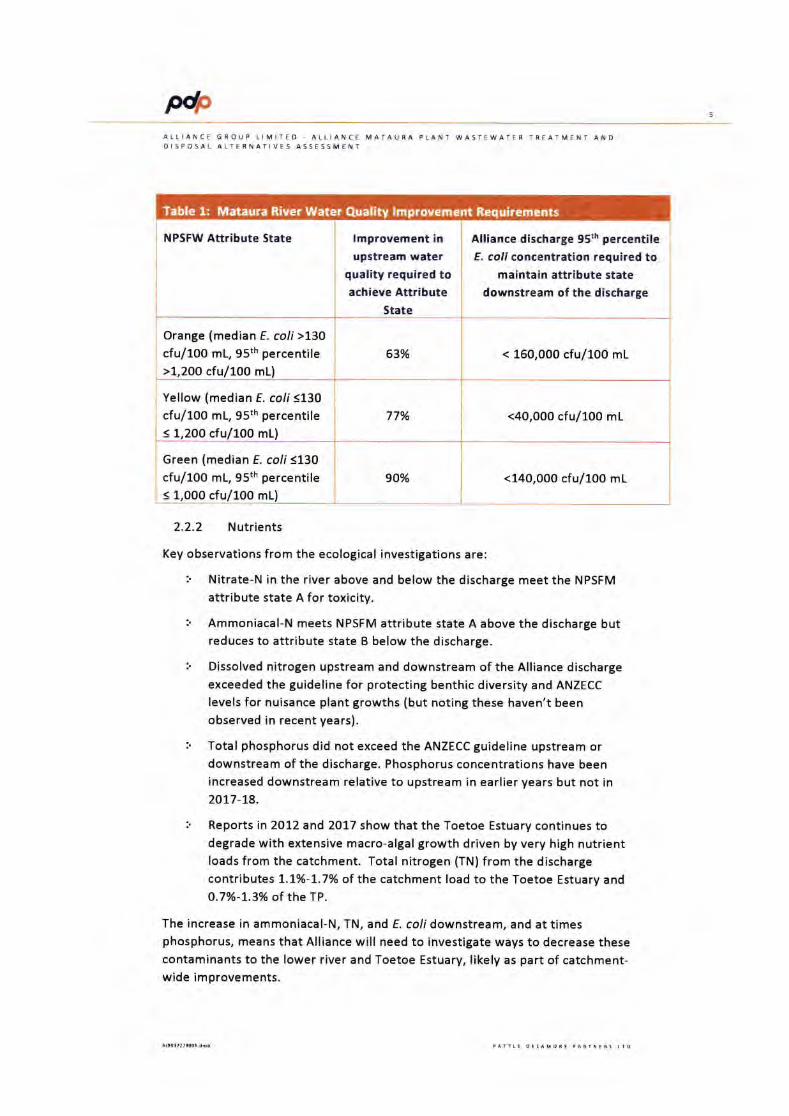
P* 5
ALLIANCE GROUP I. IMITED. ALTIANCE MATAURA PLANT WASTEWATER TREATMENT ANDDISPOSAL ALTERNATIVES ASSESSMENT
2.2.2 Nutrients
Key observations from the ecological investigations are:
i Nitrate-N in the river above and below the discharge meet the NPSFM
attribute state A for toxicity.
I Ammoniacal-N meets NPSFM attribute state A above the discharge butreduces to attribute state B below the discharge.
r Dissolved nitrogen upstream and downstream of the Alliance dischargeexceeded the guideline for protecting benthic diversity and ANZECC
levels for nuisance plant growths (but noting these haven't beenobserved in recent years).
i Total phosphorus did not exceed the ANZECC guideline upstream ordownstream of the discharge. Phosphorus concentrations have beenincreased downstream relative to upstream in earlier years but not in2017-L8.
Reports in 2072 and 2077 show that the Toetoe Estuary continues todegrade with extensive macro-algal growth driven by very high nutrientloads from the catchment. Total nitrogen (TN) from the dischargecontributes 1.7%-7.7% of the catchment load to the Toetoe Estuary andO.7%-7.3% of the TP.
The increase in ammoniacal-N, TN, and E. coli downstream, and at timesphosphorus, means that Alliance will need to investigate ways to decrease thesecontaminants to the lower river and Toetoe Estuary, likely as part of catchment-wide improvements.
NPSFW Attrabute State !mprovement in
upstream waterquality required toachieve Attribute
State
Alliance discharge 95th percentile
E. coli concentration required tomaintain attribute state
downstream of the discharge
Orange (median E. coli >73O
cfu/100 mL, 95th percentile>l,2OO cfu/100 mL)
53% < 160,000 cfu/100 mL
Yellow (median E. coli<L3Ocfu/100 mL, 95th percentile
< 1,200 cfu/100 mL)
77% <40,000 cfu/100 mL
Green (median E. coli 3L3O
cfu/100 mL, 95th percentile
< 1,000 cful100 mL)
90% <140,000 cfu/100 mL
Table 1: Mataura River Water Qual ent uirements
P*ALLIANCE GROUP LIMITED, ALLIANCE MATAURA PLANT WASTEWATER TREATMENT ANDDISPOSAL ALTERNATIVES ASSESSMENT
Total phosphorus has not been considered as a key contaminant to reduce duringthis assessment as a significant percentage (in the order of >90% dissolvedreactive phosphorus removal) of the load produced is already removed by theexisting process. ln the event, if further removal is required, even though levelsare already proportionally very low, then further chemical precipitation ofphosphorus could be included with treatment options, which already incorporateseparation technologies such as a clarifier or sand filter, at a cost of around
SlOflVr to StOOt/yr. This could achieve a mean final effluent total phosphorusconcentration of approximately 7 g/m'.
2.2.3 Organic load (cBODs)
While the organic load of the wastewater, as measured by carbonaceousbiochemical oxygen demand (cBODs), is not a contaminant of concern, removalof cBODs has been considered in this assessment as it is a contaminant that ispresent in the wastewater in reasonable quantities and is removed as part ofbiological nitrogen removal processes. lt has therefore, been included as an
additional indicator of general improvement in wastewater quality, even thoughit is not a contaminant of concern in the receiving surface water environment.
2.3 Existing Wastewater Treatment Plant Resilience
The existing wastewater management and treatment system was investigated toassess the resilience of the existing asset against failure, for the ongoingoperational use of the system.
While in general good operational order, some resilience issues associated withthe wastewater management and treatment system have been identified,summarised as follows:
1. Green Waste Cross Contamination;Separation of the green waste system is essential for minimising thephosphorus load discharged to the Mataura River via the Non-Greenwaste stream. However, there is the potential for over flow of the tripewash wastewater at the yards area to a Non-Green waste stream sumpand there is the potential for overflow of the Beef Sump Green wastemilli-screening unit to the red waste stream. Modification of the system
would decrease the risk of cross contamination.
2. Wastewater Transfer Pipe Location Risk;
The main Green waste, Non-Green waste and pelt house pipelines runthrough or above the hydro scheme water race at some locationsadjacent to the old rendering plant. This presents the risk of accidentaldischarge of contaminants directly to the River or an influx of river waterif any of the pipes fail. Relocation of the pipes outside of the hydro-racewould minimise this risk.
P*ALLIANCE GROUP LIMIIED. ALLIANCE MATAURA PLANT WASTEWATER TREATMENT ANODISPOSAL ALTERNATIVES ASSESSMENT
3. At the wastewater treatment plant some of the existing DAF
infrastructure is over 40 years old. The remaining lifespan of thistreatment system and therefore the resilience of this and any additionalwastewater systems installed needs to be considered. There is a
requirement in the future to refurbish or replace some of the existingwastewater treatment infrastructure to ensure the adequate treatmentand compliant discharge of future waste.
The resilience issues raised above are discussed in more detail in the separatereport, covering the water use survey and asset resilience assessment.
2.4 Wastewater Flows and Loads
2.4.1 Water Usage Survey and Reduction
PDP undertook a water use survey within the plant in January 2019. As part ofthis survey, flow monitoring of the incoming green and non-green waste streamsources was undertaken to identify water use within the various processing areas
of the plant. The DAF white-water flows were also recorded. This data was used
to assess water use efficiencies at the site and whether there may be
opportunities for reducing water use and wastewater volume.
The process flows measured were truck wash, cattle wash, cattle yard and cattlewash, Green waste in, Green waste out, Non-Green waste in and Non-Greenwaste out. This allowed water usage in key parts of the plant to be identifiedutilising a mass balance. A walk through the main processing areas of the plantwas also undertaken to observe water use within the plant.
Good water usage practice was observed around the main processing plant, withwater conservation measures utilised, from sensor based wash systems torestricted flow knife wash systems. Additionally, water recirculation practices
are utilised in the tripe plant to limit the amount of water added to the Green
waste. No major water saving measures were identified within the mainprocessing plant.
White-water (dissolved air water) recycling within the wastewater treatmentplant, however, was identified as a major water saving opportunity for the site.Currently white-water is generated with the use of water drawn from theMataura River using the sites river take (approximately 2,000 m3/d which makes
up approximately 37% of the overall wastewater volume). Most moderns DAF
treatment systems utilise recycled treated water for generation of the white-water and for any future plant development, it is recommended that thisapproach is followed, so long as there is no increase in the risk of foamgeneration within the dissolved air saturation vessel and the DAF plant. This willhelp reduce the capital cost associated with hydraulic sizing of equipmentrequired in the future.
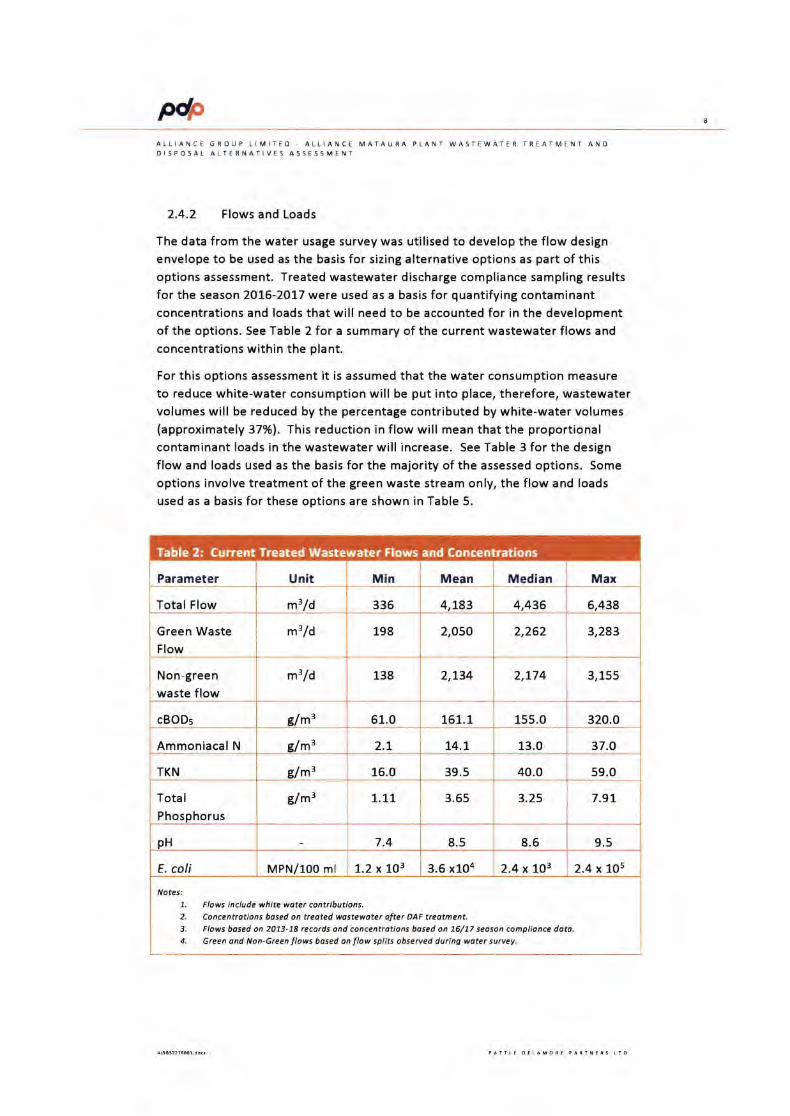
pdpALLIANCE GROUP LIMITED , ALLIANCE MATAURA PLANT WASTEWATER TREATMENT ANDDI SPOSAL ALTERNATIVES ASSESSMENT
2.4.2 Flows and Loads
The data from the water usage survey was utilised to develop the flow design
envelope to be used as the basis for sizing alternative options as part of thisoptions assessment. Treated wastewater discharge compliance sampling resultsfor the season 2OL6-2OL7 were used as a basis for quantifying contaminantconcentrations and loads that will need to be accounted for in the developmentof the options. See Table 2 for a summary of the current wastewater flows and
concentrations within the plant.
For this options assessment it is assumed that the water consumption measure
to reduce white-water consumption will be put into place, therefore, wastewatervolumes will be reduced by the percentage contributed by white-water volumes(approximately 37%1. This reduction in flow will mean that the proportionalcontaminant loads in the wastewater will increase. See Table 3 for the design
flow and loads used as the basis for the majority of the assessed options. Some
options involve treatment of the green waste stream only, the flow and loads
used as a basis for these options are shown in Table 5.
3,283
3,155
Parameter Unit Min Mean Median Max
Total Flow m3/d 336 4,183 4,436 6,438
Green Waste
Flow
2,262m3/d 198 2,O50
Non-greenwaste flow
m3/d 138 2,734 2,774
cBODs 155.0Elm3 51.0 151.1 320.0
Ammoniacal N elm3 2.1 74.L 13.0 37.O
TKN g/mt 15.0 39.5 40.0 59.0
TotalPhosphorus
g/m3 L.t7 3.65 3.25 7.97
pH 7.4 8.5 8.5 9.5
E. coli MPN/100 ml 1.2 x 10³ 3.6 x10a 2.4 x 7O3 2.4 x ].Os
7.
2.
3.
4.
Flows include white woter contributions.Concentrdtions bosed on treoted wostewdter ofter DAF treotment.Flows bosed on 2073-78 recods ond concentrdtions bdsed on 76/77 seoson complidnce ddto.Green dnd Non-Green flows bosed on flow splits obserued during woter sutvey.
,Votes;
Table 2: €rrrent Treated Wastewater Flows and Concentrations
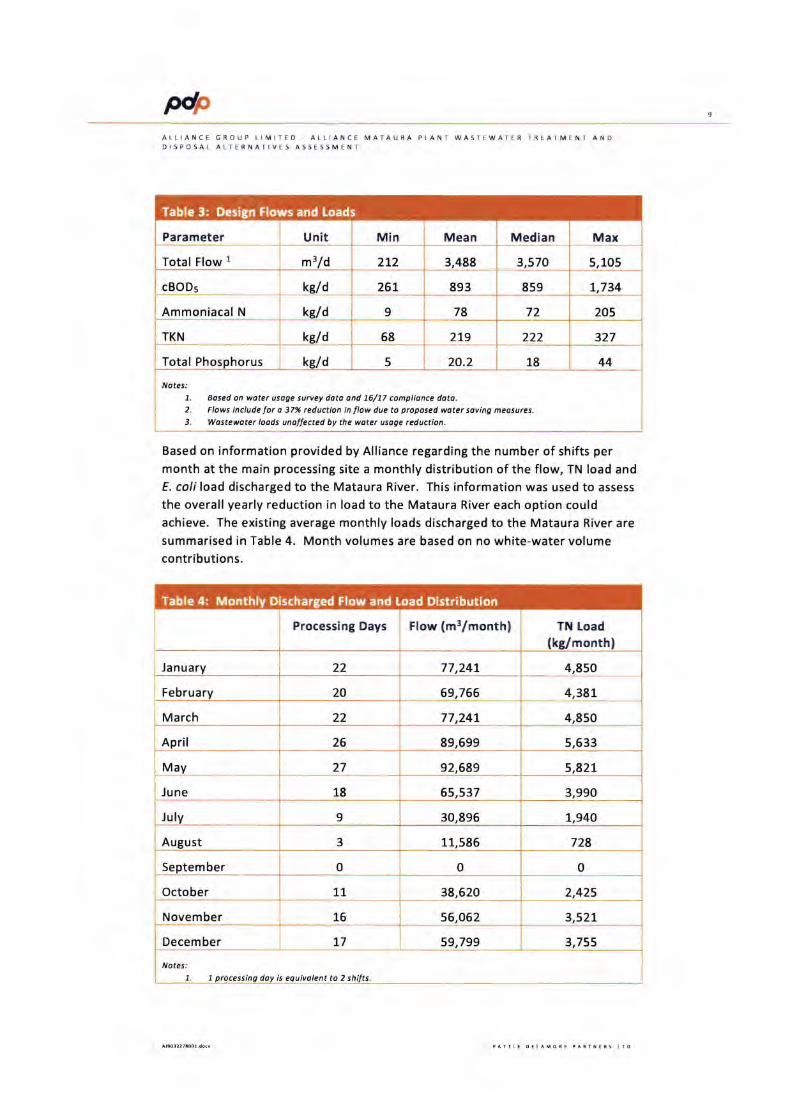
MALLIANCE GROUP LIMITED - ALLIANCE MATAURA PLANT WASTEWATER TREATMENT ANDDISPOSAL ALTERNATIVES ASSESSMENT
Total Phos ds
/Votes.'
7. Bosed on woter usoge survey doto ond 16/77 complionce doto.2. Flows include for o j7% teduction in flow due to proposed woter soying meosurcs3. Wostewater loods unolfected by the woter usoge reduction.
Based on information provided by Alliance regarding the number of shifts permonth at the main processing site a monthly distribution of the flow, TN load andE. coli load discharged to the Mataura River. This information was used to assess
the overall yearly reduction in load to the Mataura River each option couldachieve. The existing average monthly loads discharged to the Mataura River are
summarised in Table 4. Month volumes are based on no white-water volumecontributions.
Min Mean Median MaxParameter
Total Flow I
Unit
m3 212 3,488 3,570 5.105
cBODs keld 267 893 859 1,734
Ammoniacal N ks,ld 9 78 72 205
TKN kcld 58 219 222 327
5 20.2 18 44
Table 3: Flows and Loads
Processing Days Flow (m3/month) TN Load(kelmonth)
January 22 77,241 4,850
February 20 69,765 4,387
March 22 77,241 4,850
April 26 89,599 5,533
Mav 27 92,689 5,827
June 18 65,537 3,990
July 9 30,896 1,940
August 3 11,585 728
September 0 0 0
October LI 38,520 2,425
November 15 56,062 3,527
December L7 59,799 3,755
Notes:
7. 1 processino doy is eauivolent to 2 shifts.
Table 4: Mont Discha Flow and Load Distribution
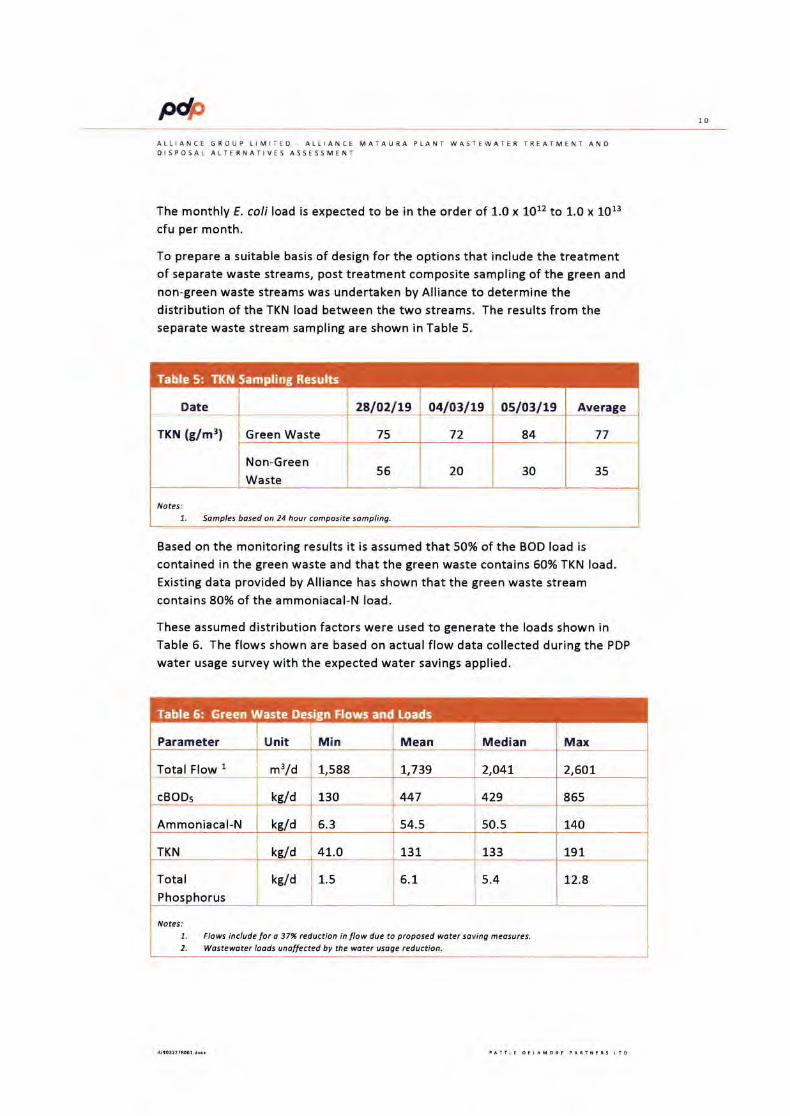
M 10
ALLIANCE GROUP LIMITED - ALLIANCE MATAURA PLANT WASTEWATER TREATMENT ANDOISPOSAL ALTERNATIVES ASSESSMENT
The monthly E. coli load is expected to be in the order of 1.0 x 10¹² to 1.0 x 10¹³
cfu per month.
To prepare a suitable basis of design for the options that include the treatmentof separate waste streams, post treatment composite sampling of the green and
non-green waste streams was undertaken by Alliance to determine thedistribution of the TKN load between the two streams. The results from theseparate waste stream sampling are shown in Table 5.
Based on the monitoring results it is assumed that 50% of the BOD load iscontained in the green waste and that the green waste contains 6O% TKN load.
Existing data provided by Alliance has shown that the green waste streamcontains 8O% of the ammoniacal-N load.
These assumed distribution factors were used to generate the loads shown in
Table 6. The flows shown are based on actual flow data collected during the PDP
water usage survey with the expected water savings applied.
Date 28lO2lL9 o4los/le oslo?lt9 Ayerage
Green Waste 75 72 84 77TKil (g/m3)
Non-Green
Waste55 20 30 35
Notes:7. Sdmples bosed on 24 hour composite sompling.
Table 5: TKN Sam Results
Parameter Unit Min Mean Median Max
Total Flow 1 m3ld 1,588 !,739 2,O41 2,601
cBODs kzld 130 447 429 865
Ammoniacal-N keld 5.3 54.5 50.5 140
TKN kzld 41.O 131 133 191
TotalPhosphorus
kela 1.5 6.1 5.4 12.8
Flows include for o 37% reduction in flow due to proposed soter soving meosures.
Wdstewoter lodds undltected by the woter usoge reduction.
irotes.'7.
2.
Table 6: Green Waste Design Flows and Loads
P* 11
ALLIANCE GROUP LIMITED - ALLIANCE MATAURA PLANT WASTEWAT€R f REATMENT ANODI5POSAL ALTERNATIVES ASSESSMENT
2.5 Summary of Key Assumptions
ln summary, the options assessment outlined in this report is based on thefollowing key assumptions:
1. The number of beef animals processed at the site will not increase;
2, Wastewater flows will be reduced by at least 35% due to the use ofrecycled treated wastewater white-water generation. The contaminantloads will be unaffected by this reduction in volume, hence wastewaterconcentrations post-DAF will increase;
3. Based on the operating information received from Alliance the followingnumber of processing days have been assumed as follows for summer(Nov - Apr) 125 days and winter (May - Oct) 70 days, where one dayconsists of 2 shifts;
4. Wastewater treatment option cost estimates are based on the followingassumptions:
Geotechnical conditions are suitable for tank foundations and forconstruction of earthen based lagoons, based on a cut to fillconstruction;
b. Land can be purchased for cut and carry irrigation within 5 km of thesite for a price of S70,000/ha;
c. A discount rate of 10% over 10 years has been assumed for the NPV
calculations.
P* a2
ALLIANCE GROUP LIMITED - ALLIANCE MATAURA PLANT WASTEWATER TREATMENT ANDDISPOSAL ALTERNATIVES ASSESSMENI
3.0 Potentially Available Wastewater Management Options
A long-list of available alternatives was developed, and from that a shortlist ofpotential options was prepared. Each of the short-listed options was thenassessed further, considering the potential for the option to reduce contaminantloads to the Mataura River, option resilience, and lifecycle costs.
Sixteen possible options were initially identified, based on 7 discharge optionswith several treatment sub-options. These identified options formed the initiallonglist, as follows:
1. Discharge to Mataura River:
A. Existing system (status quo);
B. Biological treatment for cBODs removal only, with UV disinfection;
C. Biological treatment for cBODsand nitrogen removal with UV
disinfection;
D. Filtration and UV disinfection only;
E. High pH disinfection of green waste stream;
F. Biological treatment for cBODsand nitrogen removal of Green wasteonly, with combined UV disinfection.
2. lrrigation to third party owned dairy pasture:
A. Year round irrigation with current level of treatment;
B. October to April irrigation, with biological treatment and storagefrom May to September.
3. lrrigation to cut and carry system, on purchased land:
A. Year round irrigation with current level of treatmen!
B. October to April irrigation, with biological treatment and storagefrom May to September;
4. Dual discharge to Mataura River (May to September) and irrigation tothird party owned dairy pasture (October to April):
A. No treatment prior to river discharge;
B. Biological treatment for cBODsand nitrogen removal with UV
disinfection prior to river discharge.
5. Dual discharge, to Mataura River (May to September) and irrigation to a
cut and carry system (October to April) on purchased land:
A. No treatment prior to river discharge;
P* 13
ALLIANCE GROUP LIMITED, ALI. IANCE MATAURA PLANT WASTEWATER TREATMENT ANODISPOSAL ALT€RNAlIVES ASSESSMENI
B. Biological treatment for cBODsand nitrogen removal with UV
disinfection prior to river discharge.
5. Transfer Wastewater to Gore municipal WWTP.
7. Transfer Wastewater to Mataura municipal WWTP.
An assessment of each option is summarised Table 7.
3.1 Assessment of Long List Options
Of the assessed long list options, those incorporating significant risk anduncertainty, and substantial lifecycle costs are removed from further assessment.This includes:
Options that do not provide improvement to the level of discharge to theMataura River, specifically Option 1A (the status quo) and Option lE (pH
disinfection) as neither option will provide for a significant reduction inE. coli levels or nitrogen in the discharge, which have been identified as
contaminants of concern;
Option 18 was discounted as BOD is not considered a prioritycontaminant to remove from the effluent. This option therefore, doesnot provide any additional reduction in loads of priority contaminants tothe river compared to Option 1D, for the additional costs;
Options incorporating discharge to land all year (Options 2A and 3A) as
these will require securing purchase of, or access to, considerably largeland areas and may become operationally difficult to manage,particularly d uring winter;
Options involving discharge to Gore District Council municipal treatmentsystems (Options 5 and 7) due to uncertainty associated with consenting,treatment plant capacity and future costs;
Options involving excessive capital and/or operational costs that do notoffer a good value return on investment, in terms of net reduction in loadto the river, ease of operation and efficient use of expenditure. Thisincludes options which involve investment in both treatment andirrigation (Options 28 38, 48 and 58) and options which incorporatetreatment upgrades (or capital contribution) and ongoing trade wastecharges (Options 6 and 7).
On this basis the options refined for further assessment include:
Option 1C - Existing river discharge with biological treatment for cBODs
and nitrogen removal with UV disinfection;
I Option 1D - Existing river discharge with filtration and UV disinfection;
PdP 14
ALLIANCE GROUP LIMITEO ' ALLIANCE MATAURA PLANT WASTEWATER TREATMENT ANDDISPOSAL ALTERNATIVES ASSESSMEilT
Option 1F - Existing river discharge with biological treatment for cBODs
and nitrogen removal of the green waste stream with UV disinfection;
Option 4A - Dual discharge with the existing river discharge combinedwith discharge to dairy pasture with no treatment prior to riverdischarge;
Option 5A - Dual discharge with the existing river discharge combinedwith discharge to a cut and carry system with no treatment prior to riverdischarge.
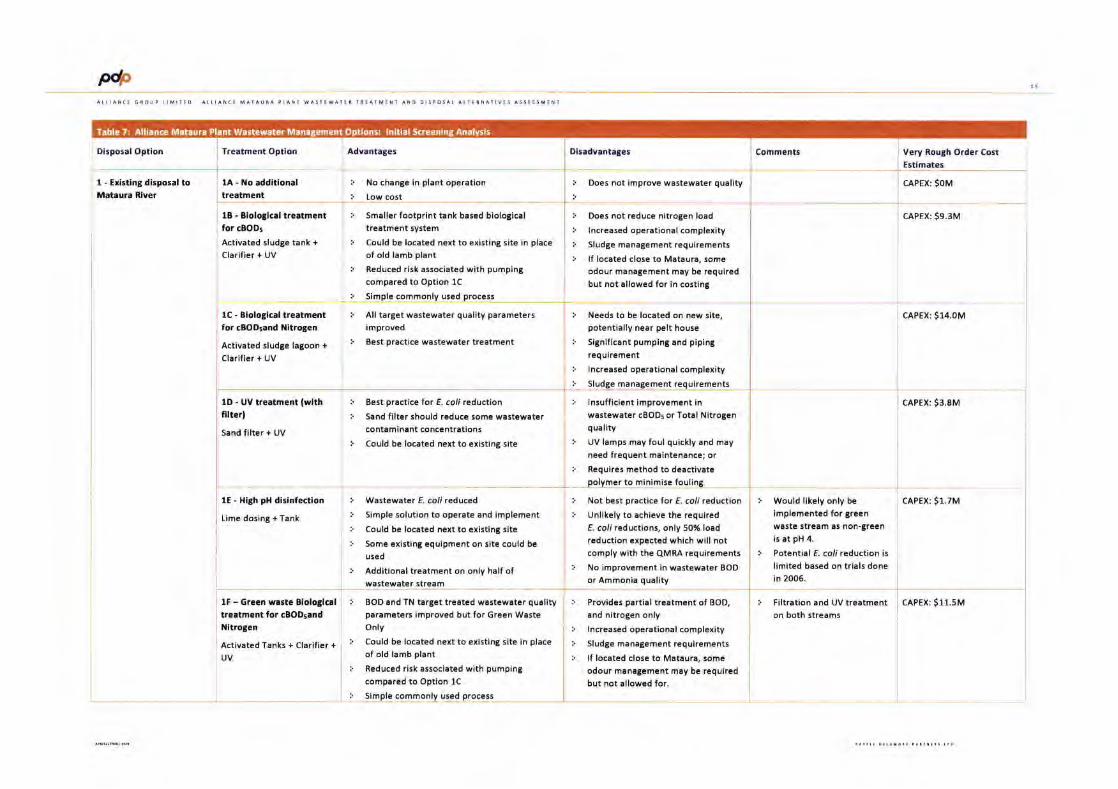
Table 7: Alliince Mrtaurr Plant Wastoweter lnitial
AILiAilCE GROUP TIMITID
PdP
Disposal Option
1 - Existint disposal toMataura River
Treatment Option
1A - No additionaltreatment
1B - Biolotical treatmentfor cBODs
Activated sludge tank +Clarifier + UV
lC - Blological treatmentfor cBODsand Nitroten
Activated sludge lagoon +
Clarifier + UV
lD - UV treatment (wlthfllter)
Sand filter + UV
lE - Hith pH disinfectlon
Lime dosing + Tank
lF - Green waste Bioloticaltreatment for cBODsand
1{itroten
Activated Tanks + Clarifier +UV
Advantates
No change in plant operation
Low cost
Smaller footprlnt tank based biological
treatment system
Could be located next to existing site in place
of old lamb plant
Reduced risk associated with pumping
compared to option 1c
Simple commonly used process
All target wastewater quality parameters
improved
Best practice wastewater treatment
l Best practice for E. coli reduction
r Sand filter should reduce some wastewatercontaminant concentrations
:. Could be located next to existing site
i Wastewater E. coli reduced
l Simple solution to operate and implement
r Could be located next to existing site
l Some existing equipment on site could be
used
l Additional treatment on only half ofwastewater stream
BOD and TN tartet treated wastcwater qualityparameters improved but for Green WasteOnly
Could be located next to existint site in place
of old lamb plant
Reduced risk associated with pumpintcompared to option 1c
Simple commonly used process
Disadvantates
l Does not improve wastewater quality
l Does not reduce nitrogen load
l lncreasedoperationalcomplexity
l Sludge manatement requirementsl lf located close to Mataura, some
odour management may be requiredbut not allowed for in costing
l Needs to be located on new site,potentially near pelt house
i Significant pumping and pipingreq uirement
l lncreasedoperationalcomplexity
l Sludge manatement requirements
l lnsufficient improvement inwastewater cBOD5 or Total Nitrogenqua lity
r UV lamps may foul quickly and mayneed frequent maintenance; or
l Requires method to deactivatepolymer to minimise fouling
l Not best practice for E. cori reductionl Unlikely to achieve the required
E. cori reductions, only 50% loadreduction expectcd which will notcomply with the QMRA requirements
r No improvement in wastewater BOD
or Ammonia quality
Provides partial treatment of BOD,
and nitrogen only
lncreased operational complexity
Sludge management requirements
lf located close to Mataura, someodour management may be requiredbut not allowed for.
Comments Very Rough Order CostEstimates
cAPEx: S0M
CAPEX: 59.3M
cAPEX: s14.0M
cAPEx: S3.8M
Would likely only be
implemented for green
waste stream as non-green
is at pH 4.
Potential E coli reduction is
limited based on trials done
in 2005.
cAPEx: S1.7M
:. Filtration and UV treatment CAPEX: S11.5Mon both streams
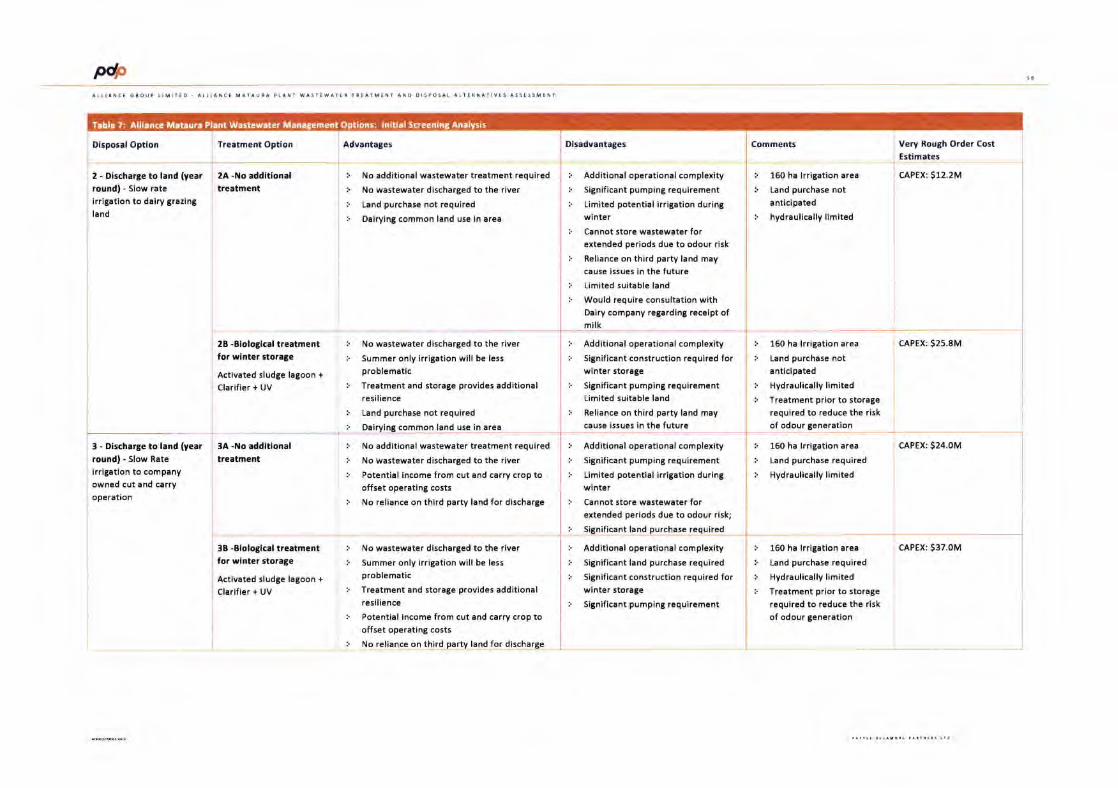
Table 7: Alliance Mataura Plant wasteurater lnitial
Np 15
ALLIANCI GNOOP ttMITEO
Disposal Option
2 - Discharte to land (yearround) - Slow rateirritation to dairy trazingland
3 - Dlscharge to land (yearroundl - Slow Rate
irrigation to companyowned cut and carry
operation
Treatment Option
2A -ilo additionaltreatment
2B -Blolotlcal treatmentfor wlnter storate
Activated sludge lagoon +
Clarifier + UV
3A -No additionaltreetment
3B -Blologlcal treatmentfor wlnter storage
Activated sludge lagoon +
Clarifier + UV
Dlsadvantates
Additional operational complexity
Significant pumpint requirement
Limited potential irritation durintwinter
Cannot stora wastewater forextended periods due to odour risk
Rcliance on third party land maycause issues in the futurcLimited suit.blG land
Would requirc consultation withDairy company regarding recript ofmilk
Additional operational complexity
Sitnificant construction required forwinter storage
Significant pumping requirementLimitcd suitable land
Reliance on third party land may
cause issues in the future
l Additional operationalcomplexity
l Significant pumping requirement
r Limited potential irritation duringwinter
r Cannot store wastewater forextended periods duc to odour risk;
:. Significant land pgrchase reqgired
l Additionaloperationalcomplexity
l Significant land purchase required
l Sitnificant construction rcquired forwinter storage
:' Significantpumpintrequirement
160 ha lrriEation area
Land purehase notanticipated
hydraulically limitcd
150 ha lrritation area
Land purchase nota nticipated
Hydraulically limited
Treatment prior to storage
required to reduce the risk
of odour generation
Very Rou8h Order CostEstimates
cAPEx: S12.2M
CAPEx: S25.8M
Advantages
l No additional wastewater treatment required
l No wastewater discharged to the river
l Land purchase not required
l DairyinS common land use in area
l No wastewater discharged to the river
i Summer only irrigation will be less
problematic
l Treatment and storage provides additionalresilience
Land purchase not required
comm91 fa1!.9se tn area
i No additional wastewater treatment required
t No wastewater discharged to the river
l Potential income from cut and carry crop tooffset operatint costs
l No reliance on third party land for discharge
No wastewater discharged to the river
Summer only irrigation will be less
problematic
Treatment and storage provides additionalrcsi liencc
Potcntial income from cut and carry crop tooffset operatinE costs
No reliance on third party land for discharge
Comments
160 ha lrrigation area
Land purchase required
Hydraulically limited
cAPEx:524.0M
160 ha lrrigation area
Land purchase required
Hydraulically limited
Traatment prior to storage
required to reduce the risk
of odour tcneration
cAPEX: s37.0M
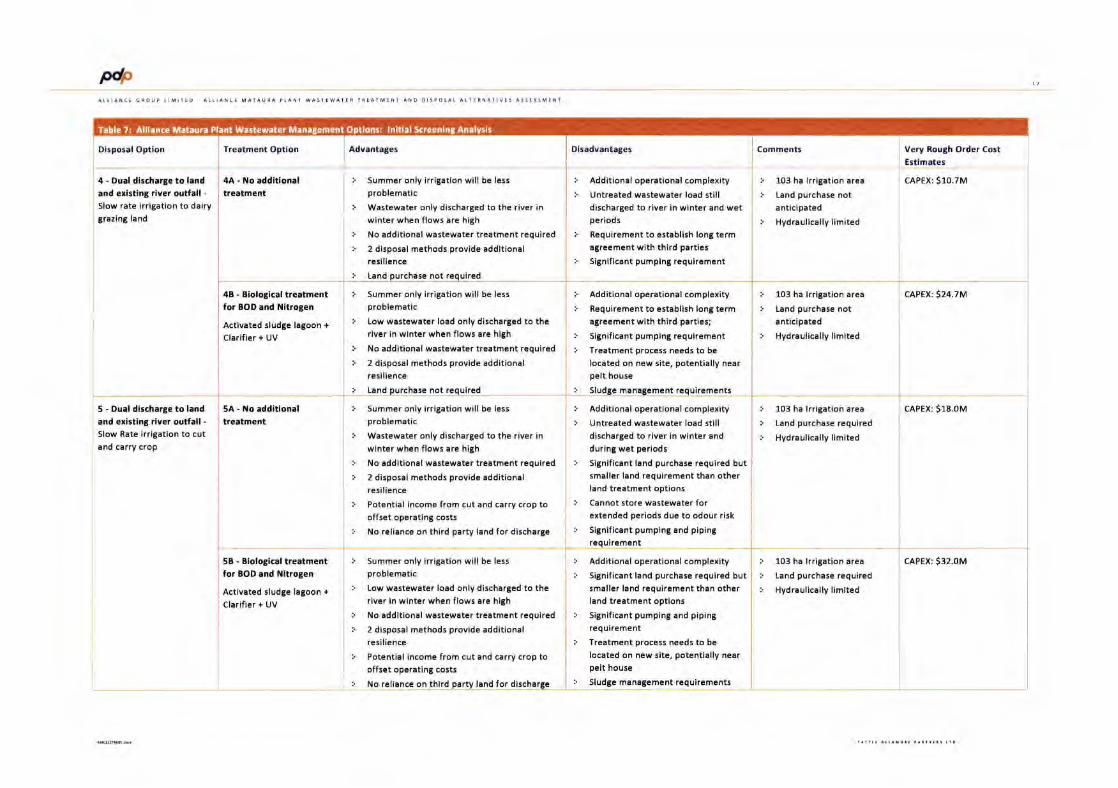
Pdp
Disposal Option
4 - Dual dlscharye to land
and exlstlnt rlver outfall -
Slow rate irrigation to dairygrazing land
5 - Dual dlscharge to land
and erlstint rlver outfall -Slow Rate irritation to cutand carry crop
Treatment Option
4A - No addltlonaltieatment
48 - Bloloticalfor BOD and Nltrogen
Activated sludge lagoon +
clarifier + UV
5A - No additionaltreatment
5B - Blolotlcal treatmentfor BOD and Nltroten
Activated sludge lagoon +
Clarifier + UV
summer only irrigation will be less
problematic
Wastewater only discharged to the river in
winter when flows are high
No additional wastewater tr!atment required
2 disposal methods provide additionalresilience
t91! purchgse nol rgquired
Summer only irrigation will be less
problematic
Low wastewater load only discharted to theriver in winter when flows are high
No additional wastewater treatment required
2 disposal methods provide additionalresilience
:. Land
Summer only irrigation will be less
problematic
Wastewater only discharged to the river inwinter when flows are high
No additional wastewatGr treatment requirGd
2 disposal methods provide additionalrasi lience
Potential incomc from cut and carry crop tooffsrt operatint costs
No rcliance on third party land for discharga
t Summer only irrigation will be less
problematic
t Low wastewater load only discharged to theriver in winter when flows are high
l No additional wastewater treatment required
l 2 disposal methods provide additionalresilience
l Potential income from cut and carry crop tooffset operating costs
l No reliance on third party land for discharge
Dlsadvantates
Additional operational complexity
Untrcated wastewater load stilldischarged to river in winter and wetperiods
Requirement to establish long termagreement with third parties
Significant pumping requirement
Additional operational complexity
Requirement to establish long termagreement with third parties;
Significant pumpint requirement
Treatment process needs to be
located on new site, potentially nearpelt house
Sludge mana6ement requir,ements
Additional operational complexity
Untreated wastewater load stilldischarged to river in winter and
during wet pcriods
Significant land purchase required butsmaller land requirement than otherland treatment options
Cannot store wastewater forcxtendcd pcriods due to odour risk
Significant pumping and pipingrcquirement
l Additionaloperationalcomplexity
r Sitnificant land purchase required butsmaller land requirement than otherland treatment options
l Significant pumpint and piping
requirement
l Treatment process needs to be
located on new site, potentially nearpelt house
l Sludte management requirements
Comments
l 103 ha lrritation area
i Land purchase nota nticipated
l Hydraulicallylimited
l 1O3 ha lrritation area
r Land purchase notanticipated
r Hydraulicallylimited
103 ha lrrigation area
Land purchasc rcquired
Hydraulically limited
103 ha lrrigation area
Land purchase required
Hydraulically limited
Very Rough Order Cost
Estimates
CAPEX: S10.7M
cAPEX: s24.7M
cAPEX: s18.OM
cAPEX: s32.0M
Advantates
Table 7: Alliance Mataura Plant Wastewater lnitial
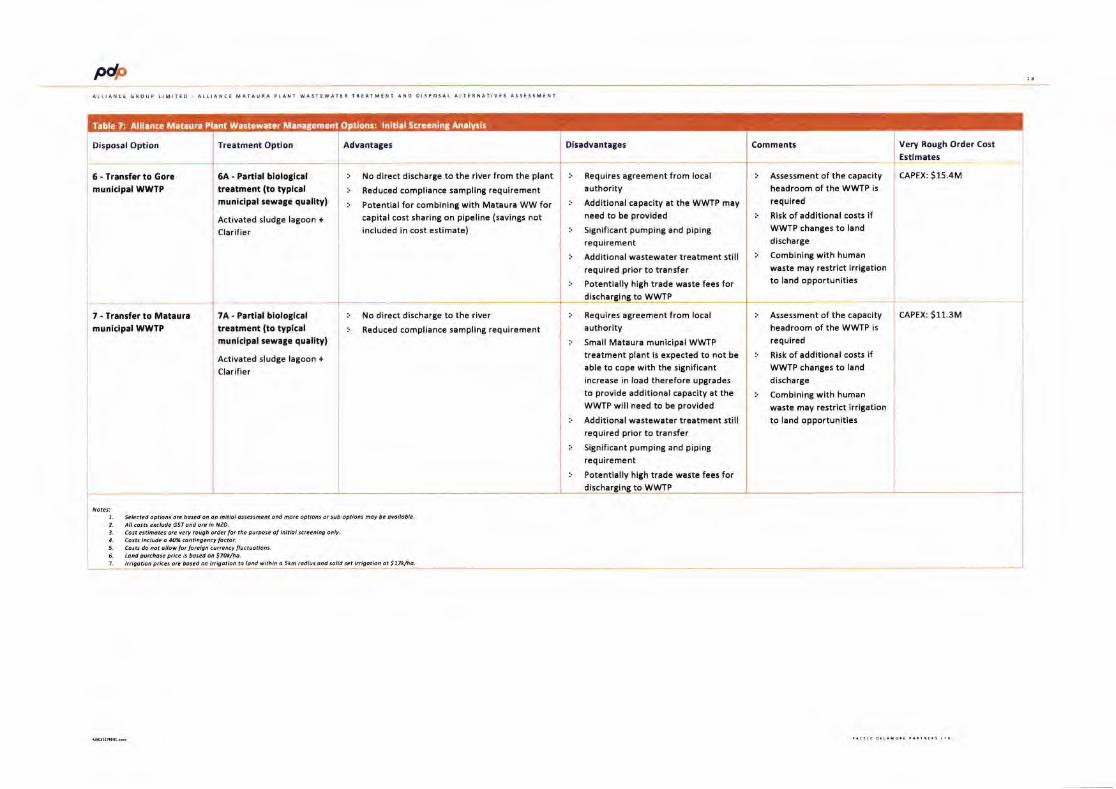
Np^I
IIAN't GNOUP LIMIT'O
Disposal Option
6 - fransfer to Goremunlcipal WWTP
7 - Transfer to Matauramunlclpal WWTP
7. S.lcct d opilons ok b6.d on on lnltlol oss.$mcnt ond morc opllont or sub-o9llons noy b. ovolloble.2. All cosB.x.ludc GSI ond orc ln NZo.
3. Cost.salmoa.s or. v.ty tough otd.t lot th. putpos. o, lnltbl t.rccnldg only.4. costs lnclutl. o 4ox @nilneency locbl5. Cost do not ollow lot lot lCn cutt.ncy fluctuotlons.5. Lond purchos. prh. ls bos.d on STOl/ho.l . hrlgoalon prk.t otc bos.d on tdootlon to lond vlrhln o
'kn rcdlut ond tolld t a bilcoalon ot $ 77k/ho.
No direct discharge to the river from the plant
Reduced compliance sampling requirement
Potential for combining with Mataura WW forcapital cost sharing on pipeline (savings notincluded in cost estimate)
l No dircct disch.rge to the river
r Reduccd compliance sampling requirement
Treatment Option AdvantaSes
6A - Partlal blologicaltreatment (to typlcalmunlclpal sewag€ quallty)
Activated sludge lagoon +
Clarifier
7A - Partlal blologlcaltreatment (to typlcalmunlclpal sewate qualltyl
Activated sludge lagoon +
Clarifier
l Requires agreement from local
authority
l Additional capacity at the wwTP may
necd to be providcd
l Sitnificant pumping and pipinB
requircment
l Additional wastewatcr treatment stillrcquirad prior to transfcr
l Potentially high trade waste fees fordischarging to WWTP
l Requires agreement from localauthority
l Small Mataura municipal WWTP
trcatment plant is expcctrd to not bc
able to cope with the sitnificantincrease in load therefore upgrades
to provide additional capacity at theWWTP will need to be providcd
l Additional wastewater treatment stillrequired prior to transfer
] Significant pumpinE and pipingrequirement
l Potentially high trade waste fees for
Dlsadvantates
tO WWTP
Table 7: Alliance Mataura Plant Wastewater lnitial
Comments
Assessment of th. capacity
headroom of the WWTP is
required
Risk of additional costs ifWWTP changes to land
discharge
Combining with human
waste may restrict irriSationto land opportunities
Assrssment of thr capacity
headroom of the WWTP is
required
Risk of additional costs ifWWTP chantcs to land
discharge
combining with human
waste may restrict irrigationto land opportuniti.s
Very Rough Order Cost
Estimates
CAPEX: S15.4M
CAPEX: s11.3M
P* 19
ALLIANCE GROUP LIMITED . ALLIANCE MATAURA PLANT WASTEWATER TREATMENT ANDDISPOSAL ALTERNATIVES ASSESSMENT
4.0 Wastewater Treatment and Disposal Options Shortlist
Each of the shortlisted options outlined in Section 3.1 have been investigatedfurther. This has enabled initial equipment sizes to be calculated and additionalcertainty to be applied to cost estimates which have been presented in eachsection below. For the options involving land treatment, local weather data andsoil moisture models have been used to obtain more accurate land arearequirements and soil maps have been used to identify suitable areas to locatethe irrigation schemes.
4.1 Assessment of Treatment Options Costs
PDP have assessed high level costs for a number of short-listed options as
outlined in this report. All costs exclude GST and are in NZD (based on January2019 equipment budget cost estimates) and do not take into account any foreignexchange currency fluctuations. These estimated costs are prepared based on aconcept design level and are suitable for indicative budget requirements, ratherthan approval for actual capital works budgets.
4.1.1 Costing Assumptions and Limitations
The cost estimates are based on the process flow diagrams. For each option, theestimate is also based on the expected treatment performance.
A number of assumptions were made to prepare the cost estimates. Theseinclude:
a. All bulk earthworks on nominated sites have suitable material for cut-to-fill with no site-specific geotechnical assessment undertaken;
b. There is unrestricted access to the site and management of any existingservices encountered and/or temporary works excluded;
c. There is no contaminated material encountered on pipeline routes or anyexcavated material and no ground improvement has been allowed for;
d. Estimates for plant equipment is based on initial budget supply prices(January 2019). Sumps and building structure costs estimates are basedon similar previous/historical projects;
e. All above ground pipework is stainless steel and all below pipework HDPE
or PVC;
f. Existing DAF treatment system is suitable for continued use with bolt-onfurther treatment process trains;
g. No provision for upgrade of existing outfall;
h. Access to land treatment sites available within 5 km of the site'
M 20
ALLIANCE GROUP LIMITED ALLIANCE MATAURA PLANT WASTEWATER TREATMENT ANDDISPOSAL ALTERNATIVES ASSESSMENT
Operating costs include electrical power, chemicals, operator timeallowances and expected maintenance costs of mechanical equipment;and
j. The cost estimating is based on Class 4 Class (AACE lnternational), on thebasis of a 40% safety contingency, giving a +4O%/-2O% estimate range.
A 10 year period has been used for the net present value (NPV) calculation as thisis the typical time span used in the industry for NPV assessments of upgradeinvestments. The NPV analysis has utilised a discount rate of 10%.
4.1.2 Summary of Costs and lmplications
lnitial concept level cost estimates have been prepared for the shortlistedtreatment options with the use of existing disposal routes, namely discharge toriver and land treatment.
PDP has investigated options for staging the treatment options to minimise initialcapital expenditure based on the likely treatment requirements at each stage
and to allow for time to validate the treatment performance at each stage priorto progressing on further upgrades.
4.2 Option lC Biological Nitrogen Removal and UV Disinfection
Option C incorporates a large, lagoon based, biological reactor, intended toreduce BOD, ammoniacal nitrogen and total nitrogen loads. The process design
is based on achieving an average wastewater BOD concentration of below20 g/m3 and a total nitrogen concentration below 2O gf m3, as these are typicalvalues that are reasonable to expect from the proposed treatment system. Due
to the large lagoon size, it cannot be located near the existing DAF WWTP and itwould likely need to be located on Alliance land, adjacent to the pelt house site.
4.2.1 Process Description
The process description of the proposed Option lC WWTP is outlined as follows:
DAF wastewater from the two waste streams will be combined in a wet-well prior to being pumped in a 300 mm OD main a distance of 2 km tothe proposed treatment plant site. lt is suggested the main follows theroute of SHl from the main treatment plant to the pelt house site.
The pumped wastewater will flow into an 8,50O m3 aerated lagoon ofvolume for BOD, ammoniacal N and total N treatment. The lagoon has
been sized to maintain a sludge retention time of 20 days at a mixed
liquor concentration of 3,000 mg/1. This provides a mean hydraulicretention time of 2.5 days. lt is assumed that the lagoon would be HDPE
lined and of earthen construction. 210 kW of aeration would be provided
by floating mechanical surface aerators.
P* 2a
AttIANCE GROUP LIMITED , ALLIANCE MATAURA PLANT WASTEWATER TREATMENT ANDDISPOSAL ALTERNATIVES ASSESSMENT
Waste Activated Sludge (WAS) will be wasted to a WAS storage tank, it isproposed that WAS be dewatered onsite in a decanter centrifuge, it has
been assumed the system used for handling DAF float sludge currentlyhas the capacity to dispose of the dewatered WAS. Daily dewatered WASproduction is expected to be 6 m3/d (wet volume) at 15% DS.
A single circular clarifier will follow the aeration lagoon to provide solidsseparation. The clarifier will have a diameter of approximately 25 m, thisis based on a conservative hydraulic overflow rate of 1O m3/m2/d. The
RAS ratio has been assumed to be 60% of the incoming wastewater flow,which is within the typical range used in similar treatment systems. The
clarifier will be of concrete construction with a mechanical launder, inletdiffuser, scraper system and walkway.
Clarified wastewater will pass through a sand filter that will act as
protection for the UV unit downstream from limited solids carryoveroccurrences from the clarifier. The filter will have a working area of18 m2, this is based on a hydraulic loading rate of O.2 mslm2lmin. Dirtybackwash water will be returned upstream of the DAF system.
Based on the UV trial work previously performed by PDP at AllianceMataura, and the Alliance Pukeuri UV installation, it is estimated thatpeaks flows can be treated by 2 No. 40 low pressure, high output UV
lamp reactors (such as the Wedeco LBX 1000). The reactors would eachbe sized for a peak flow rate of 30 L/s and it has been assumed that withclarification and filtration upstream a design UVT of 50% is appropriate.
Following the UV system the treated wastewater will be pumped back tothe site of the main processing and wastewater treatment plant, this willrequire another wet-well, pump station, and 300 mm main that willfollow the same route and the DAF wastewater main. The main will tieinto the existing discharge pipework. No changes to the dischargeinfrastructure are anticipated at the stage.
4.2.2 Load to the River
The expected load discharged to the river by this option has been estimated andcompared to the current load. These estimates have been based on the targetBOD outlet concentration (20 g/m3), target TN concentration (20 g/m3) expecteddays processing at the plant and current wastewater flows and loads. The UV
system will reduce the E cori load to the river by a 3 to 4 log reduction, with a
95th percentile of <1,000 cfu/100 mL.
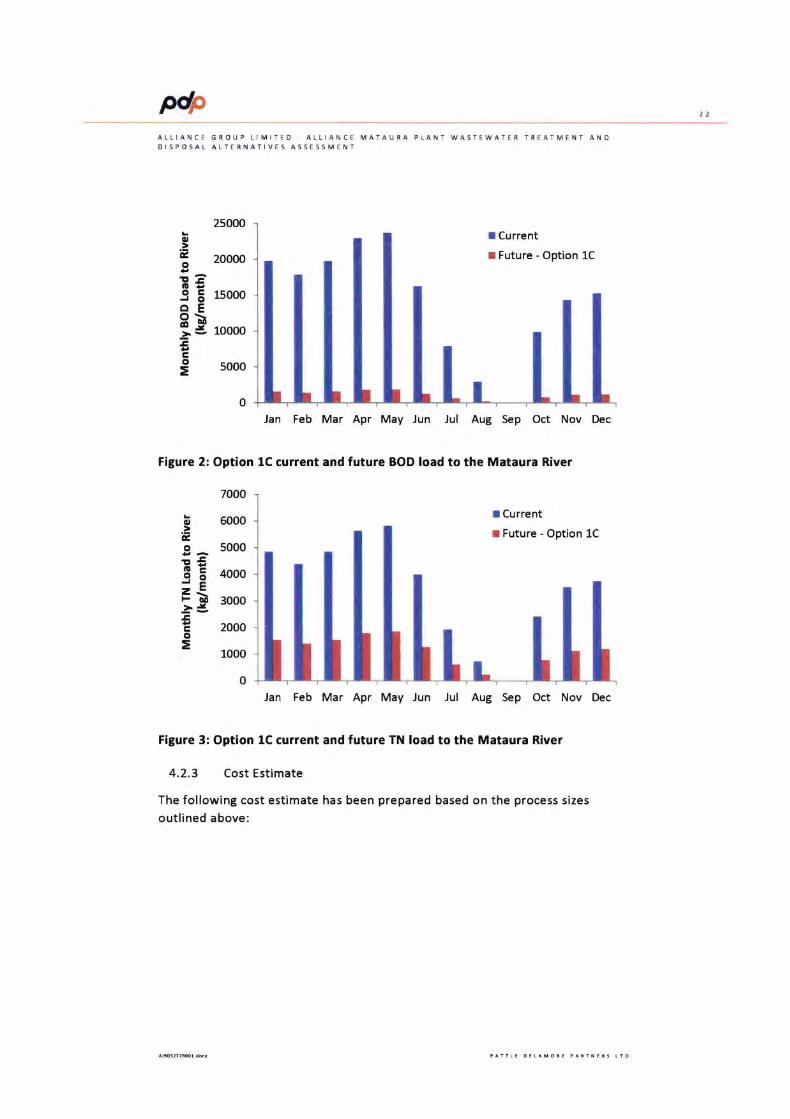
P* 72
ALLIANCE GROUP LIMITED . ALLIANCE MATAURA PLANT WASTEWATER TREATMENT ANODI5POSAL ALT€RNATIVES ASSESSMENT
I Current
I Future - Option lC
Jan Feb Mar Apr May Jun Jul Aug Sep Oct Nov Dec
Figure 2: Option lC current and future BOD load to the Mataura River
25000
20000
15000
10000
5000
o.zcot?IE€OEJOoE8BEo
=0
7000
E eooo.=OEo 5000r€q 5 rrcoo-EF E 3ooo-==aE 2oooo
= 1000
o
I Current
I Future - Option 1C
Jan Feb Mar Apr May Jun Jul Aug Sep Oct Nov Dec
Figure 3: Option lC current and future TN load to the Mataura River
4.2.3 Cost Estimate
The following cost estimate has been prepared based on the process sizes
outlined above:
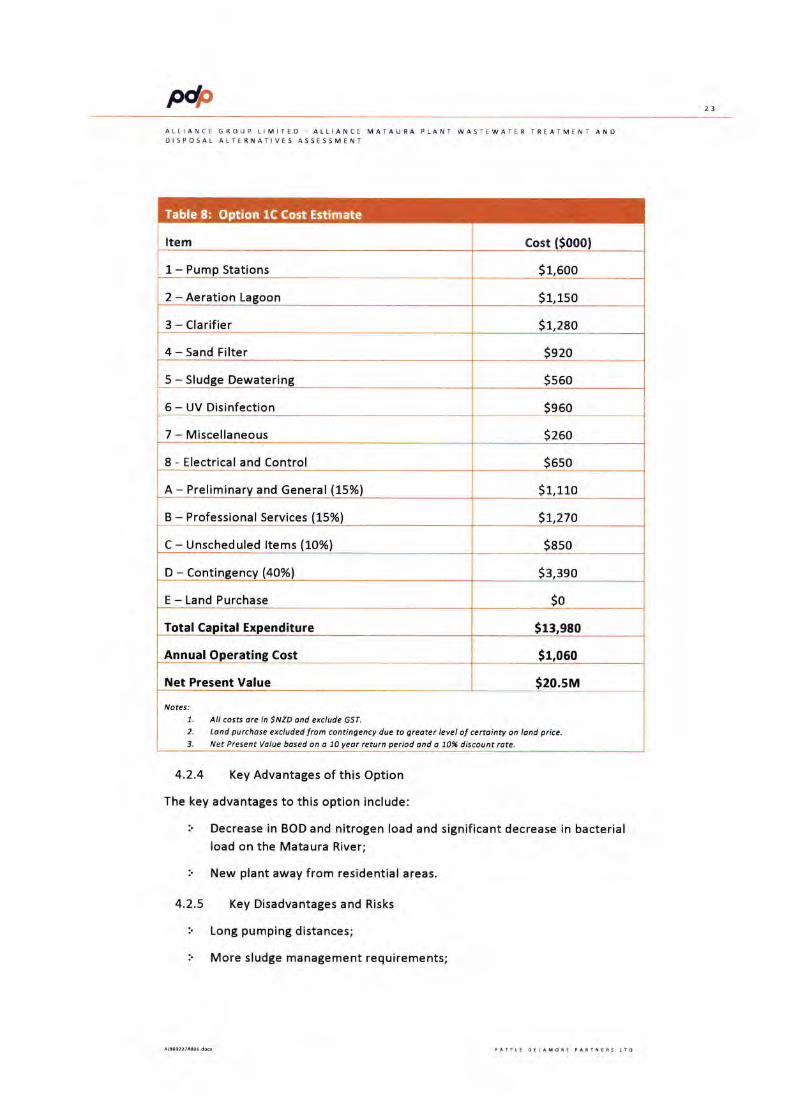
P* 23
ALLIANCE GROUP LIMITEO . ALLIANCE MATAURA PLANT WASTEWATER TREATMENT ANDDISPOSAI" ALTERNATIVES ASSESSMENl
4.2.4 Key Advantages of this Option
The key advantages to this option include:
i Decrease in BOD and nitrogen load and significant decrease in bacterialload on the Mataura River;
r New plant away from residential areas.
4.2.5 Key Disadvantages and Risks
i Long pumping distances;
i More sludge management requirements;
Item Cost (50001
1- Pump Stations S1,600
2 - Aeration Lagoon Sr,rso
3 - Clarifier S1,280
4 - Sand Filter Sszo
5 - Sludge Dewatering Ssso
6 - UV Disinfection Ssso
7 - Miscellaneous S2Go
8 - Electrical and Control Ssso
A - Preliminary and General (15%) S1,110
B - Professional Services (15%) St,zto
C - Unscheduled ltems (10%) Saso
D - Contincencv (40%) Sg,ggo
E - Land Purchase So
Tota! Capital Expenditure s13,980
Annual Operating Cost S1,o60
Net Present Value $20.sM
7. All costs ore in SNZD ond exclude GST.
2. Ldnd purchose excluded from contingency due to greoter level of certointy on lond price.i. Net Present Value bosed on o 70 yeor return period dnd d 70% discount rate.
Notes:
Table 8: on 1C Cost Estimate
PdP 24
ALLIANCE GROUP LIMITED , ALLIANCE MA'AURA PLANT WASTEWATER TREATMENT ANDDISPOSAL ALTERNATIVES ASSESSMENT
r High capital cost;
i Geotechnical limitations need to be investigated
4.3 Option 1D UV Disinfection
Option D is based on UV disinfection of the existing DAF treated wastewater.Trials were conducted in 2008 by PDP, which indicated low UV transmissivity andpotential risk of fouling due to polymer solids attraction. The polymer wouldpotentially need to be deactivated, with the conceptual design costings based onsand (or alternative media) filtration prior to the UV disinfection unit.
The system would likely be located on the site of the demolished lamb processingplant. lt has still been assumed that the sand filter will not reduce any
contaminant loads significantly enough for this to be considered as part of thisassessment.
4.3.L Process Description
The process description of the proposed Option lD WWTP is outlined as follows
The existing DAF treatment system will be retained and operated as it is
currently, with the exception of the proposed change to the white-watergeneration.
DAF wastewater will be combined in a wet-well and pumped to the sand
filter feed
A sand filter is proposed, to act as protection for the UV unitsdownstream, as there is no treatment of the wastewater following theDAFs it is expect the UV lamps would foul extremely quickly withfrequent automated cleaning required. The sand filter has thereforebeen proposed in order to remove additional solids and polymer flocsfrom the waste to significantly reduce the amount of maintenancerequired. The filter will have a working area of 18 m2, this is based on ahydraulic loading rate of O.2 mslm2lmin. Dirty backwash water will be
returned upstream of the DAF system.
The proposed UV system is based on work previously performed by PDP
when investigating tertiary treatment processes at Alliance Mataura, thesystem will feature 3 duty/duty/standby parallel reactors with theintention that peaks flows can be treated by 2 reactors. The reactors willeach be sized for a peak flow rate of 30 L/s and it has been assumed thatwith filtration upstream a design UVT of 25% is appropriate at this stage,
based UVT data provided by Alliance a mean combined waste stream UVT
of 25% was estimated. The additional standby reactor is proposed as a
contingency to account for the reduced upstream treatment and
increased risk of fouling.
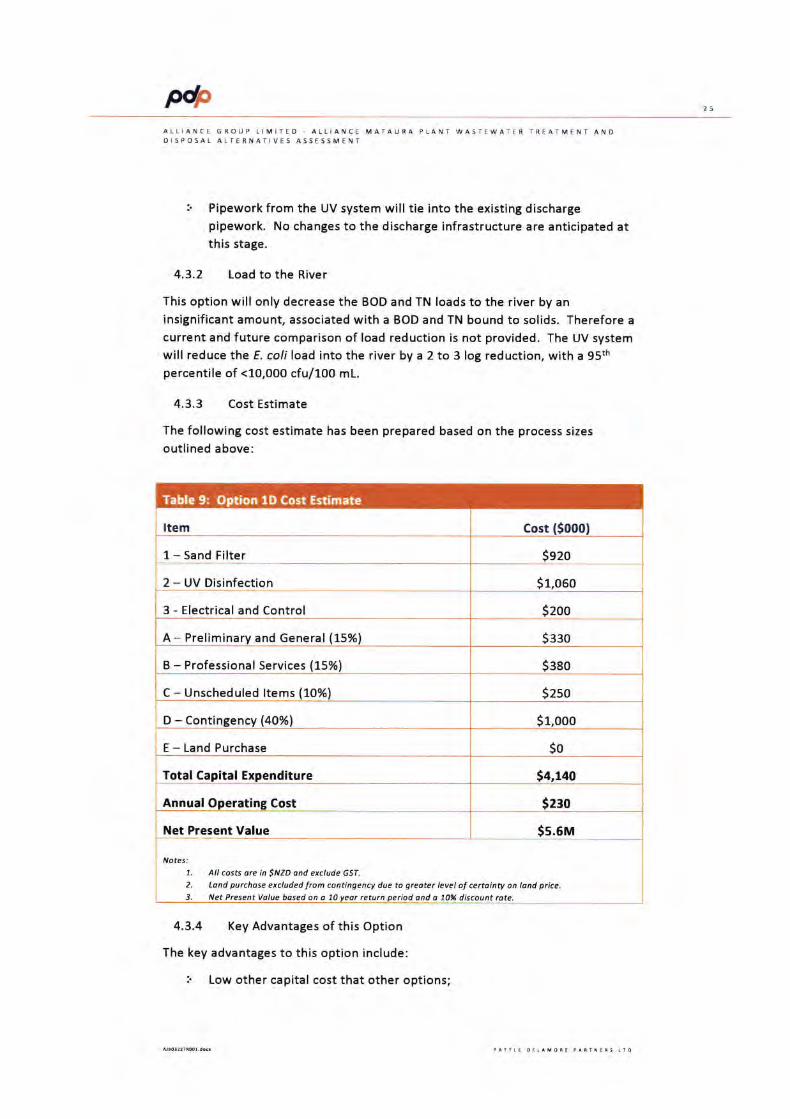
M 25
ALLIANCE GROUP LIMITED. ALLIANCE MATAURA PLANT WASTEWATER TREATM€NT ANDOISPOSAL ALTERNATIVES ASSESSMENT
Pipework from the UV system will tie into the existing dischargepipework. No changes to the discharge infrastructure are anticipated atthis stage.
4.3.2 Load to the River
This option will only decrease the BOD and TN loads to the river by aninsignificant amount, associated with a BOD and TN bound to solids. Therefore a
current and future comparison of load reduction is not provided. The UV systemwill reduce the E. coli load into the river by a 2 to 3 log reduction, with a 95thpercentile of <10,0O0 cfu/100 mL.
4.3.3 Cost Estimate
The following cost estimate has been prepared based on the process sizes
outlined above:
4.3.4 Key Advantages of this Option
The key advantages to this option include:
i Low other capital cost that other options;
Item Cost (50001
1- Sand Filter Se20
2 - UV Disinfection St,oeo
3 - Electrical and Control Szoo
A - Preliminary and General (15%) Ssso
B - Professional Services (15%) Ssgo
C - Unscheduled ltems (10%) S2so
D - Contingency (40%) Sr.ooo
E - Land Purchase So
Total Capital Expenditure 34,140
Annual Operating Cost s230
Net Present Value $s.snn
All costs dre in SNZD ond exclude GST.
Land purchose excluded from contingency due to gredter level of certointy on lond price.Net Present volue bdsed on a 70 yedr return period ond o 709d discount rdte.
7.
2.
3.
iVo tes:
Table 9: Option lD Cost Estimate
Np 26
ALLIANCE GROUP LIMITED ALLIANCE MATAURA PLANT WASTEWATER TREATMENT ANDDISPOSAL ALTERNATIVES ASSESSMENT
Significant reduction in bacterial concentrations in discharge, to address
one of the key contaminants;
l Plant can be located adjacent to existing WWTP;
] Potential interim upgrade step, leading to other discharge to riveroptions;
i No significant additional sludge generation.
4.3.5 Key Disadvantages and Risks
r lnsignificant reduction in total nitrogen load to the Mataura River;
r Risk of low UV transmissivity if not adequately filtered. Risk of rapid
blinding of the filters and bulb fouling due to the polymer content of thewastewater. Requires investigation of sand-filter performance atdeactivating polymer and subsequent UV transmissivity.
r Risk around UV transmissivity and bulb fouling needs to be investigated;
i May not be considered best practice on a longer term basis;
r Moderate difficulty in obtaining consents due to BOD load and nutrientload discharge to river remaining the same.
4.4 Option 1F Green Waste Biological Nitrogen Removal and UV
Disinfection
Option 1F incorporates biological treatment of the green waste stream, as thehigher contaminant load source, with 50% of the BOD load, TO% of theammoniacal nitrogen load and 60%of the total nitrogen load. Filtration and UV
disinfection will be performed on both waste streams.
It is not expected that the high pH of the green stream will inhibit biological
treatment so pH correction has not been accounted for in the costing of thisoption. Due to the reduced volume of the biological reactor, the location of thenew plant could be adjacent to the existing WWTP.
4.4,1 Process Description
The process description of the proposed Option 1F WWTP is outlined as follows:
l DAF wastewater from the green waste stream will be buffered in a wet-well prior to being pumped to the proposed treatment plant.
i The pumped wastewater will flow into two aerated tank reactors of a
combined volume of 4,500 m3 for BOD, ammoniacal-N and total N
treatment. The tanks are sized to maintain a sludge retention time of 20
days at a mixed liquor concentration of 3,000 mg/L. This provides a
P* 27
ALLIANCE GROUP LIMITED ALLIANCE MATAURA PLANT WASTEWATER TR€ATMENT ANDDISPOSAL ALTERNATIVES ASSESSMENT
mean hydraulic retention time of 2.5 days. Aeration would be providedby diffused aeration.
Process calculations have indicated the peak aeration requirement of thesystem is 120 kW; this is based on maximum hourly green waste flowsand maximum green waste BOD and ammoniacal-N concentrations.
A single circular clarifier will follow the aeration tank to provide solidsseparation. The clarifier will have a diameter of approximately 18 m, thisbased on a hydraulic overflow rate of 70 m3/m2ld. The RAS ratio has
been assumed to be 60% of the incoming wastewater flow, which iswithin the typical range used in similar treatment systems. The clarifierwould be of concrete construction with a mechanical launder, inletdiffuser, scraper system and walkway.
Waste Activated Sludge (WAS) will be wasted to a WAS storage tank, it isproposed that WAS be dewatered onsite in a decanter centrifuge and it isassumed the system used for disposing of DAF float sludge currently has
the capacity to dispose of the dewatered WAS. Daily dewatered WASproduction is expected to be 2.8 m3/d at 15% solids.
r Clarified wastewater will be combined with the existing DAF treated nongreen waste stream and then be filtered in a sand filter prior to UV
disinfection. lf low level solids carryover occurs from the clarifier, thefilter will help maintain UV transmissivity and minimise fouling of the UV
bulbs. The sand filter will also help remove residual solids from the non-green waste stream. Dirty backwash water will be returned upstream ofthe DAF system.
Based on the UV trial work previously performed by PDP at AllianceMataura, and the Alliance Pukeuri UV installation, it is estimated thatpeaks flows can be treated by 2 No. 40 low pressure, high output UV
lamp reactors (such as the Wedeco LBX 1000). The reactors would eachbe sized for a peak flow rate of 30 L/s and it has been assumed that withclarification and filtration upstream a design UVT of 50% is appropriate.
Following the UV system the treated green waste wastewater would bedischarged to the Mataura River. No changes to the dischargeinfrastructure are anticipated at the stage.
4.4.2 Load to the River
The expected load discharged to the river by this option has been estimated andcompared to the current load. These estimates have been based on assumedload reductions and target effluent concentrations stated previously of an overall50% reduction in BOD and a target treated green stream TN concentration of20 g/m3, expected days processing at the plant and current wastewater flows and
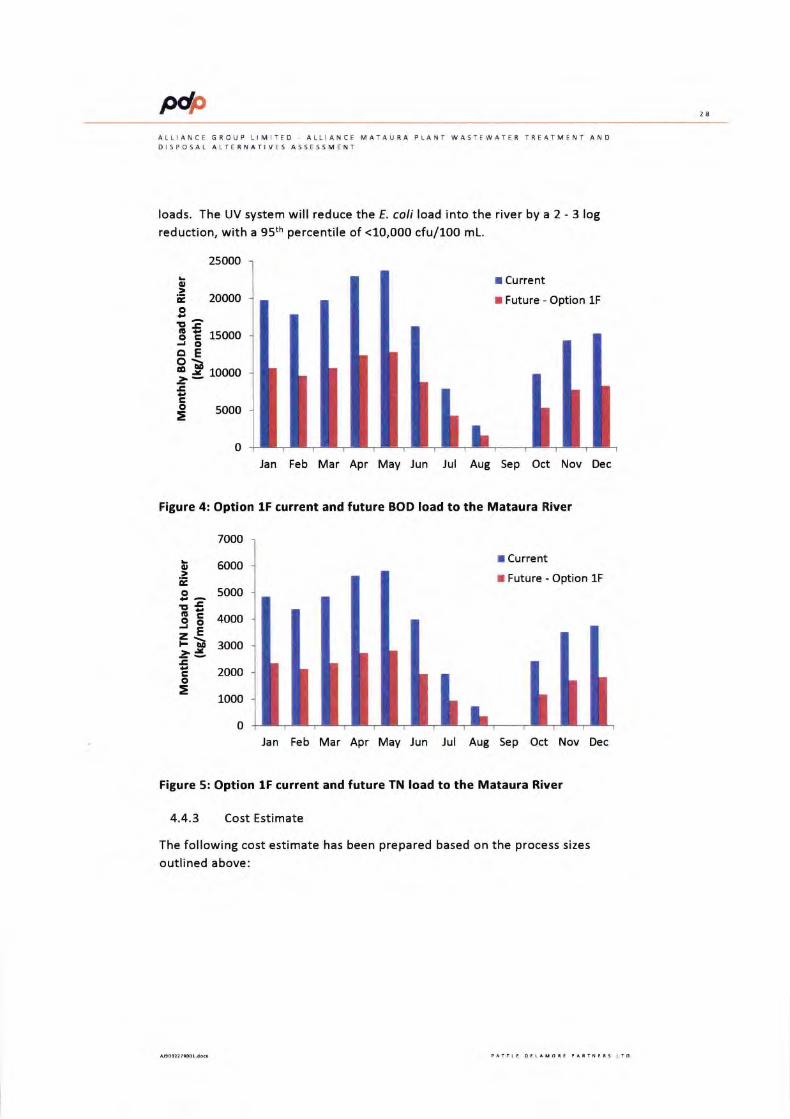
P* 2A
ALLIANCE GROUP LIMITED. ALIIANCE MATAURA PLANT WASTEWATER TREATMENT ANDOISPOSAL ALTERNATIVES ASSESSMENT
loads. The UV system will reduce the E coli load into the river by a 2 - 3 log
reduction, with a 95th percentile of <10,000 cfu/100 mL.
25000
I Current
I Future - Option 1F
15fi)O
10000
5000
0
Jan Feb Mar Apr May Jun Jul Aug Sep Oct Nov Dec
Figure 4: Option lF current and future BOD Ioad to the Mataura River
oEo
EEOC-,t ooE8Bsco
=
20(no
7000
b sooo.:Eo 50fi).G
E E 4ooo
!s 3ooo
E 2oooo
= 1000
0
I Current
I Future - Option lF
Jan Feb Mar Apr May Jun Jul Aug Sep Oct Nov Dec
Figure 5: Option 1F current and future TN load to the Mataura River
4.4.3 Cost Estimate
The following cost estimate has been prepared based on the process sizes
outlined above:
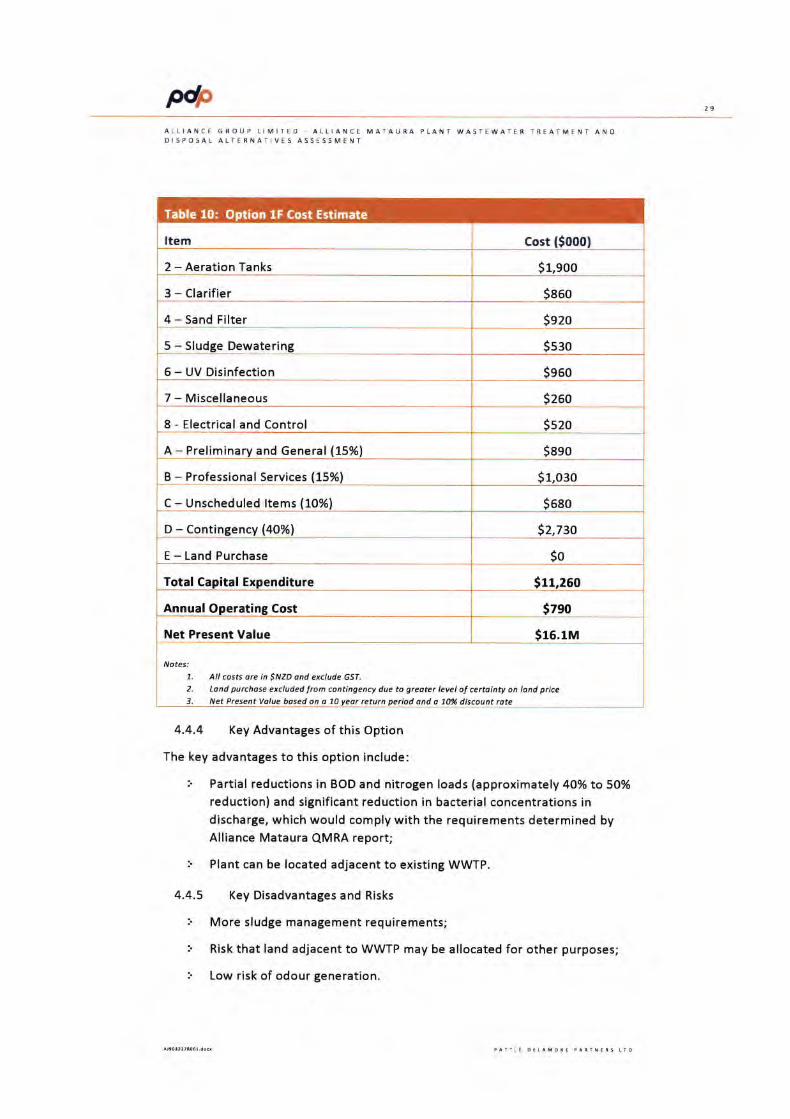
Pdp 2S
ALLIANCE GROUP LIMITED AI!IANCE MATAURA PLANT WASTEWATER TREATMENT ANDDISPOSAL ALTERNATIVES ASSESSMENT
4.4.4 Key Advantages of this Option
The key advantages to this option include:
r Partial reductions in BOD and nitrogen loads (approximately 40% to 50%
reduction) and significant reduction in bacterial concentrations indischarge, which would comply with the requirements determined byAlliance Mataura QMRA report;
r Plant can be located adjacent to existing WWTP.
4.4.5 Key Disadvantages and Risks
i More sludge management requirements;
i Risk that land adjacent to WWTP may be allocated for other purposes;
i Low risk of odour generation.
Item cost (50001
2 - Aeration Tanks S1,9oo
3 - Clarifier SsGo
4 - Sand Filter Ss2o
5 - Sludge Dewatering Ss30
6 - UV Disinfection Sgso
7 - Miscellaneous Szso
8 - Electrical and Control Ss20
A - Preliminary and General (15%) Seso
B - Professional Services (15%) S1,o3o
C - Unscheduled ltems (10%) Seeo
D - Contingency (4O%l 52,730
E - Land Purchase So
Total Capital Expenditure Su,260
Annual Operating Cost sTeo
Net Present Value Sre.rnn
7. All costs dre in SNZD ond exclude GSr.2. Lond purchose excluded from contingency due to greater level of certointy on lond price3. Net Present Volue bdsed on o 70 yeor retum period and a 70% discount rote
,Votesi
Table 10: 1F Cost Estimate
Np 30
ALLIANCE GROUP LIMITED . ALLIANCE MATAURA PLANT WASTEWATER TREATMENT ANODISPOSAL ALTERNATIVES ASSESSMENT
4.5 Option 4A Dual Discharge, Existing River location andlrrigation to Dairy Farms with No Treatment Prior to RiverDischarge
Option 4A is based on a dual discharge system, utilising the existing treatmentplant but with irrigation to third party owned dairy farm land, from October toApril, while discharging to the river predominantly from May to September. Withprocessing significantly reduced during wetter, mainly winter months, see Table
4, a much smaller volume of wastewater would be discharged to the river,estimated at 30% of the total annual wastewater volume.
Soil moisture models based on irrigation only during the summer months showedthat an irrigation rate of 555 mm/yr could be achieved meaning a land area of150 hectares would be required, this is a slightly larger area then estimatedduring the longlist assessment due to a more detailed approached used.
As stated previously, agreement with the dairy farm owners and dairy companiesis required for the operation of this system. Feasibility of this has not been
tested and it may be difficult to find 3 suitably sized farms located closelytogether, in order to allow a single irrigation system to be built. Withoutfarmland in proximity, the cost of this option could be expected to escalate.
4.5.1 System Location
The possible locations were evaluated using GIS layers to determine larger lots ofland (meaning fewer farmers to deal with) that were in flat areas with moderateto well-draining soils.
Figure 8 shows the suitability of farmland in the vicinity of the processing plantthat could be utilised for land treatment.
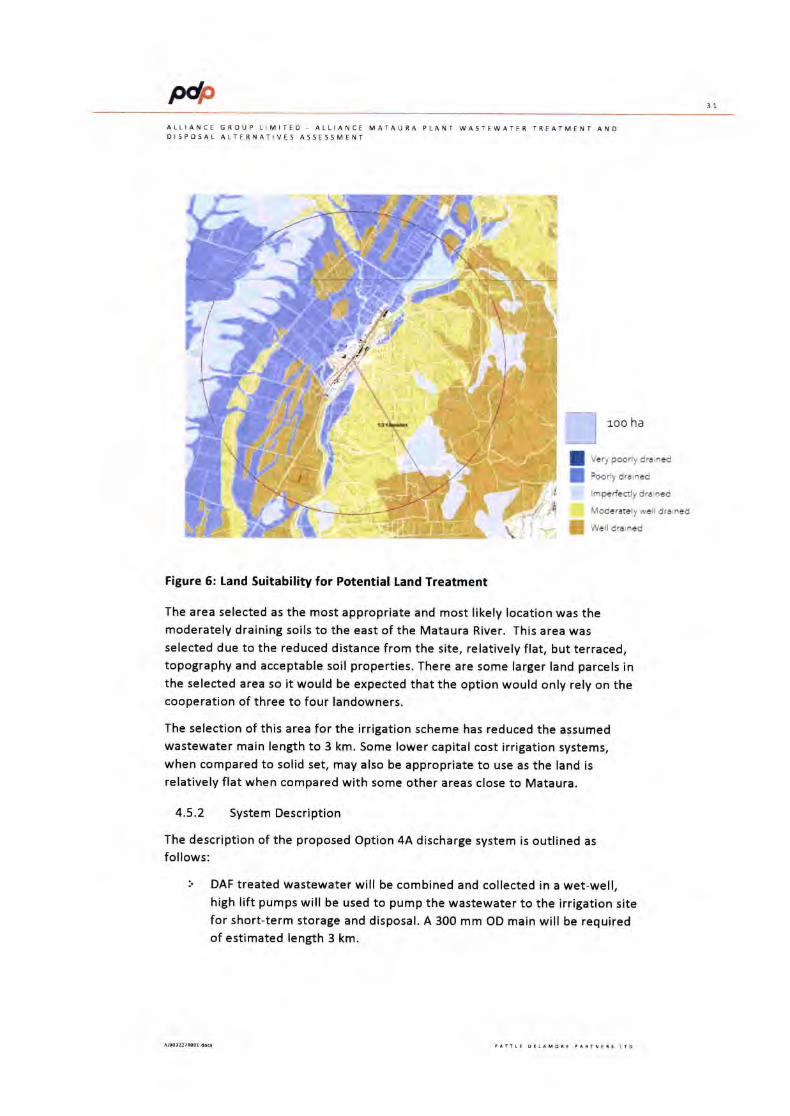
P* 31
ALLIANCE GROUP LIMITED - ALLIANCE MATAURA PLANT wASTEwATER TREATMENT Ai\iDDISPOSAL ALT€RNATIVES ASSESSMENT
.E
(
l 1oo ha
| "ncrygxeyara*d
f eoo;y ao,ncc
lmpcicctly dratncd
Moderatcly ccll drtrned
] w:it drr,acd
.i
A
Figure 6: Land Suitability for Potential land Treatment
The area selected as the most appropriate and most likely location was themoderately draining soils to the east of the Mataura River. This area wasselected due to the reduced distance from the site, relatively flat, but terraced,topography and acceptable soil properties. There are some larger land parcels inthe selected area so it would be expected that the option would only rely on thecooperation of three to four landowners.
The selection of this area for the irrigation scheme has reduced the assumedwastewater main length to 3 km. Some lower capital cost irrigation systems,when compared to solid set, may also be appropriate to use as the land isrelatively flat when compared with some other areas close to Mataura.
4.5.2 System Description
The description of the proposed Option 4A discharge system is outlined as
follows:
l DAF treated wastewater will be combined and collected in a wet-well,high lift pumps will be used to pump the wastewater to the irrigation sitefor short-term storage and disposal. A 300 mm OD main will be requiredof estimated length 3 km.
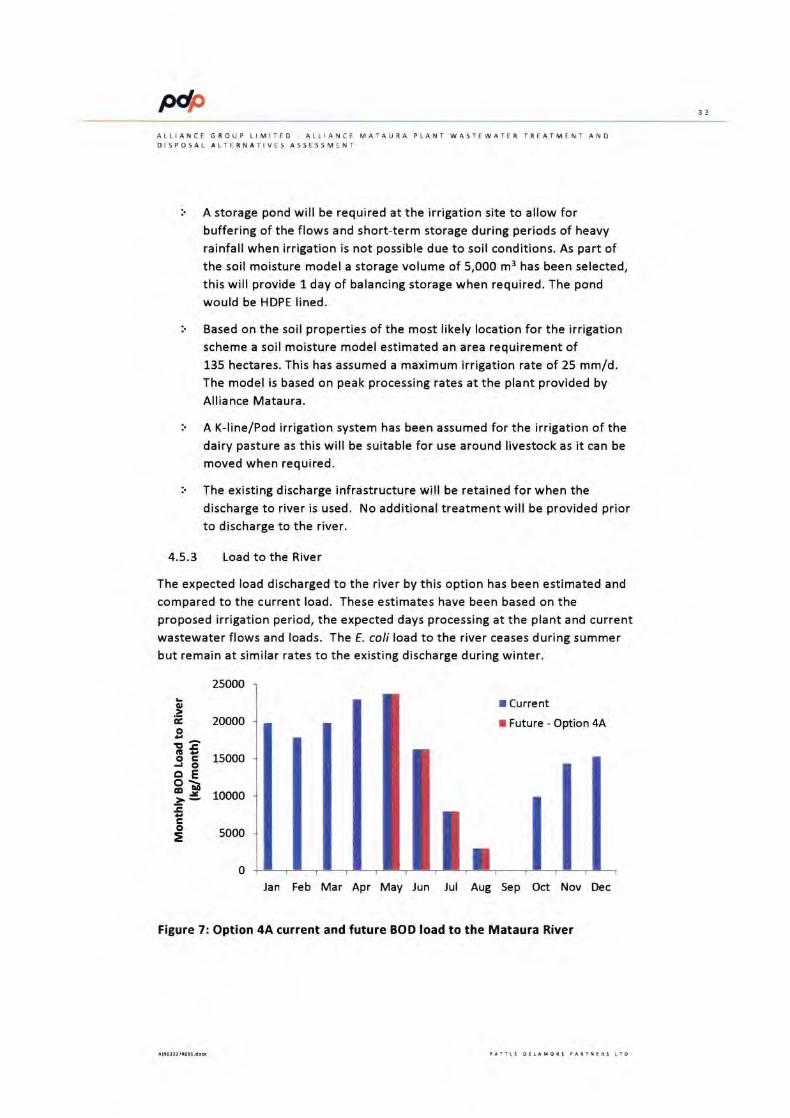
MALLIAI{CE GROUP LIMITED . ALLIANCE MATAURA PLANT WASTEWATER TREATMENT ANODISPOSAT ALTERNATIVES ASSESSMENT
l A storage pond will be required at the irrigation site to allow forbuffering of the flows and short-term storage during periods of heavy
rainfall when irrigation is not possible due to soil conditions. As part ofthe soil moisture model a storage volume of 5,000 m3 has been selected,this will provide 1 day of balancing storage when required. The pond
would be HDPE lined.
Based on the soil properties of the most likely location for the irrigationscheme a soil moisture model estimated an area requirement of135 hectares. This has assumed a maximum irrigation rate of 25 mmld.The model is based on peak processing rates at the plant provided by
Alliance Mataura.
A K-line/Pod irrigation system has been assumed for the irrigation of thedairy pasture as this will be suitable for use around livestock as it can be
moved when required.
The existing discharge infrastructure will be retained for when thedischarge to river is used. No additional treatment will be provided priorto discharge to the river.
4.5.3 Load to the River
The expected load discharged to the river by this option has been estimated and
compared to the current load. These estimates have been based on theproposed irrigation period, the expected days processing at the plant and currentwastewater flows and loads. The E. coli load to the river ceases during summerbut remain at similar rates to the existing discharge during winter.
25000
.,OE
o
EEotrJO6E9bgo
=
20000
I Current
I Future - Option 4A
15000
10000
5000
o
Jan Feb Mar Apr May Jun Jul Aug Sep Oct Nov Dec
Figure 7: Option 4A current and future BOD load to the Mataura River
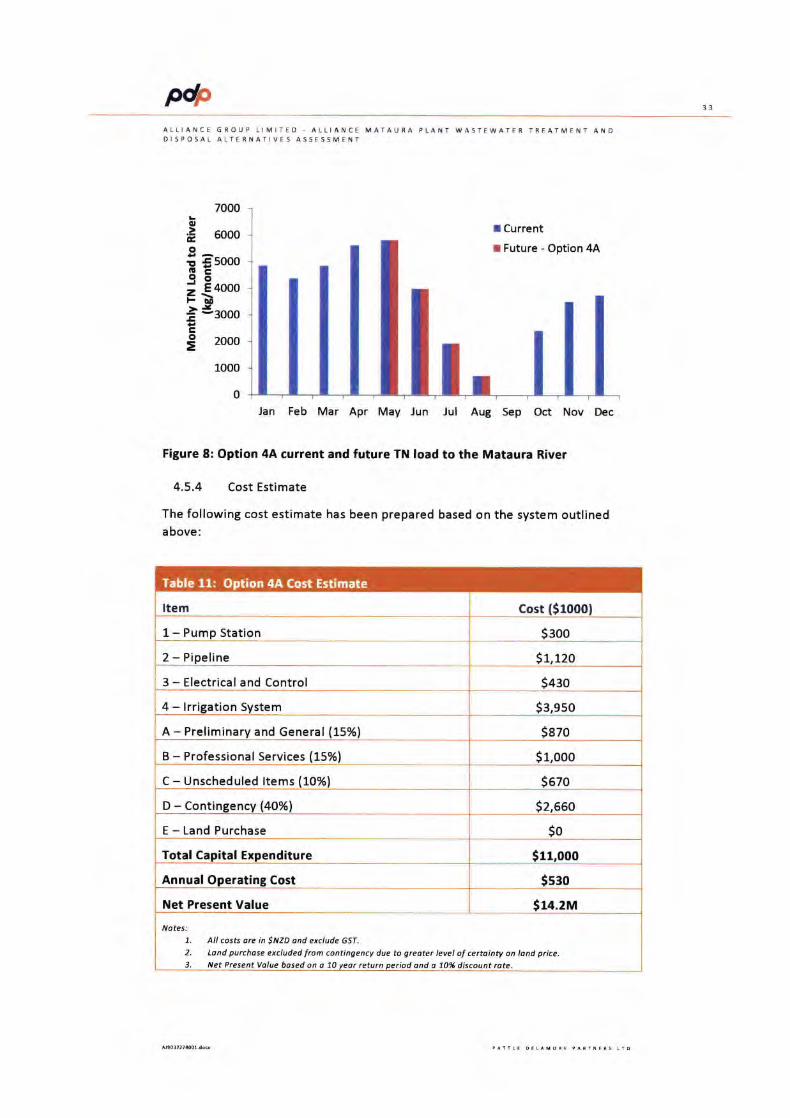
P*ALLIANCE GROUP LIMITEO. ALLIANCE MATAURA PLANT WAST€WAT€R
'REATMENT AND
DISPOSAL ALTERNATIVES ASSESSMENT
I Current
I Future - Option 44
2000
1000
0Jan Feb Mar Apr May Jun Jul Aug Sep Oct Nov Dec
Figure 8: Option 4A current and future TN load to the Mataura River
4.5.4 Cost Estimate
The following cost estimate has been prepared based on the system outlinedabove:
o.zCoEa!oz
tro
=
7000
6000
$soootroE 4000EJ-3000
Item Cost (S10001
1- Pump Station S3oo
2 - Pipeline S1,120
3 - Electrical and Control S+so
4 - lrrigation System Ss,gso
A - Preliminary and General (15%) S870
B - Professional Services (15%) St,ooo
C - Unscheduled ltems (10%) Sezo
D - Continsencv (40%) Sz,oeo
E - Land Purchase So
Total Capital Expenditure Su,ooo
Annual Operating Cost Ssso
Net Present Value S14.2M
7. All costs orc in SNZD dnd exclude cST.
2. Ldnd purchdse excluded from contingency due to greoter level ol certdinty on land price.3. Net Present Volue bosed on a 10 year rcturn oeriod ond a 70% discount rote.
IVotes:
Table 11: O 4A Cost Estimate
Pdp 34
ALLIANCE GROUP LIMITED ALLIANCE MATAURA PLANT WASTEWATER TREATMENT ANDDISPOSAL ALTERNATIVES ASSESSMENT
4.5.5 Key Advantages
The key advantages to this option include:
r Low volume of wastewater discharged to Mataura River during summermonths;
l Decrease in annual contaminant load to river;
i No additional wastewater treatment requirements and no additionalsludge generation;
i No land purchase required.
4.5.6 Key Disadvantages and Risks
The operation of a discharge to land system can be complex and willrequire significantly more operator involvement than the currentdischarge system;
This option relies on the third-party owners of the land that is to be
irrigated, this may lead to difficulties in the future if ownership changes
or new agreements need to be made;
i Wastewater treated to the same standard as currently will still be
discharged to the river during winter;
r During wet weather periods in the summer wastewater will still need tobe discharged to the river for approximately 5 to 10 days over theseason;
i Will require investment in third party owned farms;
i Consultation and agreement with the dairy company that receives themilk from the farms that are to be irrigated is required;
i May result in concerns for neighbours to the land disposal areas;
r There may be significant difficulty in finding suitable land for irrigation.The flatter land areas around Mataura do not have soil with favourableproperties for irrigation. Well-drained soils are situated to the east ofthe site but are in areas with steeper, terraced topography, whichdecreases the available irrigation area. Finding enough suitable pockets
of land that are in close proximity to each other, with agreement fromland owners may not be possible without increasing the complexity and
cost of the system.
M 35
ALLiANCE GROUP I. IMITEO ALLIANCE MATAURA PLANT WASTEWATER TREATMENT ANDDISPOSAL ALTERNATIVES ASSESSMENT
4.6 Option 5A Dual Discharge, Existing River Location andlrrigation to Cut and Carry with No Treatment Prior to RiverDischarge
Option 5A is based on irrigation of treated wastewater to a cut and carry systemon land purchased and owned by Alliance. This is the only option that willrequire land purchase so there is a significantly higher capital cost; however a
significant proportion of the cost is invested in the land.
As with option 4A the dual discharge system has been assumed to operatebetween October and April summer, with discharge to the Mataura Riverpredominantly from May to September. The land requirement is hydraulicallylimited so an area of 135 hectares is still required.
A cut and carry system offers two advantages, the first being the lack of relianceon third parties to enable the discharge, this will mean there is less riskassociated with the long term operation of the system. The second advantage isthe income generated from the cut and carry crop, this will offset a significationportion of the operating costs associated with the new disposal system. The costestimate has shown that 50% off the operating costs could be recovered with thissystem. This has been accounted for and shown in the cost estimate presentedin Table 12.
4.6.7 System Description
The system proposed will be same as that proposed for Option 4A, see section4.5.2. The only difference will be that the system will be a cut and carry systemon Alliance owned land. The different land use could potentially allow a morecost effective irrigation system to be installed, such as a centre pivot system,however, due to the rolling nature of the some areas of terrain around Mataura,a solid set system has been assumed for pricing purposes as a system with loweroperating costs but higher capital costs is more suited to use on land owned byAlliance.
4.6.2 System Location
The same criteria for determining a suitable land area were used for both option4A and 5A therefore the same possible locations are proposed, see Figure 8. Thesame moderately draining solids have been selected for the scheme.
As with option 4A it is estimated that three to four land parcels will need to bepurchased to make up the 135 ha of active irrigation area.
4.6.3 Load to the River
The expected load discharged to the river by this option will be the same as
option 4A, refer to Figure 9 and Figure 10.
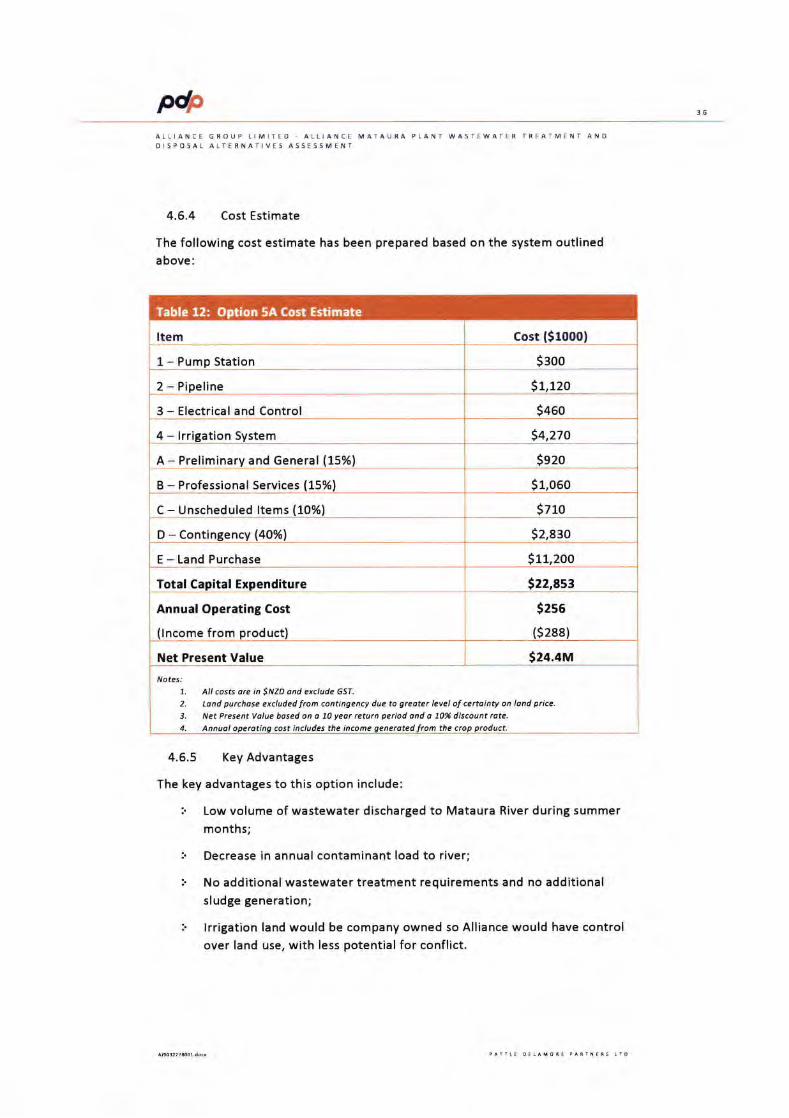
P* 36
ALTIANCE GROUP LIMITED - ALLIANCE MATAURA PLANT WASTEWATER TREATMENT ANODISPOSAL ALTERNATIVES ASSESSMENT
4.6.4 Cost Estimate
The following cost estimate has been prepared based on the system outlinedabove:
4.5.5 Key Advantages
The key advantages to this option include:
r Low volume of wastewater discharged to Mataura River during summer
months;
l Decrease in annual contaminant load to river;
r No additional wastewater treatment requirements and no additionalsludge generation;
3 lrrigation land would be company owned so Alliance would have controlover land use, with less potential for conflict.
Item Cost (S10001
1- Pump Station S3oo
2 - Pipeline Sr,rzo
3 - Electrical and Control S4Go
4 - lrrigation System 54,27O
SszoA - Preliminary and General (15%)
B - Professional Services (15%) S1,060
C - Unscheduled ltems (10%) S710
Sz,asoD - Contingency (40%)
E - Land Purchase S11,2oo
Total Capital Expenditure s22,853
s2s6
(s288)
AnnualOperating Cost
(lncome from product)
Net Present Value
All costs ore in SNzD and exclude GST.
Land purchdse excluded from contingency due to greotet level ol certointy on lond price.
Net Present vdlue bdsed on d 70 yedr return period ond o 70% discount rut".
524.4M
7.
2.
i.4.
Notes:
Annuol cost includes the income the
Table 12: Option 5A Cost Estimate
P* 37
ALLIANCE GBOUP LIMITED - ALLIANCE MATAURA PLANT WASTEWATER TREATMENT ANDDISPOSAL ALTERNATIVES ASSESSMENT
4.6.6 Key Disadvantages and Risks
The operation of a discharge to land system can be complex and willrequire significantly more operator involvement than the currentdischarge system;
Large capital cost required for land purchase irrigation system set up;
Wastewater treated to the same standard as currently will still bedischarged to the river during winter;
During wet weather periods in the summer wastewater will still need tobe discharged to the river for approximately 5 to 10 days;
There may be significant difficulty in finding suitable land for irrigation.The flatter land areas around Mataura do not have soil with favourableproperties for irrigation. Well drained soils are found to the east of theplant and are in areas with steeper, terraced topography. This willsignificantly decrease the potential irrigable area. Finding enoughsuitable pockets of land that are near each other and able to bepurchased may not be possible without increasing the complexity andcost of the system.
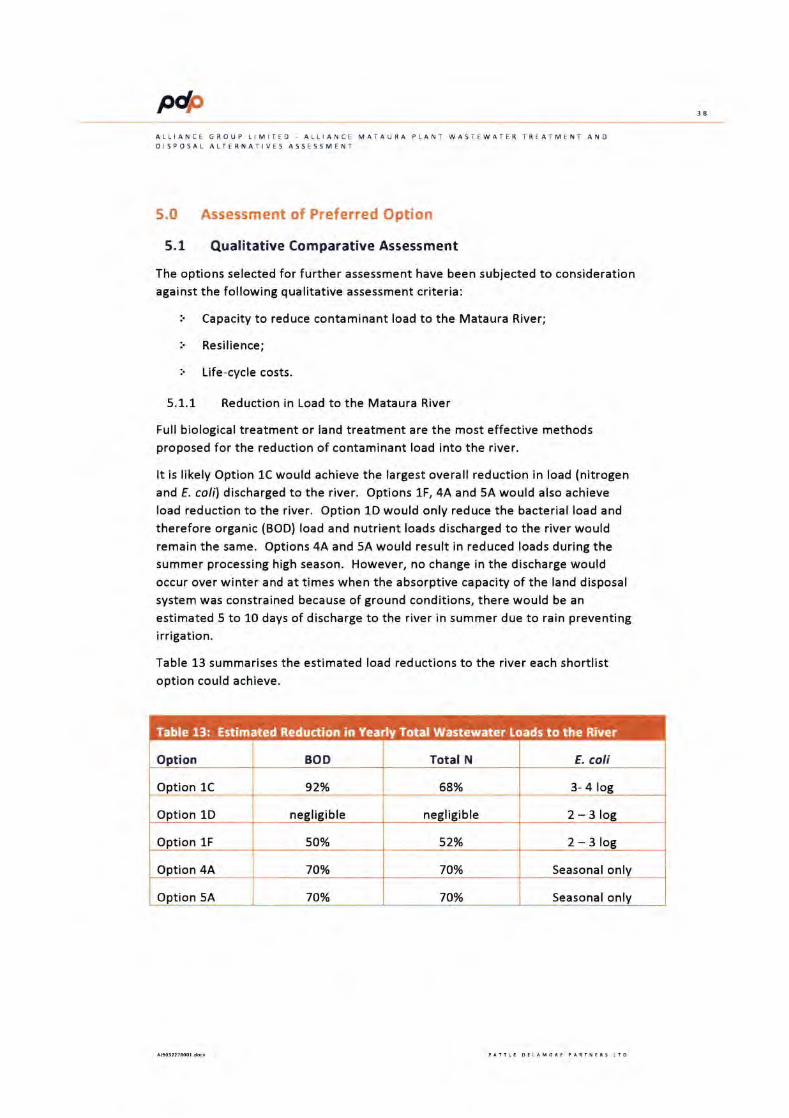
M 3a
ALLIANCE GROUP LIMITED. ALLIANCE MATAURA PLANT WASTEWATER TREATMENT ANODISPOSAL ALTERNATIVES ASSESSMENT
5.0 Assessment of Preferred Option
5.1 QualitativeComparativeAssessment
The options selected for further assessment have been subjected to considerationagainst the following qualitative assessment criteria:
l Capacity to reduce contaminant load to the Mataura River;
r Resilience;
i Life-cycle costs.
5.1.1 Reduction in Load to the Mataura River
Full biological treatment or land treatment are the most effective methodsproposed for the reduction of contaminant load into the river.
It is likely Option 1C would achieve the largest overall reduction in load (nitrogenand E. colil discharged to the river. Options 1F, 4A and 5A would also achieve
load reduction to the river. Option lD would only reduce the bacterial load and
therefore organic (BOD) load and nutrient loads discharged to the river wouldremain the same. Options 4A and 5A would result in reduced loads during thesummer processing high season. However, no change in the discharge wouldoccur over winter and at times when the absorptive capacity of the land disposal
system was constrained because of ground conditions, there would be an
estimated 5 to 10 days of discharge to the river in summer due to rain preventingirrigation.
Table 13 summarises the estimated load reductions to the river each shortlistoption could achieve.
Option BOD Total N E. coli
Option 1C 92% 68% 3- 4 log
Option 1D negligible negligible 2 - 3loe
Option 1F 50% 52% 2- 3loe
Option 4A 70% 70% Seasonal only
Option 5A 70% 70% Seasonal only
Table 13: Estimated Reduction in Yearly Total Wastewater loads to the River
M 39
ATLIANCE GROUP LIMITED - ALLIANCE MATAURA PLANT WASTEWATER TREATMENT ANDDISPOSAI ALTERNATIVES ASSESSMENT
5.1.2 Resilience
The dual discharge options 4A and 5A offer a significant amount of resilience as
the river discharge could be used as an alternative disposal method if there wereoperational issues experienced by the irrigation system.
The river disposal options only have one disposal method so options thatdischarge to the river and require a high level of treatment (Option 1C and to a
lesser extent, 1F) have lower resilience should non-compliances occur. Anappropriate level of redundancy has been accounted for in the outline designsand costings of the systems to ensure the risk of failure for the treatmentsystems is minimised to a suitable level.
There may be a slightly greater risk to the resilience of option lC due to itsreliance on the 2 No. pump stations required to convey the wastewater to andfrom the treatment locations and a single pipeline in both directions. lf thesepump stations were to become inoperable or a pipeline temporarily be
unavailable due to urgent maintenance, then no further treatment could be
provided to the wastewater prior to discharge for the period of failure. Whilststandby pumps significantly reduce this risk, it is still present.
There is an additional resilience risk to Option 1D, that the sand filter upstreamof the UV units will blind quickly due to the polymer in the waste and lack ofupstream treatment. A 3-dimensional filter, such as a sand-filter, has beenutilised in this assessment as it is expected to perform better that the 2
dimensions screen that was utilised in trials in 2005 (PDP 2005). While rapidblinding of a filter is still a risk, and back washing can be utilised to manage thisto a certain extent, this risk can be quantified and mitigated with the use of pilottrials to test the rate at which the filter would blind, and if necessary the use ofalternative filtration technologies such as suspended bed system prior tofiltration.
5.1.3 Life-cycle Costs
The financial implications to Alliance for each option are an importantconsideration as the cost of the final option can have big impacts on the viabilityof operating the plant. lt is therefore, important to consider the cost of eachoption and compare this against the other attributes of each option.
Option 5A represents the highest net present value (NPV) lifecycle cost of theshortlisted options. This is due to the significant land purchase required. Option1C is also a high cost option due to the high level of treatment provided andsignificant pumping and pipeline costs.
Most of the other options have very similar NPV estimates with the exception ofOption 1D which has a significantly lower cost.
A summary of the option life-cycle costs has been provided in Table 14.
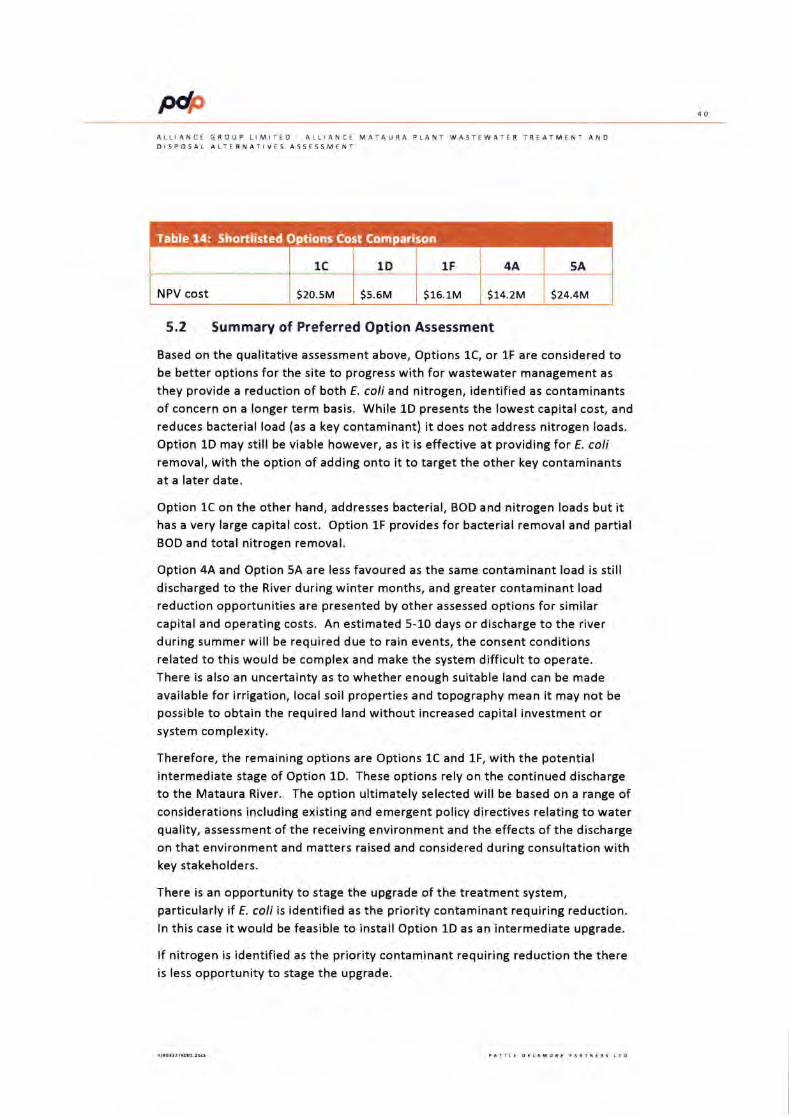
Np 40
1C 1D 1F 4A 5A
NPV cost s20.sM ss.6M s15.1M S14.2M 524.4M
Table 14: Shortlisted ons Cost Com son
ALLIANCE GROUP LIMITED ALLIANCE MATAURA PLANT WASTEWATER TREATMENT A}iDDISPOSAL ALTERNATIVES ASSESSMENT
5.2 Summary of Preferred Option Assessment
Based on the qualitative assessment above, Options lC, or 1F are considered tobe better options for the site to progress with for wastewater management as
they provide a reduction of both E. coli and nitrogen, identified as contaminantsof concern on a longer term basis. While 1D presents the lowest capital cost, and
reduces bacterial load (as a key contaminant) it does not address nitrogen loads.Option lD may still be viable however, as it is effective at providing f or E. coliremoval, with the option of adding onto it to target the other key contaminantsat a later date.
Option 1C on the other hand, addresses bacterial, BOD and nitrogen loads but ithas a very large capital cost. Option lF provides for bacterial removal and partialBOD and total nitrogen removal.
Option 4A and Option 5A are less favoured as the same contaminant load is stilldischarged to the River during winter months, and greater contaminant load
reduction opportunities are presented by other assessed options for similarcapital and operating costs. An estimated 5-10 days or discharge to the riverduring summer will be required due to rain events, the consent conditionsrelated to this would be complex and make the system difficult to operate.There is also an uncertainty as to whether enough suitable land can be made
available for irrigation, local soil properties and topography mean it may not be
possible to obtain the required land without increased capital investment orsystem complexity.
Therefore, the remaining options are Options lC and lF, with the potentialintermediate stage of Option lD. These options rely on the continued dischargeto the Mataura River. The option ultimately selected will be based on a range ofconsiderations including existing and emergent policy directives relating to waterquality, assessment of the receiving environment and the effects of the dischargeon that environment and matters raised and considered during consultation withkey stakeholders.
There is an opportunity to stage the upgrade of the treatment system,particularly if E. coli is identified as the priority contaminant requiring reduction.ln this case it would be feasible to install Option lD as an intermediate upgrade.
lf nitrogen is identified as the priority contaminant requiring reduction the thereis less opportunity to stage the upgrade.
M 47
ALLIANCE GROUP LIMITEO. ALLIANCE MATAURA PLANT WASTEWATER TREATMENT ANDDISPOSAL ALTERNATIVES ASSISSMENT
5.3 Upgrade Approach
Based on the assessment the existing wastewater management system and thepotential alternatives options, the following upgrade approach is recommended:
1. Address existing system resilience issues, including:minimising cross contamination risk points, re-routing pipes away fromhydro-race and undertaking structural maintenance of the DAF systems;
2, lmplement water reduction opportunities, including:recycling of treated wastewater for white water generation;
3. Programme towards treatment plant upgrades, in line with the outcomesof the consenting process with either:
lf there is no identified priority between contaminants of concern(E. coli and nitrogenl or E. coli is identified as the prioritycontaminant of concern, upgrade the wastewater treatment plantwith a staged approach, with Option lD implemented followed byOption 1C or 1F at a later date (if a staged approach is preferred).There would be little additional cost for a staged approach over an
un-stage approach. There is a risk of rapid filter blinding, due topolymer in the wastewater, and this risk needs to be assessed withpilot scale trial. lf necessary, additional mitigation measures, such as
mobile bed polymer deactivation, may be required.
b. lf nitrogen is identified as the priority contaminant of concern thenthere is less benefit associated with a staged upgrade due to theincreased initial capital expenditure, therefore, the upgrade wouldincorporate the complete system of either Option lC or 1F.
c. lf phosphorus is identified as an additional contaminant of concern,requiring additional removal beyond what the site is alreadyachieving, then chemical phosphorus removal, with the use of alumdosing, can be installed as part of the upgrades either upstream ofthe sand filter or clarifier. The additional capital cost of this upgradewould be negligible (in comparison to the wider capital costs) andthe additional OPEX would be approximately S100k per year.
P* 4Z
ALLIANCE GROUP LIMITED - ALLIANCE MATAURA PLANT WASTEWATER TREATMENT ANDDISPOSAL ALTERNATIVES ASSESSMENT
5.0 ConclusionsandRecommendations
For the assessment of potential alternative wastewater management options forthe Alliance Mataura site, options incorporating continued discharge to theMataura River, irrigation to land, or a dual discharge combination, and discharge
to trade waste were considered.
The selected options for further assessment included continued discharge oftreated or partially treated wastewater to the river and irrigation to land duringsummer months, as a dual discharge combination with discharge to the riverduring winter months.
A qualitative assessment was conducted to compare the shortlisted options.
Continued discharge of wastewater to the Mataura River was identified as thepreferred option but with a reduction of both nitrogen and E. coli, based on
Option 1C or Option 1F. With these two options there is the potential to developOption 1D as an intermediate stage.
Of the selected options, selection of the preferred approach going forwarddepends on a range of considerations including existing and emergent policy
directives relating to water quality, assessment of the receiving environment and
the effects of the discharge on that environment and matters raised and
considered during consultation with key stakeholders.
lf E. coli is identified as the priority contaminant requiring reduction,then there is the opportunity to install Option lD as an intermediateupgrade.
lf nitrogen is identified as the priority contaminant requiring reductionthen there is less opportunity to stage the upgrade.
ldentification of the priority contaminant of concern (E. coli or nitrogen) will help
clarify the upgrade approach and timing, however, the following overall
approach is recommended.
1. Address system resilience issues, including:minimising cross contamination risk points, removing pipes from hydro-
race and undertaking maintenance of the DAF systems;
2. lmplement water reduction opportunities, including:recycling of treated wastewater for white water generation;
3. Programme towards treatment plant upgrades, in line with theconsenting process with either:
lf there is no identified priority between contaminants of concern(E. coli and nitrogenl or E. coli is identified as the prioritycontaminant of concern, upgrade the wastewater treatment plant
with a staged approach, with Option 1D implemented followed by
P* 43
ALLIANCE GROUP I-IMITED. ALLIANCE MATAURA PLANT WASTEWATER TREATMENT ANOOISPOSAL ALTERNATIVES ASSESSMENT
Option 1C or lF at a later date (if a staged approach is preferred).There would be little additional cost for a staged approach, over anun-stage approach however, there is a risk of rapid filter blinding,due to polymer in the wastewater, and this risk needs to be assessedwith pilot scale trial. lf necessary, additional mitigation measures,such as mobile bed polymer deactivation, may be required.
b. lf nitrogen is identified as the priority contaminant of concern, thenthere is less benefit associated with a staged upgrade due to theincreased initial capital expenditure, therefore, the upgrade wouldincorporate the complete system of either Option lC or 1F.
c. lf phosphorus is identified as an additional contaminant of concern,then chemical phosphorus removal, with the use of alum dosing, canbe installed as part of the upgrades either upstream of the sand filteror clarifier. The additional capital cost of this upgrade would benegligible while the additional OPEX would be approximately $tOOkper year.
P* 44
ALLIANCE GROUP LIMITED - AIIIANCE MATAURA PLAI{T WASTEWATER TREATMENT ANDDISPOSAL ALTE RNATIVES ASSESSMET{T
7.O References
Freshwater Solutions Ltd 2019. Assessment of the Effects of Allionce Matoura'sDischorges ond Water Toke on Motoura River ond Toetoe Estuary.
Submitted to Alliance Group Ltd (DRAFT). March 2019.
Streamlined Environmental 2019. Quontitative Microbial Risk Assessment Ior thedischarge of treoted meat processing factory wostewoter into the MotouraRiver. Report AES1704 Prepared for Alliance Group/ Aquatic EnvironmentalSciences Ltd.

L
-l
APPENDIX 8
Alliance Mataura Plant - Water Useand Wastewater ManagementResilience Assessment

pd*PATTLE DELAMORE PARTNERS LTD
Alliance Mataura Plant - Water Use andWastewater Ma nagement ResilienceAssess m e nt
Alliance Group Limited
Auckland Tauranga Wellington Christchurch
solutions/or yo ur e nvironment :.
Alliance Mataura Plant -Water Use and WastewaterManagement Resilience
Assess me nt
!' Prepared for
Alliance Group Limited
] May 2019
MPATTI.E OELAMORE PARTTI'ERS I.TD
Level 5, PDP House
235 Broadway, Newmarket, Auckland 1023
PO Box 9528, Auckland 1149, New Zealand
Tel +64 9 523 6900 Far +64 9 523 6901W e bs ite L!!prLL4[s:!dp:!9:!!Auckland Tauranga Wellington Christchurch
@eerOltrtiOrf* |::t it:||t ,:i ,.,t.,t.t,n.t.I
P*ATTIAI'CE GROUP IIMITED . ATTIAIICE MATAURA PIAiIT - WATEi USE A'ID WASTEWATERMAT{A6EM EIIT iESITI ENCE AS5ES'ME'{T
Quality Control Sheet
TITLE Alllance Mataura Plant - Water Use and Wastewater Management Resllience
Assessment
CIIENT Alllance Group Llmlted
vERStOt{ Flnal
ISSUE DATE 31 May 2019
JoB REFERENcz Al9Ot227
souRcE FrrE(sl AJ903227RO02.docx
DOCUMENT CONTRIBUTORS
Prepared by
SIGI{ATUNE
D.ryl lrvln!
Revlewed by and approved by
SIGNATURE
Az.m Kh.n
tlnlt.tlonsl
Thlt Gport hil b.rn pnp.Ed by P.tth Dd.mra P.rlna6 Llritad (pDP) on th. b6f of Hom.ttoo prq,ld.d byAlhno Cop umlt d, PDp h.r not lnd.plnd.ntlyvarlild th. ,rwl{rd hbrmtlon rnd br nlLd upon lt bdnr.snt. and tulllcl.rt for ur by PDP ln pnp.lflt th. nport POP *optr m nrpordbllty ior .lm or mlralonrln, or th! cur.ncy or sufftlarcy of, th. prwldrd lnbmtlo.
ThltEporthatblrnpnpandbyPOPonthaapacmchnrEtl$ofAn n6G@pttrlt dforth.ltrltrdpu1por.3d.srtcd ln thr rpon. PDP .c.ptr m Lbillly f th. Bport b Eld ,o. . dl6.Ent prrpo$ tr tf lt Ir urd or nll.don by.ny oth.r prmn. Any ruh ulr or rlLe wfl b. rolGly.tthllrm rl3t
P*ALLIANCE GROUP LIMITED . ALLIANCE MATAURA PLANT _ WATER USE AND WASTEWATERMANAGEMENT RESILIENCE ASSESSMENT
Executive Summary
Alliance Group Limited (Alliance) owns and operates a beef processing plant atMataura, where all wastewater is treated and discharged to the Mataura River, inaccordance with Environment Southland Regional Council (ESRC) Resource
Consent 202327 . Resource Consent 202327 is d ue to expire i n Decem be r 2079and Alliance is required to apply for a new consent by June 2019.
To assist with the consenting process, it is important that Alliance reviews thewater use rates at the plant, to assess if water use (and subsequent wastewatergeneration volumes) is efficient, and that the resilience of the existingwastewater management system is reviewed to identify potential risks for thesite going forward.
Pattle Delamore Partners Limited (PDP) was engaged to undertake a water use
assessment and a wastewater management resilience assessment, for guidanceduring the consenting process.
Based on the water use assessment, water use within the processing plant areas
is slightly higher than common water use rates at other large export meat plants.
The slightly higher water use is attributed to the further tripe processing thatoccurs at the site. The use of raw river water for generation of white-water (at
approximately 2,000 m3/d) is not an efficient use of water, and is a potential area
where water use could be reduced (by approximately 37% depending on dailyprocess volumes), by recycling the treated wastewater for white-watergeneration purposes.
Assessment of the resilience of the wastewater management systems identifiedpotential intermittent cross contamination points between the Green and Non-Green waste streams and potential failure points within the reticulation system.
On the basis of these findings, the following actions are recommended, in orderof priority:
1. Where practical, re-route all pipework that runs above or in the waterrace or above the river to locations that prevents waste leaking into thewater race or fresh water leaking into the treatment system; and
2, Modify the beef sump milli-screen overflow and tripe recycle area, toprevent green waste overflows into the non-green waste stream.
P*ALLIANCE GROUP I. IMITEO ALLIANCE MATAURA PLANT - WATER USE AND WASTEWATERMANAGEMENT RESI LIEI{CE ASSESSMENT
Table of Contents
SECTION
Executive Summary
1,0 lntroduction
L.l Water Use
L.2 lnfrastructure Resilience
2.0 System Summary
3,0 Water Use Assessment
3.1 Summary of Flows and Water Use
t.2 Plant lnspection
3.3 Discussion
4.0 lnfrastructure Resilience lnvestitations
4.1 Method
4.2 Resilience lssues
4., Summary of Resilience Assessment Findings
5,0 Conclusions and Recommendations
6.0 References
Table of Figures
Figure 1: Main Plant Process Flow Diagram
Figure 2: Existint wastewater treatment process
Table of Tables
Tablc 1: Summary of wastcwatcr flows across main processing plant
arcas
PAGE
ii
1
I1
2
4
4
4
6
8
E
8
9
10
11
2
3
5
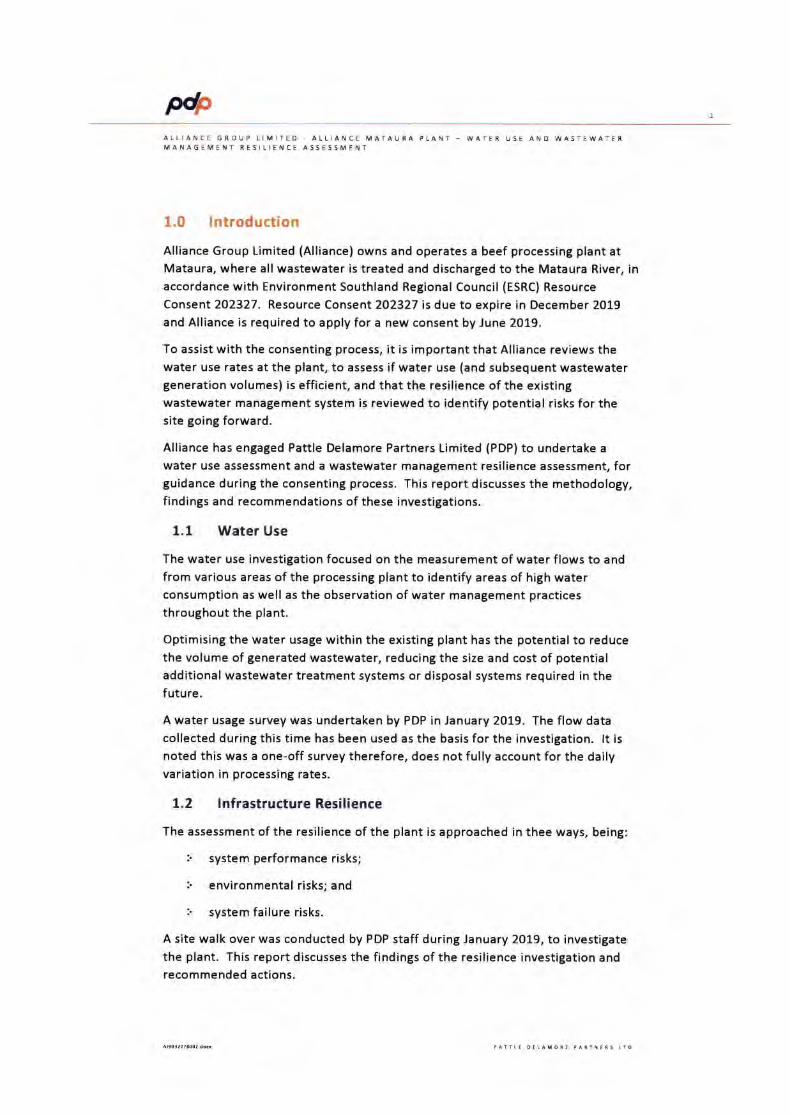
M 1
ALLIANCE GROUP LIMITEO . ALLIANCE MATAURA PLANl _ WATER USE AND WASTEWATERMANAGEMENT RESILIENCE ASSESSMENT
1.0 lntroduction
Alliance Group Limited (Alliance) owns and operates a beef processing plant atMataura, where all wastewater is treated and discharged to the Mataura River, in
accordance with Environment Southland Regional Council (ESRC) ResourceConsent 202327. Resource Consent 202327 is due to expire in December 2079and Alliance is required to apply for a new consent by June 2019.
To assist with the consenting process, it is important that Alliance reviews thewater use rates atthe plant, to assess if water use (and subsequentwastewatergeneration volumes) is efficient, and that the resilience of the existingwastewater management system is reviewed to identify potential risks for thesite going forward.
Alliance has engaged Pattle Delamore Partners Limited (PDP) to undertake a
water use assessment and a wastewater management resilience assessment, forguidance during the consenting process. This report discusses the methodology,findings and recommendations of these investigations.
1.1 Water Use
The water use investigation focused on the measurement of water flows to andfrom various areas of the processing plant to identify areas of high waterconsumption as well as the observation of water management practicesthroughout the plant.
Optimising the water usage within the existing plant has the potential to reducethe volume of generated wastewater, reducing the size and cost of potentialadditional wastewater treatment systems or disposal systems required in thefuture.
A water usage survey was undertaken by PDP in January 2019. The flow datacollected during this time has been used as the basis for the investigation. lt isnoted this was a one-off survey therefore, does not fully account for the dailyvariation in processing rates.
L.2 lnfrastructure Resilience
The assessment of the resilience of the plant is approached in thee ways, being:
I system performance risks;
I environmental risks; and
l system failure risks.
A site walk over was conducted by PDP staff during January 2OL9, to investigatethe plant. This report discusses the findings of the resilience investigation andrecommended actions.
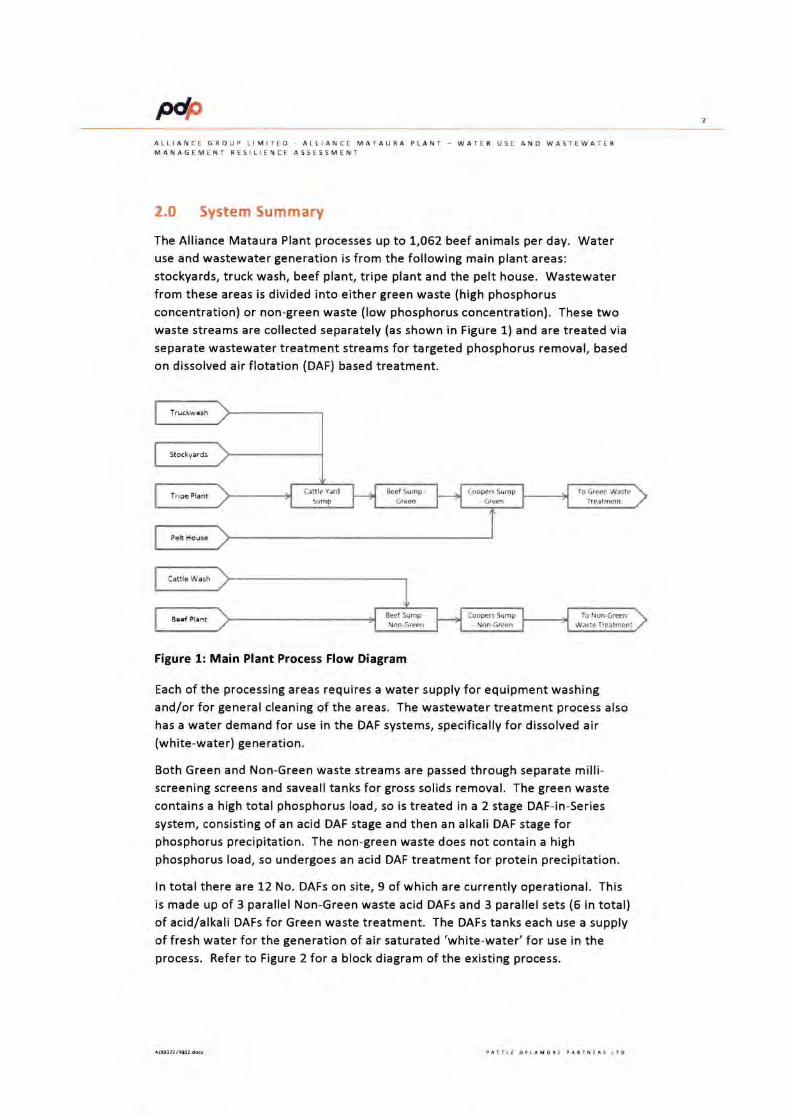
P*ALLIANCE GROUP LIMITED ALLIANCE MATAURA PLANT _ WATER USE AND WASTEWATERMANAGEM€NT RESILIENCE ASSESSMENT
2.O System Summary
The Alliance Mataura Plant processes up to 1,052 beef animals per day. Wateruse and wastewater generation is from the following main plant areas:
stockyards, truck wash, beef plant, tripe plant and the pelt house. Wastewaterfrom these areas is divided into either green waste (high phosphorusconcentration) or non-green waste (low phosphorus concentration). These twowaste streams are collected separately (as shown in Figure 1) and are treated via
separate wastewater treatment streams for targeted phosphorus removal, based
on dissolved air flotation (DAF) based treatment.
Figure 1: Main Plant Process Flow Diagram
Each of the processing areas requires a water supply for equipment washingand/or for general cleaning of the areas. The wastewater treatment process also
has a water demand for use in the DAF systems, specifically for dissolved air(white-water) generation.
Both Green and Non-Green waste streams are passed through separate milli-screening screens and saveall tanks for gross solids removal. The green wastecontains a high total phosphorus load, so is treated in a 2 stage DAF-in-Series
system, consisting of an acid DAF stage and then an alkali DAF stage forphosphorus precipitation. The non-green waste does not contain a highphosphorus load, so undergoes an acid DAF treatment for protein precipitation.
ln total there are 12 No. DAFs on site, 9 of which are currently operational. This
is made up of 3 parallel Non-Green waste acid DAFs and 3 parallel sets (6 in total)of acid/alkali DAFs for Green waste treatment. The DAFs tanks each use a supplyof fresh water for the generation of air saturated 'white-water' for use in theprocess. Referto Figure 2for ablock diagram of the existing process.
Stockya.ds
Tripr Pl.nt Canle Vard
SumpEeef Sump
GreenCoopers Sump
- 6renTo G,em Waste
T,eatmPnt
gcei SumpNon-6a&o
{ooper Sump- t{on-G.den
Io Non-Gr*nWtstc Trerlmenf
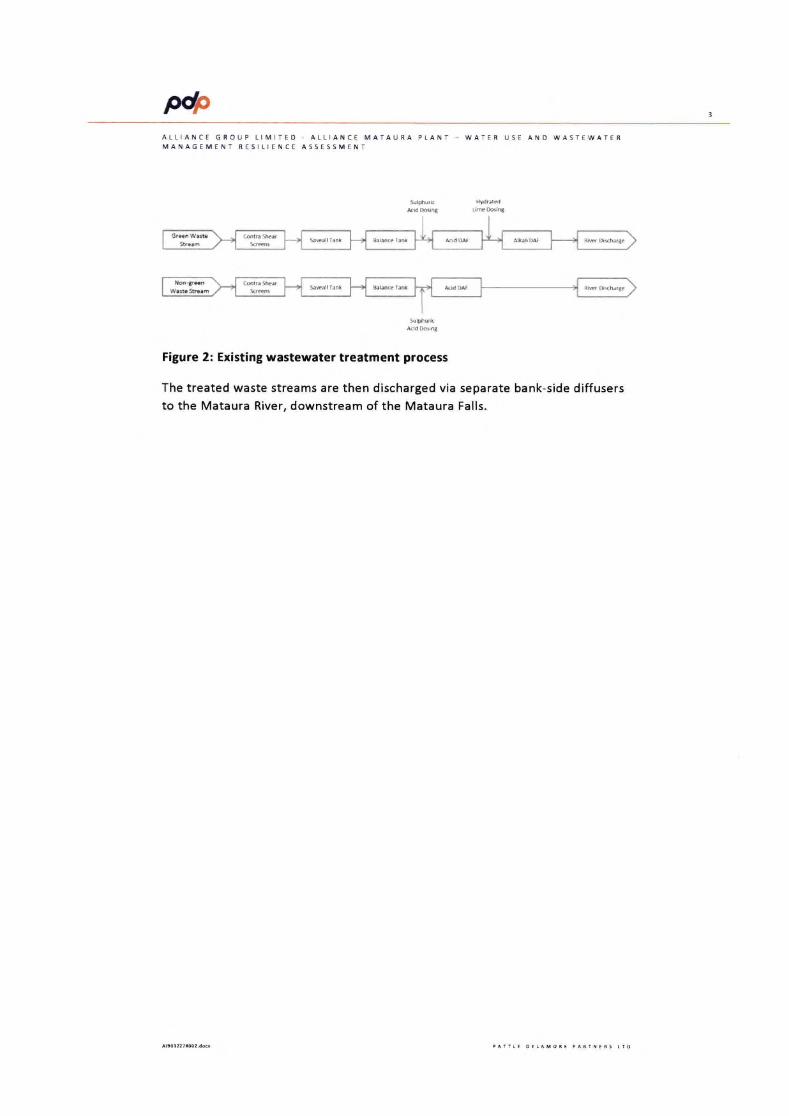
frALLIAT{CE GROUP LIMITED - ALLIAI{CE MATAURA PLANT _ WATER USE AND WASTEWATERMANAGEMET{T RESILIENC€ ASSESSME]TT
Suhhuri.eil, Hi6 umDori[
thh0rk&d hn8
Figure 2: Existing wastewater treatment process
The treated waste streams are then discharged via separate bank-side diffusersto the Mataura River, downstream of the Mataura Falls.
ffira Sha, Sa*Cl Lil &laeI.* &dru AhTru ri6Ufrll.
Cdrrftr hrllTir* &I.mIfi &5N
P* 4
ALLIANCE GROUP LIMI]EO ALLIANCE MAIAURA PLANT - WATER U5E AND WASTEWATERMANAGEMENT RESILIENCI ASSESSMENT
3.0 Water Use Assessment
PDP undertook a water use survey at the Mataura Plant, from 9:00 am on 21
January 2019 to 10:00 am 23 January 2019. As part of this survey, not all wateruse rates in each plant were able to be monitored, therefore, waste streams and
water supplies were monitored and flows to each plant established based on amass balance. The process flows measured were truck wash, cattle wash, cattleyard and cattle wash, green waste in, green waste out, non-green waste in and
non-green waste out.
This data has been used to assess water use efficiencies at the site, incomparison to animals processed, for comparison with water utilisation at otherbeef processing plants. Animal processing at the time was 435 animals per shiftduring both days and 280 animals per shift during both nights, with a total of 715animals processed per 24 hour period.
A walk through the main processing areas of the plant was also undertaken toobserve water use and water management within the plant, checking for anyobvious areas where water use could be improved. This walk through was
conducted on 20 December 2018.
3.1 Summary of Flows and Water Use
The mass balance, based on the flow data recorded on site, allowed average
flows for the main process areas to be calculated. These are shown in Error!Reference source not found..
3.2 Plant lnspection
Visual assessment within the processing plant indicated that there was a
generally good approach to water conservation, with measures such: as sensors
for apron washing and gut tray washing; and restricted flow knife washingsystems. Within the processing plant, there did not appear to be much in theway of unnecessary water use.
Site staff indicated that on occasions, a hose is utilised within gut cutting room toaid with air cooling (a practice that is discouraged by site management) however,it appears that the practice continues. This could be an area of potentialwatersaving, if cooling systems were installed, however, the potential saving could notbe verified due to the unknown frequency of operation. This has not, thereforenot been identified as an opportunity for saving but could be pursued in thefuture.
Within the tripe area, recycled water is utilised for paunch mobilisation, toconserve water use.
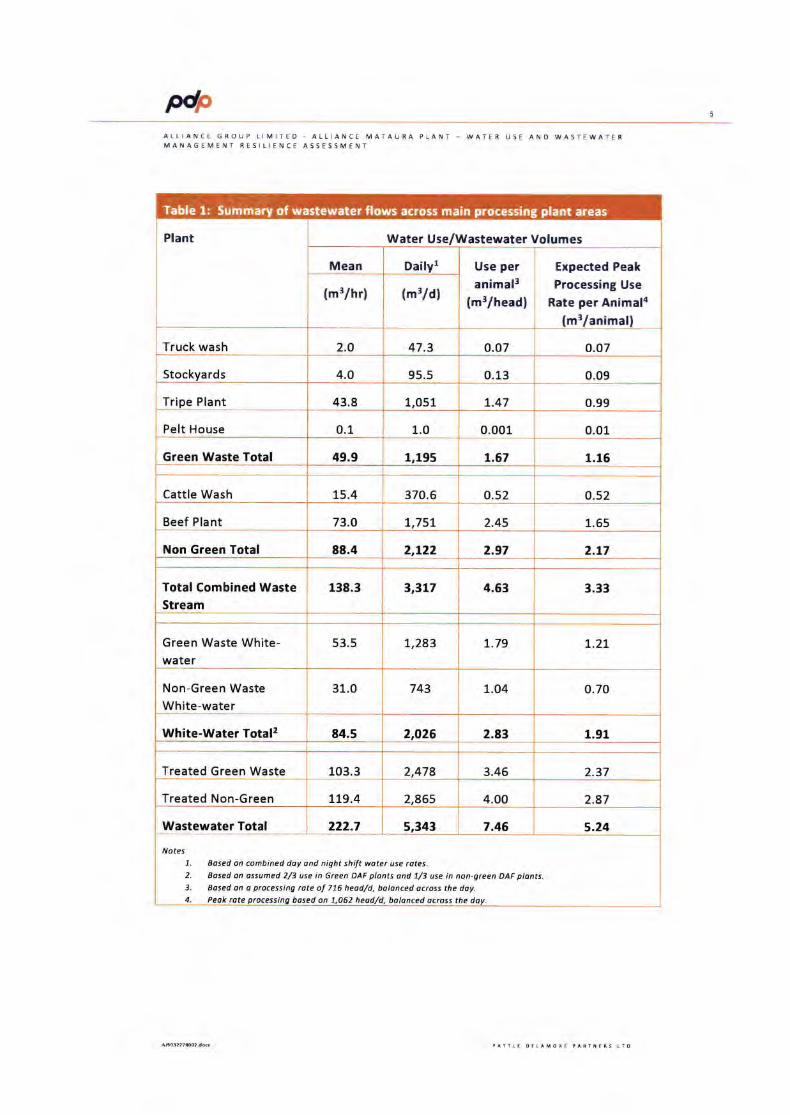
P* 5
ALLIANCE GROUP LIMITED. ALLIANCE MATAURA PLANT - WATER USE AND WASTEWAT€RMANAG€M€NT REsITIENCE ASSESSMENI
Water Use/Wastewater Voaumes
Mean Dailvr
Plant
(m3/hr) (m3ld)
Use peranimal3
(m3/head)
Expected Peak
Processing Use
Rate per Animala(m3lanimall
Truck wash 2.O 47.3 0.07 o.o7
Stockyards 4.0 95.5 0.13 0.09
Tripe Plant 43.8 1,051 1.47 0.99
Pelt House 0.1 1.O 0.001 0.01
Green Waste Total 49.9 1,195 1.67 1.16
Cattle Wash 15.4 370.5 0.52 0.52
Beef Plant 73.O 1,757 2.45 1.65
Non Green Total 88.4 2,122 2.97 2.t7
Total Combined WasteStream
138.3 ?'?17 4.63 3.33
Green Waste White-water
53.5 7,283 7.79 t.2t
Non-Green Waste
White-water31.0 743 L.O4 0.70
White-Water Total2 84.5 2,026 2.8? 1.91
Treated Green Waste 103.3 2,478 3.46 2.37
Treated Non-Green 7L9.4 2,865 4.00 2.87
Wastewater Total 222.7 5,343 7.46 5.24
7. Bosed on combined doy ond night shift woter use rotes.2- Bosed on ossumed 2/3 use in Green DAF plonts ond 7/3 use in non-grcen DAF plonts.i. Bosed on a processing rote of 716 heod/d, bdlonced ouoss the doy.4. Peok rdte processing bosed on 1,062 heod/d, bolonced ocross the day.
,Votas
of wastewater flows across main processing plant areasTable 1: Summa
M 5
ALLIANCE GROUP LIMITED, ALLIANCE MATAURA PLANT - WATER USE AND WASTEWATERMANA6EMENT RESILIENCE ASSESSMENT
3.3 Discussion
Based on the overall plant water use rates prior to the wastewater treatmentplant, the Alliance Mataura Plant was utilising approximately 4.62 m3/animalprocessed at the time of the assessment. Common industry water use rates inlarger export plants are in the order 10-11 m3/tonne of carcass weight processed(MLA 2008). Based on an average carcass weight of 24O kg/carcass at the time ofthe assessment, this equates to 2.7 m3f animal processed. ln comparison tostandard use rates, the water use rate at the Alliance Mataura Plant atthe timeof the assessment was higher, by approximately an additional 1.92 m3/animal.
Many of the water use systems within the Mataura Plant do not appear to be
processing rate based, with the exception of the cattle wash system. At the timeof the assessment, the plant was only processing at approxim ately 70% capacity,with a slightly lower than average carcass weight (seasonal average is24Okglcarcass). On this basis, if the plant was operatingatL,O62 animals per
day, then the water use rate would be in the order of 3.3 m3/animal, comparedwith a common industry use rate of 2.9 m3/animal (adjusted for average AllianceMataura season carcass weight of 260 kg/carcass).
Observations within the beef slaughter and boning plant indicates that there are
not many potential areas for water conservation. Based on monitoring data,adjusted for peak processing, water use rates were in the order of1.65 m3/animal (2.45 m3/animal at the time). This compares relatively well witha common industry rate for larger export plant more order of 1.48 m3/beefanimal (based on 51% use in slaughter/boning areas (MLA 2008)).
The water use rate in the stock yards is relatively low and there appeared to be
minimal use of hoses. The cattle wash, however, is a relatively large user ofwater for the area, at 0.5 m3/animal processed. The total water use in the yardsarea equates to 0.7 m3/beef animal, which compares well with the commonindustry rate for larger export plant of 0.5 m3/beef animal (based on 21% use in
stock yards and truck wash areas (derived from MLA 2008)).
The tripe plant is a large user of water, at 1.0 m3/beef animal, adjusted for peak
processing (7.47 m3lanimal at the time). lt is noted that the plant alreadyrecycles some of the screened tripe wastewater for mobilisation water. Acommon industry rate for wet paunch dump and green offal wash is
approximately 0.4 m3/beef animal (derived from MLA 2008)), however, it isnoted that the Alliance Mataura plant conducts further tripe processing thanwould be conducted in most plants, which would likely account for the additionalwater use.
Overall, it is concluded that the Alliance Mataura processing plant is utilisingwater at a slightly higher rate than common industry use averages for largerexport plants. The slightly higher water use rate is attributed to additional tripeprocessing.
P*ALLIANCE GROUP LIMITED - ALLIANCE MATAURA PLANT. WATER USE AND WASTEWATERMAI{AGEMENT RESILIENCE ASSESSMENT
Following the processing plant, the generated wastewater is treated utilising aDAF based treatment system. The wastewater treatment system utilises rawriver water for white-water generation for use in the DAF plant, which equates to37% of the overall plant water use. Most DAF systems utilise recycled treatedwastewater for white-water generation, and therefore, white-water generation isidentified as an area that could represent a significant water usage reduction forthe plant. This has the potential to reduce water use in the plant byapproximately 2,000 m3/d.
Recycling of treated wastewater for white-water generation will require carefulmanagement to avoid foam generation in the inter-stage tank. Considerationwill also need to be given to the implications of the decreased dilution effect ofthe white-water and the existing consent concentration limits.
PdpALLIANCE GROUP LIMITED ALLIANCE MATAURA PLANT _ WATER USE ANO WASTEWATERMANAGEMENT RESILIENCE ASSESSMENT
4.0 lnfrastructure Resilience lnvestigations
It is essential that the wastewater management system at the Alliance Matauraplant is resilient against failures to allow for continued reliance. lt is likely thatthe existing wastewater management systems will continue to be utilised as partof any future treatment system and therefore, it is important that the conditionand associate risks of the existing system are assessed. lf new wastewatermanagement systems are installed, in addition to the existing plant, then thesesystems will be subject to additional resilience assessment.
Potential resilience issues that could occur fall into 3 major categories
I System performance risks,
l Environmental risks,
i System failure risks.
4.1 Method
A site walk over was conducted by PDP on 21 and 22 January 2019, the purposeof this was to visually inspect the configuration and condition of the wastewaterreticulation and treatment systems in order to identify possible risks that fell intothe categories above. Discussions with site managers and operators were alsoused to gather site information and confirm the issues observed on site.
4.2 Resilience lssues
The following resilience issues were identified during the site walkover
4.2.1 Green waste cross contamination
There is the potential for overflow of the tripe wash recycle sump (Green Waste)to a Hide Wash sump (Non-Green waste stream), in the yards area. There is alsothe potential for overflow of the Beef Sump green waste milli-screen, to the redwaste stream.
Separation of the green and non-green waste systems is essential for minimisingthe phosphorus load discharged to the Mataura River. These overflowstherefore, represent a risk that phosphorus, that would otherwise be removed inthe green waste treatment process, would be discharged to the Mataura River
via the non-green stream. This would cause an increase in the phosphorus load
discharged to the river. Phosphorus has been identified as a high prioritycontaminant to reduce in the river. lt is therefore, criticalthat all phosphorus in
the green waste stream remains in the green waste stream for removal.
Modification of the system would decrease the risk of cross contamination and
decrease the risk of increased phosphorus loading into the Mataura River. lt isnoted that since sheep and lamb processing ceased, the plant has remainedcomplaint with regards to phosphorus discharge limits.
P*ALLIANCE GROUP LIMITED, ALLIANCE MATAURA PLANT - WATER USE ANO WASTEWATERMANAGEMENT RESILIENCE ASSESSMENT
4.2.2 Wastewater Pipes in or above Hydro-race
The main green waste, non-green waste and pelt house streams are conveyed inseparate pipes to the Coopers sump, prior to being pumped to the wastewatertreatment plant. Prior to the pipes entering the Coopers sump, they pass
through and over the hydro scheme water race. Additionally, some pipes nearthe saveall tank run above the wall adjacent to river itself. This presents the riskof accidental discharge of contaminants directly to the river or an influx of riverwater if any of the pipes fail.
A leak in a pipe in or above the water race or river would lead to untreatedwastewater being discharged directly to the river, potentially un-detected.
lf a pipe submerged in the water race is compromised, river water may flow intothe pipe and into the wastewater treatment system. This could significantlyincrease the hydraulic loading onto the wastewater treatment process andnegatively impact its performance, which could increase the wastewatercontaminant loads discharged to the river. Discussions with site operatorsindicate that this may have occurred in the past, associated with the Pelt Housewastewater pipe.
Relocation of the pipes outside of the hydro race or away from the wall abovethe river would help minimise the risk of uncontained and undetected discharge.
4.3 Summary of Resilience Assessment Findings
Each of the resilience issues noted above represent a significant riskto the plantin terms of performance, environmental or safety, therefore, these issues needto be addressed adequately under urgency in order to minimise and/or eliminateany risk. As a priority it is recommended the following measures are actioned, inorder of priority:
l. Where practical, re-route all pipework that runs above, or in, the waterrace to a location that prevents waste leaking into the water race orfresh water leaking into the treatment system;
Re-route all pipework that runs above the river to a location thatprevents waste leaking into the river;
3. Modify the beef sump milli-screen overflow to prevent green wasteoverflows into the non-green waste stream;
4. Modify the stockyard and tripe recycle area to prevent green wasteoverflows into the non-green waste stream.
P* 10
ALLIANCE GROUP IIMITEO - ALLIANCE MATAURA PLANT _ WATER USE AND WASTEWATERMANAGEMENT RESILIENCE ASSESSMENT
5.0 ConclusionsandRecommendations
Based on the water use assessment, it is concluded that water use within theprocessing plant areas is in keeping with, but slightly higher than, water use ratesat other large export meat plants. The slightly higher water use is attributed tothe level of tripe processing that occurs at the site.
The use of raw river water for generation of white-water (at approximately2,000 m3/d) is not an efficient use of water, and is a potential area where wateruse could be reduced, by recycling the treated wastewater for white-watergeneration purposes. This is common practice with DAF treatment systems.
Consideration will need to be given to managing the risk of foaming in the white-water generation system, and the impact the removal of the additional dilutingraw water will have on treated wastewater contaminant concentrations and
concentration consent limits.
Assessment of the resilience of the wastewater management systems identifiedpotential intermittent cross contamination points between the Green and Non-
Green waste stream and potential failure points within the reticulation system.
On the basis of these findings, the following actions are recommended, in orderof priority:
1.. Where practical, re-route all pipework that runs above or in the waterrace to a location that prevents waste leaking into the water race orfresh water leaking into the treatment system;
2. Re-route all pipework that runs above the river to a location thatprevents waste leaking into the river;
3. Modify the beef sump milli-screen overflow to prevent green wasteoverflows into the non-green waste stream;
4. Modify the stockyard and tripe recycle area to prevent green wasteoverflows into the non-green waste stream.

P* 71
ALI, IANCE GROUP LIMITED ALLIANC€ MATAURA PLANT, WATER USE AND WASTEWATERMANAGEMENT RESILIENCE ASSESSMTNT
5.0 References
MLA 2008, Review of Abottoir woter Usage Reduction, Recycling and Reuse, Meat& Livestock Australia Limited 2008.

L
-l
APPENDIX 9
Summary AEE document circulated tokey stakeholders during consultation

ALLIANCEFARMTRS' PRODUCE
stNcE 194E
Mataura Processing PlantResource Consent Applications
Summary Document for Consultation
May 2019
TABLE OF GONTENTS
1. lntroduction
1.1 Purpose of this Document
Environmental Setting
Alliance Mataura Plant Processes and Activities
3.1 Water Take
3.2 Cooling Water Dlscharge
3.3 Wastewater Discharge
Assessment of Environmental effects
4.1 Economic Effects 11
4.2 Effects of the Water Take 12
4.3 Effects of the Cooling Water Discharge 14
4.4 Effects of the Wastewater Discharge 14
Mitigation, Management and Monitoring of Effects 2l
Abstraction
Cooling Water Discharge
Wastewater Discharge
Summary
LIST OF FIGURES
1
2.
3.
2
2
7
7
8
8
4.
5.
5.1
5.2
5.3
5.4
21
2',1
2'.1
24
Figure 1:
Figure 2:
Figure 3:
Figure 4:
Figure 5:
Figure 6:
Figure 7:
The Alliance Mataura Plant (foreground).
The Mataura Catchment... ............................3
Mataura River approximately 2 km downstream of the discharge point. ..............4
Screen on one of the intake pumps within the hydro race... .............8
Final dried DAF solids ready to be taken offsite for composting.............................9
Beef boners at the Mataura P1ant......... ............................11
Take and discharge points. 13
LIST OF TABTES
Table 1: Summary of the discharge quality for the period November 2012 - March 2019
(all units g/m3 unless stated). 14
Table 2: Pathogen monitoring data for treated wastewater from the Mataura Plant. 15
Table 3: Summary of mitigation, monitoring and reporting measures being considered.
25
.l L
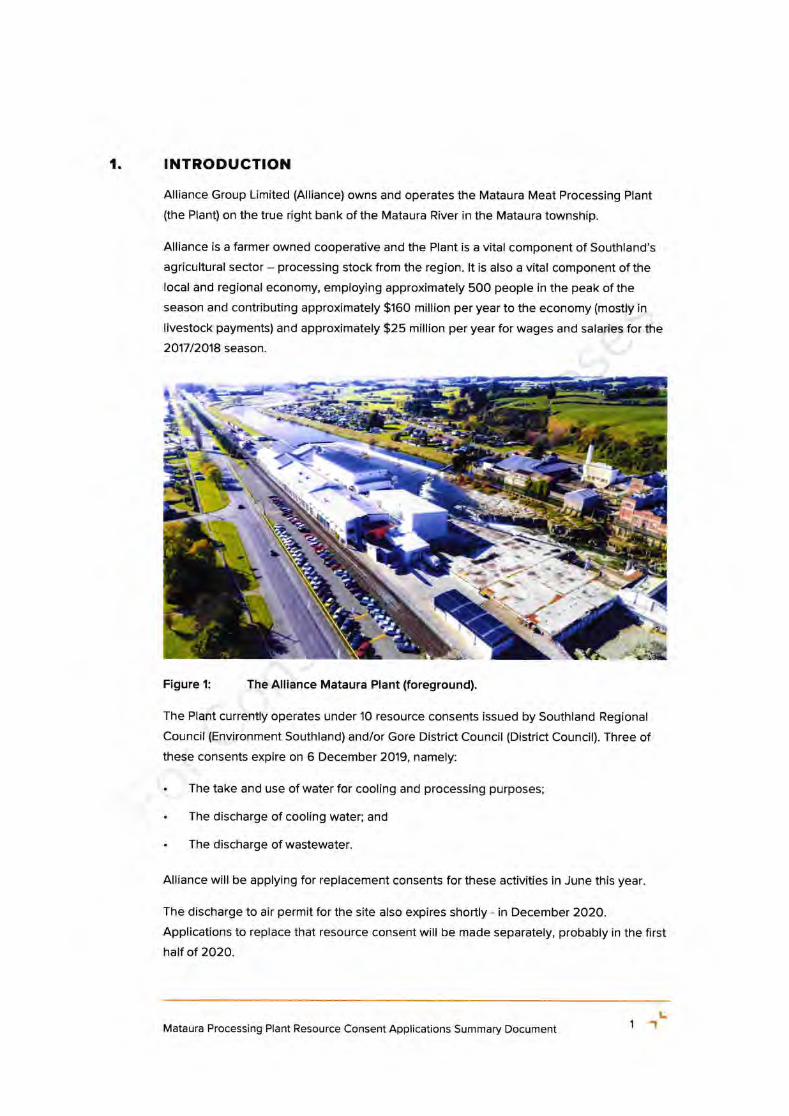
1 INTRODUCTION
Alliance Group Limited (Alliance) owns and operates the Mataura Meat Processing Plant
(the Plant) on the true right bank of the Mataura River in the Mataura township.
Alliance is a farmer owned cooperative and the Plant is a vital component of Southland's
agricultural sector - processing stock from the region. lt is also a vital component of the
local and regional economy, employing approximately 500 people in the peak of the
season and contributing approximately $160 million per year to the economy (mostly in
livestock payments) and approximately $25 million per year for wages and salaries for the
201712018 season.
/,|*!i
.d
Figure 1: The Alliance Mataura Plant (foreground).
The Plant currently operates under 10 resource consents issued by Southland Regional
Council (Environment Southland) and/or Gore District Council (District Council). Three of
these consents expire on 6 December 2019, namely:
. The take and use of water for cooling and processing purposes;
. The discharge of cooling water; and
. The discharge of wastewater.
Alliance will be applying for replacement consents for these activities in June this year.
The discharge to air permit for the site also expires shortly - in December 2O2O.
Applications to replace that resource consent will be made separately, probably in the first
half of 2020.
i t.:
Mataura Processing Plant Resource Consent Applications Summary Document 1'r L
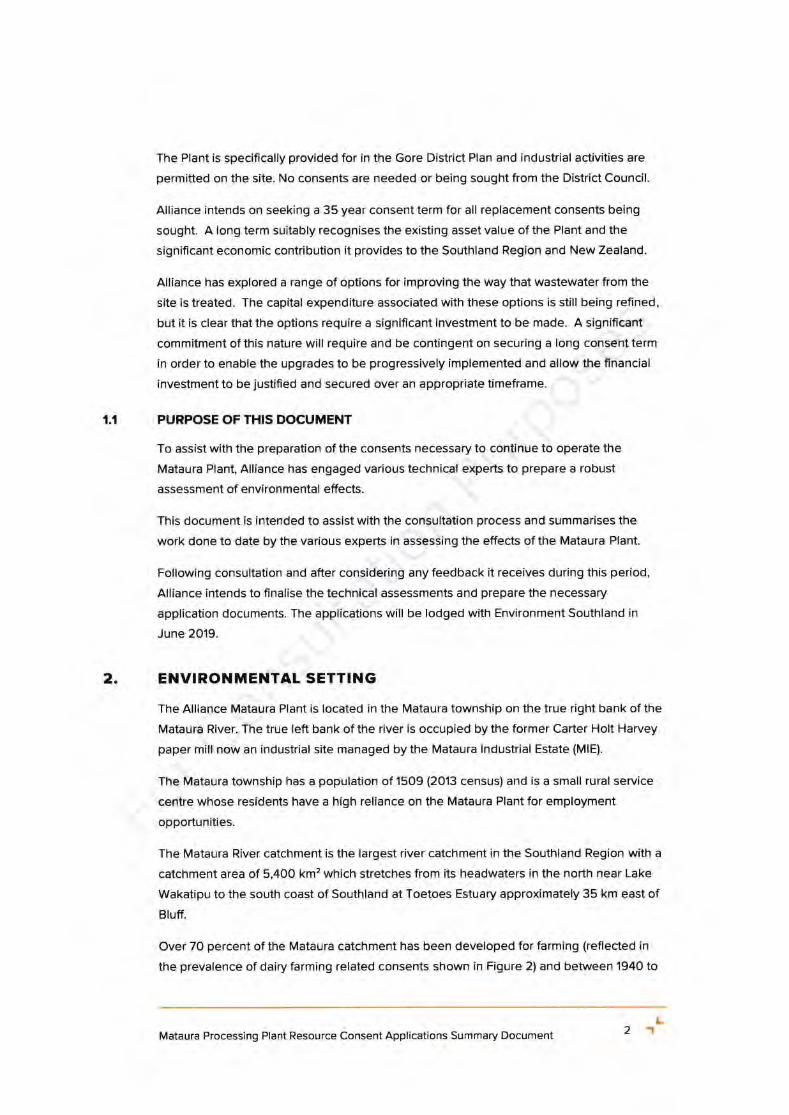
The Plant is specifically provided for in the Gore District Plan and industrial activities are
permitted on the site. No consents are needed or being sought from the District Council
Alliance intends on seeking a 35 year consent term for all replacement consents being
sought. A long term suitably recognises the existing asset value of the Plant and the
significant economic contribution it provides to the Southland Region and New Zealand
Alliance has explored a range of options for improving the way that wastewater from the
site is treated. The capital expenditure associated with these options is still being refined,
but it is clear that the options require a signiflcant investment to be made. A significant
commitment of this nature will require and be contingent on securing a long consent term
in order to enable the upgrades to be progressively implemented and allow the flnancial
investment to be justified and secured over an appropriate timeframe.
1.1 PURPOSE OF THIS DOCUMENT
To assist with the preparation of the consents necessary to continue to operate the
Mataura Plant, Alliance has engaged various technical experts to prepare a robust
assessment of environmental effeds.
This document is intended to assist with the consultation process and summarises the
work done to date by the various experts in assessing the effects of the Mataura Plant.
Following consultation and after considering any feedback it receives during this period,
Alliance intends to finalise the technical assessments and prepare the necessary
application documents. The applications will be lodged with Environment Southland in
June 2O'19.
ENVIRONMENTAL SETTING
The Alliance Mataura Plant is located in the Mataura township on the true right bank of the
Mataura River. The true left bank of the river is occupied by the former Carter Holt Harvey
paper mill now an industrial site managed by the Mataura lndustrial Estate (MlE).
The Mataura township has a population of 1509 (2013 census) and is a small rural seruice
centre whose residents have a high reliance on the Mataura Plant for employment
oppoftunities.
The Mataura River catchment is the largest river catchment in the Southland Region with a
catchment area of 5,400 km2 which stretches from its headwaters in the north near Lake
Wakatipu to the south coast of Southland at Toetoes Estuary approximately 35 km east of
Bluff.
Over 7O percent of the Mataura catchment has been developed for farming (reflected in
the prevalence of dairy farming related consents shown in Figure 2) and between 1940 to
2
Mataura Processing Plant Resource Consent Applications Summary Document 21L
1980 there was widespread willow clearing, channel straightening and artificial drainage
installed which has significantly altered the catchment hydrology and water quality. The
Mataura Plant is in the lower section of the Mataura Catchment, approximately 12 km
downstream of Gore, and 44 km upstream of the Toetoes Estuary (at Fortrose).
:
1,
':.'::lt' )
O u4orindustryhubsO DdryconsentsO whiiebaitstands
Figure 2: The Mataura Catchment.
Mataura Processing Plant Resource Consent Applications Summary Document 3't L
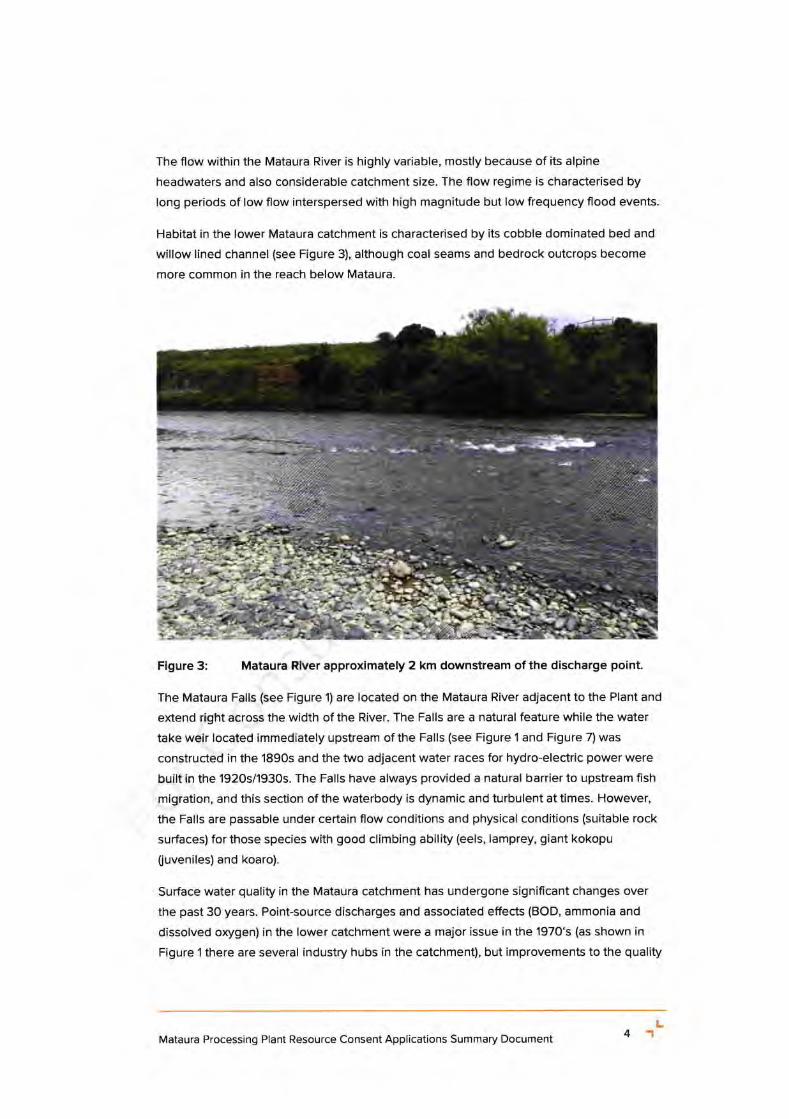
The flow within the Mataura River is highly variable, mostly because of its alpine
headwaters and also considerable catchment size. The flow regime is characterised by
long periods of low flow interspersed with high magnitude but low frequency flood events
Habitat in the lower Mataura catchment is characterised by its cobble dominated bed and
willow lined channel (see Figure 3), although coal seams and bedrock outcrops become
more common in the reach below Mataura.
Figure 3: Mataura Rfuer approximately 2 km downstream of the discharge point.
The Mataura Falls (see Figure 1) are located on the Mataura River adjacent to the Plant and
extend right across the width of the River. The Falls are a natural feature while the water
take weir located immediately upstream of the Falls (see Figure 1 and Figure 7) was
constructed in the 1890s and the two adjacent water races for hydro-electric power were
built in the 1920s/1930s. The Falls have always provided a natural barrier to upstream fish
migration, and this section of the waterbody is dynamic and turbulent at times. However,
the Falls are passable under certain flow conditions and physical conditions (suitable rock
surfaces) for those species with good climbing ability (eels, lamprey, giant kokopu
fuveniles) and koaro).
Surface water quality in the Mataura catchment has undergone significant changes over
the past 30 years. Point-source discharges and associated effects (BOD, ammonia and
dissolved o4ygen) in the lower catchment were a major issue in the 1970's (as shown in
Figure 1 there are several industry hubs in the catchment), but improvements to the quality
Mataura Processing Plant Resource Consent Applications Summary Document 41 L
of wastewater discharges have reduced these effects.i However, over the correspondingperiod an increase in contaminants (particularly nutrients) associated with the
intensification of agricultural land use occurred across much of the catchment. The surface
water quality monitoring data that Alliance has obtained generally supports these flndings.
This shows water quality in the vicinity of Mataura is characterised by:
Water temperature (between 2.3-23.2"C) and dissolved o{/gen levels (>5 g/m3)
suitable for protecting river ecosystem health;
Nitrate and ammoniacal nitrogen (Amm-N) concentrations which meet National Poliry
Statement for Freshwater Management 2014 (NPSFW) Attribute State A or B for
toxicity, but which exceed the relevant ANZECC (2000) 'physical and chemical
stressor'trigger values which relate to nuisance plant growth;
Nutrient indicators (e.9. Dissolved lnorganic Nitrogen (DlN) and Dissolved Reactive
Phosphorus (DRP)) which regularly exceed the Ministry for the Environment
periphyton guideline for protecting benthic biodiversity; and
Very high Ecoli concentrations which mean the Mataura River sits in the Red NPSFW
Attribute State for Ecoli.
The Mataura River benthic macroinvertebrate community in the vicinity of Mataura
upstream and downstream of the Plant is typical of stony bed lowland river and supports a
range of water quality sensitive and tolerant taxa. lt is dominated by Ephemeroptera
(mayflies) and Trichoptera (caddisflies)with Diptera (true flies) the next most common
group. Deleotidium are the most common mayfly and the fllter feeding Aoteopsyche the
most abundant caddisfly taxon recorded across all years. Alliance's ecological monitoring
data has generally recorded poor to fair macroinvertebrate community quality class across
all monitoring sites both upstream and downstream of the Plant
While water quality indicates that periphyton groMhs should occur, such growths are not
frequent in the Mataura River below Gore. However, periphyton growths are observed
during longer accrual periods and when this occurs the Macroinvertebrate Community
lndex (MCl - a measure of benthic invertebrate health) score typically decreases.
The lower Mataura River supports moderate to high native fish diversity (13 native fish have
been recorded) including eight species with an 'At Risk Declining' conservation status -
longfin eels, torrentfish, lamprey, Gollum galaxias, galaxias southern, inanga, giant kokopu
and koaro.
The Mataura River is also regarded as one of New Zealand's premier lowland brown trout
fisheries and is internationally recognised. The Water Conservation Order (1997)
Motouro Cotchment Strotegic Woter Study, Report prepared for Environment Southland. May 2011. LiquidEarth Aqualinc Research Harris Consulting
Mataura Processing Plant Resource Consent Applications Summary Document 5'r L
recognises the importance of the River from source to sea with its outstanding fisheries
and angling amenity. With respect to other recreational values, the Mataura river supports
a very popular whitebait fishery in its lower reaches (see Figure 2) and is subject to
relatively high use for swimming during the summer months, both up and downstream of
Mataura. lt's various riverbanks, berms, reserves and angler access points are also used
for a variety of terrestrial activities, mostly around settlements.
lwi have a long association and a strong traditional relationship with the Mataura River. A
Statutory Acknowledgement exists for the Mataura River in Schedule 42 of the Ngai Tahu
Claims Settlement Act 1998. This Statutory Acknowledgement outlines Ngai Tahu's
association with the Mataura River. Above the Mataura Falls the river was traditionally used
by the descendants of the Ngati Mamoe chiel Parapara Te Whenua, along with other
famous tupuna. The Statutory Acknowledgement states that:
'The Motouro wos on importont mohingo koi, noted for its indigenous fishery. The
Mqtouro Folls were porticulorly ossocioted with the toking of kqnokono (lomprey).
The tupuno hod consideroble knowledge of whokopopo, troditionol troils ond
tourongo woko, ploces for gothering koi ond other toongo, woys in which to use the
resources of Motouro, the relotionship of people with the river ond their dependence
on it, ond tikongo for the proper ond sustoinoble utilisotion of resources. Ail of these
volues remoin importont to Ngoi Tohu todoy.
The mouri of the Motouro represents tf,e essence thot binds the physicol ond
spirituol elements of oll things together, generoting ond upholding oll life. Alleremenfs of the noturol environment possess o life force, ond oll forms of life ore
reloted. Mouri is o criticol element of the spirituol relotionship of Ngoi Tohu Whonui
with the river."
The Mataura River is also subject to the Mataitai Reserve. This reserve status recognises
the importance of the river as providing a mahinga kai resource for Ngai Tahu Whdnui
because of its use as an access route between coastal Muruhiku (Southland) to Fiordland
and the West Coast for the gathering of pounamu. The Mataura was particularly noted for
the gathering of kanakana (lamprey) and tuna (eels), with annual flshing expeditions in
season to favoured nohoanga (campsites) along the river. The bylaw for the reserue
prohibits commercial fishing within the area. Customary fishing is permitted subject to
approval.
The Mataura River flows into the Toetoes Estuary. This estuary is a medium sized "tidal
lagoon" type estuary that discharges to Toetoes Beach at Fortrose, and it drains a large
and primarily high productivity agricultural catchment. The shallow estuary (mean depth of
around 2m) has a large freshwater influence because the estuary is small in relation to the
freshwater input. lt has a wide range of habitats (extensive mudflats and saltmarsh areas,
very small patches of seagrass) but has historically lost large areas of saltmarsh (estimated
loss of approximatelyT5% (250ha)), while virtually all the surrounding wetland has been
Mataura Processing Plant Resource Consent Applications Summary Document 6'r L
lost through drainage and reclamation and conversion to pasture. This has greatly
reduced the estuary's ability to filter, dilute, and assimilate nutrient and sediment inputs.
Recent Environment Southland monitoring has shown the estuary is in a "MODERATE" but
declining condition in relation to eutrophication, and that the ongoing drainage and loss ofsaltmarsh and densely vegetated terrestrial margins is also placing the estuary underpressure. Excessive nutrient inputs are the primary driver of the eutrophication symptoms
being expressed.
3. ATLIANCE MATAURA PTANT PROCESSES AND ACTIVITIES
The first meat processing plant was established on this site in 1893, and since that time thePlant has been a vital component of the Southland's agricultural sector, processing stock
from the region. The Plant has historically processed up to 10,0OO sheep per day and 55O
beef animals per day (with additional by-products processing including casings and
rendering). However, in 2012 the processing of sheep and rendering ceased and beefproduction increased to up to 1,O60 beef animals per day. For the foreseeable future, it is
expected that the Mataura site will continue to operate solely as a beef processing plant.
The Plant generally operates 5 days per week l24hours per day. However, Sunday
processing has also been undertaken recently for mycoplasma bovis infected stock.
Alliance holds a number of resource consents which authorise various activities associated
with the ongoing operation, use and maintenance of its Mataura Plant. As noted above,
three key operating consents are due to expire in December 2019. These relate to theabstraclion of water from the hydro race, the discharge of cooling water and the discharge
of wastewater to the Mataura River. A brief description of these activities follows.
3.t WATER TAKE
Abstraction of water is essential for operations at the Plant. The existing consent
authorises the taking of up to 35,600 m3/day of water for freezing works supply. This is
made up of:
. 2'l,2OO mt/day for cooling water; and
. 14,4OO m3/day for processing water.
The existing consent was amended in May 2018 to require meters to be installed on all
intakes which abstracl processing water. The taking of engine room condenser water and
engine room cooling water is treated as a non-consumptive water take and is not metered.
Eleven of the intake pumps (No 1 - 11) are screened with an aperture size of 5 - 6 mm toprevent debris and fish from being drawn into the takes. The remaining pumps (No. 12 -
Mataura Processing Plant Resource Consent Applications Summary Document 7'1 L
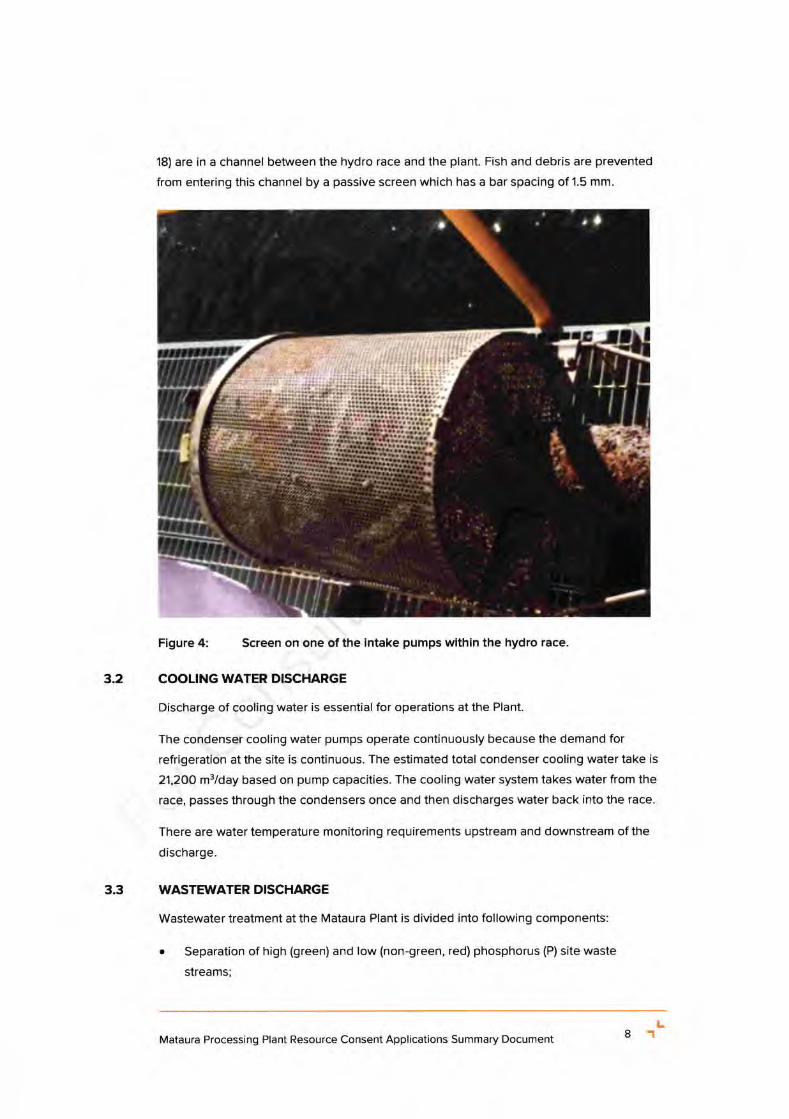
3.2
18) are in a channel between the hydro race and the plant. Fish and debris are prevented
from entering this channel by a passive screen which has a bar spacing of 1.5 mm.
Figure 4: Screen on one of the intake pumps within the hydro race.
COOLING WATER DISCHARGE
Discharge of cooling water is essential for operations at the Plant.
The condenser cooling water pumps operate continuously because the demand for
refrigeration at the site is continuous. The estimated total condenser cooling water take is
21,2OO m3/day based on pump capacities. The cooling water system takes water from the
race, passes through the condensers once and then discharges water back into the race.
There are water temperature monitoring requirements upstream and downstream of the
discharge.
WASTEWATER DISCHARGE
Wastewater treatment at the Mataura Plant is divided into following components:
o Separation of high (green) and low (non-green, red) phosphorus (P) site waste
streams;
3.3
Mataura Processing Plant Resource Consent Applications Summary Document 8'r L
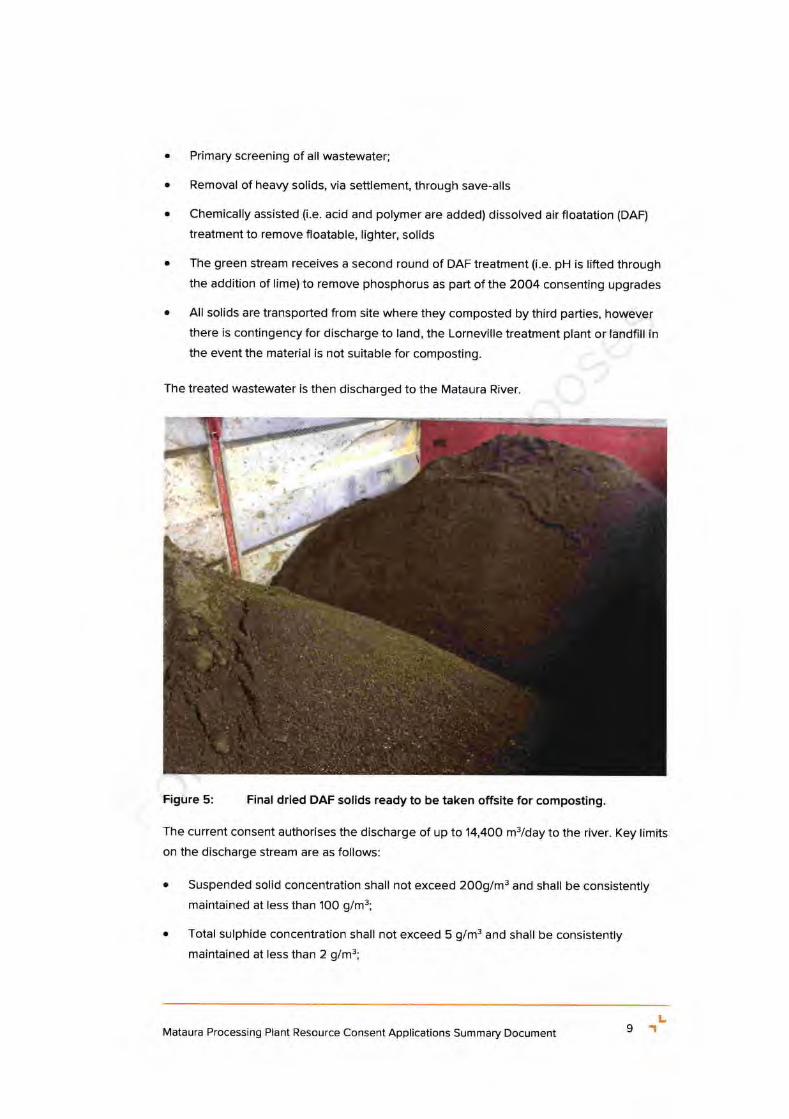
a
a
a
Primary screening of all wastewater;
Removal of heayy solids, via settlement, through save-alls
Chemically assisted (i.e. acid and polymer are added) dissolved air floatation (DAF)
treatment to remove floatable, lighter, solids
The green stream receives a second round of DAF treatment (i.e. pH is lifted through
the addition of lime) to remove phosphorus as part of the 2004 consenting upgrades
All solids are transported from site where they composted by third parties, however
there is contingency for discharge to land, the Lorneville treatment plant or landfill in
the event the material is not suitable for composting.
The treated wastewater is then discharged to the Mataura River
Figure 5: Final dried DAF solids ready to be taken offsite for composting.
The current consent authorises the discharge of up to 14,400 m3/day to the river. Key limits
on the discharge stream are as follows:
Suspended solid concentration shall not exceed 20Og/m3 and shall be consistently
maintained at less than 100 g/m3;
Total sulphide concentration shall not exceed 5 g/m3 and shall be consistenily
maintained at less than 2 g/m3;
a
Mataura Processing Plant Resource Consent Applications Summary Document 9'r L
4.
. Total ammoniacal-nitrogen concentration shall not exceed 50 g/m3 and shall be
consistently maintained at less than 309/m3;
o Carbonaceous BODS concentration of the wastewater shall not exceed 300 g/m3;
o Total loading of carbonaceous BOD5 discharged to the river shall not exceed
3,500kg/day; and
o Total load of dissolved reactive phosphorous discharged to the river shall not exceed
'l4.4kglday.
Treated wastewater is discharged through two 20Omm diameter pipes that exit the Plant
and drop approximately 1Om to the river bed.
It should be noted that wastewater from staff amenities is separated at source and
discharged to the Gore Districl Council wastewater system.
Since the existing resource consents were granted in 2004 Alliance has completed a
significant upgrade to its wastewater treatment plant to reduce Dissolved Reactive
Phosphorus (DRP) concentrations in the discharge. This means a significant percentage (in
the order of >90% DRP removal) of the DRP load produced at the Plant is now removed by
the existing process.
ASSESSMENT OF ENVIRONMENTAL EFFECTS
Alliance has commissioned several independent technical advisors to complete
assessments as part of its reconsenting programme. The assessments include:
o An economic assessment - Brown, Copeland and Company Limited.
r An assessment of in river recreational values - Rob Greenway & Associates.
o Water quality and ecological assessment - Freshwater Solutions Limited (FWS) and
Aquatic Environmental Sciences (AES).
o A Quantitative Microbial Risk Assessment - Streamlined Environmental Ltd.
o Wastewater Treatment Upgrade Alternatives Assessment, - Pattle Delamore Partners
(PDP).
o Mataura Awa Cultural Values Repoft - Te Ao Marama lnc.
o Resource Management Act 1991 and planning matters - Mitchell Daysh.
Alliance and its independent technical advisors collaborated to identifo potential adverse
environmental effects of the ongoing operation and use of the Plant along with associated
measures to ensure that any such effects are appropriately avoided, remedied or
mitigated and relevant statutory considerations addressed.
L.|Mataura Processing Plant Resource Consent Applications Summary Document 10
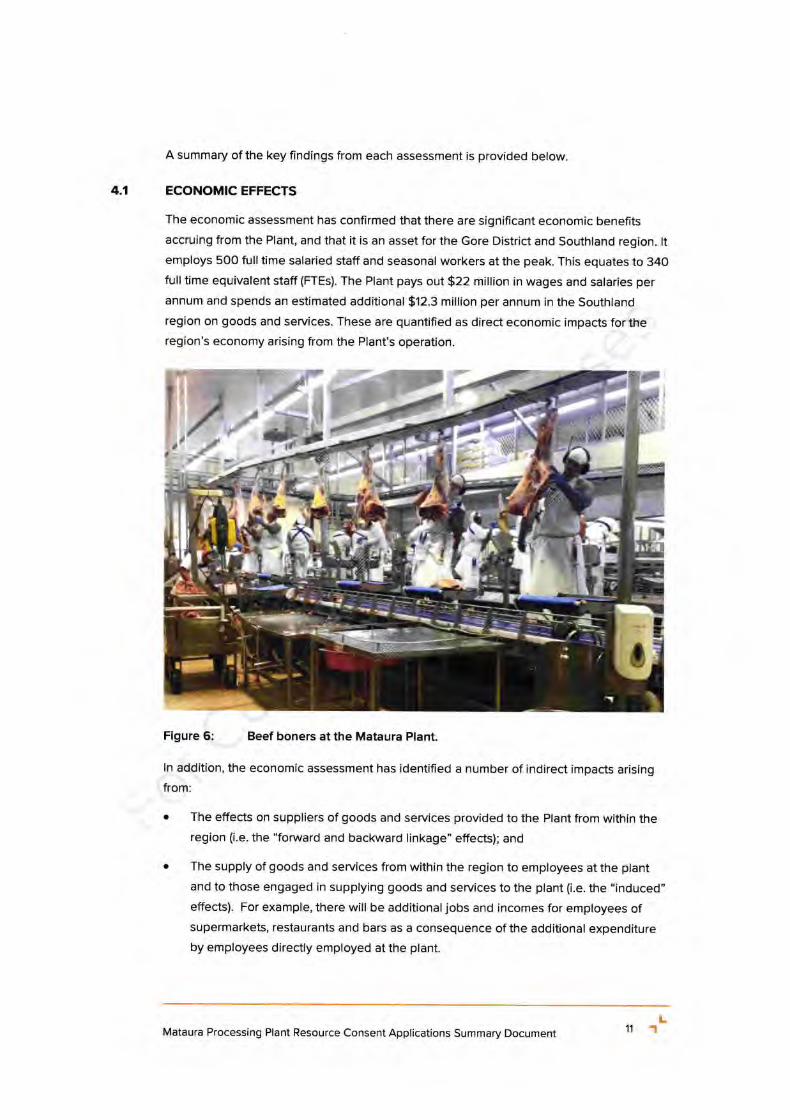
A summary of the key findings from each assessment is provided below
4.1 ECONOMIC EFFECTS
The economic assessment has confirmed that there are signiflcant economic benefits
accruing from the Plant, and that it is an asset for the Gore District and Southland region. lt
employs 500 full time salaried staff and seasonal workers at the peak. This equates to 340full time equivalent staff (FTEs). The Plant pays out $22 million in wages and salaries per
annum and spends an estimated additional $12.3 million per annum in the Southland
region on goods and services. These are quantified as direct economic impacts for theregion's economy arising from the Plant's operation.
Figure 6: Beef boners at the Mataura Plant.
ln addition, the economic assessment has identified a number of indirect impacts arising
from:
The effects on suppliers of goods and services provided to the Plant from within theregion (i.e. the "forward and backward linkage" effects); and
The supply of goods and services from within the region to employees at the plant
and to those engaged in supplying goods and services to the plant (i.e. the "induced"
effects). For example, there will be additional jobs and incomes for employees ofsupermarkets, restaurants and bars as a consequence of the additional expenditure
by employees directly employed at the plant.
Mataura Processing Plant Resource Consent Applications Summary Document 1'l 'rL
When these indirect effects are accounted for, the total contribution of the Plant's
operation is assessed to be 595 FTE jobs for Southland residents, and $38.5 million per
annum in wages and salaries for local Southland residents.
The economic assessment notes that the Mataura meat processing plant gives the Gore
District greater critical mass and as a consequence the residents and businesses within
the District beneflt from economies of scale, greater competition, increased resource
utilisation and better central government provided seruices. This is also true for the
Southland region, although to a lesser extent given the economic activity generated by the
plant is proponionately less for the region as compared to the Gore Districl.
Continuation of the Plant at its current site, on a longer consent term (i.e. 35 years) also
generates a number of economic efficiency benefits. The economic assessment identifies
these as including:
the continued use of existing plant and equipment with an insured value of $225
million (much of this value is sunk - i.e. it could not be recovered if the plant was
forced to downsize, close or be relocated);
the minimisation of transport costs (and carbon footprint) for livestock and finished
produd dispatch;
the availability of a trained and experienced workforce and businesses with
appropriate expertise and experience within close proximity of the Plan! and
greater certainty for investment and management of the Plant.
lf the Plant were to cease operation and Southland and farmers had to truck cattle out of
the region for processing, it would add to farmers'costs, reduce their disposable incomes
and reduce spending in the Gore District and elsewhere within the region.
Alliance also contributes directly to the economic and social wellbeing of the community
via its rates payments and other community contributions.
4.2 EFFECTS OF THE WATER TAKE
4.2.1 Entrainment
The Plant abstracts up to 35,600 m'/day of water using 18 pumps located on the true left
side of the hydro-race. As outlined above the intakes are fitted with screens. The water
velocity within the hydro-race is high which creates a high sweep velocity across the face
of the intake at the screen faces. This reduces the potential for entrainment of juvenile fish
in these intakes. However, despite this, FWS and AES have recommended that all the
intakes that are currently fltted with 5 - 6 mm screen mesh be fltted with 2 - 3 mm screens
to further reduce the potential for entrainment and to meet best practice standards for
screening intakes. Alliance propose to implement this recommendation.
a
a
a
a
Mataura Processing Plant Resource Consent Applications Summary Document 12 'IL
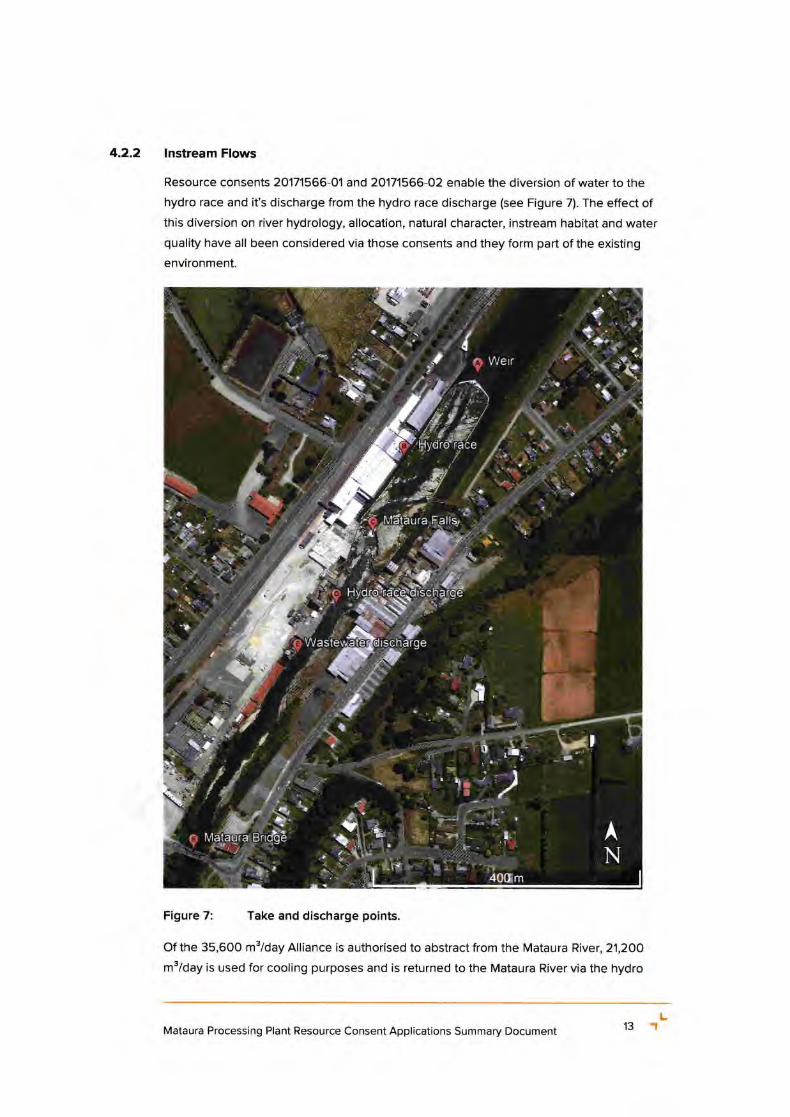
4.2.2 lnstream Flows
Resource consents 20171566-01 and 20171566-O2 enable the diversion of water to the
hydro race and it's discharge from the hydro race discharge (see Figure 7). The effect ofthis diversion on river hydrology, allocation, natural character, instream habitat and water
quality have all been considered via those consents and they form part of the existing
environment.
Figure 7: Take and discharge points.
Of the 35,500 m3/day Alliance is authorised to abstract from the Mataura River, 21,20O
m"/day is used for cooling purposes and is returned to the Mataura River via the hydro
Mataura Processing Plant Resource Consent Applications Summary Document 13 1 L
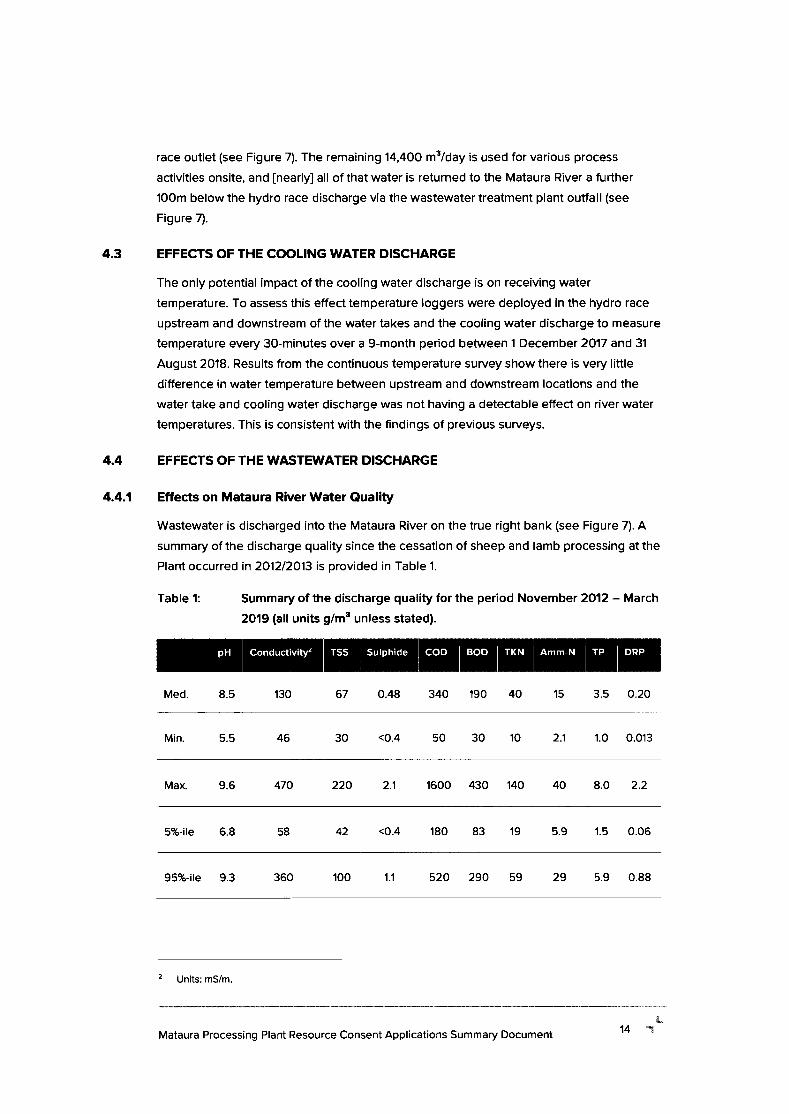
race outlet (see Figure 7). The remaining 14,400 m3/day is used for various process
aclivities onsite, and [nearly] all of that water is returned to the Mataura River a further
100m below the hydro race discharge via the wastewater treatment plant outfall (see
Figure 7).
4.3 EFFECTS OF THE COOLING WATER DISCHARGE
The only potential impacl of the cooling water discharge is on receiving water
temperature. To assess this effecl temperature loggers were deployed in the hydro race
upstream and downstream of the water takes and the cooling water discharge to measure
temperature every 3O-minutes over a 9-month period between 1 December 2017 and 31
August 20't8. Results from the continuous temperature survey show there is very little
difference in water temperature between upstream and downstream locations and the
water take and cooling water discharge was not having a detectable effect on river water
temperatures. This is consistent with the findings of previous surveys.
4.4 EFFECTS OF THE WASTEWATER DISCHARGE
4.4.1 Effects on Mataura River Water Quality
Wastewater is discharged into the Mataura River on the true right bank (see Figure 7). A
summary of the discharge quality since the cessation of sheep and lamb processing at the
Plant occurred in 201212013 is provided in Table 1.
Table 1: Summary of the discharge quality for the period November 2012 - March
2019 (all units g/m8 unless stated).
Med. 8.5 't30 67 0.48 340 190 40 15 3.5 0.20
lr, lconductivitv? rss
,surnhide,coD leoo lrxN ammru
lrn lone
Min. 5.5 46 30 <0.4 50 30 10 2.1 1.0 0.013
Max. 9.6 470 220 2.1 1600 430 140 40 8.0 2.2
S%-ile 6.8 58 42 <O.4 't80 83 19 5.9 1.5 0.06
95%-ile 9.3 360 'too 1.1 520 290 59 29 5.9 0.88
2 Units: ms/m.
t*Mataura Processing Plant Resource Consent Applications Summary Document 14-
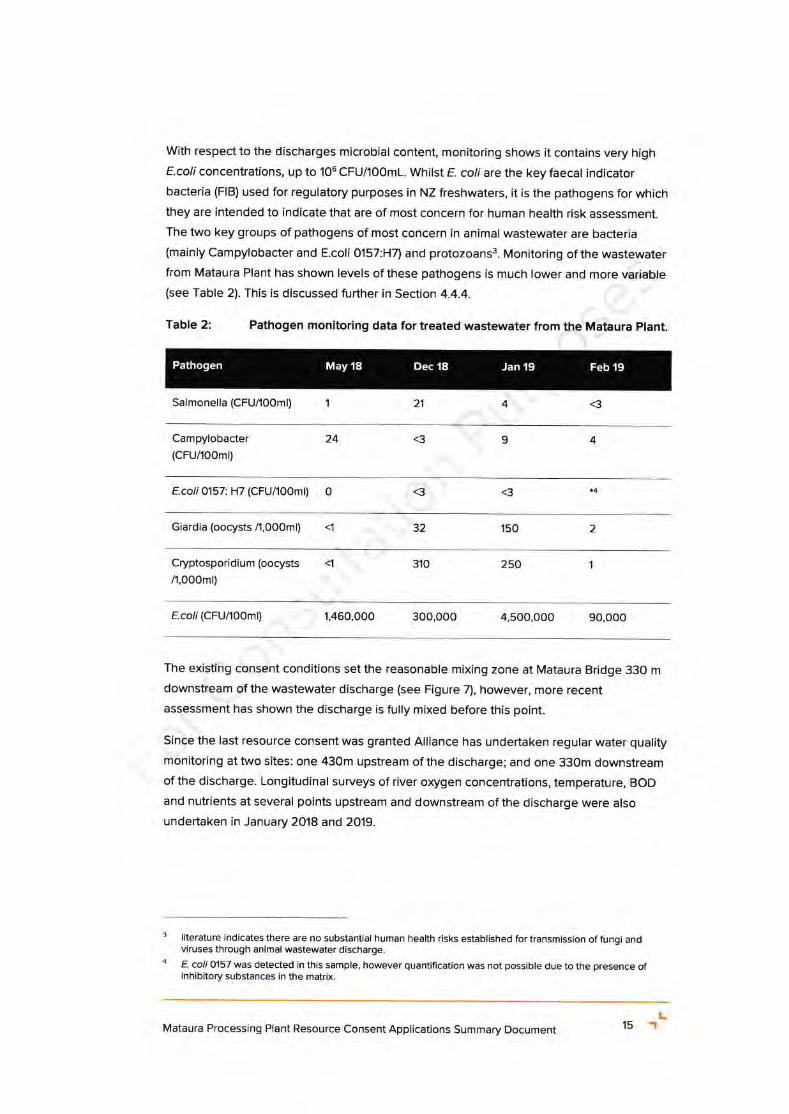
With respect to the discharges microbial content, monitoring shows it contains very high
E coli concentrations, up to 106 CFU/1OomL. Whilst E coli are the key faecal indicatorbacteria (FlB) used for regulatory purposes in NZ freshwaters, it is the pathogens for which
they are intended to indicate that are of most concern for human health risk assessment.
The two key groups of pathogens of most concern in animal wastewater are bacleria(mainly Campylobacter and E.coli 0157:H7) and protozoans3. Monitoring of the wastewaterfrom Mataura Plant has shown levels of these pathogens is much lower and more variable(see Table 2). This is discussed further in Section 4.4.4.
Table 2: Pathogen monitoring data for treated wastewater from the Mataura Plant.
Salmonella (CFU/1OOm|) 1 21 <34
Pathogen May18 Dec 18 Jan 19 Feb19
Campylobacter(CFU/10Oml)
24 <3 49
E.coti 0157: H7 (CFU/1OOm|) O <3 <3
32 150 2
Cryptosporidi u m (oocysts
/1,OOOml)
310 250
Ecoli (CFU/1OOml) 1,460,000 300,ooo 4,soo,ooo 90,ooo
The existing consent conditions set the reasonable mixing zone at Mataura Bridge 330 m
downstream of the wastewater discharge (see Figure 7), however, more recent
assessment has shown the discharge is fully mixed before this point.
Since the last resource consent was granted Alliance has undertaken regular water quality
monitoring at two sites: one 43Om upstream of the discharge; and one 330m downstream
of the discharge. Longitudinal surueys of river o{ygen concentrations, temperature, BOD
and nutrients at several points upstream and downstream of the discharge were also
undertaken in January 2018 and 2019.
literature indicates there are no substantial human health risks established for transmission of fungi andviruses through animal wastewater discharge.
E co/i 0157 was detected in this sample, however quantification was not possible due to the presence ofinhibitory substances in the matrix.
4
Mataura Processing Plant Resource Consent Applications Summary Document 15 'lL
a
FWS and AES have analysed that monitoring data and advised that it shows no evidence
that the discharge from the Plant is causing consistent measurable effects on water quality
except:
ln the immediate vicinity downstream of the discharge Amm-N and TN are elevated;
and
a E. coli is significantly elevated for many km downstream of the Plant.
The elevated Ecoli levels are discussed below in Section 4.4.4.
With respect to Amm-N, the monitoring data shows water quality reducing from attribute
NPS Freshwater State A for toxicity (annual medians 0.O2 - O.O3 g/m3) upstream of the
Plant to NPS Freshwater State B (annual medians 0.05 - 0.06 g/m3) downstream. AES and
FWS have looked at this in some detail and have advised it does not represent an effect
which requires immediate or urgent mitigation on ecological grounds.
This is because freshwater mussels are the only species protected by Amm-N attribute A
water quality, and they do not occur in the Mataura River immediately upstream or
downstream of the discharge. The Amm-N sensitive species that do occur in the Mataura
River in the vicinity of the discharge are the mayfly Deleotidium sp. and the snail
Potomopyrgus ontipodorum and these are protecled by the Attribute B state - which is
achieved.
AES and FWS have also advised that the catchment overall is degraded with respect to
water quality, and monitoring both upstream and downstream of the discharge has shown
that various nutrient indicators (including DIN and DRP) regularly exceed the relevant
guidelines relating to nuisance algal growth. But, as set out in Seclion 4.4.2 below
obseruations of periphyton suggest these relatively high levels are not generally
stimulating periphyton growths except following very long late summer / early autumn
accrual periods. Alliance's response to this catchment degradation matter is discussed
fufther in Section 5.3 below.
Ecologica! Effects in Mataura River
ln addition to monitoring and assessing effeds on water quality, FWS have monitored and
assessed effects on in-stream ecological values with a view to identiffing any instream
effects of the Plant's discharge. Potential effects of concern which FWS and AES were
looking for included:
o Proliferation of nuisance algal growths;
. Reduced benthic invertebrate community health; and
o Reduced fish abundance and diversity.
4.4.2
L.IMataura Processing Plant Resource Consent Applications Summary Document 16
Nuisance AIgal Growths
Nuisance algal growths include sewage fungus and periphyton. The amount of periphyton
in a river is determined by interactions between flow regime, nutrient status, light and
temperature, streambed substrate and benthic invertebrate grazing. Algal growths are the
most direct indicator of nutrient related effects on rivers and in turn have been monitored
at least annually since 2012.
This monitoring has recorded variable algal cover and biomass between sites upstream
and downstream of the Plant and among surveys. And it indicates that while DRP and DIN
concentrations are relatively high, this is not stimulating periphyton growths upstream or
downstream of the Plant except following very long late summer - early autumn accrual
periods (the most noticeable example of which was in February / March 2019). FWS and
AES have also advised the sewage fungus and periphyton monitoring data shows no
effect from the Plant's wastewater discharge.
Benthic lnvertebrates
Benthic invertebrates are a commonly used indicator of water quality with indices such as
the MCl, QMCI and percent EPTs designed to speciflcally assess nutrient related effects.
Benthic invertebrates have been monitored at least annually at several locations upstream
and downstream of the Plant since the early 1990s.
Overall the benthic invertebrate community upstream and downtream of the discharge
reflects the cumulative effect of catchment wide inputs upstream and is generally in fair topoor health across most benthic invertebrate indices.
Total taxa number and EPT taxa number have been variable across sites and between
surveys over the 2012-2019 period with no clear evidence that the discharge causes a
reduclion in total diversity or the diversity of water quality sensitive taxa. Prior to the most
recent surveys there had been a general increasing trend in Deleotidium sp. abundance at
downstream monitoring locations. ln February 2019 Deleoildium sp. abundance at the
downstream monitoring sites was lower compared to upstream sites. The decline in
Deleotidium sp. abundance at downstream sites in February 2O19 is not explained byperiphyton cover and biomass or Amm-N concentrations, which are all potential effecls ofthe discharge. However, it has been assessed that this decline in abundance could be
attributed to high river temperatures leading up to and at the time of the February 2019
survey and an increase in overall stress that occurred at the time. A sharp decline at
upstream and less pronounced decline at downstream sites in Deleatidium sp. was also
recorded in March 2019. This is very likely to be related to the elevated river temperature
and extensive late successional stage algal growths at the time of the survey associated
EPT h stands for Ephemeroptera (mayfly), Plecoptera (stonefly) and Trichoptera (caddisfly) which aremacroinvertebrates that are sensitive to water pollution.
5
Mataura Processing Plant Resource Consent Applications Summary Document 17 'r L
with the longest late summer - early autumn accrual period since 2012. lt also suggests
the upstream decline may have been slightly delayed compared with downstream.
MCI scores have been similar upstream and downstream of the Plant over the period
between January 2012 and March 2019 and remained within the 'fair'stream health range
for all sites. QMCI scores have been variable across years largely as a result of differences
in the relative abundance of Deleotidium. Overall FWS and AES advise that results indicate
the treated wastewater discharge has not resulted in a consistent decrease in MCI and
QMCI scores between upstream and downstream locations over a range of accrual
periods between April 2013 and December 2017. As outlined above the February and
March 2O19 surveys recorded lower Deleotidium abundance, and in turn reduced MCI and
QMCI scores downstream of the discharge and in the case of March 2O19 upstream as
well. However, these are likely to be due to a milrture of faclors and cumulative stress
including temperature and algal growths.
Fish
The lower Mataura River is a migratory pathway for eels or tuna, and important for a range
of whitebait species, brown trout and salmon. Fish abundance and health can be
influenced by a wide range of faclors including proximity to the coast, barriers such as the
Mataura Falls, habitat quality and water quality.
Results from fish surveys indicate the fish community in run habitats is dominated by a
small number of species - longfin and shortfin eel, (including elvers) and upland bully.
Elvers were more abundant at downstream sites compared to upstream sites, and could
either be attributed to differences in habitat suitably, or simply the timing of the upstream
migration by a particular group of new recruits into the river. The fish community in the
reach between the Mataura Falls and Mataura Bridge based on survey results indicates
that the Mataura River immediately upstream and downstream of the discharge supports a
healthy longfin eel population including severalvery large fish (+5 kg).
Anecdotal evidence indicates that there is a large resident population of brown trout and
late summer and early autumn run of sea run brown trout and salmon are regularly seen
and caught between the Mataura Falls and the Mataura Bridge. The presence of such
large numbers of brown trout and seasonal migration of some brown trout and salmon
indicate that the water quality in this section of the river is suitable for supporting
salmonids that are amongst the most water quality sensitive species present in New
Zealand.
Effects on Toetoes Estuary
As outlined in Section 2 Toetoes Estuary is in a declining condition in relation to
eutrophication with excessive nutrient inputs as the primary driver of the eutrophication
symptoms being expressed.
4.4.3
Mataura Processing Plant Resource Consent Applications Summary Document 18 '!L
The contribution of the Plant's discharge to Toetoes Estuary TN loads has been assessed
as being 1.1-1.7% and its contribution to TP has been assessed as 0.7{.3%, with the majority
of the TN and TP load entering Toetoes Estuary derived from other catchment inputsparticularly diffuse sources. While even a marked reduction of the Plant's TN and TP loads
would have little, if any, deteclable effect on the nutrient status of Toetoes Estuary,
Alliance acknowledge that it should contribute to any catchment wide plan for improving
water quality and the health of Toetoes Estuary.
4.4.4 E.coli and Human Health
Ecoli is the principle measure used by the NPSFW and Environment Southland's RMA
plans for determining the suitability of a river for contact recreation. E. coli is used as theindicator of possible faecal contamination because it is commonly found in human and
animal faeces and it is relatively inexpensive to monitor. As is the case for a significantnumber of New Zealand's waterbodies in lowland farming areas, Ecoli levels in theMataura River, including downstream of the Plant, are high. They sit in the Red NpSFW
Attribute State, and exceedances of the New Zealand single sample bathing waterstandardstll are common. They also do not meet the relevant Southland Land and Water
Plan standards. A recent Environment Southland study of Compytobocter risk in this
catchment using actual instream data for that parameter (rather than levels of E coli as an
indicator) suggests that the health risk in this catchment may not be anywhere near as high
as is suggested by the E.coli concentrations present,t2l and additional monitoring data
collected in 2018 by Streamlined Environmental supported this finding. However, Allianceunderstands that baseline water quality conditions in the Mataura River (absent any
contribution from the Plant) may be 'un-swimmable' at times due to contributions from
other sources.
As outlined in section 4.4.1 the Plant's discharge also contains relatively high
concentrations of E cof, and instream monitoring data shows E coli concentrations
increase significantly downstream of the Plant due to its wastewater discharge. However,
as is also outlined in Section 4.4.1, despite the Plant's discharge containing relatively high
E.coli levels, the level of pathogens in the discharge, which are of most concern whenconsidering effects on human health, are much lower and more variable.
To further understand the effect of the Plant elevating downstream E coli levels on human
health, a Quantitative Microbial Risk Assessment (QRMA) has been undeftaken byStreamlined Environmental to predict the health risk to people swimming in the Mataura
River below the Plant's discharge point as a result of the Plant's discharge only.
m 260 CFU/100m1 and 540 CFU/100mt.
Pr Cressey, P., Hodson, R., Ward, R., & Moriarty, E.l2}1n. Cressey, p., Hodson, r. Ward, N. and Moriarty, E l2117rUse of OMRA to Assess the Human Health Risk of the Mataura River, Southlandhttp://isrs2017.com/images/Cressey_Peter.pdf.
Mataura Processing Plant Resource Consent Applications Summary Document 19 'r L
4.4.5
The QMRA shows that while the Plant causes E coli concentrations in the Mataura River to
increase significantly below the Plant's discharge point, this does not equate to a
significant increase in health risk, and the risk of a person swimming below the Plant
becoming ill due to the Plant's discharge is well below'l% which is considered an
acceptable level. lt is noted that this is broadly consistent with the aforementioned
Environment Southland study which concluded the Plant's discharge contributed only a
relatively small propoftion of the overall Campylobacler risk in this catchment.l3l
However, while the Environment Southland and Streamlined Environmental studies show
the baseline health risk in this catchment, and the Plant's contribution to that health risk,
are not as significant as measured E.coli levels urould suggest, this does not equate to
there being no risk. lt is evident that there are times when the Mataura River is un-
swimmable and Environment Southland is obliged under the NPSFW to set policy and
methods to improve water quality so that it is suitable for primary contact more often. The
key indicator for how that is being achieved is also instream E coll concentrations. ln that
context Alliance acknowledges it should contribute to any catchment wide plan for
improving water quality for contact recreation, and reducing E.coli concentrations in the
Mataura River. This is discussed further in Section 5.3 below.
Effects on Recreation
Rob Greenaway & Associates has undertaken a qualitative and quantitative assessment in
order to determine the recreational values that exist in the Mataura River and whether
these are being affected by the Plant and more specifically the wastewater discharge to
the Mataura River.
The following key recreational values have been identified:
o The outstanding nature of the Mataura River for brown trout fishing;
o lts relatively high use for swimming, both upstream and downstream of Mataura;
o A very popular whitebait fishery in the lower reaches;
o Use of the riverbanks, berms, reserves and angler access points for a variety of
terrestrial activities, mostly around settlements, and with relatively high activity levels
at the Coal Pit Road angler access point;
o A low level of use of the River for salmon fishing;
r Some use of the River for jet boating and kayaking, but with no relevant data to
quantify these uses.
Fl Cressey, P., Hodson, R., Ward, R., & Moriarty, E. (2017t. Cressey, P., Hodson, r. Ward, N. and Moriarty, E (20'14Use of QMRA to Assess the Human Health Risk of the Mataura River, Southlandhttp://isrs2017.com/images/Cressey_Peter.pdf.
Mataura Processing Plant Resource Consent Applications Summary Document 20 'tL
Consultation (including formal interviews) with key recreational stakeholders and users ofthe Mataura River is currently undenvay. This is intended to identiff what the key
determinants of in-river recreation value are, particularly for water quality, and the degree
to which the discharge affects these values. The findings of this assessment will form part
of the application.
4.4.6 Cultural Effects
The Mataura River is significant to Maori. This has been recognised in statute under the
Ngai Tahu Claims Settlement Act 1998. The Mataura River is identified as a Statutory
Acknowledgement Area under that Act and contains a Miitaitai Reserve.
Alliance has commissioned Te Ao Marama lnc. to complete a cultural impact assessment
of the proposed activities. That work is ongoing and will form part of the resource consent
applications.
5. MITIGATION, MANAGEMENT AND MONITOR!NG OF EFFECTS
5.I ABSTRACTION
As set out in Section 4.2 the only potential effect of any consequence associated with the
take of water is the potential for juvenile fish to be entrained in the intakes. FWS
recommended that all the intakes that are currently fitted with 5 - 6 mm screen mesh be
fitted with 2 - 3 mm screens to further reduce the potential for this to occur and to meet
best practice standards for screening intakes. Alliance propose to implement this
recommendation.
COOLING WATER DISCHARGE
No adverse effeds requiring mitigation have been identified
WASTEWATER DISCHARGE
A comprehensive assessment of the effects of the discharge on the receiving environment
has determined that no adverse effects trigger the need for immediate or urgent
mitigation.6
However, that assessment has identified that:
The lower Mataura River contains very high levels of Ecoli above and below the
discharge, but the Plant's discharge significantly increases those levels in the
receiving water downstream.
5.2
5.3
a
6 Freshwater Solutions Ltd 2019. Assessment of the Effects of Alliance Mataura's Discharges and Water Takeon Mataura River and Toetoes Estuary. Submitted to Alliance Group Ltd (DRAFT). March 2O19.
Mataura Processing Plant Resource Consent Applications Summary Document 21 'rL
a The Mataura River can generally be characterised as degraded in terms of the
nitrogen levels present, periphyton reflects moderate to high enrichment at times, and
MCI and QMCI data are representative of fair to poor health. Toetoes Estuary also
continues to degrade with extensive macroalgal growth driven by very high nutrient
loads from the catchment. While there is no evidence suggesting the Plant's
discharge has a direcl adverse effecl on these stressors downstream of the
discharge, it does contribute to the overall loads of Amm-N and TN present
downstream of the discharge.
The planning framework which applies here anticipates a long-term catchment wide
improvement in water quality for these key parameters. No detail is available yet on the
eltent of the catchment scale improvement anticipated for each parameter, or the
timeframes and methods for achieving that improvement, including which parameter
should be afforded priority. The planning framework anticipates these matters will be
determined via a collaborative planning process for the Mataura Freshwater Management
Unit (FMU) involving all key stakeholders which is expected to commence soon. The initial
outputs from that collaborative planning process are not expecled to be complete until
2022, and they are not expected to be formalized via the RMA Schedule 1 process until at
least 2024. However, given Alliance will be making applications for long term consents,
the plan for improving water quality in the catchment will be finalised, and implemented
during the term of those new resource consents.
Alliance has sought advice from PDP on what methods and technology could be
potentially employed in order to reduce the loads of these key parameters from the Plant
to the Mataura River over the term of the consent to be sought.
As an initial step PDP developed a long-list of available alternative management options
for the Plant. Options incorporating continued discharge to the Mataura River, irrigation to
land, or a dual discharge combination, and discharge to trade waste were considered. Of
the assessed long list options, those incorporating signiflcant risk and unceftainty, and
substantial lifecycle costs were removed from further assessment.
The options selected for further assessment included
Existing river discharge with biological treatment for cBODs and nitrogen removal with
UV disinfection;
Existing river discharge with filtration and UV disinfection;
Existing river discharge with biological treatment for cBODs and nitrogen removal with
UV disinfection of the green waste stream;
Dual discharge with the existing river discharge combined with discharge to dairy
pasture with no treatment prior to river discharge;
a
a
a
a
Mataura Processing Plant Resource Consent Applications Summary Document 22 'rt-
a
a Dual discharge with the existing river discharge combined with discharge to a cut and
carry system with no treatment prior to river discharge.
Each of the short-listed options was then assessed further, considering the potential for
the option to reduce contaminant loads to the Mataura River, option resilience, and
lifecycle costs.
As a result of that further assessment it appears that:
Reducing E coli concentrations in the discharge will likely require tertiary disinfection
of microbial contaminants at a capital cost of approximately $4.1 million, and
additional annual operational expenditure of $230,000.
Reducing Amm-N, TN and E.coli in the discharge will likely require the installation of a
biological treatment system at a capital cost of approximately $tt - 15 million and
additional annual operational expenditure of $530,000 - $790,000.
a A dual discharge option is unlikely to be preferred in this case because:
There is a limited amount of suitable irrigation land in proximity to the Plant, and
the volumes involved mean a large portion of that which is available would need
to be utilised; and
This option would only be economically sensible if no fufther upgrades to theWWTP are completed over the term of the consent, meaning the current levels ofAmm-N, TN and E coli would still be discharged to the Mataura River during thewinter months, and at other times of the year during wet periods. Alliance's
freshwater ecology advisors have cautioned against this due to the propensity for
spring, autumn and even winter blooms in phytoplankton.
Alliance is still reflning the options to address the catchment degradation issue in its
applications. The key matters currently being worked through are:
The estimated capital cost of an upgrade to address both E coli and nitrogen is
approximately $tt - 15 million, with increased annual operational expenditure of
$530,000 - $790,000. This would represent a significant project, and the funds need
to be budgeted and provided for alongside other capital and environmental projects
Alliance needs to undertake across all its plants. This includes in excess of $20 million
of wastewater treatment plant upgrades at Alliance's Lorneville Plant, and work toreduce the amount of fine particulate matter discharged from the Mataura Plant's
boiler. The cooperative nature of the company is important in this regard. Money thatis set aside for this projecl is money which cannot be invested by farmers in improving
their on-farm environmental management and for that reason also needs to be
approached with care.
a
a
Mataura Processing Plant Resource Consent Applications Summary Document 23 'r L
a
There is potential to stage any wastewater treatment plant upgrade whereby
installation of tertiary disinfection to address E.coli can be done in advance of
installing a biological treatment system.
Due to the FMU process having not yet commenced there is currently uncertainty on
the extent of improvement in water quality that will be required in the Mataura
Catchment, and uncertainty in how that will be achieved and over what timeframe.
It is expected to take ES and the Mataura catchment community some time to
undertake catchment wide reductions in nutrients so that meaningful improvements in
the environment result. lt is difficult to justify spending substantial sums of money well
ahead of the necessary catchment-wide improvements, if the result is that until the
rest of the catchment catches up the environment and Alliance get no meaningful
return on that investment and any improvements would be hard to detecl.
SUMMARY
Table 3 below contains a summary of the mitigation, monitoring and reporting measures
currently being considered in respect of each actual and potential effect.
a
5.4
Mataura Processing Plant Resource Consent Applications Summary Document 24 'rL
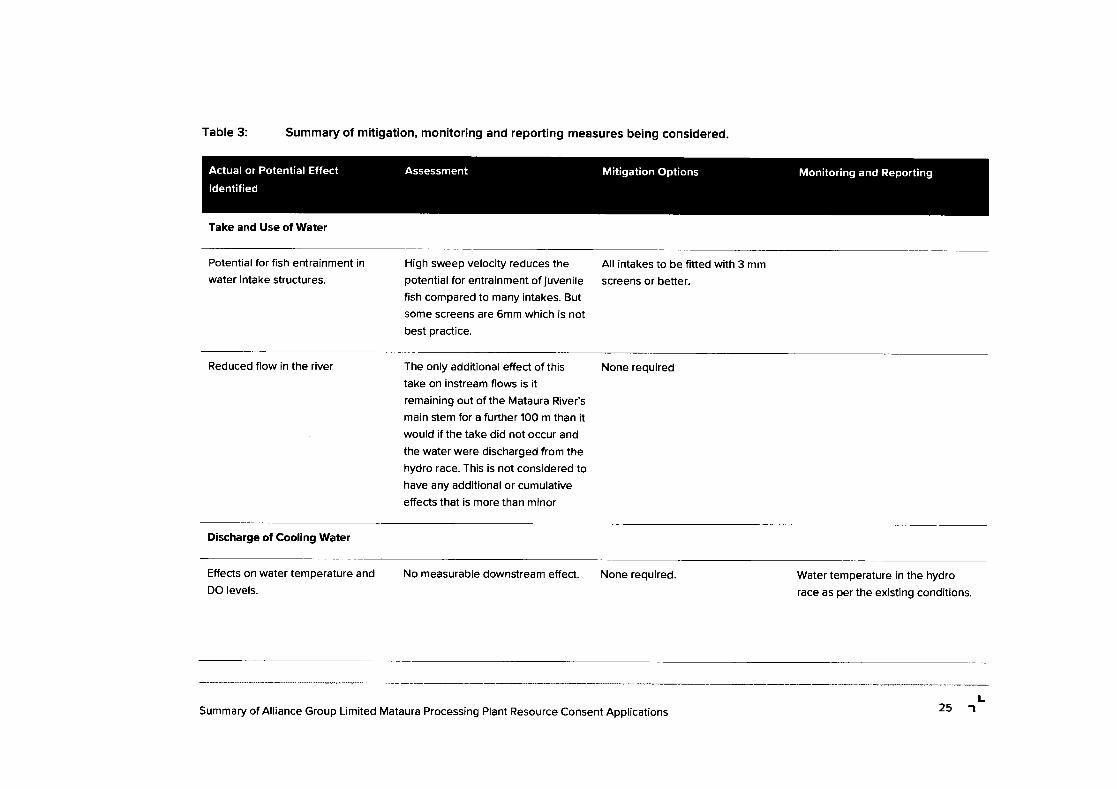
Table 3: Summary of mitigation, monitoring and reporting measures being considered.
Take and Use of Water
Actual or Potential Effect
ldentified
Mitigation Options Monitoring and ReportingAssessment
Potential for fish entrainment in
water intake structures.
High sweep velocity reduces thepotential for entrainment of juvenile
fish compared to many intakes. But
some screens are 6mm which is not
best practice.
All intakes to be fitted with 3 mm
screens or better.
Reduced flow in the river The only additional effect of thistake on instream flows is it
remaining out of the Mataura River's
main stem for a further 100 m than itwould if the take did not occur and
the water were discharged from thehydro race. This is not considered tohave any additional or cumulative
effects that is more than minor
None required
Discharge of Cooling Water
Effecls on water temperature and
DO levels.
No measurable downstream effect. None required Water temperature in the hydro
race as per the existing conditions.
Summary of Alliance Group Limited Mataura Processing Plant Resource Consent Applications 25 'rL
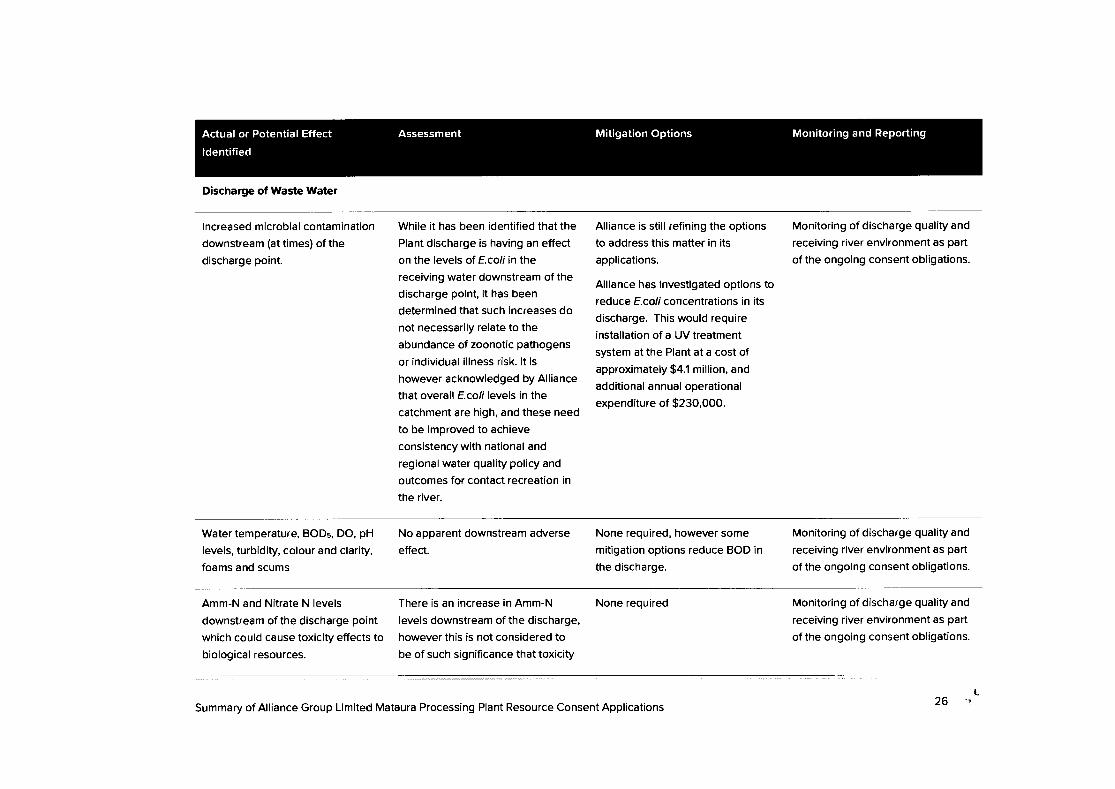
Actual or Potential Effect
ldentified
Mitigation Options Monitoring and ReportingAssessment
Discharge of Waste Watel
lncreased microbial contamination
downstream (at times) of the
discharge point.
While it has been identified that the
Plant discharge is having an effeclon the levels of E coli in the
receiving water downstream of the
discharge point, it has been
determined that such increases do
not necessarily relate to the
abundance of zoonotic pathogens
or individual illness risk. lt is
however acknowledged by Alliance
that overall E coll levels in the
catchment are high, and these need
to be improved to achieve
consistency with national and
regional water quality poliry and
outcomes for contact recreation in
the river.
Alliance is still reflning the options
to address this matter in its
applications.
Alliance has investlgated options to
reduce E co/l concentrations in its
discharge. This would require
installation of a UV treatment
system at the Plant at a cost of
approximately $4.1 million, and
additional annual operational
expenditure of $23O,OOO.
Monitoring of discharge quality and
receiving river environment as part
of the ongoing consent obligations.
Water temperature, BODs, DO, pH
levels, turbidity, colour and clarity,
foams and scums
No apparent downstream adverse
effecl.
None required, however some
mitigation options reduce BOD in
the discharge.
Monitoring of discharge quality and
receiving river environment as part
of the ongoing consent obligations.
Amm-N and Nitrate N levels
downstream of the discharge point
which could cause toxicity effects to
biological resources.
There is an increase in Amm-N
levels downstream of the discharge,
however this is not considered to
be of such significance that toxicity
None required Monitoring of discharge quality and
receiving river environment as part
of the ongoing consent obligations.
L26 -1
Summary of Alliance Group Limited Mataura Processing Plant Resource Consent Applications
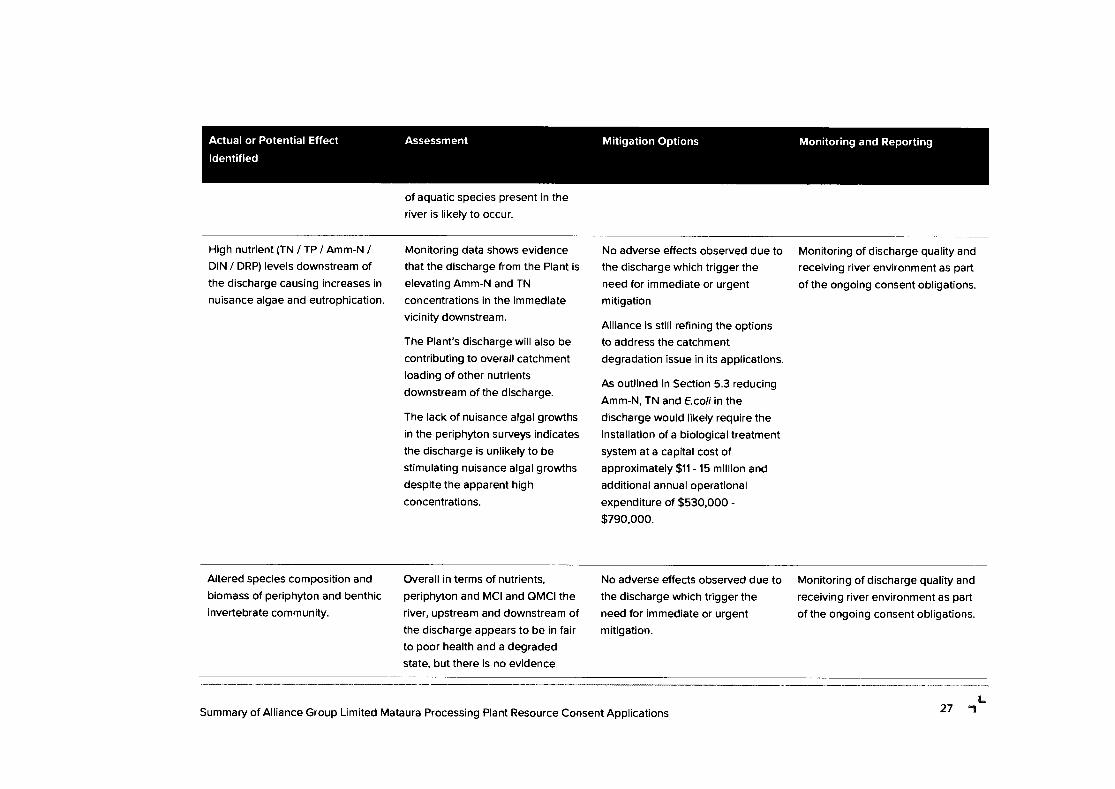
Actual or Potential Effect
ldentifiedMitigation Options Monitoring and ReportingAssessment
of aquatic species present in the
river is likely to occur.
High nutrient (TN / TP / Amm-N /DIN / DRP) levels downstream of
the discharge causing increases in
nuisance algae and eutrophication.
Monitoring data shows evidencethat the discharge from the Plant is
elevating Amm-N and TN
concentrations in the immediate
vicinity downstream.
The Plant's discharge will also be
contributing to overall catchmentloading of other nutrients
downstream of the discharge.
The lack of nuisance algal growths
in the periphyton surveys indicates
the discharge is unlikely to be
stimulating nuisance algal growths
despite the apparent high
concentrations.
No adverse effects observed due tothe discharge which trigger the
need for immediate or urgentmitigation
Alliance is still refining the optionsto address the catchment
degradation issue in its applications.
As outlined in Section 5.3 reducing
Amm-N, TN and Ecoli in the
discharge would likely require the
installation of a biological treatment
system at a capital cost ofapproximately $11 - 15 million and
additional annual operational
expenditure of $530,000 -
$790,000.
Monitoring of discharge quality and
receiving river environment as part
of the ongoing consent obligations.
Altered species composition and
biomass of periphyton and benthic
invertebrate community.
Overall in terms of nutrients,
periphyton and MCI and QMCI the
river, upstream and downstream ofthe discharge appears to be in fair
to poor health and a degraded
state, but there is no evidence
No adverse effects observed due to
the discharge which trigger the
need for immediate or urgent
mitigation.
Monitoring of discharge quality and
receiving river environment as part
of the ongoing consent obligations.
Summary of Alliance Group Limited Mataura Processing Plant Resource Consent Applications 27 'l t*
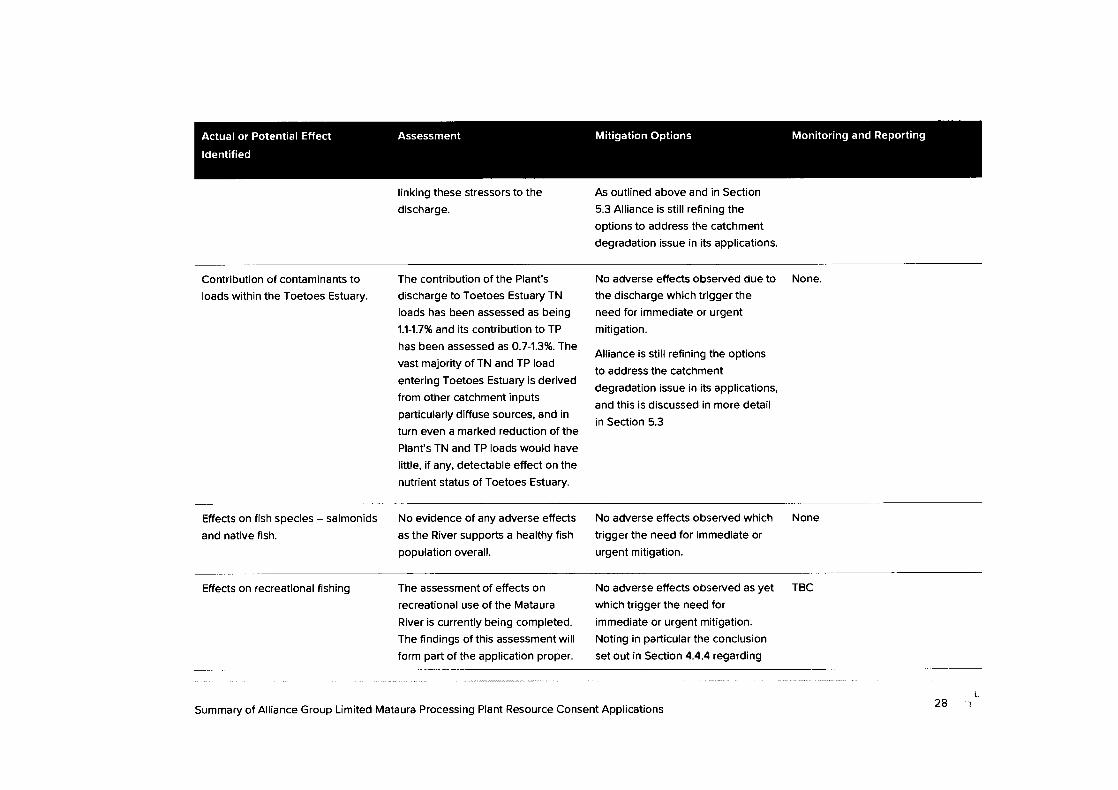
Actual or Potential Effect
ldentified
Mitigation Options Monitoring and ReportingAssessment
linking these stressors to the
discharge.
As outlined above and in Section
5.3 Alliance is still refining the
options to address the catchment
degradation issue in its applications.
Contribution of contaminants to
loads within the Toetoes Estuary.
The contribution of the Plant's
discharge to Toetoes Estuary TN
loads has been assessed as being
1.1-1.7% and its contribution to TP
has been assessed as 0.71.3%. The
vast majority of TN and TP load
entering Toetoes Estuary is derived
from other catchment inputs
particularly diffuse sources, and in
turn even a marked reduction of the
Plant's TN and TP loads would have
little, if any, detectable effect on the
nutrient status of Toetoes Estuary.
No adverse effects observed due to
the discharge which trigger the
need for immediate or urgent
mitigation.
Alliance is still refining the options
to address the catchment
degradation issue in its applications,
and this is discussed in more detail
in Section 5.3
None.
Effects on fish species - salmonids
and native fish.
No evidence of any adverse effects
as the River supports a healthy fish
population overall.
No adverse effects observed which
trigger the need for immediate or
urgent mitigation.
None
Effects on recreational fishing The assessment of effects on
recreational use of the Mataura
River is currently being completed.
The findings of this assessment will
form part of the application proper.
No adverse effects observed as yet
which trigger the need forimmediate or urgent mitigation.
Noting in particular the conclusion
set out in Section 4.4.4 regarding
TBC
28 ":lSummary of Alliance Group Limited Mataura Processing Plant Resource Consent Applications
t
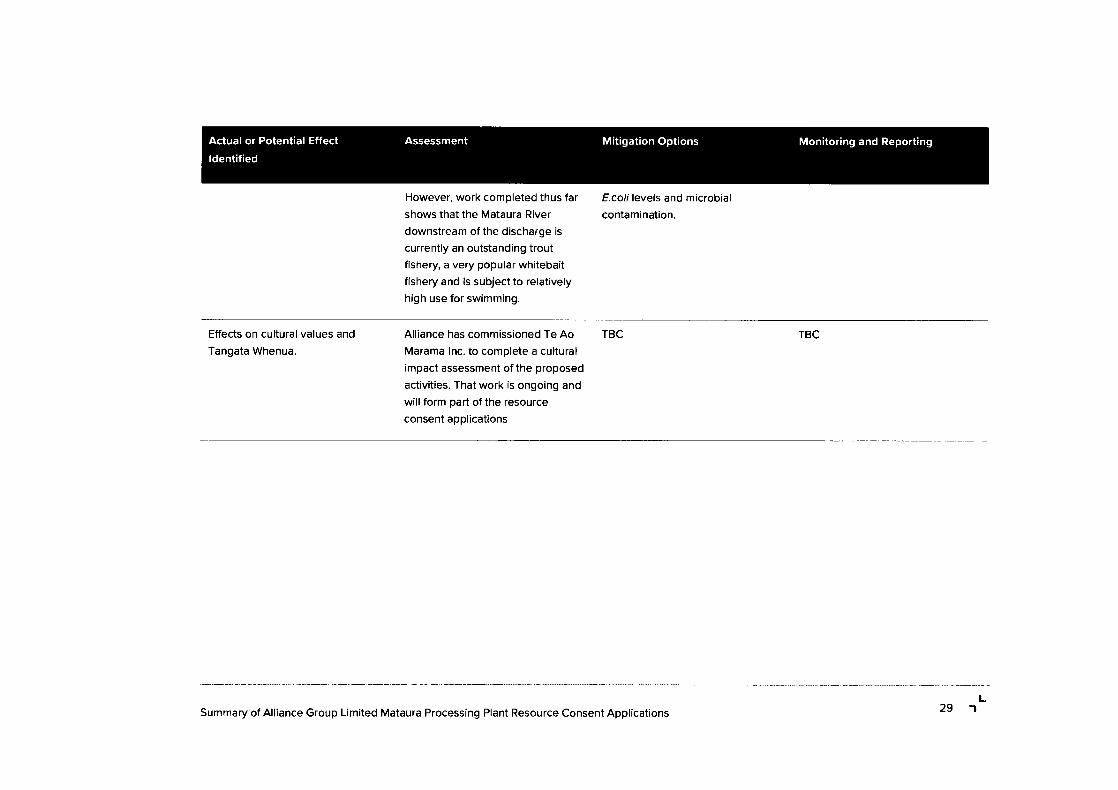
Actual or Potential Effect
ldentified
Mitigation Options Monitoring and ReportingAssessment
However, work completed thus far
shows that the Mataura River
downstream of the discharge is
currently an outstanding trout
fishery, a very popular whitebait
fishery and is subject to relatively
high use for swimming.
E coli levels and microbial
contamination.
Effects on cultural values and
Tangata Whenua.
Alliance has commissioned Te Ao
Marama lnc. to complete a cultural
impact assessment of the proposed
activities. That work is ongoing and
will form part of the resource
consent applications
TBC TBC
Summary of Alliance Group Limited Mataura Processing Plant Resource Consent Applications 29 1L
L
.I
APPENDIX 10
Consultation meeting notes
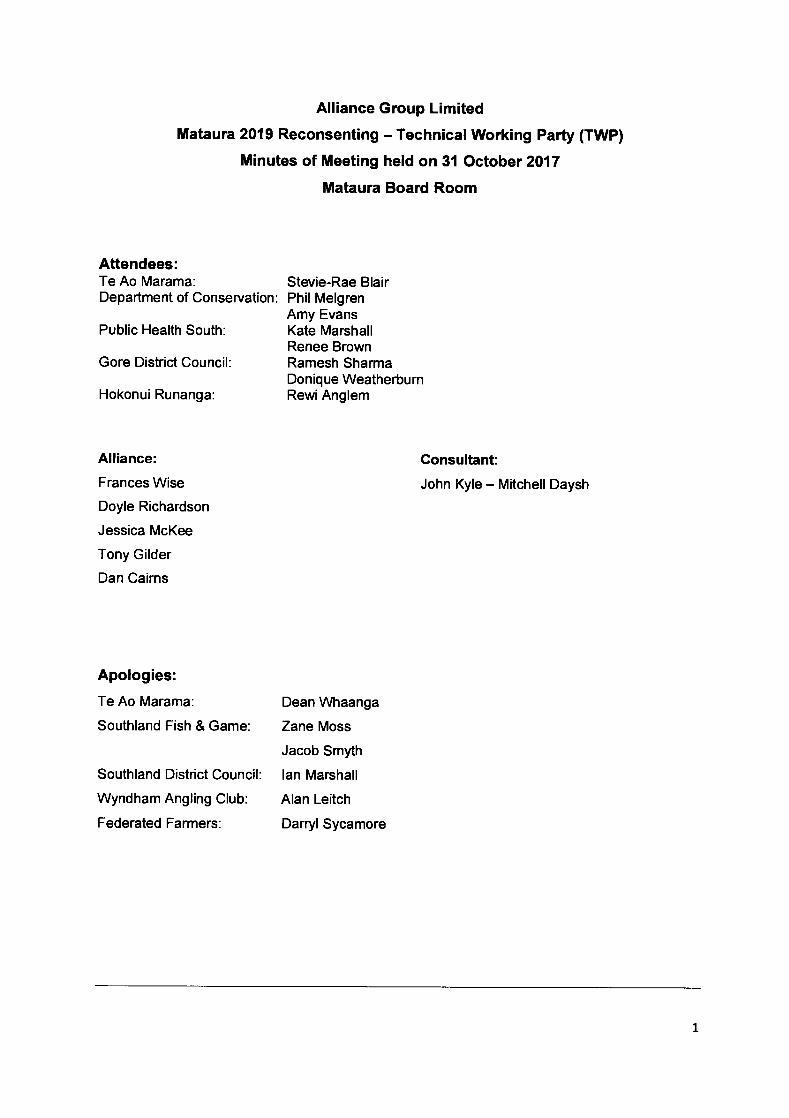
Alliance Group Limited
Mataura 2019 Reconsenting - Technical Working Party (TWP)
Minutes of Meeting held on 31 October 2017
Mataura Board Room
Attendees:Te Ao Marama:Department of Conservation
Public Health South
Gore District Council
Hokonui Runanga:
Alliance:
Frances Wise
Doyle Richardson
Jessica McKee
Tony Gilder
Dan Cairns
Apologies:
Te Ao Marama:
Southland Fish & Game:
Southland District Council
Wyndham Angling Club:
Federated Farmers:
Stevie-Rae BlairPhil MelgrenAmy EvansKate MarshallRenee BrownRamesh SharmaDonique WeatherburnRewiAnglem
Dean Whaanga
Zane Moss
Jacob Smyth
lan Marshall
Alan Leitch
Darryl Sycamore
Consultant:
John Kyle - Mitchell Daysh
1
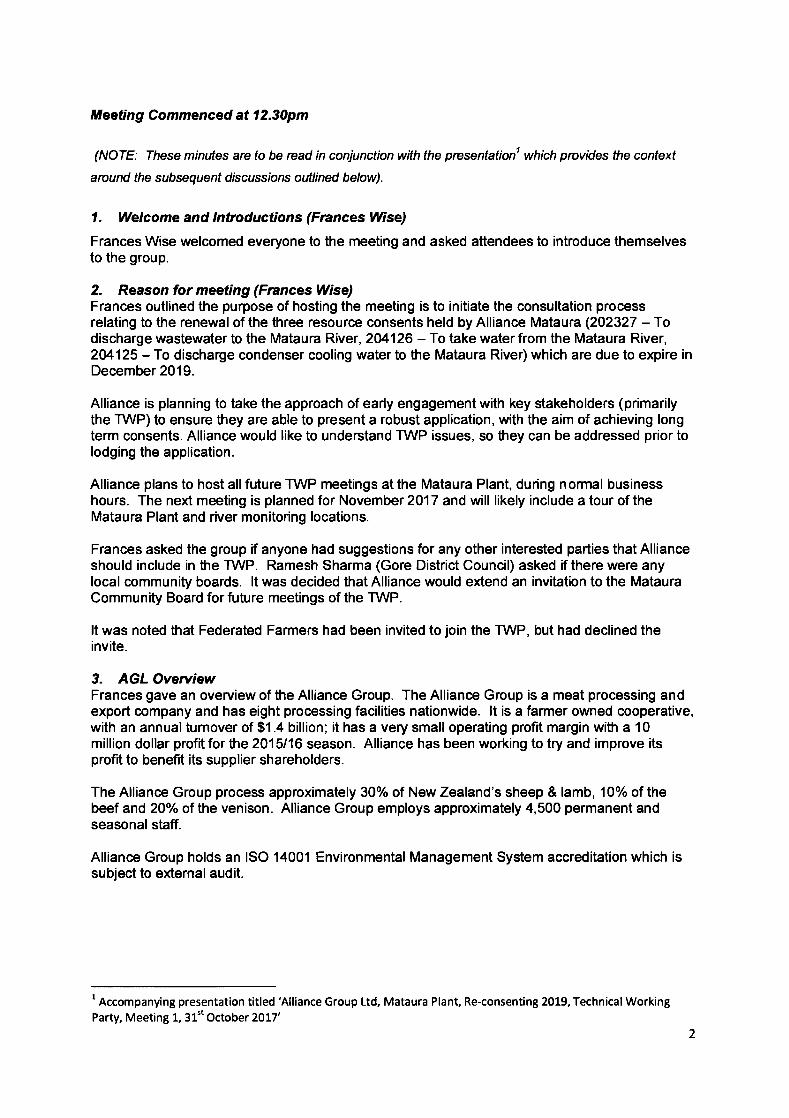
Meeting Commenced at 12.30pm
(NOTE: Ihese minutes are to be read in conjunction with the prcsentationl which provides the context
around the subsequenf drccussrbns outlined below).
1. Welcome and lntroductbns (Frances Wise)
Frances Wise welcomed everyone to the meeting and asked attendees to introduce themselvesto the group.
2. Reason for meeting (Fnnces Wise)Frances outlined the purpose of hosting the meeting is to initiate the consultation processrelating to the renewalof the three resour@ consents held byAlliance Mataura (2O2327 -Todischarge wastewater to the Mataura River, 204126 - To take water from the Mataura River,204125 - To discharge condenser cooling water to the Mataura River) which are due to expire inDecember 2019.
Alliance is planning to take the approach of early engagement with key stakeholders (primarilythe TWP) to ensure they are able to present a robust application, with the aim of achieving longterm consents. Alliance would like to understand TWP issues, so they can be addressed prior tolodging the application.
Alliance plans to host all future TWP meetings at the Mataura Plant, during normal businesshours. The next meeting is planned for November 2017 and will likely include a tour of theMataura Plant and river monitoring locations.
Frances asked the group if anyone had suggestions for any other interested parties that Allianceshould include in the TWP. Ramesh Sharma (Gore District Council) asked if there were anylocal community boards. lt was decided that Alliance would extend an invitation to the MatauraCommunity Board for future meetings of the TWP.
It was noted that Federated Farmers had been invited to join the TWP, but had declined theinvite.
3. AGL OveruiewFrances gave an overview of the Alliance Group. The Alliance Group is a meat processing andexport company and has eight processing facilities nationwide. lt is a farmer owned cooperative,with an annual tumover of $1.4 billion; it has a very small operating profit margin with a 10million dollar profit for the 2015/16 season. Alliance has been working to try and improve itsprofit to benefit its supplier shareholders.
The Alliance Group process approximately 30% of New Zealand's sheep & lamb, 10% of thebeef and 20o/o of the venison. Alliance Group employs approximately 4,500 permanent andseasonal staff.
Alliance Group holds an ISO 14001 Environmental Management System accreditation which issubject to external audit.
t Accompanying presentation titled ?lliance Group Ltd, Mataura Plant, Re-consenting 2019, Technical WorkingParty, Meeting 1, 31't October 2017'
2
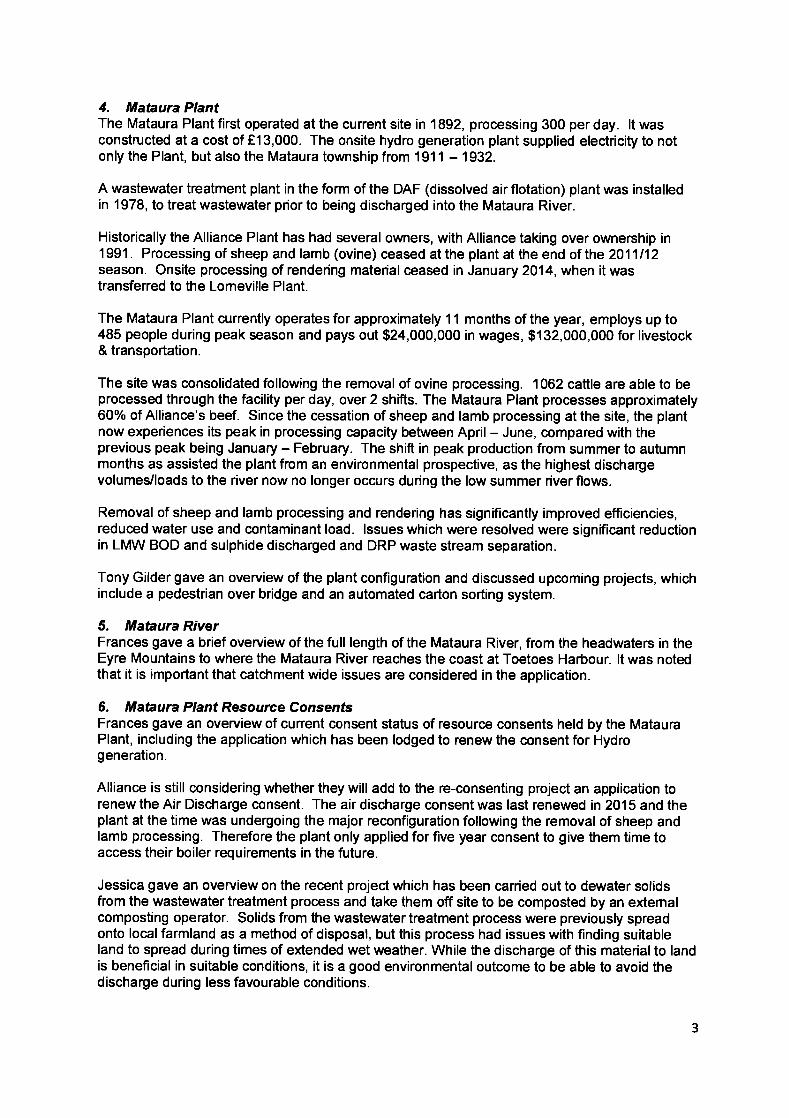
4. Mataura PlantThe Mataura Plant first operated at the current site in 1892, processing 300 per day. lt wasconstructed at a cost of 813,000. The onsite hydro generation plant supplied electricity to notonly the Plant, but also the Mataura township from 1911 - 1932.
A wastewater treatment plant in the form of the DAF (dissolved air flotation) plant was installedin 1978, to treat wastewater prior to being discharged into the Mataura River.
Historically the Alliance Plant has had several owners, with Alliance taking over ownership in1991 . Processing of sheep and lamb (ovine) ceased at the plant at the end of the 2011112season. Onsite processing of rendering material ceased in January 2014, when it wastransferred to the Lomeville Plant.
The Mataura Plant currently operates for approximately 1 1 months of the year, employs up to485 people during peak season and pays out $24,000,000 in wages, $132,000,000 for livestock& transportation.
The site was consolidated following the removal of ovine processing. 1062 cattle are able to beprocessed through the facility per day, over 2 shifts. The Mataura Plant processes approximately60% of Alliance's beef. Since the cessation of sheep and lamb processing at the site, the plantnow experiences its peak in processing capacity between April - June, compared with theprevious peak being January - February. The shift in peak production from summer to autumnmonths as assisted the plant from an environmental prospective, as the highest dischargevolumes/loads to the river now no longer occurs during the low summer river flows.
Removal of sheep and lamb processing and rendering has significantly improved efficiencies,reduced water use and contaminant load. lssues which were resolved were significant reductionin LMW BOD and sulphide discharged and DRP waste stream separation.
Tony Gilder gave an overview of the plant configuration and discussed upcoming projects, whichinclude a pedestrian over bridge and an automated carton sorting system.
5. Mabura RiverFrances gave a brief overview of the full length of the Mataura River, from the headwaters in theEyre Mountains to where the Mataura River reaches the coast at Toetoes Harbour. lt was notedthat it is important that catchment wide issues are considered in the application.
6. Mataura Plant Resource ConsentsFrances gave an overview of current consent status of resource consents held by the MatauraPlant, including the application which has been lodged to renew the consent for Hydrogeneration.
Alliance is still considering whether they will add to the re-consenting project an application torenew the Air Discharge consent. The air discharge consent was last renewed in 2015 and theplant at the time was undergoing the major reconfiguration following the removal of sheep andlamb processing. Therefore the plant only applied for five year consent to give them time toaccess their boiler requirements in the future.
Jessica gave an overview on the recent project which has been carried out to dewater solidsfrom the wastewater treatment process and take them off site to be composted by an extemalcomposting operator. Solids from the wastewater treatment process were previously spreadonto local farmland as a method of disposal, but this process had issues with finding suitableland to spread during times of extended wet weather. While the discharge of this material to landis beneficial in suitable conditions, it is a good environmentaloutcome to be able to avoid thedischarge during less favourable conditions.
3
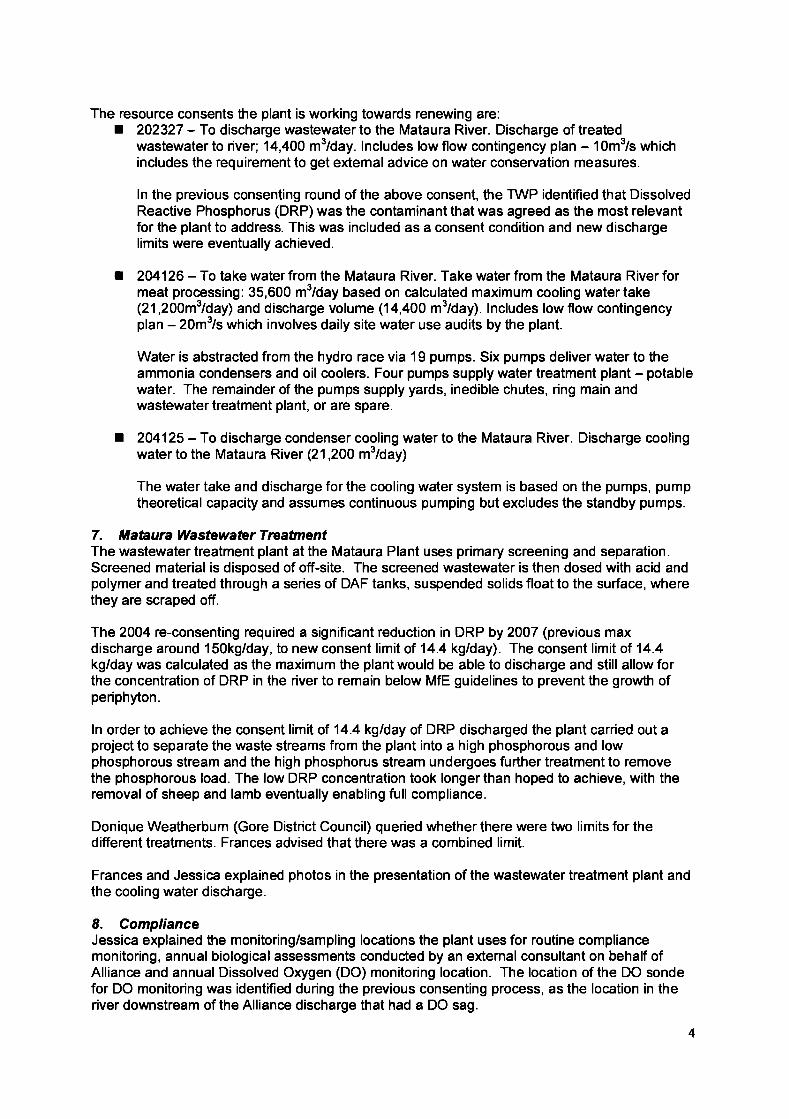
The resource consents the plant is working towards renewing are:I 202327 - To discharge wastewater to the Mataura River. Discharge of treated
wastewater to river; 14,400 m3/day. lncludes low flow contingency plan - 10m3/s whichincludes the requirement to get extemal advice on water conservation measures.
I 2U126 - To take waterfrom the Mataura River. Take waterfrom the Mataura Riverformeat processing: 35,600 m3/day based on calculated maximum cooling watertake(21 ,2}Om3lday) and discharge volume (14,400 m3/day). lncludes low flow contingencyplan - 20m3/s which involves daily site water use audits by the plant.
ln the previous consenting round of the above consent, the TWP identified that DissolvedReactive Phosphorus (DRP) was the contaminant that was agreed as the most relevantfor the plant to address. This was included as a consent condition and new dischargelimits were eventually achieved.
Water is abstracted from the hydro race via 19 pumps. Six pumps deliver water to theammonia condensers and oil coolers. Four pumps supply water treatment plant - potablewater. The remainder of the pumps supply yards, inedible chutes, ring main andwastewater treatment plant, or are spare.
204125 - To discharge condenser cooling water to the Mataura River. Discharge coolingwater to the Mataura River (2'1,200 m3/day)
The water take and discharge for the cooling water system is based on the pumps, pumptheoretical capacity and assumes continuous pumping but excludes the standby pumps.
7. Mabura Wastewater TreatmentThe wastewater treatment plant at the Mataura Plant uses primary screening and separation.Screened material is disposed of off-site. The screened wastewater is then dosed with acid andpolymer and treated through a series of DAF tanks, suspended solids float to the surface, wherethey are scraped off.
The 2004 re-consenting required a significant reduction in DRP by 2OO7 (previous maxdischarge around 150k9/day, to new consent limit of 14.4 kglday). The consent limit of 14.4kg/day was calculated as the maximum the plant would be able to discharge and still allow forthe concentration of DRP in the river to remain below MfE guidelines to prevent the growth ofperiphyton.
ln order to achieve the consent limit of 14.4 kglday of DRP discharged the plant carried out aproject to separate the waste streams from the plant into a high phosphorous and lowphosphorous stream and the high phosphorus stream undergoes further treatment to removethe phosphorous load. The low DRP concentration took longer than hoped to achieve, with theremoval of sheep and lamb eventually enabling full compliance.
Donique Weatherbum (Gore District Council) queried whether there were two limits for thedifferent treatments. Frances advised that there was a combined limit.
Frances and Jessica explained photos in the presentation of the wastewater treatment plant andthe cooling water discharge.
8. ComplianceJessica explained the monitoring/sampling locations the plant uses for routine compliancemonitoring, annual biological assessments conducted by an external consultant on behalf ofAlliance and annual Dissolved Orygen (DO) monitoring location. The location of the DO sondefor DO monitoring was identified during the previous consenting pro@ss, as the location in theriver downstream of the Alliance discharge that had a DO sag.
4
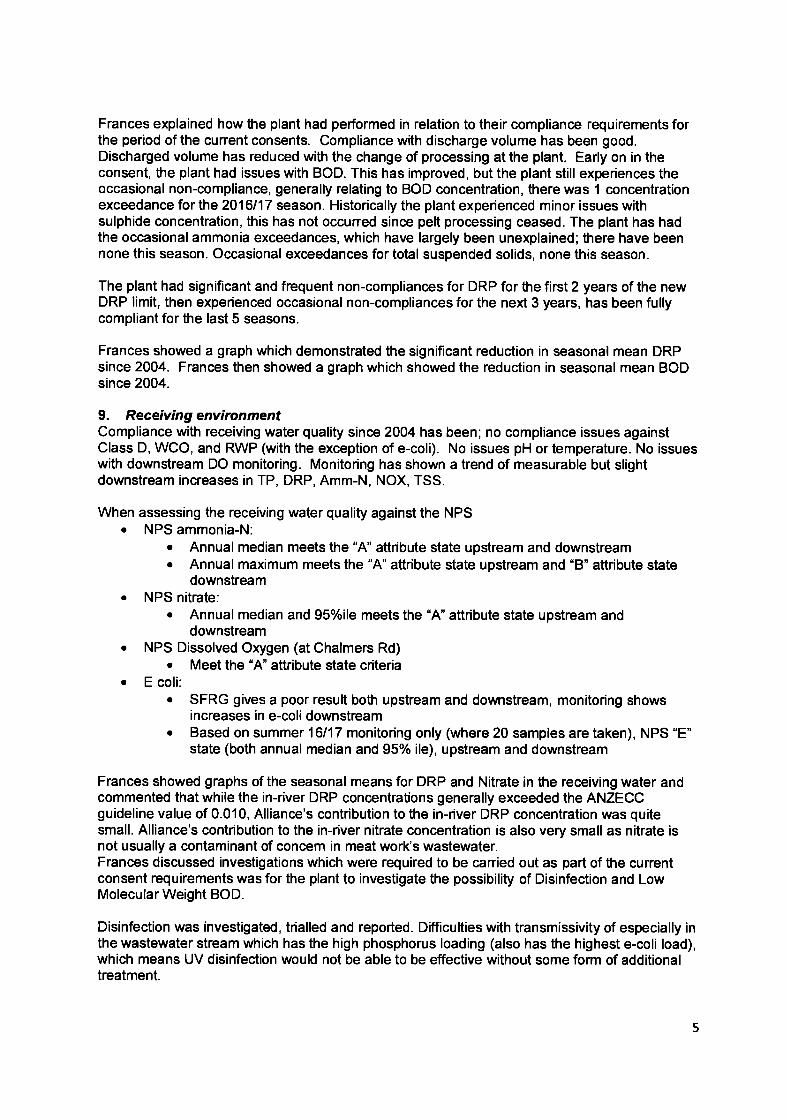
Frances explained how the plant had performed in relation to their compliance requirements forthe period of the current consents. Compliance with discharge volume has been good.Discharged volume has reduced with the change of processing at the plant. Early on in theconsent, the plant had issues with BOD. This has improved, but the plant still experiences theoccasional non-compliance, generally relating to BOD concentration, there was 1 concentrationexceedance for the 2016117 season. Historically the plant experienced minor issues withsulphide concentration, this has not occuned since pelt processing ceased. The plant has hadthe occasionalammonia exceedances, which have largely been unexplained; there have beennone this season. Occasional exceedances for total suspended solids, none this season.
The plant had significant and frequent non-compliances for DRP for the first 2 years of the newDRP limit, then experienced occasional non-compliances for the next 3 years, has been fullycompliant for the last 5 seasons.
Frances showed a graph which demonstrated the significant reduction in seasonal mean DRPsince 2004. Frances then showed a graph which showed the reduction in seasonal mean BODsince 2004.
9. ReceivingenvironmentCompliance with receiving water quality since 2004 has been; no compliance issues againstClass D, WCO, and RWP (with the exception of e-coli). No issues pH or temperature. No issueswith downstream DO monitoring. Monitoring has shown a trend of measurable but slightdownstream increases in TP, DRP, Amm-N, NOX, TSS.
When assessing the receiving water quality against the NPS. NPS ammonia-N:
. Annual median meets the "A" attribute state upstream and downstream
. Annual maximum meets the "A" attribute state upstream and "B" attribute statedownstream
. NPS nitrate:. Annual median and 95%ile meets the "A" attribute state upstream and
downstream. NPS Dissolved Orygen (at Chalmers Rd)
. Meet the "A" attribute state criteria. E coli:
. SFRG gives a poor result both upstream and downstream, monitoring showsincreases in e-coli downstream
. Based on summer 16/17 monitoring only (where 20 samples are taken), NPS "E"state (both annual median and 95% ile), upstream and downstream
Frances showed graphs of the seasonal means for DRP and Nitrate in the receiving water andcommented that while the in-river DRP concentrations generally exceeded the ANZECCguideline value of 0.010, Alliance's contribution to the in-river DRP concentration was quitesmall. Alliance's contribution to the in-river nitrate concentration is also very small as nitrate isnot usually a contaminant of concem in meat work's wastewater.Frances discussed investigations which were required to be carried out as part of the currentconsent requirements was for the plant to investigate the possibility of Disinfection and LowMolecular Weight BOD.
Disinfection was investigated, trialled and reported. Difficulties with transmissivity of especially inthe wastewater stream which has the high phosphorus loading (also has the highest e-coli load),which means UV disinfection would not be able to be effective without some form of additionaltreatment.
5
Renee Brown (Public Health South) asked if the turbidity was still high in the wastewaterdischarge following the treatment process. Frances responded that yes it was still anissue after the treatment process.Ramesh Sharma from Gore District Council asked if the plant had considered colourreduction in the wastewater discharge. Frances responded that it has been consideredbut is not likely to resolve the issue.
An investigation into Low Molecular Weight BOD in the wastewater discharge was canied outand reported to Environment Southland. Low MolecularWeight BOD (LMW BOD) promotesgrowth of sewage fungus in the river. Historically sewage fungus was an issue downstream ofthe discharge, during periods of extended low flow, but sewage fungus has not been present inrecent years (since 2012 vrhen it was found upstream as well). The investigation found no realsolution for removing LMW BOD. The issue has since resolved itseff with removal of sheep andlamb processing and rendering from the site.
Frances described how the plant water take was reported to Environment Southland on anannual basis. The plant is cunently consented to take 21,z}Om3tday. The plant is consented todischarge 14,400m3/day of treated wastewater, for the previous season the maximum the plantdischarged was 5,800m3 lday .
Frances showed two photos of the riverbed downstream of the discharge, a historic photo andone from recent years, to show the improved in the health of the river bed as a result of theimprovements in wastewater discharge.
We have extensive biomonitoring information and the conclusions from an early survey and themost recent survey were discussed, extracts from both reports below.
I 2OO5: Changes rn the inveftebnte community amposition and ecological index scoresdownstream of the discharye arc indicative of a nutient eniching and periphyton grovvthpromoting effect of the discharge
r 2017: The discharge Lvas not stimulating peiphyton grovvths or adversely affectingbenthic invertebnte community health at the time of the suruey. There is a trcnd ofcontinued inveftebnte community health af sifes downstream of the discharge.
10. ProjectteamFrances mentioned the members of the project team that would be working on the re-con The team are:
o
o
5
Name Organisation Project Role
Alliance Group Project ManagerDoyle Richardson
Frances Wise Alliance Group Project Leader
Tony Gilder Alliance Group Plant Manager
Co-ordinator & site contactJessica McKee Alliance Group
Murray DeGroot Alliance Group Plant Engineering Manager
John Kyle
Claire HunterMitchell Daysh
Regulatory assessment, consentin g
process advice, preparation of AEE.
Richard Montgomerie Freshwater Solutions Ltd Description of the aquaticenvironment
Dr Mike Fitzpatrick Freshwater Solutions Ltd Water quality effects
Assessment of effects of abstractionand discharges
Dr Mark James Aquatic Environmental Solutions
Azam Khan Pattle Delamore Partners Wastewater treatment consid erations
Other advisors will be brought in as required.
11. Project PlanFrances briefly touched on the plan for the coming summer in order to prepare for a consentapplication. The plant already has extensive records of wastewater and receiving water qualityand at least annual ecological monitoring records.
The plant plans to perform an analysis to identify if additional information is required to supportthe application. The plant intends to carry out any additional monitoring during 2017 12018summer as there will be limited opportunity during 20'1812019 summer. This will be circulatedprior to the next meeting in late November to be discussed to make sure that as far as ispracticable, all issues are addressed this summer.
Alliance aims to have technical reports completed by mid-December 2018 and provideEnvironment Southland with a draft application by 28s February 2019. The target date forlodging the application is 30th April 2019, with the last date for lodging to applicition being 6hJune 2019. The resource consents are due to expire 6m December 2019.
To date Alliance has held a preliminary meeting with Environment Southland (10h October2017), during which Alliance presented the project plan.
Alliance intends to host a second TWP meeting the last week in November 2O17 and take theTWP meeting on a tour of the site and river sampling locations. Going forward meetings of theTWP will be scheduled as required.
Alliance will engage in consultation with the wider community closer to the time of consentapplication being due.
12. Key ConsiderationsFrances presented to the group what Alliance has identified as key elements for considerationAS:
. Regulatory requirements, for example, RMA, NPSFWM, RWP (operative), WALP(proposed as yet), NES Water metering, lwi Management Plan, Gore District Plan,Coastal Plan
. Regulatory compliance (current and proposed)o Microbiological contaminants. Cultural lmpacts - will speak to Stevie and Rewi separately to thiso Economicso Consultation lnputso Abstraction volume and effects. Cooling water discharge effects. Wastewater discharge volume and effects. Mixing Zone. lf the location of the previously identified Dissolved Orygen sag is still correcto Altemative Discharge Receiving Environments. What mitigations may be required
73. Concluding questions and discussionRamesh Sharma (Gore District Council): asked if Alliance had monitored the DO sag?Frances' response was that the current location of the DO monitoring, was identified during pre-consenting work as the location in the river where a DO sag occurred. But Alliance does intendto investigate that this is still the correct location for DO monitoring to occur. lf Alliance identifiesa more relevant location then a DO monitoring sonde will be placed in this location for datacollection.
Ramesh Sharma (Gore District Council): asked if Alliance had decided on draft conditions
7

Frances response was that Alliance had not yet decided on draft conditions. John Kyle addedthat Alliance will carry out river monitoring over this coming summer period and with thatinformation, and after a regulatory review will begin to look at drafting consent conditions.
Ramesh Sharma (Gore District Council): asked why Alliance would need to change their consentconditions from the cunent state, as they had shown improvements, so why was there a need tochange.John Kyle responded that since there was an ever changing regulatory planning landscape,which has changed significantly since the current consents werc granted, Alliance fully expectsthat they will not be able to gain consents with allthe same conditions.
Renee Brown (Public Health South) asked if the plant was still planning to investigate thepossibility of e-coli disinfection on the wastewater discharge and altemative receivingenvironments for the wastewater discharge. Frances's response was, yes Alliance was aware ofthe issue regarding disinfection and would assess the opportunity for a different receivingenvironment. Alliance is cunently not aware of any practicable options for altemative dischargeenvironments.
Phil Melgren (DoC) asked about Term. Alliance responded that in order to give the plantcertainty going forward, the maximum term possibly (35 years) will be applied for.
It was reiteated by Alliance that the TWP involvement had woked well for the recent Lomevillere-consenting and a good working relationship was established, which allowed for issues to beconsidered and addressed in the lead up to the formal application process. The processenabled all parties to properly understand the nature of the applications, the resulting effects andthe mitigation proposed by Alliance to address these effects.
14. Where to next?Frances said that Alliance plans to host another meeting of the TWP near the end of November.It will include a site visit, including the locations of water take abstraction, wastewater dischargeand river monitoring locations. Water Scientist - Mark James will discuss with the TWP whatadditional information needs to be obtained and the proposed summer monitoring programmefor the 2017118 season. A copy of the proposed 2017118 summer monitoring programme will bedistributed, prior to the next meeting. Alliance would welcome any input into the proposedmonitoring programme.
Meeting closed at 1 3:55pm
Nert meeting 29/11/17
8
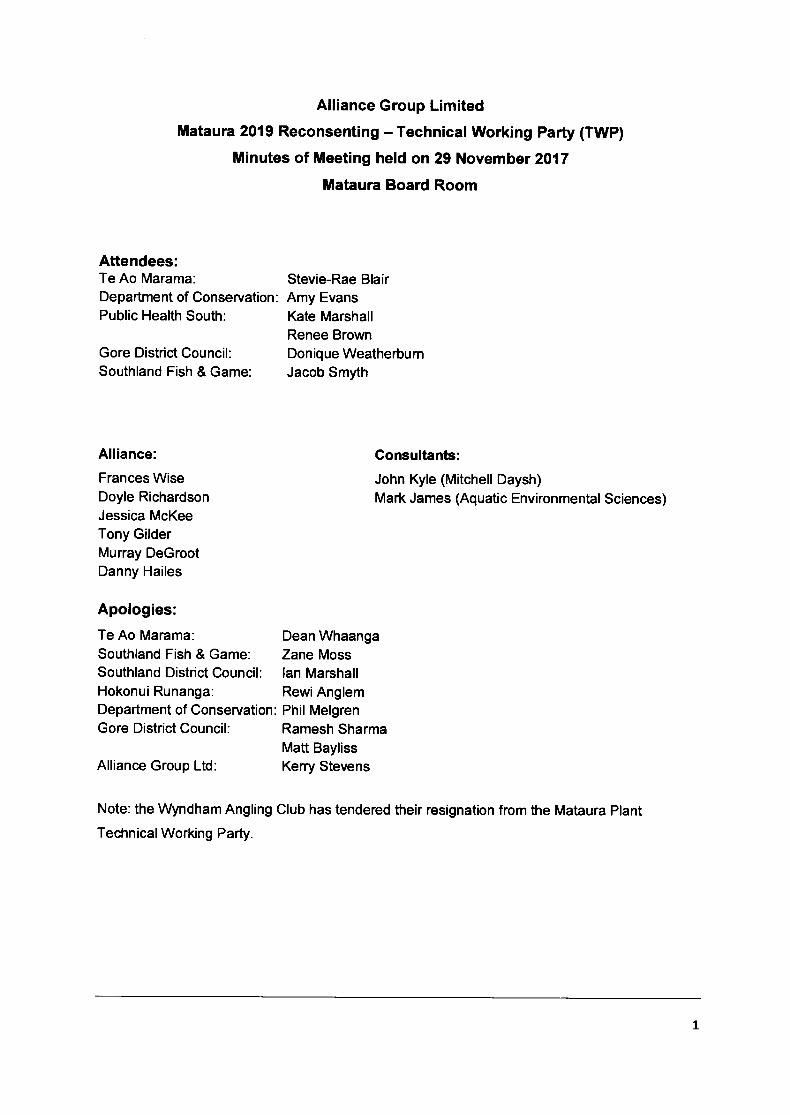
Alliance Group Limited
Mataura 2019 Reconsenting - Technical Working Party (TWP)
Minutes of Meeting held on 29 November 2O17
Mataura Board Room
Attendees:Te Ao Marama: Stevie-Rae BlairDepartment of Conservation: Amy EvansPublic Health South: Kate Marshall
Renee BrownGore District Council: Donique WeatherburnSouthland Fish & Game: Jacob Smyth
Alliance:
Frances WiseDoyle RichardsonJessica McKeeTony GilderMurray DeGrootDanny Hailes
Apologies:
Te Ao Marama:Southland Fish & Game:Southland District Council:Hokonui Runanga:Department of ConservationGore District Council:
Alliance Group Ltd:
Dean WhaangaZane Mosslan MarshallRewiAnglemPhil MelgrenRamesh SharmaMatt BaylissKerry Stevens
Consultants:
John Kyle (Mitchell Daysh)Mark James (Aquatic Environmental Sciences)
Note: the Wyndham Angling Club has tendered their resignation from the Mataura Plant
Technical Working Party.
1
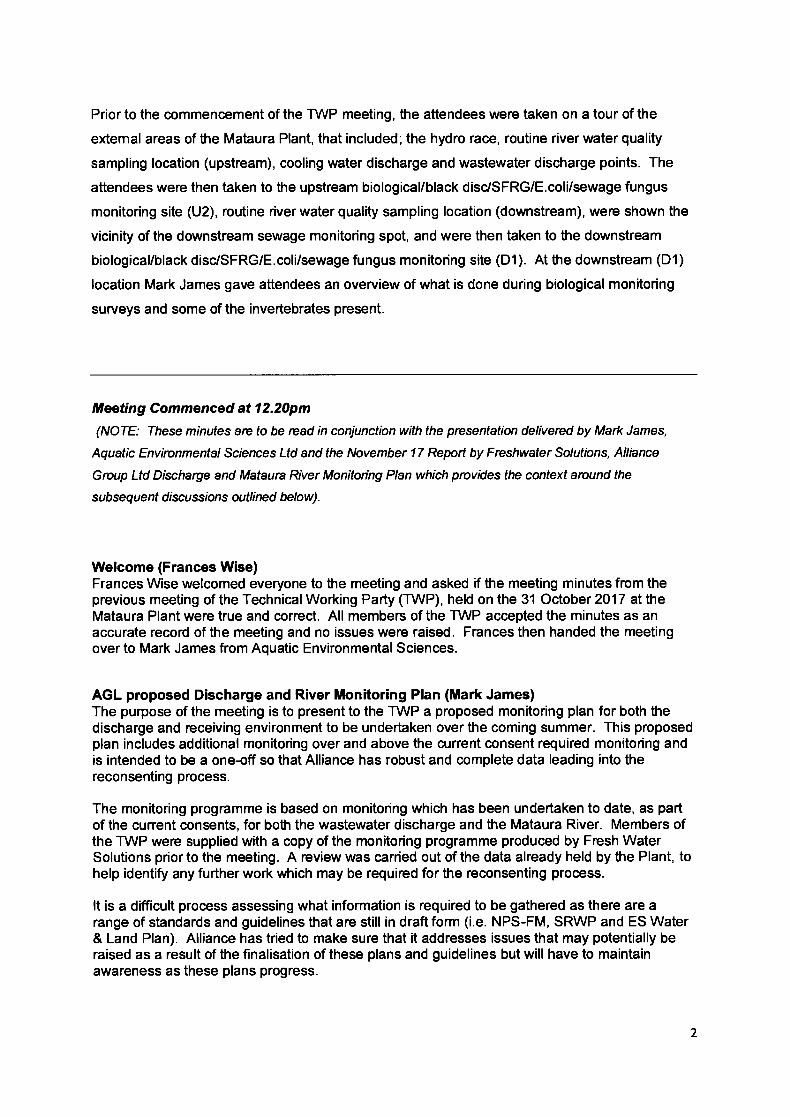
Prior to the commeneement of the TWP meeting, the attendees were taken on a tour of the
extemal areas of the Mataura Plant, that included; the hydro race, routine river water quality
sampling location (upstream), cooling water discharge and wastewater discharge points. The
attendees were then taken to the upstream biological/black disc/SFRG/E.coli/sewage fungus
monitoring site (U2), routine river water quality sampling location (downstream), were shown the
vicinity of the downstream sewage monitoring spot, and were then taken to the downstream
biological/black disc/SFRG/E.coli/sewage fungus monitoring site (Dl). At the downstream (D1)
location Mark James gave attendees an overview of what is done during biological monitoring
surveys and some of the invertebrates present.
Meeting Commenced at 12.20pm
(NOTE: These minutes arc to be read in conjunction with the presentation delivercd by Mark James,
Aquatic Environmental Sciences Ltd and the November 17 Repoft by Freshwater Solutions, Alliance
Group Ltd Discharge and Mataura River Monitoing Plan which provides the context around the
subseque nt dr'scussrbns outl i ned below).
Welcome (Frances Wise)Frances Wise welcomed everyone to the meeting and asked if the meeting minutes from theprevious meeting of the Technical Working Party (TWP), held on the 31 October 2017 attheMataura Plant were true and correct. All members of the TWP accepted the minutes as anaccurate record of the meeting and no issues were raised. Frances then handed the meetingover to Mark James from Aquatic Environmental Sciences.
AGL proposed Discharge and River Monitoring Plan (Mark James)The purpose of the meeting is to present to the TWP a proposed monitoring plan for both thedischarge and receiving environment to be undertaken over the coming summer. This proposedplan includes additional monitoring over and above the current consent required monitoring andis intended to be a one-off so that Alliance has robust and complete data leading into thereconsenting process.
The monitoring programme is based on monitoring which has been undertaken to date, as partof the cunent consents, for both the wastewater discharge and the Mataura River. Members ofthe TWP were supplied with a copy of the monitoring programme produced by Fresh WaterSolutions prior to the meeting. A review was carried out of the data already held by the Plant, tohelp identify any further work which may be required for the reconsenting process.
It is a difficult process assessing what information is required to be gathered as there are arange of standards and guidelines that are still in draft form (i.e. NPS-FM, SRWP and ES Water& Land Plan). Alliance has tried to make sure that it addresses issues that may potentially beraised as a result of the finalisation of these plans and guidelines but will have to maintainawareness as these plans progress.
2
Backgroundlssues that need to be addressed in the Assessment of Environmental Effects are:
. Ammonia toxicity
. BOD and dissolved orygen levels. Bacteria in river use up available orygen.
. Changes to water clarity and colour in the river.
. Scums and foams in the river
. Microbial components (bacteria). As E.coli is an issue for the Mataura River,Alliance needs to investigate what needs to done for this reconsenting processand other possible pathogens that need to be assessed.
o Nutrient loadings to River of nitrogen and phosphorous. Nuisance algaeo Changes in invertebrates upstream and downstream of the discharge as
invertebrates are an important food source for fish.o Effects of the discharge on fish and rccreation
The monitoring plan intends to address policy and planning changes which have occuned sincethe last consent and provide relevant and sufficient information to measure potentialexceedances and assess health of river and any potential effects.
Mark showed a graph depicting the seasonal mean cBODs (kg/day) discharged by the plantsince the 2004105 season to the 2016117 season. The graph showed the substantialdecreasein mean cBODswhich has been discharged by the plant. There have been further reductionssince the removal of sheep and lamb processing from the site.
Mark showed graphs of the seasonal mean Total Kjeldahl Nitrogen and seasonal meanDissolved Reactive Phosphorus, the latter of which showed a significant decrease in seasonalmean discharged since 2004/05 to the most recent2016l17 season. Mark also showed a graphshowing the seasonal mean E coli discharged by the plant from the 2004/05 to the 2016117season which showed variable levels.
Existing monitoring regime for the receiving environmentMark discussed the existing monitoring regime forwater quality and aquatic ecology, monitoringhas been carried out upstream and downstream for water quality and at the same 4 sites forbiology since 2004. Samples for biology are collected from a 30m reach in riffle habitat at eachsite, a description of the habitat at each site is recorded, including channelshape, substrate,organic content, shade and habitat score. Assessment is made on periphyton, heterotrophicgrowths and benthic macroinvertebrates. Dissolved orygen is monitored at Chalmers Roadduring summer low flows. Alliance intends to do more research into literature regarding fishpopulations leading into the consent.
Mark briefly described the Environment Southland river monitoring site, located 200m south ofthe Mataura River bridge at Mataura. Alliance and Mark have a meeting scheduled withEnvironment Southland tomorrow (3011112017) to discuss Alliance's proposed monitoring plan
Mark showed a map of the upstream and downstream water quality monitoring locations and thefour biological monitoring sites and the location of the dissolved orygen monitoring.
Mark showed graphs for the accrual period prior to the January 2017 biological monitoringsurvey, seasonal mean for ammonia comparing upstream and downstream results, seasonalmean for DRP comparing upstream and downstream results. DRP historically showed aconsiderable difference upstream compared with downstream, but in reeent years there aresimilar levels of seasonal mean DRP upstream compared with downstream.
Mark showed graphs showing results from the biological monitoring for periphyton,macroinvertebrates, and historical trends for QMCI.
3
Mark showed a slide of both native and introduced fish species which are found in the MatauraRiver and the species which are found above and below the falls.
Existing monitoring regime for wastewater discharge & proposed additional parametersMark discussed the cunent monitoring protocol for the wastewater discharge. The currentroutine monitoring on the wastewater includes testing for E.coli, pH, TKN, Ammonia-N, TSS,Total sulphide, DRP, TP and cBODs. E.coli is commonly tested for, as it is an indicator ofbacterial species. Additional parameters which Alliance is proposing to test for are Nitrate andnitrite-N, so that TON can be calculated. Also planning to include DlN, TN and soluble BOD.Also plan to use this information to do CLUES modelling to get a context for what percentage ofTN loading in the river Alliance is contributing. Soluble BOD is a potential driverfor sewagefungus.
P roposed additional mon itoring parameters for receiving envi ronmentMark discussed the proposed additional monitoring parameters for the receiving environment.Mark clarified that the proposalwas for additional monitoring to be carried out during the comingsummer months and would not be an ongoing long term monitoring programme. Additionalmonitoring proposed for this summer includes continuous temperature monitoring upstream anddownstream of the water takes and cooling water discharge, DO, cBODs, and TN weekly, weeklyobservations of foams and scums, monthly colour assessment, longitudinal E.coli study, monthlyturbidi$ and water clarity and monthly samples from sites U1, U2, D1 and D2 for DIN and DRP.
Alliance is planning to repeat the 2003 longitudinal DO, cBODs and temperature survey toassess the location of the DO sag. Mark discussed work that is planned to confirm the mixingzone of the discharge. Work that was carried out at the previous round of consent had thedischarge as completely mixed prior to it reaching the bridge. Alliance also plans to carry out aone off test of the wastewater for metals, organo nitrogen and phosphorus pesticides andorganics (SVOC and VOC).
The current routine annual biological survey will continue, but depending on riverflows up to twoextra surveys may be canied out. Depending on flow conditions the additional surveys maycomprise periphyton assessments only. A review of fish data will be carried out.
Mark discussed how Alliance intends to carry out further analyses of some key pathogens fromupstream and downstream and the discharge, and a longitudinal study in the river for E.coli toassess the effects of the discharge on microbial contamination in the river. The National Policystatement sets out different limits for E.coli than the MfE guidelines for recreational use, whichare different again to those in the ES Water and Land Plan and bathing sites. EnvironmentSouthland cunently has a draft report for a project that was undertaken to assess campylobacterin the Mataura River.
Mark then presented three slides tabling a range of relevant limits for receiving waters
DiscussionTo conclude the presentation Frances Wise asked the TWP for their input into the proposedmonitoring plan. Members of the TWP indicated that they were happy with the proposedmonitoring plan which had been presented. Jacob Smyth (F&G) commented that the proposedmonitoring plan was very comprehensive.
Kate Marshall (PHS) asked if Alliance planned to test for cryptosporidium as there had beenrecent outbreaks in the Southland region of people taking ill with cryptosporidium. Mark Jamesresponded that he willfollow up the meeting with some information on how the proposedmicrobial determinants had been selected.
4

Jacob Smyth (F&G) asked how the timing of river monitoring was going to be decided. MarkJames responded that Alliance and their consultants would look very closely at river flows, ratherthan selecting dates for the monitoring, as this would give more valuable data. Mark James thenadded that he and Alliance were scheduled to meet with Environment Southland tomorrow(3011112017) to present the proposed monitoring programme for input from ES. EnvironmentSouthland carry out routine water quality monitoring on the Mataura River, 200m downstream ofthe bridge, they monitor E.coli, clarity, TN, TON, ammonia-N, TP and DRP.
Jacob Smyth asked if consideration had been given to mixing zone. Mark James respondedthat the assessment of the mixing zone for the Mataura Plant discharge would be straightforward in comparison to other sites such as the Lomeville Plant discharge i.e. there is no tidalinfluence, not a braided river. Alliance needs to e,onfirm that the discharge is being properlymixed in line with cunent predictions.
Frances Wise advised the TWP that it was anticipated that the next meeting would not be for afew months and likely to be when the summer monitoring programme had been completed. Sheclosed the meeting by asking the members of the TWP if they had any questions to come backto Frances, Doyle or Jessica.
Meeting closed at 13:05pm
5
-^--.-2,-<
A LLIA N CE
Alliance Group Limited: Mataura PIantWastewater Technical Working Party
Te Ao MaramaHokonui RunangaEnvironment SouthlandEnvironment SouthlandGore District CouncilGore District CouncilFish and GameAlliance Group LtdAlliance Group LtdAlliance Group LtdAlliance Group LtdAlliance Group LtdAlliance Group LtdMitchell DayshAquatic Sciences
Te Ao MaramaDepartment of ConservationDepartment of ConservationEnvironment SouthlandEnvironment SouthlandEnvironment SouthlandSouthland District CouncilAlliance Group LtdPublic Health South
FARMEBS'PRODUCE
sri cE t9a8
Date:
Time:
Location
Present:
Apologies
31 October 2018
12.00 pm
Alliance Mataura
Stevie-Rae BlairPenny NicholasKathryn MclachlanGraeme McKenzieMatt BaylissAlex McKenzieJacob SmythDanny HailesTere NguJeff HoskingMurray De GrootDoyle RichardsonRenee MurrellJohn KyleMark James
Dean WhaangaPhil MelgrenAmy EvansMike DurandSimon MappStephen WestMatt RussellWillie WeiseRenee Brown
lntroduction1. Meeting commenced at 12.30 pm following lunch. Doyle Richardson (DR)
welcomed everyone to the meeting, acknowledged apologies, introduced attendeesand outlined the meeting.
Purpose of the Meeting2. The purpose of this fourteenth annual meeting was to receive reports, review
results, initiate meetings and recommend reviews of conditions if necessary inrelation to Consent No.202327.
29h November 2018Page I
9
Update on the Mataura Plant3. Danny Hailes (DH) presented an update on Mataura Plant activities including the
Health and Safety journey and stats
4. 142,056 cattle processed, eclipsed previous plant record of 124,418 set in 2016/17season.
5. New plant manager to start 1 December 2018 - Melonie Nagel
Annual Monitoring and Review Summary6. DR presented the 2018 Annual Monitoring and Review Report. The report had
been pre-circulated to TechnicalWorking Party members.
Treated Wastewater Monitorin g7. BODS and TSS non-compliances and associated actions were discussed by DR
and Renee Murrell (RM)
8. Slight increase on mean e.coli, CBODS, NH4-N, TSS, TKN, TP, totalsulphideconcentrations and cBODS.
Full compliance had been achieved with discharged volumes, DRP discharge load,sulphide, and ammonia concentration limits.
10. The annual average discharged DRP loads over the last 6 years have plateauedaround 1kg/day. The mean DRP load was similar to last year.
Receiving Water Monitoring11. JM reported that receiving water monitoring showed full compliance with Mataura
Water Conservation Order, Class D Waters and temperature, pH and ammoniastandards in the Southland Land and Water Plan (SLWP). There were no observedconspicuous changes in the river as a result of the discharge.
12. Annual median and maximum upstream ammonia concentrations and downstreammedian ammonia concentrations met the NPSFM "A" Attribute state, maximumdownstream was "B".
13. Downstream annual and median 95th percentile met the "A" Attribute state fornitrates. Upstream annual median met the "A" Attribute state and the annual gShpercentile met the "B" Attribute state
Biological Monitoring Summary14. Conducted by Fresh Water Solutions on the 1Sth December 2017 following an
accural period of 86 days and 16 days of continuous river flow below 40m3/sMinimum flow of 17m3ls for the 90 day period prior to the survey, was at the lowerend of the historical rangeMedian flow of 42 m3ls flows for the 90 day period prior to the survey, was at themidpoint of the historical rangeOutside of the January - April window as follow up surveys were intended forcompliance and re-consenting purposes but prevented by regular rain and flushingevents. Jacob Smyth (JS) commented that he thought it was more appropriate thatit was triggered by flow events rather than time periods.
29- November2018Page2
River conditions during the survey were representative of summer low flowsampling requirements outlined in the consent.
15. DR explained the sampling sites used for both water quality, biological and DOmonitoring. DO monitoring site was identified as where the DO sag wasexperienced, in pre-consenting surveys.
16. Black Disc - All measurements upstream and downstream met MfE guidelines(>1.6m), ranging from 2.88m - 3.05mThe black disc distance decreased slightly downstream of the discharge
17. A data sonde was deployed near Chalmers Road on the Mataura River from mid-January to late January to record temperature and Dissolved Orygen. The datashowed a typical diumal pattern. All results well above the Class D limit of 5g/m3and were comparable to the previous year. JS queried whether we should actuallybegin the monitoring of this based on flows as opposed to time of year.
18. Periphyton cover was high at all four of the monitoring sites at the time of theDecember 2017 survey. Filamentous algae was absent at site U1, sparse at sitesDl & D2 with 9% recorded atU2. All sites were well below the MfE guidelines of30% cover recommended for the protection of aesthetics, recreation and trouthabitaUangling
19. There was no significant difference in mean chlorophyll-a concentrations betweenupstream and downstream sites. Chlorophyll-a concentrations at all sites werebelow the MfE guideline (50m9/m2) recommended for the protection of benthicbiodiversi$ and well below the guideline of 200 mg/m2 recommended for theprotection of trout habitat and angling.
20. QMCI results appear to indicate a decrease in water quality but this is not whatother parameters are indicating. JS offered that perhaps it was an anomaly astrends indicate an increase in water quality.
21. A total of 42 invertebrates were collected, this is higher than previous surveys.These were dominated by Ephemeroptera (mayflies), Trichoptera (caddisflies) andDiptera (true flies). Deleatidium were by far the most common mayfly taxonrecorded across sites.The chironomids Maoridiamesa and Orthocladiinae were typically the mostabundant true flies at sites in December 2017.Mollusca and Oligochaeta represented less than 3o/o of the community at all sites.
22. The discharge was not stimulating periphyton growth or adversely affecting benthicinvertebrate community health at the time of the survey. There is a continuing trendof improved invertebrate health at sites downstream of the discharge.
Sewage Fungus and LMWBOD
23. Calculated discharged loads of LMW BOD were low during the 17118 season. Nosewage fungus was observed during the eight inspections carried out during riverflows less than 30 m3/s. None has been observed since the 12113 season when itwas observed in very small amounts upstream and downstream of the discharge.DR explained the risk profile for proliferation of sewage fungus maintained as agraph. This demonstrates that the theoretical in-river concentration of LMW BOD
29h November 2018Page 3
was always below the MfE guideline value of 1 g/m3 during the 17118 season butclearly show the period of greatest risk during low flows.
Suitability for Recreation24. DR explained the background and purpose of the SFRG assessment. Annual
summer e coli results are added to the database to derive a MicrobiologicalAssessment Category. With the 2018 results, the derived MAC remains "D"upstream and downstream. (Not to be confused with "D" Attribute state in theNPSFM)
25. A Sanitary lnspection Category was originally derived and when this SIC iscombined with the MAC a SFRG is determined. This remains "Very Poo/'bothupstream and downstream.
26. Downstream e coli concentrations are higher than upstream. Upstreamconcentrations were higher, and downstream concentrations were lower, than in2016.
Plant lmprovements27.
o Water Metering lmplementedo Cattle yards re-piped, reduction in water use. Decanter Odour lssues. lnvestigation and corrective actions identified and implemented.o Wastewater Treatment Plant lmprovement. Polymer dosing unit - all electrics updatedo Adult blood collectiono Baffles on DAF Tanks. Grit Plant - Redesigned and rebuilto Lime dosing process. $500,000 capital expenditure allocated in this years budget for further wastewater
improvements
Consent No 202327 Compliance Summary
28. Alliance summarised the results of 2017 - 18 monitoring as follows:
Compliance with treated wastewater discharye consent conditions for themajority of the seasonAnalytical data for receiving waters below the discharye werc fullycompliantFifth consecutive year since monitoing began that sewage fungus has notbeen obserued at all.SFRG confirmed as "Very Poot", upstream and downstream - higher Ecol i conce ntratio n s down stre am.Resu/fs of the December 2017 biological suruey indicate that thedischarge was not stimulating peiphyton growth of adversely affectingbenthic invertebrate community health at the time of the suNey.There is a continuing trcnd of improved invertebrate community health atsifes dournstream of the discharye
a
29" November 2018Page 4
Consents29. Dam and diversion of water - hearing early December
30. Consents expire December 2019
31. 202327 - To Discharge Wastewater to the Mataura River, 14,400 m3/day
32. 204126 - To take water from the Mataura River, 35,600 m3/day (amendments tothis consent this year)
33. 204125 - To discharge condenser cooling water to the Mataura River,21,200 m2lday
Monitoring of the Discharge and Receiving Environment for Re-consenting
34. Monitoring of discharge to continue as per Resource Consent requirements withadditional parameters as discussed in Slide 33.
35. Monitoring of the receiving environment which includes additional parameters forre-consenting as discussed in slides 35 and 35. Will analyse for E.coli but it is note.coli which makes you sick it is campylobacter which is hard to test for. JS queriedwhether the decrease in e.coli results is due to site processing changes. Alliancestaff thought not.
36. There is an increase in ammonia concentrations downstream compared toupstream; all other parameters are fairly consistent between upstream anddownstream.
37. Will repeat the 2003 longitudinal DO (add cBOD and temperature) survey at 11
sites (during summer low flow 2018) to investigate orygen sag which is in the sameplace as previously assessed - point 9 on Chalmers Road and changes in DO.Added full nutrient suite in 2017118.
38. Attempt to repeat annual biological survey at least three times over Summer
39. Review fish data and assess whether enough distributional data available
40. ln progress is a QMRA Assessment, planning assessment, existing environmentreport and an assessment of the coal-fired boiler discharge to air.
41. QMRA work to date suggests that the low risk to recreation doesn't reflect the highe.coli concentrations.
42. Stillto be completed is:
. Ecological assessment of effects
. Cultural heritage impact assessment
. Recreational assessment
. Economics assessment
. Options assessment, existing, GDC and discharge to land
. Conditionsr Consultation
Comments and Questions
November 2018Page 5

43. No questions or comments
Closure44. Alliance thanked all participants for their attendance
The meeting concluded at approximately 2.00pm.
Meeting notes by Renee Murrell
November 2018Page 6
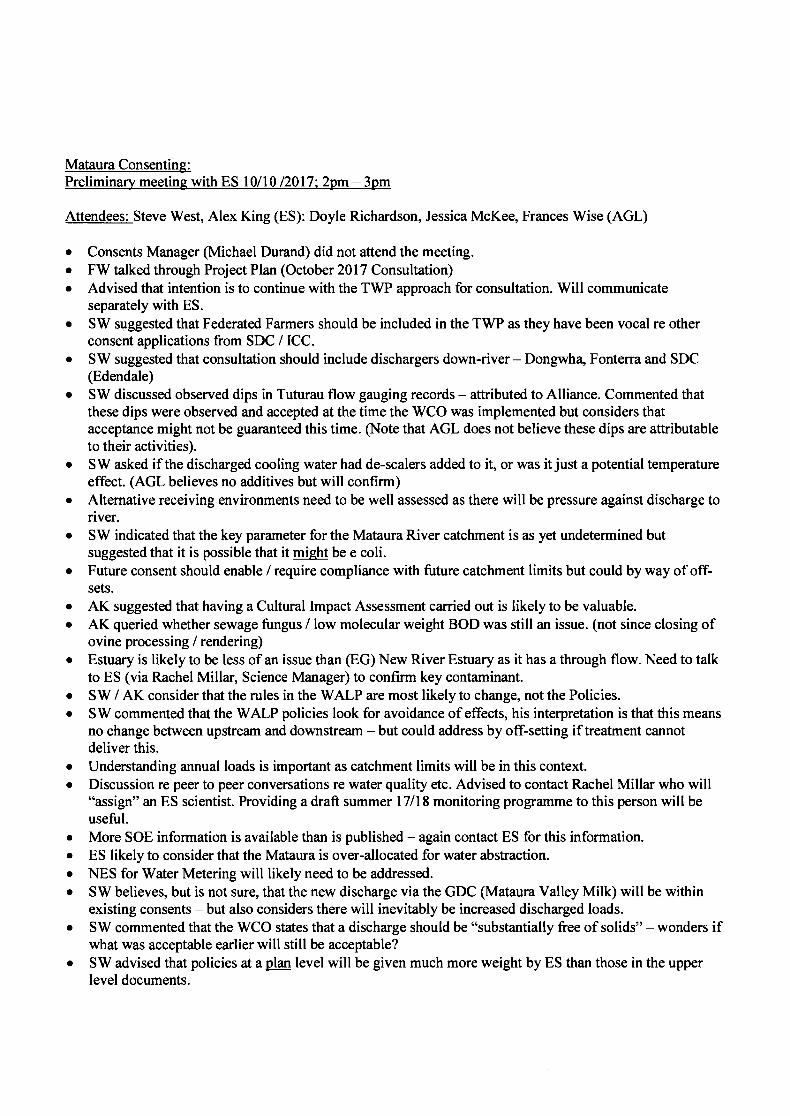
Mataura ConsentinqPreliminary meeting with ES 10/10 /2017: 2pm - 3pm
Attendees: Steve West, Alex King (ES): Doyle Richardson, Jessica McKee, Frances Wise (AGL)
o Consents Manager (Michael Durand) did not attend the meeting.o FW talked through Project Plan (October 2017 Consultation)o Advised that intention is to continue with the TWP approach for consultation. Will communicate
separately with ES.r SW suggested that Federated Farmers should be included in the TWP as they have been vocal re other
consent applications from SDC llCC.o SW suggested that consultation should include dischargers down-river - Dongwh4 Fonterra and SDC
(Edendale)o SW discussed observed dips in Tuturau flow gauging records - attributed to Alliance. Commented that
these dips were observed and accepted at the time the WCO was implemented but considers thatacceptance might not be guaranteed this time. (Note that AGL does not believe these dips are attributableto their activities).
o SW asked if the discharged cooling water had de-scalers added to it, or was it just a potential temperatureeffect. (AGL believes no additives but will confirm)
o Alternative receiving environments need to be well assessed as there will be pressure against discharge toriver.
o SW indicated that the key parameter for the Mataura River catchment is as yet undetermined butsuggested that it is possible that it might be e coli.
o Future consent should enable / require compliance with future catchment limits but could by way of off-sets.
o AK suggested that having a Cultural Impact Assessment carried out is likely to be valuable.o AK queried whether sewage fungus / low molecular weight BOD was still an issue. (not since closing of
ovine processing / rendering)o Estuary is likely to be less of an issue than (EG) New River Estuary as it has a through flow. Need to talk
to ES (via Rachel Millar, Science Manager) to confirm key contaminant.o SW / AK consider that the rules in the WALP are most likely to change, not the Policies.. SW commented that the WALP policies look for avoidance of effects, his interpretation is that this means
no change between upstream and downstream - but could address by off-setting if treatment cannotdeliver this.
o Understanding annual loads is important as catchment limits will be in this context.o Discussion re peer to peer conversations re water quality etc. Advised to contact Rachel Millar who will
"assign" an ES scientist. Providing a draft summer 17118 monitoring programme to this person will beuseful.
o More SOE information is available than is published - again contact ES for this information.o ES likely to consider that the Mataura is over-allocated for water abstraction.o NES for Water Metering will likely need to be addressed.o SW believes, but is not sure, that the new discharge via the GDC (Mataura Valley Milk) will be within
existing consents - but also considers there will inevitably be increased discharged loads.o SW commented that the WCO states that a discharge should be "substantially free of solids" - wonders if
what was acceptable earlier will still be acceptable?o SW advised that policies at a plag level will be given much more weight by ES than those in the upper
level documents.
a
a
Discussed notification in the context of an RMA change around notification of applications in StatutoryMgnt areas - but agreed this is irrelevant as expectation is that the application will be notified anyway.SW's interpretation of the catchment limit setting process is that while the "published" date forcommencing the Mataura process is 2018, he has been told that this is unlikely to commence until 2020and still with the expectation that limits are in place by 2025.With respect to possible timeframes for any improvements identified as necessary, SW suggested that anyactions should be to address the immediate effects. Utilise RMA 105 and 107. Provide strong reasons forany proposed delay in implementing mitigation.SW advised that natural character effects around the Falls will be considered. (Only opportunities likelyto be by tidying up (painting) the riverside buildings?) AK advised that the Wyndham Angling Clubhave experience in dealing with natural character aspects.Discussion around scums and foams - reference to AGL often being blamed for conspicuous foam.Acknowledgement that it is likely natural / from upstream but expected to be raised as an issue.SW emphasized the importance of an economic assessment. Considers that while a lot of people willhave an issue with a discharge to the river, few will understand the importance of the Plant to the local /regional economy.SW referred to the potential animal welfare impacts in dry / low flow conditions and the need to bringthis aspect into the application.SW suggested that it might be useful to arrange a site visit / briefing for local media - to assist in gettinga positive / informed message delivered.Alex King ([email protected]) is to be the primary contact within ES. Steve (Stephen [email protected]) to be contact if Alex is not available. Alex is keen to have a site visit - AGLwill facilitate.
F WiservtoltT
a
a
a
a
a
a
a
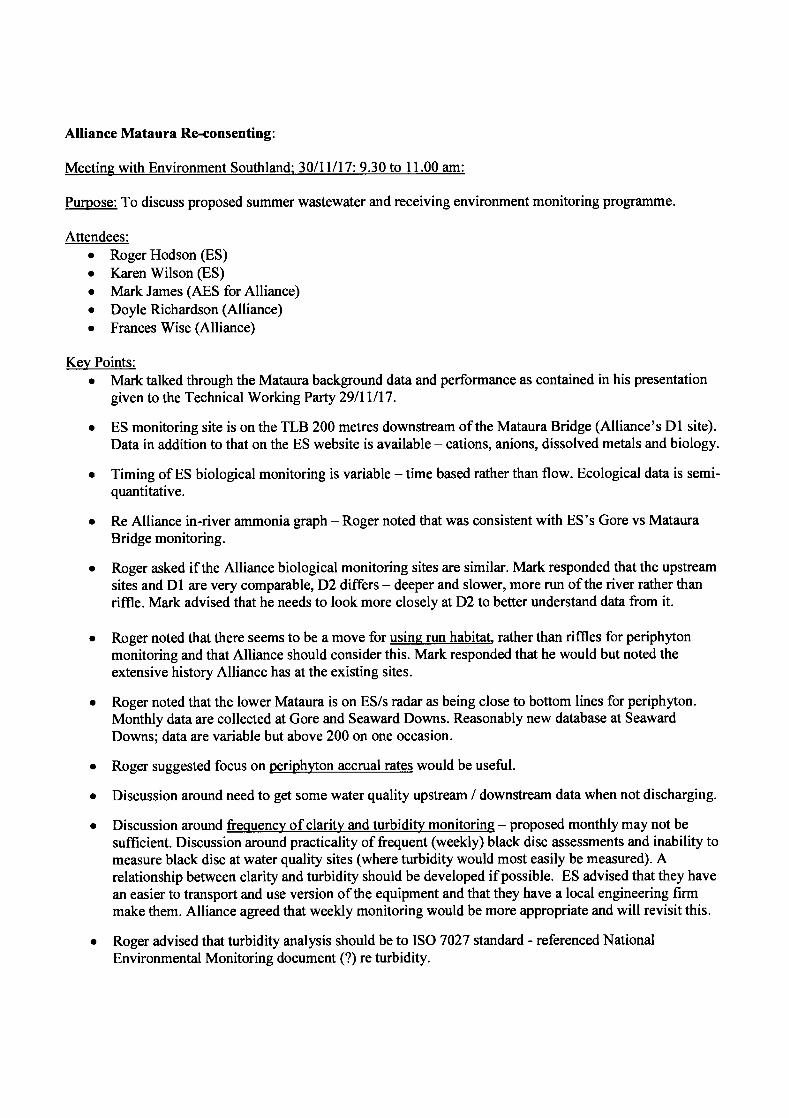
Alliance Mataura Re-consenting :
I\rfaafina rrrifh Enrrirnnmenf S,nrrfh l--,{.2 0lllllT:9.30 to.l 1 flA am.
PurDose: To discuss proposed summer wastewater and receiving environment monitoring programme
Attendees:. Roger Hodson (ES). Karen Wilson (ES)o Mark James (AES for Alliance)o Doyle Richardson (Alliance)o Frances Wise (Alliance)
Key Points:o Mark talked through the Mataura background data and performance as contained in his presentation
given to the Technical Working Party 29/ll/17.
o ES monitoring site is on the TLB 200 metres downstream of the Mataura Bridge (Alliance's Dl site).
Data in addition to that on the ES website is available - cations, anions, dissolved metals and biology
Timing of ES biological monitoring is variable - time based rather than flow. Ecological data is semi-quantitative.
Re Alliance in-river ammonia graph - Roger noted that was consistent with ES's Gore vs MatauraBridge monitoring.
Roger asked if the Alliance biological monitoring sites are similar. Mark responded that the upstream
sites and Dl are very comparable,D2 differs - deeper and slower, more run of the river rather thanriffle. Mark advised that he needs to look more closely atD2 to beffer understand data from it.
o Roger noted that there seems to be a move for using run habitat, rather than riffles for periphytonmonitoring and that Alliance should consider this. Mark responded that he would but noted theextensive history Alliance has at the existing sites.
o Roger noted that the lower Mataura is on ES/s radar as being close to bottom lines for periphyton.Monthly data are collected at Gore and Seaward Downs. Reasonably new database at Seaward
Downs; data are variable but above 200 on one occasion.
o Roger suggested focus on periphyton accrual rates would be useful.
o Discussion around need to get some water quality upstream / downskeam data when not discharging.
r Discussion around frequency of clarity and turbiditv monitoring - proposed monthly may not be
sufficient. Discussion around practicality of frequent (weekly) black disc assessments and inability tomeasure black disc at water quality sites (where turbidity would most easily be measured). Arelationship between clarity and turbidity should be developed if possible. ES advised that they have
an easier to transport and use version of the equipment and that they have a local engineering firmmake them. Alliance agreed that weekly monitoring would be more appropriate and will revisit this.
o Roger advised that turbidity analysis should be to tSO 7027 standard - referenced NationalEnvironmental Monitoring document (?) re turbidity.
a
a
a
a
a
a
Discussion re FMU compliance approach / monitoring sites - Roger suggested that ES's thinking hadnot advanced with respect to this.
Discussion re recently advised cyanobacteria outbreak - at Seaward Downs. Observational ratherconfirmed by toxicity testing. Had been significant cover (80%?) but has reduced. Cyanobacteria hadbeen an issue in the Mataura from Gore to Seaward Downs last year.
Roger asked if Alliance had considered deposited sediments - %o cover of fines, re-suspendiblematerial. Mark commented that he didn't think this was an issue but could be assessed during thebiological monitoring.
Frances asked who was likely to assess the application - staffor extemal. Roger couldn't answer -said he would talk to Steve West about this.
o Roger commented that the proposed monitoring looked "pretty comprehensive"
o Roger will provide additional ES data from below the Mataura Bridge to Mark.
o Communications to ES scientists should include both Karen and Roger.
L
't
APPENDIX II
Consultation leaflet posted to letterboxes in Mataura Township
HALLIANCE
FAR,MERS' PR,ODUCE
stxc: ltat
MATAURA RESIDENTS
REGONSENTING OF ALLIANGEMATAURA PLANT MEETING
Alliance is progressing work on renewing some of its key resource consents for theMataura Plant. The key consents are the water take permit, cooling water dischargepermit and wastewater discharge permit.
You are invited to a meeting at:
We are keen to share what wehave learnt through technical investigations, what we are proposing to do and adviseon the application process going forward. This will also be an opportunity forneighbours to ask questions about the proposal and make comment
Further summary information will be available at the meeting, or alternatively pleasecontact Doyle Richardson, Group Environmental Manager, on 03 215 6426 [email protected], if you have any questions in the meantime.
Melonie NagelMataura Plant Manager