far:m dairy - university of plymouth pearl
TRANSCRIPT
University of Plymouth
PEARL https://pearl.plymouth.ac.uk
04 University of Plymouth Research Theses 01 Research Theses Main Collection
1989
ELECTRICITY USE IN THE FARM
DAIRY
Bowes, Robert Christopher
http://hdl.handle.net/10026.1/2679
University of Plymouth
All content in PEARL is protected by copyright law. Author manuscripts are made available in accordance with
publisher policies. Please cite only the published version using the details provided on the item record or
document. In the absence of an open licence (e.g. Creative Commons), permissions for further reuse of content
should be sought from the publisher or author.
ELE·CTR:IC~TY u·sE IN THE FAR:M DAIRY
by Robert Christopher Bowes
Athesis submitted to the Councilfor National Academic Awards in partial
fulfilment of the requirements for the degree of Doctor of Philosophy.
1he work reported herein was carried out at Plymouth Polytechnic and
Seale-Hayne College, with the collaboration of the Electricity Council, the South
Western Electricity Board and the Ministry of Agriculture, Fisheries and Food
(A.D.A.S.).
March, 1989,


DECLARATION
I hereby declare that.this work has not.been accepted for any degree, and
is not being concurrently submitted for any degree other than the degree of
Doctor of Philosophy of the Council for National Academic Awards.
l also declare that all the work reported herein is my own work, except
where acknowledged, and that none of this work has been previously published
except as listed.
R.C.Bowes.
ii
DEDICATION
To Matthew and Christian
iii
To the Librarians of the British Library and Plymouth Polytechnic Library
I give my permission for my thesis to be made available forthwith for
consultation by readers in the respective libraries, or to lbe sent away on
temporary loan if requested by other institutions. I also give my permission for
the production ofa microfiche copy of this thesis, as required by the regulations
of the Council for National Academic Awards (CNAA).
The thesis is made available on the understanding that the reader will not
publish in any form either the whole or any part ofit without written permission
from both the holding library and the author. Where the regulations of the
CNAA and of the holding library allow, I give permission for the thesis to be
photocopied in whole or in part for the purposes of private study.
The copyright of this thesis remains the property of the author.
The term thesis is herein deemed to include the computer disc
accompanying the written report.
iv I
I
)
Table of Contents
ACKNOWLEDGEMENTS
ABSTRACT
l.INTRODUCTION
1.1 The Energy Crisis and Agriculture.
1.2 The UKDairy Farming Industry.
1.3 Trendsin Milk Production.
1.4 ·Equipment currently in use.
1.4.1 Milking and the Transfer of Milk.
1.4.2 Cooling and Storage of milk.
1.4.30leaning the equipment.
1.4.4 Cleaning Udders.
1.4.5 Miscellaneous equipment.
1.5 Literature Review ofRelated Work
1.SJ The Total Dairy and Parlour electricity.
1.5.2 The Bulk Milk Tank.
1.5.3Energy requirements for heating water.
1.5.4 The Vacuum System
1.5.5 Energy Conservation in the Farm Dairy.
1.5.5.1 Pre-cooling.
1.5.5.2 Heat Recovery Units.
L6 Conclusions from the Literature Review.
1. ?Methodology,
V
X
xiii
1
2
3
4
4
6
7
8
9
9
10
16
18
19
19
20
23
24
26
2. THE ENERGY AUDIT
2.1 Auditing Methods
2.1.1 Description of the Audited Farms
2.1.2 Recording of Electricity Use.
2.1.3 RecordingofWaterUse
2.1.4 Recording of Ambient Temperatures
28
28
30
32
32
2.1.5Monitoring of Herd Parameters and unusual events. 32
2.1.6 Frequency and Duration of Monitoring.
2.2 Instrumentation and Calibration
2.2.1 Electricity Meters
2.2.2 Water Meters
2.2.3Temperature Measuring Instruments.
2.3 Analytical Techniques,
2.4 Results from the Audit.
2.4.1 The Total Electrical Energy Input.
2.4.2 The Bulk Milk Tank.
2.4.3 The Vacuum Pump.
2.4.4 The Water Heater.
2.405. The Udder Washer
2.4.6; Lighting
2.4.7 Minor Components of the System.
2.5 Conclusions from the Audit
3. THE BULK TANK MODEL
3.1 Modelling Methodology
vi
32
33
33
34
34
34
41
41
53
64
68
69
70
73
73
80
3.2 Bulk Tank System Analysis 81
3.3 Addition of Milklo the Milk Vessel. 83
3.3.1. Investigation of the milk delivery pattern. 86
3.3.2 Investigation ofthe milk delivery temperature. .88
3.4 Cooling of Milk. 88
3.4.1. Experimental determination of the 'U'-value of the milk vessel. 94
3.5 Heat Transferto the Ice-Bank. 98
3.5.1. Experimental.determination ofthe evaporator surfacetemperature. 106
4. MODEL V A LID A TION.
4.1 limitations of the Model. 111
4.2 Sensitivity Analysis. 113
4.2.1 The 'U' -value of the milk vessel walls and ·floor. 114
4.2.2. The Evaporator Temperature. 116
4.2.3 The Milk Tank FillingPattem 120
4.204 The Milk Delivery Temperature. 121
4.3 Comparison with Laboratory Simulation. 123
4.3.1 Simulation Details and Results. 123
4.3.2 Modification to the Model. 129
4.4 Comparison with Audit Data. 133
5. DISCUSSION
5.1 Justification for farmers' concern 137
5.2 Typical Levels and Ranges of Use. 138
5.3 Factors affecting Levels and Costof Use. 140
vii
5.3.:1 Political Factors. 140
5.3:2 EnvironmentalFactors 141
5.3.3 Technical Factors 142
5.3.4 Managerial Factors 144
5.4 Recommendations for Reduction of Energy Levels and Cost 147
5.4.1 Good energy husbandry 147
5.4:2 Reduction of unit costs 153
5.4.3 Conservation measures. 154
6. CONCLUSIONS
6.1 Recommendations for Further Work. 159
A.PPENDIXI
Calculation, of the Convective Heat Transfer Coefficient, h, for chilled' water at the ice face. CLXI
APPENDIXII
Description of the Bulk Tank Model' Program CLXIII
lhelnputSubroutine CLXIV
List of variables and Default values. CL XIV
Output Modes; CLXVI
Program Execution CLXVIII
Flowchart ofthe main process. CLXX
APPENDIX Ill
List of References CLXXV
kPPENDIXIV
Related publications,by the author. CLXXX
viii
A:PPENDIXV
Notes on use of the accompanying disc. CLXXXll
ix
ACKNOWLEDGEMENTS
'llie work described in this thesis was carried out with the support of the
Science and Engineering Research Council, for whose award of a C.A.S.E.
Post-graduate studentship I am indebted.
I would also like to acknowledge·thesupport, financial and otherwise of
the following organisations:
• The Electricity Council, and especially Dr. Dan Mitchell, head of the
Farm Electric Centre.
• The South Western Electricity Board, and especially Mr. Mike
Grabham, Agricultural Adviser for the Devon area.
• The Ministry of Agriculture, Fisheries and Food, (A.D.A.S.), and
especially" Mr. Eddie Bromwell, Dairy Husbandry Advisory Officer.
• The National Institute for Research in Dairying, and especially Mr.John
Belcher.
• The Agricultural Research Council.
The work for this thesis has been carried out largely at Seale-Hayne
College, Newton Abbot, Devon and Plymouth Polytechnic. I would like to
record my gratitude to both these institutes for making available the academic,
technical and administrative facilities to undertake this work.
My thanks are especially due to my supervisors, Mr David Short of the
Department of Mechanical Engineering at PI ymou th Pql ytechnic and Dr. Adrian
X
V ranch of Seale-Hayne College. Withouttheir guidance, support and patience
this project would never have come to'fruition.
I must also record my thanks to Mr. John Carpenter of Seale-Hayne
College, who was largely responsible for the instigation of the project and Dr.
Tony Vallis,formerly of theDepartmentofMechanical'Engineering at PI ymouth
Polytechnic for advice on aspects of thermodynamics.
I am also indebted to Alice Norman who was working on· a parallel' project
at the same time, for her assistance with data· collection in the field and in the
laboratory together with many in-depth discussions on the two projects.
I am also grateful for the·technical assistance provided by Brian Selley and
Ron Yandell of the thermodynamics laboratory at Plymouth Polytechnic who
coped admirably with the intrusion of a bulk milk tank, its instrumentation.and
the provision of a tonne of warm water.
One of the most enjoyable aspects of the project was to visit the surveyed
farms each week to collect data. I am indebted to alUhe farmers who participated
and allowed me into their farms, and grateful· to them for the many discussions
ofthe practical aspects of dairy farming.
A number of other people have provided advice or help on a number of
topics. Included among these are Barry Undy of Plymouth Polytechnic, for
advice on statistical methods, Dr. John Kirk of Seale-Hayne College for
discussions of calving patterns and lactation curves, Mr Mark Ridley for ad vice
on programming matters and Mr. Ian Robertson of South Devon Microcentre
for translation of the bulk tank program into 'C'.
xi

I must also thank my employers, South Devon Microcentre and lately
South Devon College of Arts and Technology for allowing me the use of
computer equipment to complete the work and prepare this thesis.
Finally, I cannot overlook members of my family whose patience during
the completion of this work and the preparation of the thesis, inust surely qualify
them for 'Beatification. I include my wives and especially my. sons, to whom this
work is dedicated and who gave, of their time with me, more than I had a right
to expect.
xii
'ELECTRICITY USE IN THE FARM DAIRY
Robert Christopher Bowes
ABSTRACl
Dairy farmers suffered substantially increased energy bills during •the 1970's, at a time of herd expansion and modernisation of equipmenno allow bulk milk refrigeration and storage on the farm. Little was 'known of the levels of electricity use in the dairy farming sector, but extrapolations had suggested a figure of300 to over400 kWh/cow/annum. Farmers were requesting quantitative estimates for the potential of conservation equipment, particularly plate heat exchangers and heat recovery units.
An energy audit of dairy farms in South Devon is described. Over a period of two years, data were collected' relating to energy use by each of the major components of a milking parlour and dairy, for a range of parlour sizes, levels·of production and the ambient conditions. Analysis revealed the factors most influencing variations in energy use. An equation was developed to describe the energy use by a bulk milk tank, given the level of production and ,the ambient temperature. The bulk tank accounted for some 40% of the total energy used.
The bulk tank has been studied in detail. The stages of heat ·transfer from the milk to the chilled water and the resulting effects upon the ice bank have been modelled. Laboratory investigations were carried out to determine some parameters empirically. The model's limits, sensitivity and validation are reported.
Typical ·levels and ranges of energy use are suggested. A mean of approximately 250 kWh/cow/annum resulted from the audit, but 200 kWh/cow/annum was achieved by the most economical of farms without resort ~to conservation equipment, and this level is proposed as a target for the conscientious farmer. The factors affecting energy use in the farm dairy are identified as political, environmental, technical and managerial and these are discussed. The farmer's influence has to be directed mainly at the last of these categories. Investment -in energy conservation equipment should not be considered until consumption is down to the proposed target level.
xiii
1.IINITR-ODUCT~ON
1.1 lihe Energy Crisis and Agriculture.
'The sharp rise in energy prices following the Arab oil embargo of 1973
focused attention on the finite nature and political vulnerability .of fossil fuel
·resources. Dependence upon fossil fuels was reported by Pollock (1977) who
estimated world energy demand at 8*1012W, 97% of which is derived from fossil
fuels. Estimates of the remaining life of fossil fuels vary with projected rates of
growth in demand and discoveries of new fields, but are generally placed at
30-50 years for oil and 200-300 years for coal. 'The fall in oil prices during 1985
and 1986 has not, at the time of writing, been reflected in a significant fall in the
price of energy to the end-user. Furthermore it may be argued that fallingprices
will result in a more profligate use of energy thus shortening the remaining life
of fossil fuel reserves. As a result, further price rises seem inevitable in the long
term. The Department of Energy (1978) suggested that "the average level for
energy prices must be expected to rise, perhaps doublingby the year 2000; in
real terms."
The United Kingdom grows .a little more than one half of its food, and
Agriculture uses 4% of national energy to make this unprocessed food available
at the farm gate (White, 1977). Lewis and Tatchell (1979) estimated the input to
U.K. Agriculture as 410*106GJ per year. There is a further significant energy
input in transport and processing so that to feed the population of the United
Kingdom involves the expenditure of about 16% of the nation's total energy use
(White, 1977). White (1979) has also observed that Agriculture in the United
Kingdom is becoming more dependant on energy inputs to replace labour.
Between 1950 and 1970 energy use on the farm of direct fuels and electricity
increased by a factor of 1.7 while the labOur force was halved.
1.2 The U.K.Dairy Fa~ming Industry.
Agriculture,is a major industry in the U.K., contributing 2.11% of the Gross
Domestic Product (Ministry of Agriculture,Fisheries and;Food:(M.A.F.F.), 1982).
Total sales in 1981 amounted to over £9,000 million (Central Statistical Office,
1980). Within the industry, dairy farming is the largest enterprise, producing
milk and milk products to the value of nearly £2,000 million.
In recent years, dairy farmers have come under severe economic pressures
as a result of surplus production of milk products in the European Economic
Community (E.E.C.). Previous attempts to limit production by means of the
Dairy Cow Slaughtering Scheme and the eo-responsibility levy have not -
succeeded and ih 1984 a production quota on individual farms was imposed.
Dairy farming in the U.K. has been regarded as relatively efficient within
the E.E.C. The U.K. has the highest average herd, size (Castle and Watkins, 1977)
and the second highest average milk yield in the E.E.C. ( Milk Marketing Board
(M.M.B.), 1980). Despite this the economic pressures have been particularly
severe in the U.K. During the decade 1970-79,U.K. milk producers experienced
the second most severe squeeze between input prices and output prices in the
Community (National Economic Development Office, 1981). Nevertheless the
high average herd size and milk yield has resulted in a high output per farm
which has enabled U.K. producers to obtain relatively better levels of overall net
personal earnings from milk.
2
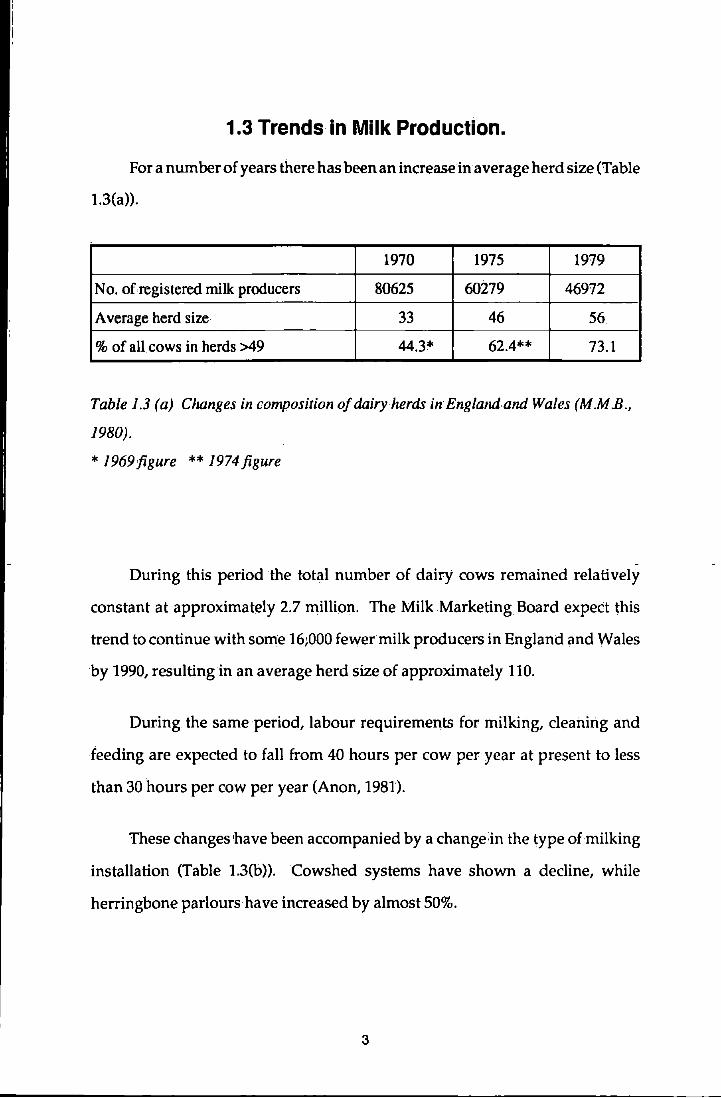
1.3 Trends in Milk Production.
For a number of years there has been an increase in average herd size (Table
1.3(a)).
1970 1975 1979
No. ofregistered milk producers 80625 60i19 46972
Average herd size 33 46 56
% of all cows in herds >49 44.3* 62.4** 73.1
Table 1.3 (a) Changes in composition of dairy herds inEngland and Wales (M.M B.,
1980).
* 1969figure ** 1974 figure
During this period the total number of dairy cows remained relatively
constant at approximately 2.7 million. The Milk MarketingBoard expectthis
trend to continue with some 16;000 fewer milk producers in England and Wales
by 1990, resulting in an average herd size of approximately 110.
Dming the same period, labour requirements for milking, cleaning and
feeding are expected to fall from 40 hours per cow per year at present to less
than 30 hours per cow per year (Anon, 1981).
These changes have been accompanied by a change in the type of milking
installation (Table l.3(b)). Cowshed systems have shown a decline, while
herringbone parlours have increased by almost 50%.
3
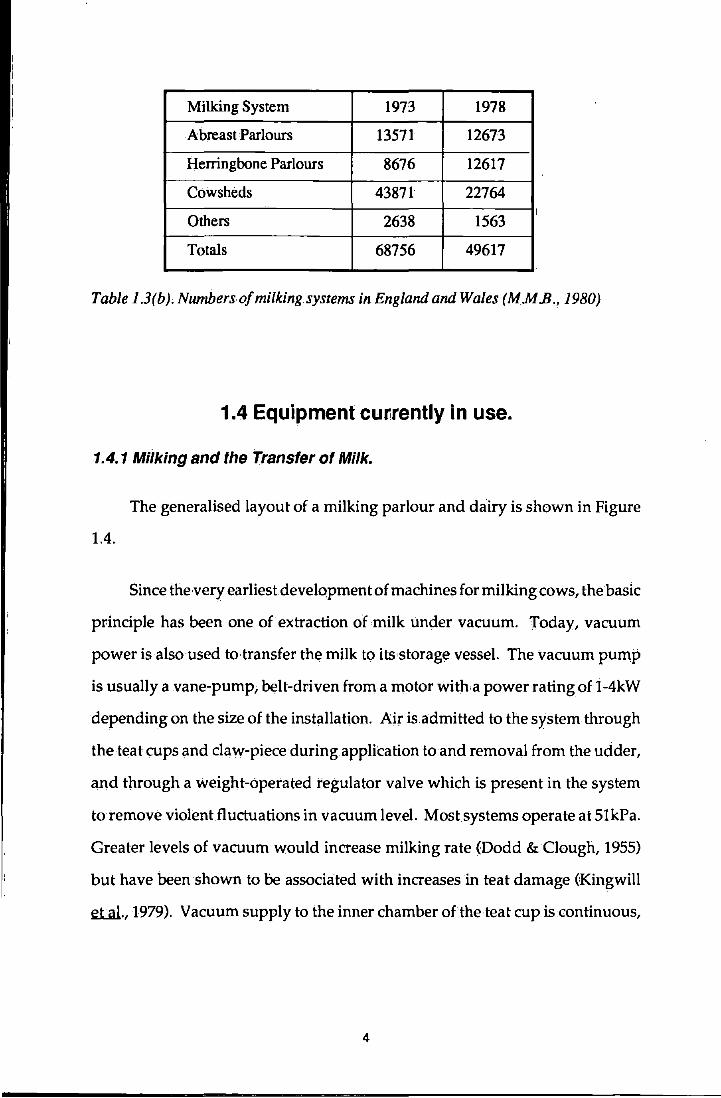
Milking System 1973 1978
Abreast Parlours 13571 12673
Herringbone Parlours 8676 12617
Cowsheds 43871 22764
Others 2638 I
1563
Totals 68756 49617
Table 1.3(b), Numbersofmilkingsystems in England and Wales (MM .B., 1980)
1.4 Equipment cur;rently in use.
1.4.1 Miiking and the Transfer of Milk.
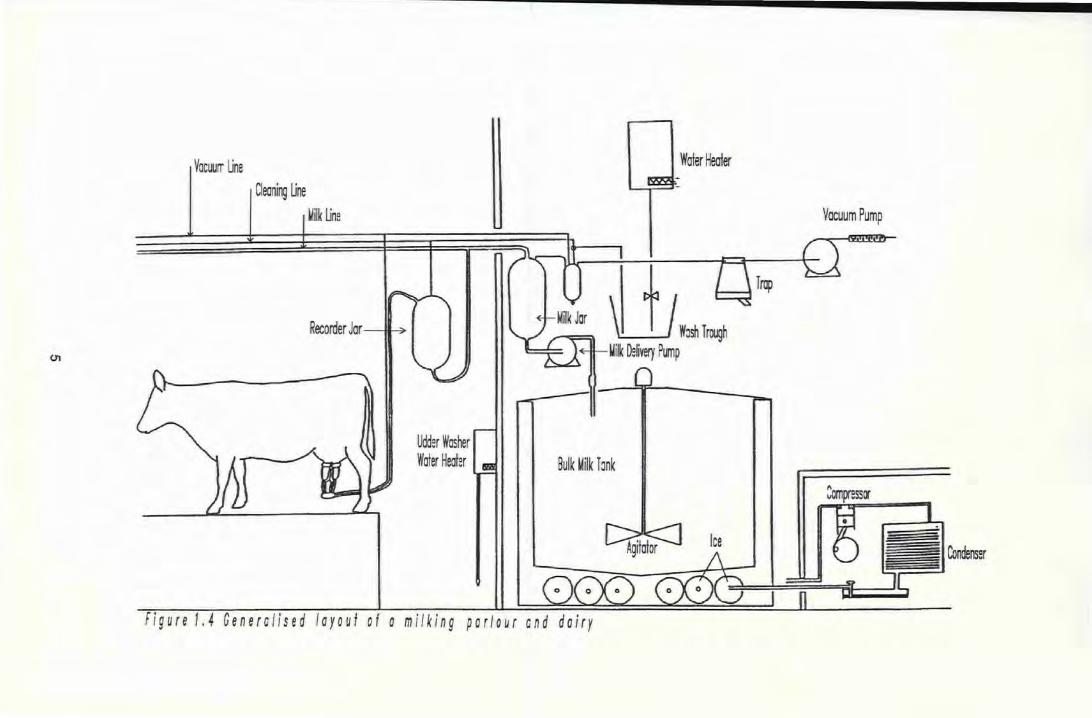
The generalised layout of a milking parlour and dairy is shown in Figure
1.4.
Since the very earliestdevelopment of machines for milking cows, the basic
principle has been one of extraction of milk under vacuum. Today, vacuum
power is also used to transfer the milk to Hs,storage vessel. The vacuum pump
is usually a vane-pump, belt-driven froma motor with' a power rating of 1-4kW
depending on the size of the installation. Air is admitted to the system through
the teat cups and claw-piece during application to and removal from the udder,
and through a weight-operated regulator valve which is present in the system
to remove violent fluctuations in vacuum level. Most systems operate at 51kPa.
Greater levels of vacuum would increase milking rate (Dodd &Clough, 1955)
but have been shown to be associated with increases in teat damage (Kingwill
etal., 1979). Vacuum supply to the inner chamber oftheteat cup is continuous,
4
Vacuurr Une
Oeaning Une
~ilk Une
Recorder Jar-,~
Udder Washer Water Healer Bulk Milk T ~nk
Figure 1.4 Generalised layout of a mil king parlour and dairy
Water Heater
Vacuum Pump
but to.the outer chamber is pulsed at the rate of 45-70 cycles per minute, to allow
regular relief to the teat and to allow the teat cistern to refill with milk.
As a means of improving labour efficiency, a recent development has.been
that of automatic cluster removal. A sensor in the milk line from the cluster
detects the reduction in .flowrate of milk associated with the termination of
milking, and shuts off vacuum to that cluster, which then falls off the udder and
is prevented from soiling on the floor by a retaining cord.
Other equipment within the system under vacilum includes recorder jars
at each milking point, although these may be replaced by milk meters, and a
receiverjar or balance tank which receives the milk before delivery to the bulk
milk storage tank.
Final delivery of milk into the bulk tank is usually achieved by a small (c.
05 kW) electrical· pump. Activation of the pump is by volume or mass in the
milk receiver jar above it.
1.4.2 Cooling and Storage of milk.
All farm dairies now store milk in a bulk milk tank for collection by tanker
once per day. There are specific requirements in terms of construction and
performance of a bulk milk tank, the most important of whieh is a requirement
on a producer to cool milk rapidly after production and to maintain a low
temperature (Milk and Dairies Regulations, 1959). This is most often achieved
by use of a refrigerated bulk milk tank. The refrigeration system may be direct
or indirect.
6
The indirect system is based on the use of chilled water as the cooling
medium. ~he low temperature of the chilled water is maintained by the
presence of an ice-bank which may be built up slowly by a small condensing
unit operating for most of the day. A 680-litre bulk milk tank for example would
require a unit of just over half a kilowatt. With direct expansion tanks,
refrigerant is evaporated in:a corrugated plate or tubes fitted against the outside
wall of the milk vessel itself. Therefore the cooling effect only occurs when the
refrigerant is being evaporated, i.e. when the condenser unit is running. The
requirements for rapid cooling therefore necessitate a relatively large
condensing unit. The 680-litre tank would require a 2.25kW unit for direct
expansion. In practice larger installations would probably require a three-phase
supply and as a consequence are not very common. Producers of very large
volumes of milk may prefer to use an insulated, non-refrigerated tank, reducing
the temperature to an acceptable level before entry to the tank, by means of a
pre-cooler.
1.4.3 Cleaning the equipment.
Many farms now have an automated cleaning system for the bulk tank.
This consists of a small pump which deliverswater to the milk vessel, and meters
the addition of a suitable sterilant. The operation is started manually by the
tanker driver after emptying the tank, and continues under the control of a
timeswitch. After draining out of the tank, a second rinse of clear water is then
metered into the tank and allowed to drain.
There also needs to be provision for cleaning aUother milk contact surfaces
after each milking.. This is achieved by a combination of hot water and/ or
chemical disinfection.
7

Hot water is most often provided' by an electrical water heater of suitable
capacity with a minimum 3kW immersion heater.
Two methods of plant cleaning are currently ill use. The first of these is
the Acidified Boiling Water system (A.B.W.). This system is a once-through
process With water close to :boiling point being drawn through,fhe system under
vacuum and discharged to waste. The second system involves the recirculation,
under vacuum, of a cleaning solution containing detergent and disinfectant, at
a slightly lower temperature.
Until recently, general recommendations have been that hot cleaning
should; take place after every milking. However a number of dairy farmers,
seeking to reduce their electricity costs, have successfully replaced the evening
hot wash by a cold' wash containing sodium hypochlorite as the disinfectant.
1.4.4 Cleaning Udders.
Dirty teats and udders need to be washed prior to milking, Modern
installations are equippedwithhoses with spray nozzles, piping warmed (40°C)
water from a smaU water heater. Purpose-madeheaters have a low capacity and
continue heating the water by means of an immersion heater, typically of 3kW,
during the extraction period. In older installations udders are often washed by
means ofa bucket and cloth, taking water from the main water heater. There is
no general requirement for the water to be warmed and some farmers wash
udders with cold water, at least during the summer months.
8
1.4.5 Miscellaneous equipment.
All parlours will require some level of artificial lighting for at least part of
the year.
Cows are fed at least part of their concentrate ration during milking. Many
systems involve· an arrangement of pull cords and levers to·deliver a metered
volume of feed' to the individual cow. Recent developments have utilised
vacuum power and a central electronic controller working at low voltage.
The parlour should have provision .for cleaning down the walls and floor
after milking, with a plentifulsupply of water; Some farmers fit a small pump
to pressurise this supply.
Finally it is desirable to have sufficient standby capabilities to allow
continuity of routine ·in the event of a power failure. This may take the form of
a simple drive-shaft allowing the vacuum .pump to be driven directly from the
p.t.o. shaft of a tractor. Alternatively the tractor ·Shaft may drive a 25kVA
alternator capable of supplying all the parlour drcuitsatmains voltage through
a change-over switch.
1.5 Literature Review of Related Work
The rise in energy prices referred to in Section 1.1, associated with the
economic pressures on dairy farmers referred to inSection 1!.2, along with the
trends noted in Section 1.3, has caused farmers to express concern about.the cost
and level of energy needed to run their fixed equipment. There has been a
response to this within the equipment supply industry to produce energy
conserving equipment, notably Heat Recovery Units and Plate Coolers. These
9
items represent significant investments for dairy farmers who are wondering
what the level ofsavings will be. Some farmers are sceptical of the claims being
made by the manufacturers of such equipment and are seeking reliable and
scientifically-based assessments of the potential of such equipment
In order to assess the potential for'energy-saving or the reduction in cost
of the energy, it is necessary to know how much energy is expended by a' typical
farm dairy before the installation of any conservation equipment. Very few
dairy farmers are able to assess this level of energy use, as farm dairies are not
usually metered separately from the rest of the farm supply. Furthermore,
where a high level of energy use is<suspected,it is difficultto establish whether
this use is atypically high in the absence of recommended levels of use for
efficient operating conditions.
This wmk has therefore commenced with an examination of the existing
literature to investigate the basis on which the advisory services might assist
farmers to make this appraisal.
Most of the work in the field ofenergy use has tended to investigate only
single items of equipment, frequently the bulk milk tank. l'his review of the
literature has first looked at work of estimating or'monitoring complete dairy
installations and then at the various components of the system.
1.5.1 The Total Dairy and Parlour electricity.
Little comprehensive work has been carried out to determine the energy
demands of dairy farming. Bayetto eLa.l.. (1974) estimated that for milk
production in 1972-73 929 GWh of electricity were used, with an estimated
10
connected load of 540 MW on 30th September, 1972. Assuming a dairy herd
population of 2.7 million cows, this estimate would suggest an annual
consumption of approximately 344 kWh per cow. 'Jihere was no error range
suggested for this estimate, nor was there any comment on the seasonal· or daily
.fluctuations in demand.
Monitoring of completedairy installations in the United Kingdom has only
been carried out by the Shropshire Farm Institute, the Ministry of Agriculture
and the Electricity Council.
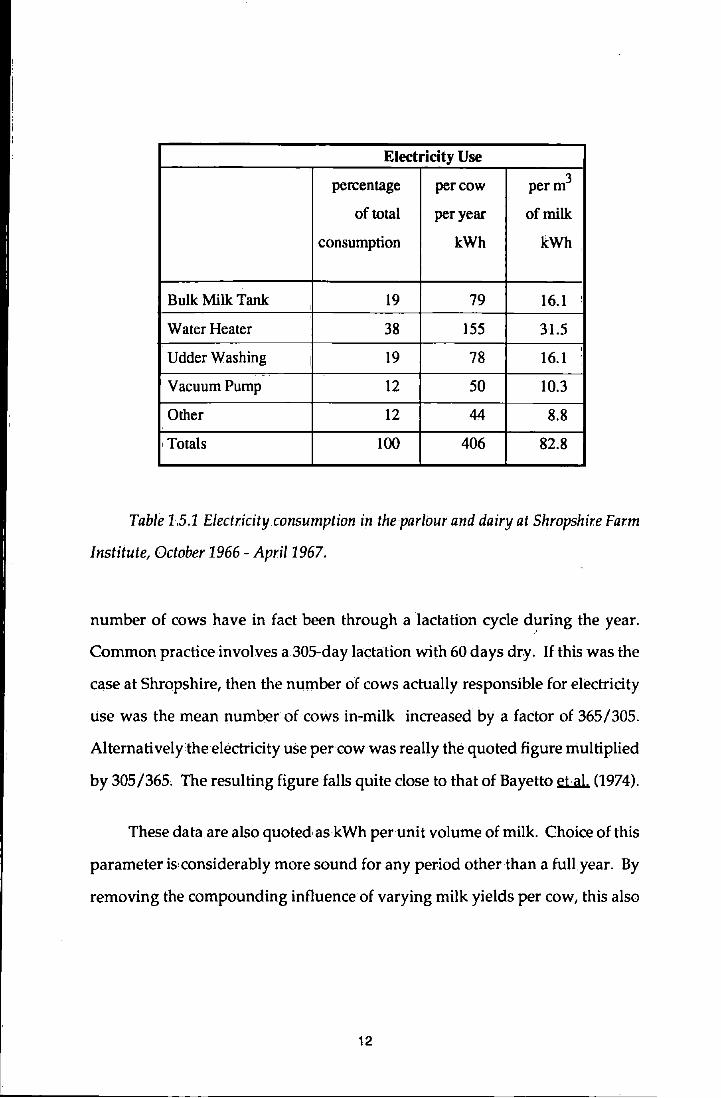
The earliest wmk which attempted to quantify and analyse the total
electricity use in the farm dairy was·carried out by Shropshire Farm Institute.
(1967). In this work electricity and water meters were fitted to all circuits in the
farm dairy and monitoring was carried out for a period of 28 weeks duringthe
winter. The results are summarised inTable 1.5.1.
The main limitation of this work is that the monitoring was not carried out
for a representative period of a whole year. l'he costs of cooling milk may be
expected to rise during the summer, while the costs of water heating fall a little.
Proportions oftotal use would therefore be different. Extrapolation of these data
to an annual basis suggested an energy use of 406 kWh/ cow, which would cost
over £2.0 per cow at todays prices. However the method by which the annual
figure was extrapolated is questionable. The Shropshire workers computed
their annual costs by dividing their 28-week consumption by the average
number of cows at each milking and then applying a factor of52/28 to give the
annual figure. Annual costs will have been incurred by the whole herd,
assuming that all the cows in the herd have been in-milk at some stage in the
year. Use·of the mean number of cows in-milk fails to recognise that a greater
11
Electricity Use
percentage per cow perm3
of total per year of milk
consumption kWh kWh
Bulk Milk Tank 19 79 16.1 ! I
Water Heater 38 155 31.5
Udder Washing I 19 78 16.1 I
Vacuum Pump 12 50 10.3
Other 12 44 8.8
'Totals 100 406 82:8
Table 1.5.1 Electricity consumption in the parlour and dairy at Shropshire Farm
Institute, October 1966- Apri/1967.
number of cows have in fact been through a lactation cycle d~ring the year.
Common practice involves a 305-day lactation with 60 days dry. If this was the
case at Shropshire, then the number of cows actually responsible for electricity
use was the mean number of cows in-milk increased by a factor of 365/305.
Alternatively the electricity use per cow was really the quoted figure multiplied
by 305/365, The resulting figure falls quite close to that of Bayetto etaL. (1974).
These data are also quoted, as kWh per unit volume of milk. Choice ofthis
parameter is,considerably more sound for any period other than a full year. By
removing the compounding influence of varying milk yields per cow, this also
12
allows comparison between farms, both of electricity use by similar components
and of total electricity use.
Electricity used for milk cooling is a function of the mass of milk to be
cooled and completely unrelated to the number of cows which have produced
it. It seems reasonable .to assume that vacuum pump electricity is more closely
related to the volume of milk extracted than to the number of cows milked.
Electricity used by the plant cleaning water should be related to the size of the
plant,not the number of cows using it.
The dangers of extrapolation have been mentioned but there is a further
reason to question the applicability of these results. The Shropshire Farm
Institute, being a teaching College, was known to maintainan exceptionally high
standard of hygiene in the parlour and this is probably reflected in the high cost
of heated water, which will also increase the total cost.
The Ministry of Agriculture, Fisheries and Food monitored the total
electricity use on four experimental husbandry farms for two years from 1974
to 1976 (M.A.F.F., 1976), The electricity use for the whole dairy system included
offices and collecting yards. The results showed a very wide range from 309
kWh/cow./annum at one farm to 533 kWh/cow/annum at another. The
reasons for this wide range were not explored. The latter farm in fact recorded
468 kWh/ cow for the first year and 638 kWh/ cow for the second year,
suggesting that some fairly dramatic but unspecified change had occurred.
There was no attempt to:break down the electricity use by component. A similar
criticism to the Shropshire work must apply here also, in that the monitored
farms were experimental husbandry farms rather than purely commercial milk
producing farms.
13
The Electricity Council (1975) started monitoring electricity use by
individual items in the farm dairy at the National Agricultural: Centre. As at the
Shropshire Farm Institute, the water heater was the heaviest user of energy,
requiring 34.2 kWh/m3, more than twice the energy use of the bulk tank. At
both Shropshire and the National Agriculture Centre the plant was cleaned by
the A.B.W. method which is known to have a higher temperature and volume
requirement than circulation cleaning, per wash. The figures reported from
N.A.C. were for aJew weeks only and to date there is still no published work of
monitoring all parlour items for a full annual cycle in this country.
Rennie (1979) reported monitoring of each piece of equipment at a single
farm in New Zealand for the 1977/78 season. A "season" in New Zealand is
frequently less than a whole year, it being common practice to dry off all the
herd at once and cease milking for a few weeks, usually in mid-winter. Tariff
arrangements in New Zealand are somewhat different to those in this country
and ranking of equipment by electricity consumption will produce a different
result to ranking by cost. For these reasons the results are not very applicable
to this country, but itis interesting to note that the biggest electricity user, both
by quantity and cost, was the water heater. The bulk tank used the second
highest amount of electricity but the vacuum pump had the highest cost.
Some recommendations to farmers are available via the Electricity Council
(1978) who suggest that approximate figures expected for a herd of 89 cows
milked through a parlour with pipeline to a bulk tank, would be 26,600
kWh/annum if circulation cleaning is used and 31,750 kWh/annum if A.B.W.
cleaning is used. In the latter case the water heater will be the highest user at
31% of the total. In the case of circulation cleaning the water heater electricity
cost will be halved, leaving the bulk tank as the largest user. The apparent saving
14
from using circulation cleaning would be £129 at 1978 prices. In either case the
total electricity use would be considerably less than that suggested by the
.Shropshire work.
The figures available to farmers are therefore either estimates orthe results
of monitoring which is either incomplete.or of questionable applicability. The
estimates of Bayetto eLal.. (1974) and the corrected measurements from
Shropshire Farm Institute at 344 and 339 kWh/cow /year respectively are fairly
similar. The Ministry of Agriculture's figures are considerably higher but
probably not truly comparable as the electricity use by collecting yards and
offices was included. The Electricity Councilfs handbook suggests 299-357
kWh/cow/year depending on the cleaning method. There is very little
indication as to whether these figures would be typical for commercial dairy
farms or indeed if they represent typical figures for the operation of milking
equipment in• efficient operating conditions. It may be the case that one or more
components of the system is using excessive amounts of energy while.another
is using less than it should. To expand upon this point, there is no indication
that the water for plant cleaning was being heated to the recommended
temperature or that the milk was being adequately cooled. 'Failure on one count
might be compensated for by poor setting on the controls of the other, resulting
in inefficiencies which cancel out when the total energy figures are examined.
J:hese doubts therefore led to a further examination of the literature in
respect of the individual components of the system.
15
1.5.2 The Bulk Milk Tank.
Despite the indications above that the water heater will have the largest
demand, it is the bulk tank which has been reported in most detail. This is
possibly due to the relatively recent innovation of refrigerated milk cooling and
the obvious potential for energy reclamation offered by the cooling process.
The literature contains some suggestions of the likely energy expenditure
for cooling milk together with some reports of laboratory work on milk cooling
costs. The published work ·of on-farm investigation of milk cooling costs is
limited.
Hoyle and Belcher (1971) suggested a typical cooling cost of 1 Ogallons (451)
of milk cooled per kWh of electricity used, with a variation of ±10%. The same
figureis quoted by Bayetto fLll. (1974) in their estimates previously referred to.
'fhis figure is equivalent to 22.22 kWh/m3.
Exactly the same figure of 22.22 kWh/m3 is quoted by Fleming and
O'Keefe (1982) for an ice bank tank. They also gave a figure of 14.29 kWh/m3
for a direct expansion tank, noting that this tank would require a condensing
unit about twice the size of that for a comparably sized indirect refrigeration
tank. Hoyle and Belcher (1971) had suggested that the direct expansion tank
would require a· condensing unit of four times the size compared with an indirect
refrigeration unit.
As a prelude to investigating water heating with heat energy from the
refrigeration cycle, Cromarty (1968) investigated the .performance of a 125 gallon
(5681) prototype refrigerated direct expansion tank following the M.M,B.
16
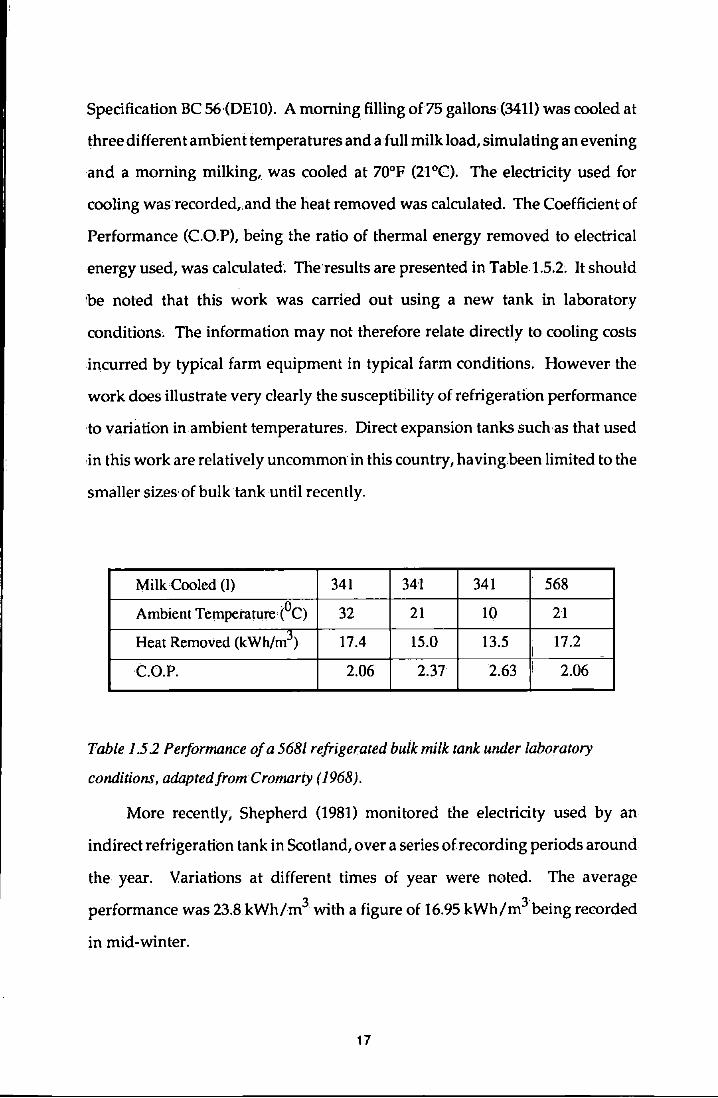
Specification BC 56·(DE10). A morning filling of75 gallons (3411) was cooled at
three different ambient temperatures and afull milk load, simulating an evening
and a morning milking, was cooled at 70°F (21°C). The electricity used for
cooling was recorded,.and the heat removed was calculated. The Coefficient of
Performance (C.O.P), being the ratio of thermal energy removed to electrical
energy used, was calculated~ The results are presented in Table 1.5.2. It should
be noted that this work was carried out using a new tank in laboratory
conditions, The information may not therefore relate directly to cooling costs
incurred by typical farm equipment in typical farm conditions. However the
work does illustrate very clearly the susceptibility of refrigeration performance
to variation in ambient temperatures. Direct expansion tanks such as that used
in this work are relatively uncommon in this country, having.been limited to the
smaller sizes of bulk tank until recently.
MilkCooled (I) 341 341 341 568
Ambient Temperature (°C) 32 21 10 21
Heat Removed (kWh/mj)· 17.4 15.0 13.5 I
17.2
C.O.P. 2.06 2.37 2.63 11 2.06
Table 1.5 2 Performance of a 5681 refrigerated bulk milk tank under laboratory
conditions, adaptedfrom Cromarty (1968).
More recently, Shepherd (1981) monitored the electricity used by an
indirect refrigeration tank in Scotland, over a series of recording periods around
the year. Variations at different times of year were noted. The average
performance was 23.8 kWh/m3 with a figure of 16.95 kWh/m3being recorded
in mid-winter.
17
A lower figure of 20.5 ± 2.36kWh/m3 was the mean performance of 19
ice-bank tanks on 8 farms throughout the country, monitored by M.A.F.F.,
Agricultural Development and Advisory Service (A.D.A.S., 1981'). Ambient
temperature recordings were made and a direct correlation between the cost of
milk cooling and ambient temperature was suggested and given by the
regression equation:
y = 15.8 + 0:53x
where yis the milk cooling cost (kWh/m3)
xis the ambient temperature (0 C)
The standard error for the intercept term was 0:79 and for the x-coefficient
0.07. The seasonal variations were remarkably similar to Shepherd's figures
quoted above. The average of all sites had a minimum of 16.7 kWh/m3 in
January and a maximum of 24.7 kWh/m3 in July. The lowest monthly figure
for any site was 11.5 kWh·/m3 in January and the highest was 38.9 kWh/m3 in
July. The fillage rate showed no significant effect on electricity consumption.
The between-farms variation in average cooling cost (25.4 -16.8 kWh/m3)was
not correlated to difference in ambient temperatures between sites and A.D.A.S.
concluded that standard, of installations, mode of use, and level, of maintenance
must account for a substantial proportion of the variation.
1.5.3 Energy requirements for heating water.
There has been a considerable amount of published work relating to
cleaning of milking equipment. However very little of this work refers to
electricity use by the water heater. There is considerable dispute as to the
temperature, volume and frequency of hot washing necessary to maintain the
18
plant in a clean condition. This has resulted' in a number of different
recommendations being made to farmers (e.g Electricity Council (1978),
A.D.A.S. (1977), BS5226:1975). The differences have been reported by Norman
f.l.al. (1981 ) .
Production and use of hot water in the farm dairy is the subject of another
study being carried out at Seale~Hayne College. Production of warmed Water
for udder washing is also part of this study, but it should again be noted that
recornnl.endations to farmers are very unclear. There is a requirement in the
Milkand Dairies (General) Regulations (1959).that visible dirt be removed from
the udder, tail and flanks of the cow before milking. The extent of washing will
result .from the herdsman's subjective assessment of cleanliness. The work
carried out at Shropshire Farm Institute and the N.A.C. have been the only
attempts in this country to quantify the electricity use until the present study.
1.5.4 The Vacuum System
Much of the published work relating to the vacuum system'is in connection
with rates of milking and effects upon the udder (e.g. Dodd and Clough, 1955
and Kingwill f1...aL. 1979). Again, only ,the works already cited refer to the
electricity use.
1.5.5 Energy Conservation In the Farm Dairy.
The rising price of purchased energy has led to work in recent years to
attempt to reduce the electricity costs in the farm dairy. Much of this work has
centred around the significanHevel oflow-grade heat which has to be removed
from the milk. A cubicmetreofmilkhastogiveup approximately 125MJ during
19
cooling from 35°Cto 4 °C. Removal of this heat requires a ,further input of energy
through the refrigeration system. This energy is normally all rejected to the
atmosphere by the air-cooled condenser.
Most workers have taken one of two approaches. The first approach is ,to
reduce the electrical cost of cooling the milk by reducing the thermal energy .to
be removed by the refrigeration,system. l'his is achieved by pre-cooling the milk
in a milk-to-water plate heat exchanger. The second approach is to recapture
some of the heat from the high pressure side of the refrigeration cycle by
inserting a water cooled condenser between the compressor and the air-cooled
condenser. This is known as· a heat recovery unit (HRU).
1.5.5.1 Pre-cooling.
AD.A.S (198l),have recently carried outmonitoring workinvolving single
and two-stage plate heat exchangers in Conjunction with ice-bank tanks. The
single stage is a simple milk-to-water plate cooler. Twelve tanks on'seven farms
using the single stage method used an average of 1.8.cubic metres,of water for
each cubic metre of milk pre-cooled. Refrigeration costs .for the remaining
cooling stage averaged 11.2 kWh/m3. The relationship between electricity
consumption and water temperature was found to be given by:
y = 3.37 + 0:68x
where y =electricity consumed (kWh/m3).
x = water temperature (°C)
20
However, water temperature was also ,found to follow closely the ambient
temperature so the regression equation could be re-written as:
y =6.81 + 0.4h
where x = Ambient Temperature (0 C)
The two-stage plate exchanger removes all the heat necessary to reduce the
milk to its target temperature before storage in an insulated, non-refrigerated
tank. The two stages are firstly running water as for the simple plate cooler and
secondly a refrigerated medium, usually glycol. Eight farms using this type of
cooler used anaverage of2.5 cubic metres of waterper cubic metre of milk cooled
and refrigeration costs were 9.7 kWh/m3. The regression equation derived from
these results was:
y = 1.54 + 0.55x
where y =Electricity consumed (kWh/m3)
x = Watertemperature(°C)
With both the single and two-stage pre-cooling there was no significant
correlation between the Water/Milk ratio and the electricity used. Reference
was made earlier to the part of this work which investigated the refrigerated
tanks withoutpre"cooling, which had an average electricity useof20.S•kWh/m3.
A.D.A.S. concluded.thata correctly installed and operated water assisted system
requires approximately half the electricity used by ice-bank refrigerated tanks.
They also recognised and commented that the cost and/ or re-use ofthecooling
water is vital to the economics of such systems. Where water has to be
purchased, a high proportion must be re-used to justify the system in·economic
terms.
21
Ubbels fi..al.. (1975) were able to save .6.6 kWh/m3, or about one third of
the cost of using a direct expansion tank, by pre~cooling. Later, Ubbels and
Bouman (1978) reported that 50% of the thermal energy would be removed by
pre-cooling.
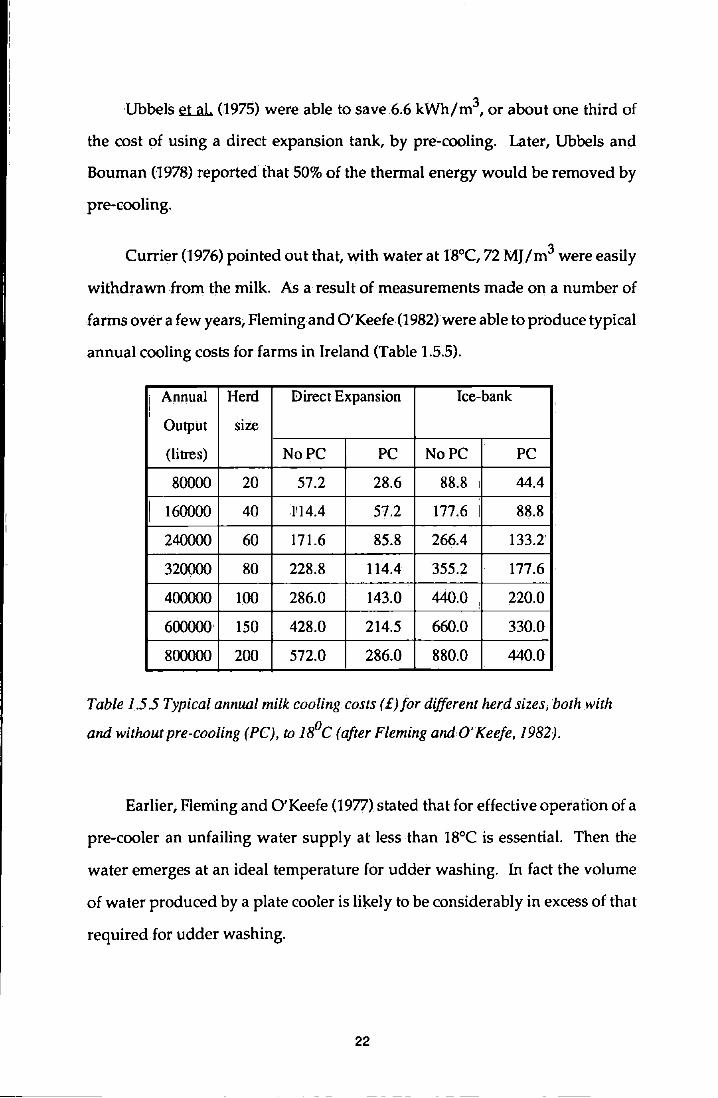
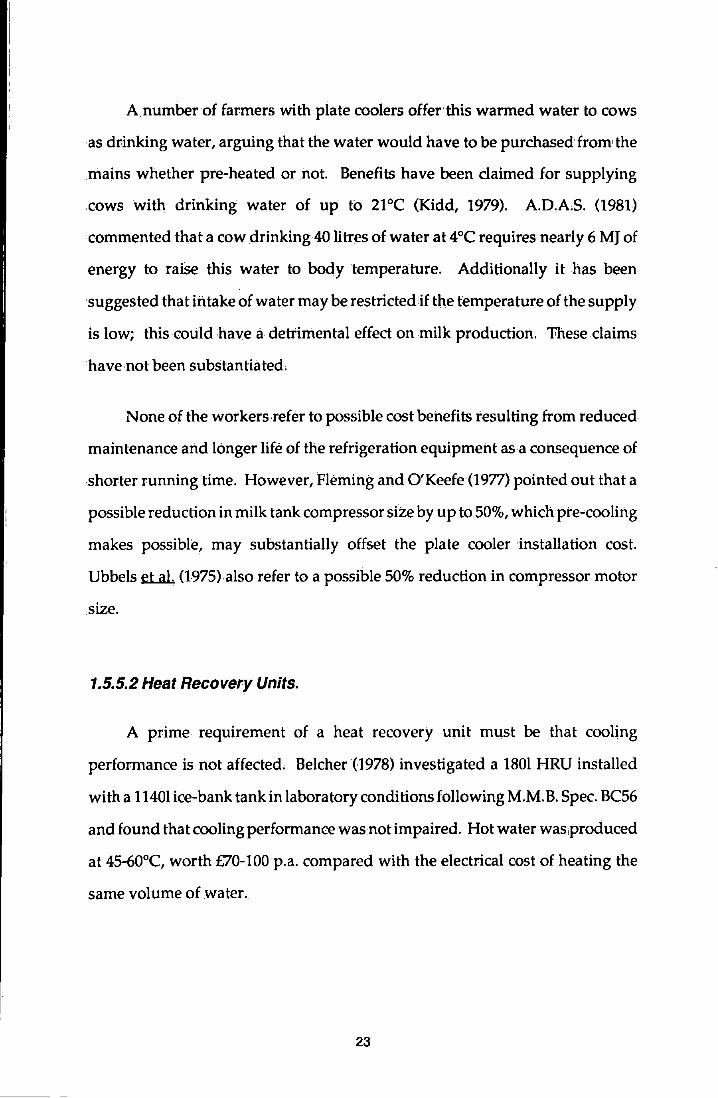
Currier (1976) pointed out that, with water at l8°C, 72MJ/m3 were easily
withdrawn .frorn the milk. As a result of measurements made on a number of
farms over a few years, Fleming and O'Keefe (1982)were able to produce typical
annual cooling costs for farms in Ireland (Table 1.5.5).
i Annual Herd Direct Expansion Ice-bank I I
Output size
(litres) No PC PC No PC PC
80000 20 57.2 28.6 88.8 I 44.4
I 160000 40 1114.4 57.2 177.6 I 88.8
240000 60 171.6 85.8 266.4 133.2
320000 80 228.8 114.4 355.2 177.6
400000 100 286.0 143.0 440.0 !
220.0
600000· 150 428.0 214.5 660.0 330.0
800000 200 572.0 286.0 880.0 440.0
Table 1.55 Typical annual milk cooling costs (£)for different herd sizes, both with
and without pre-cooling (PC), to I8°C (after Fleming and O'Keefe, 1982).
Earlier, Fleming and O'Keefe (1977) stated that for effective operation of a
pre-cooler an unfailing water supply at less than 18°C is essential. Then the
water emerges at an ideal temperature for udder washing. In fact the volume
of water produced by a plate cooler is likely to be considerably in excess of that
requiredfor udder washing.
22
A number of farmers with plate coolers offer this warmed water to cows
as drinking water, arguing that the water would have to be purchased from the
mains whether pre-heated or not. Benefits have been claimed for supplying
cows with drinking water of up to 21°C (Kidd, 1979). A.D.A.S. (1981)
commented that a cow drinking 40 litres of water at 4°C requires nearly 6 MJ of
energy to raise this water to body temperature. Additionally it has been
suggested that intake of water may be restricted.ifthe temperature of the supply
is low; this could have a detrimental effect on milk production. '"These claims
have not been substantiated.
None of the workers.refer to possible cost benefits resulting from reduced
maintenance and longer life of the refrigeration equipment as a consequence of
shorter runningtime. However, Fleming andO'Keefe (1977) pointed outthat a
possible reduction in milk tank compressor size by up to 50%, which pre~cooling
makes possible, may substantially offset the plate cooler installation cost.
Ubbels e.t...aL. (1975).also refer to a possible 50% reduction in compressor motor
size.
1.5.5.2 Heat Recovery Units.
A prime requirement of a heat recovery unit must be that cooling
performance is not affected. Belcher (1978) investigated a 1801 HRU installed
with a 11401 ice-bank tank in laboratory conditions following M.M.B. Spec. BC56
and found that cooling performance was not impaired. Hot water was;produced
at 45-60°C, worth £70-100 p.a. compared with the electrical cost of heating the
same volume of water.
23
The pot en tialfor energy recapture has been·recognised by several workers.
Fleming and O'Keefe reported that for each litre of milk cooled from 35°C to 4°C
a total of 40 kCals (0.17 MJ) is available from the milk and compressor if a direct
system is used. With an indirect system this becomes 46 kCals (0.19 MJ).
Dorfinger (1978) suggested that the use of HRUs could save Austria almost 10
million kWh per year. Sinclair (1979) claims a reduction in electricity
consumption of 2500-4000 kWh per year can be made with a 1351 HRU and a
9001 bulk tank.
Despite .this, economic benefits are uncertain when installation costs are
considered. White (1979) reported that heat from the milk of 60 cows in an 1'1001
tank is sufficient to heat 1301 of water to.43-60°C twice daily. The installation
cost would have been £250 and the saving £70 p.a. The payback time suggested
by White's figures (3.7 years,on a simple ratio basis) must be viewed' in the light
of alternative investment possibilities to the farmer. Ubbels (1977) concluded
that in many cases the use of a heat pump (strictly,.a heat recovery unit) is still
not justified.
Finally, Prosser (1977) summarised experiences with an HRU at the
National Agricultural Centre and concluded that the evidence was still
insufficient to say whether it was justified or not. Energy cost savings might be
possible in other ways for very little cost.
1.6 Conclusions from ·the Literature Review.
Agriculture uses 4% of national energy to contribute 2.1% of Gross
Domestic Product. Although this comparison is not strictly valid because of the
different units involved, the energy input to Agriculture is substantial by any
standards. Agriculture has traditionally been a labour-intensive industry, but
24
in recent decades there has been a trendtowards replacing labour by high energy
input systems, In the light of this and other trends, referred to earlier,Jarmers'
concern is understandable,
Energy use by the dairy farming sector has not been well researched or
reported. The electrical energy use per cow would seem to fall in the range of
approximately 300-350 kWh/cow/year but there is no published report of
recording for a full annual cycle in.this country. In the1light of increasing yields
per cow, farmers also need to know the energy costs per unit of milk produced,
particularly in respect of marginal units produced. The seasonal variation of
this total electricity demand has not been reported~ neither has the variation
within the daily cycle,. points which are of interest to the Electricity Supply
Industry.
Reports of work on the use ofelectricity by the bulk tank have indicated
the susceptibility of cooling performance to temperature variation. It is
suggested that cooling costs in winter are about one-third lower than the annual
average. It seems reasonable to assume that if seasonal variation of ambient
temperatures can cause such variation in the cooling efficiency, then the same
should be true of the daily cycle, but none ofthe reports makes this point. It also
seems reasonable to conclude that siting of the refrigeration unit, in respect of
ambient conditions might be an important factor. Again, this point has not·been
clarified by the literature.
There is very little literature re la tingto the ellergy use by other corn ponen ts
of the milking parlour and dairy.
Energy conservation equipment does seem to. have considerable potential.
However, there seems to be some doubt among the workers reported, about the
25
extent of this potential and whether it is sufficient to justify the capital involved.
The management of the equipment maybe a crucial factor to the success of the
investment.
The literature, then, leaves unanswered many of the questions which are
pertinent to a consideration of energy conservation in the farm dairy. The
suggested figures for total electricity consumption per cow need confirmation.
The electricity use by the,components of the system need .to be determined and
confirmed. The causes of variation need to be identified and quantified. Until
this basic information is established, claims for the effect of conservation
equipment will be spurious and lack.credibility.
1. 7 Methodology.
Having recognised that there is concern.about the level and cost of energy
use in farm dairies, the purpose of the current work is to establish reliable
information upon which to base recommendations to farmers, their advisers,
the Electricity Supply Industry and future workers in this field.
Farms will vary considerably in respect of the major factors which will
affect the level of energy used. An energy audit of a number of farms was
selected as a suitable method of identifying the factors involved. This was
supplemented by the development of computer based models constructed from
theoretical considerations which have beer\. used to evaluate the factors which
cause variation in the level of energy use. The quantitative data from the audit
have been used for model validation. Sensitivity and limits to the model's
applicability have been established.
26
This approach to the problem has permitted the answering of a number of
questions posed by the literature review. A two-year energy audit was carried
out to allow full and thorough examination of the seasonal variations. The audit
has examined a number of commercial dairy farms, with variations in herd size,
seasonality of production and type of equipment installed. Detailed
observations have been carried out in respect of the bulk milk tank, this item
appearing, from the literature, to have the highest within-farm variation of all
the components of the system. For this reason, a major emphasis has been placed
on the bulk milk tank in the modelling aspects of this work.
The audit has also allowed quantitative assessment of electricity use by
other components of the system.
Development of the model has enabled a closer examination of the factors
involved in variation of energy use. The object of this part of the work was to
identify which of these factors would most readily repay managerial attention
or design re-appraisal. The intention was to develop the criteria for optimisation
of energy use before any equipment specifically designed for conservation is
applied. Establishment of the optimum use of typical equipment in farm
conditions can then be used as a baseline against which to measure the effects
of conservation measures,
The workconcludeswith recommendations in respect of energy usein the
farm.dairy.
27
2.1 Auditing Methods
2.1. 1 Description of the Audited Farms
"fhirteen dairy farms were selected for auditing, which commenced in the
early spring of 1980 and lasted approximately two years. Selection was carried
out from a pool of farms suggested by A.D.A.S., to provide a variation in herd
size and equipment installed. All of the farms involved expected to make few
or no major changes to their farming policy or equipmentduring the life of the
audit. In practice there were a number of changes, detailed later.
Twelve of the farms were purely commercial dairy farms. Eleven of these
were in the South Hams area of South Devon, the other being near Crediton, to
the North-East of Dartmoor. The thirteenth farm was the Seale-Hayne College
farm which was selected for monitoring in greater detail'.
"fhe farms were grouped according to herd size; small herds (up to 70
cows),medium sized herds (80-120 cows), and large herds (more than 120 cows),
Farms were then labelled A to M following nominal. herd size. The Seale-Hayne
farm was designated farm X.
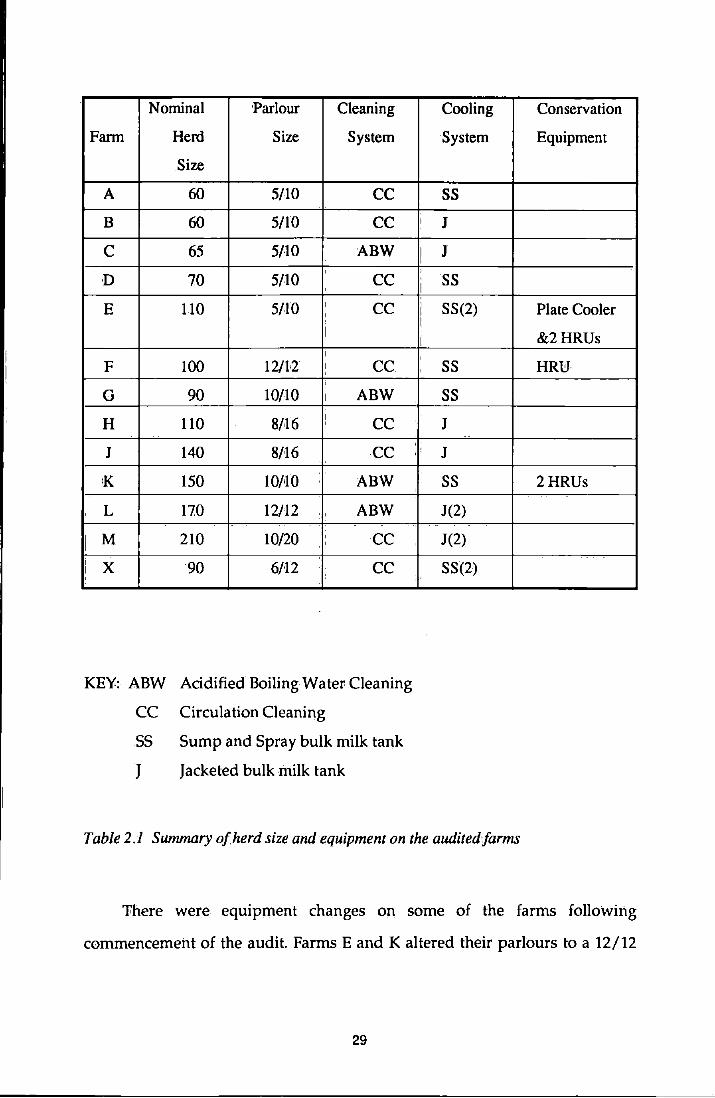
A:ll the farms have herringbone milking parlours and Friesian dairy herds,
except D which·has a Jersey herd. Table 2.1 summarises the .farms and their major
equipment and herd.size.
28
Nominal 'Parlour Cleaning
Farm Herd Size System
Size
A 60 5/10 cc B 60 5/10 cc c 65 5/10 1:
ABW
n 70 5/10 I
I I
cc E 110 5/10
I cc
I
I
F lOO 12/112 I cc G 90 10/10 I ABW
H 110 8H6 I cc J 140 8/16 cc K 150 10/•10 ABW
L 170 12/12 '' ABW
I M 210 10/20 ' cc '
I X 90 6/12 cc I '
KEY: ABW Acidified Boiling Water Cleaning
CC Circulation Cleaning
SS Sump and Spray bulk milk tank
J Jacketed bulk ·milk tank
Cooling
System
ss I J
I J
' I
ss I I
SS(2)
i
' ' ss
ss J
'' I J
ss '
J(2)
J(2)
SS(2)
Table 2.1 Summary ofherd size and equipment on the auditedfarms
Conservation
Equipment
Plate Cooler
&2HRUs
HRl:J·
2HRUs
'Jihere were equipment changes on some of the farms following
commencement of the audit. Farms E and K altered their parlours to a 12/12
29
(September 1980) and 16/16 (July 1981) respectively. A number of changes of
cleaning system or routine took place. Farms C (September 1980) and H (June
1981) changed to larger milk tanks, farm H adding a plate cooler at the same
time. Farm L ceased milk production in June 1981. Farm M reduced its herd size
from 210 to 70 cows (Autumn 1981).
Farms D, J and X are under institutional1ownership; all the othefifarms are
under the ownership of an individual, family or partnership. In the case of farms
B, C and F, the owners undertake a major proportion of the milking work. All
other farms employ one or more herdsmen for most of the milkings. Farms 0,
J, K, Land X also employ a manager. All the farms practise twice a day milking.
Ten of the .farms are mainly winter milk producers. Farms A and G aim for
all year round production, while·farm C is a mainly summer milk producer.
Farms B and F have new, purpose-built, prefabricated buildings which
allow good penetration of natural light. Farms A, D, K, L and X have older
purpose built buildings constructed of traditional materials. The remaining
farms have old, converted buildings which are typically very dark.
2. 1.2 Recording of Electricity Use.
Electricity meters were installed by engineers from the South Western
Electricity Board (S.W.E.B.). On the twelve farms A to M, electricity meters were
fitted to the circuits controlling the five major energy users in each farm dairy.
These circuits were:
• The Bulk Milk Tank including compressor motor, condenser fan, milk
and chilled water agitators.
30
• 'Fhe Vacuum Pump Motor.
• The Hot Water Heater.
o The Udder Washer Heater.
• The Lights.
In addition, a further meter was fitted to the main supply to the dairy to
meter the total electricity consumption. By subtraction of the sum of the five
major components from the total, the energy use by minoi: components such as
tank rinsing units and pressure washers could be found. Where circuits were
taken off the main supply for non-dairy uses, e.g. calf"feeding water heaters,
these were also metered to enable subtraction from the total. Where present,
stand-by generators were also metered.
In the Seale-Hayne farm dairy (Farm X) additional meters were installed
so that every circuit was individually metered. The additional meters covered
the following circuits:
o Agitators and, Chilled Water Spray Pumps (2)
• Automatic Tank Rinsers
0 Pulsator
• Power Hose Pump
• Milk lift Pump
0 Feeders
31
2.1~3 Recording of Water Use
l'he Seale-Hayne Farm was equipped with inferential water meters to
measure the water used by each of the tank rinser units and by the power'hose.
This was done to give some indication of the relationship between the electricity
used by these items and the mass of water handled.
2. 1.4 Recording of Ambient Temperatures
Bimetallic thermographs were installed at each site to record ambient
temperatures in the dairies. Charts were changed when the other meters were
read. The charts were analysed by measuring 'the area under the trace with a
planimeter. A simple model then converted this area into a mean ambient
temperature for the ,period recorded.
2.1.5 Monitoring of Herd Parameters and unusualevents.
Data on milk production, changes in herd size and numbers of cows
in-milk were·collected at regular intervals by accessing farm records. An Event
Record notebook was left in· each farm dairy and farmers were asked to record
any unusual events, such as power cuts, which could affect the electricity
consumption.
2.1.6 Frequency and Duration of Monitoring.
Monitoring commenced as.soon as the metering was installed, which was
on various dates duringthe winter and spring of 1980. Initially all meter reading
32
was·on a weekly·basis. By the beginning of March 1980, all farms, except Farm
G, were fully metered and had had a short "running in" period. During March
1981, foot and·Il\outh disease precautions prevented meter reading by the author
for a period of 4 weeks, commencing 24th March 1981. Farmers were asked to
read the meters and send in .the data by post for this period. This request was
only partially successful, resulting in 4-week gaps in the data for some of the
farms, The data were complete, however, for all the farms, except for Farm G,
for the full year up to 17th March, 1981.
Having fulfilled the objective of obtaining a complete annuakycle of data,
based on weekly meteneadings, the decision was taken to continue the audit
for a second year in order to obtain confirmatory data, but to collect the data on
a monthly basis instead of weekly. The 30th of June, 1981 was a convenient date
for the changeover in recording regime, this occurring on a weekly recording
day and; also being the.end of the month. The audit continued on this basis until
the end of April1982 when readings were terminated. lihere was thus a complete
second year of auditing from April1981, when readings resumed after disease
precautions were lifted, untilApril1982.
2.2 'Instrumentation and Calibration
2.2. 1 Electricity Meters
These were calibrated.by S.W.E.B. before installation, to comply with their
standard accuracy range of -2% to+ 1%.
33
2.2.2 Water Meters
A simple test-rig was constructed for the purpose of calibrating water
meters, 'fhis consisted of a header tank, refilled through a ball-valve from the
mains supply, and feeding a down~supply in which:thewatermeter was located
followed by a gate-valve. Below the,down supply was placed a vessel to catch
the water passing through the meter. The meters were then calibrated against
the mass of water passing through them.
'Fhe meters were Kent inferential meters of size 15mm and 22mm
connections and were all found to,be within the manufacturer's specifications.
Errors were between -1% and +1 %.
2.2.3 Temperature Measuring Instruments.
Thermographs were calibrated over their working range against a
mercury-in~gl'ass thermometer of known accuracy. At regular intervals the
thermographs were checked on the farms against a hand-held digital
thermometer, and adjustments were made as necessary.
The digital thermometer was calibrated in the laboratory against a
mercury-in-glass thermometer of known accuracy. The error was found to be
-1.5°C at ooc and -0.75°C at 90°C. Intermediate errors were linear,
2.3 Analytical Techniques.
Recording sheets for weekly meter reading were designed to enable the
week's consumption to be calculated and compared with the previous week's
consumption while still on site. This method allowed inconsistent levels of
34
consumption to be checked for validity while still on the farm. 'fhe data were
then filed on the Prime mainframe computer at Plymouth Polytechnic and
analysis was carried out using the statistical package 'Mini tab'.
Data for each farm were in.i tiall y filed as separate files. 'fhe data items for
each farm were:
Week number ........ , .. Week 1 for all farms was the week ending
Farm number
3rd January 1980, irrespective of the date of
commencement of recording,
.Farms were coded numerically for
subsequent clarity after merging files.
Total Electricity Consumption .In kWh.
Bulk Milk Tank Electricity ... .In kWh.
Vacuum Pump Electricity . , . .In kWh.
Water Heater Electricity .. , . .In kWh.
Udder Washer Electricity .... .In kWh.
Lighting Electricity ....... .In kWh.
Ambient Temperature . . . . . .Mean temperature in °C for ,the week. or
month.
Herd size .... , ......... Total number of cows in herd .
Cows in milk . Number of cows being milked.
35
Milk Production . . . . . . . . . .Litres.
Gaps in the data were given the numerical value -9, this being a value
which never occurred naturally. An instruction was issued to ignore all
occurrences:ofthis value in the statistical analyses.
For each record, a record being a set of the above data items for a single
week, the following calculations were made:
• The milk production was converted to cubic metres.
• The sum of the electricity-using components was subtracted from the
total electricity to give .the unmetered electricity.
• The total electricity, bulk tank electricity, vacuum pump electricity,
lighting electricity and unmetered electricity were each divided by the
volume of milk to give the respective consumptions per unit volume_
of milk.
• The percentage fill of the bulk tank was calculated.
The mean and standard deviation was calculated for all the basic data
items, except week and farm numbers. The mean and standard deviation were
also calculated for each of the electricity consumptions per cubic metre of milk
produced.
Sample correlation coefficients were calculated for all combinations of
pairs.of the following:
• Total Electricity Consumption
36
• Bulk Tank Electricity Consumption
• Vacuum Pump Electricity Consumption
• Water Heater Electricity Consumption
• Udder Washer Electricity Consumption
• Lighting Electricity Consumption
• Unmetered Electricity Consumption
• Herd Size
• Number of Cows in-milk
• Milk Production Volume
• Ambient Temperature
Sample correlation coefficients were also calculated for all combinations
of pairs of the following:
• Total Electricity per cubic metre of milk
• Bulk Tank Electricity per cubic metre of milk
• Vacuum Pump Electricity per cubic metre of milk
• Udder Washer Electricity per cubic metre of milk
• Lighting Electricity per cubic metre of milk
37
• Unmetered Electricity per cubic metre of milk
• Milk Production volume
• Ambient Temperature
• Herd Size
• Number of Cows in-milk
Regression analysis was carried out on all combinations of data items
where the sample correlation coefficient suggested the relationship between
variables might be worth exploring further. With a simple linear regression
using a single predictor the regression equation was calculated, with the
standard deviations of the coefficients. The Coefficient of Determination (R2)
was also,calculated.
The following linear regressions were calculated:
• Bulk Tank Electricity on Milk Volume
• Bulk Tank Electricity on Ambient Temperature
• Bulk Tank Electricity on Percentage Fill of the tank
• Bulk Tank Electricity per cubic metre of milk on Milk Volume
• Bulk Tank Electricity per cubic metre of milk on Ambient Temperature
• Bulk Tank Electricity per cubic metre of milk on Percentage Fill
• Vacuum Pump Electricity on Number of Cows in-milk
38
• Vacuum Pump Electricity on Milk Produced
• Vacuum Pump Electricity on Ambient Temperature
• Vacuum Pump Electricity per cubic metre of milk on Milk Produced.
• Vacuum Pump Electricity per cubic metre of milk on Ambient
Temperature
• Vacuum Pump Electricity per cubic metre of milk on Number of Cows
in~ milk
• Total Electricity on Number of Cows in-milk
• J:otal Electricity on Milk Produced
• Total Electricity on Ambient Temperature
• Total' Electricity .per cubic metre of milk on Number of Cows in-milk
• Total Electricity per cubic metre of milk on Milk Produced
• Total Electricity per cubic metre of milk on Ambient Temperature
Multiple Regression analysis·was carried out on a number of combinations
of data items:
• Bulk Tank Electricity on Ambient Temperature and Volume of Milk
produced
• Bulk Tank Electricity per cubic metre ofmilk on AmbientTemperature
and Volume of Milk Produced
39
• Bulk Tank Electricity on Ambient Temperature, Volume of Milk
produced and Percentage fill
• Bulk Tank,Electricity per cubic metre of milkon Ambient Temperature,
Volume of Milk Produced and Percentage fill
• Vacuum Pump Electricity on Ambient Temperature and Number of
Cows in-milk
• Vacuum Pump Electricity per cubic metre of milk on Ambient
Temperature and Number of Cows in-milk
• Vacuum Pump Electricity onNumber of Cows in-milk and Volume of
Milk Produced
• Vacuum Pump Electricity per cubic metre of milk on Number of Cows
in-milk and Volume of Milk Produced
• Vacuum Pump Electricity on Ambient Temperature and Volume of
Milk produced
• Vacuum Pump Electricity per cubic metre of milk on Ambient
Temperature and Volume of Milk Produced
• Vacuum Pump Electricity on Ambient Temperature,Number of Cows
in-milkand Volume of Milk Produced
• Vacuum Pump Electricity per cubic metre of milk on Ambient
Temperature, Number ofCows in-milk and Volume of Milk Produced
40
o Total Electricity on Number .of Cows in-milk and Volume of Milk
produced
o Total Electricity per cubic metre of milk on Number of Cows in-milk
and Volume of Milk Produced
o Total :Electricity on Number of Cows in-milk and Ambient
Temperature
• Total1 Electricity per cubic metre of milk on Number of Cows in-milk
and Ambient Temperature
• Total Electricity on Ambient Temperature and Volume of Milk
produced
• Total Electricity per cubic metre of milk on Ambient Temperature and
Volume of Milk Produced
• Total Electricity on Ambient Temperature, Volume of Milk Produced
and Number of Cows in-milk
• Total Electricity per cubic metre of milk on Ambient Temperature,
Volume of Milk Produced and Number of Cowsin-milk
2.4· Results from the Audit.
2A, 1 The Total Electrical Energy Input.
vhe total electrical energy input is defined as all the electrical energy used
within the dairy and! parlour for the purposes of milking, cooling the milk,
cleaning the equipment and lighting the area. Excluded are such items as
41
additional water heaters for calf feeding and external lighting. Space heaters
within the parlour are included where present.
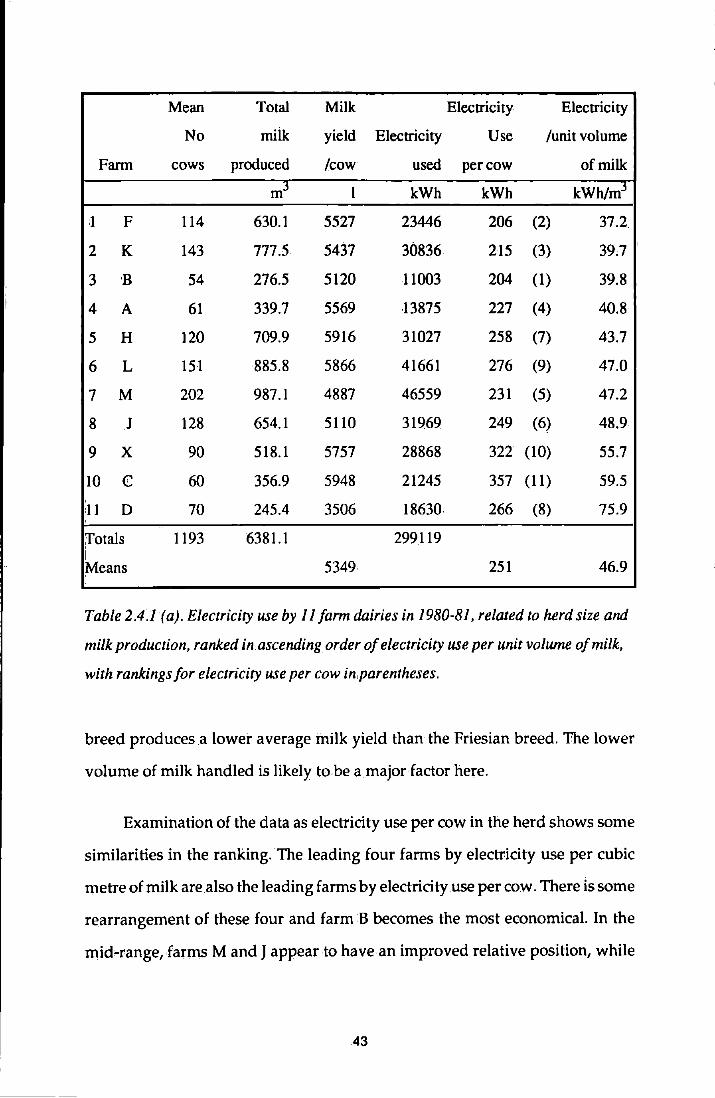
Table 2.4.1 (a) shows ,the total electricity use for 11 farms for a period of
exactly one year, March 1980 to March 1981. Farm G has been excluded because
the data are incomplete due to metering difficulties. Farm E has also been
excluded' because this farm underwent a major change of equipment during the
year. In particular there was a period of approximately three months during the
alteration work when the herd was milked through temporary accommodation
which was very difficult to meter accurately. The farms in the table have been
arranged in· ascending order of electricity use,per unit volume of milk produced.
Rankings by electricity use per cow are given in parentheses in the penultimate
column.
The average electricity use was 46.9 kWh per m3 of milk, butthere was a
range wherein the heaviest user, farm D, used slightly more than twice the
electricity per unit volume of milk than the most economical, Farm 1F. The two
most economical farms, F and K, both have heat recovery units installed to
recapture heatJrom the bulk milk tank for pre-heating water. However these
farms were only slightly more economical than Farms A and B, which are small
family farms where the owner does the milking. Farms H, J,;L and M are all fairly
close to the mean. These are all farms where an employed herdsman is
responsible for milking and operating the equipment. Farms X and C were both
some 20% or more worse than the mean. Farm X is the Seale-Hayne College farm
and Farm C uses the A.B.W. method·of plant cleaning, which may have been a
contributory factor to the·high cost. Farm D appears to have a particularly high
electricity usage per unit volume of milk. This farm has a Jersey herd and this
42
Mean Total Milk Electricity Electricity
No milk yield Electricity Use /unit volume
Fann cows produced /cow used per cow of milk
mj I kWh kWh kWh/m3
I F 114 630.1 5527 23446 206 (2) 37.2
2 K 143 777.5 5437 30836 215 (3) 39.7
3 B 54 276.5 5120 11003 204 (1) 39.8
4 A 61 339.7 5569 13875 227 (4) 40.8
5 H 120 709.9 5916 31027 258 (7) 43.7
6 L 151 885.8 5866 41661 276 (9) 47.0
7 M 202 987.1 4887 46559 231 (5) 47.2
8 J 128 654.1 5110 31969 249 (6) 48.9
9 X 90 518.1 5757 28868 322 (10) 55.7
10 c 60 356.9 5948 21245 357 (ll) 59.5
:11 D 70 245.4 3506 18630 266 (8) 75.9
Totals 1193 6381.1 299119 i Means 5349 251 46.9
Table 2.4.1 (a). Electricity use by 11 farm dairies in 1980-81, related to herd size and
milk production, ranked in ascending order of electricity use per unit volume of milk,
with rankings for electricity useper cow in,parentheses.
breed produces a lower average milk yield than the Friesian breed. The lower
volume of milk handled is likely to be a major factor here.
Examination of the data as electricity use per cow in the herd shows some
similarities in the ranking. The leading four farms by electricity use per cubic
metre of milk are also the leading farms by electricity.use per cow. There is some
rearrangement of these four and farm B becomes the most economical. In the
mid~range, farms M and J appear to have an improved relative position, while
43
'
Farm Mean Total Av milk Electricity Electricity
No milk yield Electricity use per /unit volume
cows produced /cow used cow of milk
m3 I kWh kWh kWh/m3
I F 110 572.3 5202 23133 210 (2) 40:4
2 B 54 275.7 5106 11522 214 (3) 4'1.9
3 A 67 310:8 4639 13288 200 (1) 42.8
4 H 129 750.2 5815 32100 249 (6) 42.8
5 K 183 1007.2 5503 47205 258 (7) 46.9
6 c 75 410;8 5477 20037 267 (9) 48.8
7 J 116 497.4 4288 26173 226 (5) 52.6
8 M 123 460.9 3747 27323 222 (4) 59.3
9 D 70 235.7 3367 18596 266 (8) 78.9
Totals 927 452LO 219377
Means 4877 237 48.5
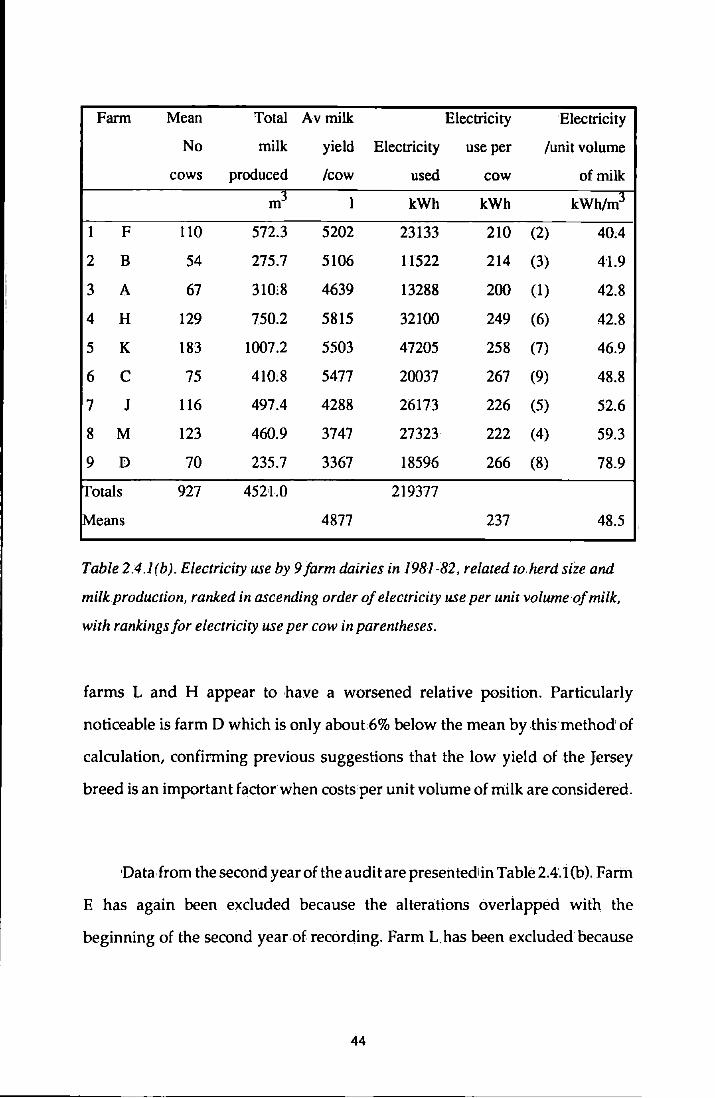
Table 2 .4.1 (b). Electricity use by 9 farm dairies in 1981-82, related to herd size and
milkproduction, ranked in ascending order of electricity use per unit volume·of milk,
withrankings for electricity use per cow in parentheses.
farms L and H appear to have a worsened relative position. Particularly
noticeable is farm D which is only about 6% below the mean by ~this method of
calculation, confirming previous suggestions that the low yield of the Jersey
breed is an important factor when costs per unit volume of milk are considered.
nata.from the second year of the audit are presehtediin Table 2.4.1 (b). Fartn
E has again been excluded because the alterations overlapped with the
beginning of the second year of recording. Farm L.has been excluded because
44
the farm ceased milk production during the course of the year and Farm X has
also been excluded due to incomplete data. The similarities in the rankings and
data are clear. On average the farms were slightly more expensive in terms of
electricity ll.sed.per unit volume of milk and a little more economical in terms of
electricity used per cow. Particularly significant is the fall in average milk yield
per cow from the first year to the second. Only farm K increased the average
yield and in some cases there were falls of several hundred litres per cow.
Following this it could have been expected that the average electricity cost per
unit volume of milk would have increased rather more than 1.6 kWh/m3 and
the exclusion of farms X andL has almost certainly been responsible for the small
size of this increase. Only farms C and H increased their efficiency of use of
electricity during the period. Farm C altered the cleaning practice to provide a
more economical cleaning routine and this reduced the amount of electricity
used while the herd was expanded by 25%. Farm H achieved a marginal
improvement by increasing the total milk production with a relatively small
increase in electricity use. Farm K showed a deterioration in performance. ·On
this farm there was a large increase in herd size and a correspondingincrease
in the size of the equipment. The result was an increase in electricity use of over
50% with an increase in milk production of less than 30%.
At the more economical farms, there was a remarkable consistency of
performance between the first and second years. Farm Aincreased the herd by
approximately 10% reducing the cost per cow by a similar proportion. At this
farm a dramatic fall in milk yield was accompanied by an increase in cost per
unit volume of milk. Farms F and B produced data which were very similar to
the first year's.
45
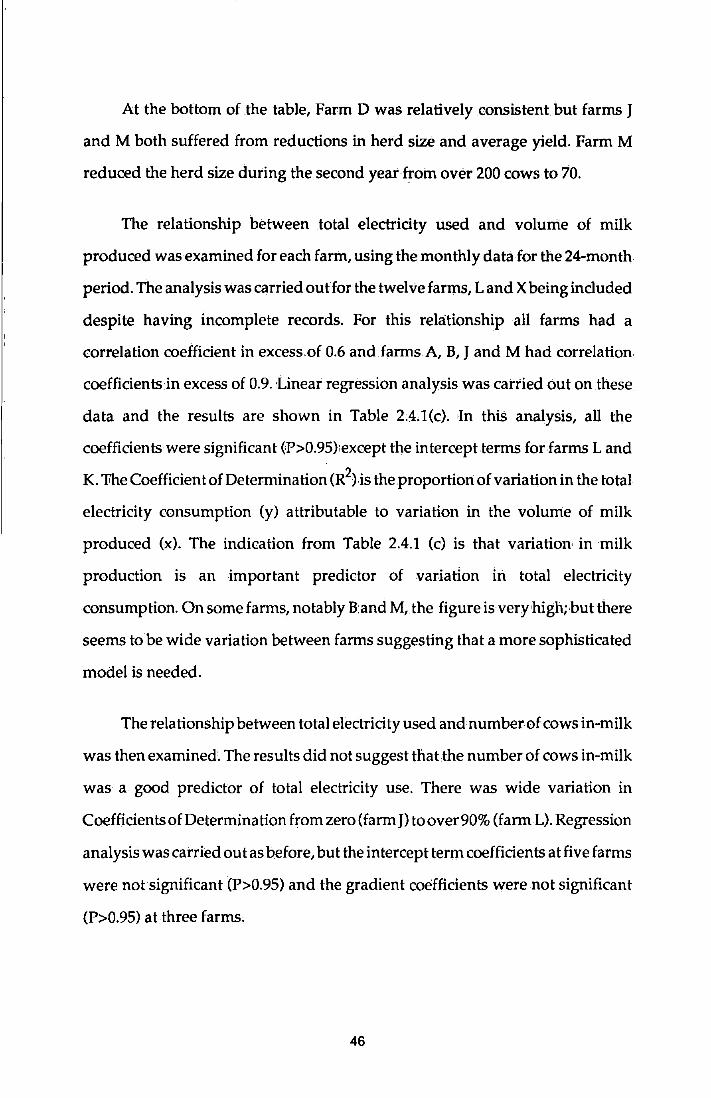
At the bottom of the table, Farm D was relatively consistent but farms J
and M both suffered from reductions in herd size and average yield. Farm M
reduced the herd size during the second year froin over 200 cows to 70.
The relationship between total electricity used and voluine of milk
produced was examined for each farm, using the monthly data for the 24-month
period. The analysis was carried outfor the twelve farms, Land X being included
despite having incomplete records. For this relationship all farms had a
correlation coefficient in excess of 0.6 andfarms.A, B, J and M had correlation
coefficients in excess of 0.9. Linear regression analysis was carried out on these
data and the results are shown in Table 2.4.1(c), >In this analysis, all the
coefficients were significant(P>0.95)>except the intercept terms forfarms Land
K. 'The Coefficient of Determination (R2).is the .proportion of variation in the total
electricity consumption (y) attributable to variation in the volume of milk
produced (x). The indication from Table 2.4.1 (c) is that variation in milk
production is an important predictor of variation in total electricity
consumption. On some farms, notably Band M, the figure is veryhigh;·but there
seems to be wide variation between farms suggesting that a more sophisticated
model is needed.
The relationship between total electricity used and number of cows in-milk
was then examined. The results did not suggest that.the number of cows in-milk
was a good predictor of total electricity use. There was wide variation in
Coefficients of Determinationfrom zero (farm J) to over 90% (farm L). Regression
analysis was carried out asbefore, but the intercept term coefficients at five farms
were not significant (P>0.95) and the gradient coefficients were not significant
(P>0.95) atthree farms.
46
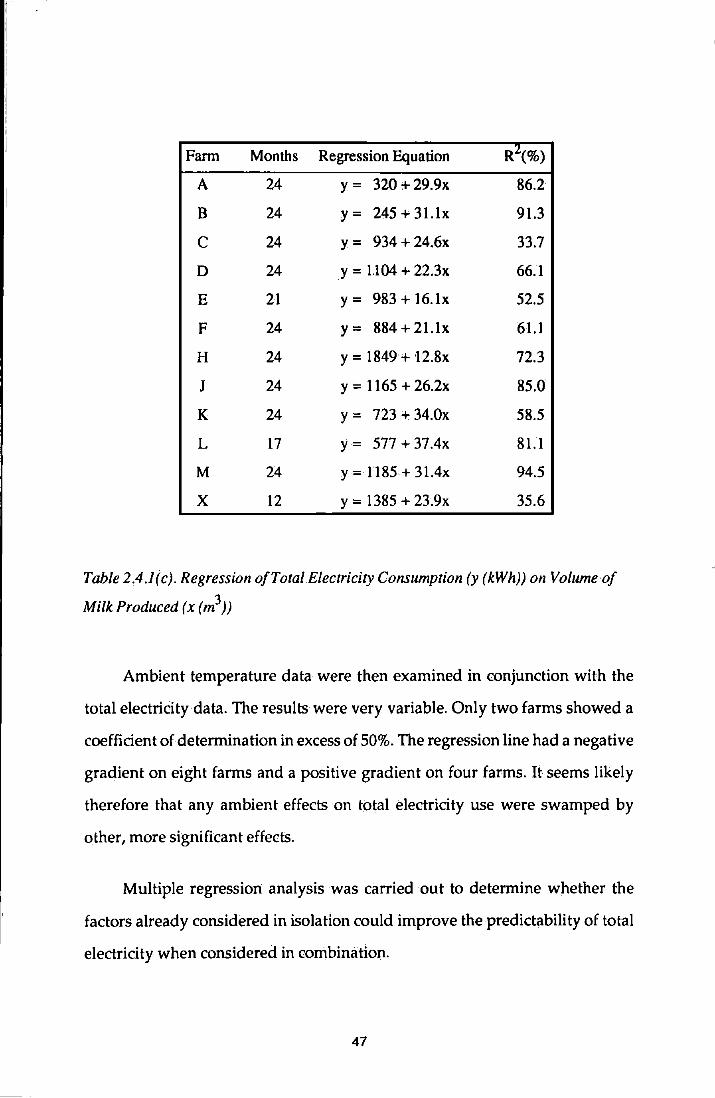
Farm Months Regression Equation Rz(%)
A 24 y= 320 + 29.9x 86.2
B 24 y= 245 + 3l.lx 91.3
c 24 y= 934 + 24.6x 33.7
D 24 y = 1104 + 22.3x 66.1
E 21 y= 983+16.1x 52.5
F 24 y= 884 + 2l.lx 61.1
H 24 y = 1849 + I2.8x 72.3
J 24 y = 1165 + 26.2x 85.0
K 24 y= 723 + 34.0x 58.5
L 17 y= 577 + 37.4x 81.1
M 24 y = 1185 + 31.4x 94.5
X 12 y = 1385 + 23~9x 35.6
Table 2.4.l(c). Regression ofTotal Electricity Consumption (y (kW h)) on Volume of
Milk Produced (x (m3))
Ambient temperature data were then examined in conjunction with the
total electricity data. The results were very variable. Only two farms showed a
coefficient of determination in excess of 50%. The regression line had a negative
gradient on eight farms and a positive gradient on four farms. It seems likely
therefore that any ambient effects on total electricity use were swamped by
other,more significant effects.
Multiple regression analysis was carried out to determine whether the
factors already considered in isolation could improve the predictability of total
electricity when considered in combination.
47
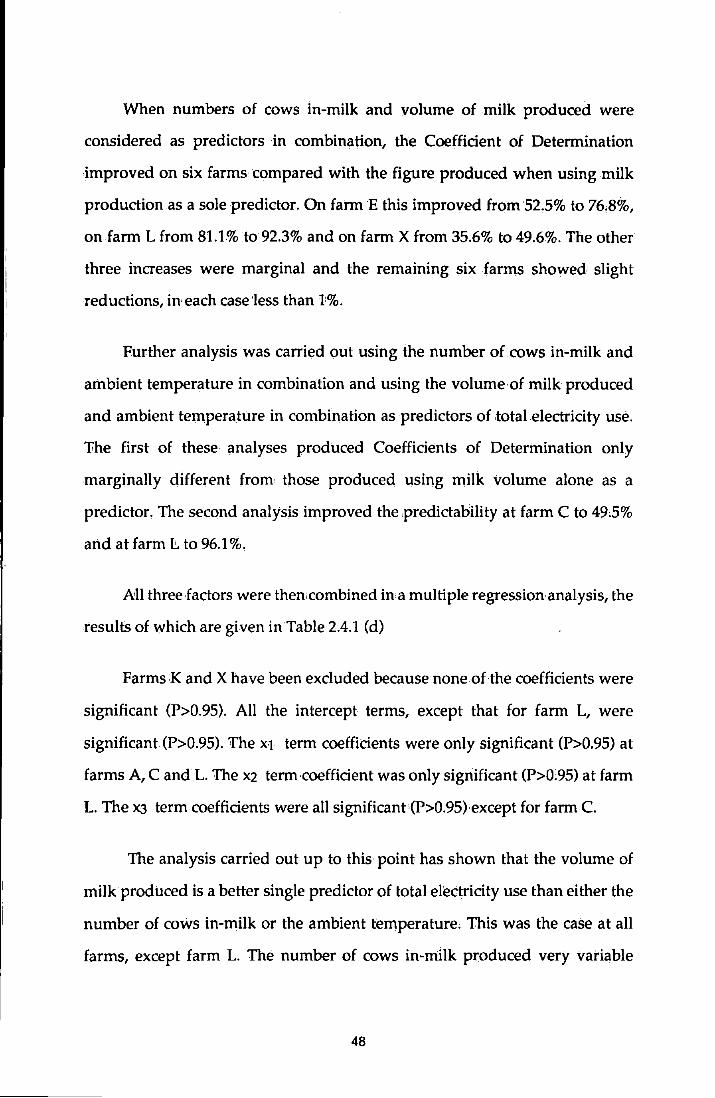
When numbers of cows in-milk and volume of milk produced were
considered as predictors in combination, the Coefficient of Determination
improved on six farms compared with the figure produced when using milk
production as a sole predictor. On farm E this improved from '52.5% to 76.8%,
on farm L from 81.1% to 92.3% and on farm X from 35.6% to 49.6%. The other
three increases were marginal and the remaining six farms showed slight
reductions, in each case·less than 11%.
Further analysis was carried out using the number ofcows in-milk and
ambient temperature in combination and using the volume of milk produced
and ambient temperature in combination as predictors of .total electricity use.
'The first of these analyses produced Coefficients of Determination only
marginally different from those produced using milk volume alone as a
predictor. The second analysis improved the predictability at farm C to 49.5%
and at farm t to 96.1 %.
~11 three factors were thencombined ina multiple regression analysis, the
results of which are given inTable 2.4.1 (d)
Farms K and X have been excluded because none ofthe coefficients were
significant (P>0.95). All the intercept terms, except that for farm L, were
significant (P>0.95). The X'l term coefficients were only significant (P>0.95) at
farms A, C and L. The x2 term ·coefficient was only significant (P>0:95) at farm
L. The X3 term coefficients were all significant{P>0.95)·except for farm C.
The analysis carried out up to this point has shown that the volume of
milk produced is a better single predictor of total electricity use than either the
number of cows in-milk or the ambient temperature. This was the case at all
farms, except farm L. The number of cows in-milk produced very variable
48
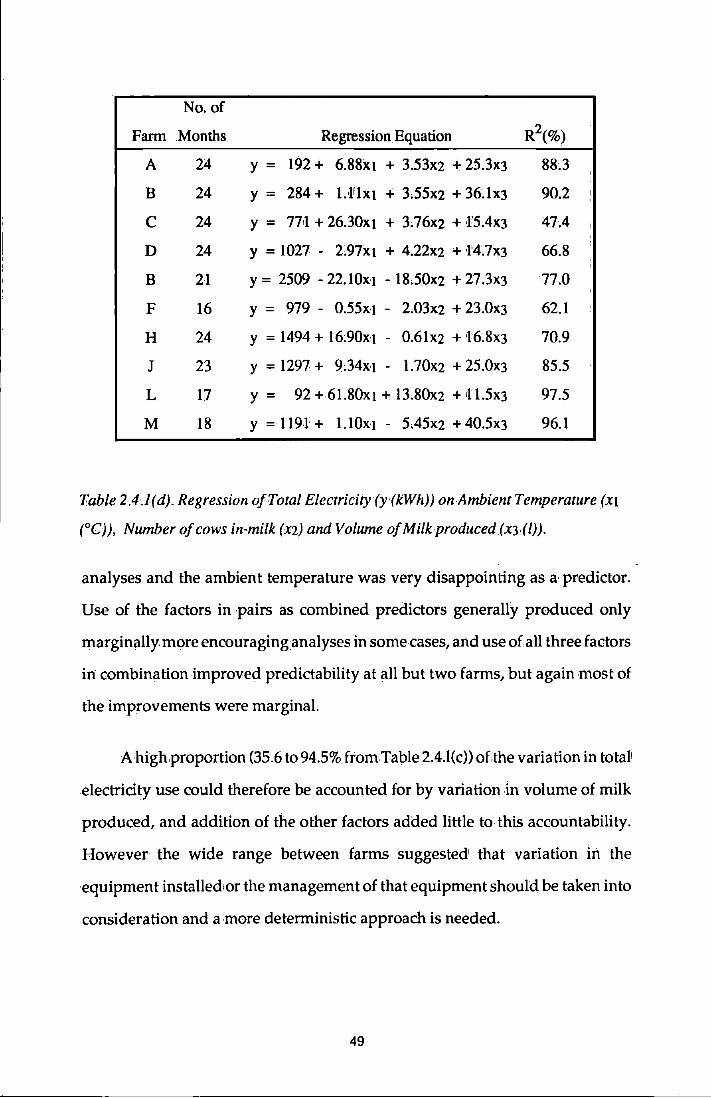
No. of
Fann Months Regression Equation R2(%)
A 24 y = 192+ 6.88x1 + 3.53x2 + 25.3x3 88.3
B 24 y = 284+ Ullxt + 3.55x2 + 36.1x3 90.2
c 24 y = 77<1 + 26.30xt + 3a6x2 + 1-'5.4x3 47.4
D 24 y = 1027 - 2,97xt + 4.22x2 + N'.7x3 66.8
B 21 y = 2509 - 22.10Xl - 18.50X2 +27.3X3 77.0
F 16 y = 979 - 0.55Xl - 2,03x2 + 23.0x3 62.1
H 24 y = 1494 + 16:90xt - 0.6lx2 + •t6.8x3 70.9
J 23 y = 1297 + 9~34xi - 1.70x2 + 25.0x3 85.5
L 17 y = 92 + 61.80xi + 13.80x2 + n.5x3 97.5
M 18 y = 1191' + 1.10Xl - 5.45X2 + 40.5X3 96.1
Table 2.4.1(d). Regression ofTotal Electricity (y(kWh)) on Ambient Temperature (XI
(°C)), Nwnber of cows in,milk (X2) and Volume of Milkproduced(X3·(/)).
analyses and the ambient temperature was very disappointing as a· predictor.
Use of the factors in pairs as combined predictors generally produced only
marginally more encouraginganalyses in some cases, and use of all three factors
in combination improved predictability at all but two farms, but again most of
the improvements were marginal.
Ahigh.proportion (35.6 to 94.5% fromTable 2.4.l(c)) of;the variation in total1
electricity use could therefore be accounted for by variation in volume of milk
produced, and addition of the other factors added little to this accountability.
However the wide range between farms suggested' that variation in the
equipment installed, or the management of that equipment should be taken into
consideration and a more deterministic approach is needed.
49
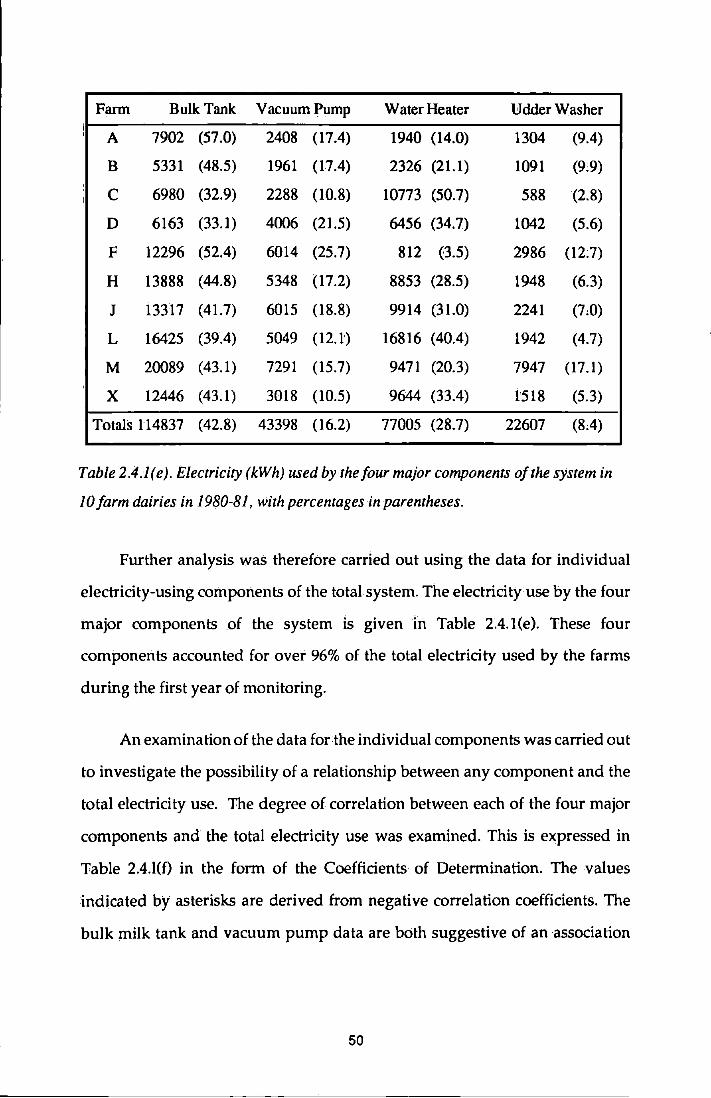
Farm Bulk Tank Vacuum Pump Water Heater Hdder Washer I I A 7902 (57.0) 2408 (17.4) 1940 (14,0) 1304 (9.4)
B 5331 (48.5) 1961 (17.4) 2326 (21.1) 1091 (9:9)
I c 6980 (32.9) 2288 (10.8) 10773 (50.7) 588 (2.8)
D 6163 (33.1) 4006 (21.5) 6456 (34.7) 1042 (5.6)
F 12296 (52.4) 6014 (25.7) 812 (3.5) 2986 (12:7)
H 13888 (44.8) 5348 (17.2) 8853 (28.5) 1948 (6.3)
J 13317 (41.7) 6015 (18.8) 9914 (31.0) 2241 (7:0)
L 16425 (39.4) 5049 (12.1) 16816 (40.4) 1942 (4.7)
M 20089 (43.1) 7291 (15.7) 9471 (20.3) 7947 (17.1)
X 12446 (43.1) 3018 (10;5) 9644 (33.4) 1'518 (5.3)
Totals 114837 (42.8) 43398 (16.2) 77005 (28.7) 22607 (8.4)
Table 2.4.1(e). Electricity (kWh) used by the four major components of the system in
10 farm dairies in 1980-81, with percentages in parentheses.
Further analysis was therefore carried out using the data for individual
electricity-using components of the total system. The electricity use by the four
major components of the system is given in Table 2.4.1(e). These four
components accounted for over 96% of the total electricity used by the farms
during the first year of monitoring.
An examination of the data forthe individual components was carried out
to investigate the possibility of a relationship between any component and the
total electricity use. 'The degree of correlation between each of the four major
components and the total electricity use was examined. This is expressed in
Table 2.4.l(f) in the form of the Coefficients of Determination. The values
indicated by asterisks are derived from negative correlation coefficients. The
bulk milk tank and vacuum pump data are both suggestive of an association
50
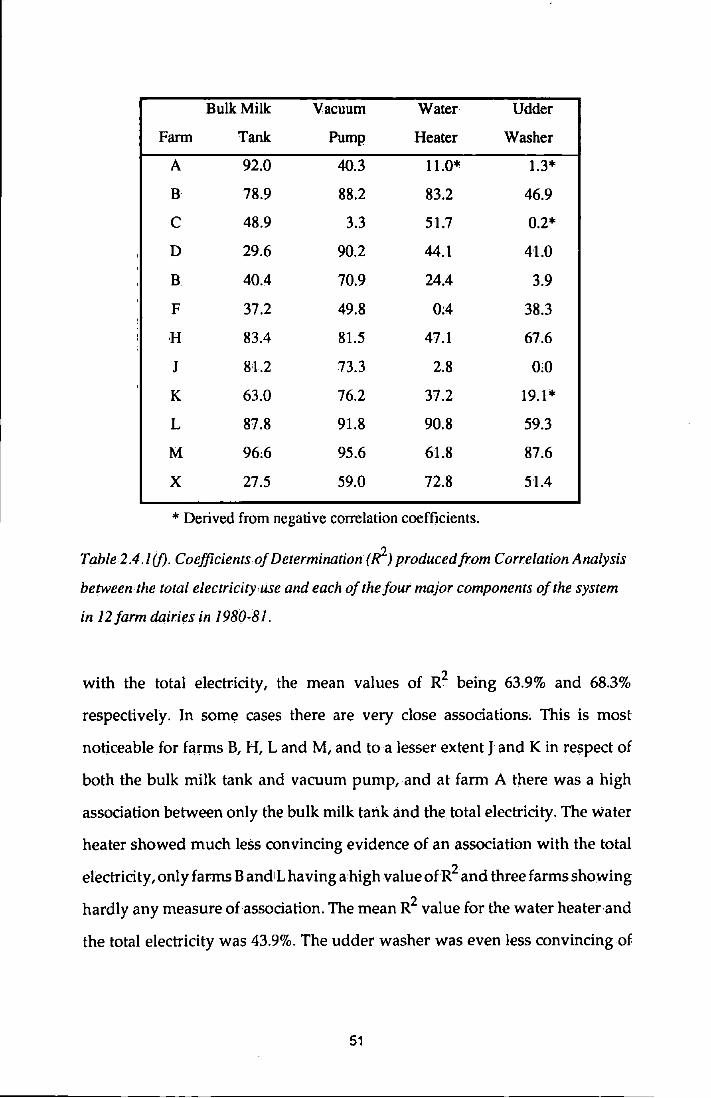
Bulk Milk Vacuum Water Udder
Farm Tank Pump Heater Washer
A 92.0 40.3 11.0* 1.3*
B 78.9 88.2 83.2 46.9
c 48.9 3.3 51.7 0.2*
D 29.6 90.2 44.1 4·1.0
B 40.4 70.9 24.4 3.9
F 37.2 49.8 0;4 38.3
H 83.4 81.5 47.1 67.6
J 8il.2 73.3 2.8 O;O
K 63.0 76.2 37.2 19.1 *
L 87;8 91.8 90.8 59.3
M 96:6 95.6 61.8 87:6
X 27.5 59.0 72.8 51.4
* Derived.from negative correlation coefficients.
Table 2.4 .I (f); Coefficients of Determination ( fil) produced from Correlation Analysis
between· the total electricity<use and each of the four major components of the system
in 12 farm dairies in 1980-81.
with the total electricity, the mean values of R2 being 63.9% and 68.3%
respectively. In some cases there are very close associations, This is most
noticeable for farms B, H, L and M, and to a lesser extent J and K in respect of
both the bulk milk tank and vacuum pump, and at farm A there was a high
association between only the bulk milk tank and the total electricity, The water
heater showed much less convincing evidence of an association with the total
electricity, only farms B andiL having a'high value ofR2 and three farms showing
hardly any measure ofassociation. The mean R2 value .for the water heater and
the total electricity was 43.9%. The udder washer was even less convincing .of
51
an association. The mean R2 was 34.7% and only farm M seemed to have
evidence of an association.
The results of the analysis at this stage demonstrate the importance of the
bulk milk tank as.themajor component of the system in terms ofelectricity use.
The bulk tank used approximately43% of all the electricity used on all the farms.
Furthermore it has been shown that almost two-thirds of the variation in total
electricity use may be associated with variation in the bulk tank electricity use.
The water heater was the second highest consumer of electricity (approx 29% of
the total) but the association between its electricity consumption and the total
is much less clear. A better association was seen between the vacuum pump
electricity use and thetotal,.but the vacuum pump accounted for only about 16%
.of all the electricity used.
It must be noted atthis pointthat indications of statistical association do
not themselves provide proof ofcausality;this would normally be sought from
other evidence. However, the total electricity use can clearly be described by an
additive model in respect ofthe components of the system, Given that this is so,
it seems reasonable to conclude that a better understanding of the causes of
variation in the components of the system will contribute to a more accurate
method of estimating the total! electricity consumption for a specific set of
circumstances.
Further analysis was therefore carried' out on each of the components of
the system,
52
2.4.2 The Bulk Milk Tank.
Electricity is used by the bulk milk tank for the running of the compressor,
the condenser fan, the milkagitator and either the chilled water spray pump for
sump and spray tanks or the air pump for jacketed tanks. Of these constituents;
the compressor motor invariably uses ;the most electricity
The audit data have already revealed that the bulk milk tank is generally
the heaviest single user of electricity within the farm dairy (Table 2.4.l(e)). Table
2.4.2(a) ranks the farms in order of mean cooling cost per unit volume of milk.
Only at farms C, D and L was the bulk tank not the highest single user of
electricity, and at these three farms the water heater was the heaviest user.
However, the margin was slight (less than two percentage points) at farms D
and L.
Percentages of the tOtal may be slightly misleading as the total electricity
use may fluctuate widely for reasons not connected with the bulk tank. In
general, though, the bulk milk tank seems to account for 40% ormore of the total
electricity used.
The bulk tank also shows the most noticeable seasonal variation in
electricity use. Figures 2.4.2(a) to 2.4.2(1) show the weekly electricity use by the
bulk tank during the first year of the audit for each of the farms. There are some
similarities. All the farms showeg a rise in the bulk tank electricity use in the
first few weeks after commencement of the audit in week 13. This rise was
followed by a peak occurring generally before week 23. There was then a decline
53
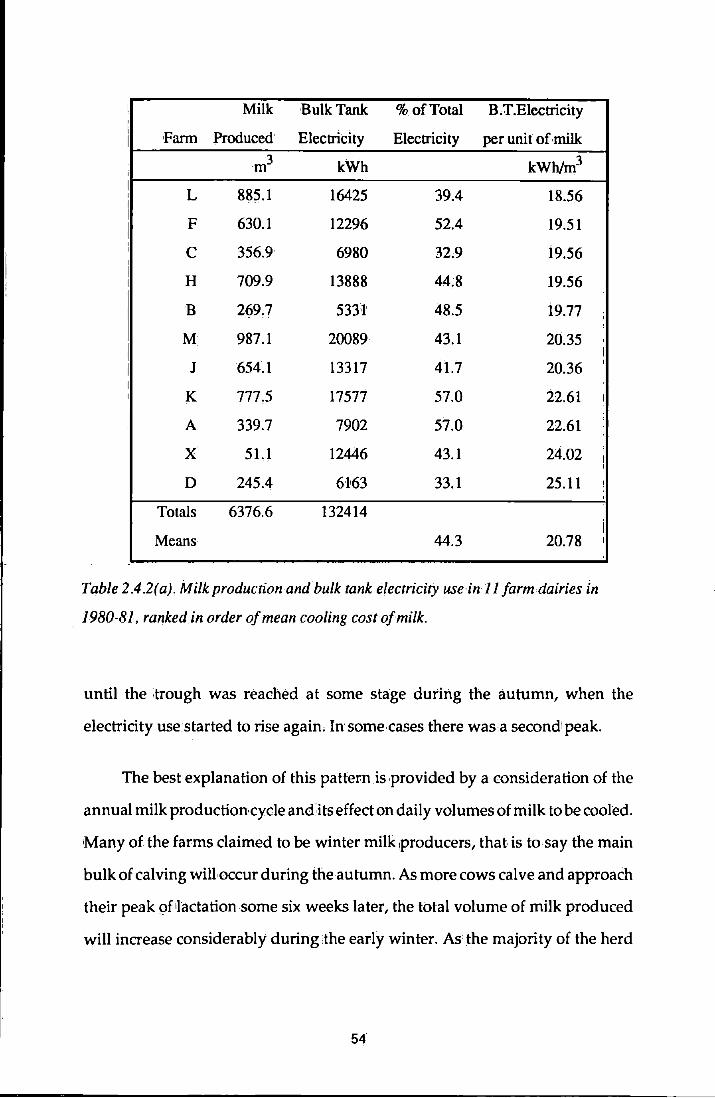
I Milk Bulk Tank %of Total B.T.Electricity I
'Fann Produced Electricity Electricity per unit of milk I
' m3 kWh kWh/m3
L 885.1 16425 39.4 18.56
F 630.1 12296 52.4 19.51
' ' c 356.9 6980 32.9 19.56 I
I H 709.9 13888 44.8 19.56 I
B 269.7 5331 48.5 i9.77
M 987.1 20089 43.1 20.35
J 654.1 13317 4L7 20.36 I I K 777.5 17577 57.0 22.61
A 339.7 7902 57.0 22.61
X 51.1 12446 43.1 24.02
D 245.4 6163 33.1 25.11
Totals 6376.6 132414
Means 44.3 20.78
-
Table 2 .42( a). Milk production and bulk tank electricity usf'in 11 farm dairies in
. 1980-81, ranked in order of mean cooling costofmilk.
'
i I
I
' I
I I
!
'
i I
I
until the ~trough was reached at some stage during the autumn, when the
electricity use started to rise again, In some cases there was a secondl peak.
The best explanation of this pattern is provided by a consideration of the
annual milk production cycle and:its effect on daily volumes of milk to be cooled.
Many of the farms claimed to be winter milk producers, that is to say the main
bulk of calving will occur during the autumn. As more cows calve and approach
their peak ofilactation some six weeks later, the total volume of milk produced
will increase considerably during the early winter. As the majority of the herd
54
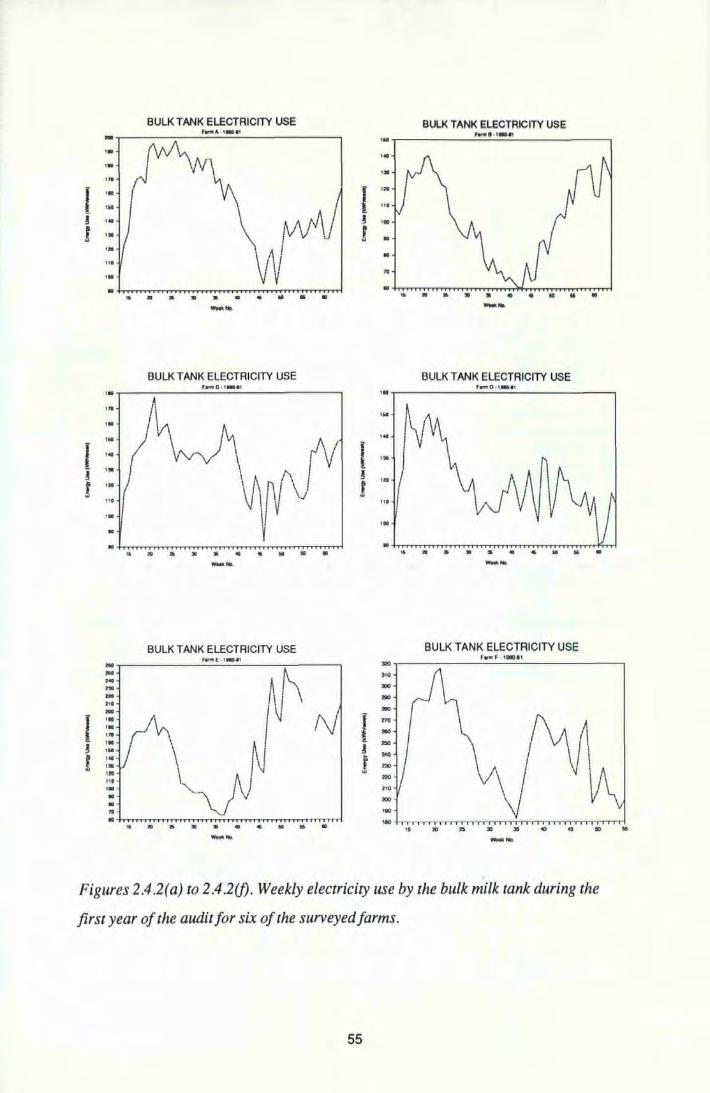
,. •• '"'
l 100
, .. ~ ... J .•
Ill
100
100
'"' •• , ..
I ... ~
,,.
l , .. Ill
00
.. ... , .. ... ... Ill
"" I •• ,.
"" •• ~ , .. ! 141
•• , .. I ll , . • • "' •
BULK TANK ELECTRICITY USE
~ • • • • • 4 y & • _ ...
BULK TANK ELECTRICITY USE FMIIC · t-•1
~I' \ f', I , r V 'v\1~
~ .. ,. ,.
" ,. • .. .. .. • _..._
BULK TANK ELECTRICITY USE F.m.E-1-.et
Aj\ I f\
J
" .. .. ,. ,. ., .. .. .. .. _..._
BULK TANK ELECTRICITY USE ... ,.------'·=-.::..:.··=' .... :..:.:'------, . 1:10
f ... 1 "' i ,. J .. ..
,.
1111
"' . .. I i ... l
Ill
... ..
... • •• ... ... ..
l "" ""' ...
~ too
J ... ... ... ""' ... ...
~ B a W S • 4 M K • -....
BULK TANK ELECTRICITY USE F..,.,o .,._.,
W\~ .. • .. ,.
" • .. .. .. .. _ ...
BULK TANK ELECTRICITY USE Fwa f- 1111041
r A
.. "' .. "' ,. ... .. ,., _ ....
Figures 2.4.2(a) to 2.4.2(f). Weekly electricity use by the bulk milk tank during the
first year of the audit for six of the surveyed farms.
55
..
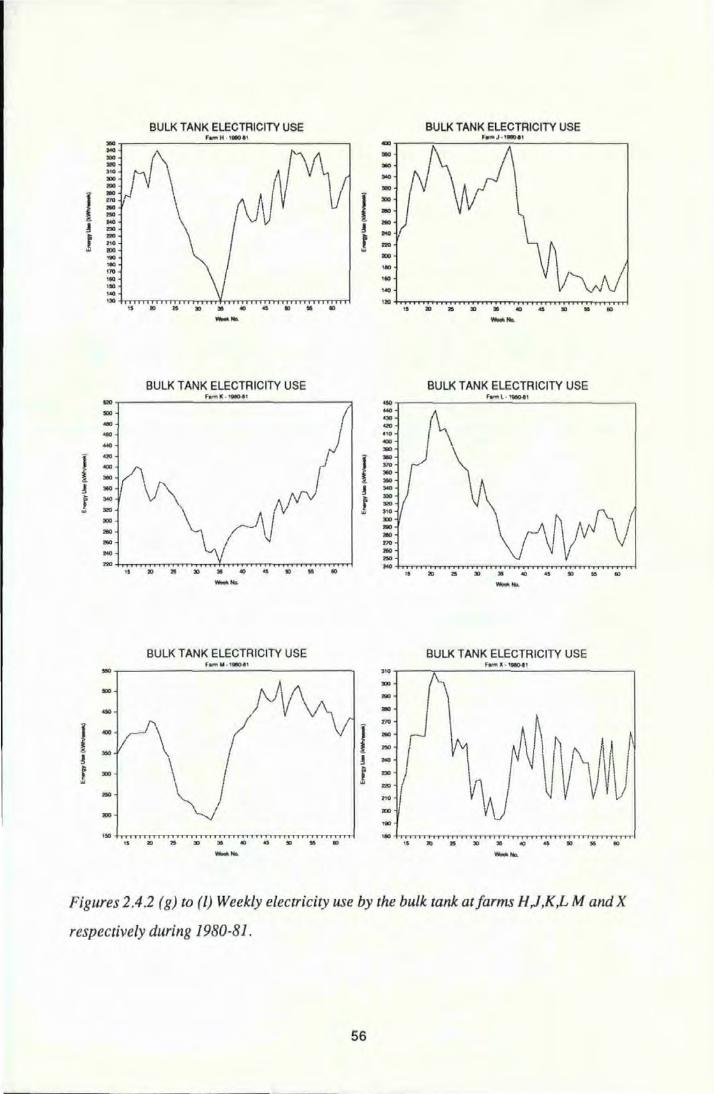
BULK TANK ELECTRICITY USE BULK TANK ELECTRICITY USE F.,_ H.,_,.., F.,_J . ,_,., ... ... - .., ... ... .., ...
""' -... ... l
.. l .,., ""' .. .. ... ... ...
! Z!O ! ... !
..., f ...
""' ""' ... ""' 100 , .. "" , .. , .. , ..
"" "" ,,. ,,. ,. ID .. "' • Cl .. ., .. ., ,. ID .. .. .. Cl .. .. .. ID _ .... -....
BULK TANK ELECTRICITY USE BULK TANK ELECTRICITY USE
BULK TANK ELECTRICITY USE BULK TANK ELECTRICITY USE FW"!U ·1_, .. , FMtt X · 'tiiG-a1 ... .. . ... .,. ... ... ..
I I .,., ... ... ... ... ...
! ! ... ! ""' r ... .. ..., ... .,.
""' ""' ... , .. ,., ,. ID .. 30 .. .. .. ., .. ., ,. ID .. 30 .. Cl .. .. .. ., _ .... -....
Figures 2.42 (g) to (l) Weekly electricity use by the bulk rank at farms H,J,K,L M and X
respectively during 1980-81 .
56
pass their peak as winter progresses, the onset of grass growth in the spring will
provide something of a boost in the declining lactation curve, helping to produce
greater volumes of milk in late spring or early summer (weeks 15 to 25).
Reduction in grass quality as the summer progresses, together with the
deliberate drying off of cows prior to calving, will combine to produce the lowest
milk volumes in the early autumn before the main calving season restarts.
This explanation is satisfactory in explaining the pattern for most of the
farms; Farm A aims for a flatter production pattern by spreading calving all
round the year and this is shown by a broader peak extending throughout the
summer weeks with a trough in mid-winter. Farm X has two main seasons of
calving in the spring and autumn and this has also produced a flatter pattern.
Farm C aims for more summer milk production by concentrating calving in early
spring. The expansion in herd size at farm K towards the end of the year is clearly
seen in the 'bulk tank electricity use.
The conclusion to be drawn at this stage is that the volume of milk to be
cooled has a majorinfluence on the bulk tank electricity use. Regression analysis
was therefore carried out to examine the relationship between electricity use·by
the bulk tank and the volume of milk. Table 2.4.2(b) shows the regression
equations and the Coefficients of Determination from this analysis, for twelve
farms,
Farm X is the only farm where the coefficient ofthe gradient term is not
significant(P>0.95). The R2 value of 16.1% at this farm suggests that this equation
would not be very reliable as a means of predicting the bulk tank electricity use.
Anexplanationmay·be provided by the pattern of use of the cooling facility. At
farm X there are two bulk milk tanks, each of 1365,litres capacity. Bulk milk tanks
57
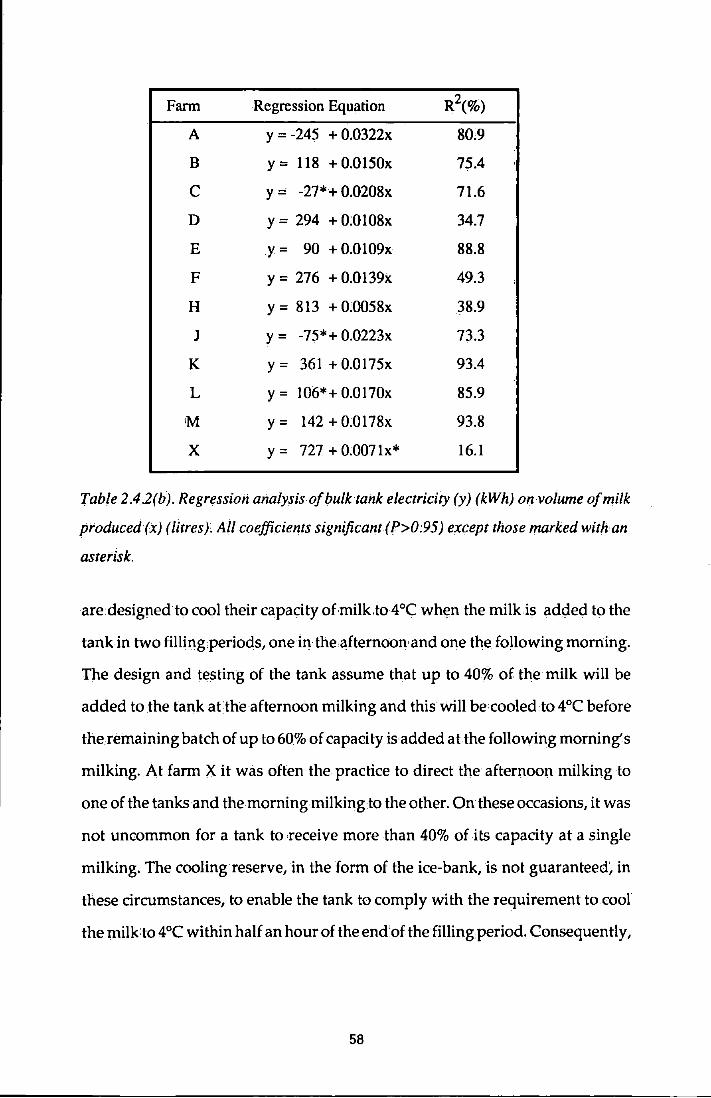
Farm Regression Equation R2(%)
A y = -245 + 0.0322x 80.9
B y = 118 + 0.0150x 75.4
c y= -27*+ 0:0208x 71.6
D y = 294 + 0:0 108x 34.7
E y= 90 + 0.0109x 88.8
F y = 276 + 0.0139x 49.3
H y = 813 + 0:0058x 38.9
J y= -75*+ 0.0223x 73.3
K y= 361 + 0:0175x 93.4
L y= 106*+ o,0170x 85.9
IM y= 142 + 0:0178x 93.8
X y= 727 + 0.0071x* 16.1
Table 2.42(b). Regression analysis of bulk tank electricity (y) (kWh) on volume of milk
produced (x) (litres). All coefficients significant( P>0:95) except those marked with an
asterisk.
are designed to cool their capacity of milk. to 4°C whtm the milk is added to the
tank in twofilling periods, one in the·afternoon and one the following morning.
The design and testing of the tank assume that up to 40% of the milk will be
added to the tank atthe afternoon milking and this will be cooled to 4°C before
the remaining batch of up to 60% of capacity is added atthe following morning's
milking. At farm X it was often the practice to direct the afternoon milking to
one of the tanks and themorningmilkingto the other. Onthese occasions, it was
not uncommon for a tank to receive more than 40% of its capacity at a single
milking. The cooling reserve, in the form of the ice-bank, is not guaranteed~ in
these circumstances, to enable the tank to comply with the requirement to cool
the milk to 4°C within half an hour of the end' of the filling period. Consequently,
58
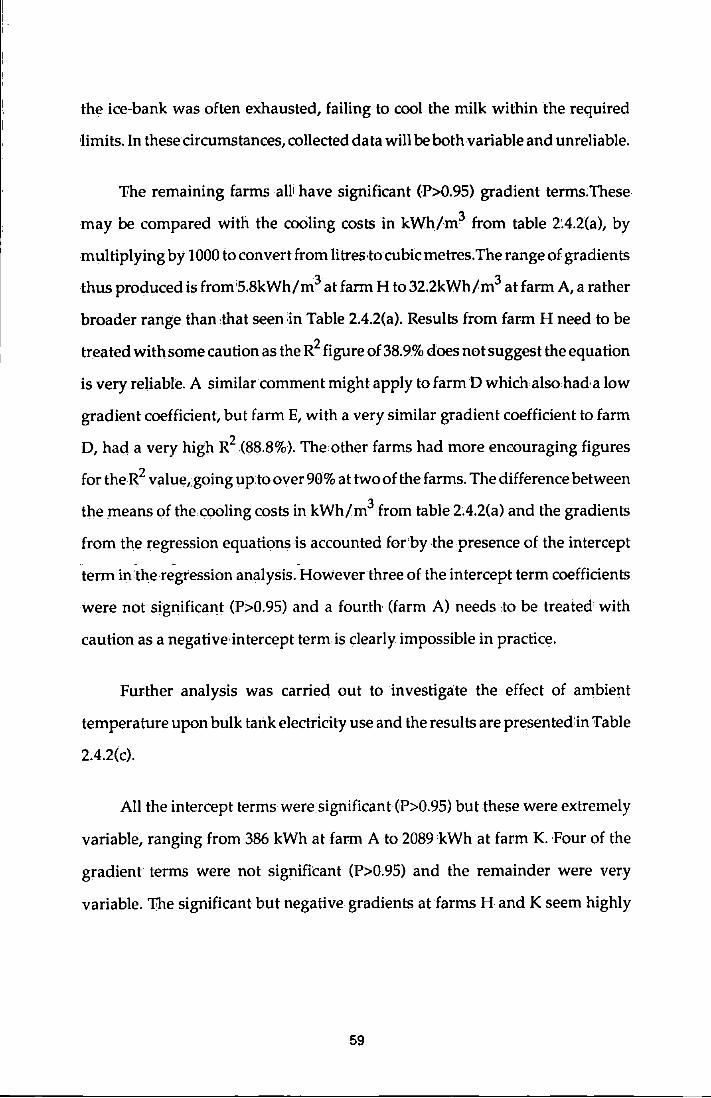
I I i
the icecbank was often exhausted, failing to cool the milk within the required
Hmits. In these circumstances, collected data will be both variable and unreliable.
'Fhe remaining farms alii have significant (P>0.95) gradient terms:These
may be compared with the cooling costs in kWh/m3 from table 2:4.2(a), by
multiplying by 1000 to convert from litres•to cubic metres.The range of gradients
thus produced is from5.8kWh/m3at farm H to 32.2kWh/m3 at farm A, a rather
broader range than ·that seen ·in Table 2.4.2(a). Results from farm H need to be
treated with some caution as the R2 figure of 38.9% does not suggest the equation
is very reliable. A similar comment might apply to farm D which also had; a low
gradient coefficient, but farm E, with a very similar gradient coefficient to farm
D, had a very high R2 .(88.8%). The other farms had more encouraging figures
for theR2 value, going upto over 90% at two of the farms. The difference between
the means of the:cooling costs in kWh/m3 from table 2;4.2(a) and the gradients
from the regression equations is accounted for'by the presence of the intercept - -
term in the regression analysis. Howeverthree of the intercept term coefficients
were not significant (P>0.95) and a fourth (farm A) needs to be treated with
caution as a negative intercept term is clearly impossible in practice.
Further analysis was carried out to investigate the effect of ambient
temperature upon bulk tank electricity use and the results are presented in Table
2.4.2(c).
All the intercept terms were significant W>0.95) but these were extremely
variable, ranging from 386 kWh at .farm A to 2089 kWh at farm K. Four of the
gradient terms were not significant (P>0:95) and the remainder were very
variable, The significant but negative gradients at farms H and K seem highly
59
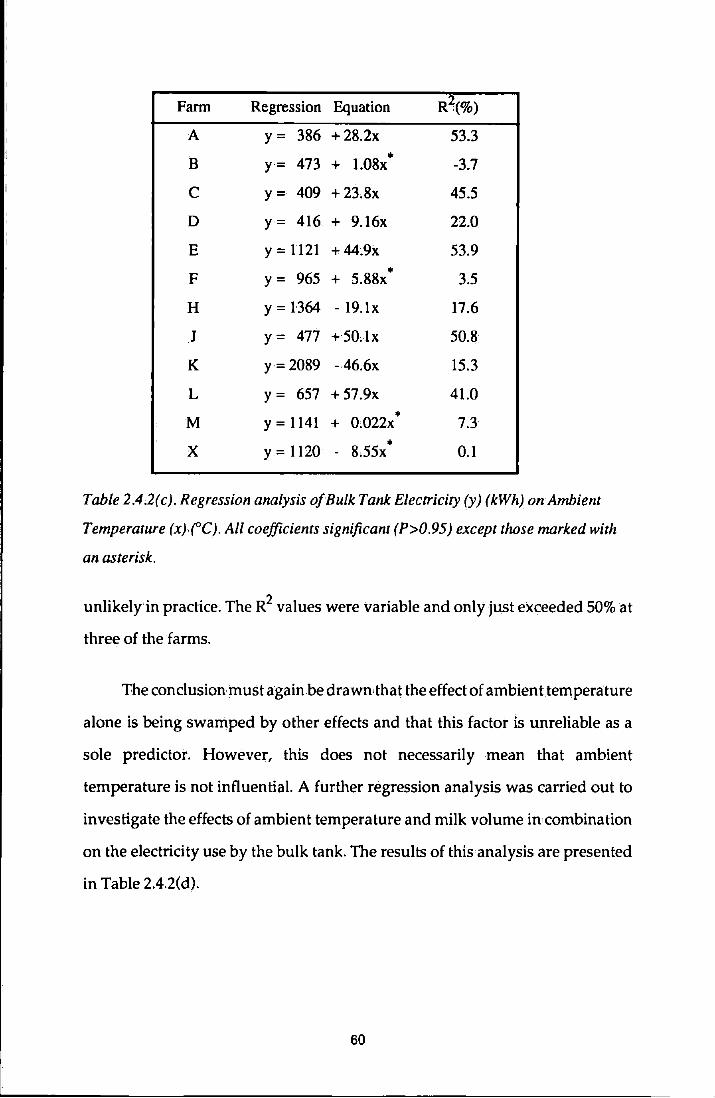
Fann Regression Equation 2 R (%)
A y= 386 +28.2x 53.3
B y·= 473 + 1.08x • -3.7
c y= 409 + 23.8x 45.5
D y= 416 + 9.16x 22.0
E y = 1121 + 44.9x 53.9
F y= 965 + 5.88x • 3.5
H y = 1364 - 19.1x 17.6
J y= 477 +50.-lx 50.8
K y = 2089 - 46.6x 15.3
L y= 657 + 57.9x 41.0
M y = 1141 + 0:022x • 7.3
• X y = 1120 - 8.55x 0.1
Table2.4.2(c). Regressionanalysis ofBu/k Tank Electricity (y) (kWh) onAmbient
Temperature (x).('C). All coefficients significant (P>0.95) except those marked with
an asterisk.
unlikely in practice. The R2 values were variable and only just exceeded 50% at
three of the farms.
The conclusion must again be drawn that the effect of ambienttemperature
alone is being swamped by other effects and that this factor is unreliable as a
sole predictor. However, this does not necessarily mean that ambient
temperature is not influential. Afurther regression analysis was carried out to
investigate the effects of ambient temperature and milk volume in combination
on the electricity use by the bulk tank. The results of this analysis arepresented
in Table 2.4.2(d).
60
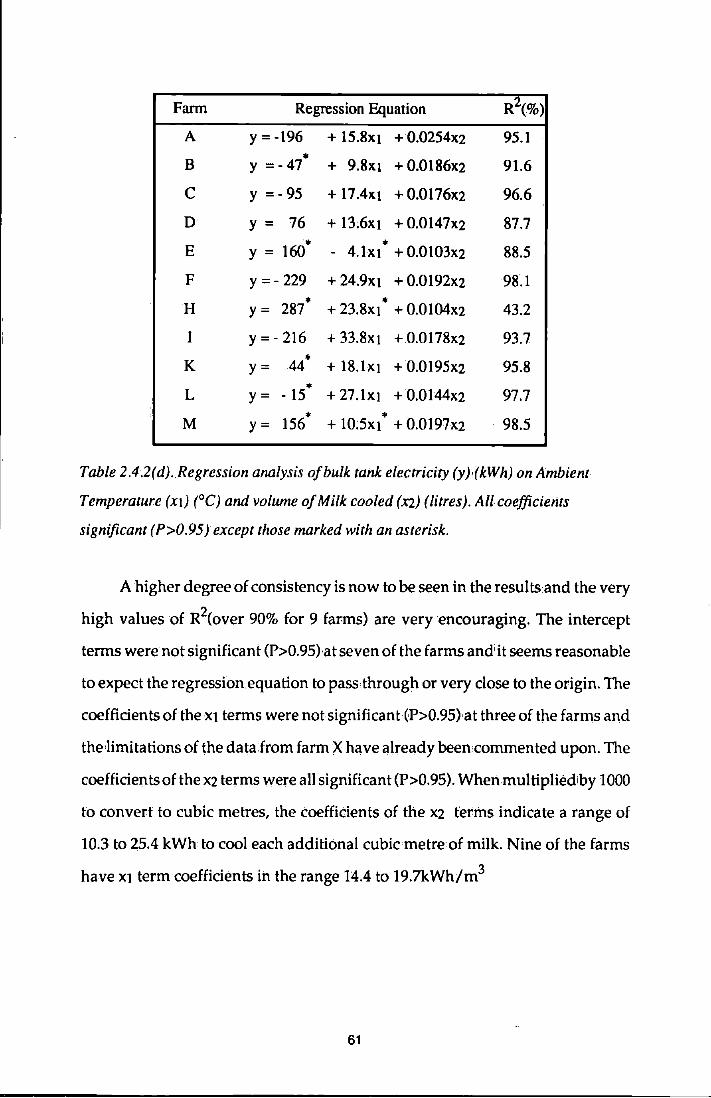
Farm Regression Equation R2(%)
A y = -196 + 15.8XI +0.0254x2 95.1 * B y = -47 + 9.8XI + O.Ol86x2 91.6
c y =- 95 + 17.4xi + 0.0176X2 96.6
D y = 76 + 13.6xi +0.0147x2 87.7
E y = 160 * - * 4.lxl + 0.0103X2 88.5
F y =- 229 + 24.9XI +0.0192X2 9Kl .. * H y= 287 + 23.8XI + 0.0104X2 43.2
I y =- 216 + 33.8XI +0.0178x2 93~7 ..
K y= 44 + 18.lxi +0.0195x2 95.8 ..
L y= - 15 + 27.1X! + O.Ol44x2 97.7
156* ..
M y= + 10;5xi + 0.Q197X2 98.5
Table 2.42(d).Regression analysis of bulk tank electricity (y)·(kWh) on Ambient
Temperature (XI) (°C) and volume of Milk cooled (X2) (litres). All coefficients
significant ( P>0.95) except those marked with an asterisk.
A higher degree of consistency is now to be seen in the results and the very
high values of R2(over 90% for 9 farms) are very encouraging. The intercept
terms were not significant (P>0.95}at seven of the farms and' it seems reasonable
to expect the regression.equation to pass through or very close to the origin. The
coefficients of the Xl terms were not significant(P>0.95)·at three of the farms and
the1imitations of the data from farm X have already been commented upon. The
coefficients of the x2 terms were all significant (P>0.95). Whenmultipliediby 1000
to convert to cubic metres, the coefficients of the x2 terms indicate a range of
10.3 to 25.4 kWh to cool each additional cubic metre of milk. Nine of the farms
have Xl term coefficients in the range 14.4to 19.7kWh/m3
61
In order to provide a comparison with the work by A.D.A.S reported in
Section 1.5.2, the data for all farms were merged and the weekly figures for milk
cooling cost per unit volume of milk (kWh/m3) were computed. Regression
analysis.of this figure on.Ambient Temperature fC) was carried out, resulting
in the equation:
where
y = 13.6 + 0;66x
y is the milk cooling cost
x is the ambient temperature (0 C)
"Ihe A.D.A.S. work produced the comparable equation:
y = 1'5.8 + 0.53x
Section 2.4.1 showed thatthe bulk milk tank used approximately 44% of
all the electricity used on all the farms and that approximately two-thirds of the
variation in total electricity use was assoCiated with variation in the bulk tank
electricity use. The further analysis (Table 2~4.1(d)) has shown that some 90% or
more of the.bulk tankelectricity is associated with the combination of variation
in the volume of milk handled and variation in the ambient temperature.
"Fhe high degree of consistency found in the regressions of bulk tank
electricity on volume of milk and ambient temperature is very encouraging and
suggests the presence of a generalrelationship which may describe the bulk tank
electricity at any farm. In order to determine an equation to describe this general
relationship, these three data items were merged for all farms. The regression
analysis was thell repeated, using all the weekly data for all the farms. The
resulting regression equation is:
62
y = -35.2 + 5.25xi + 0.0178xz
Where xt is the weekly average ambient temperature (°C)
x2 is the volume ofmilkcooled (litres)
2 R =84%
The intercept term was not significant (P>0.95), but the xt and X2 terms
were significant (P>0.95). The high value of the Coefficient of Determination
shows that 84% of the variation in bulk tank electricity is attributable to the
combination of variation in the ambient temperature and volume of milk cooled.
'Phis regression analysis was carried out using the weekly data .and the
xt-term coefficient of 5.25 refers to the number of kilowatt hours attributable to
each degree•Centigrade above zero, over the period for which the temperature
was averaged, in this case one week. On a daily basis this term would become
0.75kWhfOC/ dayc
A negative intercept termis impossible in practice·and this suggests there
is some limit to the linearity of the model. The earlier analysis also frequently
showed this term to be·non-signiflcant. Ignoringthe intercept term .the equation
may be restated as:
The electricity use.by a bulk milk tank of the type and size range examined
will be 0.75kWh/ day for each degree Centigrade that the average temperature
is above zero plus 0.0178 kWh for each·litre of milk cooled'.
63
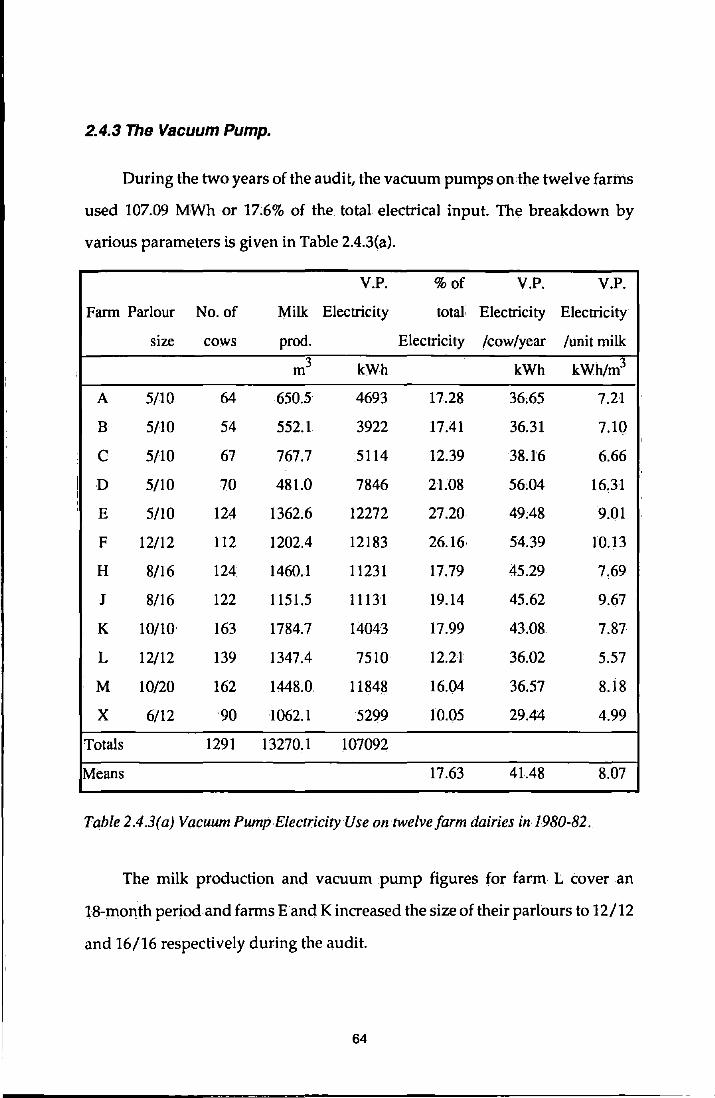
'
I I ' '
2.4.3 The Vacuum Pump.
During the two years of the audit, the vacuum pumps onthe twelve fartns
used 107.09 MWh or 17:6% of the total electrical input. The breakdown by
various parameters is given in Table 2.4.3(a).
V.P. %of V.P. V.P.
Fann Parlour No, of Milk Electricity total Electricity Electricity
size cows prod. Electricity /cow/year /unit milk
m3 kWh kWh kWh!m3
A 5/10 64 650.5 4693 17.28 36:65 7.21
B 5/10 54 552.1 3922 17.41 36.31 7.10
c 5/10 67 767.7 5114 12.39 38.16 6.66
D 5/10 70 481.0 7846 21.08 56:04 16.31
E 5/10 124 1362.6 12272 27.20 49.48 9.01
F 12/12 112 1202.4 12183 26.16 54.39 10.13
H 8/16 124 1460.1 11231 17.79 45.29 7.69
J 8/16 122 1151.5 11131 19.14 45.62 9.67
K 10/10 163 1784.7 14043 17.99 43.08 7.87
L 12/12 139 1347.4 7510 12.21 36.02 5.57
M 10/20 162 1448.0 11848 16.04 36.57 8.i8
X 6/12 90 1062.1 5299 10.05 29.44 4.99
Totals 1291 13270.1 107092
Means 17.63 41.48 8.07
Table 2.43(a) VacuumPumpE/ectricityUse on twelve farm dairies in 1980-82.
The milk production and vacuum pump figures for farm. L cover an
18-month period and farms Eand Kincreased the size of their parlours to 12/12
and 16/16 respectively during the audit.
64
Generally the vacuum pump is the third highest user of electricity in the
dairy. The percentage of total figures should again be treated with caution as
the total may vary for reasons not connected with the vacuum pump.
The electrical cost of running the vacuum system varied from 29.44
kWh/cow/year at Farm X to 56.04 kWh/cow/year at farm D where an
unusually large pump motor (3kW) for the size of the plant, was in operation.
Farm F also had a high electrical cost, but the remainder of the farms were all in
the range 35 to 50 kWh/ cow/ year. The effect of the low yield of the Jersey breed
at farm D is seen when the figures .for vacuum pump electricity are related to
the volume of milk extracted. Here the electricity cost was just over twice the
mean for all the farms. The range for the remaining farms was from just under
5kWh/m3 to just over 10 kWh/m3.
The energy use by any particular vacuum pump will be a function of the
power drawn and the running time. In normal circumstances,the pump will be
running only during milking and the plantcleaning period which follows, The
period of plant cleaning will not vary greatly from day to day and consequently
the main variation in vacuum pump running costs for any farm will be due to
variation in the duration of milking. 'Fhis in turn will vary with both the number
of cows to be milked and the volume of milk to be extracted.
Regression analysis was used to investigate this association. Separate
regressions of the vacuum pump electricity on the number of cows in-milk and
on the volume of milk extracted, were carried out, followed by multiple
regression analysis using both predictors. Regression of vacuum pump
electricity on the number of cows in-milk produced Coefficients of
Determination ranging from zero at farms J and X to 78.7% at farm M. The
65
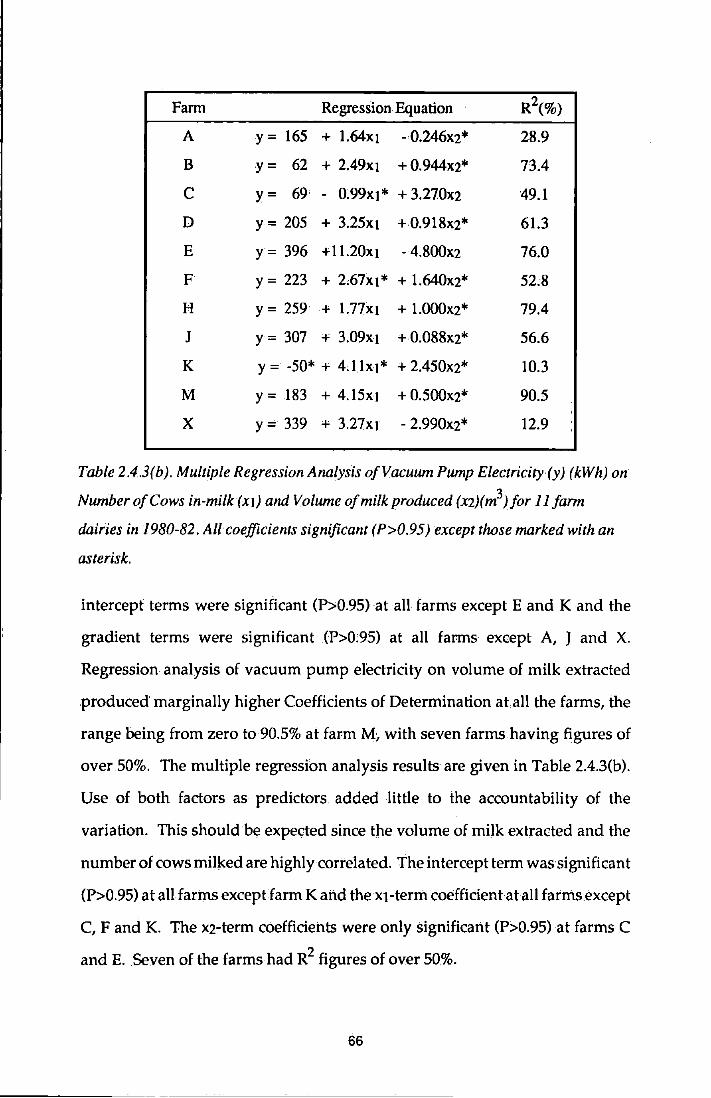
Farm Regression Equation R2(%)
A y= 165 + 1.64xt -0.246x2* 28.9
B y= 62 + 2.49xt +0.944x2* 73.4
c y= 69 - 0:99xt* + 3.270X2 49.1
D y= 205 + 3.25xt +0.918x2* 61.3
E y= 396 + 11.20xt - 4.800x2 76.0
F y = 223 + 2,67xt* + 1.640x2* 52.8
H y= 259 + I.77xt + l.OOOx2* 79.4
J y= 307 + 3;09xt +0.088x2* 56.6
K y = -50*+ 4.UxJ* +2.450x2* 10.3
M y = 183 + 4.15xt + O.SOOx2* 90.5
X y = 339 + 3.27XJ - 2.990x2* 12.9
Table 2.4.3(b). Multiple Regression Analysis of Vacuum Pump Electricity·(Y) (kWh)on
Number of Cows in-milk (xi) and Volume of milk produced (X2)(m3)/or 11 farm
dairies in 1980-82. All coefficients significant (P>0.95) exceptthose marked with an
asterisk.
intercept terms were significant (P>0.95) at all farms except E and K and the
gradient terms were significant (P>0:95) at all farms except A, J and X.
Regression analysis of vacuum pump electricity on volume of milk extracted
produced marginally higher Coefficients of Determination at. all the farms, the
range being from zero to 90.5% at farm M~ with seven farms having figures of
over 50%. The multiple regression analysis results are given in Table 2.4.3(b).
Use of both factors as predictors added little to the accountability of the
variation. This should be expected since the volume of milk extracted and the
number of cows milked are highly correlated, The intercept term was significant
(P>0.95) at all farms except farm K ahd the xHerm coefficientat all farms except
C, F and K. 'Jhe x2-term coefficients were only significant (P>0.95) at farms C
and E .. Seven of the farms had R2 figures of over 50%.
66
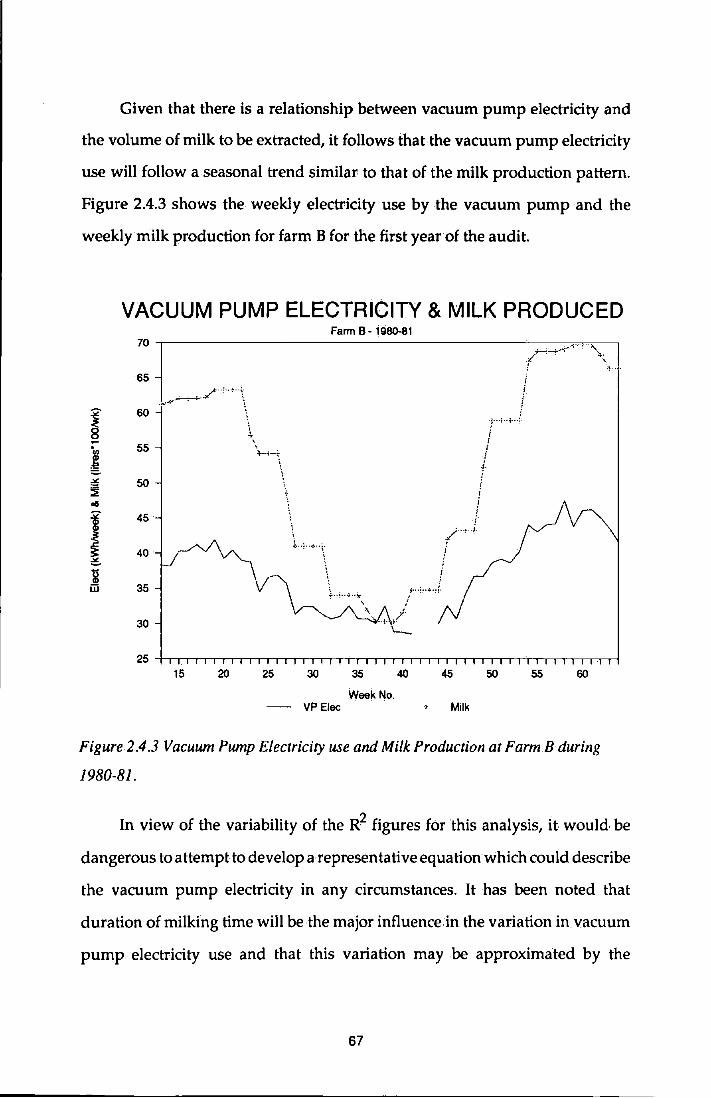
Given that there is a relationship between vacuum pump electricity and
the volume of milk to be extracted, it follows that. the vacuum pump electricity
use will follow a seasonal trend similar to that of the milk production pattern.
Figure 2.4.3 shows the weekly electricity use by the vacuum pump and the
weekly milk production for farm B for the first year of the audit.
f 8 ~ . "' ! ""' ~ "" 1 ~ 6 y w
VACUUM PUMP ELECTRICITY & MILK PRODUCED 70
65
60
... ~-~/··!···'·"\
55
50
45
40
35
30
25 15 20
Farm B- 1980-81
_;-..-......:~.-+"-~,:.,. ( \ f ~--.
i
! I
'j·++--:.
\ ~ i
' I ' I +-i-~ (
\ ! i j \. I i
i i l .
; ./_, • ..• , .. 1.
l .. -:. --~--~-
'! \ \ ! V\ \. . •··'·····!· ~ •···;;\ 1\ j . ~ ~~.\~(
L_
25 30 35 40 45
Week No. VP Elec Milk
50 55 60
Figure2.4.3 Vacuum Pump Electricity use and Milk Production at Fann B during
1980-81.
In view of the variability of the R2 figures for this analysis, it would be
dangerous to attempt to develop a representative equation which could describe
the vacuum pump electricity in any circumstances. It has been noted that
duration of milking time will be the major influence in the variation in vacuum
pump electricity use and that this variation may be approximated by the
67
equations shown above. However, the basic duration of milking, before any
variation takes place, will depend on a number of other factors such as
established work routines, individual: cows' inherent speed of milk release,
extent to which stripping out is practised, and the extent to which feeding and
medication are carried out in the parlour. It seems reasonable, however to expect
vacuum pump electricity to .fall generally within the range 5 to rDkWh/m3 of
mllkextracted, or, on an annual basis,.35 to 50 kWh/ cow.
2.4A The Water Heater.
The review of literature suggested that heating water inthe farm dairy was
likely to be the major use of electrical energyand that this area probably offered
the greatest potential for energy saving. As a consequence a separate study of
heated water in the farm dairy was recommended. This parallel study was
carried'outby Norman,A.J. and has been reported separately. The present report
will therefore confine itself to general comments insofar as they relate to
electricity use by the water heater in the context of the total parlour and dairy
electricity use.
The first year of the audit revealed thatthe electrical1energy inputfor water
heating .for plant cleaning was not normallythe·highest, but in fact usually used
rather less electricity than the·bulk milk .tank. Only at farms C, D and L was the
water heater the highest user of electrical energy in the dairy. Farms C and L
used the Acidified Boiling Water (ABW) method of plant cleaning, which is
known to have a higher requirement in respect of temperature and volume than
the more commonly practised Circulation Cleaning (CC) method used by the
other farms. At farms C and L the proportion ofthe total electrical• energy input
68
to the dairy and parlour attributable to the water heater was 50.7 and 40:4%
respectively.
2.4.5. The Udder Washer
All the monitored farms have a system for providing warmed water for
washing udders. However the extent of the use made of this system varies
considerably between farms. Many of the farms take advantage of this supply
to wash the outside of the jars and clusters at the end of each milking. Farm C
makes use of the facility in winter only, using cold waterfor udder washing in
the summer.Table 2.4.5 summarises the audit of the udder washing system on
12 farms. The percentages of total electricity used by the udder washer show
that it is not a major user. The heating of water to, typically, 40°C represents a
potential use for low-grade, reclaimed heat andfarms E and K have taken this
approach, using a plate cooler and heat recovery unit respectively to provide
this energy, and have achieved a relatively low electrical cost per cow per
milking as a result. The high cost of electricity for udder washing at farm M
requires explanation. Here there is a relatively large heating cylinder with two
3kW elements which remain switched on with no time controls. On several
occasions leaking nozzles were noticed, resulting in· excessive wastage.
Personal attitudes account for a great deal of the between-farm variation.
Management policy will determine the state of general cleanliness, through
control of the cows' environment, namely housing and grazing or feeding
conditions. Beyond this, the herdsman is then required to make a subjective
decision as to what is sufficiently clean at the time of milking. This can lead to
a great deal of variation as seen in the final column of the table.
69
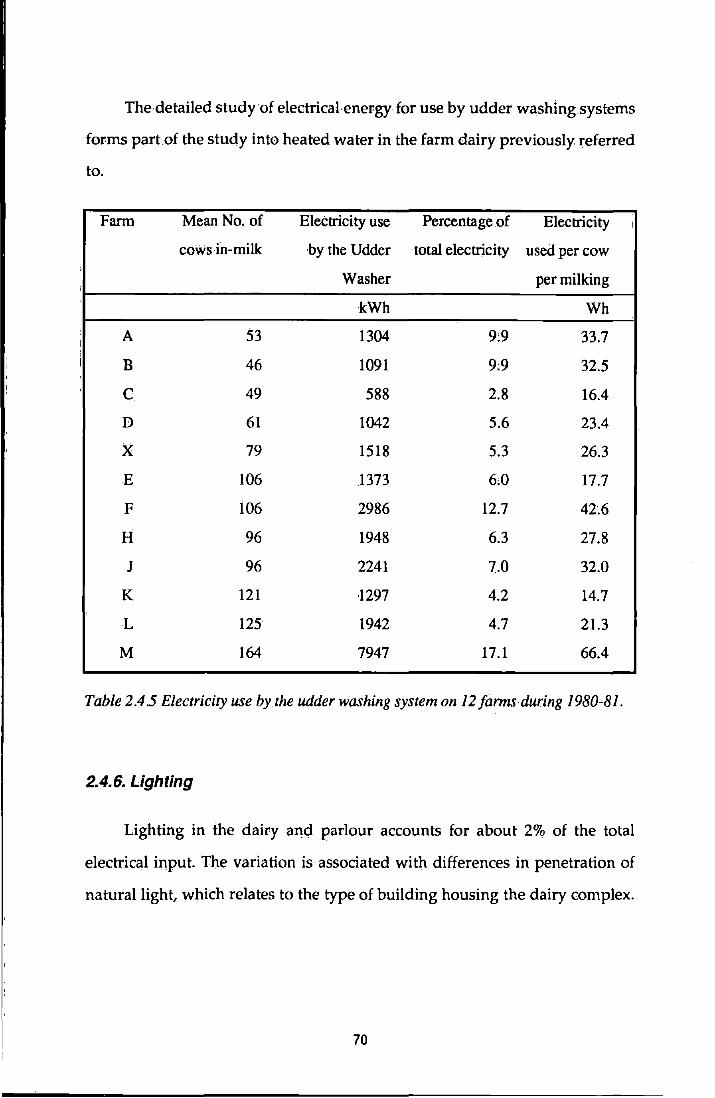
I
i ' '
The detailed study of electrical·energy for use by udder washing systems
forms part of the study into heated water in the farm dairy previously referred
to.
Farm Mean No. of Electricity use Percentage of Electricity I
coWs in-milk by the Udder total electricity used per cow
Washer per milking
kWh Wh
A 53 1304 9:9 33.7
B 46 1091 9:9 32.5
c 49 588 2.8 16.4
D 61 1042 5.6 23.4
X 79 1518 5.3 26.3
E 106 1373 6:0 17.7
F 106 2986 12.7 42.6
H 96 1948 6.3 27.8
J 96 2241 7:0 32.0
K 121 1297 4.2 14.7 ' L 125 1942 4.7 21.3
M 164 7947 17.1 66.4
Table2.45 Electricity use by the udder washing system on /2farms during /980-81.
2.4.6. Lighting
Lighting in the dairy and parlour accounts for about 2% of the total
electrical input. The variation is associated with differences in penetration of
natural light, which relates to the type of building housing the dairy complex.
70
'
'
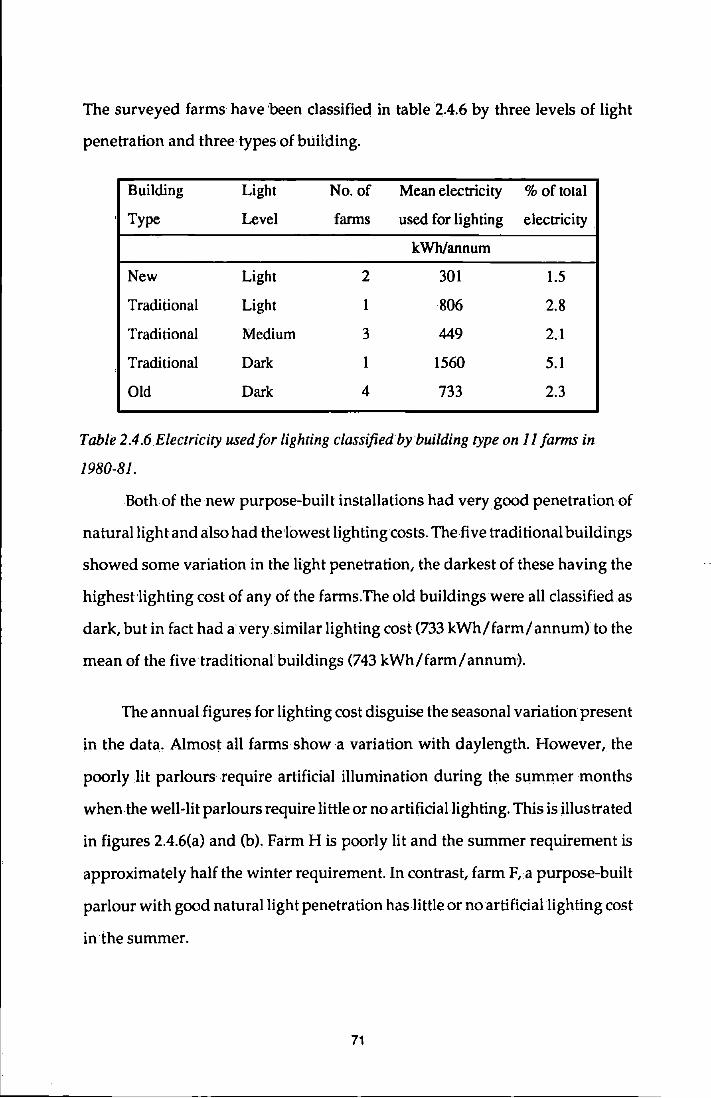
The surveyed farms have ·been classified in table 2.4.6 by three levels of light
penetration and three types of building.
Building Light No. of Mean electricity %of total
' Type Level farms used for lighting electricity .
kWh/annum
New Light 2 301 1.5
Traditional Light 1 806 2.8
Traditional Medium 3 449 2.1
Traditional Dark 1 1560 5.1 '
Old Dark 4 733 2.3
Table 2.4.6£/ectriciry used for lighting classified by building type on 11 farms in
1980-81.
Both of the new purpose-built installations had very good penetration of
natural light and also had the·lowest lighting costs. The.five traditional buildings
showed some variation in the light penetration, the darkest of these having the
highest lighting cost of any of the farms. The old buildings were all classified as
dark, but in fact had a very similar lighting cost (733 kWh/farm/annum) to the
mean of the five traditional buildings (743 kWh/farm/annum).
The annualfigures for lighting cost disguise the seasonal variation present
in the data. Almost all farms show a variation with day length. However, the
poorly lit parlours require artificial illumination during the summer months
when the well-lit parlours require little or no artifidallighting.This is illustrated
in figures 2.4.6(a) and (b). Farm His poody lit and the summer requirement is
approximately half the winter requirement. In contrast, farm F, a purpose-built
parlour with good natural light penetration has little or no artificial lighting cost
in the summer.
71
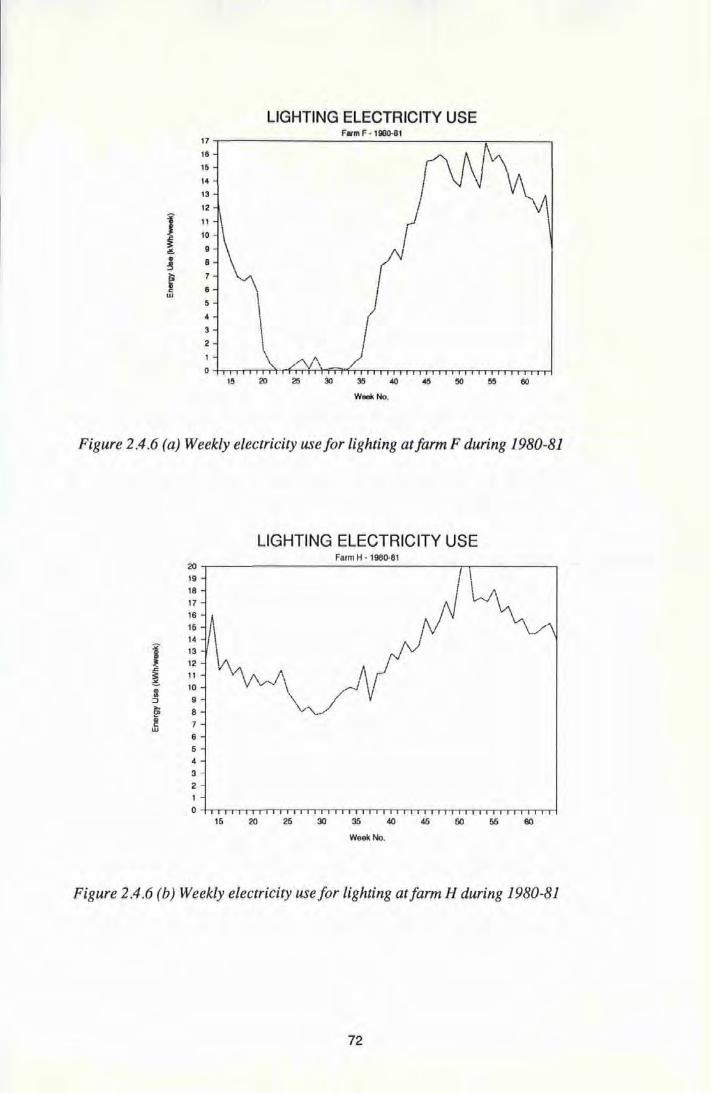
LIGHTING ELECTRICITY USE Fwm F- 1980-81
17
16
15
14
13
12
11
\ 10
9
8
6
5 \ 4 \ 3
2
u ~ ~ ~ ~ ~ ~ 00 ~ 00
Wee« No.
Figure 2.4 .6 (a) Weekly electricity use for lighting at farm F during 1980-81
LIGHTING ELECTRICITY USE Farm H - 1980-81
20 19
18
17
16
I
I~ 15
14 :i<
13 I 12 -C
! 11
: 10
~ 9
~ 8 .. 7 c:
w 6
5
4
3
2
1
0
15 ~ 25 30 35 40 45 50 55 60
Week No.
Figure 2.4.6 (b) Weekly electricity use for lighting at farm H during 1980-81
72
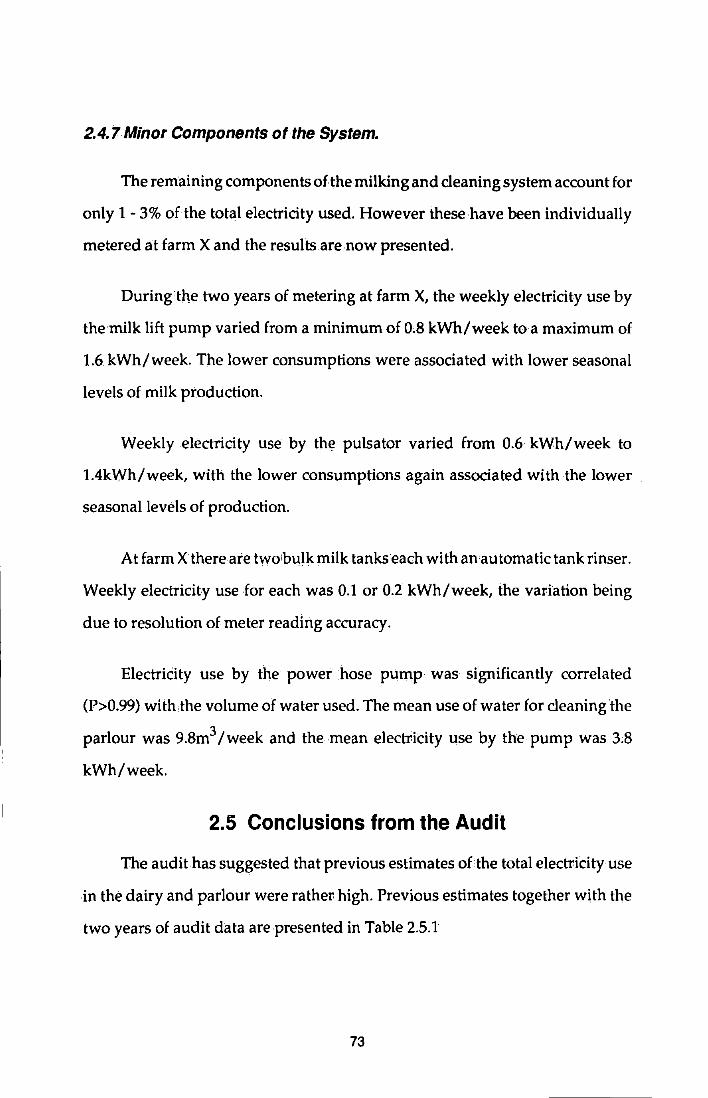
2.4.7Minor Components ofthe System.
The remaining components of the milking and cleaning system account for
only 1- 3% of the total electricity used. However these have been individually
metered at farm X and the results are now presented.
During the two years of metering at farm X, the weekly electricity use by
the milk lift pump varied from a minimum of 0,8 kWh/week to a maximum of
1.6 kWh/week. The lower consumptions were associated with lower seasonal
levels of milk production.
Weekly electricity use by the pulsator varied from 0.6 kWh/week to
1.4kWh/week, with the lower consumptions again associated with the lower .
seasonal levels of production.
At farm X there are two bulk milk tanks each with anautomatic tank rinser.
Weekly electricity use .for each was 0.1 or 0.2 kWh/week, the variation being
due to resolution of meter reading accuracy.
Electricity use by the power hose pump was significantly correlated
(P>0.99) with the volume of water used. The mean use of water for cleaning the
parlour was 9.8m3 /week and the mean electricity use by the pump was 3:8
kWh/week.
2.5 Conclusions from the Audit
The audit has suggested that previous estimates of the total electricity use
in the dairy and parlour were rather high. Previous estimates together with the
two years of audit data are presented in Table 2.5.1
73
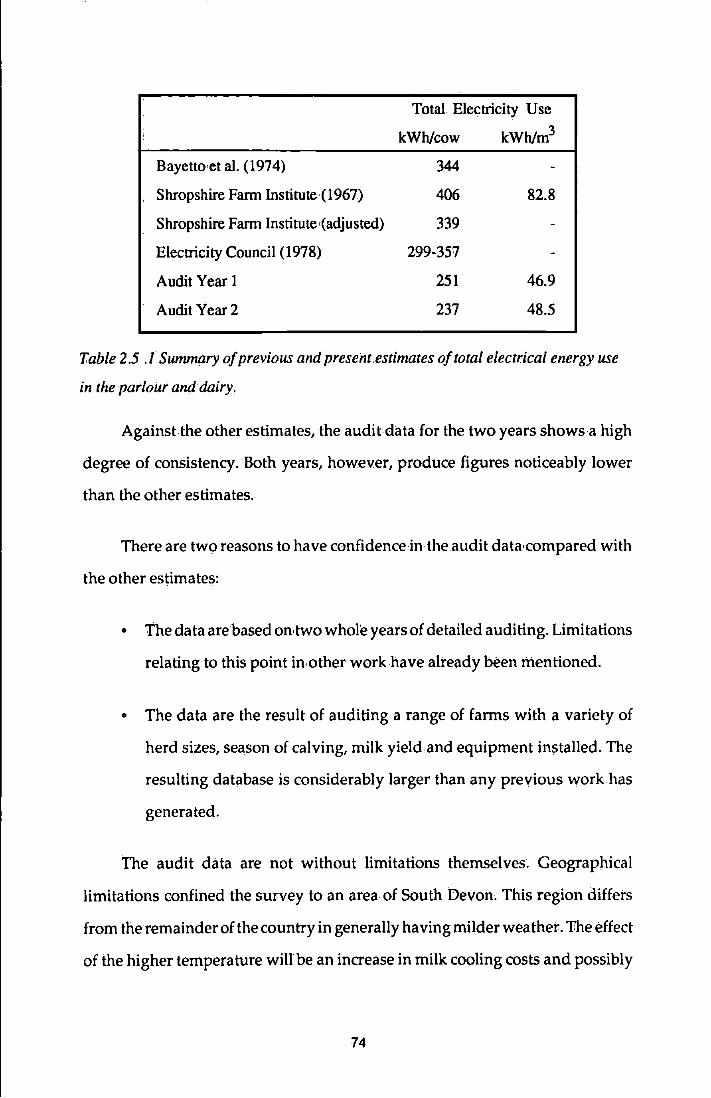
Total Electricity Use
kWh/cow kWh!m3
Bayetto,et al. (1974) 344
Shropshire Farm Institute,(1967) 406 82.8
Shropshire Farm Institute{adjusted) 339
Electricity Council (1978) 299-357
Audit Year 1 251 46.9
AuditYear2 237 48.5
'I: able 2.5 .1 Summary of previous and present,estimates of total electrical energy use
in the parlour and dairy.
AgainsUhe other estimates, the audit data for the two years shows a high
degree of consistency. Both years, however, produce figures noticeably lower
than the other estimates.
There are two reasons to have confidence in the audit data, compared with
the other estimates:
• The data arebased on,two whol'e years of detailed auditing. Limitations
relating to this point in other work have already been mentioned.
• The data are the result of auditing a range of farms with a variety of
herd sizes, season of calving, milk yield and equipment installed. The
resultingdatabase is considerably larger than any previous work has
generated.
The audit data are not without limitations themselves. Geographical
limitations confined the survey to an area of South Devon, lihis region differs
from the remainder of the country in generally having milder weather. The effect
of the higher temperature will be an increase in milk cooling costs and possibly
74
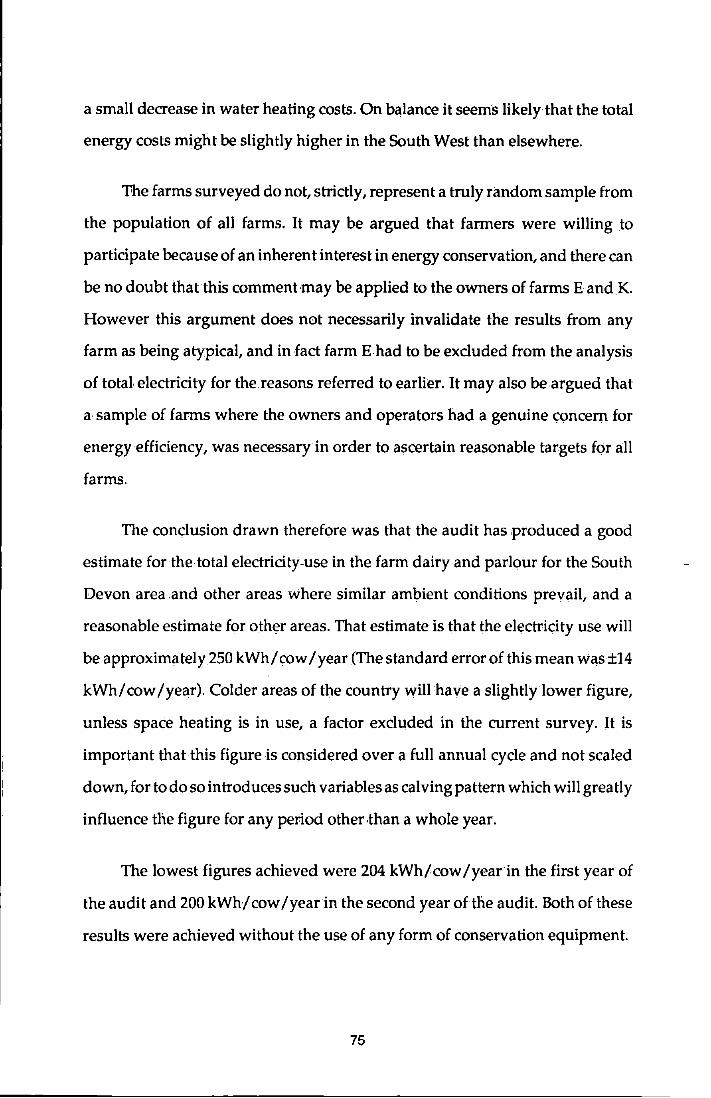
a small decrease in water'heating costs. On balance it seems likely that the total
energy costs might be slightly higher in the South West than elsewhere.
The farms surveyed do not, strictly, represent a truly random sample from
the population of all farms. It may be argued that farmers were willing to
participate because of an inherent interest in energy conservation, and there can
be no doubt that this comment may be applied to the owners of farms E and K.
However this argument does not necessarily invalidate the results from any
farm as being atypical, and in fact farm E had to be excluded from the analysis
of total electricity for the reasons referred to earlier. It may also be argued that
a sample of farms where .the owners and operators had a genuine concern for
energy efficiency, was necessary in order to ascertain reasonable targets for all
farms.
The conclusion drawn therefore was that the audit has produced a good
estimate forthe total electricity-use in the farm dairy and parlour for the South
Devon area and other areas where similar ambient conditions prevail, and a
reasonable estimate for other areas. That estimate is that the electricity use will
be approximately250 kWh/ cow /year (The standard error of this mean was ±14
kWh/cow /year). Colder areas of the country will have a slightly lower figure,
unless space heating is in use, a factor excluded in the current survey. It is
important thatthis figure is considered over a full annual cycle and not scaled
down, for to do so introduces such variables as calving pattern which will greatly
influence the figure for any period other,than a whole year.
The lowest figures achieved were 204 kWh/cow /year in the first year of
the audit and 200 kWh/cow/year in the second year of the audit. Both of these
results were achieved' without the use of any form of conservation equipment.
75
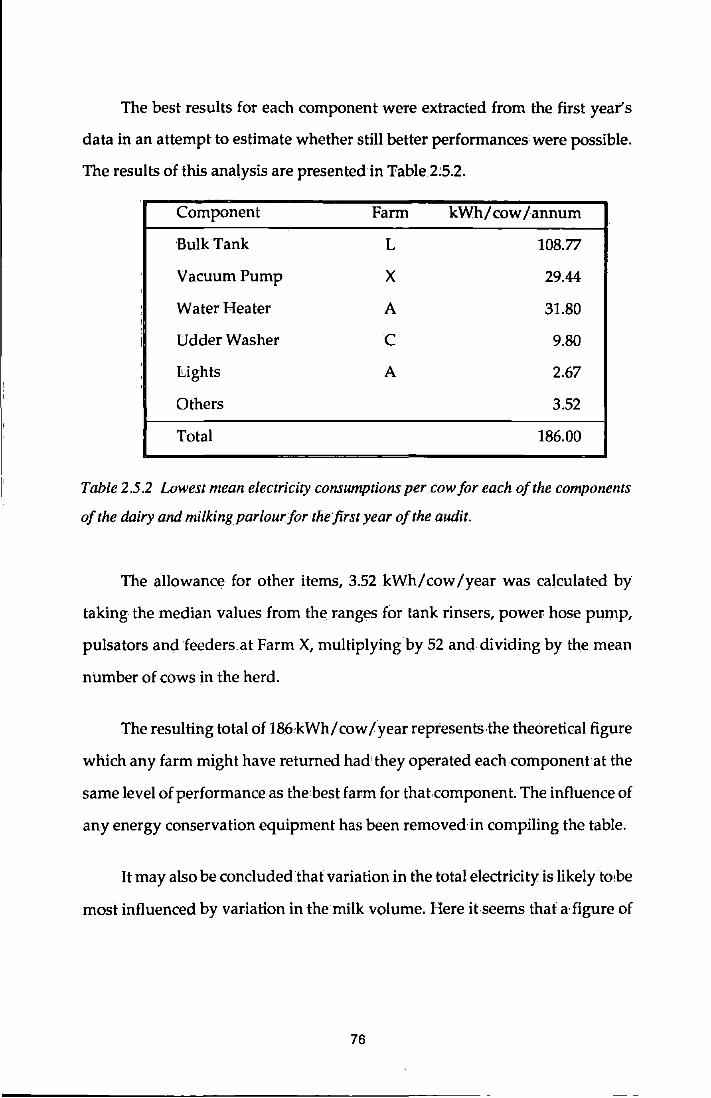
The best results for each component were extracted from the first year's
data in an attempt to estimate whether still better performances were possible.
The results of this analysis are presented· in 'Fable 2:5.2.
Component Farm kWh/ cow /annum
UulkTank L 108.77
Vacuum Pump X 29.44 I
I Water Heater A 31.80 !
I Udder Washer c 9.80 .
tights A 2.67 . '
Others 3.52
Total 186.00
Table 2.5.2 Lowest mean electricity consumptions per cow for each of the components
of the dairy and milkingparlourfor the first year of the audit.
The allowance for other items, 3.52 kWh/cow/year was calculated by
taking the median values from the ranges for tank rinsers, power hose pump,
pulsators and feeders at Farm X, multiplying by 52 and dividing by the mean
number of cows in the herd.
The resulting total of 186,kWh/ cow I year represents the theoretical figure
which any farm might have returned had they operated each component at the
same level of performance as the,best farm for that component. The influence of
any energy conservation equipment has been removed in compiling the table.
It may also be concluded that variation in the total electricity is likely to!be
most influenced by variation in the milk volume. Here it seems that a· figure of
76
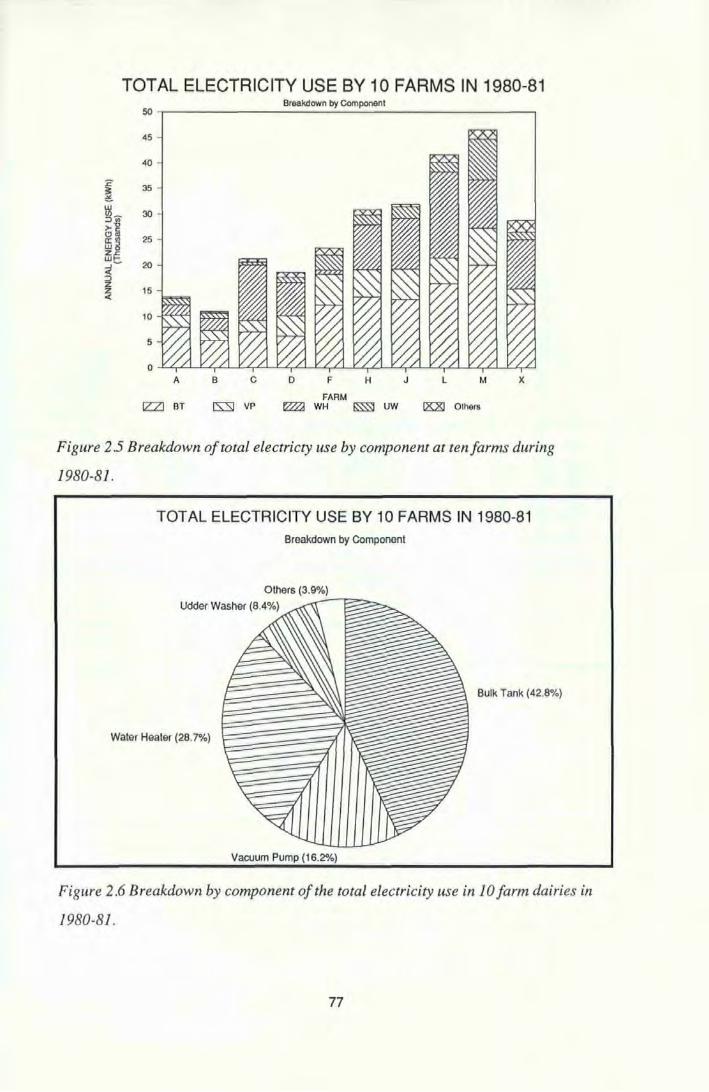
TOTAL ELECTRICITY USE BY 10 FARMS IN 1980-81 50
Breakdown by Component
45
40
'.2
~ 35
w 3 ... 30 )-,
ffi! 25
ffi~ 20 ...J
< ;:)
~ <
15
10
5
0 A B c D F H J L M X
FARM IZZl BT IS:Sl VP ~ WH ~ uw IZ:8J Others
Figure 2.5 Breakdown of total electricty use by component at ten farms during
1980-81.
TOTAL ELECTRICITY USE BY 10 FARMS IN 1980-81 Breakdown by Component
Others (3.9%)
Udder Washer (8.4%) ~_,...~
Bulk Tank (42.8%)
Water Heater (28. 7%)
Vacuum Pump (16.2%)
Figure 2.6 Breakdown by component of the total electricity use in 10 farm dairies in
1980-81.
77
between 45 and 50 kWh/m3 can be expected as typical, but Jersey herds can
expect a significantly higher figure.
Figure 2.5 shows the breakdown of the total electricity use,by component
for the first year's data for each of the .farms and figure 2.6 shows the breakdown
diagrammatically for all farms.
The bulk milk tank has been identified notonly as the heaviest user (43%
of the total) of electrical energy in the dairy but as the component whose
variation highly influences the variation in total electricity. Again the figures
should be considered only in the context of a whole year.
The two majorfactors to affect the bulk tank's electricity consumption have
been seen to be the volume of milk to be cooled and the ambient temperature,
these factors accounting for a very high proportion of the variation, and a
representative equation has been proposed as a working model for predicting
the annual energy use for cooling milk in tanks ofthe size and ~pe examined.
This equation is unable to predict the variation in energy requirements within
the annual or daily cycle, and the modelling stage of the work has attempted to
address this problem.
The vacuum pump was found to show some relationship with the volume
of milk extracted but the predictability of this relationship was poor. It seems
that a number of factors, not considered quantitatively in this work, are also
involved. These factors relate specifically to the basic work processes in the
parlour and possibly to genetic or acquired basic differences in the milking speed
of individual cows. A further contribution towards understanding the variation
in vacuum pump electricity might be made by research in the area of method
study where it applies to the milking process.
78

The electricity used by lights ·in the dairy and parlour is not .a very
significant proportion ofthe·total and offers little scopefor reduction·except in
the case of new building design, where a consideration of natural light
penetration will result in lower costs for lighting throughout the life of the
building. Frequently, though, the parlour and dairy are sited ill old converted
buildings or in traditionalbuildillgs where the natural lighting was not a major
design feature.
79
3a THIE BULK TANK MODEL
3~ 1 Modelling Methodology
The audit yielded a series of regression equations, one of which predicted
the electrlcity use by the bulk milk tank over a period of time, given .the ambient
temperature and the volume of milk to be cooled. An intermediate stage of
development of this equation was in close agreement with other work. The
equation may be regarded as a static, empirical model. While this is useful in
providing confirmation of earlier work, and as a predictive tool over a period
of time, its limits are not known and it does not describe the course of events
within the time period. There is no indication of peak demands or whether the
tank's objectives are being met in respect of the rapid!cooling of milk after filling.
What is required to satisfy these points is a dynamic model containing the
time variable. This would allow examination of the electricity use and timing
over a daily cycle and a full annual cycle. Where possible this model needs to
be mechanistic in that it needs toprovide a description of thebehaviour of the
bulk tank in terms of the processes involved in cooling milk.
The model developed examines the performance of a bulk milk tank from
the time the milk arrives at the tank to the time when it has been cooled to the
target temperature, and the cooling reserve;has been restored. It has, as output,
information showing the use of electricity over the period and information
relating to the milk temperature since the prime objective of a bulk milk tank is
80
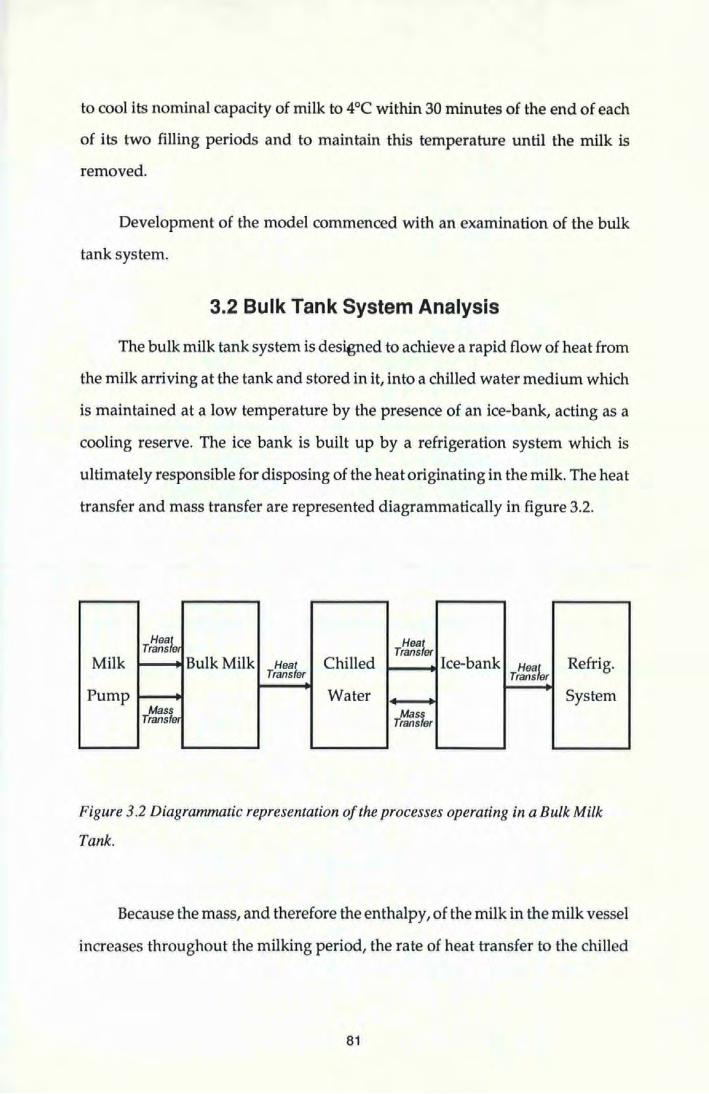
to cool its nominal capacity of milk to 4°C within 30 minutes of the end of each
of its two filling periods and to maintain this temperature until the milk is
removed.
Development of the model commenced with an examination of the bulk
tank system.
3.2 Bulk Tank System Analysis
The bulk milk tank system is designed to achieve a rapid flow of heat from
the milk arriving at the tank and stored in it, into a chilled water medium which
is maintained at a low temperature by the presence of an ice-bank, acting as a
cooling reserve. The ice bank is built up by a refrigeration system which is
ultimately responsible for disposing of the heat originating in the milk. The heat
transfer and mass transfer are represented diagrammatically in figure 3.2.
Heat Transfe1 Heat
Transfer Milk Bulk Milk Heat Chilled Ice-bank Heat Refrig.
Transfer Transfer
Pump Water System Mass Mass Transfer Transfer
Figure 3.2 Diagrammatic representation of the processes operating in a Bulk Milk
Tank.
Because the mass, and therefore the enthalpy, of the milk in the milk vessel
increases throughout the milking period, the rate of heat transfer to the chilled
81
water is not constant. Consequently the flow of heat through the rest of the
system is also not constant. This feature justifies the use ofa dynamic model in
which the time variable features.
The model which has been developed, simulates the process shown in
figure 3.2 from the additions of milk up to the point where heat is transferred
from the tank by the refrigeration system. This process is examined in three
stages:
i) The addition of milk to the contents of the milk vessel
ii) The cooling of milk by heat transfer through the milk vessei walls and
floor into the chilled1 water medium.
iii) Heat transfer from the chilled water to the ice-bank and the associated
mass·transfer.
The major proportion of the electricity use by the bulk tank as a whole is
attributable to the compressor, the minor users being the milk agitator motor
and the chilled water agitator motor. Operation of the compressor is under the
control of a sensor which starts the operation as the ice-bank diminishes in size
and stops the operation when the ice-bank is restored to a pre-set level. The
physical dimensions of the ice-bank are therefore major variables controlling the
extent and timing of the electricity use by the compressor.
A number of the rate variables in the model have been;derived by empirical
methods,therebeing no reference in the Iiteratureto.previous work of modelling
any similar systems.
82
The model was developed initially by referenceto the system and practice
associated with the Seale-Hayne bulk milk storage system, which consists of two
1365litre sump and' spray bulk tanks. This system was.selected for convenience
of measurement and checking. Empirical determination of parameters and
variables was carried out on a 2500 litre sump and1spray bulk tank in laboratory
conditions at Plymouth Polytechnic.
3.3 Addition of Milk to the Milk Vessel.
The milk vessel is constructed of stainless steel and is approximately
rectangular in shape. The floor is shaped as a shallow vee.to.enable milk to drain
towards the centrallateralline when emptying. The floor also has a.shallow fall
towards the end with the drain plug. Milk enters the vessel from a pipe
connecting the tank with the milk receiver jar delivery pump. The pump,does
not operate continuously, but switches on when the receiver jar above it is
approaching full capacity and switches off when the jar has been emptied. Milk
therefore arrives at the tank in intermittent, discrete quantities. Milkis agitated
in the tank by a flat-bladed paddle suspended into the tank and driven by an
electric motor above. Larger tanks may have two agitators. A thermometer is
also suspended in the milk. Agitation is under control of a thermostat and will
be in• operation whenever the milk temperature exceeds 4°C.
At this stage the model needs to calculate two state variables. These are
the mass and temperature of the milk in the tank. The product of these and a
constant, namely the specific heat capacity of milk, will yield an auxiliary
variable, the enthalpy of the milk in the tank, which is the subject of the
subsequent cooling process.
83
The mass of milk in the .tank is added to intermittently by deliveries from
the receiver jar, and a simple additive model describes this for a time period, t
M3=Mt +M2
where M1 is the mass of milk added in time t
Mz is the mass of milk in the tank at timeT
M3 is the mass of milk in the tank at timeT +t
(3.3.1')
Calculation of the temperature of milk in the tank following an addition
of milk, depends upon the assumption that the enthalpy of milk in the tank and
milk added may be treated additively to give the enthalpy of the increased
contents, 'Jihus:
M3CpT3 = M 1 CpTt + M2 CpTz
where Mt, M2 and M3 are masses of milk as in equation 3,3.1
Cp is the' specific heat capacity of whole milk (3918 JKg-1K 1)
(3.3.2)
Tt is the temperature of the milk added from the,delivery pump'(K)
Tz is the temperature of milk in the tank before the addition,(K)
T3 is the temperature of the milk in the tank after the addition, (K)
Equation 3.3.2 may be rearranged to make T3 the subject:
T3 = Cp(MtTt + M2T2) M3Cp
The specific heat capacity term cancels and equation 3.3.1 may be
substituted to give:
T3 = (MtTr + M2T2)/~Mt + M2) (3.3.3)
Equation 3.3.3 assumes a steady state, in which there is no loss or gain of
temperature during the timestep t In practice the cooling process takes place
continuously if the milk temperature exceeds 4°C. 'Fhe cooling effect upon the
84
accuracy of equation 3.3.3 will become progressively less significant as the
timestep variable, t, is reduced. The model was initially developed with a
on~minute .timestep.
The delivery pattern of milk to the tank was recognised as being an
important feature. In practice the filling pattern of a bulk milk tank will depend
on a number of factors relating to. the characteristics of the milking parlour and
equipment and to the herdsman's operating practices, These factors include:
o The cow throughput rate and the volume of milk to be extracted.
• The ratio of milking units to receiver jars. Some larger parlours have
two receiver jars which are emptied in parallel. In such cases the
volumes delivered to the tank will be greater and less frequent than a
similar parlour with only one receiver jar.
• Operator practice. Some herdsmen will release milk from the jars at
each milking point to the receiver jar after each cow has finished
milking. Others will only release milk to the receiver jar when each
milking jar is almost full. In the latter case larger volumes of milk will
arrive at the receiver jar and these larger volumes may continue
arriving after the milk pump· has commenced emptying the receiver jar.
This is likely to be followed by longer periods;of inactivity.
o ~he sensitivity and setting ofthe milk pump controls. Generally the
controlling. mechanism will be one of two types. The milk pump may
be triggered by the mass of milk in the receiver jar above. In this case
the jar is spring"mounted and the pump is operated by a floatswitch.
~lternatively, the milk receiver jar may contain two probes which will
85
sense the depth·of milk in the jar and operate the pump·when a pre~set
depth has'been reached.
'Investigations were carried out to establish typical milk delivery patterns
and temperatures.
3.3.1. Investigation of the milk delivery pattern.
Six of the audit farms were investigated to gain further knowledge of the
milk delivery patterns. Variation may involve changes in the frequency of
delivery pump operation or may involve changes in the volume of milk
delivered at each delivery.
Differences in the frequency ofmilk pump operation are likely to be related
to individual farm practices and equipment, such as the herdsman's routine or
the ratio of milking places to receiver jars. Thus the frequency of milk pump
operation will be a farm-related function, whereas seasonal variations in the
volume of milk handled will be associated with variation in the volume
delivered at each delivery.
An appropriate approach to modelling this aspect therefore involved
establishing a suitable estimate of the frequency of milk pump operation.
Knowing the·total volume of milk handled and the,length of the milking period,
the volume delivered each time may then be calculated.
The six farms investigated included a spread ofparlour sizes from 5/10 to
10/20. The results are given in Table 3.3.2.
86
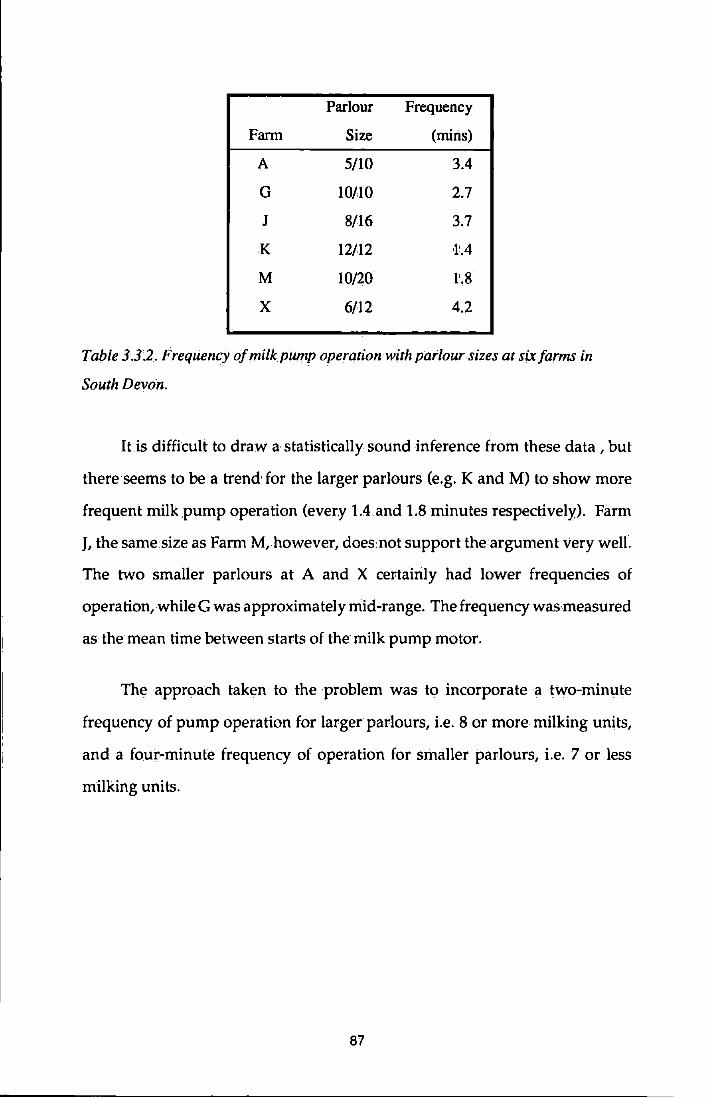
Parlour Frequency
Fann Size (mins)
A 5/10 3.4
G 10/10 2.7
J 8/16 3.7
K 12/12 1'.4
M 10/20 1'.8
X 6/12 4.2
Table 3.32. Freqliency ofmilkpump operation with parlour sizes at sixfanns in
South Devon.
Itis difficult to draw a statistically sound .jnference from these data, but
there seems to be a trend for the larger parlours (e.g. K and M) to show more
frequent milk pump operation (every 1.4 and 1.8 minutes respectively). Farm
J, the same size as Farm M, however, does not supportthe argument very welL
The two smaller parlours at A and X certainly had lower frequencies of
operation, while G was approximately mid-range. The frequency was measured
as the mean time between starts of the milk pump motor.
The approach taken to the problem was to incorporate a two-minute
frequency of pump operation for larger parlours, i.e. 8 or more milking units,
and a four-minute frequency of operation for smaller parlours, i.e. 7 or less
milking units.
87
3.3.2 Investigation o; the milk delivery temperature.
Milk is produced at a temperature very close to the cow's body
temperature, 38°C. In its passage through the milk jar and the milk .pipe to the
delivery jar, the milk will lose some of its heat to the surrounding atmosphere.
A total of 30 investigationswas carried out on six of the audit farms without
pre-cooling. The mean temperature at delivery was 32.SOC with a relatively
narrow range from 31.0 to 33.9°C. Temperatures were measured with the
hand-held digital thermometer whose calibration has been previously
described.
3.4 Cooling of Milk.
Milk is cooled by heat transfer through the milk vessel walls into the chilled
water medium surrounding it. 11he heat transfer occurring,here is an extremely
complex process and the literature contains no references to work examining it.
In the case of a sump and spray tank the milk vessel is not submerged in
the sump of.chilled water. The chilled water in factforms a sump underneath
the milk vessel, and is pumped to the top of the milk vessel walls where it
gravitates as a thin film back to the sump. There is a cooling effect caused by
the impinging jet of chilled water on the wall of the milk vessel, but this effect
is limited to the top 2 to.3 cm at the top of the wall. This aspect has been ignored
in the current work for three reasons. Firstly the milk only reaches this level on
the inside of the tank on the occasions when the tank is filled to capacity.
Secondly, by the time the milk reaches this level it is substantially cooled already.
Thirdly the area affected is a very small proportion of the total wetted area.
88
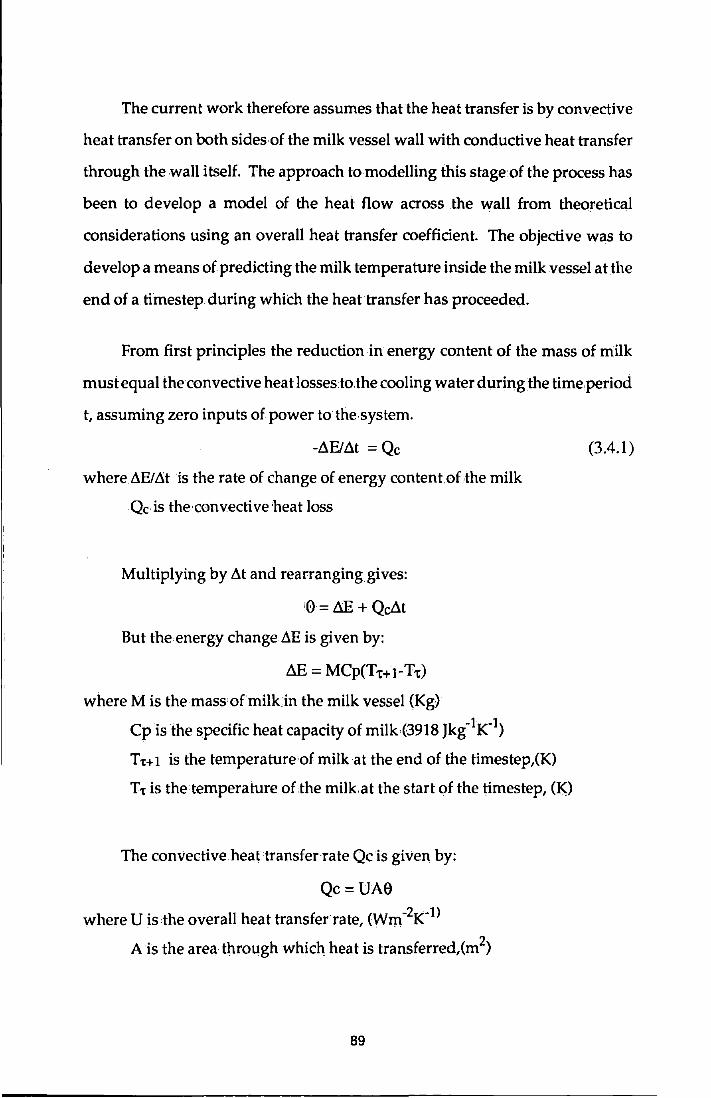
The current work therefore assumes thatthe heat transfer is by convective
heat transfer on both sides·of the milk vessel wall with conductive heat transfer
through the wall itself. The approach to modelling this stage of the process has
been to develop a model of the heat flow across the wall from theoretical
considerations using an overall heat transfer coefficient. The objective was to
develop a means of predicting the milk temperature inside the milk vessel at the
end of a timestep during which the heat transfer has proceeded.
From first principles the reduction in energy content of the mass of milk
must equal the convective heat losses to the cooling water during the time period
t, assuming zero inputs of power to the system.
-8EI8t = Qc
where 8E/.1t is the rate of change of energy content of ,the milk
Qc is the·convective heat loss
Multiplying by M and rearranging gives:
0= Llli + Qcdt
But the energy change ~E is given by:
Lill = MCp(Tnl-Tc)
where M is the mass,ofmilkin the milk vessel (Kg)
Cpis the specific heat capacity of milk{3918Jkg-1K'1)
Tt+ 1 is the temperature;of milk at the end of the timestep,(K)
Tt is the temperature of.the milkat the start of the timestep, (1<.)
The convective heat transfer rate Qc is given by:
Qc=UAe
where U is the overall heat transfer rate, ~wm-2K-l)
A is the area through which heat is transferred,(m2)
89
(3.4.1)
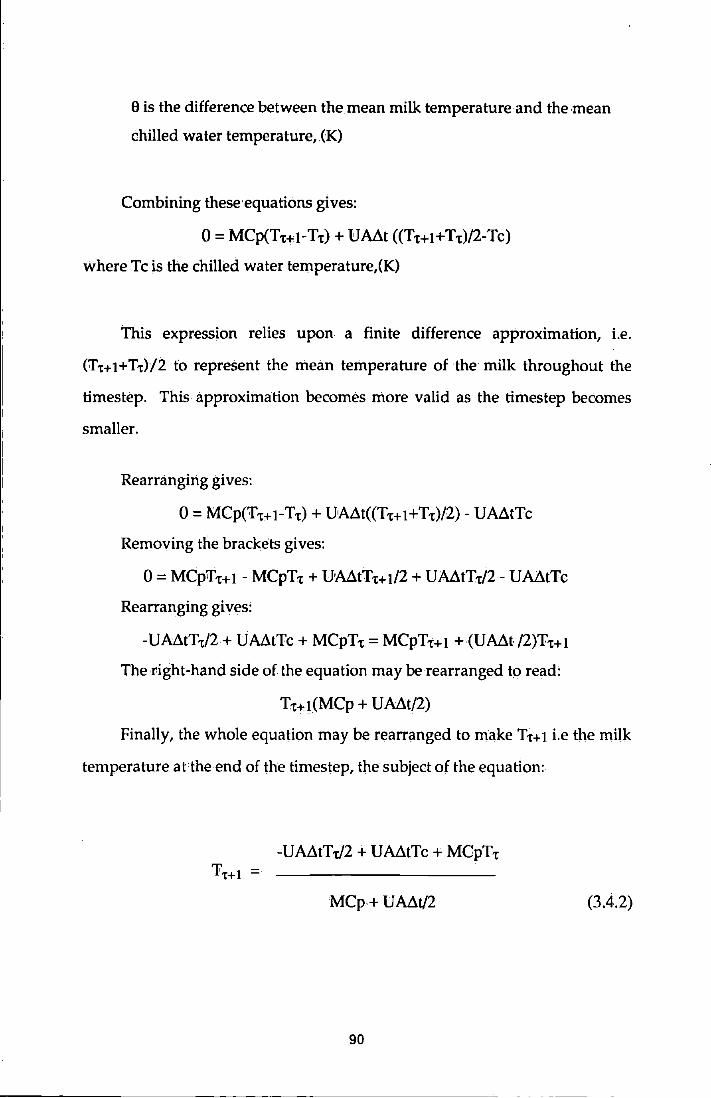
9 is the difference between the mean milk temperature·and the mean
chilled water temperature,.(K)
Combining these equations gives:
0 = MCp(Tt+t-Tr) + UMt ((Tnt+Tt)/2-Tc)
where Tc is the chilled water temperature,(K)
This expression relies upon a finite difference approximation, i.e.
(l't+l+ Tt)/2 ,to represent the .mean temperature of the milk throughout the
timestep. This approximation becomes more valid as the timestep becomes
smaller.
Rearranging .gives:
0 = MCp(Tt+t-Tt) + UA~t((Tt+t+Tt)/2)- UMtTc
Removing the brackets gives:
0 = MCpTt+t- MCpTt + UA~tTt+t/2 +UMtTt/2- UMtTc
Rearranging gives:
-UMtTt/2+ UMtTc + MCpTt = MCpTt+t +(UMt.f2)Tt+t
The right-hand side of the equation may be rearranged to read:
Tt+t(MCp + UMt/2)
Finally, the whole equation may be rearranged to make Tt+l i.e the milk
temperature atthe end of the timestep, the subject of the equation:
-UA~tTt/2 + UMtTc + MCpTt
MCp+ UA~t/2 (3.4.2)
90
This equation relies on three assumptions:
• That all the heat loss from the milk is through the milk vessel walls and
floor to the chilled water. In practice, a small amount of heat will be
lost into the air volume above the milk. This volume of air is
approximately 1 to 4m3, depending on the size of the tank. The small
mass of air, l to 5 kg, was considered insignificant and this factor was
ignored. Similarly a small volume of heat will be utilised in raising the
temperature of the stainless steel walls of the milk vessel. The mass.of
stainless steei:involved will vary with the size of the tankbut is unlikely
to exceed 100kg. If the entire mass were to rise by 10°C, then
approximately O.SMJ would be taken up, 2500 litres of milk cooling
from 32.5°C to 4°C will lose approximately 300 MJ, and the effect of the
warming of the walls and floor, which is only transitory, has been
ignored.
• Thatthe chilled water remains at the same temperature throughout the
tini.estep. Observation of tanks in operation showed that the chilled
w:ater at the start of the milking process was usually at about l°C and
during a two-hour filling period this might rise to a temperature in the
range of 4°C to 7°C, before returning to the startinglevel. The change
of temperature within a short timestep was therefore considered to be
insignificant and the temperature at the start of the timestep was
assumed to prevail throughout the timestep. It was, however,
recognised that the chilled water temperature should be recalculated
between timesteps.
91
• That the mass of milk remains unchanged throughout the timestep.
'fhis requires the assumption that within a timestep when there is a
delivery to the tank, the milk arrives over an infinitely short period at
the beginning of the timestep. The error associated with this
assumption becomes less significant as filling proceeds, because each
subsequent addition of milk increases the total mass of milk by a less
significant amount.
Equation 3.4.2 may be used to calculate the milk temperature after a
suitable timestep during which cooling has taken place. At the end of the
timestep the resulting milk temperature may be used as the starting temperature
for the following timestep. Also at the end of the timestep a further calculation
needs to be carried out to recalculate the chilled water temperature as.a result
of the heat it has gained from the milk. It has been noted that, for the
assumptions to remain valid~ the timestep should be as short as possible. This
type of repetitive, detailed recalculation lends itself to computer-based methods
and further development of the model was carried out using the programming
language BASIC on PDPll and Apple ll computers and later using the
programming language 'C' on IDM PC and AT compatible computers.
Equation 3.4.2 contains a constant, Cp,the specific heat capacity ofwhole
milk, which is 3918 Jkg-JK-1. It contains two parameters, .M and U, the timestep
in seconds, and the overall heat transfer coefficient (Wm-2K-1) respectively. It
also contains four state variableswhich need tobe calculated before the equation
can be solved. The mass of milk in the tank, M (kg), remains the same as the
previous.timestep unless there is anaddition to the tank, in which case it is given
by equation 3.3.1. The area over which heat transfer takes place, A (m2), can be
calculated, given the physical dimensions of the tank and a knowledge of the
92
volume of milk in the tank. The volume of milkwas calculated using 1.032 kgm -3
as the specific gravity of whole milk. The chilled water temperature, Tc(0 C)was
taken as 1 oc at the start of the filling period and this temperature applies to the
first timestep. Subsequently the chilled water temperature as calculated'·from
the next stage of the process, was fed back into equation 3.4.2. The milk
temperature at the beginning of the timestepwas taken as the milk temperature
at the end' of the previous timestep, untess there was an addition of milk to the
tank in Which case it was given by equation 3.33.
All the variables and the constant in equation 3.4.2 can therefore be
calculated, or are known. The timestep parameter was set at one~minute as a
compromise between the accuracy required and the length of processing time
to simulate a complete cooling process. The overall heat transfer coefficient (U)
was not known.
The heat transfer process from the milk to the chilled water is complex,
involving convective·heat transfer in the two fluids on either side of the stainless
steel wall and conduction through the wall itself. During the cooling process,
the milk is agitated by means of the agitator paddle and conditions are such .that
turbulent flow at the inner face of the wall is likely to be in operation. On the
cold face, the chilled water is in the form of a thin film of water of varying
thickness gravitating down the wall and along the underside of the floor. Forced
convection is likely to be in operation here. The literature gives no guidance
towards quantifying these convective heat transfer coefficients and there is no
record of work attempting to determine them for this tank geometry.
Experiments were therefore designed to produce an empirical determination of
the overall heat transfer coefficient.
93
3.4.1. Experimental determination of the 'U'-value of the milk vessel.
The heat transfer process is a function.of the mass ofmilkto be cooled, the
milk contact area ("wetted area") and the temperature gradient across the wall
or floor. By measuring the fall in temperature of a known mass of milk, cooled
through a known area, it is possible to calculate the overall 'heat transfer rate.
To carry this out in farm conditions was impracticable. For the accuracy
required, it would have been necessary to record the mass of each addition of
milk. Alternatively recording could have started when the last addition to the
tank had,arrived, but by this time the bulk of milk would have been substantially
cooled leaving only a short period of time, with a relatively small temperature
gradient, available for recording, before the cooling process ended.
Instead', it was decided to carry out the experiment in the laboratory. A
2500 litre sump and spray bulk tank was made available by the manufacturers
and this was installed in the thermodynamics laboratory at Plymouth
Polytechnic. Warm water was used in place of milk This avoided the risk of
waste of a valuable consignment of milk and allowed examination of the
'U'-value over a wider temperature range.
Since the convective heat transfer coefficient, and consequently the overall
heat transfer coefficient, will differ for a horizontal plate and a vertical plate, it
was necessary to repeat the experiment with different volumes of warm water
to quantify this difference. J:he experiment was performed three times. On the
first occasion only sufficient warm water to cover the floor was added. The
second and third experiments involved the tank being approximately half full
and full respectively.
94
Before the experiments commenced, the internal dimensions of the milk
vessel were carefully recorded in order to calculate the .floor and wall areas.
Water was metered into the tank and it was found that 305litres were required
to cover the floor area before any significant wall area became wetted. The
chilled water vessel was filled to the recommended level, but the compressor
motor was left switched off. Temperatures were recorded by connecting low
thermal inertia thermocouples to an analogue to digital·converter installed in an
Apple 11 computer. The analogue to digital converter used was an AIB
Analogue Input System with 12-bit (0.024%) resolution. The system was
calibrated by reference to a mercury-in-glass thermometer of known accuracy
In the first experiment, 305 litres of warm (60°C) water was pumped
rapidly into the milk vessel. The milk agitator motor and chilled water pump
motor were switched on and allowed to run for one minute to ensure an even
temperature distribution in each of the two fluids. Recording of the "milk" and
chilled water temperatures then started and continued at one minute intervals
until the temperatures ofthe two fluids were within 2°C of each other.
In the second experiment, 1354litres of warm water was pumped rapidly
into the milk vessel. This was allowed to settle and the depth carefully recorded
for subsequent calculation of the wetted wall area. The milk agitator and chilled
water agitator were then operated for one minute and recording proceeded as
before.
The third experiment followed the same pattern, except that 2383.litres.of
warm water was used, to take the tank very dose to full capacity, utilising as
much of the wall area as possible.
95
By recording the warm water temperature at one-minute intervals, and
knowing the mass of warm water, it was possible to calculate the heat transferred
in each period by equation 3.4.1.1:
Q=MCpi\T
whereQis the heat transferred, Q)
M is the mass of warmed water, (kg)
Cp is the specific heat capacity of water, (4190 Jkg-1Kl)
~T is the temperature drop over the period, (K)
(3.4.1.1)
It was then possible to substitute the value·of Q into the equation:
Q=UAe
whereQis the overall heat transferred, 0) U is the overall heat transfer coefficient, (Wm-2K-1)
A is the area of heattransfel', (m2)
e is the temperature difference between the two fluids,.(K)
(3.4.1.2)
This equation was solved repeatedly to give a. series Of values for 'U'.
Examination, of the resulting values showed that, towards the end of each
experiment, the values of 'U' became extremely variable. The variability of the
results increased as the temperatures of the two fluids came closer together.
Both equations 3.4.1.1 and 3.4.1.2 rely on a subtraction of one temperature from
another. In the first case this is the temperature at the end of the period and the
temperature at the beginning of the period. In the second case this is the
temperature on one side of the wall and the temperature on the other side.
Where one value is being subtracted from another very similar value, any errors
96
associated with the accuracy of the equipment or techniques used will take on
a greater significance than where the two values are further apart. It was
decided therefore to use the first twenty results from each experiment,
discarding the other values.
In the first experiment, where only the floor was involved in heat transfer,
the resulting mean 'U' -value from the first twenty readings was 698 ± 44.5
wm-2K"1.
The second and third experiments were both designed for the same
purpose, i.e. to estimate the 'U'-value of the milk vessei walls, already knowing
the value for the floor.
Equation 3.4.1.1 was again used to calculate the total heat transferred from
the warm water in each period. The heat transferred through the floor of the
milk vessel was then calculated for each period using equation 3.4.1.2 butthis
time substituting the value for 'U' obtained in the first experiment and solving
the equation for Q. The resulting heat transfer through the floor of the vessel
was then subtracted from the total heat transfer to give a value for the heat
transfer through the walls. This value was then substituted into equation 3.4.1.2
and solved for 'U'. The second experiment therefore yielded twenty estimates
of the 'U'-value ofthe milk vessel walls. The mean value was 612 ± 99.5
wm-2K"l.
The third experiment, in which the tank was almost full, yielded a further
20 estimates of the 'U' -value ofthe milk vessel walls. The mean value was 538
W -2K-1 ±98.6 m .
97
The data .from the second and third experiments were examined for
consistency. 'The twenty estimates from experiment 2 and the twenty estimates
from experiment 3 were tested using Student's t-test for unpaired samples, to
test the null hypothesis:
Ho:lll =1.12
The resulting value oft was·0:5273, which was not significant{P>0.7). 'The
conclusion was drawn that the two sets of estimates were not significantly
different and were drawn from the same population. The 'U'-value of the milk
vessel walls may therefore.be represented by the mean of all40 estimates,575 ±
98.2 Wm-2K 1.
3.5 Heat Transfer to the lce~Bank.
AUhis stage the model has simulated the addition of milk to the tank and
its mixing with the bulk of milk already in the tank. It has calculated the
reduction in temperature of the milk in a timestep by cooling across the milk
vessel walls and floor into the chilled water. The amount of heat transferred in
a timestep is given by:
Q = MCp(Tc-Tut)
where Q is the heat transferred in timet;(])
M is the mass of.milk, (kg)
Cp is the specific heat capacity of milk, (Jkg-IK-l)
T-r+I is the milk temperature at the end ofthe timestep, (K)
Tt is the m.ilkteni.perature at the start ofthe tim.estep,(K)
(3.5.1)
The first destination of the heat transferred from the milk is the chilled
water and the effect upon its temperature may be calculated. Within the chilled
water sump, however,is the ice-bank, and as the chilled water gains heatfrom
the milk vessel, some of this heat will. pass to theface of the ice-bank. When the
98
refrigeration process is in operation there will be a temperature gradient
between the evaporator surface at the centre of the ice-bank, and the surface of
the ice-bank. This will cause heat to·flow by conduction from the surface of the
ice-bank to the evaporator, where the refrigeration cycle will remove it to the
external environment. Conduction of heat through the ice-bank during
refrigeration will occur at a different rate to the convective heat transfer from
the liquid chilled water onto the ice face, and this is likely to be a limiting factor
to the rate of heat dissipation from the system. When more heat arrives at the
surface of the ice-bank than is being removed by conduction through the ice, the
net effect will be a melting of ice at the surface. This will increase the mass of
chilled water slightly and also affect its temperature. Melting of the ice will
reduce the radius of the annulus of ice on the evaporator, and consequently
reduce its surface area·. In the reverse situation where more heat is being
removed by conduction than is arriving at the ice-bank surface, there will be a
freezing effect, increasing the mass and surface area of the ice-bank and reducing
that of the chilled water.
Estimation of the changes in the ice-bank dimensions is critical to the
modelling methodol'ogy employed. Operation of the compressor unit is under
the control· of a sensor which switches on the motor as the ice-bank diminishes
in size and switches it off when a pre-set size ·is reached. Cutting out of the
compressor indicates :that the full cooling reserve has been restored. This point
will be reached under normal control conditions at some stage before afternoon
milking commences, and a daily cycle may be regarded as starting at this point.
The full cooling reserve may also be restored at other times during the daily
cycle, for example in the early hours of the morning before the second filling
period commences. If the full cooling reserve is not restored and the
99
refrigeration cycle is still in operation at the start of either filling period then the
ice-bank will further diminish and there is a risk of milk being inadequately
cooled. Ideally this will never happen, unless the tank is being mis-used or the
equipment is,faulty. Nevertheless it was considered important enough to1build
into the model in the form of a warning if calculations revealed the ice-bank
totally melting.
A full cycle of activity commencing with the start of the afternoon milking
would typically follow the following phases.
Phase one is a short ,period between the start of milking and the beginning
of the cooling phase. There will be a short delay before the first milk arrives at
the tank. There will be a further short delay while the milk becomes deep
enough to make contact with the sensor controlling the agitator and pump
motors. When the sensor is able to test the milk temperature, it will switch on
the agitator and chilled water pump if the milk temperature exceeds 4°C. This
point marksthetermination of the first phase. the mode), delays addition of the
milk to the tank at the beginning of the period by one milk pump frequency in
recognition of this phase.
Phase two commences with the agitator and chilled water pump cutting
in. Until this point there is no heat transfer between the two fluids, because the
chilled water is not in contact with the milk vessel'Walls or floor. Milk continues
to arrive at the tank in a pattern which is determined by the frequency of the
milk pump operation and heat is being transferred into the chilled water.
Modelling of the reduction in milk temperature has already been described, and
the change of temperature ofthe chilled water is given,by:
ATc=Q/MCp (3.5.2)
100
where Q is the heat transferred from the milk, U> M is the mass of chilled water, (kg)
Cp is the specific heatcapacity·ofwater, (4214 Jkg-1K"1)
Transfer of heat from the chilled waterto the surface of the ice-bank occurs
by convection, and the.amount of heat transferred in a timestep is given by:
Q = th82ml (35.3j
where t is the timestep, (s)
his the convective heat transfer coefficient, (Wm-2K"1>
9 is the temperature gradient!between the chilled water and the. surface
of the ice-bank, (K)
2ml is the surface area of the ice-bank, (m2)
The convective heat transfer coefficient, h, is approximately 175 Wm-2K-1
for a temperature difference of 1K and an ice-bank diameter of 0!075m.
Appendix I• gives the calculation of the convective heat transfer coefficient from
first principles, but in fact the actual value will vary as the temperature of the
chilled water varies and as the radius of the ice-bank varies, and the model takes
these changes into account as it recalculates the coefficient at each step.
Thus, during the second phase, heat is being transferred from the milk into
the chilled water, with a resulting .rise in temperature. Heat is also being
transferred to the ice face and this heat is not dispersed by the refrigeration
system during this phase, but is dissipated by melting ice. This is because the
compressor motor is not started at the beginning of the cooling period. Most
bulk tanks have a mechanism to control the compressor motor, which allows
approximately a 5% reduction in ice-bank radius before starting up the
compressor. The purpose of this is to prevent short-cycling of the refrigeration
101
system when the tank is empty. Consequently there will be no temperature
gradient from the surface of the ice~bank to the evaporator at its centre, and
therefore no conduction of heat away from the surface of the ice-bank. As a result
all the heat arriving at the surface will be dissipated by melting ice. The
observable effect of this is a reduction in the.radius ofthe annulus ofiee on the
evaporator coil. Knowing the.totallength of the evaporator and the radius at the
beginning of the timestep, the radius at the end of the timestep.is given by:
rut= "(m/-(QIFD1)1t) (3.5.4)
where rt is the radius at the·beginning ofthetimestep, (m)
Q is the thermal energy available for melting, (J)
F is the enthalpy of fusion of ice, (337734 Jkg-1)
D is the density of ice, (920 kgm-3)
I is the length of .the evaporator coil, (m)
As a result of ice melting the mass of chilled water will increase by an
amount given by:
where:
2 2 Mass melted = (mt -1tT:r+t )ID
rt is the radius atthe start of the timestep,(m)
rt+t is the radius at the end of the timestep, (m)
I is the length ofthe evaporator coil, (m)
D is the density of ice, (920 kgm-3)
The resulting chilled water temperature is then given by:
T3 ={MtTI + M2T2)/~M1 + M2)
where Tt is the temperature of the chilled water before melting, (K)
T2 is the temperature of the newly-melted ice, (273K)
102
(3.5.5)
(3.5.6)
M1 is the mass of chilled water before melting, (kg)
M2 is the mass of ice melted, (kg)
The second phase continues in this way, repeatedly taking heat into the
chilled water and using as much of this heat for ice melting as the convective
heat transfer coefficient will allow. This phase ends when the radius of the
ice-bank has been reduced to 95% of its starting level, at which point the
compressor motor starts the refrigeration cycle.
Phase three commences at this point. A temperature gradient now lbuilds
up between the evaporator surface at the centre of the ice"bank and the surface
of the ice-bank. The result is a conduction of heat from the chilled water at the
ice face through the ice to the evaporator, where it is carried off by the
evaporating refrigerant.
The rate of heat flux through an annulus is given by Fourier's:equation:
Q = -kA ~~ (3.5.7)
where k is the thermal conductivity, (Wm-1K'1)
A is the surface area of the annulus, (m2)
~represents the temperature gradient through the annulus (K)
The surface area, A, may be represented by 2ml, giving: dT
Q =-k2mldr
Rearranging gives:
dr = -k21tldT r Q
103
Integrating between the limits of n and 1"2:
Rearranging:
-k21tl loge(I2/TJ) = Q<Tz-Tt)
Q _ -k21tl(T2-T1) - loge(i2/rt:)
where 1"2 is the outer radius of the annulus; (m)
n is the radius of the evaporator pipe, (m)
Tz is the temperature of the evaporator surface, ~K)
T1 is the temperature of the ice surface, (273K)
(3.5.8)
The ice surface, being bathed in water, is assumed' to remain at 0°C.
Knowingthe evaporating temperature and the ice-bank dimensions,the thermal
conductivity at each timestep may be calculated. This process represents the
removal of heat from the system and its rate is unaffected by activities elsewhere
in the system.
The effect.is to remove heat from the chilled water /ice face. Heat will be
arriving at the ice face throughout this phase at a rate determined by the
calculated convective heat transfer coefficient, but heatis now being removed
by conduction. The neteffect.manifests itself. at the ice face. If there is more heat
arriving at the surface than is being removed by conduction, there will be a
melting ofice. The change in mass and temperature ofthe chilled water is again
calculated by equations 3.5.5 and 3.5.6 and the new radius is calculated by
104
equation 3.5;4. If, on the other hand,,the amount of heat being conducted away
fromtheke surface exceeds the 1heat arriving by convection,,then the excess heat
originates in the enthalpy of fusion and there will be a freezing effect. Again,
equations 3.5.4, 3.5.5 and 3.5.6·calculate the variables.
Throughout phase three, the chilled water is still gaining 'heat from the
milk vessel. This phase ends when the milk temperature has been reduced to
4°C and the agitator and chilled waterpump have cut out.
Phase four is the restoration of the ice-bank to its pre-set dimensions,after
the milk has been cooled. During this phase there is no further heat transfer
from the milk, since the chilled water is no •longer in physical contact with the
milk vessel walls. Heat is being conducted to the evaporating refrigerant. The
source of this heat is a further reduction of the chilled water temperature by
convection, and the enthalpy of fusion of ice. As the chilled water temperature
falls towards zero, the convective heat•transfenate will also fall andmostof the
conducted heat wHJI derive from the freezing of water onto the ice face. This
phase ends when the radius of the ice-bank has been restored to its starting level.
Throughout phases three and' four the rate of heat conduction through the
ice to the evaporator, which is given by equation 3.5;8, is dependent upon the
temperature gradient through the ice. The outer surface is assumed to remain
at 0°C, but the inner surface temperature was not known. Experiments were
therefore putin hand to determine this temperature empirically.
105
3.5.1. Experiments/determination of the evaporator surface temperature.
The 2500 litre sump and spray tank previously used for the 'U'-value
experiments was used for the evaporator temperature determination. The milk
vessel was removed to allow access to the chilled water vessel and the
evaporator coils. The internal dimensions of the chilled water vessel were
carefully recorded along with the length and layout of the evaporator coils;
Low thermal• inertia thermocouples were strapped to the surface of the
evaporator coils in three. places. The first point was close·to the point where the
evaporator enters the chilled water sump but below the water surface. The
second point was approximately halfway along the length of the evaporator and
the third point was close to.the point where the evaporator exits from the sump,
but below the water surface. The thermocouples were connected to an analogue
to digital converter in an Apple II computer as in the 'U' -value experiments.
The recommended volume of water (1000 litres) was then added to the
chilled water sump, and the compressor unit connected up. The system was
then started up and allowed to build up an ice-bank. Temperatures were
recorded every 15 minutes until the ice bank sensor cut out the compressor.
Ambient temperature close to the condenser surface was also recorded at the
same interval and by the same method as the evaporator surface temperature.
The experiment was performed a total of four times. On three occasions
the experiment was performed during the daytime with mean ambient
temperatures near the condenser of 17.2, 15:7 and 15.9°C. One experiment was
run during the night in order to observe performance at a lower ambient
temperature and on this occasion the mean ambient temperature was 8.6°C.
106
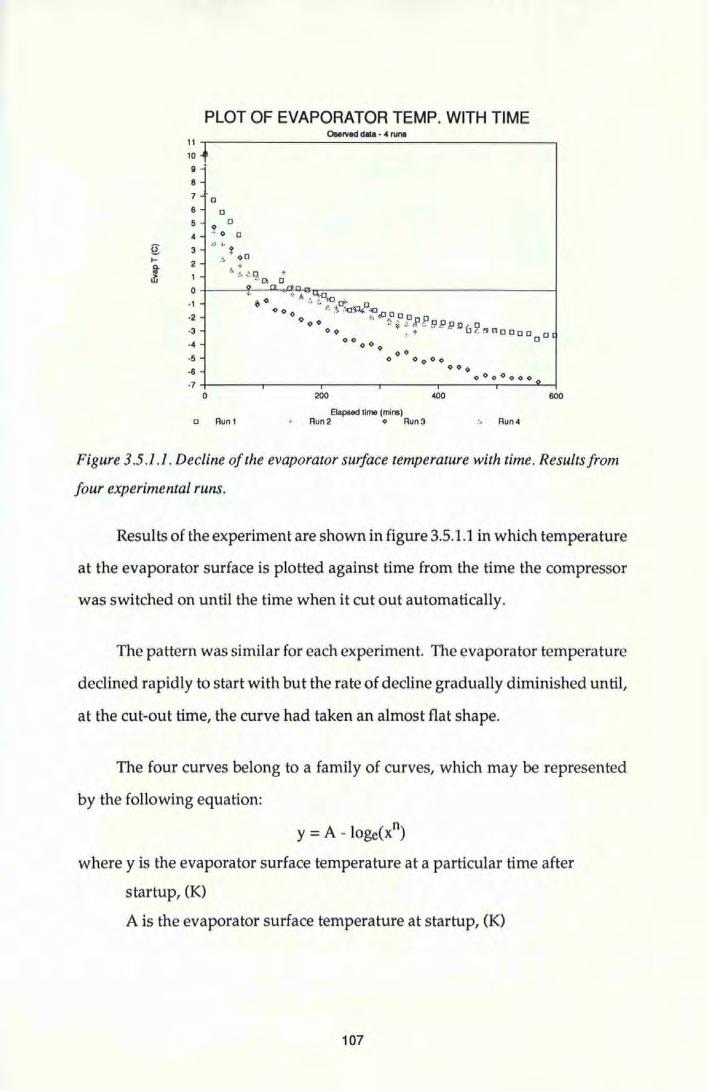
PLOT OF EVAPORATOR TEMP. WITH TIME
11 l 101 9 ~
8
7 [] 6 [] 5 9 D 4 .. 0 []
3 •H· f 2 s oc
~: t.O. +
0 "'- a D.crl-, 1
0
-1
-2
-3
-4
-5
-6
-7 0
o Run1
O&erved data - 4 runs
200 .00
Elapsed time (mina) Run2 o Run3 '' Run4
600
Figure 3.5 .1.1. Decline of the evaporator surface temperature with time. Results from
four experimental runs.
Results of the experiment are shown in figure3.5.1.1 in which temperature
at the evaporator surface is plotted against time from the time the compressor
was switched on until the time when it cut out automatically.
The pattern was similar for each experiment. The evaporator temperature
declined rapidly to start with but the rate of decline gradually diminished until,
at the cut-out time, the curve had taken an almost flat shape.
The four curves belong to a family of curves, which may be represented
by the following equation:
where y is the evaporator surface temperature at a particular time after
startup, (K)
A is the evaporator surface temperature at startup, (K)
107
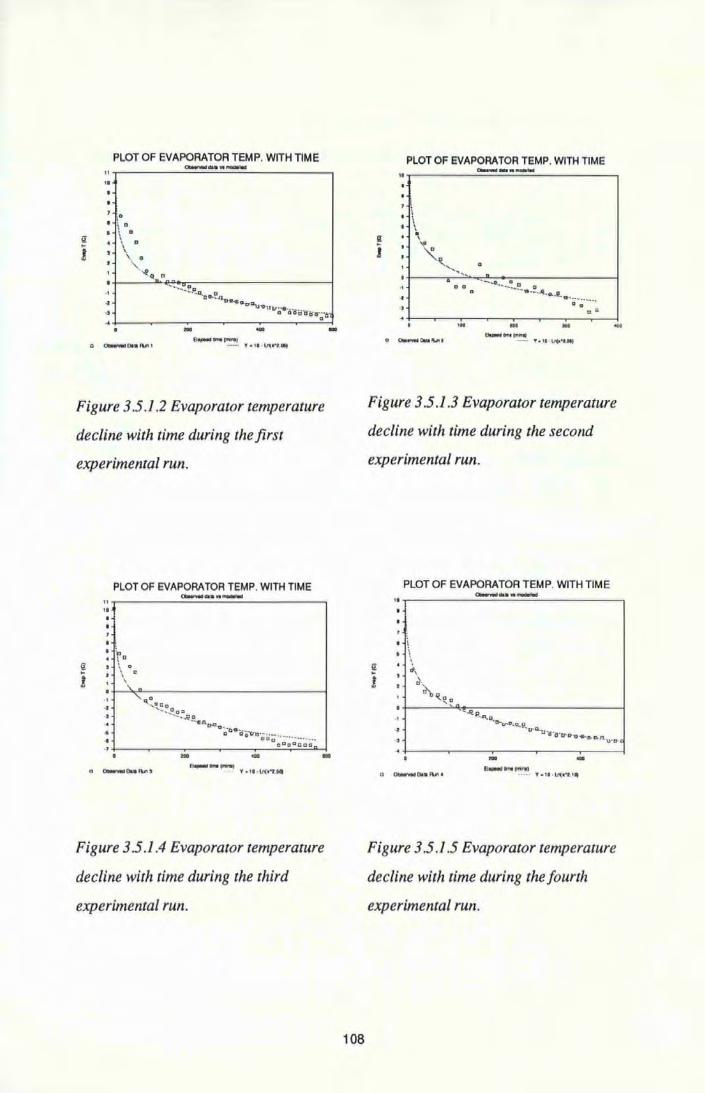
PLOT OF EVAPORATOR TEMP. WITH TIME "...--------==•::.•.:.:."=-=~------. ..
0
t \ a 1 \ a • \ 0
'\ a
•I .. ·•
' · ·~<~ ... •
... -___ , - Y•l l · ll'(•-"t.lit
Figure 3.5 .1.2 Evaporator temperature
decline with time during the first
experimental run.
PLOT OF EVAPORATOR TEMP. WITH TIME
.. I
I
• b • I D
\ 0 0
\
~-... ~
-
... ... -a o..-tOI.a ~s ---.. 'f' • tl · ll'(l.,....
Figure 3.5 .1.4 Evaporator temperature
decline with time during the third
experimental run.
108
PLOT OF EVAPORATOR TEMP. WITH TIME 11 ..,-------=-=:::-=·::-="':...._ ____ ~
. \ I . ~ ' 'I'
0 0 .. - ...... ... ... ~ .. ~ fl
•·- .Jt. o..Q.. ....... ~ .. -.. 0 0
a..... ... ....... - 't'· 1t · VC,.•t.OI)
c .
Figure 3.5 .1.3 Evaporator temperature
decline with time during the second
experimental run.
PLOT OF EVAPORATOR TEMP. WITH TIME ll r-------====•::•.:.:.•:::¥Wm==:..__-----~
l
- -tl or:..rw. 01 .• "" . ---···· · 'f'•tl · lt(rt..l~
Figure 3.5 .1.5 Evaporator temperature
decline with time during the fourth
experimental run.
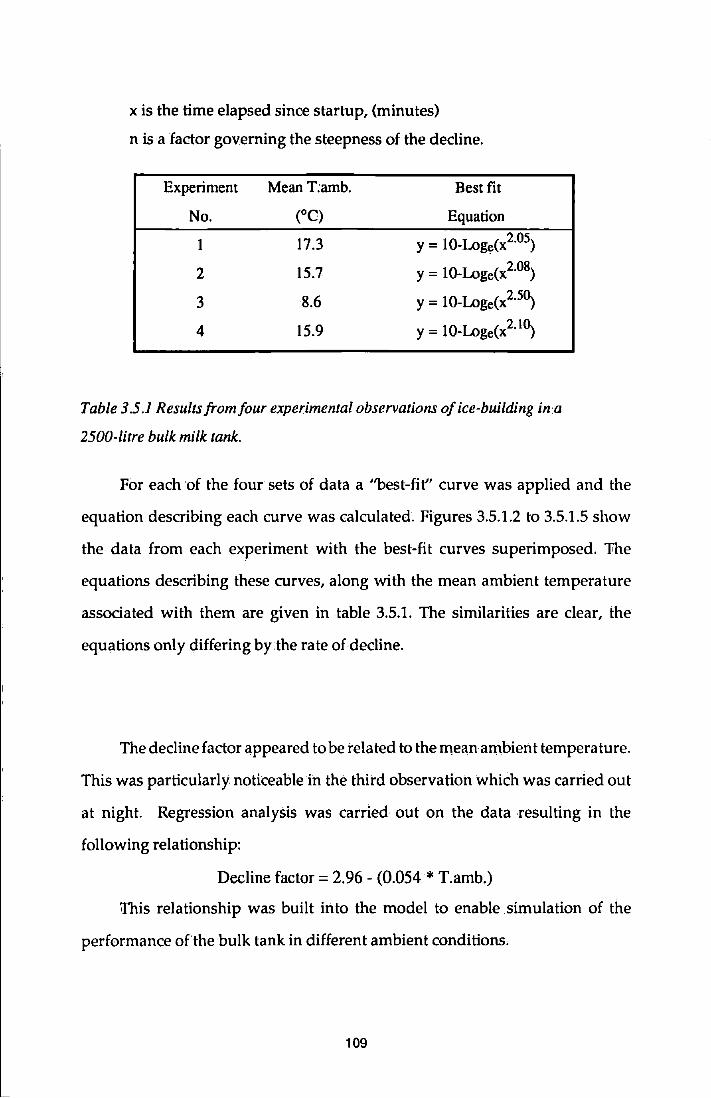
xis the time elapsed since startup, (minutes)
n is a factor governing the steepness of the decline.
Experiment Mean T:arnb. Best fit
No. (OC) Equation
1 17.3 y = 10-Loge(x2.05)
2 15.7 y = 10-Loge(x2.08)
3 8.6 y = 10-Loge(x2· 5~
4 15.9 y = 10-Loge(x2.1~
Table 3.5 .1 Results from four experimental observations of ice-building in a
2500-litre bulk milk tank.
For each of the four sets of data a "best-fit'' curve was applied and the
equation describing each curve was calculated. Figures3.5.1.2 to 3.5.1.5 show
the data from each experiment with the best-fit curves superimposed. 'Fhe
equations describing these curves, along with the mean ambient temperature
associated with them are given in table 3.5.1. '!he similarities are clear, the
equations only differing by .the rate ofdecline.
The decline factor appeared to be related to the mean ambient temperature.
This was particularly noticeable in the third observation which was carried out
at night. Regression analysis was carried out on the data resulting in the
following relationship:
Decline factor= 2.96- (0.054 * T.amb.)
This relationship was built into the model to enable simulation of the
performance of the bulk tank in different ambient conditions.
109
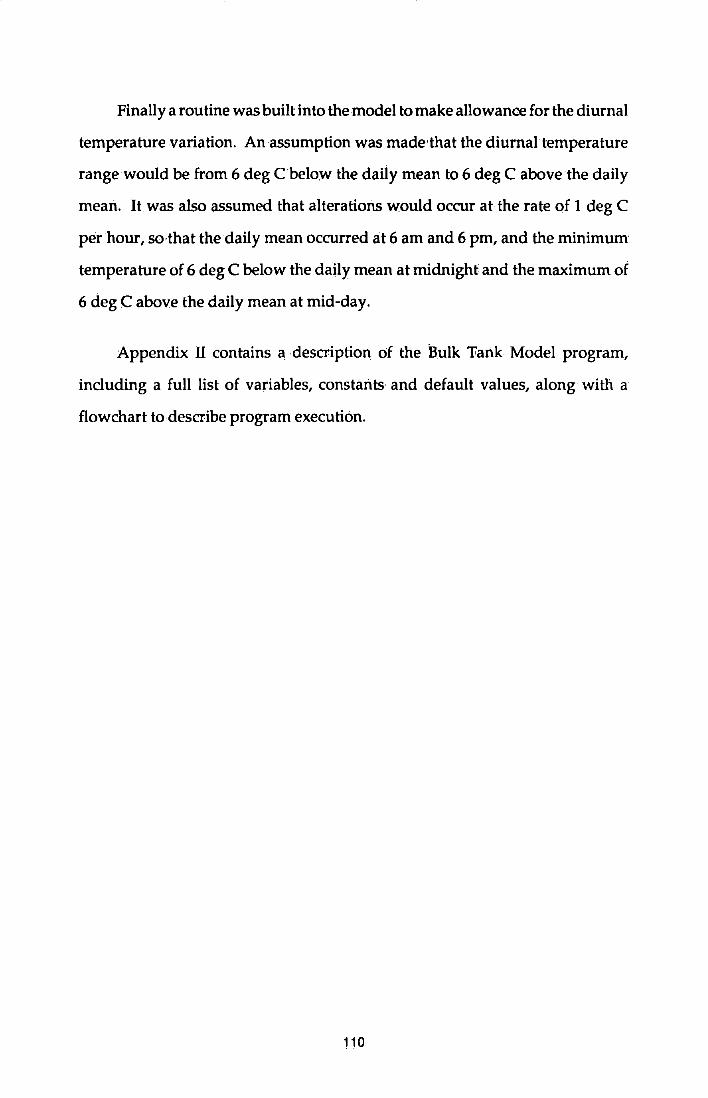
Finally a routine was built into the model to make allowance for the diurnal
temperature variation. An assumption was made 'that the diurnal temperature
range would be from 6 deg Cbelow the daily mean to 6 deg C above the daily
mean. It was also assumed that alterations would occur at the rate of 1 deg C
per hour, so·that the daily mean occurred at 6 am and 6 pm, and the minimum
temperature of 6 deg C below the daily mean at midnight and the maximum of
6 deg C above the daily mean at mid-day.
Appendix ll contains a description of the Bulk 'Fank Model program,
including a full list of variables, constants and default values, along with a
flowchart to describe program .execution.
110
The model validation was carried out in four stages. The limits to the
model's applicability were determined. The model's sensitivity to variations in
the values ascribed to the various parameters was examined with a view to
determining the relative significance of these parameters. The output from the
model was compared with a·simulation using a new 2500 litre tank in laboratory
conditions. Finally the output of the model was compared with a relevant
sample of data from the energy audit of dairy farms .in South Devon.
4.1 Limitations of the Model.
The model, as written, simulates the performance of a sump and spray
tank. It is not directly applicable to a fully jacketed .tank, nor is it applicable to a
direct expansion tank. A direct expansion tank, as. has been noted earlier,
operates on a fundamentally different principle, and modelling of this type of
tank would require a radically different approach. Fully jacketed tanks differ in
thatthe milk vessel is submerged in the surnp of chilled water andtherefore•heat
transfer from the milk to.the chilled water can occur by natural convection, even
when the agitation process is not in.operation. Some fully jacketed tanks·ha ve a
·different geometry, being semi~cylindrical in shape.
The model is designed to stop running and produce a warning message if
the ice-bankis reduced to zero. In practice a tank would not cease its operation
in these circumstances. The compressor would continue·running, removing heat
111
from the1liquid chilled water medium by direct expansion. This would continue
until the heat arrivingatthe evaporator surface was less than that being removed
by evaporation of the refrigerant, at which time ice would begin to accumulate
again. J:his is a serious situation since it would be likely to result in inadequate
cooling of the milk, and would only be caused by either a malfunction of the
equipment, incorrect setting of the controls or misuse of the tank. The model
suggested that the tank could operate at its full milk capacity at mean daily
temperatures of up to 16°C before there was a risk of the ice-bank becoming
exhausted. At this mean daily temperature, a peak temperature of 22°C would
be simulated at noon. During the first year of the audit, mean weekly
temperatures of l6°C or more were only reached during five weeks,of the year.
Under these simulation conditions the model suggested a total compressor
running time in a full24-hour cycle of 17.9 hours. The potential for improvement
in performance is suggested by the fact that the remaining 6.1 hourswere in the
middle of the night and the early hours of the morning when the ambient
temperature is atits lowest.
The model has been developed to simulate a 2500 litre sump and spray
tank. Tanks of the same operating principles whose geometry is of the same
standard design and whose dimensions were proportionately altered could also
be simulated by the model. The internal dimensions of the milk vessel would
need to·be known as would the length of the·evaporator coil.
The model assumes thatthe tank will not be mis-used in respect of its filling
pattern. The tank is designed to receive its load of milk in two fillings, the first
being 40% of the daily capacity and the second the remaining 60%. Similarly the
starting time of the am milking is assumed to.be 14 hours and'30 minutes, being
60% of a full day, after the starting time of the pm milking. These ratios and the
112
actual starting times can all be varied ·but serious misuse of the tank cannot be
simulated because exhaustion ofthe ice-bank will abort the program.
4.2 Sensitivity Analysis.
The model's sensitivity was examined in respect of the following
parameters:
• The 'U' -value of the milk vessel walls and floor.
o The evaporator surface temperature.
• l"he tank filling pattern.
o The milk delivery temperature.
In order to achieve true comparability ofresults from successive runs of
the model, a number of default values for the major variables were built in.
These values were used unless specifically changed for a particular run.
The default values used were:
Tank Size in litres 2500
Floor Area in square metres 2.9925
Maximum Wall Area in square metres 5.38
Mass of Chilled Water in kg 1000
700
'U'-value of walls in Wm-2K-I 550
113
Ice-bank radius in metres 0.0375
Evaporator length in metres 92.964
Daily milk volume in litres 2500
Start time of pm milking 16:00
Start time of am milking 06:30
No. of milking units 6
Milk Deliverytemperature in °C 32;5
4,2.1 The 'U'-va/ue of the milk vessel. walls and floor.
The 'U' -values were determined empirically(section 3.4.1) and as such had
to rely on a number ofassumptions relating to the heat transfer process. 'The
values determined were 700 wm-21<""1 and 550 wm-21<""1 for the floor and walls
respectively. The model was run with all the default values in operation,
including the two 'U' -values, and an average ambient temperature of 1 ooc. The
model was then run with 'U'-values 10% higher than the default values at an
ambient temperature of 10°C and also with the 'U' -values 10% lower than the
default values at the same ambient temperature. The whole process was
repeated .for an ambient temperature of 5°C. In each case the total compressor
running time in a complete 24-hour cycle was noted and the milk cooling time
in minutes following the end of the filling period was also noted. The results
are presented in Table 4.2.1.
114
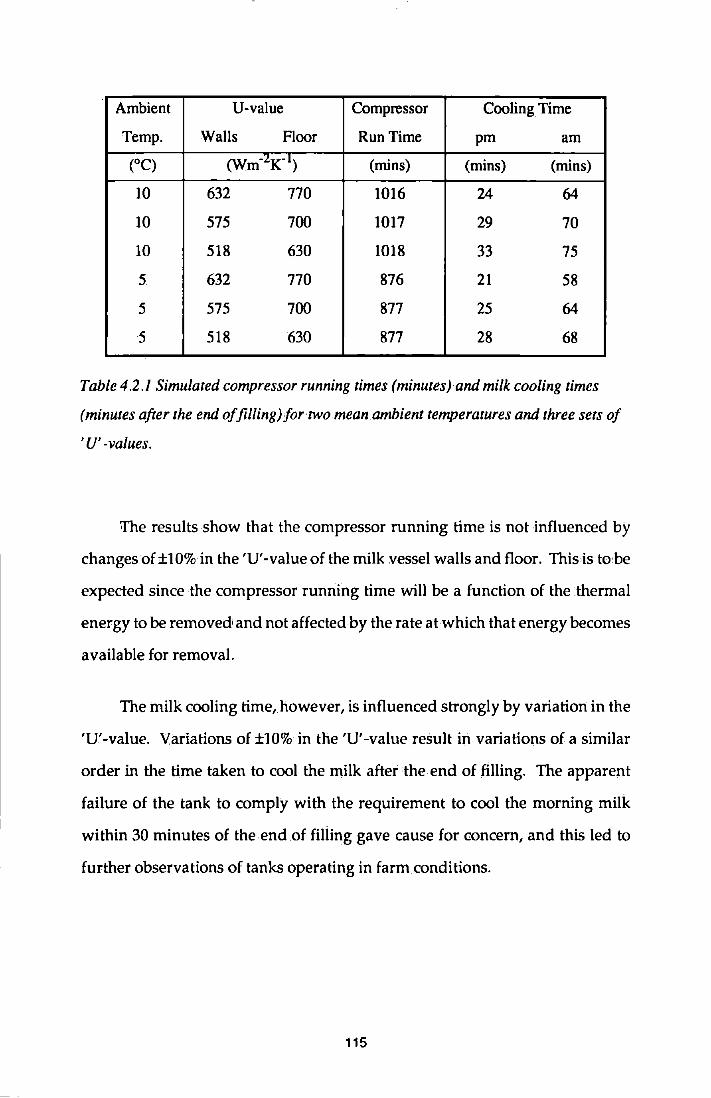
Ambient U-value Compressor Cooling Time
Temp. Walls Floor Run Time pm am
(OC) (Wm-ZK-1) (mins) (mins) (mins)
10 632 770 1016 24 64
10 575 700 1017 29 70
10 518 630 1018 33 75
5 632 770 876 21 58
5 575 700 877 25 64
5 518 630 877 28 68
Table 4.2.1 Simulated compressor running times (minutes) and milk cooling times
(minutes after the end of filling) for two mean ambient temperatures and three sets of
'U' -values.
The results show that the compressor running time is not influenced by
changesof±10%in the 'U'-value of the milk vessel walls and floor. This,is to1be
expected since the compressor running time will be a function of the .thermal
energy to be removed' and not affected by the rate at which that energy becomes
available for removal.
The milk cooling time, however, is influenced strongly by variation in the
'U' -value. Variations of ±1 0% in the 'U' -value result in variations of a similar
order in the time taken to cool the milk after the end of filling. The apparent
failure of the tank to comply with the requirement to cool the morning milk
within 30 minutes of the .end .of filiing gave cause for concern, and this led to
further observations of tanks operating in farm conditions.
115
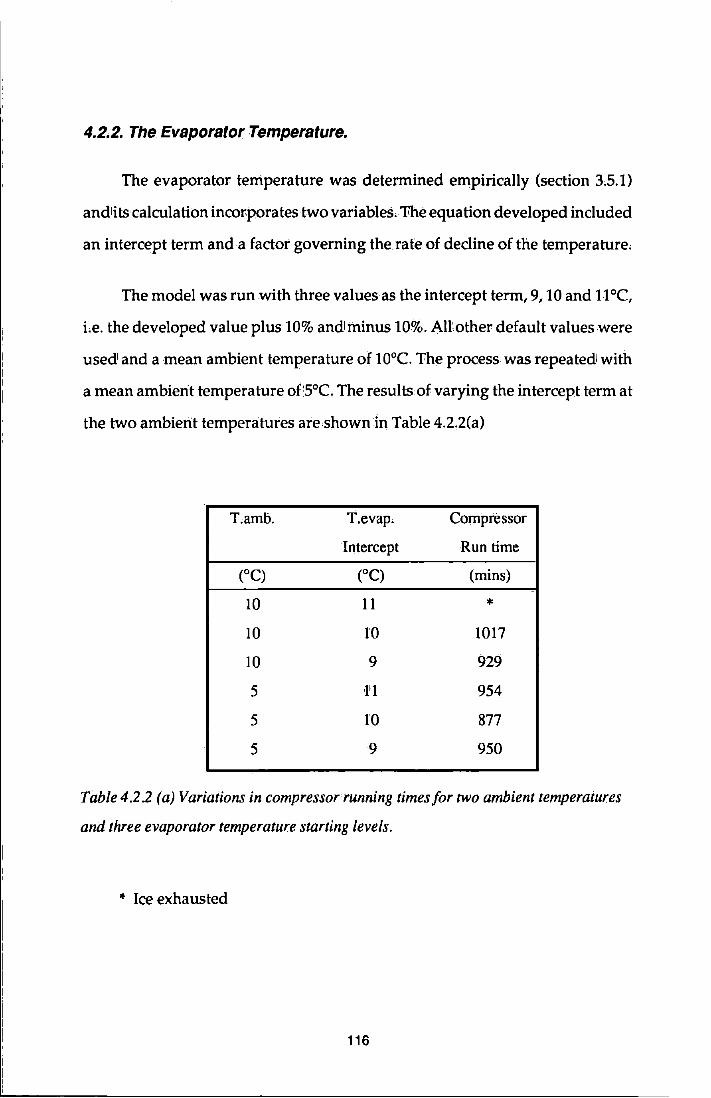
4.2.2. The Evaporator Temperature.
The evaporator temperature was determined empirically (section 35.1)
andlits calculation incor-porates two variables, 'The equation developed included
an intercept term and a factor governing the rate of decline of the temperature,
The model was run with three values as the intercept term, 9,10 and l1°C,
Le. the developed value plus 10% andlni.inus 10%. All: other default values were
used and a mean ambient temperature of 10°C. 'fhe process was repeated! with
a mean ambient temperature of'5°C. The results of varying the intercept term at
the two ambient temperatures are shown in Table 4.2.2(a)
T,amb. T.evap. Compressor
Intercept Run time
ec> ec> (ruins)
10 11 * 10 TO 1017
10 9 929
5 ·111 954
5 lO 877
5 9 950
Table4.22 (a) Variations in compressorrunning times for two ambient temperatures
and three evaporator temperature starting levels.
"" Ice exhausted
1.16
At an ambient temperature of woe, increasing the intercept term from
woe to noe resulted in the tank failing when the ice-bank was completely
exhausted shortly after the end of the morning filling period, with the milk
temperature still at 7.2°C. The previous evening's milk had been cooled 32
minutes after the end of the filling period, compared with 29 minutes for the
standard run. Reduction of the intercept term from woe to 9°e resulted in the
total compressor running time in a 24-hour cycle being reduced from 1017
minutes to 929 minutes, a reduction of 8:65%.
The three runs were repeated at an ambient temperature of 5°C. Increasing
the intercept term to 11 oe increased the compressor running time from 877
minutes to 954 minutes, an increase of 8.9%. With an intercept term of 9°e, the
compressor running time was 950 minutes compared with 877 minutes for the
standard run with an intercept of 1 ooc. This increase in the running time, against
an expected decrease is accounted for by the pattern of the compressor's activity.
During the standard run for an ambient temperature of 5°e the compressor
would have only a single period of inoperation during the 24-hour cycle. This
would occur during the night, from01:05 when the ice-bank had been restored
fromthe evening milking until39minutes after the start of the morning milking.
Following the morning milking the compressor would run throughout the
daytime period and by the start of the afternoon filling period would still be
running with the ice-bank a little short of the target radius. The most significant
aspect of this is that the evaporatortemperature was already at a very low level
at the start of afternoon milking, much lower than .if the compressor had just
switched on. The effect of this is to remove, by conduction, much more heat
during the filling period than would be the case if the compressor had cut out
before the start of the filling period. Removal of more heat by conduction means
117
that less heat is accounted for by melting of ice. Consequently, although the
radius was not fully restored at the start of filling, it then reduced at a much
lower rate than otherwise, and there was still sufficient ice to cool the milk
without running out.
However, when the intercept term was reduced to 9°C, the system, as
expected, achieved its objectives rather quicker. 'The effect of this was·that during
the daytime period the compressor was able to restore the ice-bank to the target
radius before the start of afternoon milking and then cut out. When the arrival
of the afternoon milk started the compressor up again the evaporator
temperature had to start descending again from the intercept value, In practice
it seems reasonable to expect a certain amount of time at the beginning of a
running period to be devoted to reducing the temperature of the evaporantand
its associated pipeworkto a1level at which a working temperaturegradientexists
between the evaporant and the ice"bank. This overhead will exist for each time
the compressor starts·up and is illustrated in the example of these two intercept
terms which are just sufficiently different to result in an extra start up during
the 24-hour cycle for the lower value.
The second term in the calculation of the evaporator surface temperature
is the rate of decline from the,initial starting temperature. As with the intercept
terrn,the model was run with ambient temperatures of 10°C and soc and decline
rates increased and decreased by 10% in each case. AU.other default values were
used. The results are summarised in Table 4.1.2(b).
At an ambient temperature of 1 ooc the ice-bank was again exhausted when
the evaporator temperature decline rate was reduced. Increasing the decline rate
118
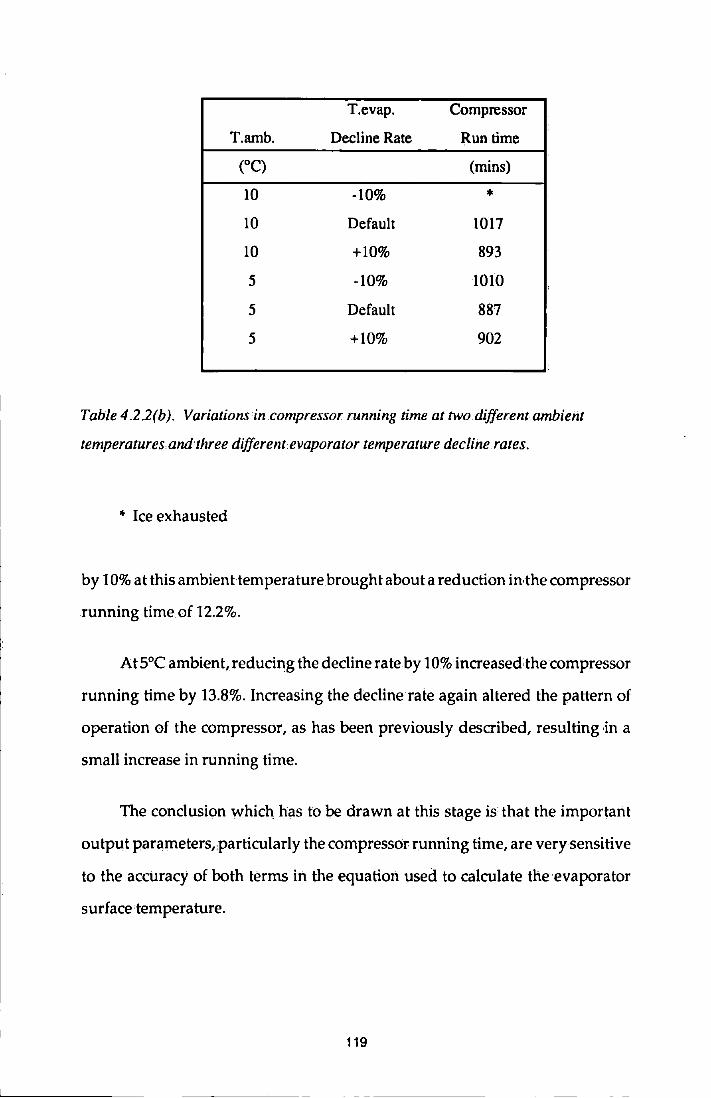
T.evap. Compressor
T.amb. Decline Rate Run time
(oC) (mins)
10 -10% * 10 Default 1017
10 +10% 893
5 -10% 1010
5 Default 887
5 +10% 902
Table 4.2 2(b ). Variations in .compressor running time at two.different ambient
temperatures. and three different evaporator temperature decline rates.
* Ice exhausted
by 10% at this ambient temperature brought about a reduction iMhe compressor
running time of 12.2%.
At 5°C ambient, reducing the decline rate by 10% increased:the compressor
running time by 13.8%. Increasing the decline rate again altered the pattern of
operation of the compressor, as has been previously described, resulting in a
small increase in running time.
The conclusion which has to be drawn at this stage is that the important
output parameters,,particularly the compressor running time, are very sensitive
to the accuracy of both terms in the equation used to calculate the evaporator
surface·temperature.
119
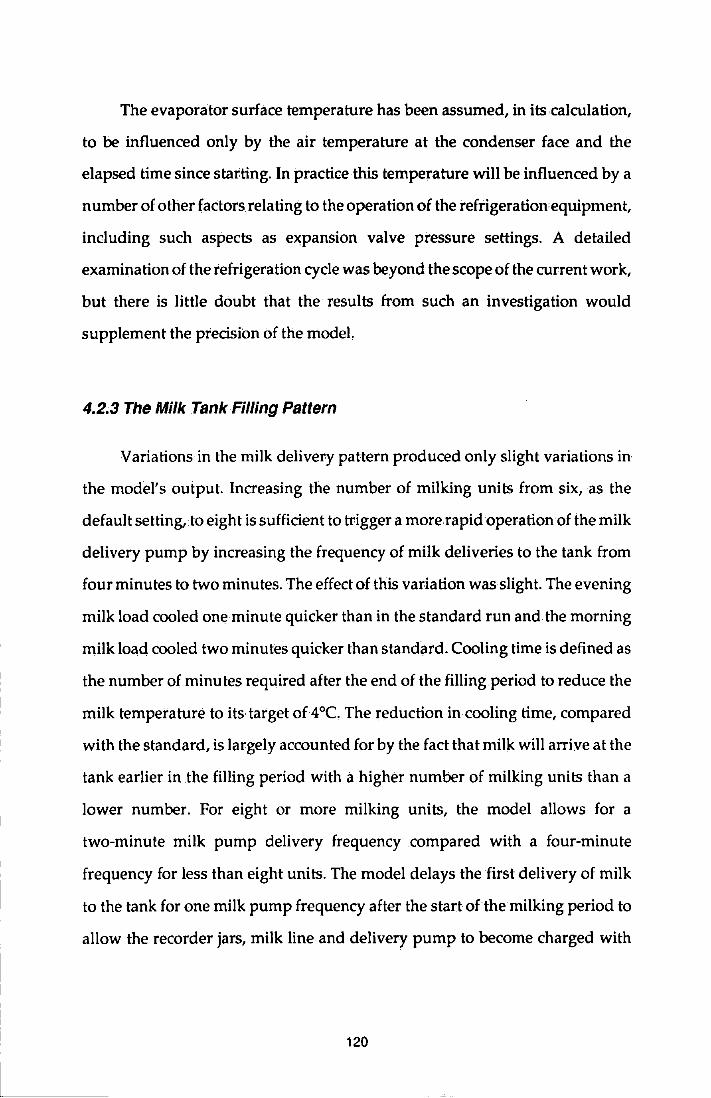
The evaporator surface temperature has been assumed, in its.calculation,
to be influenced only by the air temperature at the condenser face and the
elapsed time since starting. In practice this temperature will be influenced by a
number of other factors relating to the operation of the refrigerationequipment,
including such aspects as expansion valve pressure settings. A detailed
examination of the refrigeration cycle was beyond the scope of the current work,
but there is little doubt that the results ·from such an investigation would
supplement the precision of the model.
4.2.3 The Milk Tank Filling Pattern
Variations in the milk delivery pattern produced only slight variations in
the model's output. Increasing the number of milking units from six, as the
default setting, to eight is sufficient to trigger a more rapid operation of the milk
delivery pump by increasing the frequency of milk deliveries to the tank from
four minutes to two minutes. The effect of this variation was slight. The evening
milk load cooled one minute quicker than in the standard run and the morning
milk load cooled two minutes quicker than standard. Cooling time is defined as
the number of minutes required after the end of the filling period to reduce the
milk temperature to its target of4°C. The reduction in cooling time, compared
with the standard, is largely accounted for by the fact that milk will arrive at the
tank earlier in the filling period with a higher number of milking units than a
lower number. For eight or more milking units, the model allows for a
two-minute milk pump delivery frequency compared with a four-minute
frequency for less than eight units. The model delays the first delivery of milk
to the tank for one milk pump frequency after the start ofthe milking period to
allow the recorder jars, milk line and delivery pump to become charged with
120
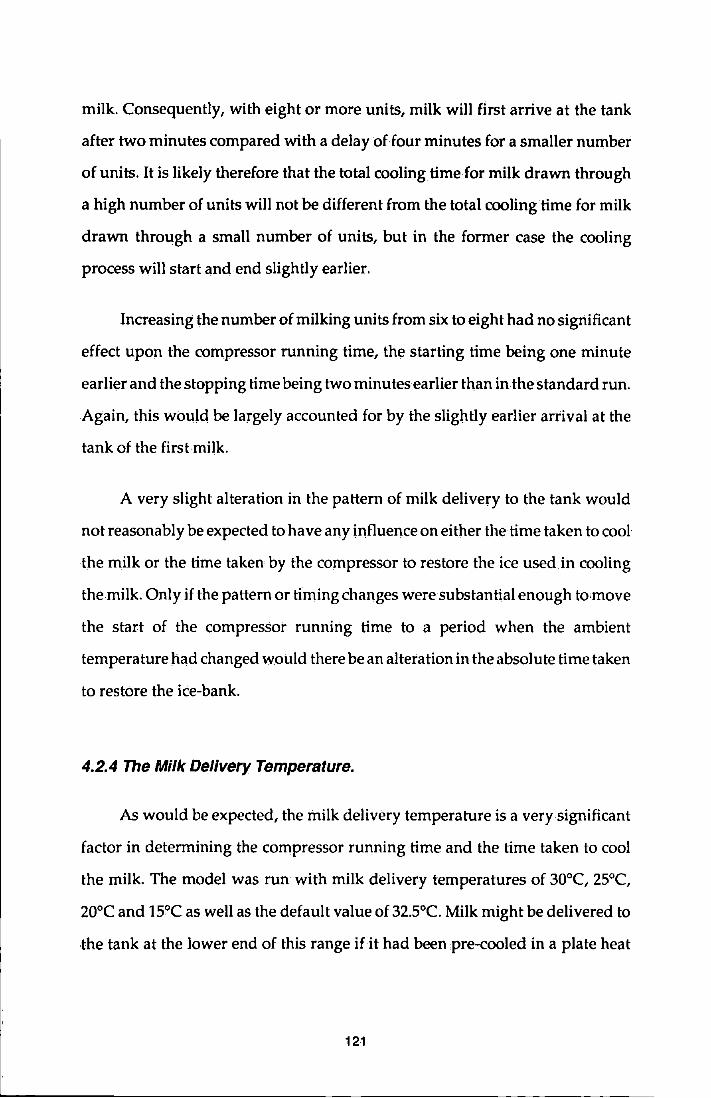
milk. Consequently, with eight or more units, milk will first arrive at the tank
after two minutes compared with a delay offour minutes for a smaller number
of units. It is likely therefore that the total cooling time for milk drawn through
a high number of units will not be different from the total cooling time for milk
drawn through a small number of units, but in the former case the cooling
process will start and end slightly earlier.
Increasing the number of milking units from six to eight had no significant
effect upon the compressor running time, the starting time being one minute
earlier and the stopping time being two minutes earlier than in the standard run.
Again, this would be largely accounted for by the slightly earlier arrival at the
tank of the first milk.
A very slight alteration in the pattern of milk delivery to the tank would
not reasonably be expected to have any influence on either the time taken to cool
the milk or the time taken by the compressor to restore the ice used in cooling
the milk. Only if the pattern or timing changes were substantial enough to move
the start of the compressor running time to a period when the ambient
temperature had changed would there be an alteration in the absolute time taken
to restore the iCe-bank.
4.2.4 The Milk Delivery Temperature.
As would be expected, the milk delivery temperature is a very significant
factor in determining the compressor running time and the time taken to cool
the milk. The model was run with milk delivery temperatures of 30°C, 25°C,
20°C and 15°C as well as the default value of 32.5°C. Milk might be delivered to
·the tank at the lower end of this range if it had been pre-cooled in a plate heat
121
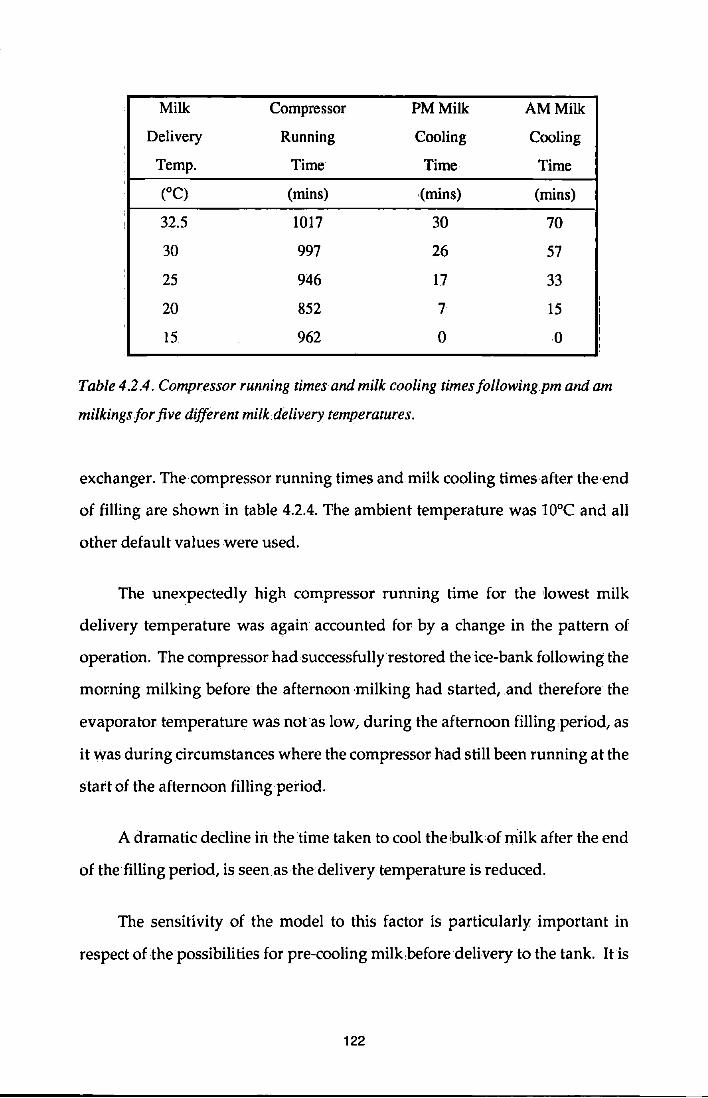
Milk Compressor PM Milk AM Milk
Delivery Running Cooling Cooling
Temp. Time Time Time
(OC) (mins) (mins) (mins) : ! 32.5 1017 30 70
30 997 26 57
25 946 17 33 ' 20 852 7 15 I I
I
15 962 0 0 I
' '
Table 4.2.4. Compressor running times and milk cooling times following pm and am
milkingsfor five different milk delivery temperatures.
exchanger. The·compressor running times and milk cooling times after the:end
of filling are shown in table 4.2.4. The ambient temperature was 10°C and .all
other default values were used.
The unexpectedly high compressor running time for the 'lowest milk
delivery temperature was again accounted for by a change in the pattern of
operation. The compressor had successfully restored the ice-bank following the
morning milking before the afternoon milking had started, and therefore the
evaporator temperature was not as low, during the afternoon filling period, as
it was during circumstances where the compressor had still been running at the
start of the afternoon filling period.
A dramatic decline in the time taken to cool the bulk of milk after the end
of the filling period, is seen as the delivery temperature is reduced.
The sensitivity of the model to this factor is particularly important in
respect ofthe possibilities for pre-cooling milk before delivery to the tank. It is
122
noticeable that the reduction in running time does not appear to bear a linear
relationship to the milk delivery temperature.
4.3 Comparison with Laboratory Simulation.
The 2500 litre bulk milk tank used in previous experiments was set up in
the laboratory to simulate normal use, as closely as was practicably possible.
The tank was fitted with low thermal inertia thermocouples, as before, to
measure the bulk milk temperature, the sump chilled water temperature, the
evaporator surface temperature and the air temperature in the region of the
condenser. The thermocouples were connected to the analogue to digital!
converterin the Apple Il computer as in previous experiments. Recordings were
taken at one minute intervals.
During the simulation warm water was used in place of milk and the tank's
automatic controls were in operation.
4.3, 1 Simulation Details and Results.
Commencing at 17:30, 1013litres of warm water was pumped into;the tank
over an approximately two-hour period. The quantity and timing were
intended to represent typical conditions for an evening milking where the tank
was to be filled to the limit of its capacity over a 2~hour cycle at a relatively high
ambient temperature.
The water was added intermittently over the period, at approximately
ten-minute intervals. A more frequent delivery of smaller volumes would have
been preferable butthis was not possible with the equipment used for generating
and delivering the warmed water. A total of 11 additions of warm water were
123
made, of average duration 42 seconds. Temperatures of the water at the point
of delivery into the tank were recorded by means of the hand-held digital
thermometer. As many recordings of delivery temperature as were possible
during each delivery period were taken and the mean temperature for each
delivery calculated. The mean for all the milk delivered was derived as a
weighted mean of the temperature of each delivery, making allowances for the
different masses of water involved. The mean delivery temperature was 35.5°C.
The diameter of the ice-bank was measured with calipers at five-minute
intervals in two locations, the mean:of the two being accepted asi:epresentative.
The diameter at the start of the process was 0:077m.
An events log was maintained to record the operational times of the
agitator and compressor, and an electricity meter was fitted into the supply to
the tank.
The agitator cut in very quickly after the first addition to the tank and
continued to run throughout the filling period. The compressor cut in at 18:05,
35 minutes after the start of the process,
At 19:30, the end of the filling period, the milk temperature had been
reduced to 10.7"C, and 30 minutes later it had, only been reduced to 8.1 °C. The
tank thus failed by a considerable margin to comply with the requirements for
rapid cooling after filling.
At 20:20the tank had completely run out of ice, but it had been noted some
35 minutes earlier that some turns of the evaporator coil were bare. The
exhaustion of ice was undoubtedly the reason for the agitator running for a
period of 3 hours and 4 minutes after the end of the filling period before cutting
124
out, The milk had, in fact, been overcooled by this stage, having been cooled
down to 3.6°C, and 'had reached the target of 4°C 25minutes,earlier.
The mean air temperature at the condenser face was 19°C The chilled
water temperature at the'beginning of the process was 3°C.
The model was then run using the following values:
Mean Ambient Temperature
Milk Delivery Temperature 35.5°C
Starting Radius of Icecbank 0:0385m
Daily Milk Volume 25001
Start of PM milking 17:30
Chilled Water Temperature at start
The model correctly predicted that the tank would fail to ·cool its 'milk'
load and that it would exhaust its ice-bank soon after the completion of the filling
period. Table 4'.3(a) compares the predicted values from the model with the
observed data from the simulationin the laboratory.
The milk temperatures generally were,higher than those predicted by the
model, as can. be seen in figure 4.3(a). However the trends were relatively similar.
Both patterns have a similar saw-tooth appearance, the inclines immediately
following an addition of warm 'milk' to the tank and the declines being the
125
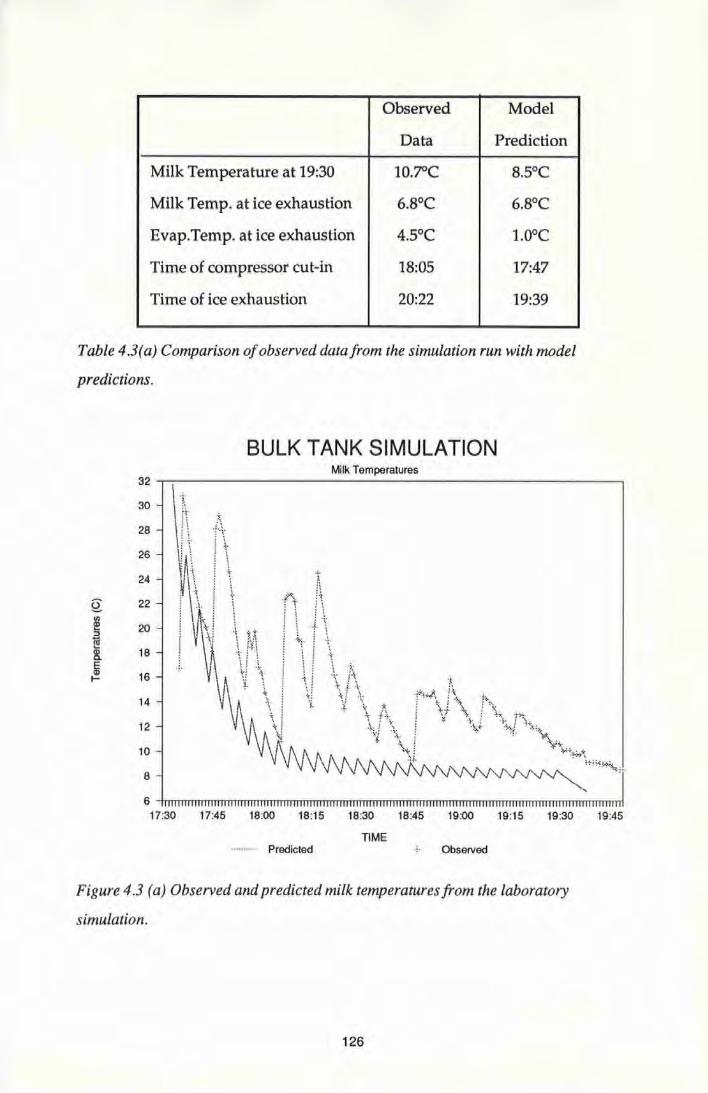
Observed Model
Data Prediction
Milk Temperature at 19:30 10.7'C 8.5°C
Milk Temp. at ice exhaustion 6.8°C 6.8°C
Evap.Temp. at ice exhaustion 4.5°C 1.0°C
Time of compressor cut-in 18:05 17:47
Time of ice exhaustion 20:22 19:39
Table 4.3(a) Comparison of observed data from the simulation run with model
predictions.
BULK TANK SIMULATION Milk Temperatures
32
30
28
26
24
§: 22 fl)
!!! 20 :I
~ ~ 18
~ 1- 16
14
12
10
8
17:30 17:45 18:00 18:15 18:30 18:45 19:00 19:15 19:30 19:45
TIME - Predicted Observed
Figure 4.3 (a) Observed and predicted milk temperatures from the laboratory
simulation.
126
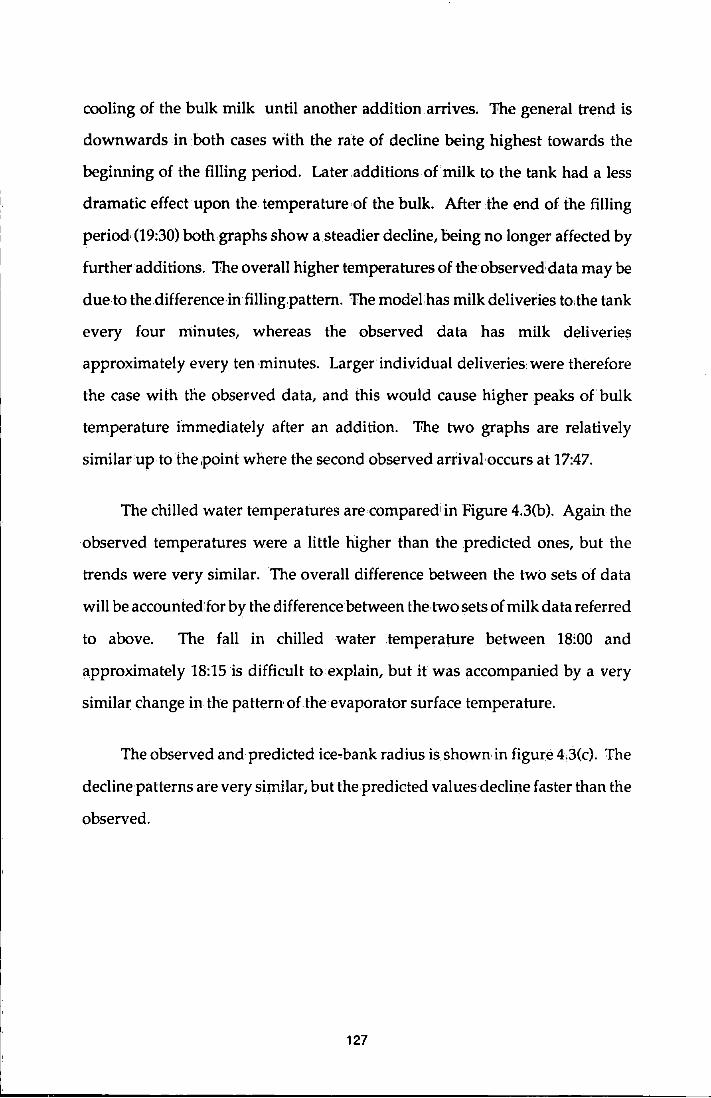
cooling of the bulk milk until another addition .arrives. "The general trend is
downwards in both cases with the rate of decline being highest towards the
beginning of the filling period. Later additions of milk to the tank had a less
dramatic effect upon the temperature of the bulk. After the end of the filling
period (19:30) both graphs show a steadier decline, being no longer affected 1by
further additions. "The overall higher temperatures of the observed-data may be
due to the difference in filling pattern. The model has milk deliveries to,thetank
every four minutes, whereas the observed data has milk .deliveries
approximately every ten minutes. Larger individual deliveries were therefore
the case with the observed data, and this would cause higher .peaks of bulk
temperature immediately after an addition. "The two graphs are relatively
similar up to the point where the second observed arrival· occurs at 17:47.
The chilled water temperatures are compared in Figure 4.3(b). Again the
observed temperatures were a little higher than the predicted ones, but the
trends were very similar. The overall difference between the two sets of data
will be accounted for by the difference between the,two sets of milk data referred
to above. The fall in chilled water .temperature between 18:00 and
approximately 18:15 is difficult to explain, but it was accompanied by a very
similar change in the pattern of the evaporator surface temperature.
The observed and predicted ice" bank radius is shown in figure 4.3(c). The
decline patterns are very similar, but the predicted values decline faster than the
observed.
127
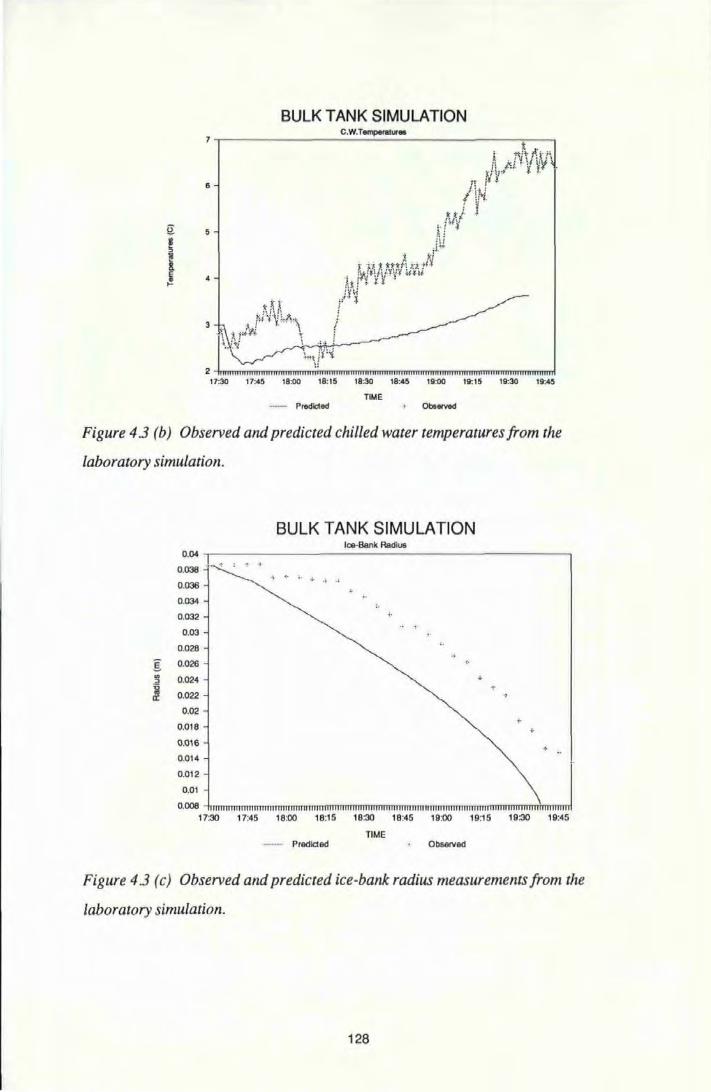
e: I !5
l E ~
BULK TANK SIMULATION
17:30 17:45 18:00 18:15 18:30 18:45 19:00 19:15 19:30 19-..45
TIME - Predlc;ted
Figure 4.3 (b) Observed and predicted chilled water temperatures from the
laboratory simulation.
0.04
0.038
0.036
0.034
0.032
0.03
0.028
§: 0.026 .,
0.024 ::>
~ 0.022 a: 0.02
0.018
0.0\6
0.014
0.0\2
0.01
0.008 17:30
BULK TANK SIMULATION lOB-Bank Radius
:. .,
+
nmnnrrnmrrmtttlltttlltitttttttlrrnflttttttrnrtllttttnntttntmnmmm'mTilnmTmmmmmrrimmmml
17:45 18:00 18:15 18:30 18:45 19:00 19:15 19:30 19:45
TIME -- Predlded Observed
Figure 4.3 (c) Observed and predicted ice-bank radius measurements from the
laboratory simulation.
128
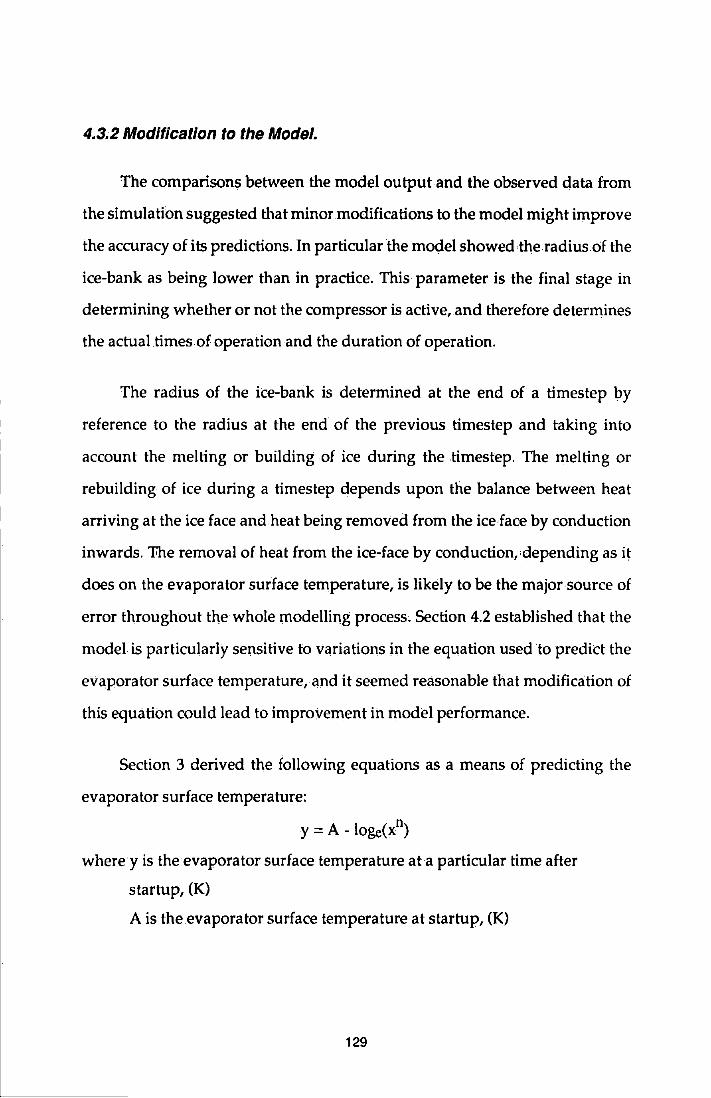
4.3.2 Modification to the Model.
The comparisons between the model output and the observed data from
the simulation suggested that minor modifications to the model might improve
the accuracy of its predictions. In particular the model showed the radius of the
ice-bank as being lower than in practice. This parameter is the final stage in
determining whether or not the compressor is active, and therefore determines
the actual times of operation and the duration of operation.
The radius of the ice-bank is determined at the end of a timestep by
reference to the radius at the end of the previous timestep and taking into
account the melting or building of ice during the timestep. The melting or
rebuilding of ice during a timestep depends upon the balance between heat
arriving at the ice face and heat being removed from the ice face by conduction
inwards. 'The removal of heat from the ice-face by conduction,;depending as it
does on the evaporator surface temperature, is likely to be the major source of
error throughout the whole modelling process, Section 4.2 established that the
model is particularly sensitive to variations in the equation used to predict the
evaporator surface temperature, and it seemed reasonable that modification of
this equation could lead to improvement in model performance.
Section 3 derived the following equations as a means of predicting the
evaporator surface temperature:
y = A - loge(x0)
where y is the evaporator surface temperature at a particular time after
startup, (K)
A is the evaporator surface temperature at startup, (K)
129
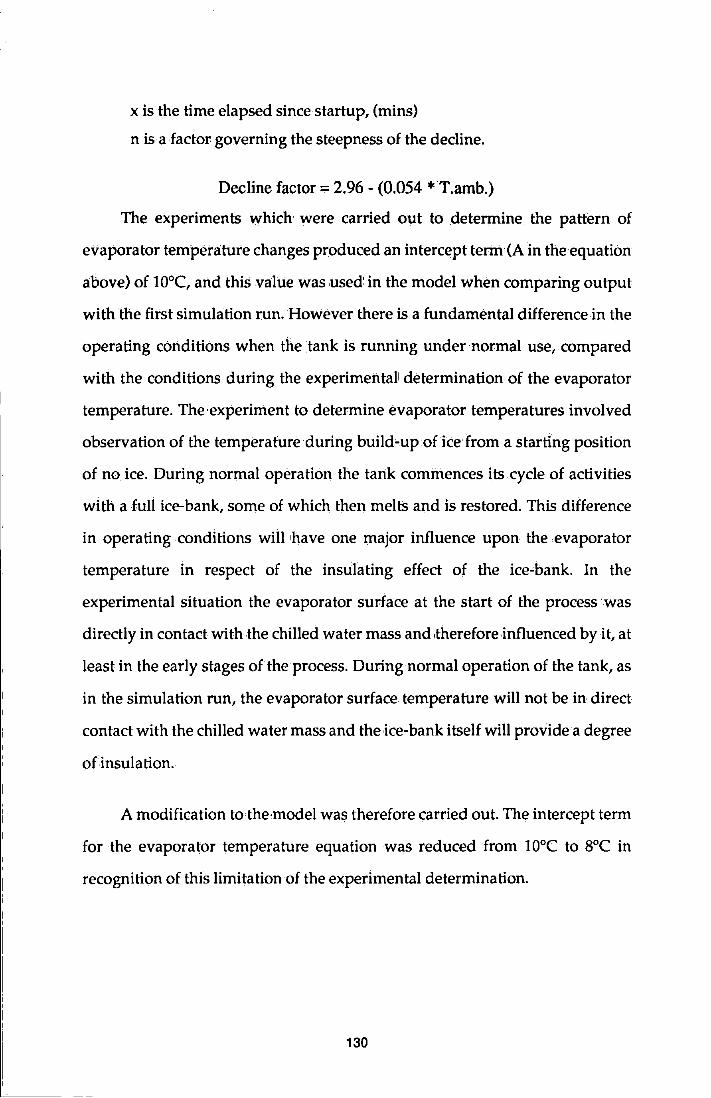
x is the time elapsed since startup, (mins)
n is a factor governing the steepness of the decline.
Decline factor= 2.96- (0.054 *T.amb.)
The experiments which were carried out to determine the pattern of
evaporator temperature changes produced an intercept tenn (Ain the equation
above) of W°C, and this value was used in the model when comparing output
with the first simulation run. However there is a fundamental difference .in the
operating conditions when the tank is running under normal use, compared
with the conditions during the experimeli.tall determination of the evaporator
temperature. The·experiment to determine evaporator temperatures involved
observation of the temperature during build•up ofice from a starting position
of no ice. During normal operation the tank commences its cycle of activities
with a full ice-bank, some of which then melts and is restored. This difference
in operating conditions will have one major influence upon the evaporator
temperature in respect of the insulating effect of the ice•bank. In the
experimental situation the evaporator surface at the start of the process ·was
directly in contact with the chilled water mass and .therefore.influenced by it, at
least in the early stages of the process. During normal operation of the tank, as
in the simulation run, the evaporator surface temperature will not be in direct
contact with the chilled water mass and the ice-bank itself will provide a degree
of.insulation.
A modification to,the~model was therefore carried out. The interceptterm
for the evaporator temperature equation was reduced from woe to 8°C in
recognition of this limitation of the experimental determination.
130
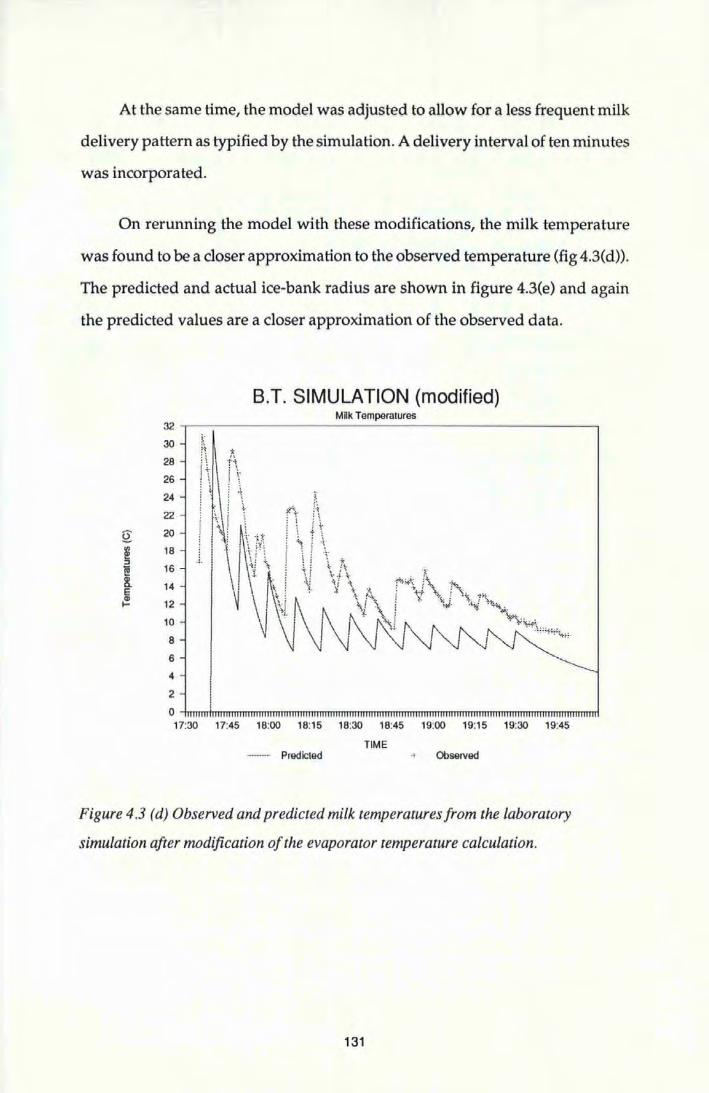
At the same time, the model was adjusted to allow for a less frequent milk
delivery pattern as typified by the simulation. A delivery interval of ten minutes
was incorporated.
On rerunning the model with these modifications, the milk temperature
was found to be a closer approximation to the observed temperature (fig 4.3(d)).
The predicted and actual ice-bank radius are shown in figure 4.3(e) and again
the predicted values are a closer approximation of the observed data.
B.T. SIMULATION (modified) Mnk Temperatures
32
30
28
26
24
22
£ 20
e 18 ::J
~ 16
8. 14 E ~ 12
10
8
6
4
2
o~~nmm=rnmm=mm~mm~mmm=mmm=mmm=mmm=mmm=mm~rnm~~
17:30 17:45 18:00 18:15 18:30 18:45 19:00 19:15 19:30 19:45
TIME - Predicted ·• Observed
Figure 4 3 (d) Observed and predicted milk temperatures from the laboratory
simulation after modification of the evaporator temperature calculation.
131
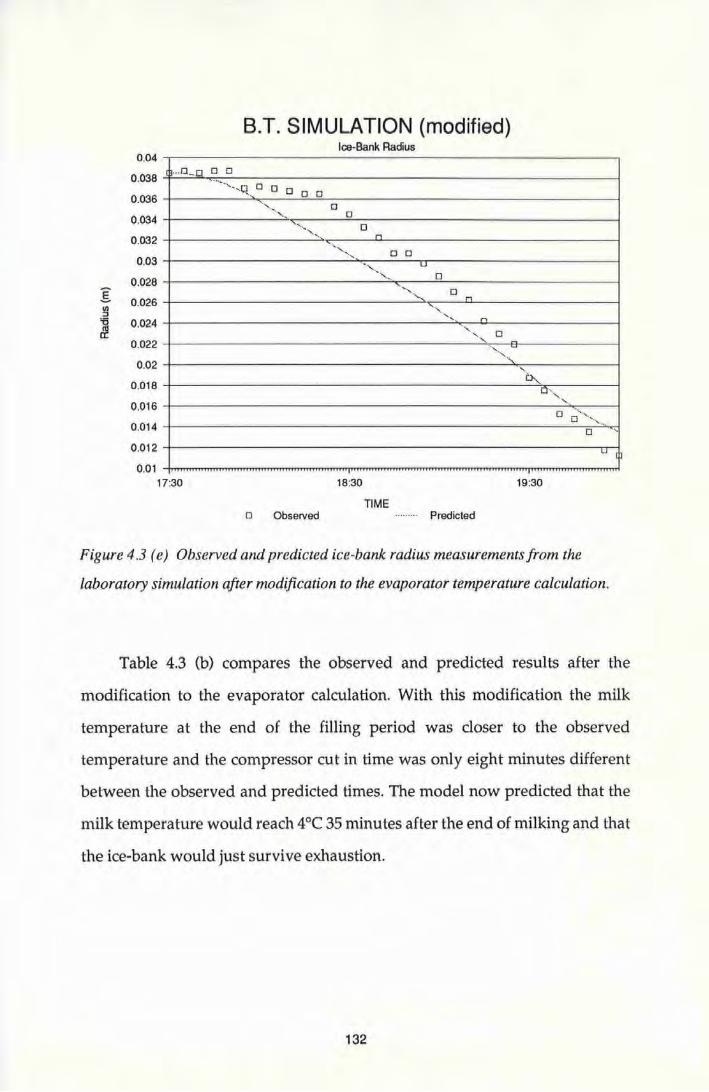
I ~ '6 12
0.04
0.038 ... a _0 o o
0.036
0.034
0.032
0.03
0.028
0.026
0.024
0.022
0.02
0.018
0.016
0.014
B.T. SIMULATION (modified) Ice-Bank Radius
0 M
·-,-., . 0 0
·-,~ u , _ 0
.,, 0
'
0
0.012 4-------------------------rr--lu
0. 0 1 -hn-TTTTnTTTTnTTTTTTTTTTTTTTTTTTTTTTTTTTTTM.,.,.,.,.,TTTTTT~TTTTMTTTTMTTTTMTTTTMTTTTM.,.,.,.,.,mTrrmTrr~~~TTTTTTTTTTnTTTTTT...j
17:30 18:30 19:30
TIME o Observed Predicted
Figure 4.3 (e) Observed and predicted ice-bank radius measurements from the
laboratory simulation after modification to the evaporator temperature calculation.
Table 4.3 (b) compares the observed and predicted results after the
modification to the evaporator calculation. With this modification the milk
temperature at the end of the filling period was closer to the observed
temperature and the compressor cut in time was only eight minutes different
between the observed and predicted times. The model now predicted that the
milk temperature would reach 4°C 35 minutes after the end of milking and that
the ice-bank would jus t survive exhaustion.
132
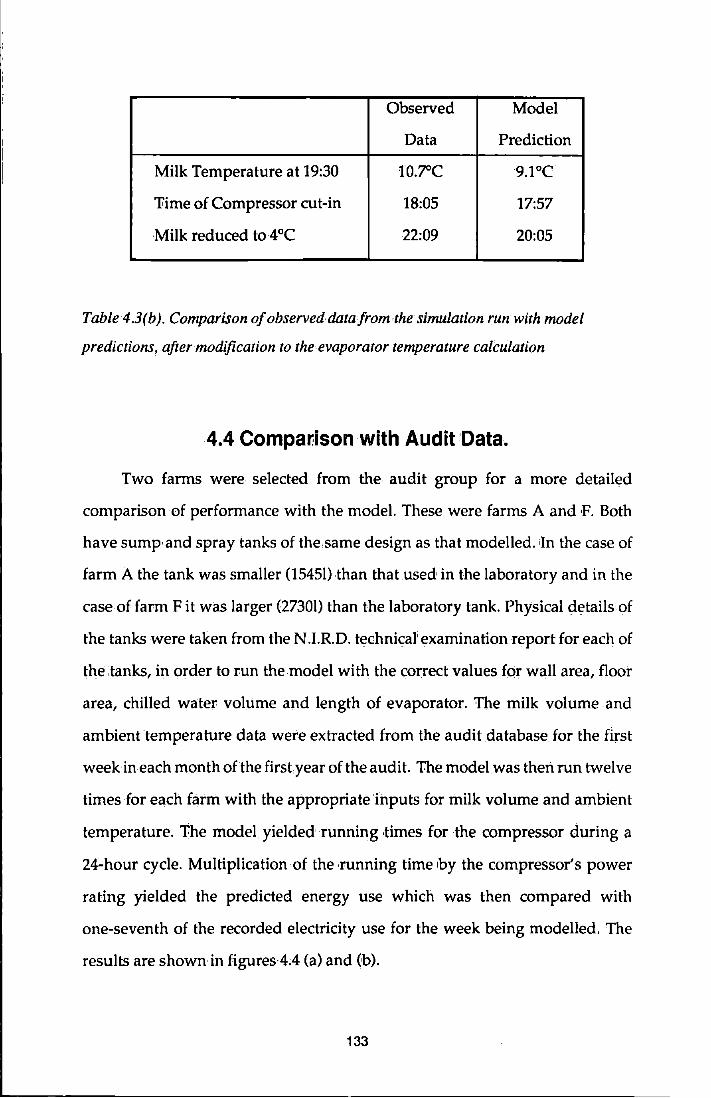
Observed Model
Data Prediction
Milk Temperature at 19:30 l0.7"C 9.1°C
'Fime of Compressor cut-in 18:05 17:57
Milk reduced to4°C 22:09 20:05
Table 4 .3( b). Comparison of observed data from ·the simulation run with model
predictions, after modification to the evaporator temperature calculation
4.4 Comparison with Audit ~Data.
Two farms were selected from the audit group for a more detailed
comparison of performance with the model. These were farms A and E Both
have sump· and spray tanks of the same design as that modelled. 'In the case of
farm A the tank was smaller (15451) than that used in the laboratory and in the
case.of farm Fit was larger (27301) than the laboratory tank. Physical details of
the tanks were taken from theN .I.R.D. technical' examination report for.each of
the .tanks, in order to run the model with the correct values for wall area, floor
area, chilled water volume and length of evaporator. The milk volume and
ambient temperature data were extracted from the audit database for the first
week in each month of the firstyear of the audit. The model was theri. run twelve
times for each farm with the appropriate inputs for milk volume and ambient
temperature. 'Fhe model yielded running Hmes for the compressor during a
24-hour cycle. Multiplication of the running time by the compressor's power
rating yielded the predicted energy use which was then compared with
one-seventh of the recorded electricity use for the week being modelled. The
results are shown in figures 4;4 (a) and ~b).
133
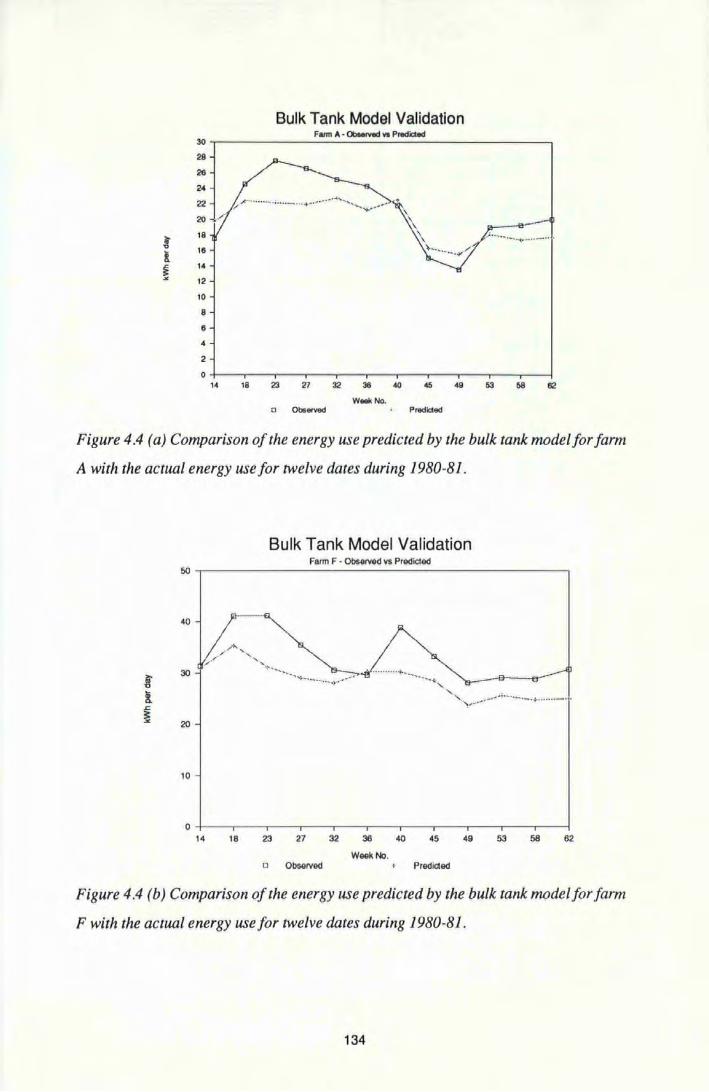
Bulk Tank Model Validation Fann A - ObM<ved Y1 Predicted
~~------------------------------------~ 28
26
24
22
18
16
14
12
10
8
6
4
2
14 18 23 27 32 36 40 45 49 53 !;11 62
Weel<No. Predicted
Figure 4.4 (a) Comparison of the energy use predicted by the bulk tank model for farm
A with the actual energy use for twelve dates during 1980-81.
Bulk Tank Model Validation Farm F - ObsGived vs Predicted
00 ~-----------------------------------------,
40
30
20
10
_,./,_,, ' , .,. ________ ;.... _____ ___ ,..~--· "1!1··········-+--., _____ ._
' '-, . ..,__ ... --···-··---........... -· .
0 +---~--~--~--------~--~--~--~---.---;
14 18 23 27 32 36 40 45 49 53 58 62
Week No. D Observed + Predicted
Figure 4.4 (b) Comparison of the energy use predicted by the bulk tank mode/for farm
F with the actual energy use for twelve dates during 1980-81 .
134
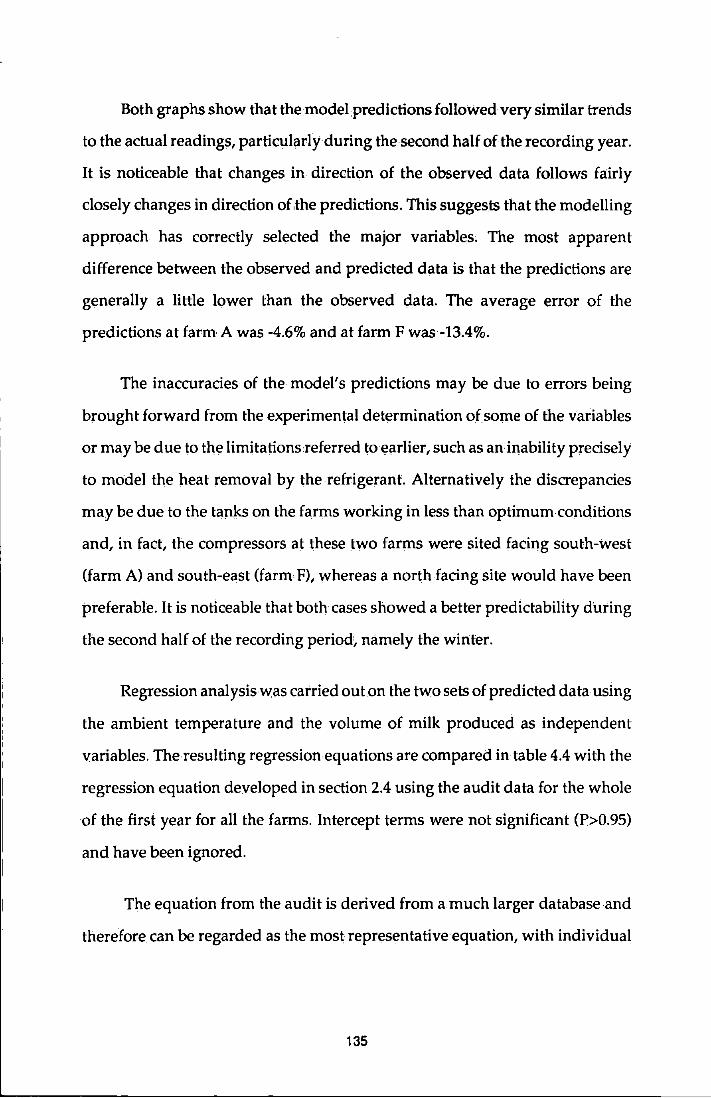
Both graphs show that the model predictions followed very similar trends
to the actual readings, particularly during the second half of the recording year.
It is noticeable that changes in direction of the observed data follows fairly
closely changes in direction of,the predictions. This suggests that the modelling
approach has correctly selected the major variables. The most apparent
difference between the observed and predicted data is that the predictions are
generally a little lower than the observed data. The average error of the
predictions at farm A was -4.6% and at farm F was -13.4%.
The inaccuracies of the model's predictions may be due to errors being
brought forward from the experimental determination ofsome of the variables
or may be due to the limitations referred to earlier, such as an inability precisely
to model the heat removal by the refrigerant. Alternatively the discrepancies
may be due to the tanks on the farms working in less than optimumconditions
and, in fact, the compressors at these two farms were sited facing south-west
(farm A) and south-east (farm F), whereas a north facing site would have been
preferable. It is noticeable that both cases showed a better predictability during
the second half of the recording period~ mi.mely the winter.
Regression analysis was carried outon the two sets of predicted data using
the ambient temperature and the volume of milk produced as independent
variables. The resulting regression equations are compared in table 4.4 with the
regression equation developed in section 2.4 using the audit data for the whole
of the first year for all the farms. Intercept terms were not significant (P>0.95)
and have been ignored.
The equation from the audit is derived from a much larger database and
therefore can be regarded as the most representative equation, with individual
135
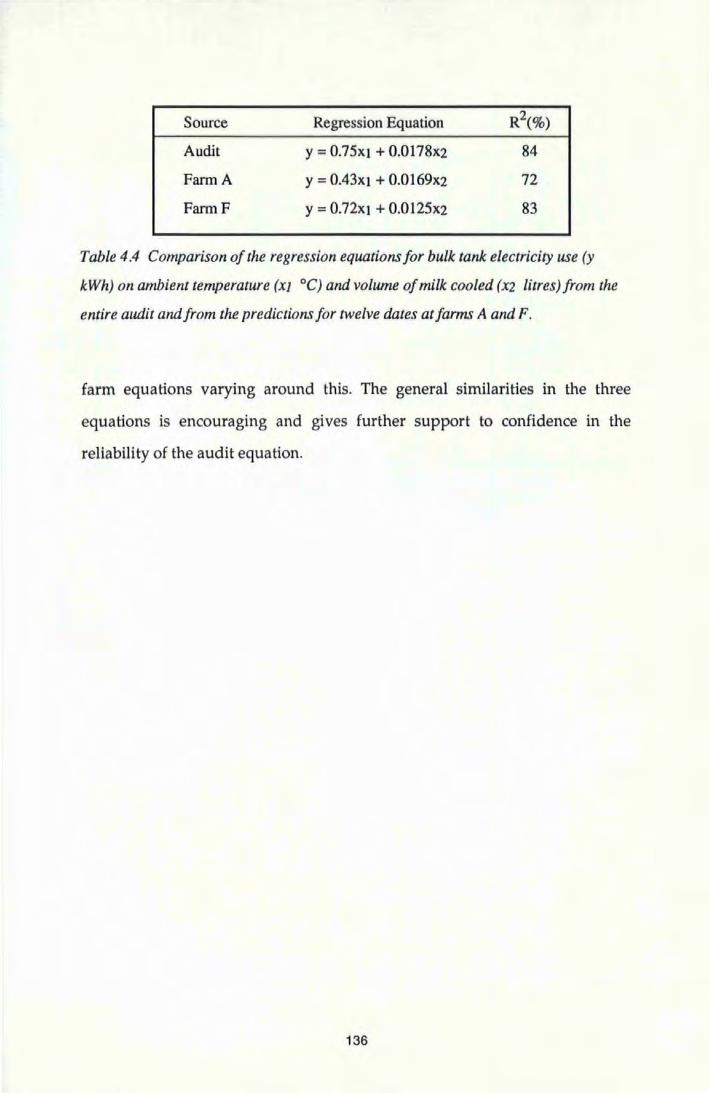
Source Regression Equation R2(%)
Audit y = 0.75XI + 0.0178X2 84
FannA y = 0.43XI + 0.0169X2 72
FannF y = 0.72xi + 0.0125x2 83
Table 4.4 Comparison of the regression equations for bulk tank electricity use (y
kWh) on ambient temperature (xJ °C) and volume of milk cooled (X2 litres) from the
entire audit and from the predictions for twelve dates at farms A and F.
farm equations varying around this. The general similarities in the three
equations is encouraging and gives further support to confidence in the
reliability of the audit equation.
136
5. D~SCUSS~ON
5.1 Justification for farmers' concern
This research project commenced partly as a response to fariners'
expressed concern about the level' and cost of their electrical energy use. It
followed a period when ,purchased energy had been subjected to dramatic price
rises at a time when dairy farming had been under severe economic pressures
.for other reasons. Farmers wishing to expand their herds were looking for ways
to keep the growth.oftheir energy bills under control. Conservation equipment
of various types was becoming available and claims for their potential appeared
to be largely anecdotal. Annual electricity bills approaching £1000 were being
faced by herds of only a little more than average size and future energy prices
were becoming very difficult to predict
The literature provided little clarification of any significance either in
respect of typical levels of use, factors affecting variation in levels of use or the
effect of conservation equipment. The long term prognostication for energy
prices appeared gloomy.
In the light.of these points itis not surprising that farmers were becoming
concerned. Nor is it surprising. that some of the more adventurous farmers were
prepared to make investments in equipment whose return on capital invested
could not be reliably assessed.
137
5.2 Typical Levels and Ranges of Use.
It must first be pointed out that electricity costs are, and are likely to
remain, a relatively small proportion of the total costs of milk production.
Accepting the audit figure of approximately 50 kWh/m3, the electricity cost at
typical mid 1980s prices is approximately 0.25 pence/litreor less than 2%of the
farm-gate value of the milk from non ChanneHsland herds.
The scale of operation on a typical dairy farm is such that this relatively
small proportion of the total is likely to amount to several hundred pounds per
annumeven.for a small herd. The audit produced a figure of 250 kWh per cow
which, again at mid 1980s prices, represents approximately £12.50 per cow. A
herd of 80 cows, considered as only a small to medium sized herd today, would
therefore face an annual expenditure of £1000 on electricity in the dairy and
parlour alone, The largest farm in the survey, with over 200 cows, will have
incurred costs of around £2500 per year in the early 1980s, assuming standard
tariff arrangements. Approximately £1000 of this will have been solely
attributable to cooling milk.
The audit suggested a figure of 250 kWh/cow/year as being a typical
energy use. This was lower than previous estimates, but reasons for confidence
in the audit have been expressed. A figure as low as 204 kWh/cow/year was
achieved by one farm without conservation equipment. This figure was
undoubtedly attained as a result of the exceptional level of care taken by the
owner who was also the only person on the farm to do the milking. In the second
year of the audit an even loWer figure of 200 kWh/ cow /year was achieved by
another farm, also a small family farm without conservation equipment.
138
Laudable though these achievements are, they may be regarded as a reasonable
target for most farms if care is exercised.
A lower target might still be possible without recourse to conservation
equipment. A figure of 186 kWh/ cow I annum was calculated as the theoretical
optimum for the .farms examined.
Atthe other extreme, a figure of 357 kWh/ cow was recorded by the worst
farm in the first year of the audit. This figure was produced by a conscientious
farmer who made changes to his plant cleaning,practice, following advice, with
dramatic improvements in the second year. This example serves.to illustrate the
fact that electricity consumption of 40% above average may be achieved in all
innocence by conscientious personnel unaware of deficiencies in their methods.
It would not be unreasonable to assume that thei:e is a large number of dairy
farms in the country in a similar position. It is unfortunate that most dairy
farmers will.be unable to extract the cost of electricity for their dairy and parlour
from their total electricity consumption since most farms will have a single
supply and meter.
Farmers with little degree of concern or badly malfunctioning equipment
can probably expect figures higher than any of those experienced in the audit
and there must·be in existence some farmers who are unknowingly consuming
over 400 kWh/cow/year. These herds will be incurring costs of over
£2.0/cow /year or twice the target suggested as possible by the performance of
the leading herds in the audit.
139
5.3 Factors affecting Levels and Cost of Use.
The use of electrical energy in the farm dairy, and the cost of this energy
are influenced by four major groups of factors:
• Political
• Environmental
• Technical
• Managerial
5,3, 1 Political Factors.
Political influence is seen at many stages from the effect upon milk
production levels and patterns, through to the cost of electrical energy used to
produce that milk.
The Milk Marketing Boards determine the wholesale price of milk. Many
considerations govern the·determination of price; principal among these is the
need to balance supply and demand. An all year round level milk price would
Iead to a glut of liquid milk in the summer and a relative shortage during the
winter. l!his is because summer milk can be produced from grass at a lower
nutritional cost than winter produced milk. The Boards therefore operate a
seasonal variation in milk price to encourage some farmers to produce winter
milk from autumn calving herds. Manipulation of the seasonal milk price
differential will have a great influence upon the farmer's choice of calving
pattern. Variation of energy use as a result of seasonality of production is likely
140
to have a lesser influence upon the farmer's management policy than will the
seasonal price differential.
There·is not necessarily a direct relationship between the electrical energy
used and the cost of this energy. The electricity supply industry are keen to
optimise the use of generating capacity·by levelling off demand during the daily
cycle. This is achieved by providing financial incentives for off-peak use of
electricity. In the South Western Electricity Board (S.W.E.B,) area, the Farm
Day /Night Tariff is a two-tier pricing system. Units used during the night-time
period (a 7-hour period between 23:00 and 08:30 GMT, starting time determined
.by the Board) are charged at a discount of approximately 60% compared with
the standard tariff rate. Units used during the remaining 17 hours of the day
suffer a 7% surcharge. A number of farmers have fitted timeswitches to their
equipment to take advantage of this tariff. It is possible in some circumstances
for the electricity use to be higher than it would without such controls, but the
cost may be lower. For example, heating water during the night period followed
by a short period of maintaining temperature may be cheaper than timing the
peak temperature to coincide with the time of use, if this time· is later in the
morning. The whole farmsupply has to be committed to the tariff and the higher
cost of day-time units may dissuade some farmers with equipment which has
to run during the day.
5.3.2 Environmental Factors
Environmental factors will have a very great ·influence upon both the
volume of milk produced and the energy used for handling and storing it. The
audit has revealed the importance of ambient temperature variations on
electricity consumption for cooling milk. This was seen in Section 2 as a seasonal
141
--------------------------------------------------------------

variation in the electricity used for cooling unit volumes of milk related to
weekly mean ambient temperature. This suggests that there should be a. diurnal
variation in the efficiency of cooling milk due to the daily cycle of ambient
variation.
The contribution of ambient temperature variations to the within-faim
variation in cooling costs also suggests that condenser siting and working
conditions will account for a significant proportion of the between-farm
variation.
Ambient variations will also have an effect upon water heating energy
requirements. Low ambient temperatures will result in lower heater inlet
temperatures and greater heat losses from the heated vessel ahd the surfaces
being cleaned. Colder areas in the north of the country are also more likely to
have a need for space,heating within the parlour and pipe-tracing for prevention
of freezing.
Rainfall, soil type and possibly housing conditions will have an indirect
effect upon energy use, in that certain conditions will lead to greater soiling of
udders with a greater need for udder washing water.
5.3;3 Technical Factors
Technical and technological factors will great! y affect the energy use in the
dairy. These include the availability and initial selection of equipment suitable
for a given installation. The vacuum pump rating for a particular size of parlour
is a matter for the design engineer. However, within the surveyed farms, there
was variation in installed equipment for similar sized parlours. Farms B and D
142
both had 5/10 parlours, but the pump ratings were 1.5and 3 kW respectively.
Energy used by the vacuum pump is not a simple function of the running time
and nominal motor rating. Measurements of the current drawn by the motors
in relation to the electrical energy used suggest that the power factor of similar
units is very variable between farms, and that the power factor of a given unit
may vary with time.
Reference has been made to the Federation of Milk Marketing Boards'
Specification BC56, with which all new tanks are expected to comply. The most
important aspect of this specification relates to the capacity of the cooling system
to reducemilktemperatures to 4°C within 30 minutes of the end of the morning
milk addition. Some of.the tanks observed did not comply with this requirement.
Ten tanks were observed and only two succeeded. One of these two was only
filled to 17% of its capacity. Conclusions should be moderated as it was only
possible to carry out a small series of observations of this feature. However, if
this pattern were to be repeated there would be cause for concern that the
technical performance of some tanks is not up to the .standard expected. The
implications for the farmer may be serious. Inadequate cooling of milk may lead
to rejection by the buyer.
There is also cause for concern over the accuracy ofinstrumentation fitted
to bulk tanks. The Milk Marketing Board examined over 4000 milk tank
thermometers and found more than a quarter of the sample to be outside the
accuracy range required by the Specification (Newell, 1980). 'The buyer may
reject milk which is inadequately cooled according to the reading on this
instrument.
143
5.3.4 Managerial Factors
These factors are of three types: The individual .farmer has very little
control over the political, technical and environmental factors which influence
his energy use and cost. However it may be possible for him to make decisions
related to these factors which are to his acivantage. These effects should be
distinguished frorn the second type of managerial effect which results from
decisions taken for overriding agronomic or economic reasons, which will
subsequently affect his energy use. Finally the farmer or manager may decide
to take direct action to reduce his energy cost by the use of energy saving
equipment or alternative energy sources.
The farmer may take advantage of the greater efficiency of the
refrigeration system at night by fitting timeswitches to the compressor. This is
usually carried out to take advantage of off-peak tariffcharges,but those farmers
not wishing to commit themselves, to the tariff for the reasons mentioned, may
still obtain an advantage from improved Coefficients of Performance at night.
For farmers practicing seasonal production this will be possible for a large part
of the year, when :the bulk tank is not filled to capacity. At peak production
periods; the compressor will need to run for most of the 24-hour cycle, and
limiting the ice-building period to the night time will result in inadequate
cooling reserves. Caremusttherefore be exercised over the management of such
controls. A recent development has been that of a fully automatic timeswitch
with ice-bank controller. This maximises the ice-building at night but also allows
an override of the timeswitch during the day if .the ice-bank is not sufficiently
large to cool the milk.
144
The farmer may also take advantage of ambient temperature variations by
careful siting of the condenser unit. This should be sited in a North-facing
position away from any sources of warm air which may affect the efficiency of
heat removal, such as the vacuum pump exhaust. Similarly, heat leakage into
the tank itself should be avoided by siting in a cool position, away from direct
sunlight and avoiding such practices as discharging waste hot water close to the
tank. Artificial illumination is not a very great proportion of the electricity use
but it may be possible, if there is no other disadvantage to the farmer, to alter
the timing of milking to take ad vantage of natural daylight. In addition there is
available a number of prefabricated milking parlour buildings which make very
good use of natural illumination through the use of transparent materials.
It is desirable to ensure that all the parlour and dairy equipment is
maintained in optimum working condition. Service contracts are available for
both the milking plant and the refrigeration system. It is also within the farmer's
power to ensure the equipment operates satisfactorily on a~day to day basis. The
vacuum regulator should be checked regularly in conjunction with the vacuum
gauge, to ensure optimum milking and cleaning vacuum levels. Condenser fins
should ,be kept clean and clear of obstructions to the flow of air. Leaks in hot
water systems should be rectified immediately and timeswitches and
thermostats set as carefully as possible and checked frequently.
The second group of management effects upon energy consumption and
cost concerns decisions relating to farming policy which may have an indirect,
but significant, effect upon the energy use.
Choice of breed is one such effect. The Jersey herd in the survey had a very
high electricity cost per unit volume of milk. This breed has a low average milk
145
yield per cow, but a higher compositional quality of milk, and the farmer
receives a higher price per litre of milk. However, all the parlour and dairy
equipment has to run for a lower volume extraction with the consequences
noted.
Another such. effect will be the selection of herd size and the appropriate
equipment. Size of the herd will be governed by a number of factors including
land availability, alternative possibilities, and labour and capital considerations.
Many farmers aim to restrict the milking period to a maximum of 2-2.5 hours,
and the size of the parlour is usually selected to accommodate this rate of
milking. The bulk tank will need to be of sufficient size to accommodate
maximum production, including a contingency for short term fluctuations in
cow numbers or the calving pattern.
Seasonality of calving can be a crucial factor affecting equipment sizing
and subsequent energy use. Equipment will need to be matched to peak
throughputs. This applies both to the parlour and'vacuumpump and to the bulk
milk tank. At other times of the year this equipment will be underused. Seasonal
variations in the electricity used for cooling a unit volume of milk have been
noted in the audit results. The autumn calving herd will have the greatest
volume of milk to cool during the winter months when the cooling system
operates most efficiently. However the spring calving herd will have a greater
cooling load during the summer months, leading to a higher year-round1a verage
cost of cooling milk. This higher cost is unlikely to be fully compensated for by
reduced electricity costs of the other components of the system, and will result
in a higher total electricity cost.
146
Choice of housing or grazing systernfor the herd may also indirectly affect
the energy requirement in the dairy. Badly designed housing systems or the
practice of graziilg.poached grass and:forage crops willlead to iilcreased soiling
of the udder. This will result in increased udder washing requirements and
reduce the throughput.
Farmers should also be aware of the effect of work ·routines on .the
throughput of cows and the subsequent effect upon vacuum pump running
times.
Given that management has a significant effect upon energy use iil the
dairy, there is a need for feedback of information between the herdsman
operating the equipment and the farm manager or financial controller. The
degree of communication may deteriorate within a long chain of command.
Farms D, ]; and X are all under institutional control, and had an average
electricity cost of £135per cow. The remaining farms, all family farms, had an
average cost of £12.0 per cow. The statistical significance of this aspect is difficult
to confirm with such a small sample, but it seems likely that this aspect will bear
further scrutiny.
5.4 Recommendations for Reduction of Energy Levels and Cost
5.4. 1 Good energy husbandry
Siting of equipment should be considered with regard to working
conditions, The bulk milk tank should be sited in a shaded position to avoid
direct sunlight striking any part of the tank and away from any other major heat
source such as wash tanks, space heaters and the vacuum pump. The
compressor/condenser unit should also be carefully sited away from direct
147
sunlight and other heat sources. The author has observed a number of cases
where vacuum pump exhausts have been located very close to condenser units,
a practice to be avoided. A north-facing site is the most desirable location for a
condenser unit, but the availability of a free air flow through the condenser unit
is also important. To facilitate this air flow, the condenser unit must be kept free
of any obstruction by regular observation and cleaning. The·presence of grease,
oil or other similar materials on or in the vicinity ofthe condenser will encourage
dirt, straw and other matter to stick to the fins of the condenser and reduce the
air flow. The positioning of refrigeration pipes should ensure the minimum
possibility of damage and resulting leaks of refrigerant. Any lagging present on
these pipes should be regularly inspected for deterioration and replaced if
necessary.
The refrigeration equipment should be regularly serviced, ideally by
taking out a regular service contract with a specialist refrigeration engineering
firm. The tank's controls and instrumentation should be regularly checked and
recalibrated if necessary. The temperature indicated on the milk thermometer
should be noted at the point where the agitator cuts out at the end of the cooling
period. If this differs significantly from 4°C the temperature of the milk should
be checked with another instrument of known accuracy to determine whether
the instrument is at fault or whether the cooling process is terminating
incorrectly.lf the milk thermometer is at fault it should be replaced'immediately,
bearing in mind that the buyer may reject milk as a result of the reading on this
instrument and that a faulty instrument will not give a reliable indication of
whether the milk is being properly cooled. If the thermometer is found to be
accurate, then variation from 4°C in the cut-out temperature should be
immediately investigated.A cut-out temperature in excess of this level indicates
148
inadequate cooling of milk. This may lead to rejection of the milk, but will also
create conditions in the milk more .favourable to bacterial multiplication with
consequent penalties. Cut-out temperatures below 4°C will indicate
over-cooling of the milk and the input of more energy than necessary to meet
the,buyer's requirements.
The chilled water compartment should be filled according to the
manufacturer's recommendations. This will involve filling to an indicated level
and then maintaining the volume at that level. Such additives as are
recommended should be included; these may include a wetting agentto ensure
a smooth flow of water over the milk vessel walls. Observations of the flow of
chilled water should be made from time to time to ensure that the whole wall is
being wetted, creating the maximum heat transfer area.
Any loss of thermal energy by the milk before it reaches the tank will
reduce the amount of energy to.be removed by the tank. It seems reasonable to
expect milk passing into recorder jars rather than flowmeters for milk recording
to lose more thermal energy due to the larger surface area. The longer milk
remains in the recorder jar, the greater will be the energy loss to the ambient
resulting in milk of a slightly lower temperature being delivered to the tank.
Less frequentemptying of the recorder jars is therefore recommended.
Farmers and herdsmen should make regular observations of the ice-bank
and develop a management strategy relating to the ice-building. The
refrigeration system operates most efficiently against a higher temperature
gradient, i.e. at night. With no control influenced and normal operating
conditions, the daily cycle of two milkings will be followed in each case by a
period of ice-rebuilding. The afternoon milkingwill be ofapproximately 40% of
149
the total load. Thus the night time rebuilding period will be the shorter of the
two periods and the main period of compressor inactivity will be during the
night and the early hours of the morning when it could be operating at its most
efficient. To make matters worse, the daytime rebuilding period not only has
the greater mass of ice to replace, but it has·to do this during the warmest hours
of the day. It is obviously desirable to attempt to shift some of the daytime
ice-rebuilding into the night period, but caution mustbe exercised.
Whatever policy is exercised in respect of ice-bank control the adequate
cooling ofa batch,of milk must not!be put at risk. Atthe same time:theproducer
must take care to ensure he does not contravene any contractual arrangements
he may have with the buyer of the milk. These may include a guarantee on the
part of the producer to maintain a continuous cooling facility or an agreement
only to use only such control equipment as has been approved by the buyer.
Over-riding the control of the ice-bank by manual control methods is
unlikely to<be satisfactory and is therefore not recommended.
The fitting of ordinary times witches to the electrical circuits controlling the
operation of the refrigeration unit would ,theoretically be sufficient to control
the process. The settings would be made to cut out the compressor at some point
during the daytime and allow the system to restart later when the ambient
temperature is loWer. This method of control requires a high levelofobservation
and anticipation on the part of the operator. The'timing of the cut-olit must not
be before the morning milk load has been adequately cooled, and· preferably not
before it has been removed from the tank. Cutting off the compressor artificially
during the daytime results in the commencement of afternoon milking with less
than a full ice-bank. Such ice-bank as there is must be sufficient to cool the
150
afternoon milk load without exhaustion and it would be prudent to have a
contingency reserve so that unanticipated increases in the volume of milk are
not put at risk. The method therefore requires the operator regularly to observe
the remainingice at the end of the.afternoon cooling. The timing of the cut-in is
also critical since the full ice-bank must be restored by the commencement of
morning milking. For most farms, for a large part of the year, it is possible to
manage the ice-bank control in this way, even if the time switch is set to allow
24-'hour supply.at the high risk times of the year, namely the mid-summer period
and when the tank is being. filled dose to capacity. However, a very high level
of vigilance is required on the part of the operator with regular observations of
the ice~bank, and frequent adjustments of the time-switch to allow for
anticipated changes in the volume of milk or the ambient temperature.
Electronic ice~bank controlling devices are now becoming available. Such
devices will attempt to optimise the timing of the ice" bank rebuilding process,
while allowing an over-riding of such controls in the event of the ice-bank
becoming close to exhaustion, Such equipment is not expensive in the light of
possible savings by running the compressor unit more efficiently and shows
further advantages when considered in the context of off-peak electricity prices.
In the longer term, the development of a fully programmable
microprocessor-based controller capable of anticipating the required ice-bank
given information relating to herd size, milk production pattern and the range
oflocal ambient conditions would be a way of optimising the tank's performance
while removing from the operator the need to be vigilant.
The responsibility for correct use of the tank will always remain with the
operator and it should always be remembered that the tank has been designed
151
to receive its milk in two loads. over a 24-hour period, the first being 40% of the
total. Producers with more than one milk tank should.avoid the temptation to
fHJ.one tank at each milking. Such a demand upon the cooling reserve is unlikely
to be met, and milk will be inadequately cooled.
The operator should check frequently whether the tank is fulfilling its
requirementto cool the milk within 30 minutes of the end of the filling period.
If it is not doing so, and the thermostat and thermometer are known to be
working accurately then the causes should be immediately investigated with
technical advice being sought if necessary.
The vacuum pump and milking equipment should all be serviced and
maintained regularly and thoroughly by skilled, technical staff. Again, service
contracts are available and should be considered. 'The vacuum level should be
precisely set and accurately maintained by keeping the regulator in good
working condition. Similarly the pulsator should receive regular attention to
ensure the correct vacuum regime at the cluster. The vacuum gauge is an
important instrument and it should be regularly checked and recalibrated if
necessary.
The vacuum pump itself should be sited sensibly for the disposal of the
heat carried in its exhaust, and the outlet should be maintained in a clean
condition.
Reasonable attempts should be made to minimise the running time of the
vacuum pump by not starting the system until the first cows are ready for
milking, and ensuring that the milking period and the following cleaning,period
are as short as possible.
152
Although lighting only accounts for a very small proportion of total
electricity use, it is still worth exercising well disciplined procedures with
respect to the use oflights. The lighting system should be designed with the
correct type, wattage and siting for the situation and specialist advice should be
taken if necessary.
Finally, one should not overlook the other activities taking place in the
parlour. Washing down the parlour after milking only incurs a very small
electricity cost for the water pump, but the volume of water itself may be very
large (e.g. approximately 10 tonnes per week at farm X). Water itself is nolonger
a resource to be taken for granted as it has a value, both economically and
energetically.
5.4.2 Reduction of unit costs
In addition to taking appropriate steps to minimise the absolute level of
energy consumption, farmers should consider attempting to reduce·the unit cost
of their purchased electricity by taking advantage of off-peak electricity tariffs.
Reference has been made in section 5.3.1 to the Farm Day /Night tariff which
offers a substantial discount for electricity used during the night period and a
small surcharge for electricity used during the remainder of the day. The whole
farm supply has to be committed to the tariff and consequently there will only
be a benefit if a sufficient proportion of the electricity use can be shifted' into this
time period. :Benefits resultingfrom maximising the running of the compressor
at night have already been: commented upon, but these benefits can be added to
significantly if the unit cost of electricity is also reduced. Where hot circulation
cleaning or Acidified Boiling Water cleaning are practised only once per day,
this should be in the morning to take advantage of heating the water during the
153
night period. If milking starts early enough then some of the vacuum pump
running time will also be accounted for during the off-peakperiod.
5.4.3 Conservation measures.
From a national point of view, any attempt to conserve energy is to be
commended in view of dwindling resources. However, farmers cannot be
expected to be any more altruistic than the remainder of.society, and they are
therefore likely to invest in conservation equipment only if the investment is
justified on economic grounds rather than energetic.
Opinion is still divided on the subject of economic viability of investment
in heat recovery units and plate coolers. The benefit from a heat recovery unit
is in the recapture of some of the thermal energy extracted by the milk cooling
process before this heat is expelled to the atm?sphere. The most obvious
application for this energy is a further transfer into heating (or pre-heating)
water for use by the plant cleaning system or as udder washing water and the
rewards from using such a system are in the form of reduced heating bills for
this water; However, the system is likely to cost several hundred pounds,
depending on the sire of the installation and the benefits are difficult to quantify.
A number of major variables need to be investigated before a recommendation
can be made; these include the overall heat transfer efficiency and the matching
of the supply with the requirementfor heated water in terms of, both temperature
and timing. Reference has been made to the work by Norman on the use of
heated water in the farm dairy.
Plate coolers would seem to offer a more easily quantifiable opportunity.
A description of the process has been made earlier and the work by A.D.A.S
154
referred to in section 1.5.2 has attempted to measure the effects. The benefits are
seen in a lower milk cooling costcaused;by reducing the milk temperature before
its arrival at the tank. However, the precise effects of a plate cooler on the
temperature of milk are dependent upon a number of variables, such as the ratio
of milk volume to Water volume, the temperature of the cooling water and the
presence or absence of a balance tank to smooth the flow of milk through the
cooler. Until these influences have been more carefully modelled it will still not
be possible precisely to determine the reduction in milk cooling cost.
Again, the installation is likely to cost several hundred pounds, and the
return on this investment will be partly dependent on whether the water'has to
be purchased or is re-used, as A. D.A.S pointed out. The capital investment might
be partly offset by the reduction in cooling capacity needed. However, this is
only likely to be possible on a new installation where both the plate cooler and
compressor are being installed' at the same time. This approach also leaves the
producer at risk of having an under-rated compressor which is incapable of
cooling the milk properly should the pre-cooling process fail for any reason.
Producers contemplating this approach should examine carefully their position
with respect to their contractual arrangements with the buyer and the warranty
or service arrangements for the tank.
Equipment for optimising the ice-bank rebuilding time has been referred
to in the previous section.
The use of specialised controllers which switch on the lights only when the
presence of an animal or the operator is detected would help to optimise the use
of electricity but seems unlikely to gain a widespread acceptance since the
benefits from installing such a system are likely to be small.
155
There is even more doubt about the viability· of alternative energy sources.
For example, it is extremely improbable that solar systems typical of those
currently available can be justified on purely economic grounds (Carpenter
etal., 1980).
156
6·. COINClUSION,S
Farmers' concern about the present and future price of energy is justified
and the advice available to them is wanting.
Levels of energy use are a little lower than previously suspected. The
average energy use for all purposes, except space heating, in the dairy and
parlour is approximately 250 kWh per cow per annum, or45~5o kWh per cubic
metre of milk. Farmers exercising careful conservation practices, but without
resorting to specialist conservation equipment, can reduce this figure to 200kWh
per cow per annum. This saving of20%is worth about£250.per year in a 100-cow
herd. For farmers whose electricity consumption is higher than average the
savings will be corresponding! y higher. For the national dairy herd·of 2.5 million
cows, the saving is approximately 125 GWh per year worth over £6million at
end~user prices.
To achieve savings ofthis level would clearly be.ofgreat national benefit
in terms of reduced demand for generating capacity, but will not be entirely
without cost. The author encountered many examples of well-intentioned but
misguided practices. Farmers will need to be made aware of the possibilities and
educated in methods of reaching the targets. Such an objective will involve a
well-designed and on-going publicity programme, a positive training role and
a means of demonstrating to farmers that progress is being made.
157
Exploring and quantifying the effects ofinstalling conservation equipment
has been beyond .the scope of the current work. However it is worth noting that
those farms in the survey which had conservation equipment were unable to
perform any more economically than those farms without conservation
equipment but where good energy housekeeping is rigourously practised. It
may therefore be concluded that conservation equipment should not·be used to
reduce consumption figures to the target of 200 1kWh per cow per year since this
is possible without resource to such equipment. Only when the maximum
savings have been achieved by improving operating practices, should
investment in conservation equipment be considered. It is likely that much of
·the anecdotal evidence for savings achieved by conservation equipment in fact
involves savings that could have been madewithout such an investment. When
conservation equipment is applied to the task oflowering consumption below
the 200 kWh per cow per year level the investment might become rather difficult
to justify at electricity prices currently prevailing, As a consequence further
savings might become dependent upon either a very dramatic rise in the price
of electricity or some other form offinancial incentive.
'"The bulk milk tank is the heaviest individual consumer of energy in the
dairy and its consumption is heavily influenced by the level of production and
the ambient temperature. An equation has been proposed to predict the
electricity consumption by the tank using the level of production and ambient
temperature as variables. Failure to achieve this level of consumption would
indicate that the tank is working in less than optimum conditions.
Development of the bulk tank model has brought about a realisation of the
dependence of the cooling rate on tank geometry. The traditional design of a
sump and spray tank has been constrained by requirements for rigidity and a
158
1...--------------------------~-~- ----
known specific cross-sectional area to facilitate measurement of the milk volume
by means of a dipstick. Non-volumetric methods of establishing the quantity of
milk leaving the farm would remove these constraints. Designers might then be
able to consider methods of providing a much larger heat transfer area enabling
cooling to proceed more efficiently. Such a design must not overlook the need
for automated cleaning systems,
the model suggested that some tanks may have difficulty in meeting the
requirement to cool milk to 4°C within 30 minutes of the end of the filling period
in certain conditions. The fai I ure of a new tank to achieve this target in laboratory
conditions and the similar failure of a large proportion of the observed tanks in
farm conditions has given further cause for concern. It should be remembered
that all farm bulk milk tanks are subjected to a rigourous testing procedure by
N.I.R.D., a process which includes testing the tank's ability to meet this cooling
target under very severe ambient conditions. Eachmodel of tank has to complete
this test successfully before being licensed for use. It was not possible in the
current work to investigate this apparent anomaly in any detail, but it is clear
that the matter requires investigation.
6.1 Recommendations for Further Work.
Development ofthe model has illuminated a number of areas worthy of
further study. While the model provides a reasonable testbench for further
investigations and predictions, further refinement would add to the precision
and accuracy of its output. Inparticular a further study and modelling of the
conditions controlling the heat transfer away from the evaporator surface and
through the refrigeration system would lead to a better understanding of the
temperature regime at the evaporator surface. This temperature is crucial in
determining the temperature gradient through the ice bank and therefore the
159
rate of conduction of heat from the ice-bank surface. In turn this determines the
changes in radius and. consequently the status of the compressor.
Further studies of the conditions prevailing in and around the ice-bank
should also consider ice-bank geometry. When the annulus of ice becomes,large
in radius and adjacent turns of the evaporator coil are relatively close together
there is a real risk.of adjacent annuli ofice beginning to coalesce. Continuation
of this process results in the total surface area of the ice-bank increasing at a
much slower rate thanifseparate annuli were increasing in radius. Eventually,
the ice-bank may take the form of a rectangular slab with a considerably lower
surface area than the separate annuli would 'have. Absolute rates of convective
heat transfer from the chilled water to the ice would then be very different to
those calculated in the current version of the model.
'Fhe overall heat transfer rate from the milk to the chilled water has been
developed empirically in the current work and this aspect would bear further
study in order to improve understanding of this complex process. Such an
understanding could lead to possible design improvements resulting in a more
efficient transfer of heat out of the bulk milk.
Having established reasonable guidelines for current levels of energy use
and targets for possible levels of use before installation of conservation
equipment, further work should now be undertaken to quantify reliably the
potential for savings resulting from the installation· of such equipment.
160
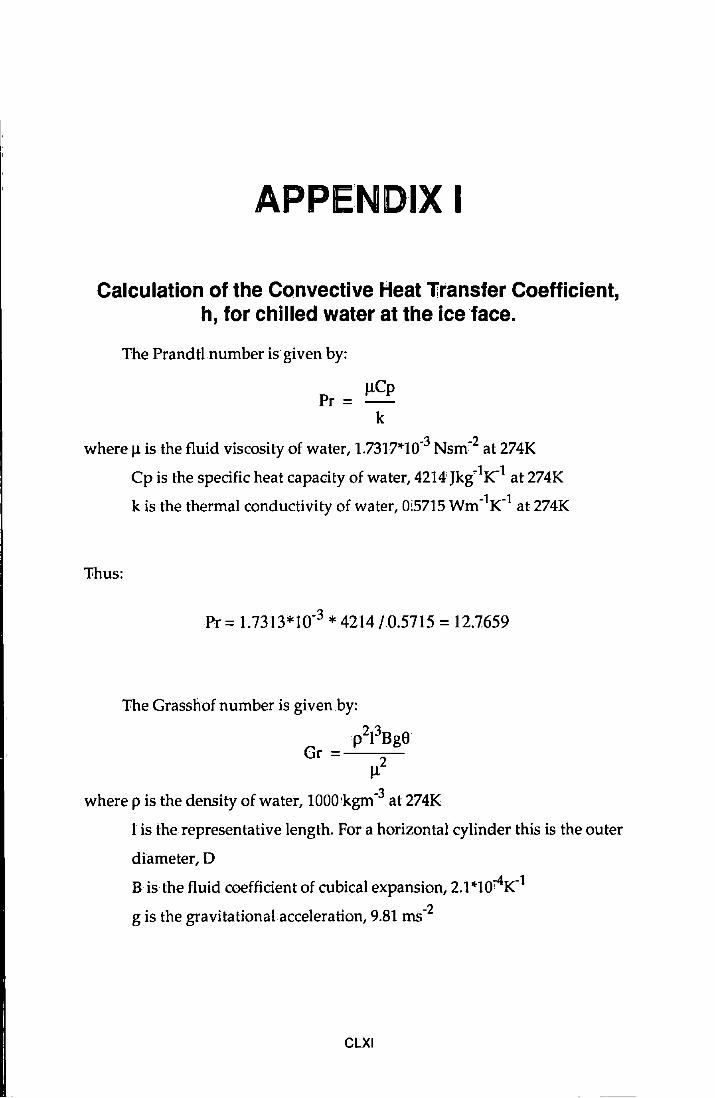
APPENDIX I
Calculation of the Convective Heat lransfer Coefficient, h, for chilled water at the ice face.
The Prandtl number is given by:
JlCp Pr=
k
where J.1 is the fluid viscosity of water, 1.7317*10-3 Nsm:2 at 274K
'Jihus:
Cp is the specific heat capacity of water, 4214'Jkg-1.K"1 at 274K
k is the thermal conductivity of water, Oi5715 Wm-1K-1 at 274K
Pr = 1.7313*10-3 * 4214/0.5715 = 12.7659
The Grasshofnumber is given by:
p213Bg9 Gr = ----:::---
112
where pis the density of water, l000'kgm-3 at 274K
1 is the representative length. For a horizontal cylinder this is the outer
diameter, D
B is the fluid coefficient of cubical expansion, 2.1 *10;4.K"1
g is the gravitational acceleration, 9.81 rns-2
CLXI
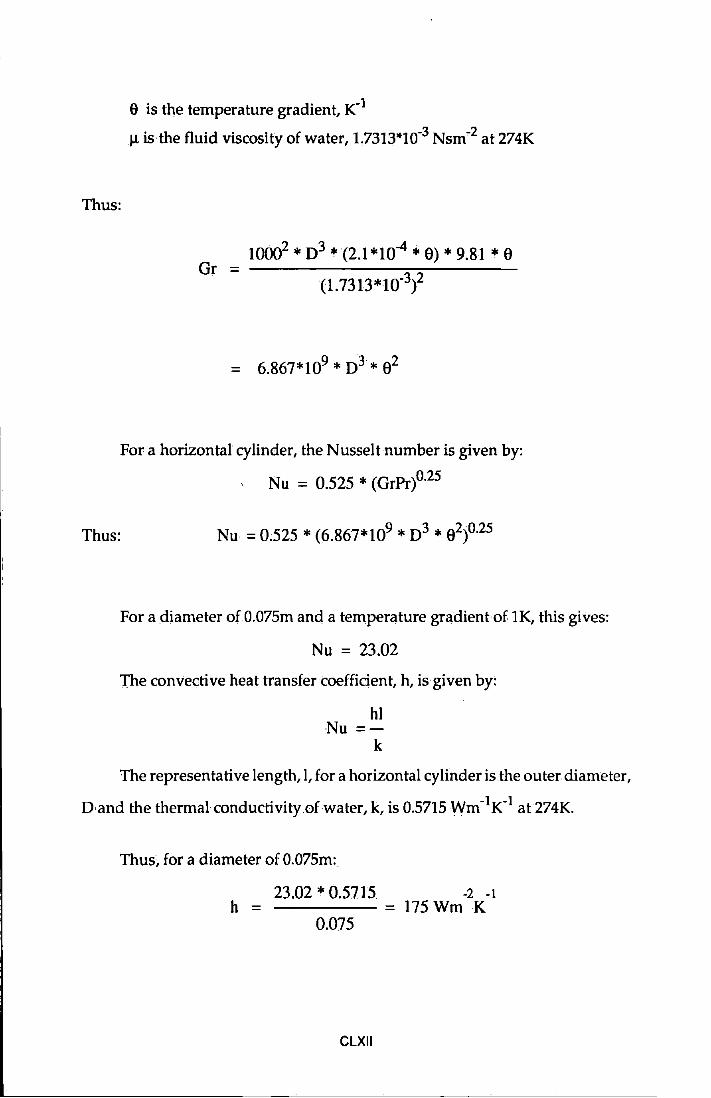
e is the temperature gradient, K"1
1.1. is the fluid viscosity of water, 1.7313*10"3 Nsm-2 at 274K
Thus:
Gr = ~~ * o3 * (2.1 *10
4 * 8) * 9.81 * 8
(1.7313*10"3~2
For a horizontal cylinder, the Nusselt number is given by:
Nu = 0.525 * (GrPr)0·25
Thus: Nu = 0.525 * (6.867*109 * D3 * 82)0·25
For a diameter of.0.075m and a temperature gradient of 1K, this gives:
Nu = 23.02
The convective heat transfer coefficient, h, is given by:
hi Nu=
k
The representative length, I, for a horizontal cylinder is the outer diameter,
o,and the thermal conductivity.ofwater, k, is 0.5715 Wm-lK-1 at 274K.
Thus, for a diameter of 0.075m:
23.02 * 0.5715 -2 -l h = = 175 Wm K
0.075
CLXII
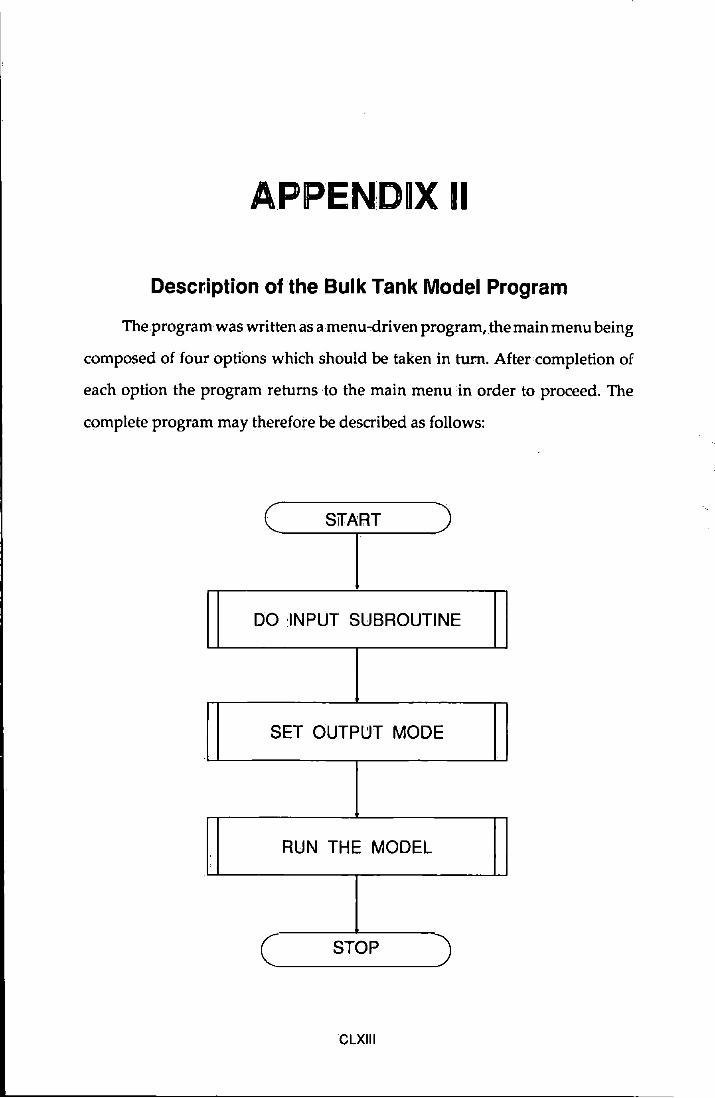
Descr:iption of the Bulk Tank Model Program
The program was written as amenu~driven program, the main menu being
composed of four options which should be taken in turn. After completion of
each option the program returns to the main menu in order to proceed. The
complete program may therefore be described as follows:
SifART
DO INPUT SUBROUTINE
SET OUTPL:JT MODE
RUN THE MODEL
STOP
CLXIII
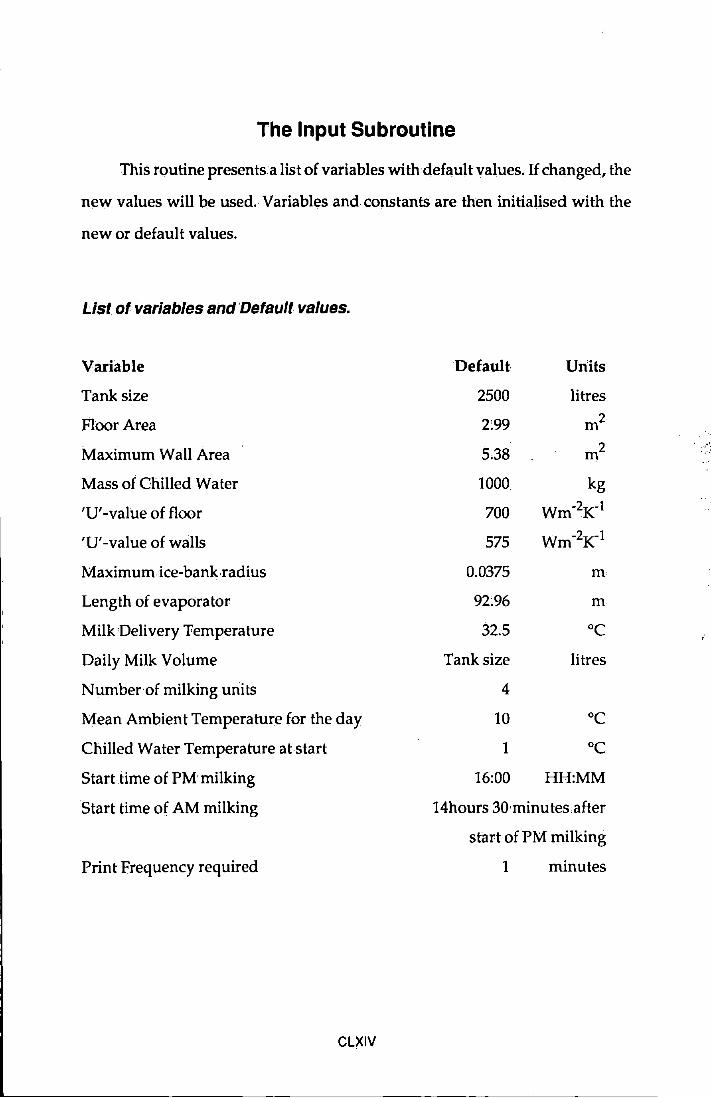
The Input Subroutine
This routine presents a list of variables with default values. If changed, the
new values will be used. Variables and constants are then initialised with the
new or default values.
List of variables and Default. values.
Variable Default Units
Tank size 2500 litres
Floor Area 2:99 m2
Maximum Wall Area 5.38 m2
Mass of Chilled Water 1000 kg
'U'-value of floor 700 Wm-2K 1
'U'-value of walls 575 Wm-2K 1
Maximum ice-bank .radius 0.0375 m
Length of evaporator 92:96 m
Milk Delivery Temperature 32.5 oc Daily Milk Volume Tank size litres
Number of milking units 4
Mean Ambient Temperature for the day 10 oc Chilled Water Temperature at start 1 oc Start time of PM milking 16:00 HH:MM
Start time of AM milking 14hours 30 minutes after
start of PM milking
Print Frequency required 1 minutes
CLXIV
,•':
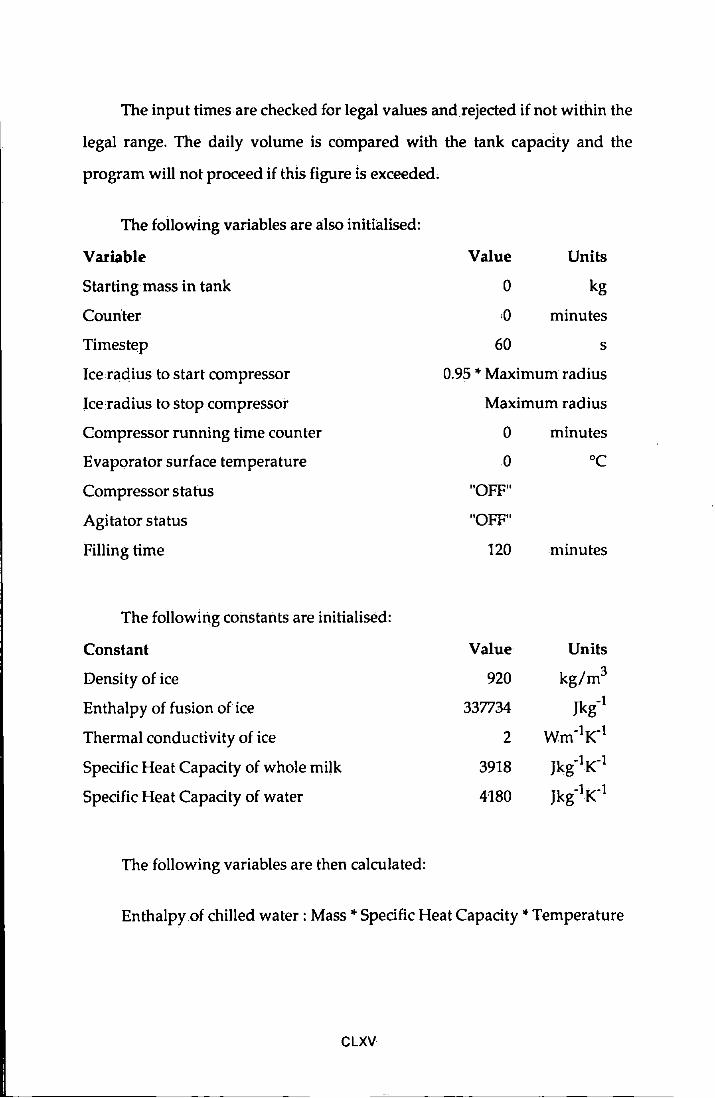
The input times are checked for legal values and rejected if not within the
legal range. The daily volume is compared with the tank capacity and the
program will not proceed if this figure is exceeded.
The following variables are also initialised:
Variable
Starting mass in tank
Counter
Timestep
Ice radius to start compressor
lcendius to stop compressor
Compressor running time counter
Evaporator surface temperature
Compressor status
Agitator status
Filling time
The following constants are initialised:
Constant
Density of ice
Enthalpy of fusion of ice
Thermal conductivity of ice
Specific Heat Capacity of whole milk
Specific Heat Capacity of water
The following variables are then calculated:
Value Units
0 kg
,o minutes
60 s
0.95 *Maximum radius
Maximum radius
0 minutes
0 oc "OFF"
"OFF"
120 minutes
Value Units
920 kg/m3
337734 Jkg-1
2 wm-1K-1
3918 Jkg-1K-1
4180 Jkg-tK-1
Enthalpy of chilled water: Mass* Specific Heat Capacity* Temperature
CLXV
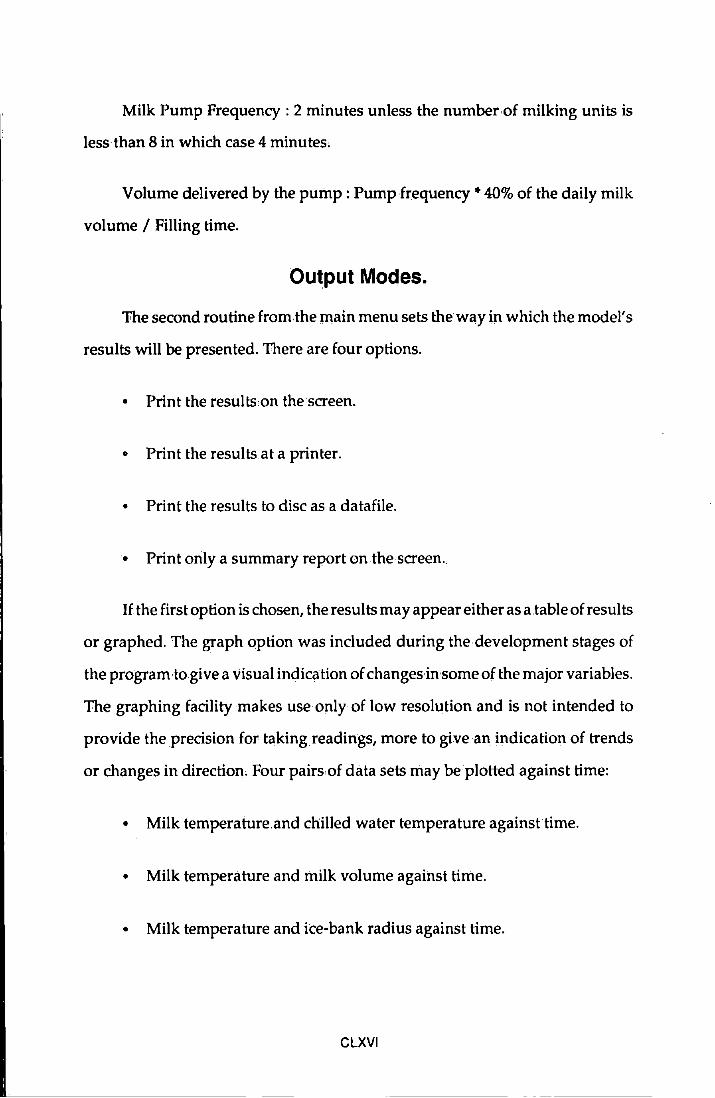
Milk Pump Frequency : 2 minutes unless the number of milking units is
less than 8 in which case 4 minutes.
Volume delivered by the pump: Pump frequency,. 40% of the daily milk
volume I Filling time.
Output Modes.
llhe second routine from.the main menu sets the way in which the model's
results will be presented. There are four options.
• Print the results on the screen.
• Print the results at a printer.
• Print the results to disc as a datafile.
• Print only a summary report on the screen ..
If the first option is chosen, the results may appear either as a .table of results
or graphed. The graph option was included during the development stages of
the program to give a visual indication of changes in some of the major variables.
The graphing facility makes use only of low resolution and is not intended to
provide the precision for taking readings, more to give an indication of trends
or changes in direction. Four pairs of data sets may be plotted against time:
• Milk temperature and chilled water temperature against time.
• Milk temperature and milk volume against time,
• Milk temperature and ice-bank radius against time.
CLXVI
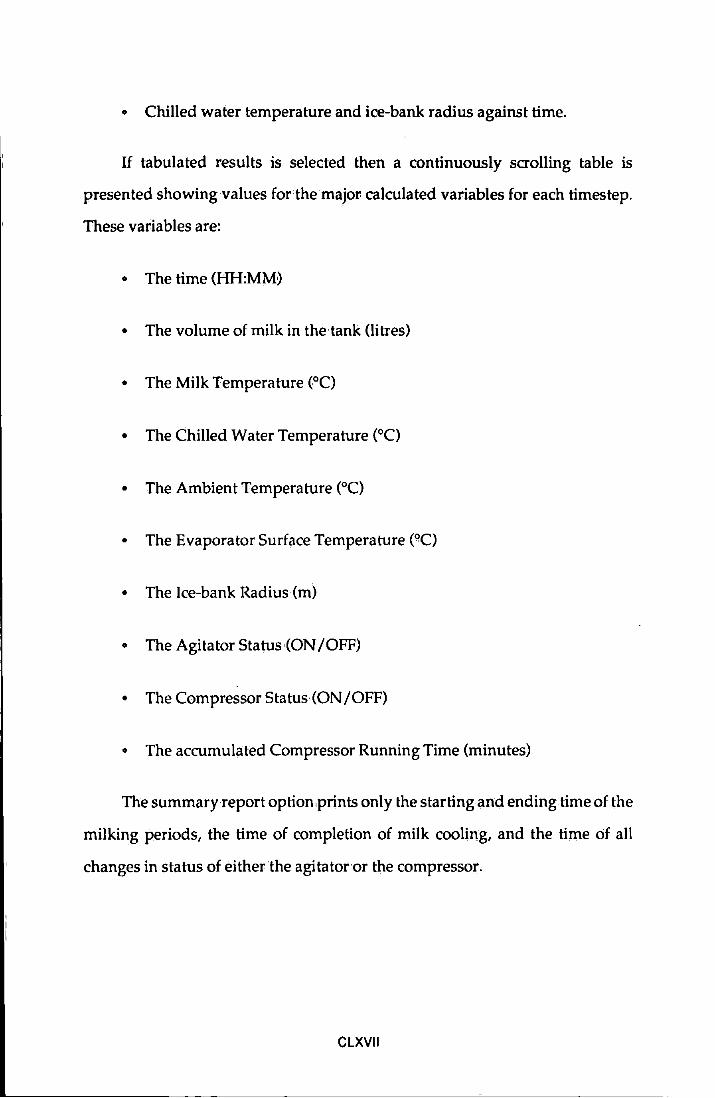
o Chilled water temperature and ice-bank radius against time.
If tabulated results is selected then a continuously scrolling table is
presented showing values forthe major calculated variables for each timestep.
These variables are:
• The time (HH:MM~
• The volume of milk in the tank (litres)
• The Milk Temperature (0 C)
• The Chilled Water Temperature (°C)
• lfhe Ambient Temperature (0 C)
• The Evaporator Surface Temperature (0 C)
• lfhe Ice-bank Radius (m)
• The Agitator Status{ON /OFF)
• 1he Compressor Status (ON/OFF)
o The accumulated Compressor Running Time (minutes)
The summary report option,prints only the starting and ending time of the
milking periods, the time of completion of milk cooling, and the time of all
changes in status of either the agitator or the compressor.
CL XVII
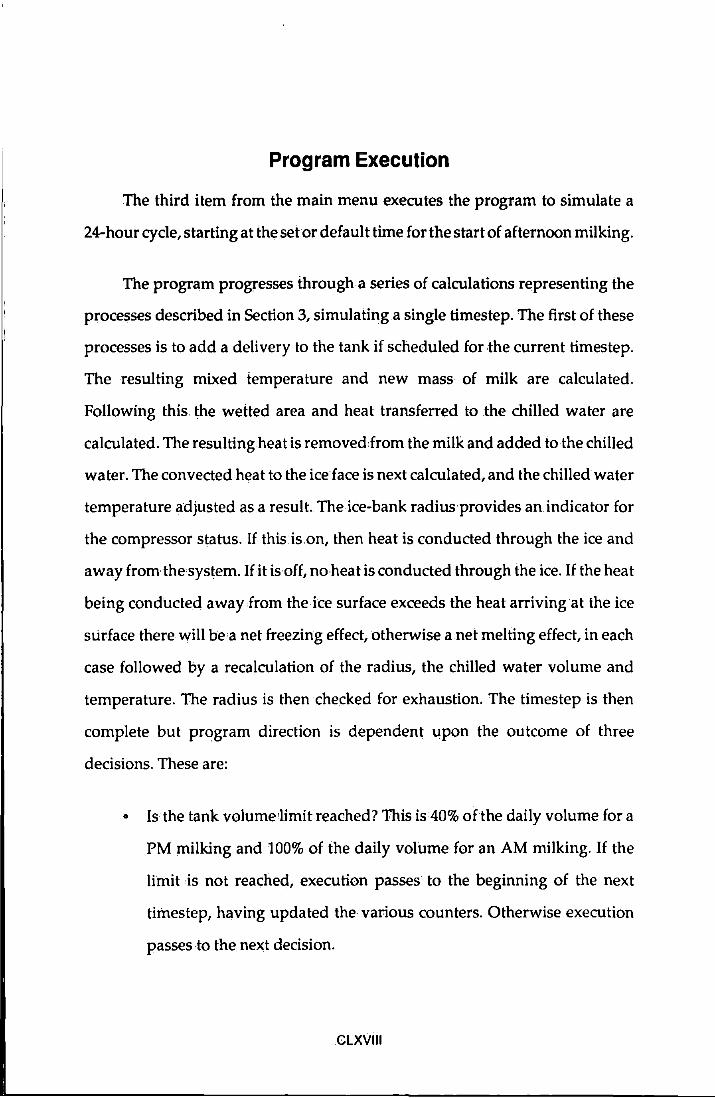
Program Execution
The third item from the main menu executes the program to simulate a
24-hour cycle, starting at the set or default time for the start of afternoon milking.
The program progresses through a series of calculations representing the
processes described in Section 3, simulating a single timestep. The first of these
processes is to add a delivery to the tank if scheduled for ·the current timestep.
The resulting mixed temperature and new mass of milk are calculated.
Following this the wetted area and heat transferred to the chilled water are
calculated. The resulting heat is removed·from the milk and added to the chilled
water. The convected heat to the ice face is next calculated, and the chilled water
temperature adjusted as a result. The .ice-bank radius provides an. indicator for
the compressor status. If thisis.on, then heat is conducted through the ice and
away from the system. If it is off, no·heatis conducted through the ice. If the heat
being conducted away from the ice surface exceeds the heat arriving at the ice
surface there will be a net freezing effect, otherwise a net melting effect, in each
case followed by a recalculation of the radius, the chilled water volume and
temperature. The radius is then checked for exhaustion. The timestep is then
complete but program direction is dependent upon the outcome of three
decisions. These are:
• Is the tank volume•limit reached? This is 40% oft he daily volume for a
PM milking and 100% of the daily volume for an AM milking. If the
limit is not reached, execution passes to the beginning of the next
tir'nestep, having updated the various counters. Otherwise execution
passes to the next decision.
CLXVIII
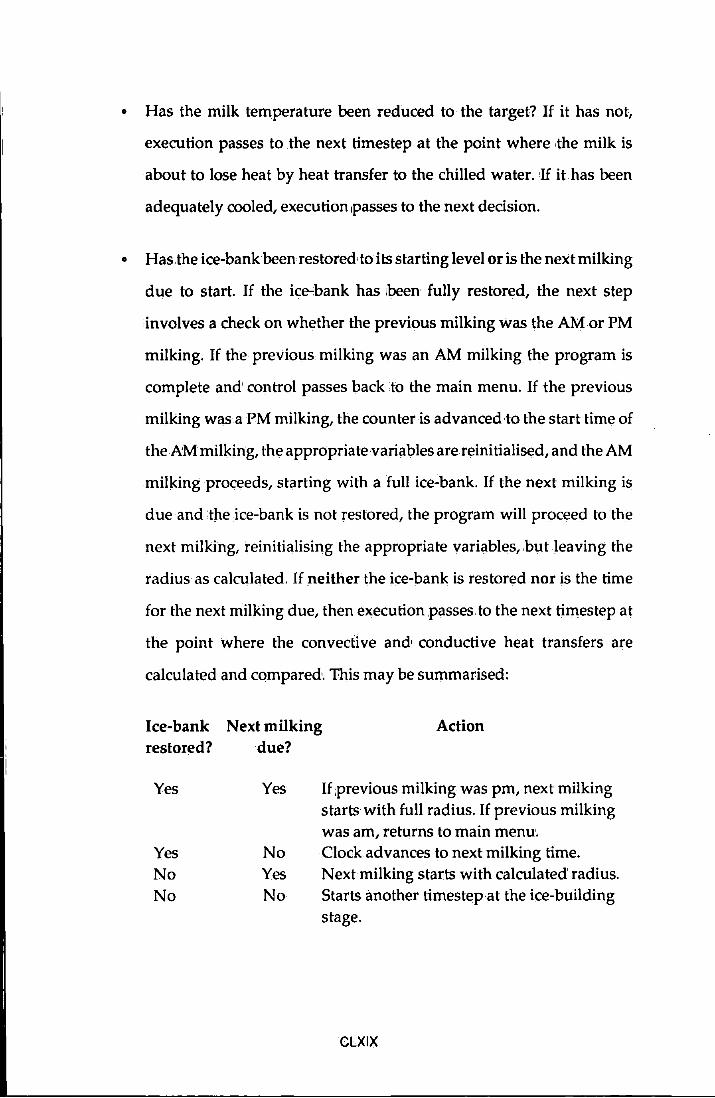
• Has the milk temperature been reduced to the target? If it has not,
execution passes to the next timestep at the point where ,the milk is
about to lose heat by heat transfer to the chilled water. If it has been
adequately cooled, execution passes to the next decision.
• Has the ice-bankbeenrestored, to its starting level or is the next milking
due to start. If the ice~bank has 1been fully restored, the next step
involves a check on whether the previous milking was the AM or PM
milking. If the previous milking was an AM milking the program is
complete and' control passes back ,to the main menu. If the previous
milking was a 'PM milking, the counter is advanced to the start time of
the AM milking, the appropriate variables are reinitialised, and the AM
milking proceeds, starting with a full ice-bank. If the next milking is
due and ,the ice-bank is not restored, the program will proceed to the
next milking, reinitialising the appropriate variables, but leaving the
radius as calculated. If neither the ice-bank is restored nor is the time
for the next milking due, then execution .passes to the next timestep at
the point where the convective and conductive heat transfers are
calculated and compared. This may be summarised:
Ice-bank Next milking Action restored? due?
Yes
Yes No No
Yes
No Yes No
If .previous milking was pm, next milking starts with full radius. If previous milking was am, returns to main menu. Clock advances to next milking time. Next milking starts with calculated' radius. Starts another timestep at the ice-building stage.
CLXIX
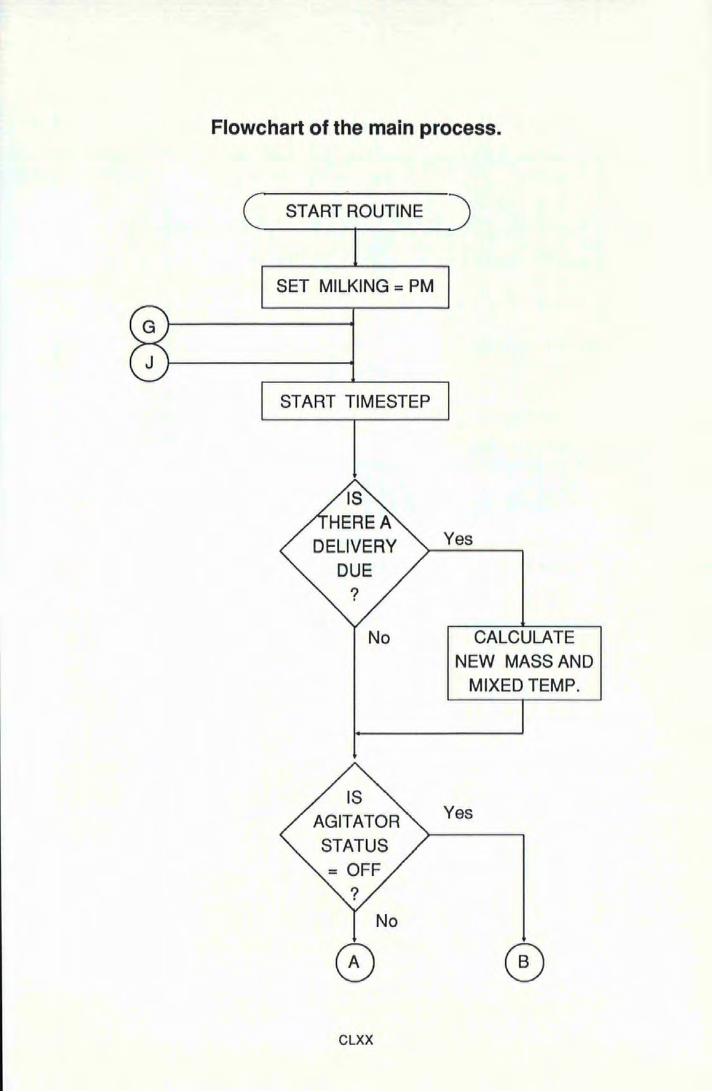
Flowchart of the main process.
START ROUTINE
SET MILKING = PM
START TIMESTEP
Yes
No CALCULATE
CLXX
NEW MASSAND MIXED TEMP.
Yes
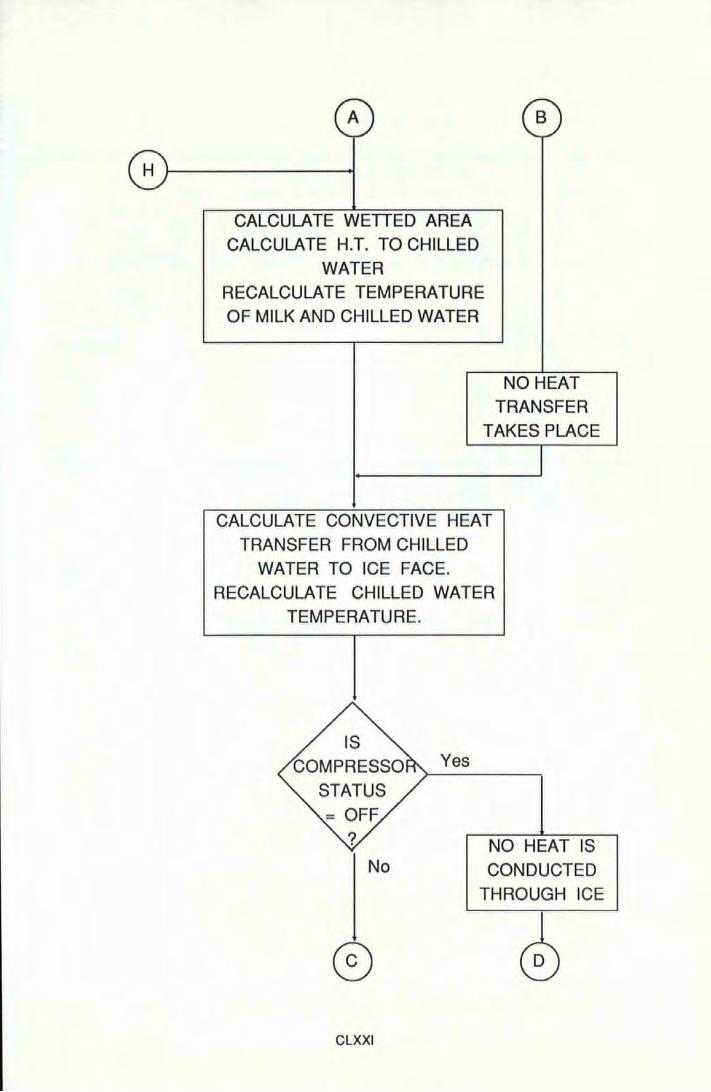
CALCULATE WETTED AREA CALCULATE H.T. TO CHILLED
WATER RECALCULATE TEMPERATURE OF MILK AND CHILLED WATER
NO HEAT TRANSFER
TAKES PLACE
CALCULATE CONVECTIVE HEAT TRANSFER FROM CHILLED
WATER TO ICE FACE. RECALCULATE CHILLED WATER
TEMPERATURE.
Yes
NO HEAT IS No CONDUCTED
THROUGH ICE
CLXXI
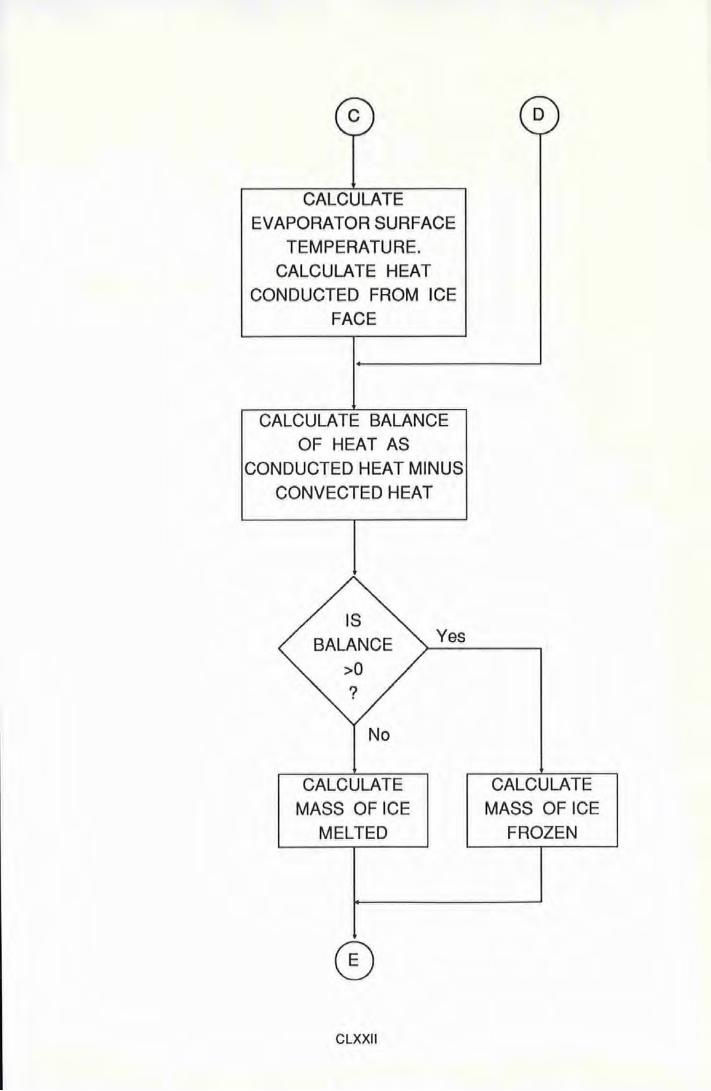
CALCULATE EVAPORATOR SURFACE
TEMPERATURE. CALCULATE HEAT
CONDUCTED FROM ICE FACE
CALCULATE BALANCE OF HEAT AS
CONDUCTED HEAT MINUS
CONVECTED HEAT
No
CALCULATE MASS OF ICE
MELTED
CLXXII
Yes
CALCULATE MASS OF ICE
FROZEN
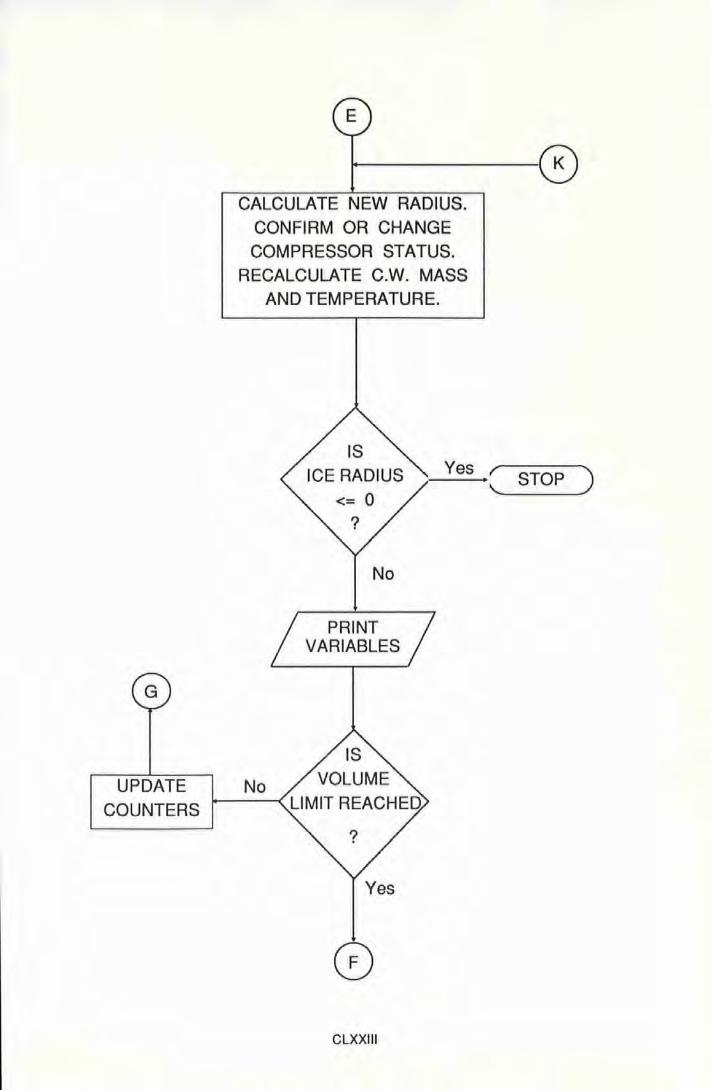
1+-----® CALCULATE NEW RADIUS.
CONFIRM OR CHANGE COMPRESSOR STATUS.
RECALCULATE C.W. MASS AND TEMPERATURE.
No
PRINT VARIABLES
Yes ~ STOP )
UPDATE No COUNTERS
CLXXIII
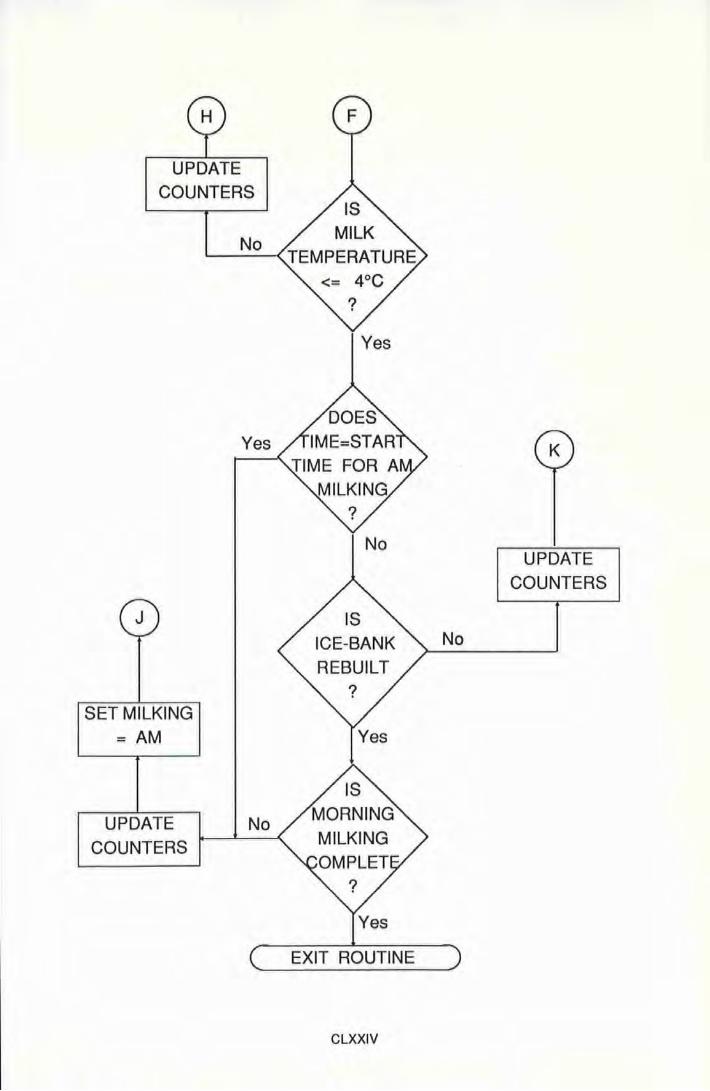
UPDATE COUNTERS
SET MILKING =AM
No
Yes
UPDATE No COUNTERS
EXIT ROUTINE
CLXXIV
No
UPDATE COUNTERS
List of References
A.D.A.S. H977). Advisory leaflet No 602: Circulation Cleaning.
A.D.A.S. (1981). A study of water assisted milk cooling systems on farms in
England and Wales. Unpublished internal communication.
BS 5226:1975. Cleaning and sterilisation of pipeline milking machine
installations,
Bayetto, R.A, Patterson, H. and Wakeford, P.O. (1974). Electricity in
Agriculture. Proc. I.E.E. Vol121, No 11R, Nov 1974,
I.E. E. Reviews.
Belcher, J.R. (1978). Laboratory assessment of heat recovery units for use
with refrigerated farm tanks. XX International Dairy Congress,
Vol E, 1978, 639"640.
Carpenter, J.L., Norman, A.J., Vallis, E.A. and Vranch A.T. (1980). The
viability of solar water heaters in milking parlours in the U.K. In
Energy conservation and use of renewable energies in the
bio-industries. Ed. F.Vogt. Pergamon.
CLXXV
Castle, M.E. and Watkins, P. (1977)~ Modem Milk Production. Faber.
Central Statistical Office. (1980). Monthly digest of statistics. H.M.S:O.,
London.
Cromarty, A.S. (1968). Water heating with heat energy recovered from a
refrigerated farm tank. J. Agric. Engng. Res; (1968) 13(3) 225"240.
Currier, J.W.R. (1976). Refrigeration energy in new milk storage. Bulletin de
t'institut du froid- Annexe 1976-1173-178.
Department of Energy. (1978).Energy Policy: a consultative document.
Cmnd 7101,1978, H.M.S.O, London,
Dodd, F.H. and Oough, P:A. (1955). Rept. Nat. Inst. Res. Dairying, 1955.
Dorfinger,H. (1978). Warm milk heats cold• water: A contribution towards
energy conservation and protection of the environment. XX
International Dairy Congress, VolE, 1978,640.
Electricity Council. (1975). Monitoring electricity at the N.A.C. Farm Electric
Focus, No.2, Dec. 1975.
Electricity Council. (1978). Farm Electric Handbook No.17: Milk Production.
June 1972 (Revised 1978).
Fleming and O'Keefe (1982) .. Farmmilkstorage. J.Soc. Dairy Tech. 35(1)
13-15.January 1982.
Fleming, M. G. and o~Keefe, J. (1977). Energy can be saved in the farm dairy.
Farm and Food Research (1977), ~(6) 139-140.
CLXXVI
Hoyle, J.B. and Belcher, J.R. (1971). Which bulk tank? Farm Management
Supplement, Dairy Farmer, 1812 41-47.
Kidd, A. (1979). The energy equation during the eighties; Farmer's Weekly,
28th Dec. 1979.
Kingwill, R.G., Dodd, F.H. and Neave,. F.K. (1979). Mastitis; in Machine
Milking, ed's Thiel, C.C. and Dodd, F.H., publ. N.I.RD. and
Hannah Research Institute, 1979.
Lewis, D.A. and Tatchell, J.A. (1979). Energy ·in UK Agriculture. J. Sci. Food
Agric. 1979,30, 449457
Milk Marketing Board. (1980). U.K.Uairy facts and figures, 1980. The
Federation. of United Kingdom Milk Marketing Boards.
Milk Marketing Board (1981). Shaping up for 1990. Milk •Producer, May 1981
Milk and :Dairies (General) Regulations. (1959). Statutory Instrument 1959,
No. 277 Food and Drugs. H.M.S.O. London.
Ministry of Agriculture, Fisheries and Food. (1976). Milking Parlour
Running Costs, Unpublished internal communication.
Ministry of Agriculture, Fisheries,and Food. (1980) . .Annual Review of
Agriculture. H.M.S.O., London.
Ministry of Agriculture, Fisheries and Food: (1982). Annual Review of
Agriculture; H.M.S.O., London.
CLXXVII
National Economic Development Office. (1981). Milk Production in the
European Community- A comparative assessment. Agriculture
E.D.C., N.E.D.O., London.
Newell, L. (1980). Coolingand storage of milk on farms. J.Soc.Dairy Tech. 33
(4) 136-139;
Norman, A.J. ·(1988). The appraisal andmodelling of the production and use
of hot water in the farm dairy. Ph.D. Thesis.
Norman, A.J., V ranch, A.T., Carpenter, J.L. and Vallis E.A. (1982). Solar
water heating for the farm dairy in. England. Proceedings ofthe
Solar World Forum, Brighton, 1981. Pergamon, 1982.
Pollock, K.A. (1977). The energy crisis: defused• or deferred? Delivered to a
joint meeting of I.Agr.E and l.Mech.E., Exeter, 1977.
Prosser, H.W. (1977). Waste heat recovery in,dairies•on the farm. Presented at
the "Energy on the Farm" conference at N.A.C., December 1977-
revised 11.6.79.
Rennie, N. (1979). Dairy Electrics. A cow costs 1.06 cents a day in electricity.
N.Z.Farmer, March22nd, 1979.
Shepherd, H. M. (1981). A study of energy saving equipment for farm dairies.
Ag. Engnr., Winter, 1981.
Shropshire Farm Institute. (1967). Electricity on the farm at Walford and its
cost effectiveness.
CLXXVIII
Sinclair, G. (1979). Bulk storage of milk at the farm. J.Soc.Dairy Tech. 32(2)
April, 1979.
l:Jbbels, J. and Bouman, S. (1978). The saving of energy when cooling milk
and heating water onfarms- Heat pumps can be economically
justified at large farms. I.I.F. -I.I.R. Commission BZ- Delft (the
Nethedands) 1978-3.
Ubbels, J. (<1977). A heatpump for cooling milk and warming water on the
farm. Koeltechniek70 (1977) nr 5 (mei).
Ubbels, J., van der Gaast, G. and Verheij, C.P. (,1975). Energy saving in milk
cooling and water heating on the fa~m. Zuivelzicht 67 (1975) 21.
White, D.J. (1977). Prospects for greater efficiencyin the use of different
energy sources. Phil. Trans. R. Soc. Lond. B. 281, 261-275,(1977).
White, D.J. (1979). Efficient use of energy in agriculture and horticulture. Ag.
Engnr. Autumn, 1979.
CLXXIX
APPENDIX IV
Related publications by the author.
Bowes, R.C., Carpenter, J.L., Vallis, E.A. and Vranch, A.T. (1981). The
potential of energy saving in milking parlours in the United
Kingdom. In Energy conservation and' use of renewable
energies,in the bio-industries~ Ed. F.Vogt. Pergamon.
Bowes, R.C., Carpenter, J.l:.., Norman, A.J., Vallis, E.A. and Vranch, A.T.
(1980). The potential for the uses of solar water heaters in
milking parlours in the United Kingdom, Department of Energy
SolarHeating Workshop, November 1980.
Bowes, R.C., Carpenter, J.L., Vallis, E.A. and Vranch, A.T. (1981). A study of
methods to optimise energy use in farm dairies in the United
Kingdom. Symposium of Technica!Section IV of Commission
International du Genie Rural. Nottingham University,. April
1981.
Carpenter, J.L., Bowes, R.C., Norman, A.J., Vallis,.E.A. and Vranch, A.T.
(1982). Energy use in herringbone parlours -an assessment of
two years auditingin South Devon, United Kingdom. Presented
to the Heat Pumps in Farming Symposium of the Institute of
Refrigeration, March 1982.
CLXXX
Norman, Alice J, and.Bowes,.R.C. (1984). Electricity in the Farm Dairy:
Requirements, use and conservation. }iSoc.Oairy Tech. 1984.
CLXXXI
Notes on use ofthe accompanying disc.
The accompanying disc is formatted under M5-00S version 3.3 to a
capacity of360K, for use on any IBM 'PC or AT compatible computer running
this operating system. It is nota system disc and therefore cannot be used for
booting the system. It contains 3 files:
• BULK.EXE
• AUDIT.WK1
• AUDIT.ASC
The first of these is the Bulk Tank program. To execute the program, type
BULK atthe DOS prompt and press RETURN. The program is menu-driven as
outlined in Appendix II.
'Phe file AUDIT.WK1 contains the audit data for the first year of auditing
in a format prepared by the spreadsheet package Lotus 1-2~3, version 2.01.
'Phe file AUDIT.ASC also contains the audit data for the first year, but in a
standard ASCII format, which should be interpretabie by a number of standard
software packages.
CLXXXII
ERRAnJM:
When the BULK program is run, the tabulated'results display has an error
in the column headings. The column headed Cond. Temp should in fact be
headed Evaporator Temp.
THESIS PREPARATION.
This thesis has been prepared on a variety of IBM AT compatible
computers and printed on an Apple Laserwriter n NTX Postscript-compatible
printer. Wordprocessing was carried out using Microsoft Word, version 4.
Graphs were prepared using Lotus 1-2-3, version2.01, and the diagram on page
5 was prepared using Microsoft Paintbrush.
The final document was laid out using Xerox VenturaPublisher; version
1.2. Chapter headings are Helvetica 28-pt bold, subheadings are Helvetica 15-pt
bold and 12-pt bold italic. Body text is 12/24 pt Palatino.
CLXXXIII