fao365-turner et al.pdf
TRANSCRIPT
1
INTERACTIONS OF ATLANTIC BLUEFIN TUNA FISHERIES
Stephen C. Turner\ Clay E. Porch\ Victor R. Restrepo2, and Gerald P. Scott1
1U.S. Department of Commerce, National Marine Fisheries Service Southeast Fisheries Science Center, Miami Laboratory 75 Virginia Beach Drive, Miami, Florida 33149, USA.
2University of Miami, Rosenstiel School of Marine and Atmospheric Science Division of Marine Biology and Fisheries
Cooperative Unit for Fisheries Education and Research 4600 Rickenbacker Causeway, Miami, Florida 33149, USA.
Miami Laboratory Contribution MIA-94/95-xx
Abstract
Examples of interactions among Atlantic bluefin tuna fisheries are reviewed. Analyses of the impact of reductions in historical catches of small bluefin tuna in the west Atlantic were conducted under an hypothesis of a West Atlantic resource negligibly affected by mixing with bluefin from the eastern component of the resource. Those analyses indicated that abundances of larger bluefin and presumably catch rates in associated fisheries for that size range would have increased. Analyses conducted under one set of hypotheses about mixing behavior and mixing rates between eastern (including the Mediterranean Sea) and western components of the resource investigated the impacts of alternative levels of fishing in each area on projected abundances. Different catch levels of the more abundant eastern component were shown to impact the western component, while different catch levels for the western area showed no impact on the eastern component.
1. INTRODUCTION
Scientists from ICCAT's the Standing Committee on Research and Statistics (SCRS) operate under the hypothesis that the Atlantic bluefin tuna resource to consists of eastern and western components with limited mixing. Spawning areas are known to exist in the east in the Mediterranean Sea and in the west in the Gulf of Mexico.
Bluefin tagged in the eastern and western regions of the distribution have been recovered in the other area. The rates of intermixing between the regions are not known, because of the absence of accepted biological tags and tagging experiments designed to estimate those rates. Nevertheless those rates have been of great concern,

2
because of their potential impact on the perception of the status of the resource; in the last few years much research in has been conducted on the existing tagging data and possible abundance patterns under hypothesized rates (ButteiWorth and Punt 1994, Anon 1994, Porch et al. in press, Porch in press, Punt and ButteiWorth in press, Turner et al. in press).
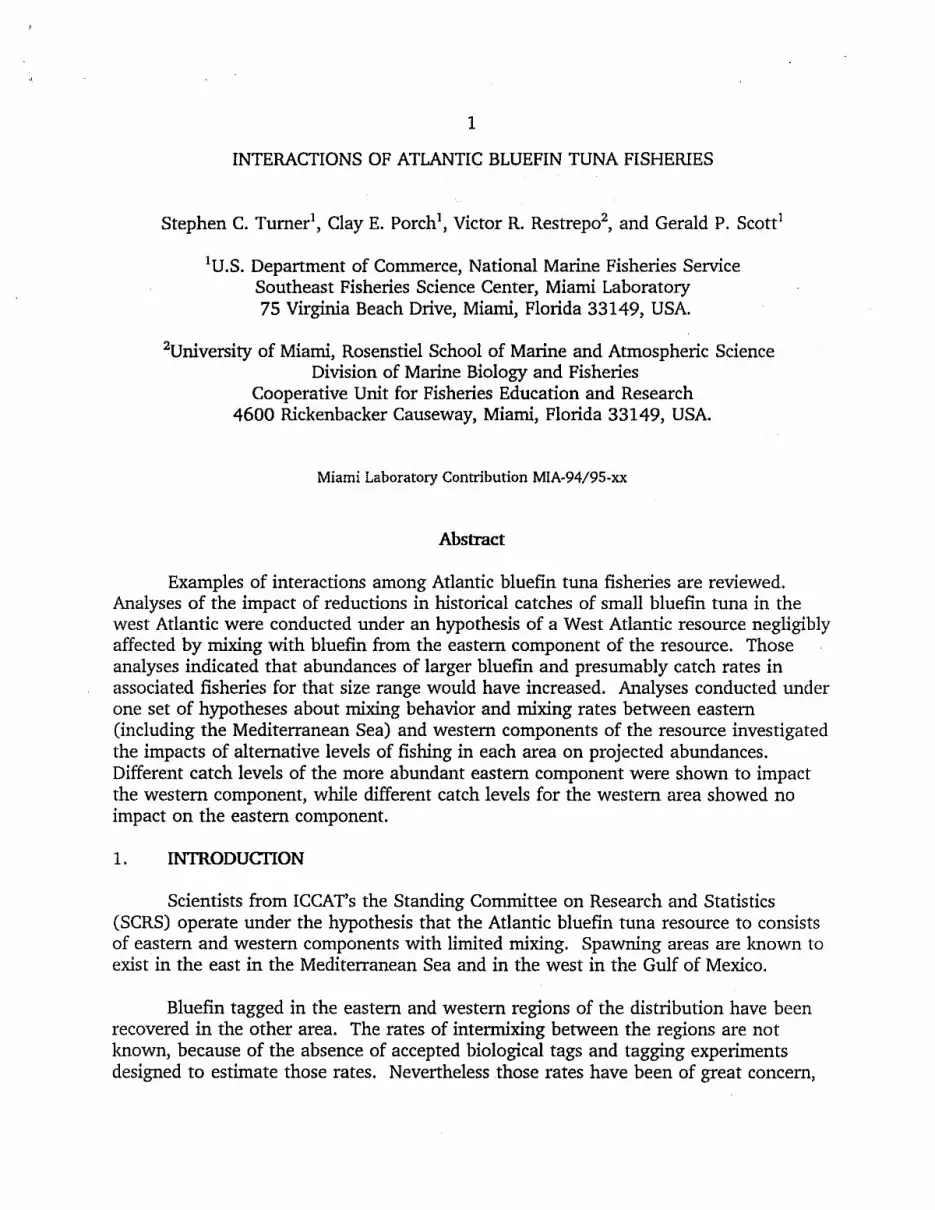
Bluefin from the two areas are thought to grow at similar rates for the first six years (Figure 1) with the western fish growing slightly faster at older ages (Cort 1991, Turner and Restrepo 1994). Eastern fish are thought to mature at about 5 years (about 130-140 em FL) while western fish are thought to mature at about 8 years old (about 195 em FL); however there are concerns about how representative of the population were samples used to estimate those ages at maturity (Deriso and Bayliff 1991) because of the difficulty in obtaining samples throughout the geographic range during the spawning season.
Analyses of the status of the eastern and western resources under the hypothesis of negligible intermixing indicated that the eastern resource was roughly an order of
Fork Length (om)
3SO
300
200
150
o~------------------0 !i 10
Age (year1)
1!i 20
Figure 1. Average lengths at age of eastern (dotted line) and western (solid line) Atlantic bluefin tuna.
magnitude larger than the western resource in recent years (Anon. in press). That the eastern resource is large is supported by reported catches of roughly 500,000 to 1,000,000 1-3 year olds annually which does not include reportedly large undocumented catches of young of the year bluefin.
The purpose of this paper if to provide examples of interactions among Atlantic bluefin tuna fisheries. Recent analyses related to the status of the Atlantic bluefin resource have addressed topics related to fisheries interactions and some of those are reproduced here.
2. METI-IODS
2.1 Reduced catch analyses
The base catch at age and VPA from the 1991 SCRS were used for the status quo analysis. For the reduced catch analysis (1) catches at age for the U.S. rod and reel and handline fisheries were retabulated from the ICCAT catch at size data base on a monthly basis until the desired reduced quota (126.5 mt) was met (as if exact real time
3
monitoring were in place), (2) the recruitment estimated by the SCRS was assumed, and (3) population abundances were calculated via forward solution of the catch equation. Projections for 1991-1995 were made using the SCRS system which attempts to reduce the influence of assumed recruitment (geometric mean of 1978-1990, 54917 fish) on the projected stock; yield is removed from age groups (ages 1, 2-3, 4-5 6-7 and 8 + for these analyses) at defined levels considered reflective of the fisheries and regulations in place. Assumed yields for 1991-1994 were 2660 mt for the status quo projections and 2470 mt (1989-1990 mean) for the reduced catch projections.
2.2 Two component projections with mixing
Initial abundances for the eastern and western component were estimated with a two component VPA assuming mixing at the end of the year using 1970-1992 catch at age data. East to west mixing was assumed to be 1% per year and west to east was assumed to be 4% per year. Those rates were selected from several two component VPAs with different mixing rates because they provided (1) one extreme in a range of western age 8+ abundance estimates and (2) the parameter estimates did not occur at or quite near input or limiting values. The mixing model assumed that fish which transferred to the other side (visitors) had the same probability of transferring back as the fish resident in the new area.
Deterministic projections were conducted assuming (1) west Atlantic 1993 catches of 2538 mt and 1995 mt catches after the year 1993 and (2) for the east component either catches of 27000 mt after 1993 or a fishing mortality rate maximum of 0.6. Recruitment was assumed constant at the geometric mean of the 1981-1990 estimates for each area and selectivities were derived from the geometric mean selectivities for 1989-1991. West Atlantic selectivities on ages 1-3 were modified to reflect ICCAT recommendations for small fish catch reductions (age 1-3 selectivities multiplied by 0.0, 0.28, and 0.28 respectively). Maximum fishing mortality rate on ages 1-9 was fixed at 3.0.
3.. RESULTS
3.1 Interactions between west Atlantic fisheries for small and large fish
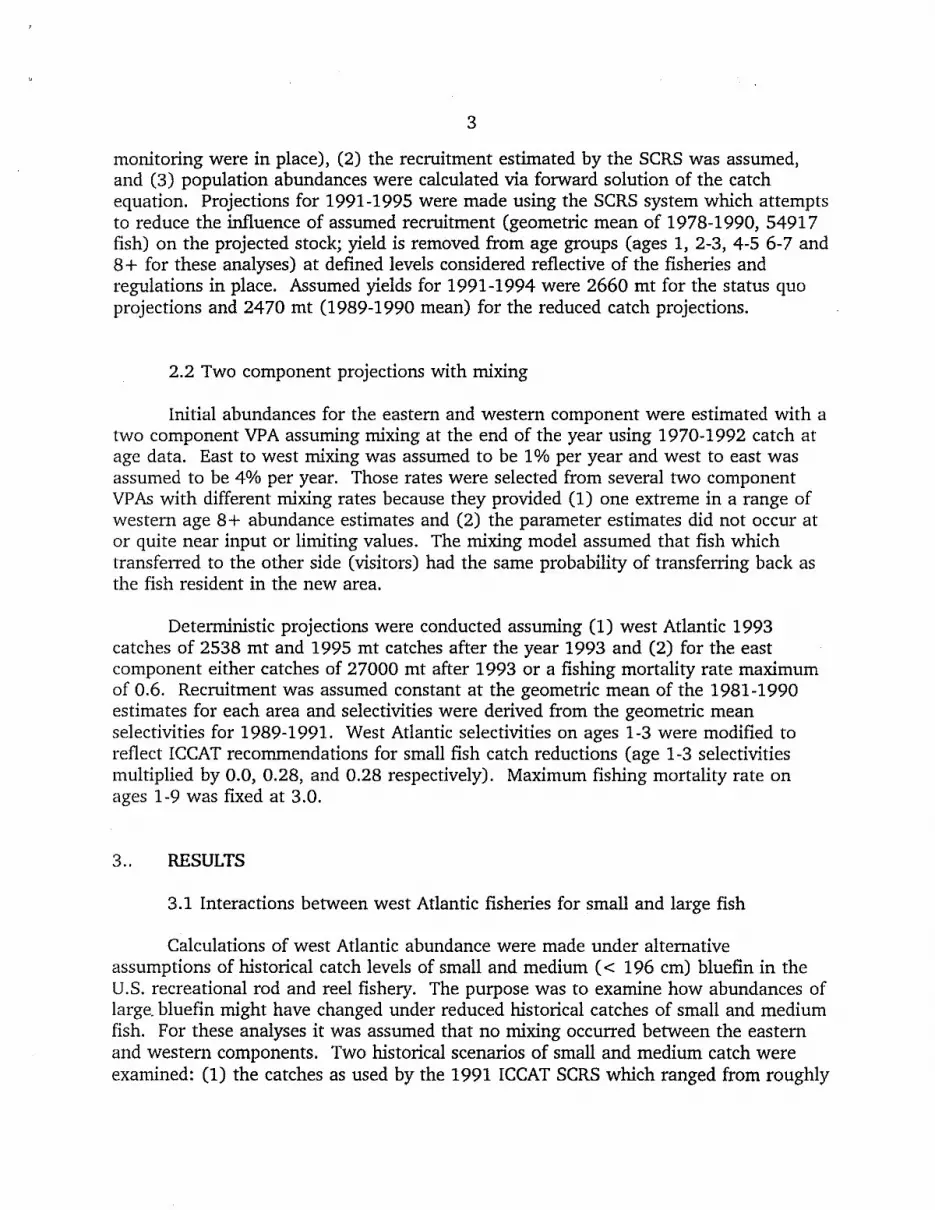
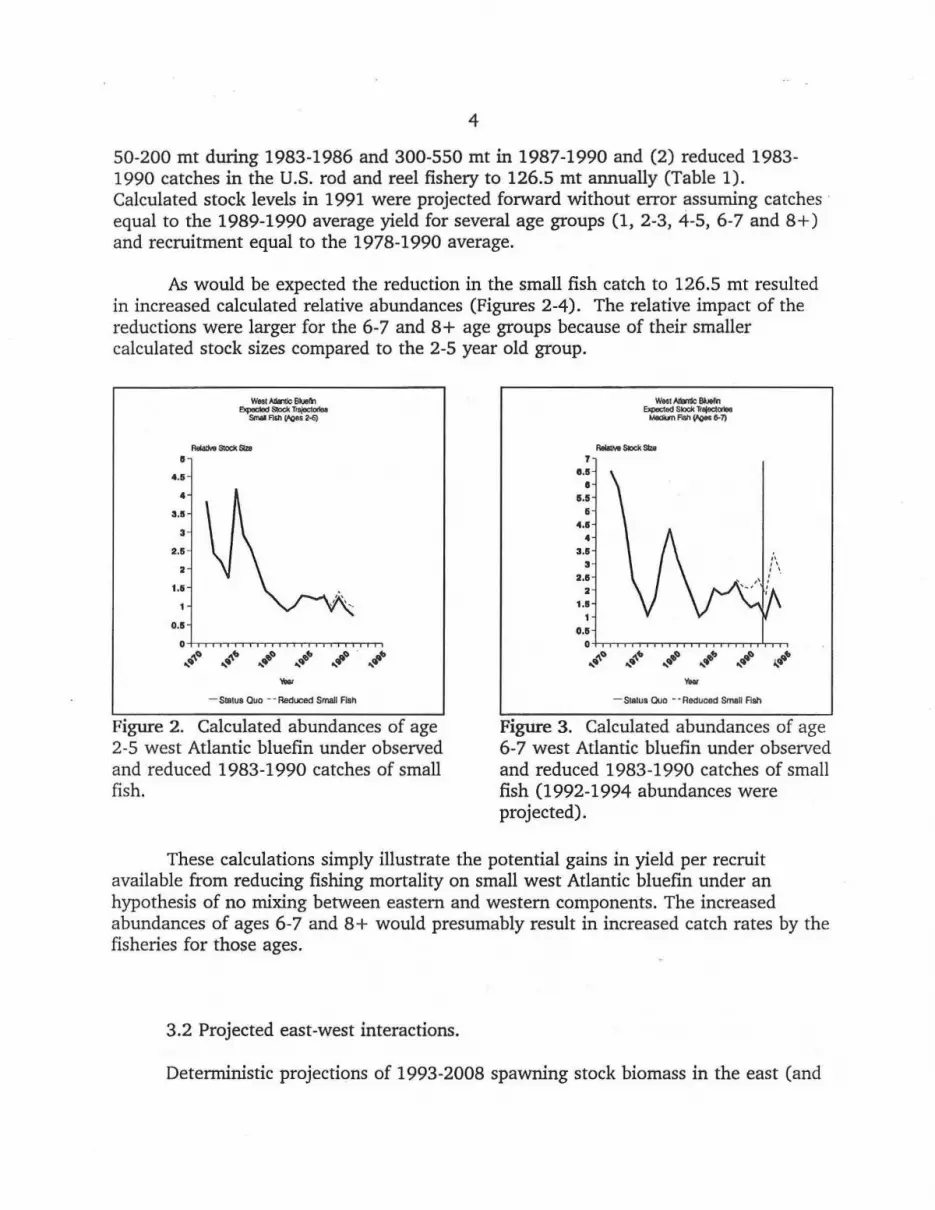
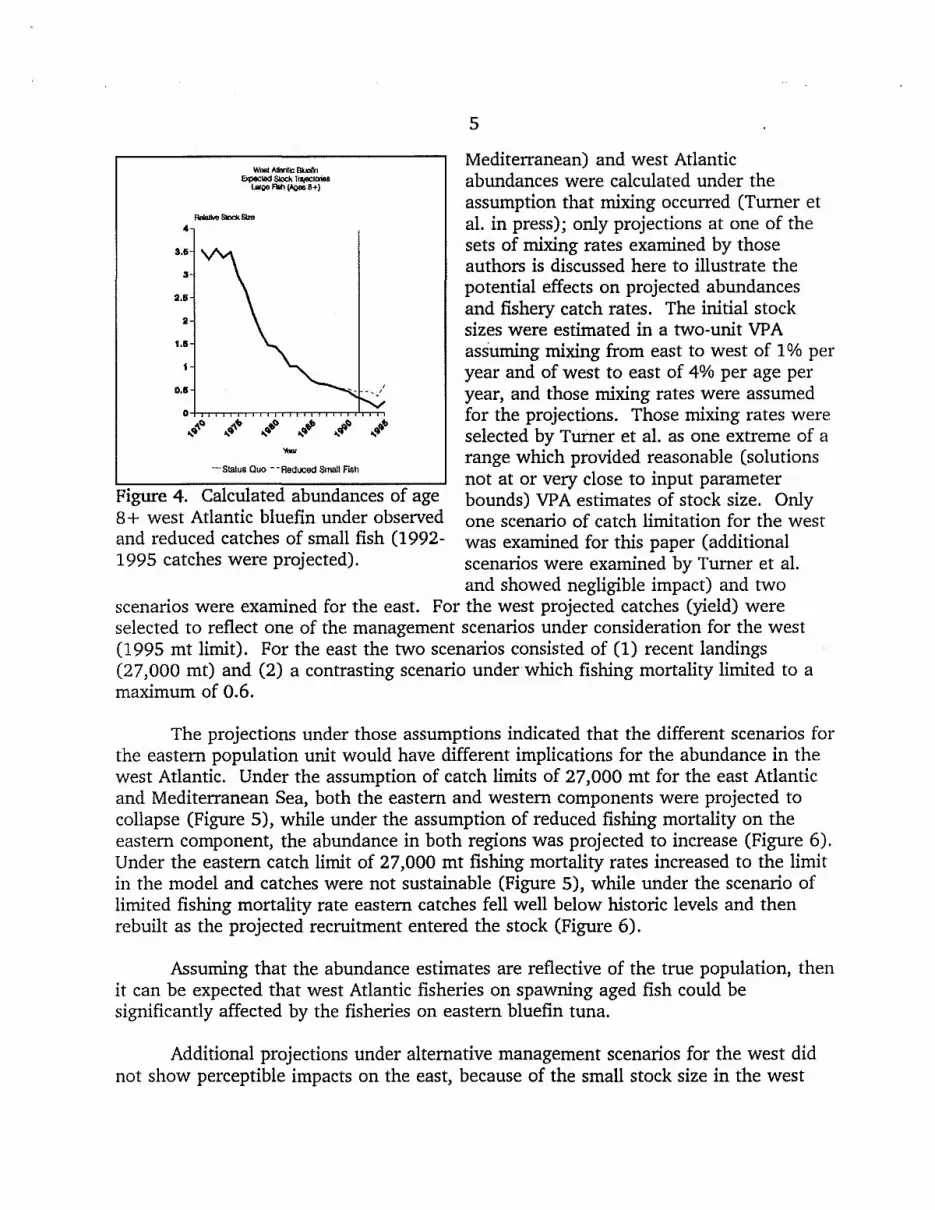
Calculations of west Atlantic abundance were made under alternative assumptions of historical catch levels of small and medium ( < 196 em) bluefin in the U.S. recreational rod and reel fishery. The purpose was to examine how abundances of large. bluefin might have changed under reduced historical catches of small and medium fish. For these analyses it was assumed that no mixing occurred between the eastern and western components. Two historical scenarios of small and medium catch were examined: (1) the catches as used by the 1991 ICCAT SCRS which ranged from roughly
4
50-200 mt during 1983-1986 and 300-550 mt in 1987-1990 and (2) reduced 1983-1990 catches in the U.S. rod and reel fishery to 126.5 mt annually (Table 1). Calculated stock levels in 1991 were projected forward without error assuming catches · equal to the 1989-1990 average yield for several age groups (1, 2-3, 4-5, 6-7 and 8 +) and recruitment equal to the 1978-1990 average.
As would be expected the reduction in the small fish catch to 126.5 mt resulted in increased calculated relative abundances (Figures 2-4). The relative impact of the reductions were larger for the 6-7 and 8+ age groups because of their smaller calculated stock sizes compared to the 2-5 year old group.
4.6
4
~.II
3
2.6
2
1.11
0.11
o+n~~~~~~~~~ ~~ ~.. rib~ rib .. .... .... ..~ .. ~ -- SIBIUA Quo - - Reduced Small Fish
Figure 2. Calculated abundances of age 2-5 west Atlantic bluefin under observed and reduced 1983-1990 catches of small fish.
11.11
• 6.5
4.1 4
3.5 3
2.11 2
1.11
0.11 o+n~~~~~~~~~
.... -..~ ........ .. ... ~ ....... ..•" ~...~ .. -- S!Aiu• Quo - - Reduced Smell Ash
Figure 3. Calculated abundances of age 6-7 west Atlantic bluefin under observed and reduced 1983-1990 catches of small fish (1992-1994 abundances were projected).
These calculations simply illustrate the potential gains in yield per recruit available from reducing fishing mortality on small west Atlantic bluefin under an hypothesis of no mixing between eastern and western components. The increased abundances of ages 6-7 and 8+ would presumably result in increased catch rates by the fisheries for those ages.
3.2 Projected east-west interactions.
Deterministic projections of 1993-2008 spawning stock biomass in the east (and
• •••
••• 2
•••
•••
Wa81AIIan!lcBkJDI'rl ElcpeciOO Slock Tr¥Clcxi&a
I.Mge Fl8h (r*Ooo 8+)
--status Quo --Reduced Small Flr;h
Figure 4. Calculated abundances of age 8+ west Atlantic bluefin under observed and reduced catches of small fish (1992-1995 catches were projected).
5
Mediterranean) and west Atlantic abundances were calculated under the assumption that mixing occurred (Turner et al. in press); only projections at one of the sets of mixing rates examined by those authors is discussed here to illustrate the potential effects on projected abundances and fishery catch rates. The initial stock sizes were estimated in a two-unit VPA assuming mixing from east to west of 1% per year and of west to east of 4% per age per year, and those mixing rates were assumed for the projections. Those mixing rates were selected by Turner et al. as one extreme of a range which provided reasonable (solutions not at or very close to input parameter bounds) VPA estimates of stock size. Only one scenario of catch limitation for the west was examined for this paper (additional scenarios were examined by Turner et al. and showed negligible impact) and two
scenarios were examined for the east. For the west projected catches (yield) were selected to reflect one of the management scenarios under consideration for the west (1995 mt limit). For the east the two scenarios consisted of (1) recent landings (27,000 mt) and (2) a contrasting scenario under which fishing mortality limited to a maximum of 0.6.
The projections under those assumptions indicated that the different scenarios for the eastern population unit would have different implications for the abundance in the west Atlantic. Under the assumption of catch limits of 27,000 mt for the east Atlantic and Mediterranean Sea, both the eastern and western components were projected to collapse (Figure 5), while under the assumption of reduced fishing mortality on the eastern component, the abundance in both regions was projected to increase (Figure 6). Under the eastern catch limit of 27,000 mt fishing mortality rates increased to the limit in the model and catches were not sustainable (Figure 5), while under the scenario of limited fishing mortality rate eastern catches fell well below historic levels and then rebuilt as the projected recruitment entered the stock (Figure 6).
Assuming that the abundance estimates are reflective of the true population, then it can be expected that west Atlantic fisheries on spawning aged fish could be significantly affected by the fisheries on eastern bluefin tuna.
Additional projections under alternative management scenarios for the west did not show perceptible impacts on the east, because of the small stock size in the west
6
and the much greater relative stock size in the east.
3.3 Caveats to projected east-west interactions
These projections were intended to be illustrative of the possible effects on the western component of fishing in east. There are several reasons to think that alternative assessments about the status of these resources may be different than presented here. The mixing rates analyzed were at one extreme of solutions examined by Turner et al. (in press). Additionally, there are uncertainties about the information used for assessing the eastern and the western components, and there are also several unanswered questions about the mixing between the components and how representative is the mixing model used above.
The basic information used for ICCAT SCRS assessments for the east Atlantic and Mediterranean contains many nation-gear strata with large catches for which catches and/or size composition are not known, and it is believed that in recent years unreported catches have substantially increased for several fisheries for which previously catches were well documented. Additionally (1) there are very few indices of abundance available for calibrating the VPA and particularly for fish of ages 4 and older and (2) the indices used for older ages (8+) have not yet stabilized in that there have been changes in the pattern of historical catch rates in recent assessments (Anon in press).
The catch and size composition information for the west Atlantic component of the resource is considered to be much better known than for the eastern component, however recent assessments have shown that basic assumptions about index standardization have little influence on the gross perceptions of the long term trend but can influence the perception of the recent status of the resource. The SCRS has recommended continued investigation into standardization model error assumptions and weighting (Anon in press).
It is known that interchange occurs between the eastern and western fishing areas for bluefin tuna. Young bluefin (1-3 years old) have transferred to the other side of the ocean in 0-2 years and that older bluefin (ages 8+) have transferred from west to east within 2 months. It is not clear (1) whether transfer rates differ with age and area of origin, (2) whether fish which transfer (visitors) are more or less likely to transfer back than fish which were spawned on the side being visited, and (3) what the average transfer rates might be. Such behavior can substantially affect the perceived abundance trends estimated from population models and most likely the migration rates calculated from tagging data.
Several authors have concluded that the under a specific set of model assumptions the existing tagging data and the indices of abundance from each component indicate different patterns in the abundances in each area (Porch et al. in
7
press, Punt and Butterworth in press). Furthermore, Porch (in press) concluded that the existing tagging data provided little information to indicate the likelihood of any of a wide range of transfer rates under the assumption that fish which transfer have the same probability of transferring back as fish which were spawned on the side being visited.
4. Discussion
These examples provide indications of the type of analyses related to fisheries interactions being conducted on Atlantic bluefin tuna. Additional direct (gear conflict) and indirect (yield per recruit and movement related) interactions are known to occur. For many of the interactions additional information on the fisheries (catch and size composition particularly for the Mediterranean Sea) and biology (especially movement patterns) would be needed to move from general models to more precise descriptions of the impacts.
5. literature Cited
Anonymous. 1994a. Report of the National Research Council Review of Atlantic Bluefin Tuna. National Academy Press. Washington D.C. 148p.
in press. Report for the Biennial period 1994-95. Part I (1994). Int. Comm. Conserv. At!. Tunas
Butterworth, D.S. and A.E Punt. 1994. The robustness of estimates of stock status for the western North Atlantic bluefin tuna population to violations of the assumptions underlying the associated assessment models. ICCAT, Col. Vol. Sci. Pap. 42(1): 192-210.
Cort, J.L. 1991. Age and growth of the bluefin tuna (L.) of the northeast Atlantic. Int. Comm. Conserv. Atl. Tunas, Col. Vol. Sci. Pap. 35(2): 213-230.
Porch, C.E. in press. A two-area VPA with discrete mixing: can we discriminate between mixing rates given the present condition of the data? ICCAT, Col. Vol. Sci. Pap. (SCRS/94/75) 30pp.
Porch, C.E.; V.R. Restrepo; S.C. Turner; and G.P. Scott. in press. A virtual population analysis of Atlantic bluefin tuna incorporating movement and tagging data. ICCAT, Col. Vol. Sci. Pap. (SCRS/94/73) 34pp.
Punt, A.E. and D.S. Butterworth. in press. Use of tagging data within a VPA formalism to estimate migration rates of bluefin across the North Atlantic. ICCAT,

8
Col. Vol. Sci. Pap. (SCRS/94/72) 36pp.
in press. Updated assessments of North Atlantic bluefin tuna taking account of trans-Atlantic migration. ICCAT (SCRS/94/125) 25p.
Turner, S.C., C.E. Porch and V.R. Restrepo. in press. Projections of Atlantic Bluefin Tuna Stock Sizes. ICCAT (SCRS/94/158) 23p.
Turner, S.C. and V.R. Restrepo. 1994. A review of the growth of Atlantic bluefin tuna, Thunnus thynnus, estimated from marked and recaptured fish. Int. Cornrn. Conserv. At!. Tunas, Col Vol. Sci. Pap. 42(1): 170-172.
9
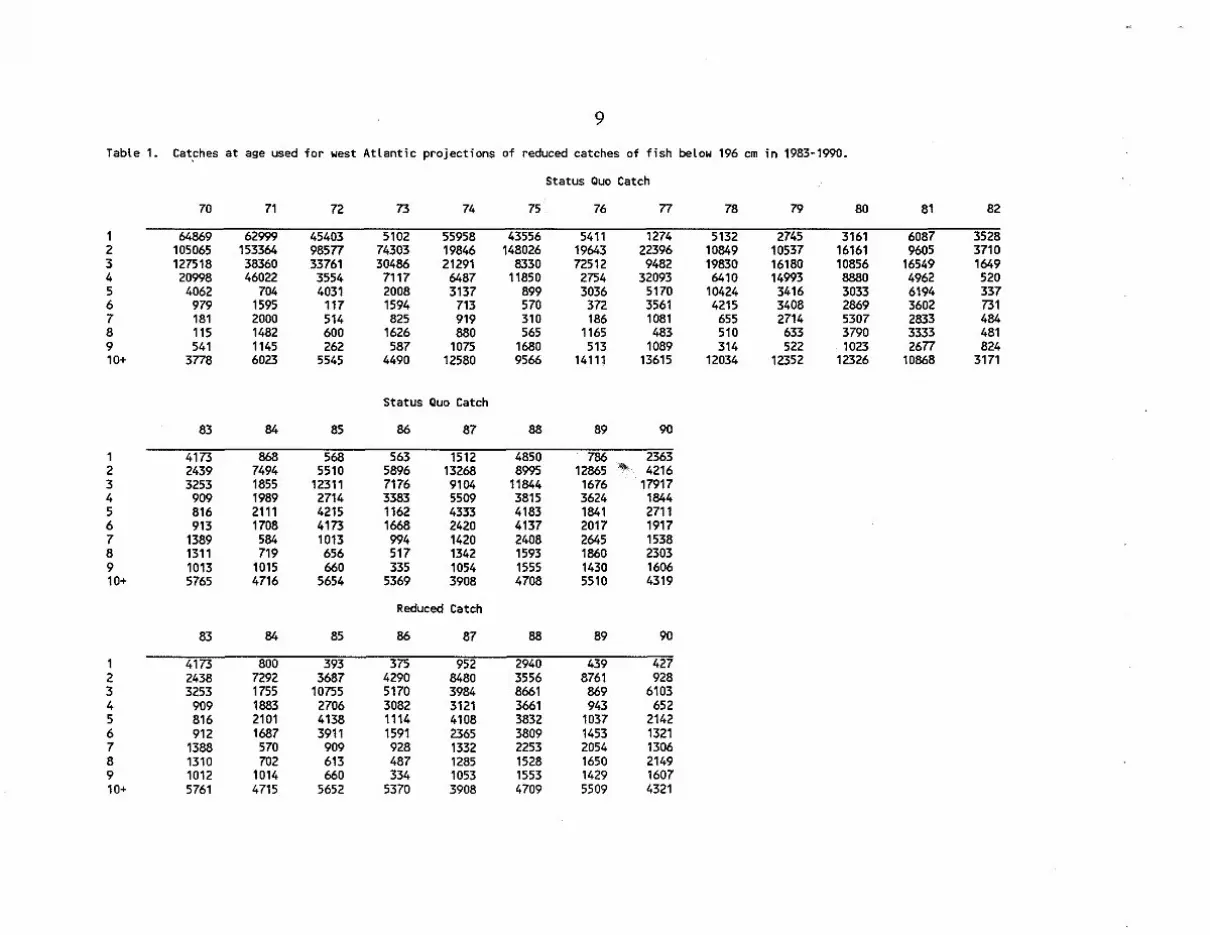
Table 1. Cat,ches at age used for west Atlantic projections of reduced catches of fish below 196 em in 1983-1990.
Status Quo Catch
70 71 72 73 74 75 76 n 78 79 80 81 82
1 64869 62999 45403 5102 55958 43556 5411 1274 5132 2745 3161 6087 3528 2 105065 153364 985n 74303 19846 148026 19643 22396 10849 10537 16161 9605 3710 3 127518 38360 33761 30486 21291 8330 72512 9482 19830 16180 10856 16549 1649 4 20998 46022 3554 7117 6487 11850 2754 32093 6410 14993 8880 4962 520 5 4062 704 4031 2008 3137 899 3036 5170 10424 3416 3033 6194 337 6 979 1595 117 1594 713 570 372 3561 4215 3408 2869 3602 731 7 181 2000 514 825 919 310 186 1081 655 2714 5307 2833 484 8 115 1482 600 1626 880 565 1165 483 510 633 3790 3333 481 9 541 1145 262 587 1075 1680 513 1089 314 522 1023 26n 824 10+ 3n8 6023 5545 4490 12580 9566 14111 13615 12034 12352 12326 10868 3171
Status Quo Catch
83 84 85 86 87 88 89 90
1 4173 868 568 563 1512 4850 786 2363 2 2439 7494 5510 5896 13268 8995 12865 ... 4216 3 3253 1855 12311 7176 9104 11844 1676 17917 4 909 1989 2714 3383 5509 3815 3624 1844 5 816 2111 4215 1162 4333 4183 1841 2711 6 913 1708 4173 1668 2420 4137 2017 1917 7 1389 584 1013 994 1420 2408 2645 1538 8 1311 719 656 517 1342 1593 1860 2303 9 1013 1015 660 335 1054 1555 1430 1606 10+ 5765 4716 5654 5369 3908 4708 5510 4319
Reduced Catch
83 84 85 86 87 88 89 90
1 4173 800 393 375 952 2940 439 427 2 2438 7292 3687 4290 8480 3556 8761 928 3 3253 1755 10755 5170 3984 8661 869 6103 4 909 1883 2706 3082 3121 3661 943 652 5 816 2101 4138 1114 4108 3832 1037 2142 6 912 1687 3911 1591 2365 3809 1453 1321 7 1388 570 909 928 1332 2253 2054 1306 8 1310 702 613 487 1285 1528 1650 2149 9 1012 1014 660 334 1053 1553 1429 1607 10+ 5761 4715 5652 5370 3908 4709 5509 4321

1 0
Ewest Eeast 0.04 0.01
3.5 3.5 7000 30000
3 • • • • • • • • • • 3 0000 25000
2.5 2.5 5000
~ 20000 ;:-
I 2 2 1 <000 !.
I " 15000 : ~ 1.5 1.5 w.. .. 3000 ..
:! 10000 ::l 2000
0.5 0.5 1000 5000
0 0 0 0 1993 1998 2003 2008 1093 1008 2003 2008
v ... v ...
3000 30000 <0000 100000
35000 00000 2500 25000
80000 30000
2000 20000;:-70000
;:- I " !. !. 25000 80000 • • I '· " ~
+ 1500 c
15000 • j 20000 50000 ! •
~ • ll'> e <0000 E ;:: 0 15000 0
1000 • 10000 z z 30000
10000
500 5000 20000
5000 10000
0 0 0 0 1093 1008 2003 2008 1003 1998 2003 2008
v ... Y••r
Figure 5. Fishing mortality rate, yield, spawning stock biomass, and abundance of ages 8+ in 1993-2008 in the east (squares) and west (circles) projected assuming mixing at 4% west to east and 1% east to west with east catches limited to 27,000 mt and west catches limited to 1995 mt after 1994.

J ~
~ ~
I J >
0.7
0.0
0.5
0.4
0.3
0.2
0.1 io • • • • • • • 0 1003 1000 ... ,
3000
2500
2000 1\ 1500 • ····· ········· 1000
... ... 500
• • • 2003
•••• ••
• •
11
Eweat Eeaat 0.04 0.01
3.5 7000
3
2.5 ~ ~ 4000 2 1 I 1.5 ~
§ 3000
2000
0.5 1000
0 0 2000 1003
0~----------~----~ 1003 1000 ... ,
00000
•···· ... 50000
40000 ~ ~
" 30000 I
20000 §
• • •······ 10000
0 1 ... 2003 2000 ....
200000 .... 100000
• 100000
140000
120000 1 100000 ~
Jl 00000 E ,
z 00000
40000
20000
0 2008
Figure 6. Fishing mortality rate, yield, spawning stock biomass, and abundance of ages 8+ in 1993-2008 in the east (squares) and west (circles) projected assuming mixing at 4% west to east and 1% east to west with east fishing mortality limited to 0.6 and west catches limited to 1995 mt after 1994.
