faculty & research working paper - insead
TRANSCRIPT
Social Science Research Centre
Faculty & Research Working Paper Downsize in 3D, Supersize in 1D: Effects of the Dimensionality of Package and Portion Size Changes on Size Estimations, Consumption, and Quantity Discount Expectations
_______________
Pierre CHANDON Nailya ORDABAYEVA 2008/46/MKT
1
Downsize in 3D, Supersize in 1D: Effects of the Dimensionality of Package and Portion Size
Changes on Size Estimations, Consumption, and Quantity Discount Expectations
by
Pierre CHANDON*
and
Nailya ORDABAYEVA**
July 14, 2008
This manuscript has benefited from the comments of Meg Campbell, Klaus Wertenbroch, Ziv Carmon, Philippe Delquié, Marwan Sinaceur and Xavier Drèze. The authors thank Amit Sood, Armando Baquero, Liselott Pettersson, Cécile Adam, Joseph Lajos, Tomasz Obloj, Wenjie Tang, Imran Chowdhury, Alfonso Pedraza-Martinez, Moqi Xu and Sam Aflaki for their help with the data collection.
* Associate Professor of Marketing at INSEAD, Boulevard de Constance, 77305 Fontainebleau Cedex, France, Tel: +33 (0)1 60 72 49 87, Fax: +33 (0)1 60 74 61 84, e-mail:[email protected]
** PhD Candidate, Marketing, at INSEAD, Boulevard de Constance, 77305 Fontainebleau
Cedex, France Tel: +33 (0)1 60 72 91 82, Fax: +33 (0)1 60 74 55 00,e-mail:[email protected]
A working paper in the INSEAD Working Paper Series is intended as a means whereby a faculty researcher's thoughts and findings may be communicated to interested readers. The paper should beconsidered preliminary in nature and may require revision. Printed at INSEAD, Fontainebleau, France. Kindly do not reproduce or circulate without permission.
2
Understanding consumer response to product supersizing and downsizing is an important
issue for policy makers, consumer researchers and marketers. In three laboratory experiments
the authors found that changes in size appear smaller when products change in all three
dimensions (height, width, and length) than when they change in only one dimension.
Specifically, they showed that a) size estimations follow an inelastic power function of the
actual size of the products; b) size estimations are even less elastic when size changes in 3D
than when it changes in 1D; and c) the effect of dimensionality is not reduced by making size
information available. As a result, consumers expect (and marketers offer) steeper quantity
discounts when packages and portions are supersized in 3D than when they are supersized in
1D; consumers pour more product into and out of conical containers (in which volume
changes in 3D) than cylindrical containers (in which volume changes in 1D); and consumers
are more likely to supersize and less likely to downsize when package and portion sizes
change in 1D than when they change in 3D.
Keywords: packaging, size choice, food, visual biases, estimation, psychophysics.
3
Product package and portion sizes have grown significantly over the past decades. Over
the last twenty years, for example, portion sizes have increased by 60% for salty snacks and
52% for soft drinks (Nielsen and Popkin 2003). Because larger package and portion sizes
increase consumption intake, the “supersizing” trend is believed to be one of the prime drivers
of the current obesity epidemic (Ledikwe et al. 2005; Wansink 1996). To respond to public
concerns about overconsumption and to reduce the threat of adverse regulation and litigation,
some companies have recently started downsizing their portions and packages. For example,
in 2003 Kraft Foods successfully introduced 100-calorie packs for its cookies; in 2007 the
restaurant chain TGI Friday’s introduced “Right Portion Right Price” menu items, which were
30% smaller and 33% cheaper than regular-size portions. Concurrent with the problem of
overconsumption, concerns over the rising production and environmental costs of packaging
have encouraged companies like Nestlé Waters and Coca-Cola to switch to less elongated
packages which require less packaging material for a given volume (Deutsch 2007).
In these circumstances, the issue of how consumers respond to changes in both the size
and shape of portions and packages has become important for marketers who seek to increase
the purchase and consumption of their products, as well as for consumers and regulators who
are concerned about improving size estimations and reducing overconsumption. In recent
years, a growing body of research has examined the effects of visual biases on consumer
behavior (Krishna 2007). Studies of size-based biases have shown that people underestimate
the magnitude of changes in portion or package sizes (Chandon and Wansink 2007; Krider et
al. 2001). Studies of shape-based biases have shown that elongated objects appear bigger than
less elongated objects of the same size (Krishna 2006; Raghubir and Krishna 1999; Wansink
and Van Ittersum 2003).
4
However, none of the existing studies has examined the effects of the shape of the size
change itself, and particularly the key issue of the dimensionality of this size change. By
dimensionality, we mean the number of axes in a Cartesian coordinate system along which a
package or portion is supersized or downsized. For example, marketers can supersize a
cylindrical soft drink can by increasing its height—a one-dimensional change—or by
increasing both its height and diameter—a three-dimensional change because the package
increases along all three spatial dimensions (height, width and length). Because a three-
dimensional object can be increased in one, two, or all three dimensions, the dimensionality of
size change is not confounded with the dimensionality of the object itself.
The goal of this research is to examine the effects of the dimensionality of portion or
package size changes on consumers’ estimations of product volume, on their preferences for
supersizing and downsizing in purchase and consumption decisions, and on the magnitude of
the price discounts offered for buying larger sizes. Drawing on research on visual biases, our
main hypothesis is that people are less sensitive to size changes when packages and portions
change in all three dimensions compared to when they change in only one dimension. We find
strong support for this hypothesis in five experiments, three in the laboratory and two in the
field.
This research contributes to the literature on visual biases by showing the importance of
studying the interaction of shape and size effects, rather than focusing on each effect
separately. In particular, we show that when a reference size is available, the elongation of the
size change matters more than the elongation of the final object itself. For example, we find
that a short and wide 100g cylindrical candle appears larger than a taller and thinner 100g
candle if the short and wide candle was created by increasing the height of a shorter 50g
candle with the same diameter while the tall and thin candle was created by increasing both
5
the height and diameter of another 50g candle with the same height-to-width ratio as the taller
and thinner candle.
Our finding that dimensionality influences consumers’ willingness to pay (WTP) for
larger packages and their purchase and consumption quantity decisions also shows that its
effects are not simple response biases due to the unfamiliarity of the task and scale but have
important implications for consumers and marketers. In particular, our results show that
consumers demand lower unit prices for larger packages not just because of diminishing
marginal utility or storage costs but because they underestimate the actual increase in product
quantity provided by larger packages. Finally, we show that providing objective volume
information improves the accuracy of size estimations but does not reduce the effects of
dimensionality. In contrast, we find that changing product sizes in 1D encourages downsizing
and reduces the overdosing of alcohol and infant medicine, which may have important
implications for policy makers.
HOW PEOPLE ESTIMATE PACKAGE OR PORTION SIZE CHANGE
When assessing portion size (e.g., of meals served in restaurants), size information is not
mandatory and consumers have little choice but to estimate it visually. In this context, several
studies show that people are unable to accurately judge portion sizes and are often unaware of
changes in portion size, and that their estimations are biased by visual cues linked to the size
and shape of the portion (Chandon and Wansink 2007; Wansink et al. 2005). For most
packaged goods it is possible to know the magnitude of a package size change by simply
reading the size information on the label. Still, surprisingly few people actually do so. Some
find size information difficult to read and process, especially when it uses non-metric units
(Viswanathan et al. 2005). Other people use the size of the package itself as a proxy for the
6
volume or weight of the product it contains. In fact, Lennard et al. (2001) found that 47% of
consumers think that the physical size of the package is generally a reliable guide to how
much it contains.
Size Effects
Research in psychophysics has shown that visual estimations of the volume of an object
follow an inelastic power function of the object’s actual size (Stevens 1986). This
relationship, the power law of sensation, is expressed mathematically as:
(1) ESTSIZE = a × (ACTSIZE)b,
where ESTSIZE is the estimated size, ACTSIZE is the actual size, a is an intercept, and
b—the power exponent—captures the elasticity of the estimation, and is always less than 1.
Equation 1 has several notable properties. First, estimations are nonlinear and exhibit
marginally decreasing sensitivity (i.e., they are inelastic) such that the subjective impact of
increasing object size diminishes as the size of the package increases. As a result, people
underestimate the magnitude of size changes. If the actual volume is multiplied by a factor of
r, the perceived volume is multiplied by a factor of (r)b, which is a smaller number since b < 1.
For example, if b = .6, a typical number when estimating the size of three-dimensional
objects, an object three times bigger appears less than two times bigger (3.6 = 1.93).
There is considerable empirical evidence that people’s estimations of the size of a wide
variety of geometrical objects are inelastic. In her review of psychophysics research on size
perception, Krishna (2007, p. 180) states that “The exponent range of 0.5-1.0 appears fairly
robust and generalizable across shapes of the same dimensionality.” These results were
replicated in various consumer contexts, such as when estimating the sizes of round and
square pizzas (Krider et al. 2001; Krishna et al. 2007) and the sizes of fast food meals
7
(Chandon and Wansink 2007). Although familiarity, expertise and self construal traits (but not
gender), influence the elasticity of size estimations, almost all individuals provide inelastic
size estimations.
Interaction of Size and Shape Effects: Effects of the Dimensionality of Size Change
A number of studies have examined the effects of the shape of an object on estimations of
its size when size itself is held constant. The major finding of these studies is that people
perceive objects with a higher height-to-width ratio to be bigger than less elongated objects of
the same size, a phenomenon referred to as the elongation bias (Piaget 1969). For example,
tall, thin glasses are perceived to contain a greater volume than short, wide glasses (Raghubir
and Krishna 1999; Wansink and Van Ittersum 2003). This effect persists even with real
packages providing volume information. Yang and Raghubir (2005) found that people’s
volume estimations are, on average, 16% higher for beer bottles than for beer cans that are the
same size yet less elongated.
Recent studies have expanded these results and reversed the elongation bias in some
conditions. Krishna (2006) found that the elongation bias does not hold when people touch a
glass without looking at it. Folkes and Matta (2004) did not find the elongation bias for
complex package shapes; rather, they found that people perceive unusual package shapes that
attract more attention as being bigger. While all these studies examined how object shape
influences perceived size when holding size constant, they did not examine whether the shape
of the size change itself (i.e., how the object “grows”) influences the perceived magnitude of
the size changes.
Some studies have estimated psychophysical functions for objects of different
dimensionality (Ekman 1958; Frayman and Dawson 1981; Teghtsoonian 1965). These studies
8
found that people’s estimations of the length of a line are fairly accurate, with exponents close
to 1.0. In contrast, people’s estimations of the area of two-dimensional objects are inelastic,
with exponents between .7 and .8 across a variety of object shapes. Estimations of three-
dimensional objects, such as cylinders or spheres, are often even less elastic, with exponents
around .6. These differences are probably multiply determined (see Krishna 2007 for a
review) and can be explained by biases in information selection (ignoring the second or third
dimension), biases in information integration (incorrectly combining the information from the
different dimensions, for example, by adding them instead of multiplying them), differences
in the salience of dimensions, and differences in the attention-getting effects of objects of
different dimensionality. In any case, these results suggest that the dimensionality of objects
systematically influences the elasticity of size estimations, with higher dimensionality leading
to lower size estimation elasticity.
Still, these studies alone do not provide conclusive evidence that resizing an object along
one or multiple dimensions will influence people’s perceptions of the magnitude of the size
change. First, these findings are based on estimation of the sizes of objects that are either one-
dimensional, two-dimensional or three-dimensional by construction (e.g., lines for 1D,
rectangles for 2D, and cylinders for 3D). The elasticity results may therefore be caused by the
specific visual properties of the objects themselves (e.g., their shape or texture) and not just by
their dimensionality. This may explain some inconsistent findings, such as those by Moyer et
al. (1978), who found a lower exponent for the estimation of a two-dimensional object (the
area of US states on a map) than for the estimation of three-dimensional objects (tennis balls
and volley balls). A second and more important limitation of these studies is that the
differences in exponents may be driven by the dimensionality of the objects themselves and
not by the dimensionality of the size changes. Indeed, it is possible to increase the size of a
9
three-dimensional object along one dimension only (e.g., by changing only its height), along
two dimensions (by changing its height and width), or along all three dimensions.
Only two extant studies have manipulated the dimensionality of a size increase while
holding the shape of an object constant. The first (Pearson 1964) showed that decreasing the
height of a cylinder while holding its diameter constant reduces its apparent volume faster
than when decreasing its diameter while holding its height constant. The second (Frayman and
Dawson 1981) also found that people’s estimations of the volume of a cylinder are more
elastic when the height of the cylinder is decreased than when the height-to-diameter
proportion of the cylinder is maintained (and hence the size is decreased along both
dimensions). However, their results were only statistically significant for the smallest sizes of
their set (8 cm3, or .27 fl. oz.), which is much smaller than most portions and packages on the
market. In addition, these studies used abstract geometric objects (wooden cylinders) and
arbitrary units (a comparison to a standard sphere assigned a value of 100 points). It remains
to be seen whether their results would hold among consumers estimating familiar product
packages or food portions, and with the smaller magnitudes of size changes typically observed
in commercial products.
In summary, psychophysics studies lead us to expect that estimations of the size of
product packages or food portions follow an inelastic power function of their actual size.
Furthermore, we hypothesize that size estimations are even less elastic when a package or
portion is increased or decreased along all three dimensions than when it is changed along one
dimension only. We test these two hypotheses in the first experiment.
10
STUDY 1: EFFECTS OF RESIZING DIMENSIONALITY ON SIZE ESTIMATIONS
Method
Study 1 used a mixed design with six within-subjects size conditions (50, 100, 200, 400,
800, and 1,600 grams) and two between-subjects resizing dimensionality conditions (one-
dimensional or three-dimensional resizing). An experimenter recruited people near a large
urban university to participate in a study about packaging in exchange for a voucher for a
sandwich and a soda. The experimenter implemented the between-subjects dimensionality
manipulation by assigning each participant to one of two rooms. In both rooms, participants
viewed color pictures of six ordinary cylindrical candles, which were identical except for their
size. The six pictures were arranged in increasing order on a table and were labeled A through
F. We told the participants that the smallest candle weighed 50 grams and asked them to write
the size (in grams) of the remaining five candles in whatever order they wanted. We chose
grams as the size unit because candles are typically sold by weight and because people are
more familiar with grams than with other size measures, such as cm3. Candles are sometimes
described in terms of burn time, but we did not choose this unit because the shape of a candle
can influence how fast it burns. We assumed a one-to-one correspondence between
participants’ estimations of volume and weight change because the stimuli were identical
across the resizing conditions in every respect except for size.
---- Insert Table 1 about here ----
11
We chose ordinary cylindrical candles as stimuli because they are familiar objects
commonly available in a variety of sizes (e.g., from 50 grams, a typical size for a glow candle,
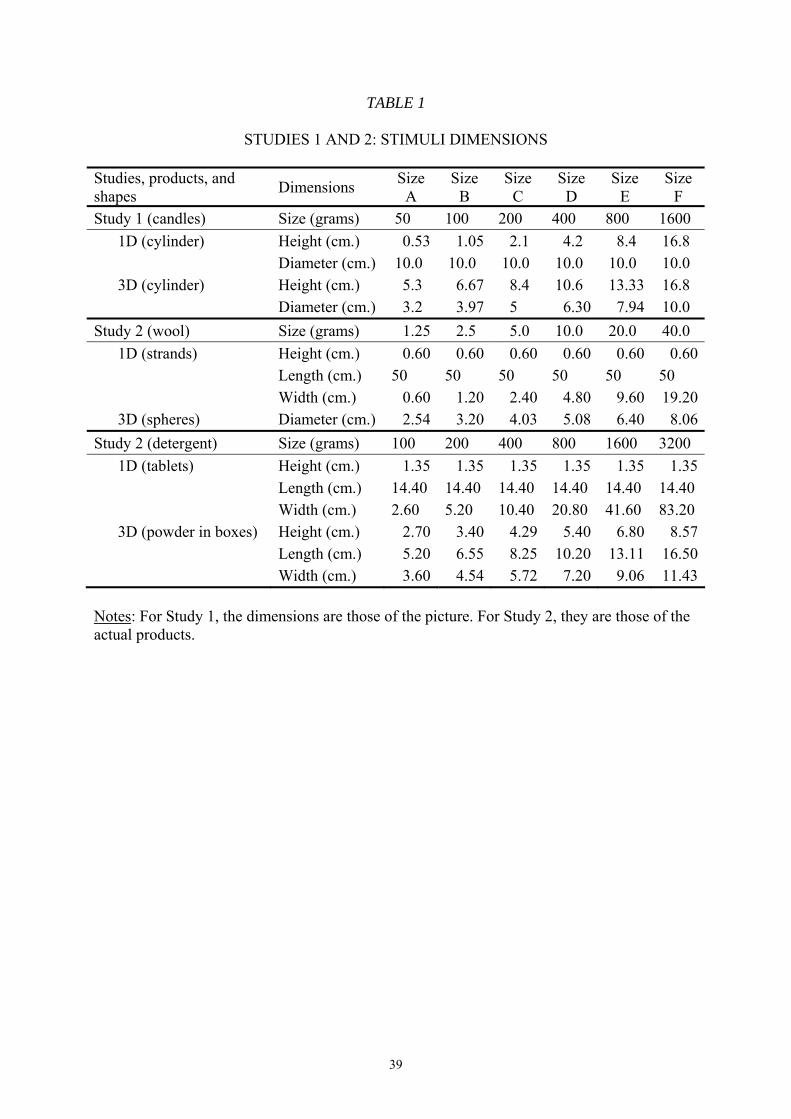
to 1.6 kilograms, the approximate size of a medium decorative pillar candle). Table 1 shows
the dimensions of the 12 candles used in Study 1 and their pictures are provided in the Web
Appendix. Table 1 shows that the largest candles (size F) were identical in the two
dimensionality conditions. In the 1D size change condition, the smaller candles were created
by halving their height from one size to the next. In the 3D size change condition, the height
and diameter of the candles were both reduced by 20.6% from one size to the next, which is
enough to halve the volume of the cylinders. The candles were thus shorter and wider (less
elongated) in the 1D condition than the same-size candles in the 3D condition.
Results
To test whether the elasticity of size estimations is lower in the 3D condition than in the
1D condition, we first fitted a power model for each of the 60 participants (using the five
estimates that they provided) by linearizing the power model shown in Equation 1 as follows:
(2) ln(ESTSIZE) = α + β × ln(ACTSIZE) + ε,
where ESTSIZE is estimated size, ACTSIZE is actual size, α and β are the two model
parameters (and are related to the parameters in Equation 1 as follows: α = ln(a) and β = b),
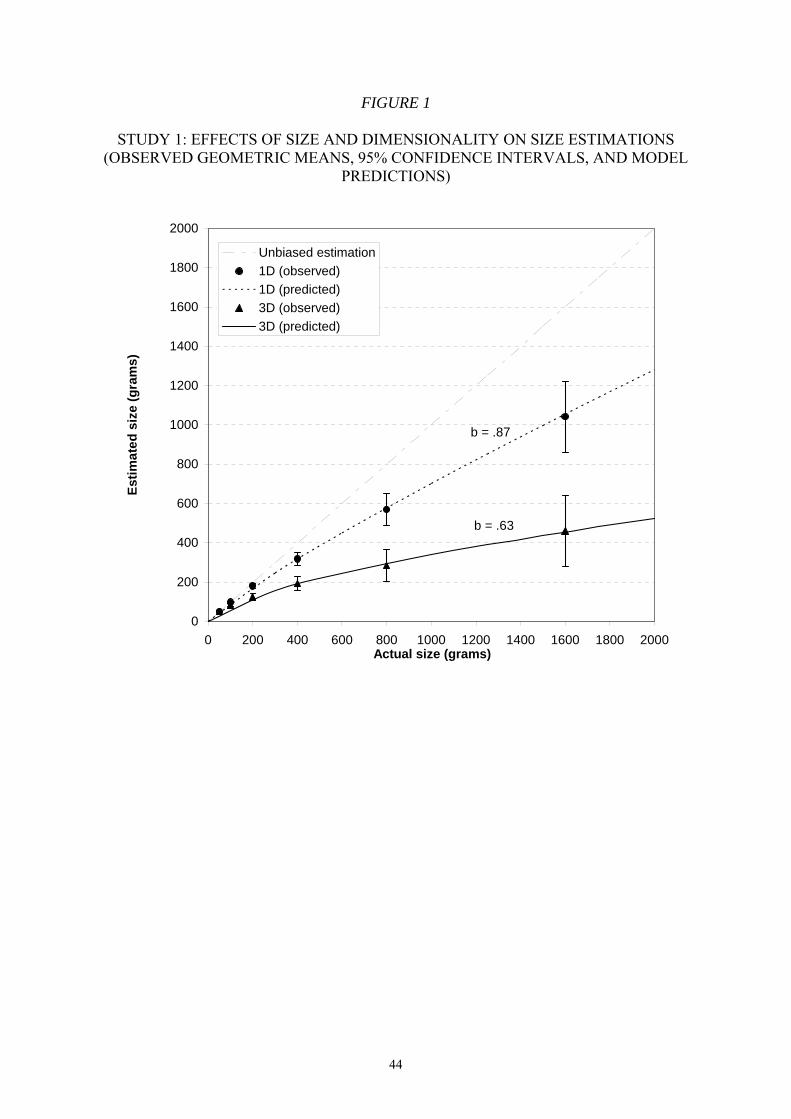
and ε is the error term. The mean value of the power exponent was .87 (SE = .02) across
participants in the 1D condition and .63 (SE = .03) across participants in the 3D condition. As
expected, both exponents were significantly smaller than 1 (t-value = -5.6, p < .001 in the 1D
condition and t-value = -13.5, p < .001 in the 3D condition), which indicates that size
estimations were inelastic in both conditions. More importantly, the elasticity of size
estimations was significantly lower in the 3D condition than in the 1D condition (t = - 4.7, p <
12
.001), as we expected. Identical results were obtained when pooling estimations across
dimensionality conditions and using a repeated-measures moderated regression with actual
size, dimensionality, and their interaction as independent variables. (These results are
provided in the Web Appendix).
---- Insert Figure 1 about here ----
To illustrate these results, Figure 1 shows the observed geometric means and confidence
intervals of the size estimations across participants in the 1D and 3D conditions. As Figure 1
shows, the mean estimates were all below the 45° line, indicating that the participants
significantly underestimated the actual increase in size in both conditions. Figure 1 also shows
that mean estimates were significantly higher in the 1D condition than in the 3D condition, as
predicted. The size estimates predicted by the fitted power models are also shown in Figure 1.
Both power curves are well inside the 95% confidence intervals for all sizes, indicating that
power models fit the data well. In fact, we found that the power model fits the data better (R2
= .79, F(1, 346) = 1276, p < .001, AIC = -1.51) than a linear model (ESTSIZE = a' + b' ×
ACTSIZE + ε', R2 = .56, F(1, 346) = 441, p < .001, AIC = 11.16) and has a lower mean
percentage error (MAPE = .40 for the power model vs. MAPE = .52, for the linear model, t =
-9.3, p < .001).
Discussion
The results of Study 1 strongly support our hypotheses that size estimations follow an
inelastic power function of actual sizes and that they are even less elastic when products
increase in 3D compared to when they increase in 1D. The size of these effects was
13
remarkable: for the 200-gram candles (size C), estimates were 44% larger in the 1D condition
than in the 3D condition (180 vs. 125 grams respectively). The difference reached 126% for
the 1,600-gram size F candles (1,041 vs. 460 grams). Another way of looking at these results
is to observe that a 32-fold increase in the size of the candle appeared as a 21-fold increase in
the 1D condition, but as a 10-fold increase in the 3D condition.
Study 1 also showed that candles appeared to be bigger in the 1D condition than in the 3D
condition, even though they were less elongated in the 1D condition than in the 3D condition,
which is the opposite of the classic elongation bias result. Still, these results do not falsify the
elongation bias and the contradiction can be easily resolved by noticing that our procedure (by
providing the size of the smallest candle) encouraged participants to focus on the magnitude
of size change. In the classic procedure of elongation bias studies, however, there is no
reference size and people simply see two objects with the same actual size, but one more
elongated than the other. We can therefore summarize the elongation and dimensionality
effects as follows: In the absence of a reference size, elongated objects appear larger (this is
the elongation bias). In the presence of a reference size, the dimensionality (and hence the
elongation) of the size change matters more than the elongation of the final object itself and
objects appear larger when they are supersized in 1D than when they are supersized in 3D.
Study 1 has some limitations. First, some studies found that size estimations are more
elastic when people see the actual objects rather than pictures of these objects (Ekman and
Junge 1961; Frayman and Dawson 1981). Second, the one-dimensional package increases
were implemented by increasing the height of the candles because increasing the width of a
cylindrical candle would actually be a two-dimensional change. It would therefore be
important to know whether the dimensionality effects found in Study 1 would also hold when
people are looking at real objects and when a dimension other than height (i.e., length or
width) is manipulated in the 1D condition. Second, the results of Study 1 may be response
14
biases that only occurred because people were specifically asked to estimate sizes, something
that few probably do spontaneously. Would dimensionality influence responses to more
familiar tasks such as estimating willingness to pay, even when people are not explicitly asked
to estimate size?
Examining WTP also allows us to re-examine why consumers demand quantity discounts
(i.e., lower unit prices) for larger sizes. According to Nason and Della Bitta (1983), 81% of
consumers expect to pay lower unit prices for larger sizes and marketers commonly offer such
quantity discounts. Common explanations for quantity discounts are diminishing marginal
utility, budget constraints, fairness considerations (driven by expectations that larger sizes are
more profitable for sellers because of lower packaging and other fixed costs), and the lower
convenience of buying in larger quantities (Clements 2006). Study 1 suggests that another
explanation may be that larger product sizes appear smaller than they really are because of the
inelasticity of size estimations. In other words, WTP for larger sizes may be mediated by
biased size estimations. This would imply that (a) WTP also follows an inelastic power
function of actual sizes, rather than the linear function that is often used, (b) quantity
discounts are steeper when packages are supersized in 3D than when they are supersized in
1D, and (c) interventions that reduce size biases, such as providing information about the
actual size of the products, also reduce quantity discount expectations and the effects of the
dimensionality of size changes. So far, these questions remain largely unanswered. Krider,
Raghubir, and Krishna (2001) found a linear relation between true area and reservation prices
for three sizes of round and square pizzas. However, this result might be because of the
limited range of sizes that they used (pizzas varied between 50 and 150 sq. inches). They also
found that providing information about the area of the pizzas (in square inches) reduced
quantity discount expectations for square pizzas, but not for round ones. We examine these
issues in Study 2.
15
STUDY 2: EFFECTS OF RESIZING DIMENSIONALITY AND OF SIZE INFORMATION ON
SIZE ESTIMATIONS AND QUANTITY DISCOUNT EXPECTATIONS
The main goals of Study 2 are to examine whether the dimensionality of product size
change influences the prices people are willing to pay for increasing sizes (and thus quantity
discount expectations) and whether these effects are mediated by size estimations. We also
examine whether providing objective size information reduces quantity discount expectations
and the effects of dimensionality. If consumers expect quantity discount at least partially
because of inelastic size estimations (i.e., because they do not realize how large the larger
sizes are), informing them about the actual size of each product should increase their WTP for
larger sizes and hence reduce quantity discount expectations. It should also moderate the
effects of dimensionality, since people can simply read the label to know the product’s size
instead of relying on biased visual estimates. Finally, Study 2 examines whether the results of
Study 1 regarding the effects of dimensionality on size estimations can be replicated when
people are looking at actual products rather than at pictures of products, when one-
dimensional size change is done by increasing the width of products rather than their height,
and with two new products.
Method
One hundred and sixty-two participants were recruited near a large urban university to
participate in a study in exchange for a voucher for a sandwich and a soda. We used a mixed
design with one within-subjects factor (six geometrically-increasing sizes labeled A through
F), two between-subjects factors (the dimensionality of size increase: one vs. three; and size
16
information: present vs. absent), and one control condition (size information only, no visual
inspection of the products). Two products, dishwashing detergent and wool, were used as
within-subjects replications. Unlike in Study 1, in which the participants provided only size
estimates, the dependent variable in Study 2 was WTP for each size. When size information
was absent, participants also provided size estimates in grams (the typical unit for these two
product categories). We systematically counterbalanced the order of the questions about WTP
and size estimations when the participants provided both.
As in Study 1, the actual size of the products doubled from one size level to the next, and
information about the smallest size (Size A = 100 grams for detergent, and Size A = 1.25
grams for wool) was provided. In addition, the price of Size A was also provided ($0.50 for
detergent and $0.25 for wool). In the control condition, the actual weights of the six product
sizes were available and the participants were asked to provide their WTP for each size
without actually seeing the products. In the other four conditions the participants saw the
actual products increase either in 1D or 3D, and information about their sizes was either
available or not.
Table 1 shows the actual dimensions of the stimuli in the two dimensionality conditions.
Images of the stimuli are provided in the Web Appendix. In the 3D condition, the
dishwashing detergent was in white cubic cardboard boxes increasing in height, length and
width, and the wool was in spherical balls of increasing diameter. In the 1D condition, the
dishwashing detergent was in tablets placed next to one another forming rectangular blocks
that were four tablets long, one tablet high, and between one and thirty-two tablets wide; the
wool was in a rectangular pattern made of one single strand that zigzagged back and forth.
This pattern was half a meter long, one strand high, and between one and thirty-two strands
wide (see the picture in the Web Appendix). As Table 1 shows, the height of the stimuli was
held constant in the 1D condition and was always lower than in the 3D condition. If people
17
estimate sizes based solely on the height of objects, or based on the change in height,
estimates should be lower in the 1D condition than in the 3D condition. However, if—as we
expect—size changes appear larger when they are one-dimensional than when they are multi-
dimensional (regardless of which dimension is increased), size and WTP estimates should be
higher in the 1D than in the 3D condition.
Size Estimation Results
We first estimated the power model shown in Equation 2 for each product and participant
in the two conditions in which the participants did not know the actual size of the products B
through F. The average elasticity across participants was significantly larger in the 1D
condition than in the 3D condition for both detergent (β = .92 vs. β = .75, t = 3.2, p < .01) and
wool (β =.94 vs. β =.61, t = 6.4, p < .01). As in Study 1, these results were replicated in a
repeated-measures moderated regression model, in which we pooled data across conditions,
participants and category replications (for detailed results, see the Web Appendix). To
illustrate these results, Figure 2 shows the geometric means and confidence intervals of size
estimations rescaled by the size of the smallest option (Size A) in the 1D and 3D conditions,
pooled across the two products. Figure 2 shows that, as in Study 1, a nonlinear power model
fitted the size estimates very well.
---- Insert Figure 2, Figure 3, and Table 2 about here ----
Willingness to Pay Results
18
Figure 3 shows the mean WTP rescaled as a multiple of the price of the smallest size,
pooled across the two products and the model predictions in each of the five conditions. We
estimated the model shown in Equation 2 with (rescaled) WTP as the dependent variable for
each participant and for each product, obtaining a total of 324 regressions. Table 2 shows the
mean exponent for each product averaged across the respondents in each condition. The
superscripts in Table 2 show the results of pairwise t-tests indicating whether the exponents
were statistically different across conditions. The results of these simple statistical tests were
confirmed with a repeated-measures moderated regression with three independent variables
(capturing the effects of actual size, dimensionality and availability of size information) and
including all two-way and three-way interactions. The results of the moderated regression are
provided in the Web Appendix.
Table 2 and Figure 3 show that in all five conditions WTP followed an inelastic power
function, not a linear function, of the actual size of the product (i.e., all the exponents are
statistically below 1). They also show, as expected, that WTP was less elastic to changes in
package size in the 3D condition than in the 1D condition for both products, regardless of
whether size information was present or absent. In addition, WTP was more elastic when size
information was present than when it was absent, indicating that the provision of information
on actual sizes reduces the quantity discounts demanded by consumers. However, the effects
of dimensionality persisted even when size information was present. Confirming this, the
moderated regression results show that the availability of size information significantly
improved the accuracy of size estimations but did not influence the effects of dimensionality.
Finally, there were no differences between the control (no visual information) condition and
the 1D condition when size information was present. This shows that looking at the products
change in 1D did not change willingness to pay compared to just knowing their sizes, whereas
19
seeing the products change in 3D significantly reduced willingness to pay, even though
information about the actual sizes of the products was always available.
Overall, these analyses show that both size and WTP estimations follow inelastic power
functions of actual size, moderated by the dimensionality of the size changes. This raises the
question of whether the effects of size change and the effects of the dimensionality of these
size changes on WTP are mediated by size estimations. Considering first the effects of size
changes, a Sobel test (1982) revealed that size estimations significantly mediated the effects
of size change on WTP for both detergent (z = 26.7, p < .01) and wool (z = 22.0, p < .01). The
results of a similar Sobel test revealed that size estimations also significantly mediated the
impact of the dimensionality of size changes on WTP for both products (z = -2.6, p < .01 for
detergent and z = -5.1, p < .01 for wool). Both results therefore support the size estimation
mediation.
Discussion
In Study 2, we first replicated the results obtained in Study 1 and demonstrated that the
effects of size changes and their dimensionality hold when estimating actual products, and not
just for their pictures. Second, we found that WTP for increasing sizes was mediated by
consumers’ biased estimations of these sizes, and hence also followed an inelastic power
function with a lower elasticity for 3D than for 1D size changes. We also found that making
objective size information available reduced quantity discount expectations but did not reduce
the effects of dimensionality. Finally, we found the same quantity discounts when size
information was present and products increased in 1D as in the control condition when people
could not look at the products and only had information about their sizes. This suggests that,
20
from the marketer’s point of view, increasing products in 1D offers the best (i.e., lowest)
quantity discount possible.
The effect sizes for WTP were very large. For example, consider the participants’ WTP
for detergent when objective size information was present (we obtained similar results for
wool). In the control condition, when the participants could not look at the products and only
knew their sizes, they were willing to pay $3.13 per kilogram for Size F ($10.0 for 3.2 kg),
which is $1.87 (−38%) less than the unit price of the reference Size A ($5 per kg). Since these
participants did not see the products, this drop represents the quantity discount caused by non-
visual factors such as diminishing marginal utility, storage costs, etc. However, when the
participants saw packages increasing in one dimension, they were willing to pay $2.94 per kg
for Size F ($9.40 for 3.2 kg), and so the quantity discount changed very little compared to the
control condition. In contrast, when the participants saw packages increasing in three
dimensions, they were willing to pay only $2.01 per kg for Size F ($6.45 for 3.2 kg), which is
$2.99 (-60%) less than the unit price of Size A. In other words, visual biases increased
quantity discounts by 60%, from $1.87 to $2.99. Using the fitted model to predict WTP across
a broad range of size increases, we found that visual biases increase quantity discount by up to
69% for a standard 5 kg pack of detergent.
By demonstrating that dimensionality influences willingness to pay and not just size
estimations, Study 2 alleviates the concern that these are simple response biases arising from
the use of unfamiliar units or somewhat artificial tasks. Still, it is true that consumers do not
necessarily estimate the size of the products or how much they are willing to pay for them
when making purchase decisions. It could also be assumed that the results would have been
different with other measurement units, such as centiliters, rather than grams. In addition, the
reference size in Studies 1 and 2 was always the smallest size, and hence participants judged
21
the magnitude of product supersizing. It remains to be seen whether dimensionality would
also influence people’s estimations of the magnitude of product downsizing.
To address these concerns, we need to examine the effects of the dimensionality of
product resizing on how much product people use, and not just on their estimation of size or
willingness to pay. We do this in Study 3 by using a magnitude production task rather than the
magnitude estimation task used in Studies 1 and 2. In magnitude estimation tasks, the stimuli
are given and participants are asked to estimate the magnitude of the size changes. In
magnitude production tasks, the magnitude of the size change is given and participants are
asked to change the size of objects to match these size changes (e.g., “pour enough liquid to
triple the reference amount”).
The magnitude production procedure also allows us to examine the effects of
dimensionality on overusage, and hence to more directly address the social welfare
implications of these biases. Although past studies showed that the elongation of a glass
influences how much volume people pour and how much they consume (Raghubir and
Krishna 1999; Wansink and Van Ittersum 2003), they did not ask participants to produce
different volumes of product. In addition, these studies used cylindrical glasses in which the
amount of liquid poured increases in one dimension (height) only. In Study 3 we address these
issues by analyzing how much volume people pour into (supersizing goal) or out of
(downsizing goal) a) cylindrical containers in which volume changes in 1D (height only) and
b) conical containers in which volume changes in 3D (because both the height and diameter
change as product is poured into or out of the container).
STUDY 3: EFFECTS OF RESIZING DIMENSIONALITY ON CONSUMPTION DOSAGE
In Study 3 we examine how the dimensionality of the change in product volume in a given
container influences how much people produce when they are supersizing or downsizing a
22
dose. Drawing on the results of Studies 1 and 2, we expect that changes in volume appear
larger in cylindrical (1D) containers (because only the height of the product changes) than in
conical (3D) containers (because all three dimensions of the product change). The
underestimation of 3D volume change will, in turn, lead consumers to add more volume when
supersizing an existing dose in a 3D container than in a 1D container. It will also lead
consumers to remove more volume when downsizing an existing dose in a 3D container than
in a 1D container. Simply stated, because 3D volume changes appear smaller, we expect
consumers to add or remove more volume in conical (3D) containers than in cylindrical (1D)
containers.
Method
Forty-seven participants were recruited near a large urban university to participate in a
study about the design of containers in return for two candies. The study used a 2 × 2
between-subjects design with resizing dimensionality (1D vs. 3D) and resizing goal
(supersizing vs. downsizing instructions). The participants individually entered a room, where
they saw three containers with initial doses of three products—infant medicine, vodka and a
cocktail—displayed on the table. The infant medicine container had graduations to measure
poured volume, whereas the vodka and cocktail containers did not have any marks for
measurement. Table 3 shows the dimensions and pictures of the containers. In the 1D
condition, the containers were a 100-ml cylindrical glass for vodka, a 250-ml cylindrical glass
for cocktails, and a 20-ml dispensing syringe for infant medicine. In the 3D condition, the
containers were a 100-ml conical glass for vodka, a 250-ml conical glass for cocktails, and a
20-ml conical serving cup for infant medicine.
23
In the supersizing goal condition a small dose of each product was already in the
containers, and the participants were asked to triple this dose by pouring more volume from a
standard jug into the existing containers. In the downsizing condition a large dose of each
product was already in the containers, and the participants were asked to divide it by three
(i.e., to decrease the volume to one third of the initial dose) by pouring out the extra volume
into a jug. In both conditions the participants were allowed to pour the product in and out as
often as they needed until they achieved the desired volume.
---- Insert Table 3 and Figure 4 about here ----
Results and Discussion
We used an ANOVA with the final amount of product left in the containers as the
dependent variable, and dimensionality, goal and their interaction as fixed factors. After
verifying that there were no interactions with product type, we pooled the data across the three
product replications and rescaled the volumes as a multiple of the smaller dose (the initial
dose in the supersizing condition and the target final dose in the downsizing condition). If
people are accurate in their estimations, the rescaled final volume should therefore be 3 in the
supersizing condition and 1 in the downsizing condition. Figure 4 shows the final volume left
(rescaled) in the 1D and 3D containers in the supersizing and downsizing conditions.
In the supersizing condition, in which participants had to triple the dose, they poured
greater (product) volume into the 3D (conical) containers than into the 1D (cylindrical)
containers and were therefore left with more product in the 3D containers (M = 3.63 times the
initial dose) than in the 1D containers (M = 3.04, p < .005). In the downsizing condition, in
which the participants had to leave only one third of the initial dose, they poured out more and
24
left less product in the 3D containers (M = .98 times the target dose) than in the 1D containers
(M = 1.28, p < .003). The interaction between consumption goal and resizing dimensionality
was statistically significant (F (1, 136) = 17.2, p < .001). The main effect of resizing was
significant since more volume was left in the supersizing condition than in the downsizing
condition (M = 3.36 vs. M = 1.12, F (1,136) = 425.8, p < .001) but the main effect of
dimensionality was not statistically significant (F (1, 136) = 1.8, p = .18).
Overall, the results of Study 3 reinforce those of Studies 1 and 2 in showing that changes
in product size appear smaller when they occur in all three dimensions than when they only
change in one dimension. In addition, Study 3 shows that these results hold even when people
are not asked to produce a numeric estimate of the magnitude of size change but are asked to
increase or decrease the amount of product itself. This provides additional evidence that
dimensionality really influences perceived size changes, and not just their expression on a
response scale. Thirdly, Study 3 shows that the effects of dimensionality hold for both
supersizing and downsizing decisions, i.e., when people try to increase and also when they try
to decrease product volume. This raises the issue of whether the dimensionality of product
size change may also influence consumers’ likelihood of supersizing or downsizing their
purchases. We address this issue with two sales experiments in Study 4.
STUDY 4: EFFECTS OF RESIZING DIMENSIONALITY ON CONSUMERS’ SUPERSIZING
AND DOWNSIZING PURCHASE DECISIONS
Building on Studies 1, 2 and 3, we expect that dimensionality will have the following
effects on supersizing and downsizing purchase decisions when consumers do not have a
fixed consumption goal and, all else being equal, prefer more product to less. First, when
choosing between a supersized and a regular-size package, we expect consumers to be more
25
likely to choose the supersized package when it is supersized in 1D than in 3D because the
size increase will appear larger in the 1D condition. Conversely, when choosing between a
downsized and a regular-size package, we expect consumers to be more likely to choose the
downsized package when it is downsized in 3D than when it is downsized in 1D because the
size decrease will appear smaller in the 3D condition than in the 1D condition. We examine
these hypotheses in two field experiments involving real products, size changes of typical
magnitude, and actual purchases. Study 4a examines supersizing decisions and Study 4b
examines downsizing decisions.
Study 4a (Supersizing): Method
To examine the effects of dimensionality on supersizing decisions, we sold two brands of
beer and cider to graduate students before a movie viewing. Upon arrival, a research assistant
directed the students to one of three booths located next to the three entrances of a campus
auditorium (however, because one booth was located next to the main entrance of the
auditorium, it received a disproportionate share of the participants). To manipulate the size
and shape of the two brands of beer and cider in a rigorous manner, students were not shown
the actual beer and cider bottles, but rather two mugs specially designed for the purpose of the
experiment, which had labels that clearly indicated their volume. The students were told that
each mug corresponded to one of the two brands of beer and to one of the two brands of cider,
that both brands were available for sale at $1.20, and that the beer or cider that they purchased
would be brought to them later in the auditorium. The price of the products never changed.
There were three between-subjects conditions. In the booth with the control condition,
both mugs contained 22 centiliters. In the two other booths, the target brand’s mug contained
33-cl, 50% more than the 22-cl of the mug of the other brand (which was the same as in the
26
control condition). In the booth with the 1D supersizing condition, the target brand’s mug was
the same diameter but 50% taller than the control mug. In the booth with the 3D supersizing
condition, the target brand’s mug was different in height and diameter from the control mug
(see Table 3 for the dimensions of the mugs). After placing their orders, the students received
the brand of their choice (in a bottle, since this was more convenient) once they were seated in
the auditorium.
Study 4a (Supersizing): Results
In a pre test, we asked 11 participants to estimate the size of the supersized mug in the 1D
and 3D supersizing conditions. The supersized mug appeared significantly larger in the 1D
than in the 3D condition (M = 35.0 cl. vs. M = 29.8 cl., t = 2.7, p < .05), showing that the
dimensionality manipulation was successful. None of the participants ordered more than one
beer or cider and we obtained 43 usable choices. After verifying that the effects of the
dimensionality manipulations were not statistically different for the two products, we pooled
the data across the beer and cider. As shown in Table 3, the choice share of the target brand
was 55% in the control condition. When the target brand was supersized in 1D, its choice
share reached 100%, a statistically significant increase over the control condition (χ² (1) = 6.0,
p < .01). When the target brand was supersized in 3D, however, its choice share was 68%,
which was not statistically different from the control condition (χ² (1) = .6, p = .44). The
difference between the 1D and 3D conditions was also statistically significant (χ² (1) = 4.1, p
< .05). These results support our prediction that supersizing in 1D attracts more consumers
than supersizing in 3D.
---- Insert Table 3 about here ----
27
Study 4b (Downsizing): Method
In Study 4b we examined the effects of dimensionality on downsizing decisions using a
procedure that clearly established the reference size for the target brand in all conditions. We
used this procedure to increase the chances that the participants would notice that the
downsized product was smaller than usual. We also used publicly available packaging for of
two familiar products (Coca-Cola and popcorn) rather than purpose-built mugs to test the
robustness of the effects of dimensionality.
Study 4b was a field experiment with two between-subjects conditions (1D downsizing vs.
3D downsizing) and two between-subjects replications (Coca-Cola and popcorn). Forty-seven
participants were recruited near a large urban university and were compensated with a product
voucher. We told the participants that, as an additional reward for their participation in an
unrelated study, they would have the opportunity to buy a bottle of Coca-Cola and a box of
local popcorn brands at a discounted price at the end of the experiment. We then showed them
a menu with two beverage options, a 50-cl bottle of Diet Coke ($ 0.80) and a 50-cl bottle of
regular Coke ($0.60), and two popcorn options, a 33 oz (94-cl) box of Baseball brand popcorn
($0.50) and the same 33 oz box of Baff popcorn ($0.40). The purpose of this first phase was
to establish the 50-cl bottle and the 33 oz cubic box as the reference sizes. The sizes of the
packages were always shown on the labels (in ounces and centiliters) and the prices were the
same in all conditions.
After participants had completed an unrelated task, we told them that we had run out of
the 50-cl regular bottle of Coke and of the 33 oz box of Baff popcorn, but that smaller sizes
were still available, albeit at the same price as the regular sizes. The participants thus had to
choose between a 50-cl bottle of Diet Coke and a 33-cl can of regular Coke, and between a 33
28
oz box of Baseball popcorn and a 22 oz box of Baff popcorn. For both products, the
downsized package was 33% smaller than the normal-size package shown in the first phase
and still available for the non-target brands (Diet Coke and Baseball popcorn). As shown in
Table 3, the downsized 33-cl can of regular Coke either had the same diameter but a lower
height (1D downsizing condition), or both a smaller diameter and height than the 50-cl bottle
(3D downsizing condition). The downsized box of popcorn was either 33% smaller than the
normal-size box (1D condition) or smaller in all three dimensions (3D condition). The
participants marked their choices and provided their WTP for the two normal-size brands.
They were then debriefed, handed their voucher and their choices of Coke and popcorn, and
dismissed.
Study 4b (Downsizing): Results and Discussion
In a pre test, we asked 11 participants to estimate the size of the downsized cans of beer
and cider and boxes of popcorn boxes in the 1D and 3D conditions. As expected, the
downsized packages were perceived to be smaller in the 1D than in the 3D condition (M =
45.8-cl vs. M = 52.7-cl, t = -2.7, p < .01). This pattern was also observed for each product
individually. After verifying that there were no interactions between the manipulations and
the product categories, we pooled the data across Coke and popcorn for the purpose of the
statistical analyses. As expected, the choice share of the downsized brands was significantly
higher in the 3D condition (M = 69%) than in the 1D condition (M = 48%, χ²(1) = 4.2, p <
.05). Similarly, participants were willing to pay significantly less for the normal-size brands
when the target brand was downsized in the 3D condition ($1.10) than when it was downsized
in the 1D condition ($0.86, F(1, 90) = 4.0, p < .05). These results support our prediction that
downsizing attracts more consumers when it is done in 3D than in 1D.
29
Overall, Study 4 shows that the dimensionality of package resizing influences consumers’
preference for supersizing and downsizing in actual purchase decisions. In Study 4a, despite
the fact that the actual volumes were always clearly marked, offering 50% more beer and
cider for free did not lead to a statistically significant increase in choice share in the 3D
condition. In contrast, when the products were supersized in 1D, their choice share nearly
doubled and all the buyers chose them. In Study 4b, even though we used well-known brands
and package sizes, the choice share of the downsized brand was 44% higher when it was
downsized in 3D than when it was downsized in 1D.
The effects of dimensionality on consumers’ size perceptions, price expectations, usage
and purchase decisions raise the question of whether marketers are aware of the effects of
dimensionality and apply different quantity discounts when package or portion sizes increase
in 1D than when they increase in 3D. We examine this issue in Study 5 by surveying quantity
discounts for larger product sizes in four categories.
STUDY 5: SURVEY OF MARKETPLACE QUANTITY DISCOUNTS
OFFERED FOR 1D AND 3D PRODUCT RESIZING
Method
The goal of Study 5 is to examine whether quantity discounts are similar for products with
packages and portions that increase in 1D as for products with packages and portions that
increase in 3D. To achieve this goal we measured the prices of different sizes of products in
four categories: cosmetics, beverages, snacks and fast-food sandwiches. We chose these
categories based on a pre-study which indicated that they each include products that increase
in both 1D and 3D. For example, in the cosmetics category, we obtained data on the retail
30
price of travel-size shaving creams that are either simply shorter than the regular size or that
have both a lower height and smaller diameter than the regular size (e.g., Edge vs. DawnMist
shaving creams in Table 5).
In total, we collected information on the retail price and size of 70 pairs of products (each
pair consisting of two different sizes of the same product) by conducting price audits at
supermarkets in a large US city and in US online retailers. We measured the sizes of
cosmetics, beverages and snacks in centiliters, and the sizes of fast-food sandwiches in
calories, in the absence of a standardized unit in this category. We then computed two
elasticity measures for each of these 70 observations. The first is the arc elasticity of prices
with respect to change in product size, that is (∆P / P ) / (∆S / S ), where ∆P and ∆S are
respectively the change in retail price and in size and where P and S are respectively the
average retail price and the average size of the two products. To allow a direct comparison
with our experimental results, we also computed the power exponent for each pair as follows:
ln(PL / PS) / ln(SL / SS), where PL and PS are the retail prices of the large and small package of
the pair and SL and SS are the sizes of the large and small packages of the pair. The correlation
between both measures was .99.
---- Insert Table 5 about here ----
Results and Discussion
For each category, Table 5 provides the average arc elasticity of retail price with respect to
change in size and the average power exponent when products increase in 1D vs. 3D. Across
categories both the elasticity and the power exponent were well below 1, indicating that prices
increase more slowly than sizes, and hence that companies offer quantity discounts. We
31
examined both dependent variables using an ANOVA with dimensionality, product category,
and their interaction. As expected, the size elasticity was higher for products that increase in
1D (M = .90) than for products that increase in 3D (M = .57, F(1, 62) = 20.2, p < .001). The
results also revealed a significant main effect of product category (F(3, 62) = 3.3, p < .03), but
the interaction with dimensionality was not statistically significant (F(3, 62) = 1.2, p = .31).
The exact same results were obtained when analyzing the power exponents. Interestingly, the
exponent values are relatively similar to those obtained in the size information present
condition in Study 2. For products increasing in 1D, the mean exponent was .88 in Study 5 vs.
.83 in Study 2. For products increasing in 3D, it was .55 in Study 5 vs. .69 in Study 2.
In summary, the field survey provides additional evidence that the dimensionality of
product resizing influences the magnitude of the price discounts that retailers offer for larger
quantities. These results suggest that the size and shape biases documented in the three
experimental studies are strong enough to influence actual pricing practices in a competitive
environment. Alternatively, it may be that marketers (like consumers) are more sensitive to
size changes when they occur in 1D than when they occur in 3D but are not aware of their
own biases. In the general discussion we address the implications of these studies for
consumer research and public policy.
GENERAL DISCUSSION
The key finding of this research is that product size changes appear smaller when the
product package or portion changes in all three dimensions (height, width, length) than when
it changes in only one of these dimensions. Specifically, we have shown a) that size
estimations follow an inelastic power function of the actual size of these products; b) that size
estimations are even less elastic when product sizes change in 3D than when they change in
1D; and c) that the effect of dimensionality is not reduced by making size information
32
available. As a result, consumers expect (and marketers offer) steeper unit price discounts
when packages and portions are supersized in 3D than when they are supersized in 1D;
consumers pour more product into and pour more product out of conical containers (in which
volume changes in 3D) than cylindrical containers (in which volume changes in 1D); and
consumers are more likely to supersize and less likely to downsize when package and portion
sizes change in 1D than when they change in 3D.
These visual biases had important consequences in our studies. Increasing product
packages or portions along all three dimensions rather than along only one dimension reduced
size estimations by up to 68%; decreased the unit price people were willing to pay for larger
sizes by up to 57%; led people to pour in 19% more vodka, alcoholic cocktail, and infant
medicine; reduced the likelihood of buying supersized alcoholic beverages by 32%; and
increased the likelihood of buying a downsized cola and popcorn by 21%. Moreover, these
effects were robust and found across food and non-food products and across different modes
of representations (pictures or actual products), in a laboratory and in a competitive market
setting, and even when information about the actual size of the products was present.
Implications for Researchers and Consumers
An important issue for future research would be to investigate the various mechanisms
that may underlie the effects of dimensionality. Raghubir (2007) created a typology of the
sources of visual biases which suggests that both the amount and the locus of attention
devoted to the stimuli play an important role. Evidence supporting the amount of attention
explanation comes from Folkes and Matta (2004), who found that packages that receive more
attention because of their unusual shape are perceived to be bigger. Because commercial
packages and portions typically increase in 3D, they may receive less attention than packages
33
that increase in 1D. This would suggest that the effects of dimensionality may be reduced by
controlling or manipulating the amount of attention, or by habituating consumers to packages
supersized in 1D. Supporting the locus of attention explanation, Chandon and Wansink (2007)
found that directing consumers, and even professional dieticians, to estimate the size of each
element of a fast food meal (sandwiches, side dishes, beverages) improves the elasticity of
their estimations of size changes, whereas alerting people to size biases and motivating them
to be accurate has no effect. Krider, Raghubir, and Krishna (2001) also found that drawing
attention to the secondary dimension of two-dimensional objects improves the elasticity of
area estimations. These results suggest that dimensionality effects may be reduced by asking
people to estimate the size of each dimension (i.e., height, width and length) separately and by
giving them computational aids to convert these one-dimensional estimates into weight or
volume estimates.
Another important area for further research would be to study the effects of the
dimensionality of changes in other multi-dimensional product attributes, such as price or
quality. It would be interesting to examine whether people are more sensitive to changes in
price or quality when they occur along one dimension than when they occur along one, two,
or more than two dimensions (e.g., in each part of a three-part tariff). Building on this idea, it
would be interesting to examine the effects of dimensionality on sensations such as volume of
sound, intensity of color, or concentration of flavor. In all these cases, it would be important
to also examine how consumers react when they find out that marketers have been leveraging
dimensionality effects to conceal or enhance attribute changes and whether they adapt to such
effects of time and usage. This is particularly important because Sprott, Manning and
Miyazaki (2003) found that some larger sizes actually carry higher unit prices and that the
success of these quantity surcharges is largely due to consumers’ unawareness of their
existence.
34
Implications for Marketers and Policy Makers
Downsizing package and portion sizes is one of the most effective methods of reducing
overeating (Ledikwe et al. 2005). One difficulty with downsizing is that consumers do not like
smaller portions because they think that they are less economical (Wansink 1996). Another
difficulty is that the lower net price of downsized products reduces average spending per
customer and may not be compensated by an increase in the number of customers. Finally,
marketers are concerned about the consumer reaction if they find out that the brand has
surreptitiously increased unit prices by downsizing product quantity. Indeed, the restaurant
chain Ruby Tuesday eliminated downsized items from its menu just five months after their
introduction because they had led to a 5% sales loss. For marketers who are concerned about
the negative impact of product downsizing, our results suggest that consumers will
underestimate the magnitude of the size reductions. They also provide a simple way of
making downsizing appear smaller than it really is.
For example, Condrasky et al. (2007) found that 76% of executive chefs think that
customers would notice if the restaurant decreased portion sizes by 25%. Using the exponents
obtained in Study 1 as an illustration, we predict that a 25% downsizing would actually look
like a 22% reduction (1-.75.87) if it were one-dimensional, but only a 17% reduction (1-.75.63)
if it were three-dimensional. Furthermore, our results suggest that it might be smarter to
increase unit prices by downsizing packages than by increasing prices. Consider a scenario in
which a restaurant needs to increase its unit price by 50% because of mounting costs. It could
either keep portion sizes constant and increase prices by 50%, or decrease portion sizes by
33% and keep the price constant. The results of Study 2 suggest that this 33% downsizing
35
would actually lead to only a 20% decrease in WTP, which is likely to have less effect on
sales than a 50% price increase.
Our results also have important implications for policy makers and marketers seeking to
promote sustainable consumption and reduce the overconsumption of potentially harmful
products such as alcohol, unhealthy food, detergent, or infant medicine (which, in the latter
case, could be fatal if overdosed). Our findings suggest that the overconsumption of these
products may be due partially to the conical shape of the containers typically used for these
products. To prevent overdosing and waste, policy makers should promote the use of
standardized one-dimensional containers such as syringes for infant medicine, cylindrical
measuring cups for detergent, and perhaps even promote the use of cylindrical glasses in bars.
More generally, our results suggest that marketers and policy makers should examine whether
the dimensionality of package and portion resizing influences not just how much people buy,
but also how much they use and consume.
36
REFERENCES
Chandon, Pierre and Brian Wansink (2007), "Is Obesity Caused by Calorie Underestimation?
A Psychophysical Model of Meal Size Estimation," Journal of Marketing Research,
44 (1), 84-99.
Clements, Kenneth W. (2006), "Pricing and Packaging: The Case of Marijuana," Journal of
Business, 79 (4), 2019-44.
Condrasky, Marge , Jenny H. Ledikwe, Julie E. Flood, and Barbara J. Rolls (2007), "Chefs'
Opinions of Restaurant Portion Sizes," Obesity, 15 (8), 2086-94.
Deutsch, Claudia H. (2007), "Incredible Shrinking Packages," The New York Times (May 12).
Ekman, Gosta (1958), "Two generalized ratio scaling methods," The Journal of Psychology,
45, 287-95.
Ekman, Gosta and Kenneth Junge (1961), "Psychophysical Relations in Visual Perception of
Length, Area, and Volume," Scandinavian Journal of Psychology, 2 (1-10).
Folkes, Valerie and Shashi Matta (2004), "The Effect of Package Shape on Consumers'
Judgments of Product Volume: Attention as a Mental Contaminant," Journal of
Consumer Research, 31 (2), 390-401.
Frayman, Bruce J. and William E. Dawson (1981), "The Effect of Object Shape and Mode of
Presentation on Judgments of Apparent Volume," Perception and Psychophysics, 29
(1), 56-62.
Krider, Robert E., Priya Raghubir, and Aradhna Krishna (2001), "Pizzas: Pi or Square?
Psychophysical Biases in Area Comparisons," Marketing Science, 20 (4), 405-25.
Krishna, Aradhna (2006), "Interaction of Senses: The Effect of Vision versus Touch on the
Elongation Bias," Journal of Consumer Research, 32 (4), 557-66.
37
---- (2007), "Spatial Perception Research: An Integrative Review of Length, Area, Volume,
and Number Perception," in Visual Marketing: From Attention to Action, Michel
Wedel and Rik Pieters, Eds. Mahwah, New Jersey: Lawrence Erlbaum Associates.
Krishna, Aradhna, Rongrong Zhou, and Shi Zhang (2007), "The Effect of Self-Construal on
Spatial Judgments," in University of Michigan.
Ledikwe, Jenny H., Julia Ello-Martin, and Barbara J. Rolls (2005), "Symposium: Modifying
the Food Environment: Energy Density, Food Costs, and Portion Size," The Journal of
Nutrition, 135 (4), 905-09.
Lennard, Dave, Vincent-Wayne Mitchell, Peter McGoldrick, and Erica Betts (2001), "Why
Consumers Under-Use Food Quantity Indicators," International Review of Retail,
Distribution & Consumer Research, 11 (2), 177-99.
Moyer, Robert S., Drake R. Bradley, Mark H. Sorenson, John C. Whiting, and David
Mansfield (1978), "Psychophysical Functions for Perceived and Remembered Size,"
Science, 200 (4339), 330-32.
Nason, Robert W. and Albert J. Della Bitta (1983), "The Incidence and Consumer Perceptions
of Quality Surcharges," Journal of Retailing, 59 (2), 40-54.
Nielsen, Samara Joy and Barry M. Popkin (2003), "Patterns and Trends in Food Portion Sizes,
1977-1998," Journal of American Medical Association, 289 (4), 450-53.
Pearson, Richard G. (1964), "Judgment of Volume from Photographs of Complex Shapes,"
Perceptual and Motor Skills, 18 (889-900).
Piaget, Jean (1969), The Mechanisms of Perception. London, UK: Routledge.
Raghubir, Priya (2007), "Are Visual Perception Biases Hard-Wired?," in Visual Marketing:
From Attention to Action, Michel Wedel and Rik Pieters, Eds. Mahwah, New Jersey:
Lawrence Erlbaum Associates.
38
Raghubir, Priya and Aradhna Krishna (1999), "Vital Dimensions in Volume Perception: Can
the Eye Fool the Stomach?," Journal of Marketing Research, 36 (3), 313-26.
Sobel, Michael E. (1982), "Asymptotic Confidence Intervals for Indirect Effects in Structural
Equation Models," in Sociological Methodology, Samuel Leinhardt, Ed. Vol. 13:
American Sociological Association.
Sprott, David E., Kenneth C. Manning, and Anthony D. Miyazaki (2003), "Grocery Price
Setting and Quantity Surchages," Journal of Marketing, 67 (3), 34-46.
Stevens, Stanley Smith (1986), Psychophysics: Introduction to Its Perceptual, Neural, and
Social Prospects. Oxford: Transaction Books.
Teghtsoonian, Martha (1965), "The Judgment of Size," The American Journal of Psychology,
78 (3), 392-402.
Viswanathan, Madhubalan, José Antonio Rosa, and James Edwin Harris (2005), "Decision
Making and Coping of Functionally Illiterate Consumers and Some Implications for
Marketing Management.," Journal of Marketing, 69 (1), 15-31.
Wansink, Brian (1996), "Can Package Size Accelerate Usage Volume?," Journal of
Marketing, 60 (3), 1-14.
Wansink, Brian, James E. Painter, and Jill North (2005), "Bottomless Bowls: Why Visual
Cues of Portion Size May Influence Intake," Obesity Research, 13 (1), 93-100.
Wansink, Brian and Koert Van Ittersum (2003), "Bottoms Up! The Influence of Elongation on
Pouring and Consumption Volume," Journal of Consumer Research, 30 (3), 455-63.
Yang, Sha and Priya Raghubir (2005), "Can Bottles Speak Volumes? The Effect of Package
Shape on How Much to Buy," Journal of Retailing, 81 (4), 269-81.
39
TABLE 1
STUDIES 1 AND 2: STIMULI DIMENSIONS
Studies, products, and shapes Dimensions Size
A Size
B Size
C Size
D Size
E Size
F Study 1 (candles) Size (grams) 50 100 200 400 800 1600 1D (cylinder) Height (cm.) 0.53 1.05 2.1 4.2 8.4 16.8 Diameter (cm.) 10.0 10.0 10.0 10.0 10.0 10.0 3D (cylinder) Height (cm.) 5.3 6.67 8.4 10.6 13.33 16.8 Diameter (cm.) 3.2 3.97 5 6.30 7.94 10.0 Study 2 (wool) Size (grams) 1.25 2.5 5.0 10.0 20.0 40.0 1D (strands) Height (cm.) 0.60 0.60 0.60 0.60 0.60 0.60 Length (cm.) 50 50 50 50 50 50 Width (cm.) 0.60 1.20 2.40 4.80 9.60 19.20 3D (spheres) Diameter (cm.) 2.54 3.20 4.03 5.08 6.40 8.06Study 2 (detergent) Size (grams) 100 200 400 800 1600 3200 1D (tablets) Height (cm.) 1.35 1.35 1.35 1.35 1.35 1.35 Length (cm.) 14.40 14.40 14.40 14.40 14.40 14.40 Width (cm.) 2.60 5.20 10.40 20.80 41.60 83.20 3D (powder in boxes) Height (cm.) 2.70 3.40 4.29 5.40 6.80 8.57 Length (cm.) 5.20 6.55 8.25 10.20 13.11 16.50 Width (cm.) 3.60 4.54 5.72 7.20 9.06 11.43 Notes: For Study 1, the dimensions are those of the picture. For Study 2, they are those of the actual products.
40
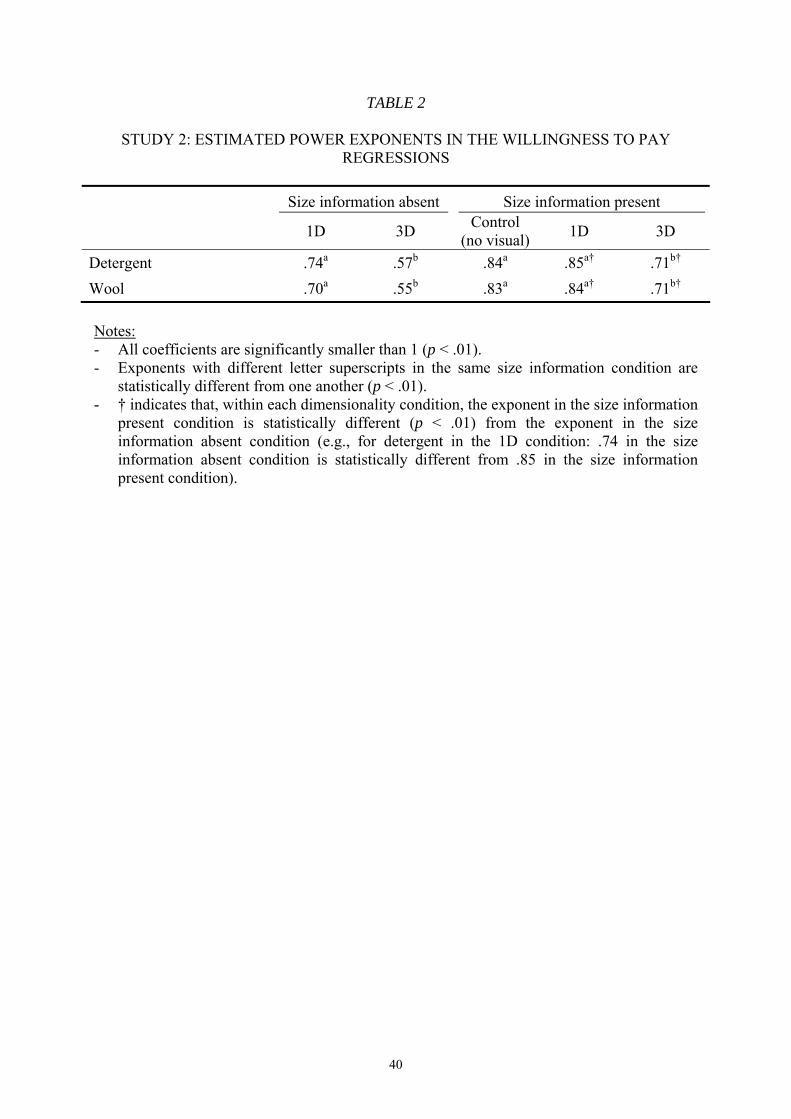
TABLE 2
STUDY 2: ESTIMATED POWER EXPONENTS IN THE WILLINGNESS TO PAY REGRESSIONS
Size information absent Size information present
1D 3D Control (no visual) 1D 3D
Detergent .74a .57b .84a .85a† .71b† Wool .70a .55b .83a .84a† .71b† Notes: - All coefficients are significantly smaller than 1 (p < .01). - Exponents with different letter superscripts in the same size information condition are
statistically different from one another (p < .01). - † indicates that, within each dimensionality condition, the exponent in the size information
present condition is statistically different (p < .01) from the exponent in the size information absent condition (e.g., for detergent in the 1D condition: .74 in the size information absent condition is statistically different from .85 in the size information present condition).
41
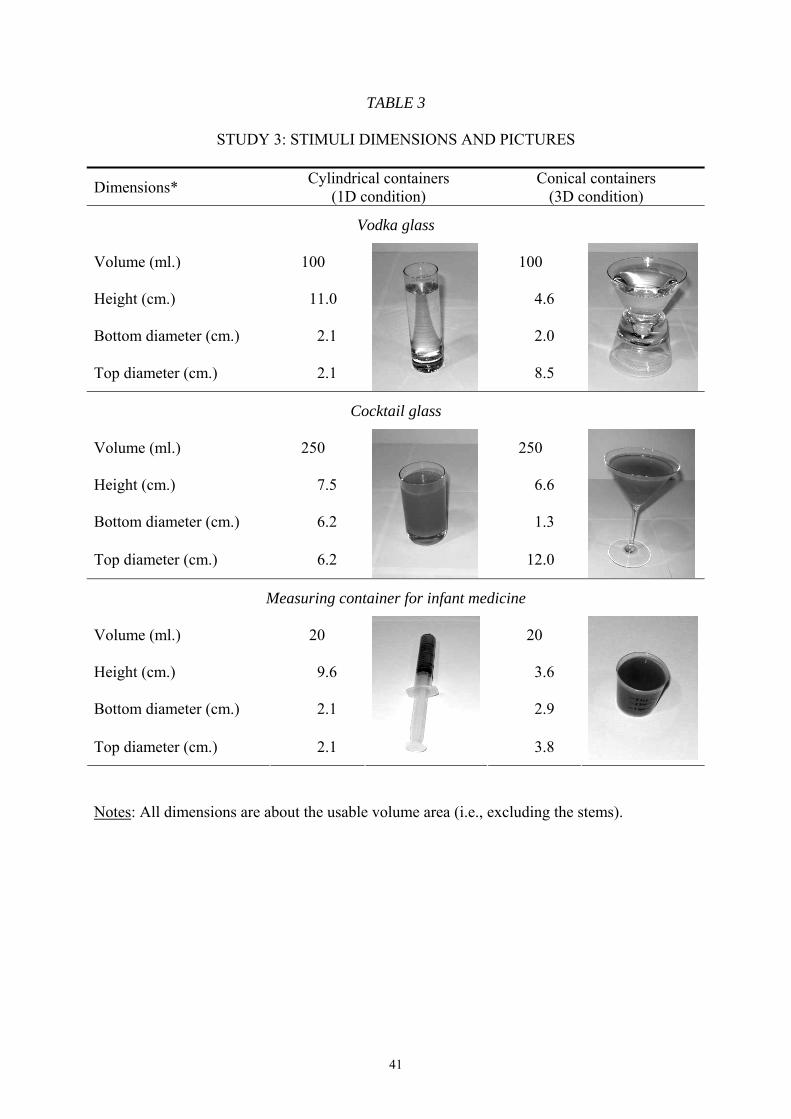
TABLE 3
STUDY 3: STIMULI DIMENSIONS AND PICTURES
Dimensions* Cylindrical containers (1D condition)
Conical containers (3D condition)
Vodka glass
Volume (ml.) 100 100
Height (cm.) 11.0 4.6
Bottom diameter (cm.) 2.1 2.0
Top diameter (cm.) 2.1
8.5
Cocktail glass
Volume (ml.) 250 250
Height (cm.) 7.5 6.6
Bottom diameter (cm.) 6.2 1.3
Top diameter (cm.) 6.2
12.0
Measuring container for infant medicine
Volume (ml.) 20 20
Height (cm.) 9.6 3.6
Bottom diameter (cm.) 2.1 2.9
Top diameter (cm.) 2.1 3.8
Notes: All dimensions are about the usable volume area (i.e., excluding the stems).
42
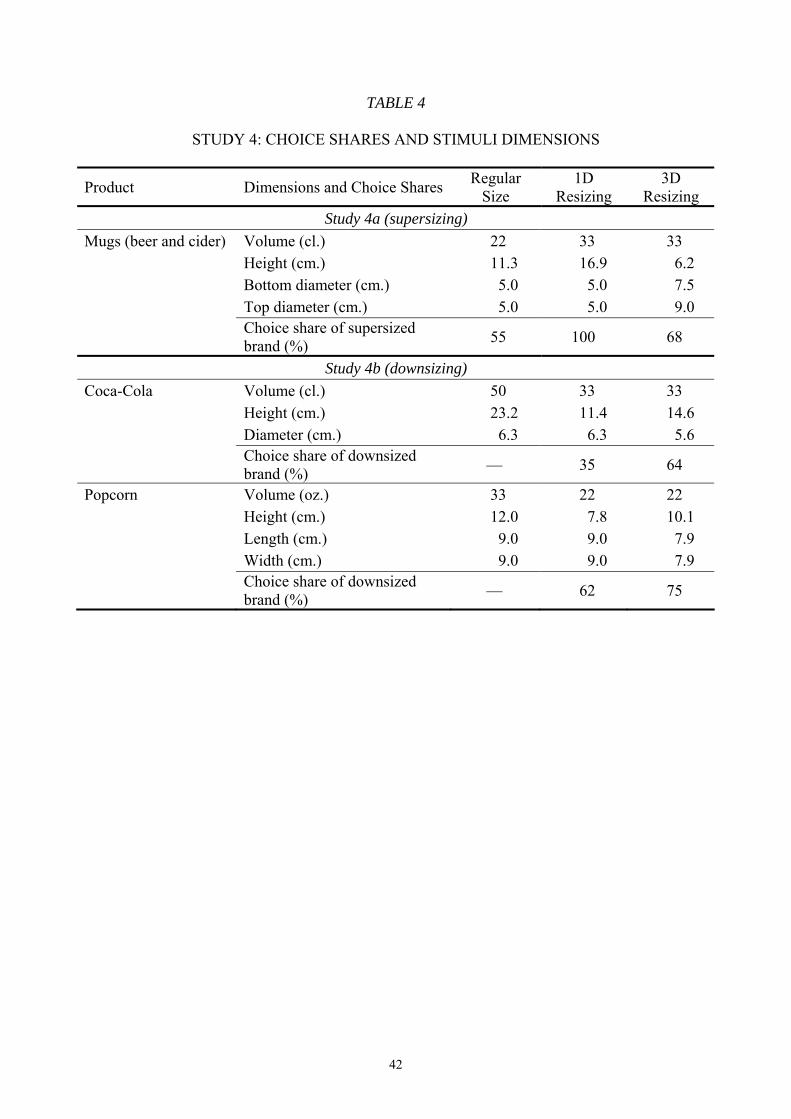
TABLE 4
STUDY 4: CHOICE SHARES AND STIMULI DIMENSIONS
Product Dimensions and Choice Shares Regular Size
1D Resizing
3D Resizing
Study 4a (supersizing) Mugs (beer and cider) Volume (cl.) 22 33 33 Height (cm.) 11.3 16.9 6.2 Bottom diameter (cm.) 5.0 5.0 7.5 Top diameter (cm.) 5.0 5.0 9.0
Choice share of supersized brand (%) 55 100 68
Study 4b (downsizing) Coca-Cola Volume (cl.) 50 33 33 Height (cm.) 23.2 11.4 14.6 Diameter (cm.) 6.3 6.3 5.6
Choice share of downsized brand (%) — 35 64
Popcorn Volume (oz.) 33 22 22 Height (cm.) 12.0 7.8 10.1 Length (cm.) 9.0 9.0 7.9 Width (cm.) 9.0 9.0 7.9
Choice share of downsized brand (%) — 62 75
43
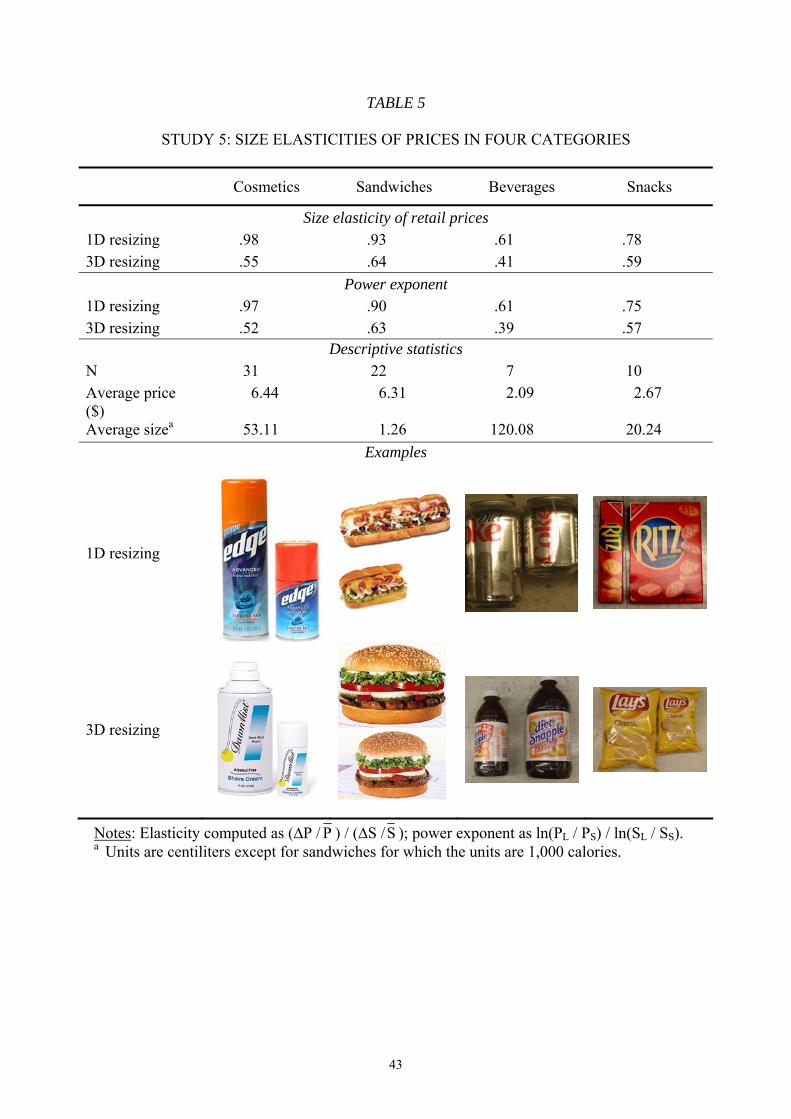
TABLE 5
STUDY 5: SIZE ELASTICITIES OF PRICES IN FOUR CATEGORIES
Cosmetics Sandwiches Beverages Snacks
Size elasticity of retail prices 1D resizing .98 .93 .61 .78 3D resizing .55 .64 .41 .59
Power exponent 1D resizing .97 .90 .61 .75 3D resizing .52 .63 .39 .57
Descriptive statistics N 31 22 7 10 Average price ($)
6.44 6.31 2.09 2.67
Average sizea 53.11 1.26 120.08 20.24 Examples
1D resizing
3D resizing
Notes: Elasticity computed as (∆P / P ) / (∆S /S ); power exponent as ln(PL / PS) / ln(SL / SS). a Units are centiliters except for sandwiches for which the units are 1,000 calories.
44
FIGURE 1
STUDY 1: EFFECTS OF SIZE AND DIMENSIONALITY ON SIZE ESTIMATIONS (OBSERVED GEOMETRIC MEANS, 95% CONFIDENCE INTERVALS, AND MODEL
PREDICTIONS)
0
200
400
600
800
1000
1200
1400
1600
1800
2000
0 200 400 600 800 1000 1200 1400 1600 1800 2000Actual size (grams)
Estim
ated
siz
e (g
ram
s)
Unbiased estimation1D (observed)1D (predicted)3D (observed)3D (predicted)
b = .87
b = .63
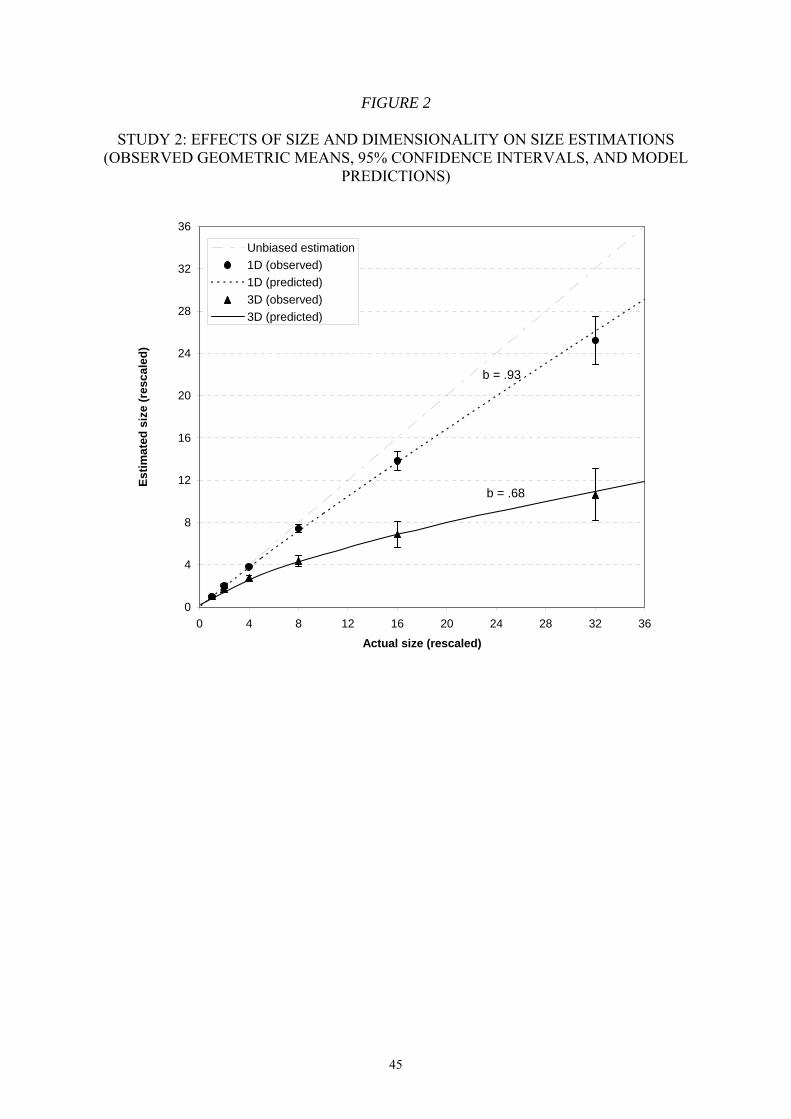
45
FIGURE 2
STUDY 2: EFFECTS OF SIZE AND DIMENSIONALITY ON SIZE ESTIMATIONS (OBSERVED GEOMETRIC MEANS, 95% CONFIDENCE INTERVALS, AND MODEL
PREDICTIONS)
0
4
8
12
16
20
24
28
32
36
0 4 8 12 16 20 24 28 32 36
Actual size (rescaled)
Estim
ated
siz
e (r
esca
led)
Unbiased estimation1D (observed)1D (predicted)3D (observed)3D (predicted)
b = .93
b = .68
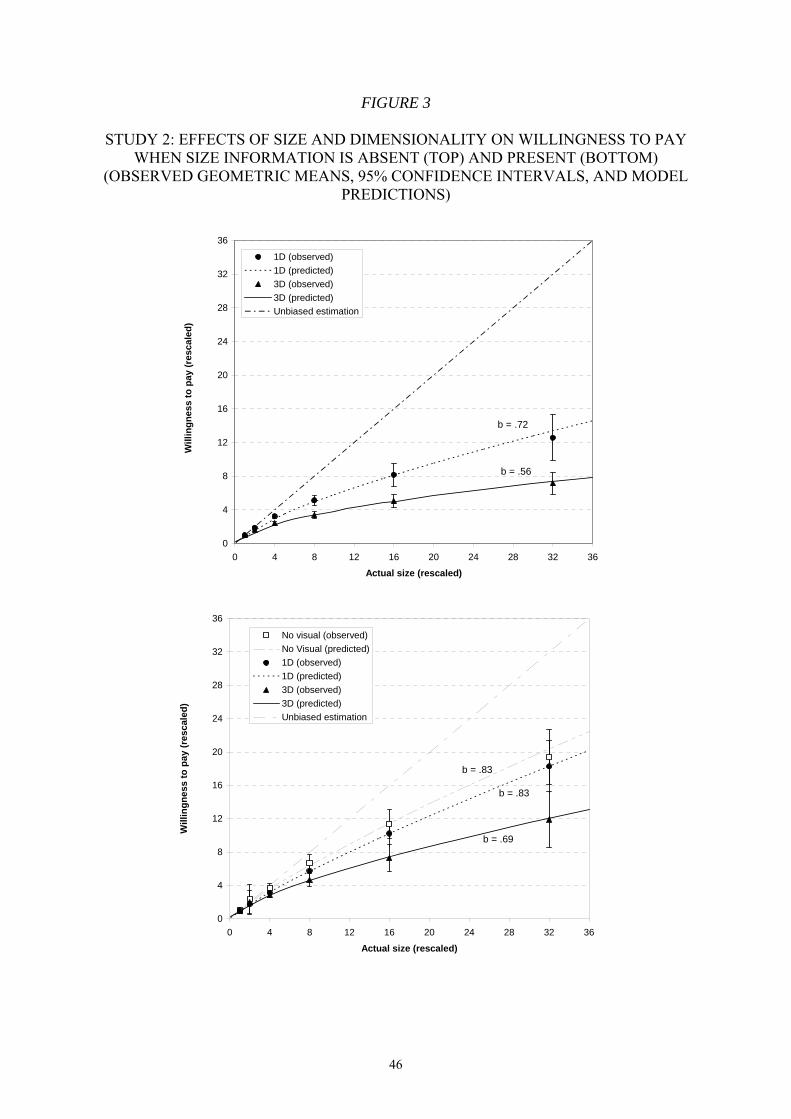
46
FIGURE 3
STUDY 2: EFFECTS OF SIZE AND DIMENSIONALITY ON WILLINGNESS TO PAY WHEN SIZE INFORMATION IS ABSENT (TOP) AND PRESENT (BOTTOM)
(OBSERVED GEOMETRIC MEANS, 95% CONFIDENCE INTERVALS, AND MODEL PREDICTIONS)
0
4
8
12
16
20
24
28
32
36
0 4 8 12 16 20 24 28 32 36
Actual size (rescaled)
Will
ingn
ess
to p
ay (r
esca
led)
1D (observed)1D (predicted)3D (observed)3D (predicted)Unbiased estimation
b = .72
b = .56
0
4
8
12
16
20
24
28
32
36
0 4 8 12 16 20 24 28 32 36
Actual size (rescaled)
Will
ingn
ess
to p
ay (r
esca
led)
No visual (observed)No Visual (predicted)1D (observed)1D (predicted)3D (observed)3D (predicted)Unbiased estimation
b = .83
b = .83
b = .69
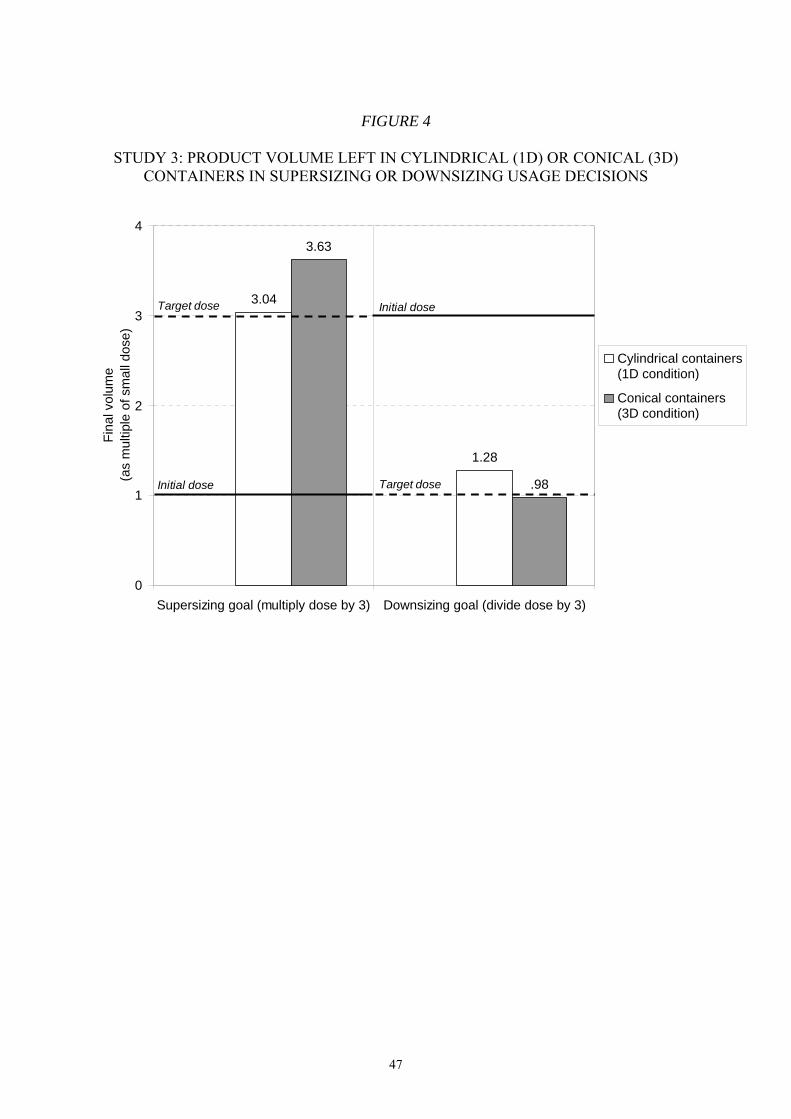
47
FIGURE 4
STUDY 3: PRODUCT VOLUME LEFT IN CYLINDRICAL (1D) OR CONICAL (3D) CONTAINERS IN SUPERSIZING OR DOWNSIZING USAGE DECISIONS
3.04
1.28
3.63
.98
0
1
2
3
4
Supersizing goal (multiply dose by 3) Downsizing goal (divide dose by 3)
Fina
l vol
ume
(as
mul
tiple
of s
mal
l dos
e)
Cylindrical containers(1D condition)
Conical containers(3D condition)
Target dose
Target doseInitial dose
Initial dose
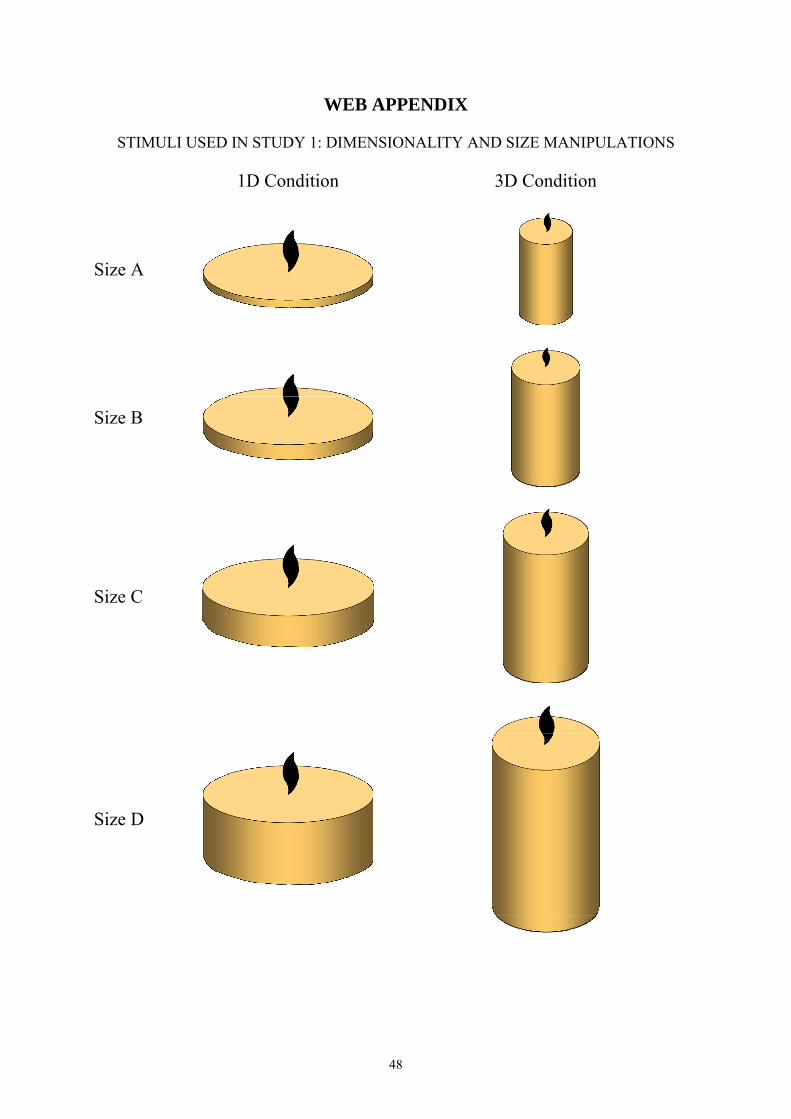
48
WEB APPENDIX
STIMULI USED IN STUDY 1: DIMENSIONALITY AND SIZE MANIPULATIONS
1D Condition 3D Condition
Size A
Size B
Size C
Size D
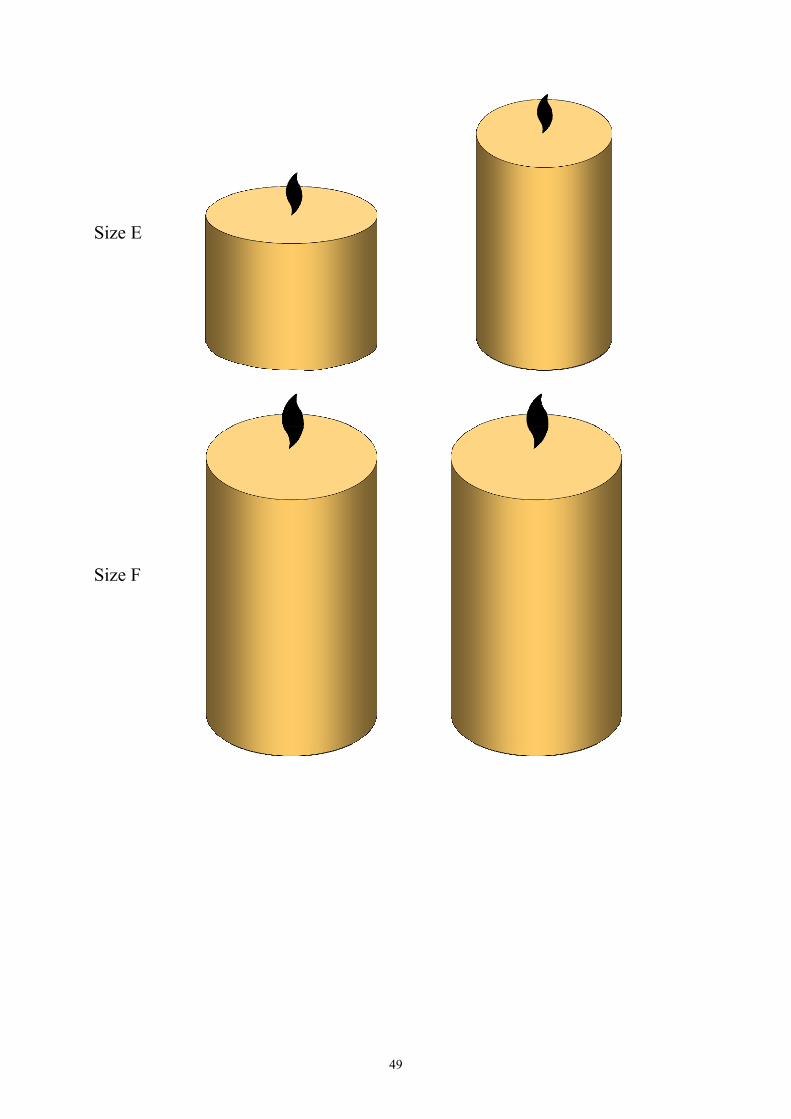
49
Size E
Size F
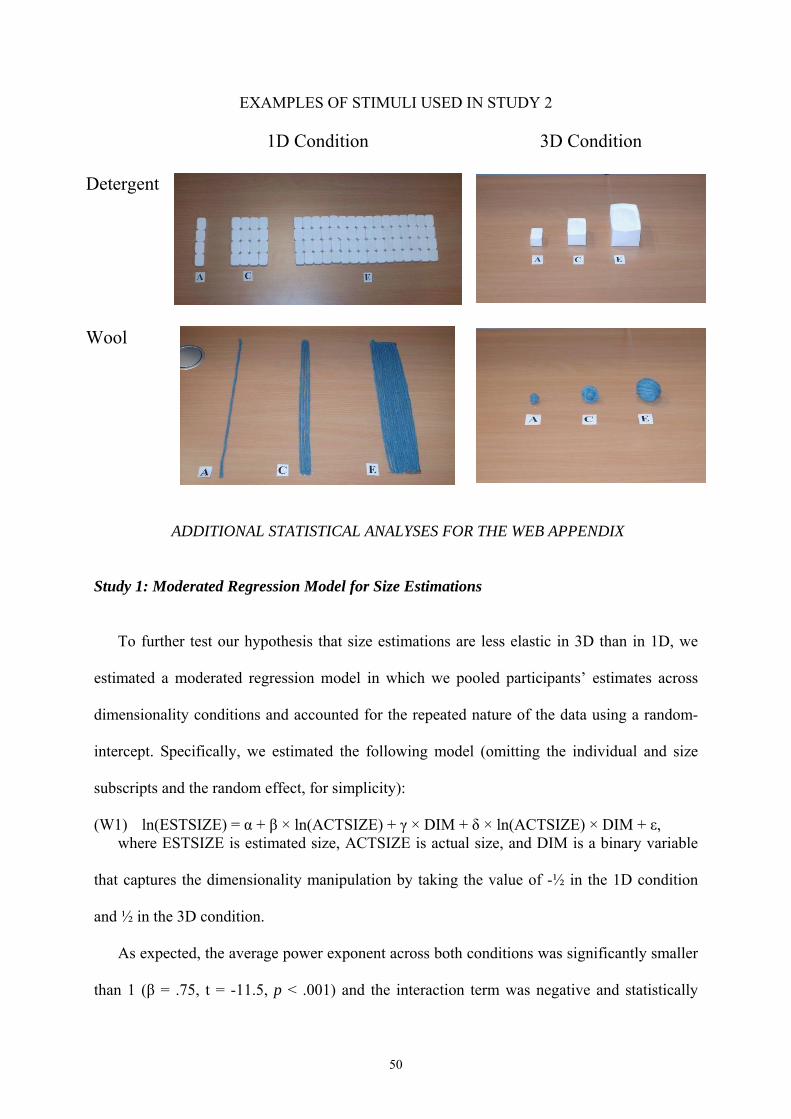
50
EXAMPLES OF STIMULI USED IN STUDY 2
1D Condition 3D Condition Detergent
Wool
ADDITIONAL STATISTICAL ANALYSES FOR THE WEB APPENDIX
Study 1: Moderated Regression Model for Size Estimations
To further test our hypothesis that size estimations are less elastic in 3D than in 1D, we
estimated a moderated regression model in which we pooled participants’ estimates across
dimensionality conditions and accounted for the repeated nature of the data using a random-
intercept. Specifically, we estimated the following model (omitting the individual and size
subscripts and the random effect, for simplicity):
(W1) ln(ESTSIZE) = α + β × ln(ACTSIZE) + γ × DIM + δ × ln(ACTSIZE) × DIM + ε, where ESTSIZE is estimated size, ACTSIZE is actual size, and DIM is a binary variable
that captures the dimensionality manipulation by taking the value of -½ in the 1D condition
and ½ in the 3D condition.
As expected, the average power exponent across both conditions was significantly smaller
than 1 (β = .75, t = -11.5, p < .001) and the interaction term was negative and statistically
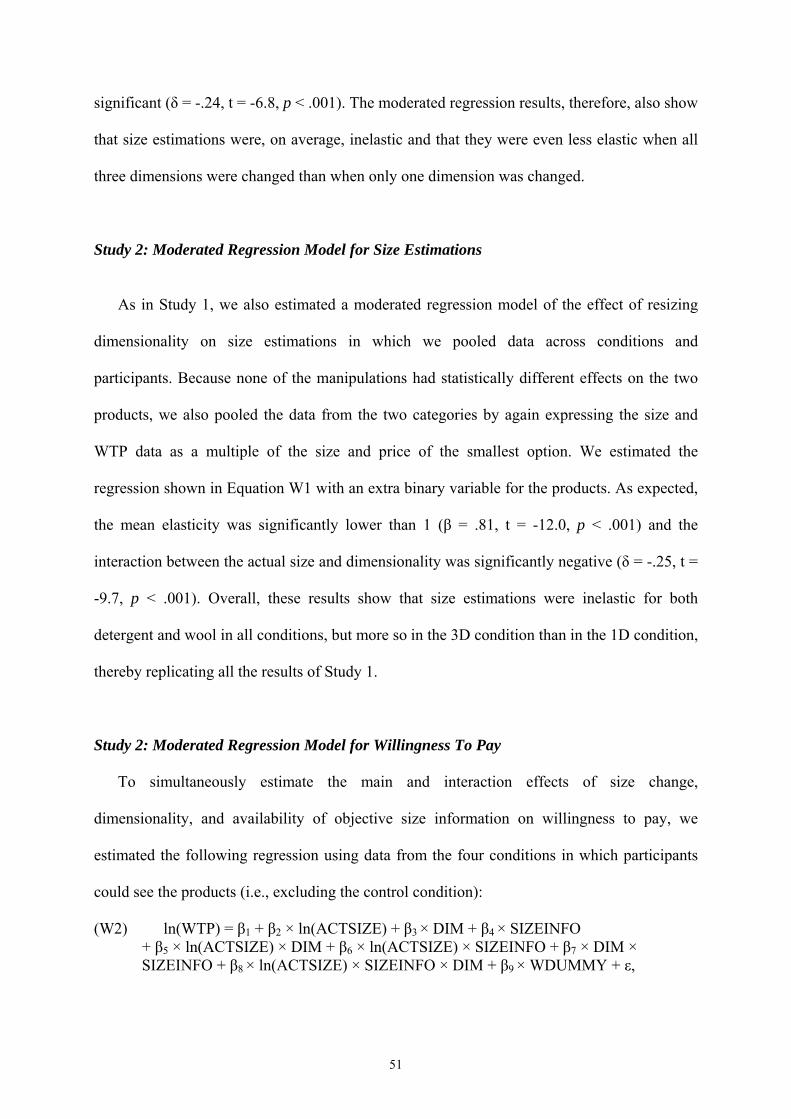
51
significant (δ = -.24, t = -6.8, p < .001). The moderated regression results, therefore, also show
that size estimations were, on average, inelastic and that they were even less elastic when all
three dimensions were changed than when only one dimension was changed.
Study 2: Moderated Regression Model for Size Estimations
As in Study 1, we also estimated a moderated regression model of the effect of resizing
dimensionality on size estimations in which we pooled data across conditions and
participants. Because none of the manipulations had statistically different effects on the two
products, we also pooled the data from the two categories by again expressing the size and
WTP data as a multiple of the size and price of the smallest option. We estimated the
regression shown in Equation W1 with an extra binary variable for the products. As expected,
the mean elasticity was significantly lower than 1 (β = .81, t = -12.0, p < .001) and the
interaction between the actual size and dimensionality was significantly negative (δ = -.25, t =
-9.7, p < .001). Overall, these results show that size estimations were inelastic for both
detergent and wool in all conditions, but more so in the 3D condition than in the 1D condition,
thereby replicating all the results of Study 1.
Study 2: Moderated Regression Model for Willingness To Pay
To simultaneously estimate the main and interaction effects of size change,
dimensionality, and availability of objective size information on willingness to pay, we
estimated the following regression using data from the four conditions in which participants
could see the products (i.e., excluding the control condition):
(W2) ln(WTP) = β1 + β2 × ln(ACTSIZE) + β3 × DIM + β4 × SIZEINFO + β5 × ln(ACTSIZE) × DIM + β6 × ln(ACTSIZE) × SIZEINFO + β7 × DIM ×
SIZEINFO + β8 × ln(ACTSIZE) × SIZEINFO × DIM + β9 × WDUMMY + ε,
52
where WTP is rescaled as a multiple of the price of the smallest size, ACTSIZE is the
actual package size rescaled as a multiple of the smallest size, DIM is a dummy for the
dimensionality of the size change (equal to -½ in the 1D condition and to ½ in the 3D
condition), SIZEINFO is a dummy for the availability of size information (equal to -½ when
size information was absent and ½ when it was present), and WDUMMY is a dummy for
wool.
As expected, the coefficient of actual size was significantly smaller than 1 (β2 = .70, t = -
31.7, p < .001). The main effects of dimensionality and size information availability were not
statistically significant (β3 = .03, t = .7, p = .49 and β4 = -.03, t = -.7, p = .50), but the two-way
interactions were both statistically significant. The coefficient of the interaction between
actual size and dimensionality was negative (β6 = -.15, t = 8.1, p < .001), indicating steeper
quantity discounts in the 3D condition than in the 1D condition, as predicted. The coefficient
of the interaction between actual size and size information was positive (β7 = .12, t = 6.6, p <
.001), indicating steeper quantity discounts when size information was absent, as predicted.
The coefficient of the three-way interaction was not statistically significant (β8 = .02, t = .5, p
= .65), which indicates that providing objective size information did not reduce the bias
created by dimensionality. Finally, WTP was slightly smaller for wool, but the difference was
not statistically significant (β9 = -.04, t = -1.9, p = .06).

Europe Campus Boulevard de Constance, 77305 Fontainebleau Cedex, France Tel: +33 (0)1 6072 40 00 Fax: +33 (0)1 60 74 00/01 Asia Campus 1 Ayer Rajah Avenue, Singapore 138676 Tel: +65 67 99 53 88 Fax: +65 67 99 53 99 www.insead.edu