factors limiting suprathreshold vision measured by a flash–sound simultaneity paradigm
TRANSCRIPT
www.elsevier.com/locate/visres
Vision Research 44 (2004) 2577–2585
Factors limiting suprathreshold vision measured by aflash–sound simultaneity paradigm
Velitchko Manahilov a,*, Kellyanne Findlay a, William A. Simpson b
a Vision Sciences Department, Glasgow Caledonian University, Cowcaddens Road, Glasgow G4 0BA, UKb Simulation & Modelling Section DRDC Toronto, 1133 Sheppard Avenue West, P.O. Box 2000, Toronto, Ont., Canada M3M 3B9
Received 22 October 2003; received in revised form 21 April 2004
Abstract
Internal noise and sampling efficiency are the main factors which limit visual performance. In a previous study [Vis. Res. 43
(2003) 1103] we compared the variance of human reaction time to that of an ideal observer and found that the sampling efficiency
to suprathreshold stimuli was much lower than that obtained in detection experiments. In order to bypass the effects of the motor
system on visual performance, we used a flash–sound simultaneity paradigm. We found that the sampling efficiency for 0.4- and 4-c/
deg near-threshold Gabor patches is higher only by a factor of 2.5 than that to above-threshold patterns. The signal-dependent mul-
tiplicative internal noise was similar to the additive internal noise at lower signal contrast levels and exceeded it at higher signal
contrast levels. The results show that real observers� performance for detecting suprathreshold stimuli can be accounted for by a
model taking into account the non-linear visual–signal transduction and multiplicative components of the internal noise induced
by the signal and external noise. In addition, this model assumes that performance depends on the response duration, rather than
signal duration. The results imply that the multiplicative internal noise induced by high contrast visual signals determines perform-
ance for suprathreshold visual detection.
� 2004 Elsevier Ltd. All rights reserved.
Keywords: Vision; Detection; Efficiency; Noise; Arrival time
1. Introduction
Our ability to extract information from incomplete
and noisy sensory messages is limited by two main fac-
tors: the level of internal noise and sampling efficiency.
Any real system, including the visual system, suffers
from internal noise which is due to random variations
in the level of background neural activity at different
visual stages. Additionally, humans do not use allavailable a priori information for the visual signal
which results in a sub-optimal sampling efficiency. Inef-
ficiency can be characterised by measuring human per-
formance and comparing it to the best possible
0042-6989/$ - see front matter � 2004 Elsevier Ltd. All rights reserved.
doi:10.1016/j.visres.2004.05.017
* Corresponding author. Tel.: +44-141-331-8204; fax: +44-141-331-
3387.
E-mail address: [email protected] (V. Manahilov).
performance of an ideal observer (Barlow, 1978; Bur-gess, Wagner, Jennings, & Barlow, 1981; Legge, Ker-
sten, & Burgess, 1987; Nagaraja, 1964; Pelli, 1990).
The sampling efficiency and internal noise of a real ob-
server can be estimated by measuring how the signal
contrast energy required for an observer to maintain
a given performance level depends on the amount of
external visual noise added to the signal (Pelli, 1990).
This approach has been used successfully to measureinternal noise and efficiency for visual detection of
near-threshold stimuli (Burgess et al., 1981; Legge
et al., 1987; Nagaraja, 1964; Pelli, 1990). In many daily
tasks, however, humans have to respond to high con-
trast visual signals whose signal-to-noise ratio is high
and the available signal detection theory methods are
not applicable to measure human detection perform-
ance.
2578 V. Manahilov et al. / Vision Research 44 (2004) 2577–2585
Recently, we reported a method for assessment of the
visuomotor sampling efficiency and internal noise in the
detection of suprathreshold stimuli which is based on
comparing the variance of human reaction times (RTs)
to that of an ideal observer (Simpson, Findlay, & Ma-
nahilov, 2003). We found that the internal noise wassimilar to that measured in detection experiments and
remained constant as the signal contrast increased.
The sampling efficiency was much lower compared to
previous detection experiments. We suggested that the
discrepancy between our and other findings might be ex-
plained by the idea that a large part of the variability in
RT arises from the motor system rather than the visual
system. Instead of using RTs, we will use a flash–soundsimultaneity paradigm. A sound is presented at a fixed
time, and a flash is displayed at one of several times
either before or after the sound. The observer judges
which occurred first. Just as in the case of simple RT,
the task requires an estimation of the flash�s time of ar-
rival. As we will show in the next section, the precision
of the simultaneity judgements can be used to determine
the internal noise and sampling efficiency of supra-threshold visual detection.
Another possible reason for the low sampling efficien-
cies we found previously may have been our use of a
simplified linear amplifier model which does not take
into account multiplicative components of the internal
noise induced by the signal and the external noise (Bur-
gess & Colborne, 1988; Tolhurst, Movshon, & Thomp-
son, 1981). Moreover, RT distributions are usuallyskewed and their approximation with a Gaussian func-
tion is not always correct.
Here we develop and test a model for estimation of
arrival time of a visual signal which is based on the per-
ceptual template model for near-threshold visual detec-
tion (Lu & Dosher, 1999).
2. Models
We propose a model for estimation of arrival time of
a visual signal. An ideal observer is presented with two
signals: an auditory signal (a brief loud tone) and a vis-
ual signal (a pattern flash). The auditory signal is always
presented at a fixed time (sa) in the absence of auditory
noise. The visual signal, embedded in dynamic Gaussianwhite visual noise, is delivered at a random time (sv).The observer�s task is to say which signal came first. Thisrequires that the observer compare the times of arrival
of the two signals. The ideal observer knows the time
of arrival of the auditory signal exactly, since it always
arrives at the same time, and because it is not embedded
in any auditory noise. The time of arrival of the visual
signal, however, must be estimated. The optimal algo-rithm to do this is to cross-correlate the received noisy
visual waveform with the expected visual signal at every
possible time of arrival. The time at which the peak of
this cross-correlation function occurs is the estimated
time of arrival of the visual signal (Simpson et al.,
2003; Woodward, 1980, pp. 104–105).
Due to the visual noise, the estimated time of arrival
of the visual signal has a normal distribution with meanequal to the actual time of arrival, and with variance
(Simpson et al., 2003; Woodward, 1980, pp. 104–105):
r2 ¼ D2r2N
E; ð1Þ
where D is the signal duration, r2N is the external noise
variance and E is the signal energy (integrated squared
contrast signal waveform).
As we noted, the ideal observer knows the time of ar-
rival of the auditory signal (sa) exactly, since it alwaysoccurs at the same time and is not embedded in auditory
noise. On the other hand, the estimated time of arrival
of the visual signal (sv) is distributed normally with
mean equal to the actual time of arrival, and with vari-
ance r2. Therefore, the discriminability of the times of
arrival of a fixed auditory signal and a randomly arriv-
ing visual signal could be expressed as
d 02 ¼ ðsv � saÞ2
r2: ð2Þ
So far we have modelled performance of an ideal ob-
server. Barlow (1978), Legge et al. (1987) and Pelli
(1990) developed a linear amplifier model (LAM), whichassumes that real observers do not use all the energy in
the delivered signal, that is they have sub-optimal sam-
pling efficiency. Real observers also appear to add extra
internal noise to the stimulus. On the other hand, brief
stimuli evoke prolonged visual responses (Rashbass,
1970; Watson, 1986). Thus, to model performance of
real observers we will modify Eq. (1) including these fac-
tors:
r2 ¼ D2Rðr2
N þ r2addÞ
kE; ð3Þ
where k is the sampling efficiency, r2add is the variance of
the additive internal noise and DR is the response dura-
tion.
Lu and Dosher (1999) have postulated that even
more parameters need to be considered: the exponent
of the power transducer function (c) and the parameter(m) determining the amounts of the signal energy
[m(kE)c] and the external noise variance (mr2cN ) which
act as multiplicative internal noise. They proposed a per-
ceptual template model (PTM) for detection of visual
stimuli which predicts that the detectability index (d 0)
could be expressed as
d 02 ¼ ðkEthrÞc
r2cN þ mr2c
N þ mðkEthrÞc þ r2add
: ð4Þ
V. Manahilov et al. / Vision Research 44 (2004) 2577–2585 2579
In the present study we will describe threshold energy
for detection of Gabor patches as a function of external
noise variance by rearranging Eq. (4) as follows:
Ethr ¼d 02=c½r2c
N þ mr2cN þ r2
add�1=c
kð1� md 02Þ1=c: ð5Þ
Applying this perceptual template model to supra-
threshold visual detection, the variance of the real
observers� estimations of arrival time of a visual signal
could be described by taking into account the power
transducer function (c) and the multiplicative internal
noise components due to the signal energy [m(kE)c]
and the external noise variance (mr2cN ). Therefore, Eq.
(3) could be modified as follows:
r2 ¼ D2R½r
2cN þ mr2c
N þ mðkEÞc þ r2add�
ðkEÞc : ð6Þ
Note that Eq. (6) takes account of the increased vari-
ance of real observers� performance relative to the ideal
observer due to various visual stages. It is likely true that
similar stages take place in auditory transduction. How-
ever, since the auditory signal always was delivered at
the same time, and since it was not embedded in audi-
tory noise, it seems plausible that the noise associatedwith the representation of the auditory signal relative
to that of the visual signal would be negligible.
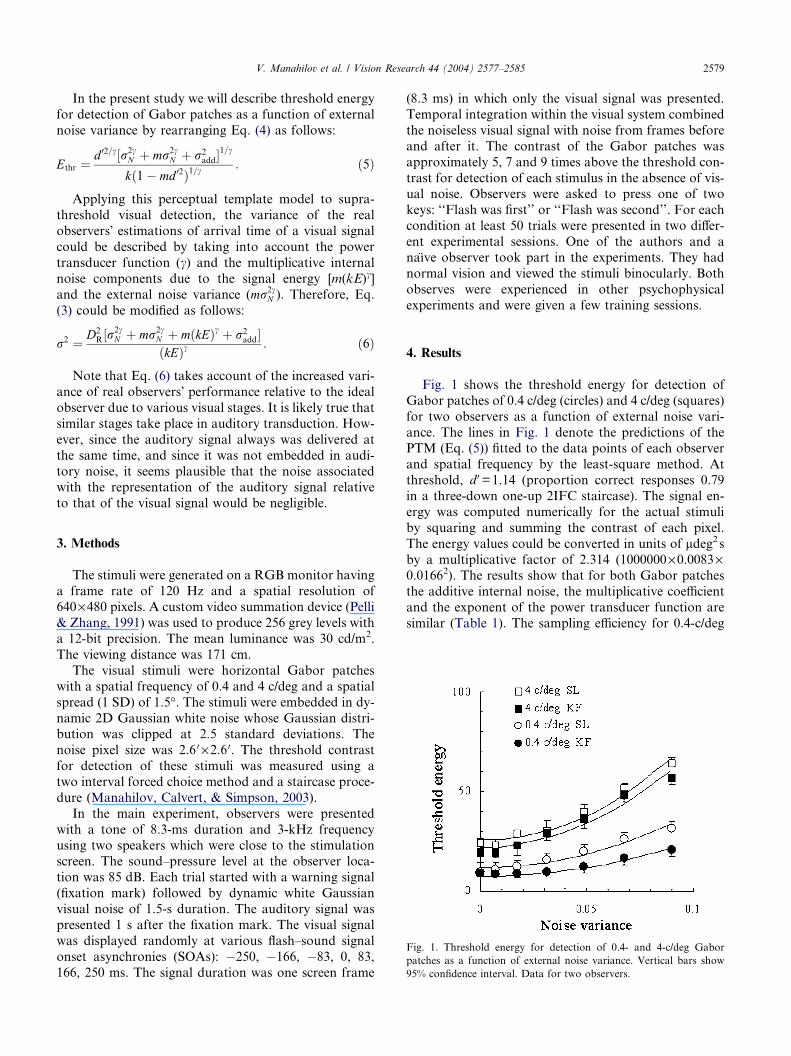
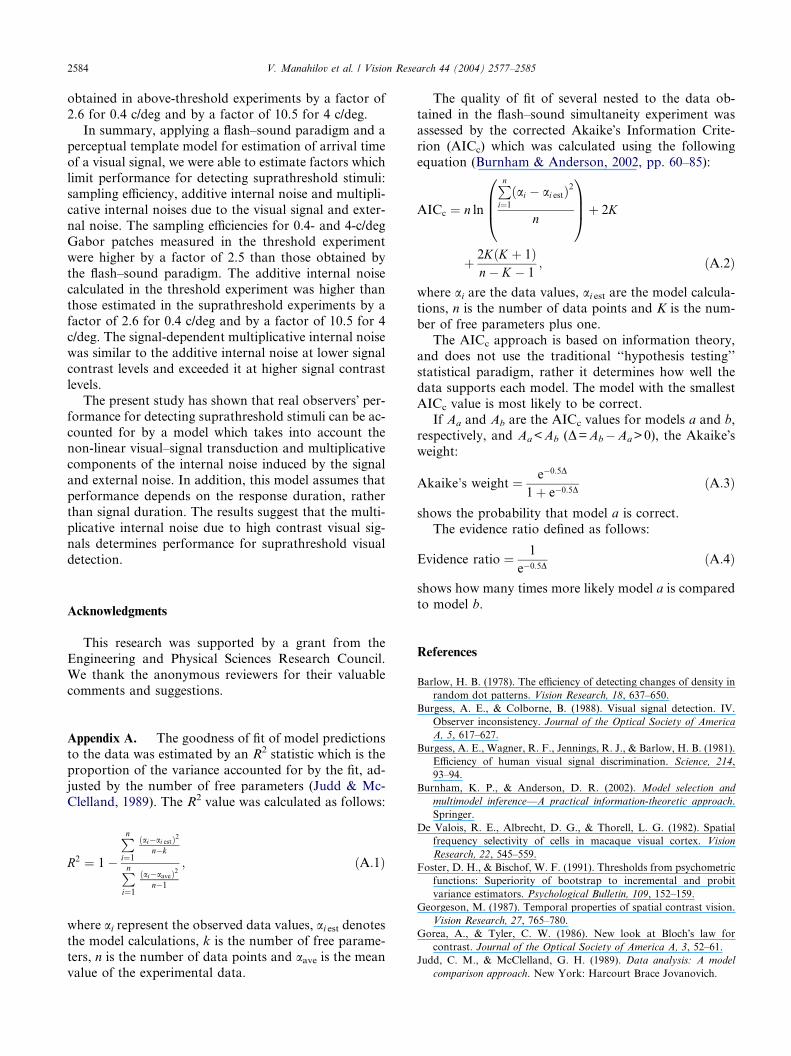
Fig. 1. Threshold energy for detection of 0.4- and 4-c/deg Gabor
patches as a function of external noise variance. Vertical bars show
95% confidence interval. Data for two observers.
3. Methods
The stimuli were generated on a RGB monitor having
a frame rate of 120 Hz and a spatial resolution of640·480 pixels. A custom video summation device (Pelli
& Zhang, 1991) was used to produce 256 grey levels with
a 12-bit precision. The mean luminance was 30 cd/m2.
The viewing distance was 171 cm.
The visual stimuli were horizontal Gabor patches
with a spatial frequency of 0.4 and 4 c/deg and a spatial
spread (1 SD) of 1.5�. The stimuli were embedded in dy-
namic 2D Gaussian white noise whose Gaussian distri-bution was clipped at 2.5 standard deviations. The
noise pixel size was 2.6 0 ·2.6 0. The threshold contrast
for detection of these stimuli was measured using a
two interval forced choice method and a staircase proce-
dure (Manahilov, Calvert, & Simpson, 2003).
In the main experiment, observers were presented
with a tone of 8.3-ms duration and 3-kHz frequency
using two speakers which were close to the stimulationscreen. The sound–pressure level at the observer loca-
tion was 85 dB. Each trial started with a warning signal
(fixation mark) followed by dynamic white Gaussian
visual noise of 1.5-s duration. The auditory signal was
presented 1 s after the fixation mark. The visual signal
was displayed randomly at various flash–sound signal
onset asynchronies (SOAs): �250, �166, �83, 0, 83,166, 250 ms. The signal duration was one screen frame
(8.3 ms) in which only the visual signal was presented.
Temporal integration within the visual system combined
the noiseless visual signal with noise from frames before
and after it. The contrast of the Gabor patches was
approximately 5, 7 and 9 times above the threshold con-
trast for detection of each stimulus in the absence of vis-ual noise. Observers were asked to press one of two
keys: ‘‘Flash was first’’ or ‘‘Flash was second’’. For each
condition at least 50 trials were presented in two differ-
ent experimental sessions. One of the authors and a
naıve observer took part in the experiments. They had
normal vision and viewed the stimuli binocularly. Both
observes were experienced in other psychophysical
experiments and were given a few training sessions.
4. Results
Fig. 1 shows the threshold energy for detection of
Gabor patches of 0.4 c/deg (circles) and 4 c/deg (squares)
for two observers as a function of external noise vari-
ance. The lines in Fig. 1 denote the predictions of thePTM (Eq. (5)) fitted to the data points of each observer
and spatial frequency by the least-square method. At
threshold, d 0=1.14 (proportion correct responses 0.79
in a three-down one-up 2IFC staircase). The signal en-
ergy was computed numerically for the actual stimuli
by squaring and summing the contrast of each pixel.
The energy values could be converted in units of ldeg2sby a multiplicative factor of 2.314 (1000000·0.0083·0.01662). The results show that for both Gabor patches
the additive internal noise, the multiplicative coefficient
and the exponent of the power transducer function are
similar (Table 1). The sampling efficiency for 0.4-c/deg
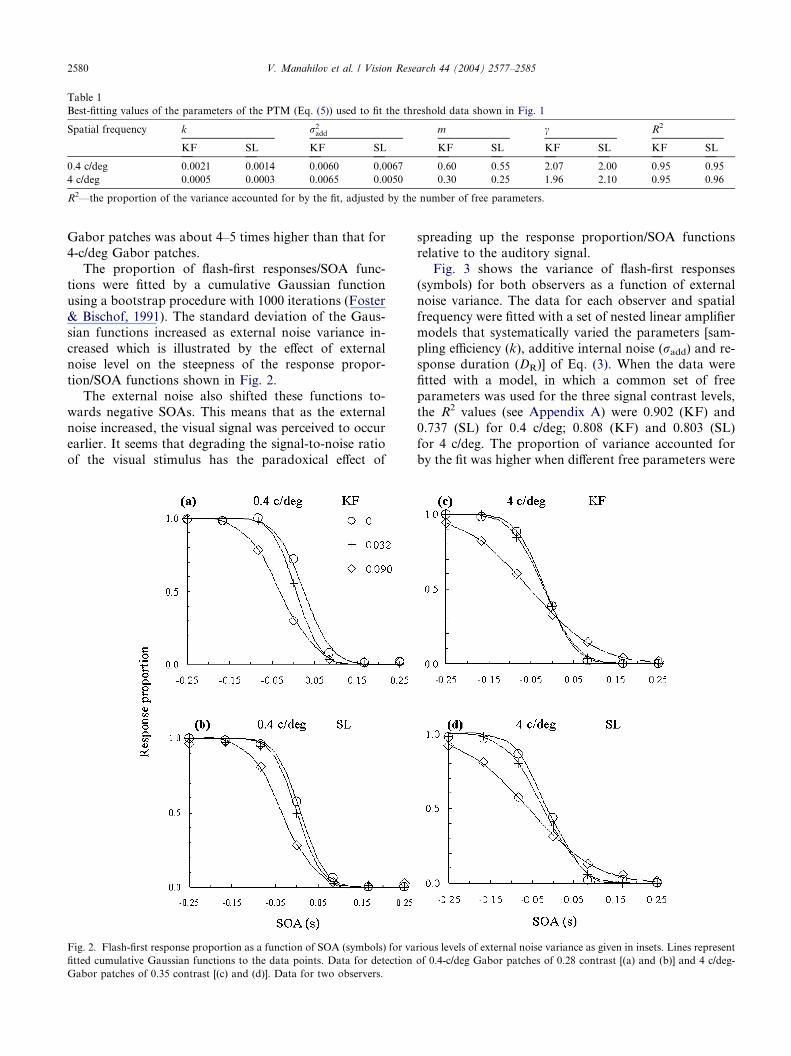
Table 1
Best-fitting values of the parameters of the PTM (Eq. (5)) used to fit the threshold data shown in Fig. 1
Spatial frequency k r2add m c R2
KF SL KF SL KF SL KF SL KF SL
0.4 c/deg 0.0021 0.0014 0.0060 0.0067 0.60 0.55 2.07 2.00 0.95 0.95
4 c/deg 0.0005 0.0003 0.0065 0.0050 0.30 0.25 1.96 2.10 0.95 0.96
R2—the proportion of the variance accounted for by the fit, adjusted by the number of free parameters.
2580 V. Manahilov et al. / Vision Research 44 (2004) 2577–2585
Gabor patches was about 4–5 times higher than that for
4-c/deg Gabor patches.
The proportion of flash-first responses/SOA func-
tions were fitted by a cumulative Gaussian function
using a bootstrap procedure with 1000 iterations (Foster
& Bischof, 1991). The standard deviation of the Gaus-
sian functions increased as external noise variance in-
creased which is illustrated by the effect of externalnoise level on the steepness of the response propor-
tion/SOA functions shown in Fig. 2.
The external noise also shifted these functions to-
wards negative SOAs. This means that as the external
noise increased, the visual signal was perceived to occur
earlier. It seems that degrading the signal-to-noise ratio
of the visual stimulus has the paradoxical effect of
Fig. 2. Flash-first response proportion as a function of SOA (symbols) for va
fitted cumulative Gaussian functions to the data points. Data for detection
Gabor patches of 0.35 contrast [(c) and (d)]. Data for two observers.
spreading up the response proportion/SOA functions
relative to the auditory signal.
Fig. 3 shows the variance of flash-first responses
(symbols) for both observers as a function of external
noise variance. The data for each observer and spatial
frequency were fitted with a set of nested linear amplifier
models that systematically varied the parameters [sam-
pling efficiency (k), additive internal noise (radd) and re-sponse duration (DR)] of Eq. (3). When the data were
fitted with a model, in which a common set of free
parameters was used for the three signal contrast levels,
the R2 values (see Appendix A) were 0.902 (KF) and
0.737 (SL) for 0.4 c/deg; 0.808 (KF) and 0.803 (SL)
for 4 c/deg. The proportion of variance accounted for
by the fit was higher when different free parameters were
rious levels of external noise variance as given in insets. Lines represent
of 0.4-c/deg Gabor patches of 0.28 contrast [(a) and (b)] and 4 c/deg-
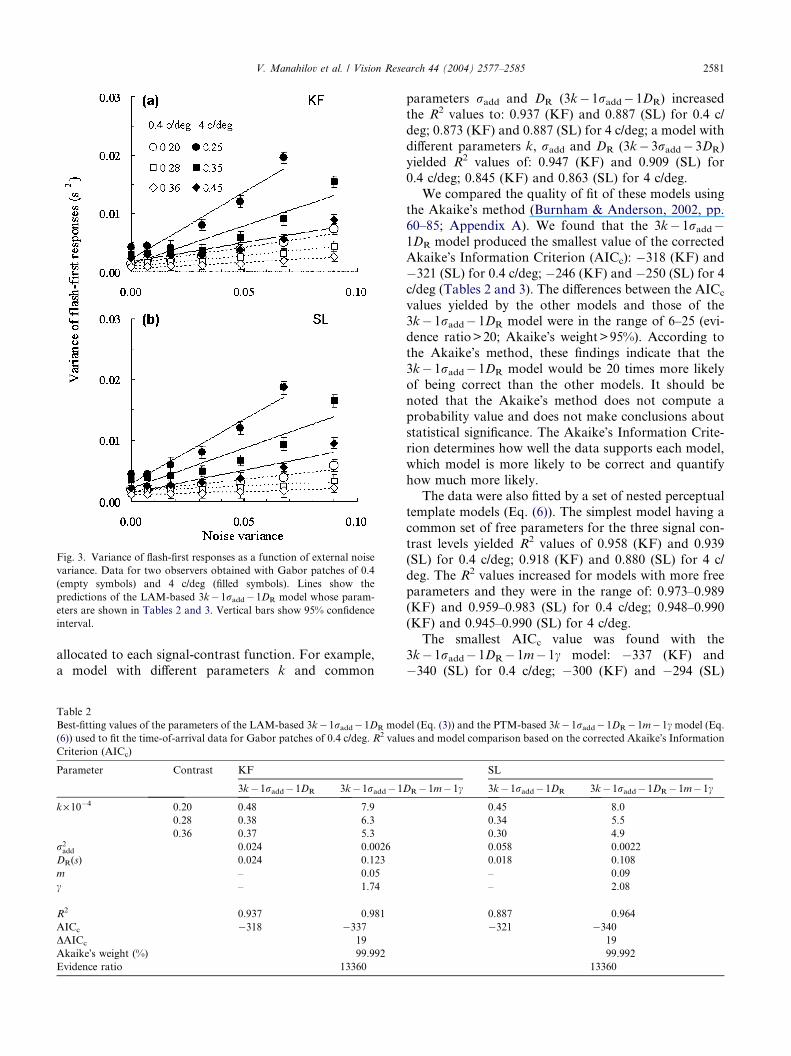
Fig. 3. Variance of flash-first responses as a function of external noise
variance. Data for two observers obtained with Gabor patches of 0.4
(empty symbols) and 4 c/deg (filled symbols). Lines show the
predictions of the LAM-based 3k�1radd�1DR model whose param-
eters are shown in Tables 2 and 3. Vertical bars show 95% confidence
interval.
V. Manahilov et al. / Vision Research 44 (2004) 2577–2585 2581
allocated to each signal-contrast function. For example,
a model with different parameters k and common
Table 2
Best-fitting values of the parameters of the LAM-based 3k�1radd�1DR mod
(6)) used to fit the time-of-arrival data for Gabor patches of 0.4 c/deg. R2 valu
Criterion (AICc)
Parameter Contrast KF
3k�1radd� 1DR 3k�1radd�1D
k·10�4 0.20 0.48 7.9
0.28 0.38 6.3
0.36 0.37 5.3
r2add 0.024 0.0026
DR(s) 0.024 0.123
m – 0.05
c – 1.74
R2 0.937 0.981
AICc �318 �337DAICc 19
Akaike�s weight (%) 99.992
Evidence ratio 13360
parameters radd and DR (3k� 1radd� 1DR) increased
the R2 values to: 0.937 (KF) and 0.887 (SL) for 0.4 c/
deg; 0.873 (KF) and 0.887 (SL) for 4 c/deg; a model with
different parameters k, radd and DR (3k� 3radd� 3DR)
yielded R2 values of: 0.947 (KF) and 0.909 (SL) for
0.4 c/deg; 0.845 (KF) and 0.863 (SL) for 4 c/deg.We compared the quality of fit of these models using
the Akaike�s method (Burnham & Anderson, 2002, pp.
60–85; Appendix A). We found that the 3k� 1radd�1DR model produced the smallest value of the corrected
Akaike�s Information Criterion (AICc): �318 (KF) and
�321 (SL) for 0.4 c/deg; �246 (KF) and �250 (SL) for 4c/deg (Tables 2 and 3). The differences between the AICc
values yielded by the other models and those of the3k� 1radd� 1DR model were in the range of 6–25 (evi-
dence ratio>20; Akaike�s weight>95%). According to
the Akaike�s method, these findings indicate that the
3k� 1radd� 1DR model would be 20 times more likely
of being correct than the other models. It should be
noted that the Akaike�s method does not compute a
probability value and does not make conclusions about
statistical significance. The Akaike�s Information Crite-rion determines how well the data supports each model,
which model is more likely to be correct and quantify
how much more likely.
The data were also fitted by a set of nested perceptual
template models (Eq. (6)). The simplest model having a
common set of free parameters for the three signal con-
trast levels yielded R2 values of 0.958 (KF) and 0.939
(SL) for 0.4 c/deg; 0.918 (KF) and 0.880 (SL) for 4 c/deg. The R2 values increased for models with more free
parameters and they were in the range of: 0.973–0.989
(KF) and 0.959–0.983 (SL) for 0.4 c/deg; 0.948–0.990
(KF) and 0.945–0.990 (SL) for 4 c/deg.
The smallest AICc value was found with the
3k� 1radd� 1DR� 1m� 1c model: �337 (KF) and
�340 (SL) for 0.4 c/deg; �300 (KF) and �294 (SL)
el (Eq. (3)) and the PTM-based 3k�1radd�1DR� 1m�1c model (Eq.es and model comparison based on the corrected Akaike�s Information
SL
R�1m�1c 3k� 1radd�1DR 3k�1radd�1DR�1m�1c
0.45 8.0
0.34 5.5
0.30 4.9
0.058 0.0022
0.018 0.108
– 0.09
– 2.08
0.887 0.964
�321 �34019
99.992
13360
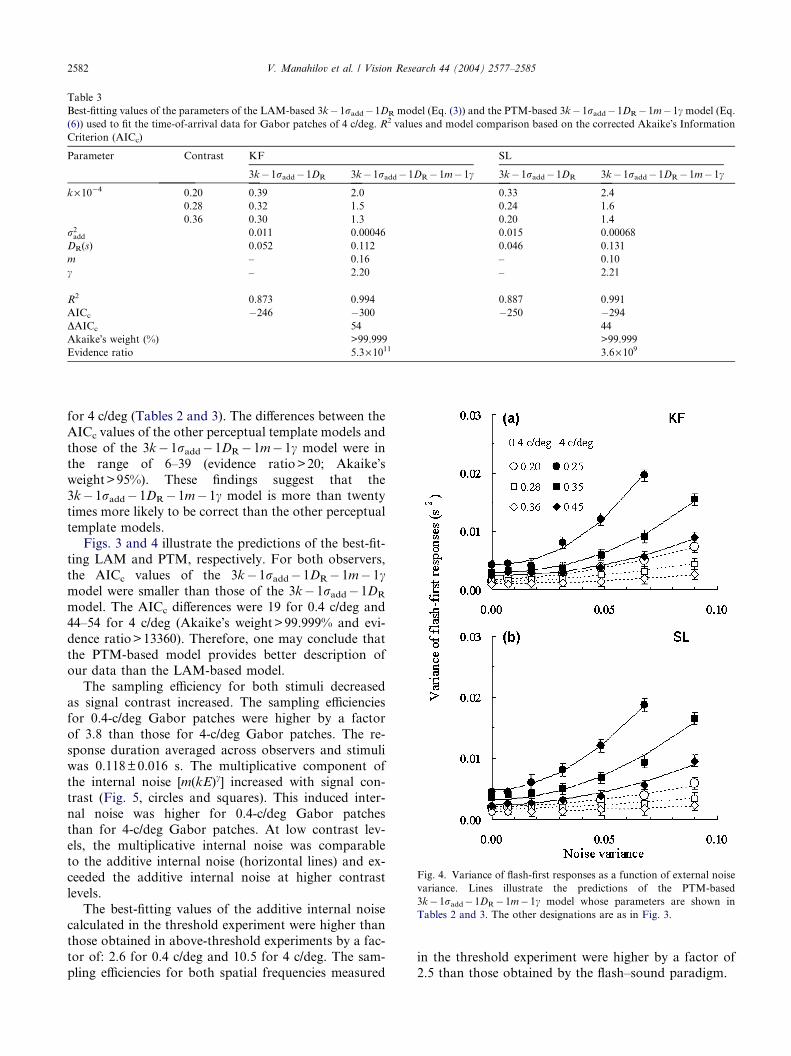
Table 3
Best-fitting values of the parameters of the LAM-based 3k�1radd�1DR model (Eq. (3)) and the PTM-based 3k�1radd�1DR�1m�1c model (Eq.(6)) used to fit the time-of-arrival data for Gabor patches of 4 c/deg. R2 values and model comparison based on the corrected Akaike�s InformationCriterion (AICc)
Parameter Contrast KF SL
3k�1radd�1DR 3k� 1radd�1DR� 1m�1c 3k�1radd�1DR 3k�1radd�1DR�1m� 1c
k·10�4 0.20 0.39 2.0 0.33 2.4
0.28 0.32 1.5 0.24 1.6
0.36 0.30 1.3 0.20 1.4
r2add 0.011 0.00046 0.015 0.00068
DR(s) 0.052 0.112 0.046 0.131
m – 0.16 – 0.10
c – 2.20 – 2.21
R2 0.873 0.994 0.887 0.991
AICc �246 �300 �250 �294DAICc 54 44
Akaike�s weight (%) >99.999 >99.999
Evidence ratio 5.3·1011 3.6·109
Fig. 4. Variance of flash-first responses as a function of external noise
variance. Lines illustrate the predictions of the PTM-based
3k�1radd�1DR�1m�1c model whose parameters are shown in
Tables 2 and 3. The other designations are as in Fig. 3.
2582 V. Manahilov et al. / Vision Research 44 (2004) 2577–2585
for 4 c/deg (Tables 2 and 3). The differences between the
AICc values of the other perceptual template models and
those of the 3k� 1radd� 1DR� 1m� 1c model were in
the range of 6–39 (evidence ratio>20; Akaike�sweight>95%). These findings suggest that the
3k� 1radd� 1DR� 1m� 1c model is more than twenty
times more likely to be correct than the other perceptual
template models.Figs. 3 and 4 illustrate the predictions of the best-fit-
ting LAM and PTM, respectively. For both observers,
the AICc values of the 3k� 1radd� 1DR� 1m� 1cmodel were smaller than those of the 3k� 1radd� 1DR
model. The AICc differences were 19 for 0.4 c/deg and
44–54 for 4 c/deg (Akaike�s weight>99.999% and evi-
dence ratio>13360). Therefore, one may conclude that
the PTM-based model provides better description ofour data than the LAM-based model.
The sampling efficiency for both stimuli decreased
as signal contrast increased. The sampling efficiencies
for 0.4-c/deg Gabor patches were higher by a factor
of 3.8 than those for 4-c/deg Gabor patches. The re-
sponse duration averaged across observers and stimuli
was 0.118±0.016 s. The multiplicative component of
the internal noise [m(kE)c] increased with signal con-trast (Fig. 5, circles and squares). This induced inter-
nal noise was higher for 0.4-c/deg Gabor patches
than for 4-c/deg Gabor patches. At low contrast lev-
els, the multiplicative internal noise was comparable
to the additive internal noise (horizontal lines) and ex-
ceeded the additive internal noise at higher contrast
levels.
The best-fitting values of the additive internal noisecalculated in the threshold experiment were higher than
those obtained in above-threshold experiments by a fac-
tor of: 2.6 for 0.4 c/deg and 10.5 for 4 c/deg. The sam-
pling efficiencies for both spatial frequencies measured
in the threshold experiment were higher by a factor of2.5 than those obtained by the flash–sound paradigm.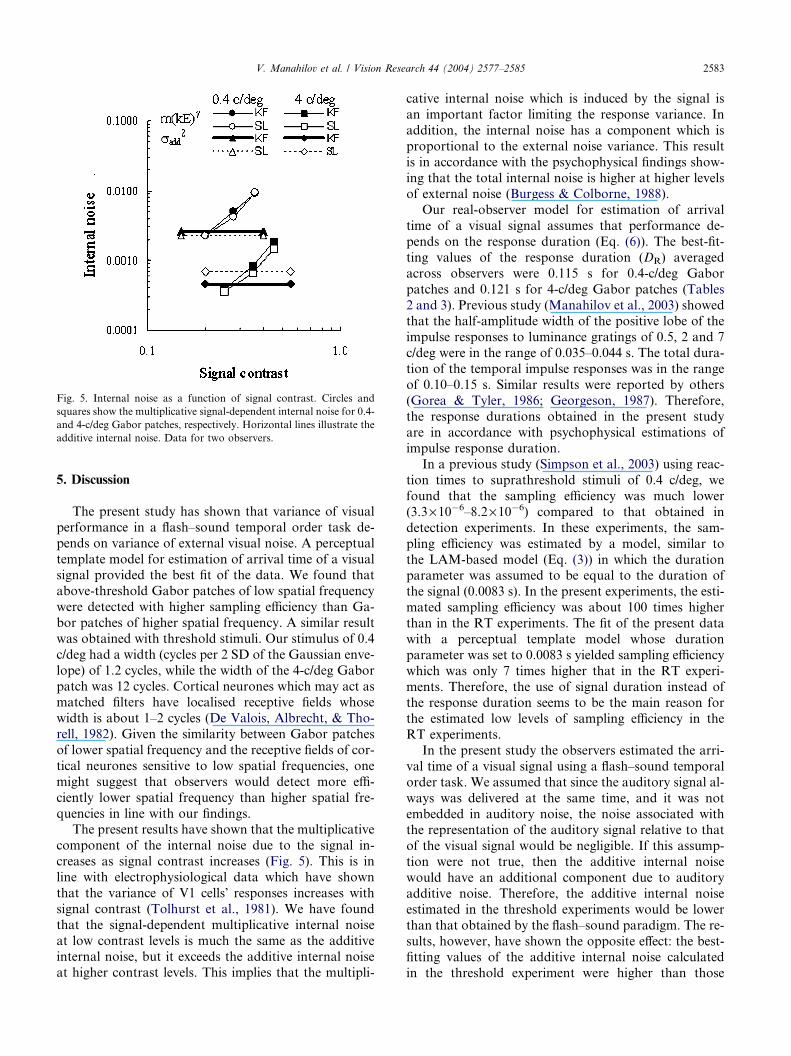
Fig. 5. Internal noise as a function of signal contrast. Circles and
squares show the multiplicative signal-dependent internal noise for 0.4-
and 4-c/deg Gabor patches, respectively. Horizontal lines illustrate the
additive internal noise. Data for two observers.
V. Manahilov et al. / Vision Research 44 (2004) 2577–2585 2583
5. Discussion
The present study has shown that variance of visual
performance in a flash–sound temporal order task de-
pends on variance of external visual noise. A perceptual
template model for estimation of arrival time of a visualsignal provided the best fit of the data. We found that
above-threshold Gabor patches of low spatial frequency
were detected with higher sampling efficiency than Ga-
bor patches of higher spatial frequency. A similar result
was obtained with threshold stimuli. Our stimulus of 0.4
c/deg had a width (cycles per 2 SD of the Gaussian enve-
lope) of 1.2 cycles, while the width of the 4-c/deg Gabor
patch was 12 cycles. Cortical neurones which may act asmatched filters have localised receptive fields whose
width is about 1–2 cycles (De Valois, Albrecht, & Tho-
rell, 1982). Given the similarity between Gabor patches
of lower spatial frequency and the receptive fields of cor-
tical neurones sensitive to low spatial frequencies, one
might suggest that observers would detect more effi-
ciently lower spatial frequency than higher spatial fre-
quencies in line with our findings.The present results have shown that the multiplicative
component of the internal noise due to the signal in-
creases as signal contrast increases (Fig. 5). This is in
line with electrophysiological data which have shown
that the variance of V1 cells� responses increases withsignal contrast (Tolhurst et al., 1981). We have found
that the signal-dependent multiplicative internal noise
at low contrast levels is much the same as the additiveinternal noise, but it exceeds the additive internal noise
at higher contrast levels. This implies that the multipli-
cative internal noise which is induced by the signal is
an important factor limiting the response variance. In
addition, the internal noise has a component which is
proportional to the external noise variance. This result
is in accordance with the psychophysical findings show-
ing that the total internal noise is higher at higher levelsof external noise (Burgess & Colborne, 1988).
Our real-observer model for estimation of arrival
time of a visual signal assumes that performance de-
pends on the response duration (Eq. (6)). The best-fit-
ting values of the response duration (DR) averaged
across observers were 0.115 s for 0.4-c/deg Gabor
patches and 0.121 s for 4-c/deg Gabor patches (Tables
2 and 3). Previous study (Manahilov et al., 2003) showedthat the half-amplitude width of the positive lobe of the
impulse responses to luminance gratings of 0.5, 2 and 7
c/deg were in the range of 0.035–0.044 s. The total dura-
tion of the temporal impulse responses was in the range
of 0.10–0.15 s. Similar results were reported by others
(Gorea & Tyler, 1986; Georgeson, 1987). Therefore,
the response durations obtained in the present study
are in accordance with psychophysical estimations ofimpulse response duration.
In a previous study (Simpson et al., 2003) using reac-
tion times to suprathreshold stimuli of 0.4 c/deg, we
found that the sampling efficiency was much lower
(3.3·10�6–8.2·10�6) compared to that obtained in
detection experiments. In these experiments, the sam-
pling efficiency was estimated by a model, similar to
the LAM-based model (Eq. (3)) in which the durationparameter was assumed to be equal to the duration of
the signal (0.0083 s). In the present experiments, the esti-
mated sampling efficiency was about 100 times higher
than in the RT experiments. The fit of the present data
with a perceptual template model whose duration
parameter was set to 0.0083 s yielded sampling efficiency
which was only 7 times higher that in the RT experi-
ments. Therefore, the use of signal duration instead ofthe response duration seems to be the main reason for
the estimated low levels of sampling efficiency in the
RT experiments.
In the present study the observers estimated the arri-
val time of a visual signal using a flash–sound temporal
order task. We assumed that since the auditory signal al-
ways was delivered at the same time, and it was not
embedded in auditory noise, the noise associated withthe representation of the auditory signal relative to that
of the visual signal would be negligible. If this assump-
tion were not true, then the additive internal noise
would have an additional component due to auditory
additive noise. Therefore, the additive internal noise
estimated in the threshold experiments would be lower
than that obtained by the flash–sound paradigm. The re-
sults, however, have shown the opposite effect: the best-fitting values of the additive internal noise calculated
in the threshold experiment were higher than those
2584 V. Manahilov et al. / Vision Research 44 (2004) 2577–2585
obtained in above-threshold experiments by a factor of
2.6 for 0.4 c/deg and by a factor of 10.5 for 4 c/deg.
In summary, applying a flash–sound paradigm and a
perceptual template model for estimation of arrival time
of a visual signal, we were able to estimate factors which
limit performance for detecting suprathreshold stimuli:sampling efficiency, additive internal noise and multipli-
cative internal noises due to the visual signal and exter-
nal noise. The sampling efficiencies for 0.4- and 4-c/deg
Gabor patches measured in the threshold experiment
were higher by a factor of 2.5 than those obtained by
the flash–sound paradigm. The additive internal noise
calculated in the threshold experiment was higher than
those estimated in the suprathreshold experiments by afactor of 2.6 for 0.4 c/deg and by a factor of 10.5 for 4
c/deg. The signal-dependent multiplicative internal noise
was similar to the additive internal noise at lower signal
contrast levels and exceeded it at higher signal contrast
levels.
The present study has shown that real observers� per-formance for detecting suprathreshold stimuli can be ac-
counted for by a model which takes into account thenon-linear visual–signal transduction and multiplicative
components of the internal noise induced by the signal
and external noise. In addition, this model assumes that
performance depends on the response duration, rather
than signal duration. The results suggest that the multi-
plicative internal noise due to high contrast visual sig-
nals determines performance for suprathreshold visual
detection.
Acknowledgments
This research was supported by a grant from the
Engineering and Physical Sciences Research Council.
We thank the anonymous reviewers for their valuable
comments and suggestions.
Appendix A. The goodness of fit of model predictions
to the data was estimated by an R2 statistic which is the
proportion of the variance accounted for by the fit, ad-
justed by the number of free parameters (Judd & Mc-
Clelland, 1989). The R2 value was calculated as follows:
R2 ¼ 1�
Pni¼1
ðai�ai estÞ2n�k
Pni¼1
ðai�aaveÞ2n�1
; ðA:1Þ
where ai represent the observed data values, ai est denotesthe model calculations, k is the number of free parame-
ters, n is the number of data points and aave is the meanvalue of the experimental data.
The quality of fit of several nested to the data ob-
tained in the flash–sound simultaneity experiment was
assessed by the corrected Akaike�s Information Crite-
rion (AICc) which was calculated using the following
equation (Burnham & Anderson, 2002, pp. 60–85):
AICc ¼ n ln
Pni¼1
ðai � ai estÞ2
n
0BB@
1CCAþ 2K
þ 2KðK þ 1Þn� K � 1
; ðA:2Þ
where ai are the data values, ai est are the model calcula-tions, n is the number of data points and K is the num-
ber of free parameters plus one.
The AICc approach is based on information theory,
and does not use the traditional ‘‘hypothesis testing’’
statistical paradigm, rather it determines how well thedata supports each model. The model with the smallest
AICc value is most likely to be correct.
If Aa and Ab are the AICc values for models a and b,
respectively, and Aa<Ab (D=Ab�Aa>0), the Akaike�sweight:
Akaike’s weight ¼ e�0:5D
1þ e�0:5DðA:3Þ
shows the probability that model a is correct.
The evidence ratio defined as follows:
Evidence ratio ¼ 1
e�0:5DðA:4Þ
shows how many times more likely model a is compared
to model b.
References
Barlow, H. B. (1978). The efficiency of detecting changes of density in
random dot patterns. Vision Research, 18, 637–650.
Burgess, A. E., & Colborne, B. (1988). Visual signal detection. IV.
Observer inconsistency. Journal of the Optical Society of America
A, 5, 617–627.
Burgess, A. E., Wagner, R. F., Jennings, R. J., & Barlow, H. B. (1981).
Efficiency of human visual signal discrimination. Science, 214,
93–94.
Burnham, K. P., & Anderson, D. R. (2002). Model selection and
multimodel inference—A practical information-theoretic approach.
Springer.
De Valois, R. E., Albrecht, D. G., & Thorell, L. G. (1982). Spatial
frequency selectivity of cells in macaque visual cortex. Vision
Research, 22, 545–559.
Foster, D. H., & Bischof, W. F. (1991). Thresholds from psychometric
functions: Superiority of bootstrap to incremental and probit
variance estimators. Psychological Bulletin, 109, 152–159.
Georgeson, M. (1987). Temporal properties of spatial contrast vision.
Vision Research, 27, 765–780.
Gorea, A., & Tyler, C. W. (1986). New look at Bloch�s law for
contrast. Journal of the Optical Society of America A, 3, 52–61.
Judd, C. M., & McClelland, G. H. (1989). Data analysis: A model
comparison approach. New York: Harcourt Brace Jovanovich.
V. Manahilov et al. / Vision Research 44 (2004) 2577–2585 2585
Legge, G., Kersten, D., & Burgess, A. E. (1987). Contrast discrimi-
nation in noise. Journal of the Optical Society of America A, 4,
391–406.
Lu, Z. L., & Dosher, B. A. (1999). Characterizing human perceptual
inefficiencies with equivalent internal noise. Journal of the Optical
Society of America A, 16, 764–778.
Manahilov, V., Calvert, J., & Simpson, W. A. (2003). Temporal
properties of the visual responses to luminance and contrast
modulated noise. Vision Research, 43, 1855–1867.
Nagaraja, N. S. (1964). Effect of luminance noise on contrast
thresholds. Journal of the Optical Society of America, 54, 950–955.
Pelli, D. G. (1990). The quantum efficiency of vision. In C. Blakemore
(Ed.), Vision: Coding and efficiency (pp. 3–24). New York:
Cambridge University Press.
Pelli, D. G., & Zhang, L. (1991). Accurate control of contrast on
microcomputer displays. Vision Research, 31, 1337–1350.
Rashbass, C. (1970). The visibility of transient changes of luminance.
Journal of Physiology, 210, 165–186.
Simpson, W. A., Findlay, K., & Manahilov, V. (2003). Efficiency
and internal noise for detection of suprathreshold patterns
measured using simple reaction time. Vision Research, 43,
1103–1109.
Tolhurst, D. J., Movshon, J. A., & Thompson, I. D. (1981). The
dependence of response amplitude and variance of cat visual cortex
neurones on stimulus contrast. Experimental Brain Research, 41,
414–419.
Watson, A. B. (1986). Temporal sensitivity. In K. R. Boff, L.
Kaufman, & J. P. Thomas (Eds.), Handbook of perception and
human performance I: Sensory processes and perception (pp. 6-1-
6.41). New York: John Wiley.
Woodward, P. M. (1980). Probability and information theory, with
applications to radar. New York: Pergamon.