f l i g h t safe
TRANSCRIPT
F L I G HT SAFE TY FOUN D A TI O N • F L I G H T S A F E T Y D I G E S T • OCTOBER 1991 1
On established U.S. airlines1 during the past15 years, the death risk per domestic jet flighthas been about one in 10 million. At that rate,a traveler who took one flight at random eachday would go 26,000 years on average beforebeing killed in a fatal crash.
Such statistics have been cited to suggest theextraordinary level of safety of U.S. commer-cial aviation. (The December 1990 Reader’s Di-gest, for example, contained an article, “FlyWithout Fear,” that quoted the second figureabove.) But, as usual for risk measures, somequalifying remarks are warranted. The num-bers reflect overall averages, which may beoptimistic in certain settings. (It has been esti-mated, for instance, that landings and take-offs in thunderstorms are at least 400 times asdangerous as those at other times.) Moreover,the calculations are predicated on a completelyrandom choice among flights. But passengers
do not select flights at random; as an example,they appear in greater numbers on an averageBoeing 747 than on an average McDonnellDouglas DC-9, and on flights the Wednesdaybefore Thanksgiving than on the third Wednes-day in January.
So long as travelers do not fly in dispropor-tionate numbers on “hazard-prone” flights,nonuniformities in passenger demand wouldnot bias the aggregate estimate of death risk.One can imagine reasons, however, why thiscondition might not be satisfied. The authors,therefore, considered it useful to investigatethe issue empirically and, in this note, presentthe results of that investigation.
We indicate that U.S. jet flights, which recentlysuffered major crashes, averaged nearly twiceas many passengers on board as U.S. jet flightsthat were uneventful. This statistically-significant
An Unfortunate Pattern Observed inU.S. Domestic Jet Accidents
On established U.S. airlines during the period from 1975-89,domestic jet flights that suffered major crashes had nearly
twice as many passengers on board as other flights. This excessarose because these flights had both higher seating capacity and
far fewer empty seats than usual. The pattern was of veryhigh statistical significance.
byArnold Barnett, Ph.D., and Todd Curtis
Sloan School of ManagementMassachusetts Institute of Technology
Cambridge, Massachusetts, U.S.
F L I G H T SAFE TY FOUN D A TI O N • F LI G H T S A F E T Y D I G E S T • OCTOBER 19912
excess results from two phenomena: a strongassociation between load factor (percentage ofseats occupied) and the risk of a major crash;and, an over-representation of widebody jetsamong ill-fated aircraft.
Major Crash Defined
In assessing whether more fully occupied flightsare statistically riskier than others, it is impor-tant to not define “major crash”in a way that artificially inducessuch a pattern. If, for example, amajor crash were defined as onethat killed at least 250 passen-gers, the resulting “finding” thatwidebody jets accounted for allmajor crashes would be inappro-priate.
In this discussion, we define acrash as major if it results in thedeath of at least 20 percent of thepassengers on board. In practice,the dichotomy “above/below 20 percent” par-titions crashes into two vastly different clus-ters; the former generally entail low survivalrates and the heavy loss of life, while the lat-ter usually involve three or fewer fatalities.
Data Source TimeframeEstablished
We focus this study on major U.S. domestic jetcrashes over the 1975-89 period on establishedU.S. air carriers. This emphasis is consideredadvantageous for three reasons:
• Major crashes caused 98 percent of thedeaths on such carriers in that period,and reflect all threats to domestic jetsafety that actually took an appreciabletoll in lives.
• After two decades of rapid improve-ment in safety, the mortality risk of do-mestic jet travel stabilized in the mid-1970s. There was no discernible time-trend in risk over the 15 year span from1975 to 1989. Thus, this period seems
more illuminating about current risksto U.S. air travelers than any longer (orshorter) time span.
• The deregulation of the domestic airtransportation industry in 1978 led tothe formation of dozens of new jet car-riers. Almost all of them have since ceasedoperations but, while they were active,their collective safety record was infe-rior to that of “established” U.S. air-
lines formed well before deregu-lation. The experiences of thesenow-defunct carriers are of doubt-ful relevance to risk patterns to-day.2
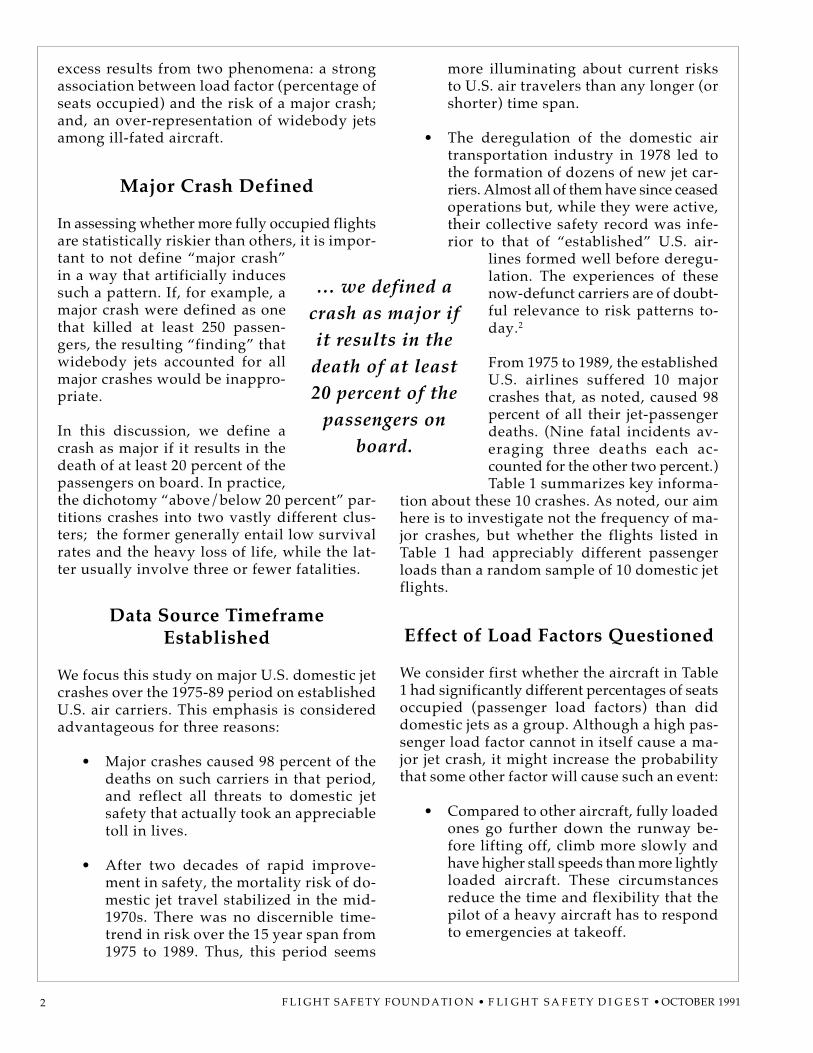
From 1975 to 1989, the establishedU.S. airlines suffered 10 majorcrashes that, as noted, caused 98percent of all their jet-passengerdeaths. (Nine fatal incidents av-eraging three deaths each ac-counted for the other two percent.)Table 1 summarizes key informa-
tion about these 10 crashes. As noted, our aimhere is to investigate not the frequency of ma-jor crashes, but whether the flights listed inTable 1 had appreciably different passengerloads than a random sample of 10 domestic jetflights.
Effect of Load Factors Questioned
We consider first whether the aircraft in Table1 had significantly different percentages of seatsoccupied (passenger load factors) than diddomestic jets as a group. Although a high pas-senger load factor cannot in itself cause a ma-jor jet crash, it might increase the probabilitythat some other factor will cause such an event:
• Compared to other aircraft, fully loadedones go further down the runway be-fore lifting off, climb more slowly andhave higher stall speeds than more lightlyloaded aircraft. These circumstancesreduce the time and flexibility that thepilot of a heavy aircraft has to respondto emergencies at takeoff.
… we defined acrash as major ifit results in the
death of at least20 percent of the
passengers onboard.
F L I G HT SAFE TY FOUN D A TI O N • F L I G H T S A F E T Y D I G E S T • OCTOBER 1991 3
• During high-traffic periods, security per-sonnel may be under greater stress andbe less able to scrutinize each passen-ger at boarding. Moreover, terroristsmight be especially desirous of causinga high death toll3. Thus, crowded planescould be more vulnerable to sabotagethan others.
• Conceivably, a greater pressure to “keepthings moving” in high-traffic condi-tions can lead to diminished conserva-tism in operating procedures.
Even if higher passenger load factors do notcontribute to air crashes, these crashes maynonetheless tend to occur at times when crowdingis unusually high:
• The busy summer vacation season co-incides with the period when weatherhazards such as thunderstorms are mostnumerous.
• Because more flights operate duringmorning and evening rush hours, therisk of midair and runway collisionsmay be higher at these times. But be-cause rush-hour flights are crowded, adisproportionate number of passengersmay be exposed to the higher risk.
Table 1 enables us to move beyond specula-tion and to test empirically the hypothesis that,in present day domestic jet operations4, loadfactor is unrelated to the risk of major crash.
Two Statistical Tests Considered
We test the no-association (unrelated) hypoth-esis in two ways. The first emphasizes a statis-tic at the bottom of Table 1; the average seatoccupancy rate (load factor) of the 10 accidentflights was 84.7 percent. In contrast, U.S. De-partment of Transportation (DOT) data yielda mean load factor of 59.4 percent for domes-
Table 1The 10 Major Crashes of Domestic Jet Flights of
Established U.S. Air Carriers, 1975-1989
Seating Load DeathDate Airline** Aircraft** Capacity Factor* Rate6/24/75 EA 72S 134 86.6(%) 91.4(%)4/4/77 SO DC9 85 95.3 76.59/25/78 PS 72S 157 81.5 1005/25/79 AA D10 258 100 1007/9/82 PA 72S 137 100 1008/2/85 DL L10 302 50.7 83.68/16/87 NW M80 150 99.3 99.311/15/87 CO DC9 85 89.4 32.912/7/87 PS 146 88 44.3 1007/19/89 UA D10 281 100 39.9
Average 167.7 84.7
Notes:
*Load Factor is percentage of seats occupied; death rate is percentage of passengers killed. Seating capacitiesrefer to the specific aircraft that crashed.
**Airlines: AA-American, CO-Continental, DL-Delta, EA-Eastern, NW-Northwest, PA-Pan Am, PS-PSA, SO-Southern, UA-United
***Aircraft: DC9-DC-9 Series 10, 72S-Stretch Boeing 727, D10-DC10, L10-L-1011, M80-DC-9 Series 80,126-BAC 146
A crash is defined as major if it killed at least 20 percent of the passengers on board. Major crashes cause 98percent of all domestic jet passenger deaths in 1975-89.
F L I G H T SAFE TY FOUN D A TI O N • F LI G H T S A F E T Y D I G E S T • OCTOBER 19914
tic jet flights from 1975 to 19895 (the meanload factor for established carriers only is withina fraction of a percentage point of this lastfigure6). Thus, jet aircraft with major crasheshad load factors that averaged more than 25percentage points higher than the overall do-mestic jet load factor. Even when account istaken of the sampling error in data with only10 observations, the probability of setting a25-point excess by chance alone is well belowone in 1,000 (see Appendix).
The second approach starts with a histogram(see Table A1 in Appendix) of load factors fordomestic jet flights for the period of 1975 to1989 (we estimated this histogram from theactual distribution of load factors on recentdomestic Delta Air Lines jets, making someslight adjustments to achieve a mean of 59.4percent). The test arises from the question, “If10 flights were chosen at random, what is thechance that their load factors would fall asheavily towards the upper tail of the histo-gram as did the 10 load factors in Table 1?”The answer, once again, is less than one in1,000.
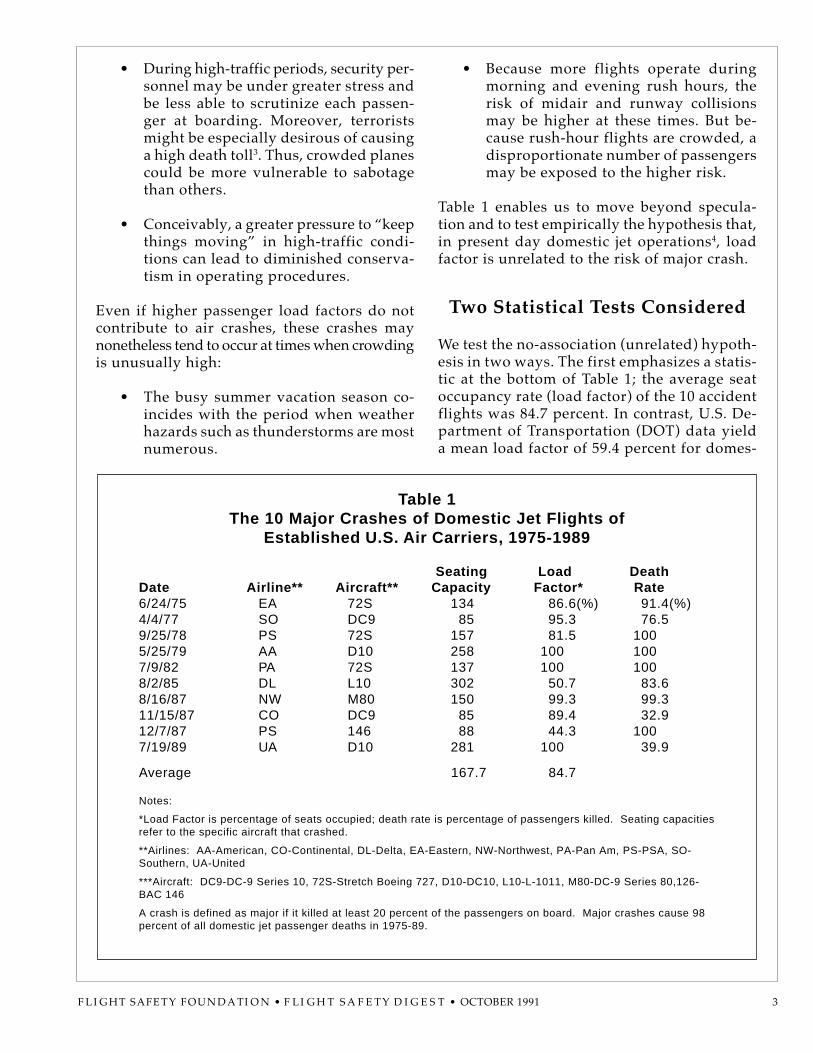
In other words, whether the test starts withthe load factors of aircraft involved in majorcrashes or with the overall load-factor distri-bution, very high statistical significance at-tends the higher seat occupancy rates on flightsin Table 1. Table 2 amplifies on this pattern byportraying the death risk per flight as a func-tion of load factor. Although the statistics aresubject to considerable imprecision, the tablesuggests that the mortality risk on flights with
load factors above 75 percent was more thanfive times as high as that on aircraft less thanthree-quarters full.
Aircraft Size and Capacity Related
The number of passengers aboard a flight de-pends not only on the fraction of seats occu-pied but also the number of seats available.The seating capacities of aircraft in the U.S.domestic jet fleet vary from 60 (Fokker F28) to400 (Boeing 747). If there is any correlationbetween aircraft size and the risk of a majorcrash, then, quite apart from any load-factoreffects, the percentage of flights involved inmajor crashes will diverge from the percent-age of passengers involved. Hence, it is worth-while to explore the possibility of such corre-lation.
The 10 aircraft in Table 1 had an average seat-ing capacity of 167.7. Within the full set ofdomestic jet flights from 1975 to 1989, the av-erage aircraft that took off had approximately135 seats available. (This estimate is derivedby weighting the usual seating capacity of eachtype of jet by the percentage of flights per-formed by the jet.) Thus, flights involved inmajor crashes had roughly 25 percent moreseats than flights in general, a difference cor-responding to about two standard deviations.In its own right, this outcome is of borderlinestatistical significance (see next to last para-graph of Appendix).
The reason for the high average capacity in
Table 2Approximate Death Risk Per Flight as a Function of Load Factor,
Domestic Jets on Established U.S. Carriers, 1975-89
Percentage of Death RiskLoad Factor Range Flights in Range Per Flight
0 - 50% 40(%) 1 in 26 million50 - 75% 26 1 in 18 million
75 - 100% 34 1 in 4 million
Notes: These “death risk per flight” statistics assume a random choice among flights in the corresponding load factorrange. The calculations take account of all fatal incidents, even those with small numbers of deaths that were notincluded in Table 1.
F L I G HT SAFE TY FOUN D A TI O N • F L I G H T S A F E T Y D I G E S T • OCTOBER 1991 5
Table 1 is that three of the 10 crashes (30 per-cent) involved widebody jets (two DC-10s andone L-1011). Yet, an analysis of schedules indi-cates that, during the 1975-1989period, widebody jets (747s, DC-10s, L-1011s, 767s, and Airbuses)performed only about seven per-cent of U.S. domestic jet flightsby established carriers. The dis-crepancy between 30 percent andseven percent implies that wide-body jets suffered roughly six timesas many major crashes per mil-lion flights as did smaller jets.Even after taking account of suchrelevant considerations as thehigher-than-average survival rate during thesewidebody crashes (25 percent vs. 14 percentfor the others), a factor-of-five difference per-sists between the fraction of widebody jet pas-sengers who perished in crashes and the cor-responding fraction for other jets.
Passenger Loads PutInto Perspective
On average, U.S. domestic jet flights from 1975to 1989 were three-fifths full, but those thatsuffered major crashes had five-sixths of theirseats occupied. Thus, the aircraft that crashedhad 1.4 times the load factor of those that didnot. Furthermore, the seating capacity on high-casualty flights was 1.25 times the average forall flights. Although the average domestic aircarrier jet had 80 passengers on board between1975 and 1989, those in Table 1 averaged 142,i.e., about 80 percent more. To put it anotherway, the 10 aircraft that suffered major crasheshad as many passengers on board as 18 jetswith average loads.
Calculations reveal that, if 10 domestic jet flightsoperated during the years 1975-1989 were chosenat random, the total number of passengers aboardwould on average be 800. The chance that the10 flights would carry more than 1,400 pas-sengers would only be one in 5,000. Yet theflights in Table 1 carried a total 1,418 passen-gers. Under the circumstances, it would seemfarfetched to dismiss the high Table 1 loads asa statistical “fluke.”
On the other hand, one would not necessarilyexpect the same pattern to prevail in all placesat all times. During 1975 to 1989, established
U.S. domestic air carriers amassedthe best aggregate safety recordin the history of civil aviation.7
Certain kinds of crashes (such ascollisions with mountains) had allbut disappeared from domestic jetoperations. Since such crashes bearlittle obvious relation to passen-ger load, their more frequent pres-ence in less-safe national air trans-portation systems might act toweaken the linkage between ma-jor crashes and high load factors.
In this connection, it is interesting to note thatdata such as that in Table 1 but for 1965-74 —when major crashes per million U.S. domesticjet flights were three times as numerous as for1975-89 — would show that the average loadfactor on jets that crashed was only modestlyhigher than the mean for all jets (61 percentvs. 53 percent) during that earlier period.
If U.S. jet load factors were more uniform, theunhappy juxtaposition of disasters and heavycrowding would presumably arise less often.If, to pick an extreme example, all flights op-erated at load factors of 60 percent (roughlythe present national mean), then the planesthat suffered major crashes would necessarilybe 60 percent full. Even it the number of majorcrashes did not decline at all, having seat oc-cupancy rates of 60 percent on ill-fated planesrather than 85 percent could cut the numberof passengers killed by nearly one-third.
Indeed, reducing the variance of jet load fac-tors (while keeping the mean constant) mightdo more than any innovation in technology ortraining to reduce the minimal death risk thatremains in the domestic jet system. One mustbe realistic, however; business travelers willnot fly at 2:00 a.m., and trips home for Christ-mas will not be replaced by visits at Hallow-een. But the possibility that off-peak flightsmay be safer as well as cheaper could increasetheir attractiveness to some passengers. Andeven a limited reduction in load-factor vari-ance could save some lives.
… but those thatsuffered major
crashes had five-sixths of theirseats occupied.
F L I G H T SAFE TY FOUN D A TI O N • F LI G H T S A F E T Y D I G E S T • OCTOBER 19916
On a more immediate matter, we should ad-just the introductory statistic in this article“26,000 years until a fatal crash” to reflect thetendency of doomed planes to have unusuallyhigh numbers of travelers on board. Assum-ing that passenger loads on aircraft involvedin major crashes are 80 percent above average,
Suppose that the risk patterns of 1975 to 1989were to prevail, and let L be the long-termaverage of load factors on U.S. domestic jetswith major crashes. Although we do not knowL, we do know that the load factors for the 10crashes in Table 1 averaged 84.7 percent andhad a sample standard deviation of 20.7 per-cent. According to traditional sampling theory,84.7 percent is an unbiased estimate of L, andthe standard error assigned to the estimate is20.7/√(10) = 6.6. The 59.4 percent average loadfactor for all domestic jet flights for 1975-89was (84.7 - 59.4)/6.6 = 3.8 standard deviationsbelow the estimate of L. Whether under a nor-mal or a t-distribution (used for smaller samples)approximation, the chance that statistical fluc-tuations could generate such a large discrep-ancy is far below one in 1,000.
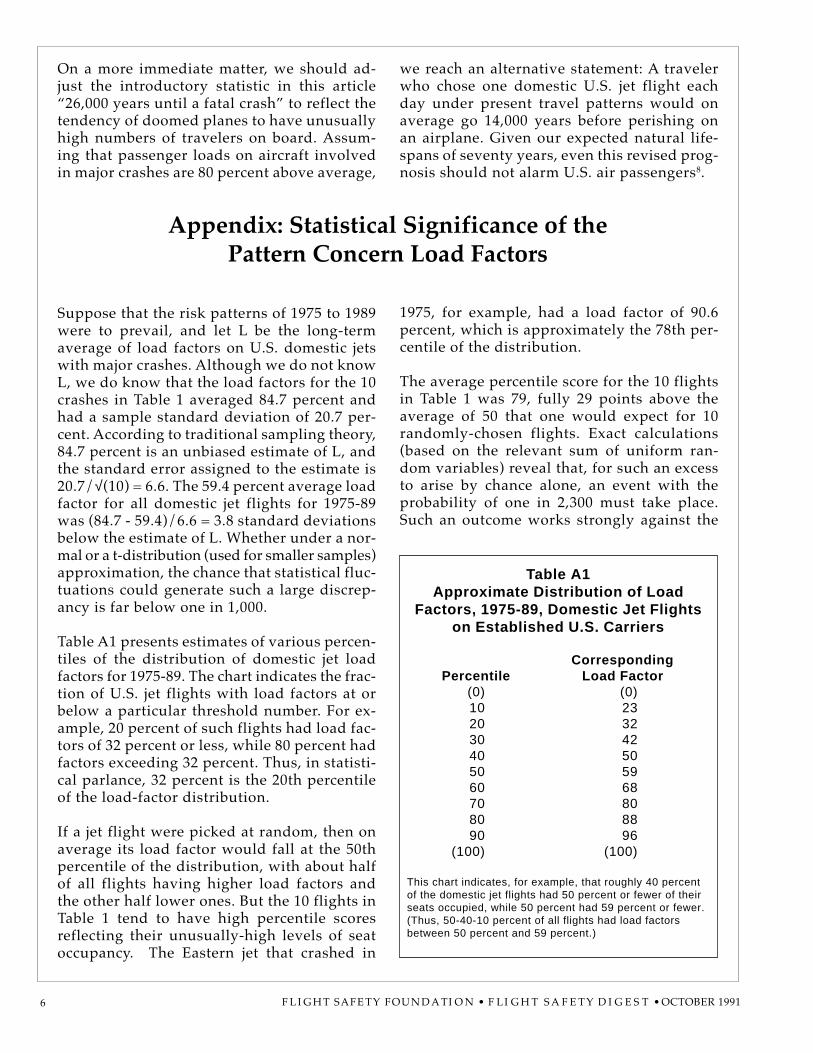
Table A1 presents estimates of various percen-tiles of the distribution of domestic jet loadfactors for 1975-89. The chart indicates the frac-tion of U.S. jet flights with load factors at orbelow a particular threshold number. For ex-ample, 20 percent of such flights had load fac-tors of 32 percent or less, while 80 percent hadfactors exceeding 32 percent. Thus, in statisti-cal parlance, 32 percent is the 20th percentileof the load-factor distribution.
If a jet flight were picked at random, then onaverage its load factor would fall at the 50thpercentile of the distribution, with about halfof all flights having higher load factors andthe other half lower ones. But the 10 flights inTable 1 tend to have high percentile scoresreflecting their unusually-high levels of seatoccupancy. The Eastern jet that crashed in
we reach an alternative statement: A travelerwho chose one domestic U.S. jet flight eachday under present travel patterns would onaverage go 14,000 years before perishing onan airplane. Given our expected natural life-spans of seventy years, even this revised prog-nosis should not alarm U.S. air passengers8.
Appendix: Statistical Significance of thePattern Concern Load Factors
1975, for example, had a load factor of 90.6percent, which is approximately the 78th per-centile of the distribution.
The average percentile score for the 10 flightsin Table 1 was 79, fully 29 points above theaverage of 50 that one would expect for 10randomly-chosen flights. Exact calculations(based on the relevant sum of uniform ran-dom variables) reveal that, for such an excessto arise by chance alone, an event with theprobability of one in 2,300 must take place.Such an outcome works strongly against the
Table A1Approximate Distribution of Load
Factors, 1975-89, Domestic Jet Flightson Established U.S. Carriers
CorrespondingPercentile Load Factor
(0) (0)10 2320 3230 4240 5050 5960 6870 8080 8890 96
(100) (100)
This chart indicates, for example, that roughly 40 percentof the domestic jet flights had 50 percent or fewer of theirseats occupied, while 50 percent had 59 percent or fewer.(Thus, 50-40-10 percent of all flights had load factorsbetween 50 percent and 59 percent.)
F L I G HT SAFE TY FOUN D A TI O N • F L I G H T S A F E T Y D I G E S T • OCTOBER 1991 7
hypothesis that no relationship exists betweenload factor and major-crash risk.
From detailed explorations of airline sched-ules in the Official Airline Guide, the authorsestimated that, during the 1975-1989 period,the number of seats on U.S. domestic jet flightshad a mean of 135 and a standard deviation47. Thus, if 10 such flights were selected atrandom, their average number of seats wouldhave a mean 135 and a standard deviation of47/√(10), which is about 15. Thus, the samplemean of 167.7 is slightly more than two stan-dard deviations above the population mean.
The point of these calculations is that dismiss-ing the difference between 84.7 percent and59.4 percent or 167.7 seats and 135 seats be-cause “only” 10 major crashes were studiedwould be inconsistent with usual standards ofstatistical inference.
Footnotes
1. By “established U.S. jet carriers,” we in-clude those U.S. airlines with extensive jetoperations prior to the Airline Deregula-tion Act of 1978: Aircal, Alaska, Aloha,American, Braniff, Continental, Delta, East-ern, Hawaiian, National, Northwest, Ozark,Pan Am, Piedmont, PSA, Republic, South-ern, Southwest, Texas International, TWA,United, USAir, and Western.
2. Barnett and Higgins (see Reference) foundthat, in a statistically-significant discrep-ancy, death risk per jet flight in 1979-86averaged 13 times as high on the new en-trants as on established carriers (these newentrants are listed on page 14 of that pa-per). However, the two main survivorsamong the new carriers — Midway andAmerica West — have had no major crashesthus far.
3. We are grateful to Steve Cohen of the U.S.Federal Aviation Administration (FAA) formaking this point, as well as many otherinsightful points that helped us in our re-search.
4. In the remainder of this paper, all refer-ences to domestic jet operations should beunderstood as pertaining only to establishedairlines.
5. The statistic 59.4 percent is based on an-nual domestic jet load factors for the years1975-89 in “Air Carrier Traffic Statistics,”distributed in early years by the U.S. CivilAeronautics Board (CAB) and later onesby the U.S. Department of Transportation(DOT). Individual years were weighted bytheir number of flights. Although officialload-factor calculations consider the lengthsof individual flights, their little evidencethat load factors on long flights differ sub-stantially from those on shorter ones. Inthe Delta Air Lines data we used, the dis-tance-weighted seat occupancy rate wasslightly higher than the unweighted one;that outcome hints that 59.4 percent mightoverstate the load factor for a flight chosenat random.
6. During 1975-89, established carriers (as listedabove in Footnote 1) performed 95 percentof all U.S. Federal Aviation Regulation (FAR)Part 121 scheduled jet flights. Most of theremainder were performed by Midway andAmerica West, which had load factors closeto the industry average. Although Midwayand America West data contributed to theDOT load-factor data, eliminating themwould only alter the mean of 59.4 percentby a few-tenths of a percentage point.
7. By this we mean that no sizable homoge-neous group of airlines (e.g., Western Eu-ropean flag carriers) has ever achieved abetter cumulative record than did estab-lished U.S. domestic airlines during 1975-89. Of course, small individual airlines cango for decades without any crashes.
8. The first major domestic jet crashes of the1990s occurred on 2/1/91 and 3/3/91. Welack full data to expand the observationperiod to cover these crashes (in any case,the length of that period should not bedetermined by events in the process understudy); for completeness, however, we brieflydiscuss these crashes below:
F L I G H T SAFE TY FOUN D A TI O N • F LI G H T S A F E T Y D I G E S T • OCTOBER 19918
The first took place in evening rush hourat Los Angeles International Airport. TheBoeing 737-300 involved had a load factorof 65 percent. Given the drop of air travelin early 1991 because of recession and fearsof terrorism, the average domestic load factoraround the time of the crash was perhaps10-15 points below that on the ill-fated jet.The accident seems consistent with the gen-eral pattern discussed in the paper.
The second occurred in Colorado Springson a Boeing 737-200 with a load factor ofonly about 17 percent. Obviously, that crashdoes not epitomize the pattern found in1975-89; as Table 2 suggests, however, therewas never any implication that sparsely-crowded planes were invulnerable to di-saster.
Even if the two crashes were included inTable 1 (as if they had occurred 1975-89),the average load factor on planes with ma-jor crashes would be more than three stan-dard deviations above the mean for all flights.Moreover, the average number of travelerson the crashed planes would be more thanthree standard deviations above the all-flight average. Thus, the statistical signifi-cance of the overall pattern remains higheven if the new major crashes are fullyincluded in the calculations.
Reference
Barnett. A. and M.K. Higgins, “Airline Safety:
The Last Decade,” Management Science, 35(1),pp. 1-21 (1989).
Research for this article was supported in partby Contract DTRS57-88C-00078TD28, U.S. Fed-eral Aviation Administration (FAA) and VolpeNational Transportation Systems Center (VNTS),Cambridge, Mass., U.S. Additional assistancewas provided by Robert Machol, FAA and DonWright, VNTSC. Points of view expressed inthis document should not be ascribed to theindividuals just cited or to either FAA or VNTSC.
About the Authors
Arnold Barnett, Ph.D., is professor of operationsresearch/statistics at the Massachussetts Instituteof Technology (MIT) Sloan School of Management.An applied statistician, Barnett has been involvedfor many years in data analyses involving air safety.The results of his research have appeared inpublications ranging from professional journalssuch as Management Science and Risk Analysisto the op-ed page of The New York Times. Barnettholds a B.A. degree in physics and a Ph.D. inapplied mathematics.
Todd Curtis is a systems safety engineer with theBoeing Commercial Airplane Group. While earninghis masters degree in management at MIT, heperformed research in the areas of airline safetyand air traffic control. Previously, Curtis was aflight test engineer for the U.S. Air Force. He alsois a licensed private pilot and holds degrees inelectrical engineering from Princeton Universityand the University of Texas.
F L I G HT SAFE TY FOUN D A TI O N • F L I G H T S A F E T Y D I G E S T • OCTOBER 1991 9
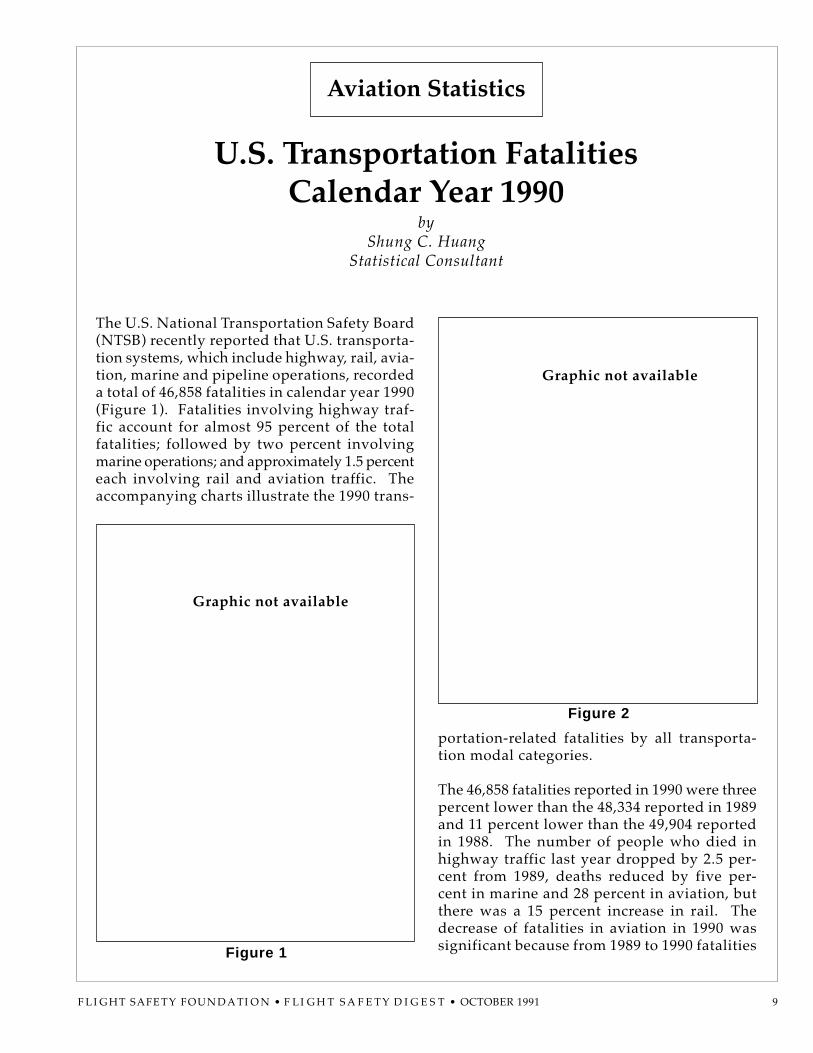
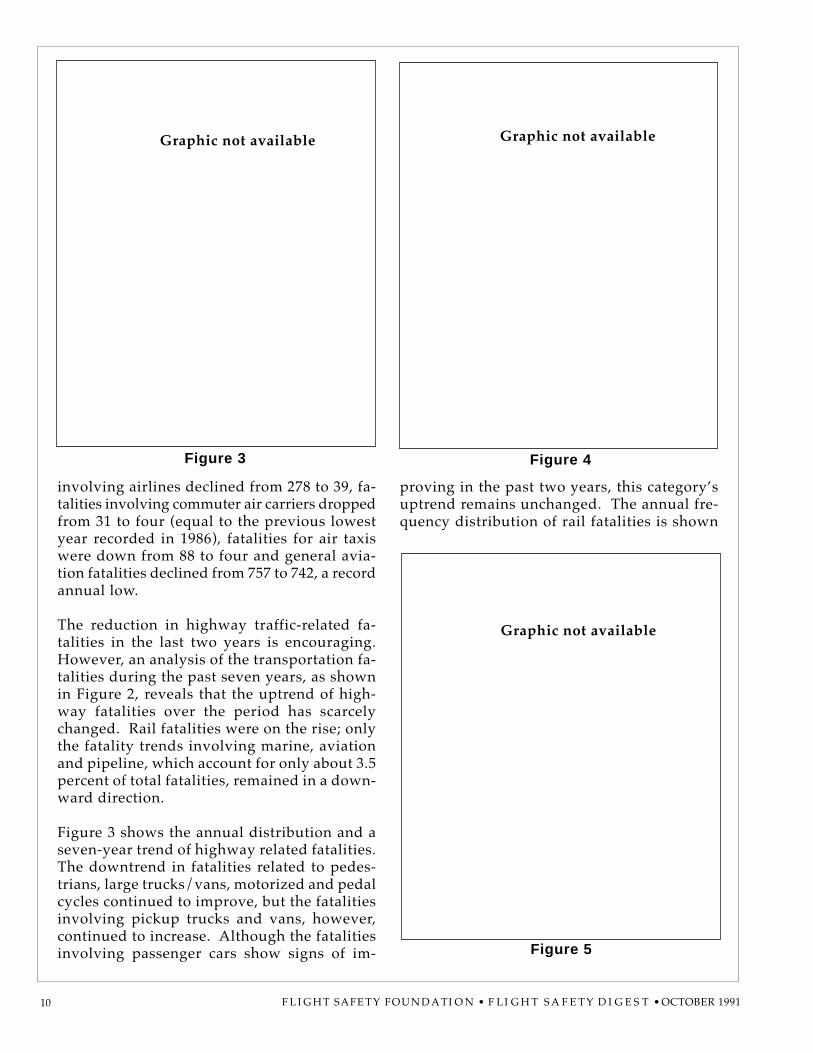
The U.S. National Transportation Safety Board(NTSB) recently reported that U.S. transporta-tion systems, which include highway, rail, avia-tion, marine and pipeline operations, recordeda total of 46,858 fatalities in calendar year 1990(Figure 1). Fatalities involving highway traf-fic account for almost 95 percent of the totalfatalities; followed by two percent involvingmarine operations; and approximately 1.5 percenteach involving rail and aviation traffic. Theaccompanying charts illustrate the 1990 trans-
portation-related fatalities by all transporta-tion modal categories.
The 46,858 fatalities reported in 1990 were threepercent lower than the 48,334 reported in 1989and 11 percent lower than the 49,904 reportedin 1988. The number of people who died inhighway traffic last year dropped by 2.5 per-cent from 1989, deaths reduced by five per-cent in marine and 28 percent in aviation, butthere was a 15 percent increase in rail. Thedecrease of fatalities in aviation in 1990 wassignificant because from 1989 to 1990 fatalities
Aviation Statistics
U.S. Transportation FatalitiesCalendar Year 1990
byShung C. Huang
Statistical Consultant
Figure 2
Graphic not available
Graphic not available
Figure 1
F L I G H T SAFE TY FOUN D A TI O N • F LI G H T S A F E T Y D I G E S T • OCTOBER 199110
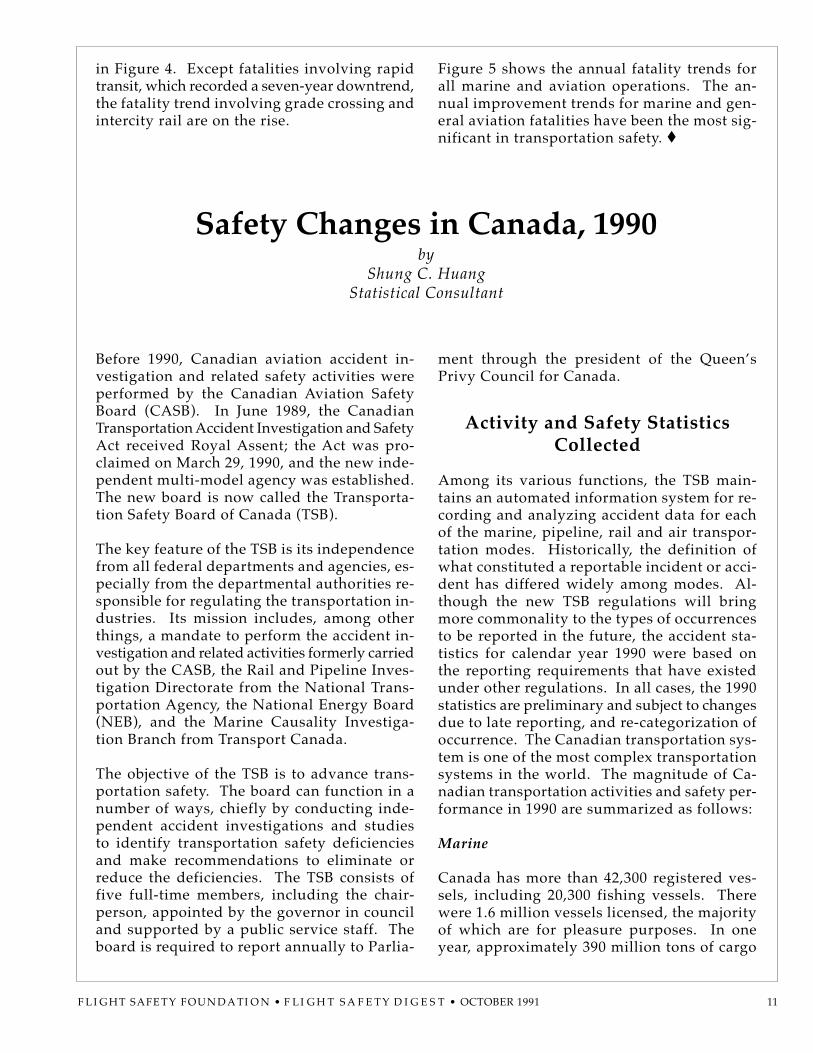
involving airlines declined from 278 to 39, fa-talities involving commuter air carriers droppedfrom 31 to four (equal to the previous lowestyear recorded in 1986), fatalities for air taxiswere down from 88 to four and general avia-tion fatalities declined from 757 to 742, a recordannual low.
The reduction in highway traffic-related fa-talities in the last two years is encouraging.However, an analysis of the transportation fa-talities during the past seven years, as shownin Figure 2, reveals that the uptrend of high-way fatalities over the period has scarcelychanged. Rail fatalities were on the rise; onlythe fatality trends involving marine, aviationand pipeline, which account for only about 3.5percent of total fatalities, remained in a down-ward direction.
Figure 3 shows the annual distribution and aseven-year trend of highway related fatalities.The downtrend in fatalities related to pedes-trians, large trucks/vans, motorized and pedalcycles continued to improve, but the fatalitiesinvolving pickup trucks and vans, however,continued to increase. Although the fatalitiesinvolving passenger cars show signs of im-
Figure 3
Figure 5
Graphic not available
Graphic not available
Figure 4
Graphic not available
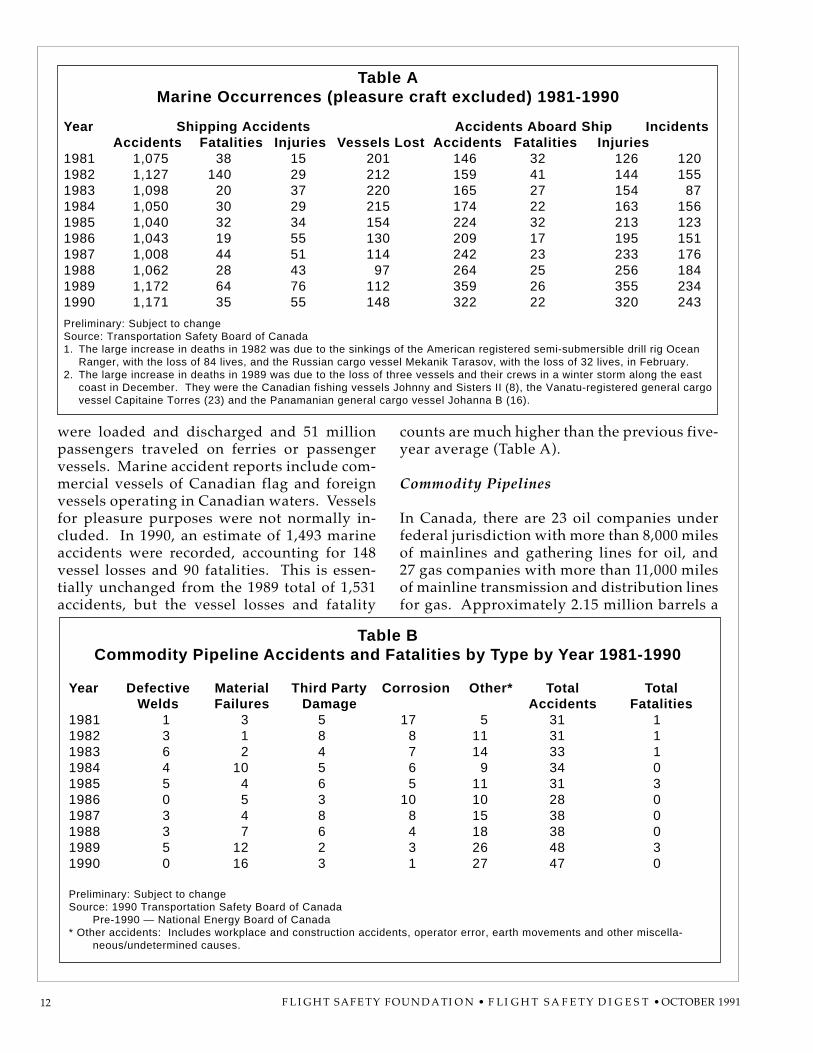
proving in the past two years, this category’suptrend remains unchanged. The annual fre-quency distribution of rail fatalities is shown
F L I G HT SAFE TY FOUN D A TI O N • F L I G H T S A F E T Y D I G E S T • OCTOBER 1991 11
Before 1990, Canadian aviation accident in-vestigation and related safety activities wereperformed by the Canadian Aviation SafetyBoard (CASB). In June 1989, the CanadianTransportation Accident Investigation and SafetyAct received Royal Assent; the Act was pro-claimed on March 29, 1990, and the new inde-pendent multi-model agency was established.The new board is now called the Transporta-tion Safety Board of Canada (TSB).
The key feature of the TSB is its independencefrom all federal departments and agencies, es-pecially from the departmental authorities re-sponsible for regulating the transportation in-dustries. Its mission includes, among otherthings, a mandate to perform the accident in-vestigation and related activities formerly carriedout by the CASB, the Rail and Pipeline Inves-tigation Directorate from the National Trans-portation Agency, the National Energy Board(NEB), and the Marine Causality Investiga-tion Branch from Transport Canada.
The objective of the TSB is to advance trans-portation safety. The board can function in anumber of ways, chiefly by conducting inde-pendent accident investigations and studiesto identify transportation safety deficienciesand make recommendations to eliminate orreduce the deficiencies. The TSB consists offive full-time members, including the chair-person, appointed by the governor in counciland supported by a public service staff. Theboard is required to report annually to Parlia-
ment through the president of the Queen’sPrivy Council for Canada.
Activity and Safety StatisticsCollected
Among its various functions, the TSB main-tains an automated information system for re-cording and analyzing accident data for eachof the marine, pipeline, rail and air transpor-tation modes. Historically, the definition ofwhat constituted a reportable incident or acci-dent has differed widely among modes. Al-though the new TSB regulations will bringmore commonality to the types of occurrencesto be reported in the future, the accident sta-tistics for calendar year 1990 were based onthe reporting requirements that have existedunder other regulations. In all cases, the 1990statistics are preliminary and subject to changesdue to late reporting, and re-categorization ofoccurrence. The Canadian transportation sys-tem is one of the most complex transportationsystems in the world. The magnitude of Ca-nadian transportation activities and safety per-formance in 1990 are summarized as follows:
Marine
Canada has more than 42,300 registered ves-sels, including 20,300 fishing vessels. Therewere 1.6 million vessels licensed, the majorityof which are for pleasure purposes. In oneyear, approximately 390 million tons of cargo
in Figure 4. Except fatalities involving rapidtransit, which recorded a seven-year downtrend,the fatality trend involving grade crossing andintercity rail are on the rise.
Figure 5 shows the annual fatality trends forall marine and aviation operations. The an-nual improvement trends for marine and gen-eral aviation fatalities have been the most sig-nificant in transportation safety. ♦
Safety Changes in Canada, 1990by
Shung C. HuangStatistical Consultant
F L I G H T SAFE TY FOUN D A TI O N • F LI G H T S A F E T Y D I G E S T • OCTOBER 199112
were loaded and discharged and 51 millionpassengers traveled on ferries or passengervessels. Marine accident reports include com-mercial vessels of Canadian flag and foreignvessels operating in Canadian waters. Vesselsfor pleasure purposes were not normally in-cluded. In 1990, an estimate of 1,493 marineaccidents were recorded, accounting for 148vessel losses and 90 fatalities. This is essen-tially unchanged from the 1989 total of 1,531accidents, but the vessel losses and fatality
counts are much higher than the previous five-year average (Table A).
Commodity Pipelines
In Canada, there are 23 oil companies underfederal jurisdiction with more than 8,000 milesof mainlines and gathering lines for oil, and27 gas companies with more than 11,000 milesof mainline transmission and distribution linesfor gas. Approximately 2.15 million barrels a
Table BCommodity Pipeline Accidents and Fatalities by Type by Year 1981-1990
Year Defective Material Third Party Corrosion Other* Total TotalWelds Failures Damage Accidents Fatalities
1981 1 3 5 17 5 31 11982 3 1 8 8 11 31 11983 6 2 4 7 14 33 11984 4 10 5 6 9 34 01985 5 4 6 5 11 31 31986 0 5 3 10 10 28 01987 3 4 8 8 15 38 01988 3 7 6 4 18 38 01989 5 12 2 3 26 48 31990 0 16 3 1 27 47 0
Preliminary: Subject to changeSource: 1990 Transportation Safety Board of Canada
Pre-1990 — National Energy Board of Canada* Other accidents: Includes workplace and construction accidents, operator error, earth movements and other miscella-
neous/undetermined causes.
Table AMarine Occurrences (pleasure craft excluded) 1981-1990
Year Shipping Accidents Accidents Aboard Ship IncidentsAccidents Fatalities Injuries Vessels Lost Accidents Fatalities Injuries
1981 1,075 38 15 201 146 32 126 1201982 1,127 140 29 212 159 41 144 1551983 1,098 20 37 220 165 27 154 871984 1,050 30 29 215 174 22 163 1561985 1,040 32 34 154 224 32 213 1231986 1,043 19 55 130 209 17 195 1511987 1,008 44 51 114 242 23 233 1761988 1,062 28 43 97 264 25 256 1841989 1,172 64 76 112 359 26 355 2341990 1,171 35 55 148 322 22 320 243
Preliminary: Subject to changeSource: Transportation Safety Board of Canada1. The large increase in deaths in 1982 was due to the sinkings of the American registered semi-submersible drill rig Ocean
Ranger, with the loss of 84 lives, and the Russian cargo vessel Mekanik Tarasov, with the loss of 32 lives, in February.2. The large increase in deaths in 1989 was due to the loss of three vessels and their crews in a winter storm along the east
coast in December. They were the Canadian fishing vessels Johnny and Sisters II (8), the Vanatu-registered general cargovessel Capitaine Torres (23) and the Panamanian general cargo vessel Johanna B (16).
F L I G HT SAFE TY FOUN D A TI O N • F L I G H T S A F E T Y D I G E S T • OCTOBER 1991 13
Canada, including pilots, navigators, flightengineers, flight attendants, air traffic controllersand aircraft maintenance engineers. In com-mercial flying, 66 million passengers were de-planed and enplaned a year at Canadian air-ports. Canadian registered aircraft in 1990were involved in 503 accidents, 46 of whichwere fatal, accounting for 87 fatalities. Thelevel one carriers (Air Canada and CanadianAirlines) and level two carriers (25 small air-lines) account for some 95 percent of fare-pay-ing passengers and more than 30 percent ofthe total hours flown — but only 2.5 percentof the total accidents. Level One Carriers havenot had a single fatal accident in the past twoyears. Other commercial operations performedby aircraft including charter, contract and specialoperations.
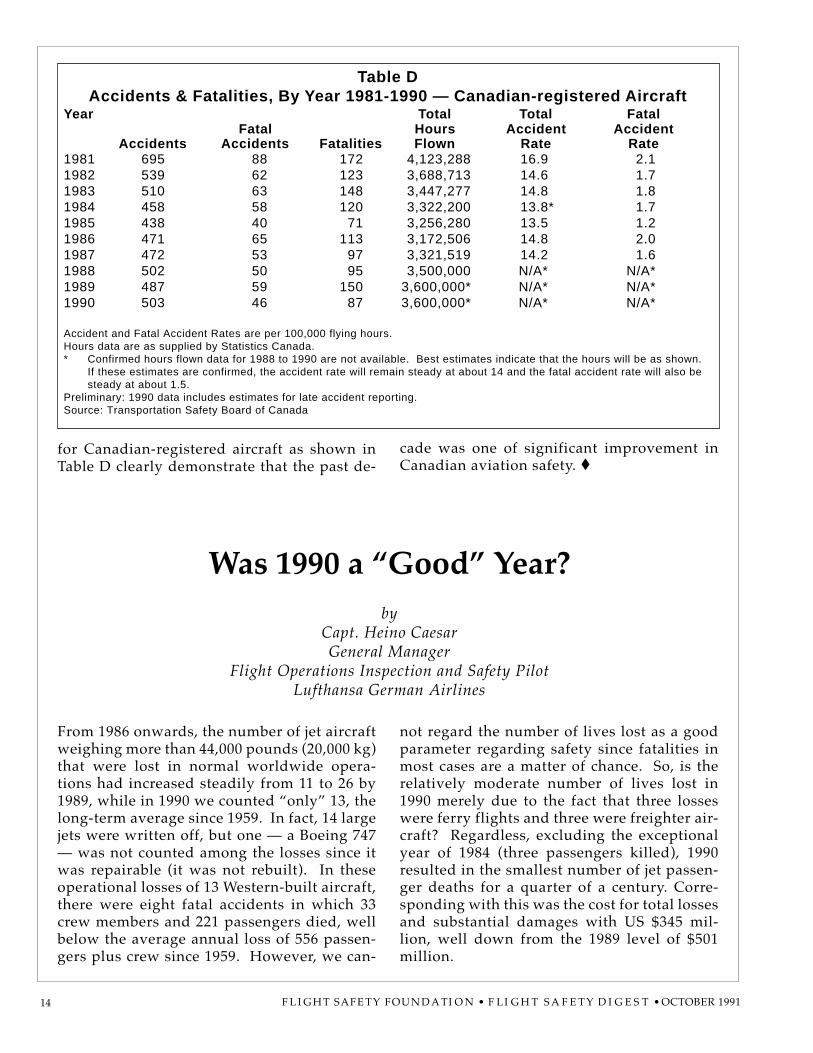
As shown in Table D, although total accidentsinvolving Canadian-registered aircraft increasedover the year, the number of fatal accidentsand resulting fatalities declined. There were46 fatal accidents and 87 fatalities in 1990,compared with 59 fatal accidents and 150 fa-talities in 1989.
The average annual number of accidents de-creased by about 30 percent between 1981 and1990; fatal accidents and fatalities recordeddecreased even more (about 40 percent). Dur-ing the same period, the accident rate declinedfrom 17 accidents to almost 14 accidents per100,000 aircraft flight hours — a decrease of20 percent. The decrease in the fatal accidentrate was even greater. The accident statistics
day of crude oil are produced in Canada anddistributed by pipeline. The TSB has an acci-dent investigation mandate for oil and gas pipe-lines under federal jurisdiction. In 1990, therewere 47 pipeline accidents, which were nearlythe same as the total of 48 accidents reportedin 1989. There were no fatalities and only 12persons involved in the accidents were injured(Table B).
Rail
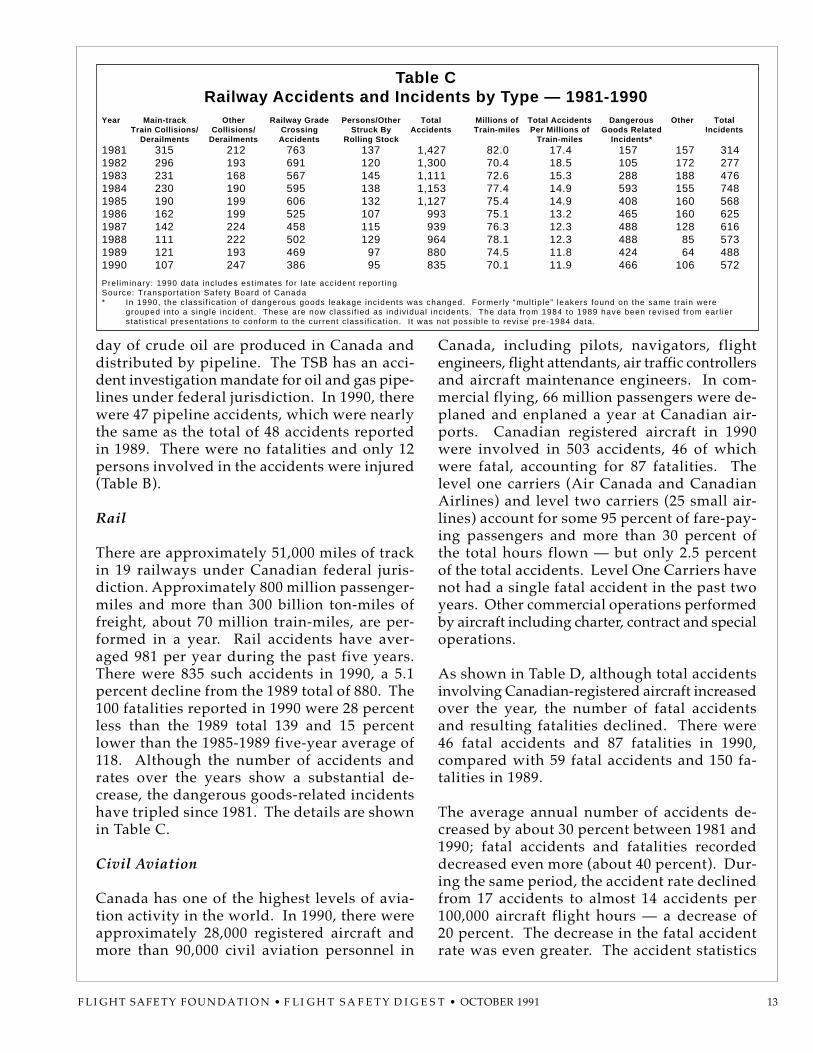
There are approximately 51,000 miles of trackin 19 railways under Canadian federal juris-diction. Approximately 800 million passenger-miles and more than 300 billion ton-miles offreight, about 70 million train-miles, are per-formed in a year. Rail accidents have aver-aged 981 per year during the past five years.There were 835 such accidents in 1990, a 5.1percent decline from the 1989 total of 880. The100 fatalities reported in 1990 were 28 percentless than the 1989 total 139 and 15 percentlower than the 1985-1989 five-year average of118. Although the number of accidents andrates over the years show a substantial de-crease, the dangerous goods-related incidentshave tripled since 1981. The details are shownin Table C.
Civil Aviation
Canada has one of the highest levels of avia-tion activity in the world. In 1990, there wereapproximately 28,000 registered aircraft andmore than 90,000 civil aviation personnel in
Table CRailway Accidents and Incidents by Type — 1981-1990
Year Main-track Other Railway Grade Persons/Other Total Millions of Total Accidents Dangerous Other TotalTrain Collisions/ Collisions/ Crossing Struck By Accidents Train-miles Per Millions of Goods Related Incidents
Derailments Derailments Accidents Rolling Stock Train-miles Incidents*1981 315 212 763 137 1,427 82.0 17.4 157 157 3141982 296 193 691 120 1,300 70.4 18.5 105 172 2771983 231 168 567 145 1,111 72.6 15.3 288 188 4761984 230 190 595 138 1,153 77.4 14.9 593 155 7481985 190 199 606 132 1,127 75.4 14.9 408 160 5681986 162 199 525 107 993 75.1 13.2 465 160 6251987 142 224 458 115 939 76.3 12.3 488 128 6161988 111 222 502 129 964 78.1 12.3 488 85 5731989 121 193 469 97 880 74.5 11.8 424 64 4881990 107 247 386 95 835 70.1 11.9 466 106 572
Prel iminary: 1990 data includes est imates for late accident report ingSource: Transportat ion Safety Board of Canada* In 1990, the c lassi f icat ion of dangerous goods leakage incidents was changed. Formerly “mul t ip le” leakers found on the same tra in were
grouped into a s ingle incident. These are now classi f ied as indiv idual incidents. The data f rom 1984 to 1989 have been revised f rom ear l ierstat is t ical presentat ions to conform to the current c lassi f icat ion. I t was not possible to revise pre-1984 data.
F L I G H T SAFE TY FOUN D A TI O N • F LI G H T S A F E T Y D I G E S T • OCTOBER 199114
From 1986 onwards, the number of jet aircraftweighing more than 44,000 pounds (20,000 kg)that were lost in normal worldwide opera-tions had increased steadily from 11 to 26 by1989, while in 1990 we counted “only” 13, thelong-term average since 1959. In fact, 14 largejets were written off, but one — a Boeing 747— was not counted among the losses since itwas repairable (it was not rebuilt). In theseoperational losses of 13 Western-built aircraft,there were eight fatal accidents in which 33crew members and 221 passengers died, wellbelow the average annual loss of 556 passen-gers plus crew since 1959. However, we can-
not regard the number of lives lost as a goodparameter regarding safety since fatalities inmost cases are a matter of chance. So, is therelatively moderate number of lives lost in1990 merely due to the fact that three losseswere ferry flights and three were freighter air-craft? Regardless, excluding the exceptionalyear of 1984 (three passengers killed), 1990resulted in the smallest number of jet passen-ger deaths for a quarter of a century. Corre-sponding with this was the cost for total lossesand substantial damages with US $345 mil-lion, well down from the 1989 level of $501million.
for Canadian-registered aircraft as shown inTable D clearly demonstrate that the past de-
Was 1990 a “Good” Year?by
Capt. Heino CaesarGeneral Manager
Flight Operations Inspection and Safety PilotLufthansa German Airlines
Table DAccidents & Fatalities, By Year 1981-1990 — Canadian-registered Aircraft
Year Total Total FatalFatal Hours Accident Accident
Accidents Accidents Fatalities Flown Rate Rate1981 695 88 172 4,123,288 16.9 2.11982 539 62 123 3,688,713 14.6 1.71983 510 63 148 3,447,277 14.8 1.81984 458 58 120 3,322,200 13.8* 1.71985 438 40 71 3,256,280 13.5 1.21986 471 65 113 3,172,506 14.8 2.01987 472 53 97 3,321,519 14.2 1.61988 502 50 95 3,500,000 N/A* N/A*1989 487 59 150 3,600,000* N/A* N/A*1990 503 46 87 3,600,000* N/A* N/A*
Accident and Fatal Accident Rates are per 100,000 flying hours.Hours data are as supplied by Statistics Canada.* Confirmed hours flown data for 1988 to 1990 are not available. Best estimates indicate that the hours will be as shown.
If these estimates are confirmed, the accident rate will remain steady at about 14 and the fatal accident rate will also besteady at about 1.5.
Preliminary: 1990 data includes estimates for late accident reporting.Source: Transportation Safety Board of Canada
cade was one of significant improvement inCanadian aviation safety. ♦

F L I G HT SAFE TY FOUN D A TI O N • F L I G H T S A F E T Y D I G E S T • OCTOBER 1991 15
Another three Western-built jets were lost inthe Peoples Republic of China, where an at-tempted hijack with a subsequent forced land-ing resulted in the destruction of three aircraftat the airport with 121 passengers and sevencrew members killed.
Half the aircraft lost in 1990 compared withthe previous year is not indicative of a re-versed trend; these numbers are within statis-tical expectation. Furthermore, the number ofnear-catastrophes among substantial damagesand reported significant events was too highto feel comfortable about the situation. Ineffect, the 13 operational total losses are ac-companied by nearly the same number of al-most identical incidents, each only a fractionaway from disaster, which did not end in acci-dents of a similar nature.
Regarding the losses, it was a normal year.The travelling public will probably accept oneloss per month. Two will likely provoke raisedeyebrows and more than that could very wellresult in media coverage and negative eco-nomic effects on the industry. An underlyingreason for this is the dramatization of abso-lute loss numbers without comparing themwith related productivity data. Nearly 22 mil-lion flight hours were flown by Western-builtjets with more than 1.2 billion passengers trans-ported in nearly 14 million estimated sectorsor flights.
The long-term average of flight hours per air-craft loss was 809,000 since 1959. The hoursflown per loss has increased to a significantlyhigher number in the past 10 years and was1,685,000 hours per loss in 1990. Approxi-mately 10 years ago, the ultimate goal was tolose not more than one aircraft in one millionhours. We are well on our way to doublingthat goal. The real risk comparison, however,can better be described by taking into accounttakeoffs or landings, or sectors. The opera-tional losses per million sectors flown decreasedin 10-year intervals from five to 1.3 jets. Dur-ing the past 10 years, the industry lost be-tween one and two aircraft per million flights.Flying became safer, but the investments toachieve this goal also steadily increased. Wewill approach the point in which a certain —
hopefully low — number of losses will be re-garded as inevitable.
During the last two decades, the phase of flightwith most accidents shifted from approach tolanding. Better airport and aircraft instru-mentation, ground proximity warning systems(GPWS), more sophisticated procedures, ra-dar and more reliable navigation aids led to aremarkable decrease of “controlled flight intoterrain” accidents. These still occur, though,as documented in 1990 by several aircraft inmarginal weather conditions that impacted theground prior to reaching the runway.
In the decade 1981-1990, 31 percent of opera-tional losses of heavy Western-built jets oc-curred during landing, 24 percent during takeoff.
During the past decade, the number of totallosses decreased by eight percent, as did thenumber of passengers and crew on board ill-fated aircrafts. But, with the enormous in-crease in productivity, estimated at seven per-cent per year (more seats offered and sold), acorresponding fatality rate did not occur. Onthe contrary, while the absolute number oftotal airframe losses decreased by eight per-cent, the number of fatalities decreased by 35percent. The percentages of individual sur-vivals and fatalities actually reversed. Althoughthe percentage of survival between 1961 and1980 was 41 percent of all on board aircraft,that were finally written off due to the acci-dent, this survivability rose to 59 percent dur-ing the last decade. To a certain degree, thismay be attributable to better equipment, in-creased training, more sophisticated means ofpassenger information and less dangerous air-craft interior. A significant factor is the de-crease in approach accidents from 41 percentbetween 1971 and 1980 to 24 percent since1981.
The cause is evident. The “controlled flightinto terrain” accidents during the approachphase of flight were hardly survivable by thevery nature of these mishaps, while landingaccidents normally offered the occupants a fairchance to leave the aircraft, although injuredand/or shocked. Between 1981 and 1990, theindustry experienced 24 aircraft losses during
F L I G H T SAFE TY FOUN D A TI O N • F LI G H T S A F E T Y D I G E S T • OCTOBER 199116
approach with 1,906 fatalities, but there were44 landing losses in which “only” 176 personswere killed.
Accidents during the takeoff phase, were theleading cause of fatalities in the United Statesbut the second leading phase worldwide. Thirty-eight large jets were lost worldwide duringthis phase of flight since 1981 and 1,101 fatali-ties were counted.
The low survivability rate resulted from high-speed accidents, sometimes shortly after lift-off. The most prominent ones with heavy lossesoccurred in the United States, making the pic-ture of this specific geographical area some-what different from the worldwide one. But,during the last 15 years, the number of pas-sengers killed per million carried, under allcircumstances and all risks, dropped to lessthan one, making flying the safest transport.
When an aircraft is lost, very often the num-ber of persons killed is a matter of pure chanceif the accident was at all survivable. So, as aparameter for an airline industry safety stan-dard, a “body-count” is of very limited value.On the other hand, the media seem to weighthe severity of an accident and its publicityalmost exclusively by the number of fatalities.Implementation of the latest model of the groundproximity warning system (GPWS), develop-ment of vertical profile indication on cathoderay tube (CRT) instrument displays and strictadherence to instrument landing systems (ILS),without putting too much confidence in lessprecise vertical navigation (V-NAV) or arealateral navigation (R/L-NAV) updates of hori-zontal navigation, could help us to achievethat goal.
Map-shifts have surfaced as a navigationalproblem during final approach in glass-cock-pit aircraft. These flight management system(FMS) position errors could be the result ofsoftware errors, inertial reference system (IRS)
problems, improper initialization, inaccuratenavigation aid location or survey position, co-located distance-measuring equipment (DME)transmitters, unreliable or malfunctioning navi-gation aids or operator error. Unfortunately,many flight crews are reluctant to report elec-tronic problems, either because they do notfully understand the system or because theyfeel they may have caused the problem them-selves. This reluctance resulted in recommen-dations to use “heading select” and “ILS” toensure a proper line-up with the runway andto avoid an undershoot of minimum safe heightson what was believed to be the right trackwith flight director and computer-generatedmagenta line properly centered. Therefore,during departures and approaches, the pilotflying should confirm the computed map withraw data indications.
Airline managements should ensure a non-adversarial atmosphere with their pilots andencourage open reporting of all incidents, in-cluding the electronic ones in glass-cockpitaircraft .
The 1990 breakdown of all accidents and inci-dents into “total losses,” “substantial damages”and “report significant events” indicates thatthe heavier the damage, the more dominant isthe human factor, which is a failure of thecockpit crews only (other human failures arepart of the technical or environmental catego-ries). In 1990, 61 percent of all losses werecaused by failure of part of the cockpit crew ineither mishandling or reacting incorrectly. But,this made also clear that, in 1990, pilots couldinfluence only 61 percent of the outcome inthese most costly cases. It reflects a generaltendency that in one out of four cases of totallosses, pilots cannot do anything to avoid thenegative results, but in the remaining 75 per-cent they are the ones capable of saving theflight. They do what they are supposed to do.Otherwise, we would not be able to perform14 million flights with 22 million hours in theair and lose only 13 aircraft.♦
F L I G HT SAFE TY FOUN D A TI O N • F L I G H T S A F E T Y D I G E S T • OCTOBER 1991 17
Reference
Advisory Circular 61-67B, 5/17/91, Stall and SpinAwareness Training. — Washington, D.C., U.S. :U.S. Federal Aviation Administration, 1991. 14p.
AC 61-67A dated October 8, 1982, and AC 61-92 dated January 25, 1980, are canceled.
Summary: This advisory circular (AC) explainsthe stall and spin awareness training requiredunder Part 61 of the Federal Aviation Regula-tions (FAR) and offers guidance to flight in-structors who provide that training. In addi-tion, this AC informs pilots of the airworthi-ness standards for the type certification of smallairplanes prescribed in FAR Section 23.221 con-cerning spin maneuvers and it emphasizes theimportance of observing restrictions that pro-hibit the intentional spinning of certain air-planes. [Purpose]
Advisory Circular 120-26H, 6/21/91, InternationalCivil Aviation Organization Three-Letter and Ra-diotelephony Designators. — Washington, D.C.,U.S. : U.S. Federal Aviation Administration,1991. 4 p.
AC 120-26G, dated 10/1/87, is canceled.
Summary: This AC defines the criteria andprocedures required for an International CivilAviation Organization (ICAO) three-letter and/or radiotelephony designator assignment. [Pur-pose]
Advisory Circular 135-14A, 06/20/91, EmergencyMedical Services/Helicopter (EMS/H). — Wash-ington, D.C., U.S.: U.S. Federal Aviation Ad-ministration, 1991. viii, 22 p.
AC 135-14, dated October 20, 1988, is canceled.
Summary: This AC provides information andguidance material which may be used by Air
Ambulance and Emergency Medical Service/Helicopter (EMS/H) operators in conductingor planning EMS/H operations. [Purpose]
Reports
Aircraft Accident Report: Northwest Airlines Inc.Flights 1482 and 299, Runway Incursion and Col-lision, Detroit Metropolitan/Wayne County Air-port, Romulus, Michigan, December 3, 1990/UnitedStates. National Transportation Safety Board.— Washington, D.C., U.S. : U.S. National Trans-portation Safety Board; Springfield, Virginia :Available through NTIS*, Adopted June 25,1991, Notation: 5416B. Report NTSB/AAR-91/05; NTIS PB 91-910405. vii, 169 p.
Key Words1. Aeronautics — Accidents — 1990.2. Aeronautics — Accidents — Air Traffic
Control Procedures.3. Aeronautics — Accidents — Airport Light-
ing.4. Aeronautics — Accidents — Airport Mark-
ings.5. Aeronautics — Accidents — Evacuation
Procedures.6. Aeronautics — Accidents — Ground Op-
erations.7. Aeronautics — Accidents — Runway In-
cursions.8. Aeronautics — Accidents — Visibility.9. Cockpit Resource Management.10. McDonnell Douglas DC-9 Jet Transport —
Design.11. Northwest Airlines — Accidents — 1990.
Summary: On December 3, 1990, at 1345 east-ern standard time, Northwest Airlines flight1482, a McDonnell Douglas DC-9, and North-west Airlines flight 299, a Boeing 727, collidednear the intersection of two runways in densefog at Detroit Metropolitan/Wayne County Air-port, Romulus, Michigan. At the time of thecollision, the Boeing 727 was on its takeoff
Reports Received at FSFJerry Lederer Aviation Safety Library
F L I G H T SAFE TY FOUN D A TI O N • F LI G H T S A F E T Y D I G E S T • OCTOBER 199118
The aircraft was on a landing approach, atnight, on the instrument landing system (ILS)to runway 14 and was cleared to 4,000 feetabove sea level (asl). The aircraft was estab-lished on the localizer at 10 nautical miles(nm) from the airport, but between 10 nm and14 nm it had descended through the 4,000-footaltitude clearance limit. According to the ap-proach procedure, this altitude should only beleft at the 8 nm point. At 8 nm the aircraft’saltitude was at 3,600 feet.
The aircraft collided with the forest on a steepmountain and was destroyed by the impactand subsequent fire. The aircraft impacted atan elevation of 1,660 feet, 5.2 nm from thethreshold and 1,460 below the glidepath. Thedigital flight data recorder (DFDR) indicateda small decrease in sink rate and a small in-crease of power 20 seconds prior to impact.Fatal injuries were sustained by the six crewmembers and 40 passengers on board.
roll, and the DC-9 had just taxied onto theactive runway. The Boeing 727 was substan-tially damaged, and the DC-9 was destroyed.Eight of the 39 passengers and 4 crewmembersaboard the DC-9 received fatal injuries. Noneof the 146 passengers and 10 crewmembersaboard the B-727 were injured. The NTSB de-termines that the probable cause of this acci-dent was a lack of proper crew coordination,including a virtual reversal of roles by theDC-9 pilots, which led to their failure to stoptaxiing their airplane and alert the ground con-troller of their positional uncertainty in a timelymanner before and after intruding onto theactive runway. Contributing to cause of theaccident were (1) deficiencies in the air trafficcontrol procedures; (2) deficiencies in the air-port marking and lighting; and (3) failure of
Northwest Airlines Inc., to provide adequatecockpit resource management training to theirline aircrews. Contributing to the fatalities inthe accident was the inoperability of the DC-9internal tailcone release mechanism. Contrib-uting to the number and severity of injurieswas the failure of the crew of the DC-9 toproperly execute the passenger evacuation. NTSBrecommendations A-91-54 through A-91-69 wereaddressed to the Federal Aviation Adminis-tration, the Detroit Metropolitan/Wayne CountyAirport, and Northwest Airlines Inc. on thefive safety issues. [Modified Executive Sum-mary] ♦
*National Technical Information Service (NTIS)Springfield, VA 22161 U.S.Telephone: (703) 487-4780
This information is intended to provide an aware-ness of problem areas through which such occur-rences may be prevented in the future. Accident/incident briefs are based upon preliminary infor-mation from government agencies, aviation orga-nizations, press information and other sources.This information may not be accurate.
Air CarrierAir Carrier
Descent Below GlidepathEnds in Disaster
McDonnell Douglas DC-9-30: Aircraft destroyed.Fatal injuries to 46.
Accident/Incident Briefs
F L I G HT SAFE TY FOUN D A TI O N • F L I G H T S A F E T Y D I G E S T • OCTOBER 1991 19
Missed Weather, Met Mountain
McDonnell Douglas DC-9-30: Aircraft destroyed.Fatal injuries to 31.
The aircraft was approaching an airport aftermidnight and was in contact with approachradar. There were four crew members and 27passengers aboard. The pilot reported visualground contact and, to avoid an area of weather,deviated from fol lowing the publishednondirectional beacon (NDB) approach proce-dure and let down to the west of the weatherpattern.
The aircraft crashed into a mountain ridge ninenautical miles southwest of the airport at analtitude of 2,000 feet. The aircraft was destroyedand the four crew members and 27 passengerson board the aircraft received fatal injuries.
The Pilot Who Thought He Could
North American Commander 500: Substantial dam-age. Minor injuries to one.
The pilot of the cargo flight was unable tostart the right engine of the twin piston-en-gine aircraft using normal procedures. Hedecided to start the balky engine by allowingthe propeller on the inoperative engine to wind-mill during the take-off run.
The attempt was unsuccessful.
The aircraft rolled off the end of the runwayand came to rest just outside the airport pe-rimeter fence. The landing gear collapsed andthe aircraft was damaged substantially. Thepilot received minor injuries.
The causal events and factors included im-proper engine start, initiating flight with aknown deficiency, directional control not main-tained, uncontrollable swerve/ground loop andcollision with fence post.
Out of Altitude, on Final andInto the Gusts
De Havilland DHC6 Twin Otter: Aircraft destroyed.Serious injury to one.
The aircraft was on final approach during day-light conditions in a right-hand traffic pat-tern. Aboard were two pilots and 14 passen-gers. There was a left-quartering, gusting, 15-knot headwind blowing across the airport.
As the aircraft neared the runway on finalapproach, the rate of descent accelerated. Thepilot applied full power to compensate for theabnormal descent, but the aircraft collided withthe ground short of the runway. Both crewmembers and 13 passengers received minorinjuries while one passenger was seriously in-jured.
Cited were an improper approach, delayedapplication of power, turbulence and verticalwind gusts and inadvertent stall.
Low on Altitude andNight Experience
Piper PA-31p-350 Mojave: Aircraft destroyed. Fatalinjuries to two.
The aircraft, with a pilot and one passengeraboard, had completed an instrument landingsystem (ILS) approach to Norton Air ForceBase, California, U.S., when the pilot receiveda special visual flight rules (VFR) clearance to
Air Taxi/CommuterAir TaxiCommuter
Corporate ExecutiveCorporateExecutive
F L I G H T SAFE TY FOUN D A TI O N • F LI G H T S A F E T Y D I G E S T • OCTOBER 199120
proceed to nearby Redlands Airport which hadan elevation of 1,572 feet mean sea level (msl).It was night and the weather conditions in-cluded one mile visibility and fog.
The aircraft descended below the circling mini-mum descent altitude (MDA) for the Air Forcebase of 1,710 feet and was last seen on theradar display flying at 1,600 feet msl one milefrom Redlands Airport. The aircraft was lastseen by ground witnesses flying low and fast.
There were few ground reference lights in thearea and the pilot had accumulated a mini-mum amount of night flying time. The leftwing contacted the ground in a 42 degree leftbank and a slight nose-down attitude. Theaircraft was destroyed and the pilot and pas-senger were fatally injured.
Causal factors included the presence of visualillusion, altitude not maintained, poor inflightplanning and lack of experience in aircraft type.
Combination of IngredientsProves Bad Medicine
Cessna 425: Aircraft destroyed. Fatal injuries toone.
The aircraft, with a pilot and one passengeraboard, was cleared for a night instrumentlanding system (ILS) approach at approximately2200 hours local time. The pilot had beenadvised of fog and that the airport was closed.
The aircraft collided with the ground on agrassy area within the airport in a near-levelattitude with the landing gear retracted. Thewreckage of the aircraft was located the nextmorning. The pilot was fatally injured in thecrash and the passenger was seriously injured.
There was no approach plate for an ILS proce-dure found in the aircraft after the crash. Thetoxicology report revealed Dextromethorphan,an ingredient in over-the-counter cold rem-edies, in the pilot. The dose was 30 times greaterthan the minimum amount necessary to causedrowsiness.
Touchdown Encounter
Mooney Mark 20k: Substantial damage. No inju-ries.
The Airbus Industrie A320 was on short finalapproach when the Mooney, with two occu-pants aboard, taxied onto the runway for takeoff,without clearance. The nose gear of the land-ing A320 struck the Mooney’s right wing. Thesmaller aircraft’s left wing was partly ingestedinto the left engine of the larger aircraft. TheA320 slid down the runway with the nose gearbroken for 2,500 feet (750 meters) before stop-ping.
There was substantial damage to both aircraft,but no injuries were sustained by the occu-pants of either airplane. Air traffic control(ATC) did not see the Mooney enter the run-way because of fog.
Glassy Water Confuses HeightPerception
Cessna 310: Aircraft destroyed. Fatal injuries totwo.
The aircraft was flying in a loose formationwith a Beech J35 Bonanza as part of a video-tape filming. The Bonanza was in the leadposition and the Cessna, with a pilot and onepassenger aboard, had assumed an echelonposition.
The aircraft were filming over Utah Lake, Utah,U.S., at low altitude when the Cessna hit thewater and sank. Neither the pilot nor the pas-senger were wearing restraining devices. Bothoccupants drowned.
Causal factors included misjudged altitude
Other GeneralAviation
OtherGeneralAviation
F L I G HT SAFE TY FOUN D A TI O N • F L I G H T S A F E T Y D I G E S T • OCTOBER 1991 21
influenced by the glassy water surface thatimposed a visual illusion and the pilot’s at-tention being diverted by the filming activi-ties.
Tripped by Unseen Wires
Hughes 369HS: Substantial damage. No injuries.
The aircraft was on a sightseeing flight aroundNiagara Falls, New York, U.S. While flyingunder visual flight rules (VFR) at the ridgelevel around the Niagara River gorge, the pi-lot flew into downflowing air and descendedinto the vicinity of the of an area called theWhirlpool. The pilot stopped his descent andwas, according to the accident report, plan-ning to climb out of the area when the aircraftstruck an aerial car support cable.
The cable tore the landing skid gear from thefuselage and control was momentarily lost. Acable car with 17 passengers aboard was jostledas the cable swayed from the helicopter en-counter, but no one was injured. The pilot re-covered control and made a forced landingapproach to a golf course. Since a normaltouchdown was not possible because of dam-age to the landing skids, he kept the helicop-ter in a hover while the passengers exited. Thepilot then allowed the aircraft to touch downon the fuselage and the tail skid; it remainedupright. There were three passengers and onecrew member on board, none of whom wereinjured.
The helicopter sustained substantial damage.Both forward struts of the aircraft were sev-ered; both rear landing gear strut assembliesand both skid tubes were missing; the hori-
zontal stabilizer had an outboard puncturethrough both surfaces; and the right forwardstrut brace had ruptured the fuselage bellyskin.
The pilot routinely flew tour flights aroundthe area of the falls but had only flown aroundthe Whirlpool area on one previous occasionand, according to the accident report, had notvisually inspected the area for hazards. Theaerial car support cables in the area were notvisibly indicated or marked on navigationalcharts.
The accident report concluded that the pilotoperated the helicopter within the river gorgewithout prior inspection for hazards, and wasunaware that the aerial car cables were there.Also cited was the fact that the cables werenot visibly marked or indicated on naviga-tional charts.
Weather, Powerlines andHelicopters Do Not Mix
Aerospatiale AS355 Twinstar: Aircraft destroyed.Fatal injuries to two.
The emergency medical service (EMS) heli-copter was flying in conditions of deteriorat-ing weather. The fact that it was a life-savingmission, plus the lack of an alternate landinglocation in case the destination’s trauma cen-ter landing area was closed, delayed the deci-sion to turn around.
The aircraft collided with power lines suspended36 feet above a road. Control of the aircraftwas lost, it hit a retaining wall, clipped thetops of trees and descended into a 70-foot-deep ravine. The main wreckage came to rest220 feet from the initial point of impact. Theaircraft was destroyed and both the pilot andthe passenger were fatally injured.
Among reasons cited as causal factors for theaccident were a delayed emergency procedurein poor weather and self-induced and externalmental pressure on the pilot. ♦
RotorcraftRotorcraft