extreme ultraviolet explorer phase-resolved spectroscopy of v834 centauri
TRANSCRIPT
EXTREME ULTRAVIOLET EXPLORER PHASE-RESOLVED SPECTROSCOPY OF V834 CENTAURI
ChristopherW.Mauche
Lawrence LivermoreNational Laboratory, L-43, 7000 East Avenue, Livermore, CA 94550; [email protected] 2001 November 13; accepted 2002 June 17
ABSTRACT
The Extreme Ultraviolet Explorer (EUVE) satellite was employed for 5.46 days, beginning on 1999 Febru-ary 9.03 UT, to acquire phase-resolved EUV photometric and spectroscopic observations of the AM Hertype cataclysmic variable V834 Centauri. The resulting data are superior to those obtained by EUVE begin-ning on 1993 May 28.14 UT, because the source was approximately 3 times brighter, the observation was 4times longer and dithered, and ASCA observed the source simultaneously. Although we do not understandthe EUV light curves in detail, they are explained qualitatively by a simple model of accretion from a ballisticstream along the field lines of a tilted ( �; ½ � � 10�; 40�½ �) magnetic dipole centered on the white dwarf. In1993, when the EUV flux was lower, accretion was primarily along the ’ � � 40� field line, whereas in1999, when the EUV flux was higher, accretion took place over a broad range of azimuths extending from’ � � 40� to ’ � 76�. These changes in the accretion geometry could be caused by an increase in the massaccretion rate and/or the clumpiness of the flow. The 75–140 A EUVE spectra are well described by either ablackbody or a pure H stellar atmosphere absorbed by a neutral hydrogen column density, but constraintson the size of the EUV emission region and its UV brightness favor the blackbody interpretation. The mean1999 EUV spectrum is best fitted by an absorbed blackbody with temperature kT � 17:6 eV, hydrogen col-umn density NH � 7:4� 1019 cm�2, fractional emitting area f � 10�3, 70–140 A flux � 3:0� 10�11 ergscm�2 s�1, and luminosity Lsoft � 7:2� 1032 d=100 pcð Þ 2 ergs s�1. The ratio of the EUV to X-ray luminositiesis Lsoft=Lhard � 40, signaling that some mechanism other than irradiation (e.g., blob heating) dominatesenergy input into the accretion spot. The 1999 short-wavelength (SW) hardness ratio variation can beexplained by minor variations in kT and/or NH, but instead of tracking the SW count rate variation, thehardness ratio variation was sinusoidal, with aminimum (maximum) when the accretion spot was on the near(far) side of the white dwarf, consistent with the trend expected for an atmosphere with an inverted tempera-ture distribution.
Subject headings: binaries: close — stars: individual (V834 Centauri) — stars: magnetic fields —ultraviolet: stars — white dwarfs
1. INTRODUCTION
Polars, or AM Her stars, are a class of semidetachedbinaries composed of a low-mass, main-sequence secondaryand a strongly magnetic (B � 10 100 MG) white dwarf pri-mary. The strong field locks the white dwarf into corotation,and the accreting matter is channeled along the field linesfor much of its trajectory from the secondary’s innerLagrange point to a spot near the white dwarf magneticpole. To match boundary conditions, the flow passesthrough a strong shock far enough above the star for thehot (kT � kTshock ¼ 3GMwdlmH=8Rwd � 20 keV), post-shock matter to cool and come to rest at the stellar surface.This plasma cools via bremsstrahlung and line emission inthe X-ray bandpass and cyclotron emission in the opticaland near-IR. Roughly half of this radiation is emitted out-ward and is observed directly; the other half is emittedinward, where it is either reflected or absorbed by the whitedwarf surface. In addition to radiative heating, the whitedwarf surface can be heated by blobs of material that pene-trate to large optical depths before thermalizing their kineticenergy. For a mass accretion rate _MM ¼ 1016 g s�1 and a rel-ative spot size f ¼ 10�3, the white dwarf surface is heated toa temperature kT ¼ k GMwd
_MM=4��fR3wd
� �1=4� 20 eV andhence produces a radiation spectrum that peaks in theEUV.
Recent progress in our understanding of the accretionspots of polars has come from photometric and spectro-
scopic observations with the Extreme Ultraviolet Explorer(EUVE). The state of our understanding of the EUVE spec-tra of polars as of mid-1998 is described by Mauche (1999),who fitted blackbody, pure H stellar atmosphere, and solar-abundance stellar atmosphere models to the phase-averagedEUVE spectra of nine polars with useful data in the archive.Among the models tested, the blackbody parameterizationgave the best fits to the data, with blackbody temperatureskTbb � 15 25 eV and hydrogen column densitieslogNH cm�2ð Þ � 19 20. Wishing to increase the number ofpolars with good signal-to-noise ratio EUV spectra, in 1998we obtained approval for a 130 ks EUVE observation ofV834 Cen, whose 40 ks archival spectrum had a peak signal-to-noise ratio of only 8 in 0.54 A bins. Coincidentally, in late1998 M. Ishida obtained approval for an additional ASCAX-ray observation of V834 Cen, so it was arranged thatthese observations should be obtained simultaneously. Adescription of the X-ray light curves and spectra from theASCA observation is provided by Ishida & Fujimoto (1999)and Terada et al. (2001). Below we present the analysis ofthe EUV light curves and spectra from both the original1993 and the new 1999 EUVE observations of V834 Cen.
V834 Cen (nee E1405�451) is a well-studied polar withan orbital period Porb ¼ 101:5 minutes (Mason et al.1983) and the high- (V � 14) and low-luminosity states(V � 17) typical of this class of binaries. The magneticnature of the white dwarf is demonstrated directly by thelinear and circular polarization present in its high states
The Astrophysical Journal, 578:439–449, 2002 October 10
# 2002. The American Astronomical Society. All rights reserved. Printed in U.S.A.
439
(Cropper, Menzias, & Tapia 1986; Cropper 1989) and theZeeman absorption features and cyclotron emission fea-tures present in its low states (Schwope & Beuermann1990; Ferrario et al. 1992), from which a magnetic fieldstrength of 23 MG is inferred. The distance d, whitedwarf mass Mwd, binary inclination i, and the colatitude� and azimuth of the accretion spot are all uncertainat some level, but Puchnarewicz et al. (1990) find d > 77pc, based on a detection of the secondary in a near-IRspectrum; Cropper et al. (1999) find Mwd ¼ 0:54 0:64M�, based on fits of a Ginga X-ray spectrum; Ramsay(2000) finds Mwd ¼ 0:64 0:68 M�, based on fits of anRXTE X-ray spectrum; and Schwope et al. (1993) usephase-resolved optical spectra to determine Mwd ¼0:66þ0:19
�0:16 M� for i ¼ 50�þ10�
�5� . Cropper (1988) advocatesi ¼ 45� 9�, � ¼ 25� 5�, and ¼ 40� 5�, based onvalues compiled from the literature.
The plan of this paper is as follows. In x 2, we describe theEUVE observations; in x 3, we present the EUVE deep sur-vey (DS) photometer and ASCA count rate light curves; inx 4, we present the EUVE short-wavelength (SW) spectrom-eter count rate and hardness ratio light curves; in x 5, wepresent the mean and phase-resolved SW spectra; in x 6, weprovide a discussion and interpretation of these data; and inx 7, we close with a summary of our results.
2. OBSERVATIONS
For a description of the EUVE satellite and instrumen-tation, refer to Bowyer & Malina (1991), Abbott et al.(1996), and Sirk et al. (1997). It is sufficient to note herethat the bandpasses of the EUVE DS photometer andSW spectrometer are defined by a Lexan/boron filter andextend from �70 to �180 A, although, as we see below,interstellar absorption extinguishes the EUV flux of V834Cen longward of �140 A. The first EUVE observation ofV834 Cen began on 1993 May 28.14 UT, ran for 1.40days, and resulted in a total of 42 ks of exposure, whilethe second observation began on 1999 February 9.03 UT,ran for 5.46 days, and resulted in a total of 161 ks ofexposure. The ASCA observation began on 1999 Febru-ary 9.96 UT, ran for 1.75 days, and resulted in a total of58 ks of exposure. Subsequent to the first observation, aprocedure was established to increase the signal-to-noiseratio of EUVE spectra by dithering (delightfully, to‘‘ dither ’’ is to ‘‘ shiver ’’ or ‘‘ tremble ’’) the pointing posi-tion of the spacecraft, thereby moving the position of thespectrum on the face of the detectors and so averagingover quantum efficiency variations. The first part of thesecond observation was erroneously performed un-dithered, but after 0.84 days and 25 ks of exposure thespacecraft was reconfigured to spiral dither. Unfortu-nately, there is no known record of the optical brightnessof V834 Cen at the time of the 1993 observation, butduring the 1999 observation the source was in a highoptical state, with V � 14 (F. M. Bateson 1999, personalcommunication).
As is the case for all observations of short-period cata-clysmic variables (CVs) by low Earth orbit satellites, EUVEobservations of V834 Cen are complicated by the similarityof the satellite’s orbital period (Psat � 94:6 minutes) to thebinary’s orbital period (Porb ¼ 101:5 minutes). This situa-tion is exacerbated by the fact that EUVE takes data onlyfor the�30 minutes it is in Earth’s shadow. The result is that
the binary phase advances by �30% during each observinginterval, but recedes by �7% for each satellite orbit (i.e.,� ¼ 0:70 1:0, 0.63–0.93, 0.56–0.86, etc.). The net result isthat all binary phases are sampled only after 11 satelliteorbits or 0.72 days, while a full cycle is completed only afterðP�1
sat � P�1orbÞ
�1 � 0:96 days. The 1993 EUVE observationspans less than two such intervals, while the 1999 observa-tion spans nearly six.
To phase these data, we assumed the spectroscopicephemeris of Schwope et al. (1993): T0 HJDð Þ ¼2; 445; 048:9500 5ð Þ þ 0:070497518 26ð ÞN, where N is thecycle number, T0 is the blue-to-red zero crossing of the nar-row component of the He ii �4686 and H� emission lines inoptical spectra of V834 Cen, and the numbers in parenthesesindicate the uncertainties in the last digits; these errors resultin a phase uncertainty of 0.02 (0.03) cycles at the midpointof the 1993 (1999) EUVE observation. For ease of compari-son, we note that Sambruna et al. (1991, 1994) used the pho-tometric ephemeris of Cropper et al. (1986) to phase theEXOSAT data, and at the midpoints of the 1984, 1985, and1986 EXOSAT LE+3000 Lexan observations and the 1993and 1999 EUVE observations these ephemerides differ by0:15 0:01, 0:18 0:02, 0:19 0:02, 0:34 0:05, and0:46 0:08 cycles, respectively. The ability of the Schwopeet al. (1993) ephemeris to phase the EXOSAT and EUVElight curves confirms that that ephemeris is to be preferred.
3. DS LIGHT CURVES
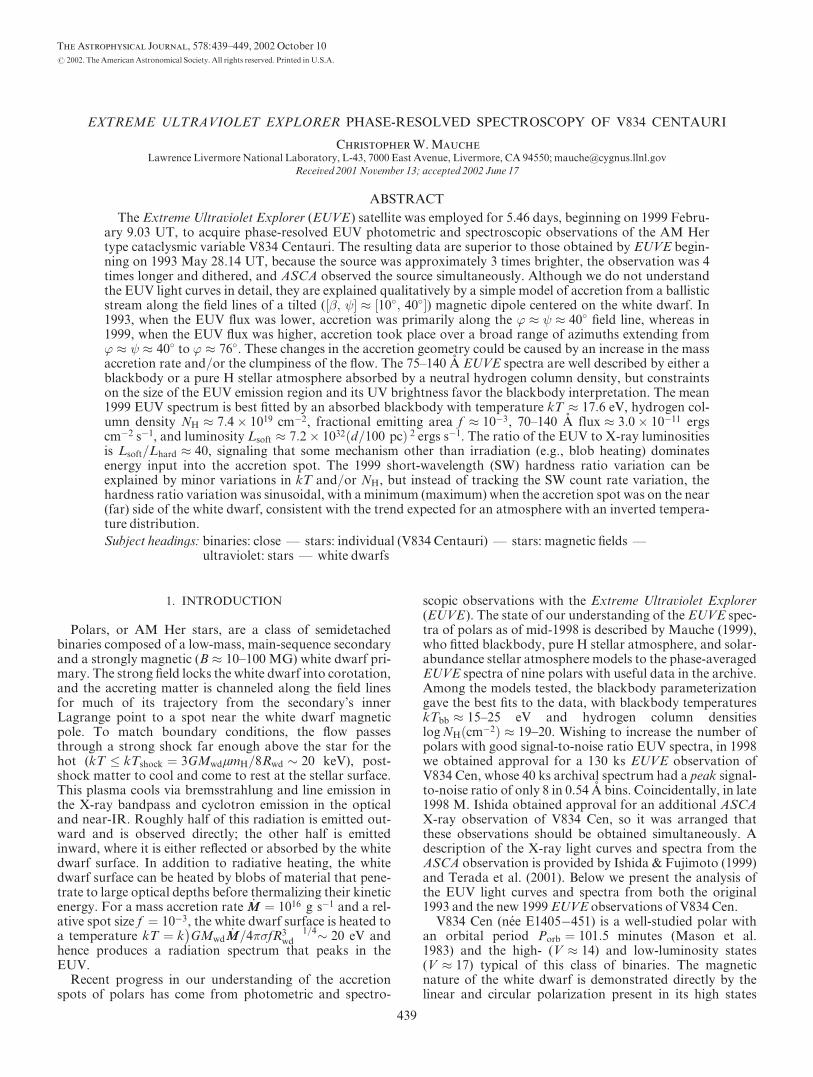
Assuming the above ephemeris, the 1993 and 1999background-subtracted DS count rate light curves are asshown in the top two panels of Figure 1. There are cleardifferences between the 1993 and 1999 DS light curves ofV834 Cen, and although the EUVE light curves are simi-lar to the 1986 and 1985 EXOSAT LE+3000 Lexan lightcurves, respectively (see Fig. 2 of Sambruna et al. 1994),they also differ in significant ways. Both the 1993 and1999 EUVE light curves have a broad maximum peakingat binary phase � � 0:55, a narrow maximum peakingjust before � � 1:0, a secondary minimum situatedbetween the two maxima, and a strong asymmetriceclipse centered at � � 0:88. Compared with the 1999light curve, the 1993 light curve has a stronger narrowmaximum and a narrower, more symmetric eclipse. Con-versely, the 1999 light curve has a more pronounced sec-ondary minimum and a broader, more asymmetriceclipse.
For completeness, we show in the bottom panel of Figure1 the ASCAX-ray light curve obtained simultaneously withthe 1999 EUVE observation. This light curve, kindly pro-vided to us by M. Ishida, is the summed count rate in the1.5–10 keV bandpass of the two ASCA SIS and GIS detec-tors. The ASCA light curve is seen to differ significantlyfrom the EUVE light curves: it appears to consist of a dou-ble hump superposed on a constant background. Theenergy-resolved ASCA light curves of Ishida & Fujimoto(1999) and Terada et al. (2001) show that the double humpis actually a broader feature cut at low energies by an asym-metric absorption feature, which, like the EUVE lightcurves, reaches minimum at � � 0:88.
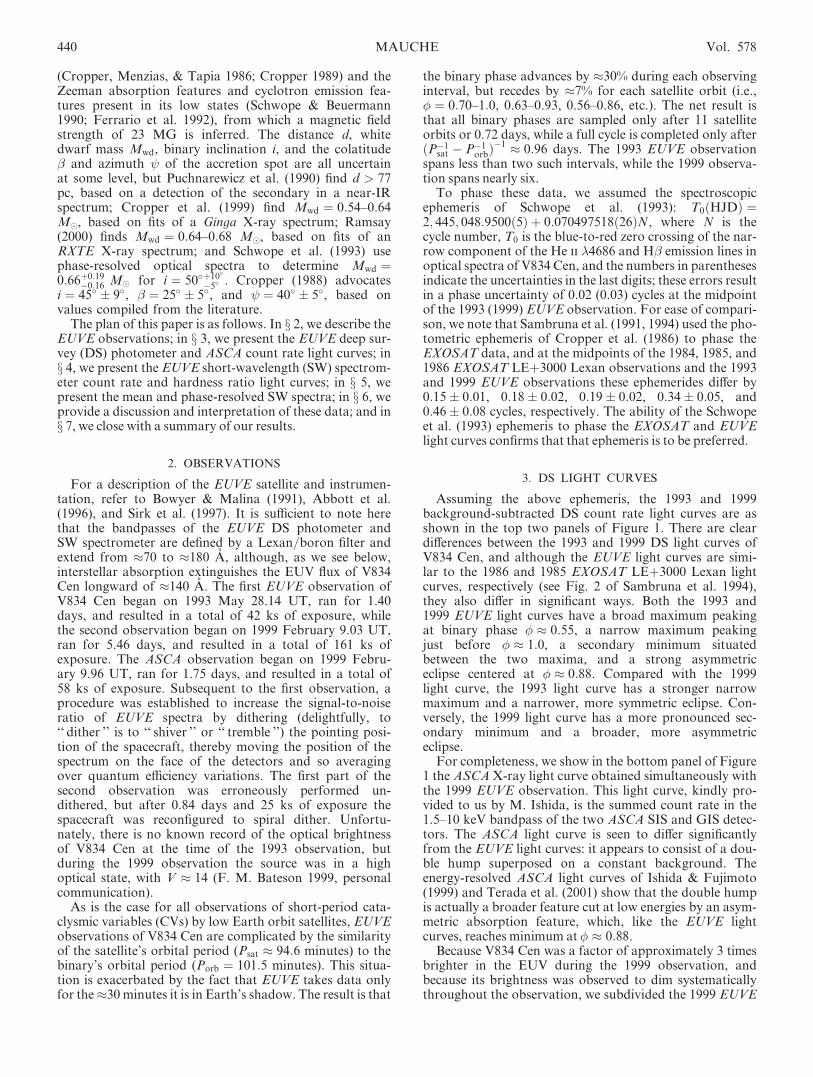
Because V834 Cen was a factor of approximately 3 timesbrighter in the EUV during the 1999 observation, andbecause its brightness was observed to dim systematicallythroughout the observation, we subdivided the 1999 EUVE
440 MAUCHE Vol. 578
observation into six equal-length intervals spanning thelength of the observation and constructed the six independ-ent DS light curves shown in Figure 2. Modulo the overalldecrease in the brightness of the source, the light curvesfrom the various intervals generally follow the mean lightcurve. It is apparent from Figure 2 that during the 1999observation the eclipse was composed of a stable, narrow(full width D� � 0:05), full eclipse centered at � � 0:88 anda variable, broad, partial eclipse centered at � � 0:79. Thelargest differences between the various intervals occur at (1)� � 0:84, at the interface between the partial and full eclip-ses; (2) � � 0:07, on the decline from the narrow maximum(compare Figs. 2a and 2e); and (3) � � 0:17, in the detailedshape of the secondary minimum. It appears at some inter-vals that there is a separate, narrow (full width D� � 0:1),partial eclipse situated in the valley between the twomaxima.
4. SW LIGHT CURVE AND HARDNESS RATIO
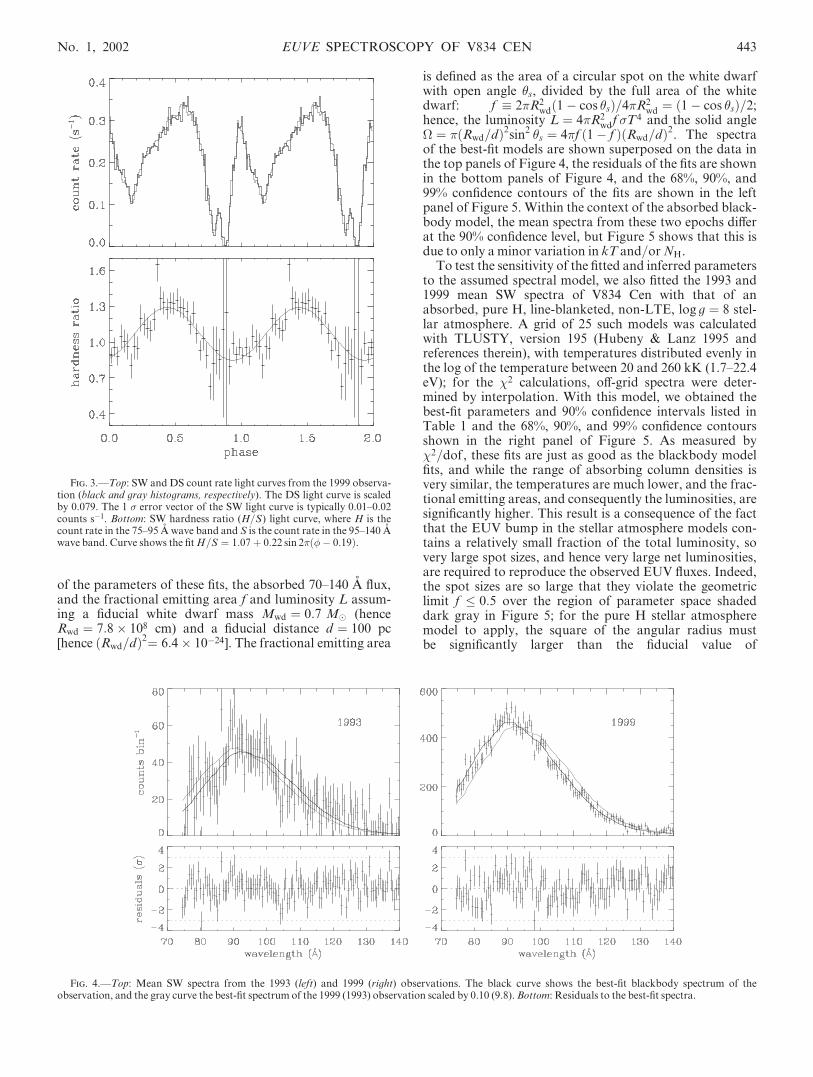
The SW spectrometer supplies an independent measure-ment of the EUV light curve of V834 Cen, albeit with lowersignal-to-noise ratio because of the instrument’s smallereffective area and effectively higher background. Mean,background-subtracted, SW count rate light curves wereconstructed in the same manner as those of the DS, with theexception that flux was collected only over the band 75–140A; shortward of �75 A the background increases strongly,and longward of �140 A there is very little source flux. Theresulting 1993 (1999) mean SW count rate light curve isconsistent [�2=degrees of freedom dofð Þ ¼ 12:4=24 ¼ 0:52(110:4=99 ¼ 1:12)] with the corresponding mean DS countrate light curve, after the latter is scaled by a factor of 0.083(0.079). The top panel of Figure 3 shows the mean SW andDS count rate light curves from the 1999 observation.
To search for spectral variations associated with the var-iations in the count rate light curves, we constructed hard-ness ratio light curves by calculating the ratio of thebackground-subtracted SW counts from 75 to 95 A to thosefrom 95 to 140 A. The break point between the two band-passes is arbitrary, but 95 A was chosen because it givesroughly equal numbers of counts in the two bandpasses. Asa compromise between phase resolution and signal-to-noiseratio, 40 phase bins were used to bin the 1999 observation,while the dimmer 1993 observation could stand no morethan 10. The 1993 hardness ratio light curve can be fitted bya constant 0:81 0:06, with �2=dof ¼ 6:78=9 ¼ 0:75, whilethe 1999 hardness ratio light curve, shown in the bottompanel of Figure 3, is fitted reasonably well by a sinusoidalfunction Aþ B sin 2� �� �0ð Þ, with A ¼ 1:07 0:02,B ¼ 0:22 0:02, �0 ¼ 0:19 0:02, and �2=dof ¼46:0=37 ¼ 1:24. The fit is significantly improved(D�2 ¼ 7:6), even without changing the fit parameters, if theisolated, aberrant datum at � ¼ 0:36 is removed from thefit. The other significant deviations from the fit coincidewith the partial eclipse at � � 0:79 and the secondary mini-mum at � � 0:17. Surprisingly, these deviations are down-ward, in the direction of softer spectra, contrary to thebehavior expected from photoelectric absorption.
5. SW SPECTRA
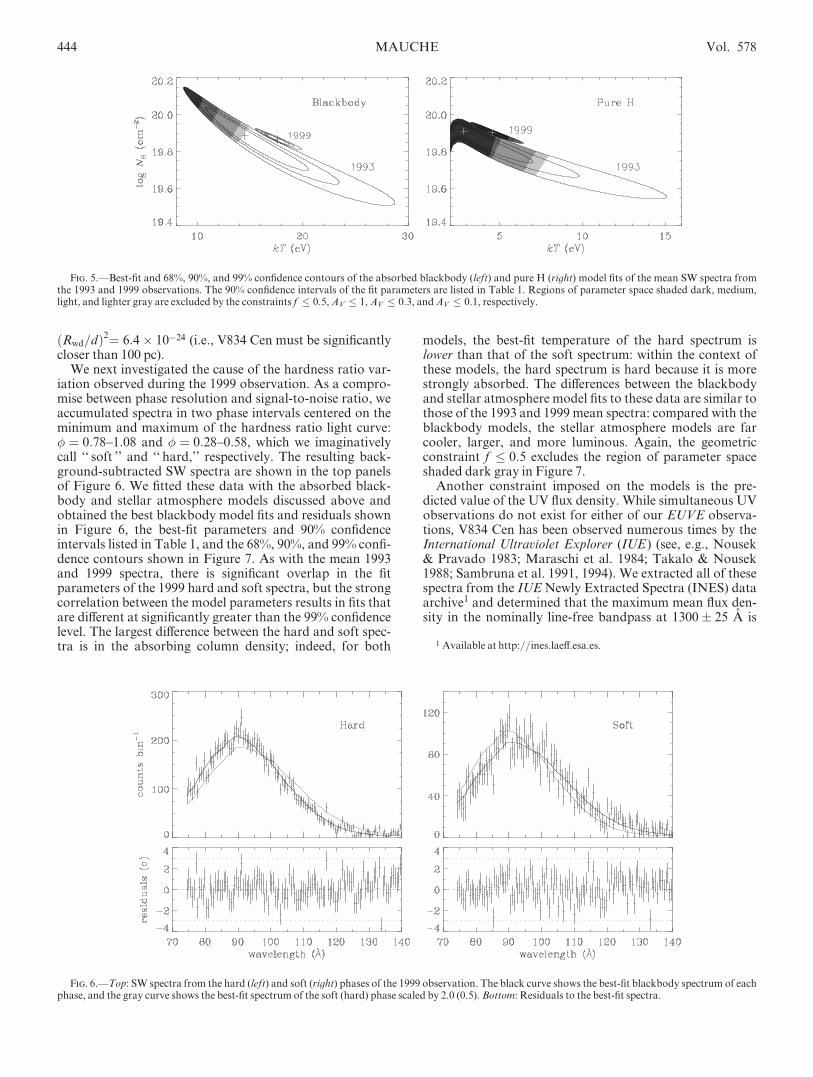
Ignoring for the moment the hardness ratio variationobserved during the 1999 observation, we constructed meanSW spectra of V834 Cen from the data obtained during thetwo epochs of observations. The analysis procedure wassimilar to that described in Mauche (1999), but the spectrawere constructed from the event data and, as above, carewas taken to avoid intervals when (1) the background washigh, (2) the source was occulted by Earth, and (3) the SWdetector was off. The spectra were binned up by a factor of 8(from D� ¼ 0:0674 A to D� ¼ 0:539 A) to increase the sig-nal-to-noise ratio, to match the spectral resolution of theSW instrument (FWHM ¼ 0:5 A), and to remove the non-statistical correlation between neighboring wavelength bins.To realize the full spectroscopic potential of the 1999 obser-vation, data from only the dithered portion of that observa-tion (136 ks of exposure starting on 1999 February 9.88 UT)were used. The resulting mean background-subtracted SWspectra are shown in the top panels of Figure 4, where thesignificantly higher quality of the 1999 spectrum is due tothe 3 times longer exposure and 3 times higher mean count
Fig. 1.—EUVE DS and ASCA SIS+GIS 1.5–10 keV count rate lightcurves. In the top (middle) panel, the DS light curve from the 1999 (1993)observation (scaled by 0.25 [3.0]) is shown by the gray histogram. The 1 �error vectors of the 1993 and 1999 EUVE and ASCA light curves are typi-cally 0.025–0.040, 0.030–0.055, and 0.015–0.030 counts s�1, respectively.
No. 1, 2002 EUVE SPECTROSCOPY OF V834 CEN 441
rate. The gross shapes of these count spectra are similar, butapparent differences are masked by the effective area of theSW spectrometer, which peaks at 100 A and falls off at bothends of the bandpass.
To determine if the differences between these spectra aresignificant, we fitted the data with a simple model consisting
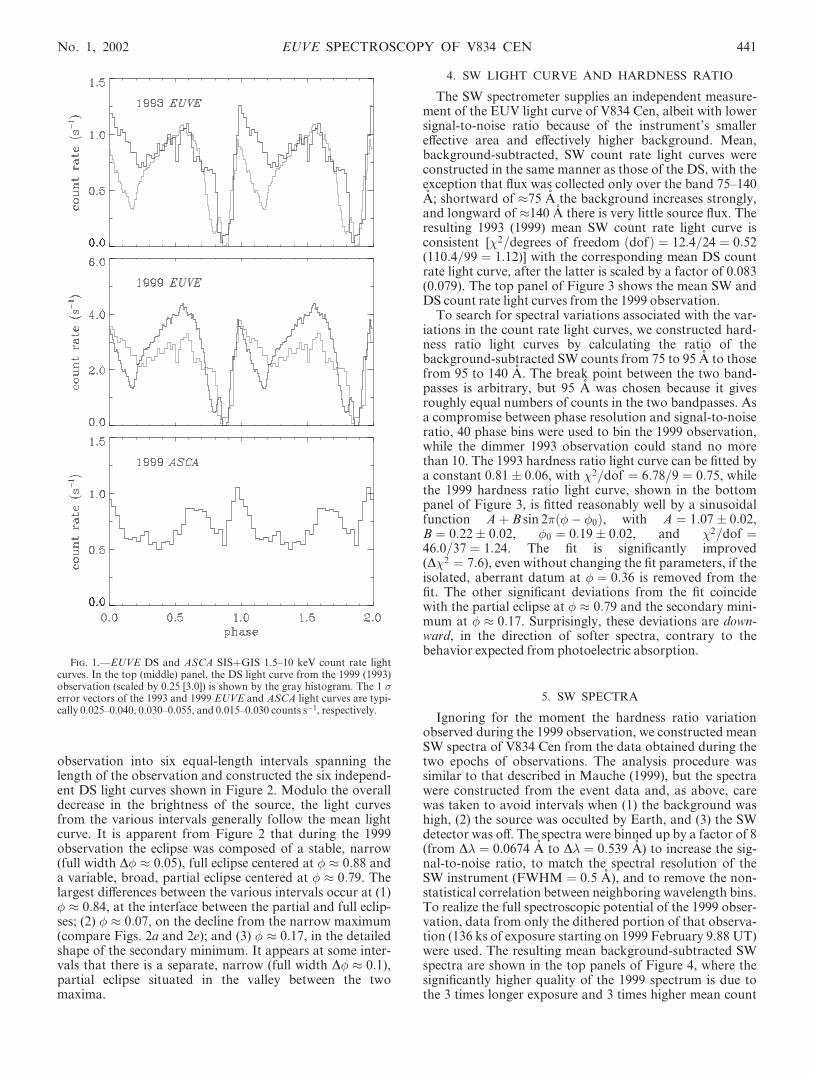
of a blackbody extinguished at long wavelengths by photo-electric absorption. For the absorption, we used the EUVabsorption cross sections of Rumph, Bowyer, & Vennes(1994) for H i, He i, and He ii with abundance ratios of1:0.1:0.01, as is typical of the diffuse interstellar medium.Table 1 lists the best-fit values and 90% confidence intervals
Fig. 2.—DS count rate light curves from the 1999 observation. Individual light curves are shown by the black histograms, while the mean DS light curve(scaled by 1.13, 1.10, 1.03, 1.05, 0.91, and 0.78 for panels a to f, respectively) is shown by the gray histograms. The 1 � error vectors for the individual lightcurves are typically 0.05–0.15 counts s�1.
TABLE 1
Blackbody and Pure HModel Fit Parameters
Phase
kT
(eV)
NH
(1019 cm�2)
70–140 A Flux
(10�11 ergs cm�2 s�1) log f
L
(1033 ergs s�1) �2/dof
BlackbodyModel
1993mean... 14:5þ9:0�4:7 7:7þ4:4
�3:5 0:9þ3:2�0:5 �2:8þ2:6
�2:0 0:59þ54:5�0:55 126/119
1999mean... 17:6þ1:6�1:6 7:4þ0:8
�0:7 3:1þ0:8�0:5 �3:0þ0:4
�0:4 0:72þ0:65�0:28 179/119
1999 hard .... 15:9þ2:4�1:9 9:1þ1:3
�1:1 4:3þ1:7�1:1 �2:3þ0:7
�0:6 2:6þ5:0�1:6 129/119
1999 soft ..... 17:6þ4:4�3:3 6:6þ1:7
�1:5 2:1þ1:3�0:7 �3:3þ1:0
�0:9 0:39þ1:29�0:26 138/119
Pure HModel
1993mean... 2:8þ7:0�0:8 8:2þ1:0
�3:6 0:9þ69:0�0:9 þ0:7þ1:0
�3:7 2:4þ3:2�2:3 127/119
1999mean... 4:5þ1:3�1:0 8:1þ0:7
�0:9 3:1þ22:4�2:7 þ0:1þ0:4
�0:8 3:7þ0:4�1:9 182/119
1999 hard .... 3:5þ1:5�1:0 9:8þ0:9
�1:2 4:3þ118�4:1 þ0:7þ0:7
�0:7 5:7þ2:8�0:8 129/119
1999 soft ..... 4:6þ3:8�1:9 7:3þ1:5
�1:8 2:1þ337�2:0 �0:1þ1:1
�2:1 2:7þ1:3�2:5 139/119
Note.—Best-fit values and 90% confidence intervals.
442 MAUCHE Vol. 578
of the parameters of these fits, the absorbed 70–140 A flux,and the fractional emitting area f and luminosity L assum-ing a fiducial white dwarf mass Mwd ¼ 0:7 M� (henceRwd ¼ 7:8� 108 cm) and a fiducial distance d ¼ 100 pc[hence Rwd=dð Þ2¼ 6:4� 10�24]. The fractional emitting area
is defined as the area of a circular spot on the white dwarfwith open angle �s, divided by the full area of the whitedwarf: f 2�R2
wd 1� cos �sð Þ=4�R2wd ¼ 1� cos �sð Þ=2;
hence, the luminosity L ¼ 4�R2wdf �T
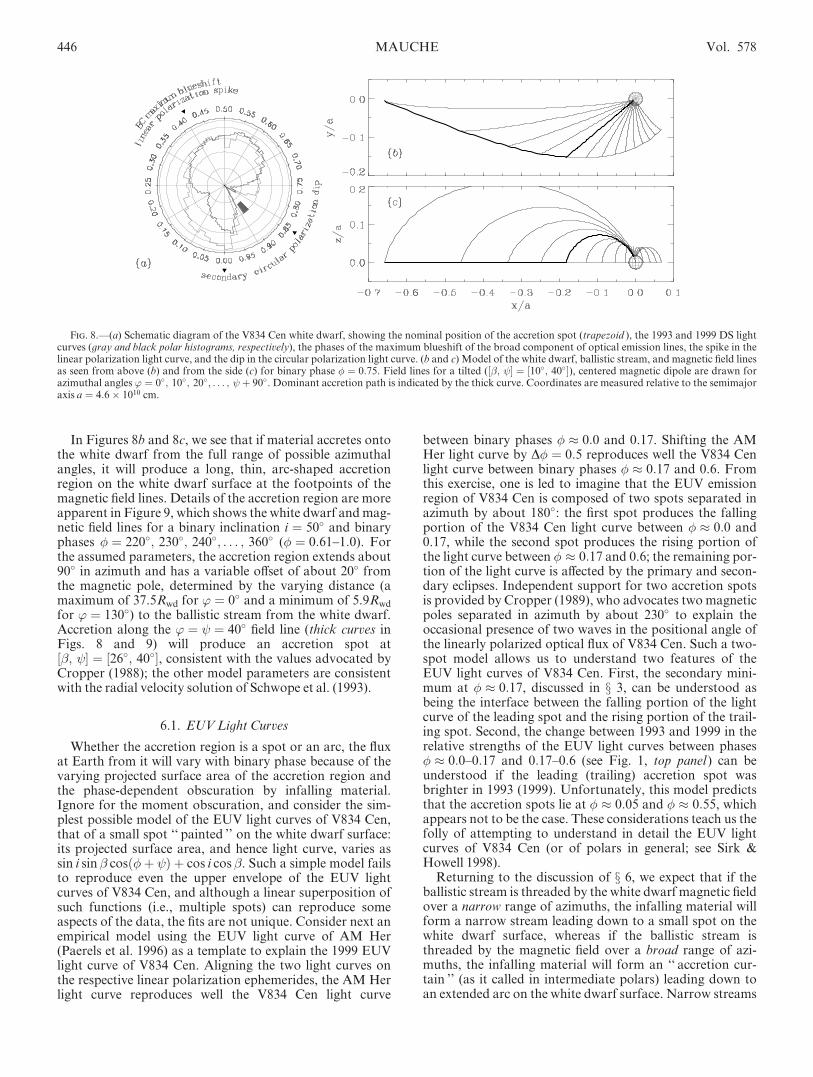
4 and the solid angle� ¼ � Rwd=dð Þ2sin2 �s ¼ 4�f 1� fð Þ Rwd=dð Þ2. The spectraof the best-fit models are shown superposed on the data inthe top panels of Figure 4, the residuals of the fits are shownin the bottom panels of Figure 4, and the 68%, 90%, and99% confidence contours of the fits are shown in the leftpanel of Figure 5. Within the context of the absorbed black-body model, the mean spectra from these two epochs differat the 90% confidence level, but Figure 5 shows that this isdue to only a minor variation in kT and/orNH.
To test the sensitivity of the fitted and inferred parametersto the assumed spectral model, we also fitted the 1993 and1999 mean SW spectra of V834 Cen with that of anabsorbed, pure H, line-blanketed, non-LTE, log g ¼ 8 stel-lar atmosphere. A grid of 25 such models was calculatedwith TLUSTY, version 195 (Hubeny & Lanz 1995 andreferences therein), with temperatures distributed evenly inthe log of the temperature between 20 and 260 kK (1.7–22.4eV); for the �2 calculations, off-grid spectra were deter-mined by interpolation. With this model, we obtained thebest-fit parameters and 90% confidence intervals listed inTable 1 and the 68%, 90%, and 99% confidence contoursshown in the right panel of Figure 5. As measured by�2=dof, these fits are just as good as the blackbody modelfits, and while the range of absorbing column densities isvery similar, the temperatures are much lower, and the frac-tional emitting areas, and consequently the luminosities, aresignificantly higher. This result is a consequence of the factthat the EUV bump in the stellar atmosphere models con-tains a relatively small fraction of the total luminosity, sovery large spot sizes, and hence very large net luminosities,are required to reproduce the observed EUV fluxes. Indeed,the spot sizes are so large that they violate the geometriclimit f � 0:5 over the region of parameter space shadeddark gray in Figure 5; for the pure H stellar atmospheremodel to apply, the square of the angular radius mustbe significantly larger than the fiducial value of
Fig. 4.—Top: Mean SW spectra from the 1993 (left) and 1999 (right) observations. The black curve shows the best-fit blackbody spectrum of theobservation, and the gray curve the best-fit spectrum of the 1999 (1993) observation scaled by 0.10 (9.8).Bottom: Residuals to the best-fit spectra.
Fig. 3.—Top: SW and DS count rate light curves from the 1999 observa-tion (black and gray histograms, respectively). The DS light curve is scaledby 0.079. The 1 � error vector of the SW light curve is typically 0.01–0.02counts s�1. Bottom: SW hardness ratio (H/S) light curve, where H is thecount rate in the 75–95 A wave band and S is the count rate in the 95–140 Awave band. Curve shows the fitH=S ¼ 1:07þ 0:22 sin 2� �� 0:19ð Þ.
No. 1, 2002 EUVE SPECTROSCOPY OF V834 CEN 443
Rwd=dð Þ2¼ 6:4� 10�24 (i.e., V834 Cen must be significantlycloser than 100 pc).
We next investigated the cause of the hardness ratio var-iation observed during the 1999 observation. As a compro-mise between phase resolution and signal-to-noise ratio, weaccumulated spectra in two phase intervals centered on theminimum and maximum of the hardness ratio light curve:� ¼ 0:78 1:08 and � ¼ 0:28 0:58, which we imaginativelycall ‘‘ soft ’’ and ‘‘ hard,’’ respectively. The resulting back-ground-subtracted SW spectra are shown in the top panelsof Figure 6. We fitted these data with the absorbed black-body and stellar atmosphere models discussed above andobtained the best blackbody model fits and residuals shownin Figure 6, the best-fit parameters and 90% confidenceintervals listed in Table 1, and the 68%, 90%, and 99% confi-dence contours shown in Figure 7. As with the mean 1993and 1999 spectra, there is significant overlap in the fitparameters of the 1999 hard and soft spectra, but the strongcorrelation between the model parameters results in fits thatare different at significantly greater than the 99% confidencelevel. The largest difference between the hard and soft spec-tra is in the absorbing column density; indeed, for both
models, the best-fit temperature of the hard spectrum islower than that of the soft spectrum: within the context ofthese models, the hard spectrum is hard because it is morestrongly absorbed. The differences between the blackbodyand stellar atmosphere model fits to these data are similar tothose of the 1993 and 1999 mean spectra: compared with theblackbody models, the stellar atmosphere models are farcooler, larger, and more luminous. Again, the geometricconstraint f � 0:5 excludes the region of parameter spaceshaded dark gray in Figure 7.
Another constraint imposed on the models is the pre-dicted value of the UV flux density. While simultaneous UVobservations do not exist for either of our EUVE observa-tions, V834 Cen has been observed numerous times by theInternational Ultraviolet Explorer (IUE) (see, e.g., Nousek& Pravado 1983; Maraschi et al. 1984; Takalo & Nousek1988; Sambruna et al. 1991, 1994). We extracted all of thesespectra from the IUENewly Extracted Spectra (INES) dataarchive1 and determined that the maximum mean flux den-sity in the nominally line-free bandpass at 1300 25 A is
Fig. 5.—Best-fit and 68%, 90%, and 99% confidence contours of the absorbed blackbody (left) and pure H (right) model fits of the mean SW spectra fromthe 1993 and 1999 observations. The 90% confidence intervals of the fit parameters are listed in Table 1. Regions of parameter space shaded dark, medium,light, and lighter gray are excluded by the constraints f � 0:5,AV � 1,AV � 0:3, andAV � 0:1, respectively.
1 Available at http://ines.laeff.esa.es.
Fig. 6.—Top: SW spectra from the hard (left) and soft (right) phases of the 1999 observation. The black curve shows the best-fit blackbody spectrum of eachphase, and the gray curve shows the best-fit spectrum of the soft (hard) phase scaled by 2.0 (0.5).Bottom: Residuals to the best-fit spectra.
444 MAUCHE Vol. 578

4� 10�14 ergs cm�2 s�1 A�1. The intrinsic UV flux densitywill be larger than this value because of reddening, butunfortunately the amount of reddening is uncertain. Giventhe upper limit of NH ¼ 2� 1020 cm�2 for the absorbingcolumn density from the various fits to the EUVE spectra, areasonable upper limit to the reddening should beAV ¼ 0:1,but from the IUE spectra themselves Nousek & Pravado(1983) inferred AV ¼ 0:40 0:16; Maraschi et al. (1984)inferred AV < 0:47 at the 90% confidence level; Sambrunaet al. (1991) inferred AV ¼ 0:10þ0:15
�0:07, whereas Sambruna etal. (1994) inferred AV ¼ 0:75. Given this uncertainty, weconsider the constraints imposed by the model UV flux den-sities forAV � 1, 0.3, and 0.1, assuming the extinction curveof Fitzpatrick (1999) with AV/EB�V = 3.1, as is typical ofthe diffuse interstellar medium. The regions of parameterspace excluded by these constraints are shaded medium,light, and lighter gray, respectively, in Figures 5 and 7. Notethat the UV constraints severely constrain the range ofparameter space allowed to the pure Hmodels.
6. DISCUSSION AND INTERPRETATION
In the previous sections, we have described the phenom-enology of the EUV light curves and spectra of V834 Cenmeasured by EUVE in 1993 May and 1999 February. Tohelp understand these data, we note the following, based onour general understanding of polars and the results fromoptical studies of V834 Cen by Rosen, Mason, & Cordova(1987), Cropper (1988, 1989), and Schwope et al. (1993). (1)The binary inclination i � 45� 9� and the accretion spotcolatitude and azimuth are, respectively, � � 25� 5� and � 40� 5�. (2) In V834 Cen only one accretion spot isvisible for all orbital phases, because the sum of the spotcolatitude and binary inclination is less than 90�. (3)Because the binary inclination is greater than the spot cola-titude, the accretion stream passes through the line of sightto the accretion region once per binary revolution. (4) Thenarrow and broad components of the optical emission linesof polars are understood to be due to, respectively, theheated face of the secondary and the base of the accretionstream. (5) Blue-to-red zero crossing of the narrow compo-nents of optical emission lines occurs at binary phase � � 0,placing the secondary (white dwarf) on the near (far) side ofthe binary at that phase. (6) Maximum blueshift of thebroad components of optical emission lines occurs at� � 0:42, so at that phase the accretion stream points most
directly toward us. (7) The linear polarization spike alsooccurs at � � 0:42, so at that phase the accretion column ison the plane of the sky. (8) We expect that the accretion col-umn will point most directly toward us approximately 180�
later, at � � 0:92. The circular polarization, EUV, andX-ray light curves are all eclipsed near this phase because ofthe passage through the line of sight of the (preshock) accre-tion stream and (postshock) accretion column.
To illustrate these results, we constructed the graphicshown in the left panel of Figure 8, which includes the nomi-nal position on the white dwarf of the accretion spot (trape-zoid ), the 1993 and 1999 DS light curves (gray and blackpolar histograms, respectively), and the phases of the maxi-mum blueshift of the broad component of optical emissionlines, the spike in linear polarization light curves, and thedip in circular polarization light curves. It is seen that theprimary eclipse of the EUV light curves occurs when theaccretion spot points toward the observer, while the dip incircular polarization light curves appears to occur betweenthe primary and secondary eclipses of the EUV light curves.
To help envision the accretion geometry of V834 Cen, weconstructed a simple model, shown in Figures 8b and 8c, ofthe path of material from the secondary’s inner Lagrangepoint to the white dwarf surface in the vicinity of the uppermagnetic pole. The model consists of the ballistic stream fora nonmagnetic, semidetached binary and the field lines of atilted magnetic dipole centered on the white dwarf for anorbital period Porb ¼ 101:5 minutes, mass ratio q ¼ 5:08(determining the trajectory of the ballistic stream), whitedwarf mass Mwd ¼ 0:66 M� (determining the white dwarfradius Rwd ¼ 8:1� 108 cm), magnetic colatitude � ¼ 10�,and magnetic azimuth ¼ 40�. Field lines are drawn forazimuthal angles ’ ¼ 0�; 10�; 20�; . . . ; þ 90�. If materialin the ballistic stream makes it beyond ’ � þ 90� � 130�,it will accrete preferentially onto the lower magnetic poleand hence disappear from consideration. In this simplemodel, the material lost by the secondary travels along theballistic stream until it is threaded by the white dwarf mag-netic field; it then leaves the orbital plane and follows themagnetic field lines down to the white dwarf surface in thevicinity of the magnetic poles. In reality, the trajectory ofthe accreting material will be affected by the magnetic field,and the magnetic field will be distorted by the accretingmaterial; our simple model is a first-order approximationof the path of the accreting material that ignores thesecomplications.
Fig. 7.—Same as Fig. 5, but for the mean, hard, and soft SW spectra from the 1999 observation. Confidence contours of the mean spectrum from the 1993observation are shown by the dotted curves.
No. 1, 2002 EUVE SPECTROSCOPY OF V834 CEN 445
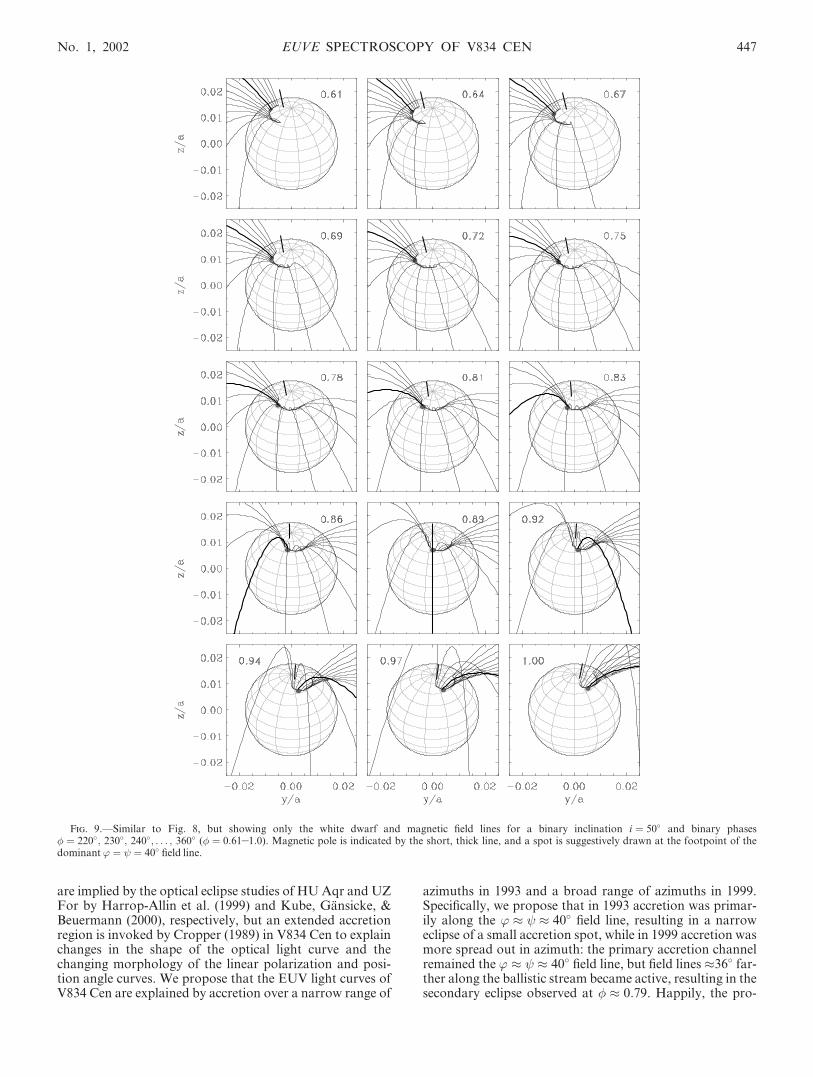
In Figures 8b and 8c, we see that if material accretes ontothe white dwarf from the full range of possible azimuthalangles, it will produce a long, thin, arc-shaped accretionregion on the white dwarf surface at the footpoints of themagnetic field lines. Details of the accretion region are moreapparent in Figure 9, which shows the white dwarf andmag-netic field lines for a binary inclination i ¼ 50� and binaryphases � ¼ 220�; 230�; 240�; . . . ; 360� (� ¼ 0:61 1:0). Forthe assumed parameters, the accretion region extends about90� in azimuth and has a variable offset of about 20� fromthe magnetic pole, determined by the varying distance (amaximum of 37.5Rwd for ’ ¼ 0� and a minimum of 5.9Rwd
for ’ ¼ 130�) to the ballistic stream from the white dwarf.Accretion along the ’ ¼ ¼ 40� field line (thick curves inFigs. 8 and 9) will produce an accretion spot at�; ½ � ¼ 26�; 40�½ �, consistent with the values advocated byCropper (1988); the other model parameters are consistentwith the radial velocity solution of Schwope et al. (1993).
6.1. EUVLight Curves
Whether the accretion region is a spot or an arc, the fluxat Earth from it will vary with binary phase because of thevarying projected surface area of the accretion region andthe phase-dependent obscuration by infalling material.Ignore for the moment obscuration, and consider the sim-plest possible model of the EUV light curves of V834 Cen,that of a small spot ‘‘ painted ’’ on the white dwarf surface:its projected surface area, and hence light curve, varies assin i sin � cosð�þ Þ þ cos i cos�. Such a simple model failsto reproduce even the upper envelope of the EUV lightcurves of V834 Cen, and although a linear superposition ofsuch functions (i.e., multiple spots) can reproduce someaspects of the data, the fits are not unique. Consider next anempirical model using the EUV light curve of AM Her(Paerels et al. 1996) as a template to explain the 1999 EUVlight curve of V834 Cen. Aligning the two light curves onthe respective linear polarization ephemerides, the AM Herlight curve reproduces well the V834 Cen light curve
between binary phases � � 0:0 and 0.17. Shifting the AMHer light curve by D� ¼ 0:5 reproduces well the V834 Cenlight curve between binary phases � � 0:17 and 0.6. Fromthis exercise, one is led to imagine that the EUV emissionregion of V834 Cen is composed of two spots separated inazimuth by about 180�: the first spot produces the fallingportion of the V834 Cen light curve between � � 0:0 and0.17, while the second spot produces the rising portion ofthe light curve between � � 0:17 and 0.6; the remaining por-tion of the light curve is affected by the primary and secon-dary eclipses. Independent support for two accretion spotsis provided by Cropper (1989), who advocates two magneticpoles separated in azimuth by about 230� to explain theoccasional presence of two waves in the positional angle ofthe linearly polarized optical flux of V834 Cen. Such a two-spot model allows us to understand two features of theEUV light curves of V834 Cen. First, the secondary mini-mum at � � 0:17, discussed in x 3, can be understood asbeing the interface between the falling portion of the lightcurve of the leading spot and the rising portion of the trail-ing spot. Second, the change between 1993 and 1999 in therelative strengths of the EUV light curves between phases� � 0:0 0:17 and 0:17 0:6 (see Fig. 1, top panel) can beunderstood if the leading (trailing) accretion spot wasbrighter in 1993 (1999). Unfortunately, this model predictsthat the accretion spots lie at � � 0:05 and � � 0:55, whichappears not to be the case. These considerations teach us thefolly of attempting to understand in detail the EUV lightcurves of V834 Cen (or of polars in general; see Sirk &Howell 1998).
Returning to the discussion of x 6, we expect that if theballistic stream is threaded by the white dwarf magnetic fieldover a narrow range of azimuths, the infalling material willform a narrow stream leading down to a small spot on thewhite dwarf surface, whereas if the ballistic stream isthreaded by the magnetic field over a broad range of azi-muths, the infalling material will form an ‘‘ accretion cur-tain ’’ (as it called in intermediate polars) leading down toan extended arc on the white dwarf surface. Narrow streams
Fig. 8.—(a) Schematic diagram of the V834 Cen white dwarf, showing the nominal position of the accretion spot (trapezoid ), the 1993 and 1999 DS lightcurves (gray and black polar histograms, respectively), the phases of the maximum blueshift of the broad component of optical emission lines, the spike in thelinear polarization light curve, and the dip in the circular polarization light curve. (b and c) Model of the white dwarf, ballistic stream, and magnetic field linesas seen from above (b) and from the side (c) for binary phase � ¼ 0:75. Field lines for a tilted ( �; ½ � ¼ 10�; 40�½ �), centered magnetic dipole are drawn forazimuthal angles ’ ¼ 0�; 10�; 20�; . . . ; þ 90�. Dominant accretion path is indicated by the thick curve. Coordinates are measured relative to the semimajoraxis a ¼ 4:6� 1010 cm.
446 MAUCHE Vol. 578
are implied by the optical eclipse studies of HUAqr and UZFor by Harrop-Allin et al. (1999) and Kube, Gansicke, &Beuermann (2000), respectively, but an extended accretionregion is invoked by Cropper (1989) in V834 Cen to explainchanges in the shape of the optical light curve and thechanging morphology of the linear polarization and posi-tion angle curves. We propose that the EUV light curves ofV834 Cen are explained by accretion over a narrow range of
azimuths in 1993 and a broad range of azimuths in 1999.Specifically, we propose that in 1993 accretion was primar-ily along the ’ � � 40� field line, resulting in a narroweclipse of a small accretion spot, while in 1999 accretion wasmore spread out in azimuth: the primary accretion channelremained the ’ � � 40� field line, but field lines �36� far-ther along the ballistic stream became active, resulting in thesecondary eclipse observed at � � 0:79. Happily, the pro-
Fig. 9.—Similar to Fig. 8, but showing only the white dwarf and magnetic field lines for a binary inclination i ¼ 50� and binary phases� ¼ 220�; 230�; 240�; . . . ; 360� (� ¼ 0:61 1:0). Magnetic pole is indicated by the short, thick line, and a spot is suggestively drawn at the footpoint of thedominant ’ ¼ ¼ 40� field line.
No. 1, 2002 EUVE SPECTROSCOPY OF V834 CEN 447
posed shift of the accretion rate farther along the ballisticstream qualitatively explains the reduction in the relativestrength of the EUV light curve between � � 0:0 and 0.17.What caused the changes in the accretion geometry between1993 and 1999? One option is a higher accretion rate, sincein 1999 the EUV flux was approximately 3 times higher thanin 1993. Another option is enhanced clumping of the flow,since greater clumping will result in magnetic threading overa broader range of azimuths and more efficient heating ofthe accretion spot as blobs of material crash into the stellarsurface.
6.2. EUV Spectra
Although we have appealed to obscuration by the pre-and postshock accretion flow to explain the primary andsecondary eclipses in the EUV light curves of V834 Cen,Figure 3 makes clear that this obscuration cannot be due tophotoelectric absorption. First, the amplitude of the SWhardness ratio variation is too small. Assuming that themean EUV spectrum of V834 Cen is an absorbed blackbodywith kT ¼ 17:6 eV and NH ¼ 7:4� 1019 cm�2 (see Table 1and Fig. 7), the SW hardness ratio equals 1.1, as observed.Doubling NH decreases the SW count rate by a factor of�10, but the SW hardness ratio increases by a factor of �4.In contrast, during the 1999 observation, the SW count ratevaried by a factor of e10, while the hardness ratio variedby only �20%. Similar results apply even if H and He aresingly ionized, and only the He ii bound-free opacity is leftto absorb the EUV flux from the accretion spot. It isactually quite easy to remove the photoelectric opacity of allthese ions: in a collisionally ionized plasma, H is fully ion-ized for Te25 kK and He is fully ionized for Te100 kK.Above that temperature, only Thomson opacity is availableto reduce the EUV flux, and an electron column densityNe ¼ � ln 0:1ð Þ=�T ¼ 3:5� 1024 cm�2 is required to reducethe EUV flux by a factor of 10. Second, the SW hardnessratio variation does not track the SW count rate variation.Instead, at least during the 1999 observation (see Fig. 3), thehardness ratio variation was sinusoidal, with a minimum(maximum) when the accretion spot was on the near (far)side of the white dwarf. Evidently, as the accretion spotrotates to the far side of the white dwarf, its spectrum sys-tematically hardens. Figure 7 shows that the detailed spec-tral fits indicate that this change is best explained bydecreasing kT and increasing NH, but within the 68% con-tours this can be accomplished simply by increasing NH,and within the 90% contours this can be accomplished sim-ply by increasing kT. The last option implies that the accre-tion region is harder when observed at shallow viewingangles. This is the trend expected for an accretion spot sub-jected to irradiation by the million-degree plasma in theaccretion column (van Teeseling, Heise, & Paerels 1994),although the affect is predicted to be small in the 75–140 Abandpass and the large ratio of hard to soft X-ray luminosi-ties (see below) argues that irradiation does not dominatethe energy deposition into the accretion spot.
The mean 1993 and 1999 and the phase-resolved 1999EUVE spectra of V834 Cen can be fitted by a blackbody ora pure H stellar atmosphere model absorbed by a neutralhydrogen column density, with the parameters listed inTable 1. Compared with the blackbody models, the stellaratmosphere models are cooler, larger, and more luminous.In fact, as shown by Figures 5 and 7, the stellar atmosphere
models are too big and too luminous (too bright in the UV)to explain the observations of V834 Cen. First, the stellar at-mosphere model fails to account for the EUV spectrumacquired during the hard phase of the 1999 observation,because the required angular size is larger than that of thewhite dwarf. Second, the stellar atmosphere model fails toaccount for the mean 1999 EUV spectrum, because it pro-duces too much flux in the UV unless the reddening AV � 1.Similar problems are met applying this model to otherpolars (Mauche 1999), so we conclude that the pure H stel-lar atmosphere model cannot in general explain the EUV ofthese magnetic CVs.
Finally, having simultaneously measured the EUV andX-ray spectra of V834 Cen in 1999, we are in a positionto determine the ratio of the luminosities of the accretioncolumn and accretion spot. Table 1 shows that the absorbedblackbody fit to the mean 1999 EUV spectrum yields best-fitparameters kT � 17:6 eV, NH � 7:4� 1019 cm�2, frac-tional emitting area f � 10�3, 70–140 A flux � 3:0� 10�11
ergs cm�2 s�1, and luminosity Lsoft � 7:2� 1032 d=100 pcð Þ2ergs s�1. The averaged 2–10 keV flux measured by ASCAwas 1:5� 10�11 ergs cm�2 s�1 (Ishida & Fujimoto 1999),implying Lhard � 1:8� 1031 d=100 pcð Þ2 ergs s�1, henceLsoft=Lhard � 40 (to within a factor of �2). This imbalancebetween the soft accretion spot and hard accretion columnluminosities is the famous ‘‘ soft X-ray problem,’’ and it sig-nals that some mechanism other than irradiation (e.g., blobheating) dominates energy deposition into the accretionspot.
7. SUMMARY
We have described EUVE observations of V834 Cenobtained in 1993 May and 1999 February. The 1999 dataare superior to those obtained in 1993 because the sourcewas approximately 3 times brighter, the observation was 4times longer and dithered, and ASCA observed the sourcesimultaneously. Although we do not understand the EUVlight curves in detail, they are explained qualitatively by asimple model of accretion from a ballistic stream along thefield lines of a tilted ( �; ½ � � 10�; 40�½ �) magnetic dipolecentered on the white dwarf. In 1993, when the EUV fluxwas lower, accretion was primarily along the ’ � � 40�
field line, whereas in 1999, when the EUV flux was higher,accretion took place over a broad range of azimuths extend-ing from ’ � � 40� to ’ � 76�. These changes in theaccretion geometry could be caused by an increase in themass accretion rate and/or the clumpiness of the flow. The75–140 A EUVE spectra are well described by either ablackbody or a pure H stellar atmosphere absorbed by aneutral hydrogen column density, but constraints on thesize of the EUV emission region and its UV brightness favorthe blackbody interpretation. The mean 1999 EUV spec-trum is best fitted by an absorbed blackbody with tempera-ture kT � 17:6 eV, hydrogen column densityNH � 7:4� 1019 cm�2, fractional emitting area f � 10�3,70–140 A flux � 3:0� 10�11 ergs cm�2 s�1, and luminosityLsoft � 7:2� 1032 d=100 pcð Þ2 ergs s�1. The ratio of theEUV to X-ray luminosities is Lsoft=Lhard � 40, signalingthat some mechanism other than irradiation (e.g., blobheating) dominates energy input into the accretion spot.The 1999 SW hardness ratio variation can be explained byminor variations in kT and/or NH, but instead of trackingthe SW count rate variation, the hardness ratio variation
448 MAUCHE Vol. 578
was sinusoidal, with a minimum (maximum) when theaccretion spot was on the near (far) side of the white dwarf,consistent with the trend expected for an atmosphere withan inverted temperature distribution.
Special thanks are due to F. Bateson, Director of theVSS/RASNZ, for helping us plan the 1999 EUVE andASCA observations of V834 Cen by instituting a programof optical observations of the source and then regularly sup-plying us with visual magnitudes estimates. We thank M.Ishida for graciously supplying the ASCA data shown inFigure 1, S. Howell for kindly supplying the ballistic streamtrajectory shown in Figure 8, and S. Howell, K. Mukai, and
P. Szkody for helpful discussions. Dispensation to schedulethe EUVE observations during the ASCA observations waskindly granted by EUVE Project Scientist R. Malina. TheEUVE observations were scheduled and performed byEUVE Science Planner M. Eckert, the staff of the EUVEScience Operations Center at CEA, and the Flight Opera-tions Team at Goddard Space Flight Center. We acknowl-edge with thanks the use in this research of INES data fromthe IUE satellite. The manuscript was improved by the com-ments and suggestions of the anonymous referee. This workwas performed under the auspices of the US Department ofEnergy by University of California Lawrence LivermoreNational Laboratory under contractW-7405-Eng-48.
REFERENCES
Abbott, M. J., Boyd, W. T., Jelinsky, P., Christian, C., Miller-Bagwell, A.,Lampton,M.,Malina, R. F., & Vallerga, J. V. 1996, ApJS, 107, 451
Bowyer, S., & Malina, R. F. 1991, in Extreme Ultraviolet Astronomy, ed.R. F.Malina & S. Bowyer (NewYork: Pergamon), 397
Cropper, M. 1988,MNRAS, 231, 597———. 1989,MNRAS, 236, 935Cropper, M.,Menzies, J.W., & Tapia, S. 1986,MNRAS, 218, 201Cropper, M., Wu, K., Ramsay, G., & Kocabiyik, A. 1999, MNRAS, 306,684
Ferrario, L., Wickramasinghe, D. T., Bailey, J., Hough, J. H., & Tuohy,I. R. 1992,MNRAS, 256, 252
Fitzpatrick, E. L. 1999, PASP, 111, 63Harrop-Allin, M. K., Cropper, M., Hakala, P. J., Hellier, C., & Ramseyer,T. 1999,MNRAS, 308, 807
Hubeny, I., & Lanz, T. 1995, ApJ, 439, 875Ishida,M., & Fujimoto, R. 1999, Astron. Nachr., 320, 352Kube, J., Gansicke, B. T., & Beuermann, K. 2000, A&A, 356, 490Maraschi, L., Treves, A., Tanzi, E. G., Mouchet, M., Lauberts, A., Motch,C., Bonnet-Bidaud, J.M., & Phillips, M.M. 1984, ApJ, 285, 214
Mason, K. O., Middleditch, J., Cordova, F. A., Jensen, K. A., Reichert, G.,Murdin, P. G., Clark, D., & Bowyer, S. 1983, ApJ, 264, 575
Mauche, C.W. 1999, in ASPConf. Ser. 157, AnnapolisWorkshop onMag-netic Cataclysmic Variables, ed. C. Hellier & K. Mukai (San Francisco:ASP), 157
Nousek, J. A., & Pravdo, S. H. 1983, ApJ, 266, L39Paerels, F., Hur,M. Y.,Mauche, C.W., &Heise, J. 1996, ApJ, 464, 884Puchnarewicz, E. M., Mason, K. O., Murdin, P. G., & Wickramasinghe,D. T. 1990,MNRAS, 244, 20P
Ramsay, G. 2000,MNRAS, 314, 403Rosen, S. R.,Mason, K. O., & Cordova, F. A. 1987,MNRAS, 224, 987Rumph, T., Bowyer, S., & Vennes, S. 1994, AJ, 107, 2108Sambruna, R. M., Chiappetti, L., Treves, A., Bonnet-Bidaud, J. M.,Bouchet, P., Maraschi, L., Motch, C., & Mouchet, M. 1991, ApJ, 374,744
Sambruna, R. M., Parmar, A. N., Chiappetti, L., Maraschi, L., & Treves,A. 1994, ApJ, 424, 947
Schwope, A. D., & Beuermann, K. 1990, A&A, 238, 173Schwope, A. D., Thomas, H.-C., Beuermann, K., & Reinsch, K. 1993,A&A, 267, 103
Sirk,M.M., &Howell, S. B. 1998, ApJ, 506, 824Sirk, M. M., Vallerga, J. V., Finley, D. S., Jelinsky, P., & Malina, R. F.1997, ApJS, 110, 347
Takalo, L. O., &Nousek, J. A. 1988, ApJ, 327, 328Terada, Y., Ishida, M., Makishima, K., Imanari, T., Fujimoto, R.,Matsuzaki, K., &Kaneda, H. 2001,MNRAS, 328, 112
van Teeseling, A., Heise, J., & Paerels, F. 1994, A&A, 281, 119
No. 1, 2002 EUVE SPECTROSCOPY OF V834 CEN 449