extreme linux performance monitoring part ii
TRANSCRIPT
Extreme Linux Performance Monitoring Part II
I. Introducing IO Monitoring
Disk IO subsystems are the slowest part of any Linux system. This is due mainly to their distance from the CPU and the fact that disks require the physics to work (rotation and seek). If the time taken to access disk as opposed to memory was converted into minutes and seconds, it is the difference between 7 days and 7 minutes. As a result, it is essential that the Linux kernel minimizes the amount of IO it generates on a disk. The following subsections describe the different ways the kernel processes data IO from disk to memory and back.
Reading and Writing Data Memory Pages
The Linux kernel breaks disk IO into pages. The default page size on most Linux systems is 4K. It reads and w rites disk blocks in and out of memory in 4K page sizes. You can check the page size of your system by using the time command in verbose mode and searching for the page size:
# /usr/bin/time -v date
<snip>
Page size (bytes): 4096
<snip>
Major and Minor Page Faults
Linux, like most UNIX systems, uses a virtual memory layer that maps into physical address space. This mapping is "on demand" in the sense that when a process starts, the kernel only maps that which is required. When an application starts, the kernel searches the CPU caches and then physical memory. If the data does not exist in either, the kernel issues a major page fault (MPF). A MPF is a request to the disk subsystem to retrieve pages off disk and buffer them in RAM. Once memory pages are mapped into the buffer cache, the kernel will attempt to use these pages resulting in a minor page fault (MnPF). A MnPF saves the kernel time by reusing a page in memory as opposed to placing it back on the disk.
In the following example, the time command is used to demonstrate how many MPF and MnPF occurred when an application started. The first time the application starts, there are many MPFs:
# /usr/bin/time -v evolution
<snip>
Major (requiring I/O) page faults: 163Minor (reclaiming a frame) page faults: 5918
<snip>
© 2007 Darren Hoch [email protected] 1
Extreme Linux Performance Monitoring Part II
The second time evolution starts, the kernel does not issue any MPFs because the application is in memory already:
# /usr/bin/time -v evolution
<snip>
Major (requiring I/O) page faults: 0Minor (reclaiming a frame) page faults: 5581
<snip>
The File Buffer Cache
The file buffer cache is used by the kernel to minimize MPFs and maximize MnPFs. As a system generates IO over time, this buffer cache will continue to grow as the system will leave these pages in memory until memory gets low and the kernel needs to "free" some of these pages for other uses. The end result is that many system administrators see low amounts of free memory and become concerned when in reality, the system is just making good use of its caches.
The following output is taken from the /proc/meminfo file:
# cat /proc/meminfoMemTotal: 2075672 kBMemFree: 52528 kBBuffers: 24596 kBCached: 1766844 kB
<snip>
The system has a total of 2 GB (MemTotal) of RAM available on it. There is currently 52 MB of RAM "free" (MemFree), 24 MB RAM that is allocated to disk write operations (Buffers), and 1.7 GB of pages read from disk in RAM (Cached). The kernel is using these via the MnPF mechanism as opposed to pulling all of these pages in from disk. It is impossible to tell from these statistics whether or not the system is under distress as we only have part of the picture.
Types of Memory Pages
There are 3 types of memory pages in the Linux kernel. These pages are described below:
Read Pages These are pages of data read in via disk (MPF) that are read only and backed on disk. These pages exist in the Buffer Cache and include static files, binaries, and libraries that do not change. The Kernel will continue to page these into memory as it needs them. If memory becomes short, the kernel will "steal" these pages and put them back on the free list causing an application to have to MPF to bring them back in.
Dirty Pages These are pages of data that have been modified by the kernel while in memory. These pages need to be synced back to disk at some point using the pdflush daemon. In the event of a memory shortage, kswapd (along with pdflush) will write these pages to disk in order to make more room in memory.
Anonymous Pages These are pages of data that do belong to a process, but do not have any file or backing store associated with them. They can't be synchronized back to disk. In the event of a memory shortage, kswapd writes these to the swap device as temporary storage until more RAM is free ("swapping" pages).
© 2007 Darren Hoch [email protected] 2
Extreme Linux Performance Monitoring Part II
Writing Data Pages Back to Disk
Applications themselves may choose to write dirty pages back to disk immediately using the fsync() or sync() system calls. These system calls issue a direct request to the IO scheduler. If an application does not invoke these system calls, the pdflush kernel daemon runs at periodic intervals and writes pages back to disk.
# ps -ef | grep pdflushroot 186 6 0 18:04 ? 00:00:00 [pdflush]
II. Monitoring IO
Certain conditions occur on a system that create IO bottlenecks. These conditions may be identified by using a standard set of system monitoring tools. These tools include top, vmstat, iostat, and sar. There are some similarities between the output of these commands, but for the most part, each offers a unique set of output that provides a different aspect on performance. The following subsections describe conditions that cause IO bottlenecks.
Condition 1: CPU Wait on IO Too Much IO at Once
In an ideal environment, a CPU splits a percentage of its time between user (65%), kernel (30%) and idle (5%). If IO starts to cause a bottleneck on the system, a new condition called "Wait on IO" (WIO) appears in CPU performance statistics. A WIO condition occurs when a CPU is completely idle because all runnable processes are waiting on IO. This means that all applications are in a sleep state because they are waiting for requests to complete in the IO subsystem.
The vmstat command provides WIO statistics in the last 4 fields of output under the "cpu" header.
# vmstat 1procs -----------memory---------- ---swap-- -----io---- --system-- ----cpu---- r b swpd free buff cache si so bi bo in cs us sy id wa 3 2 0 55452 9236 1739020 0 0 9352 0 2580 8771 20 24 0 57 2 3 0 53888 9232 1740836 0 0 14860 0 2642 8954 23 25 0 52 2 2 0 51856 9212 1742928 0 0 12688 0 2636 8487 23 25 0 52
These last 4 columns provide percentages of CPU utilization for user (us), kernel (sys), idle (id), and WIO (wa). In the previous output, the CPU averages 50% idle waiting on IO requests to complete. This means that there is 50% of the processor that is usable for executing applications, but no applications can execute because the kernel is waiting on IO requests to complete. You can observe this in the blocked threads column (b).
It is also worth noting that the major cause of the IO bottleneck is disk reads due to the large amount of disk blocks read into memory (bi). There is no data being written out to disk as the blocks out (bo) column has a zero value. From this output alone, it appears that the system is processing a large IO request.
The sar command without any options also provides CPU percentages that include WIO (%iowait) percentages:
# sar 1 10007:25:55 PM CPU %user %nice %system %iowait %idle07:25:56 PM all 74.26 0.00 25.74 0.00 0.0007:25:57 PM all 52.00 0.00 31.00 16.00 1.0007:25:58 PM all 12.87 0.00 13.86 73.27 0.00
© 2007 Darren Hoch [email protected] 3
Extreme Linux Performance Monitoring Part II
The sar command with the -B option provides statistics on kilobytes read (pgpgin/s) and written out (pgpgout/s) of memory that may be correlated with the bi and bo columns of vmstat. The sar -B command also shows MnPF (fault/s) and MPF statistics (majflt/s).
# sar -B 1 10007:28:23 PM pgpgin/s pgpgout/s fault/s majflt/s07:28:24 PM 6653.47 463.37 1604.95 74.2607:28:25 PM 7448.00 96.00 2061.00 79.0007:28:26 PM 4190.10 118.81 723.76 30.6907:28:27 PM 2966.34 146.53 525.74 9.9007:28:28 PM 3728.00 0.00 146.00 6.0007:28:29 PM 5244.00 580.00 927.00 39.00 There is no exact tool that can identify which application is causing the IO read requests. The top tool can provide enough insight to make an educated guess. Start the top command with a delay of 1 second:
# top -d 1
Once top is running, sort the output by faults (MPF and MnPF) by typing "F" to bring up the sort menu and "u" to sort by faults.
# top -d 1
top - 19:45:07 up 1:40, 3 users, load average: 6.36, 5.87, 4.40Tasks: 119 total, 3 running, 116 sleeping, 0 stopped, 0 zombieCpu(s): 5.9% us, 87.1% sy, 0.0% ni, 0.0% id, 5.9% wa, 1.0% hi, 0.0% siMem: 2075672k total, 2022668k used, 53004k free, 7156k buffersSwap: 2031608k total, 132k used, 2031476k free, 1709372k cached
PID USER PR NI VIRT RES SHR S %CPU %MEM TIME+ nFLT COMMAND 3069 root 5 -10 450m 303m 280m S 61.5 15.0 10:56.68 4562 vmware-vmx 3016 root 5 -10 447m 300m 280m S 21.8 14.8 12:22.83 3978 vmware-vmx 3494 root 5 -10 402m 255m 251m S 3.0 12.6 1:08.65 3829 vmware-vmx 3624 root 5 -10 401m 256m 251m S 1.0 12.6 0:29.92 3747 vmware-vmx
<snip>
The previous output demonstrates that a series of VMWare process are causing the majority of page faults (nFLT) which would contribute to the surge of read requests seen in the previous commands. This surge has caused the WIO condition on the system, rendering the CPU idle and causing the system to appear much slower.
Condition 2: Pipes Too Small Read and Write Efficiency
Every IO request to a disk takes a certain amount of time. This is due primarily to the fact that a disk must spin and a head must seek. The spinning of a disk is often referred to as "rotational delay" (RD) and the moving of the head as a "disk seek" (DS). The time it takes for each IO request is calculated by adding DS and RD.
A disk's RD is fixed based on the RPM of the drive. An RD is considered half a revolution around a disk. To calculate RD for a 10K RPM drive, perform the following:
1. Divide 10000 RPM by 60 seconds (10000/60 = 166 RPS)
© 2007 Darren Hoch [email protected] 4
Extreme Linux Performance Monitoring Part II
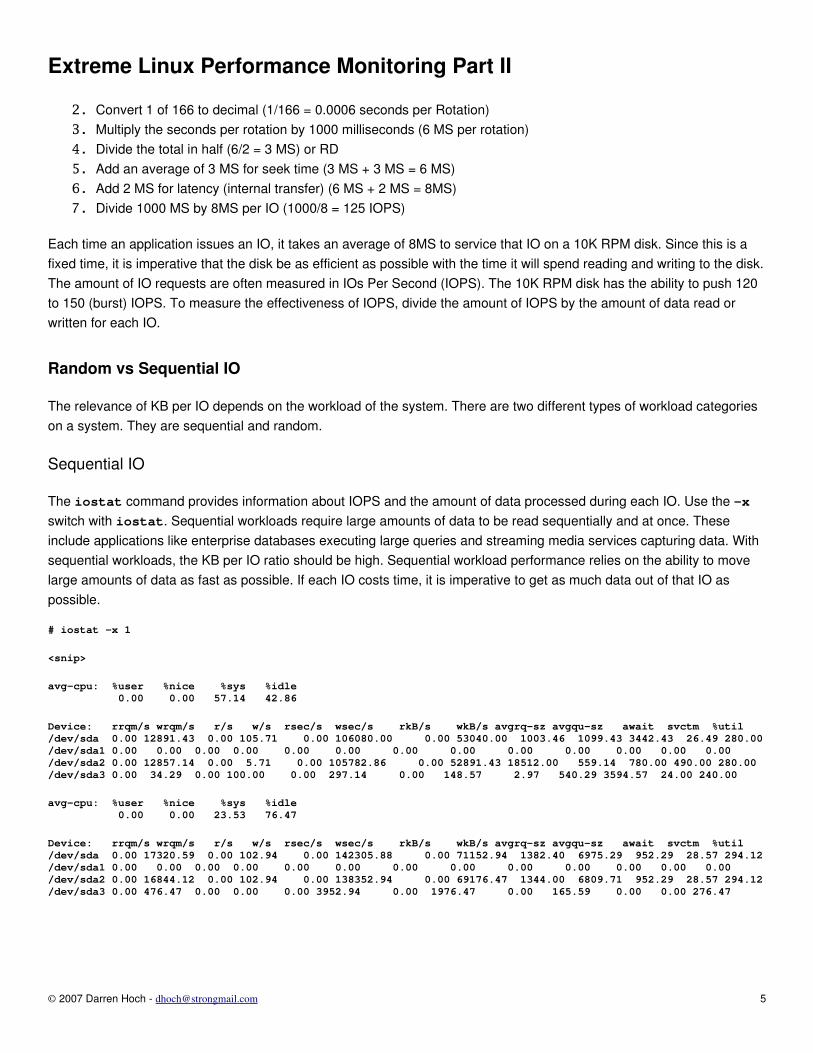
2. Convert 1 of 166 to decimal (1/166 = 0.0006 seconds per Rotation)3. Multiply the seconds per rotation by 1000 milliseconds (6 MS per rotation)4. Divide the total in half (6/2 = 3 MS) or RD5. Add an average of 3 MS for seek time (3 MS + 3 MS = 6 MS)6. Add 2 MS for latency (internal transfer) (6 MS + 2 MS = 8MS)7. Divide 1000 MS by 8MS per IO (1000/8 = 125 IOPS)
Each time an application issues an IO, it takes an average of 8MS to service that IO on a 10K RPM disk. Since this is a fixed time, it is imperative that the disk be as efficient as possible with the time it will spend reading and writing to the disk. The amount of IO requests are often measured in IOs Per Second (IOPS). The 10K RPM disk has the ability to push 120 to 150 (burst) IOPS. To measure the effectiveness of IOPS, divide the amount of IOPS by the amount of data read or written for each IO.
Random vs Sequential IO
The relevance of KB per IO depends on the workload of the system. There are two different types of workload categories on a system. They are sequential and random.
Sequential IO
The iostat command provides information about IOPS and the amount of data processed during each IO. Use the -x switch with iostat. Sequential workloads require large amounts of data to be read sequentially and at once. These include applications like enterprise databases executing large queries and streaming media services capturing data. With sequential workloads, the KB per IO ratio should be high. Sequential workload performance relies on the ability to move large amounts of data as fast as possible. If each IO costs time, it is imperative to get as much data out of that IO as possible.
# iostat -x 1
<snip>
avg-cpu: %user %nice %sys %idle 0.00 0.00 57.14 42.86
Device: rrqm/s wrqm/s r/s w/s rsec/s wsec/s rkB/s wkB/s avgrq-sz avgqu-sz await svctm %util/dev/sda 0.00 12891.43 0.00 105.71 0.00 106080.00 0.00 53040.00 1003.46 1099.43 3442.43 26.49 280.00/dev/sda1 0.00 0.00 0.00 0.00 0.00 0.00 0.00 0.00 0.00 0.00 0.00 0.00 0.00/dev/sda2 0.00 12857.14 0.00 5.71 0.00 105782.86 0.00 52891.43 18512.00 559.14 780.00 490.00 280.00/dev/sda3 0.00 34.29 0.00 100.00 0.00 297.14 0.00 148.57 2.97 540.29 3594.57 24.00 240.00
avg-cpu: %user %nice %sys %idle 0.00 0.00 23.53 76.47
Device: rrqm/s wrqm/s r/s w/s rsec/s wsec/s rkB/s wkB/s avgrq-sz avgqu-sz await svctm %util/dev/sda 0.00 17320.59 0.00 102.94 0.00 142305.88 0.00 71152.94 1382.40 6975.29 952.29 28.57 294.12/dev/sda1 0.00 0.00 0.00 0.00 0.00 0.00 0.00 0.00 0.00 0.00 0.00 0.00 0.00/dev/sda2 0.00 16844.12 0.00 102.94 0.00 138352.94 0.00 69176.47 1344.00 6809.71 952.29 28.57 294.12/dev/sda3 0.00 476.47 0.00 0.00 0.00 3952.94 0.00 1976.47 0.00 165.59 0.00 0.00 276.47
© 2007 Darren Hoch [email protected] 5
Extreme Linux Performance Monitoring Part II
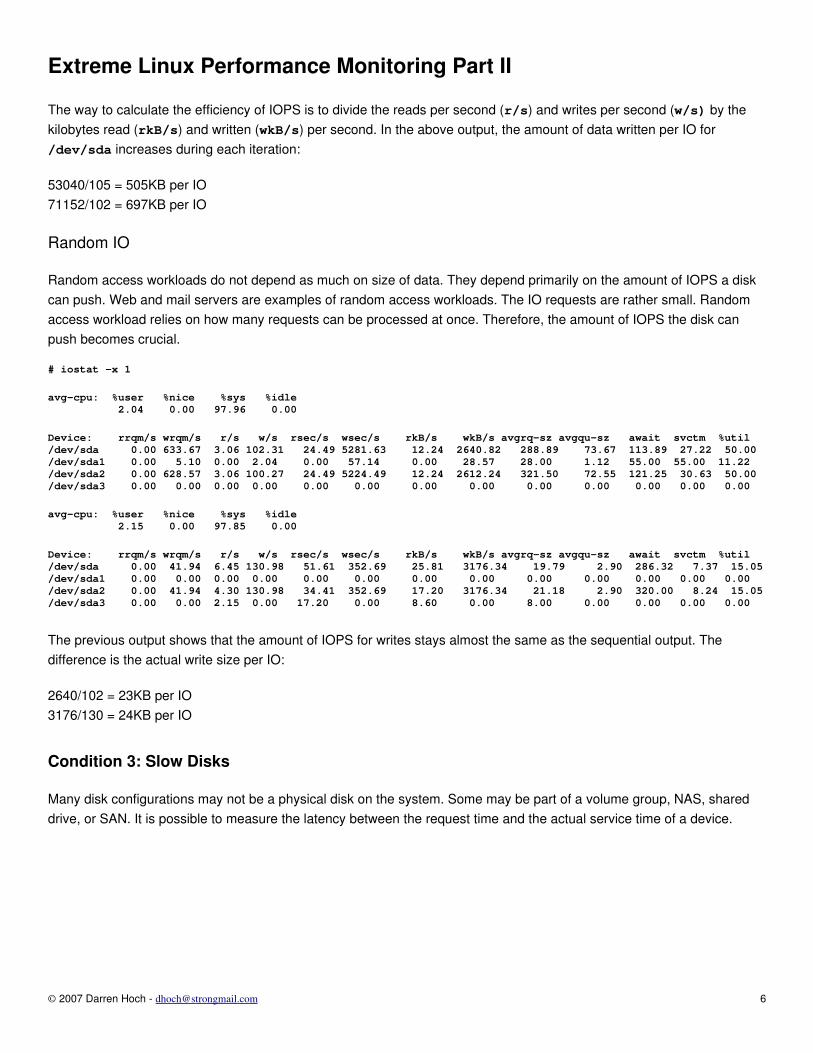
The way to calculate the efficiency of IOPS is to divide the reads per second (r/s) and writes per second (w/s) by the kilobytes read (rkB/s) and written (wkB/s) per second. In the above output, the amount of data written per IO for /dev/sda increases during each iteration:
53040/105 = 505KB per IO71152/102 = 697KB per IO
Random IO
Random access workloads do not depend as much on size of data. They depend primarily on the amount of IOPS a disk can push. Web and mail servers are examples of random access workloads. The IO requests are rather small. Random access workload relies on how many requests can be processed at once. Therefore, the amount of IOPS the disk can push becomes crucial.
# iostat -x 1
avg-cpu: %user %nice %sys %idle 2.04 0.00 97.96 0.00
Device: rrqm/s wrqm/s r/s w/s rsec/s wsec/s rkB/s wkB/s avgrq-sz avgqu-sz await svctm %util/dev/sda 0.00 633.67 3.06 102.31 24.49 5281.63 12.24 2640.82 288.89 73.67 113.89 27.22 50.00/dev/sda1 0.00 5.10 0.00 2.04 0.00 57.14 0.00 28.57 28.00 1.12 55.00 55.00 11.22/dev/sda2 0.00 628.57 3.06 100.27 24.49 5224.49 12.24 2612.24 321.50 72.55 121.25 30.63 50.00/dev/sda3 0.00 0.00 0.00 0.00 0.00 0.00 0.00 0.00 0.00 0.00 0.00 0.00 0.00
avg-cpu: %user %nice %sys %idle 2.15 0.00 97.85 0.00
Device: rrqm/s wrqm/s r/s w/s rsec/s wsec/s rkB/s wkB/s avgrq-sz avgqu-sz await svctm %util/dev/sda 0.00 41.94 6.45 130.98 51.61 352.69 25.81 3176.34 19.79 2.90 286.32 7.37 15.05/dev/sda1 0.00 0.00 0.00 0.00 0.00 0.00 0.00 0.00 0.00 0.00 0.00 0.00 0.00/dev/sda2 0.00 41.94 4.30 130.98 34.41 352.69 17.20 3176.34 21.18 2.90 320.00 8.24 15.05/dev/sda3 0.00 0.00 2.15 0.00 17.20 0.00 8.60 0.00 8.00 0.00 0.00 0.00 0.00
The previous output shows that the amount of IOPS for writes stays almost the same as the sequential output. The difference is the actual write size per IO:
2640/102 = 23KB per IO3176/130 = 24KB per IO
Condition 3: Slow Disks
Many disk configurations may not be a physical disk on the system. Some may be part of a volume group, NAS, shared drive, or SAN. It is possible to measure the latency between the request time and the actual service time of a device.
© 2007 Darren Hoch [email protected] 6
Extreme Linux Performance Monitoring Part II
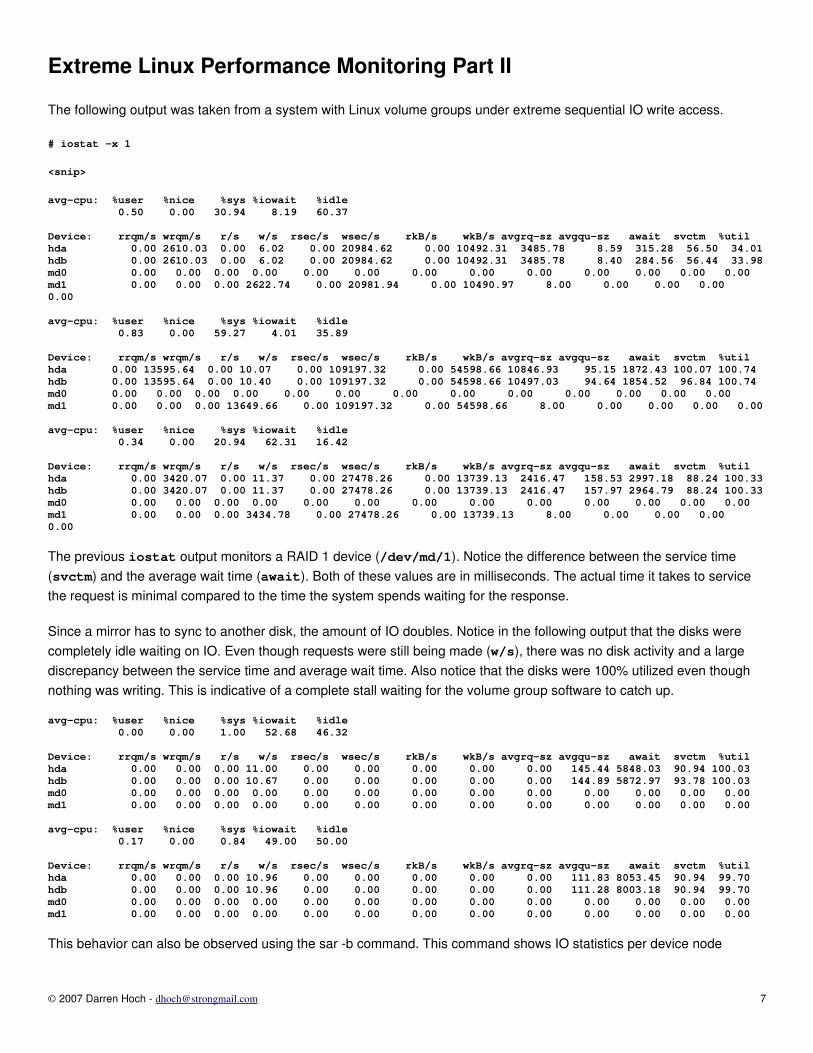
The following output was taken from a system with Linux volume groups under extreme sequential IO write access.
# iostat -x 1
<snip>
avg-cpu: %user %nice %sys %iowait %idle 0.50 0.00 30.94 8.19 60.37
Device: rrqm/s wrqm/s r/s w/s rsec/s wsec/s rkB/s wkB/s avgrq-sz avgqu-sz await svctm %utilhda 0.00 2610.03 0.00 6.02 0.00 20984.62 0.00 10492.31 3485.78 8.59 315.28 56.50 34.01hdb 0.00 2610.03 0.00 6.02 0.00 20984.62 0.00 10492.31 3485.78 8.40 284.56 56.44 33.98md0 0.00 0.00 0.00 0.00 0.00 0.00 0.00 0.00 0.00 0.00 0.00 0.00 0.00md1 0.00 0.00 0.00 2622.74 0.00 20981.94 0.00 10490.97 8.00 0.00 0.00 0.00 0.00
avg-cpu: %user %nice %sys %iowait %idle 0.83 0.00 59.27 4.01 35.89
Device: rrqm/s wrqm/s r/s w/s rsec/s wsec/s rkB/s wkB/s avgrq-sz avgqu-sz await svctm %utilhda 0.00 13595.64 0.00 10.07 0.00 109197.32 0.00 54598.66 10846.93 95.15 1872.43 100.07 100.74hdb 0.00 13595.64 0.00 10.40 0.00 109197.32 0.00 54598.66 10497.03 94.64 1854.52 96.84 100.74md0 0.00 0.00 0.00 0.00 0.00 0.00 0.00 0.00 0.00 0.00 0.00 0.00 0.00md1 0.00 0.00 0.00 13649.66 0.00 109197.32 0.00 54598.66 8.00 0.00 0.00 0.00 0.00
avg-cpu: %user %nice %sys %iowait %idle 0.34 0.00 20.94 62.31 16.42
Device: rrqm/s wrqm/s r/s w/s rsec/s wsec/s rkB/s wkB/s avgrq-sz avgqu-sz await svctm %utilhda 0.00 3420.07 0.00 11.37 0.00 27478.26 0.00 13739.13 2416.47 158.53 2997.18 88.24 100.33hdb 0.00 3420.07 0.00 11.37 0.00 27478.26 0.00 13739.13 2416.47 157.97 2964.79 88.24 100.33md0 0.00 0.00 0.00 0.00 0.00 0.00 0.00 0.00 0.00 0.00 0.00 0.00 0.00md1 0.00 0.00 0.00 3434.78 0.00 27478.26 0.00 13739.13 8.00 0.00 0.00 0.00 0.00
The previous iostat output monitors a RAID 1 device (/dev/md/1). Notice the difference between the service time (svctm) and the average wait time (await). Both of these values are in milliseconds. The actual time it takes to service the request is minimal compared to the time the system spends waiting for the response.
Since a mirror has to sync to another disk, the amount of IO doubles. Notice in the following output that the disks were completely idle waiting on IO. Even though requests were still being made (w/s), there was no disk activity and a large discrepancy between the service time and average wait time. Also notice that the disks were 100% utilized even though nothing was writing. This is indicative of a complete stall waiting for the volume group software to catch up.
avg-cpu: %user %nice %sys %iowait %idle 0.00 0.00 1.00 52.68 46.32
Device: rrqm/s wrqm/s r/s w/s rsec/s wsec/s rkB/s wkB/s avgrq-sz avgqu-sz await svctm %utilhda 0.00 0.00 0.00 11.00 0.00 0.00 0.00 0.00 0.00 145.44 5848.03 90.94 100.03hdb 0.00 0.00 0.00 10.67 0.00 0.00 0.00 0.00 0.00 144.89 5872.97 93.78 100.03md0 0.00 0.00 0.00 0.00 0.00 0.00 0.00 0.00 0.00 0.00 0.00 0.00 0.00md1 0.00 0.00 0.00 0.00 0.00 0.00 0.00 0.00 0.00 0.00 0.00 0.00 0.00
avg-cpu: %user %nice %sys %iowait %idle 0.17 0.00 0.84 49.00 50.00
Device: rrqm/s wrqm/s r/s w/s rsec/s wsec/s rkB/s wkB/s avgrq-sz avgqu-sz await svctm %utilhda 0.00 0.00 0.00 10.96 0.00 0.00 0.00 0.00 0.00 111.83 8053.45 90.94 99.70hdb 0.00 0.00 0.00 10.96 0.00 0.00 0.00 0.00 0.00 111.28 8003.18 90.94 99.70md0 0.00 0.00 0.00 0.00 0.00 0.00 0.00 0.00 0.00 0.00 0.00 0.00 0.00md1 0.00 0.00 0.00 0.00 0.00 0.00 0.00 0.00 0.00 0.00 0.00 0.00 0.00
This behavior can also be observed using the sar b command. This command shows IO statistics per device node
© 2007 Darren Hoch [email protected] 7
Extreme Linux Performance Monitoring Part II
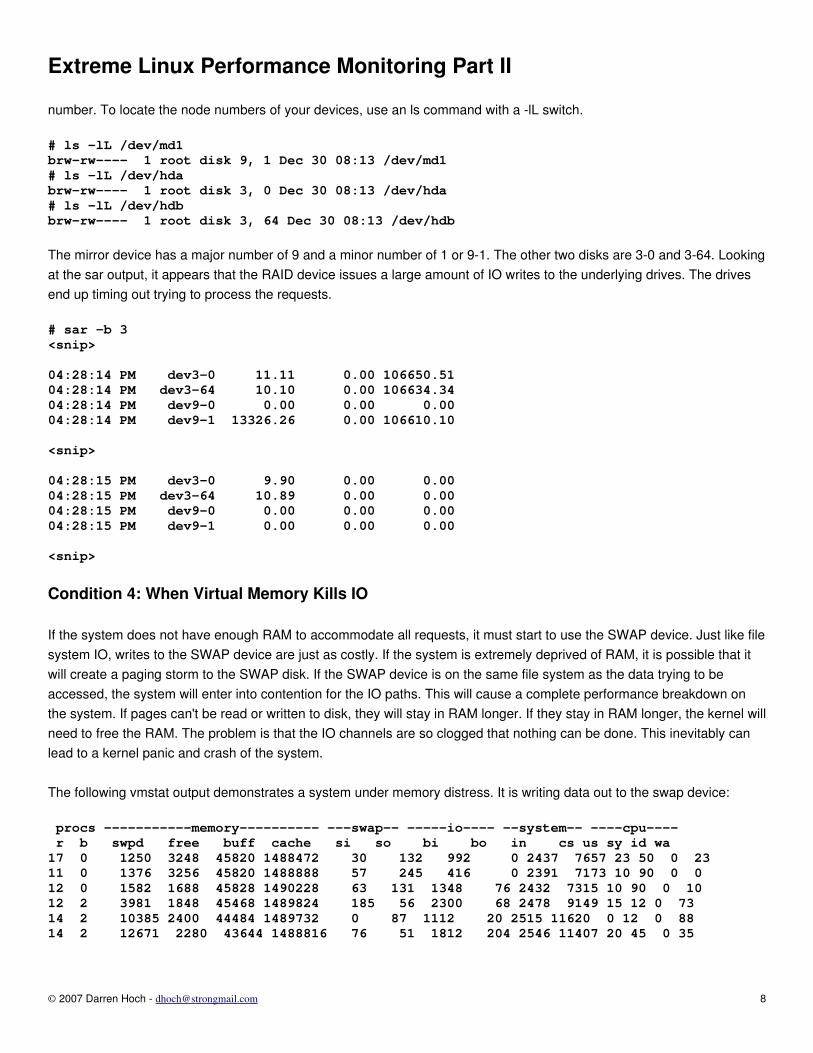
number. To locate the node numbers of your devices, use an ls command with a lL switch.
# ls -lL /dev/md1brw-rw---- 1 root disk 9, 1 Dec 30 08:13 /dev/md1# ls -lL /dev/hdabrw-rw---- 1 root disk 3, 0 Dec 30 08:13 /dev/hda# ls -lL /dev/hdbbrw-rw---- 1 root disk 3, 64 Dec 30 08:13 /dev/hdb
The mirror device has a major number of 9 and a minor number of 1 or 91. The other two disks are 30 and 364. Looking at the sar output, it appears that the RAID device issues a large amount of IO writes to the underlying drives. The drives end up timing out trying to process the requests.
# sar -b 3<snip>
04:28:14 PM dev3-0 11.11 0.00 106650.5104:28:14 PM dev3-64 10.10 0.00 106634.3404:28:14 PM dev9-0 0.00 0.00 0.0004:28:14 PM dev9-1 13326.26 0.00 106610.10
<snip>
04:28:15 PM dev3-0 9.90 0.00 0.0004:28:15 PM dev3-64 10.89 0.00 0.0004:28:15 PM dev9-0 0.00 0.00 0.0004:28:15 PM dev9-1 0.00 0.00 0.00
<snip>
Condition 4: When Virtual Memory Kills IO
If the system does not have enough RAM to accommodate all requests, it must start to use the SWAP device. Just like file system IO, writes to the SWAP device are just as costly. If the system is extremely deprived of RAM, it is possible that it will create a paging storm to the SWAP disk. If the SWAP device is on the same file system as the data trying to be accessed, the system will enter into contention for the IO paths. This will cause a complete performance breakdown on the system. If pages can't be read or written to disk, they will stay in RAM longer. If they stay in RAM longer, the kernel will need to free the RAM. The problem is that the IO channels are so clogged that nothing can be done. This inevitably can lead to a kernel panic and crash of the system.
The following vmstat output demonstrates a system under memory distress. It is writing data out to the swap device:
procs -----------memory---------- ---swap-- -----io---- --system-- ----cpu---- r b swpd free buff cache si so bi bo in cs us sy id wa17 0 1250 3248 45820 1488472 30 132 992 0 2437 7657 23 50 0 2311 0 1376 3256 45820 1488888 57 245 416 0 2391 7173 10 90 0 012 0 1582 1688 45828 1490228 63 131 1348 76 2432 7315 10 90 0 1012 2 3981 1848 45468 1489824 185 56 2300 68 2478 9149 15 12 0 7314 2 10385 2400 44484 1489732 0 87 1112 20 2515 11620 0 12 0 8814 2 12671 2280 43644 1488816 76 51 1812 204 2546 11407 20 45 0 35
© 2007 Darren Hoch [email protected] 8
Extreme Linux Performance Monitoring Part II
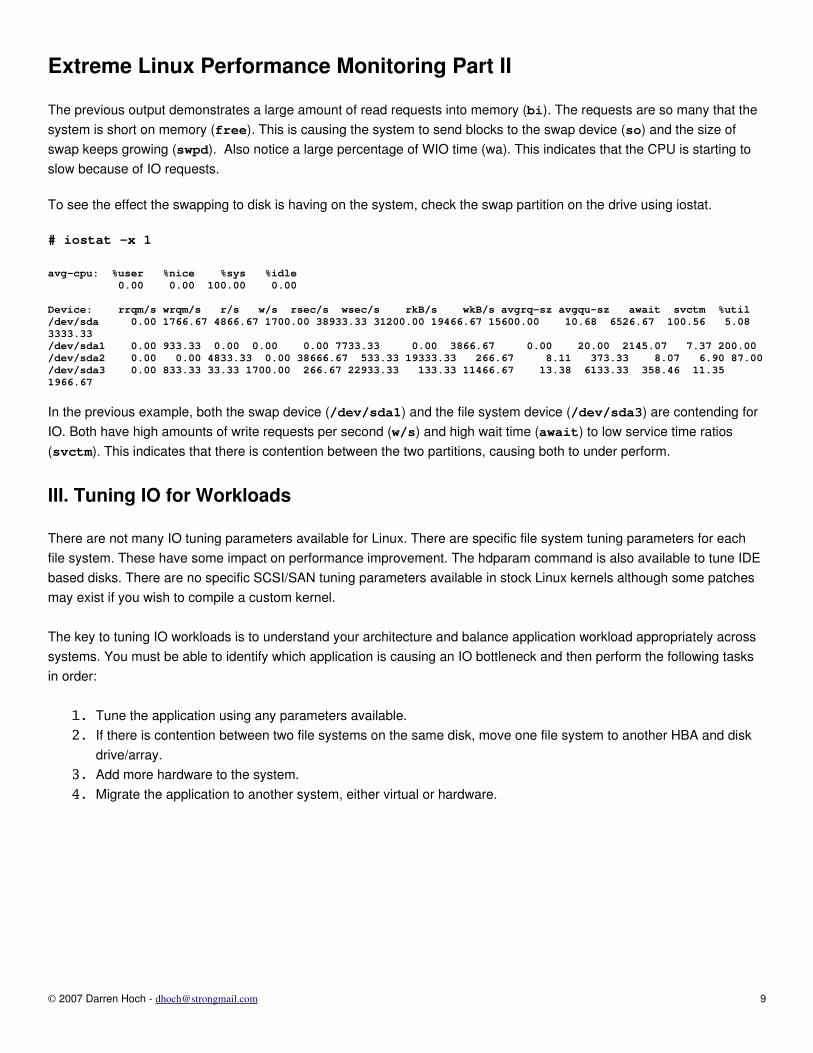
The previous output demonstrates a large amount of read requests into memory (bi). The requests are so many that the system is short on memory (free). This is causing the system to send blocks to the swap device (so) and the size of swap keeps growing (swpd). Also notice a large percentage of WIO time (wa). This indicates that the CPU is starting to slow because of IO requests.
To see the effect the swapping to disk is having on the system, check the swap partition on the drive using iostat.
# iostat -x 1
avg-cpu: %user %nice %sys %idle 0.00 0.00 100.00 0.00
Device: rrqm/s wrqm/s r/s w/s rsec/s wsec/s rkB/s wkB/s avgrq-sz avgqu-sz await svctm %util/dev/sda 0.00 1766.67 4866.67 1700.00 38933.33 31200.00 19466.67 15600.00 10.68 6526.67 100.56 5.08 3333.33/dev/sda1 0.00 933.33 0.00 0.00 0.00 7733.33 0.00 3866.67 0.00 20.00 2145.07 7.37 200.00/dev/sda2 0.00 0.00 4833.33 0.00 38666.67 533.33 19333.33 266.67 8.11 373.33 8.07 6.90 87.00/dev/sda3 0.00 833.33 33.33 1700.00 266.67 22933.33 133.33 11466.67 13.38 6133.33 358.46 11.35 1966.67
In the previous example, both the swap device (/dev/sda1) and the file system device (/dev/sda3) are contending for IO. Both have high amounts of write requests per second (w/s) and high wait time (await) to low service time ratios (svctm). This indicates that there is contention between the two partitions, causing both to under perform.
III. Tuning IO for Workloads
There are not many IO tuning parameters available for Linux. There are specific file system tuning parameters for each file system. These have some impact on performance improvement. The hdparam command is also available to tune IDE based disks. There are no specific SCSI/SAN tuning parameters available in stock Linux kernels although some patches may exist if you wish to compile a custom kernel.
The key to tuning IO workloads is to understand your architecture and balance application workload appropriately across systems. You must be able to identify which application is causing an IO bottleneck and then perform the following tasks in order:
1. Tune the application using any parameters available.2. If there is contention between two file systems on the same disk, move one file system to another HBA and disk
drive/array.3. Add more hardware to the system.4. Migrate the application to another system, either virtual or hardware.
© 2007 Darren Hoch [email protected] 9
Extreme Linux Performance Monitoring Part II
References
● Ezlot, Phillip – Optimizing Linux Performance, Prentice Hall, Princeton NJ 2005 ISBN – 0131486829● Johnson, Sandra K., Huizenga, Gerrit – Performance Tuning for Linux Servers, IBM Press, Upper Saddle River
NJ 2005 ISBN 013144753X● Hoch, Darren – Extreme Linux Monitoring Part I, http://www.ufsdump.org 2006
© 2007 Darren Hoch [email protected] 10