extraction of free fatty acids from soybean oil using ionic liquids or poly(ethyleneglycol)s
TRANSCRIPT
Extraction of Free Fatty Acids from SoybeanOil Using Ionic Liquids orPoly(ethyleneglycol)s
Marina S. Manic, Vesna Najdanovic-Visak and Manuel Nunes da PonteREQUIMTE, Departamento de Quımica, Faculdade de Ciencias e Tecnologia, Universidade Nova de Lisboa,
Quinta da Torre, Caparica 2829-516, Portugal
Zoran P. VisakCentro de Quımica Estrutural, Instituto Superior Tecnico, Avenida Rovisco Pais, Lisboa 1049-001, Portugal
DOI 10.1002/aic.12349Published online August 3, 2010 in Wiley Online Library (wileyonlinelibrary.com).
The alternative solvents poly(ethyleneglycol)s (PEGs) with various molar massesand room temperature ionic liquids (RTILs) AMMOENG100 and 1-butyl-3-methylimi-dazolium dicyanamide (bmimDCA) were studied for the purpose of extraction of lino-leic acid from soybean oil. Liquid-liquid phase equilibrium was measured for binary(PEG þ soybean oil), (RTIL þ soybean oil) as well as ternary (PEG þ soybean oil þlinoleic acid), (RTIL þ soybean oil þ linoleic acid) mixtures, as a function of temper-ature and composition. The influence on distribution coefficients and separation factorof temperature, initial acid content of the oil and solvent to oil ratio were studied. Theeffect of molar mass in the case of the PEGs was also examined. The experimentalresults were modeled using the Peng-Robinson cubic equation of state coupled withthe Mathias-Klotz-Prausnitz mixing rule, with good results. VVC 2010 American Institute of
Chemical Engineers AIChE J, 57: 1344–1355, 2011
Keywords: ionic liquids, PEGs, vegetable oils, deacidification
Introduction
The presence of free fatty acids (FFAs) in vegetable oilsis undesirable for both biodiesel and food oil productions.The most common way to produce biodiesel is through thetransesterification of vegetable oils with an alcohol, yieldingfatty acid alkyl esters and glycerol.1 Commercial processesuse alkaline catalysts NaOH or KOH, which are relativelyinexpensive. However, vegetable oils contain a considerablequantity of FFAs that react with the alkaline catalyst to formsoap, reducing the ester yield. In respect to fat containing
food, the presence of FFAs is associated to an undesirablerancid flavor. The deacidification process determines thequality of oil, having, thus, a major economic impact on oilproduction. The removal of FFAs from crude oils representsthe most important stage in their refining cycle.
Conventional methods for FFA removal present variouslimitations. A typical chemical deacidification may lead toan excessive loss of neutral oil with high FFA content aswell as to production of low commercial value soap stock.Physical deacidification methods, although suitable for highFFA content oils, require pretreatments that are performedunder very harsh conditions—high temperatures and highvacuum. The latter cause thermal polymerization and decom-position of high value oil constituents. According to Leibo-vitz and Ruckenstein,2 chemical deacidification of crude
Correspondence concerning this article should be addressed to V. Najdanovic-Visak at [email protected].
VVC 2010 American Institute of Chemical Engineers
1344 AIChE JournalMay 2011 Vol. 57, No. 5
THERMODYNAMICS
corn oil with FFA content between 8.4 and 14% resulted inneutral oil loss of 15–25%, while for physical refining theloss of neutral oil varied between 11 and 20%.
These drawbacks associated with the conventional deacidi-fication processes may be overcome by new approaches andtheir combination with current technologies. Bhosle and Sub-ramanian3 have reviewed alternative deacidification technol-ogies reported in the literature, such as biological deacidifi-cation, solvent extraction, reesterification, supercritical fluidextraction, and membrane processing. Fixation of FFAs onan anion exchange resin was also proposed.4 The authorssucceed to efficiently reduce FFA content of synthetic oil.However, in the case of viscous oils, an organic solvent isnecessary to use for dilution of the system. This implies sub-sequent recovery of free fatty acids from an organic phase.Nevertheless, these new approaches are possibly more envi-ronmentally acceptable and may reduce energy consumptionsand oil losses.
The most studied extraction solvents for deacidificationare short-chain alcohols. Meirelles and coworkers5–10 haveintensively studied the distribution coefficients of FFAsbetween oil- and alcohol-rich phase. Independently of tem-perature or chemical structures of vegetable oil, selectedshort-chain alcohol and FFA studied, the distribution coeffi-cients of FFA have relatively low values (close to 1), indi-cating similar solubility of FFA in both oil-rich and solvent-rich phases. Presence of water in alcohols lowers losses ofneutral oils but leads to slightly inferior FFA distributioncoefficients compared with the case when dry alcohols wereused.11,12 Moreover, the solubility of tryglicerides (vegetableoils) increases proportionally to their FFA contents, thusleading to the loss of neutral oils.
The aim of this work was to explore the possibility ofusing alternative solvents for vegetable oil deacidificationstudies, using room temperature ionic liquids (RTILs) andpoly(ethyleneglycol)s (PEGs). RTILs have appeared as alter-native extraction solvents, reaction media, and catalysts13,14
because of their practically null-volatility,15 nonflammabil-ity,16 comparative thermal stability,17 and versatile solubilitytoward both polar and nonpolar solutes.18 Combining differ-ent cations and anions, a variety of ionic liquids can beobtained with desired (‘‘task specific’’) solvent properties.19
The incorporation of specific functional groups enhances sol-ubility of specific solutes, such as polar substrates or cata-lysts,20 or leads to unexpected antisolvent/co-solventeffects.21 Therefore, RTILs offer wide potential in industrialapplications.22 Ionic liquids bmimDCA and Cocos alkyl pen-taethoxi methyl ammonium methylsulfate (AMMOENG100)were chosen due to their extremely low miscibility with soy-bean oil, complete miscibility with FFA studied, and lowviscosity and cost.
Liquid PEGs, are also nonvolatile, exhibit a very low tox-icity (low enough for PEG to be approved as a food additivefor humans) and biodegradability.23 Moreover, PEGs andtheir aqueous solutions have already been widely used assustainable medium for chemical reactions and liquid-liquidextractions (see Refs. 24 and 25 as well as referencestherein). In respect to solvent ability, PEGs form hydrogenbonds, because they are both proton donors and protonacceptors26 but posses as well an aliphatic back bone thatcan provide van der Waals interactions.
In this work, liquid-liquid equilibrium (LLE) measure-ments on mixtures of soybean oil and several extraction sol-vents were used to evaluate the feasibility of FFA extraction.Two RTILs were used: bmimDCA and Cocos alkyl pentae-thoxi methyl ammonium methylsulfate (AMMOENG100).Poly(ethylene glycol)s of average molar mass of 200, 400,2000, and 4000 were also used. Linoleic acid was chosen asa model FFA. The effects of: concentration, temperature,polymer molar mass, water content, and solvent to oil ratiowere scrutinized. The experimental LLE results were corre-lated using a model based on the Peng-Robinson cubic equa-tion of state and Mathias-Klotz-Prausnitz mixing rule—thePR-MKP model, which showed very good results for all thestudied systems.
Experimental
Materials
Refined soybean oil, anhydrous methanol (99.8%), and lin-oleic acid (99.5%, GC) were obtained from Sigma Aldrich,whereas diethyl ether and ethanol were purchased from Pan-reac. Analytical grade polyethylene glycols with molar mass,in g/mol, of 200 (PEG200), 400 (PEG400), 2000(PEG2000), and 4000 (PEG4000) were supplied by Fluka.RTILs AMMOENG100 and bmimDCA were purchased fromSolvent Innovation and IoLiTec, respectively. Water was dis-tilled and deionized using a Milli-Q water filtration systemfrom Millipore.
To reduce the water content and volatile compounds tonegligible values, vacuum (0.1 Pa) and moderate temperature(60�C) were applied to the RTIL samples for at least 3 daysimmediately prior to their use.
To determine the fatty acid methyl ester composition ofsoybean oil, deacidification followed by transesterificationwere performed, according to a procedure in the literature.27
Products of transesterified soybean oil were analyzed in aVARIAN CHROMPACK CP-3800 gas chromatographequipped with a 30 m � 0.32 mm i.d. fused silica capillarycolumn, coated with a 0.25 lm thickness film of 5% phenylgroups dissolved in dimethylpolysiloxane polymer, fromChrompack Company. The column temperature programstarted at 50�C for 1 min and went up to 185�C, with theheating rate of 20�C/min. The temperature was kept at 185�Cfor 2 min and then increased up to 250�C with the heatingrate of 0.8�C/min. Volumes of injected samples were 0.5 lL.The carrier gas, helium, was delivered at 0.7 bar. The injectortemperature and flame ionization detection temperature were250 and 300�C, respectively. Methyl heptanoate in hexanewas used as standard for GC analysis. Retention times inminutes were: methyl heptanoate 5.0; methyl palmitoleate15.50; methyl palmitate 16.16; methyl linoleate 22.21; methyloleate 22.5; and methyl stearate 23.71.
Model fatty systems were prepared by addition of knownquantities of linoleic acid to a refined soybean oil. All liquidsolutions were gravimetrically prepared to an estimateduncertainty of 0.02%.
Experimental procedure
Cloud points were determined by the cloud-point titration
method in a temperature-controlled equilibrium cell, with a
AIChE Journal May 2011 Vol. 57, No. 5 Published on behalf of the AIChE DOI 10.1002/aic 1345

magnetic stirrer inside. Each soybean oil þ linoleic acid
mixture of known composition was titrated by the solventmethanol or PEGs or ionic liquid, at constant temperature,
with continuous stirring. The transition point is taken as the
appearance/disappearance of turbidity in the solution, and itis defined as a cloud point. The liquid phase occupied almost
the whole volume of the cell, to avoid corrections to compo-
sition due to vaporization. All experiments were performedat least twice. The temperature was controlled within � 0.1
K and monitored by a calibrated mercury thermometer.Liquid-liquid extractions were performed according to the
following procedure: the model soybean oil mixtures con-taining from 2.62 to 17.3 mass % linoleic acid were mixed
with the extraction solvent either PEG200, PEG400,
PEG2000, PEG4000, bmimDCA, or AMMOENG100 in theratios 1:1, 1:2, and 2:1 mass ratio at the temperatures 298.2,
323.2, and 343.2 K. Before commencing the work, the time
taken to reach equilibrium was estimated by sampling thephases every 5 min until a few consecutive samples produced
essentially the same result of the analysis. It was determined
that 30 min were sufficient to reach equilibrium. After stir-ring, the mixtures were centrifugated and left still for at least
60 min at the given temperature, to allow a complete phase
separation. Using a Hamilton syringe, the two liquid phases(oil- and solvent-rich) were carefully drawn to other vials and
prepared for further analysis of the FFA content.The concentrations of FFAs were determined by titration
under dry nitrogen atmosphere. Approximately 2 g of sample
were weighed and then 25 mL of (ethyl ether:ethyl alcohol
2:1(v:v)) mixture as well as two drops of phenolphthalein so-
lution were added. These mixtures were titrated with 0.05
mol/L KOH in ethanol solution until solutions changed its
color from transparent to light pink. In the case of experiments
involving PEGs as extraction solvents, samples of both extract
(PEG-rich) and raffinate (oil-rich) phases were titrated directly.
Since RTILs are compounds composed of ions, the determina-
tion of FFAs concentration is not possible by alkali titration.
In these experiments, only oil-rich phases washed with water
(to remove traces of RTIL) and dried over Na2SO4 were ana-
lyzed for the FFA content. Afterward, the FFA content of the
related RTIL-rich phase was calculated as a difference.For those mixtures where concentrations of linoleic acid
were measured for both phases in equilibrium, the cloud-point data were used to determine tie-lines. The cloud-pointcompositions were fitted by a linear equation in the ternarydiagram at a certain temperature. The interception in the ter-nary diagram of the cloud-point line for each phase with theline corresponding to the measured concentration of linoleic
acid in the same phase gave the equilibrium composition forthat phase, including the concentration of the other two com-ponents (oil and solvent). As the overall composition of themixture is known, the procedure could be validated bychecking whether the tie-line connecting the equilibriumcompositions thus determined passed through the point inthe ternary diagram representing the overall composition. Inall cases, the maximum deviations were below � 0.001 massfraction of linoleic acid.
Results
The determined composition of the soybean oil used inthis study is shown in Table 1, allowing estimation of an av-erage molar mass of 866.5 g/mol. The main constituents ofthe soybean triglycerides are tri-esters of linoleic, oleic andpalmitic acid. Even though the oil is a mixture of various tri-glycerides, we considered it as a single component linoleicacid tri-ester (glyceryl trilinoleate). The concentration ofFFAs in the refined oil is 0.14 mass %.
Chemical structures of solvents used for extraction ofFFAs from soybean oil are shown in Figure 1. It should benoted that AMMOENG100 is an unknown isomer mixturewhere (m þ n) varies from 4 to 14 while the cocos alkylchain is a variable mixture of several fatty acid chains.
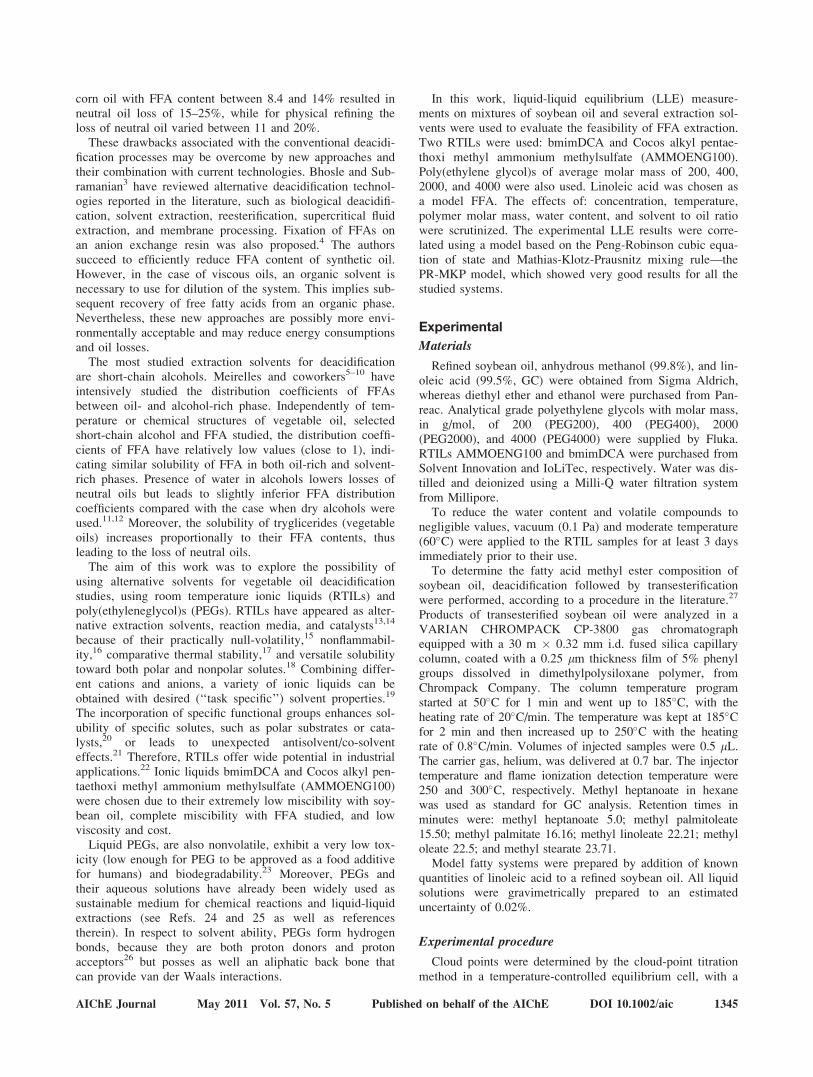
Table 2 presents the obtained cloud-point liquid-liquidequilibrium data for the pseudo-binary (extraction solvent þ(soybean oil þ linoleic acid)) systems using the followingextraction solvents: PEG200, PEG400, PEG2000, PEG4000,AMMOENG100, bmimDCA, and methanol. The latter waschosen for comparison. Data in Table 2 show large immisci-bility gaps with very steep binodal lines. This is also illus-trated in Figure 2 for (oil þ methanol), (oil þ PEG) and (oilþ RTIL) systems.
Although the mutual solubility of (soybean oil þ metha-nol) mixture was reported in the literature,28 it was not pos-sible to quantitatively compare results as they are givensolely in graphical form. However, the same data for the
Table 1. Fatty Acid Composition of Refined Soybean OilUsed in this Study (Source Sigma Aldrich)
Fatty Acid Mass %
Linoleic acid (C18:2) 59Oleic acid (C18:1) 20Palmitic acid (C16:0) 16Stearic acid (C18:0) 2Palmitoleic acid (C16:1) 2Others 1
Figure 1. Structures of extraction solvents used in thisstudy: (a) polyethylene glycol (PEG), (b) 1-butyl-3-methylimidazolium dicyanamide (bmimDCA),and (c) Cocos alkyl pentaethoximethyl ammo-nium methylsulfate (Ammoeng100).
1346 DOI 10.1002/aic Published on behalf of the AIChE May 2011 Vol. 57, No. 5 AIChE Journal
Table
2.CloudPointData
for{E
xtractionSolvent(sol)1
SoybeanOil(oil)1
Linoleic
Acid
(LA)}
Systems,whereExtractionSolventStandsforeitherPEG200or
PEG400orPEG2000orPEG4000orAMMOENG100orbmim
DCA
orMethanol
T¼
298K
T¼
323K
T¼
343K
T¼
298K
T¼
323K
T¼
343K
Solvent
wLA,init.
woilrich
sol
wsol:rich
sol
woilrich
sol
wsol:rich
sol
woilrich
sol
wsol:rich
sol
xoilrich
sol
xsol:rich
sol
xoilrich
sol
xsol:rich
sol
xoilrich
sol
xsol:rich
sol
PEG200
0.0014
0.0055
0.9991
0.0068
0.9991
0.0075
0.9991
0.0233
0.9998
0.0287
0.9998
0.0316
0.9998
0.0572
0.0061
0.9990
0.0123
0.9990
0.0189
0.9990
0.0232
0.9997
0.0460
0.9997
0.0694
0.9997
0.1554
0.0064
0.9989
0.0220
0.9989
0.0369
0.9989
0.0206
0.9997
0.0685
0.9997
0.1113
0.9997
PEG400
0.0014
0.0031
0.9989
0.0048
0.9989
0.0077
0.9989
0.0067
0.9995
0.0205
0.9995
0.0165
0.9997
0.0572
0.0047
0.9988
0.0089
0.9988
0.0135
0.9988
0.0091
0.9994
0.0336
0.9994
0.0258
0.9997
0.1554
0.0056
0.9987
0.0142
0.9987
0.0275
0.9987
0.0091
0.9992
0.0450
0.9992
0.0442
0.9996
PEG2000
0.0014
–*
–*
0.0004
0.9984
0.0009
0.9984
–*
–*
0.0017
0.9963
0.0004
0.9963
0.0572
–*
–*
0.0009
0.9983
0.0012
0.9983
–*
–*
0.0035
0.9956
0.0005
0.9956
0.1554
–*
–*
0.0014
0.9981
0.0017
0.9981
–*
–*
0.0046
0.9941
0.0006
0.9941
PEG4000
0.0014
–*
–*
–*
–*
0.0007
0.9987
–*
–*
–*
–*
0.0002
0.9940
0.0572
–*
–*
–*
–*
0.0008
0.9986
–*
–*
–*
–*
0.0002
0.9928
0.1554
–*
–*
–*
–*
0.0016
0.9983
–*
–*
–*
–*
0.0003
0.9899
AMMOENG100
0.0014
0.0028
0.9872
0.0052
0.9802
0.0060
0.9862
–†
–†
–†
–†
0.0572
0.0040
0.9864
0.0056
0.9786
0.0081
0.9859
–†
–†
–†
–†
0.1554
0.0082
0.9837
0.0087
0.9767
0.0093
0.9840
–†
–†
–†
–†
bmim
DCA
0.0014
0.0012
0.9987
0.0012
0.9987
0.0012
0.9987
0.0050
0.9997
0.0052
0.9997
0.0050
0.9997
0.0572
0.0011
0.9986
0.0011
0.9982
0.0011
0.9982
0.0041
0.9996
0.0042
0.9995
0.0041
0.9995
0.1554
0.0016
0.9984
0.0016
0.9983
0.0016
0.9983
0.0051
0.9995
0.0052
0.9995
0.0051
0.9995
MeO
H0.0014
0.0493
0.9963
0.0739
0.9929
0.0989
0.9885
0.5830
0.9999
0.6827
0.9997
0.7474
0.9996
0.0565
0.0712
0.9966
0.1008
0.9940
0.1328
0.9889
0.6497
0.9999
0.7306
0.9998
0.7874
0.9995
0.1551
0.1126
0.9967
0.1408
0.9943
0.1755
0.9896
0.7216
0.9998
0.7700
0.9997
0.8130
0.9995
wLA,init.correspondsto
theinitialmassfractionoflinoleic
acid
insoybeanoilwhilecloudpoints
woilrich
sol
andwsol:rich
sol
aremassfractionsofextractionsolventin
theoil-richandextractionsolvent-rich
sides,respec-
tively.xoilrich
sol
andw
sol:rich
sol
aremole
fractionsofextractionsolventin
theoil-richandextractionsolvent-rich
sides,respectively.
*PEG
issolidat
given
temperature.
†Molarmasscannotbecalculatedsince
AMMOENG100isan
unknownisomer
mixture.
AIChE Journal May 2011 Vol. 57, No. 5 Published on behalf of the AIChE DOI 10.1002/aic 1347
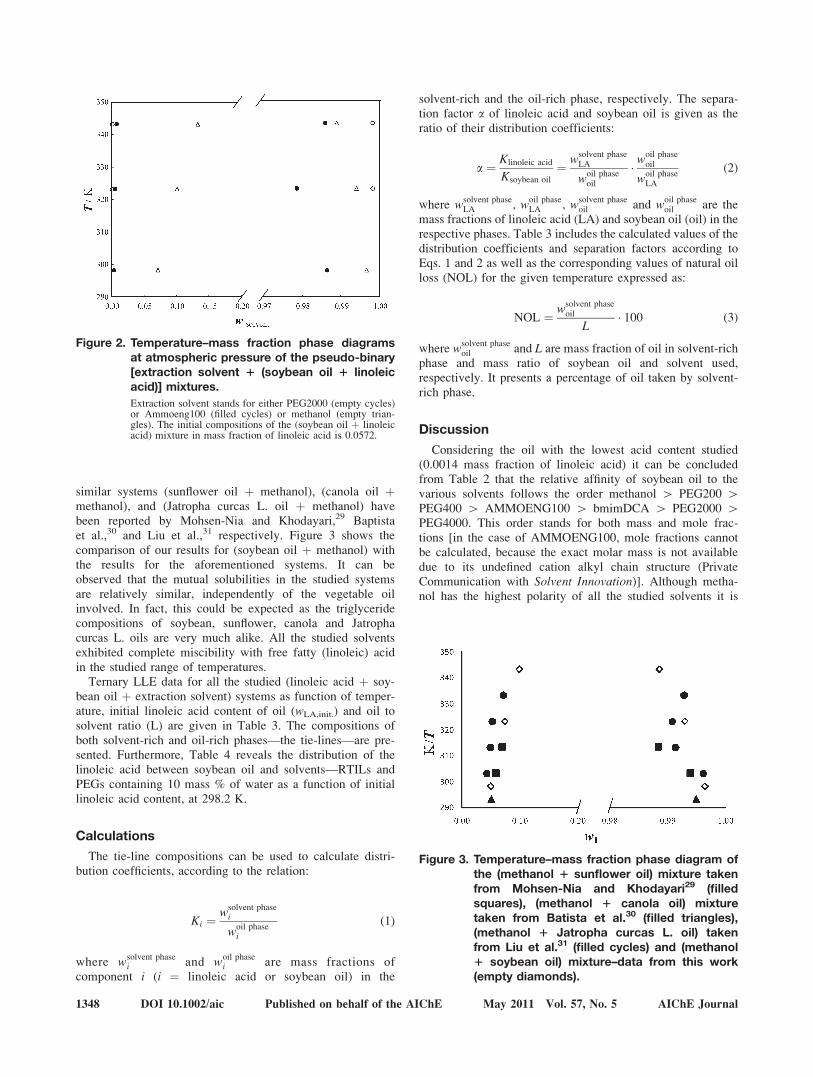
similar systems (sunflower oil þ methanol), (canola oil þmethanol), and (Jatropha curcas L. oil þ methanol) havebeen reported by Mohsen-Nia and Khodayari,29 Baptistaet al.,30 and Liu et al.,31 respectively. Figure 3 shows thecomparison of our results for (soybean oil þ methanol) withthe results for the aforementioned systems. It can beobserved that the mutual solubilities in the studied systemsare relatively similar, independently of the vegetable oilinvolved. In fact, this could be expected as the triglyceridecompositions of soybean, sunflower, canola and Jatrophacurcas L. oils are very much alike. All the studied solventsexhibited complete miscibility with free fatty (linoleic) acidin the studied range of temperatures.
Ternary LLE data for all the studied (linoleic acid þ soy-bean oil þ extraction solvent) systems as function of temper-ature, initial linoleic acid content of oil (wLA,init.) and oil tosolvent ratio (L) are given in Table 3. The compositions ofboth solvent-rich and oil-rich phases—the tie-lines—are pre-sented. Furthermore, Table 4 reveals the distribution of thelinoleic acid between soybean oil and solvents—RTILs andPEGs containing 10 mass % of water as a function of initiallinoleic acid content, at 298.2 K.
Calculations
The tie-line compositions can be used to calculate distri-bution coefficients, according to the relation:
Ki ¼ wsolvent phasei
woil phasei
(1)
where wsolvent phasei and woil phase
i are mass fractions ofcomponent i (i ¼ linoleic acid or soybean oil) in the
solvent-rich and the oil-rich phase, respectively. The separa-tion factor a of linoleic acid and soybean oil is given as theratio of their distribution coefficients:
a ¼ Klinoleic acid
Ksoybean oil
¼ wsolvent phaseLA
woil phaseoil
� woil phaseoil
woil phaseLA
(2)
where wsolvent phaseLA , woil phase
LA , wsolvent phaseoil and woil phase
oil are themass fractions of linoleic acid (LA) and soybean oil (oil) in therespective phases. Table 3 includes the calculated values of thedistribution coefficients and separation factors according toEqs. 1 and 2 as well as the corresponding values of natural oilloss (NOL) for the given temperature expressed as:
NOL ¼ wsolvent phaseoil
L� 100 (3)
where wsolvent phaseoil and L are mass fraction of oil in solvent-rich
phase and mass ratio of soybean oil and solvent used,respectively. It presents a percentage of oil taken by solvent-rich phase.
Discussion
Considering the oil with the lowest acid content studied(0.0014 mass fraction of linoleic acid) it can be concludedfrom Table 2 that the relative affinity of soybean oil to thevarious solvents follows the order methanol [ PEG200 [PEG400 [ AMMOENG100 [ bmimDCA [ PEG2000 [PEG4000. This order stands for both mass and mole frac-tions [in the case of AMMOENG100, mole fractions cannotbe calculated, because the exact molar mass is not availabledue to its undefined cation alkyl chain structure (PrivateCommunication with Solvent Innovation)]. Although metha-nol has the highest polarity of all the studied solvents it is
Figure 3. Temperature–mass fraction phase diagram ofthe (methanol 1 sunflower oil) mixture takenfrom Mohsen-Nia and Khodayari29 (filledsquares), (methanol 1 canola oil) mixturetaken from Batista et al.30 (filled triangles),(methanol 1 Jatropha curcas L. oil) takenfrom Liu et al.31 (filled cycles) and (methanol1 soybean oil) mixture–data from this work(empty diamonds).
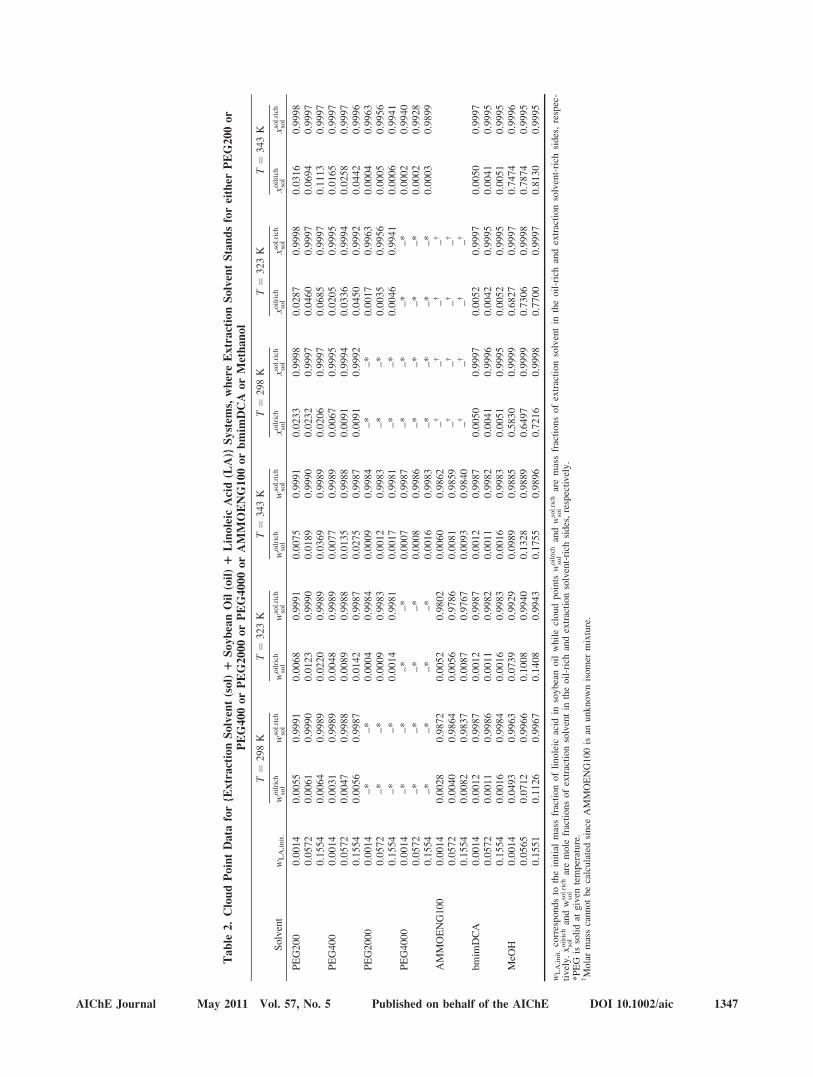
Figure 2. Temperature–mass fraction phase diagramsat atmospheric pressure of the pseudo-binary[extraction solvent 1 (soybean oil 1 linoleicacid)] mixtures.
Extraction solvent stands for either PEG2000 (empty cycles)or Ammoeng100 (filled cycles) or methanol (empty trian-gles). The initial compositions of the (soybean oil þ linoleicacid) mixture in mass fraction of linoleic acid is 0.0572.
1348 DOI 10.1002/aic Published on behalf of the AIChE May 2011 Vol. 57, No. 5 AIChE Journal
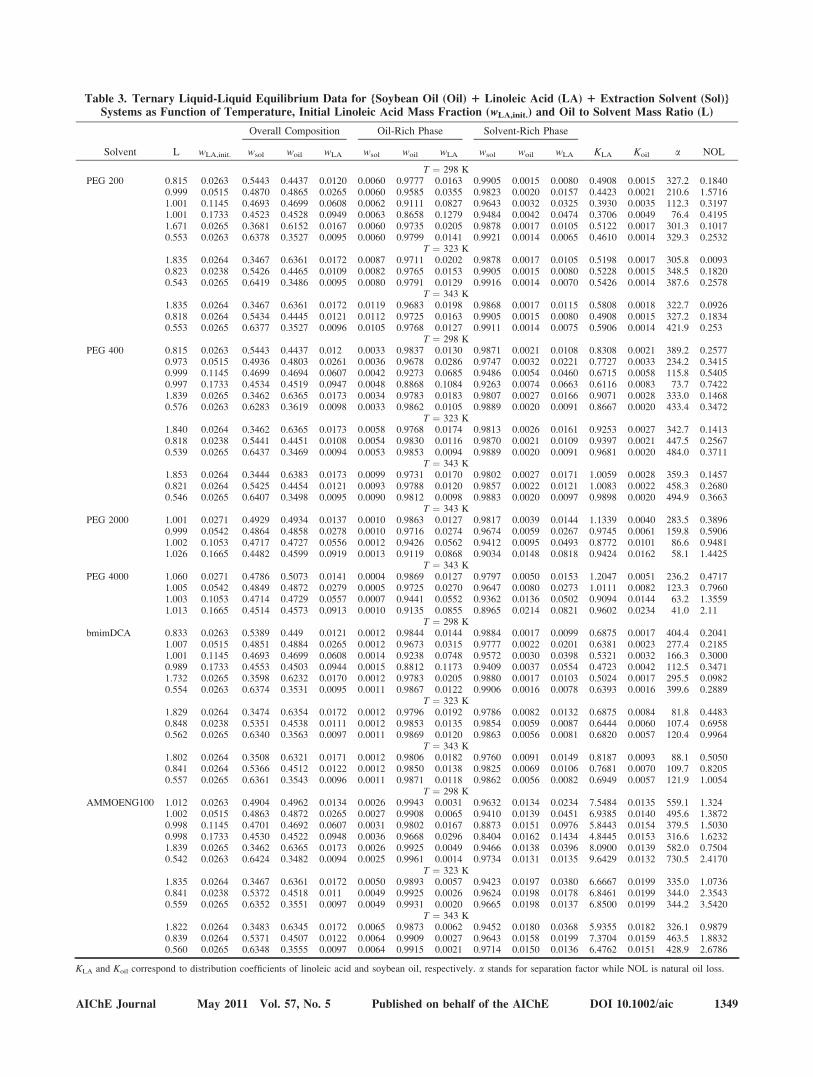
Table 3. Ternary Liquid-Liquid Equilibrium Data for {Soybean Oil (Oil) 1 Linoleic Acid (LA) 1 Extraction Solvent (Sol)}Systems as Function of Temperature, Initial Linoleic Acid Mass Fraction (wLA,init.) and Oil to Solvent Mass Ratio (L)
Solvent L wLA,init.
Overall Composition Oil-Rich Phase Solvent-Rich Phase
KLA Koil a NOLwsol woil wLA wsol woil wLA wsol woil wLA
T ¼ 298 KPEG 200 0.815 0.0263 0.5443 0.4437 0.0120 0.0060 0.9777 0.0163 0.9905 0.0015 0.0080 0.4908 0.0015 327.2 0.1840
0.999 0.0515 0.4870 0.4865 0.0265 0.0060 0.9585 0.0355 0.9823 0.0020 0.0157 0.4423 0.0021 210.6 1.57161.001 0.1145 0.4693 0.4699 0.0608 0.0062 0.9111 0.0827 0.9643 0.0032 0.0325 0.3930 0.0035 112.3 0.31971.001 0.1733 0.4523 0.4528 0.0949 0.0063 0.8658 0.1279 0.9484 0.0042 0.0474 0.3706 0.0049 76.4 0.41951.671 0.0265 0.3681 0.6152 0.0167 0.0060 0.9735 0.0205 0.9878 0.0017 0.0105 0.5122 0.0017 301.3 0.10170.553 0.0263 0.6378 0.3527 0.0095 0.0060 0.9799 0.0141 0.9921 0.0014 0.0065 0.4610 0.0014 329.3 0.2532
T ¼ 323 K1.835 0.0264 0.3467 0.6361 0.0172 0.0087 0.9711 0.0202 0.9878 0.0017 0.0105 0.5198 0.0017 305.8 0.00930.823 0.0238 0.5426 0.4465 0.0109 0.0082 0.9765 0.0153 0.9905 0.0015 0.0080 0.5228 0.0015 348.5 0.18200.543 0.0265 0.6419 0.3486 0.0095 0.0080 0.9791 0.0129 0.9916 0.0014 0.0070 0.5426 0.0014 387.6 0.2578
T ¼ 343 K1.835 0.0264 0.3467 0.6361 0.0172 0.0119 0.9683 0.0198 0.9868 0.0017 0.0115 0.5808 0.0018 322.7 0.09260.818 0.0264 0.5434 0.4445 0.0121 0.0112 0.9725 0.0163 0.9905 0.0015 0.0080 0.4908 0.0015 327.2 0.18340.553 0.0265 0.6377 0.3527 0.0096 0.0105 0.9768 0.0127 0.9911 0.0014 0.0075 0.5906 0.0014 421.9 0.253
T ¼ 298 KPEG 400 0.815 0.0263 0.5443 0.4437 0.012 0.0033 0.9837 0.0130 0.9871 0.0021 0.0108 0.8308 0.0021 389.2 0.2577
0.973 0.0515 0.4936 0.4803 0.0261 0.0036 0.9678 0.0286 0.9747 0.0032 0.0221 0.7727 0.0033 234.2 0.34150.999 0.1145 0.4699 0.4694 0.0607 0.0042 0.9273 0.0685 0.9486 0.0054 0.0460 0.6715 0.0058 115.8 0.54050.997 0.1733 0.4534 0.4519 0.0947 0.0048 0.8868 0.1084 0.9263 0.0074 0.0663 0.6116 0.0083 73.7 0.74221.839 0.0265 0.3462 0.6365 0.0173 0.0034 0.9783 0.0183 0.9807 0.0027 0.0166 0.9071 0.0028 333.0 0.14680.576 0.0263 0.6283 0.3619 0.0098 0.0033 0.9862 0.0105 0.9889 0.0020 0.0091 0.8667 0.0020 433.4 0.3472
T ¼ 323 K1.840 0.0264 0.3462 0.6365 0.0173 0.0058 0.9768 0.0174 0.9813 0.0026 0.0161 0.9253 0.0027 342.7 0.14130.818 0.0238 0.5441 0.4451 0.0108 0.0054 0.9830 0.0116 0.9870 0.0021 0.0109 0.9397 0.0021 447.5 0.25670.539 0.0265 0.6437 0.3469 0.0094 0.0053 0.9853 0.0094 0.9889 0.0020 0.0091 0.9681 0.0020 484.0 0.3711
T ¼ 343 K1.853 0.0264 0.3444 0.6383 0.0173 0.0099 0.9731 0.0170 0.9802 0.0027 0.0171 1.0059 0.0028 359.3 0.14570.821 0.0264 0.5425 0.4454 0.0121 0.0093 0.9788 0.0120 0.9857 0.0022 0.0121 1.0083 0.0022 458.3 0.26800.546 0.0265 0.6407 0.3498 0.0095 0.0090 0.9812 0.0098 0.9883 0.0020 0.0097 0.9898 0.0020 494.9 0.3663
T ¼ 343 KPEG 2000 1.001 0.0271 0.4929 0.4934 0.0137 0.0010 0.9863 0.0127 0.9817 0.0039 0.0144 1.1339 0.0040 283.5 0.3896
0.999 0.0542 0.4864 0.4858 0.0278 0.0010 0.9716 0.0274 0.9674 0.0059 0.0267 0.9745 0.0061 159.8 0.59061.002 0.1053 0.4717 0.4727 0.0556 0.0012 0.9426 0.0562 0.9412 0.0095 0.0493 0.8772 0.0101 86.6 0.94811.026 0.1665 0.4482 0.4599 0.0919 0.0013 0.9119 0.0868 0.9034 0.0148 0.0818 0.9424 0.0162 58.1 1.4425
T ¼ 343 KPEG 4000 1.060 0.0271 0.4786 0.5073 0.0141 0.0004 0.9869 0.0127 0.9797 0.0050 0.0153 1.2047 0.0051 236.2 0.4717
1.005 0.0542 0.4849 0.4872 0.0279 0.0005 0.9725 0.0270 0.9647 0.0080 0.0273 1.0111 0.0082 123.3 0.79601.003 0.1053 0.4714 0.4729 0.0557 0.0007 0.9441 0.0552 0.9362 0.0136 0.0502 0.9094 0.0144 63.2 1.35591.013 0.1665 0.4514 0.4573 0.0913 0.0010 0.9135 0.0855 0.8965 0.0214 0.0821 0.9602 0.0234 41.0 2.11
T ¼ 298 KbmimDCA 0.833 0.0263 0.5389 0.449 0.0121 0.0012 0.9844 0.0144 0.9884 0.0017 0.0099 0.6875 0.0017 404.4 0.2041
1.007 0.0515 0.4851 0.4884 0.0265 0.0012 0.9673 0.0315 0.9777 0.0022 0.0201 0.6381 0.0023 277.4 0.21851.001 0.1145 0.4693 0.4699 0.0608 0.0014 0.9238 0.0748 0.9572 0.0030 0.0398 0.5321 0.0032 166.3 0.30000.989 0.1733 0.4553 0.4503 0.0944 0.0015 0.8812 0.1173 0.9409 0.0037 0.0554 0.4723 0.0042 112.5 0.34711.732 0.0265 0.3598 0.6232 0.0170 0.0012 0.9783 0.0205 0.9880 0.0017 0.0103 0.5024 0.0017 295.5 0.09820.554 0.0263 0.6374 0.3531 0.0095 0.0011 0.9867 0.0122 0.9906 0.0016 0.0078 0.6393 0.0016 399.6 0.2889
T ¼ 323 K1.829 0.0264 0.3474 0.6354 0.0172 0.0012 0.9796 0.0192 0.9786 0.0082 0.0132 0.6875 0.0084 81.8 0.44830.848 0.0238 0.5351 0.4538 0.0111 0.0012 0.9853 0.0135 0.9854 0.0059 0.0087 0.6444 0.0060 107.4 0.69580.562 0.0265 0.6340 0.3563 0.0097 0.0011 0.9869 0.0120 0.9863 0.0056 0.0081 0.6820 0.0057 120.4 0.9964
T ¼ 343 K1.802 0.0264 0.3508 0.6321 0.0171 0.0012 0.9806 0.0182 0.9760 0.0091 0.0149 0.8187 0.0093 88.1 0.50500.841 0.0264 0.5366 0.4512 0.0122 0.0012 0.9850 0.0138 0.9825 0.0069 0.0106 0.7681 0.0070 109.7 0.82050.557 0.0265 0.6361 0.3543 0.0096 0.0011 0.9871 0.0118 0.9862 0.0056 0.0082 0.6949 0.0057 121.9 1.0054
T ¼ 298 KAMMOENG100 1.012 0.0263 0.4904 0.4962 0.0134 0.0026 0.9943 0.0031 0.9632 0.0134 0.0234 7.5484 0.0135 559.1 1.324
1.002 0.0515 0.4863 0.4872 0.0265 0.0027 0.9908 0.0065 0.9410 0.0139 0.0451 6.9385 0.0140 495.6 1.38720.998 0.1145 0.4701 0.4692 0.0607 0.0031 0.9802 0.0167 0.8873 0.0151 0.0976 5.8443 0.0154 379.5 1.50300.998 0.1733 0.4530 0.4522 0.0948 0.0036 0.9668 0.0296 0.8404 0.0162 0.1434 4.8445 0.0153 316.6 1.62321.839 0.0265 0.3462 0.6365 0.0173 0.0026 0.9925 0.0049 0.9466 0.0138 0.0396 8.0900 0.0139 582.0 0.75040.542 0.0263 0.6424 0.3482 0.0094 0.0025 0.9961 0.0014 0.9734 0.0131 0.0135 9.6429 0.0132 730.5 2.4170
T ¼ 323 K1.835 0.0264 0.3467 0.6361 0.0172 0.0050 0.9893 0.0057 0.9423 0.0197 0.0380 6.6667 0.0199 335.0 1.07360.841 0.0238 0.5372 0.4518 0.011 0.0049 0.9925 0.0026 0.9624 0.0198 0.0178 6.8461 0.0199 344.0 2.35430.559 0.0265 0.6352 0.3551 0.0097 0.0049 0.9931 0.0020 0.9665 0.0198 0.0137 6.8500 0.0199 344.2 3.5420
T ¼ 343 K1.822 0.0264 0.3483 0.6345 0.0172 0.0065 0.9873 0.0062 0.9452 0.0180 0.0368 5.9355 0.0182 326.1 0.98790.839 0.0264 0.5371 0.4507 0.0122 0.0064 0.9909 0.0027 0.9643 0.0158 0.0199 7.3704 0.0159 463.5 1.88320.560 0.0265 0.6348 0.3555 0.0097 0.0064 0.9915 0.0021 0.9714 0.0150 0.0136 6.4762 0.0151 428.9 2.6786
KLA and Koil correspond to distribution coefficients of linoleic acid and soybean oil, respectively. a stands for separation factor while NOL is natural oil loss.
AIChE Journal May 2011 Vol. 57, No. 5 Published on behalf of the AIChE DOI 10.1002/aic 1349
the most soluble in nonpolar soybean oil. The long-chainPEGs are the least soluble while the studied ionic liquids,though being ionic compounds, are in the middle. Obviously,polarity does not count much and the presence of higherpolymer chain lengths has not improved the van der Waalsinteractions with the corresponding aliphatic chains in tri-glycerides.
The increase of the acid content in the soybean oilincreases its mutual solubility with the studied extraction sol-vents as presented in Figure 2. This effect is more pro-nounced in the case methanol. On the contrary, in the caseof higher molar mass PEGs and ionic liquids, the mutual sol-ubility does not change significantly with oil’s acidity.
It is interesting that the temperature–composition phasediagram of the (AMMOENG100 þ soybean oil) systemshows an hour-glass shape, which shrinks as the acid contentincreases. Eventually, this would lead to the formation ofboth Upper Critical Solution Temperature and Lower CriticalSolution Temperature if an oil with high enough acid contentwere used.
Table 2 and Figure 2 show that the mutual solubility ofsoybean oil with each of the studied alternative solvents,except AMMOENG100, is considerably lower than that withmethanol, thus making them very promising media to carryout deacidification with lower losses of vegetable oil. As itcan be observed from Table 2, solubility of soybean oil(wLA,init. ¼ 0.0014) in solvent phase at 343 K are 0.09, 0.11,1.98, 0.13, and 0.71%, for PEG200, PEG400, Ammoeng100,bmimDCA, and methanol, respectively. On the other hand,the studied solvents are completely miscible with free fatty(linoleic) acid. It was shown in the literature32 that, at agiven temperature, the mutual solubility of triglycerides
increases with an increase of the alcohol carbon chainlength. The aforementioned facts apparently indicate that thealternative solvents proposed here show better potentials forthe deacidification purposes than short-chain alcohols, whichare considered as the best solvents in this respect.
Relatively low solubilities of ionic liquids and PEGs sol-vents in oil phase (woil rich
sol ) were observed, ranging from0.09 to 0.93 mass % depending on solvent and conditions.Eventual removal of these solvents from oil should beaddressed in future studies.
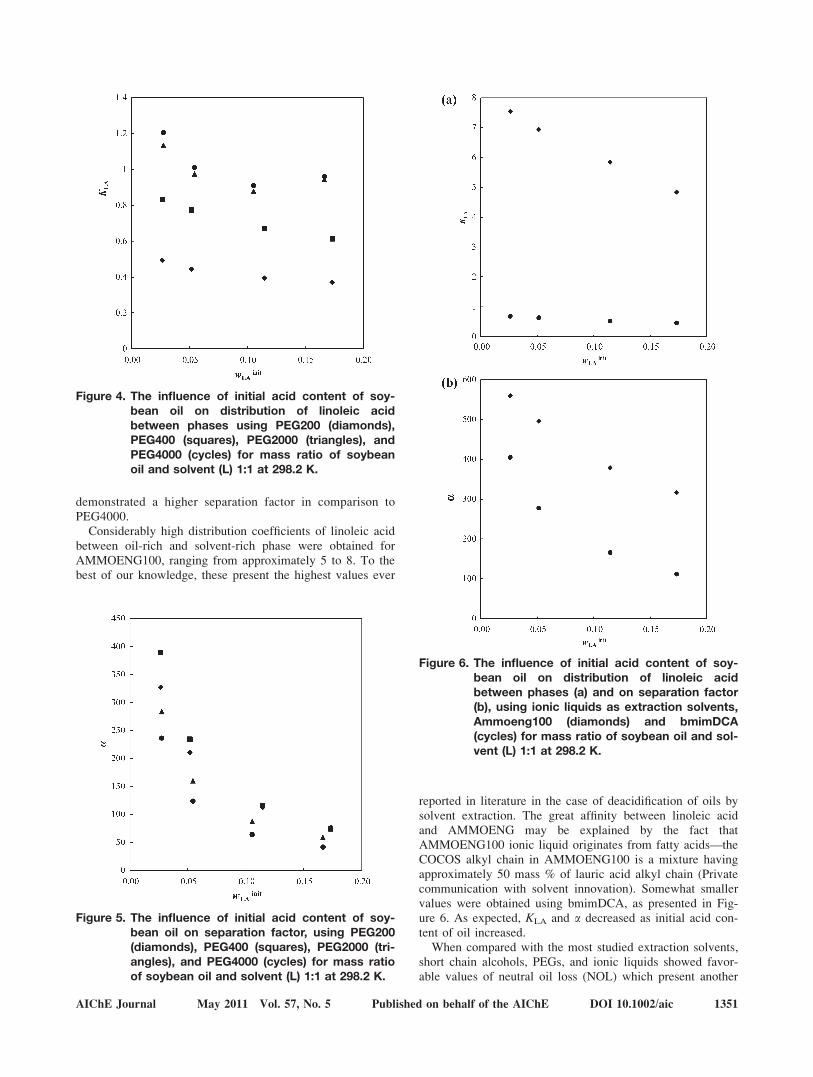
Considering the values of K and a given in Table 3, it canbe observed that the efficiency of the extraction—deacidifi-cation was, to some extent, influenced by temperature in thestudied range. It indicates that increasing the temperatureenhanced KLA. On the other hand the distribution coefficientof linoleic acid decreases with increasing the initial linoleicacid content—Figure 4, which can be attributed to theenhancement of the oil-solvent mutual solubility at highertemperatures. In the case of higher molar mass PEGs(PEG2000 and PEG4000), it appears that there is a mini-mum of the initial value of the wLA—approximately 0.10.However, there are not enough data points to prove thistrend. Also, it is clear that using the higher molar massPEGs resulted in the enhanced distribution of linoleic acidbetween the phases. Conversely—see Figure 5—the influ-ence of molar mass on the separation factor a is not thatstraightforward. For the soybean oil with the initial massfractions smaller than 0.1, the separation factor decreasedin the order: PEG400 [ PEG200 [ PEG2000 [ PEG4000.Deacidification of the oils with higher acid concentration(wLA,init. [ 0.10) gave similar value of separation factorwhether PEG200 or PEG400 were used, while PEG2000
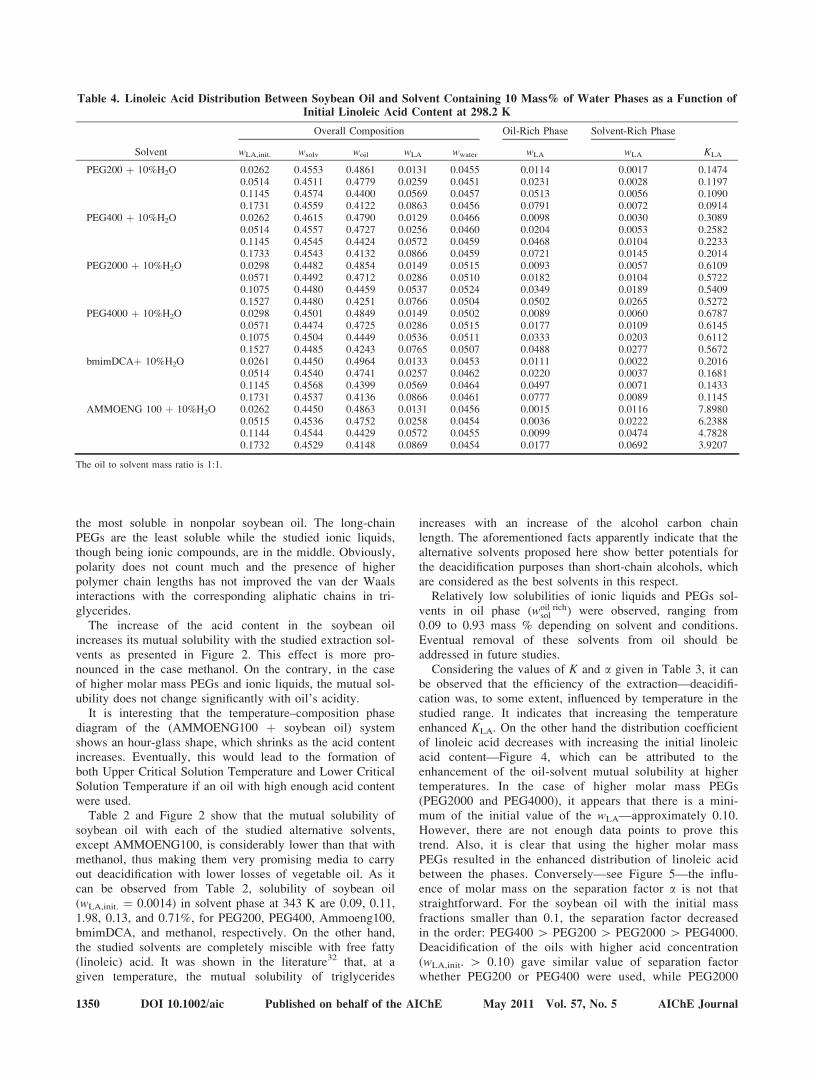
Table 4. Linoleic Acid Distribution Between Soybean Oil and Solvent Containing 10 Mass% of Water Phases as a Function ofInitial Linoleic Acid Content at 298.2 K
Solvent
Overall Composition Oil-Rich Phase Solvent-Rich Phase
KLAwLA,init. wsolv woil wLA wwater wLA wLA
PEG200 þ 10%H2O 0.0262 0.4553 0.4861 0.0131 0.0455 0.0114 0.0017 0.14740.0514 0.4511 0.4779 0.0259 0.0451 0.0231 0.0028 0.11970.1145 0.4574 0.4400 0.0569 0.0457 0.0513 0.0056 0.10900.1731 0.4559 0.4122 0.0863 0.0456 0.0791 0.0072 0.0914
PEG400 þ 10%H2O 0.0262 0.4615 0.4790 0.0129 0.0466 0.0098 0.0030 0.30890.0514 0.4557 0.4727 0.0256 0.0460 0.0204 0.0053 0.25820.1145 0.4545 0.4424 0.0572 0.0459 0.0468 0.0104 0.22330.1733 0.4543 0.4132 0.0866 0.0459 0.0721 0.0145 0.2014
PEG2000 þ 10%H2O 0.0298 0.4482 0.4854 0.0149 0.0515 0.0093 0.0057 0.61090.0571 0.4492 0.4712 0.0286 0.0510 0.0182 0.0104 0.57220.1075 0.4480 0.4459 0.0537 0.0524 0.0349 0.0189 0.54090.1527 0.4480 0.4251 0.0766 0.0504 0.0502 0.0265 0.5272
PEG4000 þ 10%H2O 0.0298 0.4501 0.4849 0.0149 0.0502 0.0089 0.0060 0.67870.0571 0.4474 0.4725 0.0286 0.0515 0.0177 0.0109 0.61450.1075 0.4504 0.4449 0.0536 0.0511 0.0333 0.0203 0.61120.1527 0.4485 0.4243 0.0765 0.0507 0.0488 0.0277 0.5672
bmimDCAþ 10%H2O 0.0261 0.4450 0.4964 0.0133 0.0453 0.0111 0.0022 0.20160.0514 0.4540 0.4741 0.0257 0.0462 0.0220 0.0037 0.16810.1145 0.4568 0.4399 0.0569 0.0464 0.0497 0.0071 0.14330.1731 0.4537 0.4136 0.0866 0.0461 0.0777 0.0089 0.1145
AMMOENG 100 þ 10%H2O 0.0262 0.4450 0.4863 0.0131 0.0456 0.0015 0.0116 7.89800.0515 0.4536 0.4752 0.0258 0.0454 0.0036 0.0222 6.23880.1144 0.4544 0.4429 0.0572 0.0455 0.0099 0.0474 4.78280.1732 0.4529 0.4148 0.0869 0.0454 0.0177 0.0692 3.9207
The oil to solvent mass ratio is 1:1.
1350 DOI 10.1002/aic Published on behalf of the AIChE May 2011 Vol. 57, No. 5 AIChE Journal
demonstrated a higher separation factor in comparison toPEG4000.
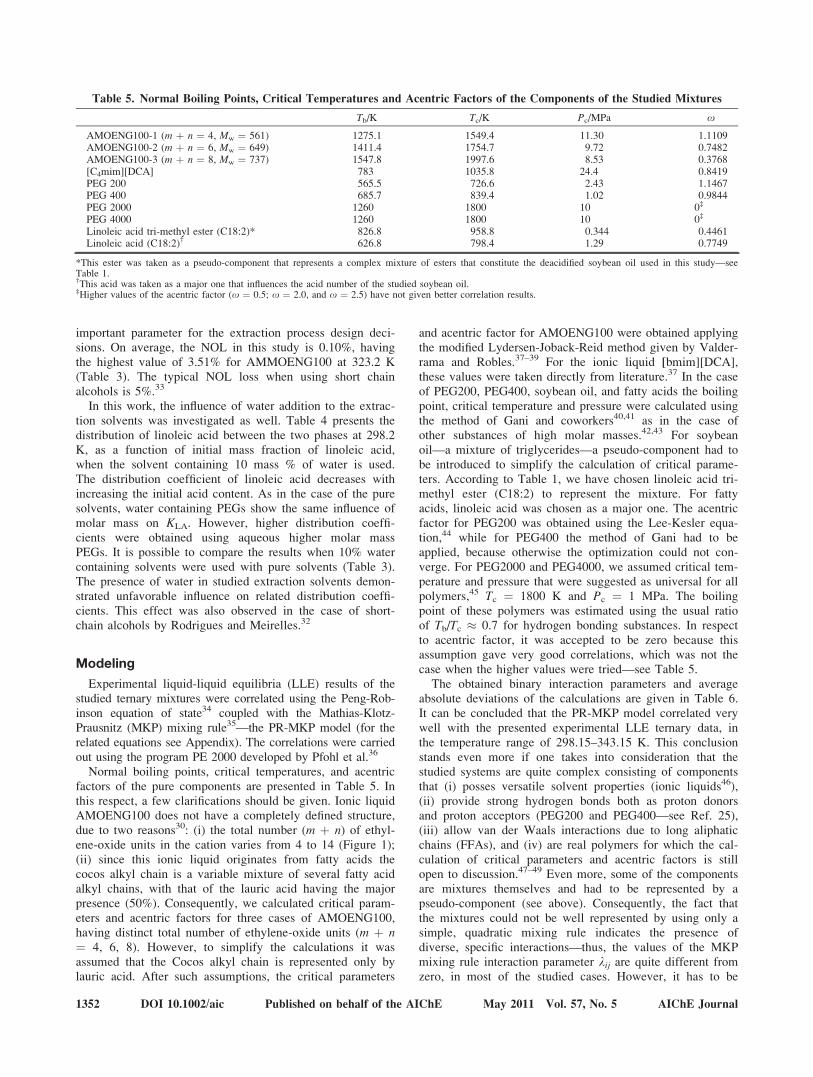
Considerably high distribution coefficients of linoleic acidbetween oil-rich and solvent-rich phase were obtained forAMMOENG100, ranging from approximately 5 to 8. To thebest of our knowledge, these present the highest values ever
reported in literature in the case of deacidification of oils bysolvent extraction. The great affinity between linoleic acidand AMMOENG may be explained by the fact thatAMMOENG100 ionic liquid originates from fatty acids—theCOCOS alkyl chain in AMMOENG100 is a mixture havingapproximately 50 mass % of lauric acid alkyl chain (Privatecommunication with solvent innovation). Somewhat smallervalues were obtained using bmimDCA, as presented in Fig-ure 6. As expected, KLA and a decreased as initial acid con-tent of oil increased.
When compared with the most studied extraction solvents,short chain alcohols, PEGs, and ionic liquids showed favor-able values of neutral oil loss (NOL) which present another
Figure 5. The influence of initial acid content of soy-bean oil on separation factor, using PEG200(diamonds), PEG400 (squares), PEG2000 (tri-angles), and PEG4000 (cycles) for mass ratioof soybean oil and solvent (L) 1:1 at 298.2 K.
Figure 4. The influence of initial acid content of soy-bean oil on distribution of linoleic acidbetween phases using PEG200 (diamonds),PEG400 (squares), PEG2000 (triangles), andPEG4000 (cycles) for mass ratio of soybeanoil and solvent (L) 1:1 at 298.2 K.
Figure 6. The influence of initial acid content of soy-bean oil on distribution of linoleic acidbetween phases (a) and on separation factor(b), using ionic liquids as extraction solvents,Ammoeng100 (diamonds) and bmimDCA(cycles) for mass ratio of soybean oil and sol-vent (L) 1:1 at 298.2 K.
AIChE Journal May 2011 Vol. 57, No. 5 Published on behalf of the AIChE DOI 10.1002/aic 1351
important parameter for the extraction process design deci-sions. On average, the NOL in this study is 0.10%, havingthe highest value of 3.51% for AMMOENG100 at 323.2 K(Table 3). The typical NOL loss when using short chainalcohols is 5%.33
In this work, the influence of water addition to the extrac-tion solvents was investigated as well. Table 4 presents thedistribution of linoleic acid between the two phases at 298.2K, as a function of initial mass fraction of linoleic acid,when the solvent containing 10 mass % of water is used.The distribution coefficient of linoleic acid decreases withincreasing the initial acid content. As in the case of the puresolvents, water containing PEGs show the same influence ofmolar mass on KLA. However, higher distribution coeffi-cients were obtained using aqueous higher molar massPEGs. It is possible to compare the results when 10% watercontaining solvents were used with pure solvents (Table 3).The presence of water in studied extraction solvents demon-strated unfavorable influence on related distribution coeffi-cients. This effect was also observed in the case of short-chain alcohols by Rodrigues and Meirelles.32
Modeling
Experimental liquid-liquid equilibria (LLE) results of thestudied ternary mixtures were correlated using the Peng-Rob-inson equation of state34 coupled with the Mathias-Klotz-Prausnitz (MKP) mixing rule35—the PR-MKP model (for therelated equations see Appendix). The correlations were carriedout using the program PE 2000 developed by Pfohl et al.36
Normal boiling points, critical temperatures, and acentricfactors of the pure components are presented in Table 5. Inthis respect, a few clarifications should be given. Ionic liquidAMOENG100 does not have a completely defined structure,due to two reasons30: (i) the total number (m þ n) of ethyl-ene-oxide units in the cation varies from 4 to 14 (Figure 1);(ii) since this ionic liquid originates from fatty acids thecocos alkyl chain is a variable mixture of several fatty acidalkyl chains, with that of the lauric acid having the majorpresence (50%). Consequently, we calculated critical param-eters and acentric factors for three cases of AMOENG100,having distinct total number of ethylene-oxide units (m þ n¼ 4, 6, 8). However, to simplify the calculations it wasassumed that the Cocos alkyl chain is represented only bylauric acid. After such assumptions, the critical parameters
and acentric factor for AMOENG100 were obtained applyingthe modified Lydersen-Joback-Reid method given by Valder-rama and Robles.37–39 For the ionic liquid [bmim][DCA],these values were taken directly from literature.37 In the caseof PEG200, PEG400, soybean oil, and fatty acids the boilingpoint, critical temperature and pressure were calculated usingthe method of Gani and coworkers40,41 as in the case ofother substances of high molar masses.42,43 For soybeanoil—a mixture of triglycerides—a pseudo-component had tobe introduced to simplify the calculation of critical parame-ters. According to Table 1, we have chosen linoleic acid tri-methyl ester (C18:2) to represent the mixture. For fattyacids, linoleic acid was chosen as a major one. The acentricfactor for PEG200 was obtained using the Lee-Kesler equa-tion,44 while for PEG400 the method of Gani had to beapplied, because otherwise the optimization could not con-verge. For PEG2000 and PEG4000, we assumed critical tem-perature and pressure that were suggested as universal for allpolymers,45 Tc ¼ 1800 K and Pc ¼ 1 MPa. The boilingpoint of these polymers was estimated using the usual ratioof Tb/Tc � 0.7 for hydrogen bonding substances. In respectto acentric factor, it was accepted to be zero because thisassumption gave very good correlations, which was not thecase when the higher values were tried—see Table 5.
The obtained binary interaction parameters and averageabsolute deviations of the calculations are given in Table 6.It can be concluded that the PR-MKP model correlated verywell with the presented experimental LLE ternary data, inthe temperature range of 298.15–343.15 K. This conclusionstands even more if one takes into consideration that thestudied systems are quite complex consisting of componentsthat (i) posses versatile solvent properties (ionic liquids46),(ii) provide strong hydrogen bonds both as proton donorsand proton acceptors (PEG200 and PEG400—see Ref. 25),(iii) allow van der Waals interactions due to long aliphaticchains (FFAs), and (iv) are real polymers for which the cal-culation of critical parameters and acentric factors is stillopen to discussion.47–49 Even more, some of the componentsare mixtures themselves and had to be represented by apseudo-component (see above). Consequently, the fact thatthe mixtures could not be well represented by using only asimple, quadratic mixing rule indicates the presence ofdiverse, specific interactions—thus, the values of the MKPmixing rule interaction parameter kij are quite different fromzero, in most of the studied cases. However, it has to be
Table 5. Normal Boiling Points, Critical Temperatures and Acentric Factors of the Components of the Studied Mixtures
Tb/K Tc/K Pc/MPa x
AMOENG100-1 (m þ n ¼ 4, Mw ¼ 561) 1275.1 1549.4 11.30 1.1109AMOENG100-2 (m þ n ¼ 6, Mw ¼ 649) 1411.4 1754.7 9.72 0.7482AMOENG100-3 (m þ n ¼ 8, Mw ¼ 737) 1547.8 1997.6 8.53 0.3768[C4mim][DCA] 783 1035.8 24.4 0.8419PEG 200 565.5 726.6 2.43 1.1467PEG 400 685.7 839.4 1.02 0.9844PEG 2000 1260 1800 10 0‡
PEG 4000 1260 1800 10 0‡
Linoleic acid tri-methyl ester (C18:2)* 826.8 958.8 0.344 0.4461Linoleic acid (C18:2)† 626.8 798.4 1.29 0.7749
*This ester was taken as a pseudo-component that represents a complex mixture of esters that constitute the deacidified soybean oil used in this study—seeTable 1.†This acid was taken as a major one that influences the acid number of the studied soybean oil.‡Higher values of the acentric factor (x ¼ 0.5; x ¼ 2.0, and x ¼ 2.5) have not given better correlation results.
1352 DOI 10.1002/aic Published on behalf of the AIChE May 2011 Vol. 57, No. 5 AIChE Journal
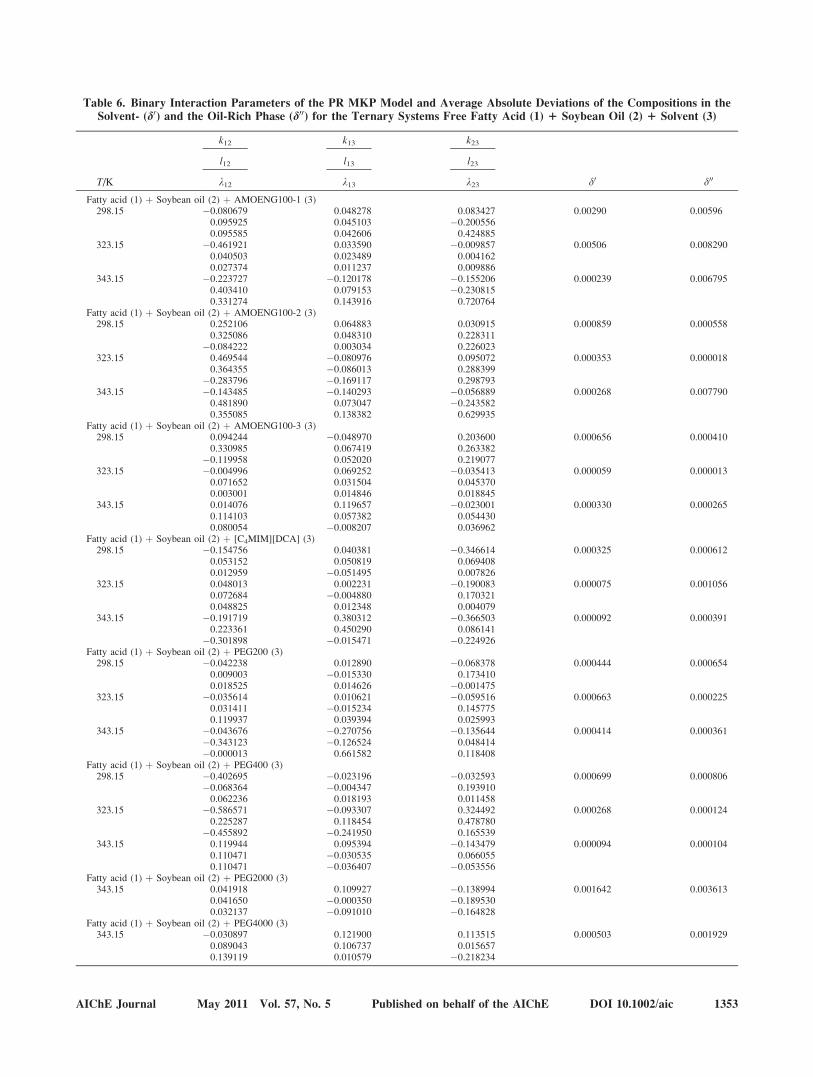
Table 6. Binary Interaction Parameters of the PR MKP Model and Average Absolute Deviations of the Compositions in theSolvent- (d0) and the Oil-Rich Phase (d00) for the Ternary Systems Free Fatty Acid (1) 1 Soybean Oil (2) 1 Solvent (3)
T/K
k12 k13 k23
d0 d00
l12 l13 l23
k12 k13 k23
Fatty acid (1) þ Soybean oil (2) þ AMOENG100-1 (3)298.15 �0.080679 0.048278 0.083427 0.00290 0.00596
0.095925 0.045103 �0.2005560.095585 0.042606 0.424885
323.15 �0.461921 0.033590 �0.009857 0.00506 0.0082900.040503 0.023489 0.0041620.027374 0.011237 0.009886
343.15 �0.223727 �0.120178 �0.155206 0.000239 0.0067950.403410 0.079153 �0.2308150.331274 0.143916 0.720764
Fatty acid (1) þ Soybean oil (2) þ AMOENG100-2 (3)298.15 0.252106 0.064883 0.030915 0.000859 0.000558
0.325086 0.048310 0.228311�0.084222 0.003034 0.226023
323.15 0.469544 �0.080976 0.095072 0.000353 0.0000180.364355 �0.086013 0.288399
�0.283796 �0.169117 0.298793343.15 �0.143485 �0.140293 �0.056889 0.000268 0.007790
0.481890 0.073047 �0.2435820.355085 0.138382 0.629935
Fatty acid (1) þ Soybean oil (2) þ AMOENG100-3 (3)298.15 0.094244 �0.048970 0.203600 0.000656 0.000410
0.330985 0.067419 0.263382�0.119958 0.052020 0.219077
323.15 �0.004996 0.069252 �0.035413 0.000059 0.0000130.071652 0.031504 0.0453700.003001 0.014846 0.018845
343.15 0.014076 0.119657 �0.023001 0.000330 0.0002650.114103 0.057382 0.0544300.080054 �0.008207 0.036962
Fatty acid (1) þ Soybean oil (2) þ [C4MIM][DCA] (3)298.15 �0.154756 0.040381 �0.346614 0.000325 0.000612
0.053152 0.050819 0.0694080.012959 �0.051495 0.007826
323.15 0.048013 0.002231 �0.190083 0.000075 0.0010560.072684 �0.004880 0.1703210.048825 0.012348 0.004079
343.15 �0.191719 0.380312 �0.366503 0.000092 0.0003910.223361 0.450290 0.086141
�0.301898 �0.015471 �0.224926Fatty acid (1) þ Soybean oil (2) þ PEG200 (3)298.15 �0.042238 0.012890 �0.068378 0.000444 0.000654
0.009003 �0.015330 0.1734100.018525 0.014626 �0.001475
323.15 �0.035614 0.010621 �0.059516 0.000663 0.0002250.031411 �0.015234 0.1457750.119937 0.039394 0.025993
343.15 �0.043676 �0.270756 �0.135644 0.000414 0.000361�0.343123 �0.126524 0.048414�0.000013 0.661582 0.118408
Fatty acid (1) þ Soybean oil (2) þ PEG400 (3)298.15 �0.402695 �0.023196 �0.032593 0.000699 0.000806
�0.068364 �0.004347 0.1939100.062236 0.018193 0.011458
323.15 �0.586571 �0.093307 0.324492 0.000268 0.0001240.225287 0.118454 0.478780
�0.455892 �0.241950 0.165539343.15 0.119944 0.095394 �0.143479 0.000094 0.000104
0.110471 �0.030535 0.0660550.110471 �0.036407 �0.053556
Fatty acid (1) þ Soybean oil (2) þ PEG2000 (3)343.15 0.041918 0.109927 �0.138994 0.001642 0.003613
0.041650 �0.000350 �0.1895300.032137 �0.091010 �0.164828
Fatty acid (1) þ Soybean oil (2) þ PEG4000 (3)343.15 �0.030897 0.121900 0.113515 0.000503 0.001929
0.089043 0.106737 0.0156570.139119 0.010579 �0.218234
AIChE Journal May 2011 Vol. 57, No. 5 Published on behalf of the AIChE DOI 10.1002/aic 1353
mentioned that the prediction of data using the parametersobtained at 298.15 K—temperature independent parame-ters—did not give such good results, with the maximumabsolute deviations between 0.02 and 0.03. Thus, the PR-MKP model did not exhibit fine predictive abilities.
Conclusions
PEGs (Mw ¼ 200, 400, 2000, and 4000 g/mol) and RTILs,AMMOENG100 and [bmim][DCA], were tested as the alter-native solvents for the deacidification of soybean oil. Liquid-
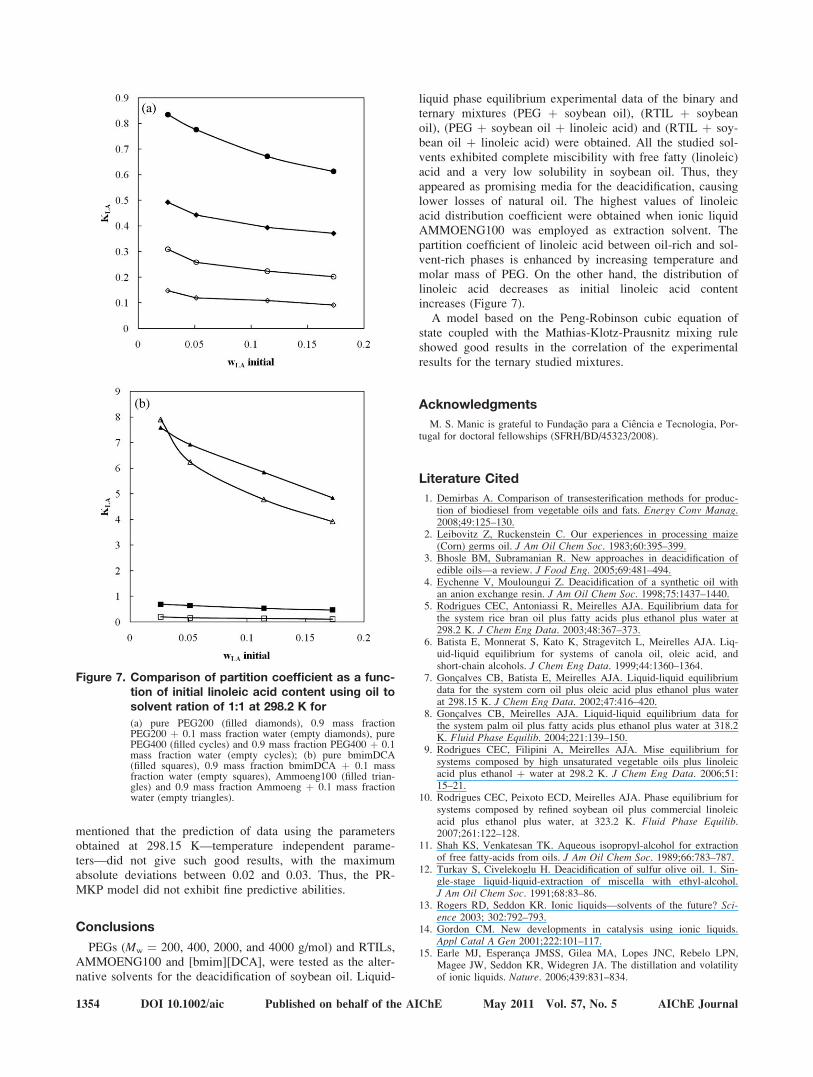
liquid phase equilibrium experimental data of the binary andternary mixtures (PEG þ soybean oil), (RTIL þ soybeanoil), (PEG þ soybean oil þ linoleic acid) and (RTIL þ soy-bean oil þ linoleic acid) were obtained. All the studied sol-vents exhibited complete miscibility with free fatty (linoleic)acid and a very low solubility in soybean oil. Thus, theyappeared as promising media for the deacidification, causinglower losses of natural oil. The highest values of linoleicacid distribution coefficient were obtained when ionic liquidAMMOENG100 was employed as extraction solvent. Thepartition coefficient of linoleic acid between oil-rich and sol-vent-rich phases is enhanced by increasing temperature andmolar mass of PEG. On the other hand, the distribution oflinoleic acid decreases as initial linoleic acid contentincreases (Figure 7).
A model based on the Peng-Robinson cubic equation ofstate coupled with the Mathias-Klotz-Prausnitz mixing ruleshowed good results in the correlation of the experimentalresults for the ternary studied mixtures.
Acknowledgments
M. S. Manic is grateful to Fundacao para a Ciencia e Tecnologia, Por-tugal for doctoral fellowships (SFRH/BD/45323/2008).
Literature Cited
1. Demirbas A. Comparison of transesterification methods for produc-tion of biodiesel from vegetable oils and fats. Energy Conv Manag.2008;49:125–130.
2. Leibovitz Z, Ruckenstein C. Our experiences in processing maize(Corn) germs oil. J Am Oil Chem Soc. 1983;60:395–399.
3. Bhosle BM, Subramanian R. New approaches in deacidification ofedible oils—a review. J Food Eng. 2005;69:481–494.
4. Eychenne V, Mouloungui Z. Deacidification of a synthetic oil withan anion exchange resin. J Am Oil Chem Soc. 1998;75:1437–1440.
5. Rodrigues CEC, Antoniassi R, Meirelles AJA. Equilibrium data forthe system rice bran oil plus fatty acids plus ethanol plus water at298.2 K. J Chem Eng Data. 2003;48:367–373.
6. Batista E, Monnerat S, Kato K, Stragevitch L, Meirelles AJA. Liq-uid-liquid equilibrium for systems of canola oil, oleic acid, andshort-chain alcohols. J Chem Eng Data. 1999;44:1360–1364.
7. Goncalves CB, Batista E, Meirelles AJA. Liquid-liquid equilibriumdata for the system corn oil plus oleic acid plus ethanol plus waterat 298.15 K. J Chem Eng Data. 2002;47:416–420.
8. Goncalves CB, Meirelles AJA. Liquid-liquid equilibrium data forthe system palm oil plus fatty acids plus ethanol plus water at 318.2K. Fluid Phase Equilib. 2004;221:139–150.
9. Rodrigues CEC, Filipini A, Meirelles AJA. Mise equilibrium forsystems composed by high unsaturated vegetable oils plus linoleicacid plus ethanol þ water at 298.2 K. J Chem Eng Data. 2006;51:15–21.
10. Rodrigues CEC, Peixoto ECD, Meirelles AJA. Phase equilibrium forsystems composed by refined soybean oil plus commercial linoleicacid plus ethanol plus water, at 323.2 K. Fluid Phase Equilib.2007;261:122–128.
11. Shah KS, Venkatesan TK. Aqueous isopropyl-alcohol for extractionof free fatty-acids from oils. J Am Oil Chem Soc. 1989;66:783–787.
12. Turkay S, Civelekoglu H. Deacidification of sulfur olive oil. 1. Sin-gle-stage liquid-liquid-extraction of miscella with ethyl-alcohol.J Am Oil Chem Soc. 1991;68:83–86.
13. Rogers RD, Seddon KR. Ionic liquids—solvents of the future? Sci-ence 2003; 302:792–793.
14. Gordon CM. New developments in catalysis using ionic liquids.Appl Catal A Gen 2001;222:101–117.
15. Earle MJ, Esperanca JMSS, Gilea MA, Lopes JNC, Rebelo LPN,Magee JW, Seddon KR, Widegren JA. The distillation and volatilityof ionic liquids. Nature. 2006;439:831–834.
Figure 7. Comparison of partition coefficient as a func-tion of initial linoleic acid content using oil tosolvent ration of 1:1 at 298.2 K for
(a) pure PEG200 (filled diamonds), 0.9 mass fractionPEG200 þ 0.1 mass fraction water (empty diamonds), purePEG400 (filled cycles) and 0.9 mass fraction PEG400 þ 0.1mass fraction water (empty cycles); (b) pure bmimDCA(filled squares), 0.9 mass fraction bmimDCA þ 0.1 massfraction water (empty squares), Ammoeng100 (filled trian-gles) and 0.9 mass fraction Ammoeng þ 0.1 mass fractionwater (empty triangles).
1354 DOI 10.1002/aic Published on behalf of the AIChE May 2011 Vol. 57, No. 5 AIChE Journal

16. Smiglak M, Reichert WM, Holbrey JD, Wilkes JS, Sun LY,Thrasher JS, Kirichenko K, Singh S, Katritzky AR, Rogers RD.Combustible ionic liquids by design: is laboratory safety anotherionic liquid myth? Chem Commun. 2006;2554–2556.
17. Baranyai KJ, Deacon GB, MacFarlane DR, Pringle JM, Scott JL.Thermal degradation of ionic liquids at elevated temperatures. AustJ Chem. 2004;57:145–147.
18. Anderson JL, Ding J, Welton T, Armstrong DW. Characterizingionic liquids on the basis of multiple solvation interactions. J AmChem Soc. 2002;124:14247–14254.
19. Davis JH. Task-specific ionic liquids. Chem Lett. 2004;33:1072–1077.20. Branco LC, Rosa JN, Ramos JJM, Afonso CAM. Preparation and
characterization of new room temperature ionic liquids. Chem Eur J.2002;8:3671–3677.
21. Najdanovic-Visak V, Rodriguez A, Visak ZP, Rosa JN, AfonsoCAM, Nunes da Ponte M, Rebelo LPN. Co-solvent effects in LLEof 1-hydroxyethyl-3-methylimidazolium based ionic liquids plus2-propanol plus dichloromethane or 1,2-dichloroethane. Fluid PhaseEquilib. 2007;254:35–41.
22. Plechkova NV, Seddon KR. Applications of ionic liquids in thechemical industry. Chem Soc Rev. 2008;37:123–150.
23. Heldebrant DJ, Witt HN, Walsh SM, Ellis T, Rauscherb J, JessopPG. Liquid polymers as solvents for catalytic reductions. GreenChem. 2006;8:807–815.
24. Chen J, Spear SK, Huddleston JG, Rogers RD. Polyethylene glycoland solutions of polyethylene glycol as green reaction media. GreenChem. 2005;7:64–82.
25. Huddleston JG, Willauer HD, Griffin ST, Rogers RD. Aqueous poly-meric solutions as environmentally benign liquid liquid extractionmedia. Ind Eng Chem Res. 1999;38:2523–2539.
26. Kim IW, Jang MD, Ryu YK, Cho EH, Lee YK, Park JH. Dipolarity,hydrogen-bond basicity and hydrogen-bond acidity of aqueous poly(ethylene glycol) solutions. Anal Sci. 2002;18:1357–1360.
27. Chuang MH, Brunner G. Concentration of minor components incrude palm oil. J Supercrit Fluids. 2006;37:151–156.
28. Boocock DGB, Konar SK, Sidi H. Phase diagrams for oil/methanol/ether mixtures. J Am Oil Chem Soc. 1996;73:1247–1251.
29. Mohsen-Nia M, Khodayari A. De-acidification of sunflower oil bysolvent extraction: (liquid plus liquid) equilibrium data at T ¼(303.15 and 313.15) K. J Chem Thermodyn. 2008;40:1325–1329.
30. Baptista E, Monnerat S, Kato K, Stragevitch L, Mierelles AJA. Liq-uid-liquid equilibrium for systems of canola oil, oleic acid, andshort-chain alcohols. J Chem Eng Data. 1999;44;1360–1364.
31. Liu Y, Lu H, Liu C, Liang B. Solubility measurement for the reac-tion systems in pre-esterification of high acid value Jatropha curcasL Oil. J Chem Eng Data. 2009;54;1421–1425.
32. Rodrigues CEC, Meirelles AJA. Extraction of free fatty acids frompeanut oil and avocado seed oil: Liquid-liquid equilibrium data at298.2 K. J Chem Eng Data. 2008;53:1698–1704.
33. Pina CG, Meirelles AJA. Deacidification of corn oil by solventextraction in a perforated rotating disc column. J Am Oil Chem Soc.2000;77:553–559.
34. Peng D, Robinson DB. New 2-constant equation of state. Ind EngChem Fund. 1976;15:59–64.
35. Mathias M, Klotz HC, Prausnitz JM. Equation-of-state mixing rulesfor multicomponent mixtures—the problems of invariance. FluidPhase Equilib. 1991;67:31–44.
36. Pfohl O, Petkov S, Brunner G, Usage of PE—A Program to Calcu-late Phase Equilibria. Munchen: Herbert Utz Verlag, 1998.
37. Valderrama JO, Robles PA. Critical properties, normal boiling tem-peratures, and acentric factors of fifty ionic liquids. Ind Eng ChemRes. 2007;46:1338–1344.
38. Valderrama JO, Sanga WW, Lazzus JA. Critical properties, normalboiling temperature, and acentric factor of another 200 ionic liquids.Ind Eng Chem Res. 2008;47:1318–1330.
39. Valderrama JO, Rojas RE. Critical properties of ionic liquids. Revis-ited. Ind Eng Chem Res. 2009;48:6890–6900.
40. Constantinou L, Gani R. New group-contribution method for esti-mating properties of pure compounds. AIChE J. 1994;40:1697–1710.
41. Constantinou L, Gani R, O’Conell JP. Estimation of the acentric fac-tor and the liquid molar volume at 298 K using a new group-contri-bution method. Fluid Phase Equilib. 1995;103:11–22.
42. Glisic S, Montoya O, Orlovic A, Skala D. Vapor-liquid equilibria oftriglycerides-methanol mixtures and their influence on the biodieselsynthesis under supercritical conditions of methanol. J Serb ChemSoc. 2007;72:13–27.
43. Araujo ME, Meireles MAA. Improving phase equilibrium calculationwith the Peng-Robinson EOS for fats and oils related compounds/supercritical CO2 systems. Fluid Phase Equilib. 2000;169:49–64.
44. Reid RC, Prausnitz J, Poling B. The Properties of Gases andLiquids, 4th ed. New York: McGraw Hill, 1987.
45. Orbey H, Bokis CP, Chen C-C. Polymer-solvent vapor-liquid equi-librium: equations of state versus activity coefficient models. IndEng Chem Res. 1998;37:1567–1573.
46. Crowhurst L, Mawdsley PR, Perez-Arlandis JM, Salter PA, WeltonT. Solvent-solute interactions in ionic liquids. Phys Chem ChemPhys. 2003;5:2790–2794.
47. Orbey H, Sandler SI. Vapor-liquid-equilibrium of polymer-solutionsusing a cubic equation of state. AIChE J. 1994;40:1203–1209.
48. Orbey H, Chen C-C, Bokis CP. An extension of cubic equations ofstate to vapor-liquid equilibria in polymer-solvent mixtures. FluidPhase Equilib. 1998;145:169–192.
49. Louli V, Tassios D. Vapor-liquid equilibrium in polymer-solventsystems with a cubic equation of state. Fluid Phase Equilib. 2000;168:165–182.
Appendix A
Peng-robinson Equation of State
p ¼ RT
V � b� aðTÞV2 þ 2bV � b2
(A1)
aiðTÞ ¼ 0:45724R2T2
c
Pc½1þ ð0:37464þ 1:54226X
�0:266992X2Þð1� ffiffiffiffiffiTr
p Þ�2 ðA2Þ
bi ¼ 0:0778RTcPc
(A3)
Mathias-Klotz-Prausnitz Mixing Rule
a ¼XNi¼1
XNj¼1
xixjffiffiffiffiffiffiffiffiaiaj
p ð1� kijÞ þXNi¼1
xiXNj¼1
xjð ffiffiffiffiffiffiffiffiaiaj
pkijÞ1=3
" #3
(A4)
b ¼XNi¼1
XNj¼1
xixjbij (A5)
bij � bi þ bj2
ð1� lijÞ (A6)
Manuscript received Mar. 9, 2010, and revision received June 4, 2010.
AIChE Journal May 2011 Vol. 57, No. 5 Published on behalf of the AIChE DOI 10.1002/aic 1355