extracellular polymeric substances govern the surface charge of biogenic elemental selenium...
TRANSCRIPT
Extracellular Polymeric Substances Govern the Surface Charge ofBiogenic Elemental Selenium NanoparticlesRohan Jain,*,†,⊥ Norbert Jordan,‡ Stephan Weiss,‡ Harald Foerstendorf,‡ Karsten Heim,‡ Rohit Kacker,§
Rene Hubner,∥ Herman Kramer,§ Eric D. van Hullebusch,⊥ Francois Farges,# and Piet N. L. Lens†
†UNESCO-IHE, Institute for Water Education, Westvest 7, 2611AX Delft, The Netherlands‡Helmholtz-Zentrum Dresden − Rossendorf, Institute of Resource Ecology, Bautzner Landstraße 400, 01328 Dresden, Germany§Process & Energy Laboratory, Delft University of Technology, Leeghwaterstraat 44, 2628 CA Delft, The Netherlands∥Helmholtz-Zentrum Dresden − Rossendorf, Institute of Ion Beam Physics and Materials Research, Bautzner Landstraße 400, 01328Dresden, Germany⊥Universite Paris-Est, Laboratoire Geomateriaux et Environnement (EA 4508), UPEM, 77454 Marne la Vallee, France#Institut de Mineralogie, de Physique des Materiaux et de Cosmochimie (IMPMC), Museum National d’Histoire Naturelle,Universite Pierre-et-Marie Curie and CNRS, UMR 7590 Paris, France
*S Supporting Information
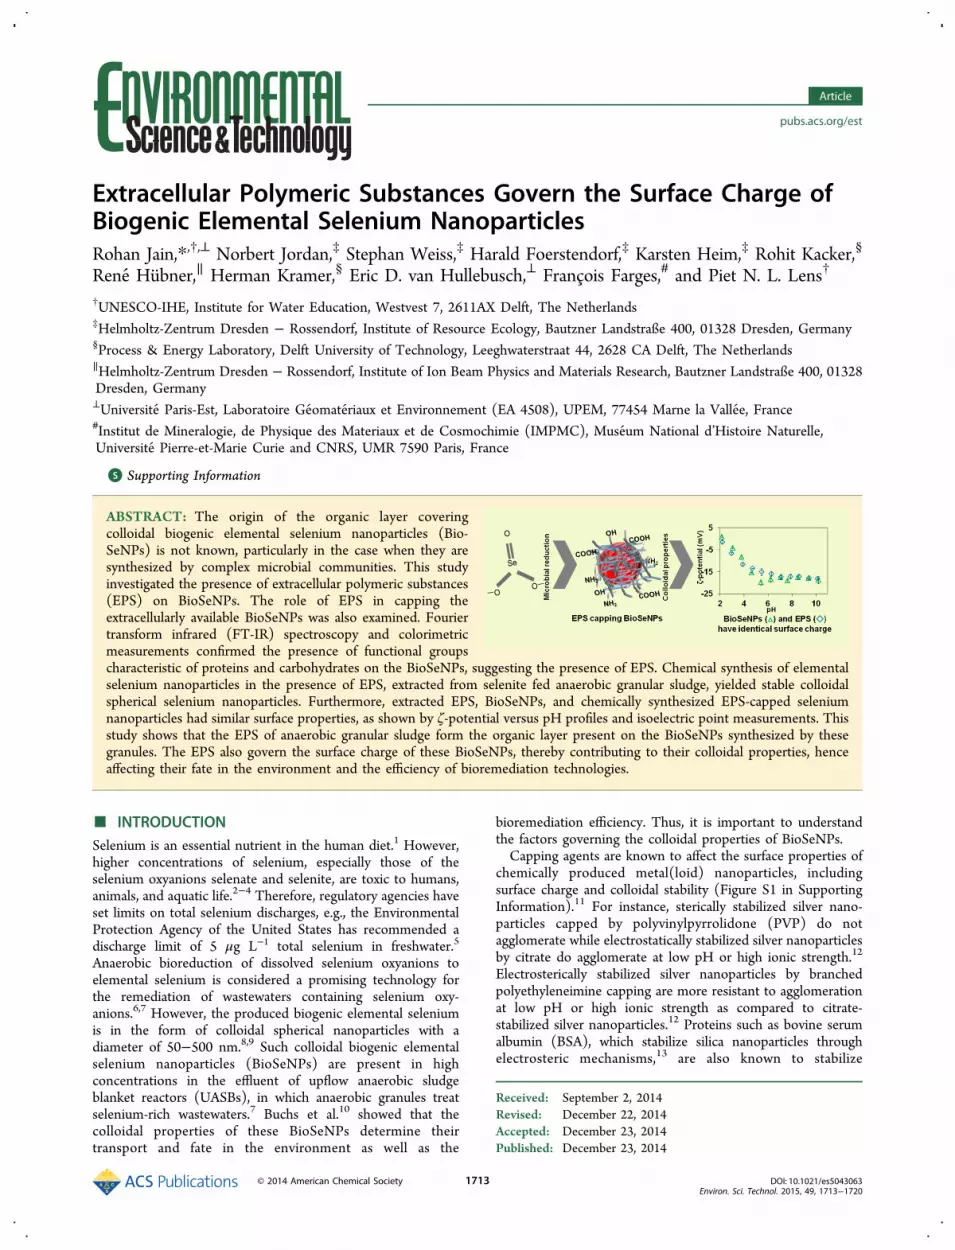
ABSTRACT: The origin of the organic layer coveringcolloidal biogenic elemental selenium nanoparticles (Bio-SeNPs) is not known, particularly in the case when they aresynthesized by complex microbial communities. This studyinvestigated the presence of extracellular polymeric substances(EPS) on BioSeNPs. The role of EPS in capping theextracellularly available BioSeNPs was also examined. Fouriertransform infrared (FT-IR) spectroscopy and colorimetricmeasurements confirmed the presence of functional groupscharacteristic of proteins and carbohydrates on the BioSeNPs, suggesting the presence of EPS. Chemical synthesis of elementalselenium nanoparticles in the presence of EPS, extracted from selenite fed anaerobic granular sludge, yielded stable colloidalspherical selenium nanoparticles. Furthermore, extracted EPS, BioSeNPs, and chemically synthesized EPS-capped seleniumnanoparticles had similar surface properties, as shown by ζ-potential versus pH profiles and isoelectric point measurements. Thisstudy shows that the EPS of anaerobic granular sludge form the organic layer present on the BioSeNPs synthesized by thesegranules. The EPS also govern the surface charge of these BioSeNPs, thereby contributing to their colloidal properties, henceaffecting their fate in the environment and the efficiency of bioremediation technologies.
■ INTRODUCTIONSelenium is an essential nutrient in the human diet.1 However,higher concentrations of selenium, especially those of theselenium oxyanions selenate and selenite, are toxic to humans,animals, and aquatic life.2−4 Therefore, regulatory agencies haveset limits on total selenium discharges, e.g., the EnvironmentalProtection Agency of the United States has recommended adischarge limit of 5 μg L−1 total selenium in freshwater.5
Anaerobic bioreduction of dissolved selenium oxyanions toelemental selenium is considered a promising technology forthe remediation of wastewaters containing selenium oxy-anions.6,7 However, the produced biogenic elemental seleniumis in the form of colloidal spherical nanoparticles with adiameter of 50−500 nm.8,9 Such colloidal biogenic elementalselenium nanoparticles (BioSeNPs) are present in highconcentrations in the effluent of upflow anaerobic sludgeblanket reactors (UASBs), in which anaerobic granules treatselenium-rich wastewaters.7 Buchs et al.10 showed that thecolloidal properties of these BioSeNPs determine theirtransport and fate in the environment as well as the
bioremediation efficiency. Thus, it is important to understandthe factors governing the colloidal properties of BioSeNPs.Capping agents are known to affect the surface properties of
chemically produced metal(loid) nanoparticles, includingsurface charge and colloidal stability (Figure S1 in SupportingInformation).11 For instance, sterically stabilized silver nano-particles capped by polyvinylpyrrolidone (PVP) do notagglomerate while electrostatically stabilized silver nanoparticlesby citrate do agglomerate at low pH or high ionic strength.12
Electrosterically stabilized silver nanoparticles by branchedpolyethyleneimine capping are more resistant to agglomerationat low pH or high ionic strength as compared to citrate-stabilized silver nanoparticles.12 Proteins such as bovine serumalbumin (BSA), which stabilize silica nanoparticles throughelectrosteric mechanisms,13 are also known to stabilize
Received: September 2, 2014Revised: December 22, 2014Accepted: December 23, 2014Published: December 23, 2014
Article
pubs.acs.org/est
© 2014 American Chemical Society 1713 DOI: 10.1021/es5043063Environ. Sci. Technol. 2015, 49, 1713−1720
chemically produced selenium nanoparticles (CheSeNPs).14
Proteins are also known to be associated with theBioSeNPs.15,16 It has been proposed that BioSeNPs are coatedwith an organic layer of microbial origin, composed notexclusively of proteins.17 However, to the best of ourknowledge, the origin of this organic layer and its effect onthe surface charge, and thus on the colloidal properties ofBioSeNPs, are not known.This study hypothesized that extracellular polymeric
substances (EPS) are the capping agents and thus can affectthe surface charge of the BioSeNPs that are availableextracellularly. EPS are high molecular weight macromoleculesthat contain mainly proteins, carbohydrates, humic-likesubstances, and small concentrations of DNA.18,19 Thus, theyprovide many sites that can interact with the elementalselenium. EPS are important components of mixed microbialaggregates, i.e., biofilms or anaerobic granules employed for thetreatment of selenium-rich wastewaters in bioreactors.19−21
Besides, reduction of selenite to BioSeNPs by pure cultures hasbeen reported both in the periplasmic space22 and extracellu-larly,23 which further indicates that the BioSeNPs are likely tobe grown in the presence of EPS.In this study, the presence of an organic layer on the surface
of BioSeNPs was determined from energy-dispersive X-rayspectroscopy (EDXS) and ζ-potential measurements as well asacid−base titrations. The presence of proteins and carbohy-drates, suggesting the presence of EPS on the BioSeNPs, wasconfirmed by Fourier transform infrared spectroscopy (FT-IR)and colorimetric measurements. EPS extracted from selenitefed anaerobic granules was used as a capping agent forCheSeNPs (EPS-capped CheSeNPs), and their colloidalproperties were studied as well. BSA, a well-known cappingagent for CheSeNPs,14,24 was used as a reference material to (a)demonstrate the capping ability of EPS and (b) show that thecapping of BioSeNPs does not exclusively consists of proteins.
■ MATERIALS AND METHODSBioSeNPs Production and Purification. BioSeNPs were
produced using an anaerobic granular sludge treating pulp andpaper wastewater, which has been described in detail by Roestet al.25 Anaerobic granular sludge (13 g L−1 wet weight) wasadded to the oxygen-free growth medium (NH4Cl 5.6, CaCl2·2H2O 0.1, KH2PO4 1.8, Na2HPO4 2.0, KCl 3.3, in mM) with20.0 mM sodium lactate and 5.0 mM sodium selenite. Theincubation was carried out at 30 °C and pH 7.3 for 14 days.The production of elemental selenium was confirmed by theappearance of a red color (Figure S2b in SupportingInformation). The produced BioSeNPs were purified followingthe protocol developed by Dobias et al.16 with minormodifications. Briefly, the supernatant was decanted, followedby simple centrifugation (Hermle Z36HK) at 3 000g and 4 °Cfor 15 min to separate the suspended biomass. The collectedBioSeNPs present in the supernatant from the previouscentrifugation step were concentrated by centrifugation(Hermle Z36HK) at 37 000g and 4 °C for 15 min. The pelletwas resuspended in Milli-Q (18 MΩ cm) water and purified bysonication (15 min at 23 kHz, Soniprep 150, U.K.) followed byhexane separation. The concentration of BioSeNPs wasdetermined by dissolving them in concentrated HNO3 andthen measuring the Se concentration by inductively coupledplasma mass spectrometry (ICP-MS).26
Analysis of the Chemical Composition of theBioSeNPs’ Surface. Thirty mL of purified BioSeNPs (390
mg L−1) were sonicated for 15 min at 23 kHz using Soniprep150 (MSE, U.K.) sonicator. After the sonication, BioSeNPswere centrifuged at 37000g for 30 min at 4 °C (HermleZ36HK). The supernatant was collected and analyzed forcarbohydrates (phenol−sulfuric acid method),27 proteins, andhumic-like substances (modified lowry method by Frølund etal.28). The DNA concentration in the supernatant wasmeasured after precipitation of the DNA with isopropanol,and then the absorbance of the pellet was measured using aspectrophotometer at 260 nm.29
EPS Extraction and Characterization. EPS was extractedfrom anaerobic granules, which were fed with selenite andlactate, and incubated at 30 °C for 14 days, using the NaOHextraction method.30 It is important to note that the NaOHextraction method may slightly alter the molecular structure ofthe EPS,19 which is, however, unavoidable.The total organic carbon (TOC) and total organic nitrogen
(TN) content of the extracted EPS was determined using atotal organic carbon analyzer (Shimadzu TOC-VCPN analyzer,Kyoto, Japan). 3D excitation (220−400 nm) and emission(300−500 nm) fluorescent spectroscopy of extracted EPS(total organic carbon concentration 0.5 mg L−1) was carriedout using a FluoroMax-3 spectrofluorometer (HORIBA JobinYvon, Edison, NJ, U.S.A.) instrument. The carbohydrate,protein, humic-like substances, and DNA content in the EPSwere determined as described above. The FT-IR spectra of EPSwere recorded on a Bruker Vertex 70/v spectrometer equippedwith a D-LaTGS-detector (L-alanine doped triglycine sulfate)(more details in Supporting Information).
Production and Purification of CheSeNPs, EPS-Capped CheSeNPs, and BSA-Capped CheSeNPs. Che-SeNPs were produced by reduction of sodium selenite (100mM, 0.35 mL) by L-reduced glutathione (GSH) (100 mM, 1.4mL) in a total volume of 30 mL at 22 °C. EPS-cappedCheSeNPs and BSA-capped CheSeNPs (chemically producedselenium nanoparticles in the presence of EPS and BSA,respectively) were produced in a similar manner, but in thepresence of 100 mg L−1 total organic carbon of the extractedEPS and 100 mg L−1 of BSA, respectively. After the addition ofNaOH (1 M) to adjust the pH to 7.2, the produced CheSeNPs,EPS-capped CheSeNPs, and BSA-capped CheSeNPs weredialyzed against Milli-Q water (18 MΩ cm) using a 3.5 kDaregenerated cellulose membrane while changing water every 12h for 96 h.14
Selenium Nanoparticles Characterization. BioSeNPswere characterized by scanning electron microscopy (SEM)coupled with EDXS, ζ-potential measurements, hydrodynamicdiameter (HDD) measurements, FT-IR, and acid−basetitrations (see Supporting Information for more details).CheSeNPs were characterized by transmission electronmicroscopy (TEM) coupled with EDXS (TEM-EDXS) (seeSupporting Information for more details). BSA- and EPS-coated CheSeNPs were characterized by TEM-EDXS, ζ-potential measurements, HDD measurements, and FT-IRspectra (see Supporting Information for more details). EPS-and BSA-capped CheSeNPs were contacted with differentinitial concentrations of Zn for ζ-potential measurements (seeSupporting Information for more details).
■ RESULTSSEM-EDXS Analysis of BioSeNPs. The red BioSeNPs
synthesized by the reduction of SeO32− by anaerobic granular
sludge are primarily spherical in shape (Figure S2a in
Environmental Science & Technology Article
DOI: 10.1021/es5043063Environ. Sci. Technol. 2015, 49, 1713−1720
1714
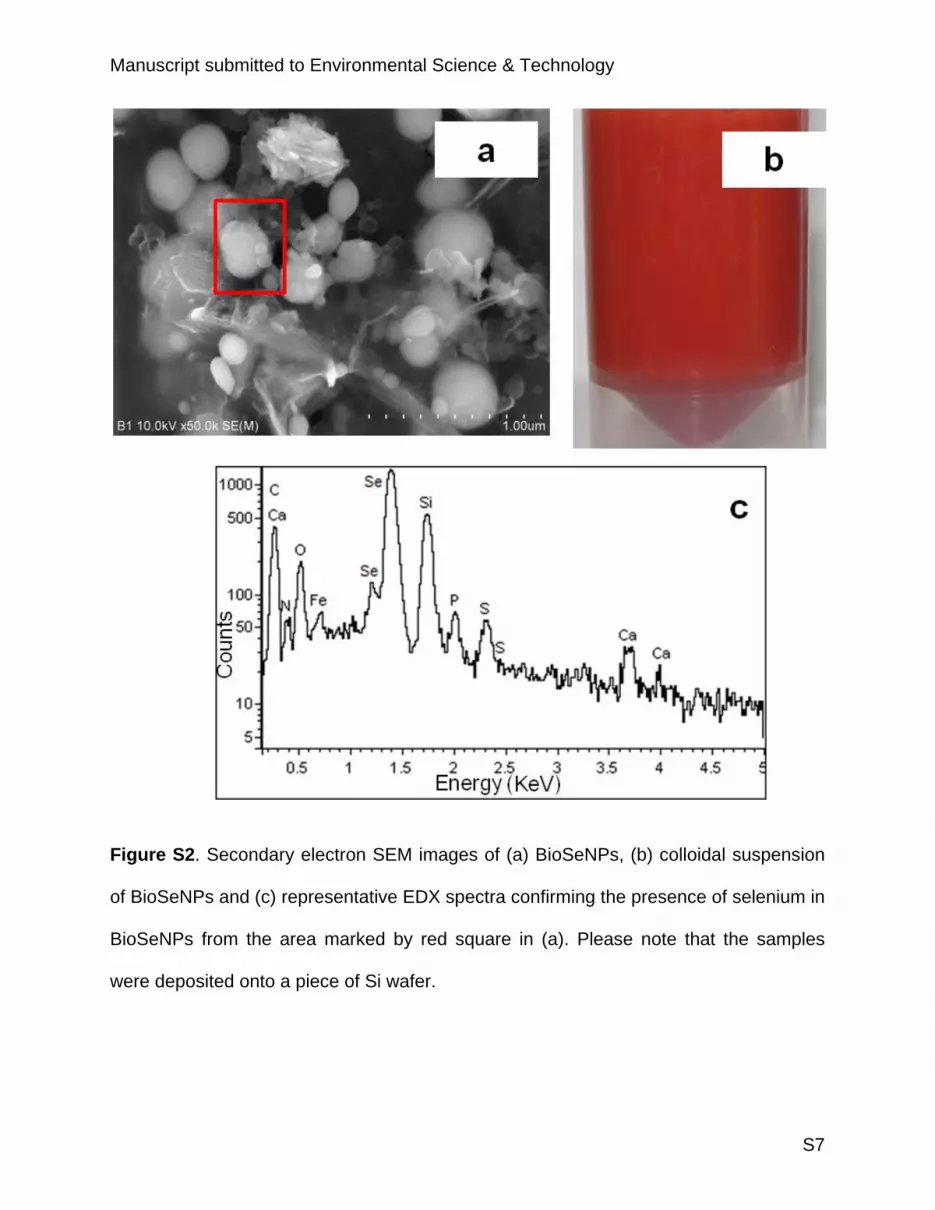
Supporting Information). The resultant BioSeNPs formed astable colloidal suspension (Figure S2b in SupportingInformation). EDXS analysis of the BioSeNPs confirmed thepresence of selenium (Figure S2c in Supporting Information).In addition, carbon, nitrogen, and oxygen as well as weaksignals of phosphorus, sulfur, calcium, and iron were alsoobserved. The presence of carbon, nitrogen, oxygen,phosphorus, and sulfur may be attributed to the EPS coatingof the BioSeNPs, while calcium and iron can be likely tracedback to the anaerobic granules used for the production ofBioSeNPs.Determination of Functional Groups Present on the
Surface of BioSeNPs. The carbohydrates, proteins, humic-likesubstances, and DNA concentrations released in the super-natant after the sonication of purified BioSeNPs were,respectively, 313.8 ± 3.5, 144.1 ± 2.1, 158.2 ± 2.3, and 4.6± 0.8 mg g−1 of BioSeNPs, confirming the presence of EPScomponents19 on the surface of the BioSeNPs.Acid−base titrations were carried out to determine the pKa
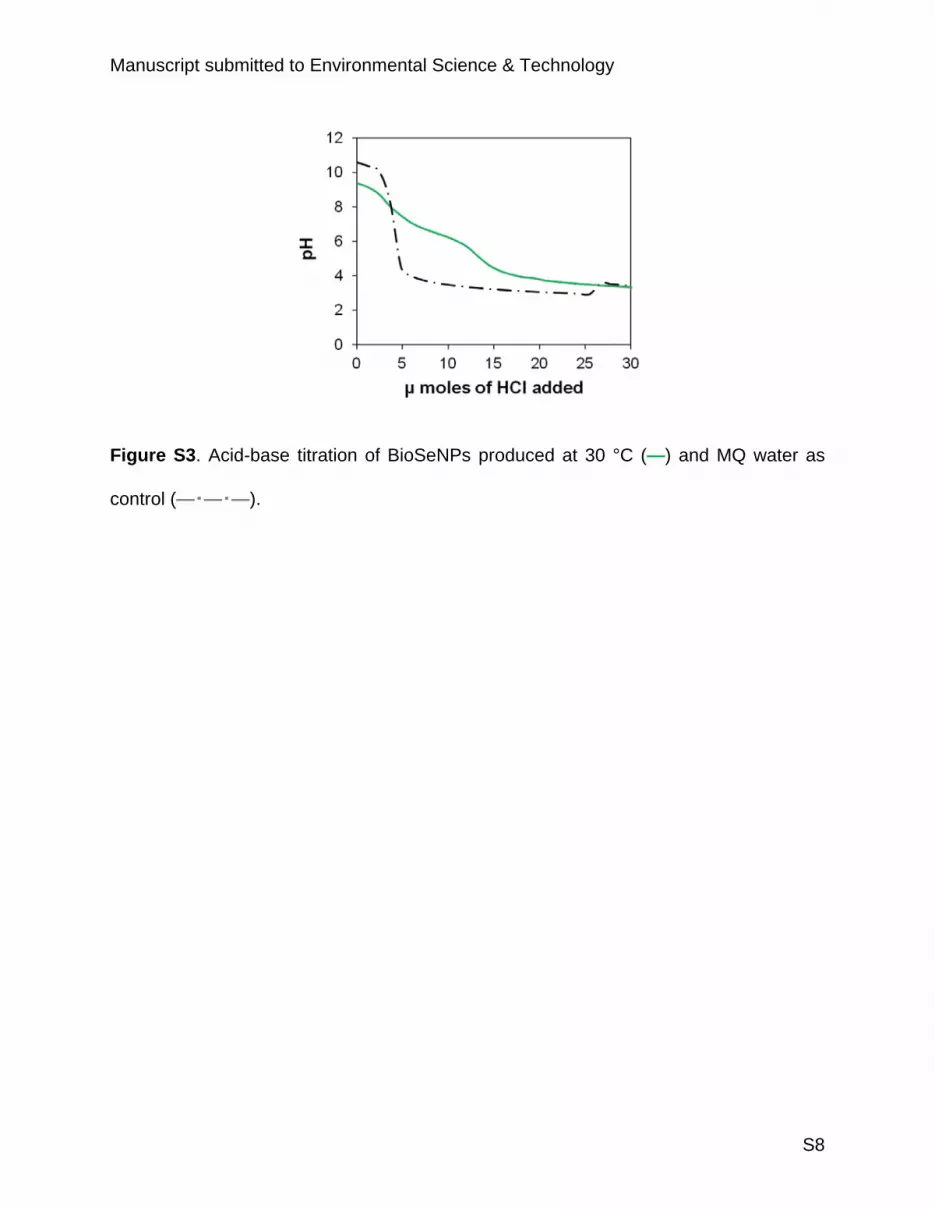
values of the different functional groups present on the surfaceof the BioSeNPs. The acid−base titration curves for BioSeNPs(Figure S3 in Supporting Information) showed smootherlowering of the pH, as compared to the control, with theaddition of acid (HCl). This can be attributed to the bufferingcapacity of the BioSeNPs due to the presence of variousfunctional groups on their surface.31
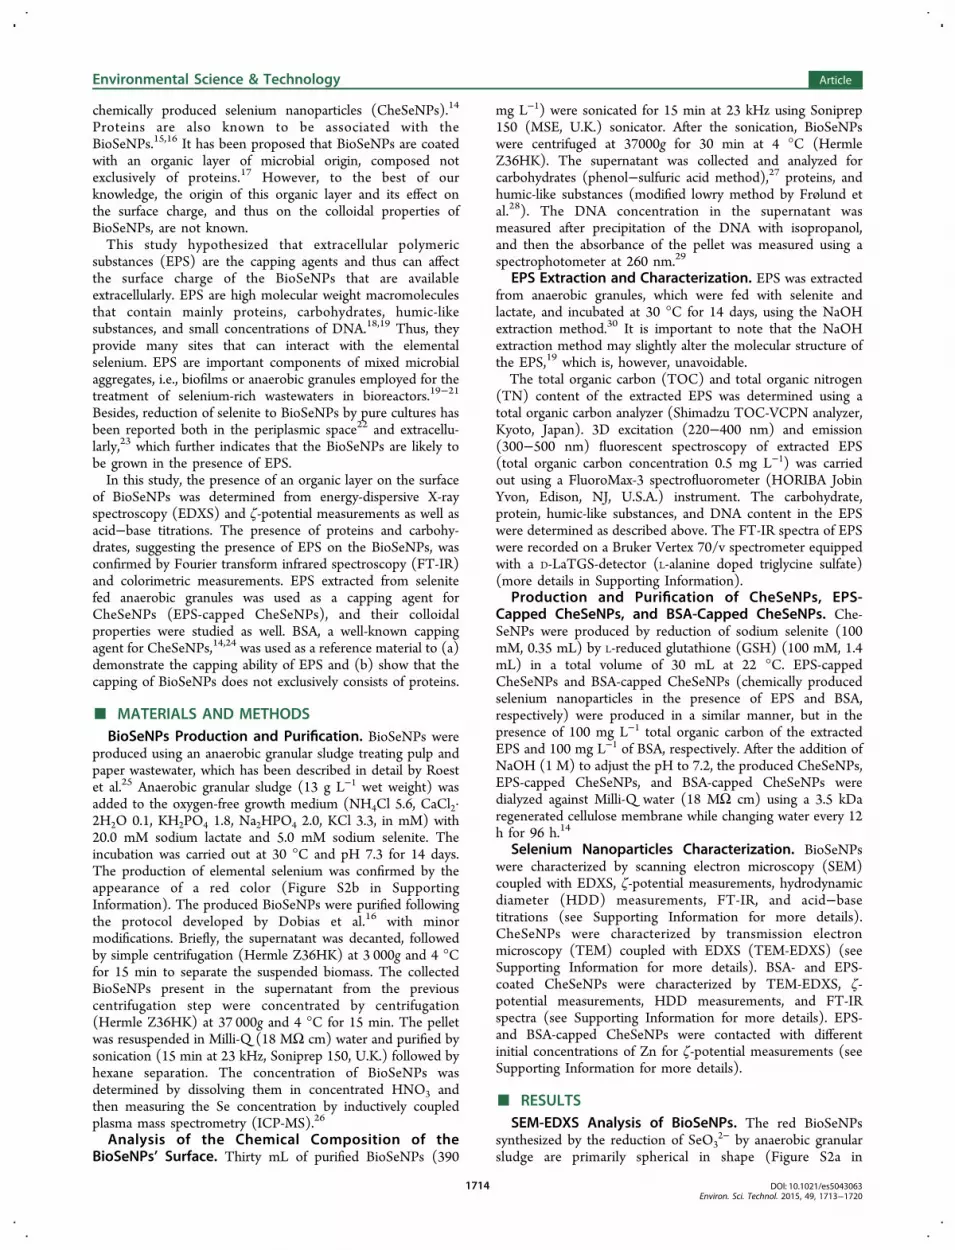
To evaluate the buffering capacity of BioSeNPs in moredetail, the derivative of the acid−base titration was plotted withpH (Figure 1). The local minima represent the minimum
variation of the pH and hence the buffering zones due to theadsorption of H+ ions on the surface of BioSeNPs, whichcorresponds to pKa values of the functional groups present onthe surface of the BioSeNPs.32 It is important to note that localminima will not be observed prominently in the beginning andthe end of titration due to the relatively small pH change. Thedifferent pKa values and their corresponding functional groupsare detailed in Figure 1. The presence of carboxylic acid (pKa =3.9), phosphoric groups (pKa = 6.3), and sulfonic, sulfinic, orthiol groups (pKa = 7.5) were confirmed by the acid−basetitration (Figure 1).31 Most notably absent are the aminogroups, but this may be due to a small change in the pH valueat the beginning of the titrations.Characterization of EPS, EPS-Capped CheSeNPs, BSA-
Capped CheSeNPs, and CheSeNPs. The total organiccarbon and total nitrogen concentration of the extracted EPSwere 116.7 ± 0.5 and 19.0 ± 0.3 mg L−1, respectively. 3Dexcitation emission fluorescent spectroscopy of EPS confirmedthe presence of aromatic proteins humic-like substances (FigureS4 in Supporting Information). The carbohydrates, proteins,
humic-like substances, and DNA concentrations in theextracted EPS were, respectively, 106.9 ± 2.3, 239.5 ± 6.2,184.7 ± 15.3, and 2.7 ± 0.6 mg L−1.The extracted EPS and BSA were used as capping agents for
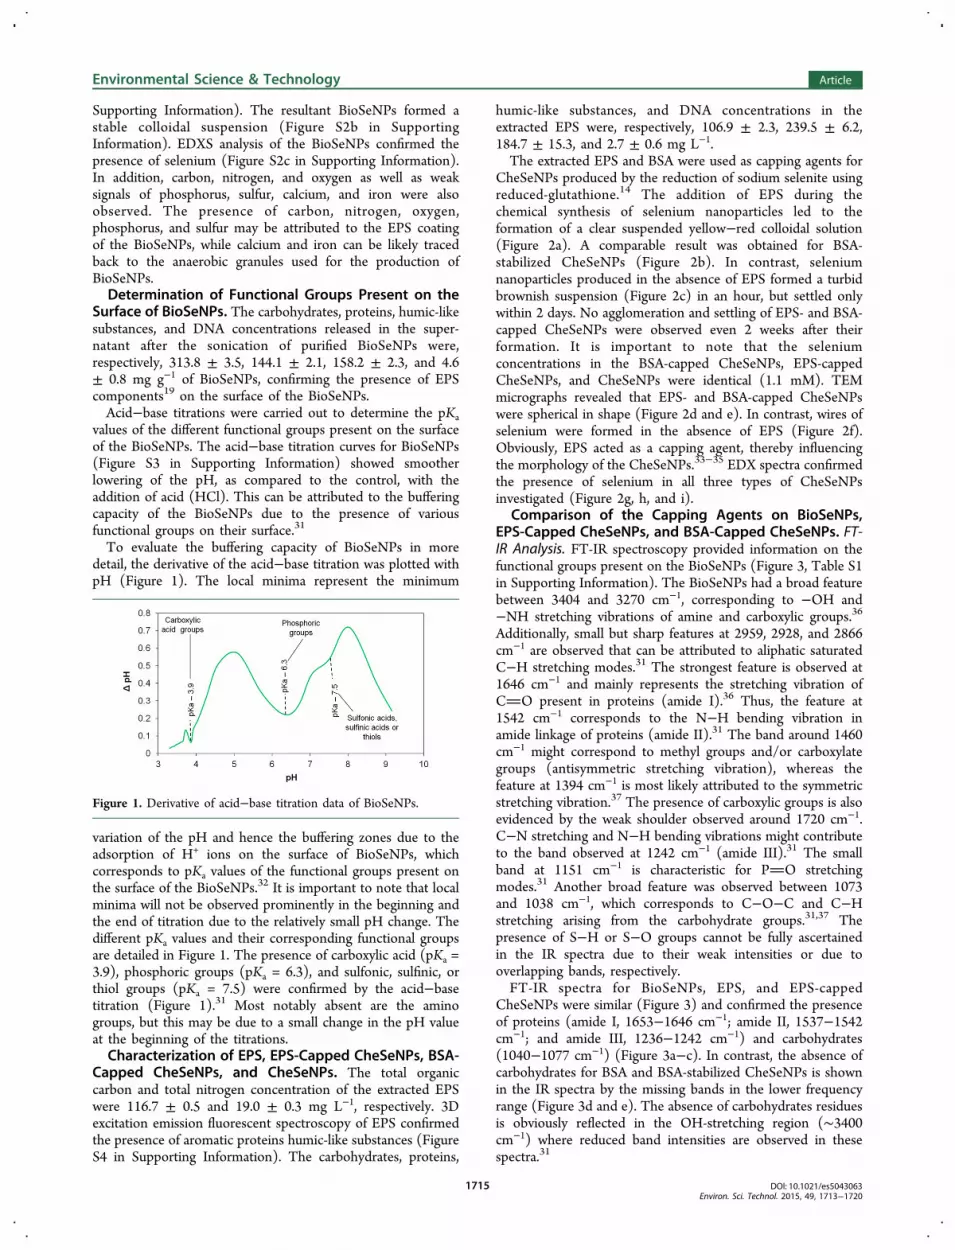
CheSeNPs produced by the reduction of sodium selenite usingreduced-glutathione.14 The addition of EPS during thechemical synthesis of selenium nanoparticles led to theformation of a clear suspended yellow−red colloidal solution(Figure 2a). A comparable result was obtained for BSA-stabilized CheSeNPs (Figure 2b). In contrast, seleniumnanoparticles produced in the absence of EPS formed a turbidbrownish suspension (Figure 2c) in an hour, but settled onlywithin 2 days. No agglomeration and settling of EPS- and BSA-capped CheSeNPs were observed even 2 weeks after theirformation. It is important to note that the seleniumconcentrations in the BSA-capped CheSeNPs, EPS-cappedCheSeNPs, and CheSeNPs were identical (1.1 mM). TEMmicrographs revealed that EPS- and BSA-capped CheSeNPswere spherical in shape (Figure 2d and e). In contrast, wires ofselenium were formed in the absence of EPS (Figure 2f).Obviously, EPS acted as a capping agent, thereby influencingthe morphology of the CheSeNPs.33−35 EDX spectra confirmedthe presence of selenium in all three types of CheSeNPsinvestigated (Figure 2g, h, and i).
Comparison of the Capping Agents on BioSeNPs,EPS-Capped CheSeNPs, and BSA-Capped CheSeNPs. FT-IR Analysis. FT-IR spectroscopy provided information on thefunctional groups present on the BioSeNPs (Figure 3, Table S1in Supporting Information). The BioSeNPs had a broad featurebetween 3404 and 3270 cm−1, corresponding to −OH and−NH stretching vibrations of amine and carboxylic groups.36
Additionally, small but sharp features at 2959, 2928, and 2866cm−1 are observed that can be attributed to aliphatic saturatedC−H stretching modes.31 The strongest feature is observed at1646 cm−1 and mainly represents the stretching vibration ofCO present in proteins (amide I).36 Thus, the feature at1542 cm−1 corresponds to the N−H bending vibration inamide linkage of proteins (amide II).31 The band around 1460cm−1 might correspond to methyl groups and/or carboxylategroups (antisymmetric stretching vibration), whereas thefeature at 1394 cm−1 is most likely attributed to the symmetricstretching vibration.37 The presence of carboxylic groups is alsoevidenced by the weak shoulder observed around 1720 cm−1.C−N stretching and N−H bending vibrations might contributeto the band observed at 1242 cm−1 (amide III).31 The smallband at 1151 cm−1 is characteristic for PO stretchingmodes.31 Another broad feature was observed between 1073and 1038 cm−1, which corresponds to C−O−C and C−Hstretching arising from the carbohydrate groups.31,37 Thepresence of S−H or S−O groups cannot be fully ascertainedin the IR spectra due to their weak intensities or due tooverlapping bands, respectively.FT-IR spectra for BioSeNPs, EPS, and EPS-capped
CheSeNPs were similar (Figure 3) and confirmed the presenceof proteins (amide I, 1653−1646 cm−1; amide II, 1537−1542cm−1; and amide III, 1236−1242 cm−1) and carbohydrates(1040−1077 cm−1) (Figure 3a−c). In contrast, the absence ofcarbohydrates for BSA and BSA-stabilized CheSeNPs is shownin the IR spectra by the missing bands in the lower frequencyrange (Figure 3d and e). The absence of carbohydrates residuesis obviously reflected in the OH-stretching region (∼3400cm−1) where reduced band intensities are observed in thesespectra.31
Figure 1. Derivative of acid−base titration data of BioSeNPs.
Environmental Science & Technology Article
DOI: 10.1021/es5043063Environ. Sci. Technol. 2015, 49, 1713−1720
1715
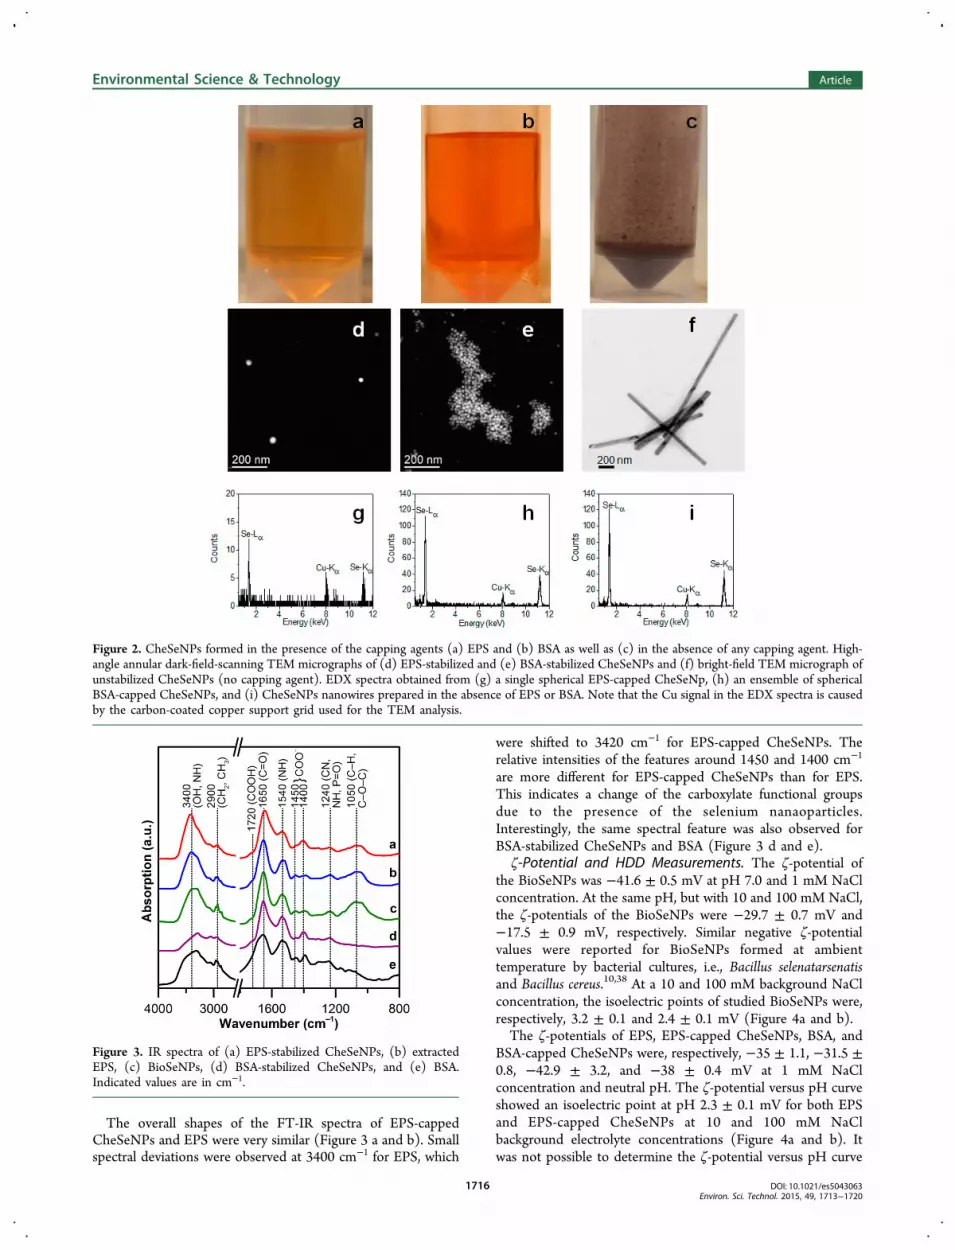
The overall shapes of the FT-IR spectra of EPS-cappedCheSeNPs and EPS were very similar (Figure 3 a and b). Smallspectral deviations were observed at 3400 cm−1 for EPS, which
were shifted to 3420 cm−1 for EPS-capped CheSeNPs. Therelative intensities of the features around 1450 and 1400 cm−1
are more different for EPS-capped CheSeNPs than for EPS.This indicates a change of the carboxylate functional groupsdue to the presence of the selenium nanaoparticles.Interestingly, the same spectral feature was also observed forBSA-stabilized CheSeNPs and BSA (Figure 3 d and e).
ζ-Potential and HDD Measurements. The ζ-potential ofthe BioSeNPs was −41.6 ± 0.5 mV at pH 7.0 and 1 mM NaClconcentration. At the same pH, but with 10 and 100 mM NaCl,the ζ-potentials of the BioSeNPs were −29.7 ± 0.7 mV and−17.5 ± 0.9 mV, respectively. Similar negative ζ-potentialvalues were reported for BioSeNPs formed at ambienttemperature by bacterial cultures, i.e., Bacillus selenatarsenatisand Bacillus cereus.10,38 At a 10 and 100 mM background NaClconcentration, the isoelectric points of studied BioSeNPs were,respectively, 3.2 ± 0.1 and 2.4 ± 0.1 mV (Figure 4a and b).The ζ-potentials of EPS, EPS-capped CheSeNPs, BSA, and
BSA-capped CheSeNPs were, respectively, −35 ± 1.1, −31.5 ±0.8, −42.9 ± 3.2, and −38 ± 0.4 mV at 1 mM NaClconcentration and neutral pH. The ζ-potential versus pH curveshowed an isoelectric point at pH 2.3 ± 0.1 mV for both EPSand EPS-capped CheSeNPs at 10 and 100 mM NaClbackground electrolyte concentrations (Figure 4a and b). Itwas not possible to determine the ζ-potential versus pH curve
Figure 2. CheSeNPs formed in the presence of the capping agents (a) EPS and (b) BSA as well as (c) in the absence of any capping agent. High-angle annular dark-field-scanning TEM micrographs of (d) EPS-stabilized and (e) BSA-stabilized CheSeNPs and (f) bright-field TEM micrograph ofunstabilized CheSeNPs (no capping agent). EDX spectra obtained from (g) a single spherical EPS-capped CheSeNp, (h) an ensemble of sphericalBSA-capped CheSeNPs, and (i) CheSeNPs nanowires prepared in the absence of EPS or BSA. Note that the Cu signal in the EDX spectra is causedby the carbon-coated copper support grid used for the TEM analysis.
Figure 3. IR spectra of (a) EPS-stabilized CheSeNPs, (b) extractedEPS, (c) BioSeNPs, (d) BSA-stabilized CheSeNPs, and (e) BSA.Indicated values are in cm−1.
Environmental Science & Technology Article
DOI: 10.1021/es5043063Environ. Sci. Technol. 2015, 49, 1713−1720
1716

of uncapped CheSeNPs as a small contamination of glutathioneaffected the ζ-potential versus pH profile. In this experiment,the profiles of BSA and BSA-capped CheSeNPs are a positivecontrol as BSA is known to stabilize the selenium nano-particles14,24 with a reported isoelectric point of 4.6 ± 0.1 mV39
(Figure 4a and b).The ζ-potential versus pH profiles of BioSeNPs, EPS, EPS-
capped CheSeNPs, BSA, and BSA-capped CheSeNPs aresimilar from pH 9.5 to 6.0. However, at pH values below 6.0,BioSeNPs, EPS, and EPS-capped CheSeNPs follow similarprofiles and remain more negative than BSA and BSA-cappedCheSeNPs (Figure 4). This leads to a similar isoelectric pointof BioSeNPs, EPS, and EPS-capped CheSeNPs (∼pHIEP 2.4 at100 mM NaCl concentration) as compared to 4.6 observed forBSA and BSA-capped CheSeNPs. It is important to note thatthe isoelectric point of BioSeNPs (pHIEP 3.2 ± 0.1) at 10 mMNaCl background electrolyte was slightly different than theisoelectric point (pHIEP 2.4 ± 0.1) of BioSeNPs at 100 mMNaCl background electrolyte. This change is not significantenough to unambiguously conclude that the differences are dueto the interfering background electrolyte.It has been shown that the ζ-potential of BioSeNPs loaded
with Zn becomes less negative, leading to a lowering of theircolloidal stability.26 Similar experiments with BSA- and EPS-capped CheSeNPs suggested that loading of Zn on theseCheSeNPs also leads to a less negative ζ-potential of −7.3 and−11.0 mV for, respectively, BSA- and EPS-capped CheSeNPscontacted with 1000 mg L−1 Zn (Figure S5 in SupportingInformation). The equilibrium pH varied between 5.5 and 6.5.The zinc concentration required to achieve −5 to −10 mV forBSA- and EPS-capped CheSeNPs was 10 times more than thatrequired for BioSeNPs, even when the concentration ofselenium concentration was 4 times higher in the BioSeNPs.26
This might be due to the smaller size of BSA- and EPS-cappedCheSeNPs (30−50 d-nm) as compared to BioSeNPs (180 d-nm).26
The HDD of BioSeNPs increased slightly from 403 ± 8 to531 ± 6 d-nm when the pH changed from 10.2 to 5.8 at 100mM NaCl concentration. However, when the pH dropped to
4.7 and 3.8, the HDD increased to 862 ± 29 and 2130 ± 180 d-nm, respectively (Figure 4c). The HDD of EPS-cappedCheSeNPs and BSA-capped CheSeNPs also increased as thepH decreased (Figure 4c). There is a large jump in the HDD ofBSA-capped CheSeNPs as the pH approached the isoelectricpoint of BSA. A similar, but smaller jump, in HDD of EPS-capped CheSeNPs is observed as the pH approaches theisoelectric point of EPS. HDD measurements at 10 mM NaClbackground electrolyte (Figure S6 in Supporting Information)gave similar profiles as observed in Figure 4c. It is important tonote that it was not possible to compare the HDD versus pHprofile of CheSeNPs free of capping agents, as these CheSeNPshad a different shape (wire versus sphere) and they sediment ascompared to the capped CheSeNPs (Figure 2).
■ DISCUSSION
EPS Are Present on the BioSeNPs. This study suggested,for the first time, that the organic layer present on theBioSeNPs synthesized by anaerobic granules is the EPS. Thepresence of the various functional groups on the BioSeNPs’surface (Figures 1 and 3) is due to the attached organicpolymers, most likely produced by the microorganisms presentin the anaerobic granules. The presence of carbohydrates,proteins, and humic-like substances, which were released uponsonication of the purified BioSeNPs, suggests that EPScomprising these components are present on the surface ofthe BioSeNPs. The presence of EPS was further suggested bythe presence of amide I and amide II bands (proteins) andstrong bands at 1073 and 1038 cm−1 (carbohydrates) in the IRspectra (Figure 3, Table S1 in Supporting Information). Thepresence of these carbohydrates, which are always a part of EPSand are not observed in IR spectra of pure proteins,31,40
indicates that not protein but EPS containing both proteins andcarbohydrates are present on the BioSeNPs (Figure 3, Table S1in Supporting Information). Moreover, the similar overall shapeof the IR spectra and ζ-potential versus pH variation ofBioSeNPs, EPS, and EPS-capped CheSeNPs (Figures 3 and 4aand b) further confirms the presence of EPS on the surface ofBioSeNPs. The small DNA concentration found on the surface
Figure 4. ζ-Potential measurement of BioSeNP (green square), EPS (blue diamond), EPS-capped CheSeNPs (red triangle), BSA (black circle), andBSA-capped CheSeNPs (blue asterisk) versus pH at (a) 10 mM and (b) 100 mM NaCl background electrolyte concentrations. (c) Hydrodynamicdiameter of BioSeNP (green square), EPS-capped CheSeNPs (red triangle), and BSA-capped CheSeNPs (blue asterisk) versus pH at 100 mM NaClbackground electrolyte concentration.
Environmental Science & Technology Article
DOI: 10.1021/es5043063Environ. Sci. Technol. 2015, 49, 1713−1720
1717
of BioSeNPs rules out the possibility of cell lysis, thus furtherconfirming the layer on BioSeNPs is from EPS and not due tointracellular organics from the microbial cells. This is aninteresting finding as previously only the presence of proteinshas been reported on the surface of BioSeNPs15,16 and theorigin of the organic layer on the BioSeNPs was unknown.17
The similar overall shape of the amide I and -II modes in IRspectra of EPS and EPS-capped CheSeNPs suggests (Figure 3)that the EPS was attached to elemental selenium without majormodification in its secondary structure. The distinct shift ofsome spectral features, e.g., shifting of features from 3400 to3420 cm−1 and 1384 to 1405 cm−1 in EPS-capped CheSeNPsas compared to EPS, cannot be unambiguously attributed to theinteraction of hydroxyl or carboxylic acid groups37 withelemental selenium, respectively, although such assignmentsappear to be obvious. For instance, a slightly different watercontent in the EPS-capped CheSeNPs and EPS samples mightcause similar shifts in the spectrum of a KBr pellet used in thesample preparation for FT-IR analysis. However, the band at1452 cm−1 observed in the spectrum of EPS, but not in theEPS-capped CheSeNPs spectrum, most likely represents theantisymmetric stretching mode of carboxylate groups. Thus, thedisappearance of this mode reflects the interaction of elementalselenium with these functional groups of EPS. The interactionof EPS and elemental selenium with hydroxyl groups suggeststhe likely interaction of the carbohydrate fraction of the EPSwith elemental selenium, as the sugar residues can be expectedto show much more −OH groups. However, further research isrequired to identify the exact EPS fractions interacting with theCheSeNPs and BioSeNPs.The synthesis of BioSeNPs involves two steps: (i) the
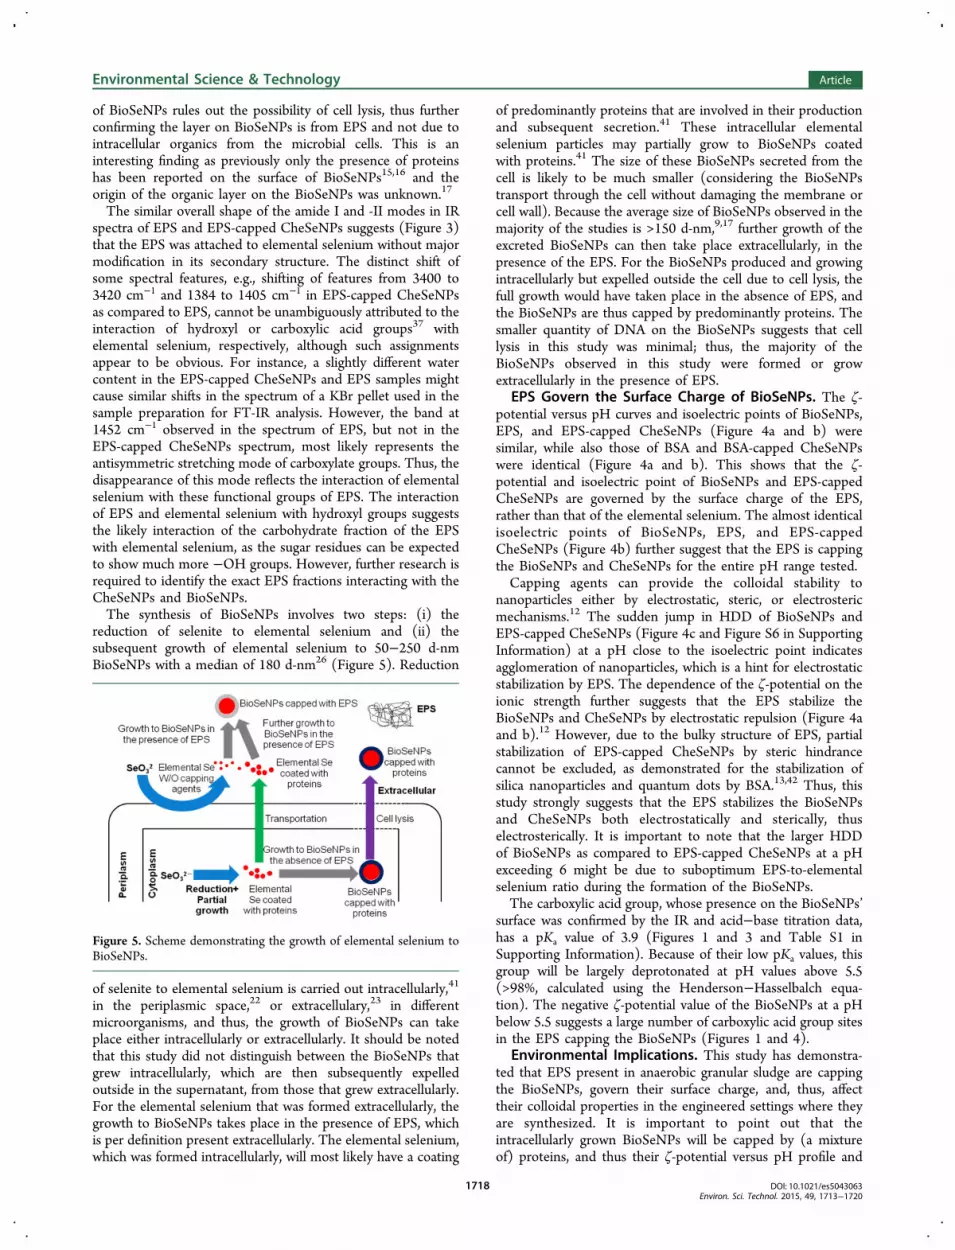
reduction of selenite to elemental selenium and (ii) thesubsequent growth of elemental selenium to 50−250 d-nmBioSeNPs with a median of 180 d-nm26 (Figure 5). Reduction
of selenite to elemental selenium is carried out intracellularly,41
in the periplasmic space,22 or extracellulary,23 in differentmicroorganisms, and thus, the growth of BioSeNPs can takeplace either intracellularly or extracellularly. It should be notedthat this study did not distinguish between the BioSeNPs thatgrew intracellularly, which are then subsequently expelledoutside in the supernatant, from those that grew extracellularly.For the elemental selenium that was formed extracellularly, thegrowth to BioSeNPs takes place in the presence of EPS, whichis per definition present extracellularly. The elemental selenium,which was formed intracellularly, will most likely have a coating
of predominantly proteins that are involved in their productionand subsequent secretion.41 These intracellular elementalselenium particles may partially grow to BioSeNPs coatedwith proteins.41 The size of these BioSeNPs secreted from thecell is likely to be much smaller (considering the BioSeNPstransport through the cell without damaging the membrane orcell wall). Because the average size of BioSeNPs observed in themajority of the studies is >150 d-nm,9,17 further growth of theexcreted BioSeNPs can then take place extracellularly, in thepresence of the EPS. For the BioSeNPs produced and growingintracellularly but expelled outside the cell due to cell lysis, thefull growth would have taken place in the absence of EPS, andthe BioSeNPs are thus capped by predominantly proteins. Thesmaller quantity of DNA on the BioSeNPs suggests that celllysis in this study was minimal; thus, the majority of theBioSeNPs observed in this study were formed or growextracellularly in the presence of EPS.
EPS Govern the Surface Charge of BioSeNPs. The ζ-potential versus pH curves and isoelectric points of BioSeNPs,EPS, and EPS-capped CheSeNPs (Figure 4a and b) weresimilar, while also those of BSA and BSA-capped CheSeNPswere identical (Figure 4a and b). This shows that the ζ-potential and isoelectric point of BioSeNPs and EPS-cappedCheSeNPs are governed by the surface charge of the EPS,rather than that of the elemental selenium. The almost identicalisoelectric points of BioSeNPs, EPS, and EPS-cappedCheSeNPs (Figure 4b) further suggest that the EPS is cappingthe BioSeNPs and CheSeNPs for the entire pH range tested.Capping agents can provide the colloidal stability to
nanoparticles either by electrostatic, steric, or electrostericmechanisms.12 The sudden jump in HDD of BioSeNPs andEPS-capped CheSeNPs (Figure 4c and Figure S6 in SupportingInformation) at a pH close to the isoelectric point indicatesagglomeration of nanoparticles, which is a hint for electrostaticstabilization by EPS. The dependence of the ζ-potential on theionic strength further suggests that the EPS stabilize theBioSeNPs and CheSeNPs by electrostatic repulsion (Figure 4aand b).12 However, due to the bulky structure of EPS, partialstabilization of EPS-capped CheSeNPs by steric hindrancecannot be excluded, as demonstrated for the stabilization ofsilica nanoparticles and quantum dots by BSA.13,42 Thus, thisstudy strongly suggests that the EPS stabilizes the BioSeNPsand CheSeNPs both electrostatically and sterically, thuselectrosterically. It is important to note that the larger HDDof BioSeNPs as compared to EPS-capped CheSeNPs at a pHexceeding 6 might be due to suboptimum EPS-to-elementalselenium ratio during the formation of the BioSeNPs.The carboxylic acid group, whose presence on the BioSeNPs’
surface was confirmed by the IR and acid−base titration data,has a pKa value of 3.9 (Figures 1 and 3 and Table S1 inSupporting Information). Because of their low pKa values, thisgroup will be largely deprotonated at pH values above 5.5(>98%, calculated using the Henderson−Hasselbalch equa-tion). The negative ζ-potential value of the BioSeNPs at a pHbelow 5.5 suggests a large number of carboxylic acid group sitesin the EPS capping the BioSeNPs (Figures 1 and 4).
Environmental Implications. This study has demonstra-ted that EPS present in anaerobic granular sludge are cappingthe BioSeNPs, govern their surface charge, and, thus, affecttheir colloidal properties in the engineered settings where theyare synthesized. It is important to point out that theintracellularly grown BioSeNPs will be capped by (a mixtureof) proteins, and thus their ζ-potential versus pH profile and
Figure 5. Scheme demonstrating the growth of elemental selenium toBioSeNPs.
Environmental Science & Technology Article
DOI: 10.1021/es5043063Environ. Sci. Technol. 2015, 49, 1713−1720
1718
isoelectric point might be different than that of the BioSeNPsgrowing extracellularly in the presence of EPS (Figures 4a andb and 5). This would lead to a different colloidal behavior ofBioSeNPs that are capped with proteins and those that arecapped with EPS in various environmental conditions (pH andinteractions with heavy metals, Figure S5 in SupportingInformation), thus affecting their fate in the environment.The presence of EPS on the surface of BioSeNPs makes
them stable in the colloidal suspension and, thus, mobile in thelow ionic strength and neutral pH environment. This is incontrast to our understanding that EPS of biofilms restrict thedispersion of natural and engineered nanoparticles, as shownfor Se,43 CdSe, Ag, or ZnS nanoparticles.44 Thus, this studyhighlights the importance of further studies on the role of EPSin the fate of bioreduced products of redox-active elements inboth natural and engineered settings.
■ ASSOCIATED CONTENT*S Supporting InformationMethods related to the analytical measurements and extrafigures with experimental data as noted in the text. Thismaterial is available free of charge via the Internet at http://pubs.acs.org
■ AUTHOR INFORMATIONCorresponding Author*Phone: +31 152151816; fax: +31 152122921; e-mail:[email protected] research was supported through the Erasmus MundusJoint Doctorate Environmental Technologies for ContaminatedSolids, Soils, and Sediments (ETeCoS3) (FPA no. 2010-0009).NotesThe authors declare no competing financial interest.
■ ACKNOWLEDGMENTSThe authors thank Dr. Graciella Gil-Gonzalez (KAUST, SaudiArabia) for insightful discussion, Ferdi Battles (UNESCO-IHE,The Netherlands) for the Nanosizer and acid−base titrationexperiments, Berend Lolkema (UNESCO-IHE, The Nether-lands) for TOC, TN, and 3D EEM analysis, Elfi Christalle(Helmholtz-Zentrum, Dresden-Rossendorf, Germany) forSEM-EDXS measurements, and Purvi Jain (Utrecht University,The Netherlands) for DNA measurements.
■ REFERENCES(1) Rayman, M. P. The importance of selenium to human health.Lancet 2000, 356, 233−241.(2) Qin, H.-B.; Zhu, J.-M.; Liang, L.; Wang, M.-S.; Su, H. Thebioavailability of selenium and risk assessment for human seleniumpoisoning in high-Se areas, China. Environ. Int. 2013, 52, 66−74.(3) Lenz, M.; Lens, P. N. L. The essential toxin: the changingperception of selenium in environmental sciences. Sci. Total Environ.2009, 407, 3620−3633.(4) Hamilton, S. J. Review of selenium toxicity in the aquatic foodchain. Sci. Total Environ. 2004, 326, 1−31.(5) United States Environmental Protection Agency website; http://water.epa.gov/scitech/swguidance/standards/criteria/current/.(6) Cantafio, A. W.; Hagen, K. D.; Lewis, G. E.; Bledsoe, T. L.;Nunan, K. M.; Macy, J. M. Pilot-scale selenium bioremediation of sanjoaquin drainage water with Thauera selenatis. Appl. Environ. Microbiol.1996, 62, 3298−3303.(7) Lenz, M.; van Hullebusch, E. D.; Hommes, G.; Corvini, P. F. X.;Lens, P. N. L. Selenate removal in methanogenic and sulfate-reducing
upflow anaerobic sludge bed reactors. Water Res. 2008, 42, 2184−2194.(8) Oremland, R. S.; Herbel, M. J.; Blum, J. S.; Langley, S.; Beveridge,T. J.; Ajayan, P. M.; Sutto, T.; Ellis, A. V.; Curran, S. Structural andspectral features of selenium nanospheres produced by Se-respiringbacteria. Appl. Environ. Microbiol. 2004, 70, 52−60.(9) Jain; Gonzalez-Gil, G.; Singh, V.; van Hullebusch, E. D.; Farges,F.; Lens, P. N. L. Biogenic selenium nanoparticles: production,characterization and challenges. In Nanobiotechnology; Kumar, A.,Govil, J. N., Eds.; Studium Press LLC: Houston, TX, 2014; pp 361−390.(10) Buchs, B.; Evangelou, M. W.-H.; Winkel, L.; Lenz, M. Colloidalproperties of nanoparticular biogenic selenium govern environmentalfate and bioremediation effectiveness. Environ. Sci. Technol. 2013, 47,2401−2407.(11) Faure, B.; Salazar-Alvarez, G.; Ahniyaz, A.; Villaluenga, I.;Berriozabal, G.; De Miguel, Y. R.; Bergstrom, L. Dispersion and surfacefunctionalization of oxide nanoparticles for transparent photocatalyticand UV-protecting coatings and sunscreens. Sci. Technol. Adv. Mater.2013, 14, 023001.(12) El Badawy, A. M.; Luxton, T. P.; Silva, R. G.; Scheckel, K. G.;Suidan, M. T.; Tolaymat, T. M. Impact of environmental conditions(pH, ionic strength, and electrolyte type) on the surface charge andaggregation of silver nanoparticles suspensions. Environ. Sci. Technol.2010, 44, 1260−1266.(13) Paula, A. J.; Silveira, C. P.; Ste, D.; Filho, A. G. S.; Romero, F.V.; Fonseca, L. C.; Tasic, L.; Alves, O. L.; Dura, N. Topography-drivenbionano-interactions on colloidal silica nanoparticles. Appl. Mater.Interfaces 2014, 6, 3437−3447.(14) Zhang, J. S.; Gao, X. Y.; Zhang, L. D.; Bao, Y. P. Biologicaleffects of a nano red elemental selenium. Biofactors 2001, 15, 27−38.(15) Lenz, M.; Kolvenbach, B.; Gygax, B.; Moes, S.; Corvini, P. F. X.Shedding light on selenium biomineralization: proteins associated withbionanominerals. Appl. Environ. Microbiol. 2011, 77, 4676−4680.(16) Dobias, J.; Suvorova, E. I.; Bernier-latmani, R. Role of proteinsin controlling selenium nanoparticle size. Nanotechnology 2011, 22,195605.(17) Winkel, L. H. E.; Johnson, C. A.; Lenz, M.; Grundl, T.; Leupin,O. X.; Amini, M.; Charlet, L. Environmental selenium research: frommicroscopic processes to global understanding. Environ. Sci. Technol.2012, 46, 571−579.(18) More, T. T.; Yadav, J. S. S.; Yan, S.; Tyagi, R. D.; Surampalli, R.Y. Extracellular polymeric substances of bacteria and their potentialenvironmental applications. J. Environ. Manage. 2014, 144, 1−25.(19) Sheng, G.-P.; Yu, H.-Q.; Li, X.-Y. Extracellular polymericsubstances (EPS) of microbial aggregates in biological wastewatertreatment systems: a review. Biotechnol. Adv. 2010, 28, 882−894.(20) Flemming, H.-C.; Wingender, J. The biofilm matrix. Nat. Rev.Microbiol. 2010, 8, 623−633.(21) Dhanjal, S.; Cameotra, S. S. Selenite Stress Elicits PhysiologicalAdaptations in Bacillus sp. (Strain JS-2). J. Microbiol. Biotechnol. 2011,21, 1184−1192.(22) Li, D.-B.; Cheng, Y.-Y.; Wu, C.; Li, W.-W.; Li, N.; Yang, Z.-C.;Tong, Z.-H.; Yu, H.-Q. Selenite reduction by Shewanella oneidensisMR-1 is mediated by fumarate reductase in periplasm. Sci. Rep. 2014,4, 3735.(23) Jiang, S.; Ho, C. T.; Lee, J.-H.; van Duong, H.; Han, S.; Hur, H.-G. Mercury capture into biogenic amorphous selenium nanospheresproduced by mercury resistant Shewanella putrefaciens 200. Chemo-sphere 2012, 87, 621−624.(24) Tran, P. a; Webster, T. J. Selenium nanoparticles inhibitStaphylococcus aureus growth. Int. J. Nanomed. 2011, 6, 1553−1558.(25) Roest, K.; Heilig, H. G. H. J.; Smidt, H.; de Vos, W. M.; Stams,A. J. M.; Akkermans, A. D. L. Community analysis of a full-scaleanaerobic bioreactor treating paper mill wastewater. Syst. Appl.Microbiol. 2005, 28, 175−185.(26) Jain, R.; Jordan, N.; Schild, D.; van Hullebusch, E. D.; Weiss, S.;Franzen, C.; Hubner, R.; Farges, F.; Lens, P. N. L. Adsorption of zinc
Environmental Science & Technology Article
DOI: 10.1021/es5043063Environ. Sci. Technol. 2015, 49, 1713−1720
1719
by biogenic elemental selenium nanoparticles. Chem. Eng. J. 2015, 260,850−863.(27) DuBois, M.; Gilles, K. a.; Hamilton, J. K.; Rebers, P. a.; Smith, F.Colorimetric method for determination of sugars and relatedsubstances. Anal. Chem. 1956, 28, 350−356.(28) Frøland, B.; Griebe, T.; Nielsen, P. H. Enzymatic activity in theactivated-sludge floc matrix. Appl. Microbiol. Biotechnol. 1995, 43, 755−761.(29) Wu, J.; Xi, C. Evaluation of different methods for extractingextracellular DNA from the biofilm matrix. Appl. Environ. Microbiol.2009, 75, 5390−5395.(30) Liu, H.; Fang, H. H. P. Extraction of extracellular polymericsubstances (EPS) of sludges. J. Biotechnol. 2002, 95, 249−256.(31) Wang, L.-L.; Wang, L.-F.; Ren, X.-M.; Ye, X.-D.; Li, W.-W.;Yuan, S.-J.; Sun, M.; Sheng, G.-P.; Yu, H.-Q.; Wang, X.-K. pHdependence of structure and surface properties of microbial EPS.Environ. Sci. Technol. 2012, 46, 737−744.(32) Braissant, O.; Decho, A. W.; Dupraz, C.; Glunk, C.; Przekop, K.M.; Visscher, P. T. Exopolymeric substances of sulfate-reducingbacteria: Interactions with calcium at alkaline pH and implication forformation of carbonate minerals. Geobiology 2007, 5, 401−411.(33) Zhang, Y.; Wang, J.; Zhang, L. Creation of highly stableselenium nanoparticles capped with hyperbranched polysaccharide inwater. Langmuir 2010, 26, 17617−17623.(34) Shah, C. P.; Singh, K. K.; Kumar, M.; Bajaj, P. N. Vinylmonomers-induced synthesis of polyvinyl alcohol-stabilized seleniumnanoparticles. Mater. Res. Bull. 2010, 45, 56−62.(35) Zheng, S.; Li, X.; Zhang, Y.; Xie, Q.; Wong, Y.-S.; Zheng, W.;Chen, T. PEG-nanolized ultrasmall selenium nanoparticles overcomedrug resistance in hepatocellular carcinoma HepG2 cells throughinduction of mitochondria dysfunction. Int. J. Nanomed. 2012, 7,3939−3949.(36) Xu, C.; Zhang, S.; Chuang, C.-Y.; Miller, E. J.; Schwehr, K. A.;Santschi, P. H. Chemical composition and relative hydrophobicity ofmicrobial exopolymeric substances (EPS) isolated by anion exchangechromatography and their actinide-binding affinities. Mar. Chem. 2011,126, 27−36.(37) Zhu, L.; Qi, H.; Lv, M.; Kong, Y.; Yu, Y.; Xu, X. Componentanalysis of extracellular polymeric substances (EPS) during aerobicsludge granulation using FTIR and 3D-EEM technologies. Bioresour.Technol. 2012, 124, 455−459.(38) Dhanjal, S.; Cameotra, S. S. Aerobic biogenesis of seleniumnanospheres by Bacillus cereus isolated from coalmine soil. Microb. CellFact. 2010, 9, 52.(39) Salg, S.; Salgı, U.; Bahad, S. Zeta potentials and isoelectric pointsof biomolecules: the effects of ion types and ionic strengths. Int. J.Electrochem. Sci. 2012, 7, 12404−12414.(40) Kong, J.; Yu, S. Fourier transform infrared spectroscopic analysisof protein secondary structures. Acta Biochim. Biophys. Sin. 2007, 39,549−559.(41) Debieux, C. M.; Dridge, E. J.; Mueller, C. M.; Splatt, P.;Paszkiewicz, K.; Knight, I.; Florance, H.; Love, J.; Titball, R. W.; Lewis,R. J.; et al. A bacterial process for selenium nanosphere assembly. Proc.Natl. Acad. Sci. U.S.A. 2011, 108, 13480−13485.(42) Bucking, W.; Massadeh, S.; Merkulov, A.; Xu, S.; Nann, T.Electrophoretic properties of BSA-coated quantum dots.pdf. Anal.Bioanal. Chem. 2010, 396, 1087−1094.(43) Bajaj, M.; Schmidt, S.; Winter, J. Formation of Se(0)nanoparticles by Duganella sp. and Agrobacterium sp. isolated fromSe-laden soil of North-East Punjab, India. Microb. Cell Fact. 2012, 11,64.(44) Tourney, J.; Ngwenya, B. T. The role of bacterial extracellularpolymeric substances in geomicrobiology. Chem. Geol. 2014, 386,115−132.
Environmental Science & Technology Article
DOI: 10.1021/es5043063Environ. Sci. Technol. 2015, 49, 1713−1720
1720

Manuscript submitted to Environmental Science & Technology
S1
Extracellular polymeric substances govern the surface charge of biogenic elemental selenium nanoparticles
Rohan Jain1,5*, Norbert Jordan2, Stephan Weiss2, Harald Foerstendorf2, Karsten Heim2, Rohit Kacker3, René Hübner4, Herman Kramer3,
Eric D. van Hullebusch5, François Farges6, Piet N. L. Lens1
1UNESCO-IHE, Institute for Water Education, Westvest 7, 2611AX Delft, The
Netherlands
2 Helmholtz-Zentrum Dresden - Rossendorf, Institute of Resource Ecology, Bautzner
Landstraße 400, 01328 Dresden, Germany
3Process & Energy Laboratory, Delft University of Technology, Leeghwaterstraat 44,
2628 CA Delft The Netherlands
4 Helmholtz-Zentrum Dresden - Rossendorf, Institute of Ion Beam Physics and Materials
Research, Bautzner Landstraße 400, 01328 Dresden, Germany
5Université Paris-Est, Laboratoire Géomatériaux et Environnement (EA 4508),
UPEMLV, 77454 Marne-la-Vallée, France
6 Institut de Mineralogie, de Physique des Materiaux et de Cosmochimie (IMPMC),
Muséum National d'Histoire Naturelle, Université Pierre-et-Marie Curie and CNRS UMR
7590, Paris, France.
*Corresponding author:

Manuscript submitted to Environmental Science & Technology
S2
Phone: +31 152151816, fax: +31 152122921 e-mail: [email protected]; mailto:
UNESCO-IHE, Institute for Water Education, Westvest 7, 2611AX Delft, The
Netherlands
The SI contains 12 pages, 6 figures and 1 table.
Manuscript submitted to Environmental Science & Technology
S3
ζ-potential measurements for EPS and BSA capped CheSeNPs loaded with Zn
EPS and BSA-capped CheSeNPs (50 mg L−1) were produced and purified by dialysis
as described in the manuscript. The pH of the EPS and BSA-capped CheSeNPs was
changed to 7.3 using 1 M NaOH. 0.5 mL of ZnCl2 was added to 5.0 mL of EPS and
BSA-capped CheSeNPs to vary the Zn concentration from 50 to 1000 mg L−1. The final
pH of the EPS and BSA-capped CheSeNPs varied from 5.5 to 6.5. The ζ-potential of
EPS and BSA-capped CheSeNPs loaded with Zn were measured in triplicates.
Analytics
SEM-EDXS
To characterize the surface morphology of the BioSeNPs, scanning electron microscopy
(SEM) was performed using a S-4800 microscope (Hitachi) operated at an accelerating
voltage of 10 kV. For qualitative chemical analysis of the BioSeNPs, energy-dispersive
X-ray spectroscopy (EDXS) analysis was carried out by means of a conventional Si(Li)
detector with S-UTW window (Oxford Instruments) attached to the SEM. Sample
preparation was done by spreading a small amount of BioSeNPs solution over a piece
of a silicon wafer, drying it for a few hours at room temperature and mounting the
sample on an aluminum holder for SEM analysis.
ζ-potential and hydrodynamic diameter measurements
The ζ-potential and hydrodynamic diameter (HDD) were calculated by DTS software
(Malvern Instrument) using electrophoretic mobility and dynamic light scattering
measurements carried out at 22 °C by a Nano Zetasizer (Malvern Instruments) at a
laser beam of 633 nm and a scattering angle of 173°. The refractive index of 2.6 for
selenium was used in the HDD measurement.1 As the concentration of selenium
Manuscript submitted to Environmental Science & Technology
S4
nanoparticles in water was low, viscosity of water at 22 °C was used for the
measurements. The general purpose algorithm in the DTS software was used for
calculating the size distribution.
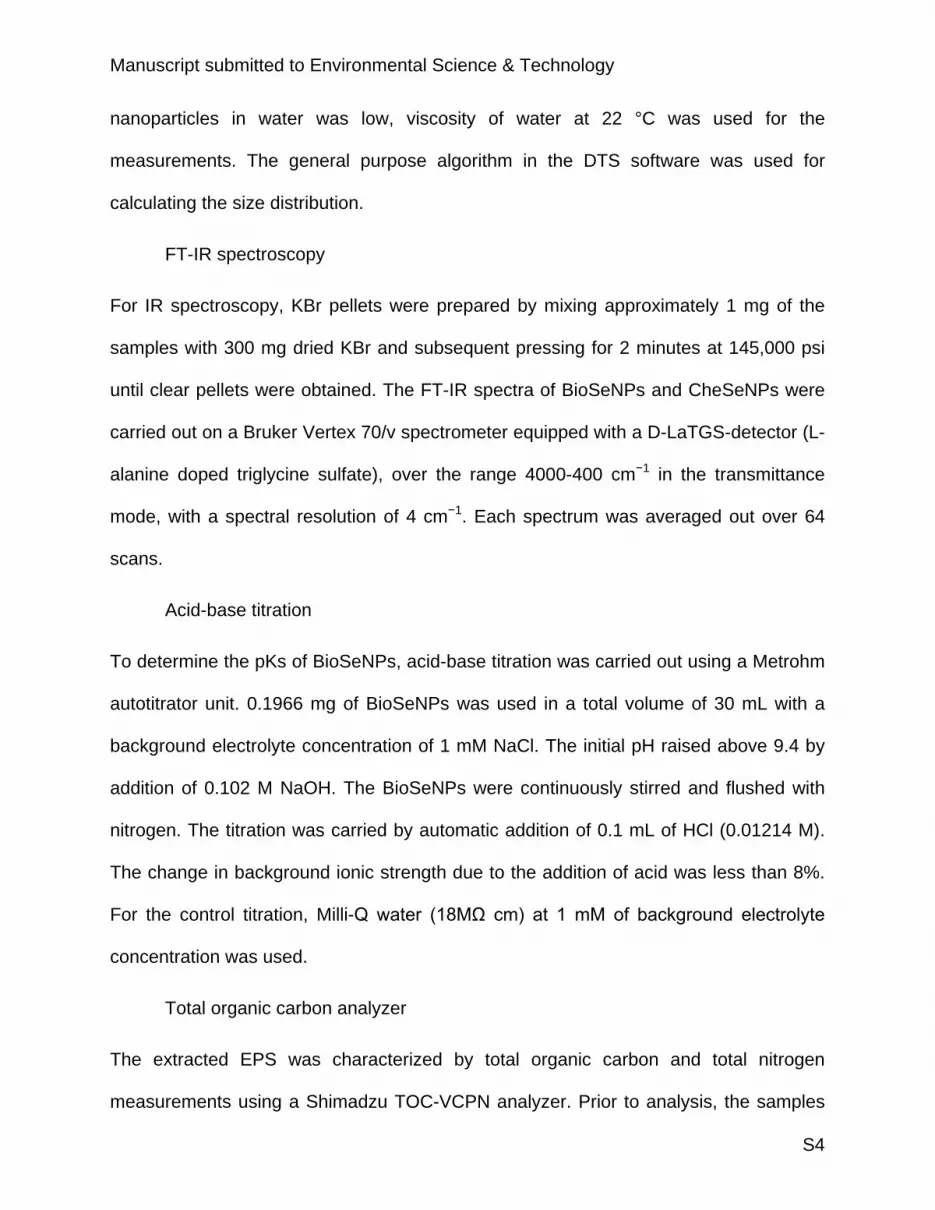
FT-IR spectroscopy
For IR spectroscopy, KBr pellets were prepared by mixing approximately 1 mg of the
samples with 300 mg dried KBr and subsequent pressing for 2 minutes at 145,000 psi
until clear pellets were obtained. The FT-IR spectra of BioSeNPs and CheSeNPs were
carried out on a Bruker Vertex 70/v spectrometer equipped with a D-LaTGS-detector (L-
alanine doped triglycine sulfate), over the range 4000-400 cm−1 in the transmittance
mode, with a spectral resolution of 4 cm−1. Each spectrum was averaged out over 64
scans.
Acid-base titration
To determine the pKs of BioSeNPs, acid-base titration was carried out using a Metrohm
autotitrator unit. 0.1966 mg of BioSeNPs was used in a total volume of 30 mL with a
background electrolyte concentration of 1 mM NaCl. The initial pH raised above 9.4 by
addition of 0.102 M NaOH. The BioSeNPs were continuously stirred and flushed with
nitrogen. The titration was carried by automatic addition of 0.1 mL of HCl (0.01214 M).
The change in background ionic strength due to the addition of acid was less than 8%.
For the control titration, Milli-Q water (18MΩ cm) at 1 mM of background electrolyte
concentration was used.
Total organic carbon analyzer
The extracted EPS was characterized by total organic carbon and total nitrogen
measurements using a Shimadzu TOC-VCPN analyzer. Prior to analysis, the samples

Manuscript submitted to Environmental Science & Technology
S5
were filtered with 0.45 μm filters (Whatman, Dassel, Germany). The determined
dissolved organic carbon was considered as the total organic carbon.
Fluorescence excitation and emission matrix spectroscopy
EPS was characterized for various components using a FluoroMax-3
spectrofluorometer (HORIBA Jobin Yvon, Edison, NJ, USA). The samples were diluted
to bring the dissolved organic carbon concentration below 1 mg L−1. The fluorometer
was operated and stabilized as described in Maeng et al.2 The measurements were
carried out at excitation and emission wavelengths of 200-400 nm and 300-500 nm,
respectively.
TEM-EDXS
Transmission electron microscopy investigations were performed to locally analyze the
microstructure and in particular the morphology of the EPS and BSA-capped
CheSeNPs and CheSeNPs formed in the absence of EPS or BSA. An image-corrected
Titan 80-300 microscope (FEI) operated at an accelerating voltage of 300 kV was used.
For sample preparation, one droplet of nanoparticles suspended in water was deposited
onto a 400 mesh Cu grid coated with a carbon support film. After drying in a desiccator
at room temperature and covering with an additional carbon-coated Cu grid, the TEM
specimen was placed into a double-tilt analytical holder to perform the TEM analyses.

Manuscript submitted to Environmental Science & Technology
S6
Figures and tables
Figure S1. Graphical representation of various stabilization mechanisms of the
nanoparticles inhibiting agglomeration.
Manuscript submitted to Environmental Science & Technology
S7
Figure S2. Secondary electron SEM images of (a) BioSeNPs, (b) colloidal suspension
of BioSeNPs and (c) representative EDX spectra confirming the presence of selenium in
BioSeNPs from the area marked by red square in (a). Please note that the samples
were deposited onto a piece of Si wafer.
Manuscript submitted to Environmental Science & Technology
S8
Figure S3. Acid-base titration of BioSeNPs produced at 30 °C (—) and MQ water as
control (—‧—‧—).

Manuscript submitted to Environmental Science & Technology
S9

Manuscript submitted to Environmental Science & Technology
S10
Figure S4. 3D fluorescence spectra of extracted EPS: (a) confirming the presence of
aromatic proteins and soluble microbial byproduct by observing a maxima at excitation
and emission wavelength of 230/370 nm and excitation and emission wavelength of
300/370 nm, respectively; and (b) further aromatic proteins by observing a maxima at
excitation and emission wavelength of 230/330 nm.
Figure S5. ζ-potential variation of BSA (*) and EPS (∆) capped CheSeNPs with
increasing Zn concentrations.
Manuscript submitted to Environmental Science & Technology
S11
Figure S6. Hydrodynamic measurements were carried out for BioSeNP (□), EPS
capped CheSeNPs (∆) and BSA capped CheSeNPs (*) versus pH at 10 mM NaCl
background electrolyte concentrations.
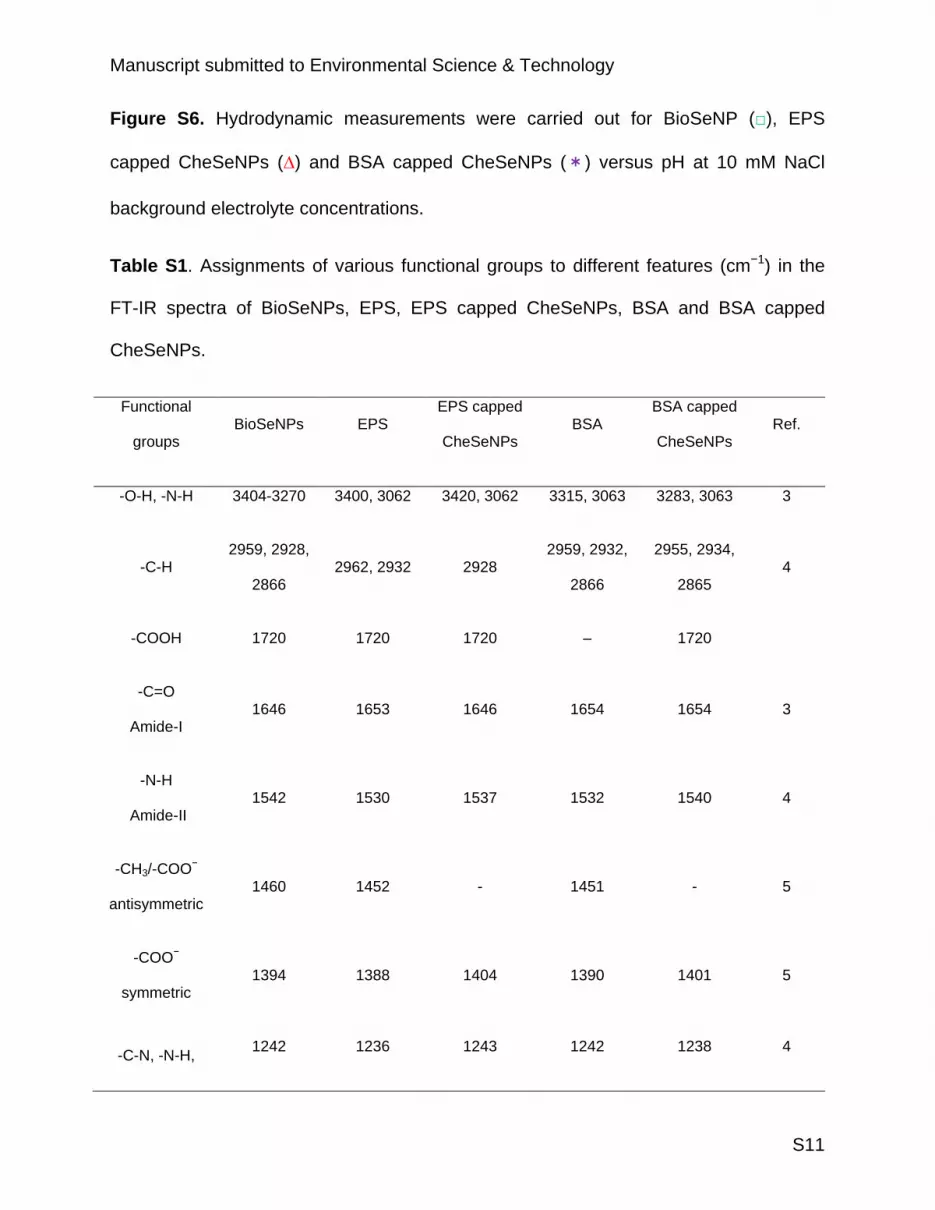
Table S1. Assignments of various functional groups to different features (cm−1) in the
FT-IR spectra of BioSeNPs, EPS, EPS capped CheSeNPs, BSA and BSA capped
CheSeNPs.
Functional
groups BioSeNPs EPS
EPS capped
CheSeNPs BSA
BSA capped
CheSeNPs Ref.
-O-H, -N-H 3404-3270 3400, 3062 3420, 3062 3315, 3063 3283, 3063 3
-C-H 2959, 2928,
2866 2962, 2932 2928
2959, 2932,
2866
2955, 2934,
2865 4
-COOH 1720 1720 1720 – 1720
-C=O
Amide-I 1646 1653 1646 1654 1654 3
-N-H
Amide-II 1542 1530 1537 1532 1540 4
-CH3/-COO−
antisymmetric 1460 1452 - 1451 - 5
-COO−
symmetric 1394 1388 1404 1390 1401 5
-C-N, -N-H, 1242 1236 1243 1242 1238 4

Manuscript submitted to Environmental Science & Technology
S12
P=O
-P–O 1151 1153 1151 1166 - 4
-C-O-C, -C-H 1073 - 1038 1077-1040 1077-1040 - - 4, 5
References
(1) Dobias, J.; Suvorova, E. I.; Bernier-latmani, R. Role of proteins in controlling selenium nanoparticle size. Nanotechnology 2011, 22, 195605.
(2) Maeng, S. K.; Sharma, S. K.; Abel, C. D. T.; Magic-Knezev, A.; Song, K.-G.; Amy, G. L. Effects of effluent organic matter characteristics on the removal of bulk organic matter and selected pharmaceutically active compounds during managed aquifer recharge: Column study. J. Contam. Hydrol. 2012, 140-141, 139–149.
(3) Xu, C.; Zhang, S.; Chuang, C.; Miller, E. J.; Schwehr, K. A.; Santschi, P. H. Chemical composition and relative hydrophobicity of microbial exopolymeric substances (EPS) isolated by anion exchange chromatography and their actinide-binding affinities. Mar. Chem. 2011, 126, 27–36.
(4) Wang, L.-L.; Wang, L.-F.; Ren, X.-M.; Ye, X.-D.; Li, W.-W.; Yuan, S.-J.; Sun, M.; Sheng, G.-P.; Yu, H.-Q.; Wang, X.-K. pH dependence of structure and surface properties of microbial EPS. Environ. Sci. Technol. 2012, 46, 737–744.
(5) Zhu, L.; Qi, H.; Lv, M.; Kong, Y.; Yu, Y.; Xu, X. Component analysis of extracellular polymeric substances (EPS) during aerobic sludge granulation using FTIR and 3D-EEM technologies. Bioresour. Technol. 2012, 124, 455–459.