extra-heavy crude oil viscosity reduction using and ... - mdpi
TRANSCRIPT

processes
Article
Extra-Heavy Crude Oil Viscosity Reduction Using and ReusingMagnetic Copper Ferrite Nanospheres
Lucía Mateus 1,†, Esteban A. Taborda 2,†, Carlos Moreno-Castilla 3 , María Victoria López-Ramón 4,* ,Camilo A. Franco 5 and Farid B. Cortés 5,*
�����������������
Citation: Mateus, L.; Taborda, E.A.;
Moreno-Castilla, C.; López-Ramón,
M.V.; Franco, C.A.; Cortés, F.B.
Extra-Heavy Crude Oil Viscosity
Reduction Using and Reusing
Magnetic Copper Ferrite
Nanospheres. Processes 2021, 9, 175.
https://doi.org/10.3390/pr9010175
Received: 3 December 2020
Accepted: 15 January 2021
Published: 19 January 2021
Publisher’s Note: MDPI stays neutral
with regard to jurisdictional claims in
published maps and institutional affil-
iations.
Copyright: © 2021 by the authors.
Licensee MDPI, Basel, Switzerland.
This article is an open access article
distributed under the terms and
conditions of the Creative Commons
Attribution (CC BY) license (https://
creativecommons.org/licenses/by/
4.0/).
1 Facultad de Ciencias, Universidad de Ciencias Aplicadas y Ambientales U.D.C.A., Bogotá 111166, Colombia;[email protected]
2 Vicepresidencia de Exploración, ECOPETROL, Bogotá 110321, Colombia; [email protected] Departamento de Química Inorgánica, Universidad de Granada, 18071 Granada, Spain; [email protected] Departamento de Química Inorgánica y Orgánica, Universidad de Jaén, 23071 Jaén, Spain5 Grupo de Investigación en Fenómenos de Superficie—Michael Polanyi, Departamento de Procesos y Energía,
Facultad de Minas, Universidad Nacional de Colombia, Sede Medellín, Medellín 050034, Colombia;[email protected]
* Correspondence: [email protected] (M.V.L.-R.); [email protected] (F.B.C.)† These two authors contributed in equal proportions.
Abstract: The main objective of this study is the synthesis, use, and reuse of magnetic copper ferritenanospheres (CFNS) for extra-heavy oil viscosity reduction. The CFNS were synthesized using asolvothermal method resulting in mean particle size of 150 nm. Interactions of CFNS with the crudeoil were evaluated through asphaltene adsorption isotherms, as well as static and dynamic rheologymeasurements for two cycles at 25 ◦C. Adsorption and desorption experiments corroborated thatmost of the asphaltenes adsorbed can be removed for nanoparticle reuse. During the rheology tests,nanoparticles were evaluated in the first cycle at different concentrations from 300 to 1500 mg/L,leading to the highest degree of viscosity reduction of 18% at 500 mg/L. SiO2 nanoparticles wereevaluated for comparison issues, obtaining similar results regarding the viscosity reduction. Aftermeasurements, the CFNS were removed with a magnet, washed with toluene, and further dried forthe second cycle of viscosity reduction. Rheology tests were performed for a second time at a fixedconcentration of 500 mg/L, and slight differences were observed regarding the first cycle. Finally,changes in the extra-heavy oil microstructure upon CFNS addition were observed according to thesignificant decrease in elastic and viscous moduli.
Keywords: magnetic copper ferrite nanospheres; extra-heavy crude oil; viscosity reduction; nanoma-terial reuse
1. Introduction
The current petroleum reserves worldwide are mainly attributed to heavy (HO) andextra-heavy (EHO) crude oils, which represent the double regarding for the conventionaloils [1,2]. In particular, Colombia is not distant from the worldwide panorama, where EHOand HO represent around 60% of the total production [3,4]. However, different processesin the oil and gas (O&G) industry remain challenging due to these crude oils’ complexity,including the production, transport, and refining. Crude oils have a low API gravity andhigh viscosity generally attributed to the high content of asphaltenes and resins and thepossible viscoelastic network between these compounds [5–12]. Various fluids such aslight crude oil, naphtha, diesel, and others, as well as gases (mainly CO2), are commonlyused to reduce the viscosity of crude oils [13–16]. However, these solvents can generateasphaltenes’ instability, further blocking the formation and oil pipelines [13,14]. In Colom-bia, for example, between 2005 and 2016 the crude oil transport increased from 150,000 to450,000 bpd, with naphtha the solvent most often used for diluting HO and EHO to reachconditions for pipeline transport (400 cSt @ 311 K, 18◦API, and BSW < 0.5%) [17–21].
Processes 2021, 9, 175. https://doi.org/10.3390/pr9010175 https://www.mdpi.com/journal/processes

Processes 2021, 9, 175 2 of 16
Improving HO and EHO mobility by reducing viscosity has been a topic of significantinterest [19,22–32]. For instance, the company Geo Estratos S.A. [33] reported using differ-ent viscosity-reducing agents based on terpolymers, with up to 60% viscosity reductionwith a dosage of 3% v/v. Mortazavi-Manesh and Shaw [34] evaluated the rheologicalproperties of Maya crude oil using different solvents at different temperatures, showingthat the toluene + butanone mixture was the best of the mixes evaluated. Gateau et al. [25]also studied the blend between solvents and naphtha for reducing oil viscosity reduc-tion. However, a high amount of solvents is required, which can generate asphalteneprecipitation and create environmental hazards from the generation of polluting gases [35].Oil-in-water (O/W) emulsions are also an alternative for improving the transport of HOand EHO [22,31]. This process has been used at the industrial level in Venezuela andlabeled Orimulsion® [19,36–38].
Moreover, a few authors have recently evaluated the use of nanoparticles and nanoflu-ids for HO viscosity reduction [39–42]. In our previous studies [43–46], nanoparticles ofdifferent chemical natures (SiO2, Al2O3, Fe2O3, etc.) have been synthesized for dispersioninto fluids. The main mechanism of viscosity reduction upon nanoparticles’ addition is themodification of the heavy crude oil’s internal structure [44]. However, the nanoparticles’reuse has not been evaluated due to removing the nanomaterial from oil is a complicatedtask and could increase the costs of the transporting process. The nanomaterial separationprocess also depends on the efficiency and the nanofluid dosage, which generates aneconomically unviable situation.
Consequently, this study proposes a novel solution by evaluating nanoparticles withmagnetic characteristics capable of being removed from the fluid and reused in newviscosity reduction cycles. In this method, the additional cost of adding the particles willbe reduced due to the reuse of the nanoparticles. The procedure aims to enhance theproduction and transportation processes, reducing the problems associated with theseprocesses previously mentioned. Therefore, this work’s main objective is to evaluate theuse and reuse of copper ferrite nanospheres (CFNS) to reduce the viscosity of EHO. Theprocess takes advantage of the magnetic properties of CFNS, which allows them to beeasily removed from the crude oil matrix using a magnet once the first cycle of viscosityreduction has finished. In this manner, different dosages of nanoparticles were added tothe crude to reduce viscosity. Additionally, two viscosity-reduction cycles were evaluated,removing the nanoparticles from the oil, washing them, and adding them again, withsimilar performances to the first cycle of viscosity reduction. The results of this studysuggest that the use of this class of particles is capable of enhancing heavy crude transportand mobility processes and offers a complementary technique to conventional processeswith promising performances for the O&G industry.
2. Materials and Methods2.1. Materials
Sodium acetate, ethylene glycol, polyethylene glycol, CuCl2·2H2O and FeCl3·6H2Oof high purity were used as reagents for the synthesis of copper ferrite nanospheres. n-Heptane was used for asphaltene isolation from an extra heavy crude oil (EHO). Toluene(99.8%) was used in the asphaltene adsorption test. All chemical reagents used were ofhigh purity and supplied by Sigma-Aldrich (Madrid, Spain).
2.2. Synthesis of Copper Ferrite Nanospheres
CFNS was prepared by a solvothermal method described elsewhere [47]. For thispurpose, CuCl2·2H2O and FeCl3·6H2O were dissolved in ethylene glycol to form a clearsolution, followed by the addition of sodium acetate and polyethylene glycol. The mixturewas vigorously stirred for 30 min and then sealed in a 125-mL Teflon-lined stainless-steelautoclave, which was heated to 200 ◦C for 12 h before cooling to room temperature. Theblack solid was centrifuged and washed three times with ethanol (50 mL/g) and dried at60 ◦C for 8 h.

Processes 2021, 9, 175 3 of 16
2.3. Physicochemical Characterization Methods
The morphology of CFNS was assessed with a transmission electron microscope(TEM) and a scanning electron microscope (SEM). TEM experiments were carried out witha JEOL JEM-1010 microscope (JEOL Europe SAS, Croissy, France), and SEM micrographswere obtained with Carl Zeiss SMT equipment (Carl Zeiss SMT, Oberkochen, Germany).The Brunauer–Emmett–Teller surface area (SBET) was determined fromN2 adsorption–desorption isotherm at –196 ◦C, obtained with an Autosorb 1 from Quantachrome (BoyntonBeach, FL, USA). X-ray photoelectron spectroscopy (XPS) was performed using an EscaLab200R system (Thermo Fisher Scientific, East Grinstead, UK) equipped with an MgKα X-raysource and a hemispherical electron analyzer [47].
The crystalline structure of CFNS was characterized by X-ray diffraction (XRD) andcollected on an X-ray Empyrean diffractometer with a PIXcel3D detector (Malvern Pan-alytical, Almelo, The Netherlands) under the following experimental conditions: CuKαradiation, 40 kV and 30 mA, in a 2θ range between 10 and 70◦ with 0.01◦ step size and anintegration time of 100 s. Identification and quantification of the different phases present ineach sample were assessed using a Rietveld refinement method [48,49] using HighScorePlus software [50] and the Crystallography Open Database [51].
A Superconducting Quantum Interface Device (SQUID) magnetometer (QuantumDesign model MPMS-XL, San Diego, CA, USA) was used to record the magnetization (M)of CFNS at room temperature as a function of the magnetic field applied (H). The mag-netic hysteresis (M-H) curve describes the magnetic response of the material and permitsmeasurement of the saturation (MS), remnant magnetization (MR), and coercivity (HC).
2.4. Extra-Heavy Crude Oil
The EHO sample has a 20% content of asphaltene, as well as an API gravity of 6.4◦
at 15.6 ◦C. n-C7 asphaltenes were obtained as described elsewhere [52–54]. The elementalanalysis showed a content of 81.7, 7.8, 0.3, 6.6, and 3.6% wt. of C, H, O, N, and S, respectively.In addition, n-C7 asphaltene’s molecular weight of 907.3 g/mol was obtained throughvapor pressure osmometry.
2.5. Adsorption/Desorption Tests
The adsorption and desorption cycles were evaluated in this manuscript, as de-scribed below. n-C7 asphaltenes were dissolved in toluene at different concentrationsup to 3000 mg/L. A fixed amount of 100 mg of CFNS was added to 10 mL of solutionand kept under 200 rpm for 24 h [53,55]. The amount adsorbed “Nads” (mg/g) is obtainedas follows:
Nads = (C− CE) ∗ (V/W) (1)
where C and CE are the concentrations of the n-C7 asphaltenes before and after adsorptiononto de CFNS, W (g) is the dry mass of CFNS, and V (L) the solution volume. CE is obtainedthrough absorbance changes using a GENESYS 10S UV-vis spectrophotometer (ThermoScientific, Waltham, MA, USA), as reported in previous studies [53,55–57]. This test wasperformed in triplicate.
CFNS with adsorbed n-C7 asphaltenes were dried (120 ◦C and 24 h) before evaluatingthe desorption tests. Then, the dried material was added to pure toluene and stirred for 72 hat 200 rpm, and the remaining adsorbed n-C7 asphaltenes “Nads,rem” (mg/g) is calculatedas follows [58,59]:
Nads,rem = Nads − CE,rem ∗ (V/W) (2)
where CE,rem (mg/L) is the asphaltene concentration in toluene after the desorption process.
2.6. Rheological Measurements2.6.1. Steady-State Rheology
The effect of CFNS on crude oil rheological properties was assessed through steady-state and dynamic rheological measurements, as reported in previous studies [44,45,60,61].
Processes 2021, 9, 175 4 of 16
For this, a Kinexus Pro rotational rheometer (Malvern Instruments, Worcestershire, UK)was employed. The effect of the concentration was evaluated by adding CFNS to the EHOmatrix at different concentrations (300, 500, 700, 1000, and 1500 mg/L). The rheologicalmeasurements were evaluated in a shear rate range 1–100 s−1 at 25 ◦C, which was done intriplicate. Nanoparticles were added to the crude oil matrix by stirring at 500 rpm for 30 minuntil homogenization [44]. To evaluate the reuse of the CFNS in the process of reducingthe viscosity of EHO, we conducted a new measurement labeled as the second cycle ofviscosity reduction by adding CFNS. The nanoparticles previously added to the EHOmatrix were removed from the crude oil, taking advantage of their magnetic properties byadding a magnet and manually stirring the crude oil. Subsequently, the magnet with thenanoparticles adhered to the surface was manually removed. The CFNS nanoparticles werethen removed and reconditioned for use by means of a rigorous 10 h wash with toluene.The first cycle step was repeated, but only 500 mg/L were added (the best dosage obtainedfrom the first round of rheological tests).
2.6.2. Dynamic Rheology Measurements
Dynamic rheology (oscillometry tests) were conducted with amplitude and frequencysweep tests. A strain-sweep test was performed to evaluate the linear viscoelasticity region.In addition, an oscillatory amplitude test was made for viscoelastic moduli estimation ofEHO and first- and second-cycle EHO with 500 mg/L CFNS nanoparticles were performedusing a rotational rheometer Kinexus Pro (Malvern, UK). A fixed frequency (ω) of 10 rad/swas employed, and the percentage of strain (γ) varied between 0.1% and 100% at a. Astrain value of 2% was employed for dynamic rheological tests [62–65]. Finally, a frequencyrange of 0.1–100 rad/s at 25 ◦C was used for oscillatory frequency tests.
3. ModelingSolid–Liquid Equilibrium (SLE) Model
The solid–liquid equilibrium (SLE) model was employed to describe the adsorptionof self-associative molecules such as asphaltene over the CFNS [66,67]. In addition, TheHerschel–Bulkley (H-B) model was employed to describe the effect of CFNS in the rhe-ological behavior of EHO [68,69]. The correlation coefficient (R2) and root-mean-squareerror (RMSE) were used to estimate the suitability of fit using the Solver feature in Excelpackage 2015 [70–74]. Expressions both the SLE and H-B model are shown below, andrelated parameters are summarized in Table 1.
Table 1. Expressions and related parameters of the solid–liquid equilibrium (SLE) and Herschel–Bulkley (H-B) models.
Model Parameters
SLE
Nads (mg/g): amount adsorbedNads,m (mg/g): maximum adsorption capacity
CE (mg/g) is the equilibrium concentration of n-C7 asphaltenes.K (g/g): the degree of n-C7 asphaltenes self-association over the CFNS surface
H (mg/g): and Henry’s law constant related to adsorption affinity
H-B
µ: viscosity at a determined shear rateγ (s−1): shear rate
nH : index of flow behavior KH (Pa sn): consistency index µ0,γ (cP): viscosity atzero stress
µ∞,γ (cP): viscosity at infinite stress
For the solid–liquid equilibrium (SLE):
CE =ψH
1 + Kψexp
(ψ
Nads,m
)(3)
Processes 2021, 9, 175 5 of 16
where,
ψ =−1 +
√1 + 4Kξ
2K; ξ =
(Nads,m · Nads
Nads,m − Nads
)And for H-B model:
µ = KH (γ(nH−1)) + µ∞,γ (4)
4. Results and Discussion
Previous results indicate that SiO2 nanoparticles (8 nm) can selectively adsorb as-phaltenes and resins on their surface [53], leading to changes in the asphaltenes aggregatesand further viscosity reduction. Hence, these particles are selected to compare the per-formance of CFNS on the viscosity change of the EHO. The results are divided into fourparts: (1) the physicochemical characterization of the CFNS sample, (2) rheology studiesat a steady state in the presence and absence of CFNS for the first and second use cycles,(3) dynamic oscillometry of HO in the presence and absence of CFNS for the first andsecond use cycles, and (4) the asphaltene adsorption isotherms on CFNS.
4.1. Characteristics of the CFNS Sample
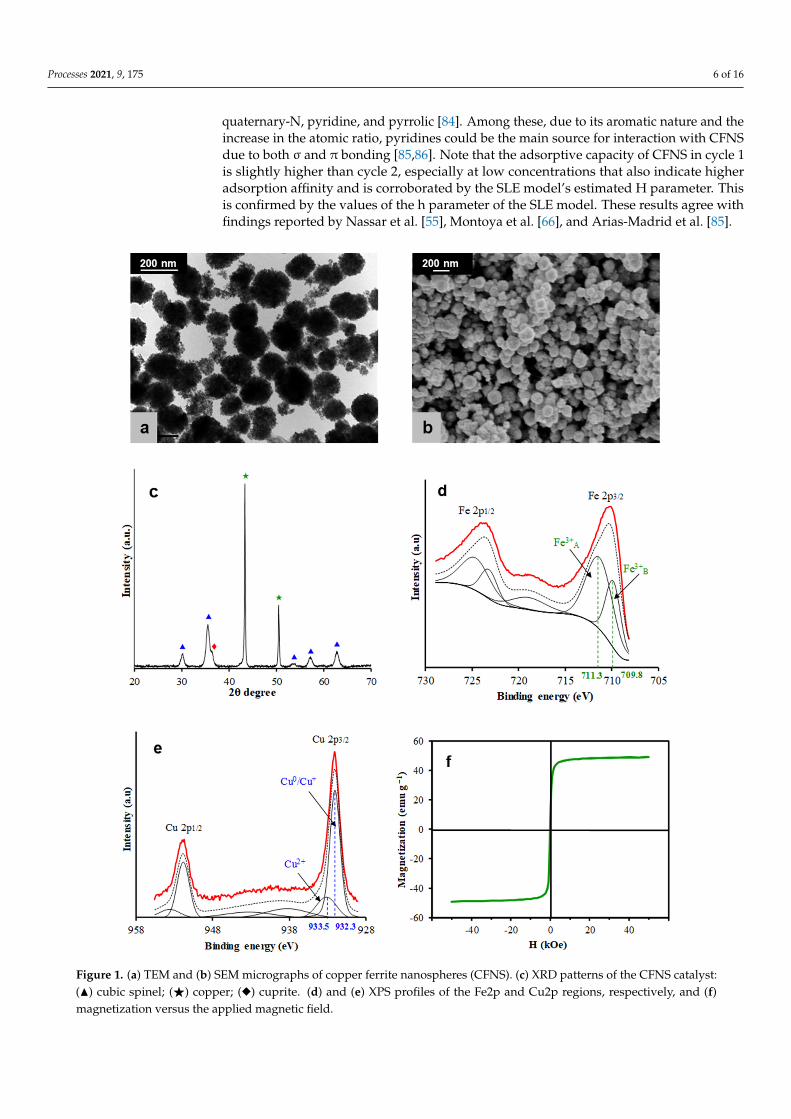
Figure 1a,b depicts TEM and SEM images, respectively, showing that CFNS is com-posed of nanospheric particles with a mean diameter of 150 nm, which was determinedby an open-source image processing program ImageJ based on different TEM imagesand an SBET value of 47 m2/g. Figure 1c shows the XRD patterns of CFNS, which wascomposed of three phases: cubic CuFe2O4 (67.5%), Cu2O (17.1%), and Cu (15.4%), withaverage crystallite sizes of 7.7, 9.8, and 90.0 nm, respectively. The presence of metallic Cuand Cu+ ions was due to the reduction by ethylene glycol of some Cu2+ ions present in thesolution [75–80].
XPS was used to investigate the oxidation state and coordination number of the metalions on the outermost surface of the CFNS sample. Figure 1d,e depicts the XPS profilesof Fe and Cu 2p core-level regions, respectively. Deconvolution of the broad Fe 2p3/2peak showed two more peaks. The first peak occurred at a BE of 709.8 eV, which wasaccompanied by a satellite peak at a BE of around 718.5 eV, indicating the presence of Fe3+
cations [6]. The second peak occurred at 711.3 eV, between the first peak and its satellite,indicating the presence of Fe3+ cations in more than one coordination environment, thatis, A sites at a higher BE (second peak) and B sites at a lower BE (first peak) [81]. The Cu2p3/2 profile showed two peaks at 932.3 and 933.5 eV, assigned to reduce copper species(Cu0/Cu+) and Cu2+, respectively, and a shake-up satellite at around 942 eV, indicating thepresence of Cu2+ [82,83]. The Cu/Fe surface atomic ratio was 0.22, which was lower thanthe theoretical value of 0.5, indicating that Fe ions were segregated to the CFNS surface.
Figure 1f depicts the M-H curve of CFNS. The MS, MR, and HC values were 49.20 emu/g,0.78 emu/g, and 15 Oe, respectively, with an MR/MS ratio of 0.02, indicating a superparam-agnetic behavior of CFNS.
4.2. Asphaltene Adsorption/Desorption Experiments
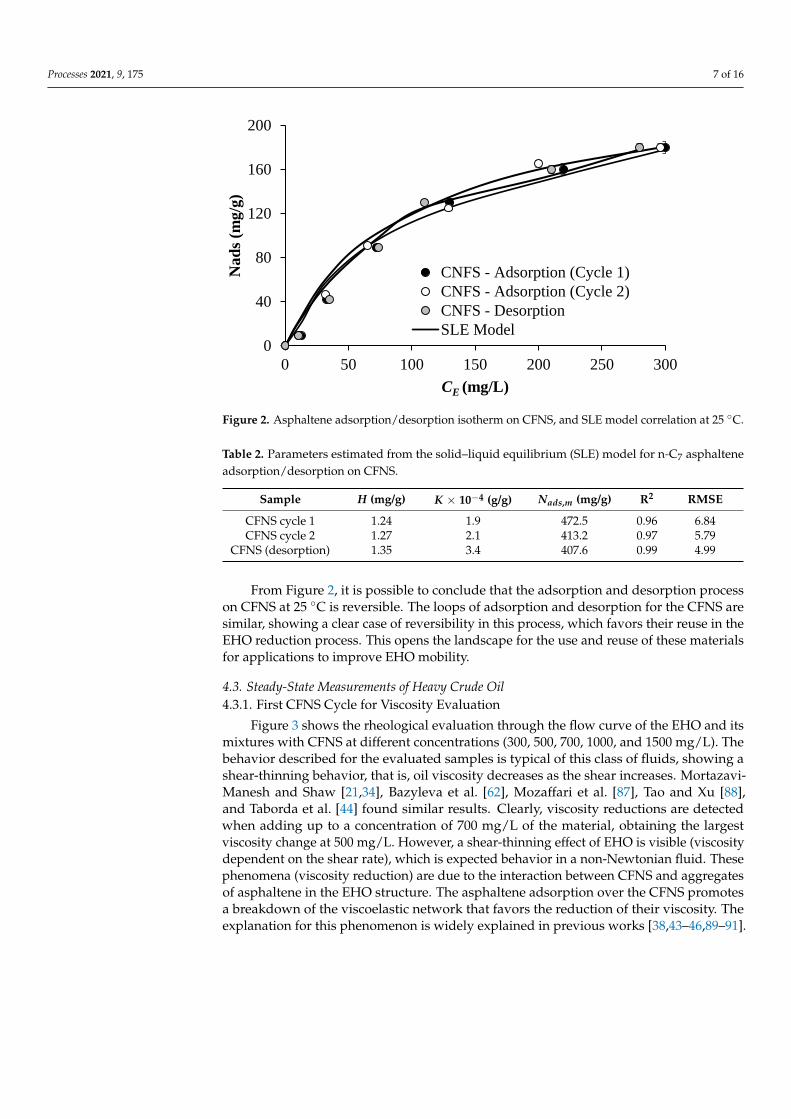
The viscosity reduction is mainly driven by the interaction between the heavy compo-nents of the EHO (mainly, the aggregates of n-C7 asphaltenes) and the CFNS. To understandthis interaction, we have evaluated the adsorption equilibrium based on the adsorptionisotherms. Figure 2 shows the adsorbed amount of n-C7 asphaltenes regarding the equi-librium concentration when CFNS is added into the solution model. Figure 2 shows theadsorption (cycles 1 and 2) and desorption isotherms of n-C7 asphaltene on CFNS at 25 ◦Cobtained from the batch mode, obtaining a deviation lower than 5%, considering bothcurves nearly equal. Adsorption isotherms are Type I according to the International Unionof Pure and Applied Chemistry, where the adsorbed amount of n-C7 asphaltenes rises asCE increases until a plateau is reached. The obtained SLE parameters support this behavior;mainly, the maximum adsorbed uptake (Table 2). Iron has a high-affinity asphaltene adsorp-tion according to the selectivity toward heteroatoms such as nitrogen in the forms of amine,
Processes 2021, 9, 175 6 of 16
quaternary-N, pyridine, and pyrrolic [84]. Among these, due to its aromatic nature and theincrease in the atomic ratio, pyridines could be the main source for interaction with CFNSdue to both σ and π bonding [85,86]. Note that the adsorptive capacity of CFNS in cycle 1is slightly higher than cycle 2, especially at low concentrations that also indicate higheradsorption affinity and is corroborated by the SLE model’s estimated H parameter. Thisis confirmed by the values of the h parameter of the SLE model. These results agree withfindings reported by Nassar et al. [55], Montoya et al. [66], and Arias-Madrid et al. [85].
Processes 2021, 9, x FOR PEER REVIEW 6 of 17
presence of Cu2+ [82,83]. The Cu/Fe surface atomic ratio was 0.22, which was lower than the theoretical value of 0.5, indicating that Fe ions were segregated to the CFNS surface.
Figure 1f depicts the M-H curve of CFNS. The MS, MR, and HC values were 49.20 emu/g, 0.78 emu/g, and 15 Oe, respectively, with an MR/MS ratio of 0.02, indicating a superparamagnetic behavior of CFNS.
Figure 1. (a) TEM and (b) SEM micrographs of copper ferrite nanospheres (CFNS). (c) XRD patterns of the CFNS catalyst: (▲) cubic spinel; (★ ) copper; (◆) cuprite. (d) and (e) XPS profiles of the Fe2p and Cu2p regions, respectively, and (f) magnetization versus the applied magnetic field.
Figure 1. (a) TEM and (b) SEM micrographs of copper ferrite nanospheres (CFNS). (c) XRD patterns of the CFNS catalyst:(N) cubic spinel; (F) copper; (u) cuprite. (d) and (e) XPS profiles of the Fe2p and Cu2p regions, respectively, and (f)magnetization versus the applied magnetic field.
Processes 2021, 9, 175 7 of 16
Processes 2021, 9, x FOR PEER REVIEW 7 of 17
4.2. Asphaltene Adsorption/Desorption Experiments
The viscosity reduction is mainly driven by the interaction between the heavy com-
ponents of the EHO (mainly, the aggregates of n-C7 asphaltenes) and the CFNS. To un-
derstand this interaction, we have evaluated the adsorption equilibrium based on the ad-
sorption isotherms. Figure 2 shows the adsorbed amount of n-C7 asphaltenes regarding
the equilibrium concentration when CFNS is added into the solution model. Figure 2
shows the adsorption (cycles 1 and 2) and desorption isotherms of n-C7 asphaltene on
CFNS at 25 °C obtained from the batch mode, obtaining a deviation lower than 5%, con-
sidering both curves nearly equal. Adsorption isotherms are Type I according to the In-
ternational Union of Pure and Applied Chemistry, where the adsorbed amount of n-C7
asphaltenes rises as CE increases until a plateau is reached. The obtained SLE parameters
support this behavior; mainly, the maximum adsorbed uptake (Table 2). Iron has a high-
affinity asphaltene adsorption according to the selectivity toward heteroatoms such as
nitrogen in the forms of amine, quaternary-N, pyridine, and pyrrolic [84]. Among these,
due to its aromatic nature and the increase in the atomic ratio, pyridines could be the main
source for interaction with CFNS due to both σ and π bonding [85,86]. Note that the ad-
sorptive capacity of CFNS in cycle 1 is slightly higher than cycle 2, especially at low con-
centrations that also indicate higher adsorption affinity and is corroborated by the SLE
model’s estimated H parameter. This is confirmed by the values of the h parameter of the
SLE model. These results agree with findings reported by Nassar et al. [55], Montoya et
al. [66], and Arias-Madrid et al. [85].
From Figure 2, it is possible to conclude that the adsorption and desorption process
on CFNS at 25 °C is reversible. The loops of adsorption and desorption for the CFNS are
similar, showing a clear case of reversibility in this process, which favors their reuse in the
EHO reduction process. This opens the landscape for the use and reuse of these materials
for applications to improve EHO mobility.
Figure 2. Asphaltene adsorption/desorption isotherm on CFNS, and SLE model correlation at 25
°C.
Table 2. Parameters estimated from the solid–liquid equilibrium (SLE) model for n-C7 asphaltene
adsorption/desorption on CFNS.
Sample H (mg/g) K × 10−4 (g/g) ,ads mN (mg/g) R2 RMSE
CFNS cycle 1 1.24 1.9 472.5 0.96 6.84
CFNS cycle 2 1.27 2.1 413.2 0.97 5.79
0
40
80
120
160
200
0 50 100 150 200 250 300
Nad
s (m
g/g
)
CE (mg/L)
CNFS - Adsorption (Cycle 1)
CNFS - Adsorption (Cycle 2)
CNFS - Desorption
SLE Model
Figure 2. Asphaltene adsorption/desorption isotherm on CFNS, and SLE model correlation at 25 ◦C.
Table 2. Parameters estimated from the solid–liquid equilibrium (SLE) model for n-C7 asphalteneadsorption/desorption on CFNS.
Sample H (mg/g) K × 10−4 (g/g) Nads,m (mg/g) R2 RMSE
CFNS cycle 1 1.24 1.9 472.5 0.96 6.84CFNS cycle 2 1.27 2.1 413.2 0.97 5.79
CFNS (desorption) 1.35 3.4 407.6 0.99 4.99
From Figure 2, it is possible to conclude that the adsorption and desorption processon CFNS at 25 ◦C is reversible. The loops of adsorption and desorption for the CFNS aresimilar, showing a clear case of reversibility in this process, which favors their reuse in theEHO reduction process. This opens the landscape for the use and reuse of these materialsfor applications to improve EHO mobility.
4.3. Steady-State Measurements of Heavy Crude Oil4.3.1. First CFNS Cycle for Viscosity Evaluation
Figure 3 shows the rheological evaluation through the flow curve of the EHO and itsmixtures with CFNS at different concentrations (300, 500, 700, 1000, and 1500 mg/L). Thebehavior described for the evaluated samples is typical of this class of fluids, showing ashear-thinning behavior, that is, oil viscosity decreases as the shear increases. Mortazavi-Manesh and Shaw [21,34], Bazyleva et al. [62], Mozaffari et al. [87], Tao and Xu [88],and Taborda et al. [44] found similar results. Clearly, viscosity reductions are detectedwhen adding up to a concentration of 700 mg/L of the material, obtaining the largestviscosity change at 500 mg/L. However, a shear-thinning effect of EHO is visible (viscositydependent on the shear rate), which is expected behavior in a non-Newtonian fluid. Thesephenomena (viscosity reduction) are due to the interaction between CFNS and aggregatesof asphaltene in the EHO structure. The asphaltene adsorption over the CFNS promotesa breakdown of the viscoelastic network that favors the reduction of their viscosity. Theexplanation for this phenomenon is widely explained in previous works [38,43–46,89–91].

Processes 2021, 9, 175 8 of 16
Processes 2021, 9, x FOR PEER REVIEW 8 of 17
CFNS (desorption) 1.35 3.4 407.6 0.99 4.99
4.3. Steady-State Measurements of Heavy Crude Oil
4.3.1. First CFNS Cycle for Viscosity Evaluation
Figure 3 shows the rheological evaluation through the flow curve of the EHO and its
mixtures with CFNS at different concentrations (300, 500, 700, 1000, and 1500 mg/L). The
behavior described for the evaluated samples is typical of this class of fluids, showing a
shear-thinning behavior, that is, oil viscosity decreases as the shear increases. Mortazavi-
Manesh and Shaw [21,34], Bazyleva et al. [62], Mozaffari et al. [87], Tao and Xu [88], and
Taborda et al. [44] found similar results. Clearly, viscosity reductions are detected when
adding up to a concentration of 700 mg/L of the material, obtaining the largest viscosity
change at 500 mg/L. However, a shear-thinning effect of EHO is visible (viscosity depend-
ent on the shear rate), which is expected behavior in a non-Newtonian fluid. These phe-
nomena (viscosity reduction) are due to the interaction between CFNS and aggregates of
asphaltene in the EHO structure. The asphaltene adsorption over the CFNS promotes a
breakdown of the viscoelastic network that favors the reduction of their viscosity. The
explanation for this phenomenon is widely explained in previous works [38,43–46,89–91].
Figure 3. Flow curve for the extra-heavy oils (EHO) on the presence of CFNS at different dosages, and the Herschel–
Bulkley model correlation, at 25 °C.
As can be seen in Figure 3, when the concentration exceeds 1000 mg/L, the effect on
viscosity reduction is negligible, and a slight increase in viscosity may appear in the mix-
ture of EHO and CFNS. This is due to an agglomeration effect of the nanoparticles them-
selves inside the highly viscous fluid. The agglomeration causes the particles to behave as
larger solids, reducing the interaction with asphaltenes and promoting an increase in vis-
cosity, according to Einstein’s theory of viscosity [92]. Figure 4 shows the degree of vis-
cosity reduction for all CFNS dosages evaluated in EHO, which was performed at low
shear rates (7.1 s−1) [93–95]. Notably, at 500 mg/L, a viscosity reduction of 18% was ob-
tained, showing the best performance of CFNS over a wide range of concentrations eval-
uated. This is a promising result in the search for a nanofluid design capable of enhancing
transport processes. Moreover, the process may eventually generate a reduction in the
consumption of diluents with economic and energy savings.
For comparison, our previous results indicated the best concentration obtained for
the use of nanoparticles in EHO was 1000 mg/L, mainly for SiO2 nanoparticles.
Figure 3. Flow curve for the extra-heavy oils (EHO) on the presence of CFNS at different dosages,and the Herschel–Bulkley model correlation, at 25 ◦C.
As can be seen in Figure 3, when the concentration exceeds 1000 mg/L, the effect onviscosity reduction is negligible, and a slight increase in viscosity may appear in the mixtureof EHO and CFNS. This is due to an agglomeration effect of the nanoparticles themselvesinside the highly viscous fluid. The agglomeration causes the particles to behave as largersolids, reducing the interaction with asphaltenes and promoting an increase in viscosity,according to Einstein’s theory of viscosity [92]. Figure 4 shows the degree of viscosityreduction for all CFNS dosages evaluated in EHO, which was performed at low shearrates (7.1 s−1) [93–95]. Notably, at 500 mg/L, a viscosity reduction of 18% was obtained,showing the best performance of CFNS over a wide range of concentrations evaluated. Thisis a promising result in the search for a nanofluid design capable of enhancing transportprocesses. Moreover, the process may eventually generate a reduction in the consumptionof diluents with economic and energy savings.
Processes 2021, 9, x FOR PEER REVIEW 9 of 17
Figure 4. Degree of viscosity reduction for EHO on the presence of CFNS at different dosages, at 25 °C.
4.3.2. Second CFNS Cycle for Viscosity Evaluation
Evaluation of the second cycle of CFNS performance was performed by reusing the
particles after the first cycle of viscosity reduction. For this process, it was decided to use
the dosage that showed the best performance in the first cycle, that is, 500 mg/L. Figure 5
shows the performance of the CFNS in its second cycle of use. It can be seen how the
reduction of viscosity is statistically equal to that obtained in the first cycle, which shows
the reuse capacity of the particles for reducing EHO viscosity. Note that the performance
of the CFNS for the two cycles evaluated showed a similar behavior over the shear rate
evaluated. There is a slight deviation between the two measurements, mostly at a shear
rate lower than 10 s−1.
Figure 5. Flow curve for EHO in the presence of CFNS. Comparison of the two evaluated cycles of CFNS use, and the
Herschel–Bulkley model correlation at 25 °C.
Figure 4. Degree of viscosity reduction for EHO on the presence of CFNS at different dosages, at25 ◦C.
For comparison, our previous results indicated the best concentration obtained for theuse of nanoparticles in EHO was 1000 mg/L, mainly for SiO2 nanoparticles.
Processes 2021, 9, 175 9 of 16
4.3.2. Second CFNS Cycle for Viscosity Evaluation
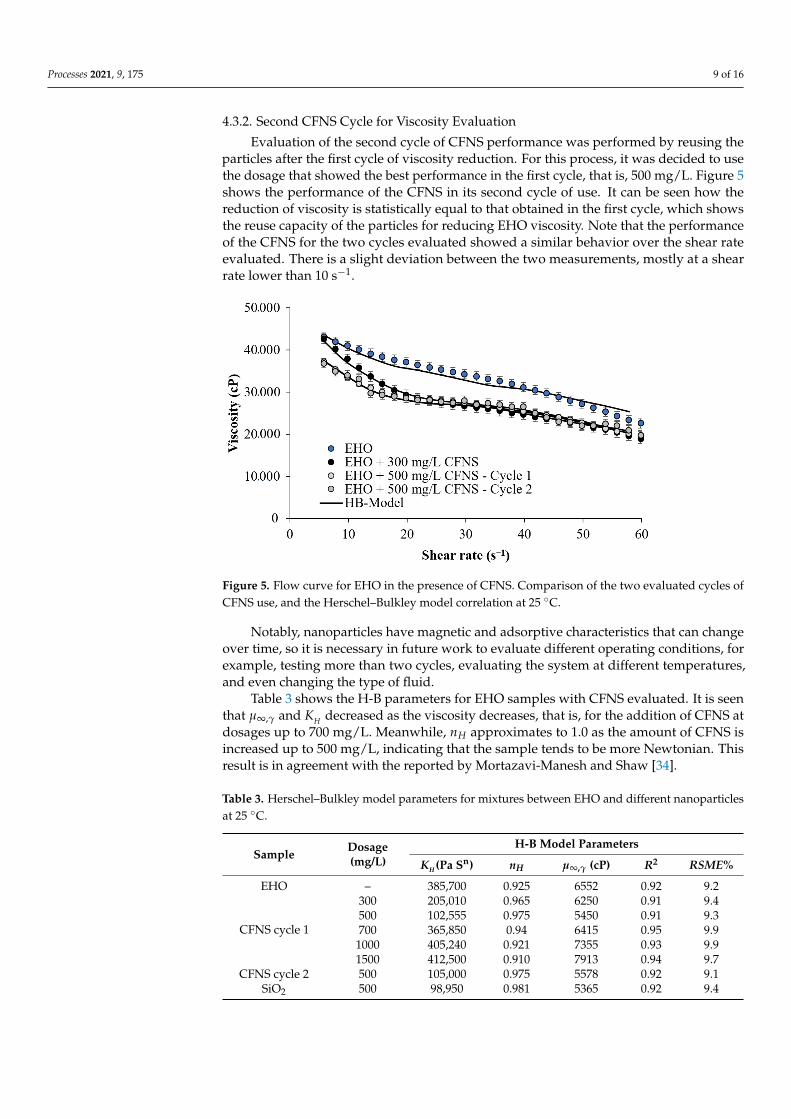
Evaluation of the second cycle of CFNS performance was performed by reusing theparticles after the first cycle of viscosity reduction. For this process, it was decided to usethe dosage that showed the best performance in the first cycle, that is, 500 mg/L. Figure 5shows the performance of the CFNS in its second cycle of use. It can be seen how thereduction of viscosity is statistically equal to that obtained in the first cycle, which showsthe reuse capacity of the particles for reducing EHO viscosity. Note that the performanceof the CFNS for the two cycles evaluated showed a similar behavior over the shear rateevaluated. There is a slight deviation between the two measurements, mostly at a shearrate lower than 10 s−1.
Processes 2021, 9, x FOR PEER REVIEW 9 of 17
Figure 4. Degree of viscosity reduction for EHO on the presence of CFNS at different dosages, at 25 °C.
4.3.2. Second CFNS Cycle for Viscosity Evaluation
Evaluation of the second cycle of CFNS performance was performed by reusing the
particles after the first cycle of viscosity reduction. For this process, it was decided to use
the dosage that showed the best performance in the first cycle, that is, 500 mg/L. Figure 5
shows the performance of the CFNS in its second cycle of use. It can be seen how the
reduction of viscosity is statistically equal to that obtained in the first cycle, which shows
the reuse capacity of the particles for reducing EHO viscosity. Note that the performance
of the CFNS for the two cycles evaluated showed a similar behavior over the shear rate
evaluated. There is a slight deviation between the two measurements, mostly at a shear
rate lower than 10 s−1.
Figure 5. Flow curve for EHO in the presence of CFNS. Comparison of the two evaluated cycles of CFNS use, and the
Herschel–Bulkley model correlation at 25 °C. Figure 5. Flow curve for EHO in the presence of CFNS. Comparison of the two evaluated cycles ofCFNS use, and the Herschel–Bulkley model correlation at 25 ◦C.
Notably, nanoparticles have magnetic and adsorptive characteristics that can changeover time, so it is necessary in future work to evaluate different operating conditions, forexample, testing more than two cycles, evaluating the system at different temperatures,and even changing the type of fluid.
Table 3 shows the H-B parameters for EHO samples with CFNS evaluated. It is seenthat µ∞,γ and KH decreased as the viscosity decreases, that is, for the addition of CFNS atdosages up to 700 mg/L. Meanwhile, nH approximates to 1.0 as the amount of CFNS isincreased up to 500 mg/L, indicating that the sample tends to be more Newtonian. Thisresult is in agreement with the reported by Mortazavi-Manesh and Shaw [34].
Table 3. Herschel–Bulkley model parameters for mixtures between EHO and different nanoparticlesat 25 ◦C.
SampleDosage(mg/L)
H-B Model Parameters
KH (Pa Sn) nH µ∞,γ (cP) R2 RSME%
EHO – 385,700 0.925 6552 0.92 9.2
CFNS cycle 1
300 205,010 0.965 6250 0.91 9.4500 102,555 0.975 5450 0.91 9.3700 365,850 0.94 6415 0.95 9.9
1000 405,240 0.921 7355 0.93 9.91500 412,500 0.910 7913 0.94 9.7
CFNS cycle 2 500 105,000 0.975 5578 0.92 9.1SiO2 500 98,950 0.981 5365 0.92 9.4

Processes 2021, 9, 175 10 of 16
4.3.3. Comparison with SiO2 Nanoparticles
Figure 6 presents the experimental comparison of the viscosity reduction capacitybetween the SiO2 nanoparticles and CFNS. SiO2 particles are taken as a reference point asprevious publications demonstrated it had the best performance in reducing heavy crude oilviscosity [44–46]. Although this figure shows an evaluated concentration of 500 mg/L, thebest concentration for this type of nanoparticle has been reported at 1000 mg/L [43,44,46].
Processes 2021, 9, x FOR PEER REVIEW 11 of 17
Figure 6. Flow curve for EHO in the presence of CFNS and SiO2 nanoparticles, and the Herschel–
Bulkley model correlation at 25 °C and 500 mg/L.
This finding can be understood from Figure 7, which shows the results quantita-
tively. The figure shows that the reduction in viscosity of the SiO2 particles is 22%, slightly
higher than the 18% produced by CFNS (evaluated at 7.1 s−1). However, the added value
of using CFNS particles lies in the reuse they can have, which considerably reduces the
consumption of new material. This can positively impact the economic aspect of the pro-
cess, which is reflected due to the low consumption of CFNS and diluents compared with
conventional methods.
Figure 7. Degree of viscosity reduction for EHO in the presence of CFNS and SiO2 at 25 °C and 500 mg/L.
4.4. Dynamic Oscillometry Test
4.4.1. Linear Viscoelasticity Region
Evaluating the viscoelastic moduli alteration is of primary importance to determine
how the CFNS leads to changes in the EHO internal structure. At low deformations, the
EHO shows a linear trend between stress and strain (linear viscoelastic region), which
indicates that the internal structure has not been modified [96]. In general, determining
the linear viscoelastic region (LVR) of a material is a relatively simple task, using dynamic
Figure 6. Flow curve for EHO in the presence of CFNS and SiO2 nanoparticles, and the Herschel–Bulkley model correlation at 25 ◦C and 500 mg/L.
However, our evaluations have been conducted at the same concentration with thesame EHO to observe the rheology behavior for this research. Thus, in Figure 6, bothparticles produce viscosity reductions, as expected. However, the SiO2 nanoparticles indi-cate the same performance, producing a similar change in viscosity for the concentrationevaluated. Note SiO2 nanoparticles at 500 mg/L showed a significant reduction in thesame amounts as CFNS. However, it is impossible to reuse SiO2 nanoparticles due tothe difficulty of recovering them from the oil matrix. Hence, the CFNS sample showedpromise for being applied in the O&G industry, reducing costs in the dilution process forthe transport of EHO.
This finding can be understood from Figure 7, which shows the results quantitatively.The figure shows that the reduction in viscosity of the SiO2 particles is 22%, slightly higherthan the 18% produced by CFNS (evaluated at 7.1 s−1). However, the added value ofusing CFNS particles lies in the reuse they can have, which considerably reduces theconsumption of new material. This can positively impact the economic aspect of theprocess, which is reflected due to the low consumption of CFNS and diluents comparedwith conventional methods.
4.4. Dynamic Oscillometry Test4.4.1. Linear Viscoelasticity Region
Evaluating the viscoelastic moduli alteration is of primary importance to determinehow the CFNS leads to changes in the EHO internal structure. At low deformations, theEHO shows a linear trend between stress and strain (linear viscoelastic region), whichindicates that the internal structure has not been modified [96]. In general, determiningthe linear viscoelastic region (LVR) of a material is a relatively simple task, using dynamicrheology tests with amplitude sweeps at a given frequency. Figure 8 shows the amplitudesweep test for EHO with and without 500 mg/L CFNS.

Processes 2021, 9, 175 11 of 16
Processes 2021, 9, x FOR PEER REVIEW 11 of 17
Figure 6. Flow curve for EHO in the presence of CFNS and SiO2 nanoparticles, and the Herschel–
Bulkley model correlation at 25 °C and 500 mg/L.
This finding can be understood from Figure 7, which shows the results quantita-
tively. The figure shows that the reduction in viscosity of the SiO2 particles is 22%, slightly
higher than the 18% produced by CFNS (evaluated at 7.1 s−1). However, the added value
of using CFNS particles lies in the reuse they can have, which considerably reduces the
consumption of new material. This can positively impact the economic aspect of the pro-
cess, which is reflected due to the low consumption of CFNS and diluents compared with
conventional methods.
Figure 7. Degree of viscosity reduction for EHO in the presence of CFNS and SiO2 at 25 °C and 500 mg/L.
4.4. Dynamic Oscillometry Test
4.4.1. Linear Viscoelasticity Region
Evaluating the viscoelastic moduli alteration is of primary importance to determine
how the CFNS leads to changes in the EHO internal structure. At low deformations, the
EHO shows a linear trend between stress and strain (linear viscoelastic region), which
indicates that the internal structure has not been modified [96]. In general, determining
the linear viscoelastic region (LVR) of a material is a relatively simple task, using dynamic
Figure 7. Degree of viscosity reduction for EHO in the presence of CFNS and SiO2 at 25 ◦C and500 mg/L.
Processes 2021, 9, x FOR PEER REVIEW 12 of 17
rheology tests with amplitude sweeps at a given frequency. Figure 8 shows the amplitude
sweep test for EHO with and without 500 mg/L CFNS.
(a)
(b)
Figure 8. Amplitude sweep test for heavy oil in (a) absence and (b) presence of 500 mg/L of CFNS
at a fixed frequency of 10 rad/s and a temperature of 25 °C.
Figure 8 shows the obtained storage modulus (G′), loss modulus (G′′), and the phase
angle (δ). For both EHO in the presence and absence of CFNS, it is observed that as the
strain increases up to 2%, the moduli do not change. Hence, the LVR is given for strain
values between 0.1 and 10%. G′′ is always higher than G′, indicating that the sample’s
behavior is more viscous than elastic. The G′ decreases when 500 mg/L of CFNS are added
to the EHO, suggesting lower internal resistance and lower viscosity. Meanwhile, δ is al-
ways higher than 45°, indicating a liquid-like behavior [96–98].
From Figure 8, it is observed that the LVR is slightly higher upon CFNS addition,
indicating an internal structure change in the EHO [61]. Further, the frequency analysis is
carried out in the LVR to determine the effect of CFNS on the EHO viscoelastic properties.
4.4.2. Frequency Sweep Test for Heavy Crude Oil
For angular frequency analysis, deformation was fixed at 2%, and the sweep was
carried out at 25 °C between 0.1 to 100 rad/s. Figure 9 shows G′, G′′, and δ at 25 °C in the
absence and presence of CFNS. From Figure 9, it is observed that in the absence of the
nanomaterial, G′′ is higher than G′, indicating a more viscous behavior than an elastic one.
The moduli also increase as the angular frequency increases, attributed to the asphaltene
65
66
67
68
69
70
71
72
0
500
1000
1500
2000
2500
3000
3500
0.1 1 10 100
δ(°
)
G′,
Gʺ (
Pa)
γ (%)
G''
G'
delta (º)
70
71
72
73
74
75
76
77
0
500
1000
1500
2000
2500
0.1 1 10 100
δ(°
)
G′,
Gʺ (
Pa)
γ (%)
G''G'delta (º)
Figure 8. Amplitude sweep test for heavy oil in (a) absence and (b) presence of 500 mg/L of CFNS ata fixed frequency of 10 rad/s and a temperature of 25 ◦C.
Figure 8 shows the obtained storage modulus (G′), loss modulus (G′ ′), and the phaseangle (δ). For both EHO in the presence and absence of CFNS, it is observed that as thestrain increases up to 2%, the moduli do not change. Hence, the LVR is given for strainvalues between 0.1 and 10%. G′ ′ is always higher than G′, indicating that the sample’s

Processes 2021, 9, 175 12 of 16
behavior is more viscous than elastic. The G′ decreases when 500 mg/L of CFNS are addedto the EHO, suggesting lower internal resistance and lower viscosity. Meanwhile, δ isalways higher than 45◦, indicating a liquid-like behavior [96–98].
From Figure 8, it is observed that the LVR is slightly higher upon CFNS addition,indicating an internal structure change in the EHO [61]. Further, the frequency analysis iscarried out in the LVR to determine the effect of CFNS on the EHO viscoelastic properties.
4.4.2. Frequency Sweep Test for Heavy Crude Oil
For angular frequency analysis, deformation was fixed at 2%, and the sweep wascarried out at 25 ◦C between 0.1 to 100 rad/s. Figure 9 shows G′, G′ ′, and δ at 25 ◦Cin the absence and presence of CFNS. From Figure 9, it is observed that in the absenceof the nanomaterial, G′ ′ is higher than G′, indicating a more viscous behavior than anelastic one. The moduli also increase as the angular frequency increases, attributed to theasphaltene distribution in the EHO matrix and the viscoelastic network formation due tostrong colloidal forces [63,99–101].
Processes 2021, 9, x FOR PEER REVIEW 13 of 17
distribution in the EHO matrix and the viscoelastic network formation due to strong col-
loidal forces [63,99–101].
In the case of the EHO in the presence of CFNS, the G′′ is also greater than G′. Nev-
ertheless, the moduli decreased by approximately 30% regarding the system without na-
noparticles, corroborating the decrease of dynamic viscosity due to the decrease in viscous
and elastic contributions. This viscosity reduction upon CFNS addition would positively
impact the optimization of operating conditions related to the production, recovery and
transport of EHO.
(a)
(b)
Figure 9. Master curve for heavy oil in (a) absence and (b) presence of 500 mg/L of CFNS at 25 °C
and a fixed strain of 2%.
5. Conclusions
CFNS is composed of nanospheric particles (150 nm) containing three phases: cubic-
CuFe2O4 (67.5%), Cu2O (17.1%), and Cu (15.4%). XPS showed that Fe3+ was placed in A
and B sites and the presence of metallic Cu and Cu+ ions. CFNS had a high MS value and
very low MR/MS ratios, indicating substantial superparamagnetic behavior. The rheologi-
cal evaluation carried out reflects a viscosity reduction of up to 18% by adding 500 mg/L
of CFNS. The rheological curve described by the extra-heavy crude oil sample in the pres-
ence and absence of CFNS defines a shear-thinning-type pseudoplastic behavior, typical
of this class of fluids, where the viscosity decreases as the shear rate increases. The nano-
particles were evaluated in their optimal concentration in two cycles, representing the use
and reuse of the magnetic particles. We identify significant decreases in the elastic and
Figure 9. Master curve for heavy oil in (a) absence and (b) presence of 500 mg/L of CFNS at 25 ◦C and a fixed strain of 2%.
In the case of the EHO in the presence of CFNS, the G′ ′ is also greater than G′. Nev-ertheless, the moduli decreased by approximately 30% regarding the system withoutnanoparticles, corroborating the decrease of dynamic viscosity due to the decrease inviscous and elastic contributions. This viscosity reduction upon CFNS addition would pos-itively impact the optimization of operating conditions related to the production, recoveryand transport of EHO.
Processes 2021, 9, 175 13 of 16
5. Conclusions
CFNS is composed of nanospheric particles (150 nm) containing three phases: cubic-CuFe2O4 (67.5%), Cu2O (17.1%), and Cu (15.4%). XPS showed that Fe3+ was placed inA and B sites and the presence of metallic Cu and Cu+ ions. CFNS had a high MS valueand very low MR/MS ratios, indicating substantial superparamagnetic behavior. Therheological evaluation carried out reflects a viscosity reduction of up to 18% by adding500 mg/L of CFNS. The rheological curve described by the extra-heavy crude oil sample inthe presence and absence of CFNS defines a shear-thinning-type pseudoplastic behavior,typical of this class of fluids, where the viscosity decreases as the shear rate increases. Thenanoparticles were evaluated in their optimal concentration in two cycles, representing theuse and reuse of the magnetic particles. We identify significant decreases in the elastic andviscous moduli through dynamic rheology tests, causing internal changes in the viscoelasticmodules, which are responsible for a reduction in the viscosity of the crude oil. Theadsorption isotherms constructed demonstrate an existing interaction between asphaltenesfrom heavy crude oil and CFNS. The main characteristic of CFNS-type materials is theirhigh magnetic power and their ability to reduce the viscosity of heavy crude oils. Bothproperties offer advantages to the chemical addition processes to enhance the transportand mobility processes of heavy crude oils, allowing the reuse of nanoparticles and thereduction of diluents. This could generate technological, economic and environmentalimpacts for the oil and gas industry.
Author Contributions: Conceptualization, all authors; methodology, L.M. and E.A.T.; formal analy-sis, all authors; investigation, L.M. and E.A.T.; data curation, C.M.-C. and F.B.C.; writing—originaldraft preparation, L.M. and E.A.T.; writing—review and editing, all authors; visualization, F.B.C. Allauthors have read and agreed to the published version of the manuscript.
Funding: C.M.-C acknowledges financial support from the Spanish Project ref. RTI2018-099,224-B-I00from ERDF/Ministry of Science, Innovation and Universities—State Research Agency. M.V.L.-R.acknowledges financial support from Junta de Andalucía, Spain, RNM-366 research group.
Data Availability Statement: The data presented in this study are available on request from thecorresponding author.
Acknowledgments: L.M. thanks the Asociación Universitaria Iberoamericana de Postgrado (AUIP)and University of Jaén for supporting her PhD studies. The authors from Grupo de InvestigaciónFenómenos de Superficie Michael Polanyi acknowledge Universidad Nacional de Colombia for thefinancial and logistical support. Special thanks to Eng. Daniel Montes.
Conflicts of Interest: The authors declare no conflict of interest.
References1. Hirsch, R.L.; Bezdek, R.; Wendling, R. Peaking of world oil production and its mitigation. AIChE J. 2005, 52, 2–8. [CrossRef]2. Williams, B. Heavy hydrocarbons playing key role in peak-oil debate, future energy supply. Oil Gas J. 2003, 101, 20–27.3. Bera, A.; Babadagli, T. Status of electromagnetic heating for enhanced heavy oil/bitumen recovery and future prospects: A review.
Appl. Energy 2015, 151, 206–226. [CrossRef]4. Franco, C.; Flórez, A.; Ochoa, M. Análisis de la cadena de suministros de biocombustibles en Colombia. Rev. Dinámica Sist. 2008,
4, 109–133.5. Adams, J. Asphaltene adsorption, a literature review. Energy Fuels 2014, 28, 2831–2856. [CrossRef]6. Chavan, S.; Kini, H.; Ghosal, R. Process for sulfur reduction from high viscosity petroleum oils. Int. J. Environ. Sci. Dev. 2012, 3,
228–231. [CrossRef]7. Chew, K.J. The future of oil: Unconventional fossil fuels. Philos. Trans. R. Soc. A Math. Phys. Eng. Sci. 2014, 372, 20120324.
[CrossRef]8. Ghanavati, M.; Shojaei, M.-J.; Saadatabadi, A.R. Effects of asphaltene content and temperature on viscosity of Iranian heavy crude
oil: Experimental and modeling study. Energy Fuels 2013, 27, 7217–7232. [CrossRef]9. Groenzin, H.; Mullins, O.C. Asphaltene molecular size and structure. J. Phys. Chem. A 1999, 103, 11237–11245. [CrossRef]10. Hinkle, A.; Shin, E.-J.; Liberatore, M.W.; Herring, A.M.; Batzle, M. Correlating the chemical and physical properties of a set of
heavy oils from around the world. Fuel 2008, 87, 3065–3070. [CrossRef]11. Khalil, M.; Jan, B.M.; Tong, C.W.; Berawi, M.A. Advanced nanomaterials in oil and gas industry: Design, application and
challenges. Appl. Energy 2017, 191, 287–310. [CrossRef]

Processes 2021, 9, 175 14 of 16
12. Meyer, R.F.; Attanasi, E. Heavy Oil and Natural Bitumen : Strategic Petroleum Resources; US Geological Survey: Reston, VA, USA,2003; Volume 434, pp. 650–657.
13. Al-Maamari, R.S.; Buckley, J.S. Asphaltene precipitation and alteration of wetting: The potential for wettability changes duringoil production. SPE Reserv. Eval. Eng. 2003, 6, 210–214. [CrossRef]
14. Gharfeh, S.; Yen, A.; Asomaning, S.; Blumer, D. Asphaltene flocculation onset determinations for heavy crude oil and itsimplications. Pet. Sci. Technol. 2004, 22, 1055–1072. [CrossRef]
15. Kojima, T.; Tahara, K. Refinement and transportation of petroleum with hydrogen from renewable energy. Energy Convers. Manag.2001, 42, 1839–1851. [CrossRef]
16. Oskui, G.; Jumaa, M.; Folad, E.G.; Rashed, A. Systematic approach for prevention and remediation of asphaltene problems duringCO2/hydrocarbon injection project. In Proceedings of the Twenty-First International Offshore and Polar Engineering Conference,Maui, Hawaii, USA, 19–24 June 2011; International Society of Offshore and Polar Engineers: Cupertino, CA, USA, 2011.
17. Alvarez, G.; Poteau, S.; Argillier, J.-F.; Langevin, M.; Salager, J.-L. Heavy oil−water interfacial properties and emulsion stability:Influence of dilution. Energy Fuels 2009, 23, 294–299. [CrossRef]
18. Gutierrez, J.G. Plan de Inversiones ECOPETROL. 2011, p. 34. Available online: www.infraestructura.org.co (accessed on 6 January2021).
19. Hasan, S.W.; Ghannam, M.T.; Esmail, N. Heavy crude oil viscosity reduction and rheology for pipeline transportation. Fuel 2010,89, 1095–1100. [CrossRef]
20. López, E.; Montes, E.; Garavito, A.; Collazos, M.M. La economía petrolera en Colombia (Parte II). Relaciones intersectoriales eimportancia en la economía nacional. Borradores Econ. 2013, 748, 1–58.
21. Mortazavi-Manesh, S.; Shaw, J.M. Thixotropic rheological behavior of maya crude oil. Energy Fuels 2014, 28, 972–979. [CrossRef]22. Al-Roomi, Y.; George, R.; Elgibaly, A.; Elkamel, A. Use of a novel surfactant for improving the transportability/transportation of
heavy/viscous crude oils. J. Pet. Sci. Eng. 2004, 42, 235–243. [CrossRef]23. Bensakhria, A.; Peysson, Y.; Antonini, G. Experimental study of the pipeline lubrication for heavy oil transport. Oil Gas. Sci.
Technol. Rev. de l’IFP 2004, 59, 523–533. [CrossRef]24. Chang, C.; Nguyen, Q.; Rønningsen, H.P. Isothermal start-up of pipeline transporting waxy crude oil. J. Non-Newton. Fluid Mech.
1999, 87, 127–154. [CrossRef]25. Gateau, P.; Henaut, I.; Barré, L.; Argillier, J.F. Heavy oil dilution. Oil Gas. Sci. Technol. Rev. de l’IFP 2004, 59, 503–509. [CrossRef]26. Isaac, J.D.; Speed, J.B. Method of Piping Fluids. U.S. Patent 759,374A, 1 May 1904.27. Joseph, D.D.; Bai, R.; Chen, K.P.; Renardy, Y.Y. Core-annular flows. Annu. Rev. Fluid Mech. 1997, 29, 65–90. [CrossRef]28. Kessick, M.A.; Denis, C.E.S. Pipeline Transportation of Heavy Crude Oil. U.S. Patent 4343323, 12 August 1982.29. Khan, M.R. Rheological properties of heavy oils and heavy oil emulsions. Energy Sources 1996, 18, 385–391. [CrossRef]30. McKibben, M.J.; Gillies, R.G.; Shook, C.A. A laboratory investigation of horizontal well heavy oil-water flows. Can. J. Chem. Eng.
2000, 78, 743–751. [CrossRef]31. Saniere, A.; Hénaut, I.; Argillier, J.F. Pipeline transportation of heavy oils, a strategic, economic and technological challenge. Oil
Gas. Sci. Technol. Rev. de l’IFP 2004, 59, 455–466. [CrossRef]32. Selim, M.Y.E. Reducing the viscosity of Jojoba Methyl Ester diesel fuel and effects on diesel engine performance and roughness.
Energy Convers. Manag. 2009, 50, 1781–1788. [CrossRef]33. Castro, J. Perspectivas de la demanda energética global. Petrotecnia 2011, February, 54–70.34. Mortazavi-Manesh, S.; Shaw, J.M. Effect of diluents on the rheological properties of maya crude oil. Energy Fuels 2016, 30, 766–772.
[CrossRef]35. Urquhart, R. Heavy oil transportation—Present and future. J. Can. Pet. Technol. 1986, 25. [CrossRef]36. Langevin, D.; Argillier, J.-F. Interfacial behavior of asphaltenes. Adv. Colloid Interface Sci. 2016, 233, 83–93. [CrossRef] [PubMed]37. Martínez-Palou, R.; Mosqueira, M.D.L.; Zapata-Rendón, B.; Mar-Juárez, E.; Bernal-Huicochea, C.; Clavel-López, J.D.L.C.; Aburto,
J. Transportation of heavy and extra-heavy crude oil by pipeline: A review. J. Pet. Sci. Eng. 2011, 75, 274–282. [CrossRef]38. Briceno, M.I.; Salager, J.-L.; Bracho, C.L. Heavy Hydrocarbon Emulsions Making Use of the State of the Art in Formulation
Engineering. In Encyclopedic Handbook of Emulsion Technology; Sjöblom, J., Ed.; Publ. Marcel Dekker: New York, NY, USA, 2001;Volume 20, pp. 455–495.
39. Anto, R.; Deshmukh, S.; Sanyal, S.; Bhui, U.K. Nanoparticles as flow improver of petroleum crudes: Study on temperature-dependent steady-state and dynamic rheological behavior of crude oils. Fuel 2020, 275, 117873. [CrossRef]
40. Contreras–Mateus, M.D.; López–López, M.T.; Ariza-León, E.; Chaves-Guerrero, A. Rheological implications of the inclusion offerrofluids and the presence of uniform magnetic field on heavy and extra-heavy crude oils. Fuel 2021, 285, 119184. [CrossRef]
41. Ke, H.; Yuan, M.; Xia, S. A review of nanomaterials as viscosity reducer for heavy oil. J. Dispers. Sci. Technol. 2020, 1–12. [CrossRef]42. Sun, Y.; Yang, D.; Shi, L.; Wu, H.; Cao, Y.; He, Y.; Xie, T. Properties of nanofluids and their applications in enhanced oil recovery:
A comprehensive review. Energy Fuels 2020, 34, 1202–1218. [CrossRef]43. Taborda, E.A.; Alvarado, V.; Cortés, F.B. Effect of SiO 2 -based nanofluids in the reduction of naphtha consumption for heavy and
extra-heavy oils transport: Economic impacts on the Colombian market. Energy Convers. Manag. 2017, 148, 30–42. [CrossRef]44. Taborda, E.A.; Alvarado, V.; Franco, C.A.; Cortés, F.B. Rheological demonstration of alteration in the heavy crude oil fluid
structure upon addition of nanoparticles. Fuel 2017, 189, 322–333. [CrossRef]
Processes 2021, 9, 175 15 of 16
45. Taborda, E.A.; Franco, C.A.; Lopera, S.H.; Alvarado, V.; Cortés, F.B. Effect of nanoparticles/nanofluids on the rheology of heavycrude oil and its mobility on porous media at reservoir conditions. Fuel 2016, 184, 222–232. [CrossRef]
46. Taborda, E.A.; Franco, C.A.; Ruiz, M.A.; Alvarado, V.; Cortés, F.B. Experimental and theoretical study of viscosity reduction inheavy crude oils by addition of nanoparticles. Energy Fuels 2017, 31, 1329–1338. [CrossRef]
47. Moreno-Castilla, C.; López-Ramón, M.V.; Fontecha-Cámara, M. Ángeles; Álvarez, M.; Mateus, L. Removal of phenolic compoundsfrom water using copper ferrite nanosphere composites as fenton catalysts. Nanomaterials 2019, 9, 901. [CrossRef] [PubMed]
48. Fontecha-Camara, M.A.; Moreno-Castilla, C.; López-Ramón, M.V.; Álvarez, M.A. Mixed iron oxides as Fenton catalysts for gallicacid removal from aqueous solutions. Appl. Catal. B Environ. 2016, 196, 207–215. [CrossRef]
49. Yabuki, A.; Tanaka, S. Oxidation behavior of copper nanoparticles at low temperature. Mater. Res. Bull. 2011, 46, 2323–2327.[CrossRef]
50. Chen, W.; Fan, Z.; Lai, Z. Synthesis of core-shell heterostructured Cu/Cu2O nanowires monitored by in situ XRD as efficientvisible-light photocatalysts. J. Mater. Chem. A 2013, 1, 13862–13868. [CrossRef]
51. Zhao, W.; Zhang, S.; Ding, J.; Deng, Z.; Guo, L.; Zhong, Q. Enhanced catalytic ozonation for NOx removal with CuFe2O4nanoparticles and mechanism analysis. J. Mol. Catal. A Chem. 2016, 424, 153–161. [CrossRef]
52. Cortés, F.B.; Ruiz, M.A.; Benjumea, P.; Patiño, E.; Franco Ariza, C.A. Kinetic and thermodynamic equilibrium of asphaltenessorption onto nanoparticles of nickel oxide supported on nanoparticulated alumina. Fuel 2013, 105, 408–414.
53. Franco, C.A.; Montoya, T.; Nassar, N.N.; Pereira-Almao, P.; Cortés, F.B. Adsorption and subsequent oxidation of colombianasphaltenes onto nickel and/or palladium oxide supported on fumed silica nanoparticles. Energy Fuels 2013, 27, 7336–7347.[CrossRef]
54. Nassar, N.N.; Hassan, A.; Pereira-Almao, P. Effect of the particle size on asphaltene adsorption and catalytic oxidation ontoalumina particles. Energy Fuels 2011, 25, 3961–3965. [CrossRef]
55. Nassar, N.N. Asphaltene adsorption onto alumina nanoparticles: Kinetics and thermodynamic studies. Energy Fuels 2010, 24,4116–4122. [CrossRef]
56. Franco, C.A.; Lozano, M.M.; Acevedo, S.; Nassar, N.N.; Cortés, F.B. Effects of resin I on asphaltene adsorption onto nanoparticles:A novel method for obtaining asphaltenes/resin isotherms. Energy Fuels 2016, 30, 264–272. [CrossRef]
57. Nassar, N.N.; Franco, C.A.; Montoya, T.; Cortés, F.B.; Hassan, A. Effect of oxide support on Ni–Pd bimetallic nanocatalysts forsteam gasification of n-C 7 asphaltenes. Fuel 2015, 156, 110–120. [CrossRef]
58. Cortés, F.B.; Montoya, T.; Acevedo, S.; Nassar, N.N.; Franco, C.A. Adsorption-desorption of n–C7 asphaltenes over micro- andnanoparticles of silica and its impact on wettability alteration. CTF—Ciencia Tecnología Futuro 2016, 6, 89–106. [CrossRef]
59. Guzmán, J.D.; Betancur, S.; Carrasco-Marín, F.; Franco, C.A.; Nassar, N.N.; Cortés, F.B. Importance of the adsorption method usedfor obtaining the nanoparticle dosage for asphaltene-related treatments. Energy Fuels 2015, 30, 2052–2059. [CrossRef]
60. Chen, D.T.N.; Wen, Q.; Janmey, P.A.; Crocker, J.C.; Yodh, A.G. Rheology of soft materials. Annu. Rev. Condens. Matter Phys. 2010,1, 301–322. [CrossRef]
61. Visintin, R.F.G.; Lapasin, R.; Vignati, E.; D’Antona, P.; Lockhart, T.P. Rheological behavior and structural interpretation of waxycrude oil gels. Langmuir 2005, 21, 6240–6249. [CrossRef]
62. Bazyleva, A.B.; Hasan, A.; Fulem, M.; Becerra, M.; Shaw, J.M. Bitumen and heavy oil rheological properties: Reconciliation withviscosity measurements. J. Chem. Eng. Data 2010, 55, 1389–1397. [CrossRef]
63. Behzadfar, E.; Hatzikiriakos, S.G. Viscoelastic properties and constitutive modelling of bitumen. Fuel 2013, 108, 391–399.[CrossRef]
64. Dimitriou, C.J.; McKinley, G.H. A comprehensive constitutive law for waxy crude oil: A thixotropic yield stress fluid. Soft Matter2014, 10, 6619–6644. [CrossRef]
65. Ershov, D.; Stuart, M.C.; Van Der Gucht, J. Mechanical properties of reconstituted actin networks at an oil-water interfacedetermined by microrheology. Soft Matter 2012, 8, 5896. [CrossRef]
66. Montoya, T.; Coral, D.; Franco, C.A.; Nassar, N.N.; Cortés, F.B. A novel solid-liquid equilibrium model for describing theadsorption of associating asphaltene molecules onto solid surfaces based on the “Chemical Theory”. Energy Fuels 2014, 28,4963–4975. [CrossRef]
67. Talu, O.; Meunier, F. Adsorption of associating molecules in micropores and application to water on carbon. AIChE J. 1996, 42,809–819. [CrossRef]
68. Buckley, S.; Leverett, M. Mechanism of fluid displacement in sands. Trans. AIME 1942, 146, 107–116. [CrossRef]69. Herschel, W.H. The Change in viscosity of oils with the temperature. J. Ind. Eng. Chem. 1922, 14, 715–722. [CrossRef]70. Preece, D.A.; Montgomery, D.C. Design and analysis of experiments. Int. Stat. Rev. 1978, 46, 120. [CrossRef]71. Nassar, N.N.; Betancur, S.; Acevedo, S.; Franco, C.A.; Cortés, F.B. Development of a population balance model to describe the
influence of shear and nanoparticles on the aggregation and fragmentation of asphaltene aggregates. Ind. Eng. Chem. Res. 2015,54, 8201–8211. [CrossRef]
72. Nik, W.W.; Ani, F.N.; Masjuki, H.; Giap, S.E. Rheology of bio-edible oils according to several rheological models and its potentialas hydraulic fluid. Ind. Crop. Prod. 2005, 22, 249–255. [CrossRef]
73. Sarpkaya, T. Flow of non-Newtonian fluids in a magnetic field. AIChE J. 1961, 7, 324–328. [CrossRef]74. Shao, S.; Lo, E.Y. Incompressible SPH method for simulating Newtonian and non-Newtonian flows with a free surface. Adv.
Water Resour. 2003, 26, 787–800. [CrossRef]

Processes 2021, 9, 175 16 of 16
75. Ding, Y.; Zhu, L.; Wang, N.; Tang, H. Sulfate radicals induced degradation of tetrabromobisphenol A with nanoscaled magneticCuFe2O4 as a heterogeneous catalyst of peroxymonosulfate. Appl. Catal. B Environ. 2013, 129, 153–162. [CrossRef]
76. Erdogan, I.Y.; Güllü, Ö. Optical and structural properties of CuO nanofilm: Its diode application. J. Alloy. Compd. 2010, 492,378–383. [CrossRef]
77. Selvan, R.; Augustin, C.; Berchmans, L.; Saraswathi, R. Combustion synthesis of CuFe2O. Mater. Res. Bull. 2003, 38, 41–54.[CrossRef]
78. Silva, M.; Silva, F.; Sinfrônio, F.S.M.; Paschoal, A.; Silva, E.; Paschoal, C. The effect of cobalt substitution in crystal structure andvibrational modes of CuFe2O4 powders obtained by polymeric precursor method. J. Alloy. Compd. 2014, 584, 573–580. [CrossRef]
79. Waldron, R.D. Infrared spectra of ferrites. Phys. Rev. 1955, 99, 1727–1735. [CrossRef]80. Wu, F.; Li, X.; Wang, Z.; Xu, C.; He, H.; Qi, A.; Yin, X.; Guo, H. Preparation of high-value TiO2 nanowires by leaching of
hydrolyzed titania residue from natural ilmenite. Hydrometallurgy 2013, 140, 82–88. [CrossRef]81. Xiong, Z.; Cao, J.; Lai, B.; Yang, P. Comparative study on degradation of p -nitrophenol in aqueous solution by mFe/Cu/O3 and
mFe0/O3 processes. J. Ind. Eng. Chem. 2018, 59, 196–207. [CrossRef]82. He, Z.; Song, S.; Ying, H.; Xu, L.; Chen, J. p-Aminophenol degradation by ozonation combined with sonolysis: Operating
conditions influence and mechanism. Ultrason. Sonochem. 2007, 14, 568–574. [CrossRef]83. Sun, M.; Yao, R.; You, Y.; Deng, S.; Gao, W. Degradation of 4-aminophenol by hydrogen peroxide oxidation using enzyme from
Serratia marcescens as catalyst. Front. Environ. Sci. Eng. China 2007, 1, 95–98. [CrossRef]84. Calemma, V.; Iwanski, P.; Nali, M.; Scotti, R.; Montanari, L. Structural characterization of asphaltenes of different origins. Energy
Fuels 1995, 9, 225–230. [CrossRef]85. Arias-Madrid, D.; Medina, O.E.; Gallego, J.; Acevedo, S.; Correa-Espinal, A.A.; Cortés, F.B.; Franco, C.A. NiO, Fe2O3, and
MoO3 supported over SiO2 nanocatalysts for asphaltene adsorption and catalytic decomposition: Optimization through asimplex-centroid mixture design of experiments. Catalysts 2020, 10, 569. [CrossRef]
86. Ascanius, B.E.; Garcia, D.M.; Andersen, S.I. Analysis of asphaltenes subfractionated byN-Methyl-2-pyrrolidone. Energy Fuels2004, 18, 1827–1831. [CrossRef]
87. Mozaffari, S.; Tchoukov, P.; Atias, J.; Czarnecki, J.; Nazemifard, N. Effect of asphaltene aggregation on rheological properties ofdiluted athabasca bitumen. Energy Fuels 2015, 29, 5595–5599. [CrossRef]
88. Tao, R.; Xu, X. Reducing the viscosity of crude oil by pulsed electric or magnetic field. Energy Fuels 2006, 20, 2046–2051. [CrossRef]89. Andreatta, G.; Bostrom, N.; Mullins, O.C. High-Q ultrasonic determination of the critical nanoaggregate concentration of
asphaltenes and the critical micelle concentration of standard surfactants. Langmuir 2005, 21, 2728–2736. [CrossRef] [PubMed]90. Andreatta, G.; Bostrom, N.; Mullins, O.C. Ultrasonic spectroscopy of asphaltene aggregation. In Asphaltenes, Heavy Oils, and
Petroleomics; Springer Science and Business Media LLC: Berlin/Heidelberg, Germany, 2007; pp. 231–257.91. Yang, X.; Czarnecki, J. Tracing sodium naphthenate in asphaltenes precipitated from athabasca bitumen. Energy Fuels 2005, 19,
2455–2459. [CrossRef]92. Einstein, A. Eine neue bestimmung der moleküldimensionen. Ann. Phys. 1906, 324, 289–306. [CrossRef]93. Maya, G.A.; Sierra, D.P.M.; Castro, R.H.; Portillo, M.L.T.; Soto, C.P.; Perez, H.H. Enhanced oil recovery (EOR) status—Colombia.
In Proceedings of the Latin American & Caribbean Petroleum Engineering Conference, Lima, Peru, 1–3 December 2010.94. García, R.H.C.; Toro, G.A.M.; Diaz, R.J.; Perez, H.I.Q.; Guardia, V.M.D.; Vargas, K.M.C.; Bustamante, J.M.P.; Aya, C.L.D.; Romero,
R.A.P. Polymer flooding to improve volumetric sweep efficiency in waterflooding processes. CTF—Ciencia Tecnología Futuro 2016,6, 71–90. [CrossRef]
95. Giraldo, L.J.; Giraldo, M.A.; Gallo, S.L.; Maya, G.; Zabala, R.D.; Nassar, N.N.; Franco, C.A.; Alvarado, V.; Cortés, F.B. The effectsof SiO2 nanoparticles on the thermal stability and rheological behavior of hydrolyzed polyacrylamide based polymeric solutions.J. Pet. Sci. Eng. 2017, 159, 841–852. [CrossRef]
96. Ghannam, M.T.; Hasan, S.W.; Abu-Jdayil, B.; Esmail, N. Rheological properties of heavy & light crude oil mixtures for improvingflowability. J. Pet. Sci. Eng. 2012, 81, 122–128. [CrossRef]
97. Behura, J.; Batzle, M.; Hofmann, R.; Dorgan, J. Heavy oils: Their shear story. Geophysics 2007, 72, E175–E183. [CrossRef]98. Lesueur, D. The colloidal structure of bitumen: Consequences on the rheology and on the mechanisms of bitumen modification.
Adv. Colloid Interface Sci. 2009, 145, 42–82. [CrossRef]99. Mullins, O.C.; Betancourt, S.S.; Cribbs, M.E.; Dubost, F.X.; Creek, J.L.; Andrews, A.B.; Venkataramanan, L. The colloidal structure
of crude oil and the structure of oil reservoirs. Energy Fuels 2007, 21, 2785–2794. [CrossRef]100. Wong, G.K.; Yen, T.F. An electron spin resonance probe method for the understanding of petroleum asphaltene macrostructure. J.
Pet. Sci. Eng. 2000, 28, 55–64. [CrossRef]101. Yen, T.F.; Chilingarian, G.V. Asphaltenes and Asphalts, 1st ed.; Elsevier: Amsterdam, The Netherlands, 2000.