externalities in peri urban agriculture economic
TRANSCRIPT
Published byACADEMIC FOUNDATION
in association with Vicissitudes of Agriculture in theFast Growing Indian Economy
Challenges, Strategies and the Way Forward
Editors
C. RAM ASAMY AND K.R. ASHOK
ACADEMIC FOUNDATIONNEW DELHI
www.academicfoundation.org
First published in 2016by
ACADEMIC FOUNDATION4772-73/23 Bharat Ram Road, (23 Ansari Road),Darya Ganj, New Delhi - 110 002 (India).Phones: 23245001 / 02 / 03 / 04.Fax: +91-11-23245005.E-mail: [email protected]
Disclaimer:The findings/views/opinions expressed in this book are solely those of theauthors and do not necessarily reflect the views of the publisher.
© 2016. Indian Society of Agricultural Economics, Mumbai.
ALL RIGHTS RESERVED.No part of this book shall be reproduced, stored in a retrieval system, ortransmitted by any means, electronic, mechanical, photocopying, record-ing, or otherwise, without the prior written permission of the copyrightholderfs) and/or the publishers.
Cataloging in Publication Data--DKCourtesy: D.K.Agencies (P) Ltd. cdocinfosedkagencies.com>
Vicissitudes of agriculture in the fast growing Indian economy: challenges, strategies and the way forward / editors, C.
Ramasamy and K.R. Ashok.pages cm
Includes bibliographical references.ISBN 9789332703360
1. Agriculture--Economic aspects=India. 2. Agriculture andstate=India. I. Ramasamy, c., 1947- editor. II. Ashok, K. R.,editor.
HD2072.V532016 DDC 338.10954 23
Typeset, printed and bound by The Book Mint, New Delhi.www.thebookmint.in
I
VICISSITUDES OF AGRICULTURE IN THE FAST GROWING INDIAN ECONOMY
8
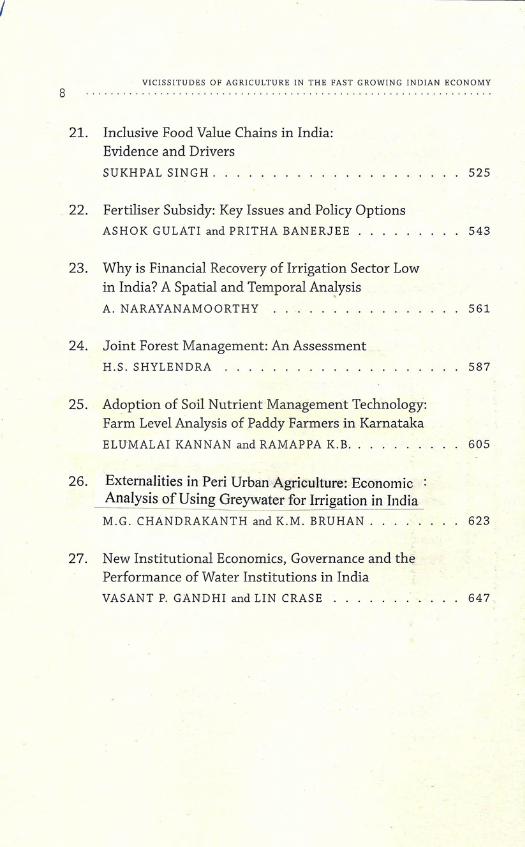
21. Inclusive Food Value Chains in India:Evidence and DriversSUKHPAL SINGH ... .... 525
22. Fertiliser Subsidy: Key Issues and Policy OptionsASHOK GULATI and PRITHA BANERJEE . . . .. . .. 543
23. Why is Financial Recovery of Irrigation Sector Lowin India? A Spatial and Temporal Ana!ysisA. NARAYANAMOORTHY . . . . . . .. . 561
24. Joint Forest Management: An AssessmentH.S. SHYLENDRA . . . 587
25. Adoption of Soil Nutrient Management Technology:Farm Level Analysis of Paddy Farmers in KarnatakaELUMALAI KANNAN and RAMAPPA K.B 605
26. Externalities in Peri Urban Agriculture: Economic :Analysis of Using Greywater for Irrigation in IndiaM.G. CHANDRAKANTH and K.M. BRUHAN 623
27. New Institutional Economics, Governance and thePerformance of Water Institutions in IndiaVASANT P. GANDHI and LIN CRASE 647.
26M.G. CHANDRAKANTH and K.M. BRUHAN
Externalities in Peri Urban AgricultureEconomic Analysis of Using Greywater for Irrigation in India
Introduction
The Chairman of the UN Secretary-General's Advisory Board onWater and Sanitation, observed that: ".... .in many parts of the world,waste water is already used for agriculture. This practice should beencouraged, but it must be done safely, with the use of guidelines,such as the globally accepted World Health Organization guidelinesfor waste water reuse. Safe water reuse is a solution, since it promotesfood security in the future,"! For humans, dealing with waste water isnot only challenging, but also is an opportunity, since the nutrientsin waste water can be put to agriculture use and in the process alsoaddress the problems involved in treatment and disposal on thelimited land.
Grey Water
In South Asia, only 31 per cent of the urban population isconnected to piped sewer systems. Despite the vast populationsupported by agriculture, rate of urbanisation is phenomenal inIndia. According to 2001 census, the urban population formed28.53 per cent and in 2011, increased to 31.16 per cent of thepopulation. In 2011 census, the rate of growth of urban populationwas 2.3 per cent, while that of rural population was 1 per cent. Theurban (rural) population grew at 2.5 per cent (1.4%) in 2001 census
1. http://www.ais. unwater.org/ ais/pluginfile.php/62/ course/section/29/proceedings-no-ll_ WEB.pdf:11
VICISSITUDES OF AGRICULTURE IN THE FAST GROWING INDIAN ECONOMY624 ..
which fell to 2.3 per cent (1%) in 2011 census. Thus, the degree offall in the rate of population growth in rural population is higherthan that in urban population between the two census periods. Inthe process, peri-urban development is on commercial agricultureto meet the demands of vegetables, fruits and flowers with theutilisation of household sewage water, which, left to nature wouldhave exacerbated pollution of water bodies and the environment. Thehousehold sewage water is commonly referred to as grey water, whichis released from houses unconnected to sewage system, which can betreated and used for irrigation. It comprises of 50 to 80 per cent ofhousehold sewage water, which is suitable for reuse:2 In this paper,grey water and household sewage water are used synonymously, sinceMagadi has only household used water in the sewage."
Peri-Urban Agriculture
Given the limitation of budget allocation required for closeddrainage systems in peri-urban areas in India, due to limited fundsavailable with the panchayats by way of tax revenues, the householdsewage water is left to nature adding to environmental pollution. UPA(peri-urban agriculture) is thus absorbing some of this grey water asfarmers are using for irrigating their marginal lands to cultivate GLV(green leafy vegetables) and other vegetables for supplying to nearbyurban areas, offering fresh produce with the least food miles. Urbanand UPA, is thus "an activity that produces, processes, and marketsfood and other products, on land and water in urban and peri-urbanareas, applying intensive production methods, and (re)using naturalresources and urban sewages" (International Development ResearchCentre, 2000). It includes a wide range of activities such as horticulture,dairy farming, cattle farming, poultry, fisheries, and so on.
Long and Short Term Impacts of UPA
In India, UPA is resulting in two types of impacts: the long-termimpact of: (i) gradual shrinkage of holding size due to subdivision and
2. Ibid.: 19.
3. This sewage is in no way comparable to the sewage in Bangalore Metropolis which has effluentsfrom industries discharging effluents,let into BelIandur lake.
ADOPTION OF SOIL NUTRIENT ... M.G. CHANDRAKANTH and K.M. BRUHAN . . 625
fragmentation of holdings, increasing demand for urban dwelling andpetty business including land for industries, and (ii) the spurt in realprices of land. The short-term impact is rise in real agricultural wage.Such farmers are also unable to bear the pressures of urbanisation inretaining their land and are gradually forced to part with their landfor unregulated prices in a phased manner, due to their inability toface land mafia. According to Ramalinge Gowda et al. (2012), in UPAand in rural agriculture, currently, wage income exceeds 50 per centof the total income" and, their per capita incomes are at least 50 percent lower than the per capita income of an average Indian.
Despite these pre-empting forces, there are farmers clinging onto agriculture to improve their economic situation in peri-urbanenvirons, where groundwater resource is absolutely scarce. Suchfarmers make use of household sewage water for productive purposesby cultivating crops. The sewage water is also known to have positiveimpact on crop production (Scott et al., 2000). This phenomenonis not uncommon in India and other developing countries, as thereis growing groundwater scarcity in UPA for agriculture purpose(Scheierling, 2010). In UPA, the sewage water largely containshousehold sanitary, kitchen wastes and municipal sewage, and isrelatively safe compared with the urban sewage which is fraughtwith industrial effluents. Hence, use of household sewage waterfor agriculture results in externality. Already the management anddisposal of solid wastes and sewage water is posing great challengesfor Bangalore metropolitan. Thus, efforts by farmers utilisinghousehold sewage water, complements the challenging efforts ofmunicipalities in combating the environmental pollution. Theseresult in reduction of: (i) environmental pollution due to productiveuse of household sewage water and (ii) food mile, due to enhancedfood availability locally, both of which are positive externalities.In this study, a modest attempt is made to analyse the economicsof cultivation of crops by farmers who are using household sewagewater in Magadi, Karnataka to estimate and value the externalitiesinvolved in the process.
4. http;llwww.toenre.comldownloadsI2012-Jun_epw_article_on_peri-urban_agriculture_uas_ban-galore.pdf
626 ..VICISSITUDES OF AGRICULTURE IN THE FAST GROWING INDIAN ECONOMY
Study Area and Data
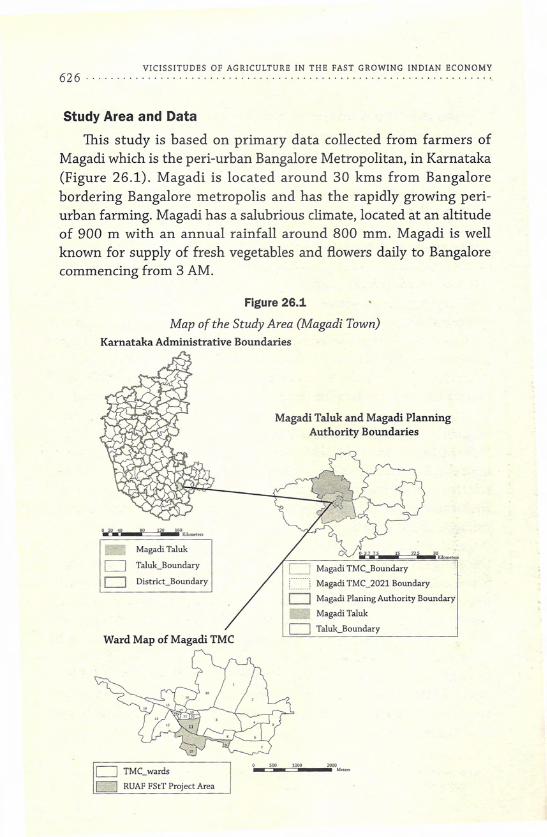
This study is based on primary data collected from farmers ofMagadi which is the peri-urban Bangalore Metropolitan, in Karnataka(Figure 26.1). Magadi is located around 30 kms from Bangalorebordering Bangalore metropolis and has the rapidly growing peri-urban farming. Magadi has a salubrious climate, located at an altitudeof 900 m with an annual rainfall around 800 mm. Magadi is wellknown for supply of fresh vegetables and flowers daily to Bangalorecommencing from 3 AM.
Figure 26.1
Map of the Study Area (Magadi Town)Karnataka Administrative Boundaries
o 20 40 80 120 160MM _kilolDH •••
Magadi Taluk
D Taluk_Boundary
o DistriccBoundary
Ward Map of Magadi TMC
Magadi Taluk and Magadi PlanningAuthority Boundaries
1S 22.5 30_Kilo_ten
D Magadi TMCBoundary
Magadi TMC_2021 Boundary
o Magadi Planing Authority Boundary_ Magadi Taluk
D Taluk_Boundary
D TMC_wards
D RUAF FStT Project Area
ADOPTION OF SOIL NUTRIENT... • M.G. CHANDRAKANTH and K.M. BRUHAN......................................................············627
A reconnaissance survey of farmers in Magadi indicated thatabout 20 per cent of farmers use household sewage water forirrigating their crops. The household sewage water is from domestichousehold sewage, municipality sewage and runoff from agriculture.There are no industries around Magadi, and hence the sewage waterhas no industrial effluents.
Sampling
For this study, the sample comprises of a random sample of30 farmers using HSWFF (household sewage water for irrigation)30 farmers using GWF (groundwater for irrigation) and 30 rainfedfarmers (RFs). HSWF are those who use household sewage water and/or in combination with groundwater for irrigation. GWF are thosewho used only groundwater (from open well, bore well and waterpurchased from others) for irrigation. RFs are those who mainlydepended on rainfall as the source of moisture for crops. The detailedinformation on economics of farming was obtained for 2011, fromthe sample farmers by personal interviews using structured and pre-tested questionnaires. In addition, information regarding croppingpattern, existing farming system, sources of irrigation, particularsof cost of cultivation, inputs used, crop output, price of output,expenses, income from different enterprises and health costs werecollected.
How Safe is the Household Sewage of Magadi?
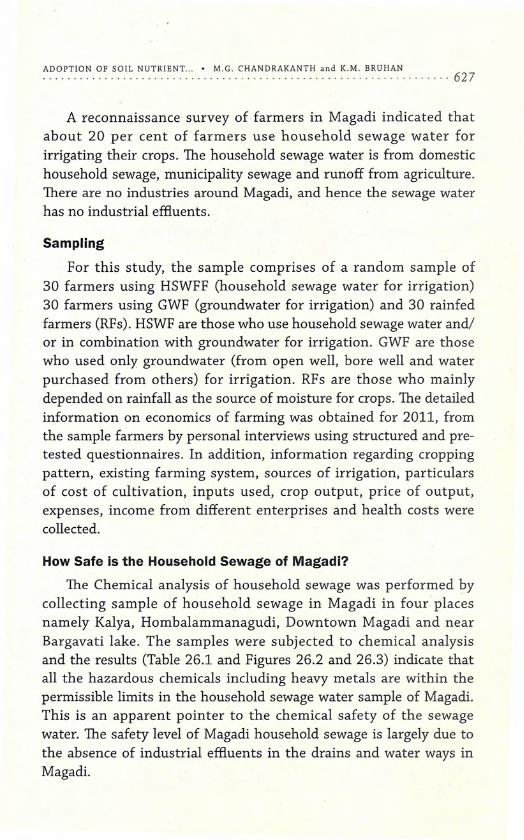
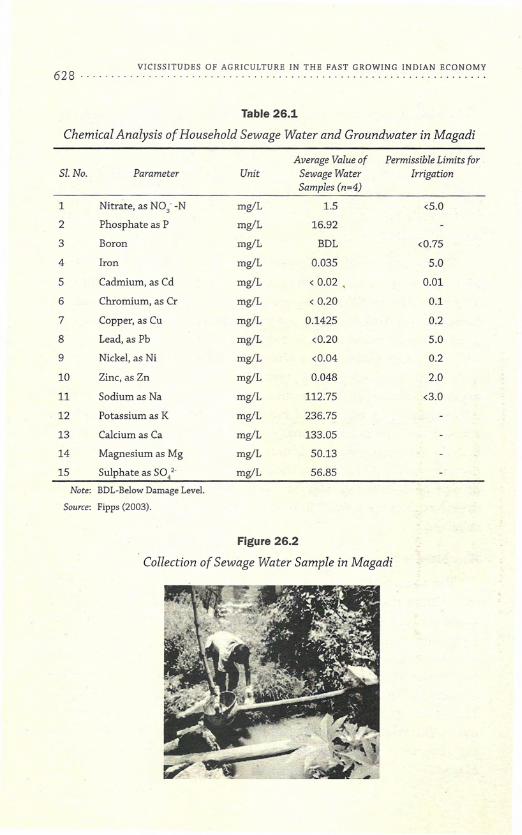
The Chemical analysis of household sewage was performed bycollecting sample of household sewage in Magadi in four placesnamely Kalya, Hombalammanagudi, Downtown Magadi and nearBargavati lake. The samples were subjected to chemical analysisand the results (Table 26.1 and Figures 26.2 and 26.3) indicate thatall the hazardous chemicals including heavy metals are within thepermissible limits in the household sewage water sample of Magadi.This is an apparent pointer to the chemical safety of the sewagewater. The safety level of Magadi household sewage is largely due tothe absence of industrial effluents in the drains and water ways inMagadi.
628 . VICISSITUDES OF AGRICULTURE IN THE FAST GROWING INDIAN ECONOMY
Table 26.1
Chemical Analysis of Household Sewage Water and Groundwater in Magadi
Average Value of Permissible Limits forSI. No. Parameter Unit Sewage Water Irrigation
Samples (n=4)
1 Nitrate, as NO;-N mg/L 1.5 <5.0
2 Phosphate as P mg/L 16.92
3 Boron mg/L BDL <0.75
4 Iron mg/L 0.035 5.0
5 Cadmium, as Cd mg/L <0.02 , 0.01
6 Chromium, as Cr mg/L <0.20 0.1
7 Copper, as Cu mg/L 0.1425 0.2
8 Lead, as Pb mg/L <0.20 5.0
9 Nickel, as Ni mg/L <0.04 0.2
10 Zinc, as Zn mg/L 0.048 2.0
11 Sodium as Na mg/L 112.75 <3.0
12 Potassium as K mg/L 236.75
13 Calcium as Ca mg/L 133.05
14 Magnesium as Mg mg/L 50.13
15 Sulphate as SO/- mg/L 56.85Note: BDL-Below Damage Level.
Source: Fipps (2003).
Figure 26.2
Collection of Sewage Water Sample in Magadi
ADOPTION OF SOIL NUTRIENT... • M.G. CHANDRAKANTH and K.M. BRUHAN........ . ·····629
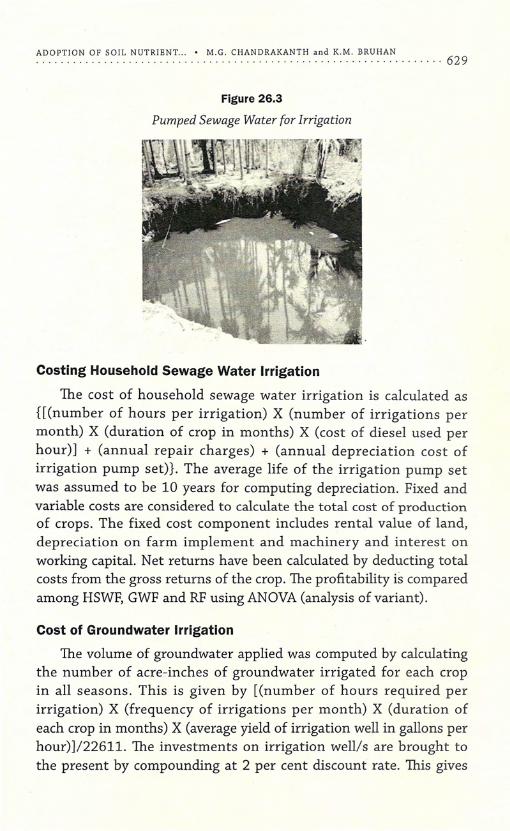
Figure 26.3
Pumped Sewage Water for Irrigation
Costing Household Sewage Water Irrigation
The cost of household sewage water irrigation is calculated as{[(number of hours per irrigation) X (number of irrigations permonth) X (duration of crop in months) X (cost of diesel used perhour)] + (annual repair charges) + (annual depreciation cost ofirrigation pump set)}. The average life of the irrigation pump setwas assumed to be 10 years for computing depreciation. Fixed andvariable costs are considered to calculate the total cost of productionof crops. The fixed cost component includes rental value of land,depreciation on farm implement and machinery and interest onworking capitaL Net returns have been calculated by deducting totalcosts from the gross returns of the crop. The profitability is comparedamong HSWF,GWFand RF using ANOVA(analysis of variant).
Cost of Groundwater Irrigation
The volume of groundwater applied was computed by calculatingthe number of acre-inches of groundwater irrigated for each cropin all seasons. This is given by [(number of hours required perirrigation) X (frequency of irrigations per month) X (duration ofeach crop in months) X (average yield of irrigation well in gallons perhour)]/22611. The investments on irrigation well/s are brought tothe present by compounding at 2 per cent discount rate. This gives
VICISSITUDES OF AGRICULTURE IN THE FAST GROWING INDIAN ECONOMY630 .
the total current cost of the well. This current cost of the well isamortised using the rule
A= 1x[(1+i)ALxil[(l+i)AL -1]
A= Amortised cost well; I= Initial investment on well; AL=Average life of well; i= Interest rate.
The cost per acre inch of groundwater used is calculated bydividing amortised cost of well/s by the annual groundwater pumpedin acre inches for all crops cultivated by farmer. ?-his gives unit costof groundwater pumped for irrigation (cost per acre inch). Cost ofirrigation water for each crop was then calculated by multiplyingthe unit cost of groundwater with total groundwater pumped inacre inches for each crop. The profitability of field crops, vegetables,flowers, livestock and dairy are analysed on per farm basis and arecompared among HSWF, GWF and RP.
Regression Analysis
Land and water are crucial resources in production and theiraccess is crucial in UPA. The net return per farm is regressed onexplanatory variables with the following estimated model:
Y = a + ~l X +~2 X2 + ~3Dl + ~4 D2 + ~SDIX + ~6D2X + cj ••• (1)Here, Y = annual net returns per farm obtained from cropscultivatedX = GCA (gross cropped area) per farm in guntas (1 acre = 40guntas)D. = (1, 0) dummy variable assigned representing groundwaterusing farmD2 = (0, 1) dummy variable assigned representing householdsewage water using farmThe base or reference dummy value of (0, 0) represents the
rainfed farm.
Marginal productivity of the GCAon rainfed farm= dY/dX = ~l +2 ~2X
ADOPTION OF SOIL NUTRIENT ...• M.G. CHANDRAKANTH and K.M. BRUHAN. . . .. .. . .. .. . . . .. .. . . . . . .. . . . .. .. . .. . . . . . . . .. . . . . . . . . 631
Marginal productivity of the GCAon groundwater using farm= dY/dX = Pi + 2 P2 X + PsMarginal productivity of the GCA on household sewage water
using farm= dY/dX = PI + 2 P2X + P6The elasticity of production with respect to GCA is calculated as
equal to(PI + 2 P2X + PSDI)XIY for groundwater using farms(PI + 2 P2X + P6D) XIY for household sewage water using farms(PI + 2 P2X) XIY for rainfed farmers
Externalities in Using Household Sewage Water
The household sewage water which reaches river system orlake inflicts external effects. Due to the scarcity of groundwater,sewage water can be a reliable and alternative source of irrigationand thus, complementing food and livelihood security of farmers.This reduces food miles benefiting peri-urban and urban consumersand demonstrates the positive external effects of household sewagewater use. Correspondingly, health of consumers who consume theseproducts as they are known to be potentially contaminated, may posenegative external effect. The producers who irrigate using householdsewage water face health impacts due to their exposure. It is crucial toanalyse whether the positive external effects overweigh the negativeeffects or vice versa and their quantification. With this framework,the impact of household sewage water on farmers and their health,savings in costs of irrigation and nutrients and increase in returns isanalysed using partial budgeting framework.
Cost of Healthcare
The annual costs incurred by farm family who use householdsewage water for irrigation are analysed. The health cost reflectsthe negative external effect. However, the cost of health careof consumers who consume crops/vegetables cultivated usinghousehold sewage water could not be obtained since it was difficultto trace the final consumer/so The cost of illness includes the direct
VICISSITUDES OF AGRICULTURE IN THE FAST GROWING INDIAN ECONOMY632 .
costs such as, cost of treatment, cost of medicines, cost of diagnosisand medical tests, imputed cost of person days lost due to illness andtransportation costs. Similar data are obtained from control farmersi.e. farmers using fresh groundwater resource for irrigation.
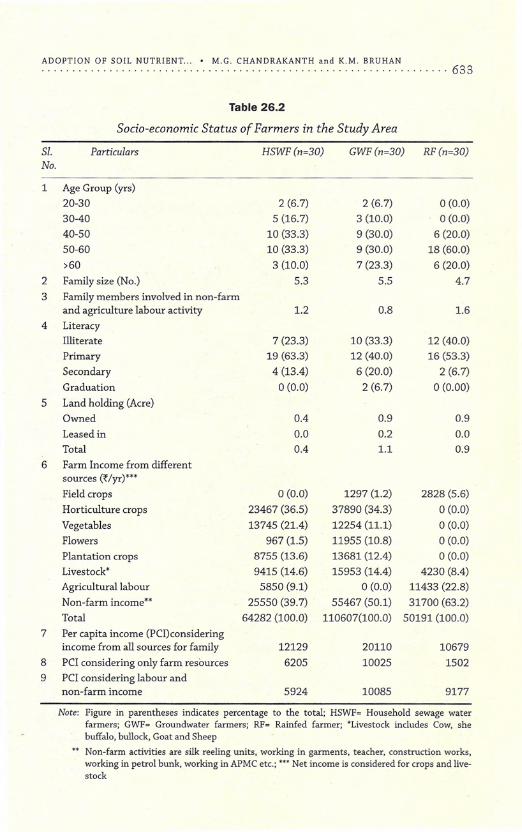
Farm Economy
Majority of farmers in UPA are above 40 years of age with 65 percent of them being literate with education up to primary level. Mostof the peri-urban farmers are marginal farmers; with the average sizeof holding of less than one acre. Hence, their holding size is measuredin guntas (each gunta = 33'X33'). The families are predominantlynuclear. Family labour availability towards farming was inadequateas some of the family members worked outside the farm. This ismanageable since holding size is marginal.
Sources of Income
For marginal farmers of HSW, the holding size is 0.4 acre followedby RFs (0.9 acre) and GWF (1.1 acres) indicative of the relative landscarcity. The economic importance of food crops (field crops) isreducing in UPA since the field crops provided only 5 per cent of theincome. For HSWF, the major portion of income is realised from non-farm income (40%) followed by horticulture crops (36%), livestock(15%), agriculture labour (10%). For GWF,major portion of income isderived from non-farm income (50%) followed by horticulture crops(34%), livestock (14%). For RFs, major income is from non-farm(63%) followed by agriculture labour wages (23%), field crops (6%).Thus, peri-urban farmers are leaning towards non-farm income, asfarming provided around 50% of the income especially for HSWF andGWF and RFs derived only 5.6 per cent of their income from cropfarming, and the rest from non-farm sources. The challenging taskfor policy makers is to strengthen the agricultural base of farmers inorder to achieve sustainable food production especially in UPA.
ADOPTION OF SOIL NUTRIENT.. M.G. CHANDRAKANTH and K.M. BRUHAN
Table 26.2
Socio-economic Status of Farmers in the Study Area
....... 633
SI. ParticularsNo.
RF(n~30)HSWF(n~30) GWF(n~30)
1 Age Group (yrs)20-3030-4040-5050-60
>602 Family size (No.)
3 Family members involved in non-farmand agriculture labour activity
4 LiteracyIlliteratePrimarySecondaryGraduationLand holding (Acre)Owned
5
6
Leased inTotalFarm Income from differentsources ('Vyr)***
Field cropsHorticulture cropsVegetablesFlowersPlantation cropsLivestock*Agricultural labourNon-farm incorne'"Total
Per capita income (PCI)consideringincome from all sources for familyPCI considering only farm resourcesPCI considering labour andnon-farm income
7
89
2 (6.7)5 (16.7)
10 (33.3)
10 (33.3)3 (10.0)
5.3
7 (23.3)19 (63.3)
4 (13.4)0(0.0)
0(0.0)23467 (36.5)13745 (21.4)
967 (1.5)
8755 (13.6)9415 (14.6)
5850 (9.1)
25550 (39.7)64282 (100.0)
12129
6205
2 (6.7)3 (10.0)9 (30.0)9 (30.0)7 (23.3)
5.5
1.2
10 (33.3)12 (40.0)
6 (20.0)2 (6.7)
0.40.00.4
1297 (1.2)
37890 (34.3)12254 (11.1)11955 (10.8)13681 (12.4)15953 (14.4)
0(0.0)
55467 (50.1)110607(100.0)
20110
10025
5924 10085
0(0.0)0(0.0)
6 (20.0)18 (60.0)
6 (20.0)
4.7
0.8 1.6
12 (40.0)16 (53.3)
2 (6.7)0(0.00)
0.9
0.21.1
0.9
0.00.9
2828 (5.6)0(0.0)0(0.0)0(0.0)0(0.0)
4230 (8.4)11433 (22.8)
31700 (63.2)50191 (100.0)
106791502
9177
Note: Figure in parentheses indicates percentage to the total; HSWF= Household sewage waterfarmers; GWF= Groundwater farmers; RF= Rainfed farmer; 'Livestock includes Cow, shebuffalo, bullock, Goat and Sheep
Non-farm activities are silk reeling units, working in garments, teacher, construction works,working in petrol bunk, working in APMC etc.; •• , Net income is considered for crops and live-stock
VICISSITUDES OF AGRICULTURE IN THE FAST GROWING INDIAN ECONOMY634 .
Per Capita Income
The per capita income from all the sources is higher for GWF(~20,110) followed by HSWF (H2,129) and RFs (HO,679). Non-farm income is inversely proportional to access to water resources.Hence farmers who have access to household sewage water, had thelowest proportion of non-farm income (40% of the total), followedby GWF (50%) and RFs (63%). Thus, access to water resource was thechief trigger to retain farmers in farming in UPA and any lapse inthis regard, motivated them to rely more on non-farm incomes thanfarm sources, due to increasing economic scarcity of labour, land andwater. Gradually this resulted in seasonal!permanent outmigration tourban areas.
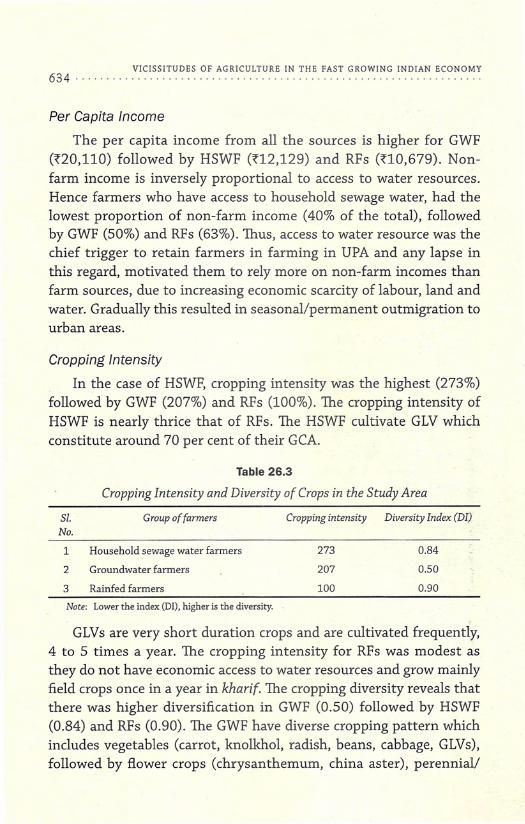
Cropping Intensity
In the case of HSWF, cropping intensity was the highest (273%)followed by GWF (207%) and RFs (100%). The cropping intensity ofHSWF is nearly thrice that of RFs. The HSWF cultivate GLV whichconstitute around 70 per cent of their GCA.
Table 26.3
Cropping Intensity and Diversity of Crops in the Study Area
SI. Group of farmersNo.
Cropping intensity Diversity Index (DI)
1 Household sewage water farmers
2 Groundwater farmers
273 0.84
207 0.50
100 0.903 Rainfed farmers
Note: Lower the index (DJ). higher is the diversity.
GLVs are very short duration crops and are cultivated frequently,4 to 5 times a year. The cropping intensity for RFs was modest asthey do not have economic access to water resources and grow mainlyfield crops once in a year in kharif. The cropping diversity reveals thatthere was higher diversification in GWF (0.50) followed by HSWF(0.84) and RFs (0.90). The GWF have diverse cropping pattern whichincludes vegetables (carrot, knolkhol, radish, beans, cabbage, GLVs),followed by flower crops (chrysanthemum, china aster), perennial!
ADOPTION OF SOIL NUTRIENT... • M.G. CHANDRAKANTH and K.M. BRUHAN.. 635
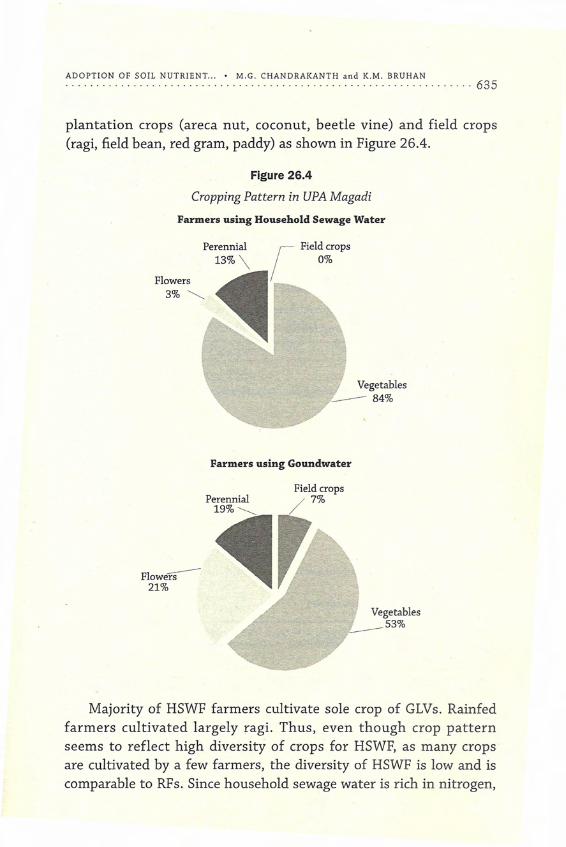
plantation crops (areca nut, coconut, beetle vine) and field crops(ragi, field bean, red gram, paddy) as shown in Figure 26.4.
Figure 26.4
Cropping Pattern in UPA Magadi
Farmers using Household Sewage Water
Flowers3% <,
Vegetables~84%
Farmers using Goundwater
Flowers--21%
Majority of HSWF farmers cultivate sole crop of GLVs. Rainfedfarmers cultivated largely ragi. Thus, even though crop patternseems to reflect high diversity of crops for HSWF, as many cropsare cultivated by a few farmers, the diversity of HSWF is low and iscomparable to RFs. Since household sewage water is rich in nitrogen,
VICISSITUDES OF AGRICULTURE IN THE FAST GROWING INDIAN ECONOMY636····· .
essential for vegetative growth, GLVs are grown by farmers. Inaddition, GLVsneed to be quickly marketed as they are very highlyperishable. Urban areas in proximity are the fastest to reach anddispose. Thus, other vegetables such as carrots, radish were not asextensively grown as GLVs in Magadi. In addition, GLVs may havehigher capacity to absorb the bacterial load compared with othervegetables. It is reported that such household sewage water containshigh bacterial load that will lead to quick rotting (Sekar, 2001).
Table 26.4
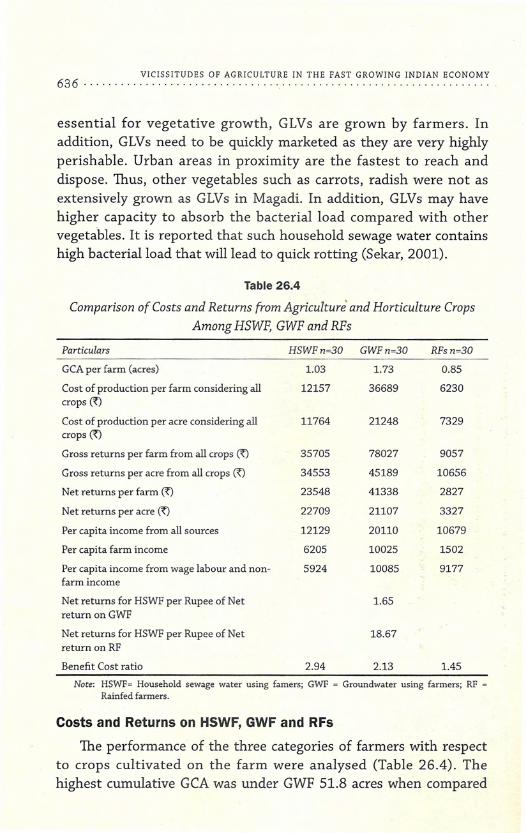
Comparison of Costs and Returns from Agriculture' and Horticulture CropsAmong HSWF, GWF and RFs
Particulars HSWFn~30 GWFn~30 RFsn~30
GCA per farm (acres) 1.03 1.73 0.85Cost of production per farm considering all 12157 36689 6230crops ~
Cost of production per acre considering all 11764 21248 7329crops ~
Gross returns per farm from all crops ~ 35705 78027 9057Gross returns per acre from all crops ~ 34553 45189 10656Net returns per farm ~ 23548 41338 2827Net returns per acre ~ 22709 21107 3327Per capita income from all sources 12129 20110 10679Per capita farm income 6205 10025 1502Per capita income from wage labour and non- 5924 10085 9177farm income
Net returns for HSWF per Rupee of Net 1.65return on GWF
Net returns for HSWF per Rupee of Net 18.67return on RF
Benefit Cost ratio 2.94 2.13 1.45Note: HSWF~ Household sewage water using famers; GWF = Groundwater using farmers; RP ~
Rainfed farmers.
Costs and Returns on HSWF, GWF and RFs
The performance of the three categories of farmers with respectto crops cultivated on the farm were analysed (Table 26.4). Thehighest cumulative GCAwas under GWF 51.8 acres when compared
ADOPTION OF SOIL NUTRIENT... • M.G. CHANDRAKANTH and K.M. BRUHAN...................................................... ············637
with HSWF (31.0 acres) and RFs (25.5 acres). The net returns per acrefor HSWF (~22,709) were higher than that of GWF (~21,107) and RFs(~3,327). This is due to reduction in the cost of inputs especially waterand fertilisers that will reflect in higher profits for HSWF. The returnper rupee of investment was higher in the case of HSWF (2.94) thanthat of GWF (2.13) and RFs (1.45).
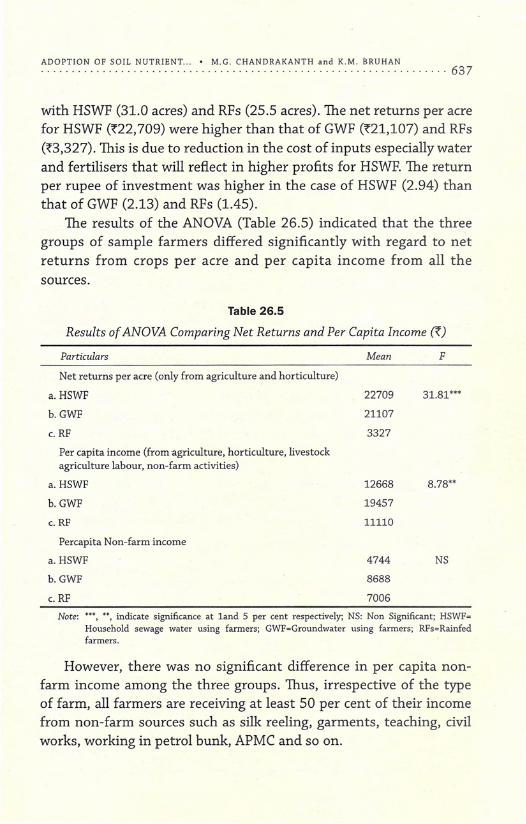
The results of the ANOVA (Table 26.5) indicated that the threegroups of sample farmers differed significantly with regard to netreturns from crops per acre and per capita income from all thesources.
Table 26.5
Results of ANOVA Comparing Net Returns and Per Capita Income ~)
Particulars Mean F
Net returns per acre (only from agriculture and horticulture)
a. HSWF
b.GWF
31.81***
c.RF
Per capita income (from agriculture, horticulture, livestockagriculture labour, non-farm activities)
22709211073327
a. HSWF
b.GWF
8.78**
c.RF
126681945711110
Percapita Non-farm income
a. HSWF
b.GWF
c. RF
474486887006
NS
Note: ***, **, indicate significance at land 5 per cent respectively; NS: Non Significant; HSWF=Household sewage water using farmers; GWF=Groundwater using farmers; RFs=Rainfedfarmers.
However, there was no significant difference in per capita non-farm income among the three groups. Thus, irrespective of the typeof farm, all farmers are receiving at least 50 per cent of their incomefrom non-farm sources such as silk reeling, garments, teaching, civilworks, working in petrol bunk, APMC and so on.
638·········································· .VICISSITUDES OF AGRICULTURE IN THE FAST GROWING INDIAN ECONOMY
Economic Contribution of Household Sewage Water in Agriculture
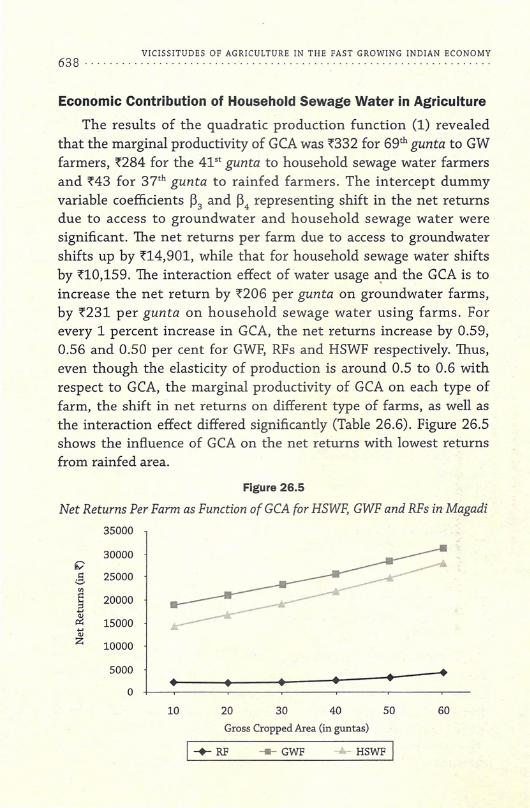
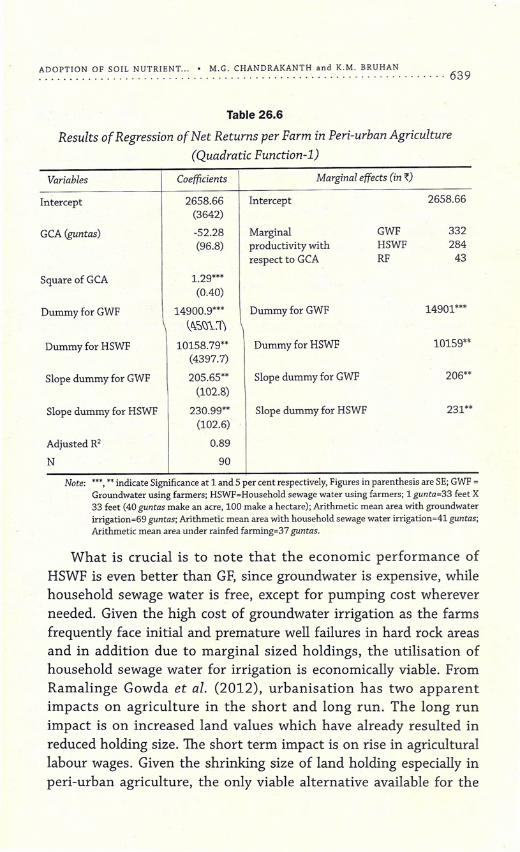
The results of the quadratic production function (1) revealedthat the marginal productivity of GCAwas ~332 for 69th gunta to GWfarmers, ~284 for the 41st gunta to household sewage water farmersand ~43 for 37th gunta to rainfed farmers. The intercept dummyvariable coefficients ~3 and ~4 representing shift in the net returnsdue to access to groundwater and household sewage water weresignificant. The net returns per farm due to access to groundwatershifts up by n4,901, while that for household sewage water shiftsby nO,159. The interaction effect of water usage and the GCAis toincrease the net return by ~206 per gunta on groundwater farms,by ~231 per gunta on household sewage water using farms. Forevery 1 percent increase in GCA, the net returns increase by 0.59,0.56 and 0.50 per cent for GWF, RFs and HSWF respectively. Thus,even though the elasticity of production is around 0.5 to 0.6 withrespect to GCA, the marginal productivity of GCA on each type offarm, the shift in net returns on different type of farms, as well asthe interaction effect differed significantly (Table 26.6). Figure 26.5shows the influence of GCAon the net returns with lowest returnsfrom rainfed area.
Figure 26.5
Net Returns Per Farm as Function of GCA for HSWF, GWF and RFs in Magadi35000
30000ID2- 25000'"~ 20000•..;::l•..QJ
P:: 15000•..QJZ 10000
5000 • ..•• • • •010 20 30 40 50 60
Gross Cropped Area (in guntas)
I --+-- RF --- GWF -A-- HSWF I
ADOPTION OF SOIL NUTRIENT... • M.G. CHANDRAKANTH and K.M. BRUHAN...................................................... ············639
Table 26.6
Results of Regression of Net Returns per Farm in Peri-urban Agriculture(Quadratic Function-L)
Variables Coefficients
Intercept 2658.66(3642)
GCA (guntas) -52.28(96.8)
Square of GCA 1.29***(0.40)
Dummy for GWF 14900.9***\1\~\Y\..l)
Dummy for HSWF 10158.79**(4397.7)
Slope dummy for GWF 205.65**(102.8)
Slope dummy for HSWF 230.99*'(102.6)
Adjusted R2 0.89
N 90
Marginal effects (in ~)
Intercept 2658.66
Marginalproductivity withrespect to GCA
GWFHSWFRP
332284
43
Dummy for GWF 14901***
Dummy for HSWF 10159**
Slope dummy for GWF 206**
Slope dummy for HSWF 231**
Note: ***, ** indicate Significance at 1 and 5 per cent respectively, Figures in parenthesis are SE; GWF =Groundwater using farmers; HSWF=Household sewage water using farmers; 1 gunta=33 feet X33 feet (40 guntas make an acre, 100 make a hectare); Arithmetic mean area with groundwaterirrigation=69 guntas; Arithmetic mean area with household sewage water irrigation=41 guntas;Arithmetic mean area under rainfed farming=37 guntas.
What is crucial is to note that the economic performance ofHSWF is even better than GF, since groundwater is expensive, whilehousehold sewage water is free, except for pumping cost whereverneeded. Given the high cost of groundwater irrigation as the farmsfrequently face initial and premature well failures in hard rock areasand in addition due to marginal sized holdings, the utilisation ofhousehold sewage water for irrigation is economically viable. FromRamalinge Gowda et al. (2012), urbanisation has two apparentimpacts on agriculture in the short and long run. The long runimpact is on increased land values which have already resulted inreduced holding size. The short term impact is on rise in agriculturallabour wages. Given the shrinking size of land holding especially inperi-urban agriculture, the only viable alternative available for the
VICISSITUDES OF AGRICULTURE IN THE FAST GROWING INDIAN ECONOMY640 .
farmer to expand agriculture is through intensive farming possible byincreasing the cropping intensity via irrigation intensity.
Therefore the MP (marginal productivity) of access to water iscompared with marginal productivity of land. Since MP of land isalready higher than that of water, the differential between the MP ofland and MP of access to water is taken as the normative increase inthe cropping intensity through intense water use on short durationcrops such as GLV.For instance, if the MP of land is higher than theMP of access to water by 50 percent, the cropping intensity needsto be increased by 50 per cent over the exis,ting level, merely bycultivating short duration commercial crops on the existing land, sothat farmer does intensive cultivation and benefits from it.
Common Ailments of Sample Farmers which Impinge on Health
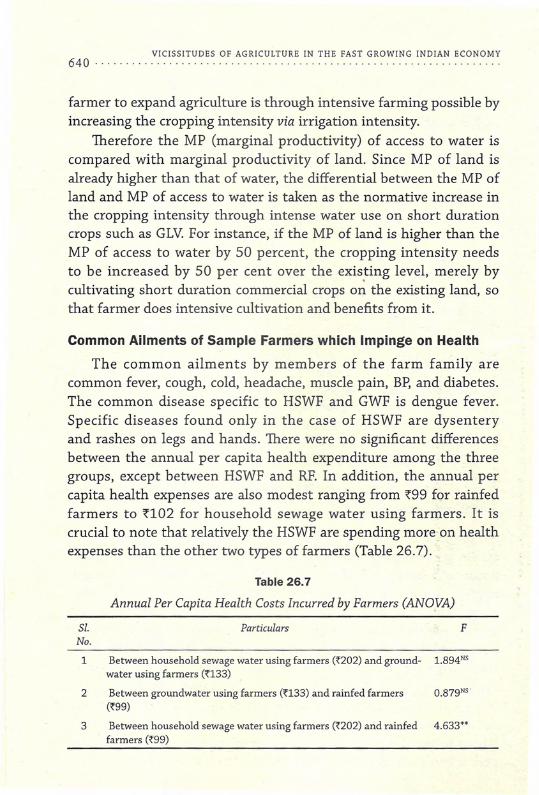
The common ailments by members of the farm family arecommon fever, cough, cold, headache, muscle pain, BP,and diabetes.The common disease specific to HSWF and GWF is dengue fever.Specific diseases found only in the case of HSWF are dysenteryand rashes on legs and hands. There were no significant differencesbetween the annual per capita health expenditure among the threegroups, except between HSWF and RF. In addition, the annual percapita health expenses are also modest ranging from ~99 for rainfedfarmers to ~102 for household sewage water using farmers. It iscrucial to note that relatively the HSWF are spending more on healthexpenses than the other two types of farmers (Table 26.7).
Table 26.7
Annual Per Capita Health Costs Incurred by Farmers (ANOVA)
SI. Particulars FNo.
1 Between household sewage water using farmers (f202) and ground- 1.894NS
water using farmers (U33)
2 Between groundwater using farmers (U33) and rainfed farmers O.879NS·
(f99)
3 Between household sewage water using farmers (f202) and rainfed 4.633**farmers (f99)
ADOPTION OF SOIL NUTRIENT... M.G. CHANDRAKANTH and K.M. BRUHAN.... 641
Estimation of Externality in Using Household Sewage Water
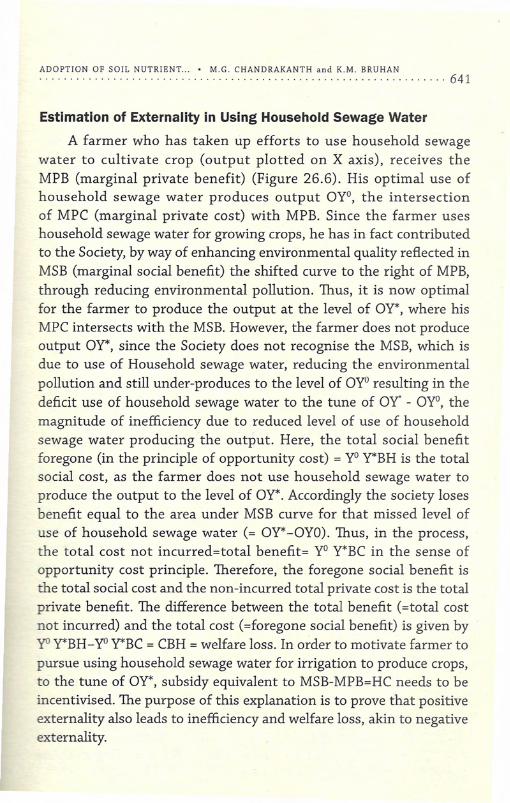
A farmer who has taken up efforts to use household sewagewater to cultivate crop (output plotted on X axis), receives theMPB (marginal private benefit) (Figure 26.6). His optimal use ofhousehold sewage water produces output O'Y'', the intersectionof MPC (marginal private cost) with MPB. Since the farmer useshousehold sewage water for growing crops, he has in fact contributedto the Society, by way of enhancing environmental quality reflected inMSB (marginal social benefit) the shifted curve to the right of MPB,through reducing environmental pollution. Thus, it is now optimalfor the farmer to produce the output at the level of OY*,where hisMPC intersects with the MSB. However, the farmer does not produceoutput OY*,since the Society does not recognise the MSB, which isdue to use of Household sewage water, reducing the environmentalpollution and still under-produces to the level of Oyo resulting in thedeficit use of household sewage water to the tune of OY - Oyo, themagnitude of inefficiency due to reduced level of use of householdsewage water producing the output. Here, the total social benefitforegone (in the principle of opportunity cost) = yo Y*BHis the totalsocial cost, as the farmer does not use household sewage water toproduce the output to the level of OY*.Accordingly the society losesbenefit equal to the area under MSB curve for that missed level ofuse of household sewage water (= OY*-OYO).Thus, in the process,the total cost not incurredvtotal benefit= yo Y*BCin the sense ofopportunity cost principle. Therefore, the foregone social benefit isthe total social cost and the non-incurred total private cost is the totalprivate benefit. The difference between the total benefit (=total costnot incurred) and the total cost (=foregone social benefit) is given byYOY*BH- yo Y*BC= CBH = welfare loss. In order to motivate farmer topursue using household sewage water for irrigation to produce crops,to the tune of OY*,subsidy equivalent to MSB-MPB=HCneeds to beincentivised. The purpose of this explanation is to prove that positiveexternality also leads to inefficiency and welfare loss, akin to negativeexternality.
642 .VICISSITUDES OF AGRICULTURE IN THE FAST GROWING INDIAN ECONOMY
Figure 26.6
Positive Externality Leading to Underproduction in Farming UsingHousehold Sewage Water for Irrigation
MSB,MPB,MPC
MPC
H-:
A ""'-
~MPB
MSB
oY*
Empirical Estimation of Positive ExternalityUsing Partial Budgeting
In this study partial budgeting framework (Table 26.8) has beenused to estimate the positive externality = MSB,due to use of HSW tocultivate crops in peri-urban Magadi. The Debit side includes healthcosts and decrease in returns due to use of household sewage water;and Credit side includes savings and increase in net returns due touse of household sewage water for irrigation. This exercise could notbe done for individual farms, since all the farms would not have allthe components of credit and debit side.
Hence, this exercise is attempted at the aggregate level consideringall the sample farmers of the study area. The credit minus debit figureis spread across the gross area differential under both the types ofirrigation in order to obtain the externality on per acre basis. Onthe debit side, the annual health cost of both HSWF and GWF wereconsidered as externality cost. Thus, the difference in annual healthcost of HSWF and GWF was ~6,200 for all the farms. The result ofpartial budgeting analysis indicated that this is a positive externalityof n2,352 per acre for all the farms.
ADOPTION OF SOIL NUTRIENT .. M.G. CHANDRAKANTH and K.M. BRUHAN. ·····643
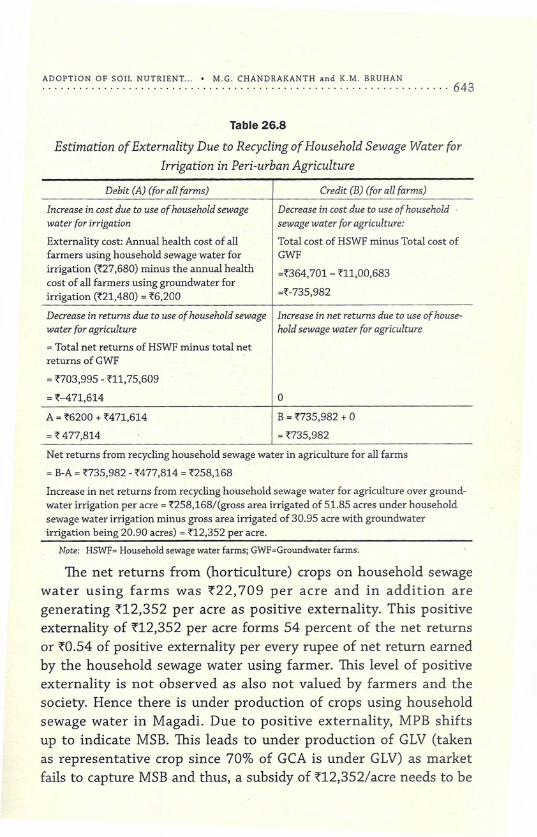
Table 26.8
Estimation of Externality Due to Recycling of Household Sewage Water forIrrigation in Peri-urban Agriculture
Debit (A) (for all farms) Credit (B) (for all farms)
Increase in cost due to use of household sewagewater for irrigation
Externality cost: Annual health cost of allfarmers using household sewage water forirrigation (~27,680) minus the annual healthcost of all farmers using groundwater forirrigation (~21,480) = ~6,200
Decrease in cost due to use of householdsewage water for agriculture:
Total cost of HSWFminus Total cost ofGWF
=~364,701 - U1,00,683
=~-735,982
Decrease in returns due to use of household sewagewater for agriculture
= Total net returns of HSWFminus total netreturns of GWF
=~703,995 - U1,75,609
=~-471,614
Increase in net returns due to use of house-hold sewage water for agriculture
oA = ~6200 + ~471,614
=~477,814
B = ~735,982 + 0
=~735,982
= B-A=~735,982 - ~477,814 =~258,168
Net returns from recyclinghousehold sewage water in agriculture for all farms
Increase in net returns from recyclinghousehold sewage water for agriculture over ground-water irrigation per acre =~258,168/(gross area irrigated of 51.85 acres under householdsewage water irrigation minus gross area irrigated of 30.95 acre with groundwaterirrigation being 20.90 acres) = U2,352 per acre.
Note: HSWF= Household sewage water farms; GWF=Groundwater farms.
The net returns from (horticulture) crops on household sewagewater using farms was ~22, 709 per acre and in addition aregenerating U2,352 per acre as positive externality. This positiveexternality of ~12,352 per acre forms 54 percent of the net returnsor ~0.54 of positive externality per every rupee of net return earnedby the household sewage water using farmer. This level of positiveexternality is not observed as also not valued by farmers and thesociety. Hence there is under production of crops using householdsewage water in Magadi. Due to positive externality, MPB shiftsup to indicate MSB. This leads to under production of GLV (takenas representative crop since 70% of GCA is under GLV) as marketfails to capture MSB and thus, a subsidy of U2,352/acre needs to be
644 .VICISSITUDES OF AGRICULTURE IN THE FAST GROWING INDIAN ECONOMY
offered to encourage farmers towards utilisation of household sewagewater for cultivation of crops in Magadi and thereby reduce thenegative external effects.
Thu's, the subsidy of U2,356 is actually the value of underproduction due to suboptimal use of household sewage water forirrigating crops. Since GLV is the main crop of HSWF, in termsof quantity, given the price of GLV being U2 per kg, the valueof under production of U2,352 translates to 1030 Kgs of GLV(=U2,352/U2). From 1.02 acres, which is the average gross areaplanted to GLV,using household sewage water, 2400 kgs of GLVcanbe obtained (according to field data from Magadi). Thus, 1030 kgsof under production of GLV forms 43 per cent (=103012400)*100of the output per acre. Since the average GCA of GLV cultivationby farmers using HSW in Magadi is 1.02 acres, every HWW farmercultivating GLV,is under producing to the tune of 43 per cent ofcapacity due to presence of positive externality, due to market failure.This can be rectified by subsidising household sewage water to thetune of U2,352 per acre. Already at present, only 20 per cent of thehousehold sewage water is currently being used in peri-urban Magadifor irrigation by the farmers, which is a prima facie indicator of thepositive externality leading to under production.
Conclusion
There is a general apathy towards use of untreated householdsewage water to cultivate crops. Such apathy is understandable ifthe urban sewage is used, akin to the use of Bellandur tank sewagewater for agriculture, which includes heavy metal affluent. However,the existing level of use of household sewage water is below 20per cent considering both area and volume basis. This needs to besubstantially improved through awareness since the householdsewage water has no heavy metals and is close to organic. Householdsewage water farmers should be incentivised to the tune of U2,352per acre or ~309 per gunta so as to motivate them to use householdsewage water for irrigation. Non-farm income opportunities such assilk reeling and other vocations need to be enhanced for HSWF toaugment their income.
ADOPTION OF SOIL NUTRIENT ... M.G. CHANDRAKANTH and K.M. BRUHAN 645
ReferencesBruhan, K.M. (2011). Economics of Recycling Household waste water in peri-urban farming, Bangalore
metropolis, India. M.Se. (Agri) Thesis (Unpublished). Bangalore: University of AgriculturalSciences.
Fipps, G. (2003). Irrigation Water Quality Standards and Salinity Management Strategies. AgriculturalCommunications. The Texas A&M University System. http://oaktrust.tamu.edulbitstream/handleI1969.1187829Ipdf_94.pdf?sequence=1&isAllowed=y
Mateo-Sagasta, J., K. Medlicott, M. Qadir, L. Raschid-Sally and P.Drechsel (2013). Proceedings of theUN-Water Project on the Safe Use of Waste water in Agriculture. http://www.ais.unwater.orglais/plugin file.phpl621 coursel sectionI29Iproceedings-no-ll_ WEB.pd f
Ramalinge Gowda, U.e., M.G. Chandrakanth, P.S. Srikanthamurthy, e.G. Yadav, N. Nagaraj andChannaveer (2012). "Economics of Peri-Urban Agriculture", Economic and Political Weekly47(24): 75-80. http://www.toenre.comldownloadsI2012--iun_epw _article_on_ periurban_agriculture_uas_bangalore.pdf
Scheierling, S.M., C. Bartone, 0.0. Mara and P. Drechsel (2010). "Improving Wastewater Use inAgriculture: An Emerging Priority", World Bank Policy Research Working Paper Series. http://www-wds. worldban k. orgl external! defa ultlWDS Con ten tServer IWDSP IIBI2 0101091071000158349_20100907090249IRenderedIPDF/WPS5412.pdf
Scott, e.A., N. !. Faruqui and L. Raschid-Sally (2004). "Wastewater Use in Irrigated Agriculture:Management Challenges in Developing Countries", in e.A. Scott, N.!. Faruqui, L. Raschid-Sally (eds.), Wastewater Use in Irrigated Agriculture.UK: CABI Publishing. http://www.ais.unwater.orglaislpluginfile.phpI225Imod_labellintroliwmL 4.pdf
Sekar, C. (2001). "Externality Effects of Common Property Resource Degradation", Indian Journal ofAgricultural Economics 56(3): 346.
Website:
www.idrc.ca/cip
646·················VICISSITUDES OF AGRICULTURE IN THE FAST GROWING INDIAN ECONOMY
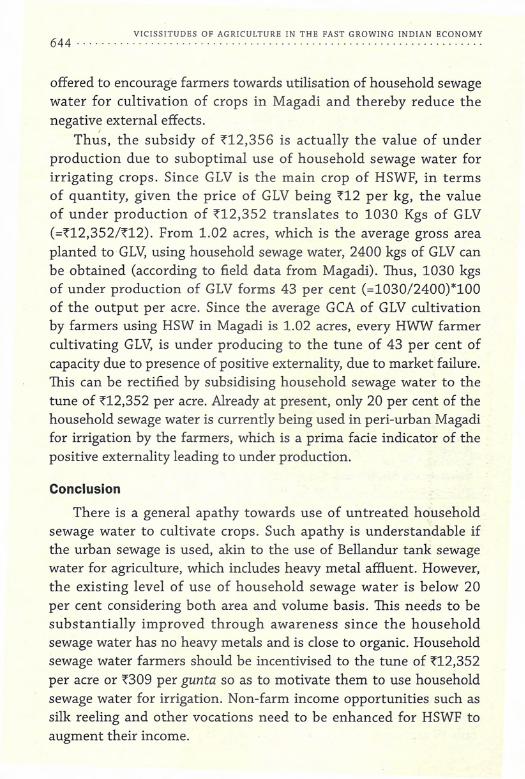
Appendix A-26.1
Farmer Cultivating Areca and Betelvine Using Sewage Water
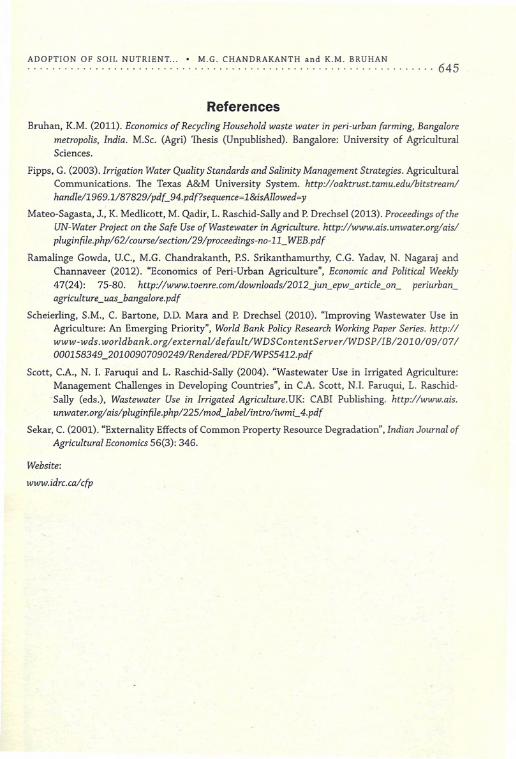
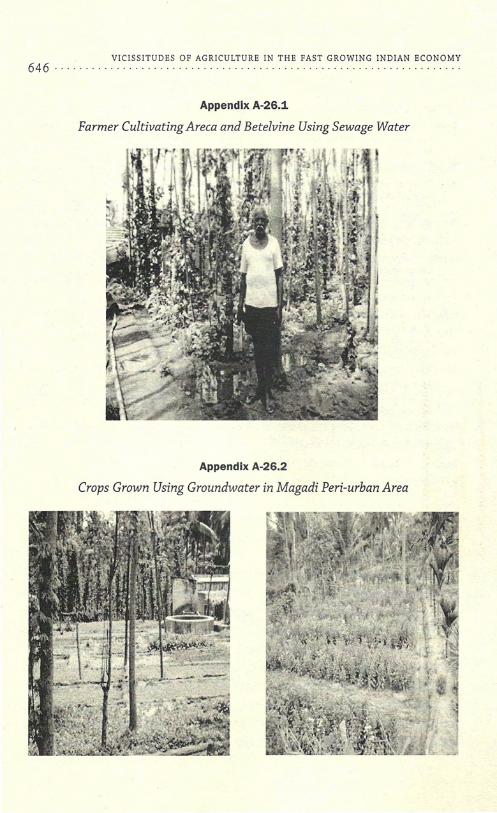
Appendix A-26.2
Crops Grown Using Groundwater in Magadi Peri-urban Area