external and internal summer atmospheric variability in the western north pacific and east asia
TRANSCRIPT

Journal of the Meteorological Society of Japan, Vol. 84, No. 3, pp. 447--462, 2006 447
External and Internal Summer Atmospheric Variability
in the Western North Pacific and East Asia
Riyu LU
Institute of Atmospheric Physics, Chinese Academy of Sciences, Beijing, China
Ying LI
Institute of Atmospheric Physics, Chinese Academy of Sciences, Beijing, China Graduate School,Chinese Academy of Sciences, Beijing, China
and
Buwen DONG
NCAS Centre for Global Atmospheric Modelling, Department of Meteorology, University of Reading, Reading,United Kingdom
(Manuscript received 30 April 2005, in final form 5 January 2006)
Abstract
The interannual variation of summer climate in the western North Pacific and East Asia (WNP/EA)has been investigated in this study using an experiment forced by global observed sea surface temper-atures (SSTs). The ensemble integrations enable us to separate externally forced variability from inter-nal variability. It is found that the lower-tropospheric circulation anomaly over the WNP is dominatedby the external variability forced by SSTs, while the anomaly of the East Asian jet (EAJ), is dominatedby the atmospheric internal variability. The external variability in the WNP/EA sector is mainly re-flected by the first leading empirical orthogonal function (EOF) mode of lower-tropospheric zonal wind,and partially by the second mode. The first mode is characterized by a cyclonic/anticyclonic circulationanomaly over the tropical WNP, reflecting changes in the WNP subtropical high. This mode is associatedwith precipitation and SST anomalies in the tropics. The second mode is characterized by a wave-likepattern of zonal wind in the meridional direction, with zonally-oriented cells over the WNP. This secondmode is associated with very weak SST anomalies, and more like a mode of the internal variability. Theinternal mode is found to be well organized in the WNP/EA sector. The features associated with thismode include the meridional displacement, and intensity variation of EAJ, and precipitation anomalyover the WNP.
1. Introduction
There is a strong linkage in the meridionaldirection among the climatic factors in the
western North Pacific, and East Asia (WNP/EA) (Nitta 1987; Tsuyuki and Kurihara 1989;Wang et al. 2001; Lu 2004). Therefore, the cli-mate in the East Asian countries is affected byboth the tropical processes and mid-latitudedisturbances. The tropical processes in thewestern Pacific are induced, to a large extentby the sea surface temperatures (SSTs), whilethe mid-latitude disturbances are dominated
Corresponding author: Riyu Lu, Institute of Atmo-spheric Physics, Chinese Academy of Sciences, POBox 9804, Beijing 100029, China.E-mail: [email protected]( 2006, Meteorological Society of Japan
by internal variability (e.g., Kang et al. 2004).Thus, both external and internal variabilitiescan significantly affect the East Asian climate.
The influence of the tropical SST anomalies,particularly of those related to the El Nino—Southern Oscillation (ENSO), on the summeratmospheric circulation and rainfall over theWNP/EA has been extensively studied. Inter-annual variability of climate in the WNP isfound to be related to the phases of ENSO(e.g., Huang and Wu 1989; Wang et al. 2000;Ailikun and Yasunari 2001; Wang and Zhang2002; Lu 2002; Chou et al. 2003). Wang et al.(2000) proposed a mechanism that the ENSOhas a delayed impact on the climate in theWNP/EA sector through a positive feedback ofthe in situ air-sea interaction in the WNP. Wuand Wang (2002) concluded that there is achange in this delayed affect of ENSO on theclimate in the WNP/EA sector in the late1970s. On the other hand, some studies investi-gated the simultaneous influence of ENSO onthe summer climate in the WNP/EA sector(Zhang et al. 1996, 1999; Tanaka 1997; Wuand Wang 2000). From the results of thesestudies, it can be concluded that the interan-nual variability of climate in the WNP/EA sec-tor is indeed linked to the ENSO, but this linkis modest and complex.
In addition, the East Asian summer climateis affected more significantly by mid-latitudeconditions. For instance, it is found that on theinterannual timescale, a zonally oriented tele-connection pattern can be identified along theAsian upper-tropospheric jet, and is linked tothe climate anomalies in East Asia (Krishnanand Sugi 2001; Lu et al. 2002; Enomoto 2004;Wakabayashi and Kawamura 2004). Lu et al.(2002) found that this teleconnection pattern isgeographically stationary, which can be ex-plained by an analysis on barotropic kinetic en-ergy conversion of Sato and Takahashi (2003).The extratropical atmospheric anomalies aremore controlled by the internal atmosphericprocesses (e.g., Wang et al. 1997; Kang et al.2004). The summer rainfall belt in East Asia(hereafter the Meiyu belt for abbreviation), islocated at 25�–40�N. Thus, it may be impliedthat the internal variability would play a con-siderable role in influencing the climate inEast Asia.
A lower-tropospheric cyclonic/anticyclonic cir-
culation anomaly over the subtropical WNP isconnected with the summer rainfall anomaliesin East Asia and in the tropical WNP (Wanget al. 2001). A zonal displacement of the sub-tropical high over the WNP closely correspondsto anomalous convection over the tropical WNP(Lu 2001). A westward extended subtropicalhigh is associated with a lower-tropospheric an-ticyclonic anomaly over the subtropical WNP,which results from an atmospheric Rossbywave response to suppressed convection overthe Philippine Sea (Lu and Dong 2001).
The EAJ is also intimately related to rainfallanomalies in East Asia in summer. Studies byLiang and Wang (1998), Lau et al. (2000) andLu (2004) showed that a poleward (equator-ward) shift of the EAJ is significantly relatedto suppressed (enhanced) convection along theMeiyu belt. Lau et al. (2000) used the meri-dional displacement of the EAJ to quantita-tively measure the interannual variability inthe East-Southeast Asian monsoon. Lin andLu (2005) performed an empirical orthogonalfunction (EOF) analysis on the interannualvariability in 200-hPa zonal wind over the sub-tropical WNP and East Asia, and found thatthe first and second leading modes reflect theEAJ’s meridional displacement and intensityvariation, respectively.
What are the features of the external and in-ternal variabilities in these dominant circula-tion systems in the WNP/EA sector in summer?To what extent, the external and internal vari-abilities contribute respectively to the interan-nual variations of these circulation systems?These questions are essential for the predict-ability of the climatic variability in the WNP/EA sector. In addition, addressing these ques-tions is also helpful for the better understand-ing of the physical mechanisms responsible forthe climatic variability in the WNP/EA sector.In this study, we address these questions byseparating externally forced variability frominternal variability through an ensemble of in-tegrations, by a model forced with the globalobserved SSTs. Some previous studies investi-gated the contributions of external forcing, andinternal process to climatic variability (e.g.,Harzallah and Sadourny 1995; Rowell et al.1995; Goswami 1998). However, there havebeen few studies on the external and internalvariabilities in summer atmospheric circulation
448 Journal of the Meteorological Society of Japan Vol. 84, No. 3
systems over the WNP/EA sector. The experi-mental design and analysis approach, are de-scribed in section 2. We analyze the variabilitiesof lower-tropospheric circulation, and upper-tropospheric circulation over the WNP/EA sec-tor in sections 3 and 4, respectively. Section 5is devoted to a summary.
2. Experimental design
The numerical model used in this study isthe Met Office Hadley Centre atmospheric gen-eral circulation model, known as HadAM3. Themodel uses a 2.5� latitude by 3.75� longitudegrid, and 19 model levels. It includes the newland surface scheme developed by Cox et al.(1999). This new land surface scheme includesa representation of the freezing and meltingof soil moisture, leading to better simulationsof surface temperatures, and a new formulationof evaporation, which includes the dependenceof stomatal resistance to temperature, vapourpressure deficit and CO2. A detailed descriptionof the model formulation, and its performance,is documented in Pope et al. (2000).
The experiment was conducted over the pe-riod 1 December 1985 to 31 August 2000, withglobal observed SSTs and sea ice extent, as de-scribed by Reynolds et al. (2002). In order toseparate externally forced variability from in-ternal variability, an ensemble of ten integra-tions was performed with slightly differentinitial states. The initial conditions were takenfrom 10 consecutive days of a spin-up integra-tion. In this study, the simulated interannualvariability is separated into an external compo-nent and an internal component, with a similarapproach of Rowell et al. (1995). That is, the ex-ternal variability is defined as the ensemblemean, and the internal variability is defined asthe deviations from the ensemble mean. Theonly assumptions required are that the internalvariability is the same for each year, and thatthe effect of altering the initial atmosphericconditions has a purely random impact on thesimulated seasonal anomalies. For the detailsof calculating method, refer to Rowell et al.(1995).
The observed data were used in this study toevaluate the simulated results. They includethe monthly precipitation data from 1979 to2003, derived by the Climate Prediction Center(CPC) Merged Analysis of Precipitation (CMAP;
Xie and Arkin 1997), SST (Smith and Reynolds2004), and monthly mean NCEP-NCAR reanal-ysis data from 1958 to 2003 (Kalnay et al.1996). We used the 15-year data from 1986 to2000, identical to the simulation period in thisstudy, to facilitate the comparison with the si-mulated results. We also used extended obser-vation data, 1979–2003 for precipitation, and1958–2003 for circulation and SST, to evaluatethe results based on the 15-year data.
3. Lower-tropospheric circulation andprecipitation in the western NorthPacific
a. Basic features in observation andsimulation
Figure 1 shows the climatological JJA-meanprecipitation and 850-hPa horizontal winds inobservations and simulation. The model cap-tures very well the basic features of both theIntertropical Convergence Zone (ITCZ), and an-ticyclonic circulation over the Pacific and In-dian Ocean. It also reproduces the small-scaleheavy precipitations in the western coast ofIndia, the Bay of Bengal, the South China Seaand the Philippine Sea, and the meanderingpattern of lower-tropospheric westerly jet overSouth Asia. The simulation differs slightlyfrom observations in the WNP, showing lessprecipitation and weaker southwesterly in Ko-rea and Japan, both of which may be related toeach other.
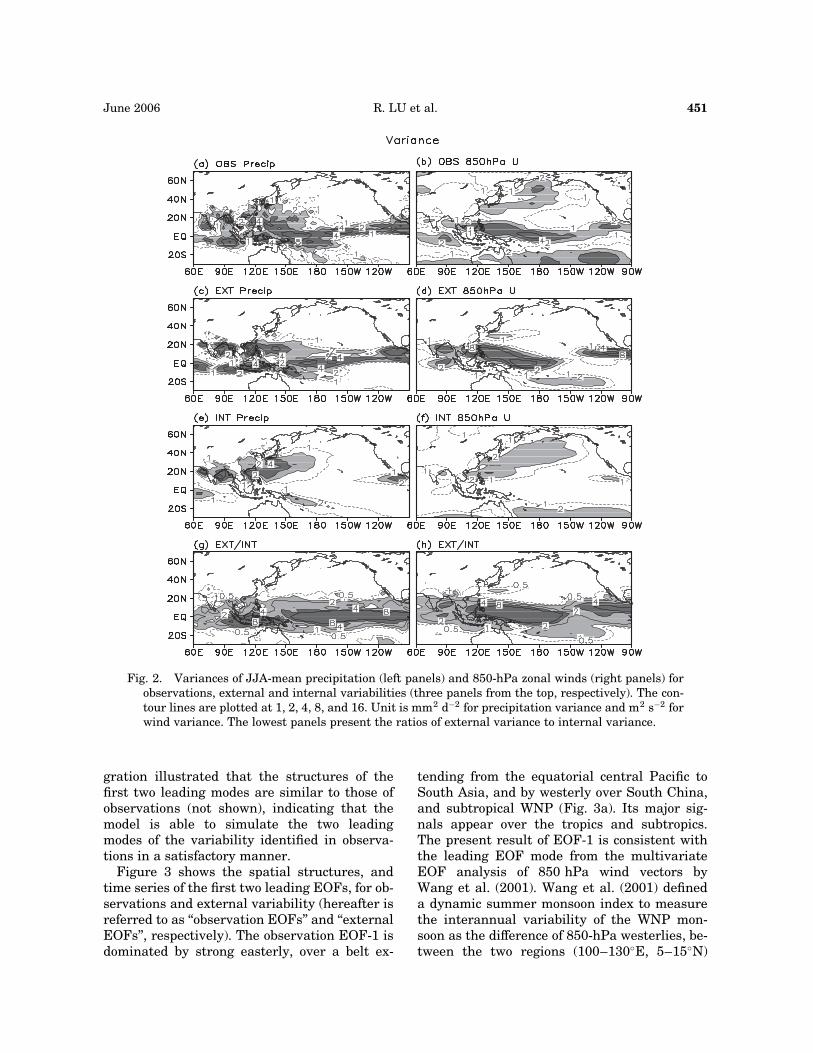
Figure 2 shows the variance of JJA-meanprecipitation, and 850-hPa zonal winds in ob-servations and simulation. The variance ofinterannual variation of precipitation, both forobservations and external variability in thesimulation (Figs. 2a and 2c), is large in theITCZ, and resembles well the climatologicalmeans in distribution. In the tropics, the exter-nally forced precipitation has a variance simi-lar to the observed precipitation. The 850-hPazonal wind, both for observations and externalvariability in the simulation, exhibits a greatinterannual variability over a belt extendingfrom the equatorial central Pacific to SouthAsia (Figs. 2b and 2d). In comparison with ob-servations, the model simulates a stronger in-terannual variability over the belt, and tropicaleastern North Pacific, and a weaker variabilityin the extratropics, which is expected since thevariances of external variability are calculated
June 2006 R. LU et al. 449

by the ensemble means, and since internalvariability is generally stronger in the extra-tropics. The zonal wind at 850 hPa exhibits aweak interannual variability over the IndianOcean and South Asia than over the westernPacific, although precipitation shows compara-ble variability in these regions. The variancesof 850-hPa zonal wind bear no resemblance tothe climatological means.
The internal variance of precipitation (Fig.2e) is large in the western coast of India, theBay of Bengal, the South China Sea and thePhilippine Sea, the tropical eastern North Pa-cific, and the southern Indian Ocean. In com-parison with the external variance, the internalvariance is relatively larger in the southernEurasian continent, East Asia, the subtropicalWNP and the central North Pacific. The inter-nal variance of 850-hPa zonal wind (Fig. 2f )is larger than, or comparable to, the externalvariance in the subtropical WNP and extra-tropical North Pacific. In the tropics, com-pared with precipitation, circulation has muchsmaller values of internal variance than theexternal variance, indicating that the latter
has a higher potential predictability than theformer. In summary, the internal variability ofboth precipitation and lower-tropospheric zonalwind is strong in the WNP, the region focusedon at this section.
The ratios between the external variance,and internal variance are shown in Figs. 2gand 2h, as in Kang et al. (2004). The externalvariance is much larger in the tropical Pacificand the maritime continent, but is smaller inthe extratropics, in comparison with the inter-nal variance, for both precipitation and 850-hPa zonal wind. Both the amplitude and distri-bution of ratios are in good agreement withthose in Kang et al. (2004), who used a differentAGCM.
b. Observation and external variabilityAn empirical orthogonal function (EOF) anal-
ysis was performed on the JJA-mean 850-hPazonal wind, to investigate the dominant fea-tures of the lower-tropospheric circulation inthe WNP. The EOF analysis on JJA-mean pre-cipitation, 850 hPa and 200 hPa zonal windssimulated by a member of the ensemble inte-
Fig. 1. JJA-mean precipitation (upper panels) and 850-hPa horizontal winds (lower panels) in obser-vations (left panels) and simulation (right panels), averaged over 15 years (1986–2000). Unit ismm d�1 for precipitation and m s�1 for wind. Contour intervals are 2 for precipitation, and valuesgreater than 6 are shaded.
450 Journal of the Meteorological Society of Japan Vol. 84, No. 3
gration illustrated that the structures of thefirst two leading modes are similar to those ofobservations (not shown), indicating that themodel is able to simulate the two leadingmodes of the variability identified in observa-tions in a satisfactory manner.
Figure 3 shows the spatial structures, andtime series of the first two leading EOFs, for ob-servations and external variability (hereafter isreferred to as ‘‘observation EOFs’’ and ‘‘externalEOFs’’, respectively). The observation EOF-1 isdominated by strong easterly, over a belt ex-
tending from the equatorial central Pacific toSouth Asia, and by westerly over South China,and subtropical WNP (Fig. 3a). Its major sig-nals appear over the tropics and subtropics.The present result of EOF-1 is consistent withthe leading EOF mode from the multivariateEOF analysis of 850 hPa wind vectors byWang et al. (2001). Wang et al. (2001) defineda dynamic summer monsoon index to measurethe interannual variability of the WNP mon-soon as the difference of 850-hPa westerlies, be-tween the two regions (100–130�E, 5–15�N)
Fig. 2. Variances of JJA-mean precipitation (left panels) and 850-hPa zonal winds (right panels) forobservations, external and internal variabilities (three panels from the top, respectively). The con-tour lines are plotted at 1, 2, 4, 8, and 16. Unit is mm2 d�2 for precipitation variance and m2 s�2 forwind variance. The lowest panels present the ratios of external variance to internal variance.
June 2006 R. LU et al. 451
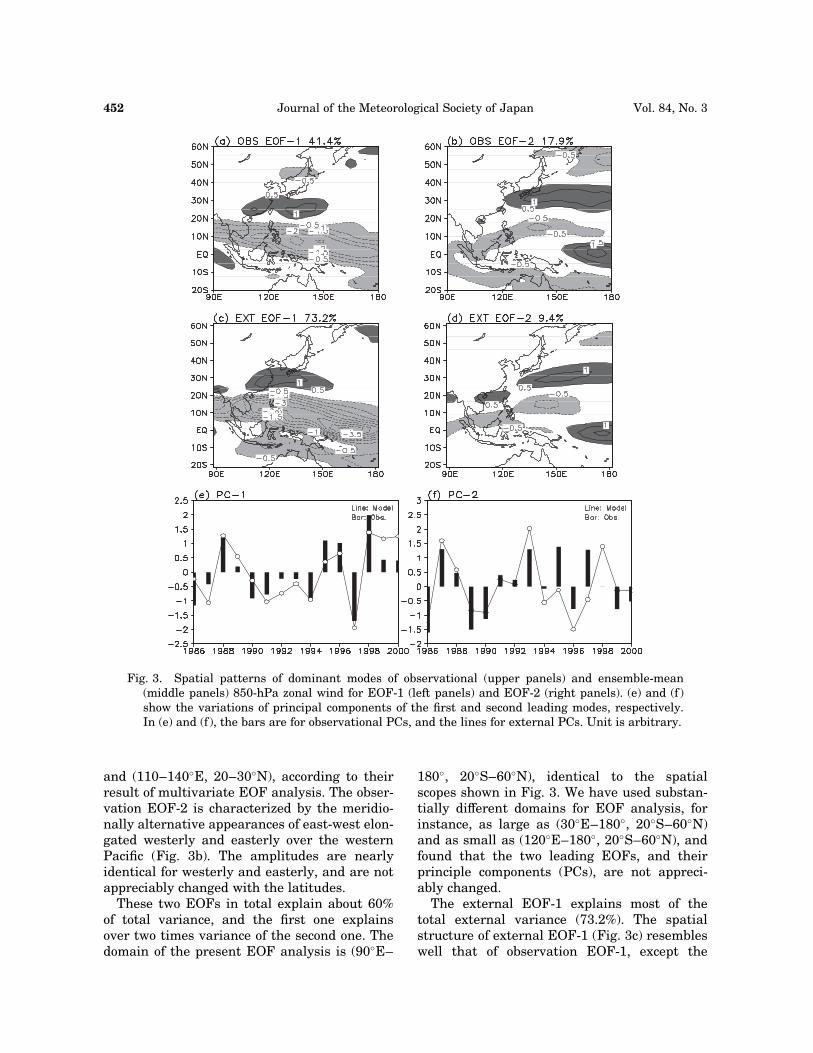
and (110–140�E, 20–30�N), according to theirresult of multivariate EOF analysis. The obser-vation EOF-2 is characterized by the meridio-nally alternative appearances of east-west elon-gated westerly and easterly over the westernPacific (Fig. 3b). The amplitudes are nearlyidentical for westerly and easterly, and are notappreciably changed with the latitudes.
These two EOFs in total explain about 60%of total variance, and the first one explainsover two times variance of the second one. Thedomain of the present EOF analysis is (90�E–
180�, 20�S–60�N), identical to the spatialscopes shown in Fig. 3. We have used substan-tially different domains for EOF analysis, forinstance, as large as (30�E–180�, 20�S–60�N)and as small as (120�E–180�, 20�S–60�N), andfound that the two leading EOFs, and theirprinciple components (PCs), are not appreci-ably changed.
The external EOF-1 explains most of thetotal external variance (73.2%). The spatialstructure of external EOF-1 (Fig. 3c) resembleswell that of observation EOF-1, except the
Fig. 3. Spatial patterns of dominant modes of observational (upper panels) and ensemble-mean(middle panels) 850-hPa zonal wind for EOF-1 (left panels) and EOF-2 (right panels). (e) and (f )show the variations of principal components of the first and second leading modes, respectively.In (e) and (f ), the bars are for observational PCs, and the lines for external PCs. Unit is arbitrary.
452 Journal of the Meteorological Society of Japan Vol. 84, No. 3
southward extension, and intensification of theeasterly in the tropics. Actually, the externalPC-1 and observation PC-1 are significantlycorrelated (also see Fig. 3e), with the correla-tion coefficient of 0.853 (significant at 99.9%level). On the other hand, the external EOF-2explains only 9.4% of variance. Its spatialstructure (Fig. 3d) resembles somewhat thespatial structure of observation EOF-2, andthe correlation coefficient between the externalPC-2 and observation PC-2 is 0.675 (significantat 95% level, also see Fig. 3f ).
We performed composite analyses based onthe principal components of the first two lead-ing modes, in order to illustrate the anomaliesof precipitation and SST associated with thesedominant circulation modes. By choosing fourcases with the highest values, and four caseswith the lowest values of each time series ofthe principal component (Table 1), we showedthe composite differences.
Corresponding to the observation PC-1, thereare negative precipitation anomalies in thePhilippine Sea, and weak positive anomaliesin East Asia (Fig. 4a). The negative precipita-tion anomalies in the Philippine Sea are associ-ated with anticyclonic circulation anomalies inlower troposphere over the WNP, with tropicaleasterly anomalies and subtropical westerlyanomalies shown in Fig. 3a. In addition, signif-icant positive precipitation anomalies appearin the maritime continent, and negative anoma-
lies appear in the equatorial western Pacific.A positive PC-1 corresponds to positive SSTanomalies in the western Pacific and easternIndian Ocean, and negative SST anomalies inthe equatorial eastern Pacific (Fig. 4c).
The observation EOF-2 corresponds to signif-icantly less precipitation in the northeast ex-tent of the Philippine Sea, and more precipita-tion in East Asia (Fig. 4b). In addition, thereare positive anomalies in the equatorial west-ern and central Pacific. This pattern of pre-cipitation anomalies is associated with positiveSST anomalies in the equatorial eastern Pacific(Fig. 4d), but the composite result based on theextended period (1958–2003) of observationaldata, shows very weak SST anomalies (notshown).
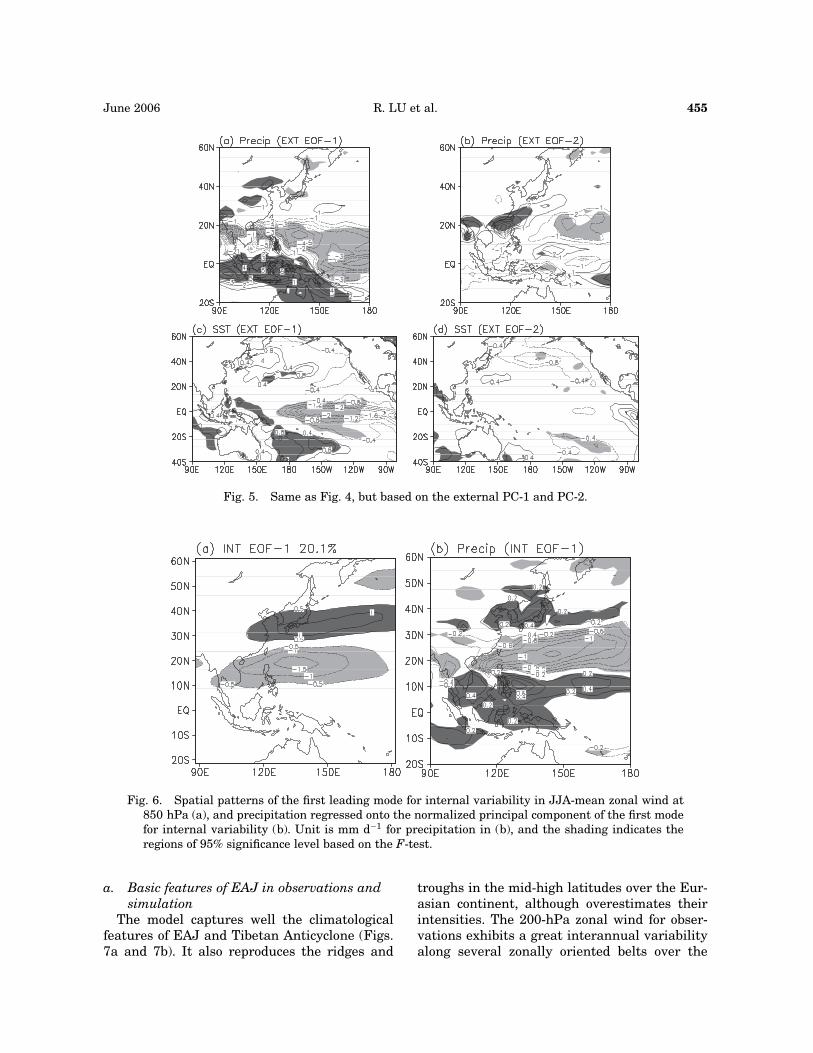
Similarly, we performed composite analysesbased on the principal components of the firsttwo leading external modes for the model simu-lation. The chosen cases bear a resemblance tothose based on observations, but with an appre-ciable distinction (Table 1). Such a resemblanceis expectable, because of the high correlationbetween the model external, and observationmodes. The precipitation and SST anomaliescorresponded to the external PC-1 (Figs. 5aand 5c) are stronger and more significant thanthose corresponded to the observation PC-1(Figs. 4a and 4c), and their spatial distributionsare in good agreement. Both for observationsand for external variability, the SST anomaliesexhibit a seesaw pattern, between the equato-rial eastern Pacific and the equatorial westernPacific/eastern Indian Ocean, and may inducepositive precipitation anomalies in the mari-time continent, and negative precipitationanomalies in the equatorial western and cen-tral Pacific. The positive precipitation anoma-lies in the maritime continent, in turn, mayresult in less rainfall in the Philippine Seaand South Asia through a local Hadley circula-tion anomaly, which is suggested by anomalous200-hPa southerly and 850-hPa northerly (notshown).
However, the precipitation and SST anoma-lies associated with the external EOF-2 (Figs.5b and 5d) are relatively different from thoseassociated with the observation EOF-2, de-spite some resemblances in distribution. For in-stance, the observation EOF-2 corresponds tothe well-organized precipitation anomalies in
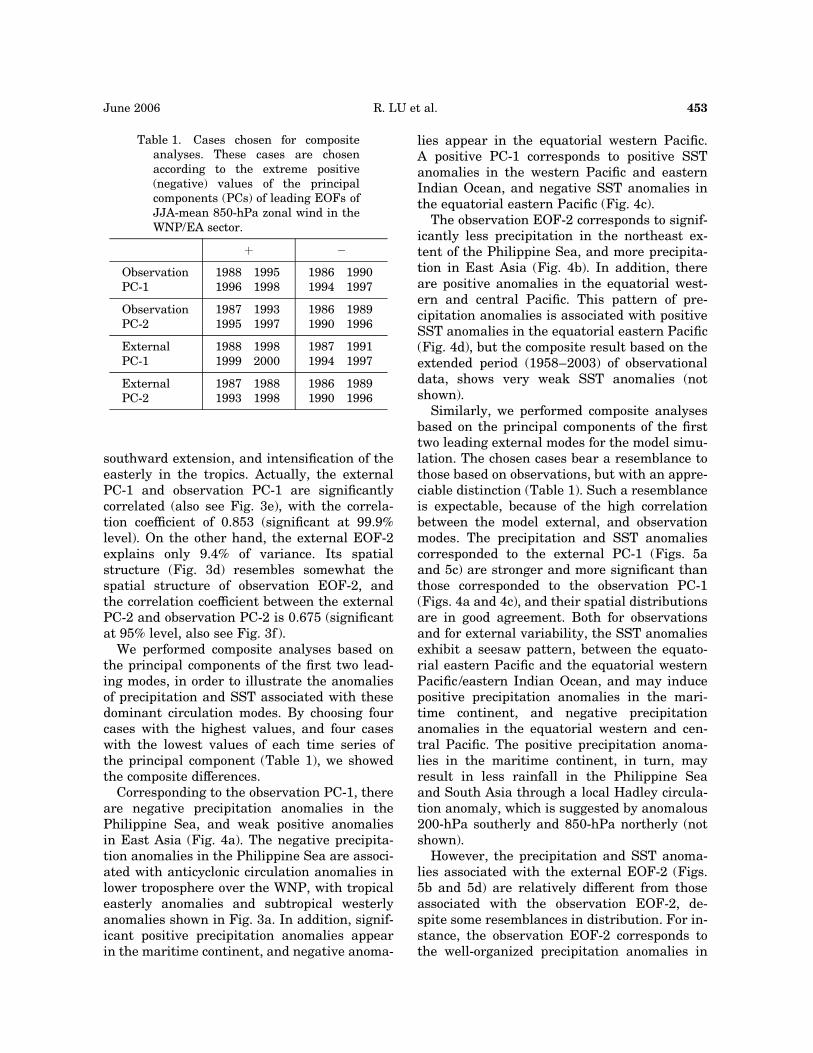
Table 1. Cases chosen for compositeanalyses. These cases are chosenaccording to the extreme positive(negative) values of the principalcomponents (PCs) of leading EOFs ofJJA-mean 850-hPa zonal wind in theWNP/EA sector.
þ �
ObservationPC-1
1988 19951996 1998
1986 19901994 1997
ObservationPC-2
1987 19931995 1997
1986 19891990 1996
ExternalPC-1
1988 19981999 2000
1987 19911994 1997
ExternalPC-2
1987 19881993 1998
1986 19891990 1996
June 2006 R. LU et al. 453

the western Pacific, and SST anomalies in theequatorial eastern Pacific, but these anomaliesare much weakened or disappear in the exter-nal EOF-2.
c. Internal variabilityAn EOF method is also applied to illustrate
dominant modes of internal variability in the850-hPa zonal wind in the model simulation.150 samples of internal variability are used toperform the EOF analysis. The spatial distribu-tion of the first leading internal mode (Fig. 6a),is similar to that of the observation EOF-2 inthe WNP/EA (Fig. 3b). The only difference be-tween them is the disappearance of the positivevalues in and south to the equator, for the in-ternal mode. The similarity suggests that theobservation EOF-2 would be closely related tothe internal mode. The difference, on the otherhand, indicates that the observation EOF-2also partially results from the external forcing,which generally plays the most dominant rolein the tropics.
A linear regression is performed, based on
the normalized principal component of the firstleading internal mode, and the regressed pre-cipitation is presented in Fig. 6b. The internalleading mode corresponds to significantly lessprecipitation in the subtropical WNP and moreprecipitation in East Asia, around 10�N. Theregressed precipitation is similar to that corre-sponded to the observation EOF-2 (Fig. 4b) inthe WNP/EA. Thus, the leading mode of notonly external variability, but also internal vari-ability over the WNP and EA is associated withprecipitation anomalies in the tropics.
4. East Asian Upper-tropospheric jetstream
The EAJ is located in the middle latitudes,with its axis approximately at 40�–45�N insummer. Its higher latitudes imply a largercontribution of the internal atmospheric vari-ability to its seasonal mean anomalies. Byusing an approach similar to the preceding sec-tion, the external and internal leading modesrelated to the EAJ are examined and comparedwith observations in this section.
Fig. 4. Composite differences in precipitation (upper panels) and in SSTs (lower panels) based on theobservational PC-1 (left panels) and PC-2 (right panels). Composite cases are shown in Table 1.Zero contours are not shown, and the unit is mm d�1 for precipitation and �C for SST. The shadingindicates the regions of 95% significance level by using a two-tailed Student’s t-test.
454 Journal of the Meteorological Society of Japan Vol. 84, No. 3
a. Basic features of EAJ in observations andsimulation
The model captures well the climatologicalfeatures of EAJ and Tibetan Anticyclone (Figs.7a and 7b). It also reproduces the ridges and
troughs in the mid-high latitudes over the Eur-asian continent, although overestimates theirintensities. The 200-hPa zonal wind for obser-vations exhibits a great interannual variabilityalong several zonally oriented belts over the
Fig. 5. Same as Fig. 4, but based on the external PC-1 and PC-2.
Fig. 6. Spatial patterns of the first leading mode for internal variability in JJA-mean zonal wind at850 hPa (a), and precipitation regressed onto the normalized principal component of the first modefor internal variability (b). Unit is mm d�1 for precipitation in (b), and the shading indicates theregions of 95% significance level based on the F-test.
June 2006 R. LU et al. 455

Pacific, concurred roughly with either strongwesterlies or the tropical central and easternPacific where action centers of ENSO locate(Fig. 7c). In comparison with observations, themodel simulates stronger interannual variabil-ity in the equatorial western and central Pacificas external variability. The variances of 200-hPa zonal wind show a great difference in theNorthern Hemisphere mid-latitudes, betweenthe external variability and observations. Par-ticularly, the observed 200-hPa zonal windshows a great interannual variability aroundthe EAJ, while the simulated ensemble meansshow a much weakened variability. This differ-ence in the variances results from the fact thatthe internal variability is generally strongerin the extratropics, as shown in Fig. 7e. Actu-ally, the internal variability is relatively greateraround the Caspian Sea, and over a large re-gion extending from East Asia eastward to theNorth Pacific. Over East Asia, the internalvariability is much stronger than the external
variability (Fig. 7f ), and comparable to the vari-ability in observations, suggesting that the in-ternal atmospheric processes would play a cru-cial role in the variations of the EAJ.
b. Interannual variability of EAJ inobservations and simulation
The interannual variations of the EAJ havetwo most dominant modes: the meridional dis-placement and variation in intensity (Lin andLu 2005). These two dominant modes are re-lated to the significant precipitation anomaliesin the WNP/EA region (Lu 2004). In this sec-tion, an EOF analysis is performed by usingthe averaged 200-hPa zonal winds over 120–150�E, since these averaged winds can wellillustrate both the meridional displacement,and variation in the intensity of the EAJ. Themeridional domain of EOF analysis is 0–90�N.
Figure 8 shows the spatial structures of thefirst two leading EOFs of JJA-mean 200-hPazonal wind averaged over 120–150�E, for obser-
Fig. 7. Observed (a) and ensemble-mean (b) JJA-mean 200-hPa horizontal winds, averaged over 15years (1986–2000), and year-to-year variances of 200-hPa zonal wind for observations (c), external(d) and internal variability (e). Unit is m s�1 in (a) and (b), and m2 s�2 in (c–e). The contour linesare plotted at 4, 8, 12, and 16.
456 Journal of the Meteorological Society of Japan Vol. 84, No. 3
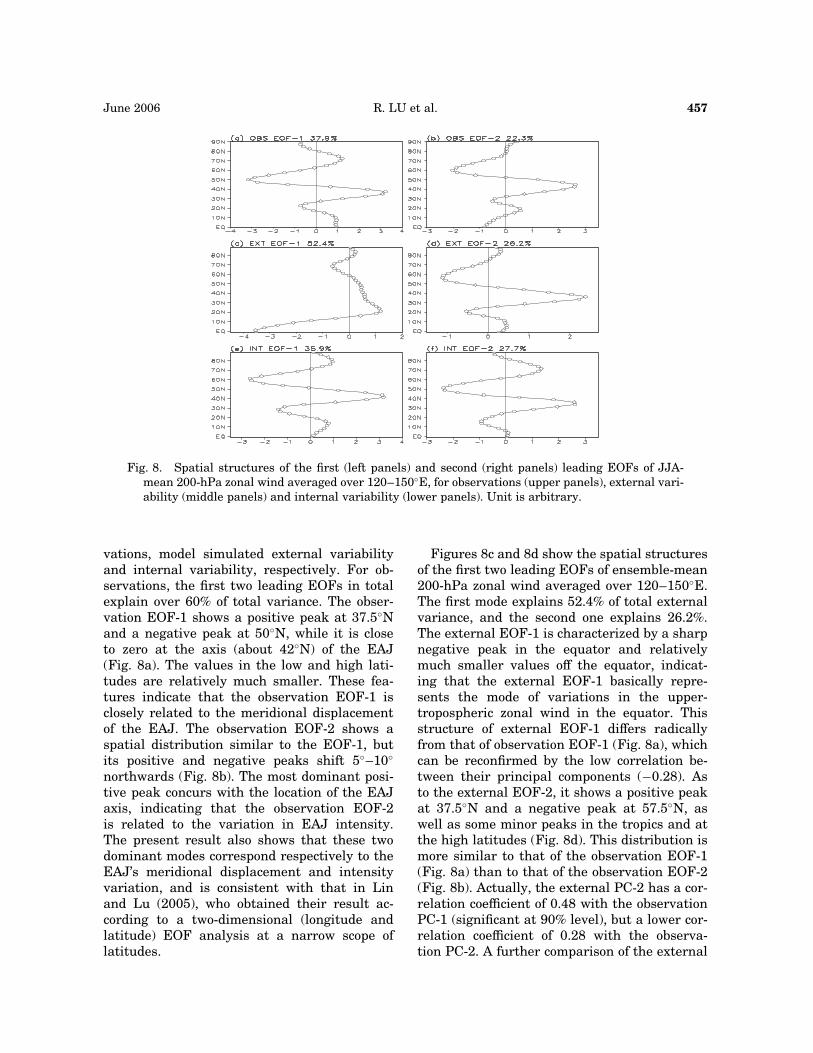
vations, model simulated external variabilityand internal variability, respectively. For ob-servations, the first two leading EOFs in totalexplain over 60% of total variance. The obser-vation EOF-1 shows a positive peak at 37.5�Nand a negative peak at 50�N, while it is closeto zero at the axis (about 42�N) of the EAJ(Fig. 8a). The values in the low and high lati-tudes are relatively much smaller. These fea-tures indicate that the observation EOF-1 isclosely related to the meridional displacementof the EAJ. The observation EOF-2 shows aspatial distribution similar to the EOF-1, butits positive and negative peaks shift 5�–10�
northwards (Fig. 8b). The most dominant posi-tive peak concurs with the location of the EAJaxis, indicating that the observation EOF-2is related to the variation in EAJ intensity.The present result also shows that these twodominant modes correspond respectively to theEAJ’s meridional displacement and intensityvariation, and is consistent with that in Linand Lu (2005), who obtained their result ac-cording to a two-dimensional (longitude andlatitude) EOF analysis at a narrow scope oflatitudes.
Figures 8c and 8d show the spatial structuresof the first two leading EOFs of ensemble-mean200-hPa zonal wind averaged over 120–150�E.The first mode explains 52.4% of total externalvariance, and the second one explains 26.2%.The external EOF-1 is characterized by a sharpnegative peak in the equator and relativelymuch smaller values off the equator, indicat-ing that the external EOF-1 basically repre-sents the mode of variations in the upper-tropospheric zonal wind in the equator. Thisstructure of external EOF-1 differs radicallyfrom that of observation EOF-1 (Fig. 8a), whichcan be reconfirmed by the low correlation be-tween their principal components (�0.28). Asto the external EOF-2, it shows a positive peakat 37.5�N and a negative peak at 57.5�N, aswell as some minor peaks in the tropics and atthe high latitudes (Fig. 8d). This distribution ismore similar to that of the observation EOF-1(Fig. 8a) than to that of the observation EOF-2(Fig. 8b). Actually, the external PC-2 has a cor-relation coefficient of 0.48 with the observationPC-1 (significant at 90% level), but a lower cor-relation coefficient of 0.28 with the observa-tion PC-2. A further comparison of the external
Fig. 8. Spatial structures of the first (left panels) and second (right panels) leading EOFs of JJA-mean 200-hPa zonal wind averaged over 120–150�E, for observations (upper panels), external vari-ability (middle panels) and internal variability (lower panels). Unit is arbitrary.
June 2006 R. LU et al. 457
EOF-2 to the observation EOF-1 shows that forthe former, the positive peak south to the EAJaxis is higher than the negative peak north tothe EAJ axis, while for the latter, the two peakshave equivalent heights. This suggests that theexternal EOF-2 has a more weight in the rela-tively lower latitudes, which is consistent withthe fact that the external mode has a tendencyshowing more signals in the low latitudes.
Similarly, an EOF analysis is performed byusing 150 samples of the internal variabilityto illustrate the most dominant modes of inter-nal variability in the upper-tropospheric zonalwind. The spatial structures of the first twoleading modes of internal variability (Figs. 8eand 8f ) are similar to those of the observationEOF-2 and observation EOF-1, respectively,particularly around the EAJ axis. Thus, the in-ternal EOF-1 is related to the variations in EAJintensity, and the internal EOF-2 is related tothe meridional displacement of EAJ. In the in-ternal variability estimated by the model, theintensity variation of the EAJ exhibits a moredominant feature than the meridional displace-ment of the EAJ, while in observations themeridional displacement of the EAJ is moredominant. This difference between the internalvariability and observations most likely resultsfrom the deficiency of the model in reproducingexactly the internal variability. It may alsoresult from the contribution of the externalvariability, although the external variability isweaker than the internal variability over EastAsia. We have examined the possibility of thesampling errors in the EOF estimation (Northet al. 1982), and had a negative answer. Wehave analyzed the internal variability by usingobservational data through an approach asin Branstator (2002), and also analyzed theextended observational data during 46 years(1958–2003), and obtained very similar results.
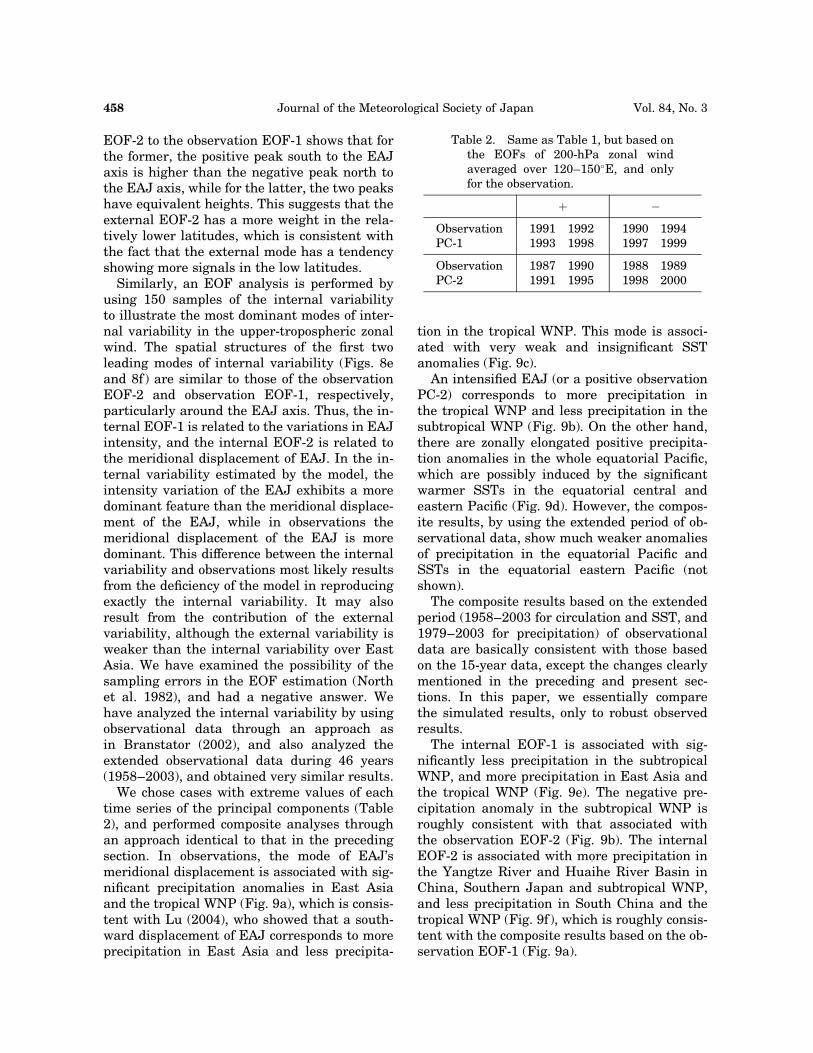
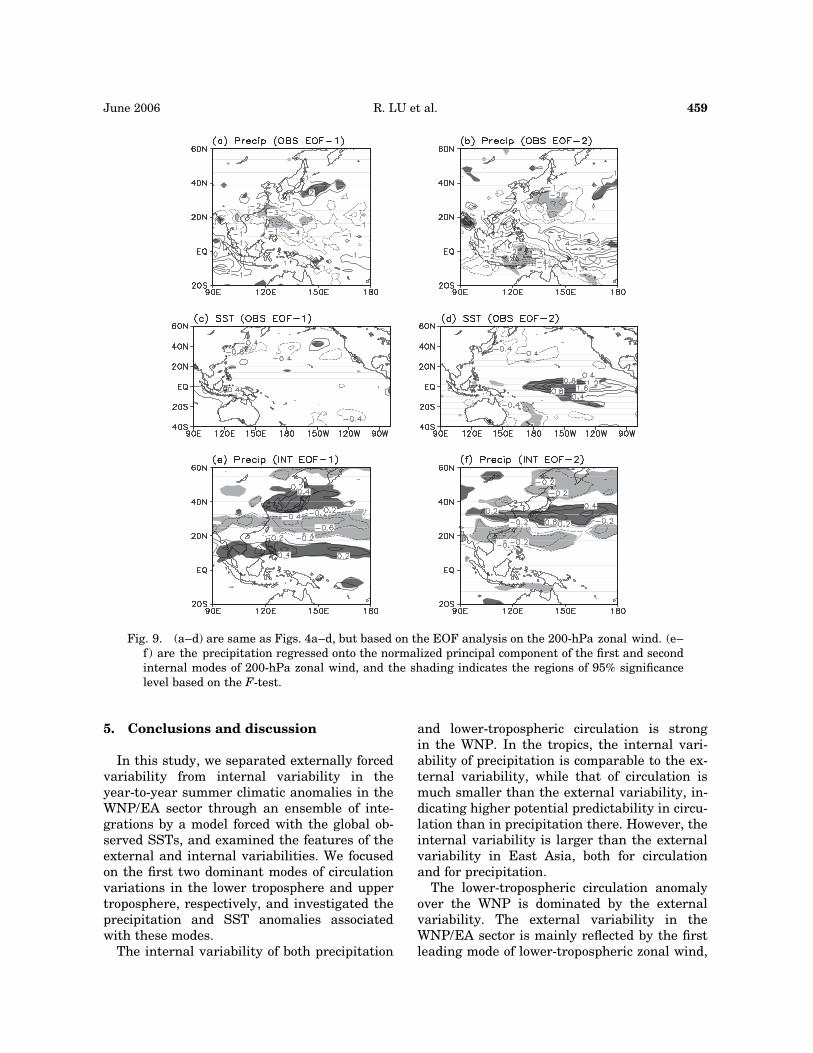
We chose cases with extreme values of eachtime series of the principal components (Table2), and performed composite analyses throughan approach identical to that in the precedingsection. In observations, the mode of EAJ’smeridional displacement is associated with sig-nificant precipitation anomalies in East Asiaand the tropical WNP (Fig. 9a), which is consis-tent with Lu (2004), who showed that a south-ward displacement of EAJ corresponds to moreprecipitation in East Asia and less precipita-
tion in the tropical WNP. This mode is associ-ated with very weak and insignificant SSTanomalies (Fig. 9c).
An intensified EAJ (or a positive observationPC-2) corresponds to more precipitation inthe tropical WNP and less precipitation in thesubtropical WNP (Fig. 9b). On the other hand,there are zonally elongated positive precipita-tion anomalies in the whole equatorial Pacific,which are possibly induced by the significantwarmer SSTs in the equatorial central andeastern Pacific (Fig. 9d). However, the compos-ite results, by using the extended period of ob-servational data, show much weaker anomaliesof precipitation in the equatorial Pacific andSSTs in the equatorial eastern Pacific (notshown).
The composite results based on the extendedperiod (1958–2003 for circulation and SST, and1979–2003 for precipitation) of observationaldata are basically consistent with those basedon the 15-year data, except the changes clearlymentioned in the preceding and present sec-tions. In this paper, we essentially comparethe simulated results, only to robust observedresults.
The internal EOF-1 is associated with sig-nificantly less precipitation in the subtropicalWNP, and more precipitation in East Asia andthe tropical WNP (Fig. 9e). The negative pre-cipitation anomaly in the subtropical WNP isroughly consistent with that associated withthe observation EOF-2 (Fig. 9b). The internalEOF-2 is associated with more precipitation inthe Yangtze River and Huaihe River Basin inChina, Southern Japan and subtropical WNP,and less precipitation in South China and thetropical WNP (Fig. 9f ), which is roughly consis-tent with the composite results based on the ob-servation EOF-1 (Fig. 9a).
Table 2. Same as Table 1, but based onthe EOFs of 200-hPa zonal windaveraged over 120–150�E, and onlyfor the observation.
þ �
ObservationPC-1
1991 19921993 1998
1990 19941997 1999
ObservationPC-2
1987 19901991 1995
1988 19891998 2000
458 Journal of the Meteorological Society of Japan Vol. 84, No. 3
5. Conclusions and discussion
In this study, we separated externally forcedvariability from internal variability in theyear-to-year summer climatic anomalies in theWNP/EA sector through an ensemble of inte-grations by a model forced with the global ob-served SSTs, and examined the features of theexternal and internal variabilities. We focusedon the first two dominant modes of circulationvariations in the lower troposphere and uppertroposphere, respectively, and investigated theprecipitation and SST anomalies associatedwith these modes.
The internal variability of both precipitation
and lower-tropospheric circulation is strongin the WNP. In the tropics, the internal vari-ability of precipitation is comparable to the ex-ternal variability, while that of circulation ismuch smaller than the external variability, in-dicating higher potential predictability in circu-lation than in precipitation there. However, theinternal variability is larger than the externalvariability in East Asia, both for circulationand for precipitation.
The lower-tropospheric circulation anomalyover the WNP is dominated by the externalvariability. The external variability in theWNP/EA sector is mainly reflected by the firstleading mode of lower-tropospheric zonal wind,
Fig. 9. (a–d) are same as Figs. 4a–d, but based on the EOF analysis on the 200-hPa zonal wind. (e–f ) are the precipitation regressed onto the normalized principal component of the first and secondinternal modes of 200-hPa zonal wind, and the shading indicates the regions of 95% significancelevel based on the F-test.
June 2006 R. LU et al. 459
and partially by the second mode. The firstmode is characterized by a tropical teleconnec-tion pattern. It is associated with an 850-hPaanticyclonic (cyclonic) anomaly over the WNP,a seesaw pattern of precipitation between thewestern Pacific and maritime continent, and anegative (positive) SST anomaly in the equato-rial eastern Pacific and a positive (negative)SST anomaly around the maritime continent.The second mode is characterized by a tele-connection of 850-hPa zonal wind in the meri-dional direction, with zonally-oriented cellsover the western Pacific, and associated withvery weak SST anomalies. This second mode ismore like a mode of the internal variability.
The variations of EAJ are dominated by theinternal variability. Over East Asia, the inter-nal variability is much stronger than theexternal variability, and comparable to thevariability in observations. The first two lead-ing internal modes of 200-hPa zonal wind inthe WNP/EA sector reflect the two dominantfeatures of the variations of EAJ, i.e., intensityvariation and meridional displacement, respec-tively. This is in consistent with the situationin observations, but in a reverse order. Thefirst and second leading internal modes areassociated with highly significant precipitationanomalies in the WNP/EA sector.
The strong internal variability leads to lowpredictability in the WNP/EA sector, and maybe a crucial mechanism responsible for the cur-rent AGCMs have great difficulty to correctlysimulate the interannual variation of summerrainfall in this region, particularly in EastAsia, where the internal variability is moresignificant. The features of the internal vari-ability in the WNP/EA sector should be furtherstudied. Such studies would be helpful for thebetter understanding of the climatic variationand ocean-atmosphere coupling in this sector.Wang et al. (2004) suggested that ocean-atmosphere coupling may play a crucial rolein determining the climatic anomalies in theWNP. On the other hand, the intraseasonalvariability (ISV) is also one of the dominantmodes of the tropical WNP monsoon variabilityon a subseasonal time scale. Modelling studiesof boreal summer ISV have been very limited,partly due to the difficulties in simulating boththe mean monsoon and its variability (Sperberet al. 2000). The ability of atmospheric models
to simulate the intraseasonal rainfall patternhas remained problematic. The results froma comparison study by Waliser et al. (2003)showed that models have difficulty in repre-senting the tilted rain band and its propagationcharacteristics. It appears that air-sea interac-tion plays an important role in the simulationof summer ISV (e.g., Kemball-Cook and Wang2001; Kemball-Cook et al. 2002; Rajendran etal. 2004; Fu and Wang 2004). Fu and Wang(2004) presented evidence that air-sea interac-tion results in more realistic boreal summerISV. Compared to uncoupled simulation, thecoupled model had 50% more northward propo-gating events, and exhibits surface flux, convec-tion, and SST feedbacks that resulted in a morerealistic life cycle of the summer ISV. What isthe relationship between ISV and interannualmonsoon variability in summer? Is the realisticsimulation of summer ISV a prerequisite forbetter mean monsoon climate and its interan-nual variability? These questions are requiredto be answered in the future.
The present results show that both externalvariability, and internal variability over EastAsia are associated with precipitation anoma-lies in the tropics. Thus, the relation betweenthe atmospheric convection over the tropicalwestern North Pacific and climate anomaliesin East Asia, which has been documented byprevious observational studies (e.g., Nitta1987; Tsuyuki and Kurihara 1989; Lu 2004;Wakabayashi and Kawamura 2004), can be es-tablished externally or internally. Separatingexternally forced variability and internal vari-ability, may be helpful for a better understand-ing of the WNP convection-East Asian climaterelationship.
The present study is mainly based on 15-yearensemble simulations and observational data.15 years of data might not be adequately longfor investigating the interannual variability,and thus a longer period of ensemble simula-tions is required to confirm the present results.However, the present results based on a longerperiod (1958–2003) of observational data arebasically consistent with those based on the15-year data, and we drew the present conclu-sions essentially based on the comparison be-tween the robust observed results and simu-lated results.
In this study, we examined the outputs of
460 Journal of the Meteorological Society of Japan Vol. 84, No. 3
only one model. Research by using other mod-els is required to investigate whether the fea-tures of external and internal variability shownin this study are model dependent.
Acknowledgments
This study was supported by the ChineseAcademy of Sciences (Grant No. KZCX3-SW-221). The simulations were performed at theNCAS Centre for Global Atmospheric Model-ling (CGAM), which is funded by the UK Natu-ral Environment Research Council. We thankDr. Masahiro Hosaka and two anonymous re-viewers for their comments, which led to greatimprovement of our presentation.
References
Ailikun, B. and T. Yasunari, 2001: ENSO and Asiansummer monsoon: Persistence and transitivityin the seasonal march. J. Meteor. Soc. Japan,79, 145–159.
Branstator, G., 2002: Circumglobal teleconnections,the jet stream waveguide, and the North At-lantic oscillation. J. Climate, 15, 1893–1910.
Chou, C., J. Tu, and J. Yu, 2003: Interannual vari-ability of the western North Pacific summermonsoon: Differences between ENSO and non-ENSO years. J. Climate, 16, 2275–2287.
Cox, P.M., R.A. Betts, C.B. Bunton, R.L.H. Essery,P.R. Rowntree, and J. Smith, 1999: The impactof new land surface physics on the GCM simu-lation of climate and climate sensitivity. Cli-mate Dyn., 15, 183–203.
Enomoto, T., 2004: Interannual variability of theBonin high associated with the propagation ofRossby waves along the Asian Jet. J. Meteor.Soc. Japan, 82, 1019–1034.
Fu, X. and B. Wang, 2004: Differences of boreal sum-mer intraseasonal oscillations simulated inan atmosphere-ocean coupled model and anatmosphere-only model. J. Climate, 17, 1263–1271.
Goswami, B.N., 1998: Interannual variations of In-dian summer monsoon in a GCM: Externalconditions versus internal feedbacks. J. Cli-mate, 11, 501–522.
Harzallah, A. and R. Sadourny, 1995: Internal ver-sus SST-forced atmospheric variability as si-mulated by an atmospheric general circulationmodel. J. Climate, 8, 474–495.
Huang, R. and Y. Wu, 1989: The influence of ENSOon the summer climate change in China andits mechanism. Adv. Atmos. Sci., 6, 21–32.
Kalnay, E. and Coauthors, 1996: The NCEP-NCAR40-year reanalysis project. Bull. Amer. Meteor.Soc., 77, 437–471.
Kang, I.-S., J.-Y. Lee, and C.-K. Park, 2004: Potentialpredictability of summer mean precipitationin a dynamical seasonal prediction systemwith systematic error correction. J. Climate,17, 834–844.
Kemball-Cook, S. and B. Wang, 2001: Equatorialwaves and air-sea interaction in the borealsummer intraseasonal oscillation. J. Climate,14, 2923–2942.
Kemball-Cook, S., B. Wang, and X. Fu, 2002: Simula-tion of the intraseasonal oscillation in theECHAM4 model: The impact of coupling withan ocean model. J. Atmos. Sci., 59, 1433–1453.
Krishnan, R. and M. Sugi, 2001: Baiu rainfall vari-ability and associated monsoon teleconnec-tions. J. Meteor. Soc. Japan, 79, 851–860.
Lau, K.-M., K.-M. Kim, and S. Yang, 2000: Dynami-cal and boundary forcing characteristics of re-gional components of the Asian summer mon-soon. J. Climate, 13, 2461–2482.
Lin, Z. and R. Lu, 2005: Interannual meridional dis-placement of the East Asian up-troposphericjet stream in summer. Adv. Atmos. Sci., 22,199–211.
Liang, X.-Z. and W.-C. Wang, 1998: Associations be-tween China monsoon rainfall and tropo-spheric jets. Quart. J. Roy. Meteor. Soc., 124,2597–2623.
Lu, R., 2001: Interannual variability of the summer-time North Pacific subtropical high and itsrelation to atmospheric convection over thewarm pool. J. Meteor. Soc. Japan, 79, 771–783.
——— and B. Dong, 2001: Westward extension ofNorth Pacific subtropical high in summer. J.Meteor. Soc. Japan, 79, 1229–1241.
———, 2002: Precursory SST anomalies associatedwith the convection over the western Pacificwarm pool. Chinese Science Bulletin, 47, 696–699.
———, J.-H. Oh, and B.-J. Kim, 2002: A teleconnec-tion pattern in upper-level meridional windover the North African and Eurasian continentin summer. Tellus, 54A, 44–55.
———, 2004: Associations among the components ofthe East Asian summer monsoon system in themeridional direction. J. Meteor. Soc. Japan, 82,155–165.
Nitta, T., 1987: Convective activities in the tropicalwestern Pacific and their impacts on the north-ern hemisphere summer circulation. J. Meteor.Soc. Japan, 65, 373–390.
North, G.R., T.L. Bell, R.F. Cahalan, and F.J. Moeng,1982: Sampling errors in the estimation of em-pirical orthogonal functions. Mon. Wea. Rev.,110, 699–706.
Pope, V.D., M.L. Gallani, P.R. Rowntree, and R.A.Stratton, 2000: The impact of new physical pa-
June 2006 R. LU et al. 461
rameterizations in the Hadley Centre climatemodel—HadAM3. Climate Dyn., 16, 123–146.
Rajendran, K., A. Kitoh, and S. Yukimoto, 2004:South and East Asian summer monsoon cli-mate and variation in the MRI coupled model(MRI-CGCM2). J. Climate, 17, 763–782.
Reynolds, R.W., N. Rayner, T. Smith, D. Stokes, andW. Wang, 2002: An improved in situ and satel-lite SST analysis for climate. J. Climate, 15,1609–1625.
Rowell, D.P., C.K. Folland, K. Maskell, and M.N.Ward, 1995: Variability of summer rainfallover tropical north Africa (1906–92): Observa-tions and modeling. Quart. J. Roy. Meteor.Soc., 121, 669–704.
Sato, N. and M. Takahashi, 2003: Formation mecha-nism of vorticity anomalies on the subtropicaljet in the midsummer Northern Hemisphere.Theoretical and Applied Mechanics Japan, 52,109–115.
Smith, T.M. and R.W. Reynolds, 2004: Improved Ex-tended Reconstruction of SST (1854–1997). J.Climate, 17, 2466–2477.
Sperber, K.R., J.M. Slingo, and H. Annamalai, 2000:Predictability and the relationship betweensubseasonal and interannual variability duringthe Asian summer monsoon. Quart. J. Roy. Me-teor. Soc., 126, 2547–2574.
Tanaka, M., 1997: Interannual and interdecadalvariations of the western North Pacific mon-soon and Baiu rainfall and their relationshipto the ENSO cycles. J. Meteor. Soc. Japan, 75,1109–1123.
Tsuyuki, T. and K. Kurihara, 1989: Impact of convec-tive activity in the western tropical Pacific onthe East Asian summer circulation. J. Meteor.Soc. Japan, 67, 231–247.
Waliser, D.E. and coauthors, 2003: AGCM simula-tions of intraseasonal variability associatedwith the Asian summer monsoon. ClimateDyn., 21, 423–446.
Wakabayashi, S. and R. Kawamura, 2004: Extrac-
tion of major teleconnection patterns possiblyassociated with the anomalous summer cli-mate in Japan. J. Meteor. Soc. Japan, 82,1577–1588.
Wang, B., R. Wu, and X. Fu, 2000: Pacific-East Asianteleconnection: How does ENSO affect EastAsian climate? J. Climate, 13, 1517–1536.
———, ———, and K.-M. Lau, 2001: Interannualvariability of the Asian summer monsoon: Con-trasts between the Indian and the westernNorth Pacific-East Asian monsoons. J. Climate,14, 4073–4090.
——— and Q. Zhang, 2002: Pacific-East Asian tele-connection. Part II: How the Philippine Seaanticyclone established during development ofEl Nino. J. Climate, 15, 3252–3265.
———, I.-S. Kang, and J.-Y. Lee, 2004: Ensemblesimulations of Asian-Australian monsoon vari-ability by 11 AGCMs. J. Climate, 17, 803–818.
Wang, H., F. Xue, and X. Bi, 1997: The interannualvariability and predictability of a global cli-mate model. Adv. Atmos. Sci., 14, 554–562.
Wu, R. and B. Wang, 2002: A contrast of the EastAsian summer monsoon-ENSO relationshipbetween 1962–77 and 1978–93. J. Climate,15, 3266–3279.
——— and ———, 2000: Interannual variability ofsummer monsoon onset over the westernNorth Pacific and the underlying processes. J.Climate, 13, 2483–2501.
Xie, P. and P.A. Arkin, 1997: Global precipitation: A17-year monthly analysis based on gauge ob-servations, satellite estimates, and numericaloutputs. Bull. Amer. Meteor. Soc., 78, 2539–2558.
Zhang, R., A. Sumi, and M. Kimoto, 1996: Impact ofEl Nino on the East Asian monsoon: A diagno-sis study of the ’86/87 and ’91/92 events. J.Meteor. Soc. Japan, 74, 49–62.
———, ———, and ———, 1999: A diagnosis studyof the impact of El Nino on the precipitation inChina. Adv. Atmos. Sci., 16, 229–241.
462 Journal of the Meteorological Society of Japan Vol. 84, No. 3