extended report: hydrology analysis sungai lereh, malacca
TRANSCRIPT

AQSP/R.No:10072/Final/August 2016
Page | 1

Extended Report: Hydrology Analysis Sungai Lereh, Malacca
AQSP/R.No:10103/Extended Report/March 2018
PAGE INTENTIONALLY LEFT BLANK

Extended Report: Hydrology Analysis Sungai Lereh, Malacca
AQSP/R.No:10103/Extended Report/March 2018
Extended Report: Hydrology Analysis Sungai Lereh,
Malacca
COASTAL HYDRAULIC STUDY FOR “THE PROJEK
PENAMBAKAN LAUT SELUAS 120 EKAR DI MUKIM
KLEBANG BESAR”, CENTRAL DISTRICT OF MALACCA,
MALACCA

Extended Report: Hydrology Analysis Sungai Lereh, Malacca
AQSP/R.No:10103/Extended Report/March 2018
Document Information
Project Title
Coastal Hydraulic Study for “The Projek Penambakan Laut
Seluas 120 Ekar Di Mukim Klebang Besar”, Central District of
Malacca, Malacca (Extended Report)
Subject Sungai Lereh,Malacca Hydrology Analysis
Sponsoring/Monitoring
Agency Awan Plasma Sdn Bhd
Performing
Organization Aqvaspace Sdn Bhd
Document No. AQSP/RPT/01-2018/ AWANPLASMA/MDL/10103
Number of Pages
Key Words
Reclamation at Malacca
MIKE 21
Mike 11
Hydrodynamic Model
Hydrology

Extended Report: Hydrology Analysis Sungai Lereh, Malacca
AQSP/R.No:10103/Extended Report/March 2018
DECLARATION FROM HYDRAULIC STUDY TEAM LEADER
TITLE : Extended Hydrology Analysis for Sg. Lereh Malacca
“COASTAL HYDRAULIC STUDY FOR “THE PROJEK PENAMBAKAN LAUT SELUAS
120 EKAR DI MUKIM KLEBANG BESAR”, CENTRAL DISTRICT OF MALACCA, ”
TEAM LEADER : Mr. KARTHIGEYAN VEERASAMY
I declare the following:
i) I have read and checked the content of this Hydraulic Report;
ii) My study team members have conducted the study professionally acceptable
methodologies;
iii) The study findings are correct to the best of my knowledge; and have not been
altered in any manner;
iv) The mitigating measures proposed (whenever relevant) to the best of my
knowledge are reliable, practical and adequate with the relevant legal
requirement; and
v) Myself and my team shall be accountable for any misleading information in any
part of the report.
Signature & Official Stamp :
Name : KARTHIGEYAN A/L VEERASAMY
I/C No. : 791203 –12- 5027
Position : DIRECTOR
Company/Organization : AQVASPACE SDN BHD
Date : MARCH 2018
Extended Report: Hydrology Analysis Sungai Lereh, Malacca
AQSP/R.No:10103/Extended Report/March 2018
TABLE OF CONTENTS
ABBREVIATIONS
LIST OF FIGURES
LIST OF TABLES
1 INTRODUCTION 1
1.1 Background 1
1.2 Project Objectives 2
2 PROJECT OVERVIEW 3
3 STUDY AREA 12
3.1 Site Assessment 12
3.2 Climate 21
3.3 Tourism 21
3.4 Environmentally Sensitive Area 21
3.5 Hydrological Characteristics of Project Area 22
3.6 Meteo-Marine Scenarios 23
3.6.1 Melaka River System 28
3.6.2 Sungai Melaka Basin 28
3.6.3 Hydrological data 31
4 DATA COLLECTION 36
4.1 Coastal Data Measurement 36
4.1.1 Bathymetry 36

Extended Report: Hydrology Analysis Sungai Lereh, Malacca
AQSP/R.No:10103/Extended Report/March 2018
4.1.2 Current Measurement 36
4.1.3 Water Level Measurement 36
4.1.4 Seabed Sediment Sampling 37
4.2 River Hydrology Data Measurement 45
4.2.1 River Hydrology Measurement 45
4.2.2 Current Measurement 47
4.2.3 Water Level Measurement 48
4.2.4 River Cross section 49
4.2.5 River Discharge 49
4.2.6 Rainfall Data 75
5 MODEL DESCRIPTION AND SETUP 76
5.1 Hydrodynamic Model for Coastal Modelling 76
5.1.1 Model Domain 76
5.1.2 Grid Generation and Bathymetry 76
5.1.3 Boundary Conditions 80
5.1.4 Calibration and Verification 80
5.1.4.1 Water Level 83
5.1.4.2 Currents 83
5.2 Hydrological Model 89
5.2.1 Introduction 89
5.2.2 Model Setup 89
5.2.3 Hydrodynamic Model 92
5.2.4 Model Calibration 93

Extended Report: Hydrology Analysis Sungai Lereh, Malacca
AQSP/R.No:10103/Extended Report/March 2018
5.2.5 Calibration Index 94
5.2.6 Calibration Water Level and Current Speed 95
5.2.7 Extreme Value Analysis 97
5.2.7.1 Long-term Simulation of Hydrological 97
Model
5.2.8 Selection of Best Suited Frequency Distribution 99
6 MODEL RESULTS 106
6.1 Coastal Modelling Scenarios 106
6.1.1 Extracted Result from Water Level Impact into 109
aaaaaSg. Lereh and Sg. Udang
6.2 Scenario Simulation 113
7 CONCLUSION 115

Extended Report: Hydrology Analysis Sungai Lereh, Malacca
AQSP/R.No:10103/Extended Report/March 2018
APPENDICES
Appendix A Marine Data Collection Report

Extended Report: Hydrology Analysis Sungai Lereh, Malacca
AQSP/R.No:10103/Extended Report/March 2018
ABBREVIATIONS
ADCP Acoustic Doppler Current Profiler
CD Chart Datum
DHI Danish Hydraulic Institute
DID Department of Irrigation and Drainage
FM Flexible Mesh
HD Hydrodynamic Model
mg/l Milligram per Litre
m/mth Meter per Month
MSL Mean Sea Level
MT Mud Transport Model
NE Northeast
RMSE Root Mean Square Error
SW Southwest
SW Spectral Wave Model

Extended Report: Hydrology Analysis Sungai Lereh, Malacca
AQSP/R.No:10103/Extended Report/March 2018
LIST OF FIGURES
Figure 2.1 Aerial Photograph of the Strait of Malacca 4
Figure 2.2 Proposed Reclamation Area at Malacca (Project Site) 5
Figure 2.3 Project Location Map 6
Figure 2.4 Overview of Revetment around Reclamation area at Project
Site
7
Figure 2.5 Drawing for Cross-section of Revetment 8
Figure 2.6 Area to be reclaimed 9
Figure 2.7 Drawing for Breakwater around Sg.Lereh River Mouth 10
Figure 2.8 Drawing for Cross-section of Breakwater 11
Figure 3.1 District of Melaka 13
Figure 3.1a Aerial Photograph of Study Area 14
Figure 3.1.1 Pulau Depan Tg Keling 16
Figure 3.1.2 Kampung Hailam 16
Figure 3.1.3 Everly Resort Hotel 16
Figure 3.1.4 Sungai Lereh River Mouth 17
Figure 3.1.5 Three Towers 17
Figure 3.1.6 Dredging 17
Figure 3.1.7 Past Reclamation 18
Figure 3.1.8 Klebang Besar 18
Figure 3.1.9 Tidal Gate 18
Figure 3.1.10 Sungai Klebang Besar River Mouth 19

Extended Report: Hydrology Analysis Sungai Lereh, Malacca
AQSP/R.No:10103/Extended Report/March 2018
Figure 3.1.11 Barge 19
Figure 3.1.12 Jetty at Pulau Upeh 19
Figure 3.2 View of Groin and Sand Dune at Study Area 15
Figure 3.3 Outlook of Sg. Lereh 20
Figure 3.4 Environmentally Sensitive Area (Pulau Upeh) around
Project Site
22
Figure 3.5 Monthly Average High and Low Temperature Round the
Year in Malacca
22
Figure 3.6 Monthly Average Precipitation and Rainfall Days Round
the Year Malacca
23
Figure 3.7 Monsoons season affecting Melaka State 24
Figure 3.8 Annual Wind Rose Plot at Project Area 25
Figure 3.9 Monthly Wind Rose for NE Monsoon 26
Figure 3.10 Monthly Wind Rose for SW Monsoon 27
Figure 3.11 Main river basins in the Flood Mitigation Master for
Melaka
29
Figure 3.12 Sg. Melaka river basin 30
Figure 3.13 Melaka River Study extent 30
Figure 3.14 Main River Distribution at Malacca State 31
Figure 3.15 Rainfall and streamflow stations in the study area 32
Figure 3.16 Monthly variations of rainfall at study area 33
Figure 3.17 Isohyets of mean annual rainfall 33
Figure 3.18 Isohyets of rainfall IDF-Curves depths (mm) for 100-yr
ARI Storms (durations of 0.5,1,3 and 6 hours)
34
Extended Report: Hydrology Analysis Sungai Lereh, Malacca
AQSP/R.No:10103/Extended Report/March 2018
Figure 3.19 Isohyets of rainfall IDF-Curve depths (mm) for 100-yr ARI
Storms (durations of 0.5,1,3 and 6 hours)
35
Figure 4.1 Bathymetry Survey (Primary Data) at Project Area 38
Figure 4.2 Bathymetry Survey (Secondary Data) around Strait of
Malacca
39
Figure 4.3 Locations of ADCPs Deployment 40
Figure 4.4 Measured Current Speed 41
Figure 4.5 Measured Current Direction 42
Figure 4.6 Measured Water Level 43
Figure 4.7 Location for Seabed Sediment Collection around Project
Area
44
Figure 4.8 Location of Measurement Point of Sungai Lereh and
Sungai Udang
46
Figure 4.9 Current and Water Level Measurement Locations at Sungai
Lereh and Sungai Udang
47
Figure 4.10 River Cross Section at Sungai Lereh 49
Figure 4.11 River Cross Section at Sungai Udang 50
Figure 4.12 Water Level at station TG1 at Sungai Lereh Melaka 51
Figure 4.13 Water Level at station TG2 at Sungai Lereh 52
Figure 4.14 Water Level at station TG3 at Sungai Udang 52
Figure 4.15 River Cross Section at Sungai Lereh (CH1-CH3) 53
Figure 4.16 River Cross Section at Sungai Lereh (CH4-CH6) 54
Figure 4.17 River Cross Section at Sungai Lereh (CH7-CH9) 55
Figure 4.18 River Cross Section at Sungai Lereh (CH10-CH12) 56

Extended Report: Hydrology Analysis Sungai Lereh, Malacca
AQSP/R.No:10103/Extended Report/March 2018
Figure 4.19 River Cross Section at Sungai Lereh (CH13-CH14) 57
Figure 4.20 River Cross Section at Sungai Udang (CH1-CH3) 58
Figure 4.21 River Cross Section at Sungai Udang (CH4-CH6) 59
Figure 4.22 River Cross Section at Sungai Udang (CH7-CH9) 60
Figure 4.23 River Cross Section at Sungai Udang (CH10-CH12) 61
Figure 4.24 River Cross Section at Sungai Udang (CH13-15) 62
Figure 4.24 Drawing For River Cross Section at CH6 Sungai Lereh 63
Figure 4.25 Flow Rate, Q (Discharge) at Sungai Lereh (07/02/2018) 64
Figure 4.26 Flow Rate, Q (Discharge) at Sungai Lereh (08/02/2018) 65
Figure 4.27 Flow Rate, Q (Discharge) at Sungai Lereh (17/02/2018) 66
Figure 4.28 Drawing For River Cross Section at CH4 Sungai Udang 72
Figure 4.29 Flow Rate, Q (Discharge) at Sungai Udang (07/02/2018) 72
Figure 4.30 Flow Rate, Q (Discharge) at Sungai Udang (08/02/2018) 72
Figure 4.31 Location of Hydrological Station at Melaka Tengah 75
Figure 5.1 Project Area - Model Domain 77
Figure 5.2 Grid Distribution of Flexible Mesh at Model Domain 78
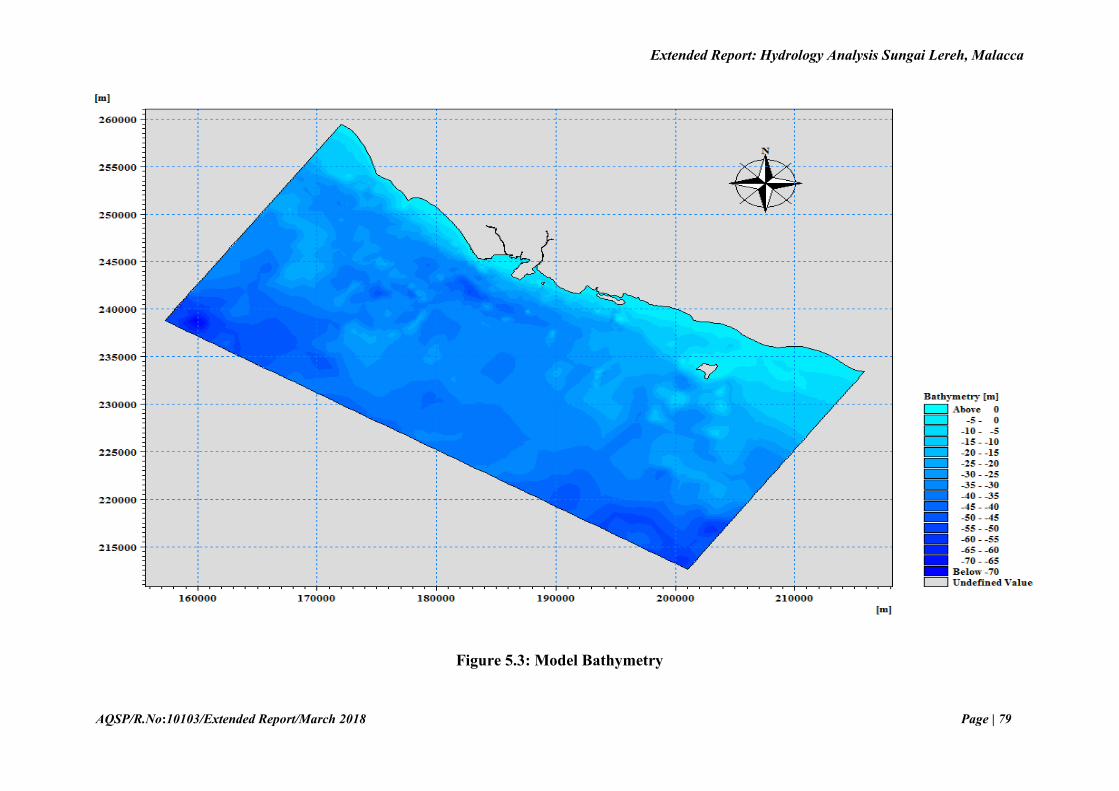
Figure 5.3 Model Bathymetry 79
Figure 5.4 Bathymetry of the Project Area 80
Figure 5.5 Location of Boundaries 81
Figure 5.6 Water Levels at Three Open Boundaries 82
Figure 5.7 Tidal Stations around Project Area 84
Figure 5.8 Model Calibration: Comparison between Predicted and
Simulated Water Level
85

Extended Report: Hydrology Analysis Sungai Lereh, Malacca
AQSP/R.No:10103/Extended Report/March 2018
Figure 5.9 Model Calibration: Comparison between Measured and
Simulated Water Level
86
Figure 5.10 Model Calibration: Comparison between Measured and
Simulated Current Speed
87
Figure 5.11 Model Calibration: Comparison between Measured and
Simulated Current Direction
88
Figure 5.12 Flow diagram of Rainfall Runoff Model 90
Figure 5.13 Catchment Area 91
Figure 5.14 River network at and Around Study Area 93
Figure 5.15 Calibration point (TG-2) 95
Figure 5.16 Water level calibration at TG-2 96
Figure 5.17 Current Speed Calibration TG-2 96
Figure 5.18 Annual Total Rainfall in the Study Area 97
Figure 5.19 Yearly Maximum Flow in the Study Area from
Rainfall-Runoff Contribution
98
Figure 5.20 Frequency Plot and Probability Plot for Generalized
Extreme Value (GEV) and Generalized Pareto (GP)
101
Figure 5.21 Frequency Plot and Probability Plot for Gumble (GUM)
and Log-Pearson Type 3 (LP3)
102
Figure 5.22 Frequency Plot and Probability Plot for Log Normal (LN2)
and Weibull (WEI)
103
Figure 5.23 Frequency plot and Probability plot for Frechet (FRE),
Pearson 3 (P3) and Square-root Exponential (SQE)
104
Figure 6.1 Data Extraction Boundary for Baseline Model 107
Figure 6.2 Data Extraction Boundary for Baseline Model 108

Extended Report: Hydrology Analysis Sungai Lereh, Malacca
AQSP/R.No:10103/Extended Report/March 2018
Figure 6.3 Water level Extraction for Base Modelling options (NE and
SW Monsoon) at 3 level stream points
109
Figure 6.4 Water level Extraction for Structure Modelling option (NE
and SW Monsoon) at 3 level stream points
109
Figure 6.5 Water level Extraction comparison for Base and Structure
modelling option for NE Monsoon at 3 level stream points
110
Figure 6.6 Water level Extraction comparison for Base and Structure
modelling option for SW Monsoon at 3 level stream point
110
Figure 6.7 Water level Extraction comparison for Downstream point
ARI 2, ARI 5, ARI10, ARI 25, ARI 50 and ARI 100 years
111
Figure 6.8 Water level Extraction comparison for Midstream point
ARI 2, ARI 5, ARI10, ARI 25, ARI 50 and ARI 100 years
111
Figure 6.9 Water level Extraction comparison for Upstream point ARI
2, ARI 5, ARI10, ARI 25, ARI 50 and ARI 100 years
112
Figure 6.10 Maximum Water Level along the River Udang and Lereh
for Scenario-1
114
Figure 6.11 Maximum Water Level along the River Udang and Lereh
for Scenario-2
114
Figure 6.12 Maximum Water Level along the River Udang and Lereh
for Scenario-3
114

Extended Report: Hydrology Analysis Sungai Lereh, Malacca
AQSP/R.No:10103/Extended Report/March 2018
LIST OF TABLES
Table 3.1 The Major Sub Catchment of Sungai Melaka 29
Table 3.2 D.I.D. rainfall recording station in study area 31
Table 3.3 Mean Monthly and Annual Rainfall Depths (mm) 32
Table 4.1 Malacca Tanjung Keling Tidal Station Datum Level
Information (Royal Malaysian Navy)
37
Table 4.2 Summary of Particle Size around proposed Project Area 45
Table 4.3 Specification of field data 46
Table 4.4 Current Meter Measurement Location 47
Table 4.5 Water level Measurement Location 48
Table 4.6 Water discharge Data at Sungai Lereh (07/02/2018) 65
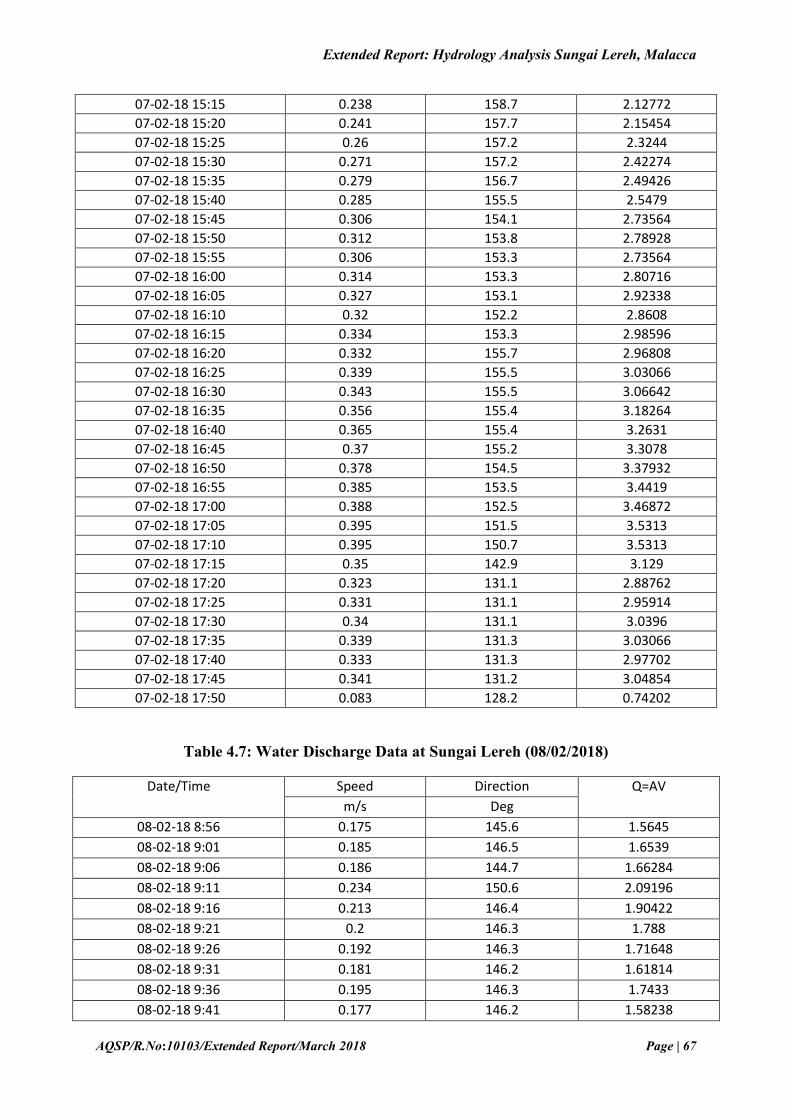
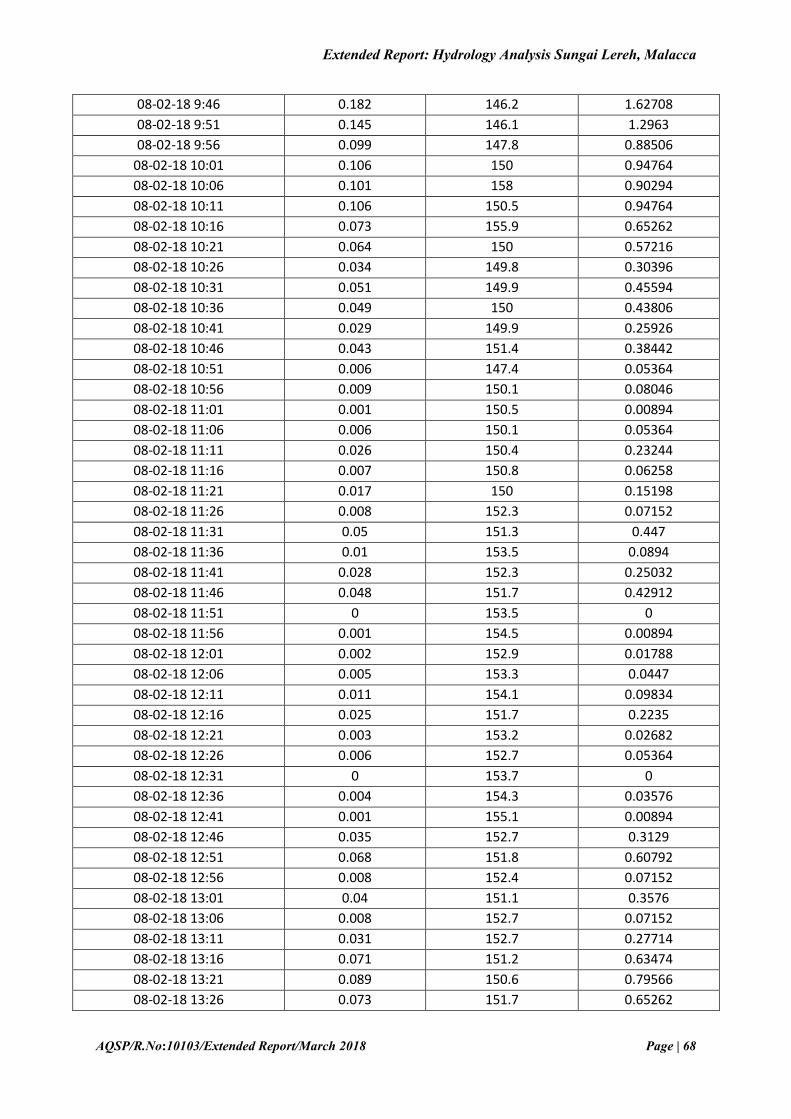
Table 4.7 Water discharge Data at Sungai Lereh (08/02/2018) 67
Table 4.8 Water discharge Data at Sungai Lereh (17/02/2018) 70
Table 4.9 Water discharge Data at Sungai Udang (07/02/2018) 73
Table 4.10 Water discharge Data at Sungai Udang (08/02/2018) 74
Table 5.1 Root Mean Squared Error Values for Measured Vs. Simulated
Water Levels
83
Table 5.2 Root Mean Squared Error Values for Measured Vs. Simulated
Currents
83
Table 5.3 Available Rainfall 91
Table 5.4 Quality Index and JPS Guideline 97
Table 5.5 Analysed Distributions along with Their Characteristics 99
Table 5.6 Goodness-of-fit statistics using Chi-squared, Kolmogorov-
Smirnov and Log-likelihood
100
Table 5.7 Flow in the Udang-Lereh Catchment for Different ARI 105
Table 6.1 Model Simulation for Two Scenarios with Different Monsoon 106
Table 6.2 ARI from Mike 11 Analysis 107
Table 6.3 Extracted Analysis Points for Backwater Effect 108
Table 6.4 Tidal Characteristics at the Outfall of Sg Lereh 113
Table 6.5 Worst Scenarios 113

Extended Report: Hydrology Analysis Sungai Lereh, Malacca
AQSP/R.No:10103/Extended Report/March 2018 Page | 1
1. INTRODUCTION
1.1 Background
A proposal from Awan Plasma Sdn Bhd for resources development led to an assessment
of impact which carried out by Aqvaspace Sdn Bhd to achieve the project scope. Coastal zones
are one of the most important areas for human activities and infrastructure growth. However,
the systems are dynamic and need to be studied extensively before any infrastructure is planned
in order to avoid damages due to natural processes such as erosion. An important tool to assess
these systems is numerical modelling to predict the environmental characteristics of the area.
The primary objective of numerical modelling is to simulate the effects of changes in the
velocities, bed thickness, erosion and deposition, and sediment mobility. Successful models
can be used to estimate water-surface elevations, velocities, erosion, deposition, and sediment
transport for flows of varying magnitudes and stages.
A hydraulic study is required to determine the impact due to the reclamation on coastal
processes and the environment are considered as shorefront development based on Department
of Irrigation and Drainage, Malaysia (DID) guideline. The hydraulic study shall comply with
the ‘Guidelines for Preparation of Coastal engineering Hydraulic Study and Impact Evaluation’
(for Hydraulic Study Using Numerical models, Fifth Edition, 2001 by DID) and ‘Guideline on
Erosion Control for Development Projects in the Coastal Zone’ (1997). Based on the above
condition imposed, this report summarizes the hydraulic study for the proposed. In order to
conduct the study, the main approach taken was the use of the MIKE 21 and Mike 11 computer
modelling package.
The approval of the reclamation works was obtain from Jabatan Pengairan dan Saliran
Malaysia on 2 August 2017 for coastal reclamation work with some condition. Malacca
State Economic Development Unit was requested the developer to build a breakwater at
river mouth to protect Sungai Lereh river mouth from higher wave and strong current
intrusion into Sungai Lereh. To fulfil the requirement of JPS, consultant had requested to
conduct the hydrology modelling work to ensure the reclamation work to ensure there is
no site effect to the river flow and back water effect.
Extended Report: Hydrology Analysis Sungai Lereh, Malacca
AQSP/R.No:10103/Extended Report/March 2018 Page | 2
1.2 Project Objectives
The study was undertaken to meet the following key project scopes:
a) Establishment of baseline condition on hydrodynamic status based on primary
and secondary data, numerical model results and previous study reports
b) Develop 1D hydrological model and 2D coastal model.
c) Assess the impact of proposed reclamation work on hydrodynamic at coastal
specifically to Sungai Lereh region
d) To collect the meteo-marine data relevant for the study model set-up and
calibration
e) To study and assess the changes of current patterns/flow and back water effect
before and after project implementation at Sungai Lereh
f) Recommend mitigation measures to reduce the impact of the proposed project
on the environment.

Extended Report: Hydrology Analysis Sungai Lereh, Malacca
AQSP/R.No:10103/Extended Report/March 2018 Page | 3
2. PROJECT OVERVIEW
The coastal zone is an important natural resource, fulfilling environmental, economic
and social roles in the development at Malacca. The Strait of Malacca is a narrow, 890 km
stretch of water between the Malay Peninsula (Peninsular Malaysia) and the Indonesian island
of Sumatra. The city of Malacca is located on both sides of the Malacca River near its mouth
into the Strait of Malacca. The modern city has grown in all directions from this historic core,
including to the south (because the present coastline of the Strait of Malacca is somewhat
further down to the south than its original location due to land reclamation).
This study carried out to determine the optimum structural measures that will allow for
safe during periods of strong wind and high wave activity and to enhance tourism and
recreational potential in these areas. The current project comprises the impact of proposed
reclamation work on hydrodynamic and morphological condition at Malacca (Figure 2.1), aims
to create a model to represent the hydrodynamics, wave and mud transport patterns prevalent
at the study site, using MIKE 21 developed by DHI. Proposed layout for Malacca reclamation
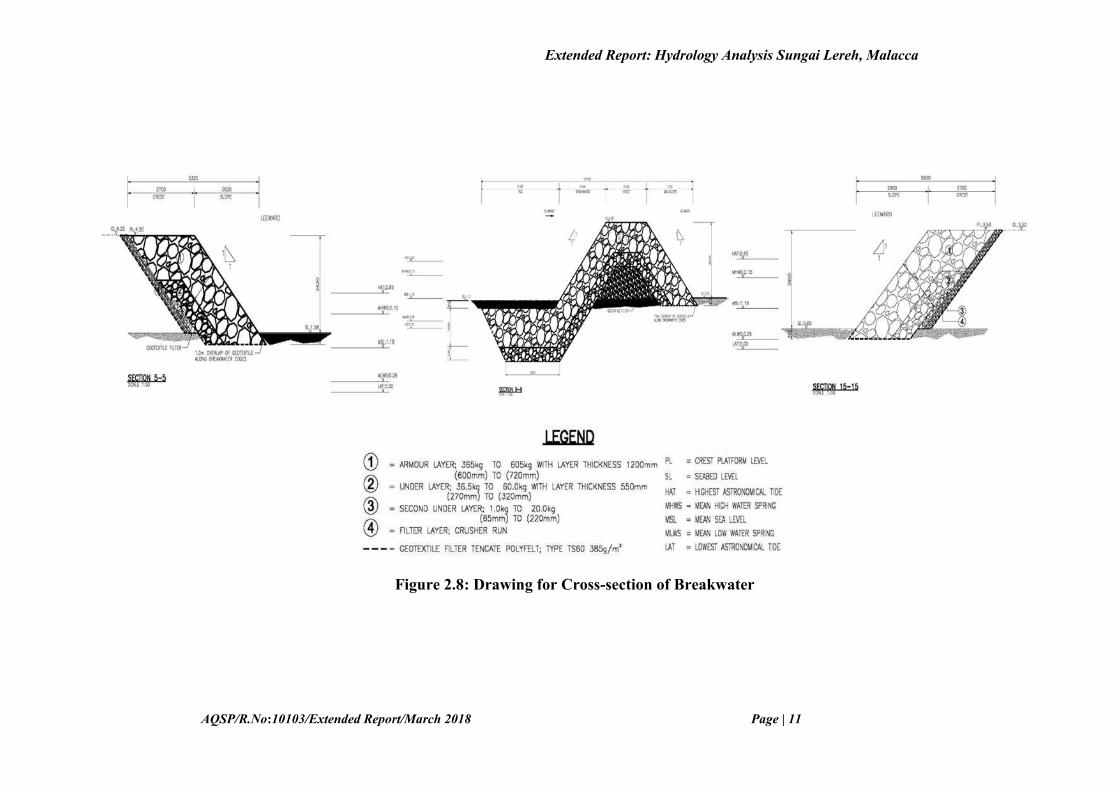
work along with revetment structure and breakwater in front of Sg. Lereh river mouth shown
at Figure 2.4 to Figure 2.8.

Extended Report: Hydrology Analysis Sungai Lereh, Malacca
AQSP/R.No:10103/Extended Report/March 2018 Page | 4
Figure 2.1: Aerial Photograph of the Strait of Malacca

Extended Report: Hydrology Analysis Sungai Lereh, Malacca
AQSP/R.No:10103/Extended Report/March 2018 Page | 5
Figure 2.2: Proposed Reclamation Area at Malacca (Project Site)

Extended Report: Hydrology Analysis Sungai Lereh, Malacca
AQSP/R.No:10103/Extended Report/March 2018 Page | 6
Figure 2.3: Project Location Map

Extended Report: Hydrology Analysis Sungai Lereh, Malacca
AQSP/R.No:10103/Extended Report/March 2018 Page | 7
Figure 2.4: Overview of Revetment around Reclamation Area at Project Site

Extended Report: Hydrology Analysis Sungai Lereh, Malacca
AQSP/R.No:10103/Extended Report/March 2018 Page | 8
Figure 2.5: Drawing for Cross-section of Revetment

Extended Report: Hydrology Analysis Sungai Lereh, Malacca
AQSP/R.No:10103/Extended Report/March 2018 Page | 9
Figure 2.6: Area to be reclaimed

Extended Report: Hydrology Analysis Sungai Lereh, Malacca
AQSP/R.No:10103/Extended Report/March 2018 Page | 10
Figure 2.7: Drawing for Breakwater around Sg.Lereh River Mouth
Extended Report: Hydrology Analysis Sungai Lereh, Malacca
AQSP/R.No:10103/Extended Report/March 2018 Page | 11
Figure 2.8: Drawing for Cross-section of Breakwater

Extended Report: Hydrology Analysis Sungai Lereh, Malacca
AQSP/R.No:10103/Extended Report/March 2018 Page | 12
3. STUDY AREA
The Strait of Malacca is a narrow, 890 km stretch of water between the Malay
Peninsula (Peninsular Malaysia) and the Indonesian island of Sumatra. The city of Malacca
is located on both sides of the Malacca River near its mouth into the Strait of Malacca. The
historic central area of the city is located near the old coastline, includes St Paul's Hill with
the ruins of the Portuguese fortress, A Famosa and the Dutch Square on the right (eastern)
bank of the river, and the old Chinatown on the left (western) bank. The modern city has
grown in all directions from this historic core, including to the south (because the present
coastline of the Strait of Malacca is somewhat further down to the south than its original
location due to land reclamation).
The state of Melaka has three (3) districts, i.e. Melaka Tengah, Alor Gajah and Jasin district as
shown in Figure 3.1. The North-South Highway cuts across the center of the state while the
Malaysian railway track in located near the northern boundary of the state. More than half of
state is below elevation RL. +20 meters. The hilly areas of higher ground are located in the
northern boundary of the state. A substantial portion of the river Sg. Melaka, Sg. Duyong, Sg.
Kesang and Sg. Linggi adjacent the river mouth is subject to tidal water level fluctuations.
Melaka is located at the southwest coastline of Peninsular Malaysia at about latitude 2°N and
longitude 102°E. It lies at the south of the main mountain range of the Peninsular Malaysia and
both the northeast monsoon (November-March) coming from the South China Sea and the
Southwest monsoon (May-September) coming from the Straits of Melaka. During the inter-
monsoon months of April and October, occasional convection rainstorm may occur, thus,
making Melaka a state which is subject to possible flooding round the year. Figure 3.7 shows
the location of the State of Melaka and the monsoon seasons affecting it.
3.1 Site Assessment
Figure 3.1a shows aerial photograph of project area. Pulau Depan Tg Keling is next
to Jeti Tanjung Beruas and is located in Malacca (Figure 3.1.1). The beach of Tanjung Kling
is one of the more recent developments of the Malacca tourism industry. Kampung Hailam
is half way towards Tanjung Kling from the city centre, along the small road leading to
Pantai Kundor is a milestone standing next to a shabby Malay shop house marking the

Extended Report: Hydrology Analysis Sungai Lereh, Malacca
AQSP/R.No:10103/Extended Report/March 2018 Page | 13
entrance to Hainanese Village (Figure 3.1.2). The Everly Resort Hotel Malacca is
characterised by Roman pillars and columns (Figure 3.1.3). It is located at the beachfront of
Tanjung Kling and is 20 minutes’ drive to Malacca City. Formerly known as the Riviera
Bay Resort Melaka. Sungai Lereh river mouth connects with waters of the Straits of Malacca
is shown in Figure 3.1.4. Due to some coastal zone management activities the dredging and
partially reclaimed lands are revealed in Figure 3.1.6 and Figure 3.1.7. The tiny island of
Upeh is located near Klebang town in Malacca. Pulau Upeh is a peaceful getaway for locals
and tourists (Figure 3.1.12). It act as a sanctuary for nesting Hawksbills, one of the rarest
species of sea turtles. During the egg-laying season between March and June, visitors can
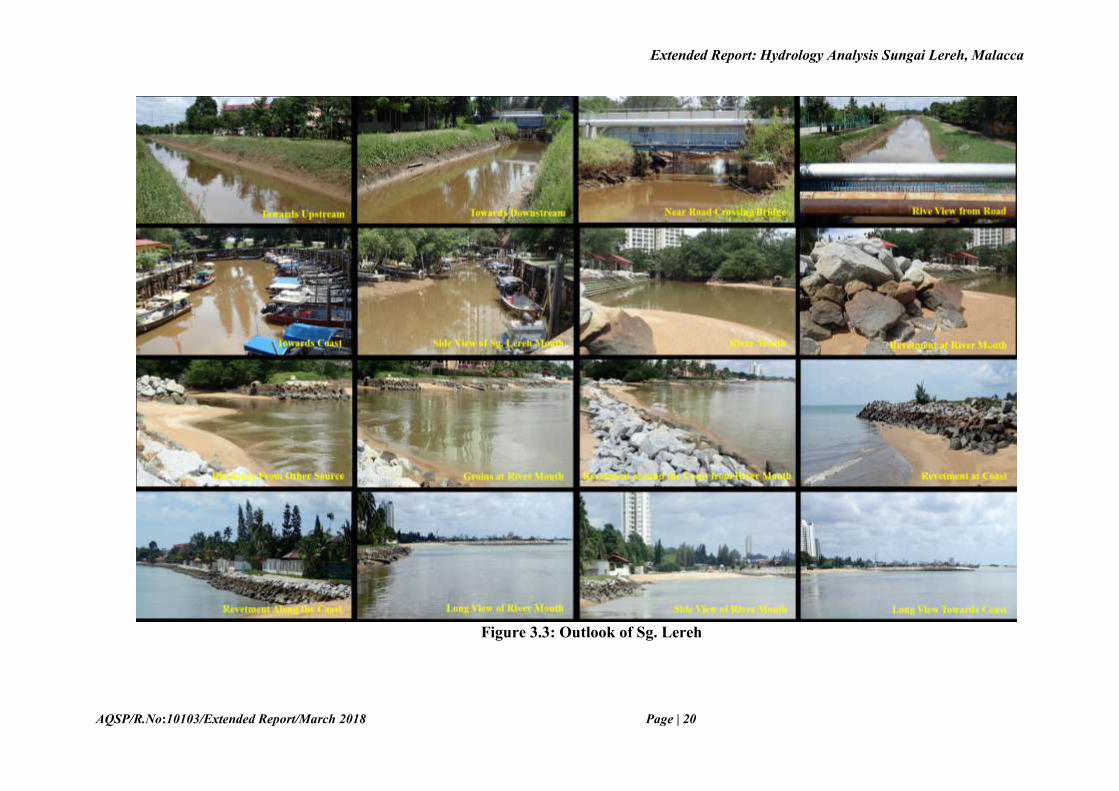
come here to catch a glimpse of Hawksbills coming on the beach to nest. Figure 3.2 and
Figure 3.3 displays the view of groin and sand dune around study area and an outlook of Sg.
Lereh.
Figure 3.1: Districts of Melaka

Extended Report: Hydrology Analysis Sungai Lereh, Malacca
AQSP/R.No:10103/Extended Report/March 2018 Page | 14
Figure 3.1a: Aerial Photograph of Study Area

Extended Report: Hydrology Analysis Sungai Lereh, Malacca
AQSP/R.No:10103/Extended Report/March 2018 Page | 15
Figure 3.2: View of Groin and Sand Dune at Study Area

Extended Report: Hydrology Analysis Sungai Lereh, Malacca
AQSP/R.No:10103/Extended Report/March 2018 Page | 16
Figure 3.1.1: Pulau Depan Tg Keling
Figure 3.1.2: Kampung Hailam
Figure 3.1.3: Everly Resort Hotel

Extended Report: Hydrology Analysis Sungai Lereh, Malacca
AQSP/R.No:10103/Extended Report/March 2018 Page | 17
Figure 3.1.4: Sungai Lereh River Mouth
Figure 3.1.5: Three Towers
Figure 3.1.6: Dredging

Extended Report: Hydrology Analysis Sungai Lereh, Malacca
AQSP/R.No:10103/Extended Report/March 2018 Page | 18
Figure 3.1.7: Past Reclamation
Figure 3.1.8: Klebang Besar
Figure 3.1.9: Tidal Gate

Extended Report: Hydrology Analysis Sungai Lereh, Malacca
AQSP/R.No:10103/Extended Report/March 2018 Page | 19
Figure 3.1.10: Sungai Klebang Besar River Mouth
Figure 3.1.11: Barge
Figure 3.1.12: Jetty at Pulau Upeh
Extended Report: Hydrology Analysis Sungai Lereh, Malacca
AQSP/R.No:10103/Extended Report/March 2018 Page | 20
Figure 3.3: Outlook of Sg. Lereh
Extended Report: Hydrology Analysis Sungai Lereh, Malacca
AQSP/R.No:10103/Extended Report/March 2018 Page | 21
3.2 Climate
Malacca's weather is hot and humid throughout the year with rainfall, the intensity
of which depends on the time of the year. It is one of the driest city in Malaysia which
receives just below 2,000 mm of rainfall annually beside Sitiawan. Malacca features tropical
rainforest climate, under the Köppen climate classification. The relatively stable weather
allows Malacca to be visited all-year-round. Temperatures generally range between 30 °C –
35 °C during the day and 27 °C – 29 °C at night. It may get cooler after periods of heavy
rainfall.
3.3 Tourism
Tourism is the key service industry in the Malacca and has grown to become one of
the most important economic activities. Most tourist attractions are concentrated in its small
city centre which encompasses Jonker Walk which houses Malacca's traditional Chinatown
that exhibits Peranakan architecture. A Famosa Fort, St. Paul's Hill is among the tourist
attractions located in the Bandar Hilir, old city area. The Malacca Straits Mosque is located
here. There are numerous islands which include Pulau Upeh near Klebang Beach (currently
undergoing reclamation works) and Pulau Besar is located near Umbai and approximately
10 km south of Malacca, Pulau Besar or ‘Big Island’ is the biggest of the eight islands off
the coast of Malacca.
3.4 Environmentally Sensitive Area
Coastal development will cause environmental impacts, such as rising temperatures,
pollution of water, air and noise and sudden loss of green areas. These issues simply and
solely involve environmentally sensitive areas. The present study area covers with
mangroves, fresh water mixing zone and good water quality for tourism activities. The tiny
island of Upeh is located near Klebang town in Malacca. Pulau Upeh is a peaceful getaway
for locals and tourists. It act as a sanctuary for nesting Hawksbills, one of the rarest species
of sea turtles. During the egg-laying season between March and June, visitors can come here
to catch a glimpse of Hawksbills coming on the beach to nest. Figure 3.4 shows the
environmentally sensitive area near project site.

Extended Report: Hydrology Analysis Sungai Lereh, Malacca
AQSP/R.No:10103/Extended Report/March 2018 Page | 22
Figure 3.4: Environmentally Sensitive Area (Pulau Upeh) around Project Site
3.5 Weather Characteristics of Project Area
Hydrological condition of the study area was also assessed from secondary data
sources. Figure 3.5 shows the temperature trend of Malacca for the whole in a monthly basis.
It is clear from the figure that maximum temperature varies from 31ºC to 33ºC and minimum
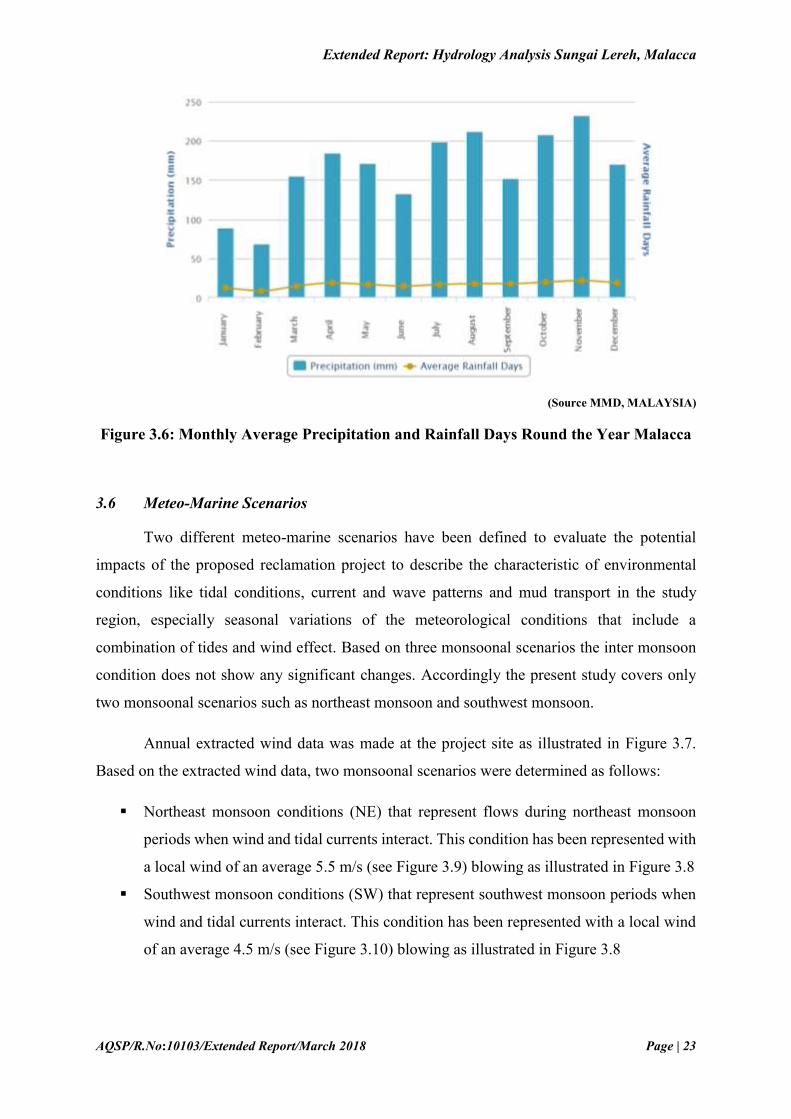
temperature varies from 23ºC to 24ºC round the year. Figure 3.6 shows the trend of average
monthly rainfall and average rainfall days in Malacca. It is evident from the figure that
maximum rainfall occurs in the month of November.
Figure 3.5: Monthly Average High and Low Temperature Round the Year in Malacca
Extended Report: Hydrology Analysis Sungai Lereh, Malacca
AQSP/R.No:10103/Extended Report/March 2018 Page | 23
(Source MMD, MALAYSIA)
Figure 3.6: Monthly Average Precipitation and Rainfall Days Round the Year Malacca
3.6 Meteo-Marine Scenarios
Two different meteo-marine scenarios have been defined to evaluate the potential
impacts of the proposed reclamation project to describe the characteristic of environmental
conditions like tidal conditions, current and wave patterns and mud transport in the study
region, especially seasonal variations of the meteorological conditions that include a
combination of tides and wind effect. Based on three monsoonal scenarios the inter monsoon
condition does not show any significant changes. Accordingly the present study covers only
two monsoonal scenarios such as northeast monsoon and southwest monsoon.
Annual extracted wind data was made at the project site as illustrated in Figure 3.7.
Based on the extracted wind data, two monsoonal scenarios were determined as follows:
Northeast monsoon conditions (NE) that represent flows during northeast monsoon
periods when wind and tidal currents interact. This condition has been represented with
a local wind of an average 5.5 m/s (see Figure 3.9) blowing as illustrated in Figure 3.8
Southwest monsoon conditions (SW) that represent southwest monsoon periods when
wind and tidal currents interact. This condition has been represented with a local wind
of an average 4.5 m/s (see Figure 3.10) blowing as illustrated in Figure 3.8

Extended Report: Hydrology Analysis Sungai Lereh, Malacca
AQSP/R.No:10103/Extended Report/March 2018 Page | 24
Figure 3.7: Monsoon seasons affecting Melaka State

Extended Report: Hydrology Analysis Sungai Lereh, Malacca
AQSP/R.No:10103/Extended Report/March 2018 Page | 25
Figure 3.8: Annual Wind Rose Plots at Project Site

Extended Report: Hydrology Analysis Sungai Lereh, Malacca
AQSP/R.No:10103/Extended Report/March 2018 Page | 26
Figure 3.9: Monthly Wind Rose for NE Monsoon

Extended Report: Hydrology Analysis Sungai Lereh, Malacca
AQSP/R.No:10103/Extended Report/March 2018 Page | 27
Figure 3.10: Monthly Wind Rose for SW Monsoon

Extended Report: Hydrology Analysis Sungai Lereh, Malacca
AQSP/R.No:10103/Extended Report/March 2018 Page | 28
3.6.1 Malacca River System
Malacca state has two main rivers which are Sungai Melaka and Sungai Kesang, where both
of these rivers are partly served by catchments within Negeri Sembilan and Johor. Other minor
rivers are Sungai Siput, a tributary of Sungai Linggi, Sungai Duyong, Sungai Lereh and Sungai
Sri Melaka.
Sg. Melaka is originates from the northern border with Negeri Sembilan at Batang Melaka. It
is about 71km long and flows through Alor Gajah area where it enters into relatively flat terrain
and goes through the flood plain at Durian Tunggal before meandering through the city of
Melaka and discharging into the Straits of Malacca. There are two water supply dams in this
river basin, namely the Durian Tunggal Dam and Jus Dam, but there is no flood mitigation
dam. Along the Sg. Melaka at Malim Jaya near the city of Melaka, a diversion regulator
structure, Malim weir, has been constructed to divert excess river flow during flood into a
nearby river called Sg. Malim which discharges into the Straits of Malacca at Klebang. The
diversion channel from Sg. Melaka to Sg. Malim has already been constructed and it has an
inlet regulation structure with a fixed - height concrete low weir at its channel bed. The
diversion channel conveys flood flows from Sg. Melaka to discharge into Sg. Malim so that it
does not flood the city of Melaka. The fixed height weir at its channel bed serves to ensure a
certain minimum low flow is maintained in the original Sg. Melaka river course which enters
into the city of Melaka.
3.6.2 Sg Melaka Basin
Sg Melaka has a catchment area of about 627 km². During early part of the century most of the
coastal plain was converted from swamp land into paddy areas by an intense network of canals
and drains. The subsequent growth of Melaka town has resulted in urbanization of most of the
coastal plain and abandonment of the paddy fields. The northern portion of the basin consists
of hills covered with forest reserves. The lower slopes of the hills and the central section of the
basin are predominated by oil palm trees.
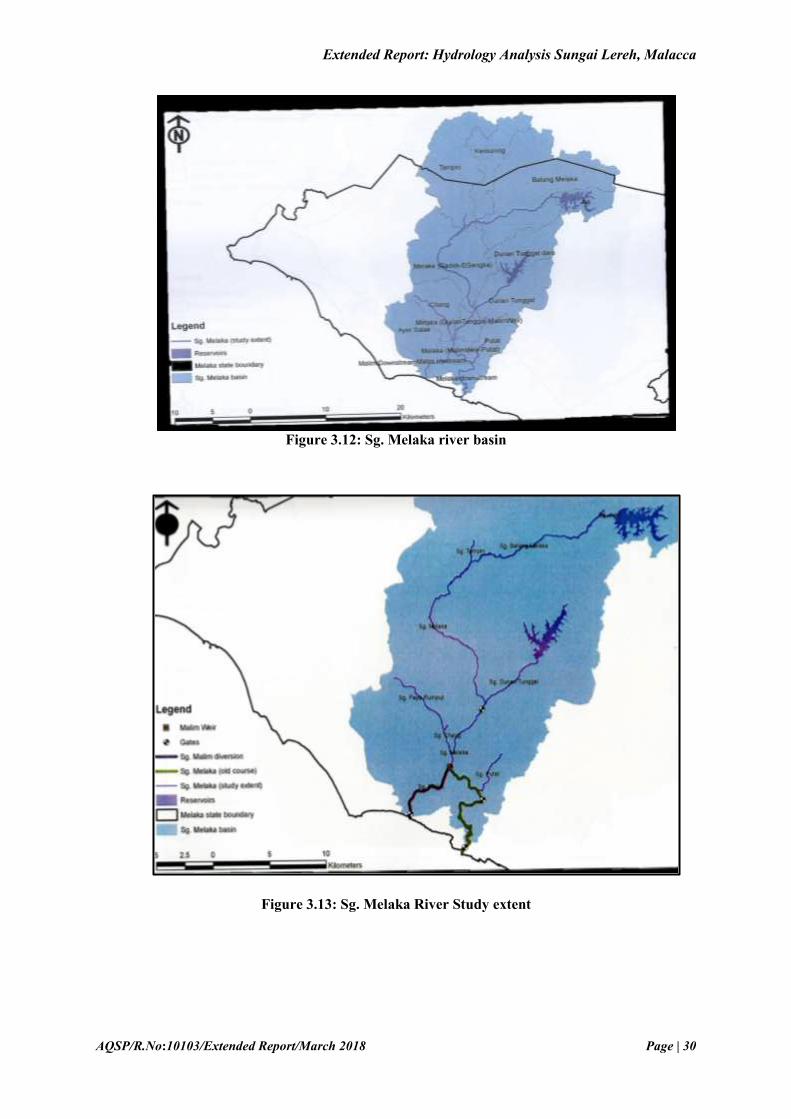
The Sg. Melaka basin, its major sub-catchments and study extent are illustrated in Figure 3.11
Sg. Melaka system has also been investigated in previous studies, such as “Kajian Pencegahan
Pencemaran dan Peningkatan Kualiti Air Sungai Melaka”commissioned by Jabatan Alam
Sekitar in 2004 [Jurutera Perunding Zaaba (2004)]. All available and compiled secondary

Extended Report: Hydrology Analysis Sungai Lereh, Malacca
AQSP/R.No:10103/Extended Report/March 2018 Page | 29
sources of information are utilized to confirm the designation of major sub-catchments and
their computed areas (summarized in Table 3.1) for this study.
Table 3.1: The major sub-catchments of Sg. Melaka
Sub-catchment Area (km²)
Tampin 90.3
Kemuning 48.8
Jus 24.1
Batang Melaka 150.5
Melaka (Gadek-EGangsa) 95.7
Durian Tunggal Dam 45.7
Durian Tunggal 55.9
Cheng 39.9
Melaka (Durian Tunggal –
Malim Weir)
14.1
Melaka (Malim-weir Putat) 9.8
Putat 24.9
Ayer Salak 39.6
Malim Upstream 9.4
Malim Downstream 7.1
Melaka Downstream 13.8
TOTAL 669.6
Figure 3.11: Main river basins in the Flood Mitigation Master for Melaka
Extended Report: Hydrology Analysis Sungai Lereh, Malacca
AQSP/R.No:10103/Extended Report/March 2018 Page | 30
Figure 3.12: Sg. Melaka river basin
Figure 3.13: Sg. Melaka River Study extent

Extended Report: Hydrology Analysis Sungai Lereh, Malacca
AQSP/R.No:10103/Extended Report/March 2018 Page | 31
Figure 3.14: Main River Distribution at Malacca State
3.6.3 Hydrological data
The hydrologic and hydraulic analyses of rivers in the study area for determining their flood
responses require a thorough understanding of storm events that have occurred in the past.
D.I.D have installed several rainfall recording stations which are in operation since the 1950s
throughout the country. For this study, the location of relevant station is shown in Table 3.2.
The recorded data have been acquired from D.I.D. Hydrology data was obtained from DID
hydrology section which is identified as Pusat Pertanian Sg. Udang (2221008) for the duration
of 2007 – 2017.

Extended Report: Hydrology Analysis Sungai Lereh, Malacca
AQSP/R.No:10103/Extended Report/March 2018 Page | 32
Figure 3.15: Rainfall and streamflow stations in the study area
Table 3.2 :D.I.D. rainfall recording station in study area
No. Station Name Latitude Longitude Type and Period
of Records
2221008 Pusat Pertanian
Sg. Udang
02°17’30” 102°08’00” M (1953 – 2007)
A (1994 –
current)
Table 3.3: Mean monthly and annual rainfall depths (mm)
NO: 2221008
STATION NAME: PUSAT PERTANIAN
SG. UDANG
JAN 77
FEB 76
MAR 116
APR 179
MAY 175
JUN 172
JUL 197
AUG 194
SEP 219
OCT 217
NOV 239
DEC 138
ANNUAL 2011

Extended Report: Hydrology Analysis Sungai Lereh, Malacca
AQSP/R.No:10103/Extended Report/March 2018 Page | 33
Figure 3.16: Monthly variations of rainfall at study area
Figure 3.17: Isohyets of mean annual rainfall
0
50
100
150
200
250
300
JAN FEB MAR APR MAY JUN JUL AUG SEP OCT NOV DEC
2221008
Extended Report: Hydrology Analysis Sungai Lereh, Malacca
AQSP/R.No:10103/Extended Report/March 2018 Page | 34
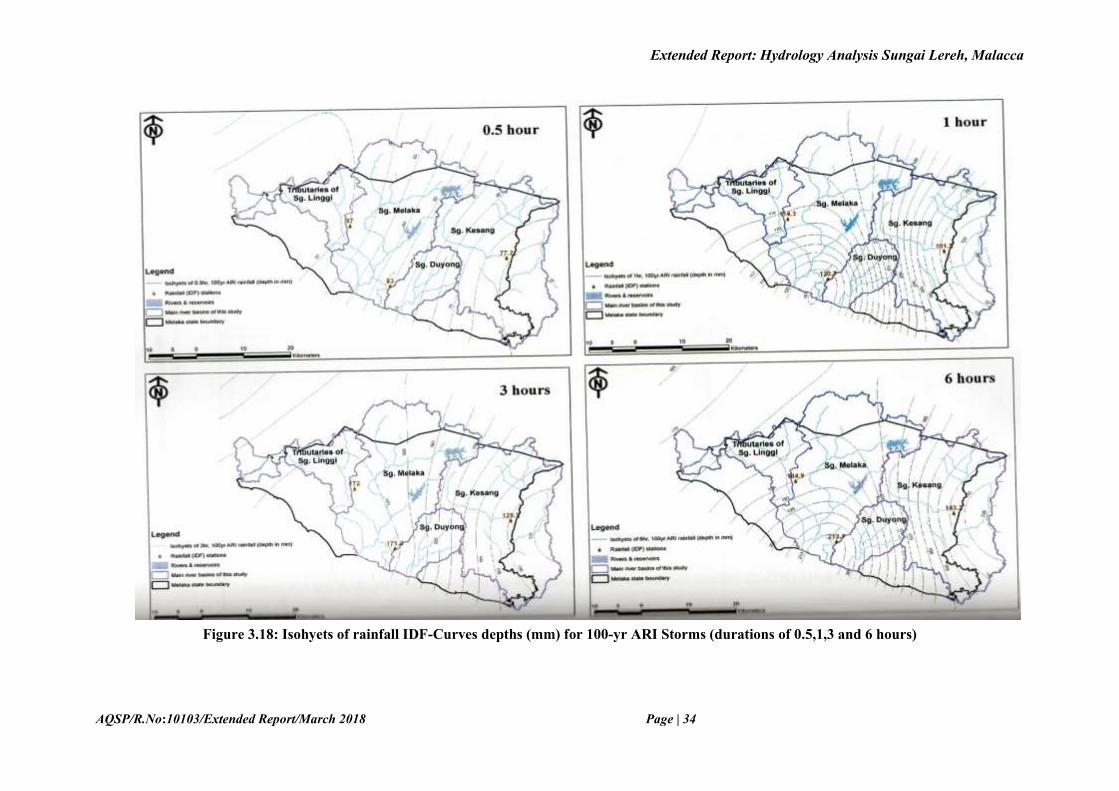
Figure 3.18: Isohyets of rainfall IDF-Curves depths (mm) for 100-yr ARI Storms (durations of 0.5,1,3 and 6 hours)

Extended Report: Hydrology Analysis Sungai Lereh, Malacca
AQSP/R.No:10103/Extended Report/March 2018 Page | 35
Figure 3.19: Isohyets of rainfall IDF-Curve depths (mm) for 100-yr ARI Storms (durations of 0.5,1,3 and 6 hours)

Extended Report: Hydrology Analysis Sungai Lereh, Malacca
AQSP/R.No:10103/Extended Report/March 2018 Page | 36
4 DATA COLLECTION
4.1 Coastal Data Measurements
In order to assess the potential impact of the proposed reclamation work in the study
area, it is important to establish the baseline conditions so that once the impacts are quantified
it is possible to evaluate the relative changes to the existing water environment. Prior to the
modelling work, the major data have been collected around the study area such as current,
water level, bathymetry data and sediment samples. The measurements are described in the
sub-sections below and the location of the water level and current measurements is depicted in
the figures below.
The scope of work and specifications for the field data collection is based on the
guidelines for preparation of coastal engineering hydraulic study and impact evaluation
(additional requirement – 2013). These were presented and approved by the JPS Malaysia.
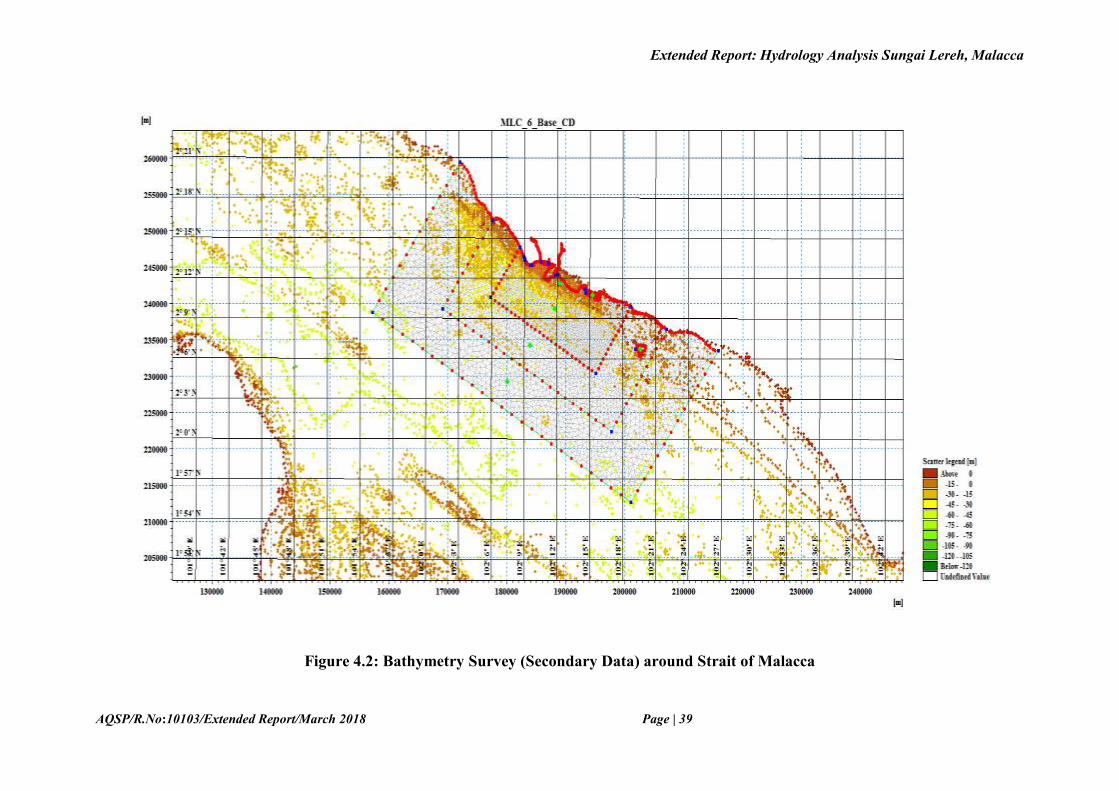
4.1.1 Bathymetry
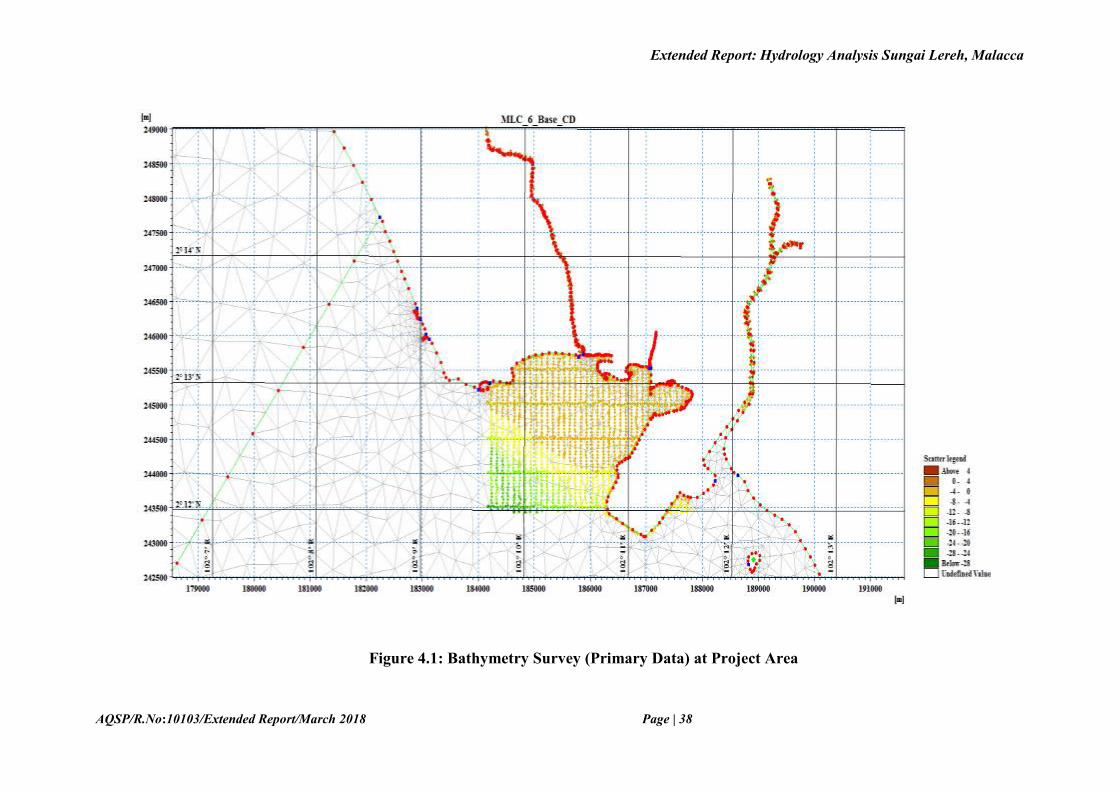
A bathymetric survey of the study area was carried as illustrated in Figure 4.1 and the
secondary data for Malacca Strait is presented in Figure 4.2. The data together with sea chart
information obtained from C-MAP, an electronic database for the regional area, has been
applied to be incorporated and interpolated into unstructured meshes for HD and SW models.
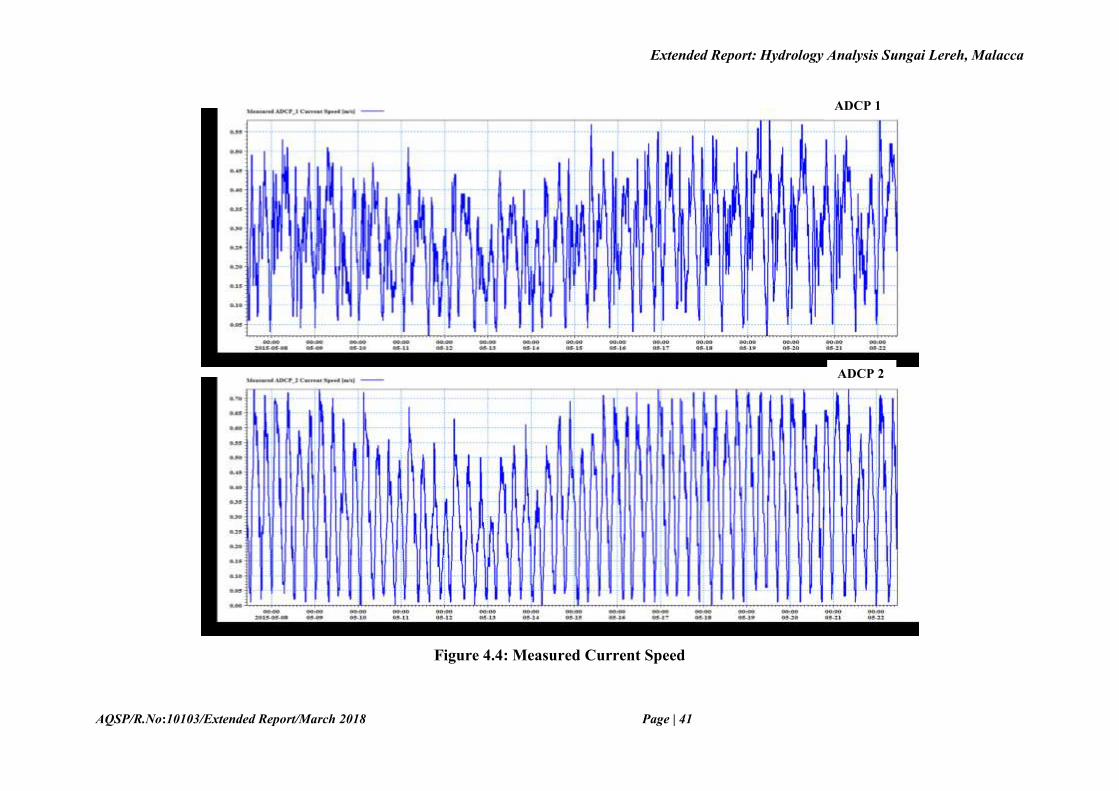
4.1.2 Current Measurements
The current measurements were performed by two ADCPs from 5th May 2015 to 23rd
May 2015 deployed in the project site (Figure 4.3 for location). ADCP 1 presented current
speeds to around 0.91 m/s while the current speeds in ADCP 2 reached up to 1.13 m/s. The
water level also measured by using ADCPs. The data acquired from ADCP the recording made
at the study area are depicted in Figures 4.4 to 4.6.
4.1.3 Water Level Measurements
The tide at the project site is semi-diurnal, i.e. two high water levels and low water
levels in a tidal day with comparatively little diurnal inequality. The nearest standard port from

Extended Report: Hydrology Analysis Sungai Lereh, Malacca
AQSP/R.No:10103/Extended Report/March 2018 Page | 37
the project site is Tanjung Keling. The typical tidal levels published in Tide Tables Malaysia
2017 by National Hydrographic Centre of the Royal Malaysian Navy (Table 4.1). Differential
datum differential from Mean Sea Level to CD are 1.19 meter. All the Datum differential are
mention below.
Table 4.1: Malacca Tanjung Keling Tidal Station Datum Level Information (Royal
Malaysian Navy)
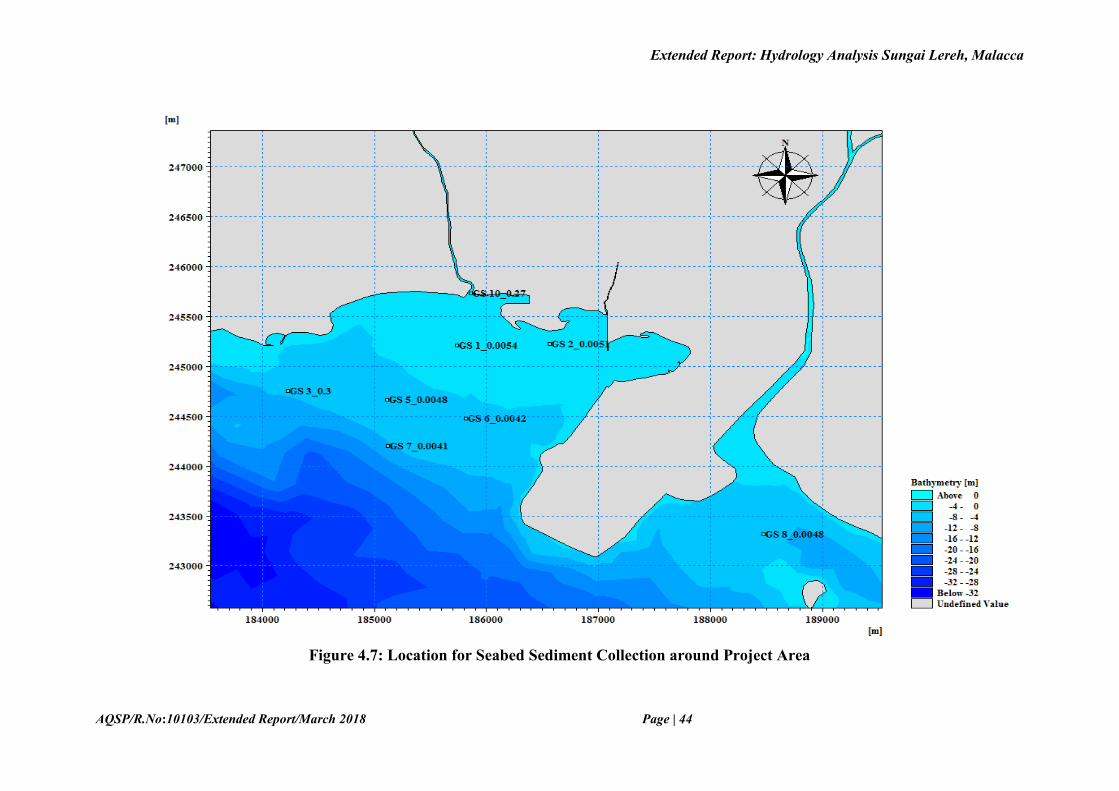
4.1.4 Seabed Sediment Sampling
Seabed sampling measurements has been taken during the deployment period (15 days)
at 10 stations and the stations are well distributed at the location of the proposed reclamation
area. Figure 4.7 and Table 4.2 shows the location of the sediment collection station and the
grain size distribution around project site at Malacca.
TIDAL LEVEL ELEVATION IN
NGVD ( m )
ELEVATION
IN CD (m )
HIGHEST ASTRONOMICAL TIDE (HAT) 1.56 2.65
MEAN HIGH WATER SPRING (MHWS) 1.01 2.10
MEAN HIGH WATER NEAP (MHWN) 0.42 1.51
MEAN SEA LEVEL ( MSL ) 0.10 1.19
LAND SURVEY DATUM (NGVD) 0.00 1.09
MEAN LOW WATER NEAP (MLWN) -0.21 0.88
MEAN LOW WATER SPRING (MLWS) -0.80 0.29
LOWEST ASTRONOMICAL TIDE
(LAT)/CD -1.09 0.00
Extended Report: Hydrology Analysis Sungai Lereh, Malacca
AQSP/R.No:10103/Extended Report/March 2018 Page | 38
Figure 4.1: Bathymetry Survey (Primary Data) at Project Area
Extended Report: Hydrology Analysis Sungai Lereh, Malacca
AQSP/R.No:10103/Extended Report/March 2018 Page | 39
Figure 4.2: Bathymetry Survey (Secondary Data) around Strait of Malacca

Extended Report: Hydrology Analysis Sungai Lereh, Malacca
AQSP/R.No:10103/Extended Report/March 2018 Page | 40
Figure 4.3: Locations of ADCPs Deployment
Extended Report: Hydrology Analysis Sungai Lereh, Malacca
AQSP/R.No:10103/Extended Report/March 2018 Page | 41
Figure 4.4: Measured Current Speed
ADCP 2
ADCP 1

Extended Report: Hydrology Analysis Sungai Lereh, Malacca
AQSP/R.No:10103/Extended Report/March 2018 Page | 42
Figure 4.5: Measured Current Direction
ADCP 2
ADCP 1

Extended Report: Hydrology Analysis Sungai Lereh, Malacca
AQSP/R.No:10103/Extended Report/March 2018 Page | 43
Figure 4.6: Measured Water Level
ADCP 2
ADCP 1
Extended Report: Hydrology Analysis Sungai Lereh, Malacca
AQSP/R.No:10103/Extended Report/March 2018 Page | 44
Figure 4.7: Location for Seabed Sediment Collection around Project Area

Extended Report: Hydrology Analysis Sungai Lereh, Malacca
AQSP/R.No:10103/Extended Report/March 2018 Page | 45
Table 4.2: Summary of Particle Size around Proposed Project Area
4.2 River Hydrology Data Measurements
4.2.1 River Hydrology Measurements
Data is essential to characterize the study area and to understand the past and present
hydrological and hydraulic conditions in the river system. In the context of model setup,
calibration, and validation, data are essential and need to collect from available sources.
All the required data set on the cross-section, rainfall, evaporation, water level, flow and current
speed will be collected from primary and secondary sources. In addition, all the information
relevant to the study such as study reports, maps and satellite images will be reviewed in the
perspective of collating information and knowledge that are useful for the present study.
Analysis of data enables in understanding the present hydrological and hydraulic condition of
Sg.Lereh and Sg.Udang sub catchment.
Primary data is essential to establish the existing condition of the project site and to calibrate
and validate the Hydrological and Hydrodynamic Model. A detailed field measurements
programme will be prepared to collect the primary data on cross-section, water level, current
Location
ID Longitude E Latitude N
Particle Size
D50 (mm)
Classification
Name
GS 1 102.174864 2.215797 0.0054 Silt Fine
GS 2 102.182289 2.215892 0.0051 Silt Fine
GS 3 102.161256 2.211633 0.3 Sand Medium
GS 4 102.148275 2.202653 0.0053 Silt Fine
GS 5 102.169247 2.210869 0.0048 Silt Fine
GS 6 102.175544 2.209167 0.0042 Silt Fine
GS 7 102.169328 2.206669 0.0041 Silt Fine
GS 8 102.199431 2.198675 0.0048 Silt Fine
GS 9 102.211692 2.191575 0.75 Sand Coarse
GS 10 102.175933 2.220461 0.27 Sand Medium

Extended Report: Hydrology Analysis Sungai Lereh, Malacca
AQSP/R.No:10103/Extended Report/March 2018 Page | 46
speed, and flow. Table 4.3 shows the data collection plan for Lereh river system and Figure 4.8
represents the location of all the measurement points.
Table 4.3: Specification of field data
Type Number of
Stations Duration Remark
Cross Section
Sg Lereh
and Sg
Udang
Once Sg Lereh: @ 250m
Sg Udang: @ 500m
Water Level 2 15 Days Minimum half hourly data
Current Speed 1 72 hours velocity
measurements in spring tide
At mid-depth ( 0.6d,d= total
water depth )
Flow 2 Twice in a day for three
days
Where there is no tidal
effect, one in Sg Lereh and
one in Sg Udang
Figure 4.8: Location of measurement point of Sungai Lereh and Sungai Udang

Extended Report: Hydrology Analysis Sungai Lereh, Malacca
AQSP/R.No:10103/Extended Report/March 2018 Page | 47
4.2.2 CURRENT MEASUREMENT
Current measurement using Valeport 106 will be carried out at CM_1 and CM_2 as shown in
Figure 4.9 to measure the current speed and current direction. The duration of the current
measurement shall be of minimum eight (8) hours, concurrent with the water level
measurement, during neap tide and spring tide. Both current meter deployments are planned
according to the suitability of the study area. Deployment location is very important to ensure
the stable calibration process later in numerical modelling process. The current meter
measurement location coordinate is shown in Table 4.4.
Table 4.4: Current Meter Measurement Location
Figure 4.9: Current and Water Level Measurement Location at Sungai Lereh and
Sungai Udang
SAMPLE ID Latitude (Y) Longitude (X)
CM_1 2.23308 102.1728
CM_2 2.25821 102.15627

Extended Report: Hydrology Analysis Sungai Lereh, Malacca
AQSP/R.No:10103/Extended Report/March 2018 Page | 48
4.2.3 WATER LEVEL MEASUREMENT
Water level measurement using pressure gauge will be carried out at three (3) locations (refer
Figure 4.8 – TG_1, TG_2 and TG_3) for a consecutive period of 15days which includes neap
and spring tide. All the water level readings shall be relative to Mean Sea Level Datum. The
data shall be logged at 10 minutes interval and with a resolution of 0.01 m. The water level
measurement location coordinate is shown in Table 4.5
Table 4.5: Water Level Measurement Location
SAMPLE ID Latitude (Y) Longitude (X)
TG_1 2.22218 102.1748
TG_2 2.23308 102.1728
TG_3 2.25821 102.1563
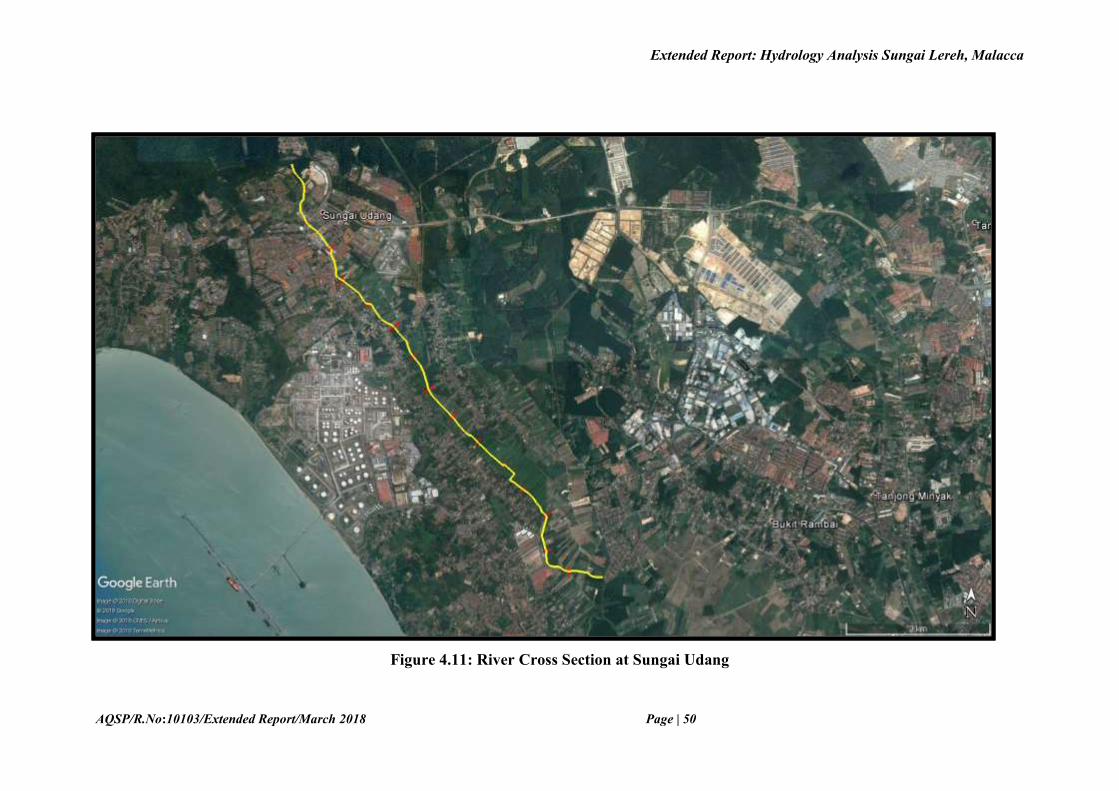
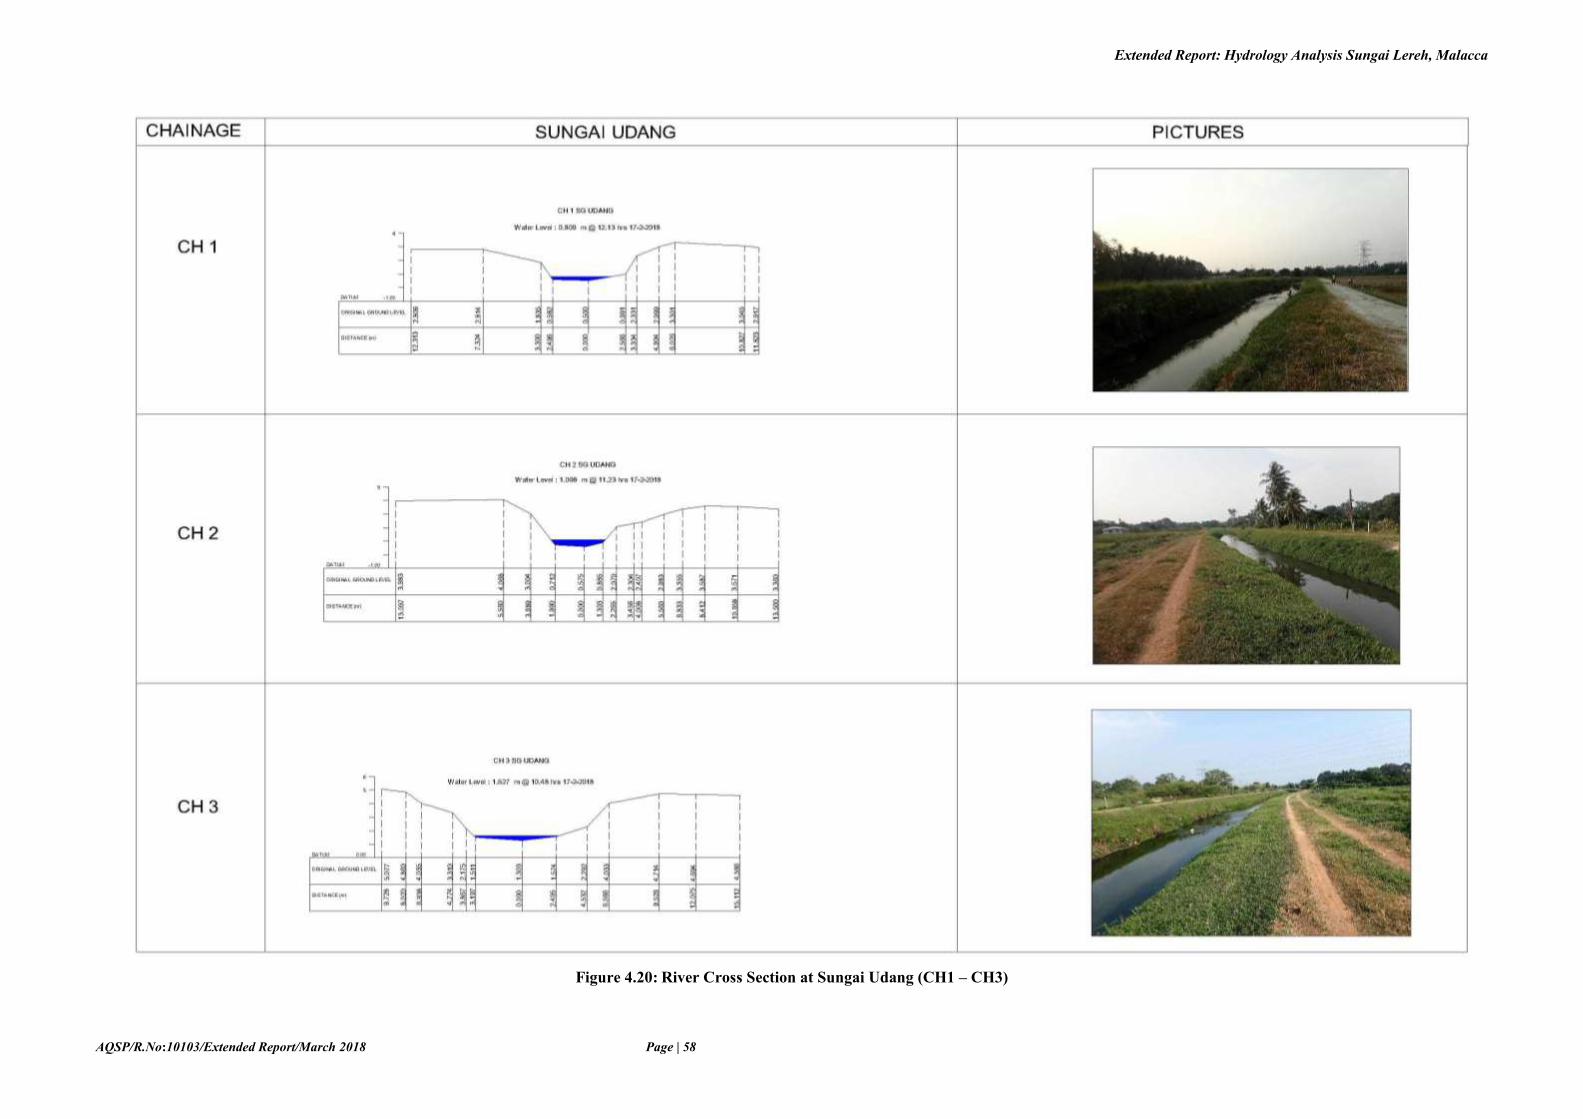
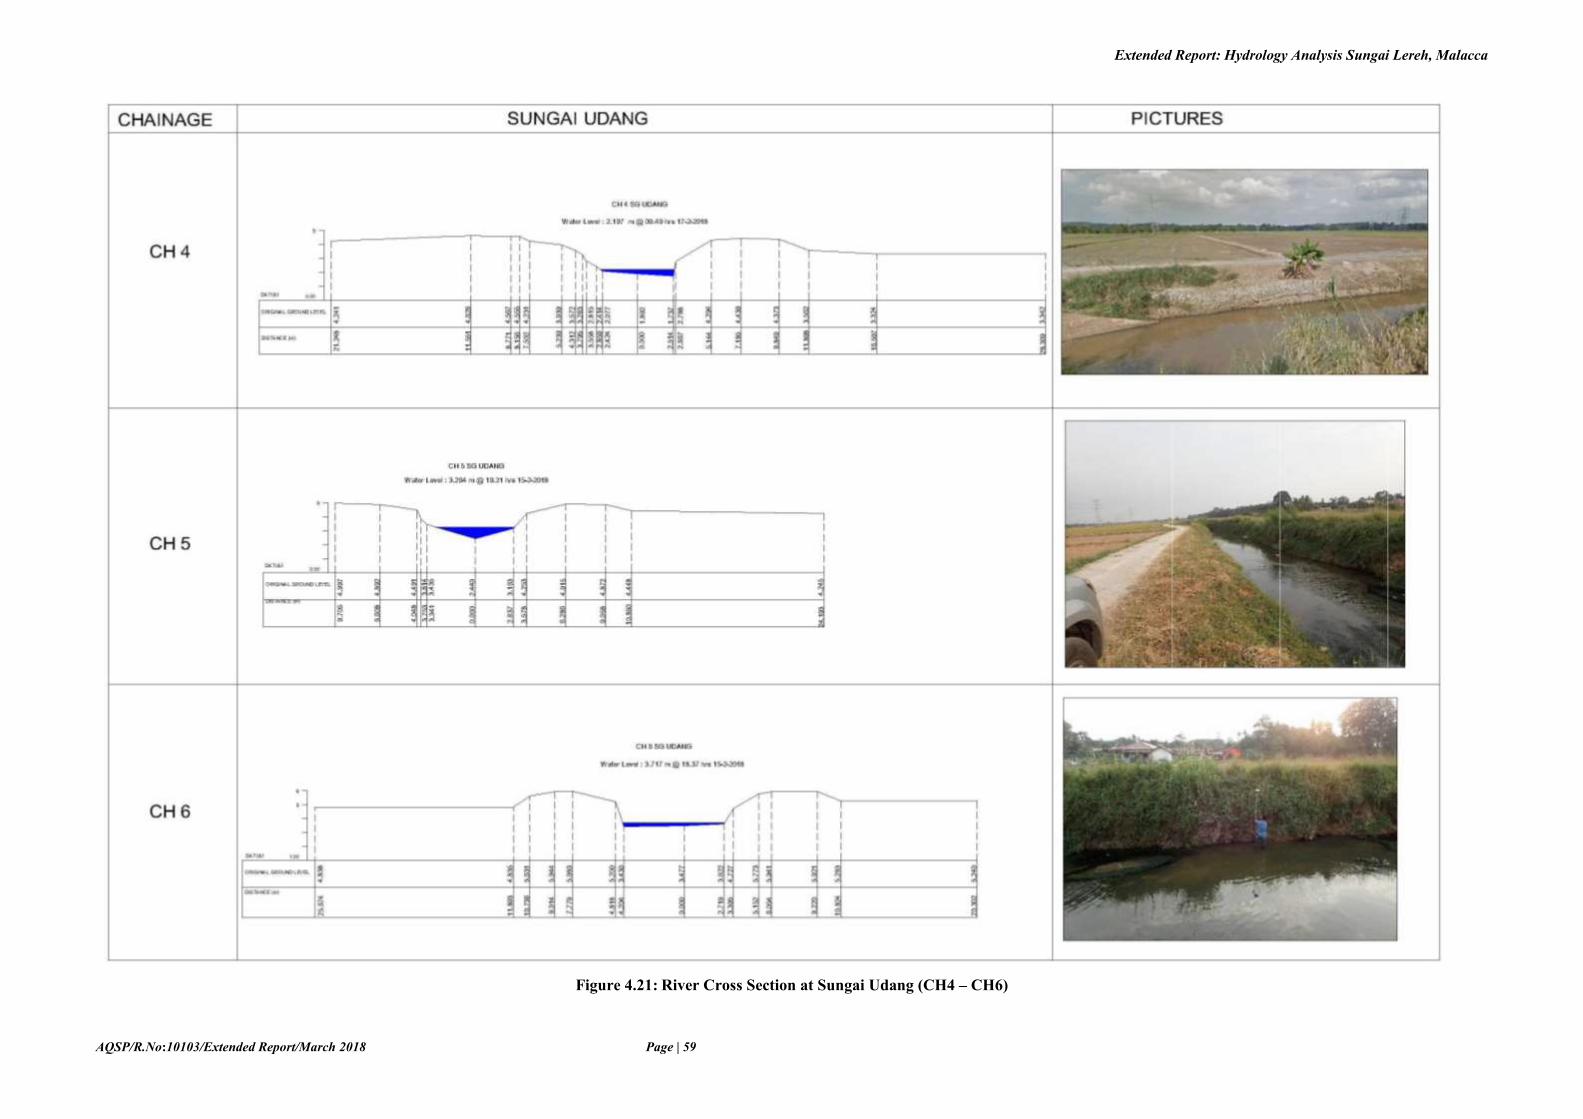
4.2.4 RIVER CROSS SECTION
The river cross section survey carried out at 250m for Sungai Lereh and 500m for Sungai
Udang intervals generally along of this study area. The river cross section of Sungai Lereh and
Sungai Udang was illustrated in Figure 4.10 and Figure 4.11. Sg Lereh Crossection extended
up to 14 and estimated distance is 3.5 km and Sg Udang Chainage extended upto Chainage 12
which is the distance estimated to be 6km.
4.2.5 RIVER DISCHARGE
Discharge is the volume of water moving down a stream or river per unit of time, commonly
expressed in cubic feet per second. In general, river discharge is computed by multiplying the
area of water in a channel cross section by the average velocity of the water in that cross section:
Discharge (Q) = Area (A) x Velocity (V)

Extended Report: Hydrology Analysis Sungai Lereh, Malacca
AQSP/R.No:10103/Extended Report/March 2018 Page | 49
Figure 4.10: River Cross Section at Sungai Lereh
Extended Report: Hydrology Analysis Sungai Lereh, Malacca
AQSP/R.No:10103/Extended Report/March 2018 Page | 50
Figure 4.11: River Cross Section at Sungai Udang

Extended Report: Hydrology Analysis Sungai Lereh, Malacca
AQSP/R.No:10103/Extended Report/March 2018 Page | 51
The Hobo water level logger was deployed in the selected location at Sungai Lereh and
Sungai Udang, data collection was carried out on 6th February 2018 and the retrieval was done
on 20th February 2018. Before deployment, the Temporary Bench Mark (TBM) was established
near the station by the surveyor. The data was recorded for 15 days with interval of 5 minutes.
TBM value was used to correct the tide data according to National Geodetic Vertical Datum
(NGVD).
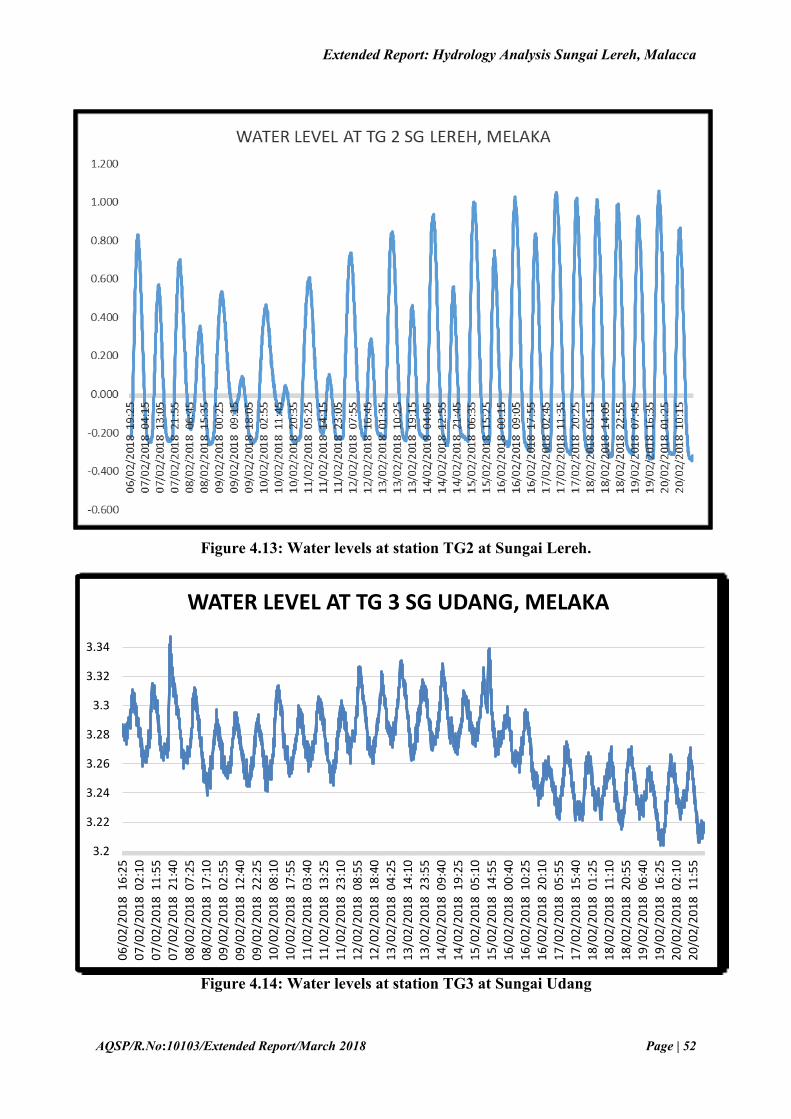
The data acquired from water level logger at the study area are represented in Figure 4.12 to
4.14. Water level at station TG1 varying from -0.497m to 1.293m while in station TG2 water
level varies from -0.345m to 1.052m. The water level at Sungai Udang, Melaka varies from
3.204m to 3.347m.
Figure 4.12: Water levels at station TG1 at Sungai Lereh, Melaka
Extended Report: Hydrology Analysis Sungai Lereh, Malacca
AQSP/R.No:10103/Extended Report/March 2018 Page | 52
Figure 4.13: Water levels at station TG2 at Sungai Lereh.
Figure 4.14: Water levels at station TG3 at Sungai Udang
3.2
3.22
3.24
3.26
3.28
3.3
3.32
3.34
06
/02
/20
18
16
:25
07
/02
/20
18
02
:10
07
/02
/20
18
11
:55
07
/02
/20
18
21
:40
08
/02
/20
18
07
:25
08
/02
/20
18
17
:10
09
/02
/20
18
02
:55
09
/02
/20
18
12
:40
09
/02
/20
18
22
:25
10
/02
/20
18
08
:10
10
/02
/20
18
17
:55
11
/02
/20
18
03
:40
11
/02
/20
18
13
:25
11
/02
/20
18
23
:10
12
/02
/20
18
08
:55
12
/02
/20
18
18
:40
13
/02
/20
18
04
:25
13
/02
/20
18
14
:10
13
/02
/20
18
23
:55
14
/02
/20
18
09
:40
14
/02
/20
18
19
:25
15
/02
/20
18
05
:10
15
/02
/20
18
14
:55
16
/02
/20
18
00
:40
16
/02
/20
18
10
:25
16
/02
/20
18
20
:10
17
/02
/20
18
05
:55
17
/02
/20
18
15
:40
18
/02
/20
18
01
:25
18
/02
/20
18
11
:10
18
/02
/20
18
20
:55
19
/02
/20
18
06
:40
19
/02
/20
18
16
:25
20
/02
/20
18
02
:10
20
/02
/20
18
11
:55
WATER LEVEL AT TG 3 SG UDANG, MELAKA

Extended Report: Hydrology Analysis Sungai Lereh, Malacca
AQSP/R.No:10103/Extended Report/March 2018 Page | 53
Figure 4.15 : River Cross Section at Sungai Lereh (CH1 – CH3)

Extended Report: Hydrology Analysis Sungai Lereh, Malacca
AQSP/R.No:10103/Extended Report/March 2018 Page | 54
Figure 4.16: River Cross Section at Sungai Lereh (CH4 – CH6)

Extended Report: Hydrology Analysis Sungai Lereh, Malacca
AQSP/R.No:10103/Extended Report/March 2018 Page | 55
Figure 4.17: River Cross Section at Sungai Lereh (CH7 – CH9)

Extended Report: Hydrology Analysis Sungai Lereh, Malacca
AQSP/R.No:10103/Extended Report/March 2018 Page | 56
Figure 4.18: River Cross Section at Sungai Lereh (CH10 – CH12)

Extended Report: Hydrology Analysis Sungai Lereh, Malacca
AQSP/R.No:10103/Extended Report/March 2018 Page | 57
Figure 4.19: River Cross Section at Sungai Lereh (CH13 – CH14)
Extended Report: Hydrology Analysis Sungai Lereh, Malacca
AQSP/R.No:10103/Extended Report/March 2018 Page | 58
Figure 4.20: River Cross Section at Sungai Udang (CH1 – CH3)
Extended Report: Hydrology Analysis Sungai Lereh, Malacca
AQSP/R.No:10103/Extended Report/March 2018 Page | 59
Figure 4.21: River Cross Section at Sungai Udang (CH4 – CH6)

Extended Report: Hydrology Analysis Sungai Lereh, Malacca
AQSP/R.No:10103/Extended Report/March 2018 Page | 60
Figure 4.22: River Cross Section at Sungai Udang (CH7 – CH9)

Extended Report: Hydrology Analysis Sungai Lereh, Malacca
AQSP/R.No:10103/Extended Report/March 2018 Page | 61
Figure 4.23: River Cross Section at Sungai Udang (CH10 – CH12)

Extended Report: Hydrology Analysis Sungai Lereh, Malacca
AQSP/R.No:10103/Extended Report/March 2018 Page | 62
Figure 4.24: River Cross Section at Sungai Udang (CH13 – CH15)

Extended Report: Hydrology Analysis Sungai Lereh, Malacca
AQSP/R.No:10103/Extended Report/March 2018 Page | 63
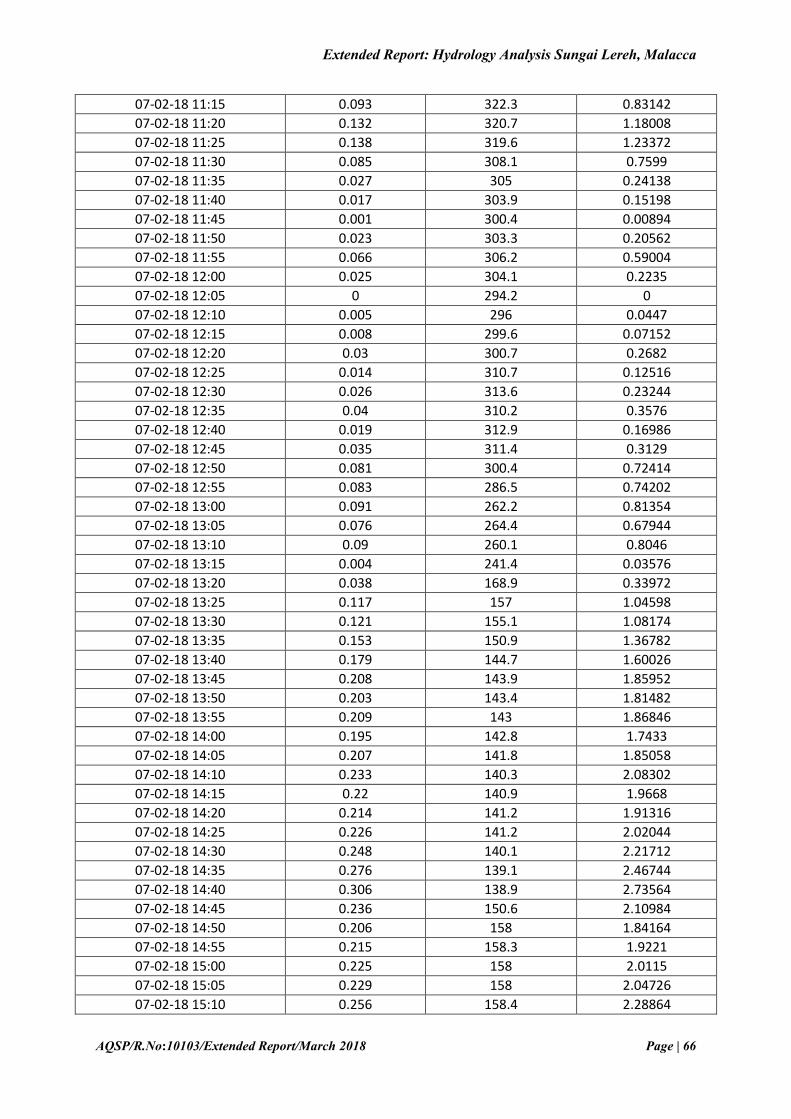
The velocity of the river is measured using a current meter. Current Meter were deployed at
two locations, CH6 at Sungai Lereh and CH4 at Sungai Udang. The discharge rate (Q) varied
from 0.00 m³/s to 3.5313 m³/s on 7th February 2018, 0.00 m³/s to 3.27204 m³/s on 8th February
2018 and 0.00 m³/s to 3.50637 m³/s on 17th February 2018 at Sungai Lereh. While at Sungai
Udang, the discharge rate (Q) varied from 0.3153 m³/s to 0.6229 m³/s on 7th February 2018 and
from 0.4291 m³/s to 0.6398 m³/s on 8th February 2018. The discharge data for Sungai Lereh
and Sungai Udang are depicted in Figure 4.24 – 4.30 and Table 4.6 – 4.10.
Figure 4.25: Drawing for River Cross Section at CH6 Sungai Lereh

Extended Report: Hydrology Analysis Sungai Lereh, Malacca
AQSP/R.No:10103/Extended Report/March 2018 Page | 64
Figure 4.26: Flow rate, Q (Discharge) at Sungai Lereh (07/02/2018)
Figure 4.27: Flow rate, Q (Discharge) at Sungai Lereh (08/02/2018)

Extended Report: Hydrology Analysis Sungai Lereh, Malacca
AQSP/R.No:10103/Extended Report/March 2018 Page | 65
Figure 4.28: Flow rate, Q (Discharge) at Sungai Lereh (17/02/2018)
Table 4.6: Water Discharge Data at Sungai Lereh (07/02/2018)
Date/Time Speed Direction Q=AV
m/s Deg
07-02-18 9:35 0.039 143.8 0.34866
07-02-18 9:40 0.054 143.7 0.48276
07-02-18 9:45 0.006 143.6 0.05364
07-02-18 9:50 0.008 143.6 0.07152
07-02-18 9:55 0.002 143.6 0.01788
07-02-18 10:00 0.048 143.8 0.42912
07-02-18 10:05 0.072 143.7 0.64368
07-02-18 10:10 0.043 143.7 0.38442
07-02-18 10:15 0.077 143.6 0.68838
07-02-18 10:20 0.091 143.5 0.81354
07-02-18 10:25 0.084 143.5 0.75096
07-02-18 10:30 0.085 143.5 0.7599
07-02-18 10:35 0.105 143.4 0.9387
07-02-18 10:40 0.077 143.4 0.68838
07-02-18 10:45 0.078 138 0.69732
07-02-18 10:50 0.173 326.4 1.54662
07-02-18 10:55 0.146 327 1.30524
07-02-18 11:00 0.112 325.8 1.00128
07-02-18 11:05 0.12 321 1.0728
07-02-18 11:10 0.1 322.4 0.894
Extended Report: Hydrology Analysis Sungai Lereh, Malacca
AQSP/R.No:10103/Extended Report/March 2018 Page | 66
07-02-18 11:15 0.093 322.3 0.83142
07-02-18 11:20 0.132 320.7 1.18008
07-02-18 11:25 0.138 319.6 1.23372
07-02-18 11:30 0.085 308.1 0.7599
07-02-18 11:35 0.027 305 0.24138
07-02-18 11:40 0.017 303.9 0.15198
07-02-18 11:45 0.001 300.4 0.00894
07-02-18 11:50 0.023 303.3 0.20562
07-02-18 11:55 0.066 306.2 0.59004
07-02-18 12:00 0.025 304.1 0.2235
07-02-18 12:05 0 294.2 0
07-02-18 12:10 0.005 296 0.0447
07-02-18 12:15 0.008 299.6 0.07152
07-02-18 12:20 0.03 300.7 0.2682
07-02-18 12:25 0.014 310.7 0.12516
07-02-18 12:30 0.026 313.6 0.23244
07-02-18 12:35 0.04 310.2 0.3576
07-02-18 12:40 0.019 312.9 0.16986
07-02-18 12:45 0.035 311.4 0.3129
07-02-18 12:50 0.081 300.4 0.72414
07-02-18 12:55 0.083 286.5 0.74202
07-02-18 13:00 0.091 262.2 0.81354
07-02-18 13:05 0.076 264.4 0.67944
07-02-18 13:10 0.09 260.1 0.8046
07-02-18 13:15 0.004 241.4 0.03576
07-02-18 13:20 0.038 168.9 0.33972
07-02-18 13:25 0.117 157 1.04598
07-02-18 13:30 0.121 155.1 1.08174
07-02-18 13:35 0.153 150.9 1.36782
07-02-18 13:40 0.179 144.7 1.60026
07-02-18 13:45 0.208 143.9 1.85952
07-02-18 13:50 0.203 143.4 1.81482
07-02-18 13:55 0.209 143 1.86846
07-02-18 14:00 0.195 142.8 1.7433
07-02-18 14:05 0.207 141.8 1.85058
07-02-18 14:10 0.233 140.3 2.08302
07-02-18 14:15 0.22 140.9 1.9668
07-02-18 14:20 0.214 141.2 1.91316
07-02-18 14:25 0.226 141.2 2.02044
07-02-18 14:30 0.248 140.1 2.21712
07-02-18 14:35 0.276 139.1 2.46744
07-02-18 14:40 0.306 138.9 2.73564
07-02-18 14:45 0.236 150.6 2.10984
07-02-18 14:50 0.206 158 1.84164
07-02-18 14:55 0.215 158.3 1.9221
07-02-18 15:00 0.225 158 2.0115
07-02-18 15:05 0.229 158 2.04726
07-02-18 15:10 0.256 158.4 2.28864
Extended Report: Hydrology Analysis Sungai Lereh, Malacca
AQSP/R.No:10103/Extended Report/March 2018 Page | 67
07-02-18 15:15 0.238 158.7 2.12772
07-02-18 15:20 0.241 157.7 2.15454
07-02-18 15:25 0.26 157.2 2.3244
07-02-18 15:30 0.271 157.2 2.42274
07-02-18 15:35 0.279 156.7 2.49426
07-02-18 15:40 0.285 155.5 2.5479
07-02-18 15:45 0.306 154.1 2.73564
07-02-18 15:50 0.312 153.8 2.78928
07-02-18 15:55 0.306 153.3 2.73564
07-02-18 16:00 0.314 153.3 2.80716
07-02-18 16:05 0.327 153.1 2.92338
07-02-18 16:10 0.32 152.2 2.8608
07-02-18 16:15 0.334 153.3 2.98596
07-02-18 16:20 0.332 155.7 2.96808
07-02-18 16:25 0.339 155.5 3.03066
07-02-18 16:30 0.343 155.5 3.06642
07-02-18 16:35 0.356 155.4 3.18264
07-02-18 16:40 0.365 155.4 3.2631
07-02-18 16:45 0.37 155.2 3.3078
07-02-18 16:50 0.378 154.5 3.37932
07-02-18 16:55 0.385 153.5 3.4419
07-02-18 17:00 0.388 152.5 3.46872
07-02-18 17:05 0.395 151.5 3.5313
07-02-18 17:10 0.395 150.7 3.5313
07-02-18 17:15 0.35 142.9 3.129
07-02-18 17:20 0.323 131.1 2.88762
07-02-18 17:25 0.331 131.1 2.95914
07-02-18 17:30 0.34 131.1 3.0396
07-02-18 17:35 0.339 131.3 3.03066
07-02-18 17:40 0.333 131.3 2.97702
07-02-18 17:45 0.341 131.2 3.04854
07-02-18 17:50 0.083 128.2 0.74202
Table 4.7: Water Discharge Data at Sungai Lereh (08/02/2018)
Date/Time Speed Direction Q=AV
m/s Deg
08-02-18 8:56 0.175 145.6 1.5645
08-02-18 9:01 0.185 146.5 1.6539
08-02-18 9:06 0.186 144.7 1.66284
08-02-18 9:11 0.234 150.6 2.09196
08-02-18 9:16 0.213 146.4 1.90422
08-02-18 9:21 0.2 146.3 1.788
08-02-18 9:26 0.192 146.3 1.71648
08-02-18 9:31 0.181 146.2 1.61814
08-02-18 9:36 0.195 146.3 1.7433
08-02-18 9:41 0.177 146.2 1.58238
Extended Report: Hydrology Analysis Sungai Lereh, Malacca
AQSP/R.No:10103/Extended Report/March 2018 Page | 68
08-02-18 9:46 0.182 146.2 1.62708
08-02-18 9:51 0.145 146.1 1.2963
08-02-18 9:56 0.099 147.8 0.88506
08-02-18 10:01 0.106 150 0.94764
08-02-18 10:06 0.101 158 0.90294
08-02-18 10:11 0.106 150.5 0.94764
08-02-18 10:16 0.073 155.9 0.65262
08-02-18 10:21 0.064 150 0.57216
08-02-18 10:26 0.034 149.8 0.30396
08-02-18 10:31 0.051 149.9 0.45594
08-02-18 10:36 0.049 150 0.43806
08-02-18 10:41 0.029 149.9 0.25926
08-02-18 10:46 0.043 151.4 0.38442
08-02-18 10:51 0.006 147.4 0.05364
08-02-18 10:56 0.009 150.1 0.08046
08-02-18 11:01 0.001 150.5 0.00894
08-02-18 11:06 0.006 150.1 0.05364
08-02-18 11:11 0.026 150.4 0.23244
08-02-18 11:16 0.007 150.8 0.06258
08-02-18 11:21 0.017 150 0.15198
08-02-18 11:26 0.008 152.3 0.07152
08-02-18 11:31 0.05 151.3 0.447
08-02-18 11:36 0.01 153.5 0.0894
08-02-18 11:41 0.028 152.3 0.25032
08-02-18 11:46 0.048 151.7 0.42912
08-02-18 11:51 0 153.5 0
08-02-18 11:56 0.001 154.5 0.00894
08-02-18 12:01 0.002 152.9 0.01788
08-02-18 12:06 0.005 153.3 0.0447
08-02-18 12:11 0.011 154.1 0.09834
08-02-18 12:16 0.025 151.7 0.2235
08-02-18 12:21 0.003 153.2 0.02682
08-02-18 12:26 0.006 152.7 0.05364
08-02-18 12:31 0 153.7 0
08-02-18 12:36 0.004 154.3 0.03576
08-02-18 12:41 0.001 155.1 0.00894
08-02-18 12:46 0.035 152.7 0.3129
08-02-18 12:51 0.068 151.8 0.60792
08-02-18 12:56 0.008 152.4 0.07152
08-02-18 13:01 0.04 151.1 0.3576
08-02-18 13:06 0.008 152.7 0.07152
08-02-18 13:11 0.031 152.7 0.27714
08-02-18 13:16 0.071 151.2 0.63474
08-02-18 13:21 0.089 150.6 0.79566
08-02-18 13:26 0.073 151.7 0.65262

Extended Report: Hydrology Analysis Sungai Lereh, Malacca
AQSP/R.No:10103/Extended Report/March 2018 Page | 69
08-02-18 13:31 0.083 151.3 0.74202
08-02-18 13:36 0.111 150.2 0.99234
08-02-18 13:41 0.122 149.9 1.09068
08-02-18 13:46 0.122 149.4 1.09068
08-02-18 13:51 0.136 149.3 1.21584
08-02-18 13:56 0.082 149.4 0.73308
08-02-18 14:01 0.132 148.4 1.18008
08-02-18 14:06 0.165 148.2 1.4751
08-02-18 14:11 0.169 147.6 1.51086
08-02-18 14:16 0.187 147.9 1.67178
08-02-18 14:21 0.17 148.4 1.5198
08-02-18 14:26 0.184 148.5 1.64496
08-02-18 14:31 0.151 148.2 1.34994
08-02-18 14:36 0.189 148.5 1.68966
08-02-18 14:41 0.201 147.7 1.79694
08-02-18 14:46 0.174 147.5 1.55556
08-02-18 14:51 0.208 148.3 1.85952
08-02-18 14:56 0.212 148 1.89528
08-02-18 15:01 0.201 148.3 1.79694
08-02-18 15:06 0.227 148.5 2.02938
08-02-18 15:11 0.241 148.7 2.15454
08-02-18 15:16 0.219 148.8 1.95786
08-02-18 15:21 0.219 148.1 1.95786
08-02-18 15:26 0.233 148.6 2.08302
08-02-18 15:31 0.238 147.1 2.12772
08-02-18 15:36 0.258 143.8 2.30652
08-02-18 15:41 0.257 144 2.29758
08-02-18 15:46 0.275 144.5 2.4585
08-02-18 15:51 0.263 144.4 2.35122
08-02-18 15:56 0.284 144.7 2.53896
08-02-18 16:01 0.282 144.6 2.52108
08-02-18 16:06 0.264 143.8 2.36016
08-02-18 16:11 0.295 145.1 2.6373
08-02-18 16:16 0.289 146.8 2.58366
08-02-18 16:21 0.304 146.8 2.71776
08-02-18 16:26 0.321 147 2.86974
08-02-18 16:31 0.315 146.7 2.8161
08-02-18 16:36 0.32 146.3 2.8608
08-02-18 16:41 0.301 146.5 2.69094
08-02-18 16:46 0.324 146.2 2.89656
08-02-18 16:51 0.329 146.9 2.94126
08-02-18 16:56 0.333 149.6 2.97702
08-02-18 17:01 0.346 148.2 3.09324
08-02-18 17:06 0.348 148.3 3.11112
08-02-18 17:11 0.349 148.1 3.12006

Extended Report: Hydrology Analysis Sungai Lereh, Malacca
AQSP/R.No:10103/Extended Report/March 2018 Page | 70
08-02-18 17:16 0.361 147.8 3.22734
08-02-18 17:21 0.366 147.3 3.27204
08-02-18 17:26 0.309 146.7 2.76246
Table 4.8: Water Discharge Data at Sungai Lereh (17/02/2018)
Date/Time Speed Direction Q=AV
m/s Deg
17-02-18 9:05 0.005 340.4 0.04245
17-02-18 9:10 0.031 323.9 0.26319
17-02-18 9:15 0.001 325.4 0.00849
17-02-18 9:20 0.002 325.7 0.01698
17-02-18 9:25 0 334.5 0
17-02-18 9:30 0 6.8 0
17-02-18 9:35 0 356.9 0
17-02-18 9:40 0 352.8 0
17-02-18 9:45 0 350.6 0
17-02-18 9:50 0 6.5 0
17-02-18 9:55 0 47.5 0
17-02-18 10:00 0 25.3 0
17-02-18 10:05 0 25.5 0
17-02-18 10:10 0 21.8 0
17-02-18 10:15 0.01 126.9 0.0849
17-02-18 10:20 0.099 131.4 0.84051
17-02-18 10:25 0.113 132.1 0.95937
17-02-18 10:30 0.044 127.4 0.37356
17-02-18 10:35 0.044 136.5 0.37356
17-02-18 10:40 0.15 124.2 1.2735
17-02-18 10:45 0.209 127.1 1.77441
17-02-18 10:50 0.228 128.9 1.93572
17-02-18 10:55 0.214 130 1.81686
17-02-18 11:00 0.215 135.7 1.82535
17-02-18 11:05 0.227 138.5 1.92723
17-02-18 11:10 0.17 145 1.4433
17-02-18 11:15 0.118 140.5 1.00182
17-02-18 11:20 0.149 149 1.26501
17-02-18 11:25 0.173 151.9 1.46877
17-02-18 11:30 0.182 161 1.54518
17-02-18 11:35 0.196 152.1 1.66404
17-02-18 11:40 0.216 134.2 1.83384
17-02-18 11:45 0.227 134.2 1.92723
17-02-18 11:50 0.252 135.3 2.13948
17-02-18 11:55 0.357 129.7 3.03093
17-02-18 12:00 0.413 127.9 3.50637

Extended Report: Hydrology Analysis Sungai Lereh, Malacca
AQSP/R.No:10103/Extended Report/March 2018 Page | 71
17-02-18 12:05 0.394 132.5 3.34506
17-02-18 12:10 0.359 133.6 3.04791
17-02-18 12:15 0.338 134.2 2.86962
17-02-18 12:20 0.365 138.9 3.09885
17-02-18 12:25 0.347 137.8 2.94603
17-02-18 12:30 0.344 137.7 2.92056
17-02-18 12:35 0.334 138.2 2.83566
17-02-18 12:40 0.325 138.4 2.75925
17-02-18 12:45 0.345 139.9 2.92905
17-02-18 12:50 0.35 140.9 2.9715
17-02-18 12:55 0.355 141.4 3.01395
17-02-18 13:00 0.329 142.6 2.79321
17-02-18 13:05 0.289 148 2.45361
17-02-18 13:10 0.278 147.2 2.36022
17-02-18 13:15 0.299 150.2 2.53851
17-02-18 13:20 0.306 150.4 2.59794
17-02-18 13:25 0.32 150.4 2.7168
17-02-18 13:30 0.314 150.2 2.66586
17-02-18 13:35 0.335 150 2.84415
17-02-18 13:40 0.335 149.4 2.84415
17-02-18 13:45 0.344 149.1 2.92056
17-02-18 13:50 0.359 149 3.04791
17-02-18 13:55 0.362 148.3 3.07338
17-02-18 14:00 0.371 147.5 3.14979
17-02-18 14:05 0.364 144.9 3.09036
17-02-18 14:10 0.365 144.5 3.09885
17-02-18 14:15 0.355 144.7 3.01395
17-02-18 14:20 0.349 144.9 2.96301
17-02-18 14:25 0.35 144.8 2.9715
17-02-18 14:30 0.336 144.3 2.85264
17-02-18 14:35 0.324 144.5 2.75076
17-02-18 14:40 0.328 144.2 2.78472
17-02-18 14:45 0.312 144.1 2.64888
17-02-18 14:50 0.334 144.9 2.83566
17-02-18 14:55 0.353 145.5 2.99697
17-02-18 15:00 0.357 145.5 3.03093

Extended Report: Hydrology Analysis Sungai Lereh, Malacca
AQSP/R.No:10103/Extended Report/March 2018 Page | 72
Figure 4.29: Drawing for River Cross Section at CH4 Sungai Udang
Figure 4.30: Flow rate, Q (Discharge) at Sungai Udang (07/02/2018)

Extended Report: Hydrology Analysis Sungai Lereh, Malacca
AQSP/R.No:10103/Extended Report/March 2018 Page | 73
Figure 4.31: Flow rate, Q (Discharge) at Sungai Udang (08/02/2018)
Table 4.9: Water Discharge Data at Sungai Udang (07/02/2018)
Date/Time Speed Direction Q=AV
measure time (8.52-10.54) m/s Deg
07-02-18 8:58 0.205 215.4 0.3153
07-02-18 9:03 0.368 211.1 0.5660
07-02-18 9:08 0.375 210.8 0.5768
07-02-18 9:13 0.378 210.6 0.5814
07-02-18 9:18 0.385 211 0.5921
07-02-18 9:23 0.388 210.4 0.5967
07-02-18 9:28 0.394 210.5 0.6060
07-02-18 9:33 0.398 210 0.6121
07-02-18 9:38 0.404 211 0.6214
07-02-18 9:43 0.396 210.8 0.6090
07-02-18 9:48 0.402 210.5 0.6183
07-02-18 9:53 0.396 210 0.6090
07-02-18 9:58 0.393 210.4 0.6044
07-02-18 10:03 0.405 210.7 0.6229
07-02-18 10:08 0.395 210.4 0.6075
07-02-18 10:13 0.394 210.2 0.6060
07-02-18 10:18 0.391 210.1 0.6014
07-02-18 10:23 0.393 210.6 0.6044
07-02-18 10:28 0.395 210.5 0.6075
07-02-18 10:33 0.399 210.7 0.6137

Extended Report: Hydrology Analysis Sungai Lereh, Malacca
AQSP/R.No:10103/Extended Report/March 2018 Page | 74
07-02-18 10:38 0.396 210.4 0.6090
07-02-18 10:43 0.393 210.7 0.6044
07-02-18 10:48 0.395 210.5 0.6075
07-02-18 10:53 0.34 211.8 0.5229
measure time (10.58-11.14)
07-02-18 11:04 0.265 209.7 0.40757
07-02-18 11:09 0.337 209.8 0.518306
07-02-18 11:14 0.29 210.1 0.44602
measure time (11.59-12.14)
07-02-18 12:04 0.265 210.4 0.40757
07-02-18 12:09 0.356 210.4 0.547528
07-02-18 12:14 0.36 211 0.55368
measure time (12.58-13.14)
07-02-18 13:04 0.277 210.7 0.426026
07-02-18 13:09 0.355 210.6 0.54599
07-02-18 13:14 0.345 210.7 0.53061
measure time (13.58-14.13)
07-02-18 14:03 0.272 210.3 0.418336
07-02-18 14:08 0.343 209.7 0.527534
07-02-18 14:13 0.297 210.4 0.456786
measure time (14.57-15.13)
07-02-18 15:02 0.271 210.1 0.416798
07-02-18 15:07 0.353 211.5 0.542914
07-02-18 15:12 0.356 212.2 0.547528
measure time (15.57-16.12)
07-02-18 16:02 0.271 210.9 0.416798
07-02-18 16:07 0.353 210.6 0.542914
07-02-18 16:12 0.343 210.5 0.527534
measure time (16.58-17.13)
07-02-18 17:03 0.287 210.8 0.441406
07-02-18 17:08 0.359 211.9 0.552142
07-02-18 17:13 0.307 211.3 0.472166
Table 4.10: Water Discharge Data at Sungai Udang (08/02/2018)
Date/Time Speed Direction Q=AV
measure time 08.59-09.14 m/s Deg
08-02-18 9:03 0.279 212.6 0.4291
08-02-18 9:08 0.321 212.5 0.4937
08-02-18 9:13 0.299 212.1 0.4599
measure time 09.57-10.13
08-02-18 10:01 0.344 208.5 0.5291
08-02-18 10:06 0.4 210.7 0.6152
08-02-18 10:11 0.411 210.6 0.6321
measure time 10.56-11.11
08-02-18 11:01 0.323 210.1 0.4968
08-02-18 11:06 0.416 210.2 0.6398
08-02-18 11:11 0.401 209.4 0.6167

Extended Report: Hydrology Analysis Sungai Lereh, Malacca
AQSP/R.No:10103/Extended Report/March 2018 Page | 75
measure time 11.55-12.10
08-02-18 12:00 0.358 210.5 0.5506
08-02-18 12:05 0.375 208.5 0.5768
08-02-18 12:10 0.355 207.1 0.5460
measure time 12.57-13.13
08-02-18 13:02 0.32 209.4 0.4922
08-02-18 13:07 0.382 210.4 0.5875
08-02-18 13:12 0.371 210.1 0.5706
measure time= 13.57-14.12
08-02-18 14:02 0.32 209.4 0.4922
08-02-18 14:07 0.381 210.2 0.5860
measure time 14.57-15.13
08-02-18 15:03 0.333 210.1 0.5122
08-02-18 15:08 0.377 209.9 0.5798
measure time 15.58-16.13
08-02-18 16:04 0.336 209.2 0.5168
08-02-18 16:09 0.37 209.1 0.5691
measure time 16.57-17.13
08-02-18 17:03 0.339 210.1 0.5214
08-02-18 17:08 0.377 209.8 0.5798
4.2.6 RAINFALL DATA
Data on rainfall will be collected from Water Resources Management & Hydrology Division,
Department of Irrigation & Drainage. The location of Hydrological Station shown in Figure
4.31.
Figure 4.32: Location of Hydrological Station at Melaka Tengah

Extended Report: Hydrology Analysis Sungai Lereh, Malacca
AQSP/R.No:10103/Extended Report/March 2018 Page | 76
5 MODEL DESCRIPTION AND SETUP
5.1 Hydrodynamic Model for Coastal Modelling
5.1.1 Model Domain
A detailed hydrodynamic model is needed to carry out the study objectives
appropriately. The main objective of this study is to assess the change in hydraulic condition
such as change in water level and current speed pattern after implementation of the project and
the Hydrodynamic Model is suitable for those calculations. A preliminary domain has been
selected to develop the hydrodynamic model and it is shown in the Figure 5.1.
5.1.2 Grid Generation and Bathymetry
The latest flexible mesh technology of MIKE 21 FM has been used under this study to
produce the grid system of the model. The grid distribution is shown in the Figure 5.2. It is
evident from the Figure 5.2 that coarser grids have been prepared near upstream and
downstream of the model which is far from our point of interest and finer grids have been
produced in and around the area of interest. Model domain bathymetry was prepared based on
the grid and bathymetric data from field survey and MIKE C-MAP data Bathymetry was
developed based on MSL shown in the Figure 5.3 and Figure 5.4.

Extended Report: Hydrology Analysis Sungai Lereh, Malacca
AQSP/R.No:10103/Extended Report/March 2018 Page | 77
Figure 5.1: Project Area - Model Domain

Extended Report: Hydrology Analysis Sungai Lereh, Malacca
AQSP/R.No:10103/Extended Report/March 2018 Page | 78
Figure 5.2: Grid Distribution of Flexible Mesh at Model Domain
Extended Report: Hydrology Analysis Sungai Lereh, Malacca
AQSP/R.No:10103/Extended Report/March 2018 Page | 79
Figure 5.3: Model Bathymetry

Extended Report: Hydrology Analysis Sungai Lereh, Malacca
AQSP/R.No:10103/Extended Report/March 2018 Page | 80
Figure 5.4: Bathymetry of the Project Area
5.1.3 Boundary Conditions
The most important thing in developing a model is to prepare an accurate boundary
condition. Three boundaries have been selected during this project to carry out the modelling
study. One is at the upstream side (north) and the other is at the downstream side (south) and
western side where predicted water level was used as boundary condition. The locations of the
boundaries are shown in the Figure 5.5. All the water level boundaries were predicted using
Global Tide Model by MIKE series (Figure 5.6).
5.1.4 Calibration and Verification
Model needs to be calibrate and verified against measured data from the calibration
period to achieve good agreement between observed and simulated data. Model calibration is
a process of adjusting the value of empirical parameters and dimensions of simplified
geometrical elements so that the model can reproduce the flow event as accurately as in the
natural system. The main governing conditions affecting performance of the hydrodynamic
model are boundary conditions, bathymetry, and bed resistance and eddy viscosity. Water
levels and currents were used to calibrate and verify the hydrodynamic model.

Extended Report: Hydrology Analysis Sungai Lereh, Malacca
AQSP/R.No:10103/Extended Report/March 2018 Page | 81
Figure 5.5: Location of Boundaries

Extended Report: Hydrology Analysis Sungai Lereh, Malacca
AQSP/R.No:10103/Extended Report/March 2018 Page | 82
Figure 5.6: Water Levels at Three Open Boundaries
Bnd_2
Bnd_3
Bnd_4
Extended Report: Hydrology Analysis Sungai Lereh, Malacca
AQSP/R.No:10103/Extended Report/March 2018 Page | 83
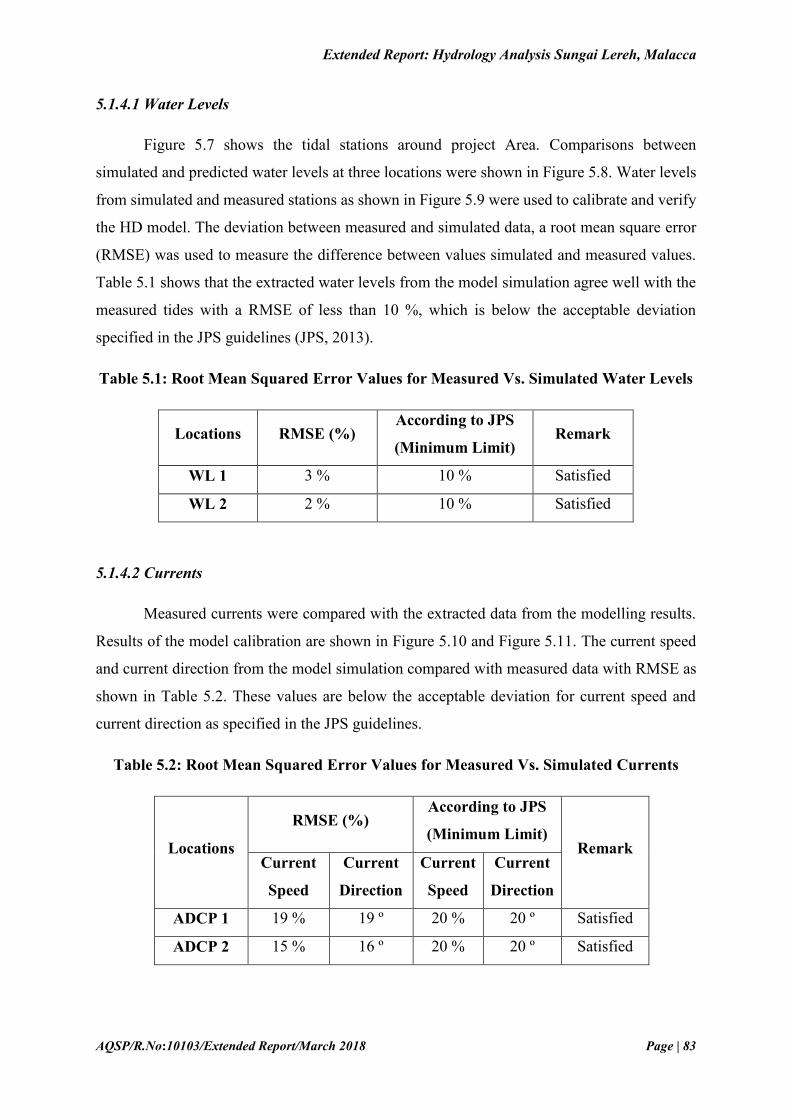
5.1.4.1 Water Levels
Figure 5.7 shows the tidal stations around project Area. Comparisons between
simulated and predicted water levels at three locations were shown in Figure 5.8. Water levels
from simulated and measured stations as shown in Figure 5.9 were used to calibrate and verify
the HD model. The deviation between measured and simulated data, a root mean square error
(RMSE) was used to measure the difference between values simulated and measured values.
Table 5.1 shows that the extracted water levels from the model simulation agree well with the
measured tides with a RMSE of less than 10 %, which is below the acceptable deviation
specified in the JPS guidelines (JPS, 2013).
Table 5.1: Root Mean Squared Error Values for Measured Vs. Simulated Water Levels
Locations RMSE (%) According to JPS
(Minimum Limit) Remark
WL 1 3 % 10 % Satisfied
WL 2 2 % 10 % Satisfied
5.1.4.2 Currents
Measured currents were compared with the extracted data from the modelling results.
Results of the model calibration are shown in Figure 5.10 and Figure 5.11. The current speed
and current direction from the model simulation compared with measured data with RMSE as
shown in Table 5.2. These values are below the acceptable deviation for current speed and
current direction as specified in the JPS guidelines.
Table 5.2: Root Mean Squared Error Values for Measured Vs. Simulated Currents
Locations
RMSE (%) According to JPS
(Minimum Limit) Remark
Current
Speed
Current
Direction
Current
Speed
Current
Direction
ADCP 1 19 % 19 º 20 % 20 º Satisfied
ADCP 2 15 % 16 º 20 % 20 º Satisfied

Extended Report: Hydrology Analysis Sungai Lereh, Malacca
AQSP/R.No:10103/Extended Report/March 2018 Page | 84
Figure 5.7: Tidal Stations around Project Area
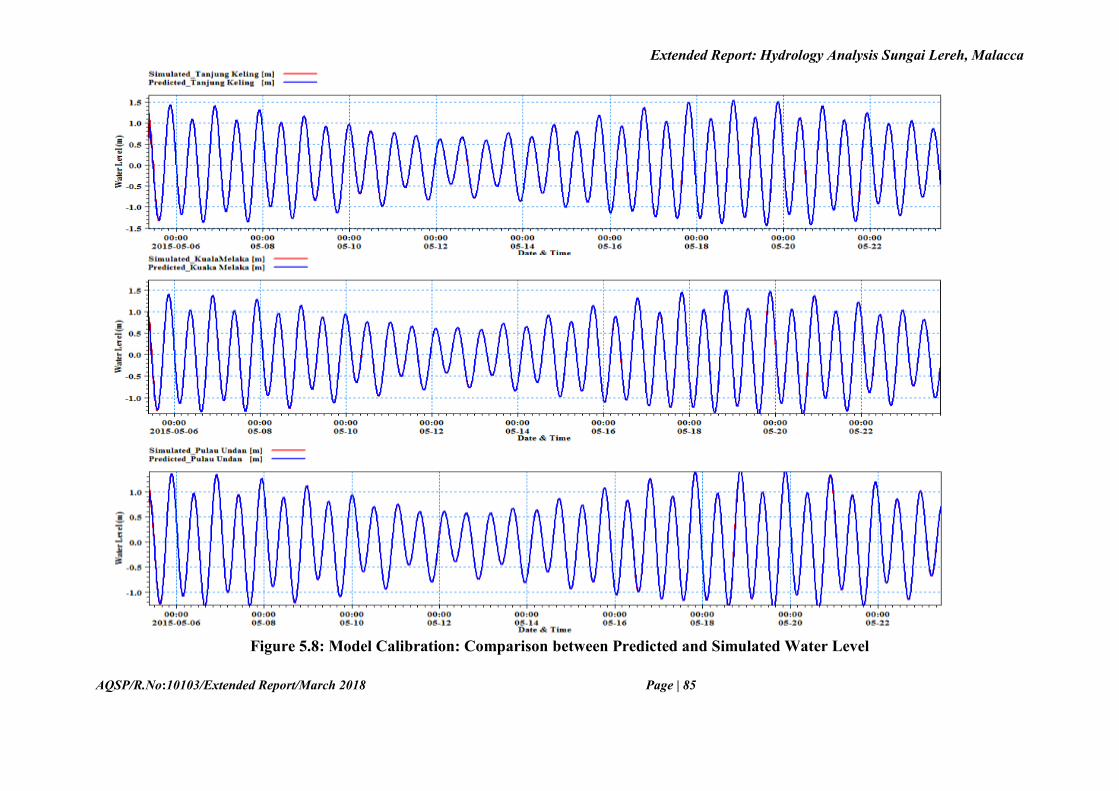
Extended Report: Hydrology Analysis Sungai Lereh, Malacca
AQSP/R.No:10103/Extended Report/March 2018 Page | 85
Figure 5.8: Model Calibration: Comparison between Predicted and Simulated Water Level

Extended Report: Hydrology Analysis Sungai Lereh, Malacca
AQSP/R.No:10103/Extended Report/March 2018 Page | 86
Figure 5.9: Model Calibration: Comparison between Measured and Simulated Water Level

Extended Report: Hydrology Analysis Sungai Lereh, Malacca
AQSP/R.No:10103/Extended Report/March 2018 Page | 87
Figure 5.10: Model Calibration: Comparison between Measured and Simulated Current Speed
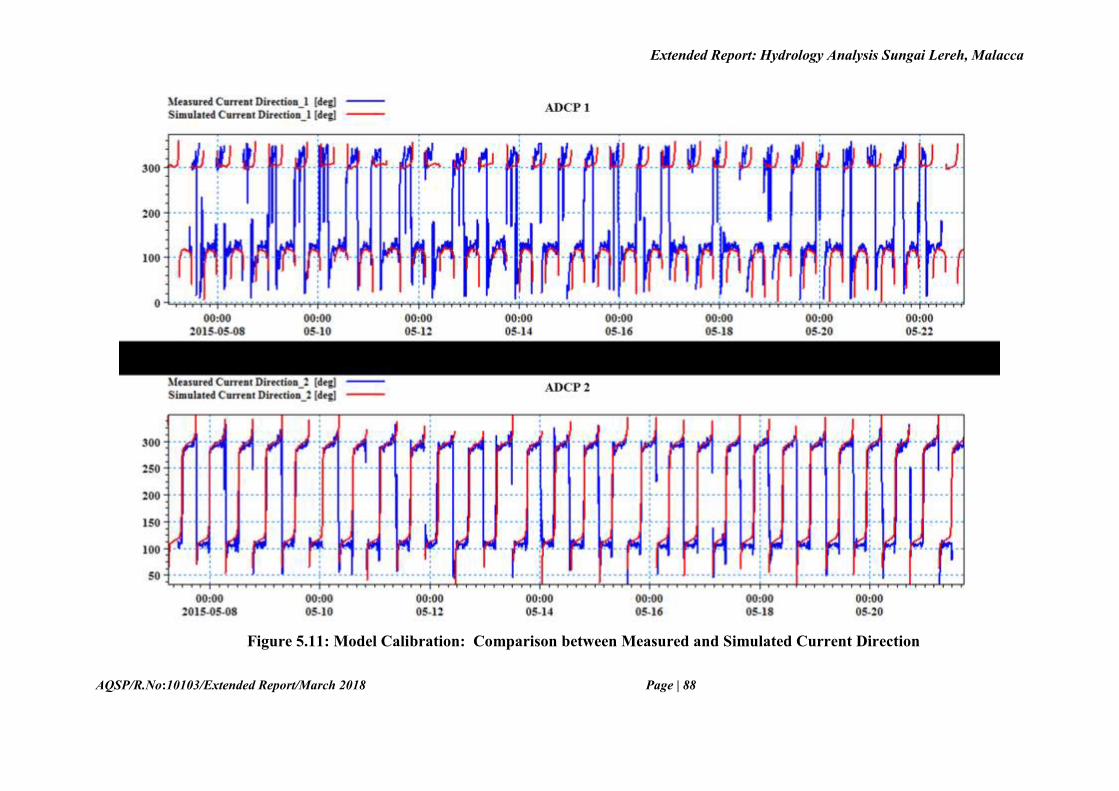
Extended Report: Hydrology Analysis Sungai Lereh, Malacca
AQSP/R.No:10103/Extended Report/March 2018 Page | 88
Figure 5.11: Model Calibration: Comparison between Measured and Simulated Current Direction

Extended Report: Hydrology Analysis Sungai Lereh, Malacca
AQSP/R.No:10103/Extended Report/March 2018 Page | 89
5.2 Hydrological Model
5.2.1 Introduction
Accurate calculation of rainfall runoff is essential to carry out hydrological model which finally
can be used for flood forecasting, drought analysis, flow availability and so on. There are a lot
of approaches to hydrologic forecasting that have been used in the last few decades. These can
be grouped into three categories (i) lumped conceptual models, (ii) models based on physical
distributions and (iii) empirical black box models. Lumped conceptual models require
substantial amounts of calibration data and also need extensive experience of the user to
implement and calibrate. On the other hand, physical distribution based models need a large
amount of data about topology, soil, vegetation and geological characteristics of the catchment
areas. However, the accuracy of empirical black box models requires good quality of observed
data and they are useful operational tools where there are not enough meteorological data
available [Bojkow 2001]. Precipitation distribution, evaporation, transpiration, abstraction,
watershed topography, and soil types are implicit and explicit factors which are affecting the
rainfall-runoff process in the modeling [Dawson et al., 2000].
The Rational Method [McPherson 1969], Soil Conservation Service- Curve Number Method
[Maidment 1993], and Green and Ampt Method [Green and Ampt 1991] are the widely known
rainfall runoff models identified. The Genetic Danish MIKE11 NAM (1972) is one of the
complex models identified which should provide better runoff estimation [Supiah and Normala
2002] and this model is used under this study.
MIKE11 NAM is a rainfall runoff model which is part of the MIKE11 RR module. It is a well-
proven engineering tool that has been applied to a number of catchments around the world
[Resfsgaard and Knudsen 1996, Thompson et al. 2004, Keskin et al.2007, Liu et al. 2007,
Kamel 2008 and Makungo et al. 2010], representing many different hydrological regimes and
climatic conditions.
The NAM (Nedbør Affstrømnings Model) is a deterministic, lumped conceptual rainfall-runoff
model which is originally developed by Technical University of Denmark [Beck 1987].
Lumped means the catchment regarded as one unit and parameters are averaged. A
mathematical hydrological model like NAM is a set of linked mathematical statements
describing, in a simplified quantitative form, the behavior of the land phase of the hydrological
cycle. NAM represents various components of the rainfall-runoff process by continuously

Extended Report: Hydrology Analysis Sungai Lereh, Malacca
AQSP/R.No:10103/Extended Report/March 2018 Page | 90
accounting for the water content in four different and mutually interrelated storages. Each
storage represents different physical elements of the catchment. NAM can be used either for
continuous hydrological modelling over a range of flows or for simulating single events. Based
on the meteorological input data NAM produces catchment runoff as well as information about
other elements of the land phase of the hydrological cycle, such as the temporal variation of
the evapotranspiration, soil moisture content, groundwater recharge, and groundwater levels.
The resulting catchment runoff is splited conceptually into overland flow, interflow and base
flow components. Figure 5.12 shows the flow diagram of NAM rainfall model.
Figure 5.12: Flow Diagram of Rainfall Runoff Model

Extended Report: Hydrology Analysis Sungai Lereh, Malacca
AQSP/R.No:10103/Extended Report/March 2018 Page | 91
5.2.2 Model Setup
In this study DHI’s MIKE 11 NAM module was adopted and developed for the whole Udang-
Lereh catchment (Figure 5.13) to calculate the contribution of rainfall runoff from each
catchment.
Figure 5.13: Catchment Distribution
Table 5.3: Available Rainfall Data
Sl.
No.
Station
No. Station District
Data availability
1 2221008
Pusat
Pertanian
Sungai Udang
Melaka January 1997 to December 2017
Parameters that were using in the model are as follows:
Parameters for surface root-zone
i. Maximum water content in surface storage (Umax)
ii. Maximum water content in root zone storage (Lmax)
iii. Overland flow runoff coefficient (CQOF)
iv. Time constant for interflow (CKIF)
v. Time constants for routing overland flow (CK1, 2)
vi. Root zone threshold value for overland flow (TOF)
vii. Root zone threshold value for inter flow (TIF)

Extended Report: Hydrology Analysis Sungai Lereh, Malacca
AQSP/R.No:10103/Extended Report/March 2018 Page | 92
Parameters for ground water
i. Time constant for routing baseflow (CKBF)
ii. Root zone threshold value for ground water recharge (Tg)
iii. Ratio of ground water catchment to topographical (surface water) catchment area
(Carea)
iv. Specific yield for the ground water storage (Sy)
v. Maximum ground water depth causing baseflow (GWLBF0)
vi. Seasonal variation of maximum depth
vii. Depth for unit capillary flux (GWLBF1)
viii. Abstraction
ix. Lower base flow. Recharge to lower reservoir (Cqlow)
x. Time constant for routing lower baseflow (Cklow)
5.2.3 Hydrodynamic Model
The physically based hydrodynamic modelling system MIKE11 has been used for carrying out
surface water modelling work under this study. MIKE 11 modelling system requires large
amount of high quality data including river channel bathymetry, water level and discharge
measurements. After a model is developed, it requires for undergoing a calibration phase. This
is done to determine its ability to reproduce phenomena actually observed in the field. This is
a trial and error process in which any deficiencies in the model setup and input data are rectified
and model elements fine-tuned until a reasonable agreement between simulation and
observation is achieved. After the model is calibrated, it is verified against known recent events
to ensure that the model is capable of simulating various hydrological scenarios correctly.
Figure 5.14 shows the tentative network of river network which has been used to develop
Hydrodynamic model.
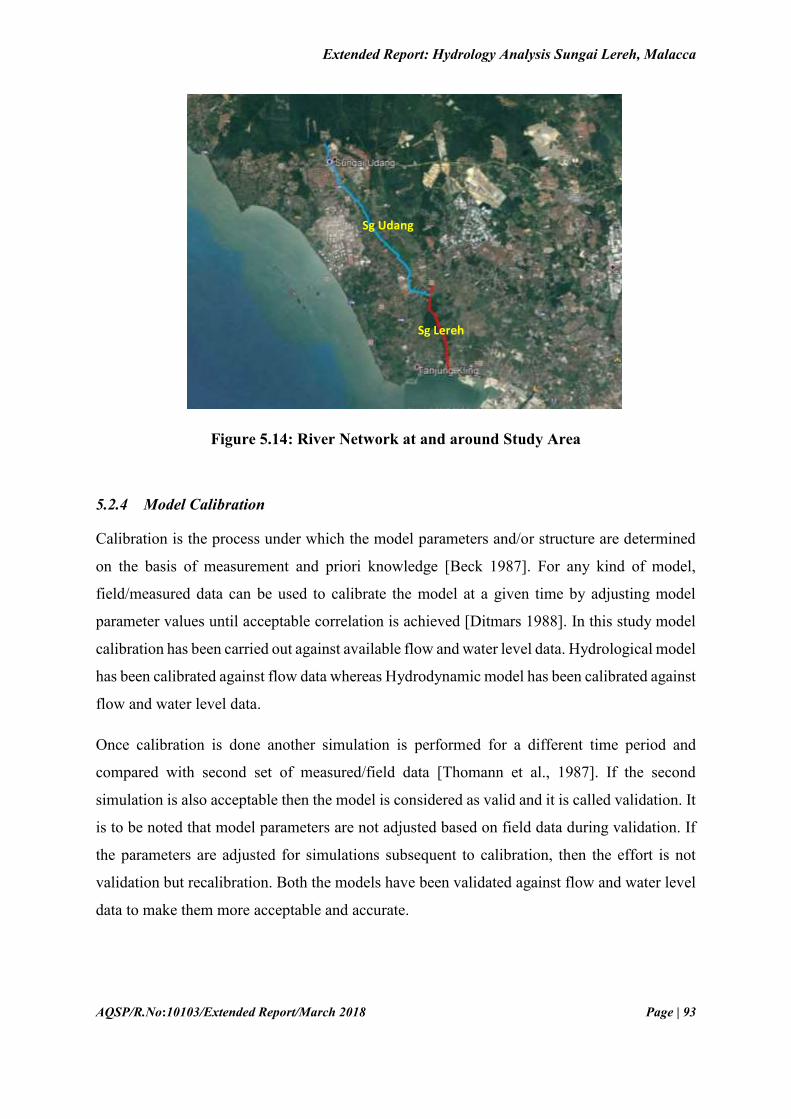
Extended Report: Hydrology Analysis Sungai Lereh, Malacca
AQSP/R.No:10103/Extended Report/March 2018 Page | 93
Figure 5.14: River Network at and around Study Area
5.2.4 Model Calibration
Calibration is the process under which the model parameters and/or structure are determined
on the basis of measurement and priori knowledge [Beck 1987]. For any kind of model,
field/measured data can be used to calibrate the model at a given time by adjusting model
parameter values until acceptable correlation is achieved [Ditmars 1988]. In this study model
calibration has been carried out against available flow and water level data. Hydrological model
has been calibrated against flow data whereas Hydrodynamic model has been calibrated against
flow and water level data.
Once calibration is done another simulation is performed for a different time period and
compared with second set of measured/field data [Thomann et al., 1987]. If the second
simulation is also acceptable then the model is considered as valid and it is called validation. It
is to be noted that model parameters are not adjusted based on field data during validation. If
the parameters are adjusted for simulations subsequent to calibration, then the effort is not
validation but recalibration. Both the models have been validated against flow and water level
data to make them more acceptable and accurate.
Sg Udang
Sg Lereh

Extended Report: Hydrology Analysis Sungai Lereh, Malacca
AQSP/R.No:10103/Extended Report/March 2018 Page | 94
5.2.5 Calibration Index
The quality indices used for comparing measurements, me, with values computed with a
hincast/forecast model, mo are
Bias
RMS
Bias Index, BI
Scatter Index, SI
And the correlation coefficient, ρ
For each valid measuremt, mei,, measured at time ti,, the corresponding model value, moi,, is
extracted from the model results, using linear interpolation between the model time steps before
and after ti
The quality indices are calculated as follows:
Notes to the quality parameters
The bias is the mean error

Extended Report: Hydrology Analysis Sungai Lereh, Malacca
AQSP/R.No:10103/Extended Report/March 2018 Page | 95
RMS is the Root Mean Square error. The RMS is not corrected for the bias, and unless
the bias is insignificant this parameter is difficult to interpret.
BI is a non-dimensional bias
SI, the Scatter index, is a non-dimensional RMS
ρ, is the correlation coefficient between two stochastic variables. The correlation co-
efficient reflects the degree to which the variation of the first is reflected in the variation
of the other variable.
5.2.6 Calibration Water Level and Current Speed
Hydrodynamic model was calibrated against water level and current speed collected at Station
TG-2 (Figure 5.15). Both water level and current speed calibration plots are furnished in Figure
5.16 and Figure 5.17 respectively. It is evident from both the figures that our simulated result
shows quite good agreement with measured data set. Calibration Index for both the cases was
also calculated and furnished in the Table 5.4. It also found from the table that both the
calibration fall under the criteria set by JPS which implies that our calibration is reliable.
Figure 5.15: Calibration point (TG-2)

Extended Report: Hydrology Analysis Sungai Lereh, Malacca
AQSP/R.No:10103/Extended Report/March 2018 Page | 96
Figure 5.16: Water level calibration at TG-2
Figure 5.17: Current speed calibration at TG-2

Extended Report: Hydrology Analysis Sungai Lereh, Malacca
AQSP/R.No:10103/Extended Report/March 2018 Page | 97
Table 5.4: Quality index and JPS Guideline
5.2.7 EXTREME VALUE ANALYSIS
5.2.7.1 Long-term Simulation of Hydrological Model
Historical rainfall data from 1997 to 2017 was collected for the study area and processed.
Annual total rainfall was calculated from the collected and furnished in the Figure 5.18. It is
evident from the figure that after 2003, the average annual rainfall was about 2000mm in the
study area. The Hydrological model was then simulated for this period (1997 – 2017) and
yearly maximum flow was calculated. The calculated yearly maximum flow is shown in the
Figure 5.19. The yearly maximum flow was then used to carry out the frequency analysis which
is furnished in the next section.
Figure 5.18: Annual Total Rainfall in the Study Area
Stations Item Period Quality
Index
JPS
Guideline
TG-2 Water Level February 2018 0.97 0.9
TG-2 Current Speed February 2018 0.92 0.8

Extended Report: Hydrology Analysis Sungai Lereh, Malacca
AQSP/R.No:10103/Extended Report/March 2018 Page | 98
Figure 5.19: Yearly Maximum Flow in the Study Area from Rainfall-Runoff
Contribution
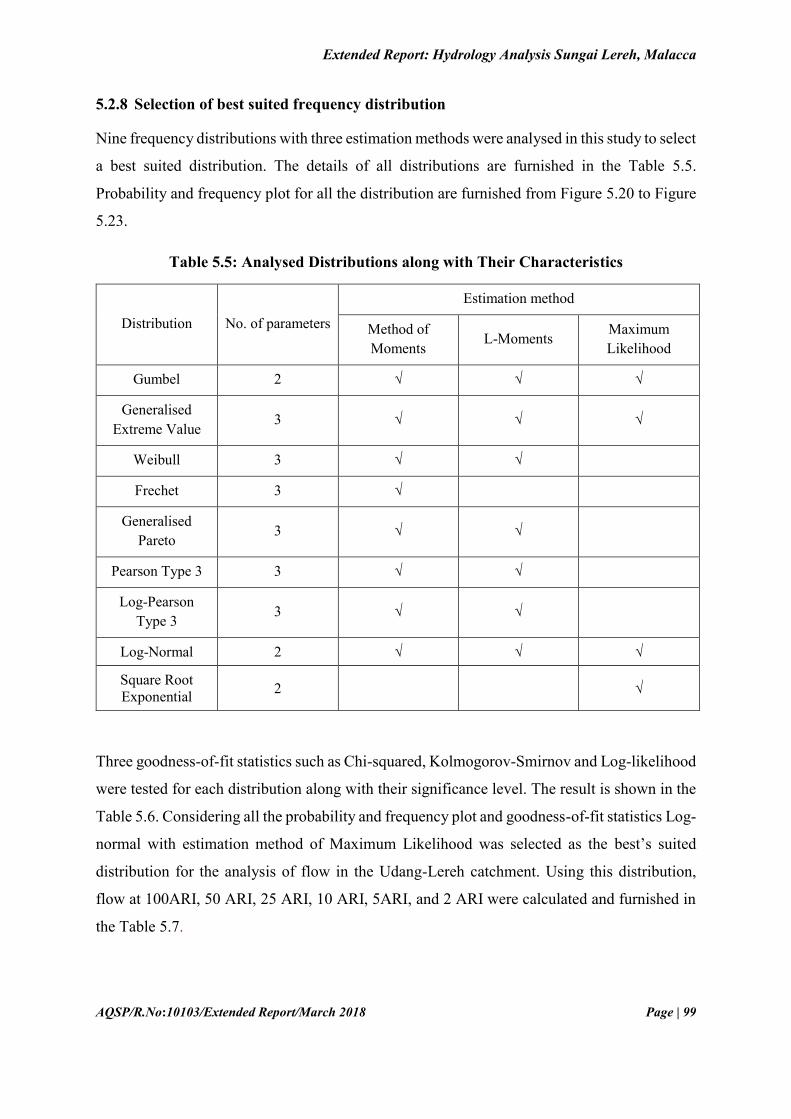
Extended Report: Hydrology Analysis Sungai Lereh, Malacca
AQSP/R.No:10103/Extended Report/March 2018 Page | 99
5.2.8 Selection of best suited frequency distribution
Nine frequency distributions with three estimation methods were analysed in this study to select
a best suited distribution. The details of all distributions are furnished in the Table 5.5.
Probability and frequency plot for all the distribution are furnished from Figure 5.20 to Figure
5.23.
Table 5.5: Analysed Distributions along with Their Characteristics
Distribution No. of parameters
Estimation method
Method of
Moments L-Moments
Maximum
Likelihood
Gumbel 2 √ √ √
Generalised
Extreme Value 3 √ √ √
Weibull 3 √ √
Frechet 3 √
Generalised
Pareto 3 √ √
Pearson Type 3 3 √ √
Log-Pearson
Type 3 3 √ √
Log-Normal 2 √ √ √
Square Root
Exponential 2 √
Three goodness-of-fit statistics such as Chi-squared, Kolmogorov-Smirnov and Log-likelihood
were tested for each distribution along with their significance level. The result is shown in the
Table 5.6. Considering all the probability and frequency plot and goodness-of-fit statistics Log-
normal with estimation method of Maximum Likelihood was selected as the best’s suited
distribution for the analysis of flow in the Udang-Lereh catchment. Using this distribution,
flow at 100ARI, 50 ARI, 25 ARI, 10 ARI, 5ARI, and 2 ARI were calculated and furnished in
the Table 5.7.

Extended Report: Hydrology Analysis Sungai Lereh, Malacca
AQSP/R.No:10103/Extended Report/March 2018 Page | 100
Table 5.6: Goodness-of-fit statistics using Chi-squared, Kolmogorov-Smirnov and Log-
likelihood
Probability distribution
Estimation method
Goodness-of-fit
Chi-squared Kolmogorov-
Smirnov Log-likelihood
value Level of
significance (%)
value Level of
significance (%)
value
Generalized Extreme
Value
Method of Moment
0.105 0 0.089 25
Maximum Likelihood
0.105 0 0.083 25
Method of L-moments
0.105 0 0.092 25
Gumbel
Method of Moment
0.105 0 0.097 25
Maximum Likelihood
0.105 0 0.79 25
Method of L-moments
0.105 0 0.093 25
Weibull
Method of Moment
0.737 0 0.131 25
Method of L-moments
0.737 0 0.106 25
Frechet Method of Moment
0.105 0 0.115 25
Generalised Pareto
Method of Moment
.737 0 0.14 25
Method of L-moments
0.737 0 0.12 25
Pearson Type 3
Method of Moment
0.737 0 0.124 25
Method of L-moments
0.737 0 0.102 25
Log-Pearson Type 3
Method of Moment
0.105 0 0.091 25
Method of L-moments
0.105 0 0.092 25
Log-normal
Method of Moment
0.105 0 0.090 25
Maximum Likelihood
0.105 0 0.083 25
Method of L-moments
0.105 0 0.091 25
Square-root Exponential
Maximum Likelihood
0.105 0 0.097 25

Extended Report: Hydrology Analysis Sungai Lereh, Malacca
AQSP/R.No:10103/Extended Report/March 2018 Page | 101
Figure 5.20: Frequency Plot and Probability Plot for Generalized Extreme Value (GEV)
and Generalized Pareto (GP)

Extended Report: Hydrology Analysis Sungai Lereh, Malacca
AQSP/R.No:10103/Extended Report/March 2018 Page | 102
Figure 5.21: Frequency Plot and Probability Plot for Gumble (GUM) and Log-Pearson
Type 3 (LP3)

Extended Report: Hydrology Analysis Sungai Lereh, Malacca
AQSP/R.No:10103/Extended Report/March 2018 Page | 103
Figure 5.22: Frequency Plot and Probability Plot for Log Normal (LN2) and Weibull
(WEI)

Extended Report: Hydrology Analysis Sungai Lereh, Malacca
AQSP/R.No:10103/Extended Report/March 2018 Page | 104
Figure 5.23: Frequency plot and Probability plot for Frechet (FRE), Pearson 3 (P3) and
Square-root Exponential (SQE)
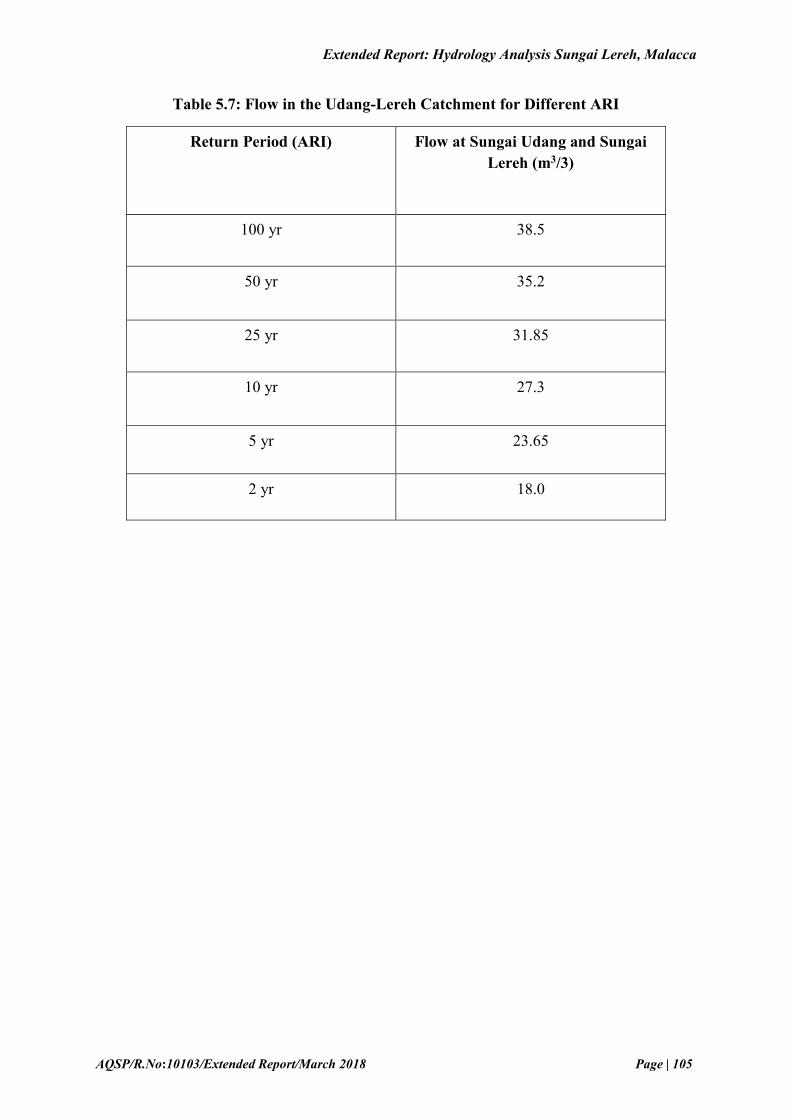
Extended Report: Hydrology Analysis Sungai Lereh, Malacca
AQSP/R.No:10103/Extended Report/March 2018 Page | 105
Table 5.7: Flow in the Udang-Lereh Catchment for Different ARI
Return Period (ARI) Flow at Sungai Udang and Sungai
Lereh (m3/3)
100 yr 38.5
50 yr 35.2
25 yr 31.85
10 yr 27.3
5 yr 23.65
2 yr 18.0

Extended Report: Hydrology Analysis Sungai Lereh, Malacca
AQSP/R.No:10103/Extended Report/March 2018 Page | 106
6.0 MODEL RESULTS
6.1 Coastal Modelling Scenarios
Hydrodynamic condition model were simulated for northeast monsoon and southwest
monsoon. Table 6.1 shows the model simulation for different scenarios. With the below table,
the model was simulated for a domain around Malacca for different scenarios viz., Scenario A
– Baseline condition comparing Scenario B – Reclamation (with floating piles) + Breakwater
(50m mouth distance). Two different monsoons were selected during this modelling study to
assess the impact of proposed reclamation work at Malacca. These monsoons were selected
based on the characteristics of wind and wave condition in the model boundaries.
Table 6.1: Model Simulation for Two Scenarios with Different Monsoon
Five boundary was defined as a boundary condition for the Sg Lereh, Malacca model area to
analyze the impact of the reclamation and breakwater which is propose by the project
proponent. This analyze had been requested by JPS to ensure there no post development impact
to the Sg. Lereh upstream zone. Few scenarios was considered for the analysis which is derived
from the ARI from Mike 11 as stated below:
Scenarios Monsoon Wind Speed (m/s) and
Direction (º) Conditions
Scenario-A
(Baseline Condition)
Northeast 5.5 m/s and 300º
Southwest 4.5 m/s and 150º
Scenario-B
(Reclamation with Breakwater )
(ARI : 5 years, 10 years, 25 years, 50
years and 100 years )
Northeast 5.5 m/s and 300º
Southwest 4.5 m/s and 150º

Extended Report: Hydrology Analysis Sungai Lereh, Malacca
AQSP/R.No:10103/Extended Report/March 2018 Page | 107
Table 6.2: ARI from Mike 11 Analysis
Return Period (ARI) Flow at Sg Lereh/ Sg Udang Upstream
(m3/3)
100 yr 38.5
50 yr 35.2
25 yr 31.85
10 yr 27.3
5 yr 23.65
2 yr 18.0
Three points chose for data extraction to compare the backwater effect along the Sg. Lereh
and Sg. Udang Down Stream, Mid-Stream and Up Stream as per shown below in Figure 6.1:
Figure 6.1: Data Extraction Boundary for Baseline Model

Extended Report: Hydrology Analysis Sungai Lereh, Malacca
AQSP/R.No:10103/Extended Report/March 2018 Page | 108
Figure 6.2: Data Extraction Boundary for Baseline Model
Table 6.3: Extracted Analysis Points for Backwater Effect
UTM Projection (48 N)
Extraction Points X Y
(Point 1) Down Stream 185734.7252364 245977.9886079
(Point 2) Mid-Stream 185084.2213261 247905.8233047
(Point 3) Up Stream 184357.1680674 248688.7491292
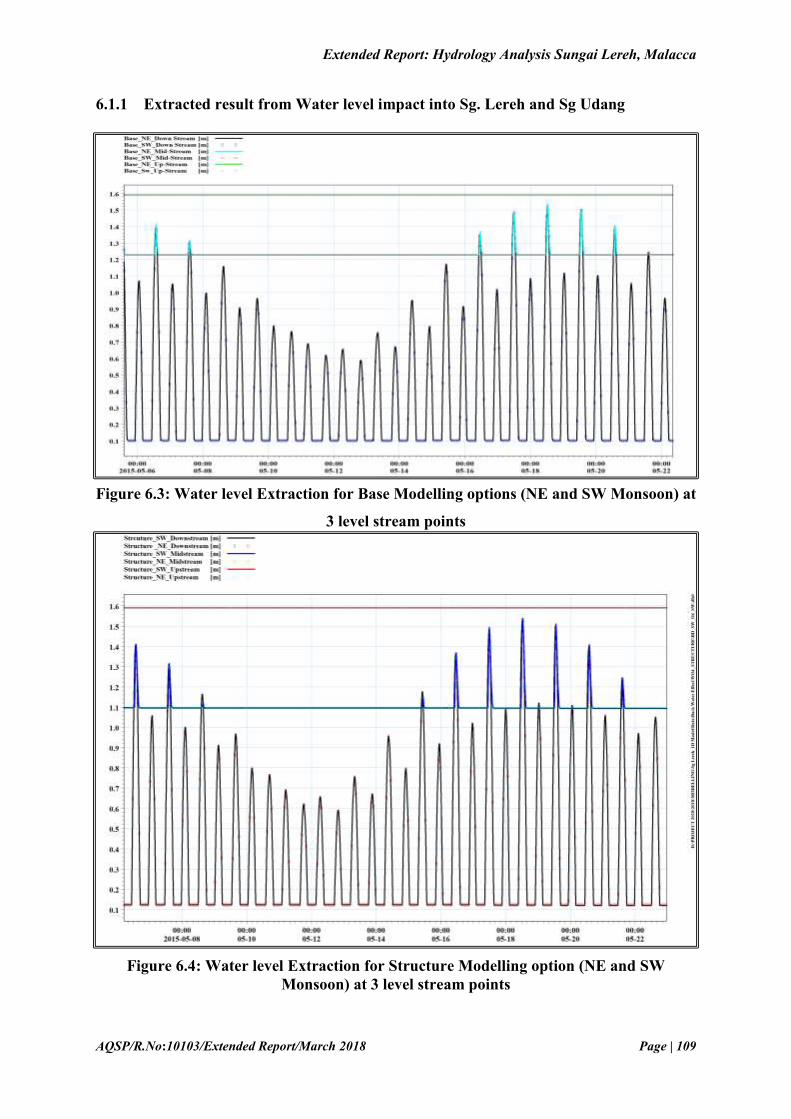
Extended Report: Hydrology Analysis Sungai Lereh, Malacca
AQSP/R.No:10103/Extended Report/March 2018 Page | 109
6.1.1 Extracted result from Water level impact into Sg. Lereh and Sg Udang
Figure 6.3: Water level Extraction for Base Modelling options (NE and SW Monsoon) at
3 level stream points
Figure 6.4: Water level Extraction for Structure Modelling option (NE and SW
Monsoon) at 3 level stream points

Extended Report: Hydrology Analysis Sungai Lereh, Malacca
AQSP/R.No:10103/Extended Report/March 2018 Page | 110
Figure 6.5: Water level Extraction comparison for Base and Structure modelling option
for NE Monsoon at 3 level stream points
Figure 6.6: Water level Extraction comparison for Base and Structure modelling option
for SW Monsoon at 3 level stream point
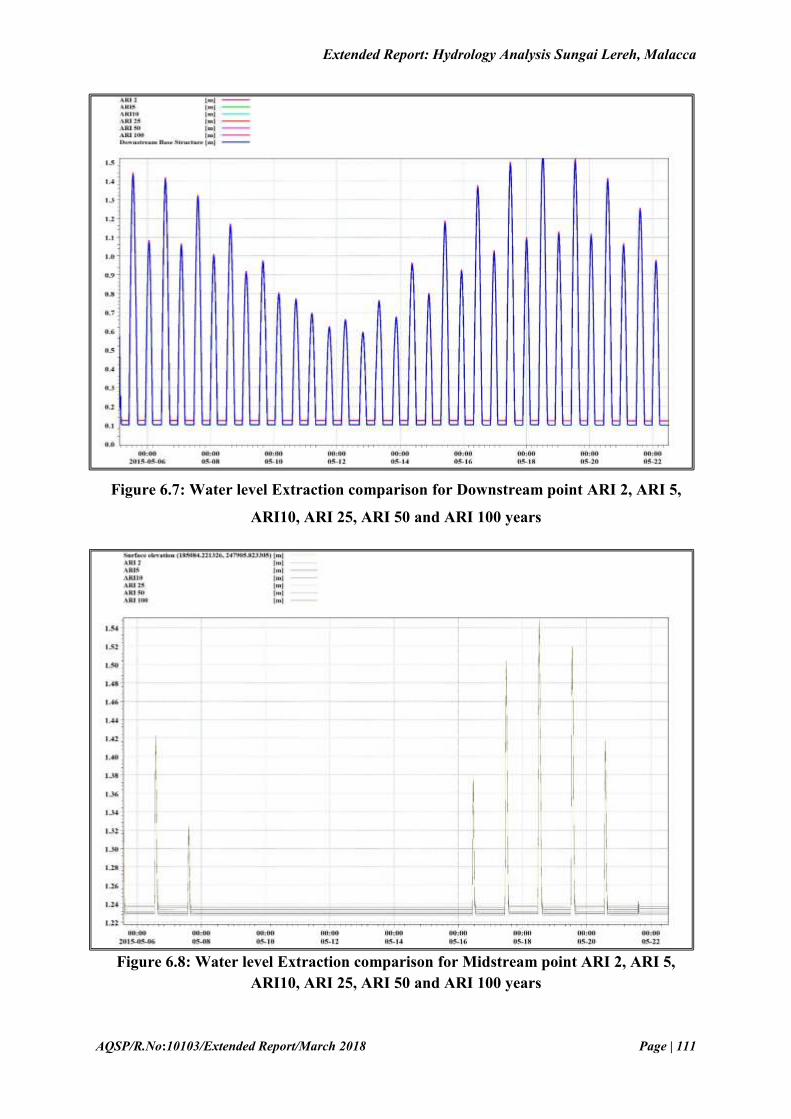
Extended Report: Hydrology Analysis Sungai Lereh, Malacca
AQSP/R.No:10103/Extended Report/March 2018 Page | 111
Figure 6.7: Water level Extraction comparison for Downstream point ARI 2, ARI 5,
ARI10, ARI 25, ARI 50 and ARI 100 years
Figure 6.8: Water level Extraction comparison for Midstream point ARI 2, ARI 5,
ARI10, ARI 25, ARI 50 and ARI 100 years

Extended Report: Hydrology Analysis Sungai Lereh, Malacca
AQSP/R.No:10103/Extended Report/March 2018 Page | 112
Figure 6.9: Water level Extraction comparison for Upstream point ARI 2, ARI 5,
ARI10, ARI 25, ARI 50 and ARI 100 years
Overall the 2D modelling findings shows there is no any major fluctuations of the backwater
flow into the Sg. Lereh due to the propose reclamation project and the breakwater. There are
very minor fluctuations happens at 1% - 2% at upstream area which id contribute about 1 mm
to 3mm which is very minimal changes.

Extended Report: Hydrology Analysis Sungai Lereh, Malacca
AQSP/R.No:10103/Extended Report/March 2018 Page | 113
6.2 Scenario simulation and result analysis from Hydrological modelling
From the frequency analysis, flow form Sg.Udang to Sg. Lereh catchment for different ARI
was calculated and furnished in the Table 6.2. On the other hand, the tidal characteristics at the
mouth of Sg Lereh is presented in the following table (Table 6.4). Based on the data on Table
6.2 and Table 6.4, three worst case has been devised and furnished in the Table 6.5
Table 6.4: Tidal Characteristics at the Outfall of Sg Lereh.
Tidal level Elevation in
NGVD (m)
Elevation in LAT /
CD (m)
Highest Astronomical Tide (HAT) 1.56 2.65
Mean High Water Spring (MHWS) 1.01 2.10
Mean High Water Neap (MHWN) 0.42 1.51
Mean Sea Level (MSL) 0.10 1.19
National Geodetic Vertical Datum (NGVD) 0.00 1.09
Mean Low Water Neap (MLWN) -0.21 0.88
Mean Low Water Spring -0.80 0.29
L.A.T / Chart Datum -1.09 0.00
Table 6.5: Worst Scenarios
Scenarios Water Level at the outfall
of Sg Lereh
Flow from the Udang-Lereh
catchment
Scenario-1 HAT: 1.56 mNGVD ARI 100: 38.5 m3
Scenario-2 MHWS: 1.01 mNGVD ARI 100: 38.5 m3
Scenario-3 HAT: 1.56 mNGVD ARI 50: 35.2 m3
All the three scenarios are simulated and maximum water level along the Udang and Lereh
river has been calculated. All the results are furnished from Figure 6.10 to Figure 6.12
respectively. It is found from the figures that maximum water level varies from 14 mNGVD to
6 mNGVD within the first 2km length of Udang river. After that within 3km length it varies
from 6mNGVD to 4mNGVD. After 6.5 km it reaches to a stable water level about 2mNGVD.

Extended Report: Hydrology Analysis Sungai Lereh, Malacca
AQSP/R.No:10103/Extended Report/March 2018 Page | 114
Figure 6.10: Maximum Water Level along the River Udang and Lereh for Scenario-1
Figure 6.11: Maximum Water Level along the River Udang and Lereh for Scenario-2
Figure 6.12: Maximum Water Level along the River Udang and Lereh for Scenario-3
Outfall of Sg Lereh
Sg Udang (0m to 7000m) Sg Lereh
(600m to 3250m)
HAT: 1.56 mNGVD ARI 100: 38.5 m3
Outfall of Sg Lereh
Sg Udang (0m to 7000m) Sg Lereh
(600m to 3250m)
MHWS: 1.01 mNGVD
ARI 100: 38.5 m3
Outfall of Sg Lereh
Sg Udang (0m to 7000m) Sg Lereh
(600m to 3250m)
HAT: 1.56 mNGVD
ARI 50: 35.2 m3

Extended Report: Hydrology Analysis Sungai Lereh, Malacca
AQSP/R.No:10103/Extended Report/March 2018 Page | 115
7.0 CONCLUSION
The main objective of the study is to assess the water level in the Udang-Lereh river system
while a characterized flow comes from upstream and a higher tide level occurs in the
downstream. To carry out the study a Hydrological and a hydrodynamic model have been
developed and simulated. Hydrological model was simulated for about 20 years to get yearly
maximum flow in the study area for frequency analysis. Flow in the Udang-Lereh catchment
for different ARI was calculated using that yearly maximum flow. After that tidal
characteristics at the out fall of the Lereh river was collected from primary sources. Finally,
three worst case scenarios were devised based on different ARI flow and tidal characteristics
at the outfall of Lereh River. All the cases were simulated and analysed. It is found from the
figures that maximum water level varies from 14 mNGVD to 6 mNGVD within the first 2km
length of Udang River. After that within 3km length it varies from 6mNGVD to 4mNGVD.
After 6.5 km it reaches to a stable water level about 2mNGVD.
This finding show us that the propose breakwater and the reclamation project does not
contributing any back water flow impact at the upstream of the Sg. Lerah and Sg. Udang.