expression of thanks - montanuniversität leoben
TRANSCRIPT
EIDESSTATTLICHE ERKLÄRUNG
Ich erkläre an Eides statt, dass ich diese Arbeit selbständig verfasst, andere als die angegebenenQuellen und Hilfsmittel nicht benutzt, und mich auch sonst keiner unerlaubten Hilfsmittel bedient habe.
Ich erkläre, dass ich die Richtlinien des Senats der Montanuniversität Leoben zu "Gutewissenschaftliche Praxis" gelesen, verstanden und befolgt habe.
Weiters erkläre ich, dass die elektronische und gedruckte Version der eingereichtenwissenschaftlichen Abschlussarbeit formal und inhaltlich identisch sind.
Datum 09.07.2021
Unterschrift Verfasser/inMichael Christian Bernhard
EXPRESSION OF THANKS
PhD thesis Michael Bernhard I
Expression of thanks
First of all, I would like to thank Univ.-Prof. Dipl.Ing. Dr.techn. Johannes Schenk for providing
the possibility to write my PhD thesis at the Chair of Ferrous Metallurgy.
The supervision of my PhD thesis and the valuable feedback of Assoc.Prof. Dipl.Ing. Dr.mont.
Susanne Michelic and Univ.-Prof. Dipl.Ing. Dr.mont Helmut Clemens during my research work
is greatly acknowledged.
A special thanks goes to my colleague and friend Dipl.Ing. Dr.mont. Peter Presoly who
introduced me to the wide field of thermal analysis techniques and showed me what the term
“careful” means with respect to experiments in the laboratory. Beside our intensive technical
discussions, I enjoyed our talks on daily news and the valuable time we spent outside of work.
Further, I would like to thank my project partners Dr. Susanne Hahn from primetals
technologies Austria GmbH and Dr. Sergiu Ilie from voestalpine Stahl GmbH for the trust in
my research and showing me the industrial relevance of my project work. I’m looking forward
to further collaborations with you.
Prof. Youn-Bae Kang from Graduate Institute of Ferrous Metallurgy at Pohang University of
Science and Technology (South Korea) introduced me to computational thermochemistry and
the CALPHAD approach. Thank you for the extensive supervision of the modelling work, I
really enjoyed the time of my research stay at École polytechnique de Montréal (Canada)!
I would like to thank our engaged crew in the melting shop: Michael Jäger, Anton Reitbauer,
Ewald Suchadolnik and Gerhard Winkler. It is not self-evident to perform complex solidification
experiments and having a good time at once.
EXPRESSION OF THANKS
PhD thesis Michael Bernhard II
Without the extensive metallographic work of Bernhard Gerstl, Bernd Lederhaas, Tobias
Rieger and Nadine Tatzreiter, only a small fraction of the present results would be created.
Franz Prucha from voestalpine Stahl Linz GmbH performed the chemical analysis of all
samples in an outstanding manner. Thank you for sharing your expertise on analytics with me!
My colleagues and friends Michael Lammer, Dipl.Ing. Dr.mont. Lukas Preuler and Paul
Reisinger not only helped me in my working life but also we pushed our fitness to the physical
limit. I really don’t want to miss our hiking trips and joint mountain runs!
Last but not least I gratefully thank my family - my parents, my grandparents and my girlfriend
- for all the support I got through my whole life and during my study time. The good mood of
my mother always put a smile on my face, even in the worst moments of preparing myself for
a tough examination. My father is not only the person who inspired me as a role model with
the passion he has for solving scientific problems but is also the friend I can talk to in any -
private or profession - situation of my life.
KURZFASSUNG
PhD thesis Michael Bernhard III
Kurzfassung
Im Allgemeinen wird Phosphor als unerwünschtes Begleitelement und als Schädling bei der
Stahlherstellung betrachtet. Während der Erstarrung führt die starke Anreicherung von
Phosphor in der interdendritischen Schmelze zu einer deutlichen Absenkung der
Solidustemperatur. Die auftretende Seigerungstendenz ist dabei von der Erstarrungsabfolge
im Peritektikum des Fe-C Diagramms abhängig und nimmt mit steigendem Kohlenstoffgehalt
zu. Die signifikante Aufweitung des Erstarrungsintervalls führt in weiterer Folge zu einer
erhöhten Heißrissempfindlichkeit des Stahls.
Heutzutage wird Phosphor trotz seiner negativen Auswirkungen auf die Produktqualität
spezifisch als kostengünstiges Legierungselement im Stahl verwendet. Beispielsweise wirkt
Phosphor als effektiver Mischkristallverfestiger und verbessert die elektrischen Eigenschaften
von siliziumhaltigen Elektroblechen. In phosphorlegierten Stahlgüten liegt der
Leigerungsgehalt bei 0.10 % und ist damit deutlich höher als in der Stahlherstellung
üblicherweise angestrebt: Hochreine Stähle enthalten weniger als 0.01 %P während die
Toleranz bei Baustählen mit einem Maximalwert von 0.05 % etwas großzügiger ausgelegt
wird.
Im Stranggießprozess wird der erstarrende Strang hohen mechanischen Belastungen
ausgesetzt, welche durch Ausbauchung, Biegen und Richten des Strangs sowie durch
thermische Gradienten innerhalb der Strangschale entstehen. Zugspannungen an der
Erstarrungsfront können in Kombination mit der erhöhten Heißrissbildungsneigung von
phosphorlegierten Stählen zu einer deutlichen Beeinträchtigung der Produktqualität führen.
Die Anpassung der Prozessparameter für das Vergießen von phosphorlegierten Stählen ist
daher von größter Bedeutung. Für die erfolgreiche Optimierung der Gießparameter ist dabei
KURZFASSUNG
PhD thesis Michael Bernhard IV
die exakte Kenntnis von Phasenumwandlungstemperaturen und thermodynamischen Daten
des Stahls unumgänglich.
In der vorliegenden Arbeit wurde daher der Einfluss von Phosphor auf die Hochtemperatur-
phasenumwandlungen von Stahl anhand des Fe-P Phasendiagramms sowie mehrerer
vertikaler Schnitte im ternären Fe-C-P System untersucht. Fokus lag hierbei auf der Bedeutung
für den Stranggießprozess. Im experimentellen Teil wurden die in-situ Techniken der
Dynamischen Differenzkalorimetrie (DSC), der Hochtemperatur-Laserscanning-
Konfokalmikroskopie (HT-LSCM), der Hochtemperatur-Röntgenbeugung (HT-XRD) und der
Dilatometrie zur Bestimmung der Umwandlungstemperaturen eingesetzt. Neben der
klassischen DSC-Analyse wurde ein neuartiger Ansatz zur Kopplung von DSC und HT-LSCM
Beobachtungen entwickelt, um die Phasengrenzlinien des geschlossenen „γ-loops“ im binären
Fe-P System zu rekonstruieren. Unter Berücksichtigung der neu gewonnenen experimentellen
Erkenntnisse wurde eine CALPHAD-basierende (Calculation of Phase Diagrams),
thermodynamische Optimierung des Fe-P und Fe-C-P durchgeführt. Erstmals erfolgte die
Beschreibung der Flüssigphase in diesem Legierungssystem mit dem modifizierten
quasichemischen Modell (MQM). Die experimentellen Daten sowie die thermodynamischen
Berechnungen konnten genutzt werden, um ein Mikroseigerungsmodell zur Beschreibung der
Erstarrung von Stahl unter stranggießähnlichen Bedingungen zu verbessern. Spezieller Fokus
lag hierbei auf phosphorlegierten Stählen.
ABSTRACT
PhD thesis Michael Bernhard V
Abstract
Phosphorus is generally known as harmful element in steel. During the solidification, P
strongly segregates in the interdendritic liquid leading to a significant drop of the solidus
temperature. Depending on the solidification sequence in the peritectic range of the Fe-C
based, multicomponent phase diagram the segregation tendency increases with higher
amount of carbon. As a consequence, even small amounts of P favour the hot tear formation
in technological solidification processes. However, in recent steel design, P is added as
alloying element to improve the physico-mechanical properties of advanced steel grades. In
so called “rephosphorized” steels, the maximum P content exceeds 0.10 mass percent and is
far higher than the typical concentration of P < 0.010% in high-quality steels or P < 0.05 % in
construction steels.
In the continuous casting process, mechanical stresses are exerted on the solidifying shell due
to bulging, bending/straightening and thermal gradients. In combination with the increased hot
tear sensitivity of highly P-alloyed steels, the tensile stresses along the solidification front may
cause serious internal defects and special care has to be taken in optimizing the process
parameters for casting rephosphorized steels. However, beside the precise knowledge of the
actual process conditions, accurate phase diagram data and thermodynamic properties of the
steel are required for a successful process control during casting.
In the present PhD thesis, the effect of phosphorus on high-temperatures phase
transformations with respect to the continuous casting process was therefore studied by
investigating the binary Fe-P and ternary Fe-C-P key-systems. In the experimental part various
in-situ techniques of differential scanning calorimetry (DSC), high-temperature laser scanning
confocal microscopy (HT-LSCM), high-temperature X-ray diffraction (HT-XRD) and dilatometry
were applied to characterize the phase transformation temperatures and phase stabilities. In
ABSTRACT
PhD thesis Michael Bernhard VI
addition to classical DSC analysis of high-temperature phase equilibria, a novel approach of
coupling DSC analysis and HT-LSCM observations was developed to characterize the “γ-loop”
in the Fe-P system. CALPHAD-type (Calculation of Phase Diagrams) thermodynamic
optimizations of the Fe-P and Fe-C-P systems were carried out considering the newly gained
phase diagram data. For the first time, the modified quasichemical model (MQM) was applied
for the liquid phase in this alloying system. Finally, the experimental data and the improved
thermodynamic assessment were used to further develop a microsegregation model for
calculation of solidification close to continuous casting conditions with particular focus on
rephosphorized steels.
TABLE OF CONTENTS
PhD thesis Michael Bernhard VII
Table of contents
Expression of thanks ............................................................................................. I
Kurzfassung ......................................................................................................... III
Abstract ................................................................................................................ V
Table of contents ............................................................................................... VII
1 Introduction .................................................................................................... 1
2 State of the art ................................................................................................ 3
2.1 Phosphorus in steel ................................................................................................. 3
2.1.1 Relevance of phosphorus in recent design of advanced steel grades ........................ 4
2.1.2 Phase stabilities in the Fe-P and Fe-C-P systems ...................................................... 5
2.1.2.1 The binary Fe-P phase diagram .............................................................................. 6
2.1.2.2 Phase equilibria in the ternary Fe-C-P system ........................................................ 9
2.1.3 Aspects of continuously casting rephosphorized steel grades .................................. 13
2.1.3.1 Continuous casting and product quality: A brief introduction................................. 13
2.1.3.2 Segregation of phosphorus on microscopic scale ................................................. 15
2.1.3.3 Influence of phosphorus on hot tear formation ...................................................... 23
2.2 Computer coupling of phase diagrams and thermochemistry .............................. 25
2.2.1 Computational thermodynamics: The CALPHAD approach ...................................... 26
2.2.2 Thermodynamic modelling of solutions ..................................................................... 29
2.2.2.1 Gibbs-energy of pure elements and stoichiometric compounds............................ 30
2.2.2.2 Bragg-Williams (BW) model and compound-energy formalism (CEF) .................. 30
2.2.2.3 Modified quasichemical model (MQM) for short-range ordering (SRO) ................ 32
TABLE OF CONTENTS
PhD thesis Michael Bernhard VIII
2.2.2.4 Thermodynamic assessments of the Fe-P and Fe-C-P systems .......................... 35
2.2.3 Application of a CALPHAD-based tool to the continuous casting process ................ 37
3 List of publications ....................................................................................... 41
4 Novel research findings and discussion .................................................... 44
4.1 Experimental reassessment of the binary Fe-P phase diagram and Fe-C-P key systems using DSC (Paper I) ............................................................................................... 45
4.2 Thermodynamic modelling of the Fe-P and Fe-C-P system using the MQM for the liquid phase (Paper II) .......................................................................................................... 48
4.3 A novel approach for in-situ characterization of γ-loops by coupling DSC and HT-LSCM: Application to the binary Fe-P system (Publication III) ............................................ 51
4.4 Development of a microsegregation model for the continuous casting process with special focus on rephosphorized steels (Paper IV-V) .......................................................... 55
4.4.1 General model description ........................................................................................ 56
4.4.2 Determination of the partition coefficients kPδ,γ from Paper I and II ........................... 59
4.4.3 Assessment of analytical liquidus equations for steel and incorporating the start of the peritectic reaction into the model .................................................................................................. 61
5 Summary and conclusion ............................................................................ 64
Bibliography ........................................................................................................ 66
Appendix: Publications ...................................................................................... 83
INTRODUCTION
PhD thesis Michael Bernhard 1
1 Introduction
Today, continuous casting is the most dominating casting process in the steelmaking
industry. The process is characterized by its cost-efficiency and provides the possibility of
manufacturing a wide range of steel grades. More than 96 % [1] of the annual steel production
is continuously cast to billets, blooms or slabs. Billets and blooms are the starting materials for
long products, e.g. wire rods and rails whereas slabs are typically further processed to heavy
plates and steel sheets for the automotive sector.
In order to guarantee a successful process control, detailed information on the solidification
behaviour of the steel grade is required. Many continuously casted steels contain less than
0.60 mass percent of carbon and solidify in the peritectic part of the Fe-C based,
multicomponent phase diagram. Depending on the chemical composition, the different phase
transformation paths are characterized by unique solidification phenomena occuring within the
casting process. The pre-identification of the ferrite (δ-Fe) and austenite (γ-Fe) phase
stabilities in the peritectic range as well as the precise knowledge of liquidus and solidus
temperatures are therefore of great importance in order to adjust the practical operation
parameters. For instance, increased trace levels of strongly segregating elements like
phosphorus decrease the solidus temperature and favour hot tearing in the liquid + solid two-
phase region. As a consequence, the secondary cooling strategy, the casting speed and
position of the softreduction have to be modified avoiding the formation of defects in the
solidifying strand.
Aim of the PhD work was therefore to experimentally and to thermodynamically investigate the
influence of phosphorus on high-temperature phase transformations in steel with respect to
the continuous casting process. For this purpose, various in-situ experimental techniques were
applied including differential scanning calorimetry (DSC), high-temperature laser scanning
INTRODUCTION
PhD thesis Michael Bernhard 2
confocal microscopy (HT-LSCM), high-temperature X-ray diffraction (HT-XRD) and
dilatometry. The newly gained phase diagram data were further processed in a CALPHAD-
type (Calculation of Phase Diagrams) thermodynamic modelling of the binary Fe-P and ternary
Fe-C-P systems. Finally, the results were implemented into an in-house microsegregation
model for solidification calculation of steel under conditions close to continuous casting.
Though the influence of phosphorus on phase equilibria in steel was frequently studied in the past, this research field is “again” of great interest for the iron and steelmaking community. In
recent steel design, P is added as alloying element in order to improve several physico-
mechanical properties of advanced steel grades. In so called “rephosphorized” steels, the
maximum P content partly exceeds 0.10 mass percent, which is far higher than the typical
trace element level of P < 0.01 % in high-quality steels or P < 0.05 % in steels for constructural
applications.
The present cumulative-type PhD thesis is structured into two main parts. The first section
summarizes the state of the art and deals with challenges in continuous casting of steels with
high amount of phosphorus. Aspects of applying computational thermodynamics in process
modelling are also discussed in this chapter. The second part highlights the novel research
findings of the present work and contains the peer-reviewed papers published within the
project of the PhD thesis.
STATE OF THE ART
PhD thesis Michael Bernhard 3
2 State of the art
This chapter emphasises the need of ongoing research activities to characterize the
influence of phosphorus on high-temperature phase transformations in steel with special focus
on the continuous casting process. The first part deals with the general role of phosphorus as
alloying element in advanced steels. Then, aspects of casting of rephosphorized steels are
discussed based on the binary Fe-P and ternary Fe-C-P phase diagrams. Finally, potentials of
computational thermodynamics in modelling the casting process are presented considering
the CALPHAD approach and optimizations of the Fe-C-P system.
2.1 Phosphorus in steel
Phosphorus is generally known to be a harmful element in steel. During the solidification, P
strongly segregates in the liquid phase and even low amounts (0.01 - 0.03 %) may seriously
affect the product quality in the continuous casting process. Further, the phosphorus impurity
level is relevant to consider in the heat treatment processing of low-alloyed Q(uenched) &
T(empered) steel grades. Particularly for Mn-, Mn-Cr and Cr-Ni steels, long holding times
between 350 - 600 °C [2,3] or slow cooling through this critical temperature range favor the
segregation of impurities (P, Sb, Sn and As) to (prior austenite) grain boundaries [3] during
tempering. This effect is well-known as “temper embrittlement” and leads to a loss of ductility
and an increase of the brittle-ductile transition temperature in the final product. It was shown
by various researchers [2,4,5] that the grain boundary segregation of P raises the sensitivity
of steel to temper embrittlement at already low impurity levels (P ≥ 0.02 %).
STATE OF THE ART
PhD thesis Michael Bernhard 4
2.1.1 Relevance of phosphorus in recent design of advanced steel grades
Despite its negative effects on steel, phosphorus is specifically added in recent material
design with concentrations up to 0.15 mass percent as P shows beneficial influence on
selected material properties of advanced steel grades. Highly P-alloyed steels are known as
“rephosphorized grades”, their applications and typical P contents are briefly summarized as
follows, see also attached Papers I-III:
• High-strength interstitial-free (HSIF) and Ultra-Low-Carbon (ULC) steels are widely used
in the automotive sector. The low carbon and nitrogen contents (< 0.003 %) guarantee
superior deep drawability required for a high surface quality of exterior skin parts. Typically,
solution hardening elements such as Mn, Si and P are added to IF steels contributing to
increased strength values. [6] Among these elements, phosphorus has been proven as
most effective in the steel matrix. [7] Alloying of 0.085 mass pct. increase the yield strength
by 60 MPa and the tensile strength by 80 MPa [8]. Further, it was reported [9] that
phosphorus can contribute to the bake hardening (BH) effect in ULC-BH steel grades.
• Transformation-Induced-Plasticity (TRIP) steel grades belong to the group of advanced
high strength steels (AHSS) being applied for crash-relevant components in automotive
engineering. The microstructure consists of about 60 vol. % ferrite, 25 vol. % bainite
balanced with ~ 15 vol. % retained austenite. [10] Alloying elements such as Si, Al and P
suppress the precipitation of carbides (Fe3C) and stabilize the retained austenite at room
temperature. During final forming, the metastable austenite transforms into martensite
leading to an excellent combination of strength and ductility. [10] In TRIP steels,
phosphorus partly substitutes silicon and aluminum. Amounts of about 0.10 mass pct. are
considered to show beneficial influence on the TRIP effect. [11,12]
• Instead of plain carbon steels, weathering steels with improved atmospheric resistance are
often used in structural application. Alloying of minor amounts of Cr, Ni, Si, P and Cu
promote the formation of a stable rust layer under long-term use in corrosive atmospheric
environment. Therefore, coating or painting of the components is not required. [13,14] The
maximum P content of weathering steels is defined by 0.15 %. [13–15]
• In silicon steel sheets for electrical applications (Si-steel) it was shown that alloying of
phosphorus with amounts up to 0.10 mass pct. improve the crystallographic texture and
reduce the core loss [16,17]. Within the current energy evolution, these steel grades attract
much attention due to their application in transformer technology and electrical motors.
STATE OF THE ART
PhD thesis Michael Bernhard 5
2.1.2 Phase stabilities in the Fe-P and Fe-C-P systems
Phase diagrams can be seen as a roadmap for developing new materials. Many product
properties and process relevant issues are closely related to the corresponding phase
diagrams. In order to describe the physical-chemical influence of phosphorus in the steel
matrix, the precise knowledge of the binary Fe-P and ternary Fe-C-P key systems are of great
importance. Hence, this chapter provides an overview of available experimental data based
on the work of Okamoto [18] and Perrot [19] and introduces the general constitution of the Fe-
P and Fe-C-P systems.
According to Okamoto [18], nine phases are stable in the binary Fe-P system: The stability of
three solution phases - liquid, body centered cubic ferrite (bcc or α/δ-Fe) and face centered
cubic austenite (fcc or γ-Fe) - as well as the existence of three stoichiometric compounds -
Fe3P, Fe2P and FeP - was confirmed in previous work. Though the existence of higher order
phosphides (FeP2 and FeP4) was reported in references [20–23], the exact phase boundaries
in the P-rich part are still unknown [18] as no reliable experimental data are available at
compositions higher than that of the FeP compound (P ~ 35 mass pct.). The high volatilization
of P makes experimental investigations in the P-rich region quite challenging. [24] For pure
phosphorus the most common form is white P (or α-P). [18] The ternary Fe-C-P system
comprises 11 phases including the nine phases from the Fe-P phase diagram as well as the
metastable cementite (Fe3C) and stable C (graphite) from the Fe-C system. No ternary phases
were reported in the Fe-C-P system. All phases found under atmospheric pressure conditions
are summarized in Table 1 along with crystallographic data (Pearson symbol, space group,
Strukturbericht designation and the corresponding prototype).
Numerous experimental techniques were applied to characterize the Fe-P and Fe-C-P phase
diagrams (see Table 2 and Table 3): (i) “Thermal analysis” is based on the enthalpy change
during the investigated phase transformation and was frequently used to study melting
equilibria, (ii) “thermo-magnetic analysis” is of particular relevance for determining solid-state
phase equilibria between austenite and ferrite taking into account the different magnetic
susceptibility of bcc and fcc above the Curie temperature and (iii) “equilibration methods” are
performed by heat-treating the samples at elevated temperatures. After chemical and thermal
equilibration the specimen is quenched in ice-water to stabilize the high-temperature
microstructure down to room temperature. The final phase analysis is done either by optical
microscopy or electron probe microanalysis (EPMA). Extensive discussion on the reliability of
the phase diagram data with particular focus on liquid/solid equilibria can be found in Paper I; Paper III deals in detail with the analysis of the solid state ferrite/austenite phase equilibrium
STATE OF THE ART
PhD thesis Michael Bernhard 6
data. Beside the phase diagram data, measurements of the thermodynamic properties
(activities, enthalpies, etc.) and previous thermodynamic descriptions were critically evaluated
within the CALPHAD-type optimization in Paper II.
For graphical representations of phase diagrams in this section, the thermodynamic
descriptions of the Fe-P system according to Shim et al. [25], Miettinen and Vassilev [26] and
You and Jung [27] were implemented into the FactSage 8.0 thermochemical software [28].
From literature, two parameter sets for the Fe-C-P system are available from Gustafson [29]
and Shim et al. [30]; the more recent work of Shim et al. [30] was used in the present chapter.
Table 1: Stable phases in the ternary Fe-C-P system along with crystallographic data [18,19,31]
Phase Pearson symbol Space group Strukturbericht Prototype
Liquid - - - -
(γFe) cF4 Fm3�m A1 Cu
(αFe), (δFe) cI2 Im3�m A2 W
Fe3P tI32 I4� D0e Ni3P
Fe2P hP9 P6�2m C22 Fe2P
FeP oP8 Pna21 - MnP
FeP2 oP6 Pnnm C18 FeS2 (marcasite)
FeP4 mP30 P21/c - FeP4
(P) white c** - - (P) white
Fe3C oP16 Pnma D011 Fe3C
C (gr.) hP4 P63/mmc A9 C (gr.)
2.1.2.1 The binary Fe-P phase diagram
First experimental investigations of the Fe-P phase diagram started already at the beginning
of the 20th century by Stead [32] and Gercke [33]. Saklatwalla [34] and later, Konstantinow [35]
reconstructed the phase diagram up to ~ 25 mass pct. by evaluating cooling curves of thermal
analysis. Haughton [36] combined thermal analysis, magnetic measurements and
metallographic examination to identify phase transformation temperatures and magnetic
transitions between 0.089 - 30 mass pct. P. Solid state phase stabilities of austenite and ferrite
were studied by Roquet and Jegaden [37] using dilatometry and equilibration experiments with
subsequent quenching, including metallographic examination. Lorenz and Fabritius [38] and
Fischer at al. [39] used the concept of the magnetic balance to completely reconstruct the
austenite/ferrite phase boundaries. Wachtel et al. [40] characterized the solid/liquid phase
STATE OF THE ART
PhD thesis Michael Bernhard 7
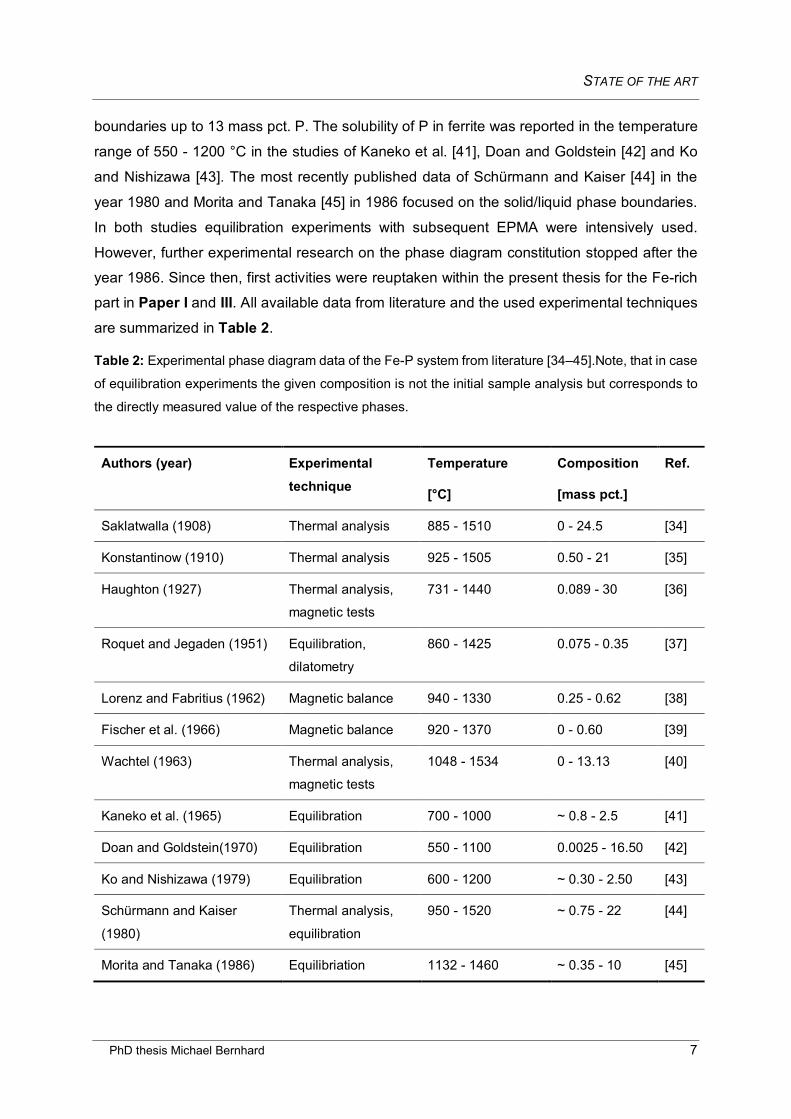
boundaries up to 13 mass pct. P. The solubility of P in ferrite was reported in the temperature
range of 550 - 1200 °C in the studies of Kaneko et al. [41], Doan and Goldstein [42] and Ko
and Nishizawa [43]. The most recently published data of Schürmann and Kaiser [44] in the
year 1980 and Morita and Tanaka [45] in 1986 focused on the solid/liquid phase boundaries.
In both studies equilibration experiments with subsequent EPMA were intensively used.
However, further experimental research on the phase diagram constitution stopped after the
year 1986. Since then, first activities were reuptaken within the present thesis for the Fe-rich
part in Paper I and III. All available data from literature and the used experimental techniques
are summarized in Table 2.
Table 2: Experimental phase diagram data of the Fe-P system from literature [34–45].Note, that in case
of equilibration experiments the given composition is not the initial sample analysis but corresponds to
the directly measured value of the respective phases.
Authors (year) Experimental technique
Temperature
[°C]
Composition
[mass pct.]
Ref.
Saklatwalla (1908) Thermal analysis 885 - 1510 0 - 24.5 [34]
Konstantinow (1910) Thermal analysis 925 - 1505 0.50 - 21 [35]
Haughton (1927) Thermal analysis,
magnetic tests
731 - 1440 0.089 - 30 [36]
Roquet and Jegaden (1951) Equilibration,
dilatometry
860 - 1425 0.075 - 0.35 [37]
Lorenz and Fabritius (1962) Magnetic balance 940 - 1330 0.25 - 0.62 [38]
Fischer et al. (1966) Magnetic balance 920 - 1370 0 - 0.60 [39]
Wachtel (1963) Thermal analysis,
magnetic tests
1048 - 1534 0 - 13.13 [40]
Kaneko et al. (1965) Equilibration 700 - 1000 ~ 0.8 - 2.5 [41]
Doan and Goldstein(1970) Equilibration 550 - 1100 0.0025 - 16.50 [42]
Ko and Nishizawa (1979) Equilibration 600 - 1200 ~ 0.30 - 2.50 [43]
Schürmann and Kaiser
(1980)
Thermal analysis,
equilibration
950 - 1520 ~ 0.75 - 22 [44]
Morita and Tanaka (1986) Equilibriation 1132 - 1460 ~ 0.35 - 10 [45]
STATE OF THE ART
PhD thesis Michael Bernhard 8
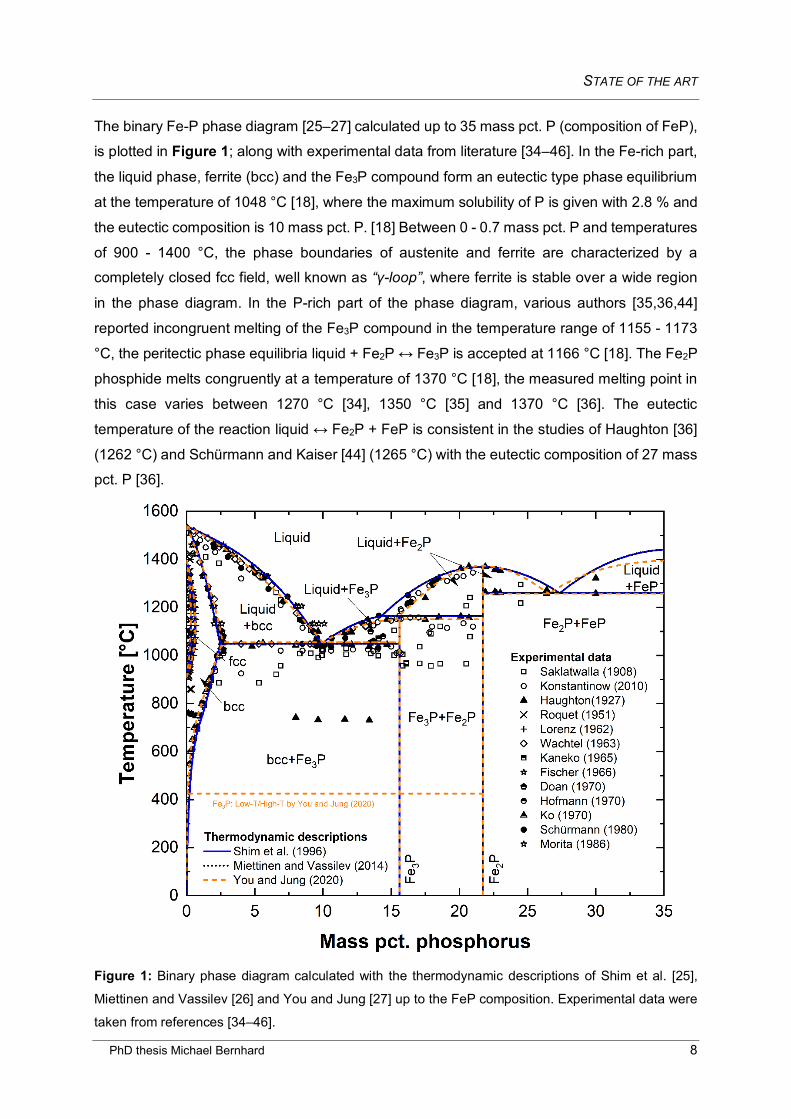
The binary Fe-P phase diagram [25–27] calculated up to 35 mass pct. P (composition of FeP),
is plotted in Figure 1; along with experimental data from literature [34–46]. In the Fe-rich part,
the liquid phase, ferrite (bcc) and the Fe3P compound form an eutectic type phase equilibrium
at the temperature of 1048 °C [18], where the maximum solubility of P is given with 2.8 % and
the eutectic composition is 10 mass pct. P. [18] Between 0 - 0.7 mass pct. P and temperatures
of 900 - 1400 °C, the phase boundaries of austenite and ferrite are characterized by a completely closed fcc field, well known as “γ-loop”, where ferrite is stable over a wide region
in the phase diagram. In the P-rich part of the phase diagram, various authors [35,36,44]
reported incongruent melting of the Fe3P compound in the temperature range of 1155 - 1173
°C, the peritectic phase equilibria liquid + Fe2P ↔ Fe3P is accepted at 1166 °C [18]. The Fe2P
phosphide melts congruently at a temperature of 1370 °C [18], the measured melting point in
this case varies between 1270 °C [34], 1350 °C [35] and 1370 °C [36]. The eutectic
temperature of the reaction liquid ↔ Fe2P + FeP is consistent in the studies of Haughton [36]
(1262 °C) and Schürmann and Kaiser [44] (1265 °C) with the eutectic composition of 27 mass
pct. P [36].
Figure 1: Binary phase diagram calculated with the thermodynamic descriptions of Shim et al. [25],
Miettinen and Vassilev [26] and You and Jung [27] up to the FeP composition. Experimental data were
taken from references [34–46].
STATE OF THE ART
PhD thesis Michael Bernhard 9
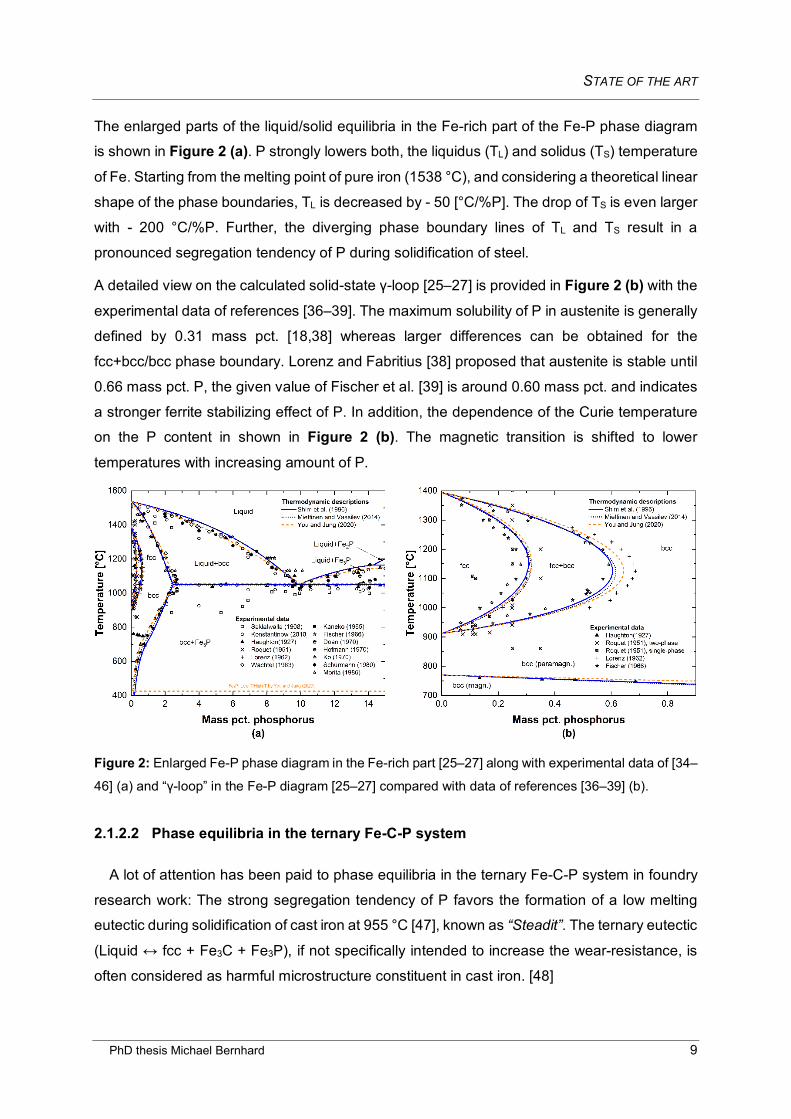
The enlarged parts of the liquid/solid equilibria in the Fe-rich part of the Fe-P phase diagram
is shown in Figure 2 (a). P strongly lowers both, the liquidus (TL) and solidus (TS) temperature
of Fe. Starting from the melting point of pure iron (1538 °C), and considering a theoretical linear
shape of the phase boundaries, TL is decreased by - 50 [°C/%P]. The drop of TS is even larger
with - 200 °C/%P. Further, the diverging phase boundary lines of TL and TS result in a
pronounced segregation tendency of P during solidification of steel.
A detailed view on the calculated solid-state γ-loop [25–27] is provided in Figure 2 (b) with the
experimental data of references [36–39]. The maximum solubility of P in austenite is generally
defined by 0.31 mass pct. [18,38] whereas larger differences can be obtained for the
fcc+bcc/bcc phase boundary. Lorenz and Fabritius [38] proposed that austenite is stable until
0.66 mass pct. P, the given value of Fischer et al. [39] is around 0.60 mass pct. and indicates
a stronger ferrite stabilizing effect of P. In addition, the dependence of the Curie temperature
on the P content in shown in Figure 2 (b). The magnetic transition is shifted to lower
temperatures with increasing amount of P.
Figure 2: Enlarged Fe-P phase diagram in the Fe-rich part [25–27] along with experimental data of [34–
46] (a) and “γ-loop” in the Fe-P diagram [25–27] compared with data of references [36–39] (b).
2.1.2.2 Phase equilibria in the ternary Fe-C-P system
A lot of attention has been paid to phase equilibria in the ternary Fe-C-P system in foundry
research work: The strong segregation tendency of P favors the formation of a low melting
eutectic during solidification of cast iron at 955 °C [47], known as “Steadit”. The ternary eutectic
(Liquid ↔ fcc + Fe3C + Fe3P), if not specifically intended to increase the wear-resistance, is
often considered as harmful microstructure constituent in cast iron. [48]
STATE OF THE ART
PhD thesis Michael Bernhard 10
First investigations on the Fe-C-P phase diagram have been carried out by Görens and
Dobbelstein [49], Wüst [50] and Stead [51]. In 1929, Vogel [52] published various isopleths of
the Fe-C-P system obtained from thermal analysis and metallographic examinations. A vertical
section with constant carbon content (2.4 mass pct. C) was reported by Ohide and Ohira [53].
Isothermal sections between 800 - 1100 °C and in the composition range of 0 - 3 mass pct. C
and 0 - 6 mass pct. P were reconstructed in references [41,46,54,55]. The liquidus projection
of the Fe-C-P system is accepted from the experimental investigation of Schürmann et al. [47].
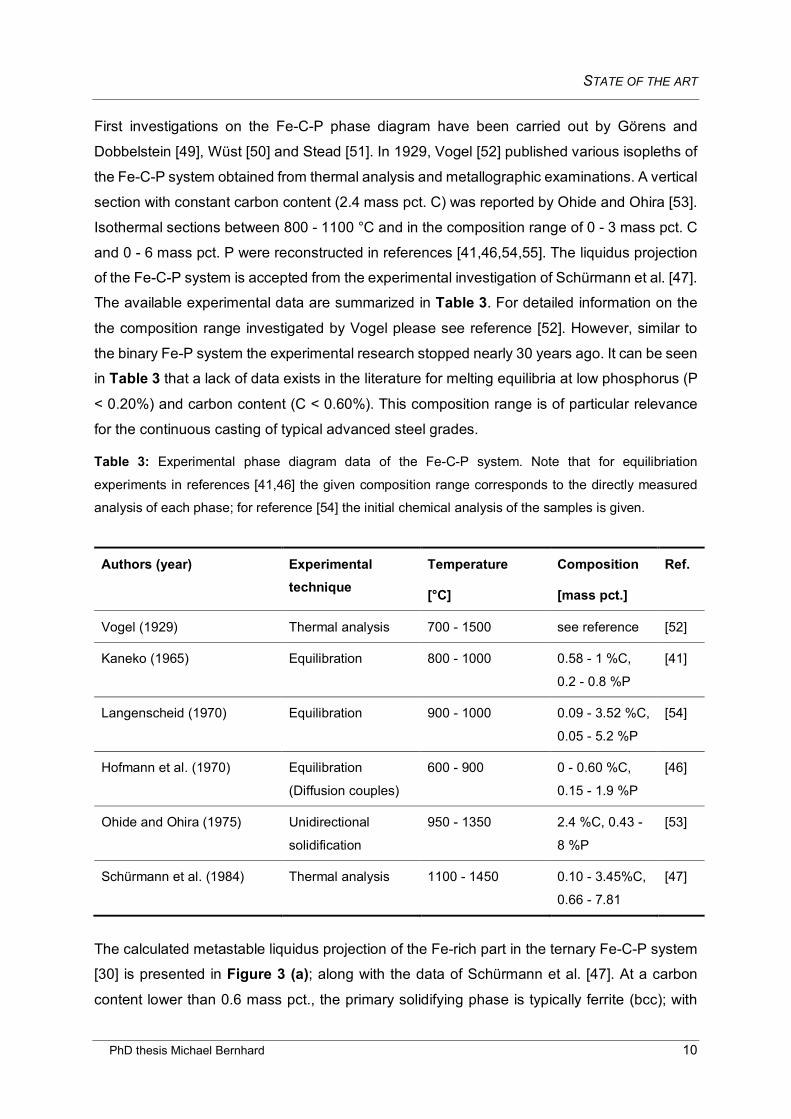
The available experimental data are summarized in Table 3. For detailed information on the
the composition range investigated by Vogel please see reference [52]. However, similar to
the binary Fe-P system the experimental research stopped nearly 30 years ago. It can be seen
in Table 3 that a lack of data exists in the literature for melting equilibria at low phosphorus (P
< 0.20%) and carbon content (C < 0.60%). This composition range is of particular relevance
for the continuous casting of typical advanced steel grades.
Table 3: Experimental phase diagram data of the Fe-C-P system. Note that for equilibriation
experiments in references [41,46] the given composition range corresponds to the directly measured
analysis of each phase; for reference [54] the initial chemical analysis of the samples is given.
Authors (year) Experimental technique
Temperature
[°C]
Composition
[mass pct.]
Ref.
Vogel (1929) Thermal analysis 700 - 1500 see reference [52]
Kaneko (1965) Equilibration 800 - 1000 0.58 - 1 %C,
0.2 - 0.8 %P
[41]
Langenscheid (1970) Equilibration 900 - 1000 0.09 - 3.52 %C,
0.05 - 5.2 %P
[54]
Hofmann et al. (1970) Equilibration
(Diffusion couples)
600 - 900 0 - 0.60 %C,
0.15 - 1.9 %P
[46]
Ohide and Ohira (1975) Unidirectional
solidification
950 - 1350 2.4 %C, 0.43 -
8 %P
[53]
Schürmann et al. (1984) Thermal analysis 1100 - 1450 0.10 - 3.45%C,
0.66 - 7.81
[47]
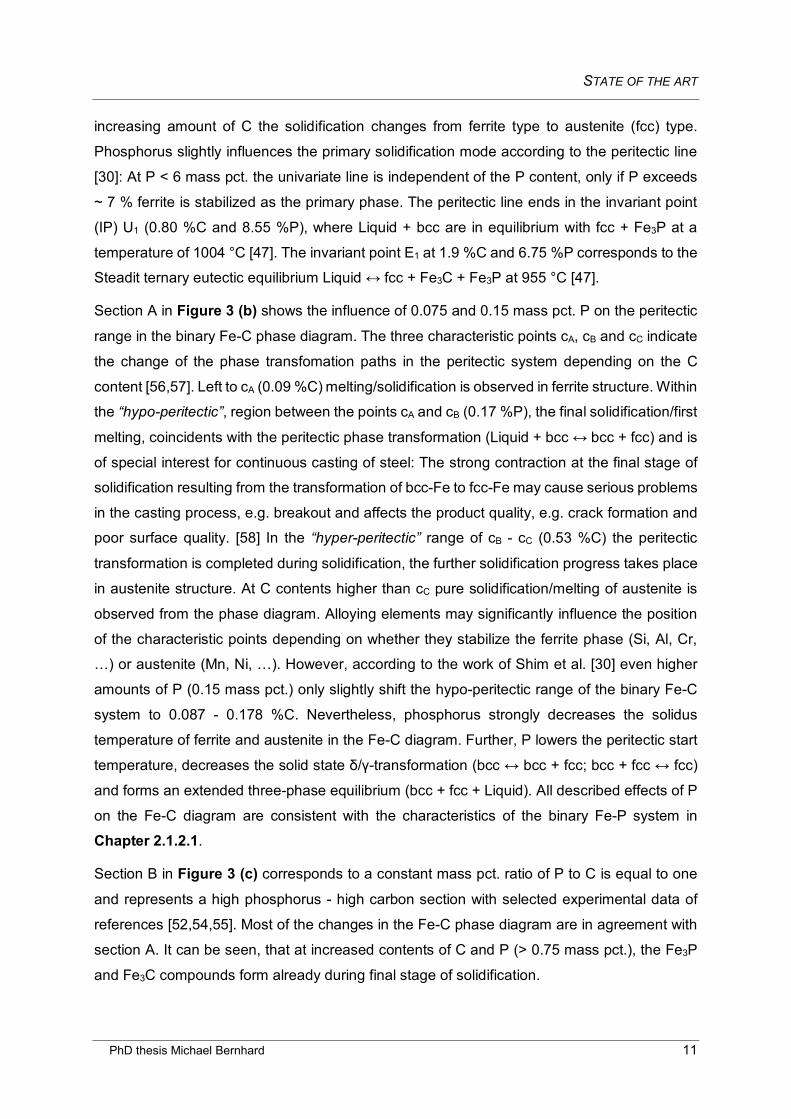
The calculated metastable liquidus projection of the Fe-rich part in the ternary Fe-C-P system
[30] is presented in Figure 3 (a); along with the data of Schürmann et al. [47]. At a carbon
content lower than 0.6 mass pct., the primary solidifying phase is typically ferrite (bcc); with
STATE OF THE ART
PhD thesis Michael Bernhard 11
increasing amount of C the solidification changes from ferrite type to austenite (fcc) type.
Phosphorus slightly influences the primary solidification mode according to the peritectic line
[30]: At P < 6 mass pct. the univariate line is independent of the P content, only if P exceeds
~ 7 % ferrite is stabilized as the primary phase. The peritectic line ends in the invariant point
(IP) U1 (0.80 %C and 8.55 %P), where Liquid + bcc are in equilibrium with fcc + Fe3P at a
temperature of 1004 °C [47]. The invariant point E1 at 1.9 %C and 6.75 %P corresponds to the
Steadit ternary eutectic equilibrium Liquid ↔ fcc + Fe3C + Fe3P at 955 °C [47].
Section A in Figure 3 (b) shows the influence of 0.075 and 0.15 mass pct. P on the peritectic
range in the binary Fe-C phase diagram. The three characteristic points cA, cB and cC indicate
the change of the phase transfomation paths in the peritectic system depending on the C
content [56,57]. Left to cA (0.09 %C) melting/solidification is observed in ferrite structure. Within
the “hypo-peritectic”, region between the points cA and cB (0.17 %P), the final solidification/first
melting, coincidents with the peritectic phase transformation (Liquid + bcc ↔ bcc + fcc) and is
of special interest for continuous casting of steel: The strong contraction at the final stage of
solidification resulting from the transformation of bcc-Fe to fcc-Fe may cause serious problems
in the casting process, e.g. breakout and affects the product quality, e.g. crack formation and
poor surface quality. [58] In the “hyper-peritectic” range of cB - cC (0.53 %C) the peritectic
transformation is completed during solidification, the further solidification progress takes place
in austenite structure. At C contents higher than cC pure solidification/melting of austenite is
observed from the phase diagram. Alloying elements may significantly influence the position
of the characteristic points depending on whether they stabilize the ferrite phase (Si, Al, Cr,
…) or austenite (Mn, Ni, …). However, according to the work of Shim et al. [30] even higher
amounts of P (0.15 mass pct.) only slightly shift the hypo-peritectic range of the binary Fe-C
system to 0.087 - 0.178 %C. Nevertheless, phosphorus strongly decreases the solidus
temperature of ferrite and austenite in the Fe-C diagram. Further, P lowers the peritectic start
temperature, decreases the solid state δ/γ-transformation (bcc ↔ bcc + fcc; bcc + fcc ↔ fcc)
and forms an extended three-phase equilibrium (bcc + fcc + Liquid). All described effects of P
on the Fe-C diagram are consistent with the characteristics of the binary Fe-P system in
Chapter 2.1.2.1.
Section B in Figure 3 (c) corresponds to a constant mass pct. ratio of P to C is equal to one
and represents a high phosphorus - high carbon section with selected experimental data of
references [52,54,55]. Most of the changes in the Fe-C phase diagram are in agreement with
section A. It can be seen, that at increased contents of C and P (> 0.75 mass pct.), the Fe3P
and Fe3C compounds form already during final stage of solidification.
STATE OF THE ART
PhD thesis Michael Bernhard 13
2.1.3 Aspects of continuously casting rephosphorized steel grades
2.1.3.1 Continuous casting and product quality: A brief introduction
In general, continuous casting machines are devided into billet, bloom and slab casters.
Billets and blooms are mainly used for long products (e.g. bars/rods and rails/structural
shapes) whereas slabs are further processed into flat products (e.g. heavy plates/coils).
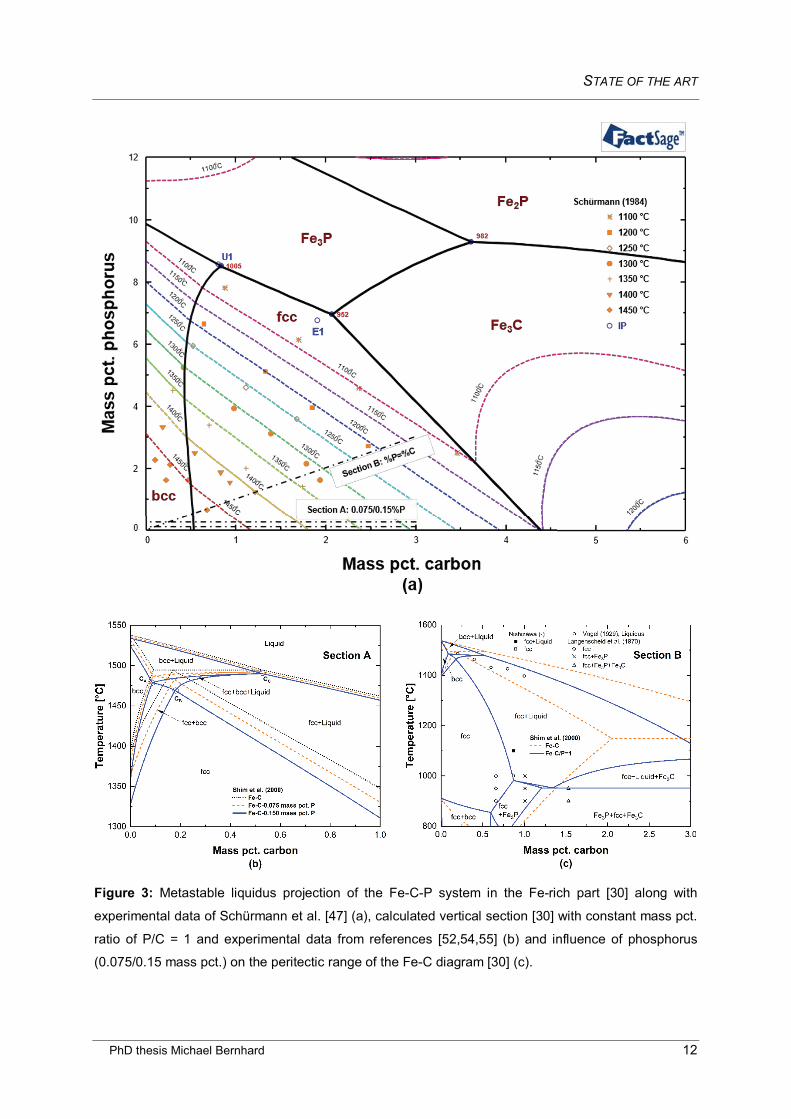
However, the general process is similar for all caster layouts and is schematically shown for
slabs in Figure 4 [59]. Liquid steel is transported with a defined superheat from secondary
metallurgy via ladles to the caster. From the ladle, the liquid steel flows through the ladle
shroud into the tundish. The tundish represents an intermediate vessel which guarantees the
actual continuity of the process without interrupting the casting sequence. Tundish and mold
are interconnected via the submerged entry nozzle (SEN) where the inlet quantity is controlled
by a stopper rod. The stopper ensures proper feeding according to the current casting format
and casting speed. At the meniscus, close to the top of the water-cooled copper mold, the
initial solidification starts. Mold oscillation and the utilization of casting powders ensure
sufficient lubrication and control the heat flux in the mold.
When the solidifying shell exits the mold, supporting rolls are required to minimize bulging of
the strand due to the ferrostatic pressure caused by the liquid pool inside the solidified shell.
The zone ranging from the exit of the mold until the cutting-off point is called secondary cooling
zone (SCZ), where the strand surface is intensively cooled by water(-air) spray-nozzles. The
SCZ is subcategorized into the bending zone, the curved section and the straightening zone.
Bending and straightening transfer the strand from the vertical direction at the exit of the mold
to the horizontal direction at the end of the continuous casting machine. Bending and
straightening are continuously performed in various points of the caster in order to reduce the
occuring strain and strain rates. When the center of the strand is completely solidified the
billet/bloom/slab is cut off, according to the desired length for further processing. The distance
between the meniscus and the final solidification point is called “metallurgical length”. The
precise knowledge of the metallurgical length is of major importance for the position of a
softreduction or final electromagnetic stirrer in order to improve the internal soundness.
During the casting process, significant mechanical stresses are exerted on the solidifying
strand resulting from bulging, bending/straightening, thermal gradients, as well as from
possible misalignment of the supporting rolls. In combination with the decreased ductility of
steel in specific high-temperature regions, the mechanical loads may seriously affect the final
product quality with respect to crack formation. Depending on the position, internal and surface cracks are distinguished as shown in Figure 4.
STATE OF THE ART
PhD thesis Michael Bernhard 14
The ductility of steel as a function of temperature is plotted in Figure 5 according to Thomas
et al. [60] and Brimacombe [61]. Internal cracks are mainly hot tears and hot tear segregations
formed during solidification close to TS (Region I), see also Chapter 2.1.3.3. Surface cracks
occur at temperatures within secondary ductility trough (600 °C to 1200 °C [60,62]) and are
associated with (i) pinning effects and actions of precipitates at the austenite grain boundaries
(Region II and III,) or solid state phase transformations (Region IV and V) in the austenite/ferrite
two-phase region. [60] Recently, Krobath et al. [63] emphasized (iii) the relevance of selective
grain boundary oxidation on the surface crack formation in the casting process.
In the continuous casting process, higher amounts of phosphorus mainly affect the internal
quality due to the strong segregation tendency during solidification. The segregations on
microscopic scale may lead to inhomogeneities on macroscopic scale (centerline
segregations) and generally increase the hot tearing sensitivity of a steel. Quality relevant
issues, with respect to segregations and hot tearing induced by phosphorus, will be now
discussed in the following sections.
Figure 4: Schematic layout of a continuous slab caster for steel (reprinted by permission from Elsevier
[59]) and cracks found in continuously cast steel according to Brimacombe [62]: Internal cracks (1
midway, 2 triple-point, 3 centreline, 4 diagonal, 5 bending/straightening, 6 pinch roll) and surface cracks
(7 longitudinal mid-face, 8 longitudinal corner, 9, transverse mid-face, 10 transverse corner, 11 star).

STATE OF THE ART
PhD thesis Michael Bernhard 15
Figure 5: Ductility of steel as a function of temperature, redrawn from the work of Thomas et al. [60]
and Brimacombe [61] (adapted by permission from Springer Nature [61]).
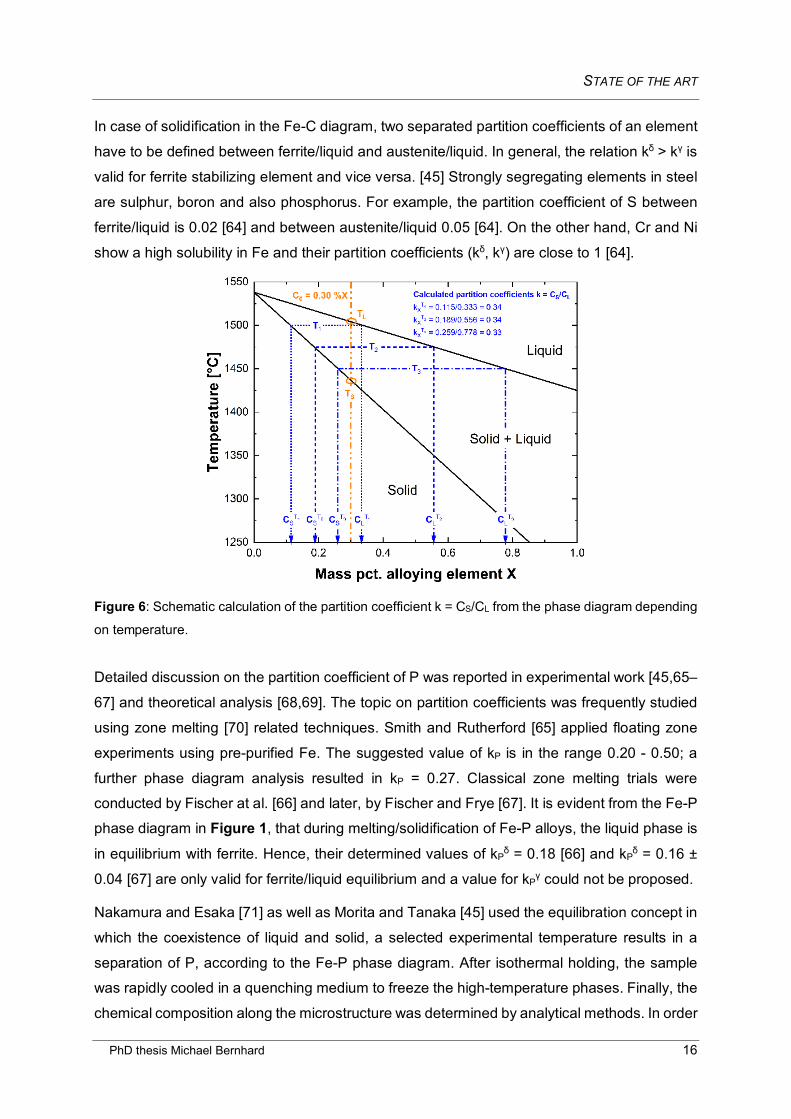
2.1.3.2 Segregation of phosphorus on microscopic scale
During solidification of steel, alloying elements show a different solubility in the liquid and
the solid phase. In general, the solubility of an element is lower in the solid, leading to an
enrichment of the component in the melt. Under equilibrium conditions, the solute redistribution
is given by the equilibrium partition coefficient k = CS/CL, where CS is the concentration of the
component in the solid phase and CL defines the amount in the liquid phase, respectively. The
smaller the ratio of CS to CL, the higher is the tendency of the element to segregate in the liquid.
The value of k for an element X is closely related to the Fe-X binary phase diagram; its
calculation is schematically illustrated in Figure 6. The initial concentration C0 is considered to
be 0.30 mass percent. By reaching the liquidus temperature TL, the first fraction of the solid
phase forms. During further cooling, CS and CL follow the course of the solidus and liquidus
line. Hence, k can be calculated at each temperature from TL to TS in the liquid/solid two-phase
region. In the present example, k is calculated at T1 - T3 by 0.34. If both phase boundaries are
linear, the value of k is more or less constant over the whole solidification interval. However,
in reality k is slightly depending on temperature as all phase diagrams show a certain curvature
of the liquidus or solidus line.
STATE OF THE ART
PhD thesis Michael Bernhard 16
In case of solidification in the Fe-C diagram, two separated partition coefficients of an element
have to be defined between ferrite/liquid and austenite/liquid. In general, the relation kδ > kγ is
valid for ferrite stabilizing element and vice versa. [45] Strongly segregating elements in steel
are sulphur, boron and also phosphorus. For example, the partition coefficient of S between
ferrite/liquid is 0.02 [64] and between austenite/liquid 0.05 [64]. On the other hand, Cr and Ni
show a high solubility in Fe and their partition coefficients (kδ, kγ) are close to 1 [64].
Figure 6: Schematic calculation of the partition coefficient k = CS/CL from the phase diagram depending
on temperature.
Detailed discussion on the partition coefficient of P was reported in experimental work [45,65–
67] and theoretical analysis [68,69]. The topic on partition coefficients was frequently studied
using zone melting [70] related techniques. Smith and Rutherford [65] applied floating zone
experiments using pre-purified Fe. The suggested value of kP is in the range 0.20 - 0.50; a
further phase diagram analysis resulted in kP = 0.27. Classical zone melting trials were
conducted by Fischer at al. [66] and later, by Fischer and Frye [67]. It is evident from the Fe-P
phase diagram in Figure 1, that during melting/solidification of Fe-P alloys, the liquid phase is
in equilibrium with ferrite. Hence, their determined values of kPδ = 0.18 [66] and kP
δ = 0.16 ±
0.04 [67] are only valid for ferrite/liquid equilibrium and a value for kPγ could not be proposed.
Nakamura and Esaka [71] as well as Morita and Tanaka [45] used the equilibration concept in
which the coexistence of liquid and solid, a selected experimental temperature results in a
separation of P, according to the Fe-P phase diagram. After isothermal holding, the sample
was rapidly cooled in a quenching medium to freeze the high-temperature phases. Finally, the
chemical composition along the microstructure was determined by analytical methods. In order
STATE OF THE ART
PhD thesis Michael Bernhard 17
to characterize the partition coefficient of P for both phases, ferrite and austenite, the
experiments were carried out for Fe-P and Fe-C-P alloys. The addition of carbon leads to the
stabilization of γ-Fe in the peritectic range of the Fe-C-P ternary system (Chapter 2.1.2.2) and
enables the analysis of the P distribution in the γ-Fe/liquid phase equilibrium. Nakamura and
Esaka [71] proposed values for kPδ = 0.23 and kP
γ = 0.13; the influence of C on the individual
values of kPδ,γ was reported to be very small. Morita and Tanaka [45] obtained a constant
partition of kPδ = 0.136 at infinite dilution, but suggested the temperature relation kP
δ = 0.643 -
2.80 x 10⁻⁴T [K] between 1460 - 1132 °C as their determined value of kPδ indicated a non-linear
decrease of the liquidus and solidus line. In highly C and P alloyed ternary samples with 2.08
- 3.93 mass pct. C and fixed P content of 0.50 mass pct. the partition coefficient kPγ was
measured by 0.09. The value at infinite dilution was thermodynamically recalculated
considering the experimental results and finally proposed as kPγ = 0.06. Similar to the work of
Nakamura and Esaka [71] addition of C seems to have only a minor effect on kPγ.
In a theoretical work on the metallurgical fundamentals of solidification of steel, Oeters et al.
[68] suggested a value of kP in ferrite of 0.15 - 0.18. Battle and Pehlke [69] thermodynamically
derived the partition coefficient of P between ferrite and liquid considering the first consistent
description of the Fe-P system by Spencer and Kubaschewski [72]. The partition coefficient
for ferrite, with respect to mole fraction, is given by kPδ = -24.90 + 4.808 x 10⁻² T [K] - 3.018 x
10-5 T2 [K] + 0.62 x 10⁻⁸ T3 [K] and is valid in the temperature range of 1132 - 1538 °C
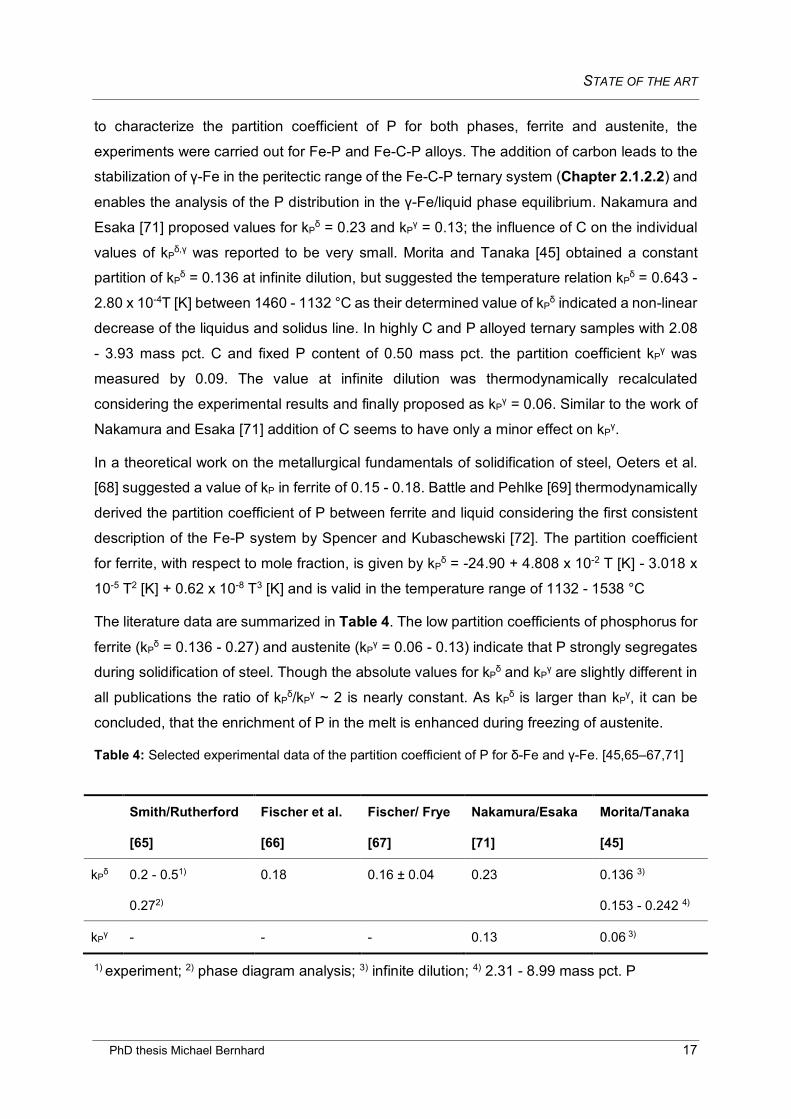
The literature data are summarized in Table 4. The low partition coefficients of phosphorus for
ferrite (kPδ = 0.136 - 0.27) and austenite (kP
γ = 0.06 - 0.13) indicate that P strongly segregates
during solidification of steel. Though the absolute values for kPδ and kP
γ are slightly different in
all publications the ratio of kPδ/kP
γ ~ 2 is nearly constant. As kPδ is larger than kP
γ, it can be
concluded, that the enrichment of P in the melt is enhanced during freezing of austenite.
Table 4: Selected experimental data of the partition coefficient of P for δ-Fe and γ-Fe. [45,65–67,71]
Smith/Rutherford
[65]
Fischer et al.
[66]
Fischer/ Frye
[67]
Nakamura/Esaka
[71]
Morita/Tanaka
[45]
kPδ 0.2 - 0.51)
0.272)
0.18 0.16 ± 0.04 0.23 0.136 3)
0.153 - 0.242 4)
kPγ - - - 0.13 0.06 3)
1) experiment; 2) phase diagram analysis; 3) infinite dilution; 4) 2.31 - 8.99 mass pct. P
STATE OF THE ART
PhD thesis Michael Bernhard 18
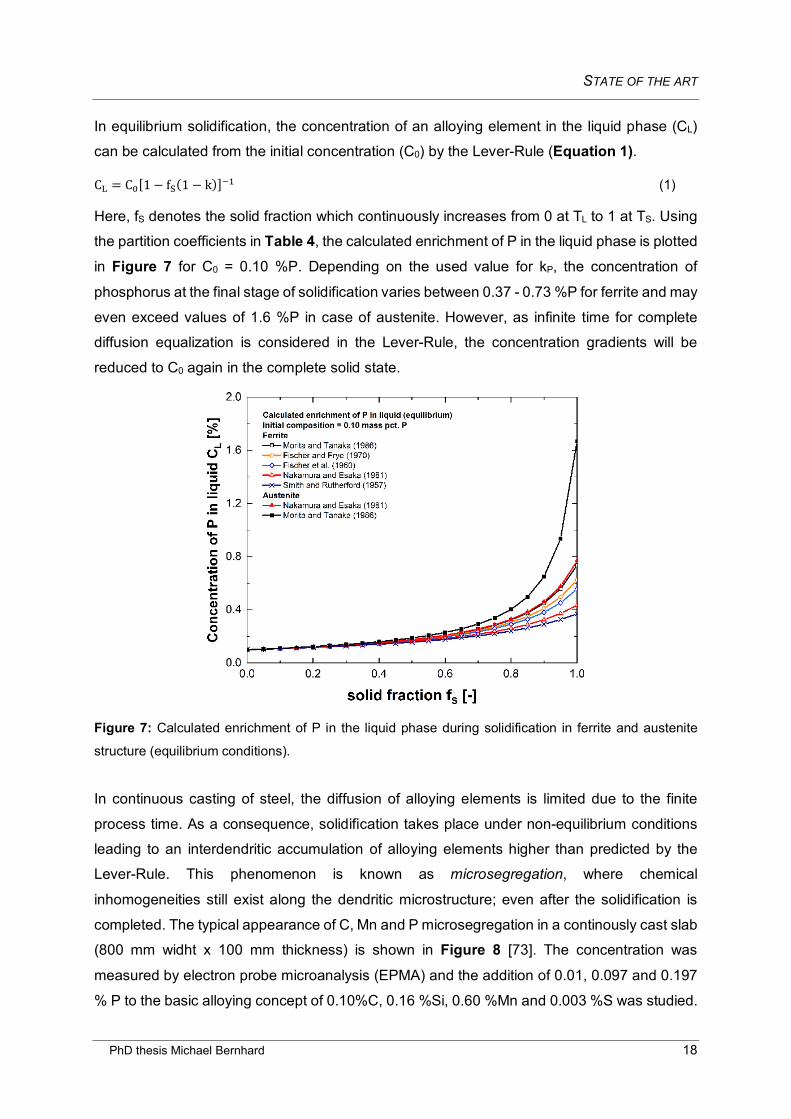
In equilibrium solidification, the concentration of an alloying element in the liquid phase (CL)
can be calculated from the initial concentration (C0) by the Lever-Rule (Equation 1).
CL = C0[1− fS(1 − k)]−1 (1)
Here, fS denotes the solid fraction which continuously increases from 0 at TL to 1 at TS. Using
the partition coefficients in Table 4, the calculated enrichment of P in the liquid phase is plotted
in Figure 7 for C0 = 0.10 %P. Depending on the used value for kP, the concentration of
phosphorus at the final stage of solidification varies between 0.37 - 0.73 %P for ferrite and may
even exceed values of 1.6 %P in case of austenite. However, as infinite time for complete
diffusion equalization is considered in the Lever-Rule, the concentration gradients will be
reduced to C0 again in the complete solid state.
Figure 7: Calculated enrichment of P in the liquid phase during solidification in ferrite and austenite
structure (equilibrium conditions).
In continuous casting of steel, the diffusion of alloying elements is limited due to the finite
process time. As a consequence, solidification takes place under non-equilibrium conditions
leading to an interdendritic accumulation of alloying elements higher than predicted by the
Lever-Rule. This phenomenon is known as microsegregation, where chemical
inhomogeneities still exist along the dendritic microstructure; even after the solidification is
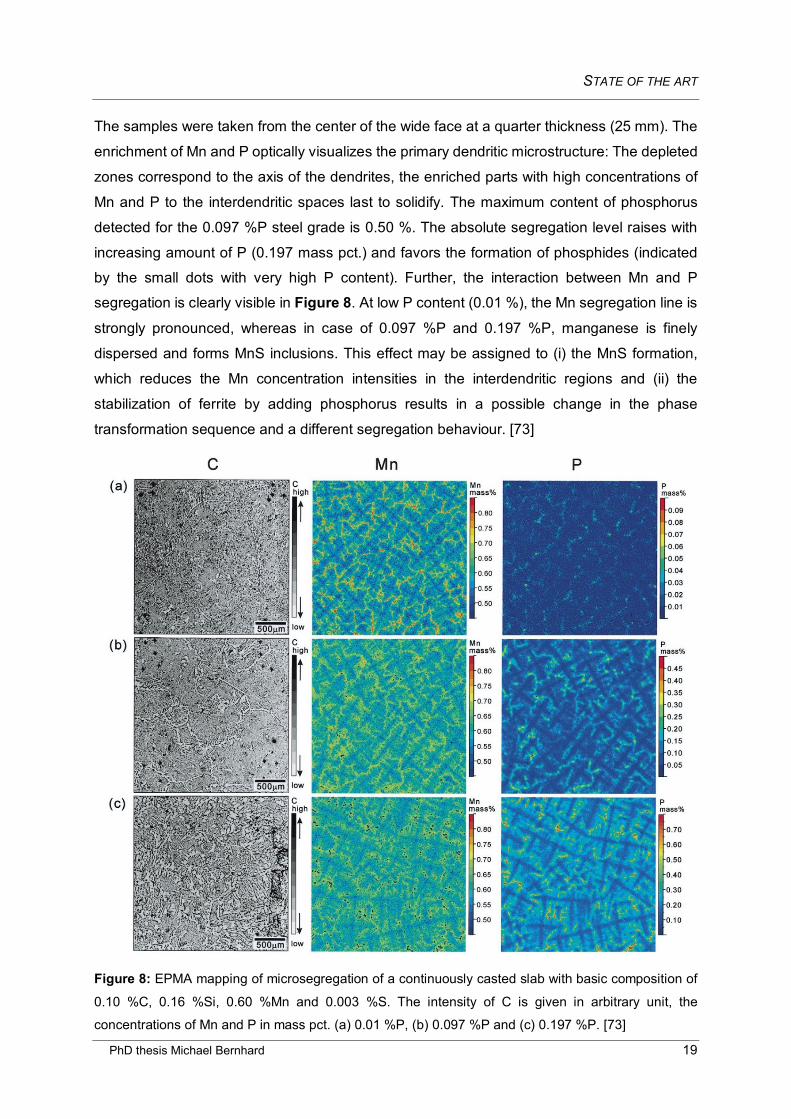
completed. The typical appearance of C, Mn and P microsegregation in a continously cast slab
(800 mm widht x 100 mm thickness) is shown in Figure 8 [73]. The concentration was
measured by electron probe microanalysis (EPMA) and the addition of 0.01, 0.097 and 0.197
% P to the basic alloying concept of 0.10%C, 0.16 %Si, 0.60 %Mn and 0.003 %S was studied.
STATE OF THE ART
PhD thesis Michael Bernhard 19
The samples were taken from the center of the wide face at a quarter thickness (25 mm). The
enrichment of Mn and P optically visualizes the primary dendritic microstructure: The depleted
zones correspond to the axis of the dendrites, the enriched parts with high concentrations of
Mn and P to the interdendritic spaces last to solidify. The maximum content of phosphorus
detected for the 0.097 %P steel grade is 0.50 %. The absolute segregation level raises with
increasing amount of P (0.197 mass pct.) and favors the formation of phosphides (indicated
by the small dots with very high P content). Further, the interaction between Mn and P
segregation is clearly visible in Figure 8. At low P content (0.01 %), the Mn segregation line is
strongly pronounced, whereas in case of 0.097 %P and 0.197 %P, manganese is finely
dispersed and forms MnS inclusions. This effect may be assigned to (i) the MnS formation,
which reduces the Mn concentration intensities in the interdendritic regions and (ii) the
stabilization of ferrite by adding phosphorus results in a possible change in the phase
transformation sequence and a different segregation behaviour. [73]
Figure 8: EPMA mapping of microsegregation of a continuously casted slab with basic composition of
0.10 %C, 0.16 %Si, 0.60 %Mn and 0.003 %S. The intensity of C is given in arbitrary unit, the
concentrations of Mn and P in mass pct. (a) 0.01 %P, (b) 0.097 %P and (c) 0.197 %P. [73]
STATE OF THE ART
PhD thesis Michael Bernhard 20
In the past, various mathematical approaches of microsegregation modelling have been
postulated in the literature, e.g. [74–80]. The most popular analytical equation is the well known
Gulliver-Scheil model [74,75]; given in the original form in Equation 2. This equation assumes
infinite diffusion in the liquid phase, but negligible diffusion in the solid state. For steel, the
application of the Gulliver-Scheil equation is limited, as interstitially dissolved carbon and
nitrogen are fast diffusing elements in the solid. The model was therefore modified in several research work of Kozeschnik et al. [81,82] and Chen and Sundman [83] in terms of “partial
equilibrium considering thermodynamic equilibrium conditions for C and N, but no diffusion for
substitutional elements, e.g. Si, Mn, P and S.
CL = C0[1 − fS](k−1) (2)
In other models, the general concept of “back-diffusion” was introduced [76–78] where the
solute redistribution is described by (i) the local cooling conditions, or cooling rates T’, (ii) the
morphology of the dendrites, (iii) the coarsening of dendrites during solidification, (iv) the
diffusivity of the alloying elements and (v) thermodynamic equilibrium at the solid/liquid
interface defined by the partition coefficient. The solidification parameters are connected in the
dimensionless Fourier-Number α in Equation 3,
α = DStL2
= 4DStfλ22
(3)
where DS is the diffusion coefficient of the alloying element and tf is the local solidification time
given by (TL - TS)/T’. The characteristic diffusion length is defined by the half of the secondary
dendrite arm spacing (λ2). According to Ohnaka [78], the concentration in the liquid phase can
be calculated using Equation 4,
CL = C0[1 − ΓfS](k−1)/Γ (4)
where Γ is defined by Equation 5 as
Γ = 1 − βk/(1 + βk) (5)
The backdiffusion parameter β = 2α is valid for a plate-like shape of the dendrites whereas for
columnar dendritic growth β = 4α is applied. The Ohnaka model reduces the Lever-Rule if
α → ∞ and is equal to the Gulliver-Scheil equation if α → 0.
In the following sections, all illustrating microsegregation calculations were performed using
the model published in Paper V (Chapter 4.4) taking the example of the 0.10%C-0.16%Si-
0.60%-0.003%S alloying concept in Figure 8 [73] as a reference.
STATE OF THE ART
PhD thesis Michael Bernhard 21
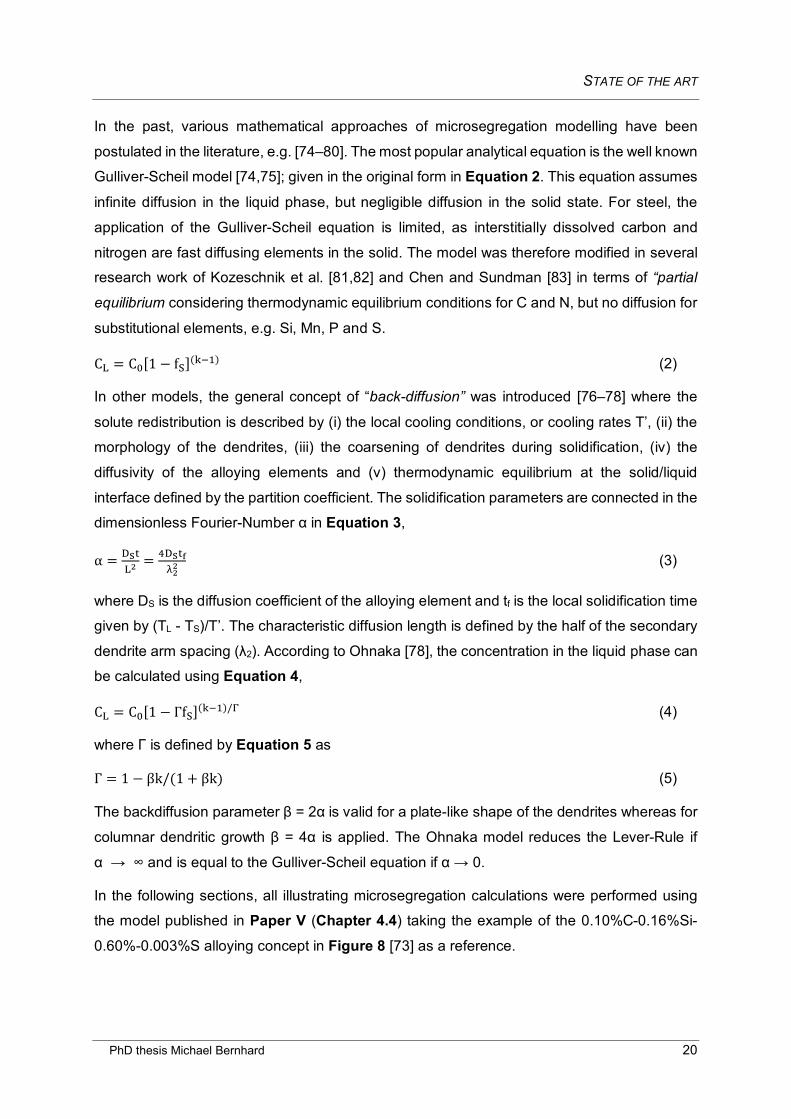
In Figure 9, the calculated P-enrichments during solidification of the 0.10%C-0.16%Si-0.60%-
0.003%S-P steels are graphically represented using the Lever-Rule and the modified Ohnaka
equation [84]. In the microsegregation model, a cooling rate of 1 °C/s was assumed. Less
difference between both equations is obtained for the low-P concept (0.01%P). The
concentration of P at fS = 1 in equilibrium solidification is 0.0623 % and slightly increases to
0.0912 % by defining a cooling rate of 1 °C/s. However, for the rephosphorized steel concepts
with 0.097 %P and 0.197 %P, clear deviations are observed between both equations:
Considering the solidification kinetics, the P content at the final stage of solidification is nearly
doubled and exceeds 1 % for C0 = 0.097 % and 2.5 % for initial P content of 0.197 %.
Compared with the experimental data in Figure 8, the calculated values of the P enrichment
are significantly higher. However, it is challenging to quantify the real microsegregation
concentration in the solidifying shell due to the high diffusion rate in the solid during further
cooling from solidus to ambient temperature. [85] Hence, the actual segregation of P may
significantly exceed the measured value from the casting machine.
Figure 9: Enrichment of phosphorus in interdendritic liquid for a 0.10%C-0.16%Si-0.60%Mn-0.003%S
steel with different initial P content (0.01, 0.097 and 0.197 %P).
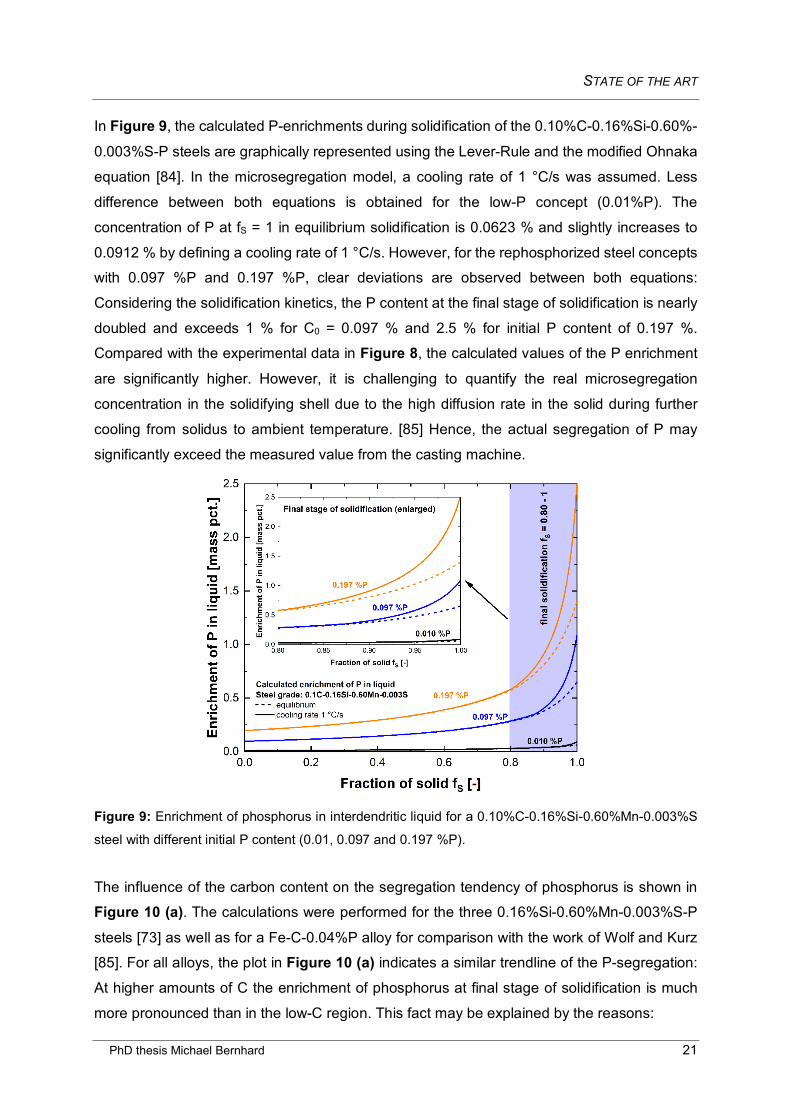
The influence of the carbon content on the segregation tendency of phosphorus is shown in
Figure 10 (a). The calculations were performed for the three 0.16%Si-0.60%Mn-0.003%S-P
steels [73] as well as for a Fe-C-0.04%P alloy for comparison with the work of Wolf and Kurz
[85]. For all alloys, the plot in Figure 10 (a) indicates a similar trendline of the P-segregation:
At higher amounts of C the enrichment of phosphorus at final stage of solidification is much
more pronounced than in the low-C region. This fact may be explained by the reasons:
STATE OF THE ART
PhD thesis Michael Bernhard 22
• Solidification sequence: Left to cA, freezing of ferrite takes place; whereas right to cA, the
solidification during the peritectic reaction is controlled by austenite [84,86]. According to
Table 4, the lower value of kPγ compared to kP
δ leads to an abrupt increase of the P-
enrichment close to cA. Further increase of carbon favors the complete change to the γ-Fe
type solidification.
• Diffusion and solidification temperatures: In contrast to interstitial elements, like carbon, P
is a slowly diffusing element in steel, see Figure 10 (b). In the body centered cubic crystal
lattice of δ-Fe, phosphorus shows a significantly higher mobility than in the face centered
cubic γ-Fe phase. Hence, the P-microsegregation is further intensified if γ-Fe is stable
during solidification. At C > 0.20 mass pct. the enrichment of P continuously raises due to
the lower solidification temperatures and the temperature dependence of the diffusion
coefficient itself.
Figure 10: Influence of carbon content on the enrichment of phosphorus in a 0.16%Si-0.60%Mn-
0.003%S steel with different initial content of P (0.01, 0.097 and 0.197 %P) and for a Fe-C-0.04%P alloy
in comparison with calculation of Wolf and Kurz [85] (a). Diffusion coefficients of C and P in austenite
and ferrite depending on temperature taken from the work of Ueshima et al. [79] (b).
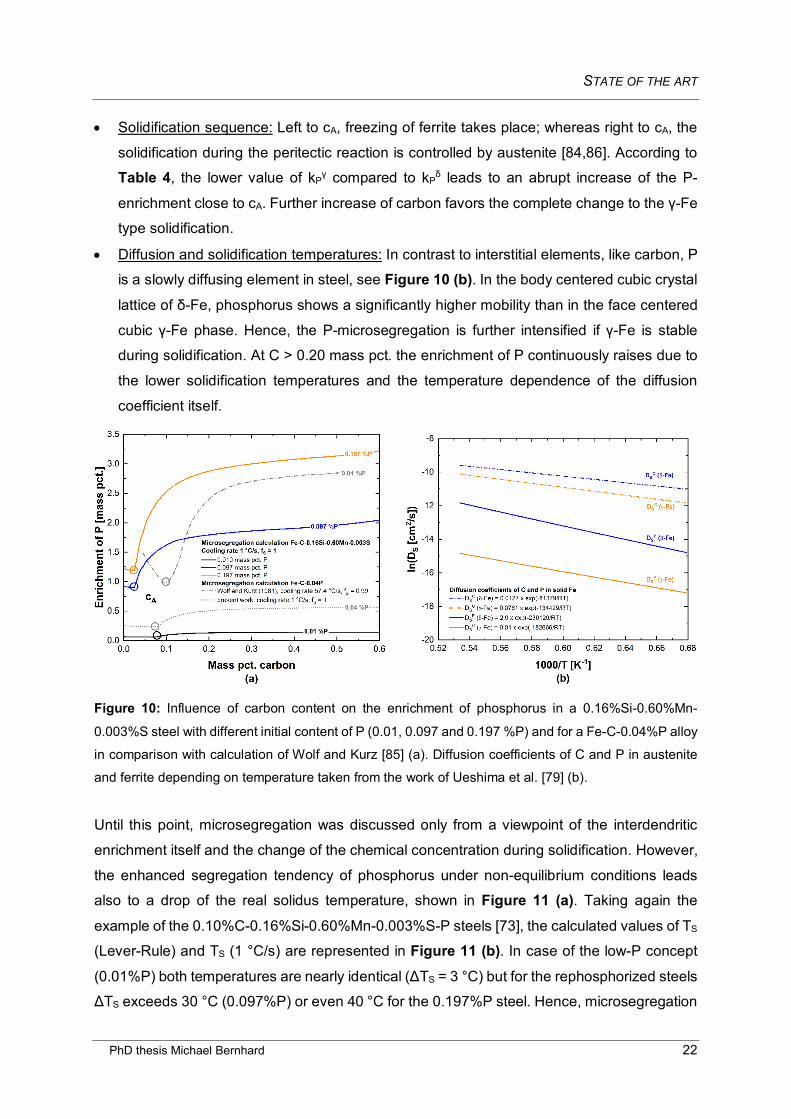
Until this point, microsegregation was discussed only from a viewpoint of the interdendritic
enrichment itself and the change of the chemical concentration during solidification. However,
the enhanced segregation tendency of phosphorus under non-equilibrium conditions leads
also to a drop of the real solidus temperature, shown in Figure 11 (a). Taking again the
example of the 0.10%C-0.16%Si-0.60%Mn-0.003%S-P steels [73], the calculated values of TS
(Lever-Rule) and TS (1 °C/s) are represented in Figure 11 (b). In case of the low-P concept
(0.01%P) both temperatures are nearly identical (ΔTS = 3 °C) but for the rephosphorized steels
ΔTS exceeds 30 °C (0.097%P) or even 40 °C for the 0.197%P steel. Hence, microsegregation
STATE OF THE ART
PhD thesis Michael Bernhard 23
phenomena can not be ignored in accurate solidification modelling of highly P-alloyed steel
grades and play an important role in the theory of hot tear formation as will be explained in the
next chapter.
Figure 11: Schematic representation of the influence of microsegregation (non-equilibrium conditions)
on the real solidus temperature of an alloy (a) and difference of TS calculated with the Lever-Rule and
the modified Ohnaka equation [84] for the 0.10%C-0.16%Si-0.60%Mn-0.003%S steel grade in reference
[73] (b).
2.1.3.3 Influence of phosphorus on hot tear formation
The term “hot tear” (HT) summarizes cracks which are formed during solidification of steel
along the interdendritic paths and the primary grain boundaries. According to C. Bernhard [87],
hot tears in the continuous casting process occur due to an overcritical amount of tensile strain
in perpendicular direction to the solidifying dendritic microstructure. A precondition for the HT
initiation is a columnar dendritic morphology; whereas coarse equiaxed grains increase the
resistance to further hot tear propagation. [88]
In the present work, the mechanism of hot tearing in steel is briefly explained based on Pellini’s
popular “Strain theory of hot tearing” [89] in Figure 12 (a). In general, this theory correlates the
phenomenon of hot tearing with microsegregation processes close to the non-equilibrium
solidus temperature. At very high solid fraction, the solidifying steel reaches the film stage,
where small fractions of residual liquid are still present along the primary grain boundaries.
The hot tear sensitivity is directly influenced by the amount of strain which is initiated at the
film stage. This means that a high strain rate resulting from the mechanical stresses as well as
a long life time of the films will increase the hot tear sensivity. The strain rate depends on the
casting process parameters (secondary cooling, casting speed, …;) whereas the existence of
liquid films is strongly influenced by the chemical composition. As shown in the previous

STATE OF THE ART
PhD thesis Michael Bernhard 24
Chapter 2.1.3.2, the presence of phosphorus leads to a drop of TS and a stabilization of
segregated films below the equilibrium solidus temperature. As a consequence, the life time
of the films is largely increased. If the accumulated strain at the film stage is close to a critical
value, pre-stages of hot tears, so called “hot tear segregations” (HTS) are formed. With
increasing strain, the coalescence of pores may lead to open hot tears. Figure 12 (b) exemplarically shows concentration mappings of the defect pattern of HTS and HTS with initial
pore formation. The micrographs were taken from internal research at the Chair of Ferrous
Metallurgy (Montanuniversitaet Leoben) using an in-situ hot tensile test during solidification.
The results were partly published by Reiter et al. [90,91] using EPMA.
Figure 12: Strain theory of hot tearing according to Pellini [89] (a); the figure was taken from the work
of Pierer [88]. Concentration mappings of Si, Mn and P close to/within hot tear segregations obtained in
an in-situ hot tensile test at laboratory scale using EPMA (b) the figure was created from internal
research at the Chair of Ferrous Metallurgy, Montauniversitaet Leoben; partly published by Reiter et al.
[90,91].
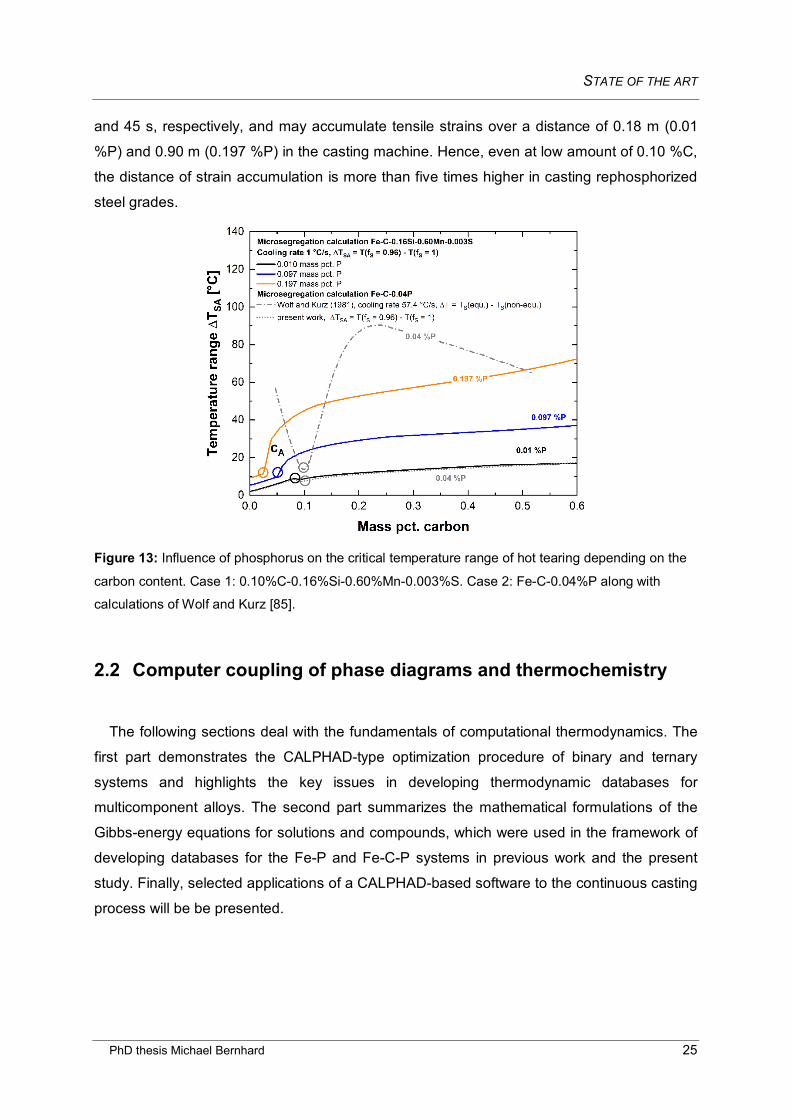
Pierer [88] defined the temperature range ΔTSA, within which the liquid films are able to
accumulate the tensile strain, between fS = 0.96 and fS = 1. The influence of phosphorus on
ΔTSA of the 0.10%C-0.16%Si-0.60%Mn-0.003%S-P steels [73] is plotted in Figure 13 as a
function of the C content. Again, additional calculations for a Fe-C-0.04%P alloy are
qualitatively compared with the results of Wolf and Kurz [85]. The high value of ΔTSA of P-
containing high carbon steels represents a main aspect for the higher HT/HTS sensitivity
compared to steels with low amount of C. [85,92,93] At a fixed carbon content of 0.10%C, ΔTSA
in Figure 13 raises from 9 °C in the low P-concept (0.01 %P) to a maximum value of 45 °C in
case of C0 = 0.197 %P. Considering typical continuous slab casting conditions with a cooling
rate of 1 °C/s and a casting speed of 1.2 m/min, the critical temperature range exists for 9 s
STATE OF THE ART
PhD thesis Michael Bernhard 25
and 45 s, respectively, and may accumulate tensile strains over a distance of 0.18 m (0.01
%P) and 0.90 m (0.197 %P) in the casting machine. Hence, even at low amount of 0.10 %C,
the distance of strain accumulation is more than five times higher in casting rephosphorized
steel grades.
Figure 13: Influence of phosphorus on the critical temperature range of hot tearing depending on the
carbon content. Case 1: 0.10%C-0.16%Si-0.60%Mn-0.003%S. Case 2: Fe-C-0.04%P along with
calculations of Wolf and Kurz [85].
2.2 Computer coupling of phase diagrams and thermochemistry
The following sections deal with the fundamentals of computational thermodynamics. The
first part demonstrates the CALPHAD-type optimization procedure of binary and ternary
systems and highlights the key issues in developing thermodynamic databases for
multicomponent alloys. The second part summarizes the mathematical formulations of the
Gibbs-energy equations for solutions and compounds, which were used in the framework of
developing databases for the Fe-P and Fe-C-P systems in previous work and the present
study. Finally, selected applications of a CALPHAD-based software to the continuous casting
process will be be presented.
STATE OF THE ART
PhD thesis Michael Bernhard 26
2.2.1 Computational thermodynamics: The CALPHAD approach
New innovations in recent steel design and the successful control of advanced steelmaking
processes require accurate thermodynamic data: In the past decades, extensive experimental
research of phase diagrams, phase transformations and thermodynamic properties in
multicomponent steel alloys has been carried out. Experiments - on laboratory or industrial
scale - are the key for developing a fundamental understanding of the material behavior under
real process conditions. However, experiments are time consuming and cost-intensive and
reliable data are often available only in limited alloying ranges. With the advances in the
computer technology, the idea of computer aided thermodynamic calculations was therefore
born. 50 years ago, Kaufmann and Bernstein [94] introduced the CALPHAD (CALculation of
PHAse Diagrams) approach; originally intended to perform phase diagram calculations.
Nowadays, this concept is widely used in the field of Integrated Computational Materials
Engineering (ICME) [95–97] enabling the calculation of a large variety of data, involving phase
equilibria, chemical activities and calorimetric functions (H, CP, …), from a self-consistent set
of Gibbs energy parameters of the alloying system. [98] These model parameters (see Chapter 2.2.2) are typically stored in thermodynamic database files. The great advantage of
CALPHAD-type databases is their possible extrapolation to higher-order multicomponent
systems as well as to provide detailed information on thermodynamic properties and phase
equilibria over the whole composition range of steel. For that purpose, various commercial
thermochemical software packages with comprehensive databases are available, e.g.
FactSage [28], MatCalc [99], MTDATA [100], Pandat [101] and ThermoCalc [102]. Recently,
OpenCalphad [103] and PyCalphad [104] were developed in the framework of open-source
software projects. Due to the general nature of the CALPHAD method, the terms
“computational thermodynamics” or “computational thermochemistry” were established.
[98,105]
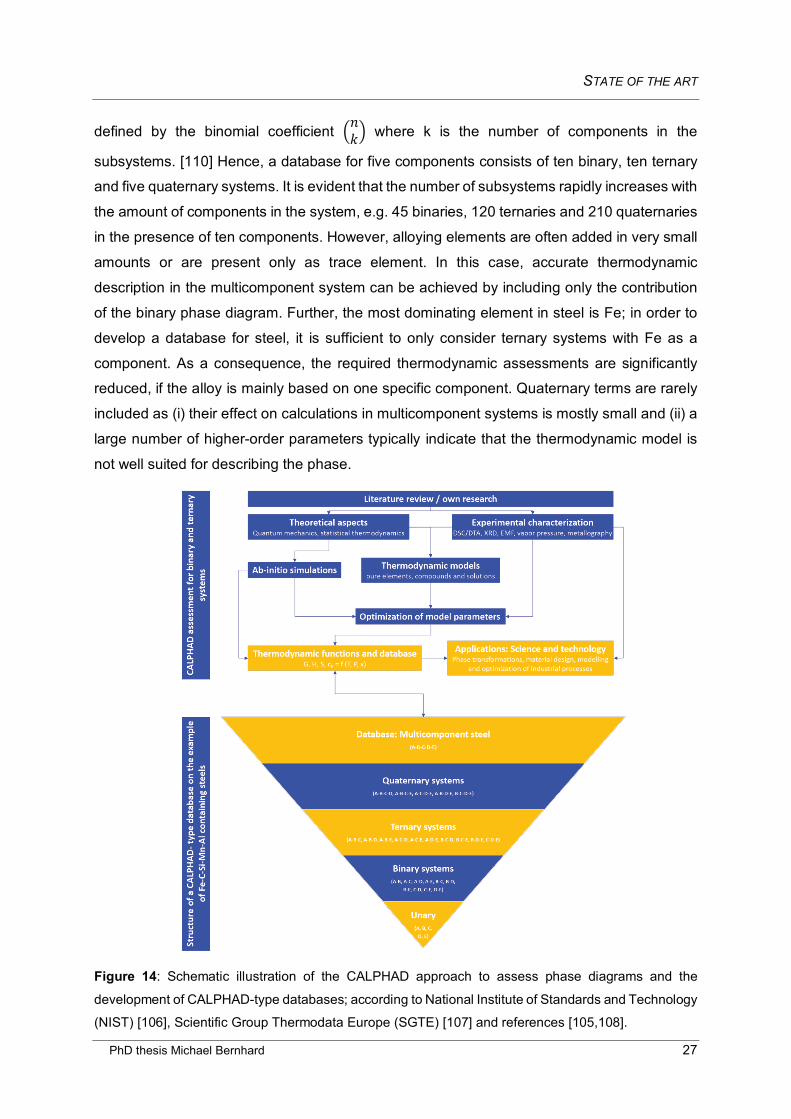
For schematic illustration, the development of a CALPHAD-type database for five components is graphically represented in Figure 14. [105–108]. Typically, one begins with the
implementation of the Gibbs energy descriptions of the pure components which are listed as
functions of temperature and pressure in the work of Dinsdale [109]. These data are universally
accepted in the scientific community and considered as standard reference data for the unary
phases. The actual database work starts by modelling binary, ternary and rarely, quaternary
subsystems. This procedure is known as “assessment” or “optimization” of the phase diagram,
meaning more or less, that the Gibbs energy model parameters of the stable phases are
adjusted with respect to the available experimental data. The number of constituent
subsystems which have to be considered in the optimization of an n-component system is
STATE OF THE ART
PhD thesis Michael Bernhard 28
The classical way of assessing a binary or ternary system can be summarized as follows [111].
Part I (Literature study): The optimization starts with the literature survey of all available
crystallographic information and experimental data. There exist a large number of techniques
to study phase diagrams and thermodynamic relations in alloys, e.g. thermal analysis and
metallography to identify phase stabilities, or, on the other hand, galvanic cells and vapor
pressure measurements to obtain chemical potential data. The first part builds the most crucial
step in developing a high quality database as the final calculation results will strongly depend
on the underlying experimental datasets. Hence, one has to critically evaluate the data
concerning reliability. To this, Kattner [112] pointed out the following criteria:
• Purity of the starting materials and sample preparation,
• reactions of the sample with the environment (evaporation, reaction with the crucible),
• quality of the reference sample and the calibration of the instruments used,
• analysis of the results and accurate documentation (numerical values and error bars) and
• use of originally measured data only; derived data may include errors due to interpretation
or conversion. [113]
Besides experiments, computational results obtained from first-principle quantum mechanics
based on the density functional theory (DFT) have been frequently implemented in the
CALPHAD approach [114–116]. DFT data are often used to describe enthalpies of formation of end-members in the compound energy formulation (CEF) model (Chapter 2.2.2). Such
enthalpy values are generally hypothetical and cannot be validated experimentally.
Part II (Selection of thermodynamic models): Experimental information and crystal structure
data enable a proper selection of the thermodynamic model for each phase. In general, the
description should be kept as simple as possible but it has to be noted that the more suitable
the model choice, the more accurate is the extrapolation to higher-order systems. [111]
Part III (Optimization of the model parameters): It is evident that for hundreds of experimental
data, the manual optimization by trial-and-error procedure means often great work effort and
requires high expertise in selecting the relevant parameter sets. For complex systems and a
high number of experimental data various programs were developed in the scientific
community based on least-square methods [117], Levenberg-Marquardt method [118] or
Bayesian estimation approach [119]. [110] The most important software tools are BINGSS
[105,120], ESPEI [121], OptiSage [28] and the PARROT module [105,122].
Part IV (Database management): By storing all Gibbs energy parameters in the database file,
several thousands of lines are created. In order to guarantee a detailed overview of the used
sources, a precise documentation has to be included in the data file. Within updating the
STATE OF THE ART
PhD thesis Michael Bernhard 29
database with new thermodynamic information, one has to consider the influence of a selected
subsystem on the thermodynamic description of the multicomponent system. For example, if
a binary phase diagram A-B is updated, the adjustment will influence all other ternary systems
containing the A-B system.
Part V (Applications in science and technology): A recent review on the way from database
development to virtual steelmaking process simulations (e.g. dephosphorization of hot metal
in the basic oxygen furnace, degassing processes and reoxidation in the continuous casting
process) using the FactSage thermochemical software [28] was given by Jung and van Ende
[123]. With respect to continuous casting, the MatCalc tool [99] provides a large variety of
options to predict precipitation formation in the solid state in processing of micro-alloyed steels
[124–126]. An application of a CALPHAD-based software to solidification simulation and
quality prediction in the continuous casting process is also content of Chapter 2.2.3.
2.2.2 Thermodynamic modelling of solutions
The general form of the Gibbs energy G of a phase θ per mole of components (subscript m)
is given by Equation 6 [105,127],
Gmθ = Gmθ,srf + Gm
θ,phys − TSmθ,conf + Gm
θ,E (6)
where Gmθ,srf = xiGi° is the “surface” Gibbs energy representing the mechanical mixture of the
the pure components in the phase; xi = ni/n is the mole fraction of the component i. Gmθ,phys is
the contribution to the Gibbs energy by other physical phenomena, e.g. the magnetic transition
in Fe [105]. The configurational entropy Smθ,conf of a phase, results from statistical
thermodynamics and defines the possible positions of the constituents in the phase according
to the Boltzmann equation S = R/NAln(W). Using Stirling’s formula the configurational entropy
is expressed as S = -RΣxilnxi. [105] The term Gmθ,E is the excess Gibbs energy and corresponds,
more or less, to the difference between the real Gibbs energy and the summation of the first
three parts. [105,128]
The excess term Gmθ,E is the actual parameter optimized in the CALPHAD-type thermodynamic
assessments of phase diagrams. In general, the more accurate the model selection for a
phase, the less excess parameters will be required to guarantee accurate calculation results.
The various thermodynamic models used in modelling work of the Fe-P and Fe-C-P systems
will be explained in the following sections.
STATE OF THE ART
PhD thesis Michael Bernhard 30
2.2.2.1 Gibbs-energy of pure elements and stoichiometric compounds
Pure elements and stoichiometric compounds (STCO) are phases with a fixed composition
over their whole stability range. The Gibbs energy is therefore not depending on the
composition, but on temperature and pressure. However, in thermodynamic modelling of steel
alloys, the pressure is typically considered to be equal to the atmospheric pressure and is kept
constant at 1 atm. The Gibbs energies of pure elements and STCO are of frequently formulated as a power series in temperature as given in Equation 7 [105]
Gm − ∑ biHiSER
i = a0 + a1T + a2Tln(T) + a3T2 + a4T−2 + a5T3 + ⋯ (7)
Here, bi is the stoichiometric coefficient of a component i in the phase θ. As the Gibbs energy
is typically referenced to a standard state of 298.15 K (25 °C) and 1 bar, the sum ∑ biHiSER
i
introduces the enthalpies in the “standard element reference (SER) state”. The Gibbs energies
of pure elements as function of temperature (and pressure) and in various stable crystal
structures are summarized in the classic work of Dinsdale [109].
A vast number of calorimetric studies on STCO is available from literature for Fe-based
systems. The experimental data generally include (i) the enthalpy of formation of the
compounds (ΔHf) at selected temperatures, (ii) the heat capacities cp depending on
temperatures and (iii) the Gibbs energies of formation ΔGf derived from measurements of
chemical reactions, e.g. vapor pressure measurements by Knudsen effusion cells [129]. In
modelling the Gibbs energy of STCO, the data can be directly used according to Equation 8 considering the typical occuring experimental erros.
Gm = ∆H298.15f + ∫ cpdTT
298.15 − T �S298.15 + ∫ �cp/T�dTT298.15 � (8)
∆H298.15f is the standard enthalpy of formation at 298.15 K (25 °C), cP the heat capacity over
temperature and S298.15 the standard entropy at 25 °C.
2.2.2.2 Bragg-Williams (BW) model and compound-energy formalism (CEF)
The single-lattice Bragg-Williams (BW) model assumes random mixing of the components
in the unit cell and hence the probability of occupying the sites is identical for all components.
The Gibbs energy for a multicomponent system is given by Equation 9
Gm = ∑ xiGi°ni=1 + RT∑ xiln(xi) + GmEn
i=1 + Gmphys (9)
In the substitutional solution, the excess Gibbs energy is directly linked to the possible
interaction of the components. Hence, in a binary solution, the GmE term is depending on the
respective mole fractions, given by Equation 10
STATE OF THE ART
PhD thesis Michael Bernhard 31
GmE = ∑ ∑ xixjLijnj=i+1
n−1i=1 (10)
Lij are the binary Redlich-Kister polynomials [130], see following Equation 11:
Lij = ∑ �xi − xj�v
Lijvkv=0 (11)
where Lijv is linearly depending on T (Equation 12):
Lijv = aij + bijTvv (12)
Similar applies for the ternary interaction terms in Equation 13 [105]
GmE = ∑ ∑ ∑ xixjxkLijknk=j+1
n−1j=i+1
n−2i=1 (13)
with the composition dependend ternary excess parameters, as for example suggested by
Hillert [131] in Equation 14 (a) - (b):
Lijk = vi Lijki + vj Lijkj + vk Lijkk (14a)
vi,j,k = xi,j,k + �1− xi − xj − xk�/3 (14b)
For steel, the liquid phase is often modelled by the BW-model. However, the single-lattice BW-
model is limited for the γ-Fe and α/δ-Fe solid solutions as small elements like C and N occupy
the interstitial sites. Hence, the compound-energy formalism (CEF) [132] is typically used to
describe the thermodynamic properties of austenite and ferrite. Considering a ternary solution,
where A and B are located on the substitutional sublattice and C and Va (vacancies) occupy
the interstital sites, noted by (A,B)a(C,Va)b,the Gibbs energy is given by Equation 15. The
stoichiometric coefficients are a = b = 1 for austenite and a = 1 and b = 3 for ferrite.
Gm = yA′ yVa′′ GA:Va + yA′ yC′′GA:C + yB′ yVa′′ GB:Va + yB′ yC′′GB:C
+aRT(yA′ lnyA′ + yB′ lnyB′ ) + bRT(yC′′lnyC′′ + yVa′′ lnyVa′′ )
+∑ yi′yj′yk′′Li,j:ki,j,k + ∑ yk′ yi′′yj′′Lk:i,ji,j,k + ∑ yi′yj′yk′′yl′′Li,j:k,li,j,k,l + Gmphys (15)
In Equation 15, yi is the site fraction, defined by yi = ni(s)/n(s) and gives the constituent fraction
of i on the sublattice s. Li,j:k and Lk:i,j are the interaction energies between i and j if the other
sublattice is solely occupied by k, whereas Li,j:k,l is the reciprocal parameter describing the
interaction among i, j, k, and l. The term Gi:j is the Gibbs energy of an “end-member” (ij for
ferrite and ij3 for austenite): All elements are stable in a specific crystal structure, e.g. bcc and
fcc in case of Fe, but show also a certain solubility in a different phases, e.g. P in fcc and bcc
structure. The Gibbs energies of end-members of pure elements GA:Va or GB:Va in various
crystal structures are called “lattice stabilities” and are summarized in the work of Dinsdale
together. On the other hand, the end-members GA:C and GB:C in the CEF are often hypothetical
STATE OF THE ART
PhD thesis Michael Bernhard 32
values, where the second sublattice is fully occupied by the component C. For these values,
experimental data are rarely available and are often calculated by atomistic modelling
approaches. The Gibbs-energy of an end-member is given similarly to Equation 7. If no
measured heat capacity is found in literature, only two coefficients are considered according
to Equation 16. In this case the heat capacity is taken from the values of pure elements. [105]
Gm − ∑ biHiSER
i = a0 + a1T (16)
The CEF is the actual extension of the substitutional model to various sublattices and reduces
to the BW-model if only one sublattice is occupied by constituents. [132] It represents a more
general mathematic approach to include substitutional and interstitial solutions. [127]
2.2.2.3 Modified quasichemical model (MQM) for short-range ordering (SRO)
Short-range-ordering (SRO) describes a local ordering phenomenon on distances close to
the atomic spacings due to energetically favorable configurations of specific atomic pairs. [133]
According to Pelton and Kang [134], SRO in a solution is characterized by a negative “V-
shaped” course in the enthalpy of mixing and a “M-shaped” entropy of mixing. The modified
quasichemical model (MQM) in the pair-approximation [135,136] enables to take into account
strong SRO effects exhibited in the liquid phase of Fe-based systems. Briefly summarized, the model considers the exchange reaction of pairs on the site of a quasi-lattice (Equation 17).
(A − A) + (B − B) = 2(A − B); ΔgAB (17)
(i-j) corresponds to the first nearest neighbor pair and ΔgAB represents the non-configurational
Gibbs free energy change forming two moles of (i-j) pairs. For a detailed mathematical
description of the MQM [135,136], the author likes to refer to Paper II. Remarkable success
was achieved using the MQM for liquid metallic solutions with respect to steel, e.g. Fe-Si [137],
Fe-B [138], Fe-C-Mn and Fe-Mn-Al [139], Fe-C-Cu [140], Fe-C-Mn-S subsystems [141–143],
Fe-Ni-S [144,145] or Mn-Si-C [146].
Maximum SRO composition and partial enthalpies of mixing: Based on outcomings from
extensive modelling work of the FactSage group, this chapter emphasizes numerous
advantages of the MQM compared to BW-models. Specific results for the Fe-P and Fe-C-P
system will be discussed in Chapter 4.2 and can be found in Paper II. Taking the example of
the binary Fe-B [138,147] and Mn-C [146,148] systems, the calculated integral and partial
enthalpies of the liquid phase are plotted in Figure 15 and Figure 16 along with calorimetric
data from literature [149,150]. At low amounts of boron or carbon, respectively, the partial
enthalpies of mixing are independend on xB and xC, but show a sharp increase at a specific
chemical composition. This is an evidence of strong SRO between Fe and B, as well as
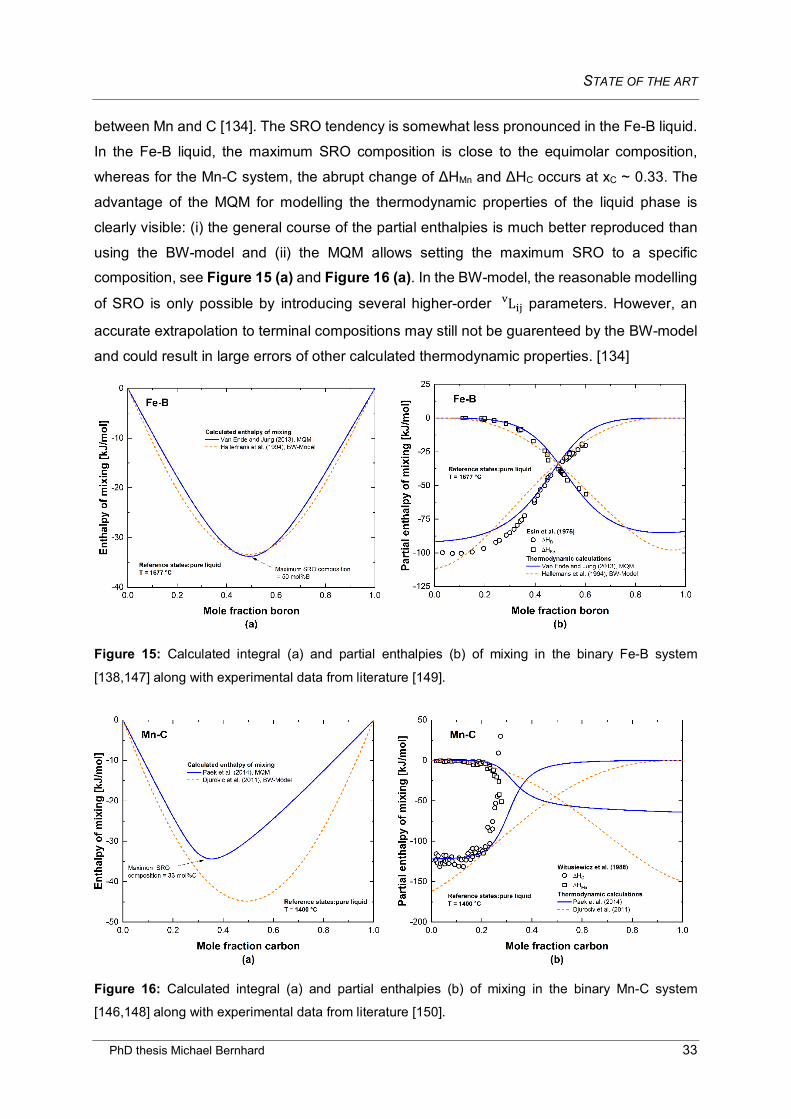
STATE OF THE ART
PhD thesis Michael Bernhard 33
between Mn and C [134]. The SRO tendency is somewhat less pronounced in the Fe-B liquid.
In the Fe-B liquid, the maximum SRO composition is close to the equimolar composition,
whereas for the Mn-C system, the abrupt change of ΔHMn and ΔHC occurs at xC ~ 0.33. The
advantage of the MQM for modelling the thermodynamic properties of the liquid phase is
clearly visible: (i) the general course of the partial enthalpies is much better reproduced than
using the BW-model and (ii) the MQM allows setting the maximum SRO to a specific composition, see Figure 15 (a) and Figure 16 (a). In the BW-model, the reasonable modelling
of SRO is only possible by introducing several higher-order Lijv parameters. However, an
accurate extrapolation to terminal compositions may still not be guarenteed by the BW-model
and could result in large errors of other calculated thermodynamic properties. [134]
Figure 15: Calculated integral (a) and partial enthalpies (b) of mixing in the binary Fe-B system
[138,147] along with experimental data from literature [149].
Figure 16: Calculated integral (a) and partial enthalpies (b) of mixing in the binary Mn-C system
[146,148] along with experimental data from literature [150].
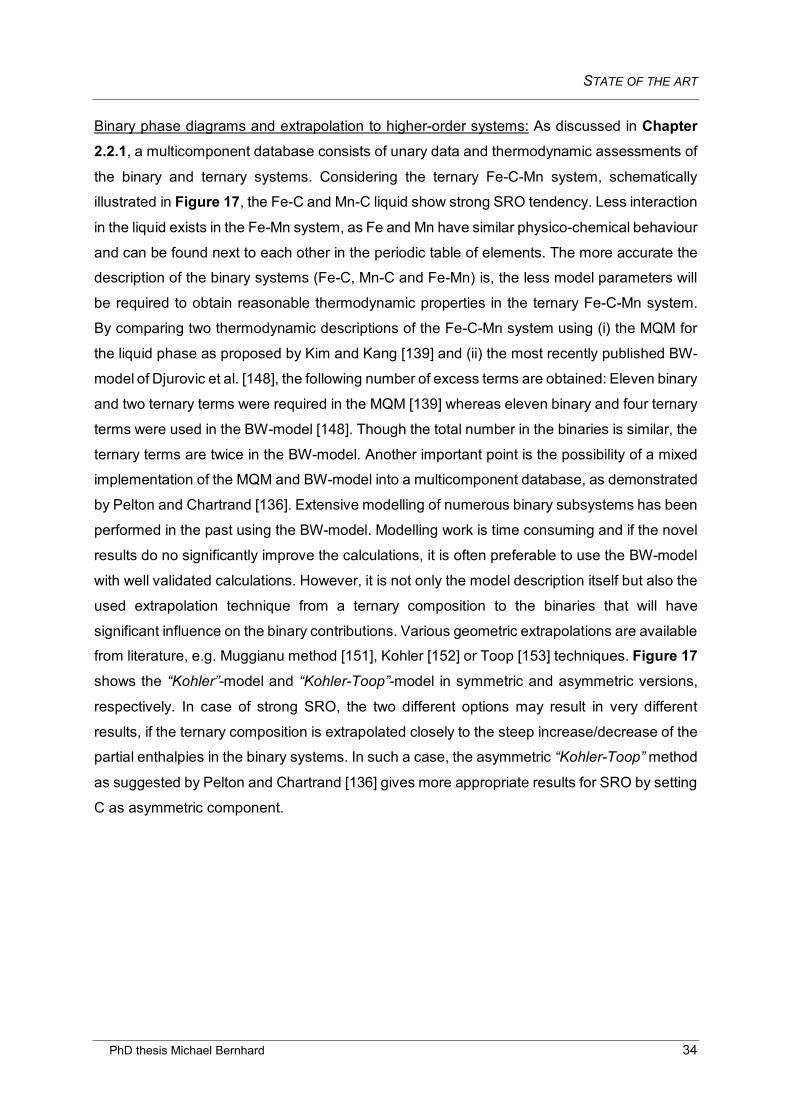
STATE OF THE ART
PhD thesis Michael Bernhard 34
Binary phase diagrams and extrapolation to higher-order systems: As discussed in Chapter 2.2.1, a multicomponent database consists of unary data and thermodynamic assessments of
the binary and ternary systems. Considering the ternary Fe-C-Mn system, schematically
illustrated in Figure 17, the Fe-C and Mn-C liquid show strong SRO tendency. Less interaction
in the liquid exists in the Fe-Mn system, as Fe and Mn have similar physico-chemical behaviour
and can be found next to each other in the periodic table of elements. The more accurate the
description of the binary systems (Fe-C, Mn-C and Fe-Mn) is, the less model parameters will
be required to obtain reasonable thermodynamic properties in the ternary Fe-C-Mn system.
By comparing two thermodynamic descriptions of the Fe-C-Mn system using (i) the MQM for
the liquid phase as proposed by Kim and Kang [139] and (ii) the most recently published BW-
model of Djurovic et al. [148], the following number of excess terms are obtained: Eleven binary
and two ternary terms were required in the MQM [139] whereas eleven binary and four ternary
terms were used in the BW-model [148]. Though the total number in the binaries is similar, the
ternary terms are twice in the BW-model. Another important point is the possibility of a mixed
implementation of the MQM and BW-model into a multicomponent database, as demonstrated
by Pelton and Chartrand [136]. Extensive modelling of numerous binary subsystems has been
performed in the past using the BW-model. Modelling work is time consuming and if the novel
results do no significantly improve the calculations, it is often preferable to use the BW-model
with well validated calculations. However, it is not only the model description itself but also the
used extrapolation technique from a ternary composition to the binaries that will have
significant influence on the binary contributions. Various geometric extrapolations are available from literature, e.g. Muggianu method [151], Kohler [152] or Toop [153] techniques. Figure 17
shows the “Kohler”-model and “Kohler-Toop”-model in symmetric and asymmetric versions,
respectively. In case of strong SRO, the two different options may result in very different
results, if the ternary composition is extrapolated closely to the steep increase/decrease of the
partial enthalpies in the binary systems. In such a case, the asymmetric “Kohler-Toop” method
as suggested by Pelton and Chartrand [136] gives more appropriate results for SRO by setting
C as asymmetric component.
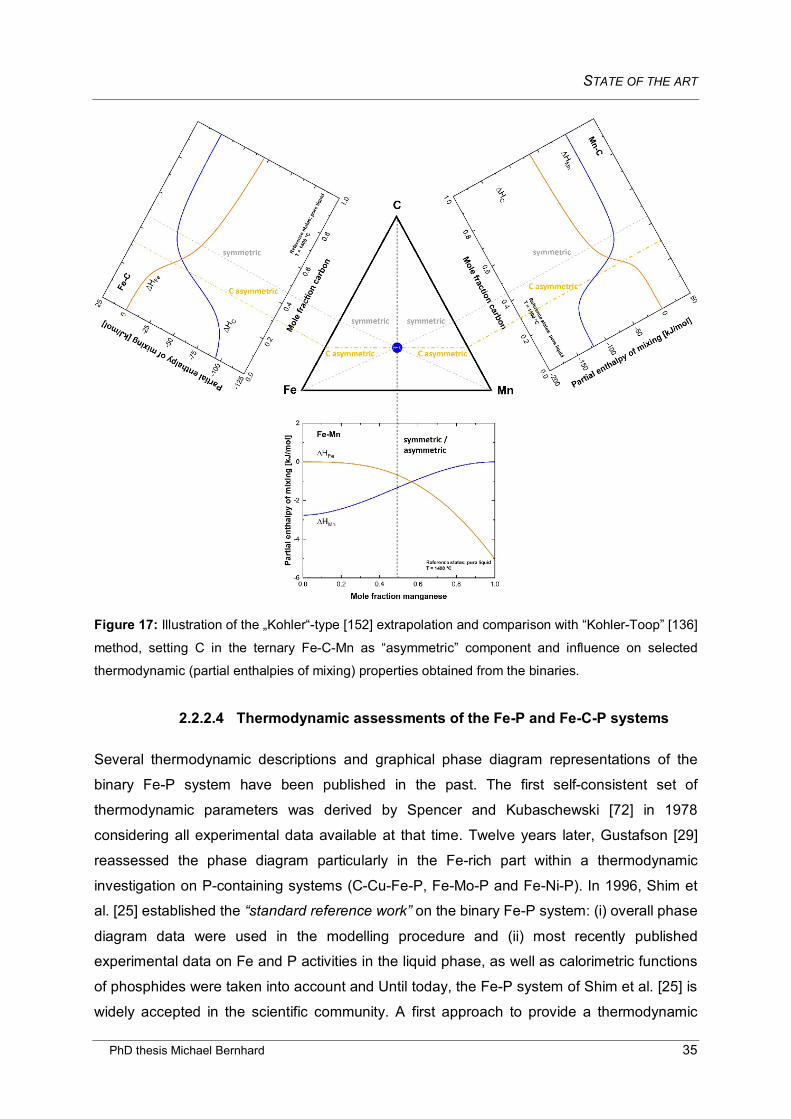
STATE OF THE ART
PhD thesis Michael Bernhard 35
Figure 17: Illustration of the „Kohler“-type [152] extrapolation and comparison with “Kohler-Toop” [136]
method, setting C in the ternary Fe-C-Mn as “asymmetric” component and influence on selected
thermodynamic (partial enthalpies of mixing) properties obtained from the binaries.
2.2.2.4 Thermodynamic assessments of the Fe-P and Fe-C-P systems
Several thermodynamic descriptions and graphical phase diagram representations of the
binary Fe-P system have been published in the past. The first self-consistent set of
thermodynamic parameters was derived by Spencer and Kubaschewski [72] in 1978
considering all experimental data available at that time. Twelve years later, Gustafson [29]
reassessed the phase diagram particularly in the Fe-rich part within a thermodynamic
investigation on P-containing systems (C-Cu-Fe-P, Fe-Mo-P and Fe-Ni-P). In 1996, Shim et
al. [25] established the “standard reference work” on the binary Fe-P system: (i) overall phase
diagram data were used in the modelling procedure and (ii) most recently published
experimental data on Fe and P activities in the liquid phase, as well as calorimetric functions
of phosphides were taken into account and Until today, the Fe-P system of Shim et al. [25] is
widely accepted in the scientific community. A first approach to provide a thermodynamic
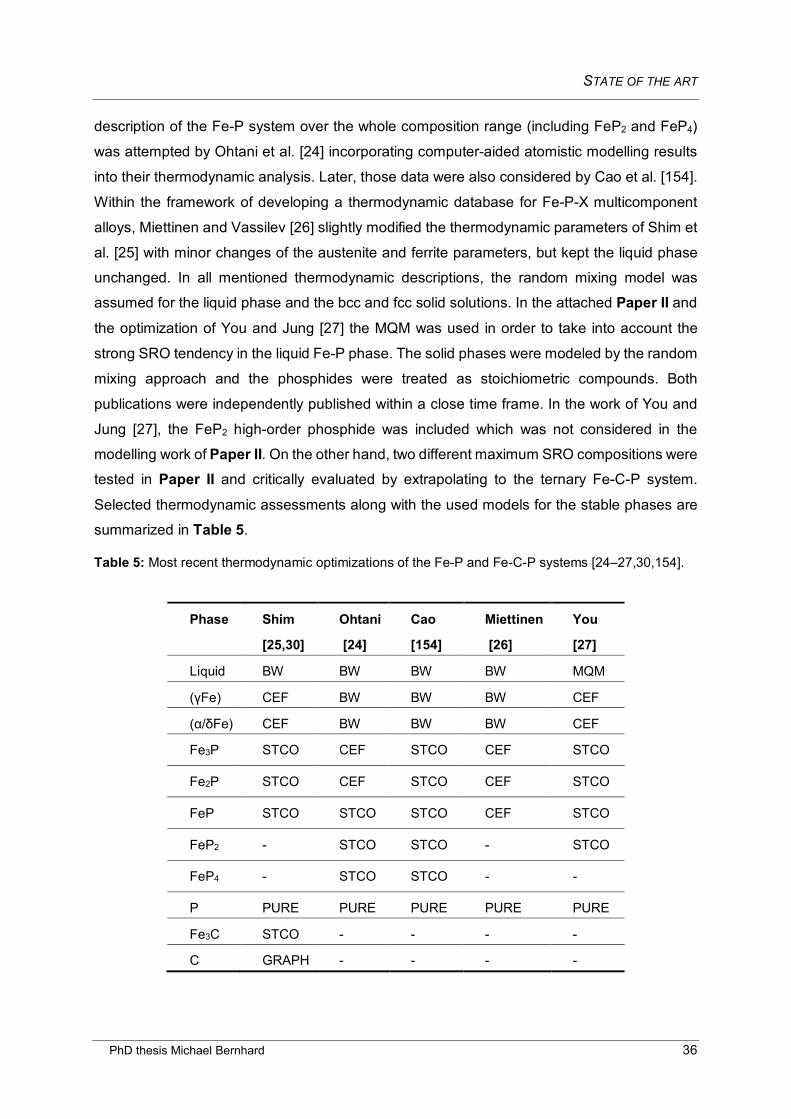
STATE OF THE ART
PhD thesis Michael Bernhard 36
description of the Fe-P system over the whole composition range (including FeP2 and FeP4)
was attempted by Ohtani et al. [24] incorporating computer-aided atomistic modelling results
into their thermodynamic analysis. Later, those data were also considered by Cao et al. [154].
Within the framework of developing a thermodynamic database for Fe-P-X multicomponent
alloys, Miettinen and Vassilev [26] slightly modified the thermodynamic parameters of Shim et
al. [25] with minor changes of the austenite and ferrite parameters, but kept the liquid phase
unchanged. In all mentioned thermodynamic descriptions, the random mixing model was
assumed for the liquid phase and the bcc and fcc solid solutions. In the attached Paper II and
the optimization of You and Jung [27] the MQM was used in order to take into account the
strong SRO tendency in the liquid Fe-P phase. The solid phases were modeled by the random
mixing approach and the phosphides were treated as stoichiometric compounds. Both
publications were independently published within a close time frame. In the work of You and
Jung [27], the FeP2 high-order phosphide was included which was not considered in the
modelling work of Paper II. On the other hand, two different maximum SRO compositions were
tested in Paper II and critically evaluated by extrapolating to the ternary Fe-C-P system.
Selected thermodynamic assessments along with the used models for the stable phases are
summarized in Table 5.
Table 5: Most recent thermodynamic optimizations of the Fe-P and Fe-C-P systems [24–27,30,154].
Phase Shim
[25,30]
Ohtani
[24]
Cao
[154]
Miettinen
[26]
You
[27]
Liquid BW BW BW BW MQM
(γFe) CEF BW BW BW CEF
(α/δFe) CEF BW BW BW CEF
Fe3P STCO CEF STCO CEF STCO
Fe2P STCO CEF STCO CEF STCO
FeP STCO STCO STCO CEF STCO
FeP2 - STCO STCO - STCO
FeP4 - STCO STCO - -
P PURE PURE PURE PURE PURE
Fe3C STCO - - - -
C GRAPH - - - -
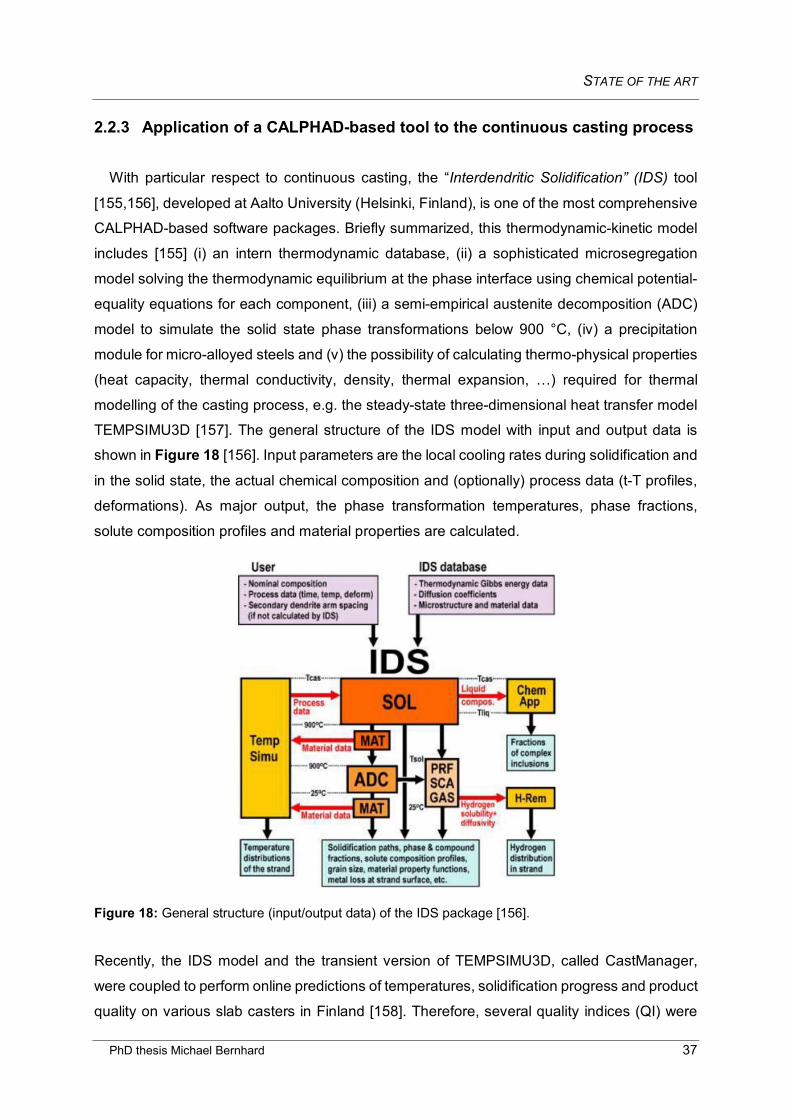
STATE OF THE ART
PhD thesis Michael Bernhard 37
2.2.3 Application of a CALPHAD-based tool to the continuous casting process
With particular respect to continuous casting, the “Interdendritic Solidification” (IDS) tool
[155,156], developed at Aalto University (Helsinki, Finland), is one of the most comprehensive
CALPHAD-based software packages. Briefly summarized, this thermodynamic-kinetic model
includes [155] (i) an intern thermodynamic database, (ii) a sophisticated microsegregation
model solving the thermodynamic equilibrium at the phase interface using chemical potential-
equality equations for each component, (iii) a semi-empirical austenite decomposition (ADC)
model to simulate the solid state phase transformations below 900 °C, (iv) a precipitation
module for micro-alloyed steels and (v) the possibility of calculating thermo-physical properties
(heat capacity, thermal conductivity, density, thermal expansion, …) required for thermal
modelling of the casting process, e.g. the steady-state three-dimensional heat transfer model
TEMPSIMU3D [157]. The general structure of the IDS model with input and output data is
shown in Figure 18 [156]. Input parameters are the local cooling rates during solidification and
in the solid state, the actual chemical composition and (optionally) process data (t-T profiles,
deformations). As major output, the phase transformation temperatures, phase fractions,
solute composition profiles and material properties are calculated.
Figure 18: General structure (input/output data) of the IDS package [156].
Recently, the IDS model and the transient version of TEMPSIMU3D, called CastManager,
were coupled to perform online predictions of temperatures, solidification progress and product
quality on various slab casters in Finland [158]. Therefore, several quality indices (QI) were
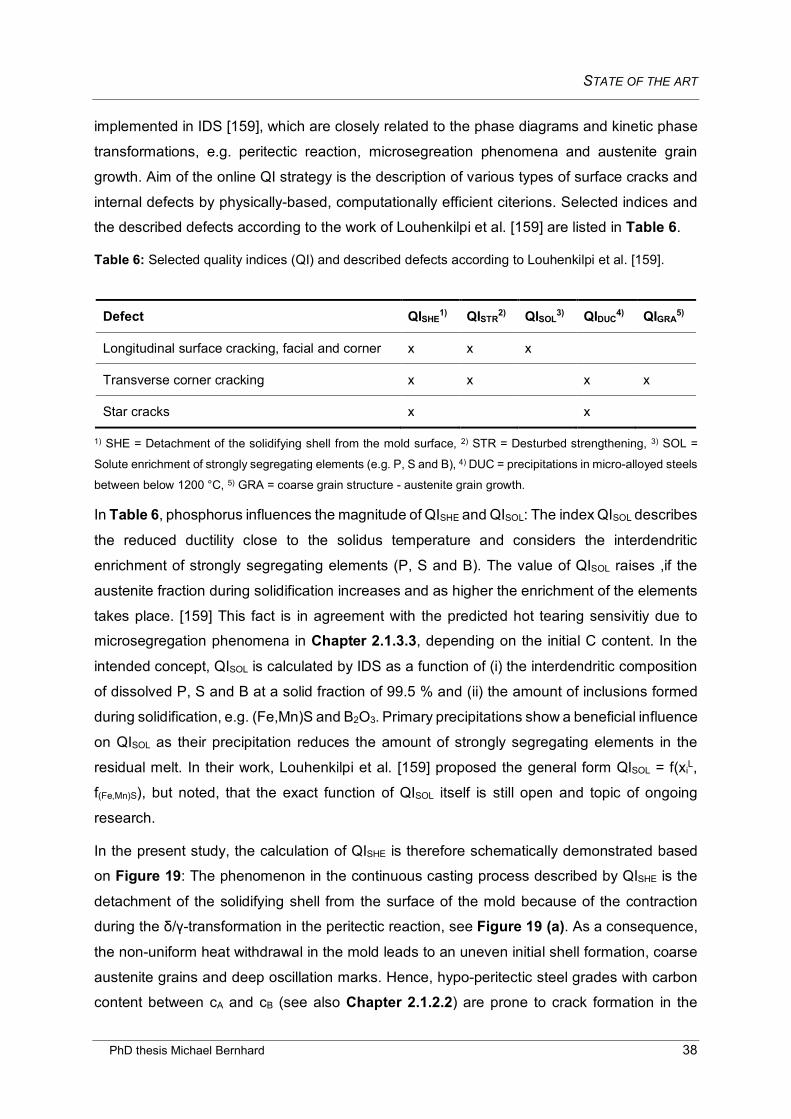
STATE OF THE ART
PhD thesis Michael Bernhard 38
implemented in IDS [159], which are closely related to the phase diagrams and kinetic phase
transformations, e.g. peritectic reaction, microsegreation phenomena and austenite grain
growth. Aim of the online QI strategy is the description of various types of surface cracks and
internal defects by physically-based, computationally efficient citerions. Selected indices and
the described defects according to the work of Louhenkilpi et al. [159] are listed in Table 6.
Table 6: Selected quality indices (QI) and described defects according to Louhenkilpi et al. [159].
Defect QISHE1) QISTR
2) QISOL3) QIDUC
4) QIGRA5)
Longitudinal surface cracking, facial and corner x x x
Transverse corner cracking x x x x
Star cracks x x
1) SHE = Detachment of the solidifying shell from the mold surface, 2) STR = Desturbed strengthening, 3) SOL =
Solute enrichment of strongly segregating elements (e.g. P, S and B), 4) DUC = precipitations in micro-alloyed steels
between below 1200 °C, 5) GRA = coarse grain structure - austenite grain growth.
In Table 6, phosphorus influences the magnitude of QISHE and QISOL: The index QISOL describes
the reduced ductility close to the solidus temperature and considers the interdendritic
enrichment of strongly segregating elements (P, S and B). The value of QISOL raises ,if the
austenite fraction during solidification increases and as higher the enrichment of the elements
takes place. [159] This fact is in agreement with the predicted hot tearing sensivitiy due to microsegregation phenomena in Chapter 2.1.3.3, depending on the initial C content. In the
intended concept, QISOL is calculated by IDS as a function of (i) the interdendritic composition
of dissolved P, S and B at a solid fraction of 99.5 % and (ii) the amount of inclusions formed
during solidification, e.g. (Fe,Mn)S and B2O3. Primary precipitations show a beneficial influence
on QISOL as their precipitation reduces the amount of strongly segregating elements in the
residual melt. In their work, Louhenkilpi et al. [159] proposed the general form QISOL = f(xiL,
f(Fe,Mn)S), but noted, that the exact function of QISOL itself is still open and topic of ongoing
research.
In the present study, the calculation of QISHE is therefore schematically demonstrated based
on Figure 19: The phenomenon in the continuous casting process described by QISHE is the
detachment of the solidifying shell from the surface of the mold because of the contraction
during the δ/γ-transformation in the peritectic reaction, see Figure 19 (a). As a consequence,
the non-uniform heat withdrawal in the mold leads to an uneven initial shell formation, coarse
austenite grains and deep oscillation marks. Hence, hypo-peritectic steel grades with carbon
content between cA and cB (see also Chapter 2.1.2.2) are prone to crack formation in the
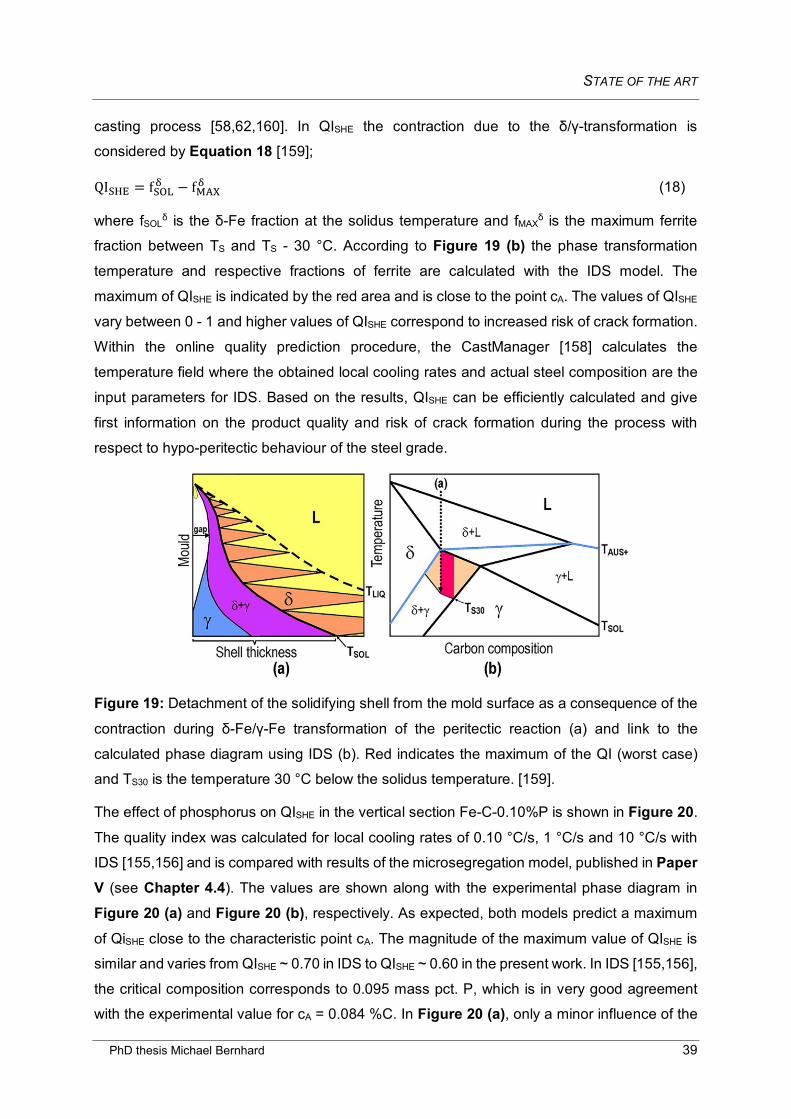
STATE OF THE ART
PhD thesis Michael Bernhard 39
casting process [58,62,160]. In QISHE the contraction due to the δ/γ-transformation is
considered by Equation 18 [159];
QISHE = fSOLδ − fMAXδ (18)
where fSOLδ is the δ-Fe fraction at the solidus temperature and fMAX
δ is the maximum ferrite
fraction between TS and TS - 30 °C. According to Figure 19 (b) the phase transformation
temperature and respective fractions of ferrite are calculated with the IDS model. The
maximum of QISHE is indicated by the red area and is close to the point cA. The values of QISHE
vary between 0 - 1 and higher values of QISHE correspond to increased risk of crack formation.
Within the online quality prediction procedure, the CastManager [158] calculates the
temperature field where the obtained local cooling rates and actual steel composition are the
input parameters for IDS. Based on the results, QISHE can be efficiently calculated and give
first information on the product quality and risk of crack formation during the process with
respect to hypo-peritectic behaviour of the steel grade.
Figure 19: Detachment of the solidifying shell from the mold surface as a consequence of the
contraction during δ-Fe/γ-Fe transformation of the peritectic reaction (a) and link to the
calculated phase diagram using IDS (b). Red indicates the maximum of the QI (worst case)
and TS30 is the temperature 30 °C below the solidus temperature. [159].
The effect of phosphorus on QISHE in the vertical section Fe-C-0.10%P is shown in Figure 20.
The quality index was calculated for local cooling rates of 0.10 °C/s, 1 °C/s and 10 °C/s with
IDS [155,156] and is compared with results of the microsegregation model, published in Paper V (see Chapter 4.4). The values are shown along with the experimental phase diagram in
Figure 20 (a) and Figure 20 (b), respectively. As expected, both models predict a maximum
of QiSHE close to the characteristic point cA. The magnitude of the maximum value of QISHE is
similar and varies from QISHE ~ 0.70 in IDS to QISHE ~ 0.60 in the present work. In IDS [155,156],
the critical composition corresponds to 0.095 mass pct. P, which is in very good agreement
with the experimental value for cA = 0.084 %C. In Figure 20 (a), only a minor influence of the
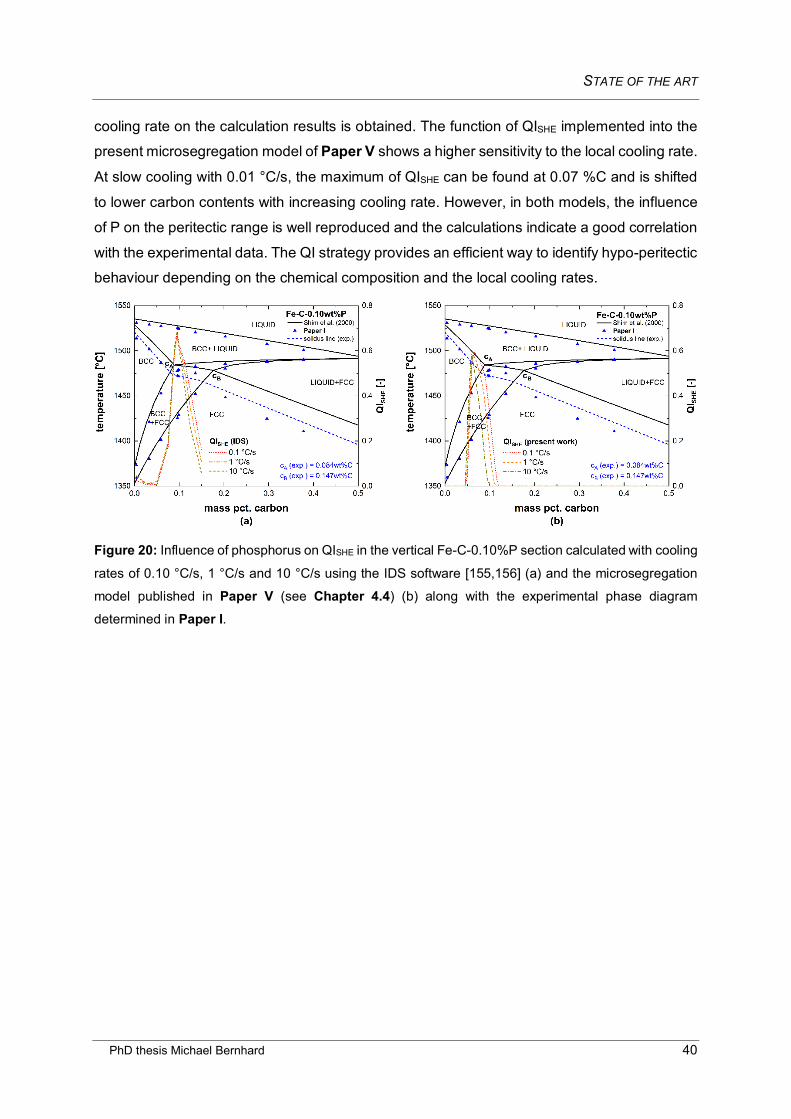
STATE OF THE ART
PhD thesis Michael Bernhard 40
cooling rate on the calculation results is obtained. The function of QISHE implemented into the
present microsegregation model of Paper V shows a higher sensitivity to the local cooling rate.
At slow cooling with 0.01 °C/s, the maximum of QISHE can be found at 0.07 %C and is shifted
to lower carbon contents with increasing cooling rate. However, in both models, the influence
of P on the peritectic range is well reproduced and the calculations indicate a good correlation
with the experimental data. The QI strategy provides an efficient way to identify hypo-peritectic
behaviour depending on the chemical composition and the local cooling rates.
Figure 20: Influence of phosphorus on QISHE in the vertical Fe-C-0.10%P section calculated with cooling
rates of 0.10 °C/s, 1 °C/s and 10 °C/s using the IDS software [155,156] (a) and the microsegregation
model published in Paper V (see Chapter 4.4) (b) along with the experimental phase diagram
determined in Paper I.
LIST OF PUBLICATIONS
PhD thesis Michael Bernhard 41
3 List of publications
Peer-reviewed publications included in the PhD thesis
Paper I: M. Bernhard, P. Presoly, N. Fuchs, C. Bernhard and Y.-B. Kang, Experimental
Study of High Temperature Phase Equilibria in the Iron-Rich Part of the Fe-P
and Fe-C-P Systems, Metallurgical and Materials Transactions A, 2020, vol. 51,
pp. 5351-5364.
Paper II: M. Bernhard, Y.-B. Kang, P. Presoly, A.E. Gheribi and C. Bernhard, Critical
evaluation and thermodynamic modeling of the Fe–P and Fe–C–P system,
CALPHAD, 2020, vol. 70, art. no. 101795.
Paper III: M. Bernhard, N. Fuchs, P. Presoly, P. Angerer, B. Friessnegger and C.
Bernhard, Characterization of the γ-loop in the Fe-P system by coupling DSC
and HT-LSCM with complementary in-situ experimental techniques, Materials
Characterization, 2021, vol. 174, art. no. 111030.
Paper IV: M. Bernhard, P. Presoly, C. Bernhard, S, Hahn and S. Ilie, An assessment of
analytical liquidus equations for Fe-C-Si-Mn-Al-P alloyed steels using DSC/DTA
techniques, Metallurgical and Materials Transactions B, 2021.
Paper V: M. Bernhard, P. Presoly, C. Bernhard, J. Six and S. Ilie, On the relevance of
microsegregation models for process control in continuous casting of steel,
Proceedings of the 26th International Conference on Metallurgy and Materials,
2017, Brno, Czech Republic.
All publications are attached in Appendix A and contributions of the present author are listed
in detail in the following part.
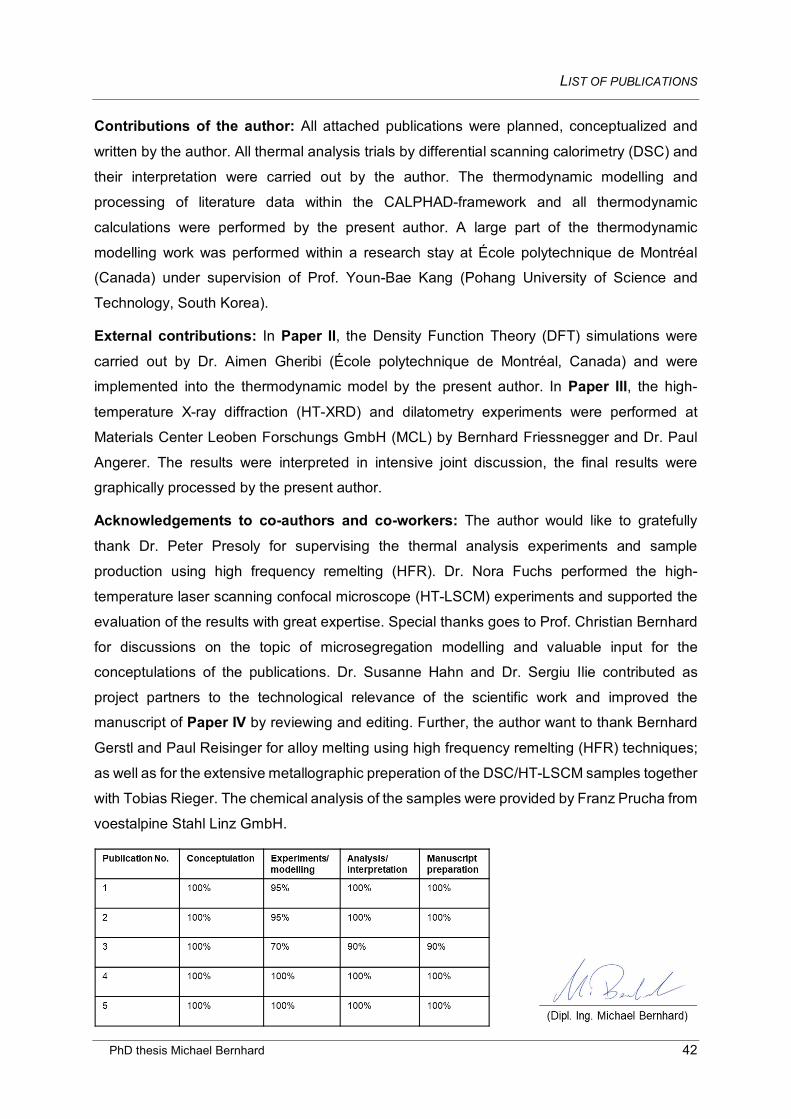
LIST OF PUBLICATIONS
PhD thesis Michael Bernhard 43
Conference contributions not included in the PhD thesis: M. Bernhard, C. Bernhard, P. Presoly and D. You, An alternative approach for the experimental
verification of microsegregation models using an in-situ hot tensile test during solidification of
steel, Proceedings of the 7th International Conference on Solidification and Gravity, 2018,
Miskolc-Lillafüred, Hungary.
P. Presoly, M. Bernhard, D. You and C. Bernhard, High concentrations at the final solidification
of advanced steels: Thermodynamic evaluation of replicated “segregation-samples” by means
of DTA/DSC-measurements, Proceedings of the 7th International Conference on Solidification
and Gravity, 2018, Miskolc-Lillafüred, Hungary.
P. Presoly, M. Bernhard and C. Bernhard, Investigation of the Fe-C-Si-Mn system with special
focus on the Fe – 3 wt.-% Si – high Mn section, Proceedings of CALPHAD XLVII: International
Conference on computer coupling of phase diagrams and thermochemistry, 2018, Queretaro,
Mexico.
P. Presoly, M. Bernhard, C. Bernhard, S. Hahn, P. Pennerstorfer, S. Ilie and S. Six, High
precious phase diagrams – a roadmap for a successful casting processing, Proceedings of the
4th European Steel Technology and Application Days, 2019, Düsseldorf, Germany.
G. Santos, C. Bernhard, M. Bernhard, M. Taferner, L. Preuler and S. Ilie, An Integrated
Approach for Near Process Modelling of the Continuous Casting of Steel, 9th International
Conference on Modeling and Simulation of Metallurgical Processes in Steelmaking, Vienna,
Austria, 2021, accepted.
M. Bernhard, P. Presoly and C. Bernhard, Experimental investigations and computational
thermodynamics of the Fe-C-P system, European Congress and Exhibition on Advanced
Materials and Processes (Euromat), 2021, Graz, Austria, accepted.
M. Bernhard, G. Santos, S. Ilie, L. Preuler and C. Bernhard, Investigations on hot tearing in a
continuous slab caster: Numerical modelling combined with analysis of plant results, 10th
European Conference on Continuous Casting, Bari, Italy, 2021, abstract accepted.
Other publications not included in the PhD thesis:
L. Drozdova, B. Smetana, P. Presoly, V. Novak, M. Machu, M. Bernhard, H. Francova, S. Zla,
L. Rehackova and C. Bernhard, Investigation of Fe–C–Cr and Fe–C–Cr–Ni‑based systems
with the use of DTA and HT‑LSCM methods, Journal of Thermal Analysis and Calorimetry,
2020, vol. 142, pp. 535-546.
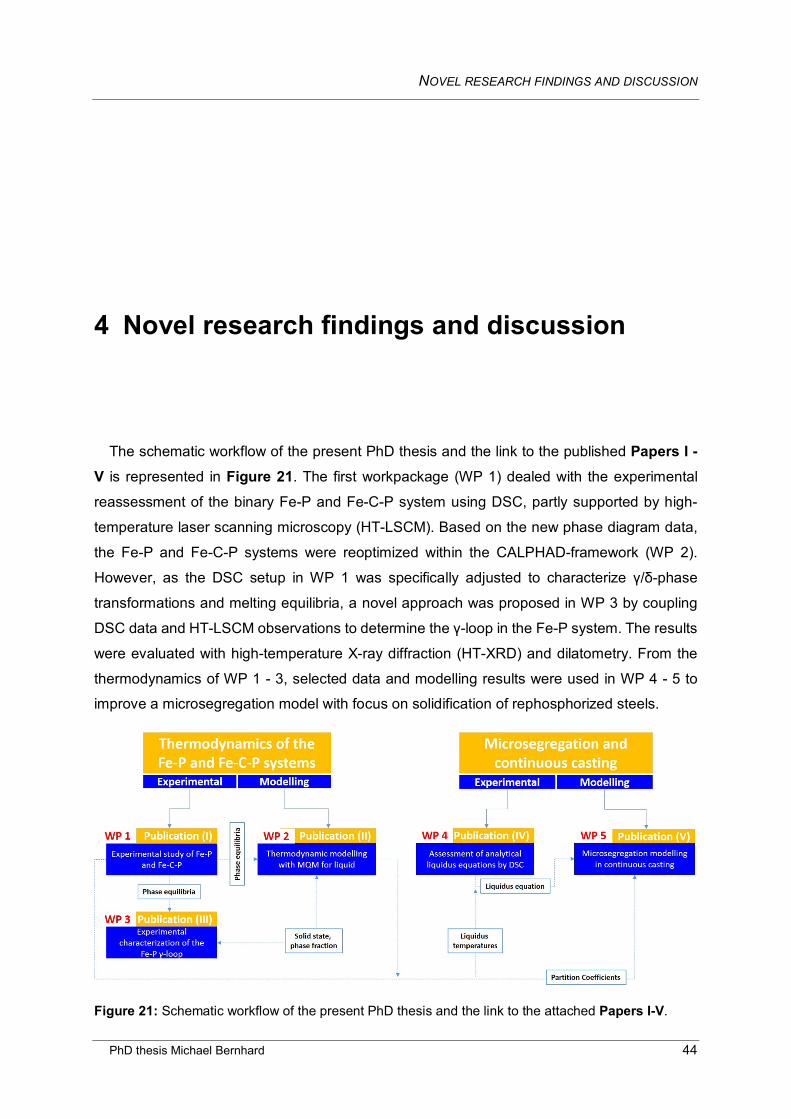
NOVEL RESEARCH FINDINGS AND DISCUSSION
PhD thesis Michael Bernhard 44
4 Novel research findings and discussion
The schematic workflow of the present PhD thesis and the link to the published Papers I - V is represented in Figure 21. The first workpackage (WP 1) dealed with the experimental
reassessment of the binary Fe-P and Fe-C-P system using DSC, partly supported by high-
temperature laser scanning microscopy (HT-LSCM). Based on the new phase diagram data,
the Fe-P and Fe-C-P systems were reoptimized within the CALPHAD-framework (WP 2).
However, as the DSC setup in WP 1 was specifically adjusted to characterize γ/δ-phase
transformations and melting equilibria, a novel approach was proposed in WP 3 by coupling
DSC data and HT-LSCM observations to determine the γ-loop in the Fe-P system. The results
were evaluated with high-temperature X-ray diffraction (HT-XRD) and dilatometry. From the
thermodynamics of WP 1 - 3, selected data and modelling results were used in WP 4 - 5 to
improve a microsegregation model with focus on solidification of rephosphorized steels.
Figure 21: Schematic workflow of the present PhD thesis and the link to the attached Papers I-V.
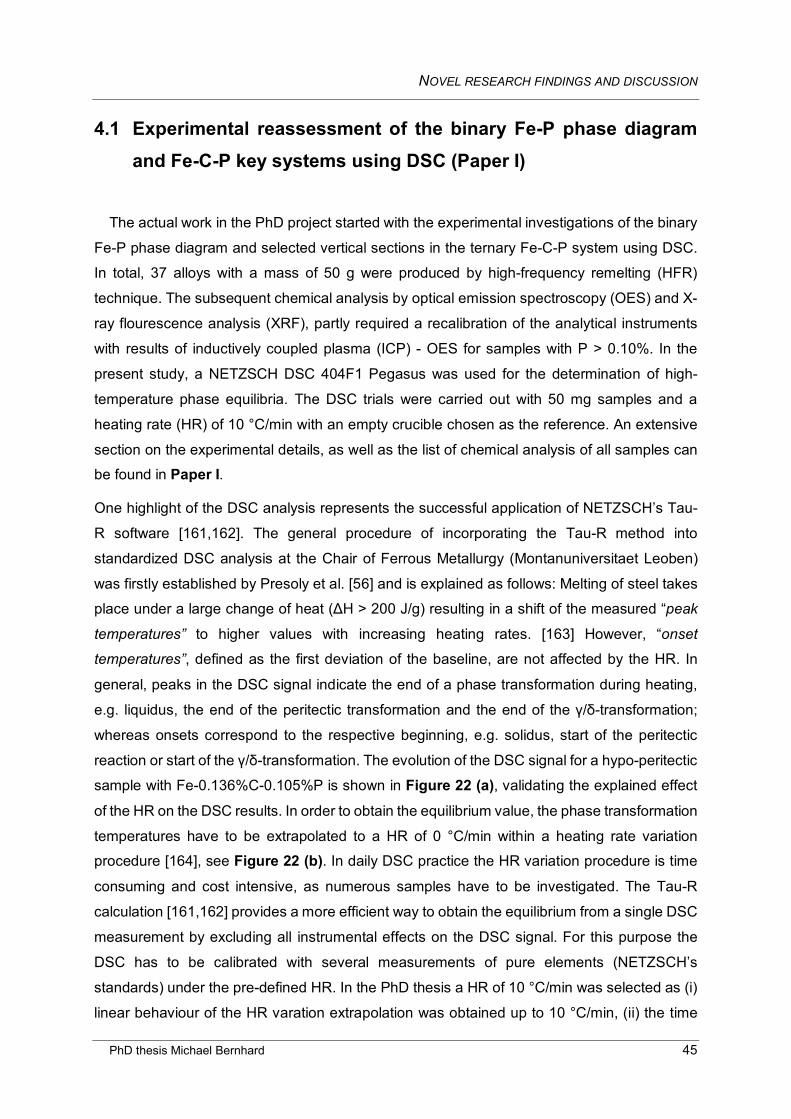
NOVEL RESEARCH FINDINGS AND DISCUSSION
PhD thesis Michael Bernhard 45
4.1 Experimental reassessment of the binary Fe-P phase diagram and Fe-C-P key systems using DSC (Paper I)
The actual work in the PhD project started with the experimental investigations of the binary
Fe-P phase diagram and selected vertical sections in the ternary Fe-C-P system using DSC.
In total, 37 alloys with a mass of 50 g were produced by high-frequency remelting (HFR)
technique. The subsequent chemical analysis by optical emission spectroscopy (OES) and X-
ray flourescence analysis (XRF), partly required a recalibration of the analytical instruments
with results of inductively coupled plasma (ICP) - OES for samples with P > 0.10%. In the
present study, a NETZSCH DSC 404F1 Pegasus was used for the determination of high-
temperature phase equilibria. The DSC trials were carried out with 50 mg samples and a
heating rate (HR) of 10 °C/min with an empty crucible chosen as the reference. An extensive
section on the experimental details, as well as the list of chemical analysis of all samples can be found in Paper I.
One highlight of the DSC analysis represents the successful application of NETZSCH’s Tau-
R software [161,162]. The general procedure of incorporating the Tau-R method into
standardized DSC analysis at the Chair of Ferrous Metallurgy (Montanuniversitaet Leoben)
was firstly established by Presoly et al. [56] and is explained as follows: Melting of steel takes
place under a large change of heat (ΔH > 200 J/g) resulting in a shift of the measured “peak
temperatures” to higher values with increasing heating rates. [163] However, “onset
temperatures”, defined as the first deviation of the baseline, are not affected by the HR. In
general, peaks in the DSC signal indicate the end of a phase transformation during heating,
e.g. liquidus, the end of the peritectic transformation and the end of the γ/δ-transformation;
whereas onsets correspond to the respective beginning, e.g. solidus, start of the peritectic
reaction or start of the γ/δ-transformation. The evolution of the DSC signal for a hypo-peritectic
sample with Fe-0.136%C-0.105%P is shown in Figure 22 (a), validating the explained effect
of the HR on the DSC results. In order to obtain the equilibrium value, the phase transformation
temperatures have to be extrapolated to a HR of 0 °C/min within a heating rate variation procedure [164], see Figure 22 (b). In daily DSC practice the HR variation procedure is time
consuming and cost intensive, as numerous samples have to be investigated. The Tau-R
calculation [161,162] provides a more efficient way to obtain the equilibrium from a single DSC
measurement by excluding all instrumental effects on the DSC signal. For this purpose the
DSC has to be calibrated with several measurements of pure elements (NETZSCH’s
standards) under the pre-defined HR. In the PhD thesis a HR of 10 °C/min was selected as (i)
linear behaviour of the HR varation extrapolation was obtained up to 10 °C/min, (ii) the time
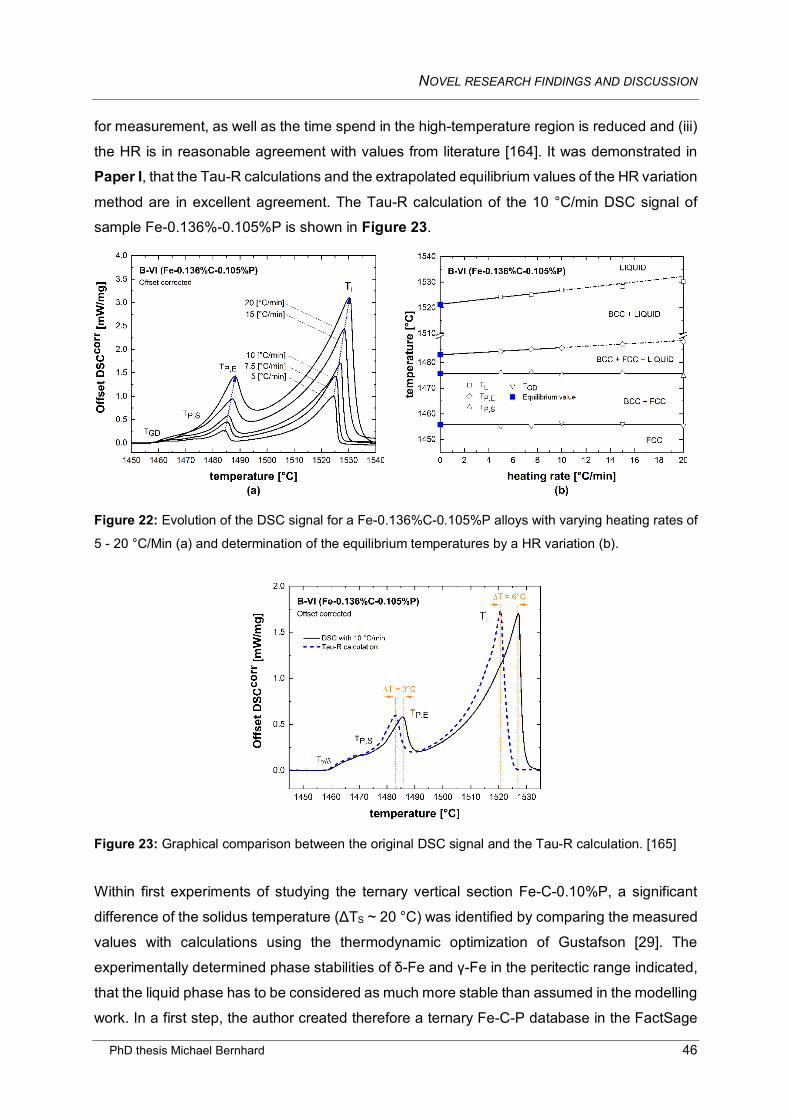
NOVEL RESEARCH FINDINGS AND DISCUSSION
PhD thesis Michael Bernhard 46
for measurement, as well as the time spend in the high-temperature region is reduced and (iii)
the HR is in reasonable agreement with values from literature [164]. It was demonstrated in
Paper I, that the Tau-R calculations and the extrapolated equilibrium values of the HR variation
method are in excellent agreement. The Tau-R calculation of the 10 °C/min DSC signal of
sample Fe-0.136%-0.105%P is shown in Figure 23.
Figure 22: Evolution of the DSC signal for a Fe-0.136%C-0.105%P alloys with varying heating rates of
5 - 20 °C/Min (a) and determination of the equilibrium temperatures by a HR variation (b).
Figure 23: Graphical comparison between the original DSC signal and the Tau-R calculation. [165]
Within first experiments of studying the ternary vertical section Fe-C-0.10%P, a significant
difference of the solidus temperature (ΔTS ~ 20 °C) was identified by comparing the measured
values with calculations using the thermodynamic optimization of Gustafson [29]. The
experimentally determined phase stabilities of δ-Fe and γ-Fe in the peritectic range indicated,
that the liquid phase has to be considered as much more stable than assumed in the modelling
work. In a first step, the author created therefore a ternary Fe-C-P database in the FactSage
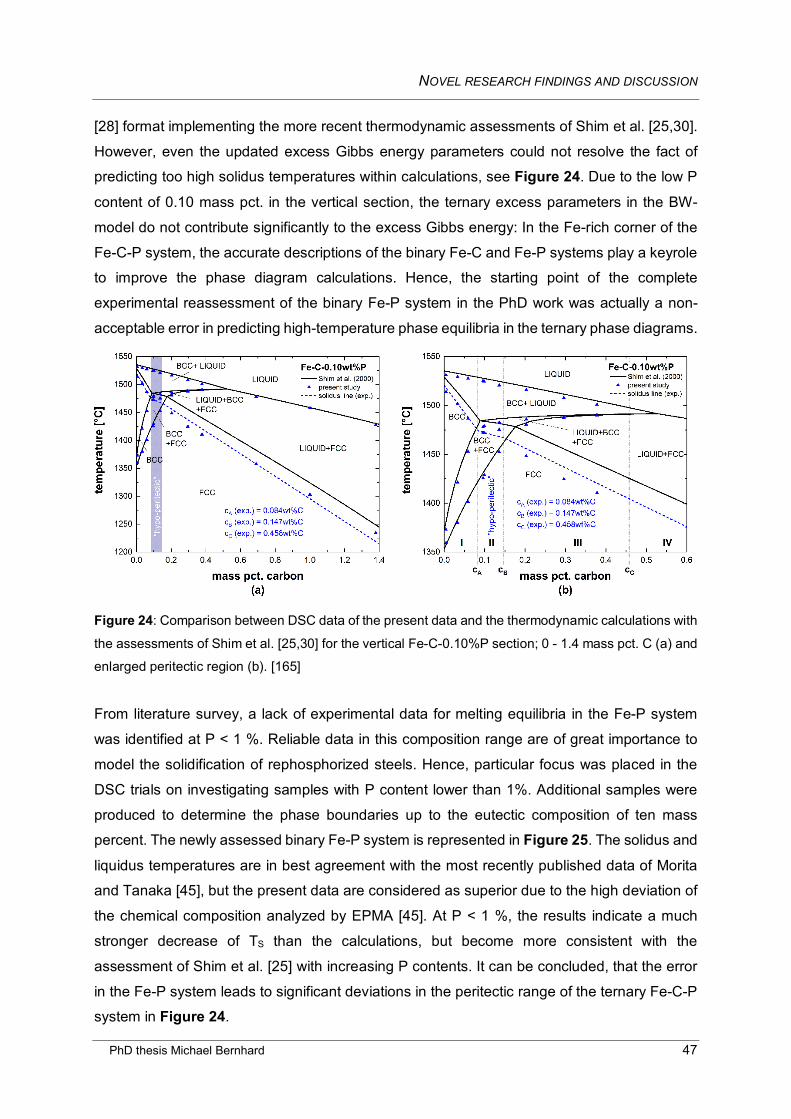
NOVEL RESEARCH FINDINGS AND DISCUSSION
PhD thesis Michael Bernhard 47
[28] format implementing the more recent thermodynamic assessments of Shim et al. [25,30].
However, even the updated excess Gibbs energy parameters could not resolve the fact of
predicting too high solidus temperatures within calculations, see Figure 24. Due to the low P
content of 0.10 mass pct. in the vertical section, the ternary excess parameters in the BW-
model do not contribute significantly to the excess Gibbs energy: In the Fe-rich corner of the
Fe-C-P system, the accurate descriptions of the binary Fe-C and Fe-P systems play a keyrole
to improve the phase diagram calculations. Hence, the starting point of the complete
experimental reassessment of the binary Fe-P system in the PhD work was actually a non-
acceptable error in predicting high-temperature phase equilibria in the ternary phase diagrams.
Figure 24: Comparison between DSC data of the present data and the thermodynamic calculations with
the assessments of Shim et al. [25,30] for the vertical Fe-C-0.10%P section; 0 - 1.4 mass pct. C (a) and
enlarged peritectic region (b). [165]
From literature survey, a lack of experimental data for melting equilibria in the Fe-P system
was identified at P < 1 %. Reliable data in this composition range are of great importance to
model the solidification of rephosphorized steels. Hence, particular focus was placed in the
DSC trials on investigating samples with P content lower than 1%. Additional samples were
produced to determine the phase boundaries up to the eutectic composition of ten mass
percent. The newly assessed binary Fe-P system is represented in Figure 25. The solidus and
liquidus temperatures are in best agreement with the most recently published data of Morita
and Tanaka [45], but the present data are considered as superior due to the high deviation of
the chemical composition analyzed by EPMA [45]. At P < 1 %, the results indicate a much
stronger decrease of TS than the calculations, but become more consistent with the
assessment of Shim et al. [25] with increasing P contents. It can be concluded, that the error
in the Fe-P system leads to significant deviations in the peritectic range of the ternary Fe-C-P
system in Figure 24.
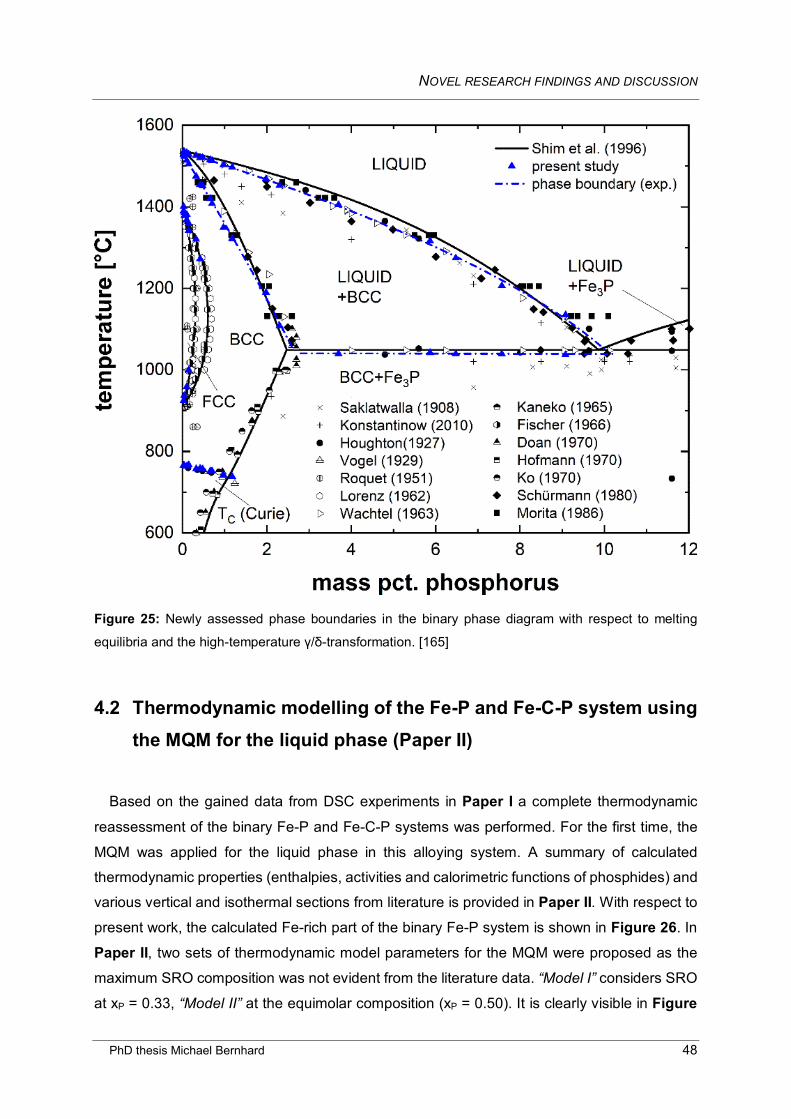
NOVEL RESEARCH FINDINGS AND DISCUSSION
PhD thesis Michael Bernhard 48
Figure 25: Newly assessed phase boundaries in the binary phase diagram with respect to melting
equilibria and the high-temperature γ/δ-transformation. [165]
4.2 Thermodynamic modelling of the Fe-P and Fe-C-P system using the MQM for the liquid phase (Paper II)
Based on the gained data from DSC experiments in Paper I a complete thermodynamic
reassessment of the binary Fe-P and Fe-C-P systems was performed. For the first time, the
MQM was applied for the liquid phase in this alloying system. A summary of calculated
thermodynamic properties (enthalpies, activities and calorimetric functions of phosphides) and
various vertical and isothermal sections from literature is provided in Paper II. With respect to
present work, the calculated Fe-rich part of the binary Fe-P system is shown in Figure 26. In
Paper II, two sets of thermodynamic model parameters for the MQM were proposed as the
maximum SRO composition was not evident from the literature data. “Model I” considers SRO
at xP = 0.33, “Model II” at the equimolar composition (xP = 0.50). It is clearly visible in Figure
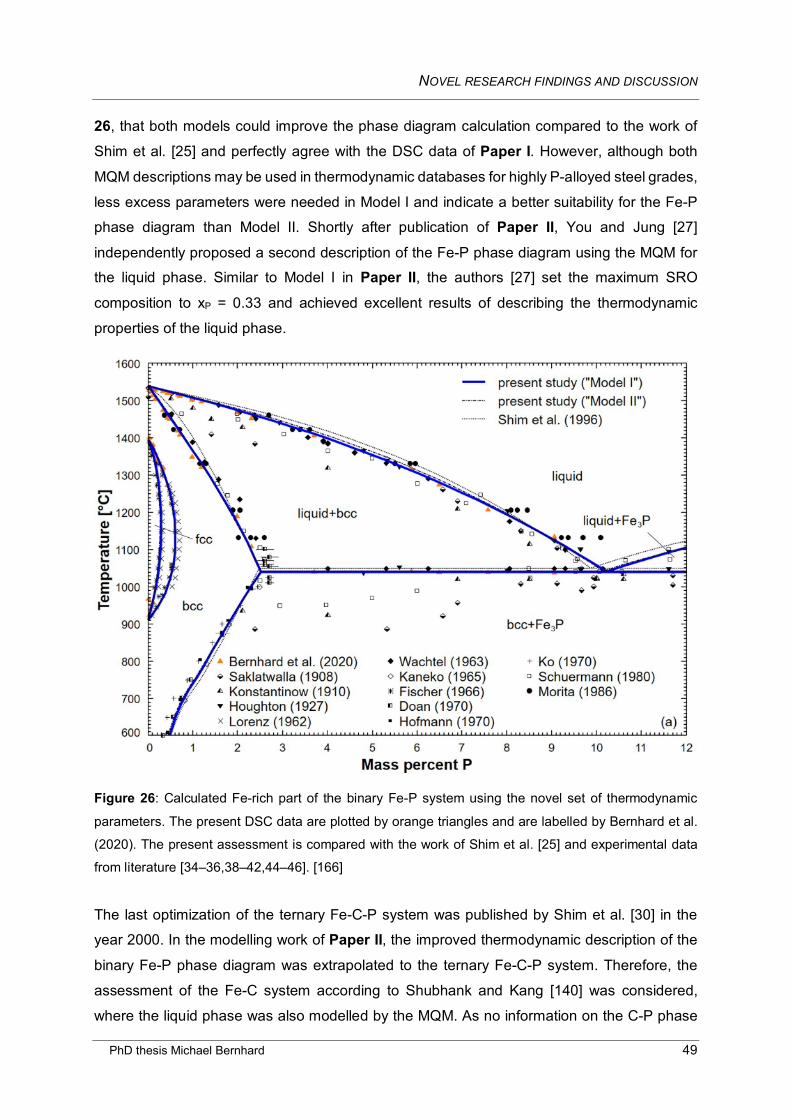
NOVEL RESEARCH FINDINGS AND DISCUSSION
PhD thesis Michael Bernhard 49
26, that both models could improve the phase diagram calculation compared to the work of
Shim et al. [25] and perfectly agree with the DSC data of Paper I. However, although both
MQM descriptions may be used in thermodynamic databases for highly P-alloyed steel grades,
less excess parameters were needed in Model I and indicate a better suitability for the Fe-P
phase diagram than Model II. Shortly after publication of Paper II, You and Jung [27]
independently proposed a second description of the Fe-P phase diagram using the MQM for the liquid phase. Similar to Model I in Paper II, the authors [27] set the maximum SRO
composition to xP = 0.33 and achieved excellent results of describing the thermodynamic
properties of the liquid phase.
Figure 26: Calculated Fe-rich part of the binary Fe-P system using the novel set of thermodynamic
parameters. The present DSC data are plotted by orange triangles and are labelled by Bernhard et al.
(2020). The present assessment is compared with the work of Shim et al. [25] and experimental data
from literature [34–36,38–42,44–46]. [166]
The last optimization of the ternary Fe-C-P system was published by Shim et al. [30] in the
year 2000. In the modelling work of Paper II, the improved thermodynamic description of the
binary Fe-P phase diagram was extrapolated to the ternary Fe-C-P system. Therefore, the
assessment of the Fe-C system according to Shubhank and Kang [140] was considered,
where the liquid phase was also modelled by the MQM. As no information on the C-P phase
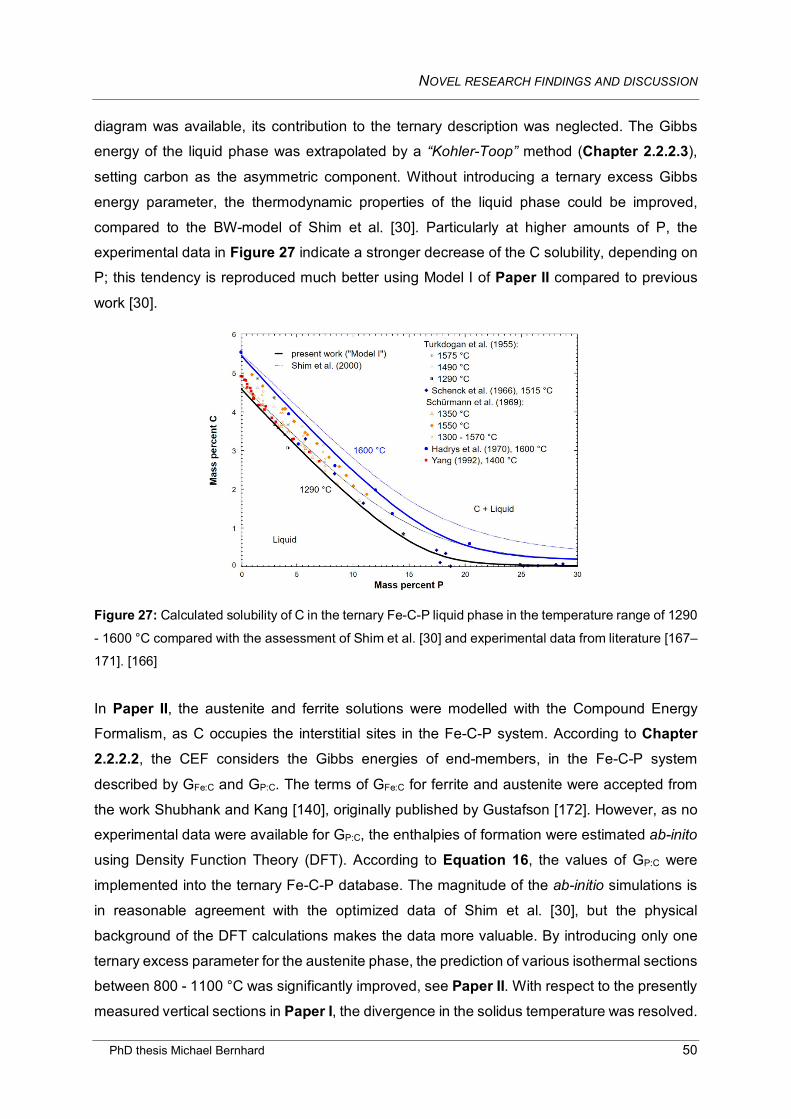
NOVEL RESEARCH FINDINGS AND DISCUSSION
PhD thesis Michael Bernhard 50
diagram was available, its contribution to the ternary description was neglected. The Gibbs
energy of the liquid phase was extrapolated by a “Kohler-Toop” method (Chapter 2.2.2.3),
setting carbon as the asymmetric component. Without introducing a ternary excess Gibbs
energy parameter, the thermodynamic properties of the liquid phase could be improved,
compared to the BW-model of Shim et al. [30]. Particularly at higher amounts of P, the
experimental data in Figure 27 indicate a stronger decrease of the C solubility, depending on
P; this tendency is reproduced much better using Model I of Paper II compared to previous
work [30].
Figure 27: Calculated solubility of C in the ternary Fe-C-P liquid phase in the temperature range of 1290
- 1600 °C compared with the assessment of Shim et al. [30] and experimental data from literature [167–
171]. [166]
In Paper II, the austenite and ferrite solutions were modelled with the Compound Energy
Formalism, as C occupies the interstitial sites in the Fe-C-P system. According to Chapter 2.2.2.2, the CEF considers the Gibbs energies of end-members, in the Fe-C-P system
described by GFe:C and GP:C. The terms of GFe:C for ferrite and austenite were accepted from
the work Shubhank and Kang [140], originally published by Gustafson [172]. However, as no
experimental data were available for GP:C, the enthalpies of formation were estimated ab-inito
using Density Function Theory (DFT). According to Equation 16, the values of GP:C were
implemented into the ternary Fe-C-P database. The magnitude of the ab-initio simulations is
in reasonable agreement with the optimized data of Shim et al. [30], but the physical
background of the DFT calculations makes the data more valuable. By introducing only one
ternary excess parameter for the austenite phase, the prediction of various isothermal sections
between 800 - 1100 °C was significantly improved, see Paper II. With respect to the presently
measured vertical sections in Paper I, the divergence in the solidus temperature was resolved.
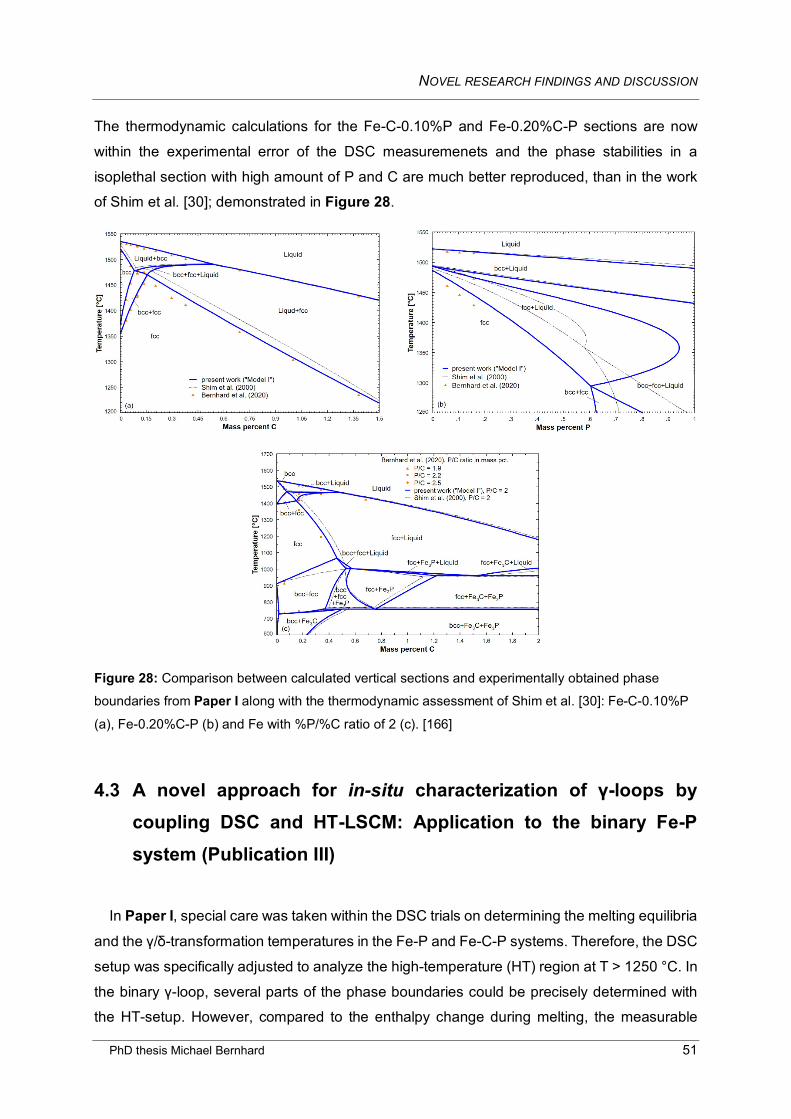
NOVEL RESEARCH FINDINGS AND DISCUSSION
PhD thesis Michael Bernhard 51
The thermodynamic calculations for the Fe-C-0.10%P and Fe-0.20%C-P sections are now
within the experimental error of the DSC measuremenets and the phase stabilities in a
isoplethal section with high amount of P and C are much better reproduced, than in the work
of Shim et al. [30]; demonstrated in Figure 28.
Figure 28: Comparison between calculated vertical sections and experimentally obtained phase
boundaries from Paper I along with the thermodynamic assessment of Shim et al. [30]: Fe-C-0.10%P
(a), Fe-0.20%C-P (b) and Fe with %P/%C ratio of 2 (c). [166]
4.3 A novel approach for in-situ characterization of γ-loops by coupling DSC and HT-LSCM: Application to the binary Fe-P system (Publication III)
In Paper I, special care was taken within the DSC trials on determining the melting equilibria
and the γ/δ-transformation temperatures in the Fe-P and Fe-C-P systems. Therefore, the DSC
setup was specifically adjusted to analyze the high-temperature (HT) region at T > 1250 °C. In
the binary γ-loop, several parts of the phase boundaries could be precisely determined with
the HT-setup. However, compared to the enthalpy change during melting, the measurable
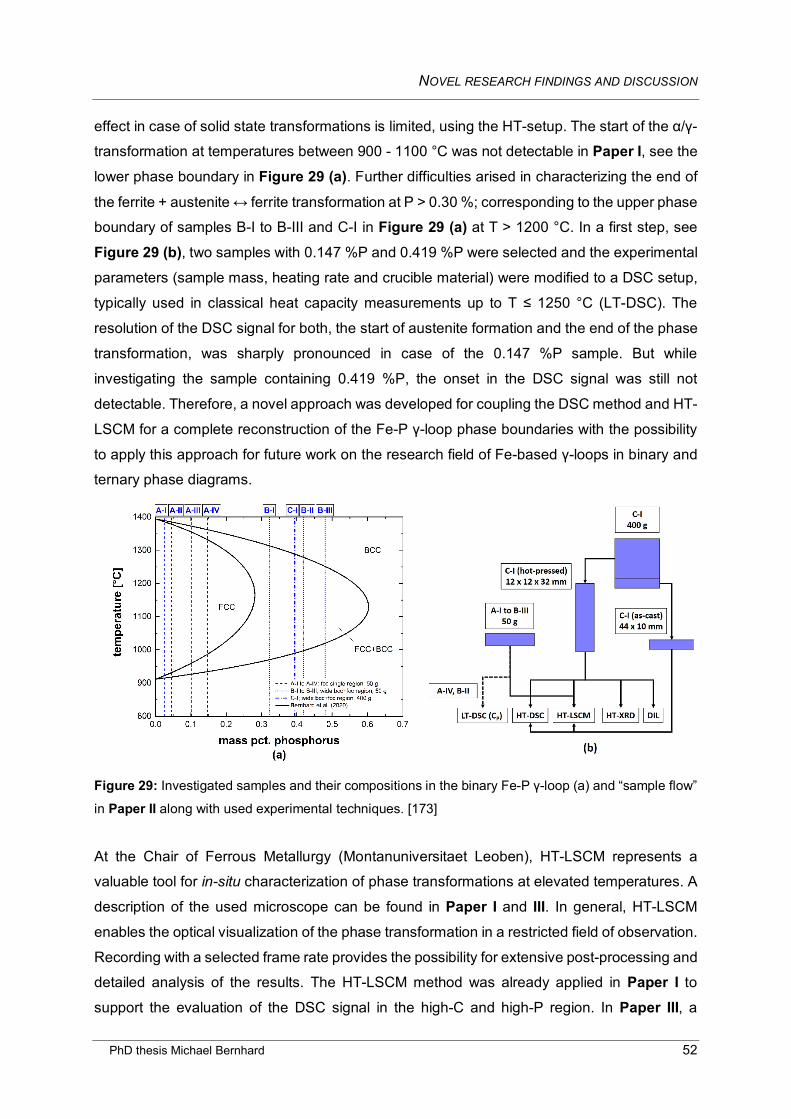
NOVEL RESEARCH FINDINGS AND DISCUSSION
PhD thesis Michael Bernhard 52
effect in case of solid state transformations is limited, using the HT-setup. The start of the α/γ-
transformation at temperatures between 900 - 1100 °C was not detectable in Paper I, see the
lower phase boundary in Figure 29 (a). Further difficulties arised in characterizing the end of
the ferrite + austenite ↔ ferrite transformation at P > 0.30 %; corresponding to the upper phase
boundary of samples B-I to B-III and C-I in Figure 29 (a) at T > 1200 °C. In a first step, see
Figure 29 (b), two samples with 0.147 %P and 0.419 %P were selected and the experimental
parameters (sample mass, heating rate and crucible material) were modified to a DSC setup,
typically used in classical heat capacity measurements up to T ≤ 1250 °C (LT-DSC). The
resolution of the DSC signal for both, the start of austenite formation and the end of the phase
transformation, was sharply pronounced in case of the 0.147 %P sample. But while
investigating the sample containing 0.419 %P, the onset in the DSC signal was still not
detectable. Therefore, a novel approach was developed for coupling the DSC method and HT-
LSCM for a complete reconstruction of the Fe-P γ-loop phase boundaries with the possibility
to apply this approach for future work on the research field of Fe-based γ-loops in binary and
ternary phase diagrams.
Figure 29: Investigated samples and their compositions in the binary Fe-P γ-loop (a) and “sample flow”
in Paper II along with used experimental techniques. [173]
At the Chair of Ferrous Metallurgy (Montanuniversitaet Leoben), HT-LSCM represents a
valuable tool for in-situ characterization of phase transformations at elevated temperatures. A
description of the used microscope can be found in Paper I and III. In general, HT-LSCM
enables the optical visualization of the phase transformation in a restricted field of observation.
Recording with a selected frame rate provides the possibility for extensive post-processing and
detailed analysis of the results. The HT-LSCM method was already applied in Paper I to
support the evaluation of the DSC signal in the high-C and high-P region. In Paper III, a
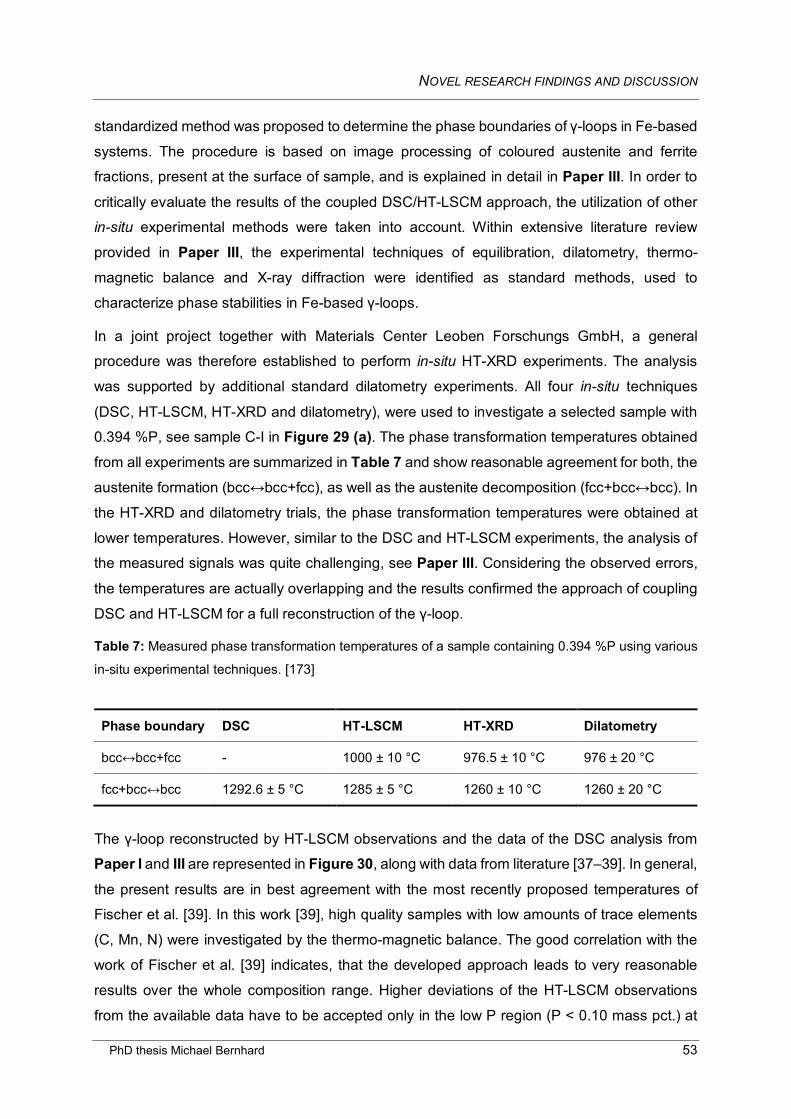
NOVEL RESEARCH FINDINGS AND DISCUSSION
PhD thesis Michael Bernhard 53
standardized method was proposed to determine the phase boundaries of γ-loops in Fe-based
systems. The procedure is based on image processing of coloured austenite and ferrite
fractions, present at the surface of sample, and is explained in detail in Paper III. In order to
critically evaluate the results of the coupled DSC/HT-LSCM approach, the utilization of other
in-situ experimental methods were taken into account. Within extensive literature review
provided in Paper III, the experimental techniques of equilibration, dilatometry, thermo-
magnetic balance and X-ray diffraction were identified as standard methods, used to
characterize phase stabilities in Fe-based γ-loops.
In a joint project together with Materials Center Leoben Forschungs GmbH, a general
procedure was therefore established to perform in-situ HT-XRD experiments. The analysis
was supported by additional standard dilatometry experiments. All four in-situ techniques
(DSC, HT-LSCM, HT-XRD and dilatometry), were used to investigate a selected sample with
0.394 %P, see sample C-I in Figure 29 (a). The phase transformation temperatures obtained
from all experiments are summarized in Table 7 and show reasonable agreement for both, the
austenite formation (bcc↔bcc+fcc), as well as the austenite decomposition (fcc+bcc↔bcc). In
the HT-XRD and dilatometry trials, the phase transformation temperatures were obtained at
lower temperatures. However, similar to the DSC and HT-LSCM experiments, the analysis of
the measured signals was quite challenging, see Paper III. Considering the observed errors,
the temperatures are actually overlapping and the results confirmed the approach of coupling
DSC and HT-LSCM for a full reconstruction of the γ-loop.
Table 7: Measured phase transformation temperatures of a sample containing 0.394 %P using various
in-situ experimental techniques. [173]
Phase boundary DSC HT-LSCM HT-XRD Dilatometry
bcc↔bcc+fcc - 1000 ± 10 °C 976.5 ± 10 °C 976 ± 20 °C
fcc+bcc↔bcc 1292.6 ± 5 °C 1285 ± 5 °C 1260 ± 10 °C 1260 ± 20 °C
The γ-loop reconstructed by HT-LSCM observations and the data of the DSC analysis from
Paper I and III are represented in Figure 30, along with data from literature [37–39]. In general,
the present results are in best agreement with the most recently proposed temperatures of
Fischer et al. [39]. In this work [39], high quality samples with low amounts of trace elements
(C, Mn, N) were investigated by the thermo-magnetic balance. The good correlation with the
work of Fischer et al. [39] indicates, that the developed approach leads to very reasonable
results over the whole composition range. Higher deviations of the HT-LSCM observations
from the available data have to be accepted only in the low P region (P < 0.10 mass pct.) at
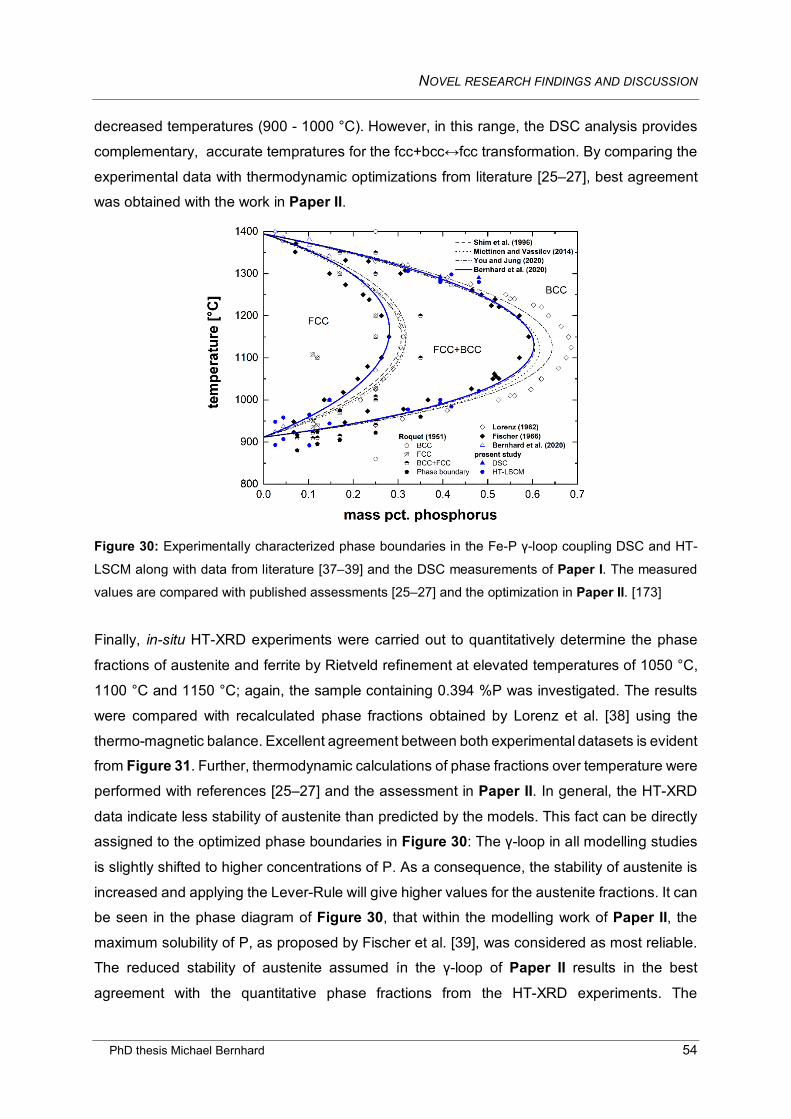
NOVEL RESEARCH FINDINGS AND DISCUSSION
PhD thesis Michael Bernhard 54
decreased temperatures (900 - 1000 °C). However, in this range, the DSC analysis provides
complementary, accurate tempratures for the fcc+bcc↔fcc transformation. By comparing the
experimental data with thermodynamic optimizations from literature [25–27], best agreement
was obtained with the work in Paper II.
Figure 30: Experimentally characterized phase boundaries in the Fe-P γ-loop coupling DSC and HT-
LSCM along with data from literature [37–39] and the DSC measurements of Paper I. The measured
values are compared with published assessments [25–27] and the optimization in Paper II. [173]
Finally, in-situ HT-XRD experiments were carried out to quantitatively determine the phase
fractions of austenite and ferrite by Rietveld refinement at elevated temperatures of 1050 °C,
1100 °C and 1150 °C; again, the sample containing 0.394 %P was investigated. The results
were compared with recalculated phase fractions obtained by Lorenz et al. [38] using the
thermo-magnetic balance. Excellent agreement between both experimental datasets is evident from Figure 31. Further, thermodynamic calculations of phase fractions over temperature were
performed with references [25–27] and the assessment in Paper II. In general, the HT-XRD
data indicate less stability of austenite than predicted by the models. This fact can be directly
assigned to the optimized phase boundaries in Figure 30: The γ-loop in all modelling studies
is slightly shifted to higher concentrations of P. As a consequence, the stability of austenite is
increased and applying the Lever-Rule will give higher values for the austenite fractions. It can
be seen in the phase diagram of Figure 30, that within the modelling work of Paper II, the
maximum solubility of P, as proposed by Fischer et al. [39], was considered as most reliable.
The reduced stability of austenite assumed ín the γ-loop of Paper II results in the best
agreement with the quantitative phase fractions from the HT-XRD experiments. The
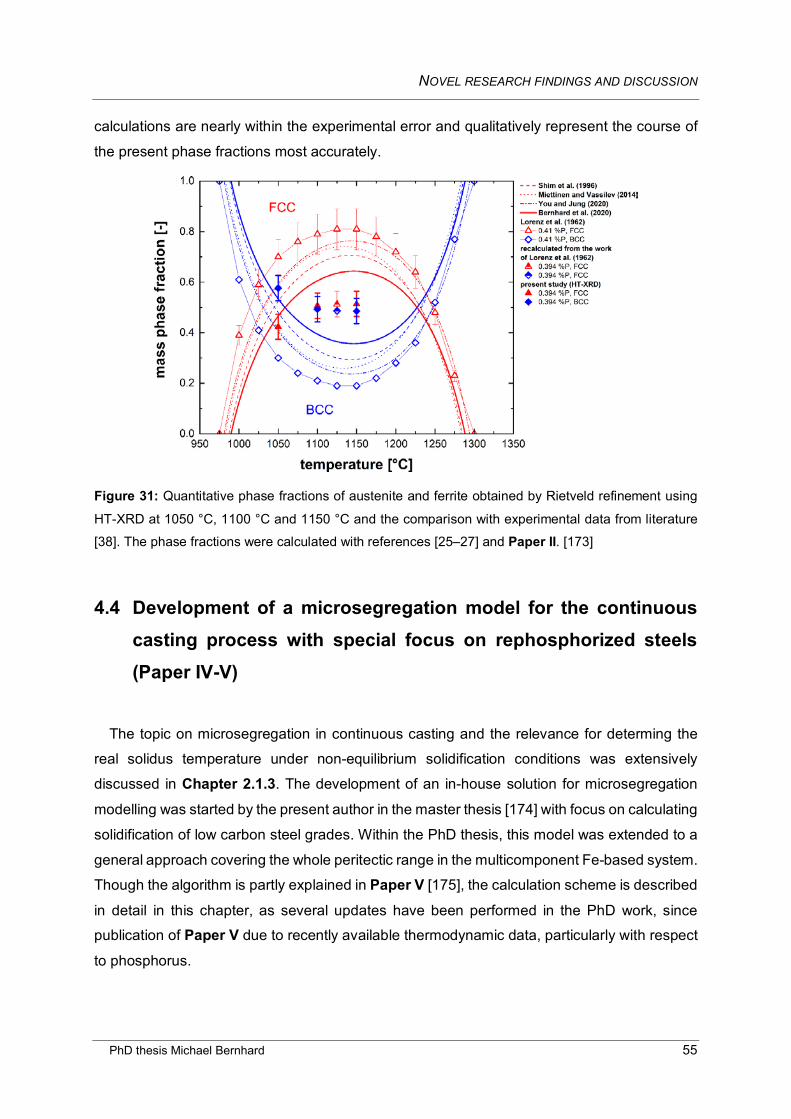
NOVEL RESEARCH FINDINGS AND DISCUSSION
PhD thesis Michael Bernhard 55
calculations are nearly within the experimental error and qualitatively represent the course of
the present phase fractions most accurately.
Figure 31: Quantitative phase fractions of austenite and ferrite obtained by Rietveld refinement using
HT-XRD at 1050 °C, 1100 °C and 1150 °C and the comparison with experimental data from literature [38]. The phase fractions were calculated with references [25–27] and Paper II. [173]
4.4 Development of a microsegregation model for the continuous casting process with special focus on rephosphorized steels (Paper IV-V)
The topic on microsegregation in continuous casting and the relevance for determing the
real solidus temperature under non-equilibrium solidification conditions was extensively
discussed in Chapter 2.1.3. The development of an in-house solution for microsegregation
modelling was started by the present author in the master thesis [174] with focus on calculating
solidification of low carbon steel grades. Within the PhD thesis, this model was extended to a
general approach covering the whole peritectic range in the multicomponent Fe-based system.
Though the algorithm is partly explained in Paper V [175], the calculation scheme is described
in detail in this chapter, as several updates have been performed in the PhD work, since publication of Paper V due to recently available thermodynamic data, particularly with respect
to phosphorus.
NOVEL RESEARCH FINDINGS AND DISCUSSION
PhD thesis Michael Bernhard 56
4.4.1 General model description
All input and out parameters of the microsegregation model are schematically represented in
Figure 32:
Initial data: The general calculation starts by inserting the chemical composition of the steel
grade and the definition of the local cooling rate T’. In the current version, 15 elements can be
considered in the calculation; including C, Si, Mn, P, S, Al, Cu, Cr, Ni, Mo, V, Nb, Ti, B and N.
The algorithm itself is based on the semi-integrated Ohnaka equation according to You et al.
[84]. In contrast to the original form of the Ohnaka model in Equation 4 (Chapter 2.1.3.2), the
semi-integrated form in Equation 19 enables to take into account local partition coefficients
[84] by respecting the mass balance. ΔfS is the pre-defined increment of the solidification
progress and increases from 0 to 1; ΔfS is currently set to 0.005.
CLfS+∆fS = CL
fS � 1−Γfs1−Γ(fS+∆fS)
�1−kΓ (19)
Morphology: In the model, dendritic-columnar growth is assumed with Γ = 1-4αk/(1+4αk)
according to Equation 5 (Chapter 2.1.3.2). The coarsening of the dendrites during
solidification is described by a semi-empirical relation between the local solidification time (tf,
s) and the secondary dendrite arm spacing (λ2, µm); given in Equation 20 [176], depending
on the initial carbon concentration C0 in mass percent.
λ2 = �23.7− 13.1C01/3�tf1/3 (20)
Diffusion: Together with the diffusion coefficients of the elements in the solid state (DS), using
the Arrhenius approach (Equation 21), the λ2-tf relation is inserted into the Fourier-Number α,
given in Equation 3 (Chapter 2.1.3.2). In the Arrhenius equation, D0 is a pre-exponential
coefficient in cm2/s, Q is the activation energy in J/mol, R is the gas constant with 8.314 J/mol.K
and T is the temperature in Kelvin.
DS = D0exp(−Q/RT) (21)
Partition coefficients: The partition coefficients of each alloying element are required for the
ferrite phase and the austenite phase (see Chapter 2.1.3.2) for calculating the enrichment in
the interdendritic liquid. The partition coefficients of C, Si, Mn, P, S Al, Cr, Ni, Mo and Cu were
partly assessed in a publication [177] of the present author and within previous project work.
In the PhD project work, data of micro-alloying elements (V, Nb, Ti), nitrogen and the strongly
segregating element boron were implemented by FactSage [28] calculations, using the most
recently available thermodynamic database FSStel2019. For P, the newly obtained data in
Paper I and II were used to improve the partition coefficient input data, see Chapter 4.4.2.
NOVEL RESEARCH FINDINGS AND DISCUSSION
PhD thesis Michael Bernhard 57
Temperature calculation: Empirical liquidus equations are applied to obtain the relation
between fS and the solidification temperatures. Analytical expressions for TL are typically used
to adjust the superheat of a specific steel grade in the continuous casting process, but can
also be applied in conjunction with microsegregation models. In the latter case, the
interdendritic liquid can be seen as a melt with very high amount of enriched elements.
Inserting the actual chemical composition, calculated by Equation 19 at each step of fS will
give the characteristic function of T depending on the solid fraction. The final solidus
temperature is therefore defined as TL of the melt with calculated enrichments of CL at fS = 1.
In the model, the liquidus formula as suggested by Howe and Miettinen [178] is used. The
expression of the liquidus equation is given in Equation 22 [178], where TL is separately
calculated for austenite and ferrite.
TL = TL0 + ∑ Ai%Xini=1 + ∑ Bi%Xi%Cn
j=1 (22)
TL0 is the melting point of pure iron (1538 °C for δ-Fe and 1528 °C for γ-Fe [178]). The
coefficients Ai describe the decreasing effect of the alloying element Xi in mass pct. on TL of
Fe according to the phase diagram; whereas Bi represents the interaction of Xi with carbon
(%C). The parameters Ai and Bi for C, Si, Mn and P were evaluated in Paper IV, where the
coefficient of P was slightly modified; according to the results of Paper I. The original values
of Ai and Bi [178] were taken for S, Cr, Ni and Mo. Similarly to the calculations of the partition
coefficients, simulations with FactSage [28] and FSStel2019 were performed to extend the
liquidus equation for Cu, V, Nb, Ti, N and B by fitting the results to the approach of Miettinen
and Howe [178] in Equation 22 within internal research work.
MnS formation: During solidification, the high enrichment of Mn and S may lead to the
formation of MnS. Based on the interdendritic concentration and the current temperature, the
MnS product is calculated at each step of fS. If the solubility product is exceeded, MnS will form
and the concentration of Mn and S is reduced to the equilibrium value given by the T-
dependent Equation 23 [179].
logKMnS = −8750T[K]
+ 4.63 (23)
Output: The main output data of the model are (i) the relation between fS and T, (ii) enrichment
concentrations of alloying elements and (iii) the phase transformation temperatures and phase
fraction prediction of austenite, ferrite and the liquid phase during solidification. The latter data
can be determined by incorporating the peritectic reaction into the model; the procedure is
described in the next chapter 4.4.2. Based on the results, the thermo-physical properties [180]
(i) heat capacity, (ii) latent heats, (iii) thermal conductivity and (iv) density can be calculated
for further use in solidification modelling. The current parameter settings of the
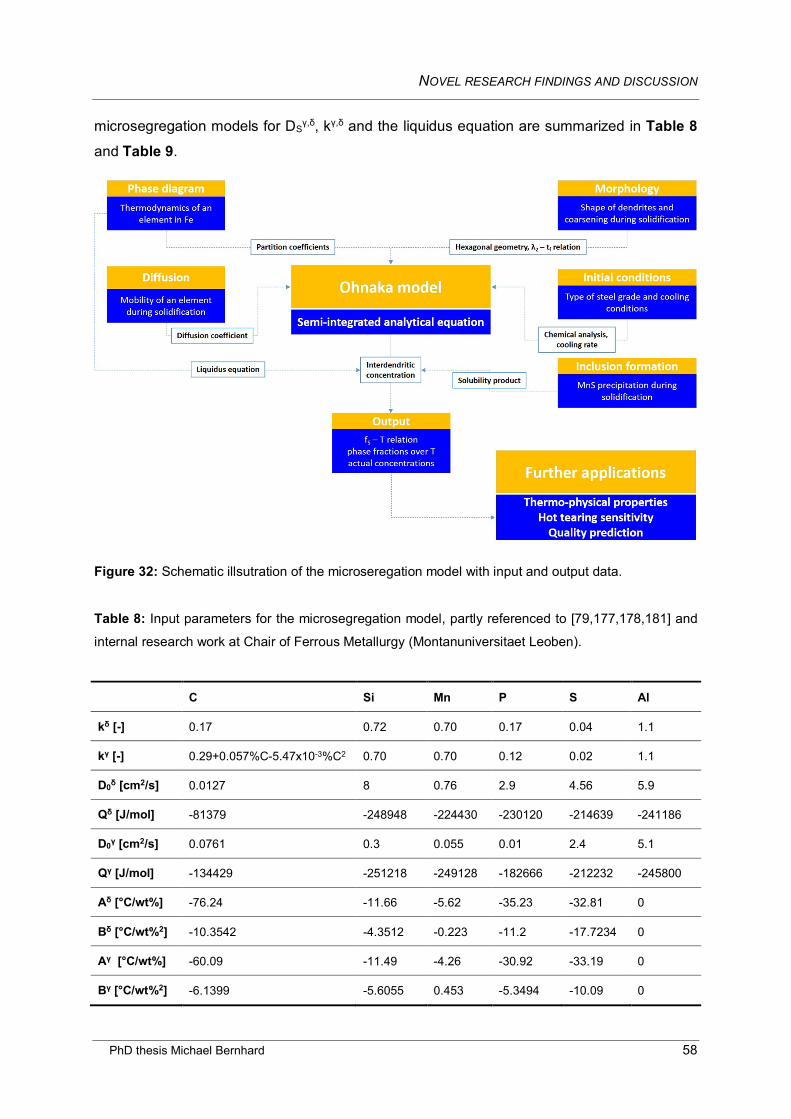
NOVEL RESEARCH FINDINGS AND DISCUSSION
PhD thesis Michael Bernhard 58
microsegregation models for DSγ,δ, kγ,δ and the liquidus equation are summarized in Table 8
and Table 9.
Figure 32: Schematic illsutration of the microseregation model with input and output data.
Table 8: Input parameters for the microsegregation model, partly referenced to [79,177,178,181] and
internal research work at Chair of Ferrous Metallurgy (Montanuniversitaet Leoben).
C Si Mn P S Al
kδ [-] 0.17 0.72 0.70 0.17 0.04 1.1
kγ [-] 0.29+0.057%C-5.47x10⁻³%C2 0.70 0.70 0.12 0.02 1.1
D0δ [cm2/s] 0.0127 8 0.76 2.9 4.56 5.9
Qδ [J/mol] -81379 -248948 -224430 -230120 -214639 -241186
D0γ [cm2/s] 0.0761 0.3 0.055 0.01 2.4 5.1
Qγ [J/mol] -134429 -251218 -249128 -182666 -212232 -245800
Aδ [°C/wt%] -76.24 -11.66 -5.62 -35.23 -32.81 0
Bδ [°C/wt%2] -10.3542 -4.3512 -0.223 -11.2 -17.7234 0
Aγ [°C/wt%] -60.09 -11.49 -4.26 -30.92 -33.19 0
Bγ [°C/wt%2] -6.1399 -5.6055 0.453 -5.3494 -10.09 0
NOVEL RESEARCH FINDINGS AND DISCUSSION
PhD thesis Michael Bernhard 59
Table 9: Input parameters for the microsegregation model, partly referenced to [79,181] and internal
research work at Chair of Ferrous Metallurgy (Montanuniversitaet Leoben).
Cr Ni Mo Cu V Nb Ti B N
kδ [-] 0.90 0.81 0.65 1 0.73 0.26 0.28 0.025 0.30
kγ [-] 0.83 0.89 0.47 1 0.50 0.15 0.15 0.020 0.60
D0δ [cm2/s] 2.4 1.6 3.47 2.6 4.8 50 3.15 0.008 0.008
Qδ [J/mol] -239785 -239994 -241375 -239994 -239994 -251960 -247693 -87900 -79078
D0γ [cm2/s] 0.0012 0.34 0.068 0.7 0.284 0.83 0.15 0.002 0.91
Qγ [J/mol] -218991 -282378 -246856 -285976 -258990 -266479 -250956 -87900 -168490
Aδ [°C/wt%] -1.95 -3.58 -2.2 0.17 -3.97 -6.61 -16.123 -101.06 -58.4
Bδ [°C/wt%2] -0.0329 -0.8364 -0.8451 0.22 2.871 1 9 -20.48 -10.4
Aγ [°C/wt%] -2.47 -1.97 -4.36 0.36 -7.425 -8.43 -16.05 -95.77 -48.29
Bγ [°C/wt%2] 1.3303 -0.5886 0.0701 1.3 4.7 2.5 7.49 -9.41 -0.92
4.4.2 Determination of the partition coefficients kPδ,γ from Paper I and II
The experimentally reconstructed liquidus and solidus phase boundaries from Paper I were
used to determine the partition coefficient kPδ over temperature; the results are graphically
compared with data of previous publications [45,69] in Figure 33. The melting temperature of
pure Fe (1538 °C) represents the dilute solution, whereas the lower limit of 1100 °C is already close to the eutectic temperature in the binary Fe-P phase diagram (see Figure 1). In order to
guarantee a better comparability with the data of Battle and Pehlke [69], the values of Morita
and Tanaka [45] and those obtained within the present work were converted from mass
percent-related to mole fraction-related; according to references [182,183]. The lines are
plotted separately in Figure 33. However, kPδ (mole fraction) and kP
δ (mass percent) are
identical at infinite dilution and only a minor difference is observed at lower temperatures
(ΔkPδ ~ 0.01 at 1150 °C). Since in fact, the solidus and liquidus line in the Fe-P phase diagram
do not decrease perfectly linear, all plotted partition coefficients are clearly dependent on
temperature. The temperature dependence of kPδ is mostly pronounced in the work of Battle
and Pehlke [69]; kPδ increases from a very low value of 0.02 at the melting point of pure Fe
(1538 °C) to 0.27 at 1130 °C. The strong curvature of kPδ can be explained by the shape of the
solidus line in the phase diagram of Spencer and Kubaschweski [72]. Further, kPδ = 0.02 at
infinite dilution seems not to be reliable, because this value significantly disagrees with other
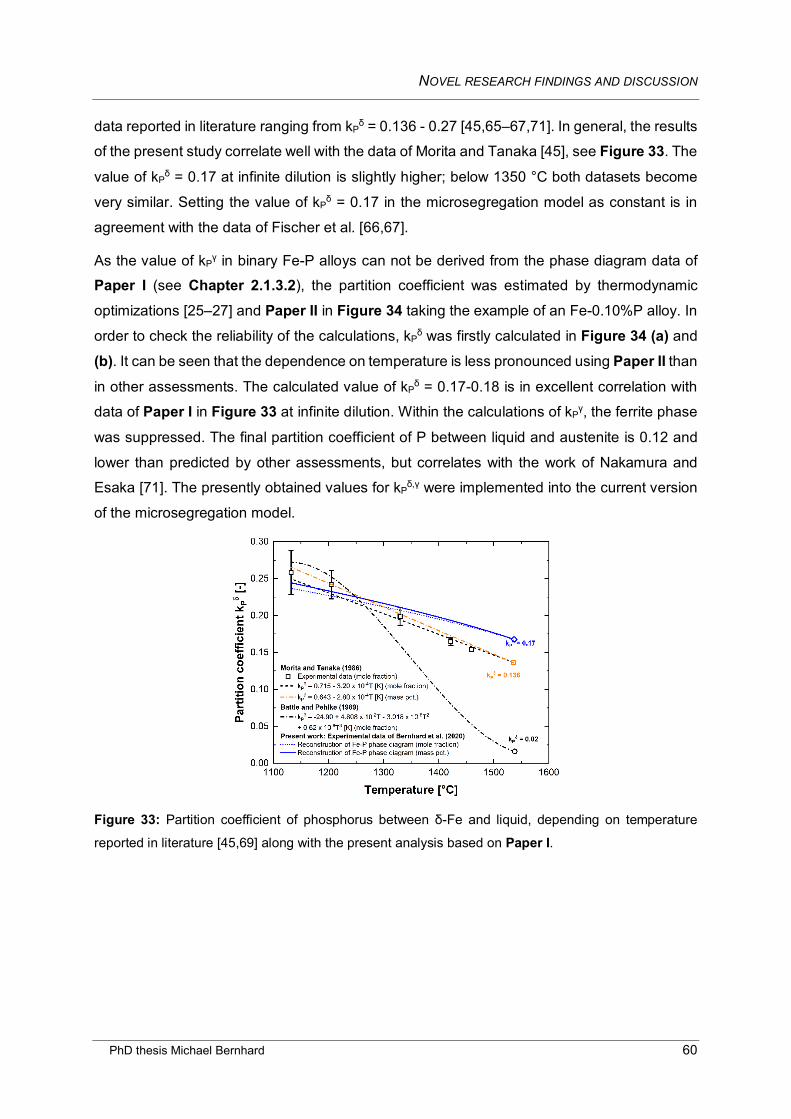
NOVEL RESEARCH FINDINGS AND DISCUSSION
PhD thesis Michael Bernhard 60
data reported in literature ranging from kPδ = 0.136 - 0.27 [45,65–67,71]. In general, the results
of the present study correlate well with the data of Morita and Tanaka [45], see Figure 33. The
value of kPδ = 0.17 at infinite dilution is slightly higher; below 1350 °C both datasets become
very similar. Setting the value of kPδ = 0.17 in the microsegregation model as constant is in
agreement with the data of Fischer et al. [66,67].
As the value of kPγ in binary Fe-P alloys can not be derived from the phase diagram data of
Paper I (see Chapter 2.1.3.2), the partition coefficient was estimated by thermodynamic
optimizations [25–27] and Paper II in Figure 34 taking the example of an Fe-0.10%P alloy. In
order to check the reliability of the calculations, kPδ was firstly calculated in Figure 34 (a) and
(b). It can be seen that the dependence on temperature is less pronounced using Paper II than
in other assessments. The calculated value of kPδ = 0.17-0.18 is in excellent correlation with
data of Paper I in Figure 33 at infinite dilution. Within the calculations of kPγ, the ferrite phase
was suppressed. The final partition coefficient of P between liquid and austenite is 0.12 and
lower than predicted by other assessments, but correlates with the work of Nakamura and
Esaka [71]. The presently obtained values for kPδ,γ were implemented into the current version
of the microsegregation model.
Figure 33: Partition coefficient of phosphorus between δ-Fe and liquid, depending on temperature
reported in literature [45,69] along with the present analysis based on Paper I.
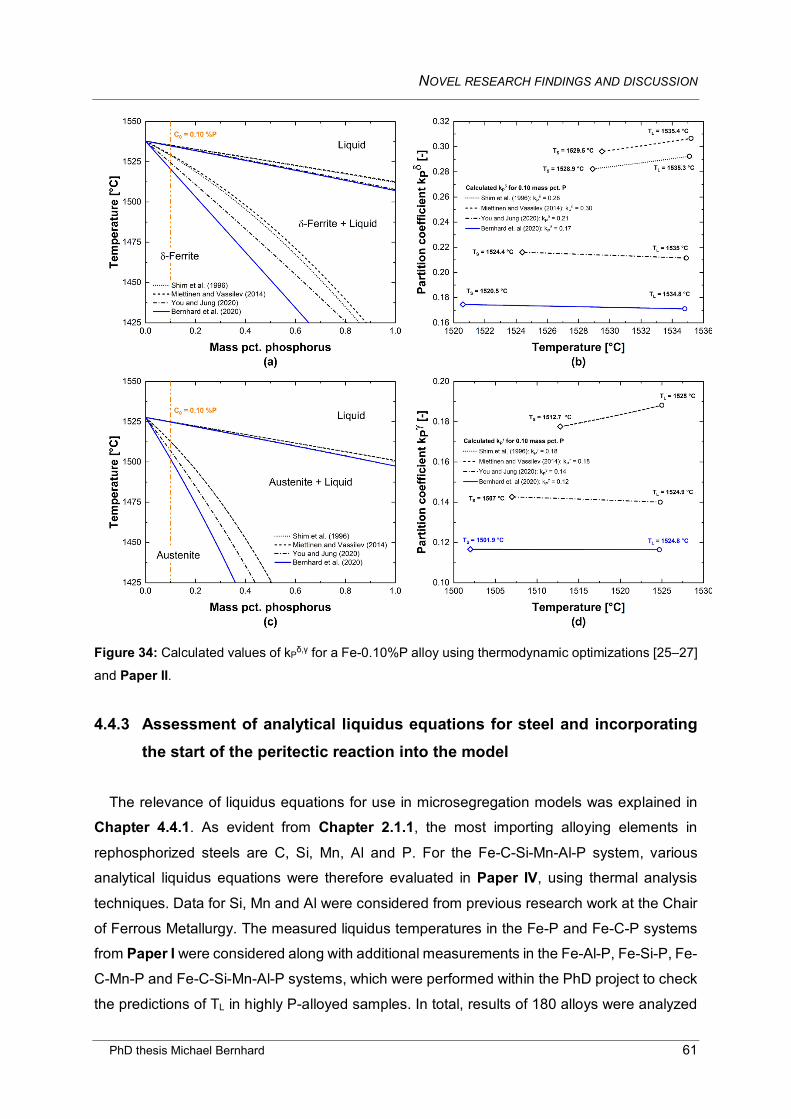
NOVEL RESEARCH FINDINGS AND DISCUSSION
PhD thesis Michael Bernhard 61
Figure 34: Calculated values of kPδ,γ for a Fe-0.10%P alloy using thermodynamic optimizations [25–27]
and Paper II.
4.4.3 Assessment of analytical liquidus equations for steel and incorporating the start of the peritectic reaction into the model
The relevance of liquidus equations for use in microsegregation models was explained in
Chapter 4.4.1. As evident from Chapter 2.1.1, the most importing alloying elements in
rephosphorized steels are C, Si, Mn, Al and P. For the Fe-C-Si-Mn-Al-P system, various
analytical liquidus equations were therefore evaluated in Paper IV, using thermal analysis
techniques. Data for Si, Mn and Al were considered from previous research work at the Chair
of Ferrous Metallurgy. The measured liquidus temperatures in the Fe-P and Fe-C-P systems
from Paper I were considered along with additional measurements in the Fe-Al-P, Fe-Si-P, Fe-
C-Mn-P and Fe-C-Si-Mn-Al-P systems, which were performed within the PhD project to check
the predictions of TL in highly P-alloyed samples. In total, results of 180 alloys were analyzed
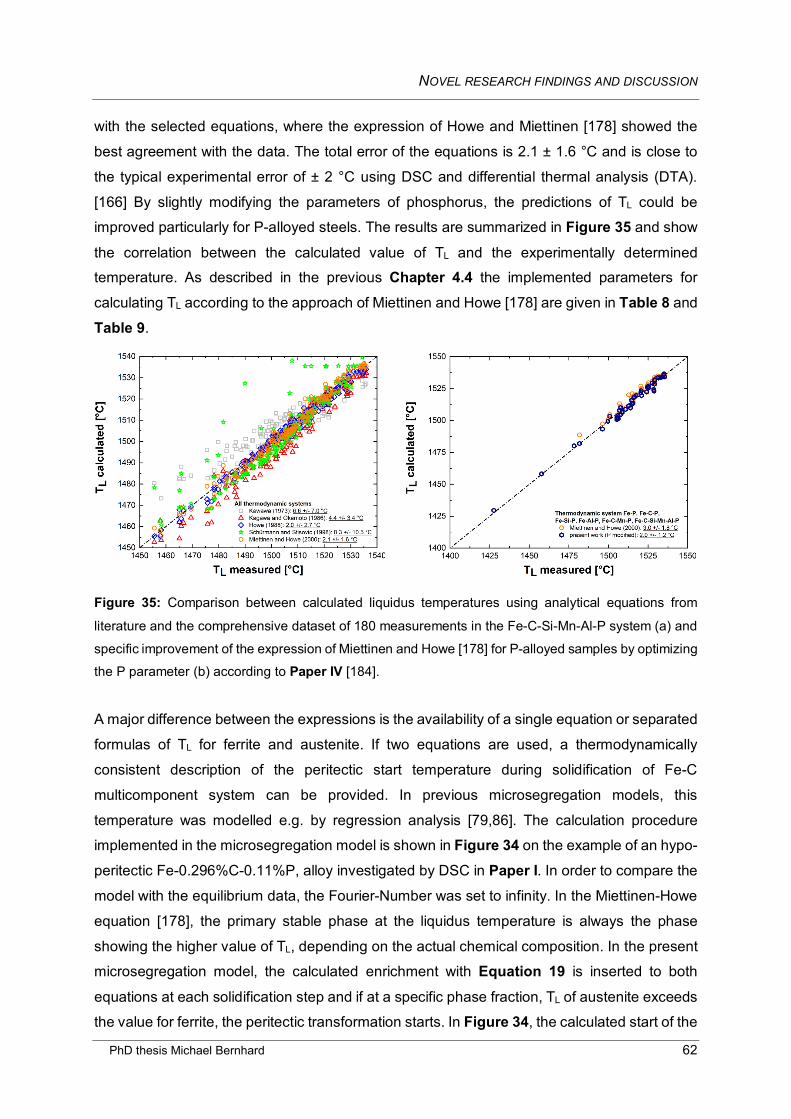
NOVEL RESEARCH FINDINGS AND DISCUSSION
PhD thesis Michael Bernhard 62
with the selected equations, where the expression of Howe and Miettinen [178] showed the
best agreement with the data. The total error of the equations is 2.1 ± 1.6 °C and is close to
the typical experimental error of ± 2 °C using DSC and differential thermal analysis (DTA).
[166] By slightly modifying the parameters of phosphorus, the predictions of TL could be
improved particularly for P-alloyed steels. The results are summarized in Figure 35 and show
the correlation between the calculated value of TL and the experimentally determined temperature. As described in the previous Chapter 4.4 the implemented parameters for
calculating TL according to the approach of Miettinen and Howe [178] are given in Table 8 and
Table 9.
Figure 35: Comparison between calculated liquidus temperatures using analytical equations from
literature and the comprehensive dataset of 180 measurements in the Fe-C-Si-Mn-Al-P system (a) and
specific improvement of the expression of Miettinen and Howe [178] for P-alloyed samples by optimizing the P parameter (b) according to Paper IV [184].
A major difference between the expressions is the availability of a single equation or separated
formulas of TL for ferrite and austenite. If two equations are used, a thermodynamically
consistent description of the peritectic start temperature during solidification of Fe-C
multicomponent system can be provided. In previous microsegregation models, this
temperature was modelled e.g. by regression analysis [79,86]. The calculation procedure
implemented in the microsegregation model is shown in Figure 34 on the example of an hypo-
peritectic Fe-0.296%C-0.11%P, alloy investigated by DSC in Paper I. In order to compare the
model with the equilibrium data, the Fourier-Number was set to infinity. In the Miettinen-Howe
equation [178], the primary stable phase at the liquidus temperature is always the phase
showing the higher value of TL, depending on the actual chemical composition. In the present
microsegregation model, the calculated enrichment with Equation 19 is inserted to both
equations at each solidification step and if at a specific phase fraction, TL of austenite exceeds
the value for ferrite, the peritectic transformation starts. In Figure 34, the calculated start of the
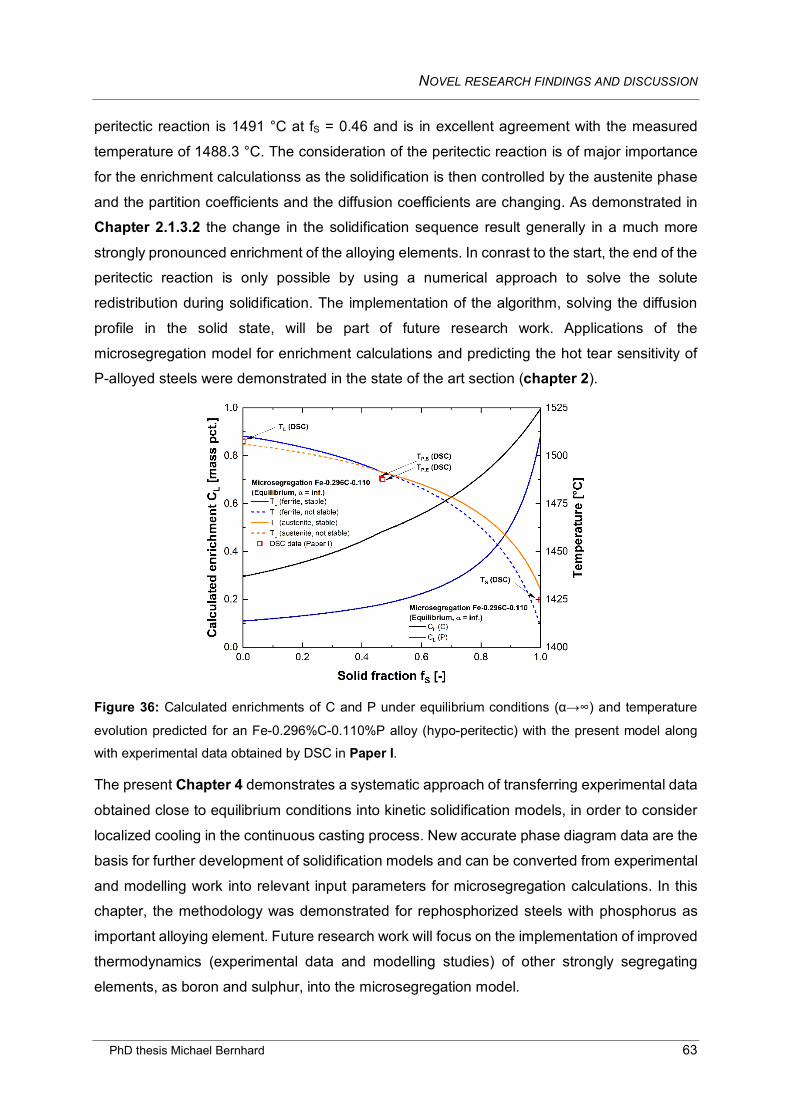
NOVEL RESEARCH FINDINGS AND DISCUSSION
PhD thesis Michael Bernhard 63
peritectic reaction is 1491 °C at fS = 0.46 and is in excellent agreement with the measured
temperature of 1488.3 °C. The consideration of the peritectic reaction is of major importance
for the enrichment calculationss as the solidification is then controlled by the austenite phase
and the partition coefficients and the diffusion coefficients are changing. As demonstrated in
Chapter 2.1.3.2 the change in the solidification sequence result generally in a much more
strongly pronounced enrichment of the alloying elements. In conrast to the start, the end of the
peritectic reaction is only possible by using a numerical approach to solve the solute
redistribution during solidification. The implementation of the algorithm, solving the diffusion
profile in the solid state, will be part of future research work. Applications of the
microsegregation model for enrichment calculations and predicting the hot tear sensitivity of
P-alloyed steels were demonstrated in the state of the art section (chapter 2).
Figure 36: Calculated enrichments of C and P under equilibrium conditions (α→∞) and temperature
evolution predicted for an Fe-0.296%C-0.110%P alloy (hypo-peritectic) with the present model along with experimental data obtained by DSC in Paper I.
The present Chapter 4 demonstrates a systematic approach of transferring experimental data
obtained close to equilibrium conditions into kinetic solidification models, in order to consider
localized cooling in the continuous casting process. New accurate phase diagram data are the
basis for further development of solidification models and can be converted from experimental
and modelling work into relevant input parameters for microsegregation calculations. In this
chapter, the methodology was demonstrated for rephosphorized steels with phosphorus as
important alloying element. Future research work will focus on the implementation of improved
thermodynamics (experimental data and modelling studies) of other strongly segregating
elements, as boron and sulphur, into the microsegregation model.
SUMMARY AND CONCLUSION
PhD thesis Michael Bernhard 64
5 Summary and conclusion
Within this thesis, the effect of phosphorus on solidification and high-temperature phase
transformations in steel was extensively studied. In the experimental part, the in-situ methods
of differential scanning calorimetry (DSC), high-temperature laser scanning confocal
microscopy (HT-LSCM), high-temperature X-ray diffraction (HT-XRD) and dilatometry were
applied to investigate phase equilibria in 40 high-purity alloys of the Fe-P and Fe-C-P key-
systems. Based on the experimental results, a complete CALPHAD-type (Calculation of Phase
Diagrams) thermodynamic modelling study was carried out. Finally, the new results were
implemented into a microsegregation model for calculating solidification of steel under
continuous casting conditions.
In the binary Fe-P system, the DSC trials indicated a significantly lower solidus temperature
(TS) than predicted by most recently published thermodynamic assessments. Special focus
was placed on composition range of P < 1 mass pct. as a lack of experimental data was
identified in literature. In this region, the deviation between the measured values of TS and the
calculations exceeded 50 °C; with increasing amount of phosphorus (P = 1.5 - 2 %) a better
correlation of TS was obtained. Similar to the calculation results in the binary Fe-P system, the
stability of the liquid phase was underestimated in the vertical sections Fe-C-0.10%P and Fe-
0.20%C-P. In a third ternary section with mass percent of P to C equals two, the analysis of
the DSC signals was supported by HT-LSCM observations. In those alloys, containing high
amounts of C and P, the calculated phase stabilities of ferrite (δ-Fe) and austenite (γ-Fe), using
previous thermodynamic assessments of the Fe-C-P system, significantly disagreed with the
new experimental data.
SUMMARY AND CONCLUSION
PhD thesis Michael Bernhard 65
In the CALPHAD-type thermodynamic modelling of the Fe-P and Fe-C-P system, the use of
the modified quasichemical model (MQM) for the liquid phase resolved the discrepancies in
the solidus temperature wihout introducing a ternary excess Gibbs energy parameter. By
improving the thermodynamic description of the binary Fe-P phase diagram, the measured
phase equilibria in the Fe-C-P could be predicted more accurately. The consideration of ab-
initio calculations of enthalpies of formation for the austenite and ferrite phase enhanced the
calculations in various ternary isothermal sections between 800 - 1100 °C. Finally, the
predicted phase stabilities of δ-Fe and γ-Fe phases in the vertical section with high carbon and
phosphorus concentrations are in excellent agreement with the experimental data.
A novel approach of coupling DSC analysis and HT-LSCM observations for characterizing the
phase boundaries in the Fe-P γ-loop was successfully evaluated with the well established in-
situ methods of HT-XRD and dilatomerty. The obtained phase transformation temperatures
correlate with the most recently published data from literature. Further, quantitative phase
fraction analysis of ferrite and austenite were carried out by Rietveld refinement using HT-XRD
at elevated temperatures of 1050 °C, 1100 °C and 1150 °C. The measured phase fractions
are in reasonable agreement with calculations of the thermodynamic reassessment, performed
in the present study.
Finally, the obtained experimental data and thermodynamic calcutions were used to improve
a microsgregation model with particular focus on rephosphorized steel grades. Therefore,
analytical liquidus equations from literature were evaluated and the partition coefficients kPγ,δ
were calculated with the current optimization of the Fe-P system. The thermodynamically
consistent implementation of the peritectic start temperature was compared with DSC results
of the Fe-C-0.10%P system by setting the model to the equilibrium mode.
PhD thesis Michael Bernhard 66
Bibliography
[1] worldsteel association, https://www.worldsteel.org/media-centre/press-
releases/2021/world-steel-in-figures-2021.html, Accessed: 28.06.2021
[2] R.A. Mulford, C.J. Mcmahon, D.P. Pope and H.C. Feng, Temper embrittlement of Ni-Cr
Steels by phosphorus. Metallurgical and Materials Transactions A 7 (1976), 8, pp. 1183–1195.
doi:10.1007/BF02656602
[3] I. Olefjord, Temper embrittlement. International Metals Reviews 23 (1978), 1, pp. 149–163.
doi:10.1179/imtr.1978.23.1.149
[4] R. Viswanathan, Temper embrittlement in a Ni-Cr steel containing phosphorus as impurity.
Metallurgical and Materials Transactions B 2 (1971), 3, pp. 809–815. doi:10.1007/BF02662740
[5] D.B.V.d. Castro, J.M. Ventura, C.O.F.T. Ruckert, D. Spinelli and W.W. Bose Filho, Influence
of phosphorus content and quenching/tempering temperatures on fracture toughness and
fatigue life of SAE 5160 steel. Materials Research 13 (2010), 4, pp. 445–455.
doi:10.1590/S1516-14392010000400005
[6] X.-M. Chen, S.-H. Song, L.-Q. Weng, S.-J. Liu and K. Wang, Relation of ductile-to-brittle
transition temperature to phosphorus grain boundary segregation for a Ti-stabilized interstitial
free steel. Materials Science and Engineering: A 528 (2011), 28, pp. 8299–8304.
doi:10.1016/j.msea.2011.08.002
[7] J.S. Rege, M. Hua, C.I. Garcia and A.J. Deardo, The Segregation Behavior of Phosphorus
in Ti and Ti+Nb Stabilized Interstitial-Free Steels. ISIJ International 40 (2000), 2, pp. 191–199.
doi:10.2355/isijinternational.40.191
BIBLIOGRAPHY
PhD thesis Michael Bernhard 67
[8] W.-m. Guo, Z.-c. Wang, Y.-d. Li, N. Xu and J.-b. Shi, Effect of Phosphorus Content on
Properties of Warm-Rolled Interstitial-Free Steel Sheets. Metallography, Microstructure, and
Analysis 2 (2013), 4, pp. 249–256. doi:10.1007/s13632-013-0086-4
[9] X.-l. Zhang, H.-f. Hou, T. Liu, Q. Zhou, H.-j. Liu, Y.-l. Zhang, H.-x. Cui and Z. Lv, Effect of
annealing time and phosphorus addition on bake hardening behavior of ultra-low carbon bake
hardening steel. Journal of Iron and Steel Research International 25 (2018), 12, pp. 1287–
1295. doi:10.1007/s42243-018-0189-x
[10] D. Krizan, TRIP steels: Advanced High-Strength Multiphase Steels for Automotive
Applications. 14th International Scientific Conference CO-MAT-TECH, pp. 1-10, Trnava,
Slovak Republic (2006).
[11] E. Jimenez-Melero, N.H. van Dijk, L. Zhao, J. Sietsma, S.E. Offerman, J.P. Wright and S.
van der Zwaag, The effect of aluminium and phosphorus on the stability of individual austenite
grains in TRIP steels. Acta Materialia 57 (2009), 2, pp. 533–543.
doi:10.1016/j.actamat.2008.09.040
[12] L. Barbé, K. Verbeken and E. Wettinck, Effect of the Addition of P on the Mechanical
Properties of Low Alloyed TRIP Steels. ISIJ International 46 (2006), 8, pp. 1251–1257.
doi:10.2355/isijinternational.46.1251
[13] G. Sahoo, A. Deva, B. Singh and A. Sexena, Corrosion Behaviour of High Phosphorus
Containing Cu-Cr Weather Resistant Steel. Journal of Metals, Materials and Minerals 24
(2014), 2, pp. 1–7. doi:10.14456/jmmm.2014.9
[14] M. Yamashita, H. Nagano, T. Misawa and H.E. Townsend, Structure of Protective Rust
Layers Formed on Weathering Steels by Long-term Exposure in the Industrial Atmospheres of
Japan and North America. ISIJ International 38 (1998), 3, pp. 285–290.
doi:10.2355/isijinternational.38.285
[15] M. Yamashita, H. Miyuki, Y. Matsuda, H. Nagano and T. Misawa, The long term growth of
the protective rust layer formed on weathering steel by atmospheric corrosion during a quarter
of a century. Corrosion Science 36 (1994), 2, pp. 283–299. doi:10.1016/0010-938X(94)90158-
9
[16] S. Lee and B.C.D. Cooman, Effect of Phosphorus on the Magnetic Losses of Non-oriented
2% Si Steel. ISIJ International 52 (2012), 6, pp. 1162–1170.
doi:10.2355/isijinternational.52.1162
BIBLIOGRAPHY
PhD thesis Michael Bernhard 68
[17] I. Tanaka and H. Yashiki, Magnetic properties and recrystallization texture of phosphorus-
added non-oriented electrical steel sheets. Journal of Magnetism and Magnetic Materials 304
(2006), 2, e611-e613. doi:10.1016/j.jmmm.2006.02.155
[18] H. Okamoto, The Fe-P (iron-phosphorus) system. Bulletin of Alloy Phase Diagrams 11
(1990), 4, pp. 404–412. doi:10.1007/BF02843320
[19] P. Perrot, Carbon – Iron – Phosphorus. Berlin Heidelberg (2008), Springer.
[20] W. Franke, K. Meisel, R. Juza and W. Biltz, Beiträge zur systematischen
Verwandtschaftslehre. 60. Über die Verwandtschaft von Phosphor zu Eisen. Zeitschrift für
anorganische und allgemeine Chemie 218 (1934), 4, pp. 346–359.
doi:10.1002/zaac.19342180403
[21] K. Meisel, Über die Kristallstruktur des FeP2. Zeitschrift für anorganische und allgemeine
Chemie 218 (1934), 4, pp. 360–364. doi:10.1002/zaac.19342180404
[22] M. Heimbrecht and W. Biltz, Zur Frage des Bestehens eines höheren Eisenphosphids.
Zeitschrift für anorganische und allgemeine Chemie 242 (1939), 3, pp. 233–236.
doi:10.1002/zaac.19392420303
[23] W. Jeitschko and D.J. Braun, Synthesis and crystal structure of the iron polyphosphide
FeP 4. Acta Crystallographica Section B: Structural Crystallography and Crystal Chemistry 34
(1978), 11, pp. 3196–3201. doi:10.1107/S056774087801047X
[24] H. Ohtani, N. Hanaya, M. Hasebe, S.-i. Teraoka and M. Abe, Thermodynamic analysis of
the Fe–Ti–P ternary system by incorporating first-principles calculations into the CALPHAD
approach. Calphad 30 (2006), 2, pp. 147–158. doi:10.1016/J.CALPHAD.2005.09.006
[25] J.H. Shim, C.S. Oh and D.N. Lee, Thermodynamic Properties and Calculation of Phase
Diagram of the Fe-P System. Journal of the Korean Institute of Metals and Materials 34 (1996),
11, pp. 1385–1393.
[26] J. Miettinen and G. Vassilev, Thermodynamic Description of Ternary Fe-X-P Systems.
Part 1: Fe-Cr-P. Journal of Phase Equilibria and Diffusion 35 (2014), 4, pp. 458–468.
doi:10.1007/s11669-014-0314-x
[27] Z. You and I.-H. Jung, Critical Evaluation and Thermodynamic Optimization of the Fe-P
System. Metallurgical and Materials Transactions B 51 (2020), 6, pp. 3108–3129.
doi:10.1007/s11663-020-01939-0
[28] C.W. Bale, E. Bélisle, P. Chartrand, S.A. Decterov, G. Eriksson, A.E. Gheribi, K. Hack, I.-
H. Jung, Y.-B. Kang, J. Melançon, A.D. Pelton, S. Petersen, C. Robelin, J. Sangster, P.
BIBLIOGRAPHY
PhD thesis Michael Bernhard 69
Spencer and M.-A. van Ende, FactSage thermochemical software and databases, 2010–2016.
Calphad 54 (2016), pp. 35–53.
[29] P. Gustafson, Study of the Thermodynamic Properties of the C-Cu-Fe-P, Fe-Mo-P and
Fe-Ni-P Systems. Report IM-2549, Swedish Institute for Metals Research, Stockholm,
Sweden, 1990
[30] J.H. Shim, D.N. Lee and C.S. Oh, Thermodynamic assessment of the Fe-C-P system.
Zeitschrift für Metallkunde 91 (2000), pp. 114–120.
[31] V. Raghavan, C-Fe-P (Carbon-Iron-Phosphorus). Journal of Phase Equilibria and
Diffusion 25 (2004), 6, pp. 541–542. doi:10.1007/s11669-004-0070-4
[32] J.E. Stead, Iron and Phosphorus. Journal of the Iron and Steel Institute 58 (1900), pp. 60–
155.
[33] E. Gercke, Experimental Thermal and Metallographic Investigation on the System Iron
Phosphorus. Metallurgie 5 (1908), 20, pp. 604–609.
[34] B. Saklatwalla, Constitution of the Iron and Phosphorous Compounds. Journal of the Iron
and Steel Institute 77 (1908), pp. 92–103.
[35] N. Konstantinow, Phosphide of Iron. Zeitschrift für anorganische und allgemeine Chemie
66 (1910), pp. 209–227.
[36] J.L. Haughton, Alloys of Iron Research. Part VIII. The Constitution of Alloys of Iron and
Phosphorus. Journal of the Iron and Steel Institute 115 (1927), pp. 417–433.
[37] P. Roquet and G. Jegaden, Contribution à l'étude du diagramme fer-phosphore. Revue
de Métallurgie 48 (1951), 9, pp. 712–721. doi:10.1051/metal/195148090712
[38] K. Lorenz and H. Fabritius, Anwendung der magnetischen Waage zur Aufstellung von
Zustandsschaubildern im Bereich des festen Zustandes eisenreicher Systeme Untersuchung
am System Eisen-Phosphor. Archiv für das Eisenhüttenwesen 33 (1962), 4, pp. 269–275.
doi:10.1002/srin.196203329
[39] W.A. Fischer, K. Lorenz, H. Fabritius, A. Hoffmann and G. Kalwa, Untersuchung von
Phasenumwandlungen in reinen Eisenlegierungen mit der magnetischen Waage. Archiv für
das Eisenhüttenwesen 37 (1966), 1, pp. 79–86. doi:10.1002/srin.196602736
[40] E. Wachtel, G. Urbain and E. Übelacker, Étude du Diagramme Fer-Phosphore par Analyse
Magnétique et Thermique. Comptes Rendus 257 (1963), pp. 2470–2472.
BIBLIOGRAPHY
PhD thesis Michael Bernhard 70
[41] H. Kaneko, T. Nishizawa, K. Tamaki and A. Tanifuji, Solubility of Phosphorus in alpha and
gamma-Iron. Journal of the Japan Institute of Metals 29 (1965), 2, pp. 166–170.
doi:10.2320/jinstmet1952.29.2_166
[42] A.S. Doan and J.I. Goldstein, The ternary phase diagram, Fe-Ni-P. Metallurgical and
Materials Transactions B 1 (1970), 6, pp. 1759–1767. doi:10.1007/BF02642026
[43] M. Ko and T. Nishizawa, Effect of Magnetic Transition on the Solubility of Alloying
Elements in Alpha Iron. Journal of the Japan Institute of Metals 43 (1979), 2, pp. 118–126.
doi:10.2320/jinstmet1952.43.2_118
[44] E. Schürmann and H.-P. Kaiser, Beitrag zu den Schmelzgleichgewichten der Eisen-
Aluminium- und Eisen-Phosphor-Legierungen. Archiv für das Eisenhüttenwesen 51 (1980), 8,
pp. 325–327. doi:10.1002/srin.198004848
[45] Z. Morita and T. Tanaka, Equilibrium distribution coefficient of phosphorus in iron alloys.
ISIJ International 26 (1986), 2, pp. 114–120. doi:10.2355/isijinternational1966.26.114
[46] H.-P. Hofmann, K. Löhberg and W. Reif, Über die Löslichkeit des Phosphors in Eisen und
Eisen-Kohlenstoff-Legierungen unterhalb 1000°C. Archiv für das Eisenhüttenwesen 41 (1970),
10, pp. 975–982. doi:10.1002/srin.197001687
[47] E. Schürmann, U. Hensgen and J. Schweinichen, Schmelzgleichgewichte der ternaeren
Systeme Eisen-Kohlenstoff-Silicium und Eisen-Kohlenstoff-Phosphor: Untersuchungen zur
Festlegung der Liquidusflaechen und der Linien doppelter Saettigung auf der eisenreichen
Seite der stabilen und metastabilen Systeme Eisen-Kohlenstoff-Silicium und Eisen-
Kohlenstoff-Phosphor. Giessereiforschung 36 (1984), 4, pp. 121–129.
[48] Foundry Technologies & Engineering GmbH (FT&E), https://www.giessereilexikon.com/,
Accessed: 16.06.2021
[49] P. Görens and W. Dobbelstein, The Fe-P-C Ternary System. Metallurgie 5 (1908), pp.
561–566.
[50] F. Wüst, Influence of Phosphorus on Iron-Carbon (in German). Metallurgie 5 (1908), pp.
73–87.
[51] J.E. Stead, Iron, Carbon, Phosphorus. Journal of the Iron and Steel Institute 97 (1918),
pp. 389–415.
[52] R. Vogel, Ueber das System Eisen-Phosphor-Kohlenstoff. Archiv für das
Eisenhüttenwesen 3 (1929), 5, pp. 369–381.
BIBLIOGRAPHY
PhD thesis Michael Bernhard 71
[53] T. Ohide and G. Ohira, The solidification structures of iron-carbon-phosphorus ternary
Alloys. British Foundryman 68 (1975), pp. 106–115.
[54] G. Langenscheid, H.A. Mathesius and F.K. Naumann, Anwendung des quantitativen
Fernsehmikroskopes und der Elektronenstrahlmikrosonde für die Untersuchung des Systems
Eisen-Kohlenstoff-Phosphor bei 900 bis 1000°C. Archiv für das Eisenhüttenwesen 41 (1970),
8, pp. 817–824. doi:10.1002/srin.197001663
[55] T. Nishizawa, unpublished work, cited by Gustafson (1990) and Shim et al. (2000).
[56] P. Presoly, R. Pierer and C. Bernhard, Identification of Defect Prone Peritectic Steel
Grades by Analyzing High-Temperature Phase Transformations. Metallurgical and Materials
Transactions A 44 (2013), 12, pp. 5377–5388. doi:10.1007/s11661-013-1671-5
[57] P. Presoly, G. Xia, P. Reisinger and C. Bernhard, Continuous Casting of Hypo-peritectic
Steels: Mould Thermal Monitoring and DSC-analysis. Berg- und Hüttenmännische
Monatshefte 159 (2014), 11, pp. 430–437. doi:10.1007/s00501-014-0306-5
[58] G. Azizi, B.G. Thomas and M. Asle Zaeem, Review of Peritectic Solidification Mechanisms
and Effects in Steel Casting. Metallurgical and Materials Transactions B 51 (2020), 5, pp.
1875–1903. doi:10.1007/s11663-020-01942-5
[59] R. Vertnik and B. Šarler, Solution of a continuous casting of steel benchmark test by a
meshless method. Engineering Analysis with Boundary Elements 45 (2014), pp. 45–61.
doi:10.1016/j.enganabound.2014.01.017
[60] B.G. Thomas, J.K. Brimacombe and I.V. Samarasekera, The Formation of Panel Cracks
in Steel Ingots: A State-of-the-Art Review. ISS Transactions 7 (1986), pp. 7–20.
[61] J.K. Brimacombe, The challenge of quality in continuous casting processes. Metallurgical
and Materials Transactions B 30 (1999), 4, pp. 553–566. doi:10.1007/s11663-999-0016-7
[62] J.K. Brimacombe and K. Sorimachi, Crack formation in the continuous casting of steel.
Metallurgical and Materials Transactions B 8 (1977), 2, pp. 489–505. doi:10.1007/BF02696937
[63] R. Krobath, C. Bernhard, S. Ilie, J. Six, S. Hahn and P. Pennerstorfer, The Role of Grain
Boundary Oxidation on Surface Crack Formation under Continuous Casting Conditions. Berg-
und Hüttenmännische Monatshefte 164 (2019), 11, pp. 461–465. doi:10.1007/s00501-019-
00902-0
[64] Z. Morita and T. Tanaka, Thermodynamics of solute distributions between solid and liquid
phases in iron-base ternary alloys. ISIJ International 23 (1983), 10, pp. 824–833.
doi:10.2355/isijinternational1966.23.824
BIBLIOGRAPHY
PhD thesis Michael Bernhard 72
[65] R.L. Smith and J.L. Rutherford, Zone purification of reactive metals. Journal of Metals 9
(1957), 4, pp. 478–484. doi:10.1007/BF03397903
[66] W.A. Fischer, H. Spitzer and M. Hishinuma, Das Zonenschmelzen von Eisen und die
Ermittlung der Verteilungskoeffizienten für Kohlenstoff, Phosphor, Schwefel und Sauerstoff.
Archiv für das Eisenhüttenwesen 31 (1960), 6, pp. 365–371. doi:10.1002/srin.196002871
[67] W.A. Fischer and H. Frye, Das Zonenschmelzen von weichmagnetischen Stählen und
sein Einfluß auf den Konzentrationsverlauf der Begleitelemente in Stäben bis 60 mm
Durchmesser. Archiv für das Eisenhüttenwesen 41 (1970), 3, pp. 293–302.
doi:10.1002/srin.197001604
[68] F. Oeters, K. Rüttiger, A. Diener and G. Zahs, Zur Theorie der metallurgischen Vorgänge
bei der Erstarrung von Stahl. Archiv für das Eisenhüttenwesen 40 (1969), 8, pp. 603–613.
doi:10.1002/srin.196904363
[69] T.P. Battle and R.D. Pehlke, Equilibrium partition coefficients in iron-based alloys.
Metallurgical and Materials Transactions B 20 (1989), 2, pp. 149–160.
doi:10.1007/BF02825596
[70] W.G. Pfann, Principles of Zone-Melting. Journal of Metals 4 (1952), 7, pp. 747–753.
doi:10.1007/BF03398137
[71] Y. Nakamura and H. Esaka, Measurement of the equilibrium partition coefficient of
phosphorus in carbon steel. Tetsu-to-Hagane 67 (1981), S140 - S141.
[72] P. Spencer and O. Kubaschewski, A thermodynamic assessment of the iron-phosphorus
system. Archiv für das Eisenhüttenwesen 49 (1978), 5, pp. 225–228.
doi:10.1002/srin.197804616
[73] N. Yoshida, O. Umezawa and K. Nagai, Influence of Phosphorus on Solidification
Structure in Continuously Cast 0.1 mass% Carbon Steel. ISIJ International 43 (2003), 3, pp.
348–357. doi:10.2355/isijinternational.43.348
[74] G.H. Gulliver, Metallic Alloys (1922), Griffin.
[75] E. Scheil, Bemerkungen zur Schichtkristallbildung. Zeitschrift für Metallkunde 34 (1942),
pp. 70–72.
[76] H.D. Brody and M.C. Flemings, Solute Redistribution in Dendritic Solidification.
Transactions of the Metallurgical Society of AIME 236 (1966), pp. 615–623.
BIBLIOGRAPHY
PhD thesis Michael Bernhard 73
[77] T.W. Clyne and W. Kurz, Solute redistribution during solidification with rapid solid state
diffusion. Metallurgical and Materials Transactions A 12 (1981), 6, pp. 965–971.
doi:10.1007/BF02643477
[78] I. Ohnaka, Mathematical analysis of solute redistribution during solidification with diffusion
in solid phase. ISIJ International 26 (1986), 12, pp. 1045–1051.
doi:10.2355/isijinternational1966.26.1045
[79] Y. Ueshima, S. Mizoguchi, T. Matsumiya and H. Kajioka, Analysis of solute distribution in
dendrites of carbon steel with δ/γ transformation during solidification. Metallurgical and
Materials Transactions B 17 (1986), 4, pp. 845–859. doi:10.1007/BF02657148
[80] S. Kobayashi, Solute redistribution during solidification with diffusion in solid phase: A
theoretical analysis. Journal of Crystal Growth 88 (1988), 1, pp. 87–96. doi:10.1016/S0022-
0248(98)90010-0
[81] E. Kozeschnik, A scheil-gulliver model with back-diffusion applied to the microsegregation
of chromium in Fe-Cr-C alloys. Metallurgical and Materials Transactions A 31 (2000), 6, pp.
1682–1684. doi:10.1007/s11661-000-0179-y
[82] E. Kozeschnik, W. Rindler and B. Buchmayr, Scheil–Gulliver simulation with partial
redistribution of fast diffusers and simultaneous solid–solid phase transformations.
International Journal of Materials Research 98 (2007), 9, pp. 826–831.
doi:10.3139/146.101535
[83] Q. Chen and B. Sundman, Computation of Partial Equilibrium Solidification with Complete
Interstitial and Negligible Substitutional Solute Back Diffusion. Materials Transactions 43
(2002), 3, pp. 551–559. doi:10.2320/matertrans.43.551
[84] D. You, C. Bernhard, G. Wieser and S. Michelic, Microsegregation Model with Local
Equilibrium Partition Coefficients During Solidification of Steels. steel research international 87
(2016), 7, pp. 840–849. doi:10.1002/srin.201500216
[85] M. Wolf and W. Kurz, The effect of carbon content on solidification of steel in the
continuous casting mold. Metallurgical and Materials Transactions B 12 (1981), 1, pp. 85–93.
doi:10.1007/BF02674761
[86] Y.-M. Won and B.G. Thomas, Simple model of microsegregation during solidification of
steels. Metallurgical and Materials Transactions A 32 (2001), 7, pp. 1755–1767.
doi:10.1007/s11661-001-0152-4
[87] C. Bernhard, Anforderungen an prozessorientierte Heißrissbildungsmodelle. Berg- und
Hüttenmännische Monatshefte 149 (2004), 3, pp. 90–95.
BIBLIOGRAPHY
PhD thesis Michael Bernhard 74
[88] R. Pierer, Formulation of a Hot Tearing Criterion for the Continuous Casting Process. PhD
thesis, Leoben, Austria (2007).
[89] W.S. Pellini, Strain Theory of Hot Tearing. Foundry 80 (1952), pp. 125–199.
[90] J. Reiter, R. Pierer, C. Bernhard and S. Ilie, The role of tramp elements in hot tearing of
steels in the continuous casting process. European Congress on Advanced Materials and
Processes, Nürnberg, Germany (2007).
[91] J. Reiter, R. Pierer, S. Ilie, H. Preßlinger, J. Fluch and C. Bernhard, Über die Bildung von
Heißrissseigerungen in Stahl: Vergleichende Untersuchungen an Stranggussbrammen und
Laborversuchsproben. Berg- und Hüttenmännische Monatshefte 155 (2010), 3, pp. 129–135.
doi:10.1007/s00501-010-0549-8
[92] T.W. Clyne, M. Wolf and W. Kurz, The effect of melt composition on solidification cracking
of steel, with particular reference to continuous casting. Metallurgical and Materials
Transactions B 13 (1982), 2, pp. 259–266. doi:10.1007/BF02664583
[93] M. Wintz, M. Bobadilla and J.M. Jolivet, Fragilité à la solidification des aciers influence du
carbone, du soufre et du phosphore. Revue de Métallurgie 91 (1994), 1, pp. 105–114.
doi:10.1051/metal/199491010105
[94] L. Kaufmann and H. Bernstein, Computer calculation of phase diagrams with special
reference to refractory metals. New York (1970), Academic Press.
[95] J. Allison, D. Backman and L. Christodoulou, Integrated computational materials
engineering: A new paradigm for the global materials profession. JOM (The Journal of The
Minerals, Metals & Materials Society) 58 (2006), 11, pp. 25–27. doi:10.1007/s11837-006-0223-
5
[96] National Research Council, Integrated Computational Materials Engineering: A
Transformational Discipline for Improved Competitiveness and National Security. Washingten,
DC (2008), The National Academies Press.
[97] W. Yi Wang, J. Li, W. Liu and Z.-K. Liu, Integrated computational materials engineering
for advanced materials: A brief review. Computational Materials Science 158 (2019), pp. 42–
48. doi:10.1016/j.commatsci.2018.11.001
[98] R. Schmid-Fetzer and J. Gröbner, Focused Development of Magnesium Alloys Using the
Calphad Approach. Advanced Engineering Materials 3 (2001), 12, pp. 947–961.
[99] E. Kozeschnik and B. Buchmayer, Matcalc–a simulation tool for multicomponent ther-
modynamics, diffusion and phase transformation kinetics. in Mathematical modelling of weld
phenomena (2001), pp. 349–361.
BIBLIOGRAPHY
PhD thesis Michael Bernhard 75
[100] R.H. Davies, A.T. Dinsdale, J.A. Gisby, J.A.J. Robinson and S.M. Martin, MTDATA -
thermodynamic and phase equilibrium software from the national physical laboratory. Calphad
26 (2002), 2, pp. 229–271. doi:10.1016/S0364-5916(02)00036-6
[101] W. Cao, S.-L. Chen, F. Zhang, K. Wu, Y. Yang, Y.A. Chang, R. Schmid-Fetzer and W.A.
Oates, PANDAT software with PanEngine, PanOptimizer and PanPrecipitation for multi-
component phase diagram calculation and materials property simulation. Calphad 33 (2009),
2, pp. 328–342. doi:10.1016/j.calphad.2008.08.004
[102] J.-O. Andersson, T. Helander, L. Höglund, P. Shi and B. Sundman, Thermo-Calc &
DICTRA, computational tools for materials science. Calphad 26 (2002), 2, pp. 273–312.
[103] B. Sundman, U.R. Kattner, M. Palumbo and S.G. Fries, OpenCalphad - a free
thermodynamic software. Integrating Materials and Manufacturing Innovation 4 (2015), 1, pp.
1–15. doi:10.1186/s40192-014-0029-1
[104] R. Otis and Z.-K. Liu, pycalphad: CALPHAD-based Computational Thermodynamics in
Python. Journal of Open Research Software 5 (2017), 2, pp. 273. doi:10.5334/jors.140
[105] H.L. Lukas, S.G. Fries and B. Sundman, Computational thermodynamics. Cambridge
(2007), Cambridge University Press.
[106] National Institute of Standards and Technology, Thermodynamic & Kinetic Data for
Sustainable Energy. https://www.nist.gov/programs-projects/thermodynamic-kinetic-data-
sustainable-energy, Accessed: 24.05.2021
[107] Scientific Group Thermodata Europe, Thermochemistry methods.
https://www.sgte.net/en/thermochemistry-methods, Accessed: 24.05.2021
[108] A. Kroupa, Modelling of phase diagrams and thermodynamic properties using Calphad
method – Development of thermodynamic databases. Computational Materials Science 66
(2013), May, pp. 3–13. doi:10.1016/j.commatsci.2012.02.003
[109] A.T. Dinsdale, SGTE data for pure elements. Calphad 15 (1991), 4, pp. 317–425.
doi:10.1016/0364-5916(91)90030-N
[110] U.R. Kattner, The Calphad Method and its Role in Material and Process Development.
Tecnologia em metalurgia, materiais e mineracao 13 (2016), 1, pp. 3–15.
[111] R. Schmid-Fetzer, D. Andersson, P.Y. Chevalier, L. Eleno, O. Fabrichnaya, U.R. Kattner,
B. Sundman, C. Wang, A. Watson, L. Zabdyr and M. Zinkevich, Assessment techniques,
database design and software facilities for thermodynamics and diffusion. Calphad 31 (2007),
1, pp. 38–52. doi:10.1016/j.calphad.2006.02.007
BIBLIOGRAPHY
PhD thesis Michael Bernhard 76
[112] U.R. Kattner, The need for reliable data in computational thermodynamics. High
Temperatures-High Pressures 49 (2020), 1-2, pp. 31–47. doi:10.32908/hthp.v49.853
[113] U.R. Kattner, The Art of Data Evaluation. Journal of Phase Equilibria and Diffusion 32
(2011), 2, pp. 85. doi:10.1007/s11669-011-9850-9
[114] Y. Wang, S. Curtarolo, C. Jiang, R. Arroyave, T. Wang, G. Ceder, L.-Q. Chen and Z.-K.
Liu, Ab initio lattice stability in comparison with CALPHAD lattice stability. Calphad 28 (2004),
1, pp. 79–90. doi:10.1016/j.calphad.2004.05.002
[115] P.E.A. Turchi, I.A. Abrikosov, B. Burton, S.G. Fries, G. Grimvall, L. Kaufman, P.
Korzhavyi, V. Rao Manga, M. Ohno, A. Pisch, A. Scott and W. Zhang, Interface between
quantum-mechanical-based approaches, experiments, and CALPHAD methodology. Calphad
31 (2007), 1, pp. 4–27. doi:10.1016/j.calphad.2006.02.009
[116] Z.-K. Liu, First-Principles Calculations and CALPHAD Modeling of Thermodynamics.
Journal of Phase Equilibria and Diffusion 30 (2009), 5, pp. 517–534. doi:10.1007/s11669-009-
9570-6
[117] H.L. Lukas, E.T. Henig and B. Zimmermann, Optimization of phase diagrams by a least
squares method using simultaneously different types of data. Calphad 1 (1977), 3, pp. 225–
236. doi:10.1016/0364-5916(77)90002-5
[118] D.W. Marquardt, An Algorithm for Least-Squares Estimation of Nonlinear Parameters.
Journal of the Society for Industrial and Applied Mathematics 11 (1963), 2, pp. 431–441.
doi:10.1137/0111030
[119] E. Königsberger, Improvement of excess parameters from thermodynamic and phase
diagram data by a sequential Bayes algorithm. Calphad 15 (1991), 1, pp. 69–78.
doi:10.1016/0364-5916(91)90027-H
[120] H.L. Lukas and S.G. Fries, Demonstration of the use of “BINGSS” with the Mg-Zn system
as example. Journal of Phase Equilibria 13 (1992), 5, pp. 532–542. doi:10.1007/BF02665766
[121] B. Bocklund, R. Otis, A. Egorov, A. Obaied, I. Roslyakova and Z.-K. Liu, ESPEI for
efficient thermodynamic database development, modification, and uncertainty quantification:
application to Cu–Mg. MRS Communications 9 (2019), 2, pp. 618–627.
doi:10.1557/mrc.2019.59
[122] F. Tang and B. Hallstedt, Using the PARROT module of Thermo-Calc with the Cr–Ni
system as example. Calphad 55 (2016), 5, pp. 260–269. doi:10.1016/j.calphad.2016.10.003
BIBLIOGRAPHY
PhD thesis Michael Bernhard 77
[123] I.-H. Jung and M.-A. van Ende, Computational Thermodynamic Calculations: FactSage
from CALPHAD Thermodynamic Database to Virtual Process Simulation. Metallurgical and
Materials Transactions B 51 (2020), 5, pp. 1851–1874.
[124] M. Pudar, S. Zamberger, K. Spiradek-Hahn, R. Radis and E. Kozeschnik, Computational
Analysis of Precipitation during Continuous Casting of Microalloyed Steel. steel research
international 81 (2010), 5, pp. 372–380. doi:10.1002/srin.201000021
[125] S. Zamberger, M. Pudar, K. Spiradek-Hahn, M. Reischl and E. Kozeschnik, Numerical
simulation of the evolution of primary and secondary Nb(CN), Ti(CN) and AlN in Nb-
microalloyed steel during continuous casting. International Journal of Materials Research 103
(2012), 6, pp. 680–687. doi:10.3139/146.110688
[126] M. Lückl, O. Caliskanoglu, S. Ilie, J. Six and E. Kozeschnik, Impact of Surface Structure
Control Cooling During Continuous Casting on Hot Ductility of Microalloyed Steel. steel
research international 87 (2016), 7, pp. 871–879. doi:10.1002/srin.201500248
[127] B. Sundman, Q. Chen and Y. Du, A Review of Calphad Modeling of Ordered Phases.
Journal of Phase Equilibria and Diffusion 39 (2018), 5, pp. 678–693. doi:10.1007/s11669-018-
0671-y
[128] A.D. Pelton, Phase Diagrams and Thermodynamic Modeling of Solutions (2019),
Elsevier.
[129] A.I. Zaitsev, Z.V. Dobrokhotova, A.D. Litvina and B.M. Mogutnov, Thermodynamic
properties and phase equilibria in the Fe–P system. Journal of the Chemical Society, Faraday
Transactions 91 (1995), 4, pp. 703–712. doi:10.1039/FT9959100703
[130] O. Redlich and A.T. Kister, Algebraic Representation of Thermodynamic Properties and
the Classification of Solutions. Industrial & Engineering Chemistry 40 (1948), 2, pp. 345–348.
doi:10.1021/ie50458a036
[131] M. Hillert, Empirical methods of predicting and representing thermodynamic properties
of ternary solution phases. Calphad 4 (1980), 1, pp. 1–12. doi:10.1016/0364-5916(80)90016-
4
[132] M. Hillert, The compound energy formalism. Journal of Alloys and Compounds 320
(2001), 2, pp. 161–176. doi:10.1016/S0925-8388(00)01481-X
[133] R.-Z. Zhang and M.J. Reece, High-Entropy Ceramics, in: Reference Module in Materials
Science and Materials Engineering. 119 (2021), Elsevier.
[134] A.D. Pelton and Y.-B. Kang, Modeling short-range ordering in solutions. International
Journal of Materials Research 98 (2007), 10, pp. 907–917. doi:10.3139/146.101554
BIBLIOGRAPHY
PhD thesis Michael Bernhard 78
[135] A.D. Pelton, S.A. Degterov, G. Eriksson, C. Robelin and Y. Dessureault, The modified
quasichemical model I—Binary solutions. Metallurgical and Materials Transactions B 31
(2000), 4, pp. 651–659. doi:10.1007/s11663-000-0103-2
[136] A.D. Pelton and P. Chartrand, The modified quasi-chemical model: Part II.
Multicomponent solutions. Metallurgical and Materials Transactions A 32 (2001), 6, pp. 1355–
1360. doi:10.1007/s11661-001-0226-3
[137] S. Cui and I.-H. Jung, Critical reassessment of the Fe-Si system. Calphad 56 (2017),
584, pp. 108–125. doi:10.1016/j.calphad.2016.11.003
[138] M.-A. van Ende and I.-H. Jung, Critical thermodynamic evaluation and optimization of
the Fe–B, Fe–Nd, B–Nd and Nd–Fe–B systems. Journal of Alloys and Compounds 548 (2013),
pp. 133–154. doi:10.1016/j.jallcom.2012.08.127
[139] M.-S. Kim and Y.-B. Kang, Thermodynamic Modeling of the Fe-Mn-C and the Fe-Mn-Al
Systems Using the Modified Quasichemical Model for Liquid Phase. Journal of Phase
Equilibria and Diffusion 36 (2015), 5, pp. 453–470. doi:10.1007/s11669-015-0401-7
[140] K. Shubhank and Y.-B. Kang, Critical evaluation and thermodynamic optimization of Fe–
Cu, Cu–C, Fe–C binary systems and Fe–Cu–C ternary system. Calphad 45 (2014), pp. 127–
137. doi:10.1016/j.calphad.2013.12.002
[141] P. Walder and A.D. Pelton, Thermodynamic modeling of the Fe-S system. Journal of
Phase Equilibria and Diffusion 26 (2005), 1, pp. 23–38. doi:10.1007/s11669-005-0055-y
[142] Y.-B. Kang, Critical evaluations and thermodynamic optimizations of the Mn–S and the
Fe–Mn–S systems. Calphad 34 (2010), 2, pp. 232–244. doi:10.1016/j.calphad.2010.03.005
[143] F. Tafwidli and Y.-B. Kang, Thermodynamic Modeling of Fe–C–S Ternary System. ISIJ
International 57 (2017), 5, pp. 782–790. doi:10.2355/isijinternational.ISIJINT-2016-672
[144] P. Waldner and A.D. Pelton, Thermodynamic modeling of the Ni–S system. Zeitschrift
für Metallkunde 95 (2004), 8, pp. 672–681. doi:10.3139/146.018005
[145] P. Waldner and A.D. Pelton, Critical thermodynamic assessment and modeling of the
Fe-Ni-S system. Metallurgical and Materials Transactions B 35 (2004), 5, pp. 897–907.
doi:10.1007/s11663-004-0084-7
[146] M.-K. Paek, J.-J. Pak and Y.-B. Kang, Phase equilibria and thermodynamics of Mn–C,
Mn–Si, Si–C binary systems and Mn–Si–C ternary system by critical evaluation, combined with
experiment and thermodynamic modeling. Calphad 46 (2014), S415, pp. 92–102.
doi:10.1016/j.calphad.2014.02.007
BIBLIOGRAPHY
PhD thesis Michael Bernhard 79
[147] B. Hallemans, P. Wollants and J.R. Roos, Thermodynamic Reassessment and
Calculation of the Fe-B Phase Diagram. International Journal of Materials Research 85 (1994),
10, pp. 676–682. doi:10.1515/ijmr-1994-851002
[148] D. Djurovic, B. Hallstedt, J. von Appen and R. Dronskowski, Thermodynamic assessment
of the Mn–C system. Calphad 34 (2010), 3, pp. 279–285. doi:10.1016/j.calphad.2010.05.002
[149] Y.O. Esin, V.M. Baev, M.S. Petrushevskii and P.V. Gel'd, Enthalpies of formation of liquid
binary alloys of cobalt and iron with boron (in Russian). Izvestija Akademii Nauk SSSR 3
(1975), pp. 82–86.
[150] V.T. Witusiewicz, A.K. Biletski and V.S. Shumikin, Thermodynamic properties of liquid
Mn-C alloys. Metally 6 (1988), pp. 26–29.
[151] Y.-M. Muggianu, M. Gambino and J.-P. Bros, Enthalpies de formation des alliages
liquides bismuth-étain-gallium à 723 k. Choix d’une représentation analytique des grandeurs
d’excès intégrales et partielles de mélange. Journal de Chimie Physique 72 (1975), pp. 83–
88. doi:10.1051/jcp/1975720083
[152] F. Kohler, Zur Berechnung der thermodynamischen Daten eines ternren Systems aus
den zugehrigen binren Systemen. Monatshefte für Chemie 91 (1960), 4, pp. 738–740.
doi:10.1007/BF00899814
[153] G.W. Toop, Predicting ternary activities using binary data. Transactions of the
Metallurgical Society of AIME 233 (1965), 5, pp. 850–855.
[154] Z.-M. Cao, K.-P. Wang, Z.-Y. Qiao and G.-W. Du, Thermodynamic Reoptimization of the
Fe-P System. Acta Physico-Chimica Sinica 28 (2012), 01, pp. 37–43.
doi:10.3866/PKU.WHXB201111172
[155] J. Miettinen, S. Louhenkilpi, H. Kytönen and J. Laine, IDS: Thermodynamic–kinetic–
empirical tool for modelling of solidification, microstructure and material properties.
Mathematics and Computers in Simulation 80 (2010), 7, pp. 1536–1550.
doi:10.1016/j.matcom.2009.11.002
[156] J. Miettinen, S. Louhenkilpi, V.-V. Visuri and T. Fabritius, Advances in Modeling of Steel
Solidification with IDS. IOP Conference Series: Materials Science and Engineering 529 (2019),
pp. 12063. doi:10.1088/1757-899X/529/1/012063
[157] S. Louhenkilpi, M. Mäkinen, S. Vapalahti, T. Räisänen and J. Laine, 3D steady state and
transient simulation tools for heat transfer and solidification in continuous casting. Materials
Science and Engineering: A 413-414 (2005), pp. 135–138. doi:10.1016/j.msea.2005.08.153
BIBLIOGRAPHY
PhD thesis Michael Bernhard 80
[158] S. Louhenkilpi, J. Miettinen, J. Laine, R. Vesanen, I. Rentola, J. Moilanen, V.-V. Visuri,
E.-P. Heikkinen and A. Jokilaakso, Online Modelling of Heat Transfer, Solidification and
Microstructure in Continuous Casting of Steel. IOP Conference Series: Materials Science and
Engineering 529 (2019), pp. 12051. doi:10.1088/1757-899X/529/1/012051
[159] S. Louhenkilpi, J. Miettinen, V.-V. Visuri, M.C. Somani, S. Koskenniska and T. Fabritius,
New phenomenological quality criteria for continuous casting of steel based on solidification
and microstructure tool IDS. Ironmaking & Steelmaking 48 (2021), 2, pp. 170–179.
doi:10.1080/03019233.2020.1758994
[160] S. Saleem, M. Vynnycky and H. Fredriksson, The Influence of Peritectic
Reaction/Transformation on Crack Susceptibility in the Continuous Casting of Steels.
Metallurgical and Materials Transactions B 48 (2017), 3, pp. 1625–1635. doi:10.1007/s11663-
017-0926-8
[161] E. Moukhina and E. Kaisersberger, Temperature dependence of the time constants for
deconvolution of heat flow curves. Thermochimica Acta 492 (2009), 1-2, pp. 101–109.
doi:10.1016/j.tca.2008.12.022
[162] Software: NETZSCH Tau-Calibration 8.0.1 from Netzsch Gerätebau GmbH, Selb,
Germany, 2019.
[163] W.J. Boettinger, U.R. Kattner, K.W. Moon and J. Perepezko, NIST Recommended
Practice Guide: DTA and Heat-Flux DSC Measurements of Alloy Melting and Freezing. Special
Publication 960-15 (2006)
[164] L.A. Chapman, Application of high temperature DSC technique to nickel based
superalloys. Journal of Materials Science 39 (2004), 24, pp. 7229–7236.
doi:10.1023/B:JMSC.0000048736.86794.12
[165] M. Bernhard, P. Presoly, N. Fuchs, C. Bernhard and Y.-B. Kang, Experimental Study of
High Temperature Phase Equilibria in the Iron-Rich Part of the Fe-P and Fe-C-P Systems.
Metallurgical and Materials Transactions A 51 (2020), 10, pp. 5351–5364.
doi:10.1007/s11661-020-05912-z
[166] M. Bernhard, Y.-B. Kang, P. Presoly, A.E. Gheribi and C. Bernhard, Critical evaluation
and thermodynamic modeling of the Fe–P and Fe–C–P system. Calphad 70 (2020), 1, pp.
101795. doi:10.1016/j.calphad.2020.101795
[167] E.T. Turkdogan and L.E. Leake, Thermodynamics of carbon dissolved in iron alloys. Part
I: Solubility of carbon in iron-phosphorus, iron-silicon, and iron-manganese melts. Journal of
the Iron and Steel Institute 179 (1955), pp. 39–43.
BIBLIOGRAPHY
PhD thesis Michael Bernhard 81
[168] H. Schenck, E. Steinmetz and R. Gohlke, Beitrag zur chemischen Aktivität der Elemente
Phosphor, Schwefel, Silizium, Kupfer und Chrom in flüssigen kohlenstoffgesättigten
Eisenlösungen. Archiv für das Eisenhüttenwesen 37 (1966), 12, pp. 919–924.
doi:10.1002/srin.196604304
[169] E. Schürmann and D. Kramer, Untersuchungen über den Einfluss der Temperatur und
über die äquivalente Wirkung der Legierungselemente auf die Kohlenstofflöslichkeit in
eisenreichen, kohlenstoffgesättigten Drei- und Mehrstoffschmelzen. Giessereiforschung 21
(1969), 1, pp. 29–42.
[170] H.G. Hadrys, M.G. Frohberg and J.F. Elliott, Activities in the liquid Fe-Cr-C(sat), Fe-P-
C(sat) and Fe-Cr-P systems at 1600 °C. Metallurgical Transactions 1 (1970), 7, pp. 1867–
1874.
[171] Y.D. Yang, Interaction coefficients in Fe-C-P ternary and Fe-Cr-C-P quaternary solutions
at 1400 °C. Scandinavian Journal of Metallurgy 21 (1992), pp. 194–201.
[172] P. Gustafson, A thermodynamic evaluation of the Fe-C system. Scandinavian Journal of
Metallurgy 14 (1985), 5, pp. 259–267.
[173] M. Bernhard, N. Fuchs, P. Presoly, P. Angerer, B. Friessnegger and C. Bernhard,
Characterization of the γ-loop in the Fe-P system by coupling DSC and HT-LSCM with
complementary in-situ experimental techniques. Materials Characterization 174 (2021), 11, pp.
111030. doi:10.1016/j.matchar.2021.111030
[174] M. Bernhard, Adjustment of microsegregation models by means of hot tearing
investigations on solidifying steel. Masterthesis, Leoben, Austria (2016).
[175] M. Bernhard, P. Presoly, C. Bernhard, J. Six and S. Ilie, On the Relevance of
Microsegregation Models for Process Control in Continuous Casting of Steel. Proceedings of
the 26th International Conference on Metallurgy and Materials, Brno, Czech Republic (2017).
[176] R. Pierer and C. Bernhard, On the influence of carbon on secondary dendrite arm spacing
in steel. Journal of Materials Science 43 (2008), 21, pp. 6938–6943. doi:10.1007/s10853-008-
2985-3
[177] M. Bernhard, C. Bernhard, P. Presoly and D. You, An alternative approach for the
experimental verification of microsegregation models using an in-situ hot tensile test during
solidification of steel. Proceedings of the 7th International Conference on Solidification and
Gravity, Miskolc-Lillafüred, Hungary (2018).
BIBLIOGRAPHY
PhD thesis Michael Bernhard 82
[178] J. Miettinen and A.A. Howe, Estimation of liquidus temperatures for steels using
thermodynamic approach. Ironmaking & Steelmaking 27 (2000), 3, pp. 212–227.
doi:10.1179/030192300677516
[179] G. Xia, Kokillenmetallurgie des konventionellen Brammenstranggießens von Stahl.
Habilitation thesis, Leoben, Austria (2001).
[180] J. Miettinen, Thermodynamic–kinetic simulation of solidification and phase
transformations in steels. Report TKK-MK-78, Helsinki University of Technology Publications
in Materials Science and Metallurgy, TKK, Espoo, 1999
[181] S.K. Choudhary and A. Ghosh, Mathematical Model for Prediction of Composition of
Inclusions Formed during Solidification of Liquid Steel. ISIJ International 49 (2009), 12, pp.
1819–1827. doi:10.2355/isijinternational.49.1819
[182] A. Kagawa, S. Moriyama and T. Okamoto, Partition of solute elements during
solidification of iron-carbon-chromium alloys. Journal of Materials Science 17 (1982), 1, pp.
135–144. doi:10.1007/BF00809045
[183] A. Kagawa and T. Okamoto, Coefficients for equilibrium partition of a third element
between solid and liquid in iron-carbon base ternary alloys and their relation to graphitization
during iron-carbon eutectic solidification. Journal of Materials Science 19 (1984), 7, pp. 2306–
2318. doi:10.1007/BF01058107
[184] M. Bernhard, P. Presoly, C. Bernhard, S. Hahn and S. Ilie, An assessment of analytical
liquidus equations for Fe-C-Si-Mn-Al-P alloyed steels using DSC/DTA techniques.
Metallurgical and Materials Transactions B (2021). doi:10.1007/s11663-021-02251-1

APPENDIX: PUBLICATIONS
PhD thesis Michael Bernhard 83
Appendix: Publications
APPENDIX: PUBLICATIONS
PhD thesis Michael Bernhard 84
Paper I
Experimental Study of High Temperature Phase Equilibria in the Iron-Rich Part of the Fe-P and Fe-C-P Systems
M. Bernhard, P. Presoly, N. Fuchs, C. Bernhard and Y.-B. Kang
Metallurgical and Materials Transactions A, 2020, vol. 51, pp. 5351-5364.
Abstract: During the solidification of steel, phosphorus strongly segregates in the
interdendritic liquid phase. In the continuous casting process, even low levels of P may have
a detrimental effect on the final product quality. However, phosphorus is partly added up to
0.10 wt pct to improve the mechanical properties of advanced steel grades nowadays, e.g.,
High-Strength Interstitial-Free (HSIF). To provide new experimental data for the development
of thermodynamic databases and solidification models for P alloyed steel grades, phase
equilibria in the Fe-P and Fe-C-P key systems were studied up to 1550 °C using differential
scanning calorimetry (DSC) and high temperature laser scanning confocal microscopy (HT-
LSCM). Special focus was placed on solid/liquid equilibrium temperatures in the Fe-rich part
of the binary Fe-P system between 0.025 and 9 wt pct P. In the ternary system, three isoplethal
sections with 0.10 mass pct. P, 0.20 mass pct. C and constant mass percent ratio P/C of 2
were investigated. In the latter section, HT-LSCM observations were linked with DSC signals
to optically identify present phase stabilities. Particularly at [pct P] < 1, significant differences
between performed measurements and calculated phase equilibrium temperatures using
thermodynamic assessments from the literature were identified. In all ternary sections, the
experiments indicate less influence of P on the hypo-peritectic range compared to the
thermodynamic calculations.
Used and reprinted under the Creative Commons Attribution 4.0 International License
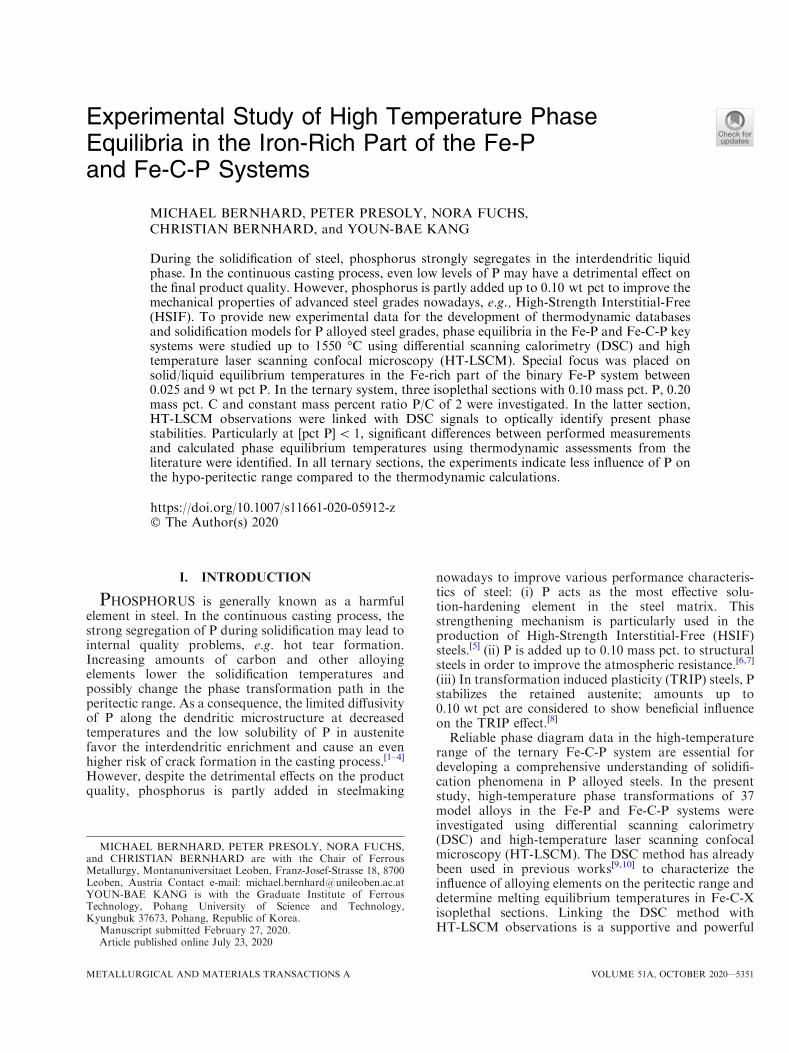
Experimental Study of High Temperature PhaseEquilibria in the Iron-Rich Part of the Fe-Pand Fe-C-P Systems
MICHAEL BERNHARD, PETER PRESOLY, NORA FUCHS,CHRISTIAN BERNHARD, and YOUN-BAE KANG
During the solidification of steel, phosphorus strongly segregates in the interdendritic liquidphase. In the continuous casting process, even low levels of P may have a detrimental effect onthe final product quality. However, phosphorus is partly added up to 0.10 wt pct to improve themechanical properties of advanced steel grades nowadays, e.g., High-Strength Interstitial-Free(HSIF). To provide new experimental data for the development of thermodynamic databasesand solidification models for P alloyed steel grades, phase equilibria in the Fe-P and Fe-C-P keysystems were studied up to 1550 �C using differential scanning calorimetry (DSC) and hightemperature laser scanning confocal microscopy (HT-LSCM). Special focus was placed onsolid/liquid equilibrium temperatures in the Fe-rich part of the binary Fe-P system between0.025 and 9 wt pct P. In the ternary system, three isoplethal sections with 0.10 mass pct. P, 0.20mass pct. C and constant mass percent ratio P/C of 2 were investigated. In the latter section,HT-LSCM observations were linked with DSC signals to optically identify present phasestabilities. Particularly at [pct P]< 1, significant differences between performed measurementsand calculated phase equilibrium temperatures using thermodynamic assessments from theliterature were identified. In all ternary sections, the experiments indicate less influence of P onthe hypo-peritectic range compared to the thermodynamic calculations.
https://doi.org/10.1007/s11661-020-05912-z� The Author(s) 2020
I. INTRODUCTION
PHOSPHORUS is generally known as a harmfulelement in steel. In the continuous casting process, thestrong segregation of P during solidification may lead tointernal quality problems, e.g. hot tear formation.Increasing amounts of carbon and other alloyingelements lower the solidification temperatures andpossibly change the phase transformation path in theperitectic range. As a consequence, the limited diffusivityof P along the dendritic microstructure at decreasedtemperatures and the low solubility of P in austenitefavor the interdendritic enrichment and cause an evenhigher risk of crack formation in the casting process.[1–4]
However, despite the detrimental effects on the productquality, phosphorus is partly added in steelmaking
nowadays to improve various performance characteris-tics of steel: (i) P acts as the most effective solu-tion-hardening element in the steel matrix. Thisstrengthening mechanism is particularly used in theproduction of High-Strength Interstitial-Free (HSIF)steels.[5] (ii) P is added up to 0.10 mass pct. to structuralsteels in order to improve the atmospheric resistance.[6,7]
(iii) In transformation induced plasticity (TRIP) steels, Pstabilizes the retained austenite; amounts up to0.10 wt pct are considered to show beneficial influenceon the TRIP effect.[8]
Reliable phase diagram data in the high-temperaturerange of the ternary Fe-C-P system are essential fordeveloping a comprehensive understanding of solidifi-cation phenomena in P alloyed steels. In the presentstudy, high-temperature phase transformations of 37model alloys in the Fe-P and Fe-C-P systems wereinvestigated using differential scanning calorimetry(DSC) and high-temperature laser scanning confocalmicroscopy (HT-LSCM). The DSC method has alreadybeen used in previous works[9,10] to characterize theinfluence of alloying elements on the peritectic range anddetermine melting equilibrium temperatures in Fe-C-Xisoplethal sections. Linking the DSC method withHT-LSCM observations is a supportive and powerful
MICHAEL BERNHARD, PETER PRESOLY, NORA FUCHS,and CHRISTIAN BERNHARD are with the Chair of FerrousMetallurgy, Montanuniversitaet Leoben, Franz-Josef-Strasse 18, 8700Leoben, Austria Contact e-mail: [email protected] KANG is with the Graduate Institute of FerrousTechnology, Pohang University of Science and Technology,Kyungbuk 37673, Pohang, Republic of Korea.
Manuscript submitted February 27, 2020.Article published online July 23, 2020
METALLURGICAL AND MATERIALS TRANSACTIONS A VOLUME 51A, OCTOBER 2020—5351
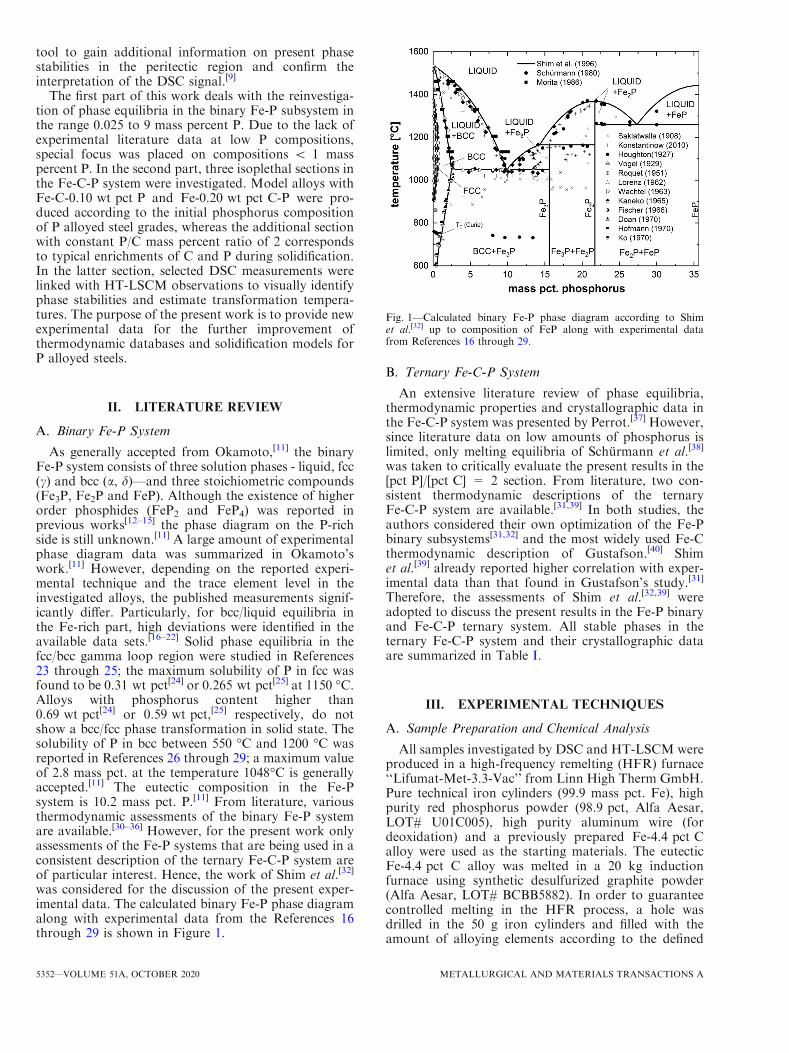
tool to gain additional information on present phasestabilities in the peritectic region and confirm theinterpretation of the DSC signal.[9]
The first part of this work deals with the reinvestiga-tion of phase equilibria in the binary Fe-P subsystem inthe range 0.025 to 9 mass percent P. Due to the lack ofexperimental literature data at low P compositions,special focus was placed on compositions < 1 masspercent P. In the second part, three isoplethal sections inthe Fe-C-P system were investigated. Model alloys withFe-C-0.10 wt pct P and Fe-0.20 wt pct C-P were pro-duced according to the initial phosphorus compositionof P alloyed steel grades, whereas the additional sectionwith constant P/C mass percent ratio of 2 correspondsto typical enrichments of C and P during solidification.In the latter section, selected DSC measurements werelinked with HT-LSCM observations to visually identifyphase stabilities and estimate transformation tempera-tures. The purpose of the present work is to provide newexperimental data for the further improvement ofthermodynamic databases and solidification models forP alloyed steels.
II. LITERATURE REVIEW
A. Binary Fe-P System
As generally accepted from Okamoto,[11] the binaryFe-P system consists of three solution phases - liquid, fcc(c) and bcc (a, d)—and three stoichiometric compounds(Fe3P, Fe2P and FeP). Although the existence of higherorder phosphides (FeP2 and FeP4) was reported inprevious works[12–15] the phase diagram on the P-richside is still unknown.[11] A large amount of experimentalphase diagram data was summarized in Okamoto’swork.[11] However, depending on the reported experi-mental technique and the trace element level in theinvestigated alloys, the published measurements signif-icantly differ. Particularly, for bcc/liquid equilibria inthe Fe-rich part, high deviations were identified in theavailable data sets.[16–22] Solid phase equilibria in thefcc/bcc gamma loop region were studied in References23 through 25; the maximum solubility of P in fcc wasfound to be 0.31 wt pct[24] or 0.265 wt pct[25] at 1150 �C.Alloys with phosphorus content higher than0.69 wt pct[24] or 0.59 wt pct,[25] respectively, do notshow a bcc/fcc phase transformation in solid state. Thesolubility of P in bcc between 550 �C and 1200 �C wasreported in References 26 through 29; a maximum valueof 2.8 mass pct. at the temperature 1048�C is generallyaccepted.[11] The eutectic composition in the Fe-Psystem is 10.2 mass pct. P.[11] From literature, variousthermodynamic assessments of the binary Fe-P systemare available.[30–36] However, for the present work onlyassessments of the Fe-P systems that are being used in aconsistent description of the ternary Fe-C-P system areof particular interest. Hence, the work of Shim et al.[32]
was considered for the discussion of the present exper-imental data. The calculated binary Fe-P phase diagramalong with experimental data from the References 16through 29 is shown in Figure 1.
B. Ternary Fe-C-P System
An extensive literature review of phase equilibria,thermodynamic properties and crystallographic data inthe Fe-C-P system was presented by Perrot.[37] However,since literature data on low amounts of phosphorus islimited, only melting equilibria of Schurmann et al.[38]
was taken to critically evaluate the present results in the[pct P]/[pct C] = 2 section. From literature, two con-sistent thermodynamic descriptions of the ternaryFe-C-P system are available.[31,39] In both studies, theauthors considered their own optimization of the Fe-Pbinary subsystems[31,32] and the most widely used Fe-Cthermodynamic description of Gustafson.[40] Shimet al.[39] already reported higher correlation with exper-imental data than that found in Gustafson’s study.[31]
Therefore, the assessments of Shim et al.[32,39] wereadopted to discuss the present results in the Fe-P binaryand Fe-C-P ternary system. All stable phases in theternary Fe-C-P system and their crystallographic dataare summarized in Table I.
III. EXPERIMENTAL TECHNIQUES
A. Sample Preparation and Chemical Analysis
All samples investigated by DSC and HT-LSCM wereproduced in a high-frequency remelting (HFR) furnace‘‘Lifumat-Met-3.3-Vac’’ from Linn High Therm GmbH.Pure technical iron cylinders (99.9 mass pct. Fe), highpurity red phosphorus powder (98.9 pct, Alfa Aesar,LOT# U01C005), high purity aluminum wire (fordeoxidation) and a previously prepared Fe-4.4 pct Calloy were used as the starting materials. The eutecticFe-4.4 pct C alloy was melted in a 20 kg inductionfurnace using synthetic desulfurized graphite powder(Alfa Aesar, LOT# BCBB5882). In order to guaranteecontrolled melting in the HFR process, a hole wasdrilled in the 50 g iron cylinders and filled with theamount of alloying elements according to the defined
Fig. 1—Calculated binary Fe-P phase diagram according to Shimet al.[32] up to composition of FeP along with experimental datafrom References 16 through 29.
5352—VOLUME 51A, OCTOBER 2020 METALLURGICAL AND MATERIALS TRANSACTIONS A
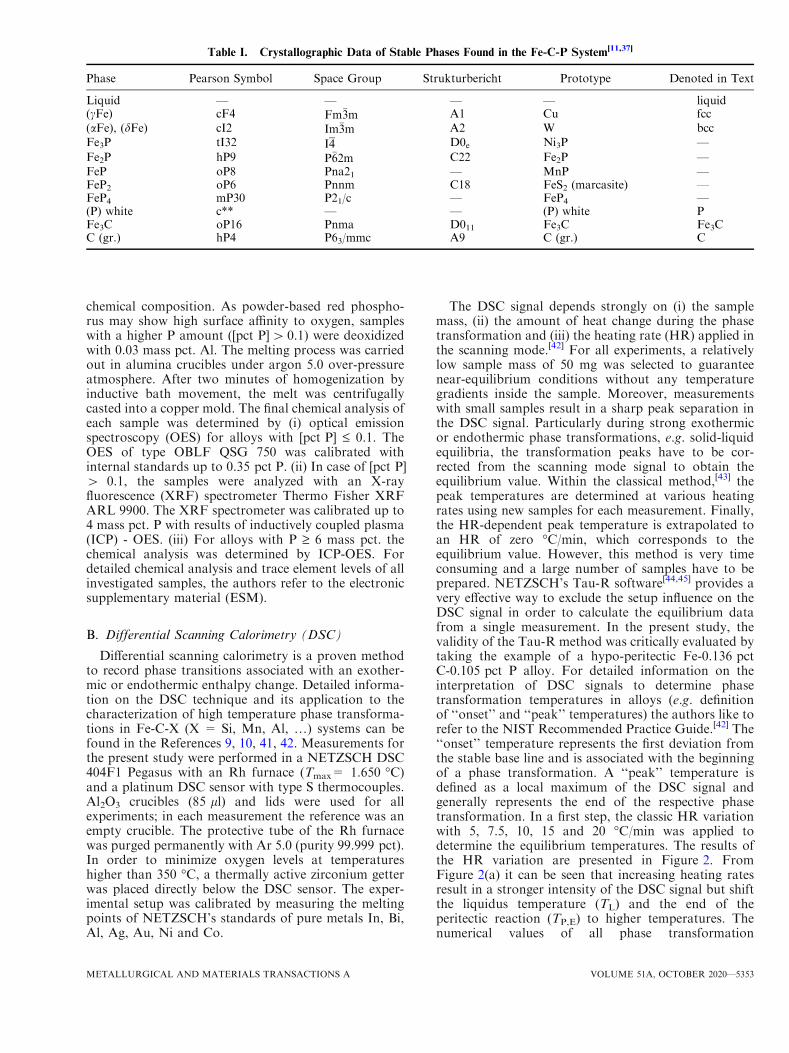
chemical composition. As powder-based red phospho-rus may show high surface affinity to oxygen, sampleswith a higher P amount ([pct P]> 0.1) were deoxidizedwith 0.03 mass pct. Al. The melting process was carriedout in alumina crucibles under argon 5.0 over-pressureatmosphere. After two minutes of homogenization byinductive bath movement, the melt was centrifugallycasted into a copper mold. The final chemical analysis ofeach sample was determined by (i) optical emissionspectroscopy (OES) for alloys with [pct P] £ 0.1. TheOES of type OBLF QSG 750 was calibrated withinternal standards up to 0.35 pct P. (ii) In case of [pct P]> 0.1, the samples were analyzed with an X-rayfluorescence (XRF) spectrometer Thermo Fisher XRFARL 9900. The XRF spectrometer was calibrated up to4 mass pct. P with results of inductively coupled plasma(ICP) - OES. (iii) For alloys with P ‡ 6 mass pct. thechemical analysis was determined by ICP-OES. Fordetailed chemical analysis and trace element levels of allinvestigated samples, the authors refer to the electronicsupplementary material (ESM).
B. Differential Scanning Calorimetry (DSC)
Differential scanning calorimetry is a proven methodto record phase transitions associated with an exother-mic or endothermic enthalpy change. Detailed informa-tion on the DSC technique and its application to thecharacterization of high temperature phase transforma-tions in Fe-C-X (X = Si, Mn, Al, …) systems can befound in the References 9, 10, 41, 42. Measurements forthe present study were performed in a NETZSCH DSC404F1 Pegasus with an Rh furnace (Tmax= 1.650 �C)and a platinum DSC sensor with type S thermocouples.Al2O3 crucibles (85 ll) and lids were used for allexperiments; in each measurement the reference was anempty crucible. The protective tube of the Rh furnacewas purged permanently with Ar 5.0 (purity 99.999 pct).In order to minimize oxygen levels at temperatureshigher than 350 �C, a thermally active zirconium getterwas placed directly below the DSC sensor. The exper-imental setup was calibrated by measuring the meltingpoints of NETZSCH’s standards of pure metals In, Bi,Al, Ag, Au, Ni and Co.
The DSC signal depends strongly on (i) the samplemass, (ii) the amount of heat change during the phasetransformation and (iii) the heating rate (HR) applied inthe scanning mode.[42] For all experiments, a relativelylow sample mass of 50 mg was selected to guaranteenear-equilibrium conditions without any temperaturegradients inside the sample. Moreover, measurementswith small samples result in a sharp peak separation inthe DSC signal. Particularly during strong exothermicor endothermic phase transformations, e.g. solid-liquidequilibria, the transformation peaks have to be cor-rected from the scanning mode signal to obtain theequilibrium value. Within the classical method,[43] thepeak temperatures are determined at various heatingrates using new samples for each measurement. Finally,the HR-dependent peak temperature is extrapolated toan HR of zero �C/min, which corresponds to theequilibrium value. However, this method is very timeconsuming and a large number of samples have to beprepared. NETZSCH’s Tau-R software[44,45] provides avery effective way to exclude the setup influence on theDSC signal in order to calculate the equilibrium datafrom a single measurement. In the present study, thevalidity of the Tau-R method was critically evaluated bytaking the example of a hypo-peritectic Fe-0.136 pctC-0.105 pct P alloy. For detailed information on theinterpretation of DSC signals to determine phasetransformation temperatures in alloys (e.g. definitionof ‘‘onset’’ and ‘‘peak’’ temperatures) the authors like torefer to the NIST Recommended Practice Guide.[42] The‘‘onset’’ temperature represents the first deviation fromthe stable base line and is associated with the beginningof a phase transformation. A ‘‘peak’’ temperature isdefined as a local maximum of the DSC signal andgenerally represents the end of the respective phasetransformation. In a first step, the classic HR variationwith 5, 7.5, 10, 15 and 20 �C/min was applied todetermine the equilibrium temperatures. The results ofthe HR variation are presented in Figure 2. FromFigure 2(a) it can be seen that increasing heating ratesresult in a stronger intensity of the DSC signal but shiftthe liquidus temperature (TL) and the end of theperitectic reaction (TP,E) to higher temperatures. Thenumerical values of all phase transformation
Table I. Crystallographic Data of Stable Phases Found in the Fe-C-P System[11,37]
Phase Pearson Symbol Space Group Strukturbericht Prototype Denoted in Text
Liquid — — — — liquid(cFe) cF4 Fm�3m A1 Cu fcc(aFe), (dFe) cI2 Im�3m A2 W bccFe3P tI32 I4 D0e Ni3P —
Fe2P hP9 P�62m C22 Fe2P —FeP oP8 Pna21 — MnP —FeP2 oP6 Pnnm C18 FeS2 (marcasite) —FeP4 mP30 P21/c — FeP4 —(P) white c** — — (P) white PFe3C oP16 Pnma D011 Fe3C Fe3CC (gr.) hP4 P63/mmc A9 C (gr.) C
METALLURGICAL AND MATERIALS TRANSACTIONS A VOLUME 51A, OCTOBER 2020—5353
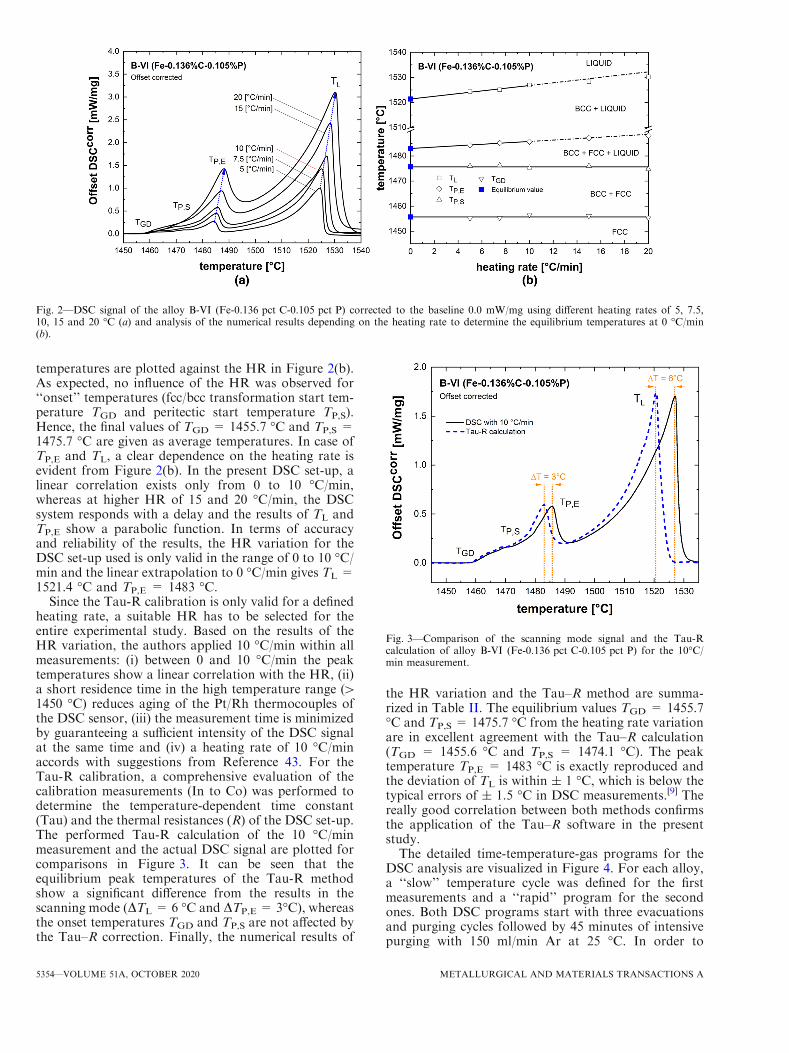
temperatures are plotted against the HR in Figure 2(b).As expected, no influence of the HR was observed for‘‘onset’’ temperatures (fcc/bcc transformation start tem-perature TGD and peritectic start temperature TP,S).Hence, the final values of TGD = 1455.7 �C and TP,S =1475.7 �C are given as average temperatures. In case ofTP,E and TL, a clear dependence on the heating rate isevident from Figure 2(b). In the present DSC set-up, alinear correlation exists only from 0 to 10 �C/min,whereas at higher HR of 15 and 20 �C/min, the DSCsystem responds with a delay and the results of TL andTP,E show a parabolic function. In terms of accuracyand reliability of the results, the HR variation for theDSC set-up used is only valid in the range of 0 to 10 �C/min and the linear extrapolation to 0 �C/min gives TL =1521.4 �C and TP,E = 1483 �C.
Since the Tau-R calibration is only valid for a definedheating rate, a suitable HR has to be selected for theentire experimental study. Based on the results of theHR variation, the authors applied 10 �C/min within allmeasurements: (i) between 0 and 10 �C/min the peaktemperatures show a linear correlation with the HR, (ii)a short residence time in the high temperature range (>1450 �C) reduces aging of the Pt/Rh thermocouples ofthe DSC sensor, (iii) the measurement time is minimizedby guaranteeing a sufficient intensity of the DSC signalat the same time and (iv) a heating rate of 10 �C/minaccords with suggestions from Reference 43. For theTau-R calibration, a comprehensive evaluation of thecalibration measurements (In to Co) was performed todetermine the temperature-dependent time constant(Tau) and the thermal resistances (R) of the DSC set-up.The performed Tau-R calculation of the 10 �C/minmeasurement and the actual DSC signal are plotted forcomparisons in Figure 3. It can be seen that theequilibrium peak temperatures of the Tau-R methodshow a significant difference from the results in thescanning mode (DTL = 6 �C and DTP,E = 3�C), whereasthe onset temperatures TGD and TP,S are not affected bythe Tau–R correction. Finally, the numerical results of
the HR variation and the Tau–R method are summa-rized in Table II. The equilibrium values TGD = 1455.7�C and TP,S = 1475.7 �C from the heating rate variationare in excellent agreement with the Tau–R calculation(TGD = 1455.6 �C and TP,S = 1474.1 �C). The peaktemperature TP,E = 1483 �C is exactly reproduced andthe deviation of TL is within ± 1 �C, which is below thetypical errors of ± 1.5 �C in DSC measurements.[9] Thereally good correlation between both methods confirmsthe application of the Tau–R software in the presentstudy.The detailed time-temperature-gas programs for the
DSC analysis are visualized in Figure 4. For each alloy,a ‘‘slow’’ temperature cycle was defined for the firstmeasurements and a ‘‘rapid’’ program for the secondones. Both DSC programs start with three evacuationsand purging cycles followed by 45 minutes of intensivepurging with 150 ml/min Ar at 25 �C. In order to
Fig. 2—DSC signal of the alloy B-VI (Fe-0.136 pct C-0.105 pct P) corrected to the baseline 0.0 mW/mg using different heating rates of 5, 7.5,10, 15 and 20 �C (a) and analysis of the numerical results depending on the heating rate to determine the equilibrium temperatures at 0 �C/min(b).
Fig. 3—Comparison of the scanning mode signal and the Tau-Rcalculation of alloy B-VI (Fe-0.136 pct C-0.105 pct P) for the 10�C/min measurement.
5354—VOLUME 51A, OCTOBER 2020 METALLURGICAL AND MATERIALS TRANSACTIONS A
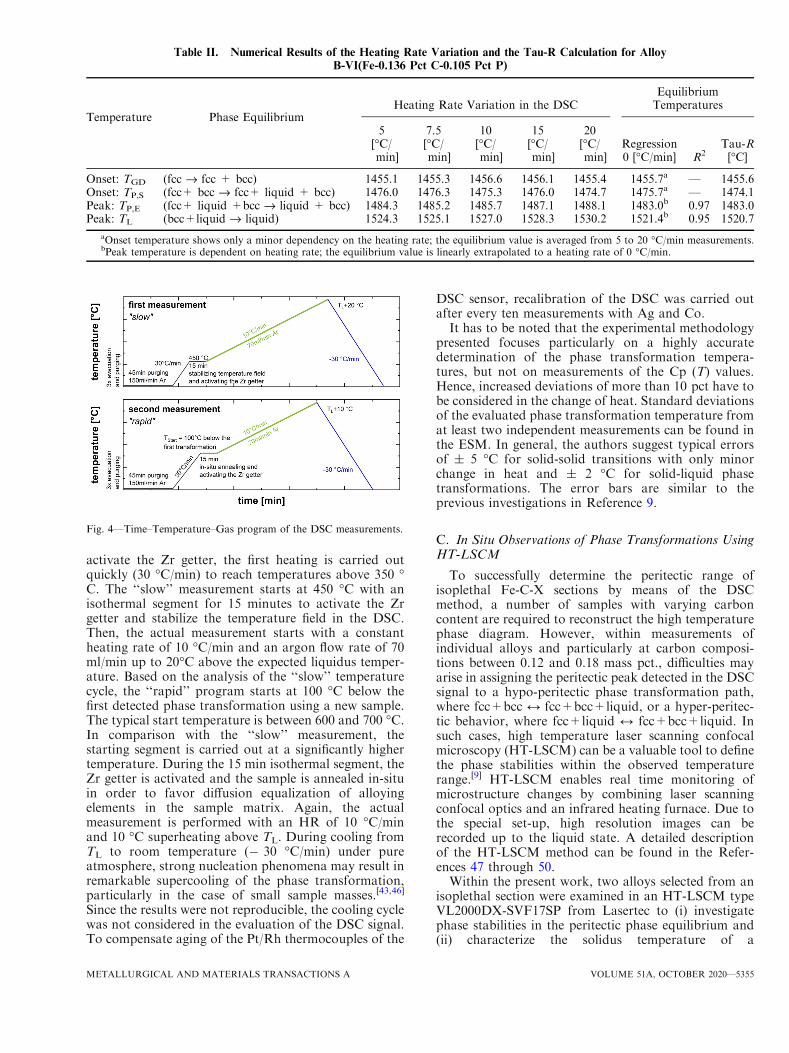
activate the Zr getter, the first heating is carried outquickly (30 �C/min) to reach temperatures above 350 �C. The ‘‘slow’’ measurement starts at 450 �C with anisothermal segment for 15 minutes to activate the Zrgetter and stabilize the temperature field in the DSC.Then, the actual measurement starts with a constantheating rate of 10 �C/min and an argon flow rate of 70ml/min up to 20�C above the expected liquidus temper-ature. Based on the analysis of the ‘‘slow’’ temperaturecycle, the ‘‘rapid’’ program starts at 100 �C below thefirst detected phase transformation using a new sample.The typical start temperature is between 600 and 700 �C.In comparison with the ‘‘slow’’ measurement, thestarting segment is carried out at a significantly highertemperature. During the 15 min isothermal segment, theZr getter is activated and the sample is annealed in-situin order to favor diffusion equalization of alloyingelements in the sample matrix. Again, the actualmeasurement is performed with an HR of 10 �C/minand 10 �C superheating above TL. During cooling fromTL to room temperature (� 30 �C/min) under pureatmosphere, strong nucleation phenomena may result inremarkable supercooling of the phase transformation,particularly in the case of small sample masses.[43,46]
Since the results were not reproducible, the cooling cyclewas not considered in the evaluation of the DSC signal.To compensate aging of the Pt/Rh thermocouples of the
DSC sensor, recalibration of the DSC was carried outafter every ten measurements with Ag and Co.It has to be noted that the experimental methodology
presented focuses particularly on a highly accuratedetermination of the phase transformation tempera-tures, but not on measurements of the Cp (T) values.Hence, increased deviations of more than 10 pct have tobe considered in the change of heat. Standard deviationsof the evaluated phase transformation temperature fromat least two independent measurements can be found inthe ESM. In general, the authors suggest typical errorsof ± 5 �C for solid-solid transitions with only minorchange in heat and ± 2 �C for solid-liquid phasetransformations. The error bars are similar to theprevious investigations in Reference 9.
C. In Situ Observations of Phase Transformations UsingHT-LSCM
To successfully determine the peritectic range ofisoplethal Fe-C-X sections by means of the DSCmethod, a number of samples with varying carboncontent are required to reconstruct the high temperaturephase diagram. However, within measurements ofindividual alloys and particularly at carbon composi-tions between 0.12 and 0.18 mass pct., difficulties mayarise in assigning the peritectic peak detected in the DSCsignal to a hypo-peritectic phase transformation path,where fcc+bcc M fcc+bcc+liquid, or a hyper-peritec-tic behavior, where fcc+liquid M fcc+bcc+liquid. Insuch cases, high temperature laser scanning confocalmicroscopy (HT-LSCM) can be a valuable tool to definethe phase stabilities within the observed temperaturerange.[9] HT-LSCM enables real time monitoring ofmicrostructure changes by combining laser scanningconfocal optics and an infrared heating furnace. Due tothe special set-up, high resolution images can berecorded up to the liquid state. A detailed descriptionof the HT-LSCM method can be found in the Refer-ences 47 through 50.Within the present work, two alloys selected from an
isoplethal section were examined in an HT-LSCM typeVL2000DX-SVF17SP from Lasertec to (i) investigatephase stabilities in the peritectic phase equilibrium and(ii) characterize the solidus temperature of a
Table II. Numerical Results of the Heating Rate Variation and the Tau-R Calculation for Alloy
B-VI(Fe-0.136 Pct C-0.105 Pct P)
Temperature Phase EquilibriumHeating Rate Variation in the DSC
EquilibriumTemperatures
5[�C/min]
7.5[�C/min]
10[�C/min]
15[�C/min]
20[�C/min]
Regression0 [�C/min] R2
Tau-R[�C]
Onset: TGD (fcc fi fcc + bcc) 1455.1 1455.3 1456.6 1456.1 1455.4 1455.7a — 1455.6Onset: TP,S (fcc+ bcc fi fcc+ liquid + bcc) 1476.0 1476.3 1475.3 1476.0 1474.7 1475.7a — 1474.1Peak: TP,E (fcc+ liquid +bcc fi liquid + bcc) 1484.3 1485.2 1485.7 1487.1 1488.1 1483.0b 0.97 1483.0Peak: TL (bcc+liquid fi liquid) 1524.3 1525.1 1527.0 1528.3 1530.2 1521.4b 0.95 1520.7
aOnset temperature shows only a minor dependency on the heating rate; the equilibrium value is averaged from 5 to 20 �C/min measurements.bPeak temperature is dependent on heating rate; the equilibrium value is linearly extrapolated to a heating rate of 0 �C/min.
Fig. 4—Time–Temperature–Gas program of the DSC measurements.
METALLURGICAL AND MATERIALS TRANSACTIONS A VOLUME 51A, OCTOBER 2020—5355
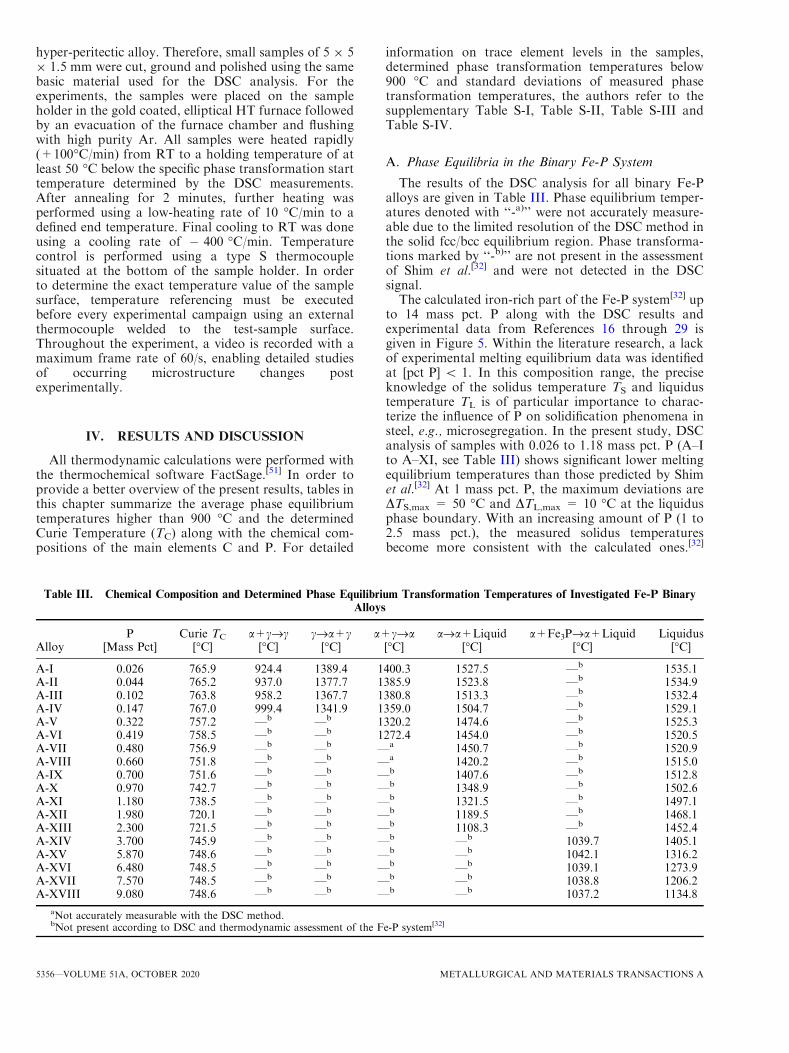
hyper-peritectic alloy. Therefore, small samples of 5 9 59 1.5 mm were cut, ground and polished using the samebasic material used for the DSC analysis. For theexperiments, the samples were placed on the sampleholder in the gold coated, elliptical HT furnace followedby an evacuation of the furnace chamber and flushingwith high purity Ar. All samples were heated rapidly(+100�C/min) from RT to a holding temperature of atleast 50 �C below the specific phase transformation starttemperature determined by the DSC measurements.After annealing for 2 minutes, further heating wasperformed using a low-heating rate of 10 �C/min to adefined end temperature. Final cooling to RT was doneusing a cooling rate of � 400 �C/min. Temperaturecontrol is performed using a type S thermocouplesituated at the bottom of the sample holder. In orderto determine the exact temperature value of the samplesurface, temperature referencing must be executedbefore every experimental campaign using an externalthermocouple welded to the test-sample surface.Throughout the experiment, a video is recorded with amaximum frame rate of 60/s, enabling detailed studiesof occurring microstructure changes postexperimentally.
IV. RESULTS AND DISCUSSION
All thermodynamic calculations were performed withthe thermochemical software FactSage.[51] In order toprovide a better overview of the present results, tables inthis chapter summarize the average phase equilibriumtemperatures higher than 900 �C and the determinedCurie Temperature (TC) along with the chemical com-positions of the main elements C and P. For detailed
information on trace element levels in the samples,determined phase transformation temperatures below900 �C and standard deviations of measured phasetransformation temperatures, the authors refer to thesupplementary Table S-I, Table S-II, Table S-III andTable S-IV.
A. Phase Equilibria in the Binary Fe-P System
The results of the DSC analysis for all binary Fe-Palloys are given in Table III. Phase equilibrium temper-atures denoted with ‘‘-a)’’ were not accurately measure-able due to the limited resolution of the DSC method inthe solid fcc/bcc equilibrium region. Phase transforma-tions marked by ‘‘-b)’’ are not present in the assessmentof Shim et al.[32] and were not detected in the DSCsignal.The calculated iron-rich part of the Fe-P system[32] up
to 14 mass pct. P along with the DSC results andexperimental data from References 16 through 29 isgiven in Figure 5. Within the literature research, a lackof experimental melting equilibrium data was identifiedat [pct P] < 1. In this composition range, the preciseknowledge of the solidus temperature TS and liquidustemperature TL is of particular importance to charac-terize the influence of P on solidification phenomena insteel, e.g., microsegregation. In the present study, DSCanalysis of samples with 0.026 to 1.18 mass pct. P (A–Ito A–XI, see Table III) shows significant lower meltingequilibrium temperatures than those predicted by Shimet al.[32] At 1 mass pct. P, the maximum deviations areDTS,max = 50 �C and DTL,max = 10 �C at the liquidusphase boundary. With an increasing amount of P (1 to2.5 mass pct.), the measured solidus temperaturesbecome more consistent with the calculated ones.[32]
Table III. Chemical Composition and Determined Phase Equilibrium Transformation Temperatures of Investigated Fe-P BinaryAlloys
AlloyP
[Mass Pct]Curie TC
[�C]a+cfic[�C]
cfia+c[�C]
a+cfia[�C]
afia+Liquid[�C]
a+Fe3Pfia+Liquid[�C]
Liquidus[�C]
A-I 0.026 765.9 924.4 1389.4 1400.3 1527.5 —b 1535.1A-II 0.044 765.2 937.0 1377.7 1385.9 1523.8 —b 1534.9A-III 0.102 763.8 958.2 1367.7 1380.8 1513.3 —b 1532.4A-IV 0.147 767.0 999.4 1341.9 1359.0 1504.7 —b 1529.1A-V 0.322 757.2 —b —b 1320.2 1474.6 —b 1525.3A-VI 0.419 758.5 —b —b 1272.4 1454.0 —b 1520.5A-VII 0.480 756.9 —b —b —a 1450.7 —b 1520.9A-VIII 0.660 751.8 —b —b —a 1420.2 —b 1515.0A-IX 0.700 751.6 —b —b —b 1407.6 —b 1512.8A-X 0.970 742.7 —b —b —b 1348.9 —b 1502.6A-XI 1.180 738.5 —b —b —b 1321.5 —b 1497.1A-XII 1.980 720.1 —b —b —b 1189.5 —b 1468.1A-XIII 2.300 721.5 —b —b —b 1108.3 —b 1452.4A-XIV 3.700 745.9 —b —b —b —b 1039.7 1405.1A-XV 5.870 748.6 —b —b —b —b 1042.1 1316.2A-XVI 6.480 748.5 —b —b —b —b 1039.1 1273.9A-XVII 7.570 748.5 —b —b —b —b 1038.8 1206.2A-XVIII 9.080 748.6 —b —b —b —b 1037.2 1134.8
aNot accurately measurable with the DSC method.bNot present according to DSC and thermodynamic assessment of the Fe-P system[32]
5356—VOLUME 51A, OCTOBER 2020 METALLURGICAL AND MATERIALS TRANSACTIONS A
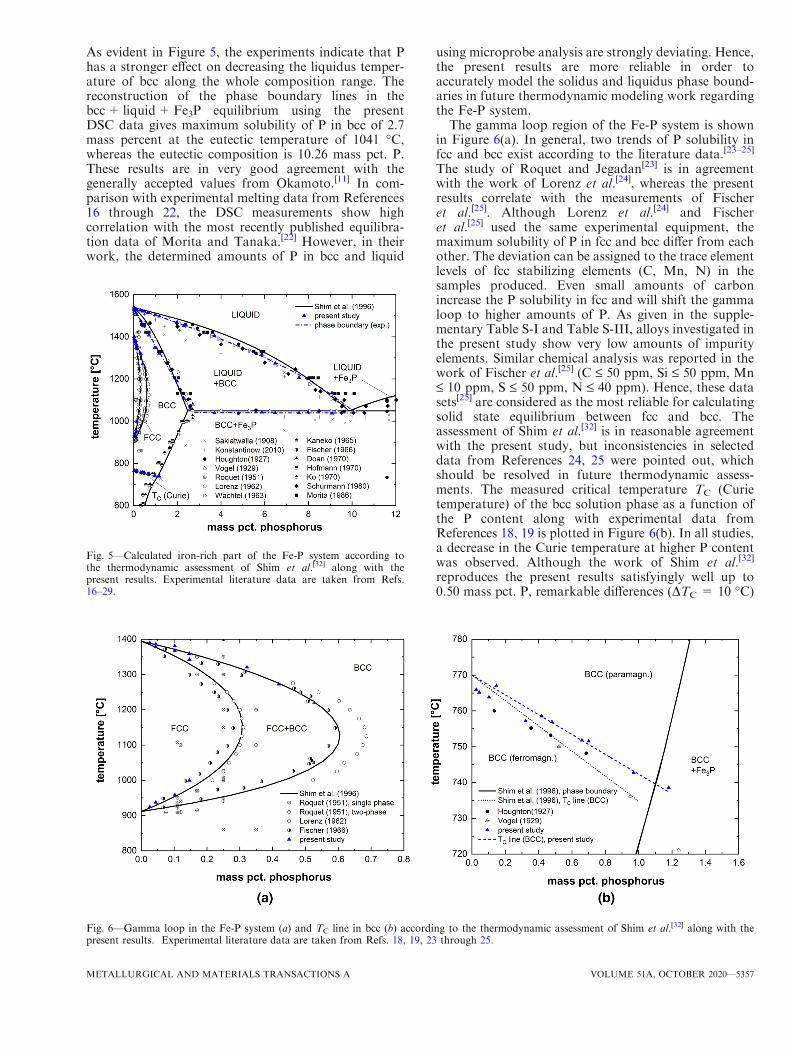
As evident in Figure 5, the experiments indicate that Phas a stronger effect on decreasing the liquidus temper-ature of bcc along the whole composition range. Thereconstruction of the phase boundary lines in thebcc+ liquid+Fe3P equilibrium using the presentDSC data gives maximum solubility of P in bcc of 2.7mass percent at the eutectic temperature of 1041 �C,whereas the eutectic composition is 10.26 mass pct. P.These results are in very good agreement with thegenerally accepted values from Okamoto.[11] In com-parison with experimental melting data from References16 through 22, the DSC measurements show highcorrelation with the most recently published equilibra-tion data of Morita and Tanaka.[22] However, in theirwork, the determined amounts of P in bcc and liquid
using microprobe analysis are strongly deviating. Hence,the present results are more reliable in order toaccurately model the solidus and liquidus phase bound-aries in future thermodynamic modeling work regardingthe Fe-P system.The gamma loop region of the Fe-P system is shown
in Figure 6(a). In general, two trends of P solubility infcc and bcc exist according to the literature data.[23–25]
The study of Roquet and Jegadan[23] is in agreementwith the work of Lorenz et al.[24], whereas the presentresults correlate with the measurements of Fischeret al.[25]. Although Lorenz et al.[24] and Fischeret al.[25] used the same experimental equipment, themaximum solubility of P in fcc and bcc differ from eachother. The deviation can be assigned to the trace elementlevels of fcc stabilizing elements (C, Mn, N) in thesamples produced. Even small amounts of carbonincrease the P solubility in fcc and will shift the gammaloop to higher amounts of P. As given in the supple-mentary Table S-I and Table S-III, alloys investigated inthe present study show very low amounts of impurityelements. Similar chemical analysis was reported in thework of Fischer et al.[25] (C £ 50 ppm, Si £ 50 ppm, Mn£ 10 ppm, S £ 50 ppm, N £ 40 ppm). Hence, these datasets[25] are considered as the most reliable for calculatingsolid state equilibrium between fcc and bcc. Theassessment of Shim et al.[32] is in reasonable agreementwith the present study, but inconsistencies in selecteddata from References 24, 25 were pointed out, whichshould be resolved in future thermodynamic assess-ments. The measured critical temperature TC (Curietemperature) of the bcc solution phase as a function ofthe P content along with experimental data fromReferences 18, 19 is plotted in Figure 6(b). In all studies,a decrease in the Curie temperature at higher P contentwas observed. Although the work of Shim et al.[32]
reproduces the present results satisfyingly well up to0.50 mass pct. P, remarkable differences (DTC = 10 �C)
Fig. 5—Calculated iron-rich part of the Fe-P system according tothe thermodynamic assessment of Shim et al.[32] along with thepresent results. Experimental literature data are taken from Refs.16–29.
Fig. 6—Gamma loop in the Fe-P system (a) and TC line in bcc (b) according to the thermodynamic assessment of Shim et al.[32] along with thepresent results. Experimental literature data are taken from Refs. 18, 19, 23 through 25.
METALLURGICAL AND MATERIALS TRANSACTIONS A VOLUME 51A, OCTOBER 2020—5357
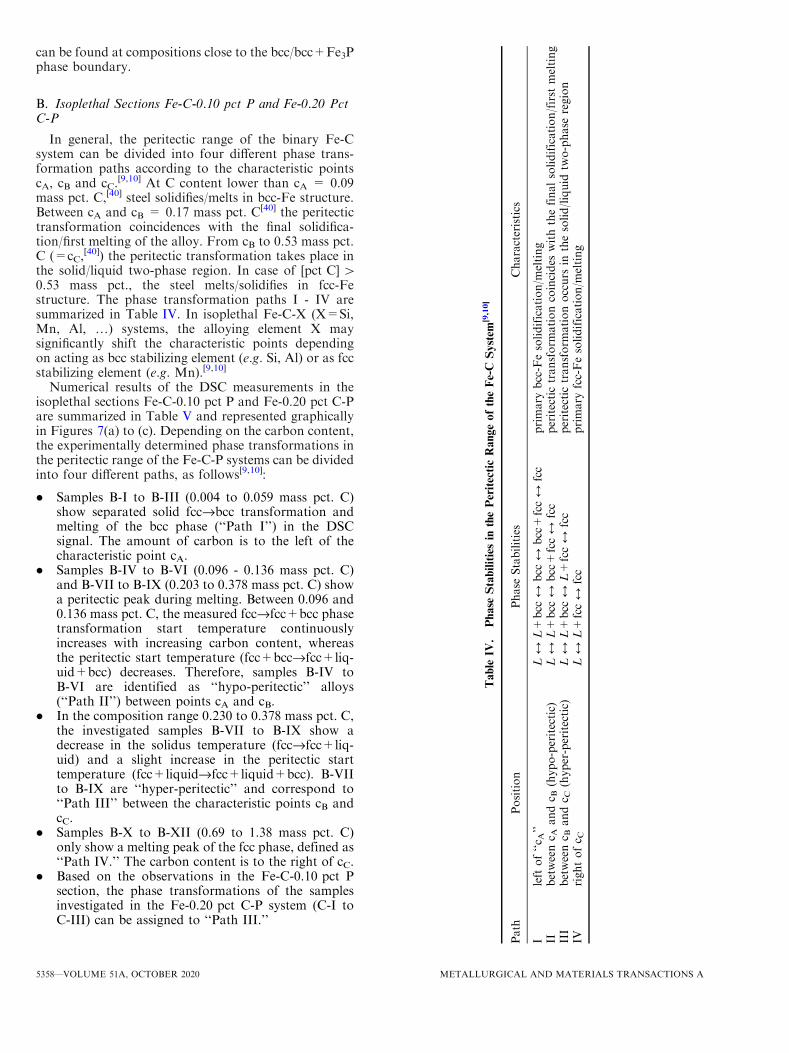
can be found at compositions close to the bcc/bcc+Fe3Pphase boundary.
B. Isoplethal Sections Fe-C-0.10 pct P and Fe-0.20 PctC-P
In general, the peritectic range of the binary Fe-Csystem can be divided into four different phase trans-formation paths according to the characteristic pointscA, cB and cC.
[9,10] At C content lower than cA = 0.09mass pct. C,[40] steel solidifies/melts in bcc-Fe structure.Between cA and cB = 0.17 mass pct. C[40] the peritectictransformation coincidences with the final solidifica-tion/first melting of the alloy. From cB to 0.53 mass pct.C (=cC,
[40]) the peritectic transformation takes place inthe solid/liquid two-phase region. In case of [pct C] >0.53 mass pct., the steel melts/solidifies in fcc-Festructure. The phase transformation paths I - IV aresummarized in Table IV. In isoplethal Fe-C-X (X=Si,Mn, Al, …) systems, the alloying element X maysignificantly shift the characteristic points dependingon acting as bcc stabilizing element (e.g. Si, Al) or as fccstabilizing element (e.g. Mn).[9,10]
Numerical results of the DSC measurements in theisoplethal sections Fe-C-0.10 pct P and Fe-0.20 pct C-Pare summarized in Table V and represented graphicallyin Figures 7(a) to (c). Depending on the carbon content,the experimentally determined phase transformations inthe peritectic range of the Fe-C-P systems can be dividedinto four different paths, as follows[9,10]:
� Samples B-I to B-III (0.004 to 0.059 mass pct. C)show separated solid fccfibcc transformation andmelting of the bcc phase (‘‘Path I’’) in the DSCsignal. The amount of carbon is to the left of thecharacteristic point cA.
� Samples B-IV to B-VI (0.096 - 0.136 mass pct. C)and B-VII to B-IX (0.203 to 0.378 mass pct. C) showa peritectic peak during melting. Between 0.096 and0.136 mass pct. C, the measured fccfifcc+bcc phasetransformation start temperature continuouslyincreases with increasing carbon content, whereasthe peritectic start temperature (fcc+bccfifcc+liq-uid+bcc) decreases. Therefore, samples B-IV toB-VI are identified as ‘‘hypo-peritectic’’ alloys(‘‘Path II’’) between points cA and cB.
� In the composition range 0.230 to 0.378 mass pct. C,the investigated samples B-VII to B-IX show adecrease in the solidus temperature (fccfifcc+liq-uid) and a slight increase in the peritectic starttemperature (fcc+liquidfifcc+liquid+bcc). B-VIIto B-IX are ‘‘hyper-peritectic’’ and correspond to‘‘Path III’’ between the characteristic points cB andcC.
� Samples B-X to B-XII (0.69 to 1.38 mass pct. C)only show a melting peak of the fcc phase, defined as‘‘Path IV.’’ The carbon content is to the right of cC.
� Based on the observations in the Fe-C-0.10 pct Psection, the phase transformations of the samplesinvestigated in the Fe-0.20 pct C-P system (C-I toC-III) can be assigned to ‘‘Path III.’’
Table
IV.
Phase
Stabilitiesin
thePeritecticRangeoftheFe-C
System
[9,10]
Path
Position
Phase
Stabilities
Characteristics
Ileft
of‘‘c A
’’LM
L+
bcc
Mbcc
Mbcc+
fccM
fcc
primary
bcc-Fesolidification/m
elting
IIbetweenc A
andc B
(hypo-peritectic)
LM
L+
bcc
Mbcc+
fccM
fcc
peritectictransform
ationcoincides
withthefinalsolidification/first
melting
III
betweenc B
andc C
(hyper-peritectic)
LM
L+
bcc
ML+
fccM
fcc
peritectictransform
ationoccurs
inthesolid/liquid
two-phase
region
IVrightofc C
LM
L+
fccM
fcc
primary
fcc-Fesolidification/m
elting
5358—VOLUME 51A, OCTOBER 2020 METALLURGICAL AND MATERIALS TRANSACTIONS A
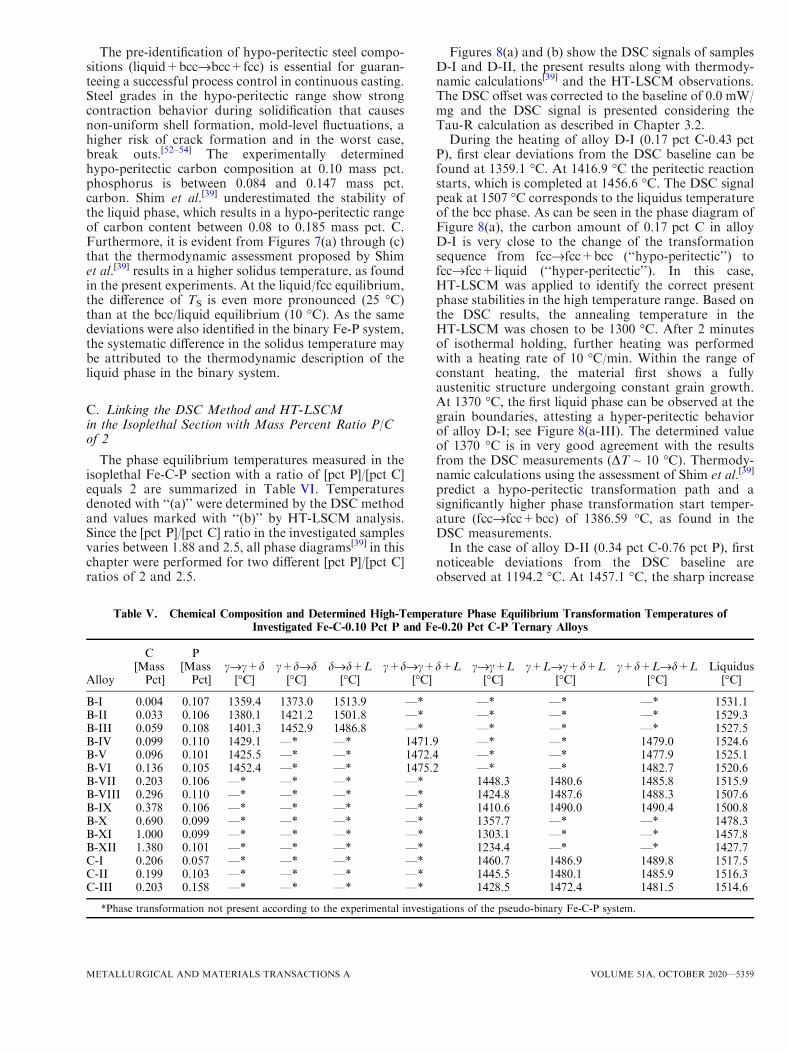
The pre-identification of hypo-peritectic steel compo-sitions (liquid+bccfibcc+fcc) is essential for guaran-teeing a successful process control in continuous casting.Steel grades in the hypo-peritectic range show strongcontraction behavior during solidification that causesnon-uniform shell formation, mold-level fluctuations, ahigher risk of crack formation and in the worst case,break outs.[52–54] The experimentally determinedhypo-peritectic carbon composition at 0.10 mass pct.phosphorus is between 0.084 and 0.147 mass pct.carbon. Shim et al.[39] underestimated the stability ofthe liquid phase, which results in a hypo-peritectic rangeof carbon content between 0.08 to 0.185 mass pct. C.Furthermore, it is evident from Figures 7(a) through (c)that the thermodynamic assessment proposed by Shimet al.[39] results in a higher solidus temperature, as foundin the present experiments. At the liquid/fcc equilibrium,the difference of TS is even more pronounced (25 �C)than at the bcc/liquid equilibrium (10 �C). As the samedeviations were also identified in the binary Fe-P system,the systematic difference in the solidus temperature maybe attributed to the thermodynamic description of theliquid phase in the binary system.
C. Linking the DSC Method and HT-LSCMin the Isoplethal Section with Mass Percent Ratio P/Cof 2
The phase equilibrium temperatures measured in theisoplethal Fe-C-P section with a ratio of [pct P]/[pct C]equals 2 are summarized in Table VI. Temperaturesdenoted with ‘‘(a)’’ were determined by the DSC methodand values marked with ‘‘(b)’’ by HT-LSCM analysis.Since the [pct P]/[pct C] ratio in the investigated samplesvaries between 1.88 and 2.5, all phase diagrams[39] in thischapter were performed for two different [pct P]/[pct C]ratios of 2 and 2.5.
Figures 8(a) and (b) show the DSC signals of samplesD-I and D-II, the present results along with thermody-namic calculations[39] and the HT-LSCM observations.The DSC offset was corrected to the baseline of 0.0 mW/mg and the DSC signal is presented considering theTau-R calculation as described in Chapter 3.2.During the heating of alloy D-I (0.17 pct C-0.43 pct
P), first clear deviations from the DSC baseline can befound at 1359.1 �C. At 1416.9 �C the peritectic reactionstarts, which is completed at 1456.6 �C. The DSC signalpeak at 1507 �C corresponds to the liquidus temperatureof the bcc phase. As can be seen in the phase diagram ofFigure 8(a), the carbon amount of 0.17 pct C in alloyD-I is very close to the change of the transformationsequence from fccfifcc+bcc (‘‘hypo-peritectic’’) tofccfifcc+liquid (‘‘hyper-peritectic’’). In this case,HT-LSCM was applied to identify the correct presentphase stabilities in the high temperature range. Based onthe DSC results, the annealing temperature in theHT-LSCM was chosen to be 1300 �C. After 2 minutesof isothermal holding, further heating was performedwith a heating rate of 10 �C/min. Within the range ofconstant heating, the material first shows a fullyaustenitic structure undergoing constant grain growth.At 1370 �C, the first liquid phase can be observed at thegrain boundaries, attesting a hyper-peritectic behaviorof alloy D-I; see Figure 8(a-III). The determined valueof 1370 �C is in very good agreement with the resultsfrom the DSC measurements (DT ~ 10 �C). Thermody-namic calculations using the assessment of Shim et al.[39]
predict a hypo-peritectic transformation path and asignificantly higher phase transformation start temper-ature (fccfifcc+bcc) of 1386.59 �C, as found in theDSC measurements.In the case of alloy D-II (0.34 pct C-0.76 pct P), first
noticeable deviations from the DSC baseline areobserved at 1194.2 �C. At 1457.1 �C, the sharp increase
Table V. Chemical Composition and Determined High-Temperature Phase Equilibrium Transformation Temperatures ofInvestigated Fe-C-0.10 Pct P and Fe-0.20 Pct C-P Ternary Alloys
Alloy
C[MassPct]
P[MassPct]
cfic+d[�C]
c+dfid[�C]
dfid+L[�C]
c+dfic+d+L[�C]
cfic+L[�C]
c+Lfic+d+L[�C]
c+d+Lfid+L[�C]
Liquidus[�C]
B-I 0.004 0.107 1359.4 1373.0 1513.9 —* —* —* —* 1531.1B-II 0.033 0.106 1380.1 1421.2 1501.8 —* —* —* —* 1529.3B-III 0.059 0.108 1401.3 1452.9 1486.8 —* —* —* —* 1527.5B-IV 0.099 0.110 1429.1 —* —* 1471.9 —* —* 1479.0 1524.6B-V 0.096 0.101 1425.5 —* —* 1472.4 —* —* 1477.9 1525.1B-VI 0.136 0.105 1452.4 —* —* 1475.2 —* —* 1482.7 1520.6B-VII 0.203 0.106 —* —* —* —* 1448.3 1480.6 1485.8 1515.9B-VIII 0.296 0.110 —* —* —* —* 1424.8 1487.6 1488.3 1507.6B-IX 0.378 0.106 —* —* —* —* 1410.6 1490.0 1490.4 1500.8B-X 0.690 0.099 —* —* —* —* 1357.7 —* —* 1478.3B-XI 1.000 0.099 —* —* —* —* 1303.1 —* —* 1457.8B-XII 1.380 0.101 —* —* —* —* 1234.4 —* —* 1427.7C-I 0.206 0.057 —* —* —* —* 1460.7 1486.9 1489.8 1517.5C-II 0.199 0.103 —* —* —* —* 1445.5 1480.1 1485.9 1516.3C-III 0.203 0.158 —* —* —* —* 1428.5 1472.4 1481.5 1514.6
*Phase transformation not present according to the experimental investigations of the pseudo-binary Fe-C-P system.
METALLURGICAL AND MATERIALS TRANSACTIONS A VOLUME 51A, OCTOBER 2020—5359
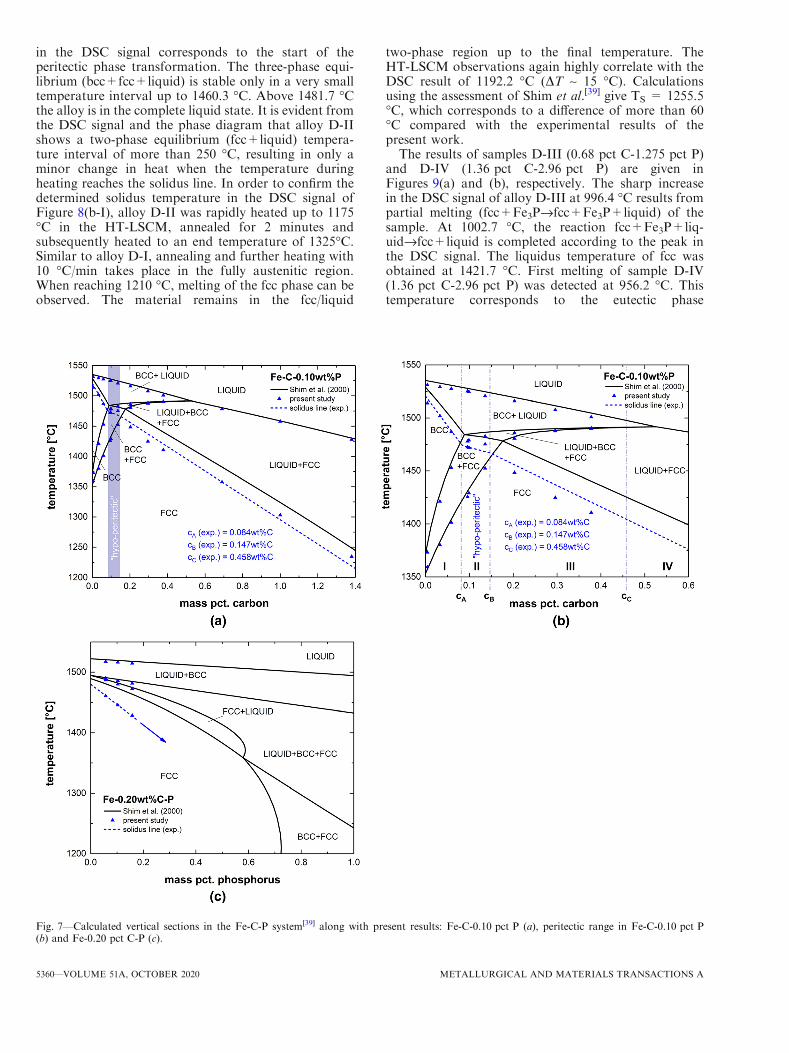
in the DSC signal corresponds to the start of theperitectic phase transformation. The three-phase equi-librium (bcc+fcc+liquid) is stable only in a very smalltemperature interval up to 1460.3 �C. Above 1481.7 �Cthe alloy is in the complete liquid state. It is evident fromthe DSC signal and the phase diagram that alloy D-IIshows a two-phase equilibrium (fcc+liquid) tempera-ture interval of more than 250 �C, resulting in only aminor change in heat when the temperature duringheating reaches the solidus line. In order to confirm thedetermined solidus temperature in the DSC signal ofFigure 8(b-I), alloy D-II was rapidly heated up to 1175�C in the HT-LSCM, annealed for 2 minutes andsubsequently heated to an end temperature of 1325�C.Similar to alloy D-I, annealing and further heating with10 �C/min takes place in the fully austenitic region.When reaching 1210 �C, melting of the fcc phase can beobserved. The material remains in the fcc/liquid
two-phase region up to the final temperature. TheHT-LSCM observations again highly correlate with theDSC result of 1192.2 �C (DT ~ 15 �C). Calculationsusing the assessment of Shim et al.[39] give TS = 1255.5�C, which corresponds to a difference of more than 60�C compared with the experimental results of thepresent work.The results of samples D-III (0.68 pct C-1.275 pct P)
and D-IV (1.36 pct C-2.96 pct P) are given inFigures 9(a) and (b), respectively. The sharp increasein the DSC signal of alloy D-III at 996.4 �C results frompartial melting (fcc+Fe3Pfifcc+Fe3P+liquid) of thesample. At 1002.7 �C, the reaction fcc+Fe3P+liq-uidfifcc+liquid is completed according to the peak inthe DSC signal. The liquidus temperature of fcc wasobtained at 1421.7 �C. First melting of sample D-IV(1.36 pct C-2.96 pct P) was detected at 956.2 �C. Thistemperature corresponds to the eutectic phase
Fig. 7—Calculated vertical sections in the Fe-C-P system[39] along with present results: Fe-C-0.10 pct P (a), peritectic range in Fe-C-0.10 pct P(b) and Fe-0.20 pct C-P (c).
5360—VOLUME 51A, OCTOBER 2020 METALLURGICAL AND MATERIALS TRANSACTIONS A
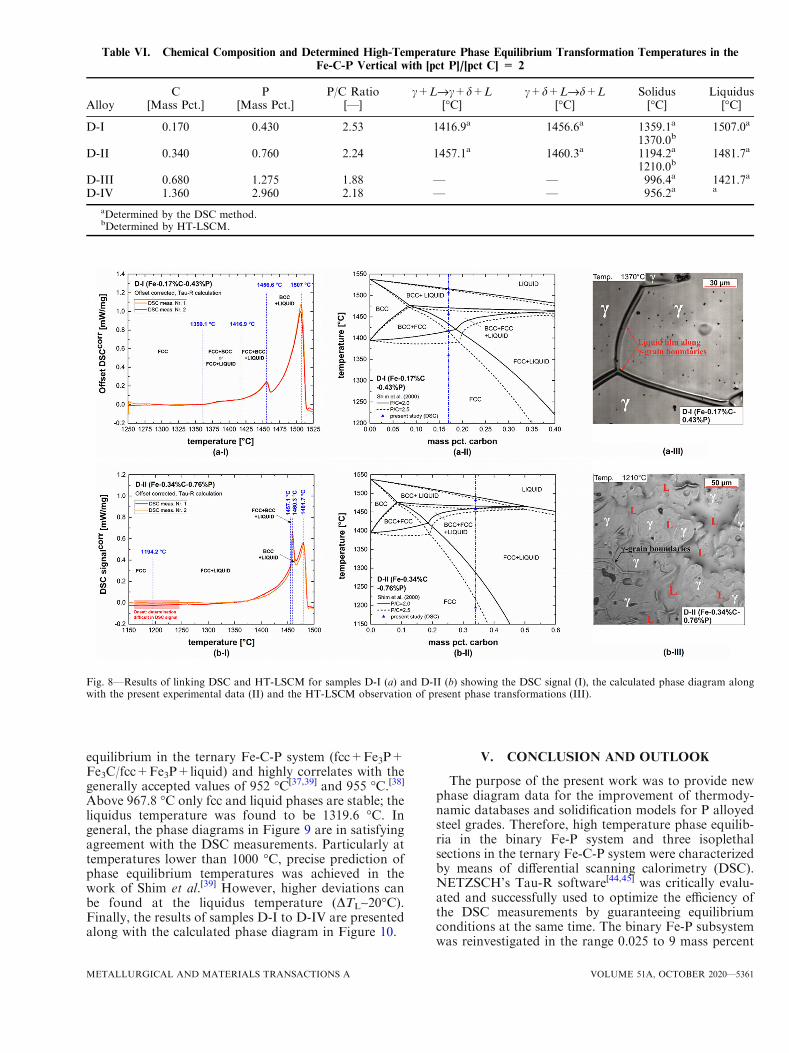
equilibrium in the ternary Fe-C-P system (fcc+Fe3P+Fe3C/fcc+Fe3P+liquid) and highly correlates with thegenerally accepted values of 952 �C[37,39] and 955 �C.[38]Above 967.8 �C only fcc and liquid phases are stable; theliquidus temperature was found to be 1319.6 �C. Ingeneral, the phase diagrams in Figure 9 are in satisfyingagreement with the DSC measurements. Particularly attemperatures lower than 1000 �C, precise prediction ofphase equilibrium temperatures was achieved in thework of Shim et al.[39] However, higher deviations canbe found at the liquidus temperature (DTL~20�C).Finally, the results of samples D-I to D-IV are presentedalong with the calculated phase diagram in Figure 10.
V. CONCLUSION AND OUTLOOK
The purpose of the present work was to provide newphase diagram data for the improvement of thermody-namic databases and solidification models for P alloyedsteel grades. Therefore, high temperature phase equilib-ria in the binary Fe-P system and three isoplethalsections in the ternary Fe-C-P system were characterizedby means of differential scanning calorimetry (DSC).NETZSCH’s Tau-R software[44,45] was critically evalu-ated and successfully used to optimize the efficiency ofthe DSC measurements by guaranteeing equilibriumconditions at the same time. The binary Fe-P subsystemwas reinvestigated in the range 0.025 to 9 mass percent
Table VI. Chemical Composition and Determined High-Temperature Phase Equilibrium Transformation Temperatures in the
Fe-C-P Vertical with [pct P]/[pct C] = 2
AlloyC
[Mass Pct.]P
[Mass Pct.]P/C Ratio
[—]c+Lfic+d+L
[�C]c+d+Lfid+L
[�C]Solidus[�C]
Liquidus[�C]
D-I 0.170 0.430 2.53 1416.9a 1456.6a 1359.1a
1370.0b1507.0a
D-II 0.340 0.760 2.24 1457.1a 1460.3a 1194.2a
1210.0b1481.7a
D-III 0.680 1.275 1.88 — — 996.4a 1421.7a
D-IV 1.360 2.960 2.18 — — 956.2a a
aDetermined by the DSC method.bDetermined by HT-LSCM.
Fig. 8—Results of linking DSC and HT-LSCM for samples D-I (a) and D-II (b) showing the DSC signal (I), the calculated phase diagram alongwith the present experimental data (II) and the HT-LSCM observation of present phase transformations (III).
METALLURGICAL AND MATERIALS TRANSACTIONS A VOLUME 51A, OCTOBER 2020—5361
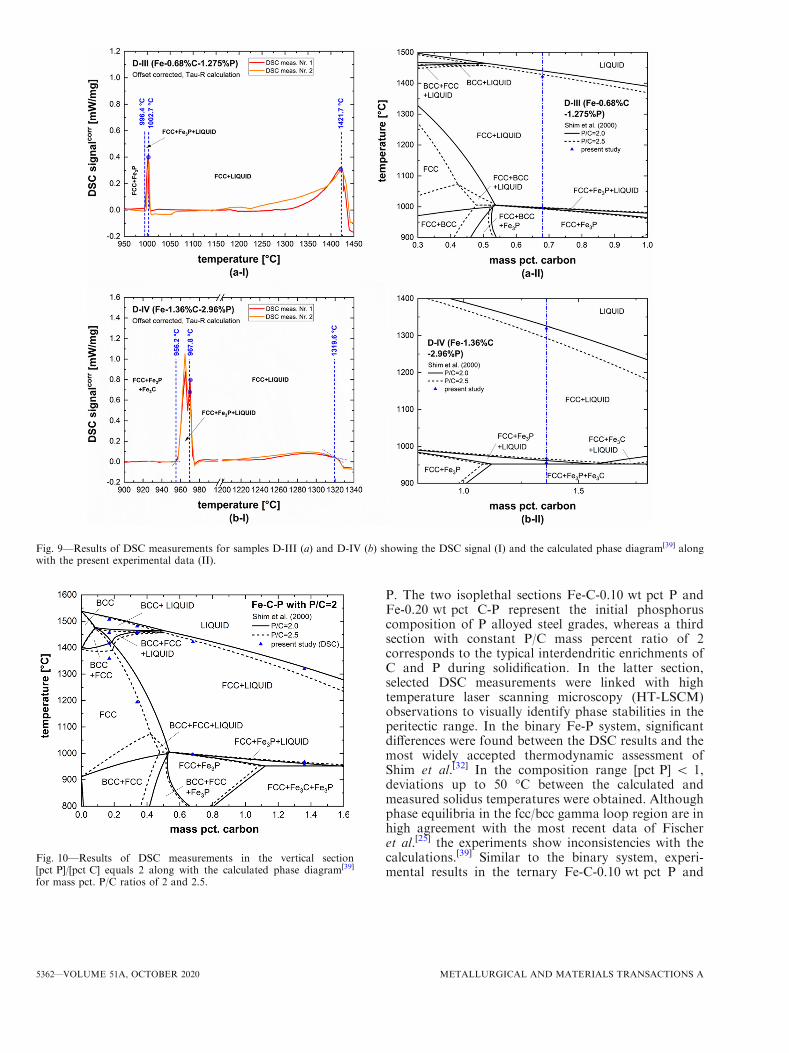
P. The two isoplethal sections Fe-C-0.10 wt pct P andFe-0.20 wt pct C-P represent the initial phosphoruscomposition of P alloyed steel grades, whereas a thirdsection with constant P/C mass percent ratio of 2corresponds to the typical interdendritic enrichments ofC and P during solidification. In the latter section,selected DSC measurements were linked with hightemperature laser scanning microscopy (HT-LSCM)observations to visually identify phase stabilities in theperitectic range. In the binary Fe-P system, significantdifferences were found between the DSC results and themost widely accepted thermodynamic assessment ofShim et al.[32] In the composition range [pct P] < 1,deviations up to 50 �C between the calculated andmeasured solidus temperatures were obtained. Althoughphase equilibria in the fcc/bcc gamma loop region are inhigh agreement with the most recent data of Fischeret al.[25] the experiments show inconsistencies with thecalculations.[39] Similar to the binary system, experi-mental results in the ternary Fe-C-0.10 wt pct P and
Fig. 9—Results of DSC measurements for samples D-III (a) and D-IV (b) showing the DSC signal (I) and the calculated phase diagram[39] alongwith the present experimental data (II).
Fig. 10—Results of DSC measurements in the vertical section[pct P]/[pct C] equals 2 along with the calculated phase diagram[39]
for mass pct. P/C ratios of 2 and 2.5.
5362—VOLUME 51A, OCTOBER 2020 METALLURGICAL AND MATERIALS TRANSACTIONS A
Fe-0.20 pct C-P sections indicate higher stability of theliquid phase than that found in the optimization.[39] Theexperimentally determined peritectic range in theFe-C-0.10 wt pct P section is between 0.084-0.147 masspct. C, whereas the calculations[39] predict C composi-tion 0.08-0.185. In the [pct P]/[pct C] equals 2 section,HT-LSCM was successfully applied to identify thepresent phase stabilities (fcc/bcc/liquid) within in theinvestigated temperature range and the observationshighly correlate with results from the DSC measure-ments. The present experimental data can be used torefine previous thermodynamic modeling of the Fe-Pand the Fe-C-P ternary system in a CALPHAD frame-work. The revised thermodynamic modeling of the twosystems by the present authors is available elsewhere.[55]
This work gives much improved thermodynamicdescription of the two systems, which certainly yieldsbetter prediction of thermodynamic calculation forsegregation behavior in these system during casting orcooling.
ACKNOWLEDGMENTS
Open access funding provided by Montanuniversi-taet Leoben. The authors gratefully acknowledge thefinancial support under the scope of the COMET pro-gram within the K2 Center ‘‘Integrated ComputationalMaterial, Process and Product Engineering(ICMPPE)’’ (Project No 859480). This program is sup-ported by the Austrian Federal Ministries for Trans-port, Innovation and Technology (BMVIT) and forDigital and Economic Affairs (BMDW), representedby the Austrian research funding association (FFG),and the federal states of Styria, Upper Austria andTyrol.
ELECTRONIC SUPPLEMENTARY MATERIAL
The online version of this article (https://doi.org/10.1007/s11661-020-05912-z) contains supplementarymaterial, which is available to authorized users.
OPEN ACCESS
This article is licensed under a Creative CommonsAttribution 4.0 International License, which permitsuse, sharing, adaptation, distribution and reproductionin any medium or format, as long as you give appro-priate credit to the original author(s) and the source,provide a link to the Creative Commons licence, and
indicate if changes were made. The images or otherthird party material in this article are included in thearticle’s Creative Commons licence, unless indicatedotherwise in a credit line to the material. If material isnot included in the article’s Creative Commons licenceand your intended use is not permitted by statutoryregulation or exceeds the permitted use, you will needto obtain permission directly from the copyrightholder. To view a copy of this licence, visit http://creativecommons.org/licenses/by/4.0/.
REFERENCES1. M. Wintz, M. Bobadilla, and J. Jolivet: Rev. Metall., 1994, vol. 91,
pp. 106–14.2. E. Schmidtmann and F. Rakoski: Arch. Eisenhuettenwes., 1983,
vol. 54, pp. 357–62.3. M. Wolf and W. Kurz: Metall. Trans. B, 1981, vol. 12, pp. 85–93.4. H.G. Suzuki, S. Nishimura, and Y. Nakamura: Trans. Iron Steel
Inst. Jpn., 1984, vol. 24, pp. 54–59.5. X.-M. Chen, S.-H. Song, L.-Q. Weng, S.-J. Liu, and K. Wang:
Mater. Sci. Eng. A, 2011, vol. 528, pp. 8299–04.6. M. Yamashita, H. Miyukia, Y. Matsudaa, H. Naganoa, and
T. Misawa: Corros. Sci., 1994, vol. 36, pp. 283–99.7. M. Yamashita, H. Nagano, T. Misawa, and H.E. Townsend: ISIJ
Int., 1998, vol. 38, pp. 285–90.8. L. Barbe, K. Verbeken, and E. Wettinck: ISIJ Int., 2006, vol. 46,
pp. 1251–57.9. P. Presoly, R. Pierer, and C. Bernhard: Metall. Mater. Trans. A,
2013, vol. 44A, pp. 5377–88.10. P. Presoly, G. Xia, P. Reisinger, and C. Bernhard: Berg- Huet-
tenmaenn. Monatsh., 2014, vol. 159, pp. 430–37.11. H. Okamoto: Bull. Alloy Phase Diagrams, 1990, vol. 11,
pp. 404–12.12. W. Franke, K. Meisel, and R. Juza: Z. Anorg. Chem., 1934,
vol. 218, pp. 346–59.13. K. Meisel: Z. Anorg. Chem., 1934, vol. 218, pp. 360–64.14. M. Heimbrecht and W. Biltz: Z. Anorg. Chem., 1939, vol. 242,
pp. 233–36.15. W. Jeitschko and D.J. Braun: Acta Crystallogr. B, 1978, vol. 34,
pp. 3196–3201.16. B. Saklatwalla: J. Iron Steel Inst., 1908, vol. 77, pp. 92–103.17. N. Konstantinow: Z. Anorg. Chem., 1910, vol. 66, pp. 209–27.18. J.L. Houghton: J. Iron Steel Inst., 1927, vol. 115, pp. 417–33.19. R. Vogel: Arch. Eisenhuettenw., 1929, vol. 3, pp. 369–81.20. E. Wachtel, G. Urbain, and E. Ubelacker: C.R., 1963, vol. 257,
pp. 2470–72.21. E. Schurmann: Arch. Eisenhuettenw., 1980, vol. 51, pp. 325–27.22. Z.I. Morita and T. Tanaka: Trans. Iron Steel Inst. Jpn., 1986,
vol. 26, pp. 114–20.23. P. Roquet and G. Jegaden: Rev. Metall., 1951, vol. 48, pp. 712–21.24. K. Lorenz and H. Fabritius: Arch. Eisenhuettenw., 1962, vol. 33,
pp. 269–75.25. W.A. Fischer, K. Lorenz, H. Fabritius, A. Hoffmann, and
G. Kalwa: Arch. Eisenhuettenw., 1966, vol. 37, pp. 79–86.26. H. Kaneko, T. Nishizawa, K. Tamaki, and A. Tanifuji: J. Japan.
Inst. Metals, 1965, vol. 29, pp. 166–70.27. A.S. Doan and J.I. Goldstein: Metall. Trans., 1970, vol. 1,
pp. 1759–67.28. H.P. Hofmann, K. Lohberg, and W. Reif: Arch. Eisenhuettenw.,
1970, vol. 41, pp. 975–82.29. M. Ko and T. Nishizawa: J. Jpn. Inst. Met., 1979, vol. 43,
pp. 118–26.30. P. Spencer and O. Kubaschewski: Arch. Eisenhuettenwes., 1978,
vol. 49, pp. 225–28.
METALLURGICAL AND MATERIALS TRANSACTIONS A VOLUME 51A, OCTOBER 2020—5363
31. P. Gustafson, Report IM-2549, Swedish Institute for MetalsResearch, Stockholm, Sweden, 1990.
32. J.H. Shim, C.S. Oh, and D.N. Lee: J. Korean Inst. Met. Mater.,1996, vol. 34, pp. 1385–93.
33. H. Ohtani, N. Hanaya, M. Hasebe, S.-I. Teraoka, and M. Abe:Calphad, 2006, vol. 30, pp. 147–58.
34. T. Tokunaga, N. Hanaya, H. Ohtani, and M. Hasebe: Mater. Sci.Forum, 2007, vols. 561–565, pp. 1899–1902.
35. Z.-M. Cao, K.-P. Wang, Z.-Y. Qiao, and G.-W. Du: Acta Phys.Chim. Sin., 2012, vol. 28, pp. 37–43.
36. J. Miettinen and G. Vassilev: Phase Equilib. Diffus., 2014, vol. 35,pp. 458–68.
37. P. Perrot, Landolt-Bornstein—Group IV Physical ChemistryVolume 11D2: ‘‘Iron Systems, Part 2’’, Springer Materials,Springer, Berlin Heidelberg, 2008. https://doi.org/10.1007/978-3-540-74196-1_11.
38. E. Schurmann,U.Hensgen, and J. Schweinichen:Giessereiforschung,1984, vol. 36, pp. 121–29.
39. J.-H. Shim, C.-S. Oh, and D.N. Lee: Z. Metallkd., 2000, vol. 91,pp. 114–20.
40. P. Gustafson: Scand. J. Metall., 1985, vol. 14, pp. 259–67.41. G.W. Hohne, H.W. Hemminger, and H.J. Flemmingheim:
Differential Scanning Calorimetry: An Introduction to Practitioners,1st ed., Springer, Berlin, 1996.
42. W. J. Boettinger, U. R. Kattner, K.-W. Moon and J. H.Perepezko, DTA and Heat-flux DSC measurements of AlloyMelting and Freezing. NIST Recommended Practice Guide, Spe-cial Publication 960-15, 2006.
43. L.A. Chapman: J. Mater. Sci., 2004, vol. 39, pp. 7229–36.
44. Software: NETZSCH Tau-R Calibration 8.0.1 from NetzschGeratebau GmbH, Selb, Germany, 2019.
45. E. Moukhina and E. Kaisersberger: Thermochim. Acta, 2009,vol. 492, pp. 101–109.
46. W.J. Boettinger and U.R. Kattner: Metall. Mater. Trans. A, 2002,vol. 33A, pp. 1779–94.
47. M. Reid, D. Phelan, and R. Dippenaar: ISIJ Int., 2004, vol. 44,pp. 565–72.
48. C. Bernhard, S. Schider, A. Sormann, G. Xia, and S. Ilie:Berg-Huettenmaenn. Monatsh, 2011, vol. 156, pp. 161–67.
49. S. Griesser and R. Dippenaar: ISIJ Int., 2014, vol. 54, pp. 533–35.50. N. Fuchs, P. Krajewski, and C. Bernhard: Berg-Huettenmaenn.
Monatsh., 2015, vol. 160, pp. 214–20.51. C.W. Bale, E. Belisle, P. Chartrand, S.A. Decterov, G. Eriksson,
A.E. Gheribi, K. Hack, I.-H. Jung, Y.-B. Kang, J. Melancon,A.D. Pelton, S. Petersen, C. Robelin, J. Sangster, P. Spencer, andM.-A. van Ende: Calphad, 2016, vol. 54, pp. 35–53.
52. A. Grill and J.K. Brimacombe: Ironmak. Steelmak., 1976, vol. 3,pp. 76–79.
53. Y. Maehara, K. Yasumoto, H. Tomono, T. Nagamichi, andY. Ohmori: Mater. Sci. Technol., 1990, vol. 6, pp. 793–806.
54. G. Xia, C. Bernhard, S. Ilie and C. Furst, Proceedings of the 6thEuropean Conference on Continuous Casting 2008, Riccione,Italy, 2008.
55. M. Bernhard, Y.-B. Kang, P. Presoly, A.E. Gheribi, andC. Bernhard: Calphad, 2020, vol. 70, art. no. 101795.
Publisher’s Note Springer Nature remains neutral with regard tojurisdictional claims in published maps and institutional affiliations.
5364—VOLUME 51A, OCTOBER 2020 METALLURGICAL AND MATERIALS TRANSACTIONS A
APPENDIX: PUBLICATIONS
PhD thesis Michael Bernhard. 85
Paper II
Critical evaluation and thermodynamic modeling of the Fe–P and Fe–C–P system
M. Bernhard, Y.-B. Kang, P. Presoly, A.E. Gheribi and C. Bernhard
CALPHAD, 2020, vol. 70, art. no. 101795.
Abstract: Phosphorus is known to be a strongly segregating element in steel; even small
amounts influence the solidification phenomena and product quality during casting processes.
In order to provide an accurate prediction tool for process control in steelmaking, a CALPHAD-
type thermodynamic optimization of the Fe–C–P system was performed including modeling of
the binary Fe–P subsystem. The liquid phase was modeled using the Modified Quasichemical
Model (MQM) in the pair approximation, which generally yields better results for strong short-
range ordering (SRO) tendency in the solution. The solid bcc and fcc solutions were described
using the Compound Energy Formalism (CEF). In addition, ab-initio calculations were
performed to estimate the enthalpies of formation of the corresponding end-member for fcc
and bcc, respectively. The phosphides Fe3P, Fe2P and FeP were treated as stoichiometric
compounds. Higher order phosphides were not considered, since there is no reliable
experimental information available in literature. The present model successfully reproduces
most of the literature data within the experimental uncertainty in the Fe–C–P system without
introducing a ternary parameter for the liquid phase. Compared with previous thermodynamic
assessments, the agreement with recently published thermal analysis measurements of Fe–P
and Fe–C–P alloys is significantly improved.
Used and reprinted based on author rights in Elsevier’s proprietary journals
–
– –
� � �
–
– – – –
–
– –
– – –
–
–
–
–
–
– –
–
journal homepage: http://www.elsevier.com/locate/calphad
Calphad 70 (2020) 101795
2
Fe–P description and the most accepted Fe–C model [16], Gustafson [8] and later Shim et al. [17] assessed the ternary Fe–C–P system. Within their work, activity of the liquid phase, liquidus projections and several vertical and isothermal sections were considered.
Recently, four of the present authors reinvestigated the binary Fe–P system and various vertical sections of the Fe–C–P system by means of differential scanning calorimetry (DSC) [18]. Obviously, there are still discrepancies between calculated and measured phase equilibria tem-peratures using available thermodynamic assessments, particularly with respect to solidification. In previous assessments [8–13,17], the Bragg-Williams (BW) random mixing model was used to formulate the Gibbs energy of the liquid phase. The binary Fe–P liquid phase exhibits a strong short-range-ordering (SRO) tendency, which is difficult to take into account with the BW model. Hence, the Modified Quasichemical Model (MQM) in the pair-approximation [19,20] was applied in the present study, due to its better performance in solutions with strong SRO. The solid fcc and bcc solutions were described by the Compound Energy Formalism (CEF) [21] with two-sublattices. Fe3P, Fe2P and FeP phosphides were treated as stoichiometric compounds. Higher order phosphides were not considered, since there is no reliable experimental data available in literature. Model parameters of the sub-binary Fe–C system are taken from the work of Shubhank and Kang [22] and Gus-tafson [8]. The main purpose of the present work is to provide a set of thermodynamic parameters to reproduce the DSC data of M. Bernhard et al. [18] more accurately, in consideration of extensive experimental literature data.
2. Literature review
There is a large variety of thermodynamic and phase diagram data available in literature. A review of experimental investigations of the Fe–P system up to 1990 was given by Okamoto [23]. Perrot [24] sum-marized phase relations, crystallographic data and material properties in the Fe–C–P system. Another extensive literature review is not repeated in the present work, but published data with relevance to the optimization will be reported briefly.
2.1. Fe–P system
Schürmann et al. [25] indirectly derived the integral enthalpy of mixing at 1550 �C from calorimetric measurements in a high-temperature calorimeter in the composition range up to 33 at% P. Urbain [26,27] determined activities of phosphorus with respect to infinite dilution by distribution experiments between immiscible liquid iron and silver. His activity data is available in a temperature range of 1300–1600 �C and up to 33 at% P. A similar technique and experimental conditions were used in the work done by Ban-Ya and Suzuki [28]. Based on the activity measurements, Urbain [27] also provided the partial mixing enthalpy of P. Fischer at al [29]. Performed electromotive force measurements using solid and liquid calcium-phosphate electrolytes at 1650 �C between 0.1 and 31 at% phosphorus. Vapor pressure of phos-phorus in liquid Fe–P alloys was measured by Ban-Ya et al. [30] at temperatures of 1200–1500 �C and 5 to 25 at% P and by Schenck [31, 32] from 1515 to 1650 �C with maximum concentrations of 43 at% P. Zaitsev et al. [14] determined activities of phosphorus in the liquid phase from their Knudsen effusion cell data of P vapor pressure. With respect to pure liquid components, the activities are given up to 30 at% P at 1536 �C and at various fixed compositions in the temperature range from 1127 to 1527 �C. Zaitsev et al. [14] further measured heat ca-pacities of iron phosphides using the DSC method and determined their Gibbs energies of formation from the effusion experiments. The enthalpy of formation for Fe2P was estimated by Roth et al. [33] using combustion calorimetry. Weibke [34] measured heats of formation of Fe3P, Fe2P and FeP in a high-temperature calorimeter at 635 �C. Lewis and Myers [35] chose the Knudsen effusion cell to measure the heat of formation of phosphides at 627 �C. Several DFT studies have been reported in the
literature on the prediction of the enthalpy of formation of stable and metastable compounds in both Fe–P and Fe–C systems, considering the same methodology used in the present study (PAW pseudopotential and GGA exchange correlation functional) [10,11,36]. Moreover, for several stable and metastable compounds, a summary of enthalpy of formation and equilibrium lattice parameters are available in Material project [37]. For Fe–P and Fe–C, the DFT-based predictions of the enthalpy of formation compare very well with available experimental data as shown by Ohtani et al. [10] for Fe–P and, among others, by Hallstedt [38] for Fe–C. Note that for Fe–P, a significant magnetic contribution to the enthalpy of formation have been calculated. For C–P, Claeyssens et al. [39] showed that PxCy compounds are thermodynamically unstable and defect zinc-blended structures are favored. There is no data available for PxCy end-member of fcc and bcc phases.
There are large discrepancies in the phase diagram data of the binary Fe–P system resulting from both the different experimental procedures and the impurity levels of the alloys used. First investigations of the Fe–P diagram were performed by Saklatwalla [40] and Konstantinow [41] evaluating cooling curves of liquid Fe–P alloys by means of the py-rometer technique. Houghton [42] applied thermal analysis and mag-netic measurements to determine phase equilibrium temperatures. Phase equilibria between solid fcc and bcc solution were determined in the work of Roquet and Jegaden [43] by applying thermal treatment of samples with different P concentrations with subsequent quenching and micrographic examination. Additionally, phase boundaries in the gamma loop were measured using the dilatometer method. Lorenz et al. [44] and Fischer et al. [45] used the magnetic balance to reconstruct the fcc þ bcc gamma loop up to 1400 �C. Thermal and magnetic analysis were employed by Wachtel et al. [46] to determine the solid þ liquid equilibria between 0.5 and 13 mass pct. Phosphorus. Kaneko et al. [47] reported P solubility in bcc between 700 and 1000 �C. Doan and Gold-stein [48] combined long-term heat treatments with electron micro-probe analysis in the temperature range of 550–1100 �C to measure the compositions of coexisting stable phases. Ko and Nishizawa [49] determined the solubility of P in bcc from 600 to 1200 �C using X-ray diffraction and microprobe analysis. Schürmann [50] investigated the melting equilibria in the Fe–P system by thermal analysis and holding tests with subsequent EPMA analysis of the quenched samples. Similar holding tests were also performed in the work of Morita and Tanaka [51]. Recently, M. Bernhard et al. [18] provided new equilibrium data on phase transformations in the binary Fe–P system using the differen-tial scanning calorimetry (DSC) method. Within this extensive work, equilibrium temperatures between 0.025 and 9 mass pct. Phosphorus were determined.
2.2. Fe–C–P system
Frohberg et al. [52] and Hadrys et al. [53] studied the influence of carbon on the activity of P using the distribution method between liquid iron and silver at 1600 �C. Schenck et al. [54] investigated the solubility of phosphorus in carbon-saturated melts at 1515 �C by means of P vapor pressure measurements. Yang [55] measured the carbon solubility depending on the P concentration with the carbon iso-activity method at 1400 �C. Carbon solubility in liquid Fe–C–P melts in the temperature ranges of 1200–1600 �C and 1300–1570 �C were determined by Turk-dogan and Leake [56] and Schürmann and Kramer [57], respectively. Various vertical sections in the Fe–C–P determined by cooling curves and metallographic examinations were reported by Vogel [58]. Thermal analysis and metallographic examinations of the 2.4 mass pct. C isopleth section were performed by Ohide and Ohira [59]. The liquidus surface in the iron-rich corner was constructed by Schürmann et al. [60] using thermal analysis. Kaneko et al. [47] reported the solubility of phos-phorus in fcc at 800, 900 and 1000 �C. Langenscheid et al. [61] used metallographic analysis and EPMA to determine the phase boundaries at 900, 950 and 1000 �C. Hofmann et al. [62] applied diffusion annealing experiments with subsequent EPMA analysis to determine four
M. Bernhard et al.
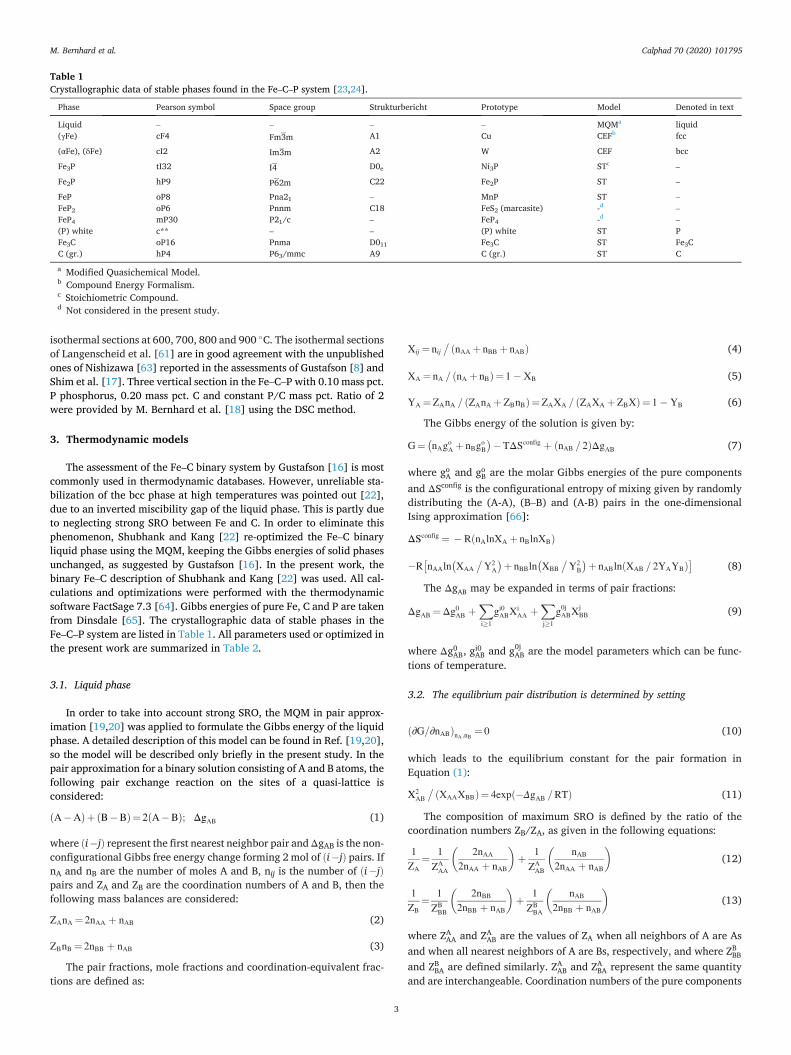
�
– –
–
–
–
– –
ðA�AÞþ ðB�BÞ¼ 2ðA�BÞ; ΔgAB
ð � Þ Δ
ð � Þð � Þ
ZAnA ¼ 2nAA þ nAB
ZBnB ¼ 2nBB þ nAB
Xij ¼ nij� ðnAA þ nBB þ nABÞ
XA ¼ nA = ðnA þ nBÞ¼ 1 � XB
YA ¼ZAnA = ðZAnA þZBnBÞ¼ZAXA = ðZAXA þZBXÞ¼ 1 � YB
G¼ �nAgo
A þ nBgoB
��TΔSconfig þ ðnAB = 2ÞΔgAB
Δ
–
ΔSconfig ¼ � RðnAlnXA þ nBlnXBÞ
�R�nAAln
�XAA
�Y2
A
�þ nBBln�XBB
�Y2
B
�þ nABlnðXAB = 2YAYBÞ�
Δ
ΔgAB ¼Δg0AB þ
Xi�1
gi0ABXi
AA þXj�1
g0jABX
jBB
Δ
ð∂G=∂nABÞnA ;nB¼ 0
X2AB
� ðXAAXBBÞ¼ 4expð�ΔgAB =RTÞ
1
ZA
¼ 1
ZAAA
�2nAA
2nAA þ nAB
�þ 1
ZAAB
�nAB
2nAA þ nAB
�
1
ZB
¼ 1
ZBBB
�2nBB
2nBB þ nAB
�þ 1
ZBBA
�nAB
2nBB þ nAB
�
– –
– – – –
γ
α δ
–
–
– –
–
– –
– –
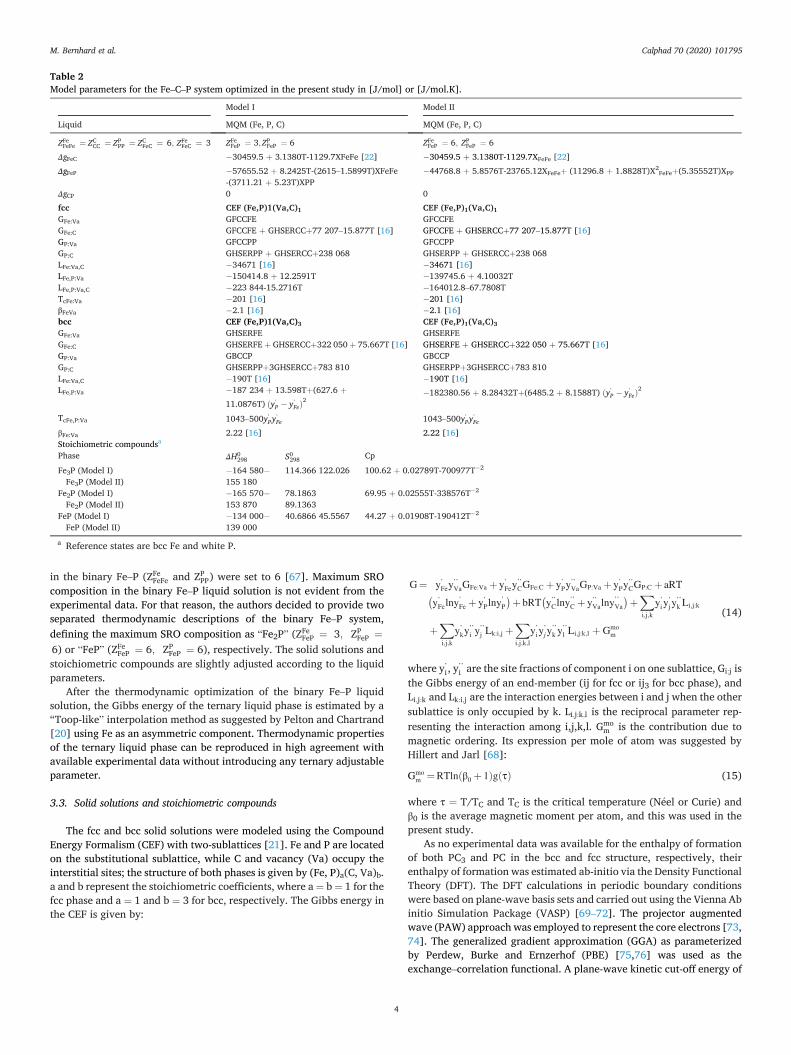
–
–
–
“ ” ¼ ; ¼“ ” ¼ ; ¼
–
”
¼ ¼¼ ¼
G¼ y’Fey
’’VaGFe:Va þ y’
Fey’’CGFe:C þ y’
Py’’VaGP:Va þ y’
Py’’CGP:C þ aRT�
y’Felny’
Fe þ y’Plny’
P
�þ bRT�y’’
Clny’’C þ y’’
Valny’’Va
�þXi;j;k
y’iy
’j y
’’k Li;j:k
þXi;j;k
y’ky’’
i y’’j Lk:i;j þ
Xi;j;k;l
y’iy
’jy
’’k y’’
l Li;j:k;l þ Gmom
’ ’’:
; : : ;
; : ;
Gmom ¼RTlnðβ0 þ 1ÞgðτÞ
τ ¼ �
β
–
–
– –
¼ ¼ ¼ ¼ ; ¼ ¼ ; ¼ ¼ ; ¼Δ � þ � þΔ � þ –
þ� þ þ þ þ
Δ
þ þ – þ þ –
þ þ þ þ� �� þ � þ� � –
� �β � �
þ þ þ þ þ þ
þ þ þ þ� �� þ þ þ
ð ’ � ’ Þ� þ þ þ ð ’ � ’ Þ
– ’ ’ – ’ ’
β
Δ� � þ �
� � þ �
� � þ �
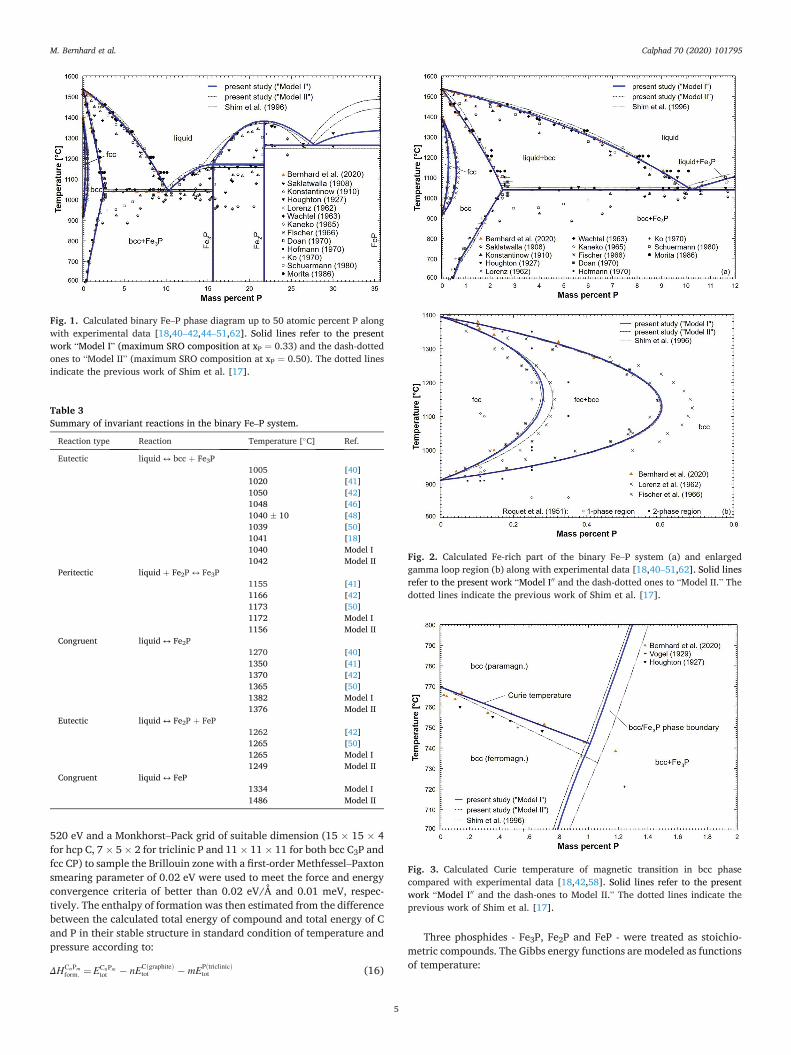
– � �� � � �
–
ΔHCnPmform: ¼ECnPm
tot � nECðgraphiteÞtot � mEPðtriclinicÞ
tot
–
– –
“ ” ¼“ ” ¼
–
�
↔ þ
�
þ ↔
↔
↔ þ
↔
–
–
“ 00 “ ”
“ 00 ”
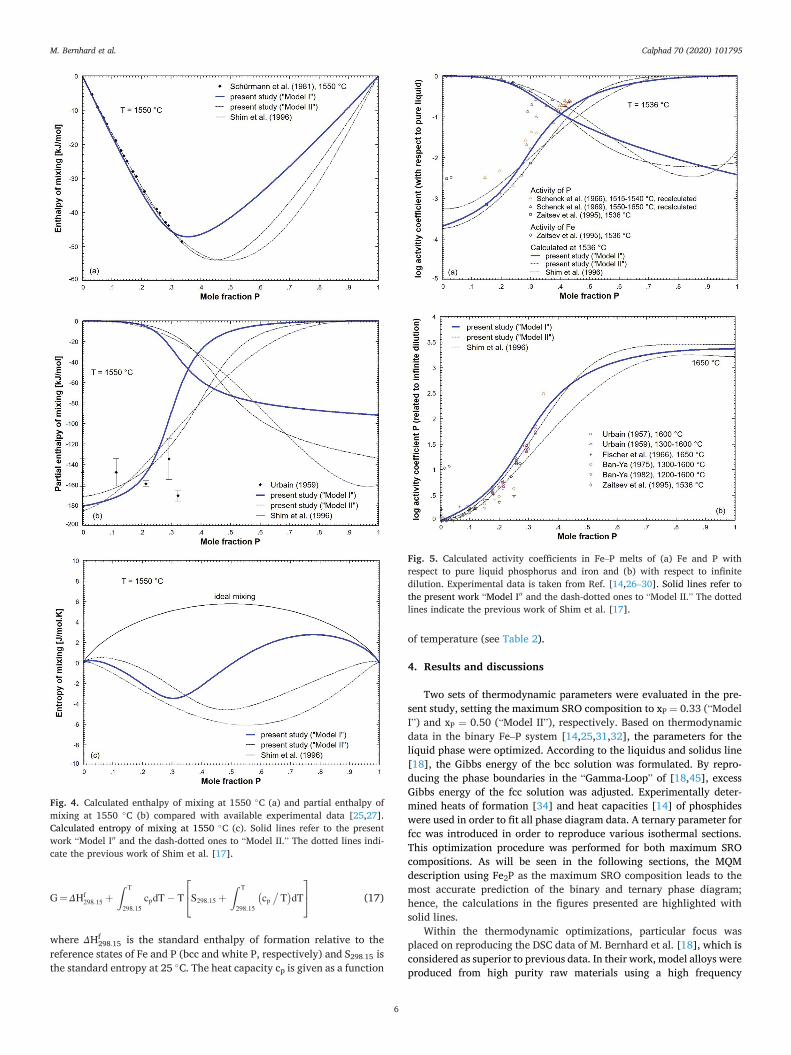
G¼ΔHf298:15 þ
Z T
298:15
cpdT � T
24S298:15 þ
Z T
298:15
�cp
�T�dT
35
Δ :
:�
¼ “
” ¼ “ ”
–
“ ”
��
�
“ 00 “ ”
–
–
“ 00 “ ”
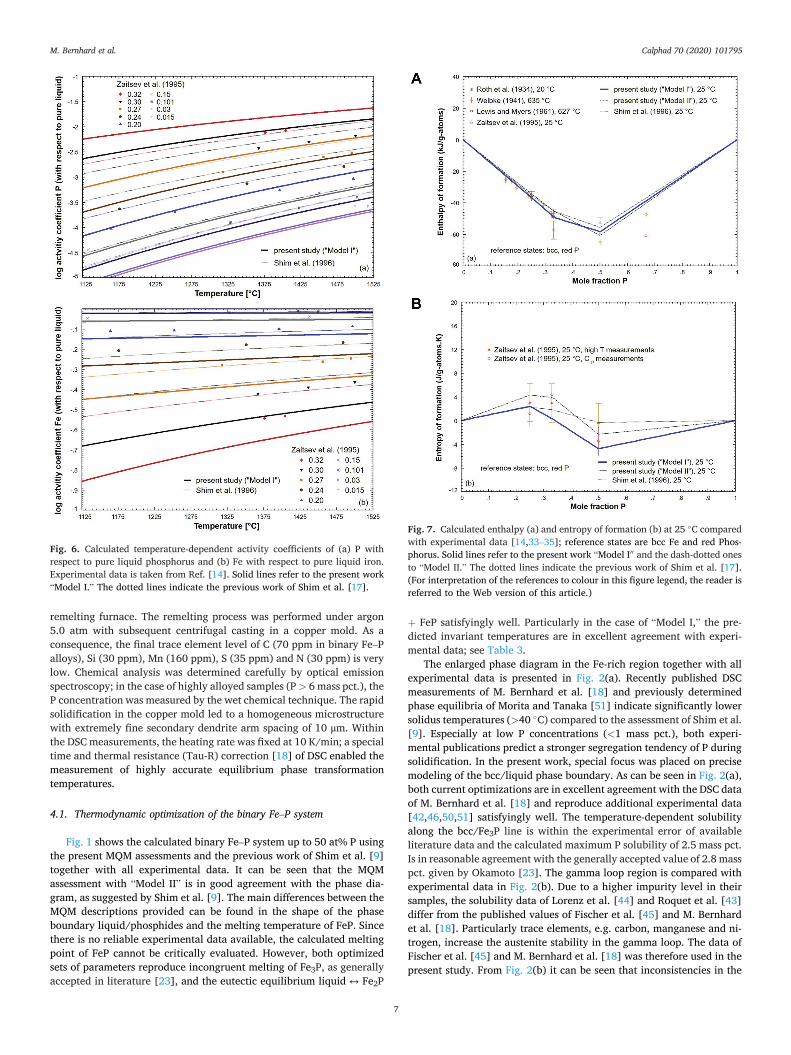
–
>
μ
–
–
“ ”
↔
þ “ ”
> �
<
“ ”
�
–
“ 00
“ ”
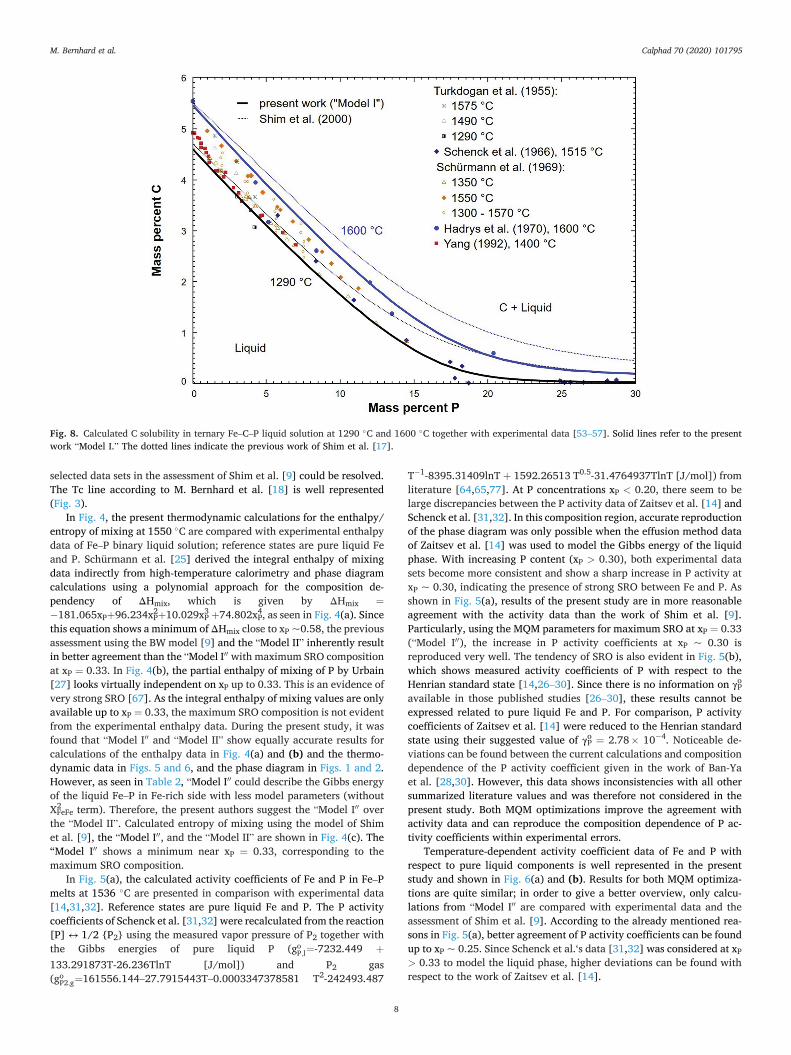
�
–
Δ Δ ¼� þ þ þ
Δ
“ ”
“ 00
¼
¼
“ 00 “ ”
“ 00
–
“ 00
“ ”
“ 00 “ ” 00 ¼
–�
↔
; ¼ þ
; ¼ – –
� þ<
>
¼“ 00
– γ
–
γ ¼ � �
“ 00
>
– – � � –
“ ”
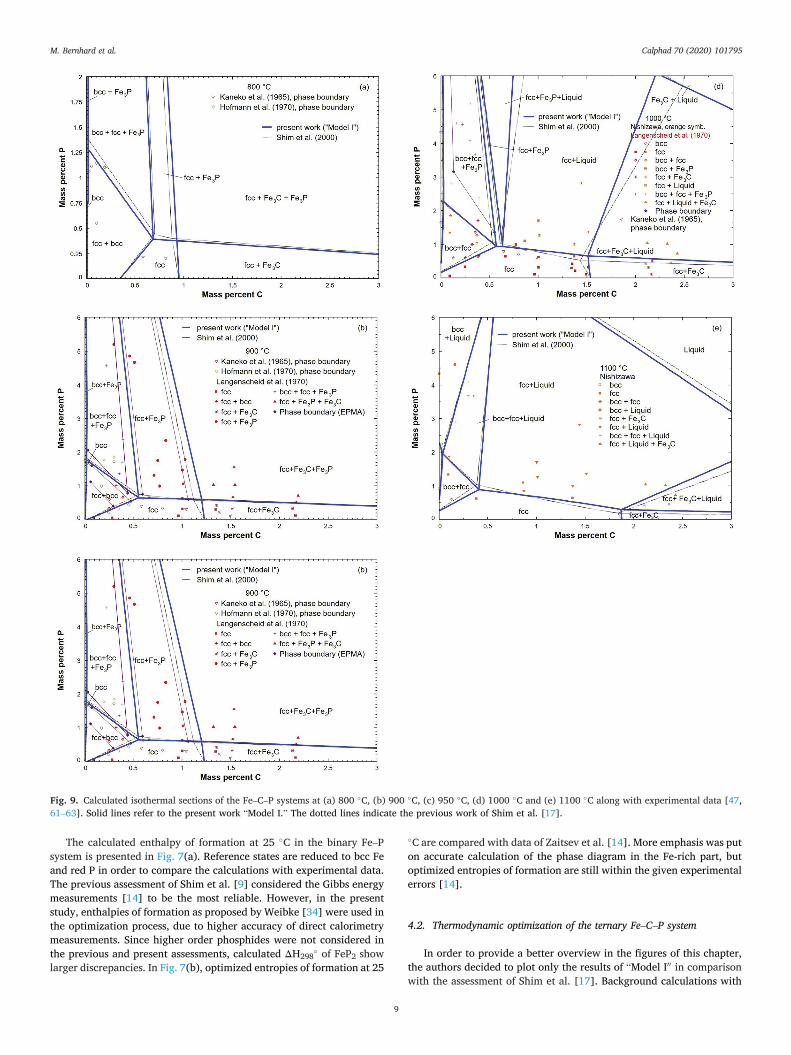
� –
Δ �
�
– –
“ 00
– – � � � � �
– “ ”
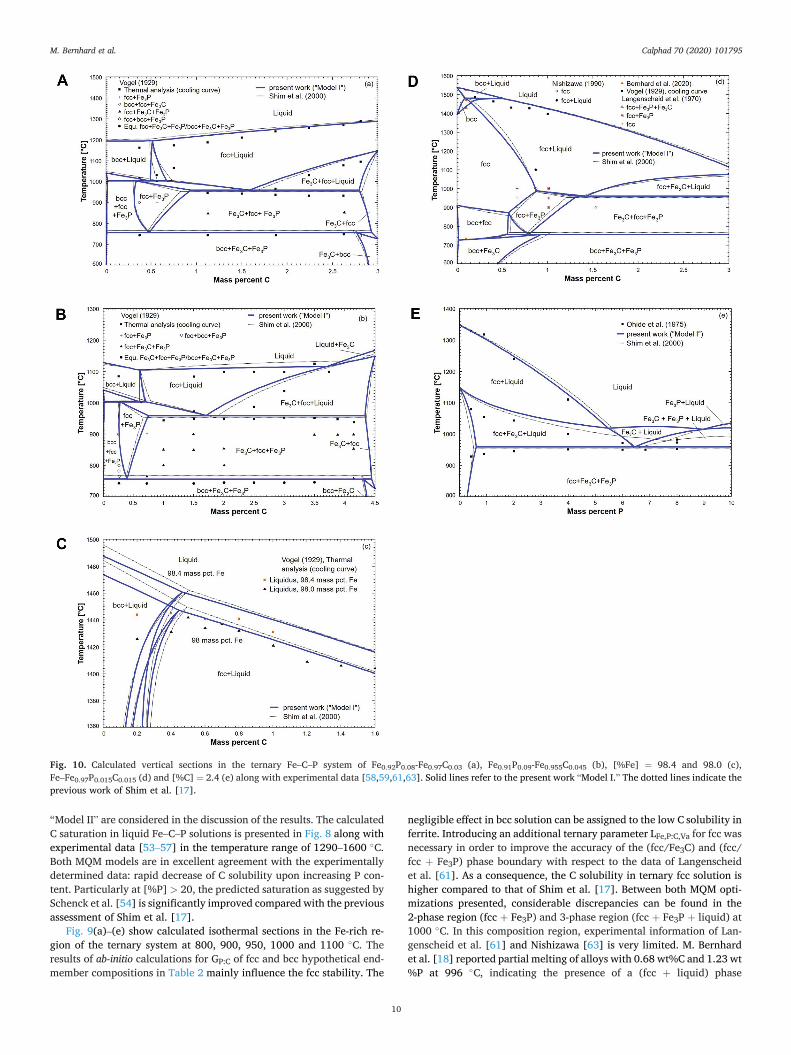
”
– –
– – �
>
–�
þ
þ þ þ�
� þ
– – ¼– ¼ “ ”

�
“ 00
–
“ 00
– –
“ ” þ → þ
–
–
¼
> –
þ þ�
– –
¼“ 00 “ ”
–
– – –
= ¼ “ 00
= ¼ “ ”
“ ”
–
¼ “ 00
“ 00
ε ρ
– ’
lnðγiÞ¼ ln�γo
i
�þXn
j¼2
εjixj þ
Xn
j¼2
ρjix
2j
logðfiÞ¼Xn
j¼2
ejið%jÞ þ
Xn
j¼2
ρjið%jÞ2
γ
� γ� � ε ρ
ε ρ
– –
–
“ ”
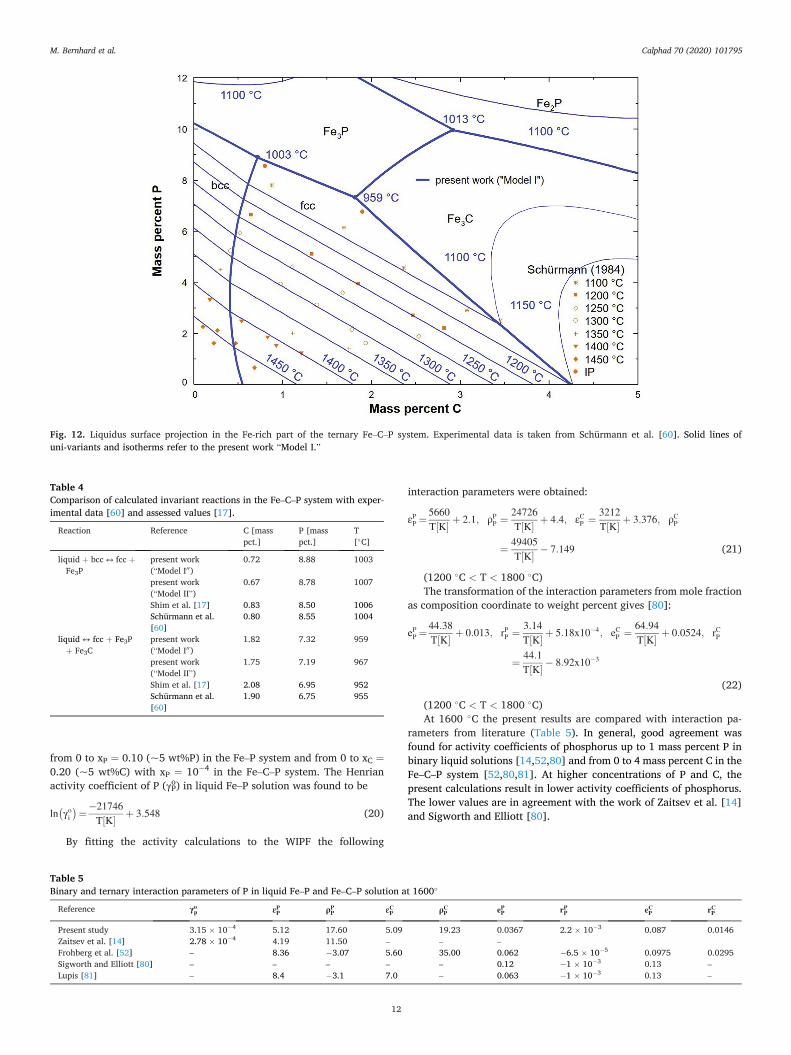
¼ – ¼¼ � – –
γ –
ln�γo
i
�¼�21746
T½K� þ 3:548
εPP ¼
5660
T½K� þ 2:1; ρPP ¼ 24726
T½K� þ 4:4; εCP ¼ 3212
T½K� þ 3:376; ρCP
¼ 49405
T½K� � 7:149
� < < �
ePP ¼
44:38
T½K� þ 0:013; rPP ¼ 3:14
T½K� þ 5:18x10�4; eCP ¼ 64:94
T½K� þ 0:0524; rCP
¼ 44:1
T½K� � 8:92x10�3
� < < ��
– –
– –
“ ”
– –
�
þ ↔ þ“ 00
“ ”
↔ þþ “ 00
“ ”
– – – �
γop εP
P ρPP εC
P ρCP eP
P rPP eC
P rCP
� � � �
� � – – –
– � � � �
– – – – – � � � –
– � – � � � –
Calphad 70 (2020) 101795
13
5. Conclusion
A CALPHAD-type thermodynamic assessment of the ternary Fe–C–P system was carried out including modeling of the Fe–P binary subsystem in the experimentally investigated range up to 50 at% P. Gibbs energy of the liquid phase was formulated using the Modified Quasichemical Model (MQM) in order to take into account the strong short-range- ordering (SRO) tendency. Since maximum SRO composition was not evident from experimental information, the authors decided to provide two sets of model parameters for different maximum SRO in the binary Fe–P system. Ab-initio calculations were performed to estimate the enthalpy of formation of fcc and bcc endmembers in the Compound Energy Formalism (CEF). Combining the already assessed Fe–C subsys-tem by Shubhank and Kang [22] and the present Fe–P descriptions, solubility data of C in the Fe–C–P liquid phase could be reproduced more accurately without adding a ternary parameter for the excess Gibbs energy. Based on various isothermal and isopleth sections in the ternary Fe–C–P system, both MQM descriptions were critically evaluated. Both parameter sets are in excellent agreement with recently published phase equilibrium data of M. Bernhard et al. [18]. Regarding the solidus temperature and phase stabilities in the peritectic region, the discrep-ancies between the experimental data and the previous assessment of Shim et al. [17] were resolved. Although both MQM optimizations can be used particularly for steel databases, the authors suggest “Model I” (maximum SRO in the liquid near Fe2P composition) because less model parameters were needed in order to accurately reproduce thermody-namic properties of the liquid phase in the Fe-rich part of the Fe–P system.
Data availability
The raw/processed data required to reproduce these findings are available from the authors upon a written request.
Declaration of competing interest
None.
Acknowledgments
The authors gratefully acknowledge the financial support under the scope of the COMET program within the K2 Center “Integrated Computational Material, Process and Product Engineering (IC-MPPE)” (Project No 859480). This program is supported by the Austrian Federal Ministries for Climate Action, Environment, Energy, Mobility, Innova-tion and Technology (BMK) and for Digital and Economic Affairs (BMDW), represented by the Austrian research funding association (FFG), and the federal states of Styria, Upper Austria and Tyrol. One of the authors (MB) appreciates the valuable discussions with Dr. Jyrki Miettinen, University of Oulu, Finland. Kind hospitality of Prof. Patrice Chartrand, Polytechnique Montreal, Canada, during the period of this work is greatly appreciated.
References
[1] M. Wintz, M. Bobadilla, J. Jolivet, Hot cracking during solidification of steel: effect of carbon, sulphur and phosphorus, Rev. M�etall. 91 (1) (1994) 106–114, in French.
[2] E. Schmidtmann, F. Rakoski, Einfluß des Kohlenstoffgehaltes von 0,015 bis 1% und der Gefügestruktur auf das Hochtemperaturfestigkeits- und z€ahigkeitsverhalten von Baust€ahlen nach der Erstarrung aus der Schmelze (Influence of the carbon content of 0.015 to 1% and of the structure on the high-temperature strength and toughness behaviour of structural steels after solidification from the melt), Arch. Eisenhuettenwes. 54 (9) (1983) 357–362, in German.
[3] M. Wolf, W. Kurz, The effect of carbon content on solidification of steel in the continuous casting mold, Metall. Trans. B 12 (1) (1981) 85–93.
[4] H.G. Suzuki, S. Nishimura, Y. Nakamura, Improvement of hot ductility of continuously cast carbon steels, Trans. Iron Steel Inst. Jpn. 24 (1) (1984) 54–59.
[5] X.-M. Chen, S.-H. Song, L.-Q. Weng, S.-J. Liu, K. Wang, Relation of ductile-to-brittle transition temperature to phosphorus grain boundary segregation for a Ti- stabilized interstitial free steel, Mater. Sci. Eng. 528 (28) (2011) 8299–8304.
[6] L. Barb�e, K. Verbeken, E. Wettinck, Effect of the addition of P on the mechanical properties of low alloyed TRIP steels, ISIJ Int. 46 (8) (2006) 1251–1257.
[7] P. Spencer, O. Kubaschewski, A thermodynamic assessment of the iron-phosphorus system, Arch. Eisenhuettenwes. 49 (5) (1978) 225–228.
[8] P. Gustafson, Study of the Thermodynamic Properties of the C-Cu-Fe-P, Fe-Mo-P and Fe-Ni-P Systems, Report IM-2549, Swedish Institute for Metals Research, Stockholm, Sweden, 1990.
[9] J.H. Shim, C.S. Oh, D.N. Lee, Thermodynamic properties and calculation of the Fe- P system, J. Korean Inst. Met. Mater. 34 (11) (1996) 1385–1393, in Korean.
[10] H. Ohtani, N. Hanaya, M. Hasebe, S.-i. Teraoka, M. Abe, Thermodynamic analysis of the Fe–Ti–P ternary system by incorporating first-principles calculations into the CALPHAD approach, Calphad 30 (2) (2006) 147–158.
[11] T. Tokunaga, N. Hanaya, H. Ohtani, M. Hasebe, Thermodynamic analysis of the Fe- Mn-P ternary phase diagram by combining the first-principles and CALPHAD methods, Mater. Sci. Forum 561–565 (2007) 1899–1902.
[12] Z.-M. Cao, K.-P. Wang, Z.-Y. Qiao, G.-W. Du, Thermodynamic reoptimization of the Fe-P system, Acta Phys. Chim. Sin. 28 (1) (2012) 37–43.
[13] J. Miettinen, G. Vassilev, Thermodynamic description of ternary Fe-X-P systems. Part 1: Fe-Cr-P, J. Phase Equilibria Diffus. 35 (4) (2014) 458–468.
[14] A.I. Zaitsev, Z.V. Dobrokhotova, A.D. Litvina, B.M. Mogutnov, Thermodynamic properties and phase equilibria in the Fe-P system, J. Chem. Soc., Faraday Trans. 91 (4) (1995) 703–712.
[15] X.-M. Yang, P.-C. Li, M. Zhang, J.-L. Zhang, J. Zhang, Representation reaction abilities of structural units and related thermodynamic properties in Fe-P binary melts based on the atom-molecule coexistence theory, Steel Res. Int. 85 (3) (2014) 426–460.
[16] P. Gustafson, A thermodynamic evaluation of the Fe-C system, Scand. J. Metall. 14 (5) (1985) 259–267.
[17] J.-H. Shim, C.-S. Oh, D.N. Lee, Thermodynamic assessment of the Fe-C-P system, Z. Metallkd. 91 (2) (2000) 114–120.
[18] M. Bernhard, P. Presoly, N. Fuchs, C. Bernhard, Y.-B. Kang, Experimental Study of High Temperature Phase Equilibria in the Iron-Rich Part of the Fe-P and Fe-C-P Systems, 2020 under revision.
[19] A.D. Pelton, S.A. Degterov, G. Eriksson, C. Robelin, Y. Dessureault, The modified quasichemical model I - Binary solutions, Metall. Mater. Trans. B 31 (4) (2000) 651–659.
[20] A.D. Pelton, P. Chartrand, The modified quasi-chemical model: Part II. Multicomponent solutions, Metall. Mater. Trans. 32 (6) (2001) 1355–1360.
[21] M. Hillert, The compound energy formalism, J. Alloys Compd. 320 (2001) 161–176.
[22] K. Shubhank, Y.-B. Kang, Critical evaluation and thermodynamic optimization of Fe-Cu, Cu-C, Fe-C binary systems and Fe-Cu-C ternary system, Calphad 45 (2014) 127–137.
[23] H. Okamoto, The Fe-P (Iron-Phosphorus) system, Bull. Alloy Phase Diagrams 11 (4) (1990) 404–412.
[24] P. Perrot, Carbon - Iron - Phosphorus: Datasheet from Landolt-B€ornstein - Group IV Physical Chemistry, in: “Iron Systems, Part 2” in Springer Materials, ume 11D2, Springer-Verlag, Berlin Heidelberg, 2008, https://doi.org/10.1007/978-3-540- 74196-1_11.
[25] E. Schürmann, H.P. Kaiser, U. Hensgen, Kalorimetrie und Thermodynamik des Systems Eisen-Phosphor (Calorimetry and Thermodynamics of the System Iron- Phosphorus), Arch. Eisenhuettenwes. 52 (2) (1981) 51–55, in German.
[26] G. Urbain, Activit�e thermodynamique du phosphere dans les alliages fer-phosphore liquides �a 1600 �C, Compt. Rend. 244 (1957) 1036–1039, in French.
[27] G. Urbain, Activit�e du phosphere dissous dans le fer liquide, Mem. Sci. Rev. Metall. 56 (5) (1959) 529–544, in French.
[28] S. Ban-Ya, M. Suzuki, Activity of phosphorus in liquid Fe-P and Fe-P-C alloys, Tetsu-To-Hagane 61 (14) (1975) 2933–2942, in Japanese.
[29] W.A. Fischer, D. Janke, H.-J. Engell, Elektrochemische und elektrische Untersuchungen im System Eisen-Phosphor-Sauerstoff-Kalk. Teil I: die Aktivit€at des Phosphors in Eisen-Phosphor-Schmelzen und die Freie Enthalpie der Phosphorverschlackung (Electrochemical and Electrical Studies in the System Iron- Phosphorus-Oxygen-Lime. Part I: the Activity of Phosphorus in Iron-Phosphorus Melts and the Free Enthalpy of Phosphorus Scorification), Arch. Eisenhuettenw. 37 (11) (1996) 853–862, in German.
[30] S. Ban-Ya, N. Maruyama, S. Fujino, Vapor pressure of phosphorus in liquid Fe-P alloys, Tetsu-To-Hagane 68 (2) (1982) 269–276, in Japanese.
[31] H. Schenck, E. Steinmetz, R. Gohlke, Untersuchungen zur Phosphoraktivit€at im flüssigen Eisen (Investigations on the Activity of Phosphorus in Molten Iron), Arch. Eisenhuettenw. 37 (10) (1966) 775–778, in German.
[32] H. Schenck, E. Steinmetz, H. Gitizad, Die Phosphoraktivit€at im flüssigen Eisen und ihre Beeinflussung durch Nickel, Mangan und Chrom (The Activity of Phosphorus in Molten Iron and its Control by Nickel, Manganese and Chromium), Arch. Eisenhuettenw. 40 (8) (1969) 597–602, in German.
[33] W.A. Roth, A. Meichsner, H. Richter, Ein N€aherungswert für die Bildungsw€arme eines Eisenphosphides [Fe2P], Arch. Eisenhuettenw. 8 (6) (1934) 239–241, in German.
[34] F. Weibke, G. Schrag, Die Bildungsw€armen der niederen Phosphide einiger Schwermetalle, Z. Elektrochem. 47 (3) (1941) 222–238, in German.
[35] G.L. Lewis, C.E. Myers, Vaporization properties of iron phosphides, J. Phys. Chem. 67 (6) (1963) 1289–1292.
M. Bernhard et al.
Calphad 70 (2020) 101795
14
[36] J. Wu, X.-Y. Chong, R. Zhou, Y.-H. Jiang, J. Feng, Structure, stability, mechanical and electronic properties of Fe-P binary compounds by first-principle calculations, RSC Adv. 5 (2015) 81943–81956.
[37] A. Jain, S.P. Ong, G. Hautier, W. Chen, W.D. Richards, S. Dacek, S. Cholia, D. Gunter, D. Skinner, G. Ceder, K.A. Persson, The Materials Project: a materials genome approach to accelerating materials innovation, Apl. Mater. 1 (1) (2013), 011002.
[38] B. Hallstedt, D. Djurovic, J. von Appen, R. Dronskowski, A. Dick, F. K€ormann, T. Hickel, J. Neugebauer, Thermodynamic properties of cementite (Fe3C), Calphad 34 (1) (2010) 129–133.
[39] F. Claeyssens, J.N. Hart, N.L. Allan, J.M. Oliva, Solid phases of phosphorus carbide: an ab initio study, Phys. Rev. B 79 (13) (2009), 134115.
[40] B. Saklatwalla, Constitution of the iron and phosphorus compounds, J. Iron Steel Inst. 77 (1908) 92–103.
[41] N. Konstantinow, Über die Phosphide des Eisens, Z. Anorg. Chem. 66 (1910) 209–227, in German.
[42] J.L. Houghton, Alloys of iron research: Part VIII.-Constitution of alloys of iron and phosphorus, J. Iron Steel Inst. 115 (1927) 417–433.
[43] P. Roquet, G. Jegaden, Contribution �a l’�etude du diagramme fer-phosphore: etude de l’essai dit du grain de phosphore, Rev. M�etall. 48 (9) (1951) 712–721, in French.
[44] K. Lorenz, H. Fabritius, Anwendung der magnetischen Waage zur Aufstellung von Zustandsschaubildern im Bereich des festen Zustandes eisenreicher Systeme: untersuchung am System Eisen-Phosphor, Arch. Eisenhuettenw. 33 (4) (1962) 269–275, in German.
[45] W.A. Fischer, K. Lorenz, H. Fabritius, A. Hoffmann, G. Kalwa, Untersuchung von Phasenumwandlungen in reinen Eisenlegierungen mit der magnetischen Waage (Investigation of phase transformations in pure iron alloys with a magnetic balance), Arch. Eisenhuettenw. 37 (1) (1966) 79–86, in German.
[46] E. Wachtel, G. Urbain, E. Übelacker, �Etude du diagramme fer-phosphore par analyse magn�etique et thermique, Compt. Rend. 257 (1963) 2470–2472, in French.
[47] H. Kaneko, T. Nishizawa, K. Tamaki, A. Tanifuji, Solubility of phosphorus in alpha- Fe and gamma-Fe, Nippon Kinzoku Gakkaishi 29 (1965) 166–170, in Japanese.
[48] A.S. Doan, J.I. Goldstein, The ternary phase diagram, Fe-Ni-P, Metall. Trans. 1 (6) (1970) 1759–1767.
[49] M. Ko, T. Nishizawa, Effect of magnetic transition on the solubility of alloying elements in alpha iron, J. Jpn. Inst. Metals 43 (2) (1979) 118–126.
[50] E. Schürmann, Beitrag zu den Schmelzgleichgewichten der Eisen-Aluminium- und Eisen-Phosphor-Legierungen (On the Melting Equilibria of the Iron-Aluminium and Iron-Phosphorus Alloys), Arch. Eisenhuettenw. 51 (8) (1980) 325–327, in German.
[51] Z.I. Morita, T. Tanaka, Equilibrium distribution coefficient of phosphorus in iron alloys, Trans. Iron Steel Inst. Jpn. 26 (1986) 114–120.
[52] M.G. Frohberg, J.F. Elliott, H.G. Hadrys, Beitrag zur Thermodynamik von Mehrstoffl€osungen am Beispiel homogener Eisen-Chrom-Phosphor-Kohlenstoff- Schmelzen (Contribution to the study of the thermodynamics of complex solutions shown by the example of homogeneous iron-chromium-phosphorus-carbon melts), Arch. Eisenhuettenw. 39 (8) (1968) 587–593, in German.
[53] H.G. Hadrys, M.G. Frohberg, J.F. Elliott, Activities in the liquid Fe-Cr-C(sat), Fe-P-C (sat) and Fe-Cr-P systems at 1600�C, Metall. Trans. 1 (7) (1970) 1867–1874.
[54] H. Schenck, E. Steinmetz, R. Gohlke, Beitrag zur chemischen Aktivit€at der Elemente Phosphor, Schwefel, Silizium, Kupfer und Chrom in flüssigen kohlenstoffges€attigten Eisenl€osungen (Contribution to the study of the chemical activity of the elements phosphorus, sulphur, silicon, copper and chromium in molten iron solutions saturated with carbon, Arch. Eisenhuettenw. 37 (12) (1966) 919–924, in German.
[55] Y.-D. Yang, Interaction coefficients in Fe-C-P ternary and Fe-Cr-C-P quaternary solutions at 1400�C, Scand. J. Metall. 21 (1992) 194–201.
[56] E.T. Turkdogan, L.E. Leake, Thermodynamics of carbon dissolved in iron alloys. Part I: solubility of carbon in iron-phosphorus, iron-silicon, and iron-manganese melts, J. Iron Steel Inst. 179 (1955) 39–43.
[57] E. Schürmann, D. Kramer, Untersuchungen über den Einfluss der Temperatur und über die €aquivalente Wirkung der Legierungselemente auf die Kohlenstoffl€oslichkeit in eisenreichen, kohlenstoffges€attigten Drei- und Mehrstoffschmelzen, Giessereiforschung 21 (1) (1969) 29–42, in German.
[58] R. Vogel, Ueber das System Eisen-Phosphor-Kohlenstoff, Arch. Eisenhuettenw. 3 (5) (1929) 369–381, in German.
[59] T. Ohide, G. Ohira, The solidification structures of iron-carbon-phosphorus ternary Alloys, Br. Foundryman 68 (1975) 106–115.
[60] E. Schürmann, U. Hensgen, J. Schweinichen, Schmelzgleichgewichte der tern€aren Systeme Eisen-Kohlenstoff-Silicium und Eisen-Kohlenstoff-Phosphor (Melting equilibrium of the ternary systems iron-carbon-silicon and iron-carbon- phosphorus), Giessereiforschung 36 (4) (1984) 121–129, in German.
[61] G. Langenscheid, H.A. Mathesius, F.K. Naumann, Anwendung des quantitativen Fernsehmikroskopes und der Elektronenstrahlmikrosonde für die Untersuchung des Systems Eisen-Kohlenstoff-Phosphor bei 900 bis 1000 �C (Use of the quantitative television microscope and of the electron beam microprobe for examining the system iron-carbon-phosphorus at 900 to 1000 �C), Arch. Eisenhuettenw. 41 (8) (1970) 817–824, in German.
[62] H.P. Hofmann, K. L€ohberg, W. Reif, Über die L€oslichkeit des Phosphors in Eisen und Eisen-Kohlenstoff-Legierungen unterhalb 1000 �C (On the solubility of phosphorus in iron and iron-carbon alloys), Arch. Eisenhuettenw. 41 (10) (1970) 975–982, in German.
[63] T. Nishizawa, unpublished work, cited in the work of Gustafson [8] and Shim et al. [17].
[64] C.W. Bale, E. B�elisle, P. Chartrand, S.A. Decterov, G. Eriksson, A.E. Gheribi, K. Hack, I.-H. Jung, Y.-B. Kang, J. Melançon, A.D. Pelton, S. Petersen, C. Robelin, J. Sangster, P. Spencer, M.-A. van Ende, FactSage thermochemical software and databases, Calphad 54 (2010–2016) 35–53, 2016.
[65] A.T. Dinsdale, SGTE Data for pure elements, Calphad 15 (4) (1991) 317–425. [66] A.D. Pelton, M. Blander, Thermodynamic analysis of ordered liquid solutions by a
modified quasichemical approach - application to silicate slags, Metall. Trans. B 17 (4) (1986) 805–815.
[67] A.D. Pelton, Y.-B. Kang, Modeling short-range ordering in solutions, Int. J. Mater. Res. 98 (10) (2007) 907–917.
[68] M. Hillert, M. Jarl, A model for alloying effects in ferromagnetic metals, Calphad 2 (3) (1978) 227–238.
[69] G. Kresse, Hafner, Ab initio molecular dynamics for liquid metals, Phys. Rev. B 47 (1) (1993) 558–561.
[70] G. Kresse, Hafner, Ab initio molecular-dynamics simulation of the liquid-metal- amorphous-semiconductor transition in germanium, Phys. Rev. B 49 (20) (1994) 14251–14269.
[71] G. Kresse, J. Furthmüller, Efficiency of ab-initio total energy calculations for metals and semiconductors using a plane-wave basis set, Comput. Mater. Sci. 6 (1) (1996) 15–50.
[72] G. Kresse, J. Furthmüller, Efficient iterative schemes for ab initio total-energy calculations using a plane-wave basis set, Phys. Rev. B 54 (16) (1996) 11169–11186.
[73] P.E. Bl€ochl, Projector augmented-wave method, Phys. Rev. B 50 (24) (1994) 17953–17979.
[74] G. Kresse, D. Joubert, From ultrasoft pseudopotentials to the projector augmented- wave method, Phys. Rev. B 59 (3) (1999) 1758–1775.
[75] J.P. Perdew, K. Burke, M. Ernzerhof, Generalized gradient approximation made simple, Phys. Rev. Lett. 77 (18) (1996) 3865–3868.
[76] J.P. Perdew, K. Burke, M. Ernzerhof, Generalized gradient approximation made simple [phys. Rev. Lett. 77, 3865, Phys. Rev. Lett. 78 (7) (1996) 1396, 1997.
[77] M.W. Chase, NIST-JANAF thermochemical tables, J. Phys. Chem. Ref. Data 9 (1998) 1–1951. Fourth Edition.
[78] P. Presoly, R. Pierer, C. Bernhard, Identification of defect prone peritectic steel grades by analyzing high-temperature phase transformations, Metall. Mater. Trans. 44 (12) (2013) 5377–5388.
[79] P. Presoly, M. Bernhard, C. Bernhard, S. Hahn, P. Pennerstorfer, S. Ilie, J. Six, High precious phase diagrams – a roadmap for a successful casting processing. Proceedings of the 4th European Steel Technology and Application Days (ESTAD), Steel Institute VDEh, Duesseldorf, Germany, 2019.
[80] G. K. Sigworth and J. F. Elliott, The thermodynamics of liquid dilute iron alloys, Met. Sci., 8, 298-310.
[81] C.H.P. Lupis, Chemical Thermodynamics of Materials, Elsevier Science Publishing Co. Inc., New York NY, USA, 1983.
M. Bernhard et al.
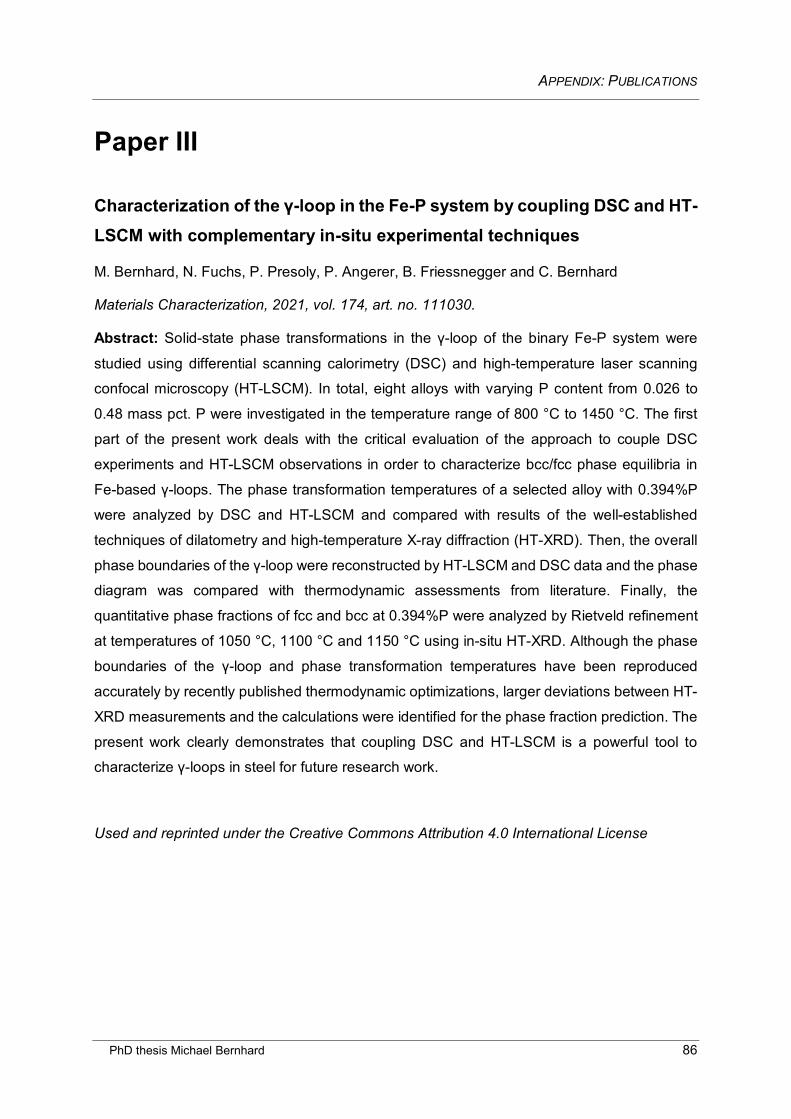
APPENDIX: PUBLICATIONS
PhD thesis Michael Bernhard 86
Paper III
Characterization of the γ-loop in the Fe-P system by coupling DSC and HT-LSCM with complementary in-situ experimental techniques
M. Bernhard, N. Fuchs, P. Presoly, P. Angerer, B. Friessnegger and C. Bernhard
Materials Characterization, 2021, vol. 174, art. no. 111030.
Abstract: Solid-state phase transformations in the γ-loop of the binary Fe-P system were
studied using differential scanning calorimetry (DSC) and high-temperature laser scanning
confocal microscopy (HT-LSCM). In total, eight alloys with varying P content from 0.026 to
0.48 mass pct. P were investigated in the temperature range of 800 °C to 1450 °C. The first
part of the present work deals with the critical evaluation of the approach to couple DSC
experiments and HT-LSCM observations in order to characterize bcc/fcc phase equilibria in
Fe-based γ-loops. The phase transformation temperatures of a selected alloy with 0.394%P
were analyzed by DSC and HT-LSCM and compared with results of the well-established
techniques of dilatometry and high-temperature X-ray diffraction (HT-XRD). Then, the overall
phase boundaries of the γ-loop were reconstructed by HT-LSCM and DSC data and the phase
diagram was compared with thermodynamic assessments from literature. Finally, the
quantitative phase fractions of fcc and bcc at 0.394%P were analyzed by Rietveld refinement
at temperatures of 1050 °C, 1100 °C and 1150 °C using in-situ HT-XRD. Although the phase
boundaries of the γ-loop and phase transformation temperatures have been reproduced
accurately by recently published thermodynamic optimizations, larger deviations between HT-
XRD measurements and the calculations were identified for the phase fraction prediction. The
present work clearly demonstrates that coupling DSC and HT-LSCM is a powerful tool to
characterize γ-loops in steel for future research work.
Used and reprinted under the Creative Commons Attribution 4.0 International License
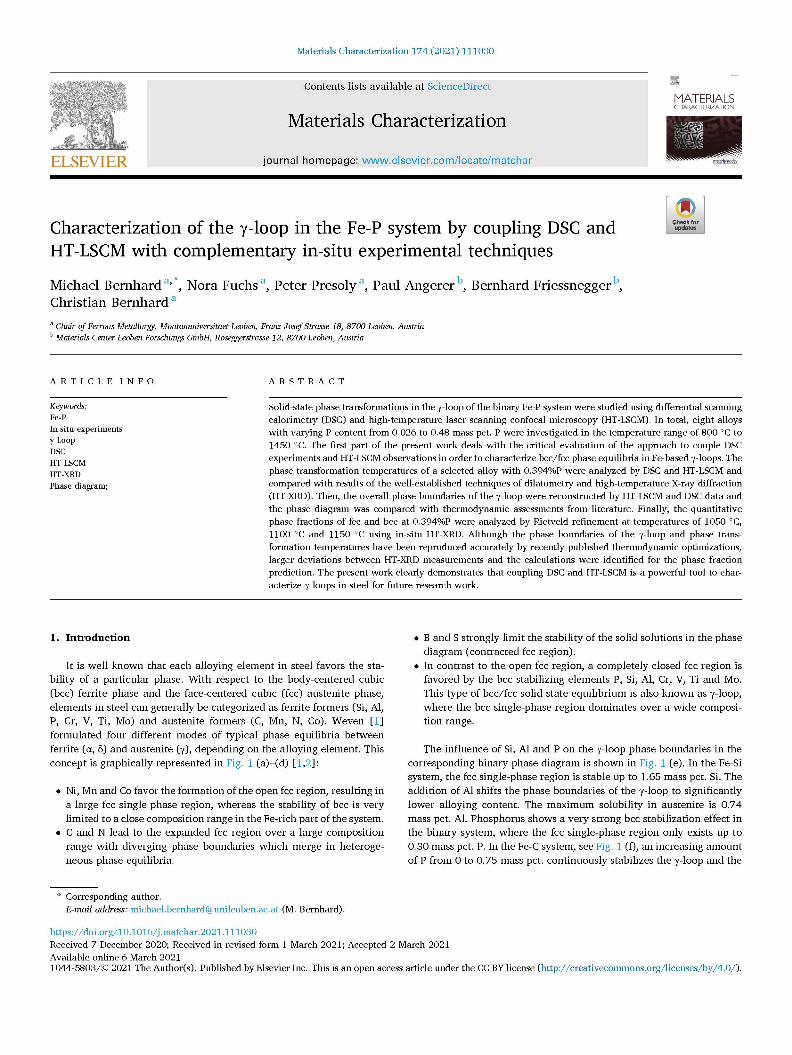
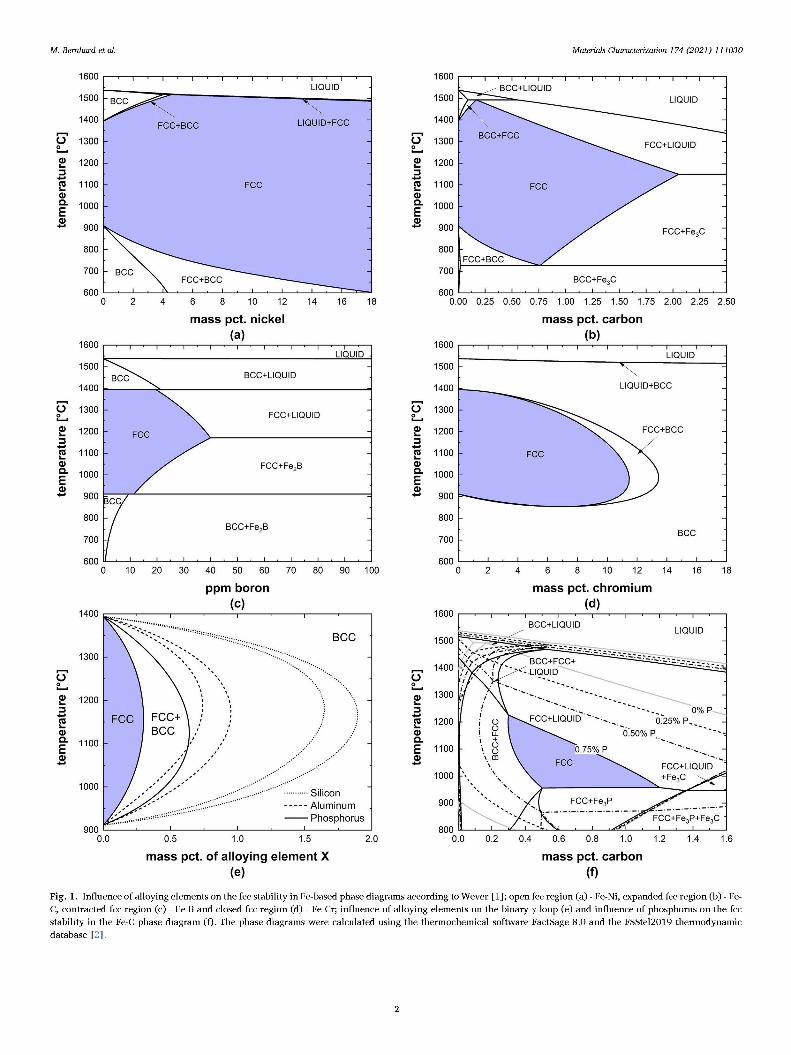
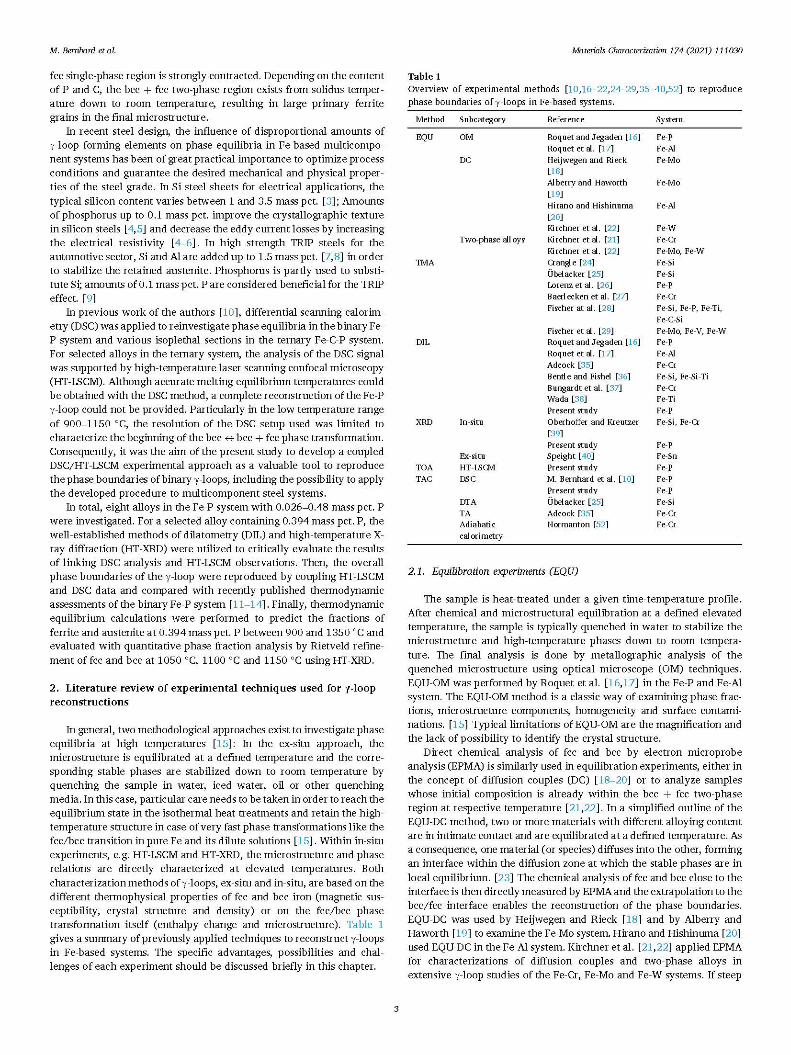
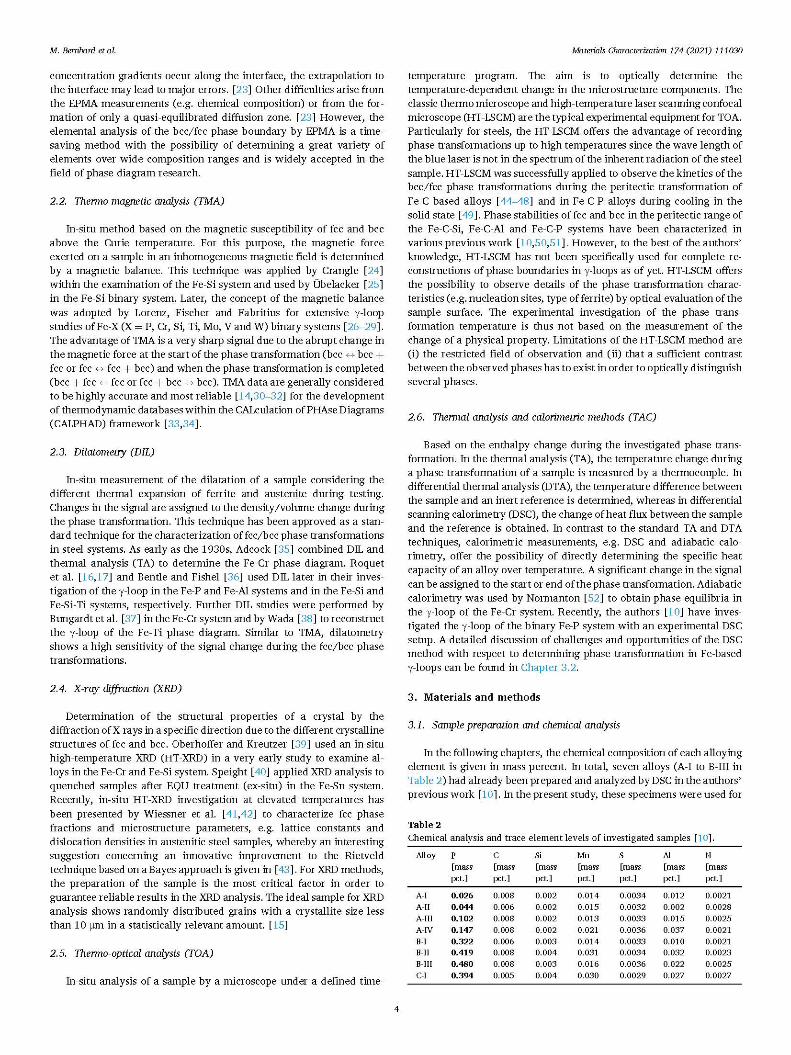
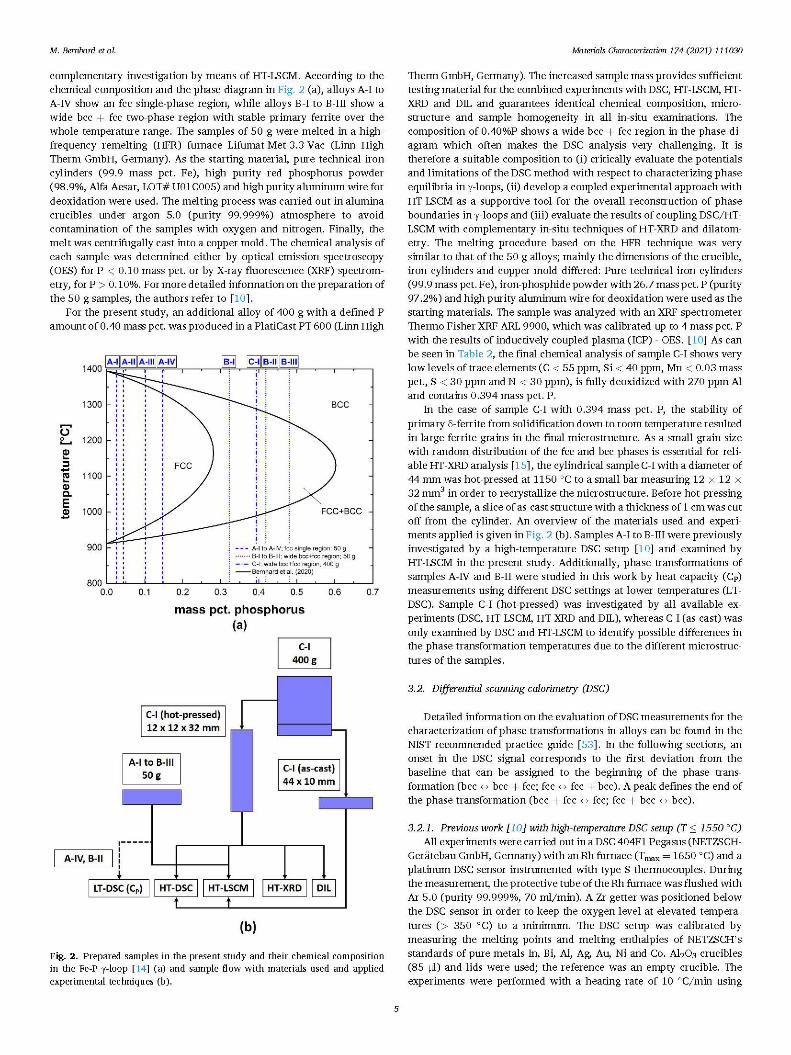
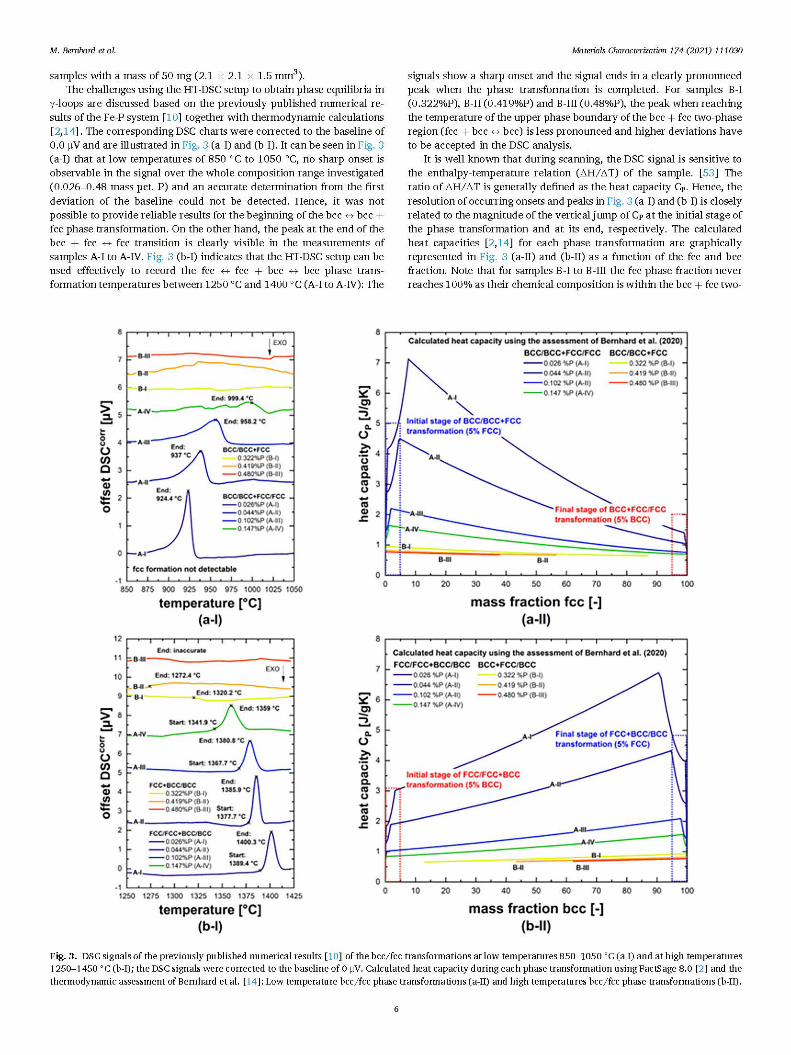
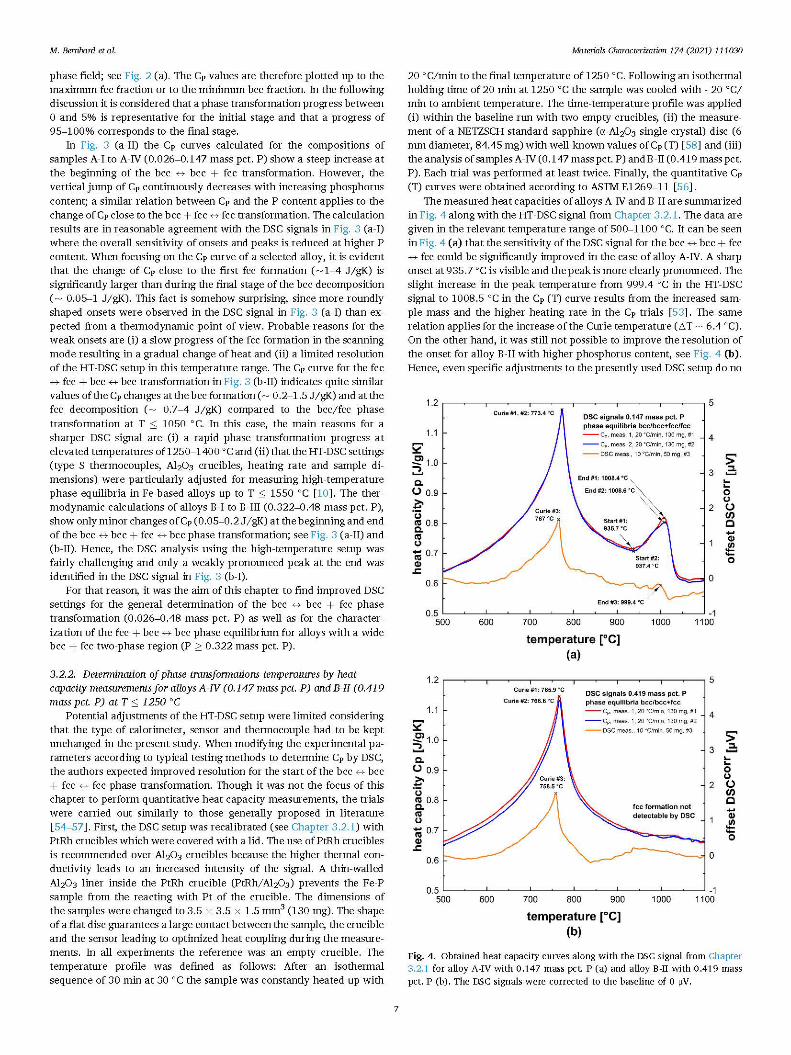
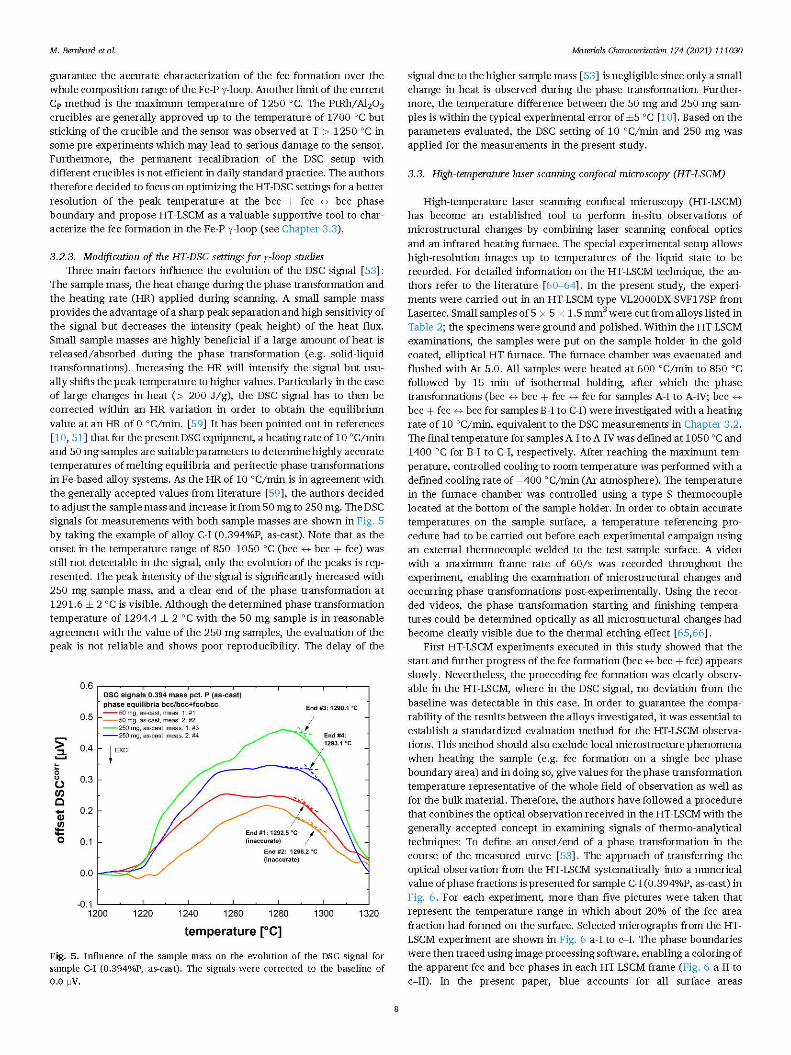
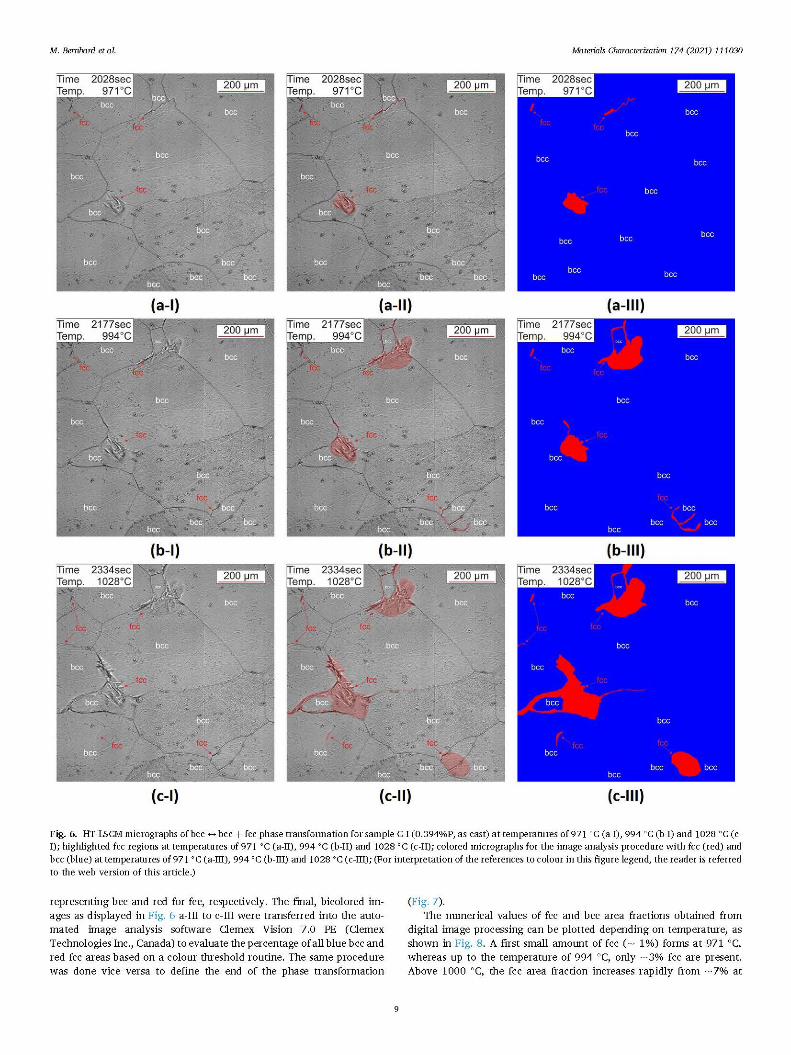
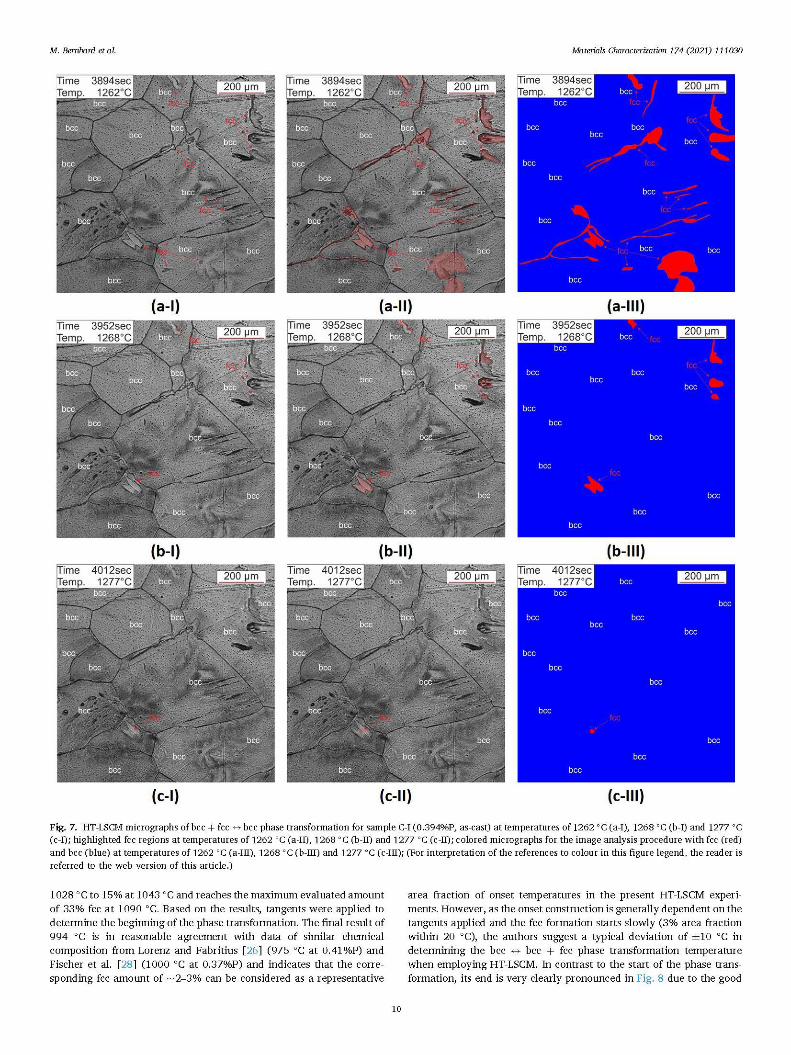
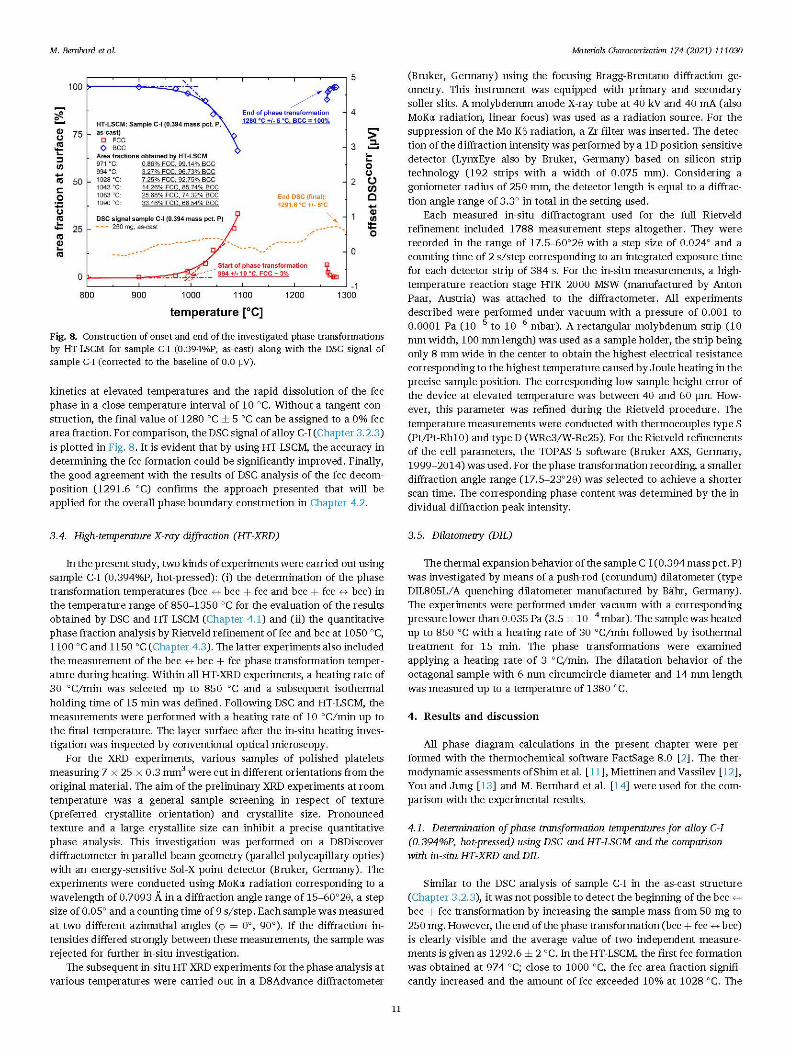
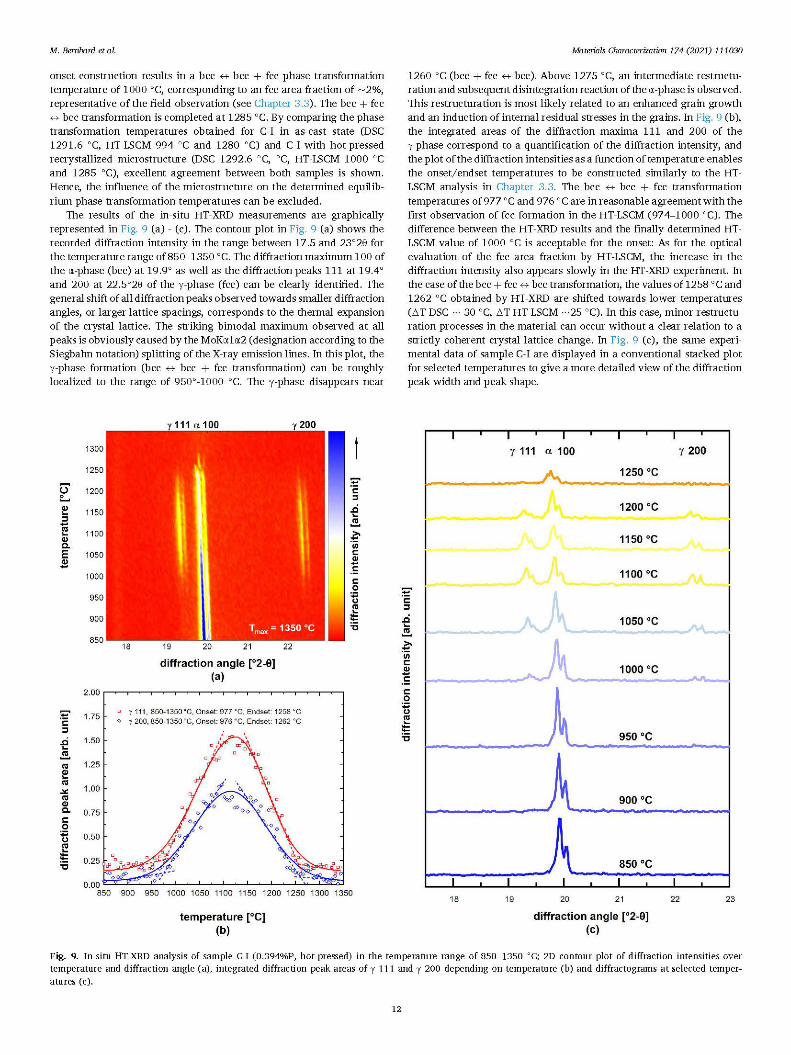
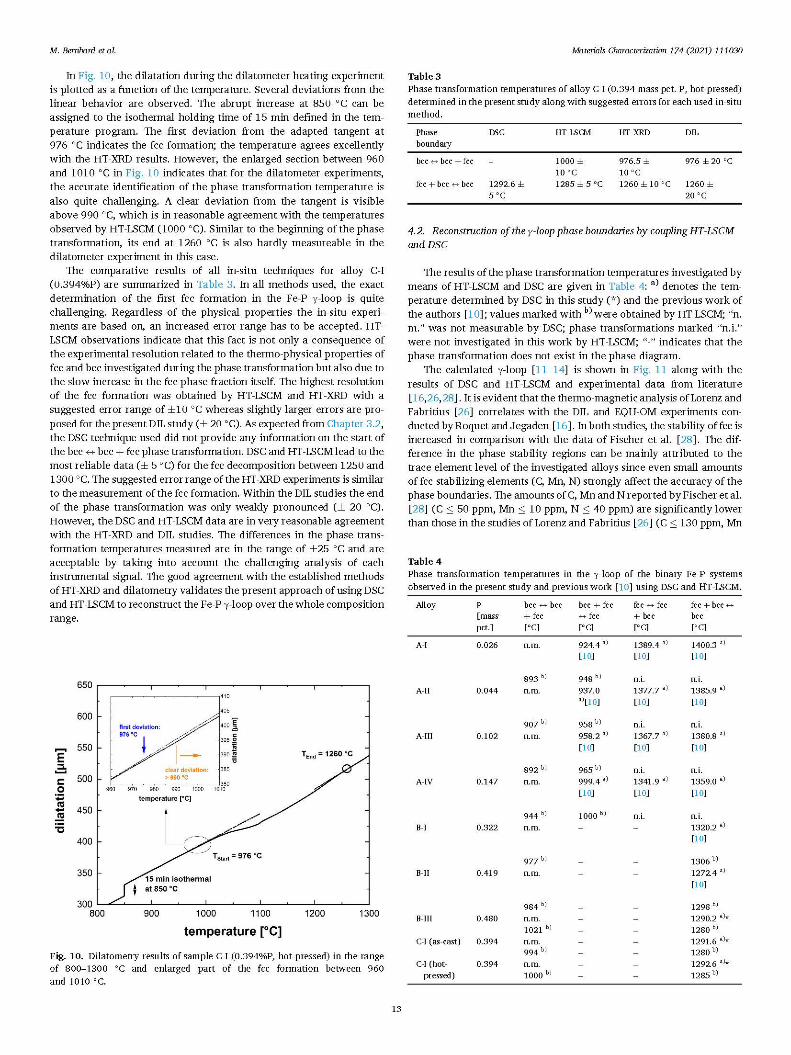
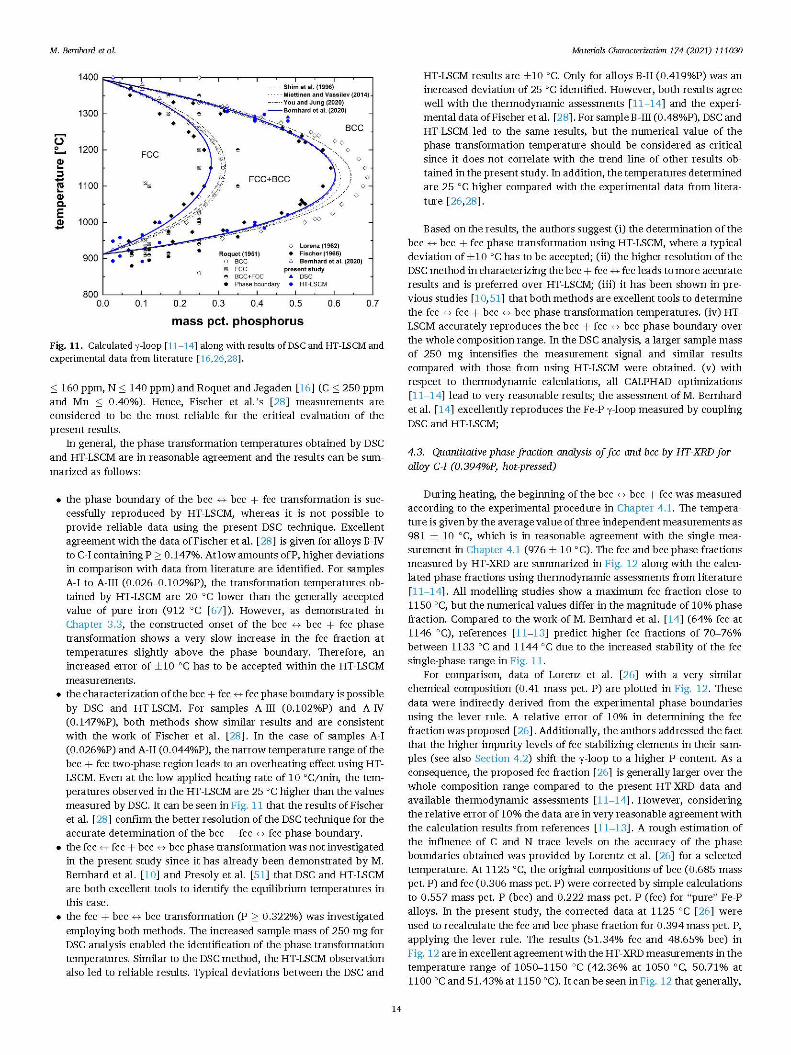
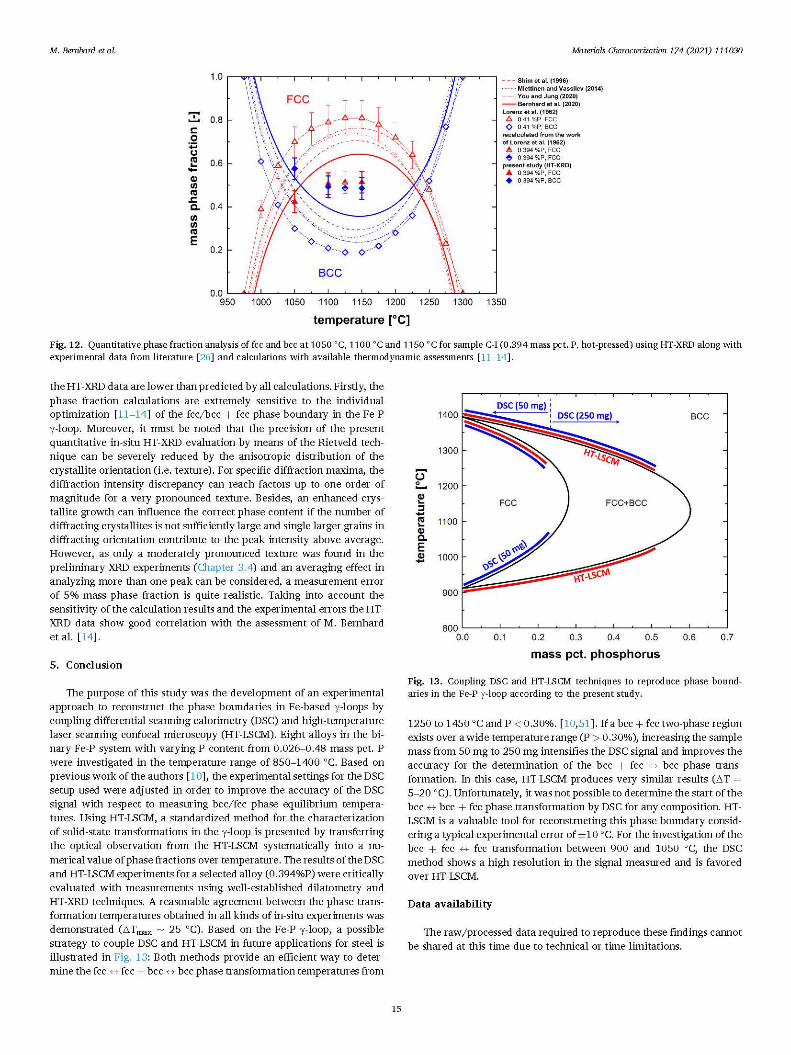
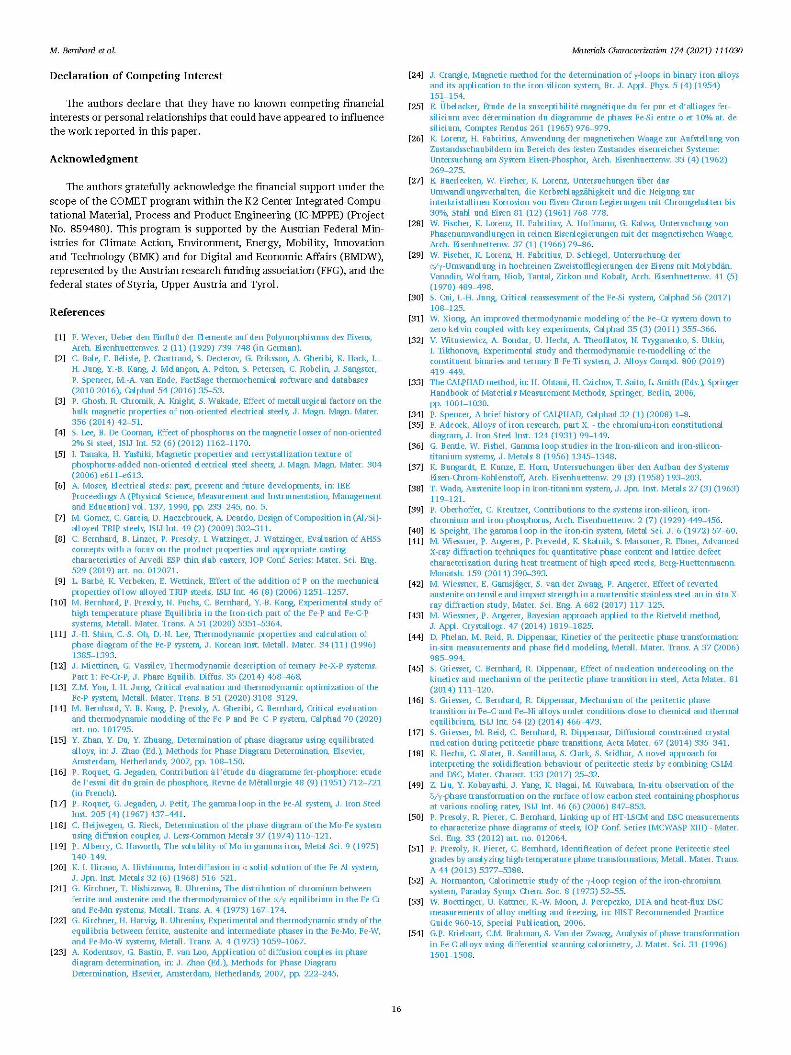
APPENDIX: PUBLICATIONS
PhD thesis Michael Bernhard. 87
Paper IV
An assessment of analytical liquidus equations for Fe-C-Si-Mn-Al-P alloyed steels using DSC/DTA techniques
M. Bernhard, P. Presoly, C. Bernhard, S. Hahn and S. Ilie
Metallurgical and Materials Transactions B, 2021.
Abstract: Analytical liquidus equations were evaluated using differential scanning calorimetry
(DSC) and differential thermal 11 analysis (DTA). Results of 180 measurements in the Fe-C-
Si-Mn-Al-P subsystems were considered, where the 12 experimental methodology was
demonstrated for four alloys in the Fe-Si-Mn-Al system. Excellent agreement between 13 the
DSC/DTA dataset and the most recently published equation was found (error 2.1 ± 1.6 °C).
For this equation, 14 suggested modifications of phosphorus parameters will help to improve
calculations for P-alloyed steels.
Used and reprinted under the Creative Commons Attribution 4.0 International License
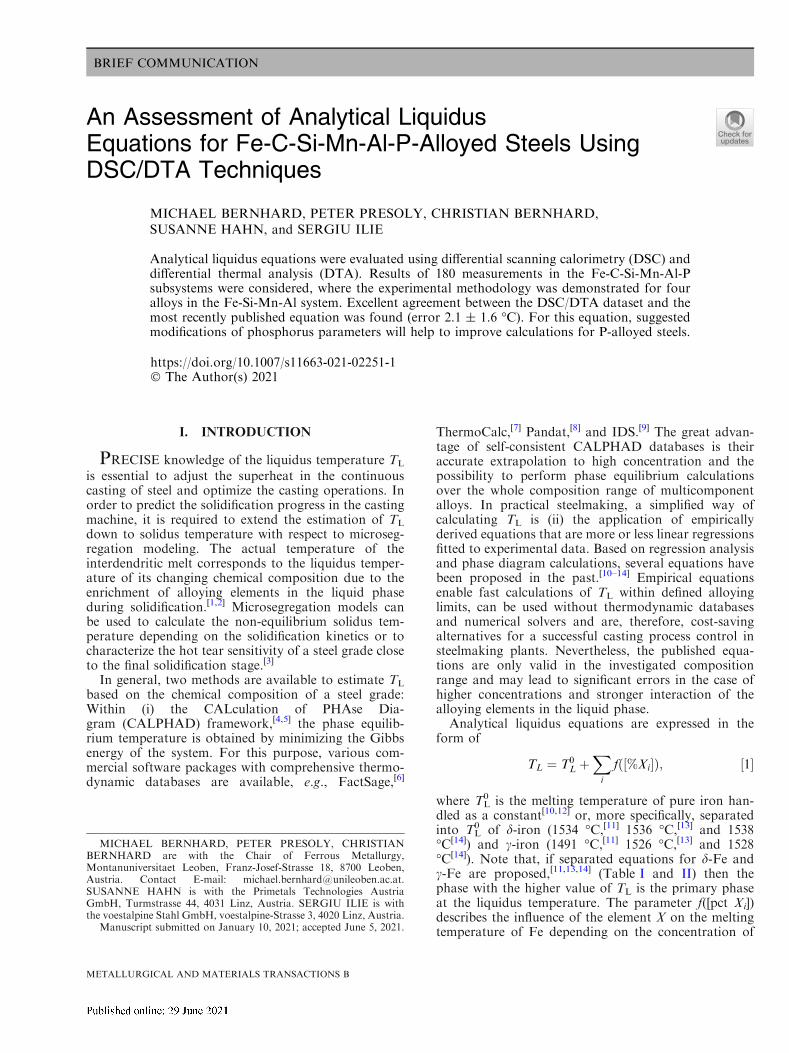
BRIEF COMMUNICATION
An Assessment of Analytical LiquidusEquations for Fe-C-Si-Mn-Al-P-Alloyed Steels UsingDSC/DTA Techniques
MICHAEL BERNHARD, PETER PRESOLY, CHRISTIAN BERNHARD,SUSANNE HAHN, and SERGIU ILIE
Analytical liquidus equations were evaluated using differential scanning calorimetry (DSC) anddifferential thermal analysis (DTA). Results of 180 measurements in the Fe-C-Si-Mn-Al-Psubsystems were considered, where the experimental methodology was demonstrated for fouralloys in the Fe-Si-Mn-Al system. Excellent agreement between the DSC/DTA dataset and themost recently published equation was found (error 2.1 ± 1.6 �C). For this equation, suggestedmodifications of phosphorus parameters will help to improve calculations for P-alloyed steels.
https://doi.org/10.1007/s11663-021-02251-1� The Author(s) 2021
I. INTRODUCTION
PRECISE knowledge of the liquidus temperature TL
is essential to adjust the superheat in the continuouscasting of steel and optimize the casting operations. Inorder to predict the solidification progress in the castingmachine, it is required to extend the estimation of TL
down to solidus temperature with respect to microseg-regation modeling. The actual temperature of theinterdendritic melt corresponds to the liquidus temper-ature of its changing chemical composition due to theenrichment of alloying elements in the liquid phaseduring solidification.[1,2] Microsegregation models canbe used to calculate the non-equilibrium solidus tem-perature depending on the solidification kinetics or tocharacterize the hot tear sensitivity of a steel grade closeto the final solidification stage.[3]
In general, two methods are available to estimate TL
based on the chemical composition of a steel grade:Within (i) the CALculation of PHAse Dia-gram (CALPHAD) framework,[4,5] the phase equilib-rium temperature is obtained by minimizing the Gibbsenergy of the system. For this purpose, various com-mercial software packages with comprehensive thermo-dynamic databases are available, e.g., FactSage,[6]
ThermoCalc,[7] Pandat,[8] and IDS.[9] The great advan-tage of self-consistent CALPHAD databases is theiraccurate extrapolation to high concentration and thepossibility to perform phase equilibrium calculationsover the whole composition range of multicomponentalloys. In practical steelmaking, a simplified way ofcalculating TL is (ii) the application of empiricallyderived equations that are more or less linear regressionsfitted to experimental data. Based on regression analysisand phase diagram calculations, several equations havebeen proposed in the past.[10–14] Empirical equationsenable fast calculations of TL within defined alloyinglimits, can be used without thermodynamic databasesand numerical solvers and are, therefore, cost-savingalternatives for a successful casting process control insteelmaking plants. Nevertheless, the published equa-tions are only valid in the investigated compositionrange and may lead to significant errors in the case ofhigher concentrations and stronger interaction of thealloying elements in the liquid phase.Analytical liquidus equations are expressed in the
form of
TL ¼ T0L þ
X
i
f %Xi½ �ð Þ; ½1�
where TL0 is the melting temperature of pure iron han-
dled as a constant[10,12] or, more specifically, separatedinto TL
0 of d-iron (1534 �C,[11] 1536 �C,[13] and 1538�C[14]) and c-iron (1491 �C,[11] 1526 �C,[13] and 1528�C[14]). Note that, if separated equations for d-Fe andc-Fe are proposed,[11,13,14] (Table I and II) then thephase with the higher value of TL is the primary phaseat the liquidus temperature. The parameter f([pct Xi])describes the influence of the element X on the meltingtemperature of Fe depending on the concentration of
MICHAEL BERNHARD, PETER PRESOLY, CHRISTIANBERNHARD are with the Chair of Ferrous Metallurgy,Montanuniversitaet Leoben, Franz-Josef-Strasse 18, 8700 Leoben,Austria. Contact E-mail: [email protected] HAHN is with the Primetals Technologies AustriaGmbH, Turmstrasse 44, 4031 Linz, Austria. SERGIU ILIE is withthe voestalpine Stahl GmbH, voestalpine-Strasse 3, 4020 Linz, Austria.
Manuscript submitted on January 10, 2021; accepted June 5, 2021.
METALLURGICAL AND MATERIALS TRANSACTIONS B
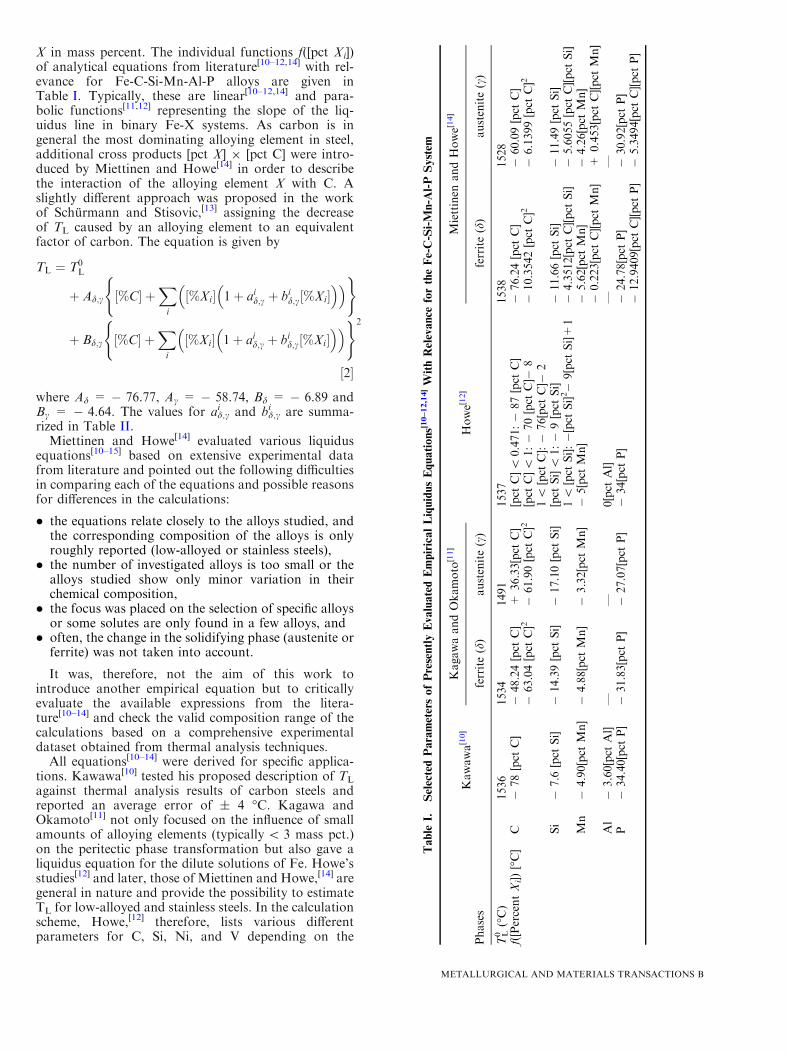
X in mass percent. The individual functions f([pct Xi])of analytical equations from literature[10–12,14] with rel-evance for Fe-C-Si-Mn-Al-P alloys are given inTable I. Typically, these are linear[10–12,14] and para-bolic functions[11,12] representing the slope of the liq-uidus line in binary Fe-X systems. As carbon is ingeneral the most dominating alloying element in steel,additional cross products [pct X] 9 [pct C] were intro-duced by Miettinen and Howe[14] in order to describethe interaction of the alloying element X with C. Aslightly different approach was proposed in the workof Schurmann and Stisovic,[13] assigning the decreaseof TL caused by an alloying element to an equivalentfactor of carbon. The equation is given by
TL ¼ T0L
þ Ad;c %C½ � þX
i
%Xi½ � 1þ aid;c þ bid;c %Xi½ �� �� �( )
þ Bd;c %C½ � þX
i
%Xi½ � 1þ aid;c þ bid;c %Xi½ �� �� �( )2
½2�
where Ad = � 76.77, Ac = � 58.74, Bd = � 6.89 andBc = � 4.64. The values for ad,c
i and bd,ci are summa-
rized in Table II.Miettinen and Howe[14] evaluated various liquidus
equations[10–15] based on extensive experimental datafrom literature and pointed out the following difficultiesin comparing each of the equations and possible reasonsfor differences in the calculations:
� the equations relate closely to the alloys studied, andthe corresponding composition of the alloys is onlyroughly reported (low-alloyed or stainless steels),
� the number of investigated alloys is too small or thealloys studied show only minor variation in theirchemical composition,
� the focus was placed on the selection of specific alloysor some solutes are only found in a few alloys, and
� often, the change in the solidifying phase (austenite orferrite) was not taken into account.
It was, therefore, not the aim of this work tointroduce another empirical equation but to criticallyevaluate the available expressions from the litera-ture[10–14] and check the valid composition range of thecalculations based on a comprehensive experimentaldataset obtained from thermal analysis techniques.
All equations[10–14] were derived for specific applica-tions. Kawawa[10] tested his proposed description of TL
against thermal analysis results of carbon steels andreported an average error of ± 4 �C. Kagawa andOkamoto[11] not only focused on the influence of smallamounts of alloying elements (typically< 3 mass pct.)on the peritectic phase transformation but also gave aliquidus equation for the dilute solutions of Fe. Howe’sstudies[12] and later, those of Miettinen and Howe,[14] aregeneral in nature and provide the possibility to estimateTL for low-alloyed and stainless steels. In the calculationscheme, Howe,[12] therefore, lists various differentparameters for C, Si, Ni, and V depending on the
Table
I.SelectedParametersofPresentlyEvaluatedEmpiricalLiquidusEquations[10–12,14]WithRelevance
fortheFe-C-Si-Mn-A
l-P
System
Kawawa[10]
KagawaandOkamoto
[11]
Howe[12]
Miettinen
andHowe[14]
Phases
—ferrite(d)
austenite(c)
—ferrite(d)
austenite(c)
TL0(�C)
1536
1534
1491
1537
1538
1528
f([PercentXi])
[�C]
C�
78[pct
C]
�48.24[pct
C]
+36.33[pct
C]
[pct
C]<
0.471:�
87[pct
C]
�76.24[pct
C]
�60.09[pct
C]
�63.04[pct
C]2
�61.90[pct
C]2
[pct
C]<
1:�
70[pct
C]�
8�
10.3542[pct
C]2
�6.1399[pct
C]2
1<
[pct
C]:�
76[pct
C]�
2Si
�7.6
[pct
Si]
�14.39[pct
Si]
�17.10[pct
Si]
[pct
Si]<
1:�
9[pct
Si]
�11.66[pct
Si]
�11.49[pct
Si]
1<
[pct
Si]:�[pct
Si]2�
9[pct
Si]+
1�
4.3512[pct
C][pct
Si]
�5.6055[pct
C][pct
Si]
Mn
�4.90[pct
Mn]
�4.88[pct
Mn]
�3.32[pct
Mn]
�5[pct
Mn]
�5.62[pct
Mn]
�4.26[pct
Mn]
�0.223[pct
C][pct
Mn]
+0.453[pct
C][pct
Mn]
Al
�3.60[pct
Al]
——
0[pct
Al]
——
P�
34.40[pct
P]
�31.83[pct
P]
�27.07[pct
P]
�34[pct
P]
�24.78[pct
P]
�30.92[pct
P]
�12.9409[pct
C][pct
P]
�5.3494[pct
C][pct
P]
METALLURGICAL AND MATERIALS TRANSACTIONS B
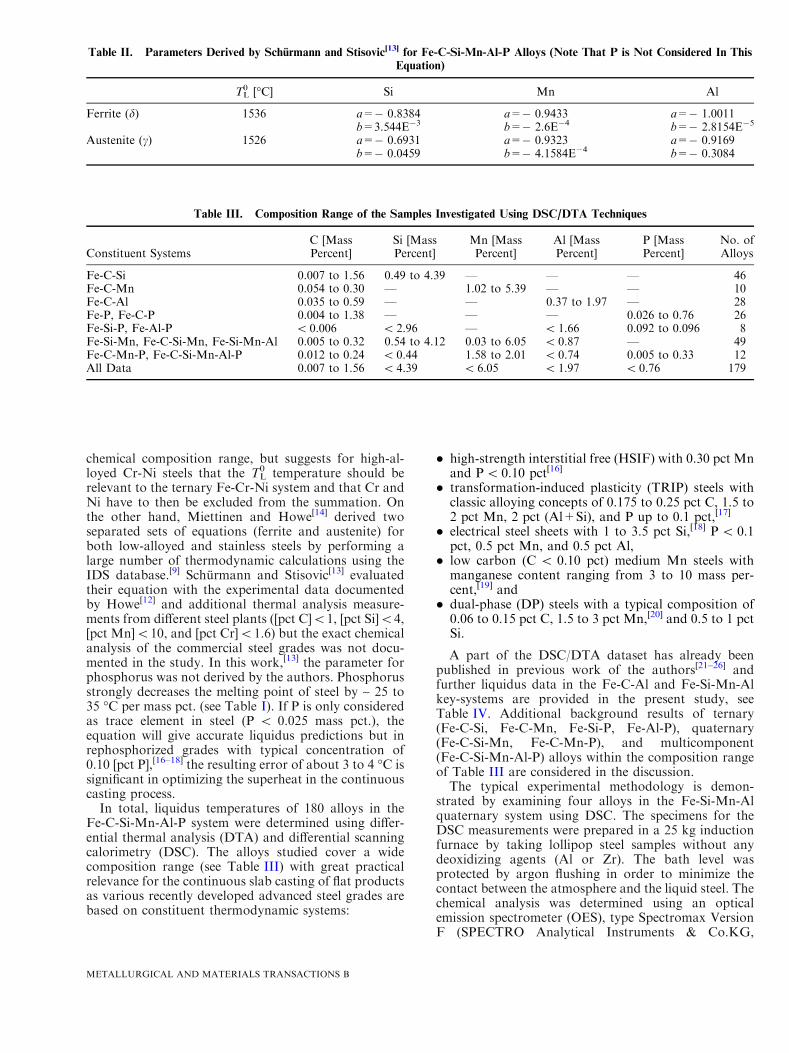
chemical composition range, but suggests for high-al-loyed Cr-Ni steels that the TL
0 temperature should berelevant to the ternary Fe-Cr-Ni system and that Cr andNi have to then be excluded from the summation. Onthe other hand, Miettinen and Howe[14] derived twoseparated sets of equations (ferrite and austenite) forboth low-alloyed and stainless steels by performing alarge number of thermodynamic calculations using theIDS database.[9] Schurmann and Stisovic[13] evaluatedtheir equation with the experimental data documentedby Howe[12] and additional thermal analysis measure-ments from different steel plants ([pct C]<1, [pct Si]<4,[pct Mn]<10, and [pct Cr]<1.6) but the exact chemicalanalysis of the commercial steel grades was not docu-mented in the study. In this work,[13] the parameter forphosphorus was not derived by the authors. Phosphorusstrongly decreases the melting point of steel by ~ 25 to35 �C per mass pct. (see Table I). If P is only consideredas trace element in steel (P < 0.025 mass pct.), theequation will give accurate liquidus predictions but inrephosphorized grades with typical concentration of0.10 [pct P],[16–18] the resulting error of about 3 to 4 �C issignificant in optimizing the superheat in the continuouscasting process.
In total, liquidus temperatures of 180 alloys in theFe-C-Si-Mn-Al-P system were determined using differ-ential thermal analysis (DTA) and differential scanningcalorimetry (DSC). The alloys studied cover a widecomposition range (see Table III) with great practicalrelevance for the continuous slab casting of flat productsas various recently developed advanced steel grades arebased on constituent thermodynamic systems:
� high-strength interstitial free (HSIF) with 0.30 pct Mnand P< 0.10 pct[16]
� transformation-induced plasticity (TRIP) steels withclassic alloying concepts of 0.175 to 0.25 pct C, 1.5 to2 pct Mn, 2 pct (Al+Si), and P up to 0.1 pct,[17]
� electrical steel sheets with 1 to 3.5 pct Si,[18] P< 0.1pct, 0.5 pct Mn, and 0.5 pct Al,
� low carbon (C < 0.10 pct) medium Mn steels withmanganese content ranging from 3 to 10 mass per-cent,[19] and
� dual-phase (DP) steels with a typical composition of0.06 to 0.15 pct C, 1.5 to 3 pct Mn,[20] and 0.5 to 1 pctSi.
A part of the DSC/DTA dataset has already beenpublished in previous work of the authors[21–26] andfurther liquidus data in the Fe-C-Al and Fe-Si-Mn-Alkey-systems are provided in the present study, seeTable IV. Additional background results of ternary(Fe-C-Si, Fe-C-Mn, Fe-Si-P, Fe-Al-P), quaternary(Fe-C-Si-Mn, Fe-C-Mn-P), and multicomponent(Fe-C-Si-Mn-Al-P) alloys within the composition rangeof Table III are considered in the discussion.The typical experimental methodology is demon-
strated by examining four alloys in the Fe-Si-Mn-Alquaternary system using DSC. The specimens for theDSC measurements were prepared in a 25 kg inductionfurnace by taking lollipop steel samples without anydeoxidizing agents (Al or Zr). The bath level wasprotected by argon flushing in order to minimize thecontact between the atmosphere and the liquid steel. Thechemical analysis was determined using an opticalemission spectrometer (OES), type Spectromax VersionF (SPECTRO Analytical Instruments & Co.KG,
Table II. Parameters Derived by Schurmann and Stisovic[13] for Fe-C-Si-Mn-Al-P Alloys (Note That P is Not Considered In This
Equation)
TL0 [�C] Si Mn Al
Ferrite (d) 1536 a=� 0.8384 a=� 0.9433 a=� 1.0011b=3.544E�3 b=� 2.6E�4 b=� 2.8154E�5
Austenite (c) 1526 a=� 0.6931 a=� 0.9323 a=� 0.9169b=� 0.0459 b=� 4.1584E�4 b=� 0.3084
Table III. Composition Range of the Samples Investigated Using DSC/DTA Techniques
Constituent SystemsC [MassPercent]
Si [MassPercent]
Mn [MassPercent]
Al [MassPercent]
P [MassPercent]
No. ofAlloys
Fe-C-Si 0.007 to 1.56 0.49 to 4.39 — — — 46Fe-C-Mn 0.054 to 0.30 — 1.02 to 5.39 — — 10Fe-C-Al 0.035 to 0.59 — — 0.37 to 1.97 — 28Fe-P, Fe-C-P 0.004 to 1.38 — — — 0.026 to 0.76 26Fe-Si-P, Fe-Al-P < 0.006 < 2.96 — < 1.66 0.092 to 0.096 8Fe-Si-Mn, Fe-C-Si-Mn, Fe-Si-Mn-Al 0.005 to 0.32 0.54 to 4.12 0.03 to 6.05 < 0.87 — 49Fe-C-Mn-P, Fe-C-Si-Mn-Al-P 0.012 to 0.24 < 0.44 1.58 to 2.01 < 0.74 0.005 to 0.33 12All Data 0.007 to 1.56 < 4.39 < 6.05 < 1.97 < 0.76 179
METALLURGICAL AND MATERIALS TRANSACTIONS B
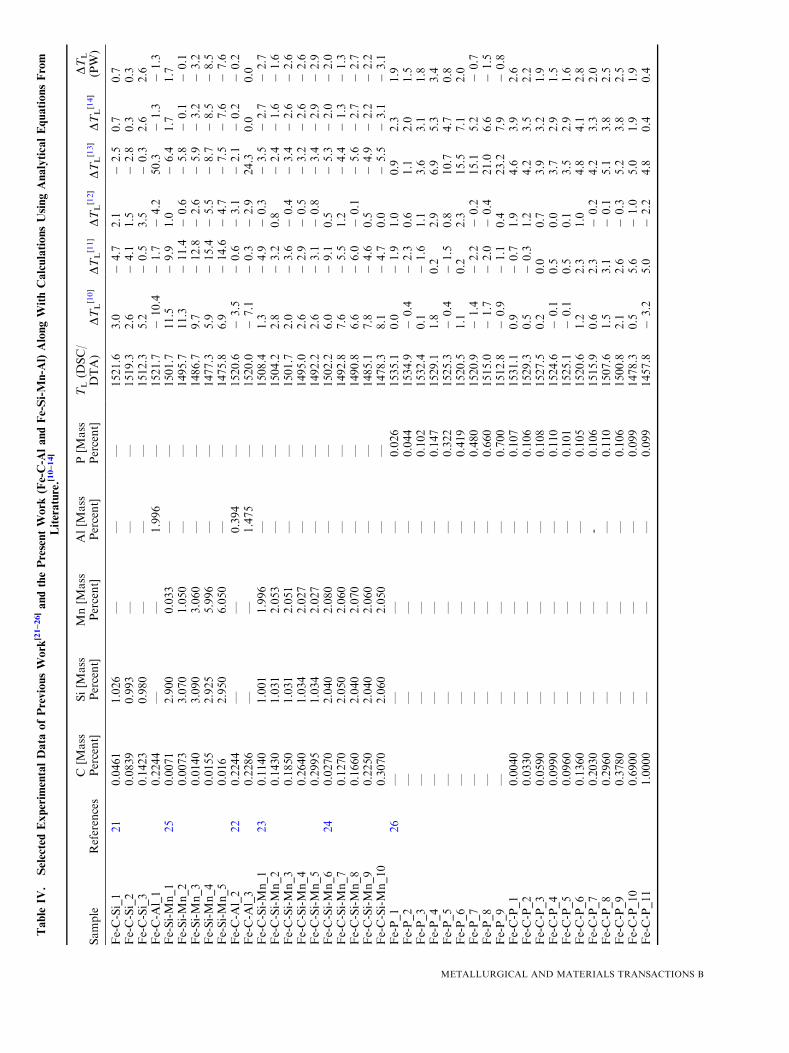
Table
IV.
SelectedExperim
entalData
ofPreviousWork
[21–26]andthePresentWork
(Fe-C-A
landFe-Si-Mn-A
l)AlongWithCalculationsUsingAnalyticalEquationsFrom
Literature.[10–14]
Sample
References
C[M
ass
Percent]
Si[M
ass
Percent]
Mn[M
ass
Percent]
Al[M
ass
Percent]
P[M
ass
Percent]
TL(D
SC/
DTA)
DTL[10]
DTL[11]
DTL[12]
DTL[13]
DTL[14]
DTL
(PW)
Fe-C-Si_1
21
0.0461
1.026
——
—1521.6
3.0
�4.7
2.1
�2.5
0.7
0.7
Fe-C-Si_2
0.0839
0.993
——
—1519.3
2.6
�4.1
1.5
�2.8
0.3
0.3
Fe-C-Si_3
0.1423
0.980
——
—1512.3
5.2
�0.5
3.5
�0.3
2.6
2.6
Fe-C-A
l_1
0.2244
——
1.996
—1521.7
�10.4
�1.7
�4.2
50.3
�1.3
�1.3
Fe-Si-Mn_1
25
0.0071
2.900
0.033
——
1501.7
11.5
�9.9
1.0
�6.4
1.7
1.7
Fe-Si-Mn_2
0.0073
3.070
1.050
——
1495.7
11.3
�11.4
�0.6
�5.8
�0.1
�0.1
Fe-Si-Mn_3
0.0140
3.090
3.060
——
1486.7
9.7
�12.8
�2.6
�5.9
�3.2
�3.2
Fe-Si-Mn_4
0.0155
2.925
5.996
——
1477.3
5.9
�15.4
�5.5
�8.7
�8.5
�8.5
Fe-Si-Mn_5
0.016
2.950
6.050
——
1475.8
6.9
�14.6
�4.7
�7.5
�7.6
�7.6
Fe-C-A
l_2
22
0.2244
——
0.394
—1520.6
�3.5
�0.6
�3.1
�2.1
�0.2
�0.2
Fe-C-A
l_3
0.2286
——
1.475
—1520.0
�7.1
�0.3
�2.9
24.3
0.0
0.0
Fe-C-Si-Mn_1
23
0.1140
1.001
1.996
——
1508.4
1.3
�4.9
�0.3
�3.5
�2.7
�2.7
Fe-C-Si-Mn_2
0.1430
1.031
2.053
——
1504.2
2.8
�3.2
0.8
�2.4
�1.6
�1.6
Fe-C-Si-Mn_3
0.1850
1.031
2.051
——
1501.7
2.0
�3.6
�0.4
�3.4
�2.6
�2.6
Fe-C-Si-Mn_4
0.2640
1.034
2.027
——
1495.0
2.6
�2.9
�0.5
�3.2
�2.6
�2.6
Fe-C-Si-Mn_5
0.2995
1.034
2.027
——
1492.2
2.6
�3.1
�0.8
�3.4
�2.9
�2.9
Fe-C-Si-Mn_6
24
0.0270
2.040
2.080
——
1502.2
6.0
�9.1
0.5
�5.3
�2.0
�2.0
Fe-C-Si-Mn_7
0.1270
2.050
2.060
——
1492.8
7.6
�5.5
1.2
�4.4
�1.3
�1.3
Fe-C-Si-Mn_8
0.1660
2.040
2.070
——
1490.8
6.6
�6.0
�0.1
�5.6
�2.7
�2.7
Fe-C-Si-Mn_9
0.2250
2.040
2.060
——
1485.1
7.8
�4.6
0.5
�4.9
�2.2
�2.2
Fe-C-Si-Mn_10
0.3070
2.060
2.050
——
1478.3
8.1
�4.7
0.0
�5.5
�3.1
�3.1
Fe-P_1
26
——
——
0.026
1535.1
0.0
�1.9
1.0
0.9
2.3
1.9
Fe-P_2
——
——
0.044
1534.9
�0.4
�2.3
0.6
1.1
2.0
1.5
Fe-P_3
——
——
0.102
1532.4
0.1
�1.6
1.1
3.6
3.1
1.8
Fe-P_4
——
——
0.147
1529.1
1.8
0.2
2.9
6.9
5.3
3.4
Fe-P_5
——
——
0.322
1525.3
�0.4
�1.5
0.8
10.7
4.7
0.8
Fe-P_6
——
——
0.419
1520.5
1.1
0.2
2.3
15.5
7.1
2.0
Fe-P_7
——
——
0.480
1520.9
�1.4
�2.2
�0.2
15.1
5.2
�0.7
Fe-P_8
——
——
0.660
1515.0
�1.7
�2.0
�0.4
21.0
6.6
�1.5
Fe-P_9
——
——
0.700
1512.8
�0.9
�1.1
0.4
23.2
7.9
�0.8
Fe-C-P_1
0.0040
——
—0.107
1531.1
0.9
�0.7
1.9
4.6
3.9
2.6
Fe-C-P_2
0.0330
——
—0.106
1529.3
0.5
�0.3
1.2
4.2
3.5
2.2
Fe-C-P_3
0.0590
——
—0.108
1527.5
0.2
0.0
0.7
3.9
3.2
1.9
Fe-C-P_4
0.0990
——
—0.110
1524.6
�0.1
0.5
0.0
3.7
2.9
1.5
Fe-C-P_5
0.0960
——
—0.101
1525.1
�0.1
0.5
0.1
3.5
2.9
1.6
Fe-C-P_6
0.1360
——
—0.105
1520.6
1.2
2.3
1.0
4.8
4.1
2.8
Fe-C-P_7
0.2030
——
-0.106
1515.9
0.6
2.3
�0.2
4.2
3.3
2.0
Fe-C-P_8
0.2960
——
—0.110
1507.6
1.5
3.1
�0.1
5.1
3.8
2.5
Fe-C-P_9
0.3780
——
—0.106
1500.8
2.1
2.6
�0.3
5.2
3.8
2.5
Fe-C-P_10
0.6900
——
—0.099
1478.3
0.5
5.6
�1.0
5.0
1.9
1.9
Fe-C-P_11
1.0000
——
—0.099
1457.8
�3.2
5.0
�2.2
4.8
0.4
0.4
METALLURGICAL AND MATERIALS TRANSACTIONS B
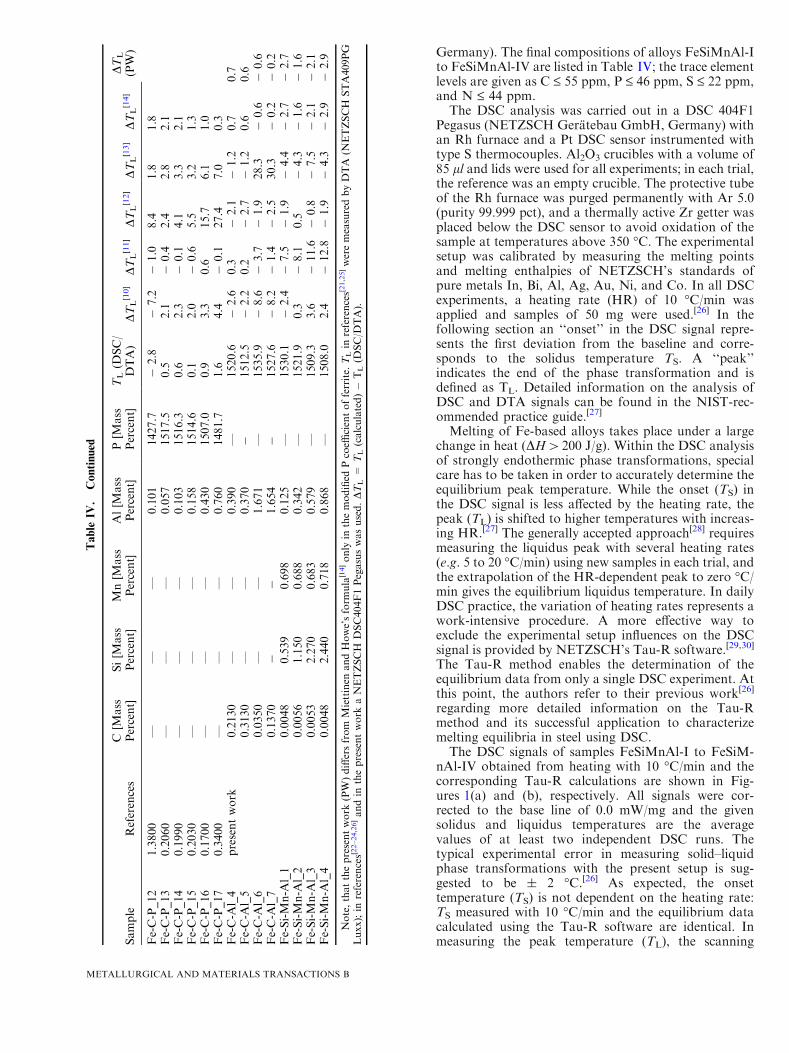
Germany). The final compositions of alloys FeSiMnAl-Ito FeSiMnAl-IV are listed in Table IV; the trace elementlevels are given as C £ 55 ppm, P £ 46 ppm, S £ 22 ppm,and N £ 44 ppm.The DSC analysis was carried out in a DSC 404F1
Pegasus (NETZSCH Geratebau GmbH, Germany) withan Rh furnace and a Pt DSC sensor instrumented withtype S thermocouples. Al2O3 crucibles with a volume of85 ll and lids were used for all experiments; in each trial,the reference was an empty crucible. The protective tubeof the Rh furnace was purged permanently with Ar 5.0(purity 99.999 pct), and a thermally active Zr getter wasplaced below the DSC sensor to avoid oxidation of thesample at temperatures above 350 �C. The experimentalsetup was calibrated by measuring the melting pointsand melting enthalpies of NETZSCH’s standards ofpure metals In, Bi, Al, Ag, Au, Ni, and Co. In all DSCexperiments, a heating rate (HR) of 10 �C/min wasapplied and samples of 50 mg were used.[26] In thefollowing section an ‘‘onset’’ in the DSC signal repre-sents the first deviation from the baseline and corre-sponds to the solidus temperature TS. A ‘‘peak’’indicates the end of the phase transformation and isdefined as TL. Detailed information on the analysis ofDSC and DTA signals can be found in the NIST-rec-ommended practice guide.[27]
Melting of Fe-based alloys takes place under a largechange in heat (DH>200 J/g). Within the DSC analysisof strongly endothermic phase transformations, specialcare has to be taken in order to accurately determine theequilibrium peak temperature. While the onset (TS) inthe DSC signal is less affected by the heating rate, thepeak (TL) is shifted to higher temperatures with increas-ing HR.[27] The generally accepted approach[28] requiresmeasuring the liquidus peak with several heating rates(e.g. 5 to 20 �C/min) using new samples in each trial, andthe extrapolation of the HR-dependent peak to zero �C/min gives the equilibrium liquidus temperature. In dailyDSC practice, the variation of heating rates represents awork-intensive procedure. A more effective way toexclude the experimental setup influences on the DSCsignal is provided by NETZSCH’s Tau-R software.[29,30]
The Tau-R method enables the determination of theequilibrium data from only a single DSC experiment. Atthis point, the authors refer to their previous work[26]
regarding more detailed information on the Tau-Rmethod and its successful application to characterizemelting equilibria in steel using DSC.The DSC signals of samples FeSiMnAl-I to FeSiM-
nAl-IV obtained from heating with 10 �C/min and thecorresponding Tau-R calculations are shown in Fig-ures 1(a) and (b), respectively. All signals were cor-rected to the base line of 0.0 mW/mg and the givensolidus and liquidus temperatures are the averagevalues of at least two independent DSC runs. Thetypical experimental error in measuring solid–liquidphase transformations with the present setup is sug-gested to be ± 2 �C.[26] As expected, the onsettemperature (TS) is not dependent on the heating rate:TS measured with 10 �C/min and the equilibrium datacalculated using the Tau-R software are identical. Inmeasuring the peak temperature (TL), the scanning
Table
IV.
Continued
Sample
References
C[M
ass
Percent]
Si[M
ass
Percent]
Mn[M
ass
Percent]
Al[M
ass
Percent]
P[M
ass
Percent]
TL(D
SC/
DTA)
DTL[10]
DTL[11]
DTL[12]
DTL[13]
DTL[14]
DTL
(PW)
Fe-C-P_12
1.3800
——
—0.101
1427.7
�2.8
�7.2
�1.0
8.4
1.8
1.8
Fe-C-P_13
0.2060
——
—0.057
1517.5
0.5
2.1
�0.4
2.4
2.8
2.1
Fe-C-P_14
0.1990
——
—0.103
1516.3
0.6
2.3
�0.1
4.1
3.3
2.1
Fe-C-P_15
0.2030
——
—0.158
1514.6
0.1
2.0
�0.6
5.5
3.2
1.3
Fe-C-P_16
0.1700
——
—0.430
1507.0
0.9
3.3
0.6
15.7
6.1
1.0
Fe-C-P_17
0.3400
——
—0.760
1481.7
1.6
4.4
�0.1
27.4
7.0
0.3
Fe-C-A
l_4
presentwork
0.2130
——
0.390
—1520.6
�2.6
0.3
�2.1
�1.2
0.7
0.7
Fe-C-A
l_5
0.3130
——
0.370
�1512.5
�2.2
0.2
�2.7
�1.2
0.6
0.6
Fe-C-A
l_6
0.0350
——
1.671
—1535.9
�8.6
�3.7
�1.9
28.3
�0.6
�0.6
Fe-C-A
l_7
0.1370
��
1.654
�1527.6
�8.2
�1.4
�2.5
30.3
�0.2
�0.2
Fe-Si-Mn-A
l_1
0.0048
0.539
0.698
0.125
—1530.1
�2.4
�7.5
�1.9
�4.4
�2.7
�2.7
Fe-Si-Mn-A
l_2
0.0056
1.150
0.688
0.342
—1521.9
0.3
�8.1
0.5
�4.3
�1.6
�1.6
Fe-Si-Mn-A
l_3
0.0053
2.270
0.683
0.579
—1509.3
3.6
�11.6
�0.8
�7.5
�2.1
�2.1
Fe-Si-Mn-A
l_4
0.0048
2.440
0.718
0.868
—1508.0
2.4
�12.8
�1.9
�4.3
�2.9
�2.9
Note,thatthepresentwork
(PW)differsfrom
Miettinen
andHowe’sform
ula
[14]only
inthemodified
Pcoeffi
cientofferrite.
TLin
references[21,25]weremeasuredbyDTA
(NETZSCH
STA409PG
Luxx);in
references[22–24,26]andin
thepresentwork
aNETZSCH
DSC404F1Pegasuswasused.DTL=
TL(calculated)�
TL(D
SC/D
TA).
METALLURGICAL AND MATERIALS TRANSACTIONS B
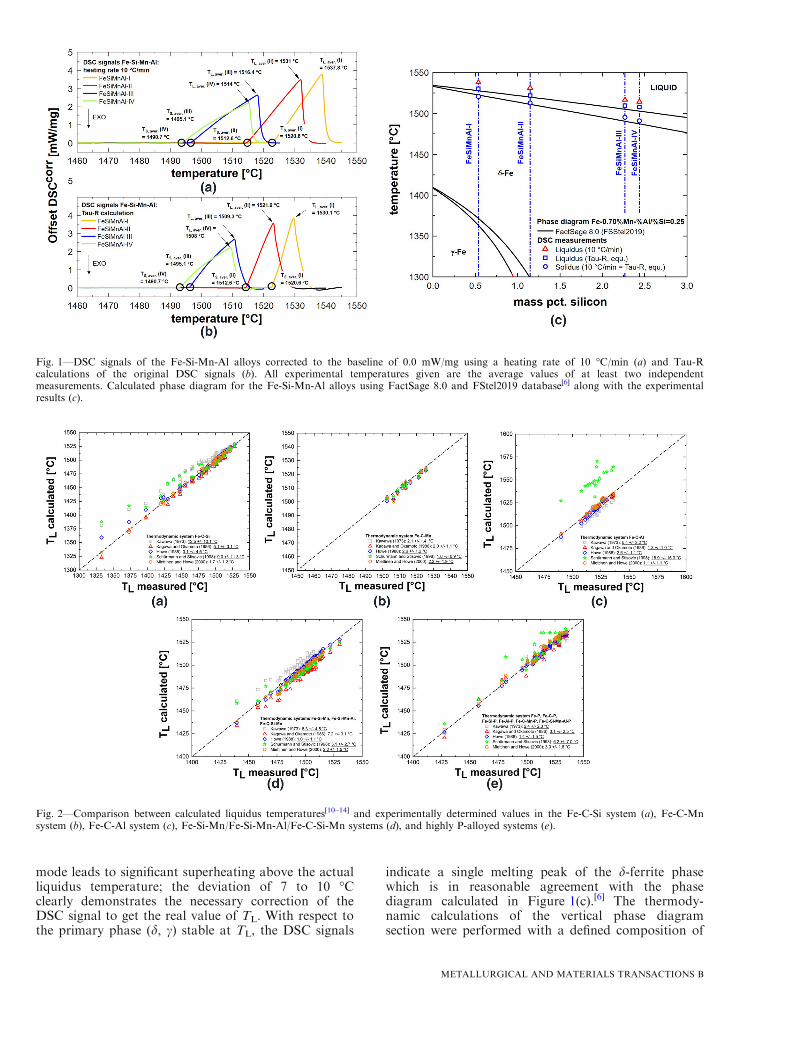
mode leads to significant superheating above the actualliquidus temperature; the deviation of 7 to 10 �Cclearly demonstrates the necessary correction of theDSC signal to get the real value of TL. With respect tothe primary phase (d, c) stable at TL, the DSC signals
indicate a single melting peak of the d-ferrite phasewhich is in reasonable agreement with the phasediagram calculated in Figure 1(c).[6] The thermody-namic calculations of the vertical phase diagramsection were performed with a defined composition of
Fig. 1—DSC signals of the Fe-Si-Mn-Al alloys corrected to the baseline of 0.0 mW/mg using a heating rate of 10 �C/min (a) and Tau-Rcalculations of the original DSC signals (b). All experimental temperatures given are the average values of at least two independentmeasurements. Calculated phase diagram for the Fe-Si-Mn-Al alloys using FactSage 8.0 and FStel2019 database[6] along with the experimentalresults (c).
Fig. 2—Comparison between calculated liquidus temperatures[10–14] and experimentally determined values in the Fe-C-Si system (a), Fe-C-Mnsystem (b), Fe-C-Al system (c), Fe-Si-Mn/Fe-Si-Mn-Al/Fe-C-Si-Mn systems (d), and highly P-alloyed systems (e).
METALLURGICAL AND MATERIALS TRANSACTIONS B

Fe-0.70 pct Mn and a constant [pctAl]/[pctSi] ratio of0.25. Due to induction melting practice, the [pct Al]/[pct Si] ratio in the samples varies in the range of 0.23to 0.36 (see Table IV). Hence, minor differences of ~ 5�C between the calculated and measured temperatureshave to be considered in Figure 1(c).
The final equilibrium liquidus temperatures TL
(Tau-R) in the system Fe-Si-Mn-Al are summarized inTable IV. In a first comparison with the analyticalequations,[10–14] the best agreement was found for thestudies of Kawawa[10] (error 2.2 ± 1.2 �C), Howe[12]
(error 1.3 ± 0.6 �C) and Miettinen and Howe[14] (2.3 ±0.5 �C). The deviations are close to or below the typical
experimental error. However, for C-free Fe-Si-Mn-Alalloys, only the liquidus slopes of the binary system areof relevance, as the interaction parameters with car-bon[14] cannot be evaluated.The comparison between the DSC/DTA dataset
(Table III) and the calculations using the analyticalliquidus equations[10–14] is summarized graphically inFigures 2(a) through (e) and discussed in the followingsubsystems:
� Fe-C-Si: The binary coefficients of the Fe-Si systemsignificantly differ in the equations. The liquidus slopeof � 7.6 �C/[pct Si] as proposed by Kawawa[10] sys-tematically predicts too high values of TL compared
Fig. 3—Binary Fe-Al system[6] along with experimental data of Stein and Palm[31] (a) and calculated Fe-C diagram[6] compared with liquidustemperatures published in previous work[21, 22] and ternary Fe-C-0.40 pct Al and Fe-C-1.60 pct Al alloys (b) (see also Table IV).
Fig. 4—Comparison between calculated liquidus temperature[10–14] and experimentally determined values in all thermodynamic systems (a) andthe corresponding enlarged section between 1450 �C and 1540 �C (b). Improved calculations in the P-alloyed system by modifying the Pcoefficients of d-Fe in Miettinen and Howe’s equation[14] (c).
Table V. Originally Documented Limits of Howe and Miettinen’s[14] Equation Based on the Defined Composition Range in Their
Thermodynamic Calculations Using IDS[9]
and Validated Composition Range of Their Work by Experimental DSC/DTA Data inthe Present Work (PW)
Reference C [Mass Percent] Si [Mass Percent] Mn [Mass Percent] Al [Mass Percent] P [Mass Percent]
[14] 0 to 1.20 0 to 2 0 to 2 — 0 to 0.03PW 0 to 1.56 0 to 4.5 0 to 5 0 to 2 0 to 0.10
For calculations up to 0.10 [pct P] the proposed modifications of the P coefficients for d-Fe are suggested.
METALLURGICAL AND MATERIALS TRANSACTIONS B
to the measurements, while Kagawa and Okamato’sequation [11] (� 14.39 �C/[pct Si]) results in slightlylower calculated liquidus temperatures. The equationof Schurmann and Stisovic[13] gives good correlationup to 3 mass pct. Si; the error is typically smaller than8 �C, which is in agreement with the evaluation ofhigh-Si commercial steels in their work[13] (error ± 10�C). Deviations of more than 40 �C were found in thecase of high amounts of Si (~ 4 pct) and C (> 1 pct).Excellent results were obtained using Miettinen andHowe’s equations.[14] The small averaged error of 1.7± 1.2 �C indicates that the most suitable Fe-Si factorfor ferrite and austenite corresponds to about � 12�C/[pct Si]. Even for the high-alloyed samples, theconsideration of the Si-C interaction[14] provides anaccurate description of TL.
� Fe-C-Mn: As the liquidus slopes of each equation areconsistent, all liquidus formulas give very similar re-sults (error<± 2.5 �C). However, at [pct Mn]>5, thecalculations of TL with equations[10–12,14] lead tohigher deviations from the DSC results (DT = 4 to 6�C). In this system, the equation of Schurmann andStisovic[13] provides reliable predictions of TL up tothe maximum alloying content of 5.3 mass pct. Mn(error 1 ± 1.1 �C).
� Fe-C-Al: Most recently published experimental dataof Stein and Palm[31] showed that the addition ofaluminum increases the melting point of Fe in thebinary Fe-Al system by + 1 �C/[pct Al]. A localmaximum was reported at 1540 �C and ~ 5 mass pct.Al[31] before TL continuously decreases with increas-ing Al content, see Figure 3(a).[6, 31] It is thereforeevident that at high Al content, CALPHAD basedthermodynamic optimizations are essential to accu-rately model the liquidus phase boundary. In thiscase, analytical equations for TL have to includenumerous fitting parameters to reproduce the curva-ture of the liquidus line for alloys with [pct Al]>2.5.Hence, the authors decided to consider only alloyswith Al content below the composition of the Fe-Alinflection point covering the typical compositionrange typical AHSS ([pct Al]<2).[17, 18] However, theeffect of Al on TL is hardly measureable in ternaryFe-C-Al vertical sections with 0.40,[pct Al], 1.60 [pctAl] and 2 [pct Al], see Figure 3(b). In this alloyingrange the minor change of TL is within the experi-mental error of ± 2 �C[26] and a clear influence of Alon the melting point in the Fe-C diagram[6] cannot beobserved. In analytical equations for TL the effect ofAl is considered in the expressions of Kawawa[10] (�3.6 �C/[pct Al]) and Howe[12] (0 �C/[pct Al]). It can beseen in Figure 2(c) and Table IV that the negativecoefficient in Kawawa’s equation[10] results in too lowvalues of TL. In agreement with Howe’s study,[12],setting the Fe-Al coefficient specifically to 0 �C/[pctAl], Miettinen and Howe’s equation[14] results in thelowest deviation from the DSC data (DTL ~ ± 1 �C).In the case of the Schurmann and Stisovic[13] equa-tion, the measurements are most presumably outsideof the valid composition range for Al. This results inan unreliable stabilization effect of austenite and avery high liquidus temperature.
� Fe-Si-Mn and Fe-C-Si-Mn: In general, all liquidusequations evaluated provide sufficiently accuratepredictions of TL, including calculations for alloyscontaining Si and Mn up to 4 pct. Again the work ofHowe[12] (error 1.0 ± 1.1 �C) and Miettinen andHowe[14] (error 2.2 ± 1.5 �C) result in lowest deviationfrom the DSC/DTA data.
� P-alloyed systems: Excellent predictions of TL inhighly P-alloyed systems could be performed usingthe equation of Howe[12], showing a deviation fromthe experimental results of only 1.4 ± 1.5 �C. Miet-tinen and Howe’s[14] coefficients underestimate thedecrease of TL induced by alloying P, resulting insystematically higher values of TL in the Fe-P andFe-C-P systems. As all other ternary subsystems(Fe-C-Si, Fe-C-Al and Fe-C-Mn) are well describedby their work, the deviation may result from a factortoo large for phosphorus. Compared to otherwork,[10–12] the parameter of P is considered to begenerally lower than � 30 �C/[pct P], whereas Miet-tinen and Howe[14] suggest a value of � 24.78 �C/[pctP] for ferrite and � 30.92 �C/[pct P] for austenite. Ithas to be noted, that the P content of most alloysinvestigated by DSC/DTA exceeds the defined validcomposition range of their derived equations (0.03mass pct.[14]). The increased error of the Schurmannand Stisovic[13] equation is a consequence of themissing factor of P. For that reason, the results willnot be discussed at this point.
By evaluating all 180 DSC/DTA measurements inFigures 4(a) and (b), highly accurate liquidus tempera-tures for steel were predicted using the equations ofHowe[12] (error 2.0 ± 2.7 �C) and Miettinen andHowe[14] (error 2.1 ± 1.6 �C). Although both equationsyield very similar calculation results, the work ofMiettinen and Howe[14] offers the significant advantageof providing two separated equations for ferrite andaustenite. It is, therefore, possible (i) to identify the moststable phase at the liquidus temperature based on theinitial chemical composition and (ii) to estimate the startof the peritectic reaction during solidification in con-junction with microsegregation models. For this equa-tion, the authors suggest specifically setting theparameter of aluminum to 0 �C/[pct Al] for the bestcorrelation in Al-alloyed systems up to 2 pct. Based onthe present experimental DSC/DTA data, the resultsshow clearly that Miettinen and Howe’s[14] liquidusformula may be used without hesitation for liquiduscalculations of steels even at elevated alloying content ofC (<1.56 pct), Si (<4.5 pct), Mn (<5 pct), and Al (<2pct) outside the originally documented valid composi-tion limits[14] in Table V.However, for the strongly segregating element phos-
phorus, there is still some room to improve the liquidusslope in the expressions of Miettinen and Howe.[14] Byfitting the binary coefficient and the cross productparameter in their equations to the recently publisheddata [26] of Fe-P and Fe-C-P alloys in Table IV, valuesof -35.23 �C/[pct P] and � 11.2 �C/([pct P] x [pct C]) ford-Fe were obtained. The binary Fe-P coefficient forferrite is in reasonable agreement with the literature
METALLURGICAL AND MATERIALS TRANSACTIONS B
values[10–12] (see Table I) and the interaction parameterwith carbon is not changed significantly. As only a fewliquidus data for austenite were available and thecorrelation between the calculations and the measure-ments is very accurate (1.4 ± 0.7 �C), the c-Fe parameterset[14] (Table I) was kept unchanged. By using theoptimized factors for phosphorus, the error in theP-alloyed systems could be reduced from 3.0 ± 1.8 �C to2.0 ± 1.2 �C, and the overall error is then decreasedbelow the value of 2 �C (1.9 ± 1.4 �C). Further, byintroducing the modified phosphorus coefficient, theconcentration limit of Miettinen and Howe’s equationcould be extended up to 0.10 mass pct. P (Table V). Theimproved calculations for highly P-alloyed samples aregraphically represented in Figure 4(c).
In summary, various analytical liquidus equa-tions[10–14] for steel were evaluated based on a compre-hensive DTA/DSC dataset of 180 alloys in theFe-C-Si-Mn-Al-P thermodynamic subsystems. Excellentagreement was obtained with the most recently pub-lished expressions by Miettinen and Howe.[14] Theaverage error of 2.1 ± 1.6 �C is close to the typicalexperimental error of ± 2 �C in determining solid–liquidphase equilibria with the present DSC/DTA setups.[26]
For this equation, the slight adjustments for the Fe-Pand Fe-C-P liquidus slope suggested here may help toimprove calculations for steel with higher P content.
The present work demonstrates a systematic method-ology to evaluate liquidus equations using DSC andDTA. Future research will focus on measurements ofthe high-carbon austenite melting equilibria for systemsalready examined in the past (Fe-C-Al, Fe-C-P,Fe-C-Mn, Fe-C-Si-Mn, etc.) and further thermody-namic systems (e.g., Fe-C-Si-Mn-P, Fe-C-Si-Mn-Al,etc.) will be investigated.
ACKNOWLEDGMENT
The authors gratefully acknowledge the financialsupport under the scope of the COMET programwithin the K2 Center ‘‘Integrated ComputationalMaterial. Process and Product Engineering(IC-MPPE)’’ (Project No 859480). This program issupported by the Austrian Federal Ministries for Cli-mate Action, Environment, Energy, Mobility, Innova-tion, and Technology (BMK) and for Digital andEconomic Affairs (BMDW), represented by the Aus-trian research funding association (FFG), and the fed-eral states of Styria. Upper Austria and Tyrol.
FUNDING
Open access funding provided by MontanuniversitatLeoben.
OPEN ACCESS
This article is licensed under a Creative CommonsAttribution 4.0 International License, which permitsuse, sharing, adaptation, distribution and reproduction
in any medium or format, as long as you give appro-priate credit to the original author(s) and the source,provide a link to the Creative Commons licence, andindicate if changes were made. The images or otherthird party material in this article are included in thearticle’s Creative Commons licence, unless indicatedotherwise in a credit line to the material. If material isnot included in the article’s Creative Commons licenceand your intended use is not permitted by statutoryregulation or exceeds the permitted use, you will needto obtain permission directly from the copyright hold-er. To view a copy of this licence, visit http://creativecommons.org/licenses/by/4.0/.
REFERENCES1. Y. Ueshima, S. Mizoguchi, T. Matsumiya, and H. Kajioka: Me-
tall. Trans. B, 1986, vol. 17, pp. 845–59.2. A. Howe: Appl. Sci. Res., 1987, vol. 44, pp. 51–59.3. R. Pierer, C. Bernhard, and C. Chimani: Rev. Met. (Paris), 2007,
vol. 104, pp. 72–83.4. P. Spencer: Calphad, 2008, vol. 31, pp. 1–8.5. H. Lukas, S. Fries, and B. Sundman: Computational Thermody-
namics: The Calphad Method, Cambridge University Press, NewYork, 2007.
6. C. Bale, E. Belisle, P. Chartrand, S. Decterov, G. Eriksson, A.Gheribi, K. Hack, I.-H. Jung, Y.-B. Kang, J. Melancon, A. Pelton,S. Petersen, C. Robelin, J. Sangster, P. Spencer, and M.-A. vanEnde: Calphad, 2016, vol. 54, pp. 35–53.
7. J. Andersson, T. Helander, L. Hoglund, P. Shi, and B. Sundman:Calphad, 2002, vol. 26, pp. 73–312.
8. W. Cao, S.-L. Chen, F. Zhang, K. Wu. Y. Yang, Y. Chang, R.Schmid-Fetzer and W. Oates: Calphad, 2009, vol. 33, pp. 328-342.
9. J. Miettinen, S. Louhenkilpi, H. Kytonen, and J. Laine: Math.Comput. Simul., 2010, vol. 80, pp. 1536–50.
10. T. Kawawa: Report of 6th Meeting on Solidification of Steel, No.6-III-9, Japan, 1973.
11. A. Kagawa and T. Okamoto: Mater. Sci. Technol., 1986, vol. 2,pp. 997–1008.
12. A. Howe: Ironmaking Steelmaking, 1988, vol. 15, pp. 134–42.13. E. Schurmann and T. Stisovic: Stahl Eisen, 1998, vol. 118, pp. 97–
102.14. J. Miettinen and A. Howe: Ironmaking Steelmaking, 2000, vol. 27,
pp. 212–27.15. M. Wolf: Proceedings of Concast Metallurgical Seminar, Zurich,
Switzerland, 1982.16. X.-M. Chen, S.-H. Song, L.-Q. Weng, S.-J. Liu, and K. Wang:
Mater. Sci. Eng. A, 2011, vol. 528, pp. 8299–04.17. C. Bernhard, B. Linzer, P. Presoly, I. Watzinger and J. Watzinger:
IOP Conf. Ser.: Mater. Sci. Eng., 2019, vol. 529, art. no. 012071.18. P. Ghosh, R. Chromik, A. Knight, and S. Wakade: J. Magn.
Magn. Mater., 2014, vol. 356, pp. 42–51.19. Y.-K. Lee and J. Han: Mater. Sci. Technol., 2015, vol. 31 (7),
pp. 843–56.20. C. Tasan, M. Diehl, D. Yan, M. Bechtold, F. Roters, L. Schem-
mann, C. Zheng, N. Peranio, D. Ponge, M. Koayama, K. Tsuzaki,and D. Raabe: Annu. Rev. Mater. Res., 2015, vol. 45, pp. 391–31.
21. P. Presoly, R. Pierer, and C. Bernhard: Metall. Mater. Trans. A,2013, vol. 44, pp. 5377–88.
22. P. Presoly, R. Pierer and C. Bernhard: IOP Conf. Ser.: Mater. Sci.Eng., 2012, vol. 33, art. no. 012064.
23. P. Presoly, C. Bernhard, N. Fuchs, J. Miettinen, S. Louhenkilpiand J. Laine: Proceedings of 9th ECCC European ContinuousCasting Conference, Vienna, Austria, 2017.
24. P. Presoly, C. Bernhard and J. Six: IOP Conf. Ser.: Mater. Sci.Eng., 2015, vol. 119, art. no. 012013.
25. P. Presoly, M. Bernhard, and C. Bernhard: Calphad XLVII Con-ference Proceedings, Queretaro, Mexico, 2018.
26. M. Bernhard, P. Presoly, N. Fuchs, C. Bernhard, and Y.-B. Kang:Metall. Mater. Trans. A, 2020, vol. 51, pp. 5351–64.
METALLURGICAL AND MATERIALS TRANSACTIONS B
27. W. J. Boettinger, U. R. Kattner, K.-W. Moon and J. H.Perepezko, DTA and Heat-flux DSC measurements of AlloyMelting and Freezing. NIST Recommended Practice Guide, SpecialPublication 960-15, 2006.
28. L. Chapman: J. Mater. Sci., 2004, vol. 39, pp. 7229–36.29. Software: NETZSCH Tau-R Calibration 8.0.1 from Netzsch
Geratebau GmbH, Selb, Germany, 2019.
30. E. Moukhina and E. Kaisersberger: Thermochim. Acta, 2009,vol. 492, pp. 101–109.
31. F. Stein and M. Palm: Int. J. Mat. Res., 2007, vol. 98 (7), pp. 580–88.
Publisher’s Note Springer Nature remains neutral with regard tojurisdictional claims in published maps and institutional affiliations.
METALLURGICAL AND MATERIALS TRANSACTIONS B
APPENDIX: PUBLICATIONS
PhD thesis Michael Bernhard 88
Paper V
On the relevance of microsegregation models for process control in continuous casting of steel
M. Bernhard, P. Presoly, C. Bernhard, J. Six and S. Ilie
Proceedings of the 26th International Conference on Metallurgy and Materials, 2017, Brno,
Czech Republic.
Abstract: Microsegregation in general is the consequence of the different solubility of alloying
and residual elements in liquid and solid steel. The result is an enrichment of segregating
elements between the dendrites due to incomplete diffusion equalization. This enrichment
favours the precipitation of inclusions (e.g. MnS) during solidification as well as the formation
of hot tear segregations (HTS) along primary grain boundaries. Hence, the modelling of
microsegregation phenomena is an important task in order to predict the final product quality
and to optimize the process parameters in continuous casting of steel. A microsegregation
model based on the analytical solution proposed by Ohnaka was implemented in an in-house
1D-FV solidification simulation software. Considering equilibrium partition coefficients from
FactSage (FSStel2015) non-equilibrium solidus temperatures of various steel grades were
calculated. These results show very good correspondence with values determined from an in-
situ hot tensile on solidifying steel. Finally, the results were applied to calculate solidification in
a continuous slab casting machine and to analyse the strain in the mushy zone subsequently.
For selected steel grades the probability of HTS formation was predicted and the influence of
operating parameters was quantified.
Used and reprinted under the Creative Commons Attribution 4.0 International License
May 24th - 26th 2017, Brno, Czech Republic, EU
ON THE RELEVANCE OF MICROSEGREGATION MODELS FOR PROCESS CONTROL IN CONTINUOUS CASTING OF STEEL
BERNHARD Michael1, PRESOLY Peter1, BERNHARD Christian1, SIX Jakob2, ILIE Sergiu2
1 Chair of Ferrous Metallurgy, Montanuniversitaet Leoben, Leoben, Austria, EU, [email protected]
2 voestalpine Stahl GmbH, Linz, Austria, EU
Abstract
Microsegregation in general is the consequence of the different solubility of alloying and residual elements in liquid and solid steel. The result is an enrichment of segregating elements between the dendrites due to incomplete diffusion equalization. This enrichment favours the precipitation of inclusions (e.g. MnS) during solidification as well as the formation of hot tear segregations (HTS) along primary grain boundaries. Hence, the modelling of microsegregation phenomena is an important task in order to predict the final product quality and to optimize the process parameters in continuous casting of steel.
A microsegregation model based on the analytical solution proposed by Ohnaka was implemented in an in-house 1D-FV solidification simulation software. Considering equilibrium partition coefficients from FactSage (FSStel2015) non-equilibrium solidus temperatures of various steel grades were calculated. These results show very good correspondence with values determined from an in-situ hot tensile on solidifying steel. Finally, the results were applied to calculate solidification in a continuous slab casting machine and to analyse the strain in the mushy zone subsequently. For selected steel grades the probability of HTS formation was predicted and the influence of operating parameters was quantified.
Keywords: solidification, microsegregation, continuous casting, hot tearing
1. INTRODUCTION
Elements generally show a different solubility in solid and liquid steel. In contrast to the thermodynamic equilibrium, the complete diffusion equalization of elements inside the solidifying microstructure is limited under continuous casting conditions. The consequence is an enrichment of alloying elements and tramp elements in the interdendritic melt. This phenomenon, known as microsegregation, has a decisive influence on the process quality and subsequently on the final product properties: The enrichment favours the formation of hot tear segregations (HTS) along primary grain boundaries as well as precipitation of inclusions during solidification. Further, the segregation on microscopic scale could lead to a macroscopic inhomogeneity in the center of the strand.
In the present work a microsegregation model based on Ohnaka’s analytical solution [1] was implemented in an in-house 1D-FV solidification simulation software using input parameters from literature and FactSage (FSStel2015). Further, an evaluation of liquidus formulas by the comparison with results from Differential Scanning Calorimetry (DSC) measurements for a wide range of steel compositions was performed. A published formula could be slightly modified and improved. Calculated solidus temperatures are in good agreement with values determined from an in-situ hot tensile test on solidifying steel. Finally, the model was used for the solidification simulation and the prediction of hot tear formation in a continuous slab caster. Considering different steel compositions and secondary cooling strategies, the relevance of microsegregation modelling regarding quality control in the continuous casting process is shown.
May 24th - 26th 2017, Brno, Czech Republic, EU
2. MICROSEGREGATION MODELLING
2.1 Model description
Various models for the mathematical description of microsegregation during solidification have been developed in the past [1-7]. Ohnaka [1] presented an analytical model based on the assumption of a quadratic solute distribution profile in the solid. The solution of the model is given in Equation 1.
( )
fskdfk
cdc s
l
l
+
−−
−=
ββ1
11
1 (1)
cl is the solute concentration in the liquid, fs is the fraction of solid, dcl ist the change of the solute concentration in the liquid corresponding to an increase of the solid fraction dfs and k is the equilibrium distribution coefficient. The backdiffusion parameter β depends on the dendrite geometry and the dimensionless Fourier-Number α (β=2α for the plate-like model and β=4α for the columnar model). In solidification processes α is generally defined by Equation 2, where Ds is the diffusion coefficient of elements in the solid steel, tf is the local solidification time and λ2 is the secondary dendrite arm spacing (SDAS).
22
4λ
α fstD= (2)
Setting Γ=1-βk/(1+βk) and assuming that the backdiffusion parameter is constant within an increase of solid fraction by Δfs, integration of Equation 1 from fs to fs+Δfs results in the semi-integrated Equation 3 according to You et al. [8]. In the present work the semi-integrated form with a columnar dendrite structure (β=4α) is applied for the microsegregation calculation.
( )Γ−
∆+
∆+Γ−
Γ−=
k
ss
sfl
ffl ff
fcc sss
1
11
(3)
2.2 Input parameters
The temperature dependence of solute diffusion coefficients follows an Arrhenius approach (Equation 4), where the gas constant R is 8.314 J / (mol∙K) and T is the temperature in Kelvin. The used values for the activation energy Q and D0 are listed in Table 1.
RTQ
s eDD−
= 0 (4)
Table 1: Diffusion coefficients of solutes in ferrite (δ) and austenite (γ) [6,9]
C Si Mn P S Al Cr Ni Mo Cu
δ D0 [cm2/s] 0.0127 8.0 0.76 2.9 4.56 5.9 2.4 1.6 3.47 2.6
Q [103 J/mol] 81.4 248.9 224.4 230.1 214.6 241.2 239.8 240 241.4 240
γ D0 [cm2/s] 0.0761 0.30 0.055 0.01 2.4 5.1 0.0012 0.34 0.068 0.7
Q [103 J/mol] 134.4 251.2 249.1 182.7 212.2 245.8 219 282.4 246.9 286
Equilibrium partition coefficients are taken from FactSage (FSStel2015) [10]. SDAS is computed as a function of local solidification time and carbon content as proposed by Pierer and Bernhard [11]. Further it
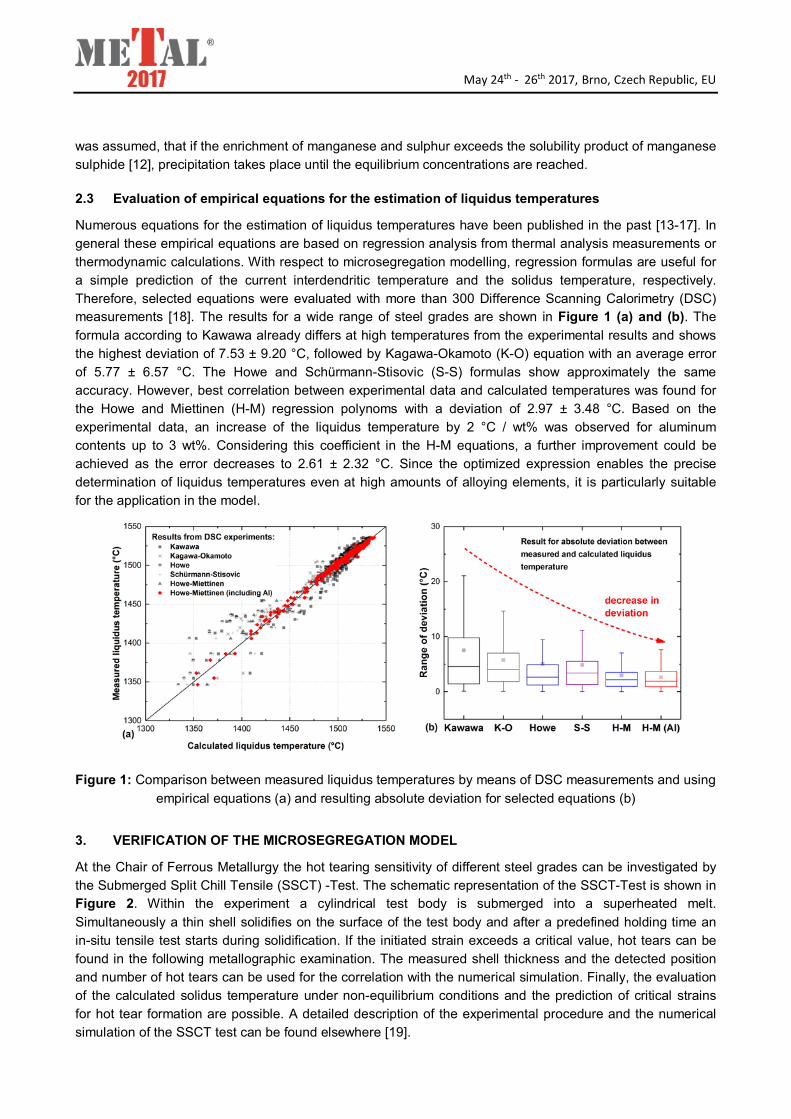
May 24th - 26th 2017, Brno, Czech Republic, EU
was assumed, that if the enrichment of manganese and sulphur exceeds the solubility product of manganese sulphide [12], precipitation takes place until the equilibrium concentrations are reached.
2.3 Evaluation of empirical equations for the estimation of liquidus temperatures
Numerous equations for the estimation of liquidus temperatures have been published in the past [13-17]. In general these empirical equations are based on regression analysis from thermal analysis measurements or thermodynamic calculations. With respect to microsegregation modelling, regression formulas are useful for a simple prediction of the current interdendritic temperature and the solidus temperature, respectively. Therefore, selected equations were evaluated with more than 300 Difference Scanning Calorimetry (DSC) measurements [18]. The results for a wide range of steel grades are shown in Figure 1 (a) and (b). The formula according to Kawawa already differs at high temperatures from the experimental results and shows the highest deviation of 7.53 ± 9.20 °C, followed by Kagawa-Okamoto (K-O) equation with an average error of 5.77 ± 6.57 °C. The Howe and Schürmann-Stisovic (S-S) formulas show approximately the same accuracy. However, best correlation between experimental data and calculated temperatures was found for the Howe and Miettinen (H-M) regression polynoms with a deviation of 2.97 ± 3.48 °C. Based on the experimental data, an increase of the liquidus temperature by 2 °C / wt% was observed for aluminum contents up to 3 wt%. Considering this coefficient in the H-M equations, a further improvement could be achieved as the error decreases to 2.61 ± 2.32 °C. Since the optimized expression enables the precise determination of liquidus temperatures even at high amounts of alloying elements, it is particularly suitable for the application in the model.
Figure 1: Comparison between measured liquidus temperatures by means of DSC measurements and using empirical equations (a) and resulting absolute deviation for selected equations (b)
3. VERIFICATION OF THE MICROSEGREGATION MODEL
At the Chair of Ferrous Metallurgy the hot tearing sensitivity of different steel grades can be investigated by the Submerged Split Chill Tensile (SSCT) -Test. The schematic representation of the SSCT-Test is shown in Figure 2. Within the experiment a cylindrical test body is submerged into a superheated melt. Simultaneously a thin shell solidifies on the surface of the test body and after a predefined holding time an in-situ tensile test starts during solidification. If the initiated strain exceeds a critical value, hot tears can be found in the following metallographic examination. The measured shell thickness and the detected position and number of hot tears can be used for the correlation with the numerical simulation. Finally, the evaluation of the calculated solidus temperature under non-equilibrium conditions and the prediction of critical strains for hot tear formation are possible. A detailed description of the experimental procedure and the numerical simulation of the SSCT test can be found elsewhere [19].
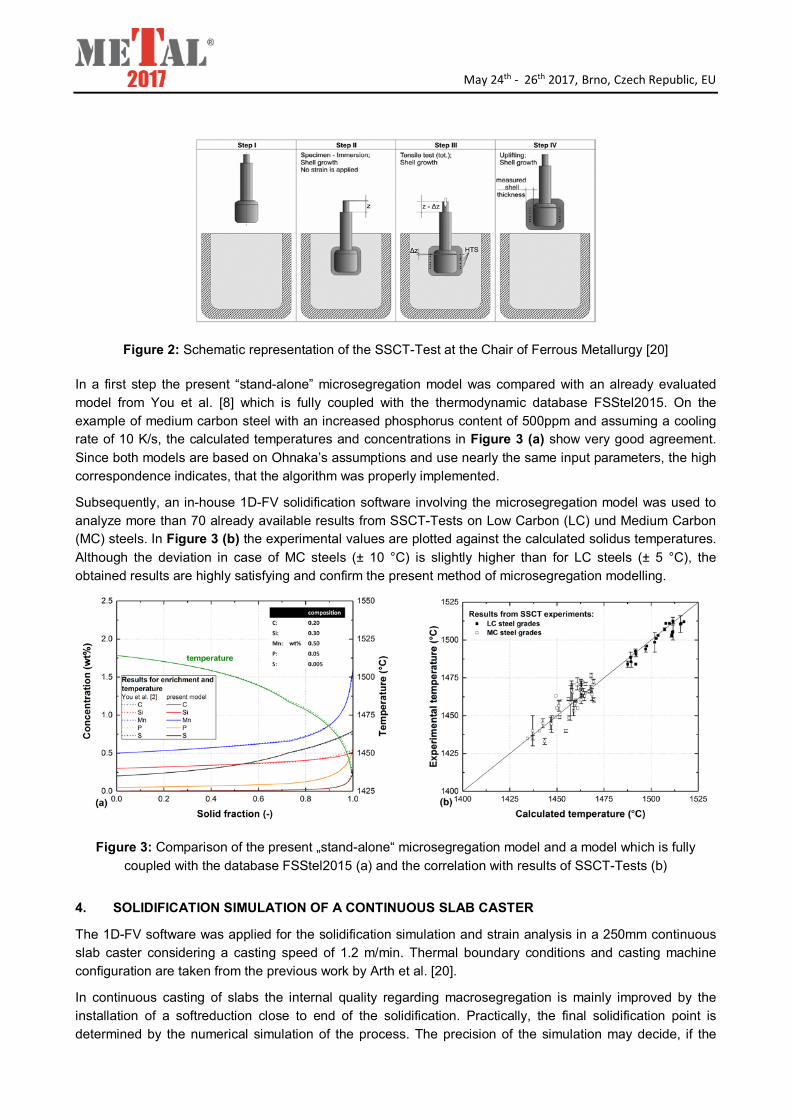
May 24th - 26th 2017, Brno, Czech Republic, EU
Figure 2: Schematic representation of the SSCT-Test at the Chair of Ferrous Metallurgy [20]
In a first step the present “stand-alone” microsegregation model was compared with an already evaluated model from You et al. [8] which is fully coupled with the thermodynamic database FSStel2015. On the example of medium carbon steel with an increased phosphorus content of 500ppm and assuming a cooling rate of 10 K/s, the calculated temperatures and concentrations in Figure 3 (a) show very good agreement. Since both models are based on Ohnaka’s assumptions and use nearly the same input parameters, the high correspondence indicates, that the algorithm was properly implemented.
Subsequently, an in-house 1D-FV solidification software involving the microsegregation model was used to analyze more than 70 already available results from SSCT-Tests on Low Carbon (LC) und Medium Carbon (MC) steels. In Figure 3 (b) the experimental values are plotted against the calculated solidus temperatures. Although the deviation in case of MC steels (± 10 °C) is slightly higher than for LC steels (± 5 °C), the obtained results are highly satisfying and confirm the present method of microsegregation modelling.
Figure 3: Comparison of the present „stand-alone“ microsegregation model and a model which is fully coupled with the database FSStel2015 (a) and the correlation with results of SSCT-Tests (b)
4. SOLIDIFICATION SIMULATION OF A CONTINUOUS SLAB CASTER
The 1D-FV software was applied for the solidification simulation and strain analysis in a 250mm continuous slab caster considering a casting speed of 1.2 m/min. Thermal boundary conditions and casting machine configuration are taken from the previous work by Arth et al. [20].
In continuous casting of slabs the internal quality regarding macrosegregation is mainly improved by the installation of a softreduction close to end of the solidification. Practically, the final solidification point is determined by the numerical simulation of the process. The precision of the simulation may decide, if the
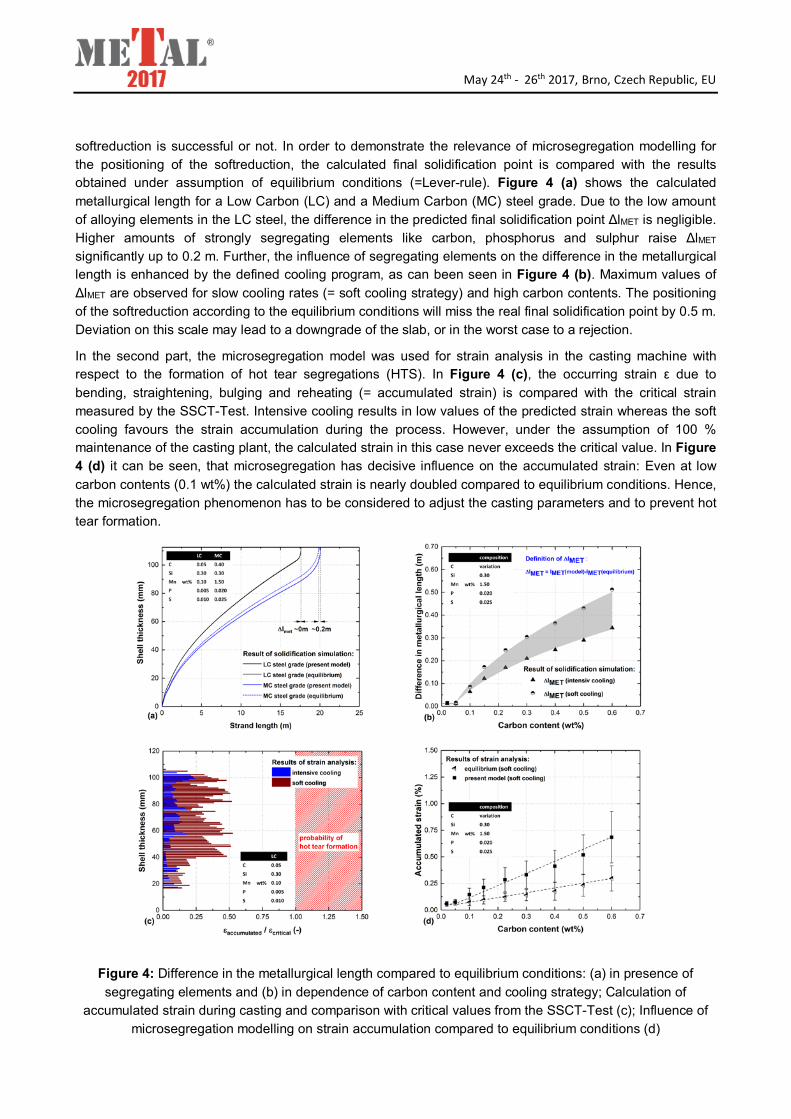
May 24th - 26th 2017, Brno, Czech Republic, EU
softreduction is successful or not. In order to demonstrate the relevance of microsegregation modelling for the positioning of the softreduction, the calculated final solidification point is compared with the results obtained under assumption of equilibrium conditions (=Lever-rule). Figure 4 (a) shows the calculated metallurgical length for a Low Carbon (LC) and a Medium Carbon (MC) steel grade. Due to the low amount of alloying elements in the LC steel, the difference in the predicted final solidification point ΔlMET is negligible. Higher amounts of strongly segregating elements like carbon, phosphorus and sulphur raise ΔlMET significantly up to 0.2 m. Further, the influence of segregating elements on the difference in the metallurgical length is enhanced by the defined cooling program, as can been seen in Figure 4 (b). Maximum values of ΔlMET are observed for slow cooling rates (= soft cooling strategy) and high carbon contents. The positioning of the softreduction according to the equilibrium conditions will miss the real final solidification point by 0.5 m. Deviation on this scale may lead to a downgrade of the slab, or in the worst case to a rejection.
In the second part, the microsegregation model was used for strain analysis in the casting machine with respect to the formation of hot tear segregations (HTS). In Figure 4 (c), the occurring strain ε due to bending, straightening, bulging and reheating (= accumulated strain) is compared with the critical strain measured by the SSCT-Test. Intensive cooling results in low values of the predicted strain whereas the soft cooling favours the strain accumulation during the process. However, under the assumption of 100 % maintenance of the casting plant, the calculated strain in this case never exceeds the critical value. In Figure 4 (d) it can be seen, that microsegregation has decisive influence on the accumulated strain: Even at low carbon contents (0.1 wt%) the calculated strain is nearly doubled compared to equilibrium conditions. Hence, the microsegregation phenomenon has to be considered to adjust the casting parameters and to prevent hot tear formation.
Figure 4: Difference in the metallurgical length compared to equilibrium conditions: (a) in presence of segregating elements and (b) in dependence of carbon content and cooling strategy; Calculation of
accumulated strain during casting and comparison with critical values from the SSCT-Test (c); Influence of microsegregation modelling on strain accumulation compared to equilibrium conditions (d)
May 24th - 26th 2017, Brno, Czech Republic, EU
5. CONCLUSION
By means of Difference Scanning Calorimetry measurements the published equation for the estimation of liquidus temperature by Miettinen and Howe [17] could be slightly modified. Based on the experimental data, an increase of the liquidus temperature by 2 °C / wt% was observed for aluminum contents up to 3 wt%. The consideration of the coefficient leads to a further improvement of the equation. The optimized expression enables the accurate calculation of liquidus temperature even at higher amount of alloying elements and is thus used for determination of the current temperature in the microsegregation model. The calculated solidus temperatures and concentrations performed with the present “stand-alone” model are in very good agreement with a model from literature which is fully coupled to the thermodynamic database FSStel2015 (FactSage) [10]. Further, the model has been evaluated with more than 70 hot tensile tests on Low Carbon and Medium Carbon steels. The solidification simulations of continuous slab caster and the subsequently strain analysis regarding hot tear show the relevance of microsegregation modelling for process control in continuous casting processes.
ACKNOWLEDGEMENTS
The authors gratefully acknowledge the funding support of K1-MET GmbH, metallurgical competence center. The research program of the K1-MET competence center is supported by COMET
(Competence Center for Excellent Technologies), the Austrian program for competence centers. COMET is funded by the Federal Ministry for Transport, Innovation and Technology, the Federal
Ministry for Science, Research and Economy, the provinces of Upper Austria, Tyrol and Styria as well as the Styrian Business Promotion Agency (SFG). This work is also part of the ongoing K2-
MPPE project A3.32 (SmartCast).
REFERENCES [1] OHNAKA, I. Mathematical analysis of solute redistribution during solidification with diffusion in the solid state,
Transactions ISIJ, 1986, vol. 26, no. 12, pp. 1045-1051.
[2] GULLIVER, G. H. Metallic Alloys, London: Griffin, 1922, 439 p.
[3] SCHEIL, E. Bemerkungen zur Schichtkristallbildung, Zeitschrift für Metallkunde, 1942, vol. 34, pp. 70-72.
[4] BRODY, H. D., FLEMINGS, M. C. Solute Redistribution in Dendritic Solidification, Transactions of the Metallurgical Society of AIME, 1966, vol. 236, pp. 615-623.
[5] CLYNE, T. W., KURZ, W. Solute Redistribution during Solidification with Rapid Solid State Diffusion, Metallurgical Transactions A, 1981, vol. 12, no. 6, pp. 965-971.
[6] UESHIMA, Y., MIZOGUCHI, S., MATSUMIYA, T., KAJIOKA, H. Analysis of solute distribution in dendrites of carbon steels with δ/γ transformation during solidification, Metallurgical Transactions B, 1986, vol. 17B, no. 4 , 845-859.
[7] KOBAYASHI, S. Solute redistribution during solidification with diffusion in solid phase: A theoretical analysis, Journal of Crystal Growth, 1988, vol. 88, no. 1, pp. 87-96
[8] YOU, D., BERNHARD, C., WIESER, G., MICHELIC, S. Microsegregation model with local equilibrium partition coefficients during solidification of steels, steel research international, 2016, vol. 87, no. 7, pp. 840-849.
[9] YAMADA, W., MATSUMIYA, T., ITO, A. Development of simulation model for composition change of nonmetallic inclusions during solidification of steels. In 6th International Iron and Steel Congress, Tokyo, 1990, pp. 618-625.
[10] BALE, C. W., BÉLISLE, E., CHARTRAND, P., DECTEROV, S. A., ERIKSSON, G., GHERIBI, A. E., HACK, K., JUNG, I.-H., KANG, Y.-B., MELANCON, J., PELTON, A. D., PETERSON, S., ROBELIN, C., SANGSTER, J., SPENCER, P., VAN ENDE, M.-A. FactSage thermochemical software and databases, 2010–2016, CALPHAD, 2016, vol. 54, pp. 35-53.
[11] PIERER, R., BERNHARD, C. On the influence of carbon on secondary dendrite arm spacing in steel, Journal of Material Science, 2008, vol. 43, no. 21, pp. 6938-6943.
May 24th - 26th 2017, Brno, Czech Republic, EU
[12] XIA, G. Untersuchungen über das mechanische Verhalten von erstarrendem Stahl unter stranggußähnlichen Bedingungen, PhD Thesis, Chair of Ferrous Metallurgy, Montanuniversitaet Leoben, 1992.
[13] KAWAWA, T. Estimation of liquidus temperatures of steel, Report of 6th Meeting on Solidification of Steel, 1973, No. 6-III-9.
[14] KAGAWA, A., OKAMOTO, T. Influence of alloying elements on temperature and composition for peritectic reaction in plain carbon steels, Materials Science and Technology, 1986, vol. 2, no. 10, pp. 997-1008.
[15] HOWE, A. Estimation of liquidus temperatures for steels, Ironmaking and Steelmaking, 1988, vol. 15, no. 3, pp. 134–142.
[16] SCHÜRMANN, E., STISOVIC, T. Berechnung der Liquidustemperatur aus der chemischen Analyse legierter Stahlschmelzen, Stahl und Eisen, 1998, vol. 118, no. 11, pp. 97–102.
[17] MIETTINEN, J., HOWE, A. A. Estimation of liquidus temperatures for steels using thermodynamic approach, Ironmaking and Steelmaking, 2000, vol. 27, no. 3, pp. 212–227.
[18] PRESOLY, P., PIERER, R., BERNHARD, C. Identification of defect prone peritectic steel grades by analyzing high temperature phase transformations, Metallurgical and Materials Transactions A, 2013, vol. 44, no. 12, 5377-5388.
[19] PIERER, R. Formulation of a new hot tearing criterion for the continuous casting process, PhD Thesis, Chair of Ferrous Metallurgy, Montanuniversitaet Leoben, 2007.
[20] ARTH, G., BERNHARD, C., ILIE, S., SCHADEN, T., PIERER, R. Experimental und numerical investigations on hot tearing during continuous casting of steel, Berg- und Hüttenmännische Monatshefte, 2015, vol. 160, no. 3, pp. 103–108.