exploring vehicle level benefits of revolutionary technology
TRANSCRIPT
energies
Article
Exploring Vehicle Level Benefits of RevolutionaryTechnology Progress via Aircraft Designand Optimization
Yaolong Liu 1,* ID , Ali Elham 2, Peter Horst 2 and Martin Hepperle 3
1 Aeronautics Research Centre Niedersachsen (NFL), Technische Universität Braunschweig,Hermann-Blenk-Straße 42, 38108 Braunschweig, Germany
2 Institute of Aircraft Design and Lightweight Structures, Technische Universität Braunschweig,Hermann-Blenk-Straße 35, 38108 Braunschweig, Germany; [email protected] (A.E.);[email protected] (P.H.)
3 Institute of Aerodynamics and Flow Technology, German Aerospace Center, Lilienthalplatz 7,38108 Braunschweig, Germany; [email protected]
* Correspondence: [email protected]; Tel.: +49-531-391-66662
Received: 15 December 2017; Accepted: 4 January 2018; Published: 10 January 2018
Abstract: It is always a strong motivation for aeronautic researchers and engineers to reduce theaircraft emissions or even to achieve emission-free air transport. In this paper, the impacts of differentgame-changing technologies together on the reduction of aircraft fuel consumption and emissions arestudied. In particular, a general tool has been developed for the technology assessment, integrationand also for the overall aircraft multidisciplinary design optimization. The validity and robustnessof the tool has been verified through comparative and sensitivity studies. The overall aircraft leveltechnology assessment and optimization showed that promising fuel efficiency improvements arepossible. Though, additional strategies are required to reach the aviation emission reduction goals forshort and medium range configurations.
Keywords: aircraft conceptual design; fuel efficiency; multidisciplinary design optimization; laminarflow control; load alleviation; modeling and simulation; technology assessment
1. Introduction
Despite the dramatic progress in the past decades, aviation industry is still facing significantpressure in reducing fuel consumptions, emissions and costs, especially when it comes to the ambitiousgoals set by aviation authorities such as Flightpath 2050 [1] in Europe. To have a quantitativeimpression, the aviation emission reduction goals in the US and in Europe for both short term andlong term are summarized in Table 1.
To realize the challenging goals aforementioned, researchers and engineers endeavor to developnew concepts and technologies. In 2013, IATA Technology Roadmap [2] has identified 24 potentialairframe and propulsion technologies which might be available for sustainable aviation in 2050 timeframe according to technology readiness level. Within the US NASA N-plus programs, a coupleof innovative airframe technologies have been identified to reduce emissions [3,4]. However, bothIATA and NASA studies have concluded that the technology development alone cannot reach thedesired emission reduction goals; novel aircraft concepts needs to be developed to achieve the targetaircraft performance. Graham et al. [5] from University of Cambridge have summarized different novelaircraft concepts proposed by aviation research communities and have concluded that ACARE andNASA emission goals cannot be achieved without developing transformational concepts. To supportthis claim, the historical development of commercial aircraft fuel efficiency since 1980 is shown in
Energies 2018, 11, 166; doi:10.3390/en11010166 www.mdpi.com/journal/energies
Energies 2018, 11, 166 2 of 22
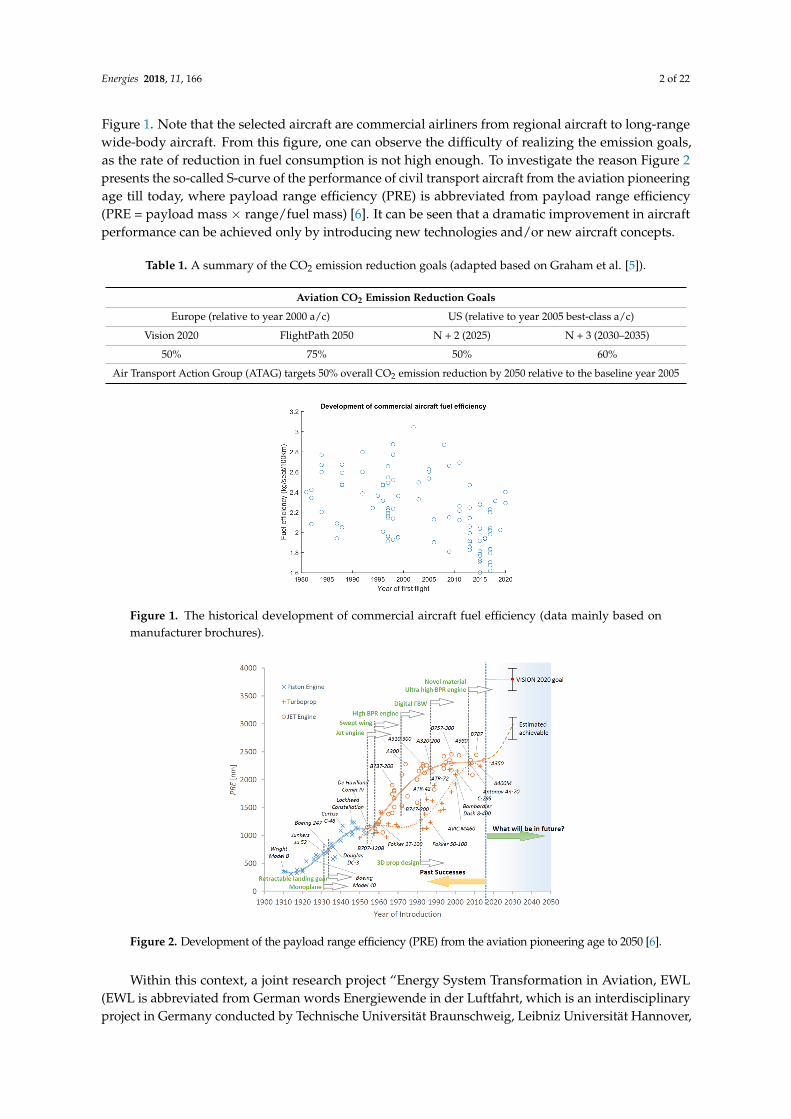
Figure 1. Note that the selected aircraft are commercial airliners from regional aircraft to long-rangewide-body aircraft. From this figure, one can observe the difficulty of realizing the emission goals,as the rate of reduction in fuel consumption is not high enough. To investigate the reason Figure 2presents the so-called S-curve of the performance of civil transport aircraft from the aviation pioneeringage till today, where payload range efficiency (PRE) is abbreviated from payload range efficiency(PRE = payload mass × range/fuel mass) [6]. It can be seen that a dramatic improvement in aircraftperformance can be achieved only by introducing new technologies and/or new aircraft concepts.
Table 1. A summary of the CO2 emission reduction goals (adapted based on Graham et al. [5]).
Aviation CO2 Emission Reduction Goals
Europe (relative to year 2000 a/c) US (relative to year 2005 best-class a/c)
Vision 2020 FlightPath 2050 N + 2 (2025) N + 3 (2030–2035)
50% 75% 50% 60%
Air Transport Action Group (ATAG) targets 50% overall CO2 emission reduction by 2050 relative to the baseline year 2005
Energies 2018, 11, 166 2 of 22
realizing the emission goals, as the rate of reduction in fuel consumption is not high enough. To investigate the reason Figure 2 presents the so-called S-curve of the performance of civil transport aircraft from the aviation pioneering age till today, where payload range efficiency (PRE) is abbreviated from payload range efficiency (PRE = payload mass × range/fuel mass) [6]. It can be seen that a dramatic improvement in aircraft performance can be achieved only by introducing new technologies and/or new aircraft concepts.
Within this context, a joint research project “Energy System Transformation in Aviation, EWL (EWL is abbreviated from German words Energiewende in der Luftfahrt, which is an interdisciplinary project in Germany conducted by Technische Universität Braunschweig, Leibniz Universität Hannover, HBK-Braunschweig, DLR, PTB and Fraunhofer-Gesellschaft)” has been initiated in Germany to identify and further study possible transformative energy systems that can be used for civil transport aircraft in combination with target game-changing technologies. In this paper, potential technologies are firstly discussed from an aircraft design perspective. Then, the overall approach and also the component modelling methodologies are presented. After that, aircraft level results for integrating different technologies are also presented. To give a better overview of the presented results, further implications of the results are discussed at the end.
Table 1. A summary of the CO2 emission reduction goals (adapted based on Graham et al. [5]).
Aviation CO2 Emission Reduction GoalsEurope (relative to year 2000 a/c) US (relative to year 2005 best-class a/c)
Vision 2020 FlightPath 2050 N + 2 (2025) N + 3 (2030–2035) 50% 75% 50% 60%
Air Transport Action Group (ATAG) targets 50% overall CO2 emission reduction by 2050 relative to the baseline year 2005
Figure 1. The historical development of commercial aircraft fuel efficiency (data mainly based on manufacturer brochures).
Figure 2. Development of the payload range efficiency (PRE) from the aviation pioneering age to 2050 [6].
Figure 1. The historical development of commercial aircraft fuel efficiency (data mainly based onmanufacturer brochures).
Energies 2018, 11, 166 2 of 22
realizing the emission goals, as the rate of reduction in fuel consumption is not high enough. To investigate the reason Figure 2 presents the so-called S-curve of the performance of civil transport aircraft from the aviation pioneering age till today, where payload range efficiency (PRE) is abbreviated from payload range efficiency (PRE = payload mass × range/fuel mass) [6]. It can be seen that a dramatic improvement in aircraft performance can be achieved only by introducing new technologies and/or new aircraft concepts.
Within this context, a joint research project “Energy System Transformation in Aviation, EWL (EWL is abbreviated from German words Energiewende in der Luftfahrt, which is an interdisciplinary project in Germany conducted by Technische Universität Braunschweig, Leibniz Universität Hannover, HBK-Braunschweig, DLR, PTB and Fraunhofer-Gesellschaft)” has been initiated in Germany to identify and further study possible transformative energy systems that can be used for civil transport aircraft in combination with target game-changing technologies. In this paper, potential technologies are firstly discussed from an aircraft design perspective. Then, the overall approach and also the component modelling methodologies are presented. After that, aircraft level results for integrating different technologies are also presented. To give a better overview of the presented results, further implications of the results are discussed at the end.
Table 1. A summary of the CO2 emission reduction goals (adapted based on Graham et al. [5]).
Aviation CO2 Emission Reduction GoalsEurope (relative to year 2000 a/c) US (relative to year 2005 best-class a/c)
Vision 2020 FlightPath 2050 N + 2 (2025) N + 3 (2030–2035) 50% 75% 50% 60%
Air Transport Action Group (ATAG) targets 50% overall CO2 emission reduction by 2050 relative to the baseline year 2005
Figure 1. The historical development of commercial aircraft fuel efficiency (data mainly based on manufacturer brochures).
Figure 2. Development of the payload range efficiency (PRE) from the aviation pioneering age to 2050 [6]. Figure 2. Development of the payload range efficiency (PRE) from the aviation pioneering age to 2050 [6].
Within this context, a joint research project “Energy System Transformation in Aviation, EWL(EWL is abbreviated from German words Energiewende in der Luftfahrt, which is an interdisciplinaryproject in Germany conducted by Technische Universität Braunschweig, Leibniz Universität Hannover,
Energies 2018, 11, 166 3 of 22
HBK-Braunschweig, DLR, PTB and Fraunhofer-Gesellschaft)” has been initiated in Germany to identifyand further study possible transformative energy systems that can be used for civil transport aircraft incombination with target game-changing technologies. In this paper, potential technologies are firstlydiscussed from an aircraft design perspective. Then, the overall approach and also the componentmodelling methodologies are presented. After that, aircraft level results for integrating differenttechnologies are also presented. To give a better overview of the presented results, further implicationsof the results are discussed at the end.
2. Overview of Game-Changing Technologies
Before illustrating the modelling approach, it is reasonable to take a look at the potential technologiesthat are investigated. As such, the game-changing aircraft-associated technologies identified within theproject are briefly discussed and the methods for preliminary studies at the aircraft level are presented.
2.1. Laminar Flow Control
Laminar and turbulent boundary layers as well as the transition are of key importance with respect toaircraft friction drag and its impact on pressure drag because drag is significantly lower for laminar flow.Together with the cumulative effects on the overall aircraft design level the laminar flow technology isa key enabler for further reductions of fuel consumption.
The development of laminar airfoils and wings had begun already in the early phases of aviationand is today well applied for glider and small aircraft [7–11]. The application for transonic aircraft isstill a challenge due to the transition of laminar to turbulent flow at the Reynolds- and Mach numbersof such aircraft. In addition, geometric surface imperfections can trigger transition too.
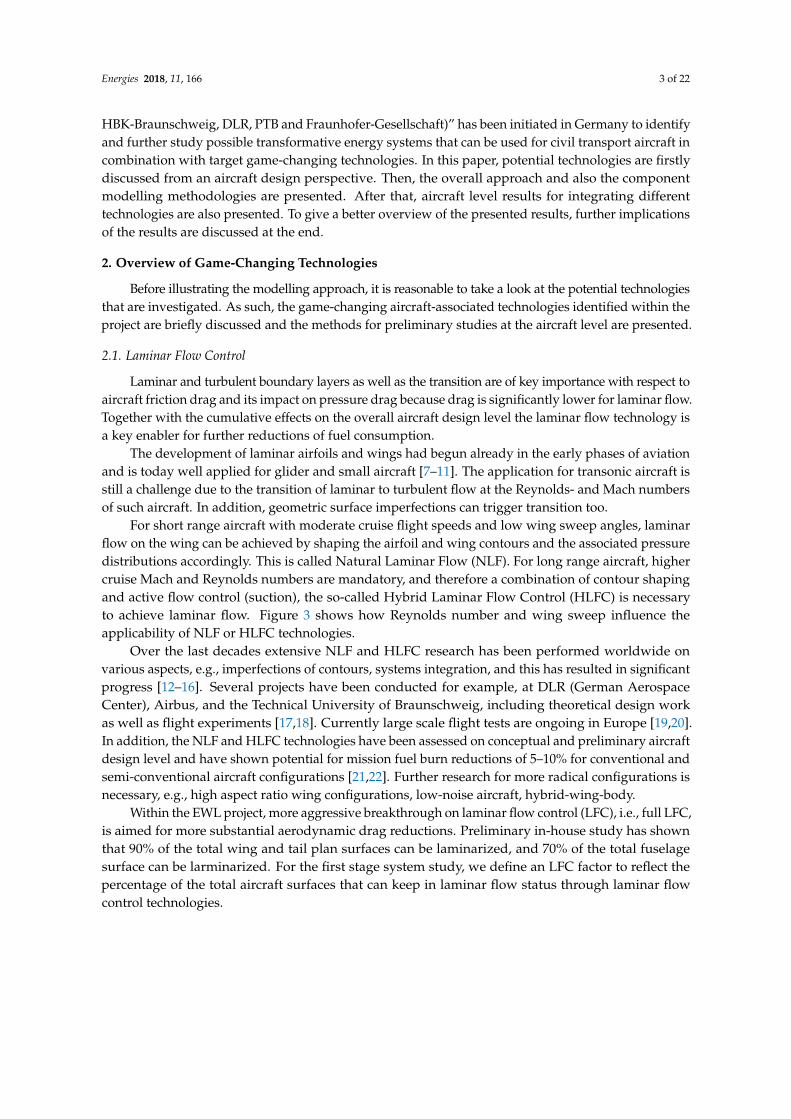
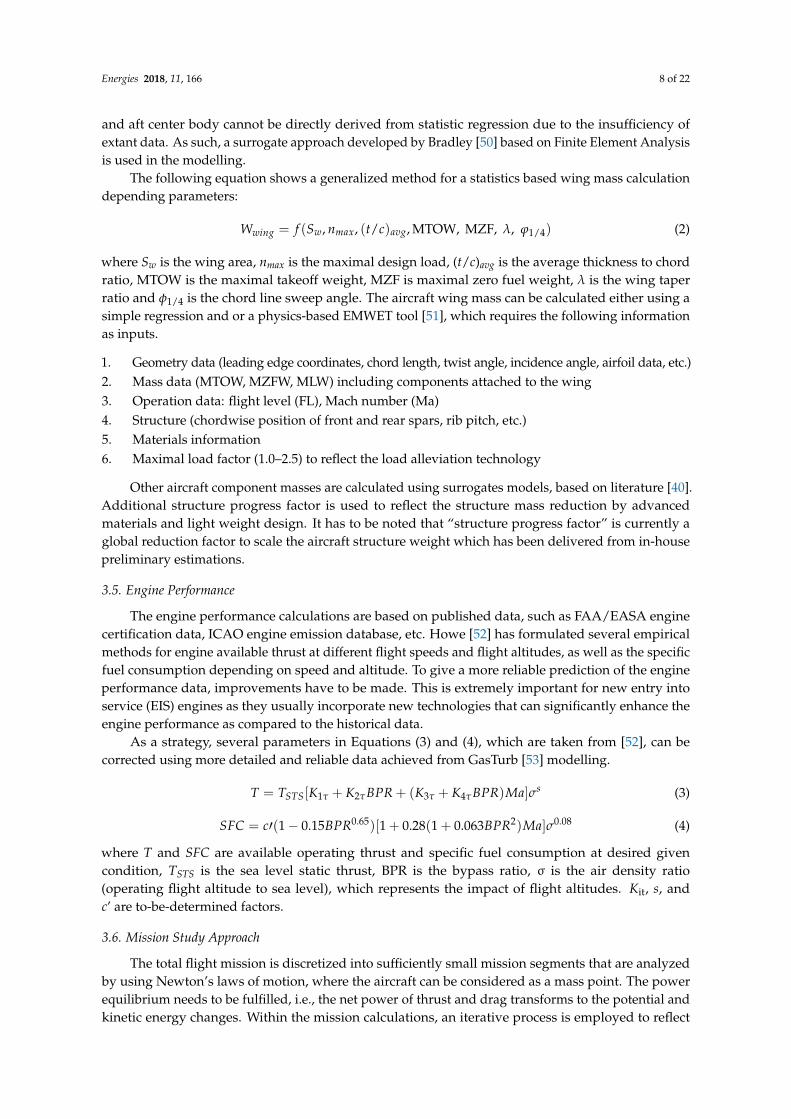
For short range aircraft with moderate cruise flight speeds and low wing sweep angles, laminarflow on the wing can be achieved by shaping the airfoil and wing contours and the associated pressuredistributions accordingly. This is called Natural Laminar Flow (NLF). For long range aircraft, highercruise Mach and Reynolds numbers are mandatory, and therefore a combination of contour shapingand active flow control (suction), the so-called Hybrid Laminar Flow Control (HLFC) is necessaryto achieve laminar flow. Figure 3 shows how Reynolds number and wing sweep influence theapplicability of NLF or HLFC technologies.
Over the last decades extensive NLF and HLFC research has been performed worldwide onvarious aspects, e.g., imperfections of contours, systems integration, and this has resulted in significantprogress [12–16]. Several projects have been conducted for example, at DLR (German AerospaceCenter), Airbus, and the Technical University of Braunschweig, including theoretical design workas well as flight experiments [17,18]. Currently large scale flight tests are ongoing in Europe [19,20].In addition, the NLF and HLFC technologies have been assessed on conceptual and preliminary aircraftdesign level and have shown potential for mission fuel burn reductions of 5–10% for conventional andsemi-conventional aircraft configurations [21,22]. Further research for more radical configurations isnecessary, e.g., high aspect ratio wing configurations, low-noise aircraft, hybrid-wing-body.
Within the EWL project, more aggressive breakthrough on laminar flow control (LFC), i.e., full LFC,is aimed for more substantial aerodynamic drag reductions. Preliminary in-house study has shownthat 90% of the total wing and tail plan surfaces can be laminarized, and 70% of the total fuselagesurface can be larminarized. For the first stage system study, we define an LFC factor to reflect thepercentage of the total aircraft surfaces that can keep in laminar flow status through laminar flowcontrol technologies.
Energies 2018, 11, 166 4 of 22
Energies 2018, 11, 166 3 of 22
2. Overview of Game-Changing Technologies
Before illustrating the modelling approach, it is reasonable to take a look at the potential technologies that are investigated. As such, the game-changing aircraft-associated technologies identified within the project are briefly discussed and the methods for preliminary studies at the aircraft level are presented.
2.1. Laminar Flow Control
Laminar and turbulent boundary layers as well as the transition are of key importance with respect to aircraft friction drag and its impact on pressure drag because drag is significantly lower for laminar flow. Together with the cumulative effects on the overall aircraft design level the laminar flow technology is a key enabler for further reductions of fuel consumption.
The development of laminar airfoils and wings had begun already in the early phases of aviation and is today well applied for glider and small aircraft [7–11]. The application for transonic aircraft is still a challenge due to the transition of laminar to turbulent flow at the Reynolds- and Mach numbers of such aircraft. In addition, geometric surface imperfections can trigger transition too.
For short range aircraft with moderate cruise flight speeds and low wing sweep angles, laminar flow on the wing can be achieved by shaping the airfoil and wing contours and the associated pressure distributions accordingly. This is called Natural Laminar Flow (NLF). For long range aircraft, higher cruise Mach and Reynolds numbers are mandatory, and therefore a combination of contour shaping and active flow control (suction), the so-called Hybrid Laminar Flow Control (HLFC) is necessary to achieve laminar flow. Figure 3 shows how Reynolds number and wing sweep influence the applicability of NLF or HLFC technologies.
Over the last decades extensive NLF and HLFC research has been performed worldwide on various aspects, e.g., imperfections of contours, systems integration, and this has resulted in significant progress [12–16]. Several projects have been conducted for example, at DLR (German Aerospace Center), Airbus, and the Technical University of Braunschweig, including theoretical design work as well as flight experiments [17,18]. Currently large scale flight tests are ongoing in Europe [19,20]. In addition, the NLF and HLFC technologies have been assessed on conceptual and preliminary aircraft design level and have shown potential for mission fuel burn reductions of 5–10% for conventional and semi-conventional aircraft configurations [21,22]. Further research for more radical configurations is necessary, e.g., high aspect ratio wing configurations, low-noise aircraft, hybrid-wing-body.
LFC - B-18, slot ted glove, f light tests6-series airfoils, Langley LPTP tests
0 5 10 15 20 25 30 35 40 45 50ϕLE
0
5
10
15
20
25
Re / 10T
6
TS TS+CF CF
King Cobra, f light testAmes 12-f t wind tunnel testsNLF - F-111/TACT f light testNLF - Boeing 757 glove f light testNLF - F-14 VSTFE f light test , M=0.6 ... 0.8
NLF
LFC
HLF - DLR-ONERA-Airbus A320 f in 50%, S1MA, M=0.7HLF - LATEC A320 f in, f light test , M=0.78
30
LFC - RAE Vampire, f light tests
t ransit ion mechanism
M=0.80
M=0.75
M=0.70
M=0.80
M=1.16M=0.9
M=1.1
NLF - F-15, f light test , M=0.9 ... 1.2
HLF - ALTTA A320 f in, simplif ied system, M=0.78 Figure 3. Applicability of Natural Laminar Flow (NLF) and Hybrid Laminar Flow Control (HLFC) for Reynolds number and wing sweep with respect to transition to Tollmien-Schlichtung (TS) and Cross-Flow (CF) instability mechanisms; experimental data included [23].
Figure 3. Applicability of Natural Laminar Flow (NLF) and Hybrid Laminar Flow Control (HLFC)for Reynolds number and wing sweep with respect to transition to Tollmien-Schlichtung (TS) andCross-Flow (CF) instability mechanisms; experimental data included [23].
2.2. Active Load Alleviation
In general, aircraft is designed for extreme maneuver and gust load cases, which leads to heavystructure mass. Through maneuver and gust load alleviation technologies, the structure mass can besignificantly decreased. For example, the NASA Sugar Volt design assumes that a properly designedactive load alleviation system can reduce the wing weight by 25% [24].
The latest aircraft models produced by industry already incorporate several load alleviationtechnologies. Within the Airbus family these range from static application of differential flap settings toincrease the maximum takeoff mass over relatively slow maneuver load alleviation functions coveringsymmetrical as well as asymmetrical maneuvers (e.g., A350) up to systems for the dynamic control ofelastic modes and flutter (e.g., A320neo).
Today, it is not clear how large the potential of fully exploiting dynamic load alleviation techniquesreally is. Research in the past was often limited by computational and modeling capabilities,and by restrictions due to the then available sensor and actuator technology. Today, with theavailability of advanced simulation tools and the introduction of more flexible electric actuationsystems, more capable control systems and design for deformation using composite materials it shouldbe possible to obtain larger benefits than in the past. Therefore, it is of interest to assess the potential ofaggressive load alleviation techniques and then to design and optimize aircraft for rigorous applicationof this technique. The reduction of the loads via application of all available aerodynamic controldevices coupled with the tailoring of the elastic properties of the flexible wing and the consideration ofthe control system early in the design phase could lead to a considerable reduction of the wing mass.We assume that by taking load control fully into account already in the early stages of aircraft design,the potential of this technology could be exploited much better than in current designs.
Preliminary studies [24–28] have shown that the application of flap systems for static gust andlow dynamics maneuver load control has a potential to reduce takeoff mass and fuel consumptionof long range transport aircraft. More aggressive load alleviation techniques and a wing planformdesigned to exploit these functions, as well as adapted thickness respectively, stiffness distributionsare expected to increase the benefits to about a 25% reduction of the mass of the wing box, which canresult in a 7% reduction of the fuel consumption [29].
Energies 2018, 11, 166 5 of 22
The limit case would be a wing, designed as a dynamic spanload, minimizing the bending momentall over the wing span in all maneuver and gust cases dramatically. For example, in a symmetric 2.5 gload case, all additional loads due to the inertia of the fuselage and payload would be shifted towardsthe symmetry plane by deploying wing and possibly fuselage flaps. Also a wider fuselage cross sectioncould help to shift the load more inboard. The inertia loads due to wing, engines and fuel mass wouldbe compensated by adaptation of the lift distribution in the outer wing.
2.3. Technology for New Structure and Materails
One important way to enhance the aircraft fuel efficiency is to reduce the structure weightthrough introducing new metals and new composites with better material/structural properties [3].In addition, new structure design and manufacturing concepts can also lead to aircraft structureweight savings. Researchers from NASA have carried out a comprehensive overview of the prevalentstructure technologies potentially available for improving aircraft fuel efficiency [3]. As highlighted bythe review, stitched composites are seen to be one promising solution for low-cost and lightweightstructures, which can give around 10% weight reduction relative to a baseline with advanced compositesandwich structure [3]. Electronic Beam Free Form Fabrication (EBF3) manufacturing is considered as abreakthrough for saving structure weight associated with significant cost and lead-time reductions [3].
Besides, Structural Health Monitoring (SHM) has also been identified as a promising technologyfor weight reduction by IATA Technology Roadmap [2] and NASA [30].
Except for the state-of-the-art material and structure developments, one very important taskfor structure research is to support other game-changing technologies, such as LFC and active loadalleviation. For example, LFC requires porous structure, where multiple-shell structure can providesuitable differential pressure through suction plenum that is formed by tailoring.
A challenging aspect comes when the structure on the one hand has to fulfill additional requirementsfor future unconventional applications, but also for reducing the operation empty weigh itself. As such,radical new paradigms for structure studies are necessary.
Within the EWL project, a total structure weight reduction by 20% relative to today’s technologyhas been preliminarily estimated.
2.4. Boundary Layer Ingestion
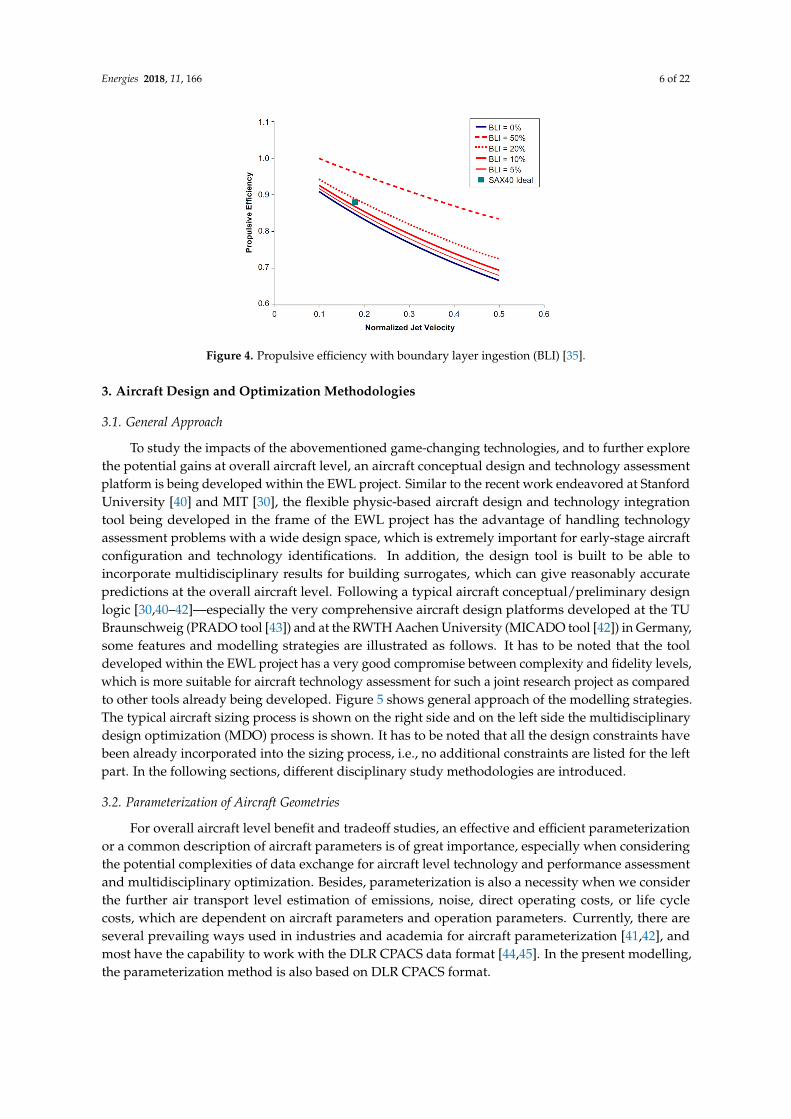
The main motivation of boundary layer ingestion is to make use of the boundary layer flow forimproving the engine propulsive efficiency [31], i.e., “propulsor ingests and reaccelerates airframeboundary layer” [32]. Figure 4 shows a comparative study of the boundary layer ingestion (BLI) effecton propulsive efficiency.
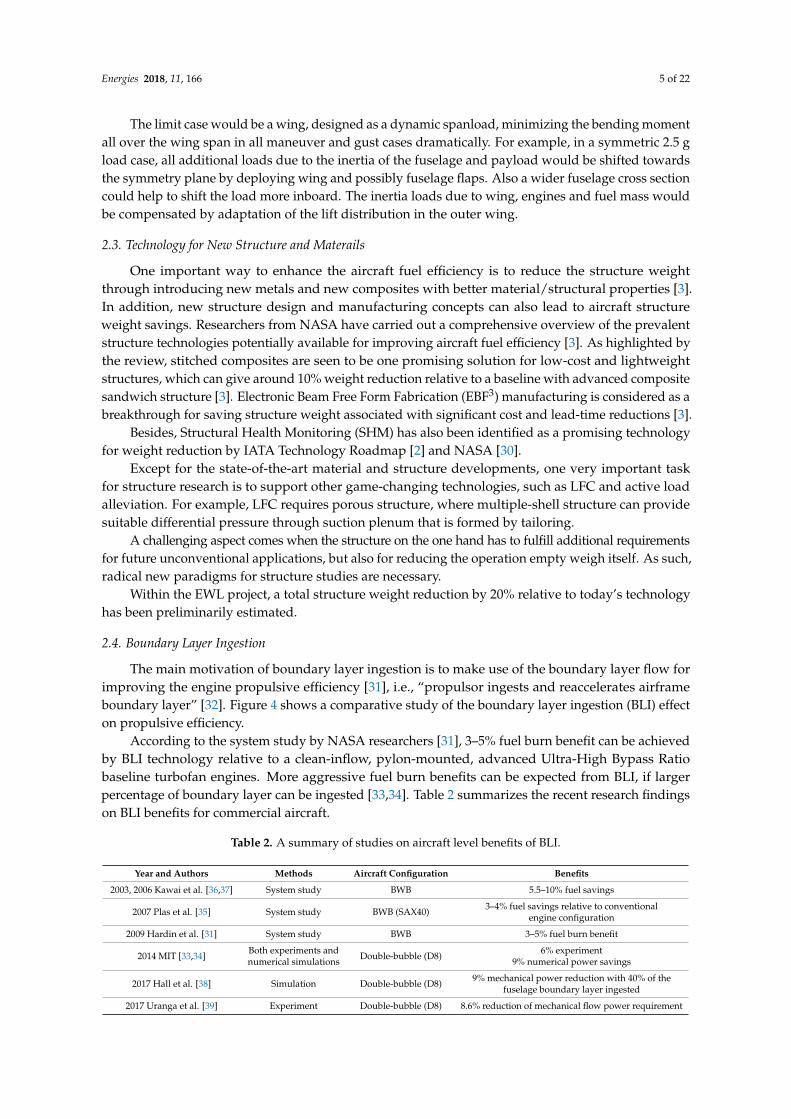
According to the system study by NASA researchers [31], 3–5% fuel burn benefit can be achievedby BLI technology relative to a clean-inflow, pylon-mounted, advanced Ultra-High Bypass Ratiobaseline turbofan engines. More aggressive fuel burn benefits can be expected from BLI, if largerpercentage of boundary layer can be ingested [33,34]. Table 2 summarizes the recent research findingson BLI benefits for commercial aircraft.
Table 2. A summary of studies on aircraft level benefits of BLI.
Year and Authors Methods Aircraft Configuration Benefits
2003, 2006 Kawai et al. [36,37] System study BWB 5.5–10% fuel savings
2007 Plas et al. [35] System study BWB (SAX40) 3–4% fuel savings relative to conventionalengine configuration
2009 Hardin et al. [31] System study BWB 3–5% fuel burn benefit
2014 MIT [33,34] Both experiments andnumerical simulations Double-bubble (D8) 6% experiment
9% numerical power savings
2017 Hall et al. [38] Simulation Double-bubble (D8) 9% mechanical power reduction with 40% of thefuselage boundary layer ingested
2017 Uranga et al. [39] Experiment Double-bubble (D8) 8.6% reduction of mechanical flow power requirement
Energies 2018, 11, 166 6 of 22
Energies 2018, 11, 166 5 of 22
considered as a breakthrough for saving structure weight associated with significant cost and lead-time reductions [3].
Besides, Structural Health Monitoring (SHM) has also been identified as a promising technology for weight reduction by IATA Technology Roadmap [2] and NASA [30].
Except for the state-of-the-art material and structure developments, one very important task for structure research is to support other game-changing technologies, such as LFC and active load alleviation. For example, LFC requires porous structure, where multiple-shell structure can provide suitable differential pressure through suction plenum that is formed by tailoring.
A challenging aspect comes when the structure on the one hand has to fulfill additional requirements for future unconventional applications, but also for reducing the operation empty weigh itself. As such, radical new paradigms for structure studies are necessary.
Within the EWL project, a total structure weight reduction by 20% relative to today’s technology has been preliminarily estimated.
2.4. Boundary Layer Ingestion
The main motivation of boundary layer ingestion is to make use of the boundary layer flow for improving the engine propulsive efficiency [31], i.e., “propulsor ingests and reaccelerates airframe boundary layer” [32]. Figure 4 shows a comparative study of the boundary layer ingestion (BLI) effect on propulsive efficiency.
According to the system study by NASA researchers [31], 3–5% fuel burn benefit can be achieved by BLI technology relative to a clean-inflow, pylon-mounted, advanced Ultra-High Bypass Ratio baseline turbofan engines. More aggressive fuel burn benefits can be expected from BLI, if larger percentage of boundary layer can be ingested [33,34]. Table 2 summarizes the recent research findings on BLI benefits for commercial aircraft.
Figure 4. Propulsive efficiency with boundary layer ingestion (BLI) [35].
Table 2. A summary of studies on aircraft level benefits of BLI.
Year and Authors Methods Aircraft Configuration
Benefits
2003, 2006 Kawai et al. [36,37] System study BWB 5.5–10% fuel savings
2007 Plas et al. [35] System study BWB (SAX40) 3–4% fuel savings relative to conventional
engine configuration 2009 Hardin et al.
[31] System study BWB 3–5% fuel burn benefit
2014 MIT [33,34] Both experiments and numerical simulations
Double-bubble (D8)
6% experiment 9% numerical power savings
2017 Hall et al. [38] Simulation Double-bubble
(D8) 9% mechanical power reduction with 40% of
the fuselage boundary layer ingested 2017 Uranga et al.
[39] Experiment
Double-bubble (D8)
8.6% reduction of mechanical flow power requirement
Figure 4. Propulsive efficiency with boundary layer ingestion (BLI) [35].
3. Aircraft Design and Optimization Methodologies
3.1. General Approach
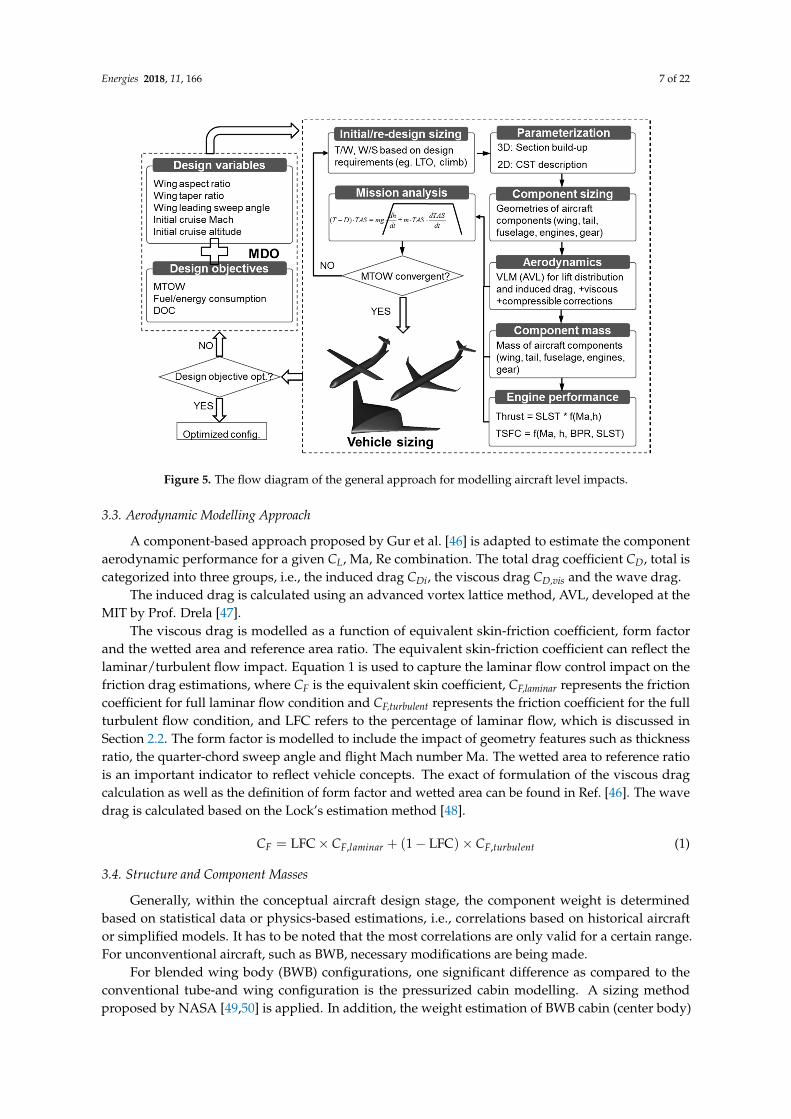
To study the impacts of the abovementioned game-changing technologies, and to further explorethe potential gains at overall aircraft level, an aircraft conceptual design and technology assessmentplatform is being developed within the EWL project. Similar to the recent work endeavored at StanfordUniversity [40] and MIT [30], the flexible physic-based aircraft design and technology integrationtool being developed in the frame of the EWL project has the advantage of handling technologyassessment problems with a wide design space, which is extremely important for early-stage aircraftconfiguration and technology identifications. In addition, the design tool is built to be able toincorporate multidisciplinary results for building surrogates, which can give reasonably accuratepredictions at the overall aircraft level. Following a typical aircraft conceptual/preliminary designlogic [30,40–42]—especially the very comprehensive aircraft design platforms developed at the TUBraunschweig (PRADO tool [43]) and at the RWTH Aachen University (MICADO tool [42]) in Germany,some features and modelling strategies are illustrated as follows. It has to be noted that the tooldeveloped within the EWL project has a very good compromise between complexity and fidelity levels,which is more suitable for aircraft technology assessment for such a joint research project as comparedto other tools already being developed. Figure 5 shows general approach of the modelling strategies.The typical aircraft sizing process is shown on the right side and on the left side the multidisciplinarydesign optimization (MDO) process is shown. It has to be noted that all the design constraints havebeen already incorporated into the sizing process, i.e., no additional constraints are listed for the leftpart. In the following sections, different disciplinary study methodologies are introduced.
3.2. Parameterization of Aircraft Geometries
For overall aircraft level benefit and tradeoff studies, an effective and efficient parameterizationor a common description of aircraft parameters is of great importance, especially when consideringthe potential complexities of data exchange for aircraft level technology and performance assessmentand multidisciplinary optimization. Besides, parameterization is also a necessity when we considerthe further air transport level estimation of emissions, noise, direct operating costs, or life cyclecosts, which are dependent on aircraft parameters and operation parameters. Currently, there areseveral prevailing ways used in industries and academia for aircraft parameterization [41,42], andmost have the capability to work with the DLR CPACS data format [44,45]. In the present modelling,the parameterization method is also based on DLR CPACS format.
Energies 2018, 11, 166 7 of 22
Energies 2018, 11, 166 6 of 22
3. Aircraft Design and Optimization Methodologies
3.1. General Approach
To study the impacts of the abovementioned game-changing technologies, and to further explore the potential gains at overall aircraft level, an aircraft conceptual design and technology assessment platform is being developed within the EWL project. Similar to the recent work endeavored at Stanford University [40] and MIT [30], the flexible physic-based aircraft design and technology integration tool being developed in the frame of the EWL project has the advantage of handling technology assessment problems with a wide design space, which is extremely important for early-stage aircraft configuration and technology identifications. In addition, the design tool is built to be able to incorporate multidisciplinary results for building surrogates, which can give reasonably accurate predictions at the overall aircraft level. Following a typical aircraft conceptual/preliminary design logic [30,40–42]—especially the very comprehensive aircraft design platforms developed at the TU Braunschweig (PRADO tool [43]) and at the RWTH Aachen University (MICADO tool [42]) in Germany, some features and modelling strategies are illustrated as follows. It has to be noted that the tool developed within the EWL project has a very good compromise between complexity and fidelity levels, which is more suitable for aircraft technology assessment for such a joint research project as compared to other tools already being developed. Figure 5 shows general approach of the modelling strategies. The typical aircraft sizing process is shown on the right side and on the left side the multidisciplinary design optimization (MDO) process is shown. It has to be noted that all the design constraints have been already incorporated into the sizing process, i.e., no additional constraints are listed for the left part. In the following sections, different disciplinary study methodologies are introduced.
Figure 5. The flow diagram of the general approach for modelling aircraft level impacts.
Figure 5. The flow diagram of the general approach for modelling aircraft level impacts.
3.3. Aerodynamic Modelling Approach
A component-based approach proposed by Gur et al. [46] is adapted to estimate the componentaerodynamic performance for a given CL, Ma, Re combination. The total drag coefficient CD, total iscategorized into three groups, i.e., the induced drag CDi, the viscous drag CD,vis and the wave drag.
The induced drag is calculated using an advanced vortex lattice method, AVL, developed at theMIT by Prof. Drela [47].
The viscous drag is modelled as a function of equivalent skin-friction coefficient, form factorand the wetted area and reference area ratio. The equivalent skin-friction coefficient can reflect thelaminar/turbulent flow impact. Equation 1 is used to capture the laminar flow control impact on thefriction drag estimations, where CF is the equivalent skin coefficient, CF,laminar represents the frictioncoefficient for full laminar flow condition and CF,turbulent represents the friction coefficient for the fullturbulent flow condition, and LFC refers to the percentage of laminar flow, which is discussed inSection 2.2. The form factor is modelled to include the impact of geometry features such as thicknessratio, the quarter-chord sweep angle and flight Mach number Ma. The wetted area to reference ratiois an important indicator to reflect vehicle concepts. The exact of formulation of the viscous dragcalculation as well as the definition of form factor and wetted area can be found in Ref. [46]. The wavedrag is calculated based on the Lock’s estimation method [48].
CF = LFC× CF,laminar + (1− LFC)× CF,turbulent (1)
3.4. Structure and Component Masses
Generally, within the conceptual aircraft design stage, the component weight is determinedbased on statistical data or physics-based estimations, i.e., correlations based on historical aircraftor simplified models. It has to be noted that the most correlations are only valid for a certain range.For unconventional aircraft, such as BWB, necessary modifications are being made.
For blended wing body (BWB) configurations, one significant difference as compared to theconventional tube-and wing configuration is the pressurized cabin modelling. A sizing methodproposed by NASA [49,50] is applied. In addition, the weight estimation of BWB cabin (center body)
Energies 2018, 11, 166 8 of 22
and aft center body cannot be directly derived from statistic regression due to the insufficiency ofextant data. As such, a surrogate approach developed by Bradley [50] based on Finite Element Analysisis used in the modelling.
The following equation shows a generalized method for a statistics based wing mass calculationdepending parameters:
Wwing = f (Sw, nmax, (t/c)avg, MTOW, MZF, λ, ϕ1/4) (2)
where Sw is the wing area, nmax is the maximal design load, (t/c)avg is the average thickness to chordratio, MTOW is the maximal takeoff weight, MZF is maximal zero fuel weight, λ is the wing taperratio and φ1/4 is the chord line sweep angle. The aircraft wing mass can be calculated either using asimple regression and or a physics-based EMWET tool [51], which requires the following informationas inputs.
1. Geometry data (leading edge coordinates, chord length, twist angle, incidence angle, airfoil data, etc.)2. Mass data (MTOW, MZFW, MLW) including components attached to the wing3. Operation data: flight level (FL), Mach number (Ma)4. Structure (chordwise position of front and rear spars, rib pitch, etc.)5. Materials information6. Maximal load factor (1.0–2.5) to reflect the load alleviation technology
Other aircraft component masses are calculated using surrogates models, based on literature [40].Additional structure progress factor is used to reflect the structure mass reduction by advancedmaterials and light weight design. It has to be noted that “structure progress factor” is currently aglobal reduction factor to scale the aircraft structure weight which has been delivered from in-housepreliminary estimations.
3.5. Engine Performance
The engine performance calculations are based on published data, such as FAA/EASA enginecertification data, ICAO engine emission database, etc. Howe [52] has formulated several empiricalmethods for engine available thrust at different flight speeds and flight altitudes, as well as the specificfuel consumption depending on speed and altitude. To give a more reliable prediction of the engineperformance data, improvements have to be made. This is extremely important for new entry intoservice (EIS) engines as they usually incorporate new technologies that can significantly enhance theengine performance as compared to the historical data.
As a strategy, several parameters in Equations (3) and (4), which are taken from [52], can becorrected using more detailed and reliable data achieved from GasTurb [53] modelling.
T = TSTS[K1τ + K2τ BPR + (K3τ + K4τ BPR)Ma]σs (3)
SFC = c′(1− 0.15BPR0.65)[1 + 0.28(1 + 0.063BPR2)Ma]σ0.08 (4)
where T and SFC are available operating thrust and specific fuel consumption at desired givencondition, TSTS is the sea level static thrust, BPR is the bypass ratio, σ is the air density ratio(operating flight altitude to sea level), which represents the impact of flight altitudes. Kit, s, andc’ are to-be-determined factors.
3.6. Mission Study Approach
The total flight mission is discretized into sufficiently small mission segments that are analyzedby using Newton’s laws of motion, where the aircraft can be considered as a mass point. The powerequilibrium needs to be fulfilled, i.e., the net power of thrust and drag transforms to the potential andkinetic energy changes. Within the mission calculations, an iterative process is employed to reflect
Energies 2018, 11, 166 9 of 22
the changes of variables in each mission segment. The aerodynamic polar and engine performanceparameters are interpolated for the full flight mission usage, which, as mentioned earlier, are dependenton flight Mach number and flight altitude.
The mission tool has employed the conditions for more realistic operation conditions. In particular,the lift-to-drag ratio L/D has been considered as a function of true airspeed (TAS), flight altitude (h) andthe current aircraft mass (m) which is updated by the fuel consumption in previous mission segment.Similarly, the specific fuel consumption (SFC) varies with TAS, h and the engine thrust (T) that isdetermined by the current aerodynamic drag.
In each mission segment, the basic relationship is fulfilled: power of thrust and drag = rate ofchange of potential energy + rate of change of kinetic energy + secondary power off-takes. The wholemission iterates till the design range is reached. As operation conditions also play very important rolesin the aircraft fuel consumptions. To avoid additional impacts from operational aspects, predefinedflight profile that are typical for each aircraft types have been assumed for fuel burn calculations.The predefined flight profile satisfies flight constraints such as flight physics constraints and engineperformance constraints.
4. Results
In this section, overall aircraft level results are presented for three different configurations.The reference aircraft configuration with year-2000 technologies are summarized first for furthercomparison studies, i.e., the EWL developed aircraft concepts and identified technologies for 2050 willbe checked with the Flightpath 2050 goals. Then, an overall aircraft level verification study of the toolsas well as sensitivity studies of new technologies are carried out. After that, the fuel efficiency resultsfor optimal aircraft configurations with year-2050 best assumed technology scenarios will be presentedand compared with data of baseline configurations.
4.1. Baseline Configurations
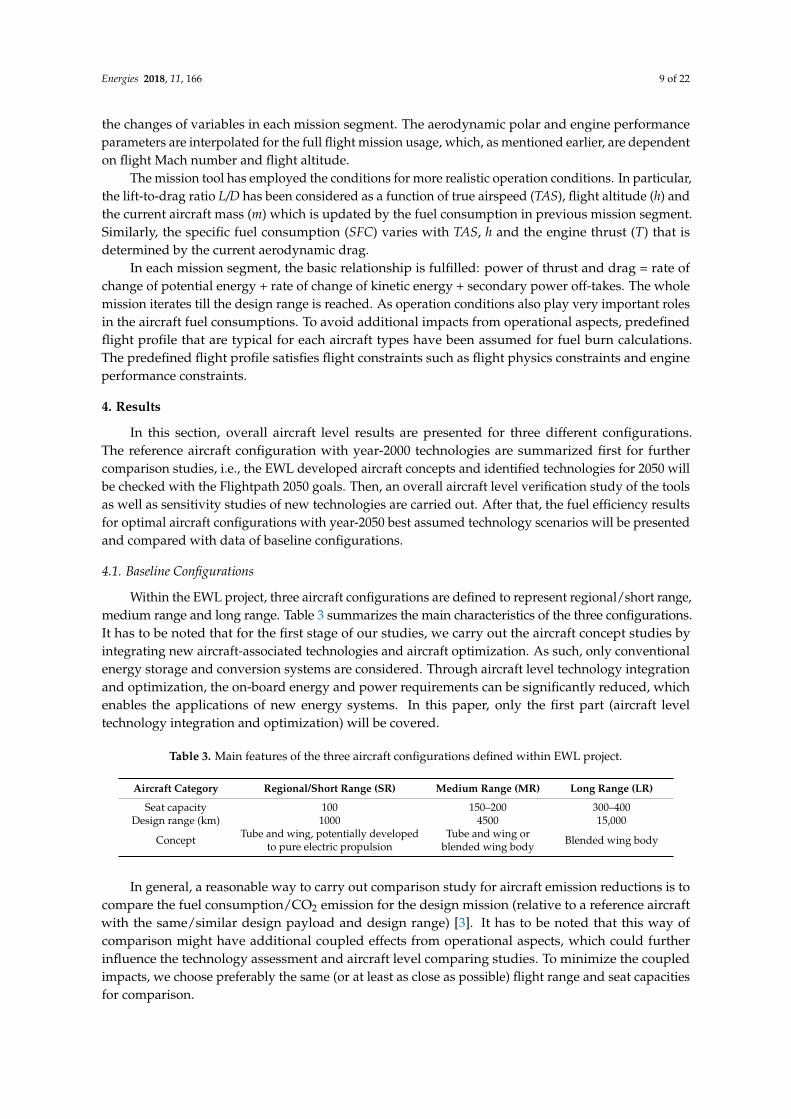
Within the EWL project, three aircraft configurations are defined to represent regional/short range,medium range and long range. Table 3 summarizes the main characteristics of the three configurations.It has to be noted that for the first stage of our studies, we carry out the aircraft concept studies byintegrating new aircraft-associated technologies and aircraft optimization. As such, only conventionalenergy storage and conversion systems are considered. Through aircraft level technology integrationand optimization, the on-board energy and power requirements can be significantly reduced, whichenables the applications of new energy systems. In this paper, only the first part (aircraft leveltechnology integration and optimization) will be covered.
Table 3. Main features of the three aircraft configurations defined within EWL project.
Aircraft Category Regional/Short Range (SR) Medium Range (MR) Long Range (LR)
Seat capacity 100 150–200 300–400Design range (km) 1000 4500 15,000
Concept Tube and wing, potentially developedto pure electric propulsion
Tube and wing orblended wing body Blended wing body
In general, a reasonable way to carry out comparison study for aircraft emission reductions is tocompare the fuel consumption/CO2 emission for the design mission (relative to a reference aircraftwith the same/similar design payload and design range) [3]. It has to be noted that this way ofcomparison might have additional coupled effects from operational aspects, which could furtherinfluence the technology assessment and aircraft level comparing studies. To minimize the coupledimpacts, we choose preferably the same (or at least as close as possible) flight range and seat capacitiesfor comparison.
Energies 2018, 11, 166 10 of 22
In this section, fuel efficiency (generally carbon emission can be seen proportional to fuel consumption)is used to show the overall aircraft level benefits through technology progress. As such, Table 4 lists thedata for regional/short, medium, long range reference aircraft, which includes aircraft types, year offirst flight, typical seat capacity, design range, and fuel efficiency for design range with typical payload.
Table 4. Representative data for regional/short, medium, long range reference aircraft (fuel efficiencydata compiled based on manufacture brochures and literature [54]).
Items Regional/Short Range Medium Range Long Range
Representative types ATR72–500
BombardierCRJ900
EmbraerE-Jet-170
AirbusA320-200
Boeing737–800
AirbusA330-200
Boeing777–200ER
Year of first flight 1997 2001 2002 1993 1997 1997 1996
Seat capacity (typical) 68 86 66 150 174 295 301
Design range (km) 1452 2553 3982 5090 5575 11,000 11,000
Fuel efficiency at typicalpayload and design
range (kg/seat/100 km)2.03 2.29 3.04 1.93 1.80 2.33 2.69
For better representation, we have selected not only turboprop but also turbofan aircraft modelsfor the studies of the regional/short range aircraft group. The medium range and long range flightgroups, we have chosen one Airbus aircraft and one Boeing aircraft, respectively. The data inTable 4 are derived from official brochures of the corresponding manufactures. To be compatiblewith the Flightpath 2050 requirements, the best fuel-efficiency aircraft in each category are chosen,i.e., 2.03 kg/seat/100 km for regional/short range category, 1.80 kg/seat/100 km for medium rangecategory and 2.33 kg/seat/100 km for long range category.
4.2. Verification
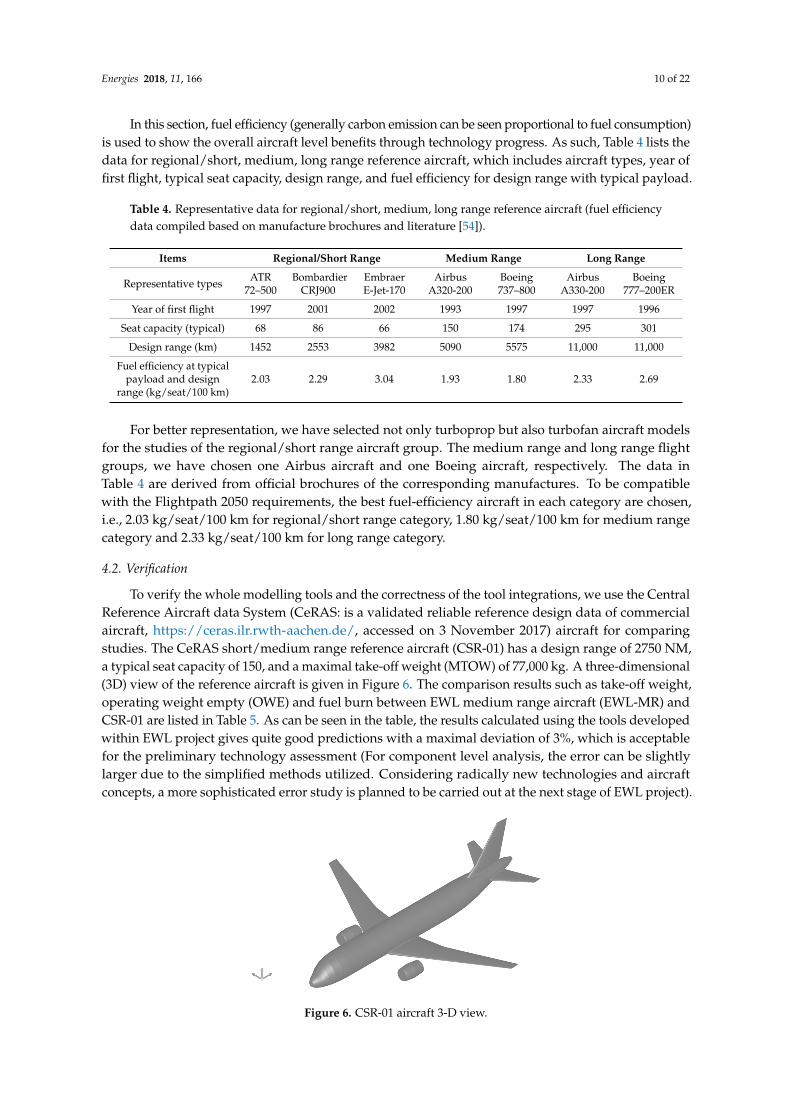
To verify the whole modelling tools and the correctness of the tool integrations, we use the CentralReference Aircraft data System (CeRAS: is a validated reliable reference design data of commercialaircraft, https://ceras.ilr.rwth-aachen.de/, accessed on 3 November 2017) aircraft for comparingstudies. The CeRAS short/medium range reference aircraft (CSR-01) has a design range of 2750 NM,a typical seat capacity of 150, and a maximal take-off weight (MTOW) of 77,000 kg. A three-dimensional(3D) view of the reference aircraft is given in Figure 6. The comparison results such as take-off weight,operating weight empty (OWE) and fuel burn between EWL medium range aircraft (EWL-MR) andCSR-01 are listed in Table 5. As can be seen in the table, the results calculated using the tools developedwithin EWL project gives quite good predictions with a maximal deviation of 3%, which is acceptablefor the preliminary technology assessment (For component level analysis, the error can be slightlylarger due to the simplified methods utilized. Considering radically new technologies and aircraftconcepts, a more sophisticated error study is planned to be carried out at the next stage of EWL project).
Energies 2018, 11, 166 10 of 22
Table 4. Representative data for regional/short, medium, long range reference aircraft (fuel efficiency data compiled based on manufacture brochures and literature [54]).
Items Regional/Short Range Medium Range Long Range
Representative types ATR 72–500 Bombardier
CRJ900 Embraer E-Jet-170
Airbus A320-200
Boeing 737–800
Airbus A330-200
Boeing 777–200ER
Year of first flight 1997 2001 2002 1993 1997 1997 1996 Seat capacity (typical) 68 86 66 150 174 295 301
Design range (km) 1452 2553 3982 5090 5575 11000 11000 Fuel efficiency at
typical payload and design range
(kg/seat/100 km)
2.03 2.29 3.04 1.93 1.80 2.33 2.69
4.2. Verification
To verify the whole modelling tools and the correctness of the tool integrations, we use the Central Reference Aircraft data System (CeRAS: is a validated reliable reference design data of commercial aircraft, https://ceras.ilr.rwth-aachen.de/, accessed on 3 November 2017) aircraft for comparing studies. The CeRAS short/medium range reference aircraft (CSR-01) has a design range of 2750 NM, a typical seat capacity of 150, and a maximal take-off weight (MTOW) of 77,000 kg. A three-dimensional (3D) view of the reference aircraft is given in Figure 6. The comparison results such as take-off weight, operating weight empty (OWE) and fuel burn between EWL medium range aircraft (EWL-MR) and CSR-01 are listed in Table 5. As can be seen in the table, the results calculated using the tools developed within EWL project gives quite good predictions with a maximal deviation of 3%, which is acceptable for the preliminary technology assessment (For component level analysis, the error can be slightly larger due to the simplified methods utilized. Considering radically new technologies and aircraft concepts, a more sophisticated error study is planned to be carried out at the next stage of EWL project).
Figure 6. CSR-01 aircraft 3-D view.
Table 5. Comparison of the major aircraft design results between CSR-01 and EWL-MR.
Parameter CSR-01 EWL-MR Deviation (%) Passenger number 150 150 - Design range (NM) 2750 2750 - Take-off weight (kg) 74,102 75,157 1.42
OWE (kg) 42,100 42,035 −0.15 Fuel burn (kg) 15,420 15,835 3.05
4.3. Sensitivity Study of Technology Progress
In this sub-section, sensitivity studies are carried out to show the impacts of different technologies addressed in Section 2. In addition, the overall aircraft level impacts of wing aspect ratio are also discussed.
Figure 6. CSR-01 aircraft 3-D view.
Energies 2018, 11, 166 11 of 22
Table 5. Comparison of the major aircraft design results between CSR-01 and EWL-MR.
Parameter CSR-01 EWL-MR Deviation (%)
Passenger number 150 150 -Design range (NM) 2750 2750 -Take-off weight (kg) 74,102 75,157 1.42
OWE (kg) 42,100 42,035 −0.15Fuel burn (kg) 15,420 15,835 3.05
4.3. Sensitivity Study of Technology Progress
In this sub-section, sensitivity studies are carried out to show the impacts of different technologiesaddressed in Section 2. In addition, the overall aircraft level impacts of wing aspect ratio are also discussed.
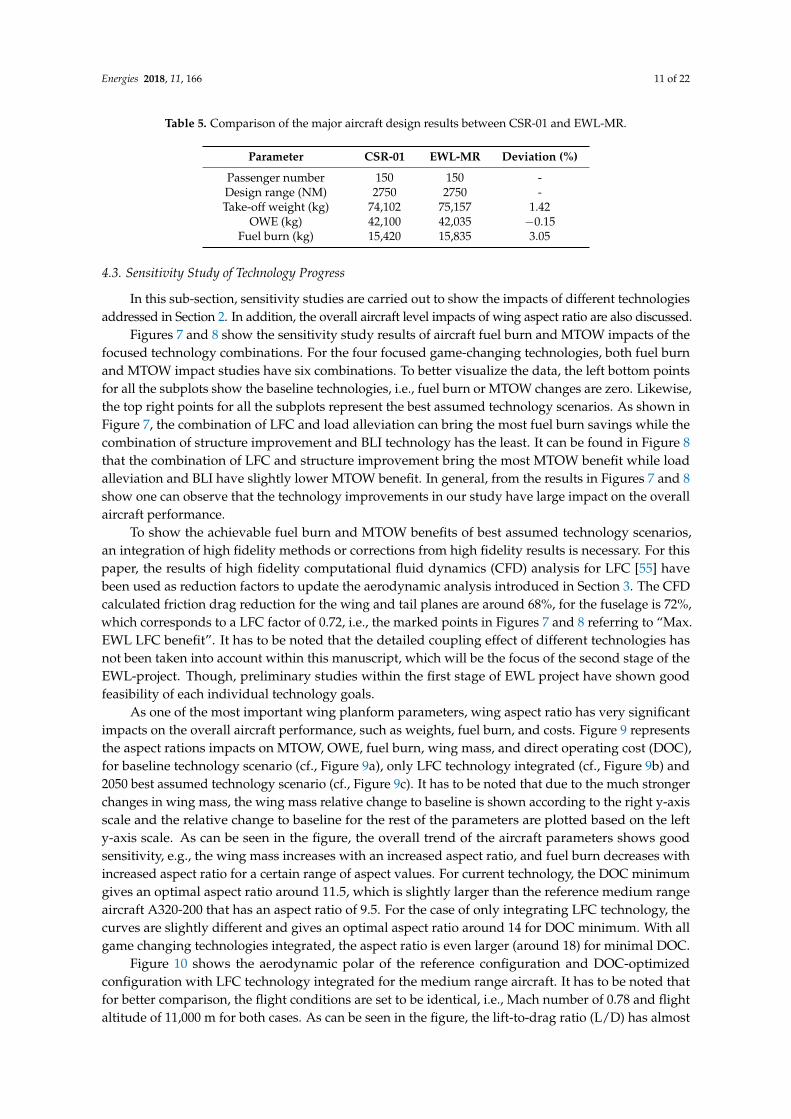
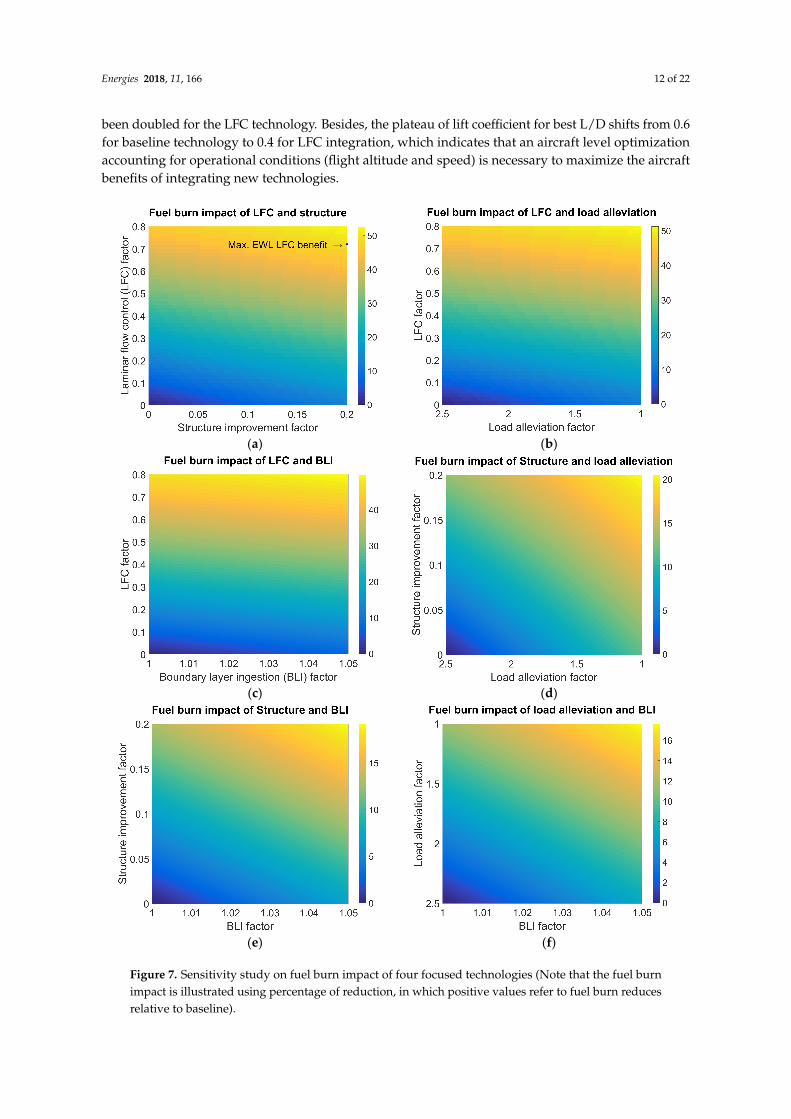
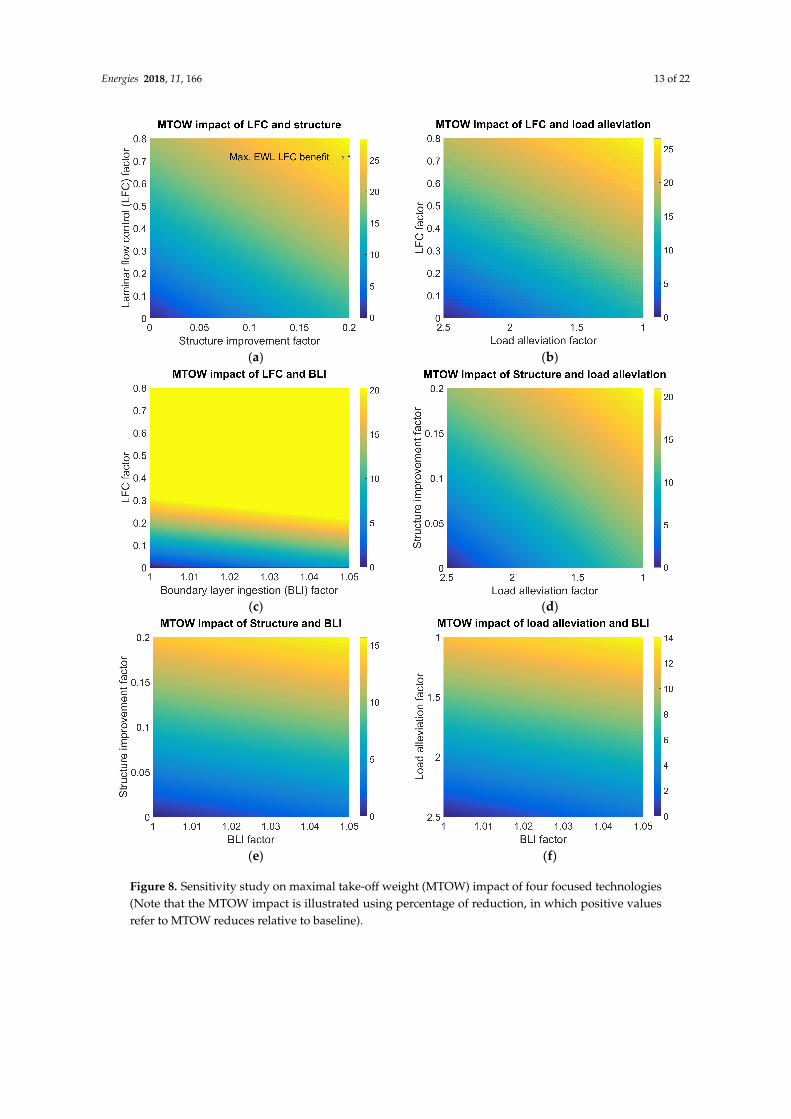
Figures 7 and 8 show the sensitivity study results of aircraft fuel burn and MTOW impacts of thefocused technology combinations. For the four focused game-changing technologies, both fuel burnand MTOW impact studies have six combinations. To better visualize the data, the left bottom pointsfor all the subplots show the baseline technologies, i.e., fuel burn or MTOW changes are zero. Likewise,the top right points for all the subplots represent the best assumed technology scenarios. As shown inFigure 7, the combination of LFC and load alleviation can bring the most fuel burn savings while thecombination of structure improvement and BLI technology has the least. It can be found in Figure 8that the combination of LFC and structure improvement bring the most MTOW benefit while loadalleviation and BLI have slightly lower MTOW benefit. In general, from the results in Figures 7 and 8show one can observe that the technology improvements in our study have large impact on the overallaircraft performance.
To show the achievable fuel burn and MTOW benefits of best assumed technology scenarios,an integration of high fidelity methods or corrections from high fidelity results is necessary. For thispaper, the results of high fidelity computational fluid dynamics (CFD) analysis for LFC [55] havebeen used as reduction factors to update the aerodynamic analysis introduced in Section 3. The CFDcalculated friction drag reduction for the wing and tail planes are around 68%, for the fuselage is 72%,which corresponds to a LFC factor of 0.72, i.e., the marked points in Figures 7 and 8 referring to “Max.EWL LFC benefit”. It has to be noted that the detailed coupling effect of different technologies hasnot been taken into account within this manuscript, which will be the focus of the second stage of theEWL-project. Though, preliminary studies within the first stage of EWL project have shown goodfeasibility of each individual technology goals.
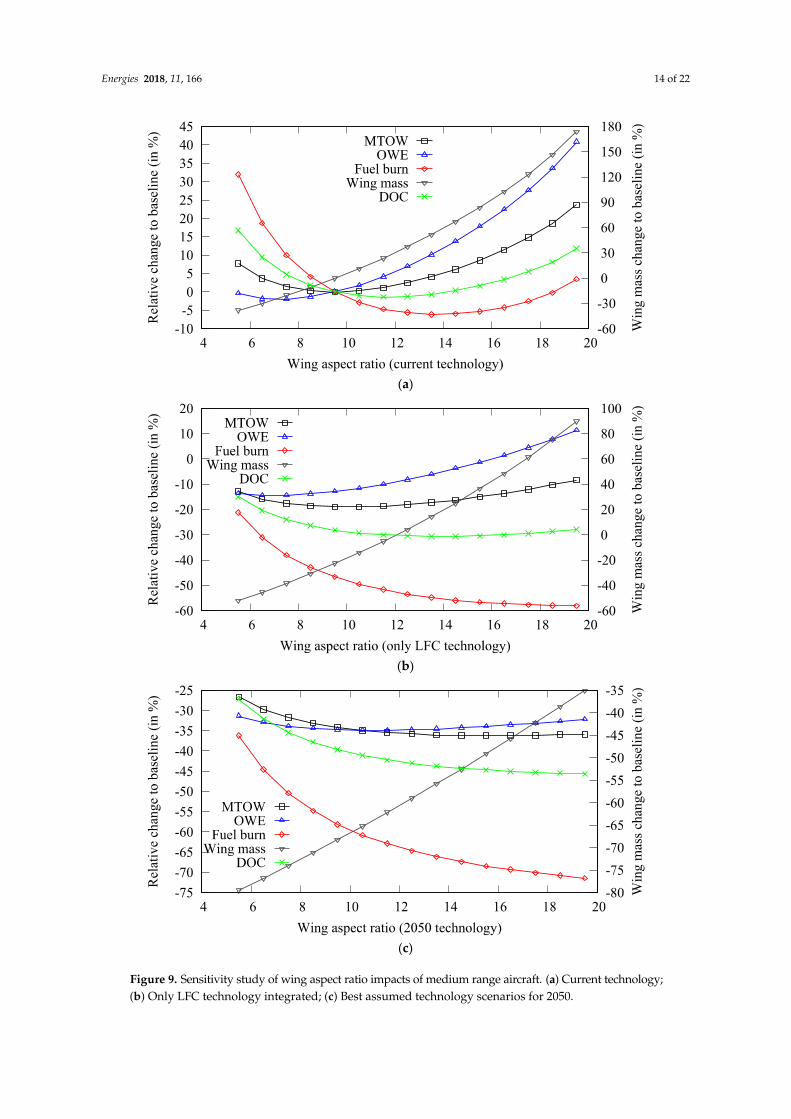
As one of the most important wing planform parameters, wing aspect ratio has very significantimpacts on the overall aircraft performance, such as weights, fuel burn, and costs. Figure 9 representsthe aspect rations impacts on MTOW, OWE, fuel burn, wing mass, and direct operating cost (DOC),for baseline technology scenario (cf., Figure 9a), only LFC technology integrated (cf., Figure 9b) and2050 best assumed technology scenario (cf., Figure 9c). It has to be noted that due to the much strongerchanges in wing mass, the wing mass relative change to baseline is shown according to the right y-axisscale and the relative change to baseline for the rest of the parameters are plotted based on the lefty-axis scale. As can be seen in the figure, the overall trend of the aircraft parameters shows goodsensitivity, e.g., the wing mass increases with an increased aspect ratio, and fuel burn decreases withincreased aspect ratio for a certain range of aspect values. For current technology, the DOC minimumgives an optimal aspect ratio around 11.5, which is slightly larger than the reference medium rangeaircraft A320-200 that has an aspect ratio of 9.5. For the case of only integrating LFC technology, thecurves are slightly different and gives an optimal aspect ratio around 14 for DOC minimum. With allgame changing technologies integrated, the aspect ratio is even larger (around 18) for minimal DOC.
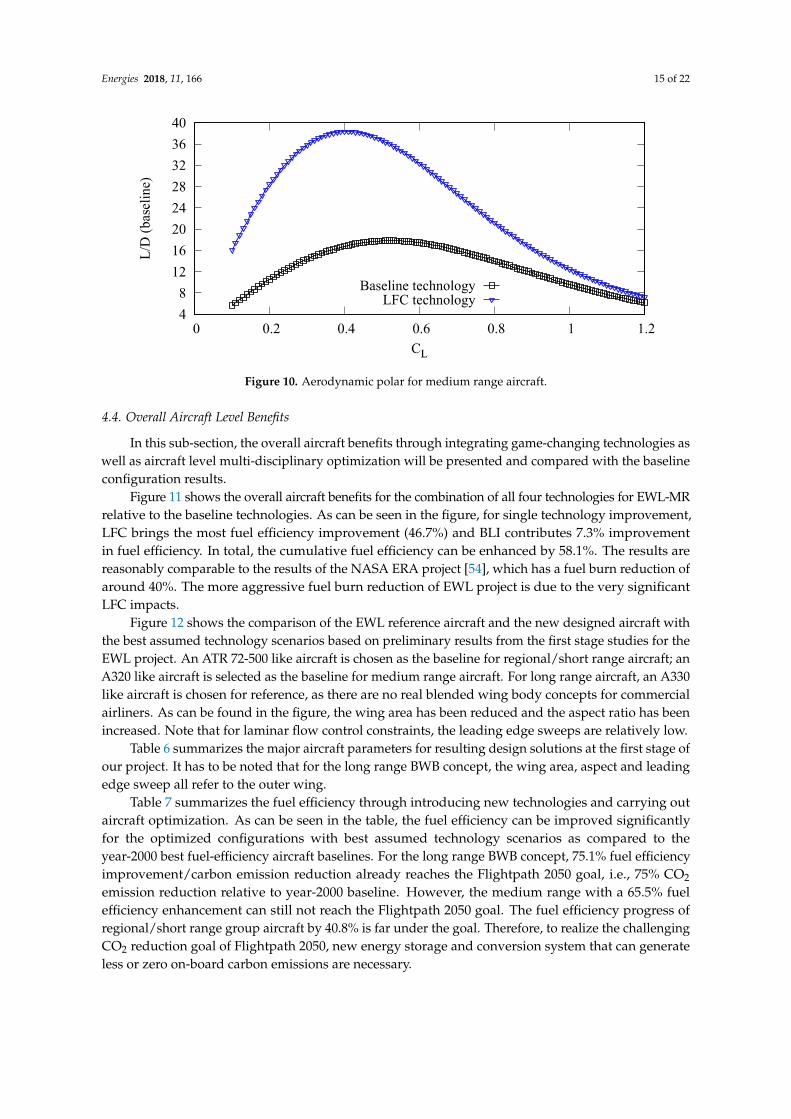
Figure 10 shows the aerodynamic polar of the reference configuration and DOC-optimizedconfiguration with LFC technology integrated for the medium range aircraft. It has to be noted thatfor better comparison, the flight conditions are set to be identical, i.e., Mach number of 0.78 and flightaltitude of 11,000 m for both cases. As can be seen in the figure, the lift-to-drag ratio (L/D) has almost
Energies 2018, 11, 166 12 of 22
been doubled for the LFC technology. Besides, the plateau of lift coefficient for best L/D shifts from 0.6for baseline technology to 0.4 for LFC integration, which indicates that an aircraft level optimizationaccounting for operational conditions (flight altitude and speed) is necessary to maximize the aircraftbenefits of integrating new technologies.Energies 2018, 11, 166 12 of 22
(a) (b)
(c) (d)
(e) (f)
Figure 7. Sensitivity study on fuel burn impact of four focused technologies (Note that the fuel burn impact is illustrated using percentage of reduction, in which positive values refer to fuel burn reduces relative to baseline).
Figure 7. Sensitivity study on fuel burn impact of four focused technologies (Note that the fuel burnimpact is illustrated using percentage of reduction, in which positive values refer to fuel burn reducesrelative to baseline).
Energies 2018, 11, 166 13 of 22Energies 2018, 11, 166 13 of 22
(a) (b)
(c) (d)
(e) (f)
Figure 8. Sensitivity study on maximal take-off weight (MTOW) impact of four focused technologies (Note that the MTOW impact is illustrated using percentage of reduction, in which positive values refer to MTOW reduces relative to baseline).
Figure 8. Sensitivity study on maximal take-off weight (MTOW) impact of four focused technologies(Note that the MTOW impact is illustrated using percentage of reduction, in which positive valuesrefer to MTOW reduces relative to baseline).
Energies 2018, 11, 166 14 of 22Energies 2018, 11, 166 14 of 22
(a)
(b)
(c)
Figure 9. Sensitivity study of wing aspect ratio impacts of medium range aircraft. (a) Current technology; (b) Only LFC technology integrated; (c) Best assumed technology scenarios for 2050.
Figure 9. Sensitivity study of wing aspect ratio impacts of medium range aircraft. (a) Current technology;(b) Only LFC technology integrated; (c) Best assumed technology scenarios for 2050.
Energies 2018, 11, 166 15 of 22Energies 2018, 11, 166 15 of 22
Figure 10. Aerodynamic polar for medium range aircraft.
4.4. Overall Aircraft Level Benefits
In this sub-section, the overall aircraft benefits through integrating game-changing technologies as well as aircraft level multi-disciplinary optimization will be presented and compared with the baseline configuration results.
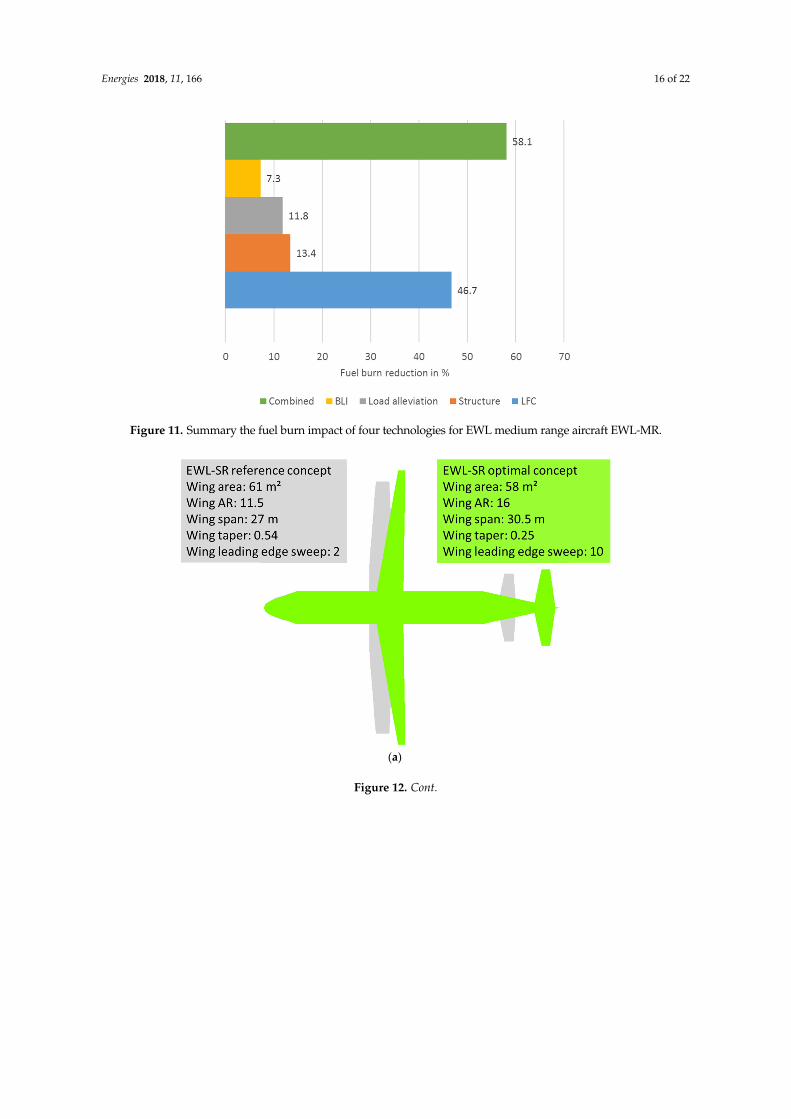
Figure 11 shows the overall aircraft benefits for the combination of all four technologies for EWL-MR relative to the baseline technologies. As can be seen in the figure, for single technology improvement, LFC brings the most fuel efficiency improvement (46.7%) and BLI contributes 7.3% improvement in fuel efficiency. In total, the cumulative fuel efficiency can be enhanced by 58.1%. The results are reasonably comparable to the results of the NASA ERA project [54], which has a fuel burn reduction of around 40%. The more aggressive fuel burn reduction of EWL project is due to the very significant LFC impacts.
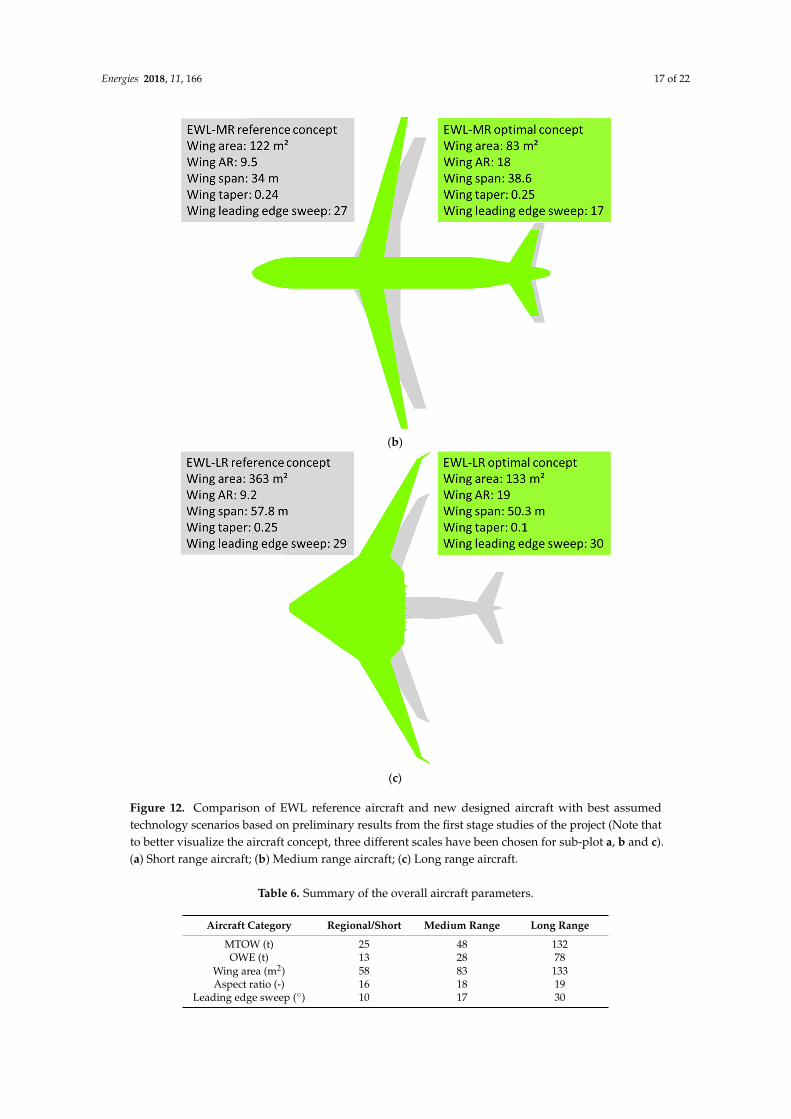
Figure 12 shows the comparison of the EWL reference aircraft and the new designed aircraft with the best assumed technology scenarios based on preliminary results from the first stage studies for the EWL project. An ATR 72-500 like aircraft is chosen as the baseline for regional/short range aircraft; an A320 like aircraft is selected as the baseline for medium range aircraft. For long range aircraft, an A330 like aircraft is chosen for reference, as there are no real blended wing body concepts for commercial airliners. As can be found in the figure, the wing area has been reduced and the aspect ratio has been increased. Note that for laminar flow control constraints, the leading edge sweeps are relatively low.
Table 6 summarizes the major aircraft parameters for resulting design solutions at the first stage of our project. It has to be noted that for the long range BWB concept, the wing area, aspect and leading edge sweep all refer to the outer wing.
Table 7 summarizes the fuel efficiency through introducing new technologies and carrying out aircraft optimization. As can be seen in the table, the fuel efficiency can be improved significantly for the optimized configurations with best assumed technology scenarios as compared to the year-2000 best fuel-efficiency aircraft baselines. For the long range BWB concept, 75.1% fuel efficiency improvement/carbon emission reduction already reaches the Flightpath 2050 goal, i.e., 75% CO2 emission reduction relative to year-2000 baseline. However, the medium range with a 65.5% fuel efficiency enhancement can still not reach the Flightpath 2050 goal. The fuel efficiency progress of regional/short range group aircraft by 40.8% is far under the goal. Therefore, to realize the challenging CO2 reduction goal of Flightpath 2050, new energy storage and conversion system that can generate less or zero on-board carbon emissions are necessary.
Figure 10. Aerodynamic polar for medium range aircraft.
4.4. Overall Aircraft Level Benefits
In this sub-section, the overall aircraft benefits through integrating game-changing technologies aswell as aircraft level multi-disciplinary optimization will be presented and compared with the baselineconfiguration results.
Figure 11 shows the overall aircraft benefits for the combination of all four technologies for EWL-MRrelative to the baseline technologies. As can be seen in the figure, for single technology improvement,LFC brings the most fuel efficiency improvement (46.7%) and BLI contributes 7.3% improvementin fuel efficiency. In total, the cumulative fuel efficiency can be enhanced by 58.1%. The results arereasonably comparable to the results of the NASA ERA project [54], which has a fuel burn reduction ofaround 40%. The more aggressive fuel burn reduction of EWL project is due to the very significantLFC impacts.
Figure 12 shows the comparison of the EWL reference aircraft and the new designed aircraft withthe best assumed technology scenarios based on preliminary results from the first stage studies for theEWL project. An ATR 72-500 like aircraft is chosen as the baseline for regional/short range aircraft; anA320 like aircraft is selected as the baseline for medium range aircraft. For long range aircraft, an A330like aircraft is chosen for reference, as there are no real blended wing body concepts for commercialairliners. As can be found in the figure, the wing area has been reduced and the aspect ratio has beenincreased. Note that for laminar flow control constraints, the leading edge sweeps are relatively low.
Table 6 summarizes the major aircraft parameters for resulting design solutions at the first stage ofour project. It has to be noted that for the long range BWB concept, the wing area, aspect and leadingedge sweep all refer to the outer wing.
Table 7 summarizes the fuel efficiency through introducing new technologies and carrying outaircraft optimization. As can be seen in the table, the fuel efficiency can be improved significantlyfor the optimized configurations with best assumed technology scenarios as compared to theyear-2000 best fuel-efficiency aircraft baselines. For the long range BWB concept, 75.1% fuel efficiencyimprovement/carbon emission reduction already reaches the Flightpath 2050 goal, i.e., 75% CO2
emission reduction relative to year-2000 baseline. However, the medium range with a 65.5% fuelefficiency enhancement can still not reach the Flightpath 2050 goal. The fuel efficiency progress ofregional/short range group aircraft by 40.8% is far under the goal. Therefore, to realize the challengingCO2 reduction goal of Flightpath 2050, new energy storage and conversion system that can generateless or zero on-board carbon emissions are necessary.
Energies 2018, 11, 166 16 of 22
Energies 2018, 11, 166 16 of 22
Figure 11. Summary the fuel burn impact of four technologies for EWL medium range aircraft EWL-MR.
(a)
Figure 11. Summary the fuel burn impact of four technologies for EWL medium range aircraft EWL-MR.
Energies 2018, 11, 166 16 of 22
Figure 11. Summary the fuel burn impact of four technologies for EWL medium range aircraft EWL-MR.
(a)
Figure 12. Cont.
Energies 2018, 11, 166 17 of 22Energies 2018, 11, 166 17 of 22
(b)
(c)
Figure 12. Comparison of EWL reference aircraft and new designed aircraft with best assumed technology scenarios based on preliminary results from the first stage studies of the project (Note that to better visualize the aircraft concept, three different scales have been chosen for sub-plot a, b and c). (a) Short range aircraft; (b) Medium range aircraft; (c) Long range aircraft.
Table 6. Summary of the overall aircraft parameters.
Aircraft Category Regional/Short Medium Range Long Range MTOW (t) 25 48 132 OWE (t) 13 28 78
Wing area (m²) 58 83 133
Figure 12. Comparison of EWL reference aircraft and new designed aircraft with best assumedtechnology scenarios based on preliminary results from the first stage studies of the project (Note thatto better visualize the aircraft concept, three different scales have been chosen for sub-plot a, b and c).(a) Short range aircraft; (b) Medium range aircraft; (c) Long range aircraft.
Table 6. Summary of the overall aircraft parameters.
Aircraft Category Regional/Short Medium Range Long Range
MTOW (t) 25 48 132OWE (t) 13 28 78
Wing area (m2) 58 83 133Aspect ratio (-) 16 18 19
Leading edge sweep (◦) 10 17 30
Energies 2018, 11, 166 18 of 22
Table 7. Summary overall aircraft level benefits through new technologies and optimization.
Aircraft Category Year-2000 Best FuelEfficiency (kg/seat/100 km)
EWL-2050 Best FuelEfficiency (kg/seat/100 km)
Potential Fuel EfficiencyImprovement (%)
Regional/short 2.03 1.20 40.8Medium range 1.80 0.62 65.5
Long range 2.33 0.55 75.1
5. Discussion
In the previous sections we have studied the potential benefits through integrating newaircraft-associated technologies. Another significant contribution to improving the aircraft fuel efficiencycomes from engines. As predicted by Rolls-Royce, engine related technologies can make around 30%contribution toward ACARE Flightpath 2050 Targets [56].
In addition to the technology parts, other operational aspects, such as multiple-stop-operation,air-refueling, aircraft formation flight, cruise step climbs, etc. [57] should also be taken into accountfor exploring the benefits. As such, these aspects should also be taken into account for aircraft designwork to make the overall trade-offs and design for optimal operations.
As already mentioned previously, the current work only covers the aircraft-associated technologyintegration and optimization at a conceptual/preliminary design fidelity level. The detailedhigh-fidelity data will be provided from the team-members of the project, which will be integrated inthe whole aircraft level studies. In addition to the conventional energy systems, detailed new storageand conversion systems also need to be modelled within the framework.
1. System energy conversion efficiency (e.g., battery to propulsive power)2. Energy density of energy storage systems3. Power density of energy conversion systems4. Tank systems (mass and volume)
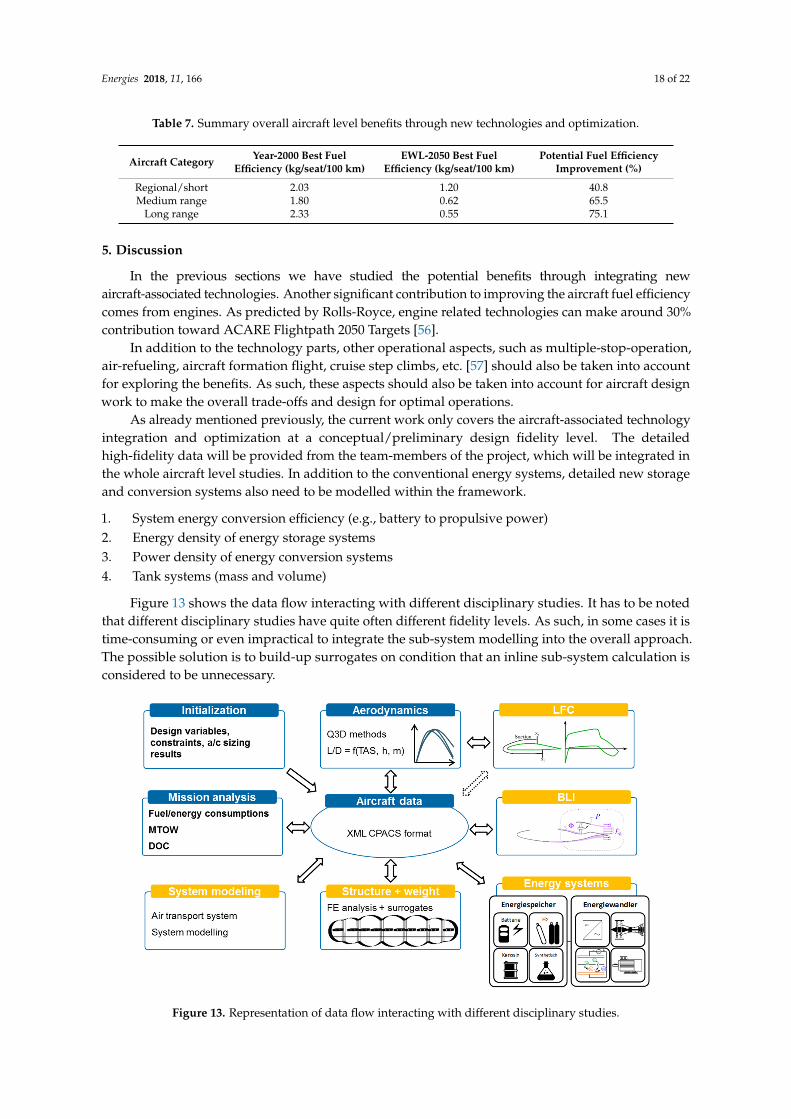
Figure 13 shows the data flow interacting with different disciplinary studies. It has to be notedthat different disciplinary studies have quite often different fidelity levels. As such, in some cases it istime-consuming or even impractical to integrate the sub-system modelling into the overall approach.The possible solution is to build-up surrogates on condition that an inline sub-system calculation isconsidered to be unnecessary.
Energies 2018, 11, 166 18 of 22
Aspect ratio (-) 16 18 19 Leading edge sweep (°) 10 17 30
Table 7. Summary overall aircraft level benefits through new technologies and optimization.
Aircraft Category
Year-2000 Best Fuel Efficiency (kg/seat/100 km)
EWL-2050 Best Fuel Efficiency (kg/seat/100 km)
Potential Fuel Efficiency Improvement (%)
Regional/short 2.03 1.20 40.8 Medium range 1.80 0.62 65.5
Long range 2.33 0.55 75.1
5. Discussion
In the previous sections we have studied the potential benefits through integrating new aircraft-associated technologies. Another significant contribution to improving the aircraft fuel efficiency comes from engines. As predicted by Rolls-Royce, engine related technologies can make around 30% contribution toward ACARE Flightpath 2050 Targets [56].
In addition to the technology parts, other operational aspects, such as multiple-stop-operation, air-refueling, aircraft formation flight, cruise step climbs, etc. [57] should also be taken into account for exploring the benefits. As such, these aspects should also be taken into account for aircraft design work to make the overall trade-offs and design for optimal operations.
As already mentioned previously, the current work only covers the aircraft-associated technology integration and optimization at a conceptual/preliminary design fidelity level. The detailed high-fidelity data will be provided from the team-members of the project, which will be integrated in the whole aircraft level studies. In addition to the conventional energy systems, detailed new storage and conversion systems also need to be modelled within the framework.
1. System energy conversion efficiency (e.g., battery to propulsive power) 2. Energy density of energy storage systems 3. Power density of energy conversion systems 4. Tank systems (mass and volume)
Figure 13 shows the data flow interacting with different disciplinary studies. It has to be noted that different disciplinary studies have quite often different fidelity levels. As such, in some cases it is time-consuming or even impractical to integrate the sub-system modelling into the overall approach. The possible solution is to build-up surrogates on condition that an inline sub-system calculation is considered to be unnecessary.
Figure 13. Representation of data flow interacting with different disciplinary studies.
Energies 2018, 11, 166 19 of 22
6. Conclusions
In the context of Energy System Transformation in Aviation research project, a generalized frameworkis developed to investigate the airframe technologies and new energy systems. A verification studywith comparison to a reliable CSR-01 reference aircraft showed very good agreement. The study onthe technology progress level impacts for both MTOW and fuel burn showed good sensitivity.
With a combination of four major EWL-identified technologies, the total fuel burn at the designrange is reduced by 58% for medium range aircraft without carrying out aircraft optimization.
By optimizing aircraft with best assumed technology scenarios, fuel efficiency can be substantiallyimproved for all three aircraft categories. To be specific, the BWB concept for long range aircrafthave shown the most promising fuel efficiency improvement or carbon emission reduction, whichcan realize the Flightpath 2050 goal. While the other two tube and wing concepts are not able toreach the emission reduction goals, which indicates that further applications of new energy systemsare necessary.
For future work, the coupled effect of game-changing airframe technologies and radical newenergy systems have to be investigated (reduced energy requirement relaxed the application of new energysystems). Besides, full aircraft level MDO with more design variables, both from aircraft-associatedparameters but also from engine and operational parameters, have to be carried out for furtherexploring the benefits of energy system transformations in aviation.
Acknowledgments: We would like to acknowledge the support of the Ministry for Science and Culture ofLower Saxony (Grant No. VWZN3177) for funding the research project “Energy System Transformation inAviation” in the initiative “Niedersächsisches Vorab”. The authors are also thankful for the many helpful andproductive discussions and cooperation with other EWL team members from different institutes. Special thanksgo to the project leader Jens Friedrichs (Head and Professor of Institute of Jet propulsion and Turbomachinery,TU Braunschweig) for defining and clarifying the concepts.
Author Contributions: Y.L. designed and implemented the simulation tools, carried out the simulations, analyzedthe results, and wrote the main part of the paper. M.H. involved in the writing of the technology overview section,especially the laminar flow control and active load alleviation parts. A.E. and P.H. involved in refining thestoryline, and also elaborated the introduction section and the discussion section.
Conflicts of Interest: The authors declare no conflict of interest.
References
1. Flightpath 2050-Europe’s Vision for Aviation. Advisory Council for Aeronautics Research in Europe,European Commission, 2011. Available online: https://ec.europa.eu/transport/sites/transport/files/modes/air/doc/flightpath2050.pdf (accessed on 8 November 2017).
2. IATA. IATA Technology Roadmap 2013. 2013. Available online: http://www.iata.org/whatwedo/environment/Documents/technology-roadmap-2013.pdf (accessed on 8 November 2017).
3. Bezos-O’Connor, G.; Mangelsdorf, M.; Nickol, C.; Maliska, H.; Washburn, A.; Wahls, R. Fuel Efficienciesthrough Airframe Improvements. In Proceedings of the 3rd AIAA Atmospheric Space EnvironmentsConference, Honolulu, HI, USA, 27–30 June 2011; American Institute of Aeronautics and Astronautics:Reston, VA, USA, 2011.
4. Kimmel, W. Systems Analysis Approach for the NASA Environmentally Responsible Aviation Project.In Proceedings of the 3rd AIAA Atmospheric Space Environments Conference, Honolulu, HI, USA, 27–30June 2011; American Institute of Aeronautics and Astronautics: Reston, VA, USA, 2011.
5. Graham, W.R.; Hall, C.A.; Vera Morales, M. The potential of future aircraft technology for noise and pollutantemissions reduction. Air Transp. Environ. 2014, 34, 36–51. [CrossRef]
6. Mo, L. Conceptual Design Study for In-Flight Refueling of Passenger Aircraft. Ph.D. Thesis, Delft Universityof Technology, Delft, The Netherlands, 2017.
7. Tollmien, W. Über die Entstehung der Turbulenz. 1. Mitteilung. Nachrichten von der Gesellschaft derWissenschaften zu Göttingen, Mathematisch-Physikalische Klasse 1928, 1929, 21–44.
8. Schlichting, H. Zur Enstehung der Turbulenz bei der Plattenströmung. Nachrichten von der Gesellschaft derWissenschaften zu Göttingen, Mathematisch-Physikalische Klasse 1933, 1933, 181–208.
Energies 2018, 11, 166 20 of 22
9. Doetsch, H. Untersuchungen an einigen Profilen mit geringem Widerstand im Bereich kleiner ca-Werte.Jahrbuch der Deutschen Luftfahrtforschung 1940, I, 54–57.
10. Abbott, I.H.; von Doenhoff, A.E. Theory of Wing Sections, Including a Summary of Airfoil Data;Dover Publications Inc.: New York, NY, USA, 1959.
11. Pfenninger, W. Laminar Flow Control, Laminarization; Special course on concepts for drag reduction, AGARDReport No. 654; AGARD: Neuilly sur Seine, France, 1977.
12. Redeker, G.; Horstmann, K.-H.; Koester, H.; Quast, A. Laminarprofile Fuer Verkehrsflugzeuge; DLR Report,IB-129-86/12; DLR: London, UK, 1985.
13. Arnal, D. Boundary Layer Transition. Predictions Based on Linear Theory. In Special Course on Progress inTransition Modelling; AGARD Report 793; AGARD: Neuilly sur Seine, France, 1994.
14. Braslow, A.L. A History of Suction-Type Laminar-Flow Control with Emphasis on Flight Research; NASA HistoryDivision, Monographs in Aerospace History, No. 13; NASA: Washington, DC, USA, 1999. Available online:https://ntrs.nasa.gov/search.jsp?R=19990058717 (accessed on 8 November 2017).
15. Joslin, R.D. Aircraft Laminar Flow Control. Annu. Rev. Fluid Mech. 1998, 30, 1–29. [CrossRef]16. Schrauf, G. Status and perspectives of laminar flow. Aeronaut. J. 2005, 109, 639–644. [CrossRef]17. Horstmann, K.; Redeker, G.; Quast, A.; Dressler, U.; Bieler, H. Flight tests with a natural laminar flow glove
on a transport aircraft. In Proceedings of the Flight Simulation Technologies Conference and Exhibit, Dayton,OH, USA, 17–19 September 1990; American Institute of Aeronautics and Astronautics: Reston, VA, USA, 1990.
18. Schrauf, G. Evaluation of the A320 Hybrid Laminar Fin Experiment. In Proceedings of the EuropeanCongress on Computational Methods in Applied Sciences and Engineering, ECCOMAS 2000, Barcelona,Spain, 11–14 September 2000.
19. AFLONEXT, European Project. Available online: http://www.aflonext.eu/ (accessed on 2 October 2017).20. Airbus BLADE Flight Test Campaign. Available online: http://www.airbus.com/newsroom/press-
releases/en/2017/09/airbus_-_blade_-laminar-flow-wing-demonstrator-makes-first-fligh.html (accessedon 2 October 2017).
21. Seitz, A.; Horstmann, K.-H. Design Studies on NLF and HLFC Applications at DLR. In Proceedings of the27th International Congress of the Aeronautical Sciences, Nizza, France, 19–24 September 2010.
22. Risse, K. Preliminary Overall Aircraft Design with Hybrid Laminar Flow Control. Ph.D. Thesis, RWTHAachen, Aachen, Germany, 2016.
23. Hepperle, M. MDO of Forward Swept Wings. In Proceedings of the KATnet II Workshop, Braunschweig,Germany, 28–29 January 2008.
24. Xu, J. Aircraft Design with Active Load Alleviation and Natural Laminar Flow. Ph.D. Thesis, StanfordUniversity, Stanford, CA, USA, 2012.
25. Nigam, N.; Ayyalasomayajula, S.K.; Qi, X.; Chen, P.C.; Alonso, J.J. High-Fidelity Weight Estimation forAircraft Conceptual Design Optimization. In Proceedings of the 16th AIAA/ISSMO MultidisciplinaryAnalysis and Optimization Conference, Dallas, TX, USA, 22–26 June 2015; American Institute of Aeronauticsand Astronautics: Reston, VA, USA, 2015.
26. Xu, J.; Kroo, I. Aircraft Design with Active Load Alleviation and Natural Laminar Flow. J. Aircr. 2014, 51,1532–1545. [CrossRef]
27. Hahn, K.-U. Verfahren zur Reduzierung der Turbulenz und Böeneinflüsse auf das Flugverhalten vonLuftfahrzeugen und Steuerungseinrichtung hierfür. U.S. Patent EP1854717 A1, 14 November 2007.
28. Hepperle, M. Loads and Structural Sizing; Technical Note; DLR Institute of Aerodynamics and FlowTechnology: London, UK, 2012.
29. Rossow, C.-C.; von Geyr, H.; Hepperle, M. The 1g-Wing, Visionary Concept or Naive Solution? 2016.Available online: http://elib.dlr.de/105029/ (accessed on 9 January 2018).
30. Greitzer, E.M.; Bonnefoy, P.A.; DelaRosaBlanco, E.; Dorbian, C.S.; Drela, M.; Hall, D.K.; Hansman, R.J.;Hileman, J.I.; Liebeck, R.H.; Lovegren, J.; et al. N + 3 Aircraft Concept Designs and Trade Studies.Volume 2: Appendices-Design Methodologies for Aerodynamics, Structures, Weight, and Thermodynamic Cycles;NASA/CR-2010-216794/VOL2; NASA Langley Research Center: Cleveland, OH, USA, 2010.
31. Hardin, L.; Tillman, G.; Sharma, O.; Berton, J.; Arend, D. Aircraft System Study of Boundary Layer IngestingPropulsion. In Proceedings of the 48th AIAA/ASME/SAE/ASEE Joint Propulsion Conference & Exhibit,Atlanta, GA, USA, 30 July–1 August 2012.
Energies 2018, 11, 166 21 of 22
32. Hall, K.D. Boundary Layer Ingestion Propulsion—Benefit, Challenges, and Opportunities. In Proceedings ofthe 5th UTIAS International Workshop on Aviation and Climate Change, Toronto, ON, Canada, 18–20 May 2016.
33. Pandya, S.A.; Uranga, A.; Espitia, A.; Huang, A. Computational Assessment of the Boundary Layer IngestingNacelle Design of the D8 Aircraft. In Proceedings of the 52nd Aerospace Sciences Meeting, National Harbor,MD, USA, 13–17 January 2014; American Institute of Aeronautics and Astronautics: Reston, VA, USA, 2014.
34. Uranga, A.; Drela, M.; Greitzer, E.; Titchener, N.; Lieu, M.; Siu, N.; Huang, A.; Gatlin, G.M.; Hannon, J.Preliminary Experimental Assessment of the Boundary Layer Ingestion Benefit for the D8 Aircraft.In Proceedings of the 52nd Aerospace Sciences Meeting, National Harbor, MD, USA, 13–17 January 2014;American Institute of Aeronautics and Astronautics: Reston, VA, USA, 2014.
35. Plas, A.; Crichton, D.; Sargeant, M.; Hynes, T.; Greitzer, E.; Hall, C.; Madani, V. Performance of a BoundaryLayer Ingesting (BLI) Propulsion System. In Proceedings of the 45th AIAA Aerospace Sciences Meeting andExhibit, Reno, NV, USA, 8–11 January 2007; American Institute of Aeronautics and Astronautics: Reston, VA,USA, 2007.
36. Kawai, R.T.; Friedman, D.M.; Serrano, L. Blended Wing Body (BWB) Boundary Layer Ingestion (BLI) InletConfiguration and System Studies; NASA/CR-2006-214534; NASA Langley Research Center: Hampton, VA,USA, 2006.
37. Geiselhart, K.A.; Daggett, D.L.; Kawai, R.; Friedman, D. Blended Wing Body Systems Studies: Boundary LayerIngestion Inlets with Active Flow Control; NASA/CR-2003-212670; NASA Langley Research Center: Hampton,VA, USA, 2003.
38. Hall, D.K.; Huang, A.C.; Uranga, A.; Greitzer, E.M.; Drela, M.; Sato, S. Boundary Layer Ingestion PropulsionBenefit for Transport Aircraft. J. Propuls. Power 2017, 33, 1118–1129. [CrossRef]
39. Uranga, A.; Drela, M.; Greitzer, E.M.; Hall, D.K.; Titchener, N.A.; Lieu, M.K.; Siu, N.M.; Casses, C.;Huang, A.C.; Gatlin, G.M.; et al. Boundary Layer Ingestion Benefit of the D8 Transport Aircraft. AIAA J.2017, 55, 3693–3708. [CrossRef]
40. Botero, E.M.; Wendorff, A.; MacDonald, T.; Variyar, A.; Vegh, J.M.; Lukaczyk, T.W.; Alonso, J.J.; Orra, T.H.;Ilario da Silva, C. SUAVE: An Open-Source Environment for Conceptual Vehicle Design and Optimization.In Proceedings of the 54th AIAA Aerospace Sciences Meeting, San Diego, CA, USA, 4–8 January 2016;American Institute of Aeronautics and Astronautics: Reston, VA, USA, 2016.
41. Werner-Westphal, C.; Heinze, W.; Horst, P. Multidisciplinary Integrated Preliminary Design Applied toUnconventional Aircraft Configurations. J. Aircr. 2008, 45, 581–590. [CrossRef]
42. Risse, K.; Anton, E.; Lammering, T.; Franz, K.; Hoernschemeyer, R. An Integrated Environment forPreliminary Aircraft Design and Optimization. In Proceedings of the 8th AIAA Multidisciplinary DesignOptimization Specialist Conference (MDO), Honolulu, HI, USA, 23–26 April 2012; AIAA: Honolulu, HI,USA, 2012.
43. Werner-Spatz, C.; Heinze, W.; Horst, P. Improved Representation of High-Lift Devices for a MultidisciplinaryConceptual Aircraft Design Process. J. Aircr. 2009, 46, 1984–1994. [CrossRef]
44. Liersch, C.M.; Hepperle, M. A distributed toolbox for multidisciplinary preliminary aircraft design. CEASAeronaut. J. 2011, 2, 57–68. [CrossRef]
45. Rizzi, A.; Zhang, M.; Nagel, B.; Boehnke, D.; Saquet, P. Towards a Unified Framework using CPACS forGeometry Management in Aircraft Design. In Proceedings of the 50th AIAA Aerospace Sciences Meeting(ASM) including the New Horizons Forum and Aerospace Exposition, Nashville, TN, USA, 9–12 January2012; AIAA: Nashville, TN, USA, 2012.
46. Gur, O.; Mason, W.H.; Schetz, J.A. Full-Configuration Drag Estimation. J. Aircr. 2010, 47, 919–939. [CrossRef]47. Drela, M.; Youngren, H. AVL. Available online: http://web.mit.edu/drela/Public/web/avl/ (accessed on
2 October 2017).48. Malone, B.; Mason, W.H. Multidisciplinary optimization in aircraft design using analytic technology models.
J. Aircr. 1995, 32, 431–438. [CrossRef]49. Mukhopadhyay, V.; Sobieszczanski-Sobieski, J.; Kosaka, I.; Quinn, G.; Vanderpaats, G.N. Analysis, Design,
and Optimization of Noncylindrical Fuselage for Blended-Wing-Body Vehicle. J. Aircr. 2004, 41, 925–930.[CrossRef]
50. Bradley, K.R. A Sizing Methodology for the Conceptual Design of Blended-Wing-Body Transports;NASA/CR-2004-213016; NASA Langley Research Center: Hampton, VA, USA, 2004.
Energies 2018, 11, 166 22 of 22
51. Elham, A.; La Rocca, G.; van Tooren, M.J.L. Development and implementation of an advanced, design-sensitivemethod for wing weight estimation. Aerosp. Sci. Technol. 2013, 29, 100–113. [CrossRef]
52. Howe, D. Aircraft Conceptual Design Synthesis; John Wiley & Sons, Ltd.: Chichester, UK, 2000.53. Kurzke, J. Gas Turb 12—Design and Off-Design Performance of Gas Turbines; GasTurb GmbH: Aachen, Germany, 2012.54. Schutte, J.; Jimenez, H.; Mavris, D. Technology Assessment of NASA Environmentally Responsible Aviation
Advanced Vehicle Concepts. In Proceedings of the 49th AIAA Aerospace Sciences Meeting including theNew Horizons Forum and Aerospace Exposition, Orlando, FL, USA, 4–7 January 2011; American Institute ofAeronautics and Astronautics: Reston, VA, USA, 2011.
55. Beck, N.; Radespiel, R. Drag Reduction by Laminar Flow Control. Energies 2017. submitted.56. Whurr, J.; Hart, J. A Rolls-Royce Perspective on Concepts and Technologies for Future Green Propulsion
Systems. In Encyclopedia of Aerospace Engineering; John Wiley & Sons, Ltd.: Hoboken, NJ, USA, 2010; pp. 1–9.57. Green, J.E. Greener by Design—The technology challenge. Aeronaut. J. 2002, 106, 57–113. [CrossRef]
© 2018 by the authors. Licensee MDPI, Basel, Switzerland. This article is an open accessarticle distributed under the terms and conditions of the Creative Commons Attribution(CC BY) license (http://creativecommons.org/licenses/by/4.0/).