exploring the use of faa radar weather data by the nws: comparisons and observations between the...
TRANSCRIPT

P1.32
EXPLORING THE USE OF FAA RADAR WEATHER DATA BY THE NWS: COMPARISONS AND OBSERVATIONS BETWEEN THE WSR-88D AND FAA WEATHER RADARS
Andrew D. Stern*
Mitretek Systems, Inc., Falls Church, VA
Warren M. Blanchard, Peter K. Pickard, Robert E. Saffle, Michael J. Istok and Michael D. DiVecchio National Weather Service, Office of Science and Technology, Silver Spring, MD
Bill Bumgarner
BAE Systems, Washington, DC
1. INTRODUCTION
The National Weather Service (NWS) has embarked on a continuous cycle of developing new techniques and leveraging complementary technologies in order to improve the accuracy of its forecasts and severe weather warnings. One such endeavor involves partnering with other federal agencies to use existing systems to enhance the atmospheric observational capability of the NWS. The Federal Aviation Administration (FAA) and Department of Defense (DoD) operate over 400 radar systems across the country. Many of these systems contain “weather channels” that can potentially be used to supplement the existing network of NWS Doppler weather radars.
The NWS has begun proof-of-concept demonstrations at several locations around the country to allow forecasters to evaluate the characteristics of the different radars and to determine the different levels of value provided by each kind of FAA radar system. In the future, the NWS is considering options for possible deployment of FAA radar weather channel processing systems to Weather Forecast Offices (WFOs) and National Centers for use in operations (DiVecchio, 2003).
This paper will discuss the characteristics of three specific FAA radar systems that the NWS is evaluating. These systems include the Terminal Doppler Weather Radar (TDWR), the Air Route Surveillance Radar, Model 4 (ARSR-4), and the Aircraft Surveillance Radar, Model 11. Each will be used to contrast and compare beam structures and scan strategies with the NWS Weather Surveillance Radar, 1988 Doppler (WSR-88D) and show potential benefits for NWS operations and warnings.
2. FAA RADAR SYSTEMS
The primary purpose of FAA and DoD radar systems is for national defense and the surveillance of aircraft. However, as a secondary function, many of the radars contain a weather channel. In this section, the weather surveillance capability of several of these radars will be described. 2.1 TDWR
The Terminal Doppler Weather Radar is a unique system for the FAA since it is the only radar designed specifically for the surveillance of weather. Its main function is to alert air traffic controllers to the existence and location of low-level wind shear hazards within the terminal areas of airports.
The TDWR was born out of a National Research Council study that indicated that over two dozen airplane accidents in the 1960s, 70s and early 80s were caused primarily by microbursts and gust fronts (TDWR Server Users’ Guide). The FAA contracted with the Massachusetts Institute of Technology (MIT) and the National Center for Atmospheric Research (NCAR) to find a solution that would mitigate the dangers of shear and downbursts in the terminal area. Initial deployment began at Memphis, TN in 1994. By 2000, all 47 TDWRs had been installed and were operational (Figure 1).
Similar to the WSR-88D, the TDWR utilizes a conical beam, the automatic selection of different ‘scan strategies’ based on specific weather threats, and obtains both reflectivity and Doppler moments. However, due to a lack of available spectrum in the S-Band range around major airports , the TDWR was designed with a C-Band frequency (5.6-5.65 GHz) (US DOT, 1994).
Table 1 lists the specifications of the TDWR. It provides a peak transmitted power of 250K Watts and an unambiguous Doppler range of 89 km. Its range resolution is highest of all of the radars surveyed. The discrete gate or bin size of the
* Corresponding author address: Andrew D. Stern Mitretek Systems; 3150 Fairview Park Drive South, Falls Church, Virginia 22042-4519; Email: [email protected] The views expressed are those of the author(s) and do not necessarily represent those of the National Weather Service.

TDWR has a resolution of 150 meters for both reflectivity and velocity moments. This compares to a range resolution of 1000 meters for reflectivity and 250 meters for velocity on the WSR-88D.
The TDWR is designed to identify conditions hazardous to aircraft in the terminal area. The terminal area is defined as a volume covering the airport plus about 3 miles from the ends of the runways. This requires the system to routinely run gust front and microburst identification algorithms. These programs levy several requirements on the scan strategy of the system.
• To support automatic and adaptive PRF (Pulse Repetition Frequency) selection for the task of obscuration mitigation, one long range (long pulse) scan must be performed every 5 minutes.
• To capture the evolution of wind shear, one low-level, “near surface” scan must be performed every minute during hazardous conditions.
Similar to the WSR-88D, the TDWR uses a
concept of compositing numerous scans of its antenna at different elevations to build a picture of the near atmospheric environment. This picture is called a radar volume. The first scan of every volume is comprised of long pulse sampling for obstruction mitigation and has a range of 297 km. All remaining scans consist of short pulse sampling of varying PRFs. The range of the short pulse scan at low elevations is 89 km. This range becomes truncated (at 70k feet) with increasing elevation angles.
The TDWR operates in two weather modes: monitor (clear air) mode and hazardous (severe weather) mode. The number of scans and the elevation angles that makeup each scan strategy may be different for each system since the strategy is based on optimizing surveillance over its associated airport. The radar is able to automatically switch between these modes depending on a threat assessment from the continuously running wind shear identification algorithms.
Monitor mode is made up of numerous, 360-degree scans beginning with a long pulse base scan and rising up to near 60 degrees at the end of the volume. As an example, Table 2 (left set of columns) shows the monitor mode at the Oklahoma City (OKC) TDWR. Scan #1 contains the long pulse elevation followed by two scans at 0.3 degrees. Each scan is performed at a different PRF to handle issues associated with range folding and clutter mitigation. Scan #5 brings the antenna back down to 1 degree for a base scan. Thereafter, the remaining scans gradually climb to a maximum elevation of 60 degrees.
Similar to the monitor mode (Table 2 center set of columns), the hazardous weather mode starts with a base long pulse elevation followed by two short pulse scans at 0.3 degrees. Starting with scan #3, the strategies undergo a significant departure. Highlights of the hazardous weather mode include:
• The antenna returns to a base elevation every seventh scan
• Above scan #4, the antenna switches to a sector scan which means that data are only gathered in a 100-150 degree arc centered over the associated airport.
• The sector scan requires the antenna to physically stop and change direction in a sweeping motion as the elevation changes .
At the OKC TDWR, the hazardous weather
mode consists of 33 scans, only five of which contain full 360-degree elevations. The rotation rate column in Table 2 shows clockwise rotations as positive numbers while counterclockwise are negative. Those sweeps that are sector scans are denoted with red elevation angles.
A consequence of using the sector scan during hazardous weather mode is the mechanical stress placed upon the antenna assembly. The constant change of rotation direction plus the large changes in elevation caused bearings to wear and increased mechanical breakdowns. With the advent of faster computers and communication rates, the FAA began studying refitting the legacy radar product generator with a new, state-of-the-art system that could handle a full rotation hazardous weather mode.
A new “360-degree hazardous weather mode” has been created that uses a faster antenna rotation rate at a constant direction to maintain nearly the same volume coverage and still maintain frequent base elevation scans. Table 2 (right columns) contains data showing the new hazardous weather mode at OKC. Instead of 33 scans, the new mode consists of 23 scans with every fourth elevation returning to the base angle. In addition, the maximum elevation was reduced from 38.4 degrees to 31.8 degrees.
The time required to complete the monitor mode and legacy hazardous weather mode volume is about 5 minutes. The new 360-degree hazardous weather mode needs about 6 minutes to complete (Stern, 2002).
Finally, the TDWR reports reflectivity values in a range from -30 dBZ to + 80 dBZ. Both unconditioned and dealiased velocities are reported from -80 to +80 m/s. Spectrum width values are reported from 0 to 10 m/s. And, signal-to-noise ratios are reported in a range from 0 to 128 dB.
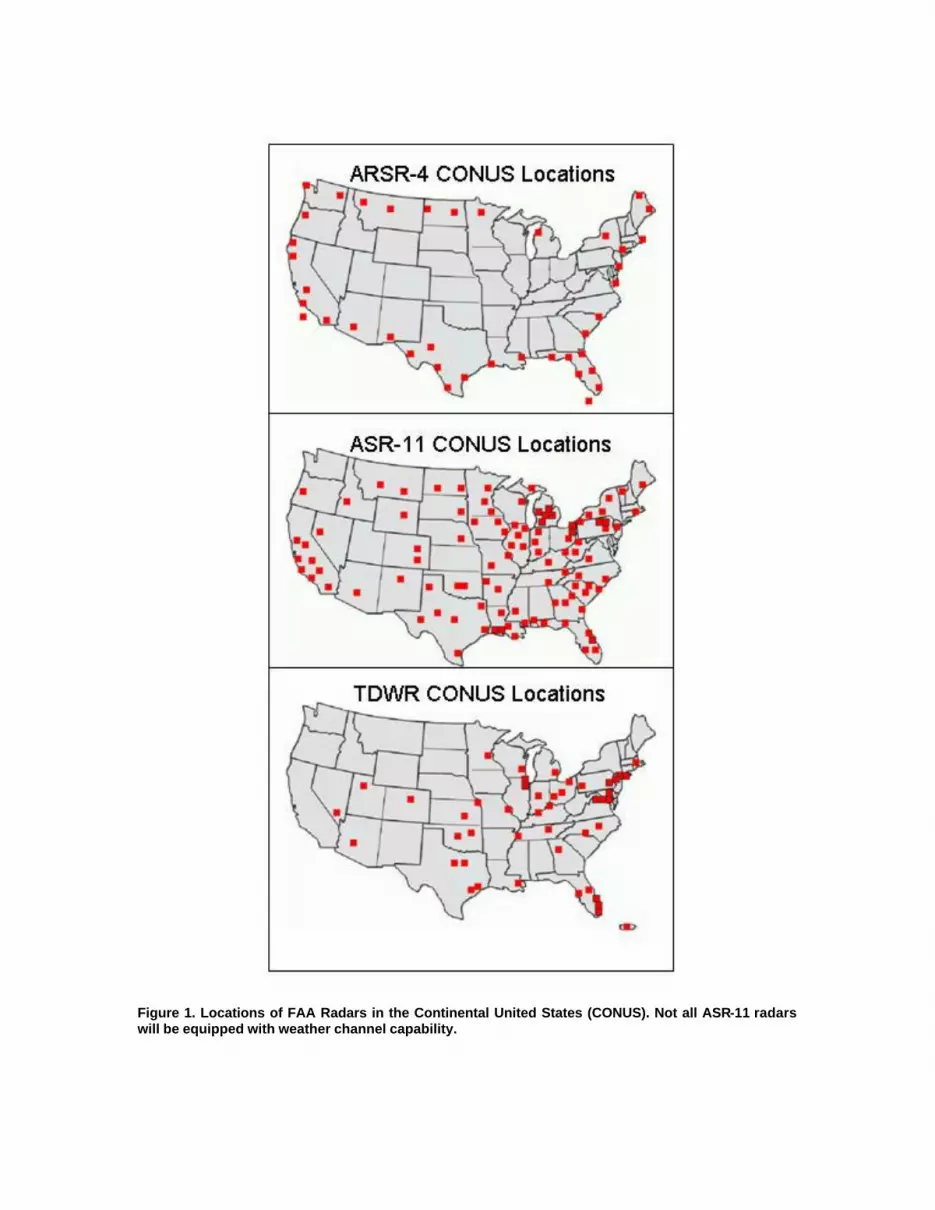
Figure 1. Locations of FAA Radars in the Continental United States (CONUS). Not all ASR-11 radars will be equipped with weather channel capability.
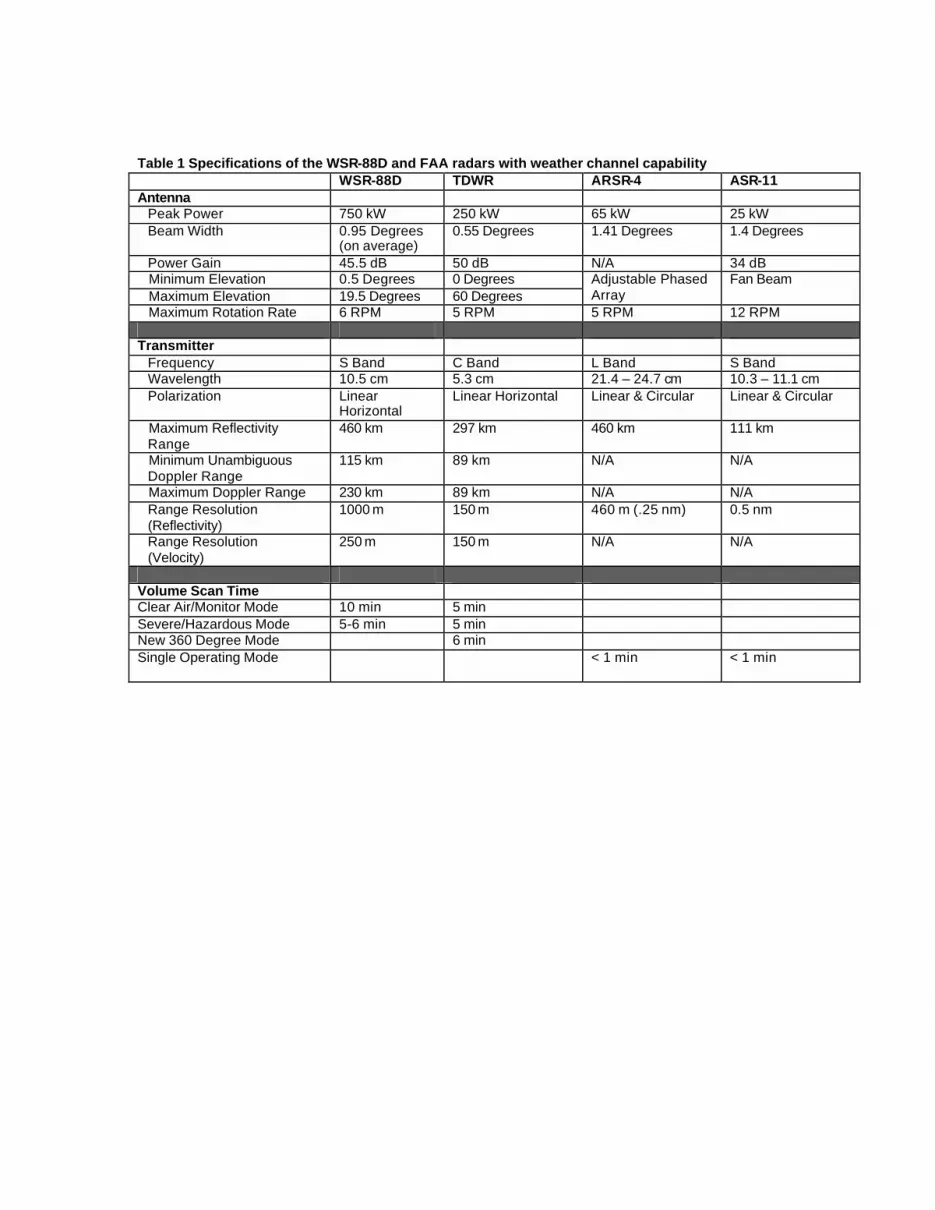
Table 1 Specifications of the WSR-88D and FAA radars with weather channel capability WSR-88D TDWR ARSR-4 ASR-11 Antenna Peak Power 750 kW 250 kW 65 kW 25 kW Beam Width 0.95 Degrees
(on average) 0.55 Degrees 1.41 Degrees 1.4 Degrees
Power Gain 45.5 dB 50 dB N/A 34 dB Minimum Elevation 0.5 Degrees 0 Degrees Maximum Elevation 19.5 Degrees 60 Degrees
Adjustable Phased Array
Fan Beam
Maximum Rotation Rate 6 RPM 5 RPM 5 RPM 12 RPM Transmitter Frequency S Band C Band L Band S Band Wavelength 10.5 cm 5.3 cm 21.4 – 24.7 cm 10.3 – 11.1 cm Polarization Linear
Horizontal Linear Horizontal Linear & Circular Linear & Circular
Maximum Reflectivity Range
460 km 297 km 460 km 111 km
Minimum Unambiguous Doppler Range
115 km 89 km N/A N/A
Maximum Doppler Range 230 km 89 km N/A N/A Range Resolution (Reflectivity)
1000 m 150 m 460 m (.25 nm) 0.5 nm
Range Resolution (Velocity)
250 m 150 m N/A N/A
Volume Scan Time Clear Air/Monitor Mode 10 min 5 min Severe/Hazardous Mode 5-6 min 5 min New 360 Degree Mode 6 min Single Operating Mode
< 1 min < 1 min

Table 2 TDWR Scan Strategies at Oklahoma City. Red Elevation values denote sector scans. Negative rotation rates indicate counterclockwise antenna motion.
Monitor Mode
Legacy
Hazardous Weather
Mode
New 360-Degree
Hazardous Weather
Mode
Scan No.
Elev Deg
Rot Rate
Elev Deg
Rot Rate
Elev Deg
Rot Rate
1 0.6 21.6 0.6 22 0.6 22 2 0.3 21.6 0.3 22 0.3 22 3 0.3 21.6 0.3 22 0.3 22 4 2.5 21.6 2.5 25 3.8 30 5 1.0 21.6 5.1 -25 7.5 30 6 6.1 21.6 7.6 25 11.2 30 7 11.0 21.6 10.1 -25 0.3 22 8 15.9 21.6 12.5 25 1.0 22 9 20.8 21.6 14.8 -25 14.6 30
10 25.7 21.6 17.6 25 19.2 30 11 30.6 21.6 0.3 -22 0.3 22 12 35.5 21.6 1.0 -22 24.9 30 13 40.4 21.6 20.9 25 31.8 30 14 45.3 21.6 24.6 -25 3.8 30 15 50.2 21.6 28.8 25 0.3 22 16 55.1 21.6 33.4 -25 7.5 30 17 60.0 21.6 38.4 25 11.2 30 18 0.3 -22 14.6 30 19 2.5 -22 0.3 22 20 5.1 25 19.2 30 21 7.6 -25 24.9 30 22 10.1 25 31.8 30 23 12.5 -25 0.3 22 24 14.8 25 25 0.3 -22 26 17.6 25 27 20.9 -25 28 24.6 25 29 28.8 -25 30 33.4 25 31 38.4 -25 32 1.0 22 33 0.3 -22

2.2 ARSR-4
The Air Route Surveillance Radar, Model 4 is a joint FAA and DoD initiative whose mission is to provide aircraft position information to the FAA, Air Force, Navy and Customs Service. The system is used simultaneously for national defense early warning, drug smuggling interdiction, and air traffic control. As a secondary function, the ARSR-4 also provides weather information to both the FAA and the NWS (Stern, 2001).
The ARSR-4 is a long-range surveillance radar system, capable of detecting all aircraft up to 250 NM (460 km). In mid 2000, the FAA completed the installation of 44 ARSR-4 systems. Of these, 43 were deployed around the periphery of the continental United States as well as in Guam, Hawaii and Guantanamo Bay, Cuba (Figure 1). The 44th system is used for support, development and training at the FAA Academy in Oklahoma City.
The ARSR-4 uses a data acquisition system that is quite different from the WSR-88D or TDWR. The ARSR-4 utilizes a huge (60 foot diameter), L-Band, phased-array antenna. Within a phased array system, the individual (array) elements can be electronically controlled to manipulate the direction and shape of each beam. This means that the phased array can be used to scan the entire volume of the atmosphere with one pass instead of combining many individual elevation slices to create a volume. This allows for a much faster processing of atmospheric volumes.
The ARSR-4’s phased-array generates 10 beams which are divided into the upper or “high stack” and the lower or “low stack”. The high stack beams contain no weather filtering and have no way to filter AP (anomalous propagation) contamination. Hence, these upper beams are not used for weather sampling. The low stack array, however, does contain a weather channel and at present returns reflectivity values based on the old NWS DVIP (Digital Video Integrator and Processor) standard (US DOC, 1981). In the future, if additional equipment is added, the Doppler channel may become available for NWS use.
When generating an elevation of reflectivity, the ARSR-4 approximates a CAPPI (Constant Altitude Plan Position Indicator) environment by using a “stair-stepping” methodology. At close in ranges , the highest beam (in the low stack) is used for a certain range, followed by the next highest beam extending out to the lowest beam at the longest range. An example of this scheme can be seen in Figure 2.
This beam structure, while allowing for rapid atmospheric volumes to be obtained, produces several artifacts (Stern et al, 2002).
1. At each ‘beam switch range’ (the
beginning point when a radial switches from using data from one beam to another), there can be a gap in echo coverage which can occasionally be seen as a discontinuity in the echo presentation.
2. The scale of reflectivity values returned can change from one beam range to another. Within the first beam range (closest to the radar), only DVIP levels 1 through 5 are returned. From the first beam switch range to the maximum effective coverage, only DVIP levels 2 through 6 are returned. Hence, when precipitation moves from the second beam range into the first, it may appear as if strong echoes diminish or the areal coverage of low intensity returns increase (since level 1 echoes become visible).
3. The beam structure can miss (undercut) elevated convective cores at ranges within 80 NM. Also, some low altitude returns may be underestimated within 50 NM.
The angular beam width of the ARSR-4 is 1.41
degrees which means that a scan consists of 256 radial ‘wedges’. The vertical dimension of the beam is 2.2 degrees. The range resolution is 0.25 NM out to a range of 250 NM (460 km).
The ARSR-4, in an effort to minimize the effects of hydrometeorological returns, uses two polarization schemes. In clear air, the system uses Linear Polarization (LP). However, when precipitation coverage exceeds a specific threshold, the system utilizes Circular Polarization (CP). This change in polarization change can be performed on the entire scan, or on a sector-by-sector basis. A sector on the ARSR-4 consists of 8 wedges or about 11.25 degrees of arc. This can produce one elevation with numerous changes in polarization processing.
Table 3 shows the elevations associated with the low stack beams in LP and CP at both the Oklahoma City, OK and Watford City, ND (which is located about 180 NM northwest of Bismarck, ND). Each ARSR-4 has a unique base tilt, which must be added to all of the values. For example, the base tilt at Oklahoma City is +1.2 degrees. As with the TDWR, the beam elevations can be different for each radar.

Figure 2 The CAPPI Beam Structure of the ARSR-4. Beam Switch Locations can be seen at 20, 35 and 55 NM.
Table 3 ARSR-4 Low Stack Beam Angles. The unique base tilt of each radar must be added to every value.
Oklahoma City, OK Watford City, ND Linear
Polarization Circular
Polarization Linear
Polarization Circular
Polarization Beam 4 3.8 deg 5.0 deg Beam 3 2.3 deg 3.8 deg 3.5 deg 5.0 deg Beam 2 0.8 deg 1.6 deg 2.0 deg 2.8 deg Beam 1 -0.7 deg -0.7 deg 0.5 deg 0.5 deg
2.3 ASR-11
The Airport Surveillance Radar, Model 11, or ASR-11 is a next-generation solid-state, terminal area air traffic control radar. Both the FAA and the DoD are using the ASR-11 to replace aging analog systems at up to 213 military and civilian airfields across the country (Raytheon, 2002).
The ASR-11’s primary coverage range extends for 60 NM. In addition to aircraft location information, the system generates a calibrated six-level weather output based on the NWS DVIP scale.
With a fixed rotation rate of 12 RPM, the ASR-11 can generate a map of weather data every 30 seconds. Containing 256 radials per scan, the angular resolution is 1.41 degrees. The vertical dimension is the largest of the surveyed radars at 4.8 degrees. The range resolution is 0.5 NM.
Like the ARSR-4, the ASR-11 uses a
combination of Linear and Circular Polarization changes to reduce its sensitivity to hydrometeorological returns. Also, because of the use of a fan beam structure (a beam much larger in vertical extent than horizontal) only one fixed elevation of weather data is available. 3. BENEFITS OF FAA RADAR WEATHER DATA
There are numerous potential benefits that can be obtained from the deployment and operational use of FAA radar weather data within the NWS forecast and warning structure (Saffle, 2001).
• There is an immediate cost benefit in leveraging a system that is already developed, deployed and maintained.

• The operating agencies (FAA and DoD) will be able to receive new or enhanced weather products from their systems.
• In many cases, FAA radars will provide data in poor coverage areas; either in the WSR-88D ‘cone of silence’ region, in areas where there are beam obstructions or at long ranges where the beam can overshoot echoes.
• In the case of the TDWR, high resolution reflectivity and Doppler data could be used for faster and more accurate severe weather detection.
• Also, the TDWR’s Doppler information could be used to better handle range folding and obscuration issues within the WSR-88D.
• The deployment of the ARSR-4 radars along the country’s coastlines would provide additional long range coverage for tropical and subtropical cyclones.
• Multiple radars in relatively close proximity could provide an environment for the development and validation of multidimensional storm identification algorithms and lead to a better understanding of storm morphology.
• Additional radars can act in a backup mode in the event that a WSR-88D goes down for mechanical reasons or maintenance.
• Since the TDWR is located near the nation’s largest airports, its high-resolution coverage extends over a substantial percentage of the country’s urban population. Using statistics from the 2000 census based on metropolitan area populations, the 47 TDWR’s cover at least 120 million people or 43% of the total U.S. population (Boyer, 1999).
4. EXAMPLES OF FAA RADAR WEATHER DATA
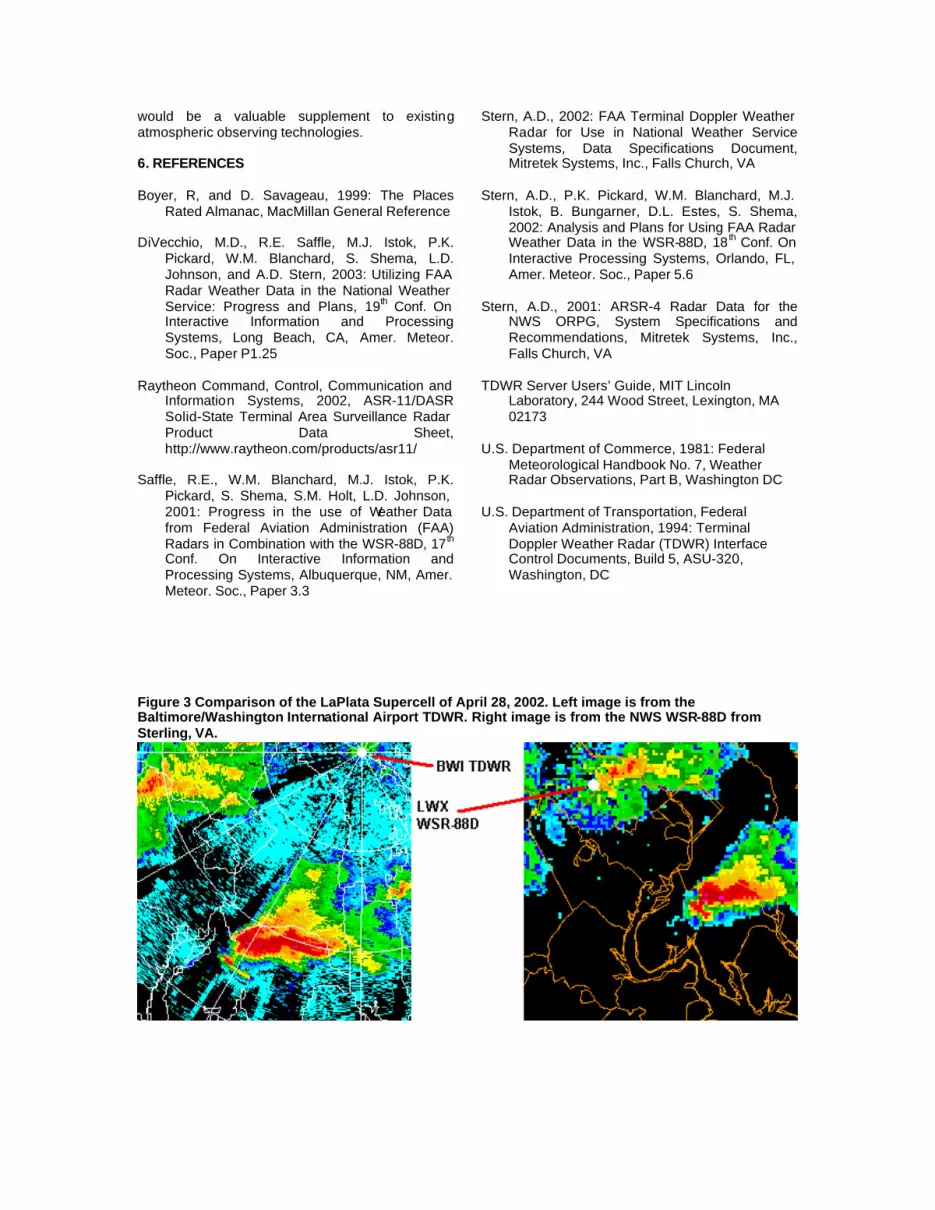
On April 28, 2002, a deadly tornado swept across the southern suburbs of Washington, D.C. Post storm analysis indicated that the tornado had reached an F4 on the Fujita scale with winds as high as 260 mph. Softball size hail (4.5” diameter) was reported with this storm.
Figure 3 shows two views of the supercell responsible for the tornado. The left image is from the Baltimore/Washington International Airport (BWI) TDWR on April 28, 2002 at 2305Z. The distance from BWI to the storm is about 50 NM.
The right image is from the NWS WSR-88D at Sterling, VA. This image was from April 28, 2002 at 2304Z. Like the TDWR, the storm is about 50 NM from the Sterling radar.
Both images show the classic structure of a mature supercell storm. The hook located on the right rear flank is indicative of strong mesocyclonic circulation. The spreading shape of the right side of the echo clearly shows the storms diffluent mid level structure. Both images contain small maximums of reflectivity (in purple) over and just downstream from the main updraft. In short, the quality of the TDWR image compared favorably with the higher power and longer wavelength of the WSR-88D at this range.
However, the legacy hazardous weather strategy employed at the BWI site would have only produced a limited number of elevations with data from the supercell. As an example, Figure 4 shows the areal coverage of a sector scan at BWI. The sweep extends for 120 degrees. Depending on the distance of the TDWR to its associated airport, the sector size will change. Figure 5 shows the relative locations of the BWI TDWR and the airport.
The Stockton ASR-11 is located between Sacramento and Modes to in central California. Its short range, beam characteristics and limited reflectivity scale will allow forecasters to see basic precipitation coverage, but little in the way of storm structure. In Figure 6, light level 1 and 2 precipitation can be seen to the southeast of the ASR-11 radar. The bottom image shows much more detail, from the Sacramento WSR-88D even though that radar is twice as far away.
Finally, Figure 7 shows a display from the Watford City, ND ARSR-4. In this image, a storm producing large hail was located just to the east of the radar. However, due to the scan strategy of the phased-array beams, much of the core of the storm was undercut. Several other artifacts of the ARSR-4 can be seen in the image including the ring associated with the first beam switch range and the loss of level 1 outside of the first beam area. 5. SUMMARY
The NWS continues to strive to improve its forecast and warning operations through the use of new and leveraging existing technologies. Demonstration activities at a number of offices are providing forecasters with real-time FAA radar weather data both to compare and enhance NWS Doppler information, short-range forecasting and warnings.
Though the primary purpose of most FAA radars is to detect aircraft, all of the radars surveyed contain valuable weather channels. Once the characteristics, biases and limitations of the data can be cataloged, and forecasters trained in their interpretation, it is believed that these data
would be a valuable supplement to existing atmospheric observing technologies.
6. REFERENCES Boyer, R, and D. Savageau, 1999: The Places
Rated Almanac, MacMillan General Reference DiVecchio, M.D., R.E. Saffle, M.J. Istok, P.K.
Pickard, W.M. Blanchard, S. Shema, L.D. Johnson, and A.D. Stern, 2003: Utilizing FAA Radar Weather Data in the National Weather Service: Progress and Plans, 19th Conf. On Interactive Information and Processing Systems, Long Beach, CA, Amer. Meteor. Soc., Paper P1.25
Raytheon Command, Control, Communication and
Information Systems, 2002, ASR-11/DASR Solid-State Terminal Area Surveillance Radar Product Data Sheet, http://www.raytheon.com/products/asr11/
Saffle, R.E., W.M. Blanchard, M.J. Istok, P.K.
Pickard, S. Shema, S.M. Holt, L.D. Johnson, 2001: Progress in the use of Weather Data from Federal Aviation Administration (FAA) Radars in Combination with the WSR-88D, 17 th Conf. On Interactive Information and Processing Systems, Albuquerque, NM, Amer. Meteor. Soc., Paper 3.3
Stern, A.D., 2002: FAA Terminal Doppler Weather Radar for Use in National Weather Service Systems, Data Specifications Document, Mitretek Systems, Inc., Falls Church, VA
Stern, A.D., P.K. Pickard, W.M. Blanchard, M.J.
Istok, B. Bungarner, D.L. Estes, S. Shema, 2002: Analysis and Plans for Using FAA Radar Weather Data in the WSR-88D, 18 th Conf. On Interactive Processing Systems, Orlando, FL, Amer. Meteor. Soc., Paper 5.6
Stern, A.D., 2001: ARSR-4 Radar Data for the
NWS ORPG, System Specifications and Recommendations, Mitretek Systems, Inc., Falls Church, VA
TDWR Server Users’ Guide, MIT Lincoln
Laboratory, 244 Wood Street, Lexington, MA 02173
U.S. Department of Commerce, 1981: Federal
Meteorological Handbook No. 7, Weather Radar Observations, Part B, Washington DC
U.S. Department of Transportation, Federal
Aviation Administration, 1994: Terminal Doppler Weather Radar (TDWR) Interface Control Documents, Build 5, ASU-320, Washington, DC
Figure 3 Comparison of the LaPlata Supercell of April 28, 2002. Left image is from the Baltimore/Washington International Airport TDWR. Right image is from the NWS WSR-88D from Sterling, VA.

Figure 4 BWI TDWR Sector Scan Image during Hazardous Weather Mode Operations
Figure 5 The location of the BWI TDWR to the Airport and the extent of its sector sweep area.
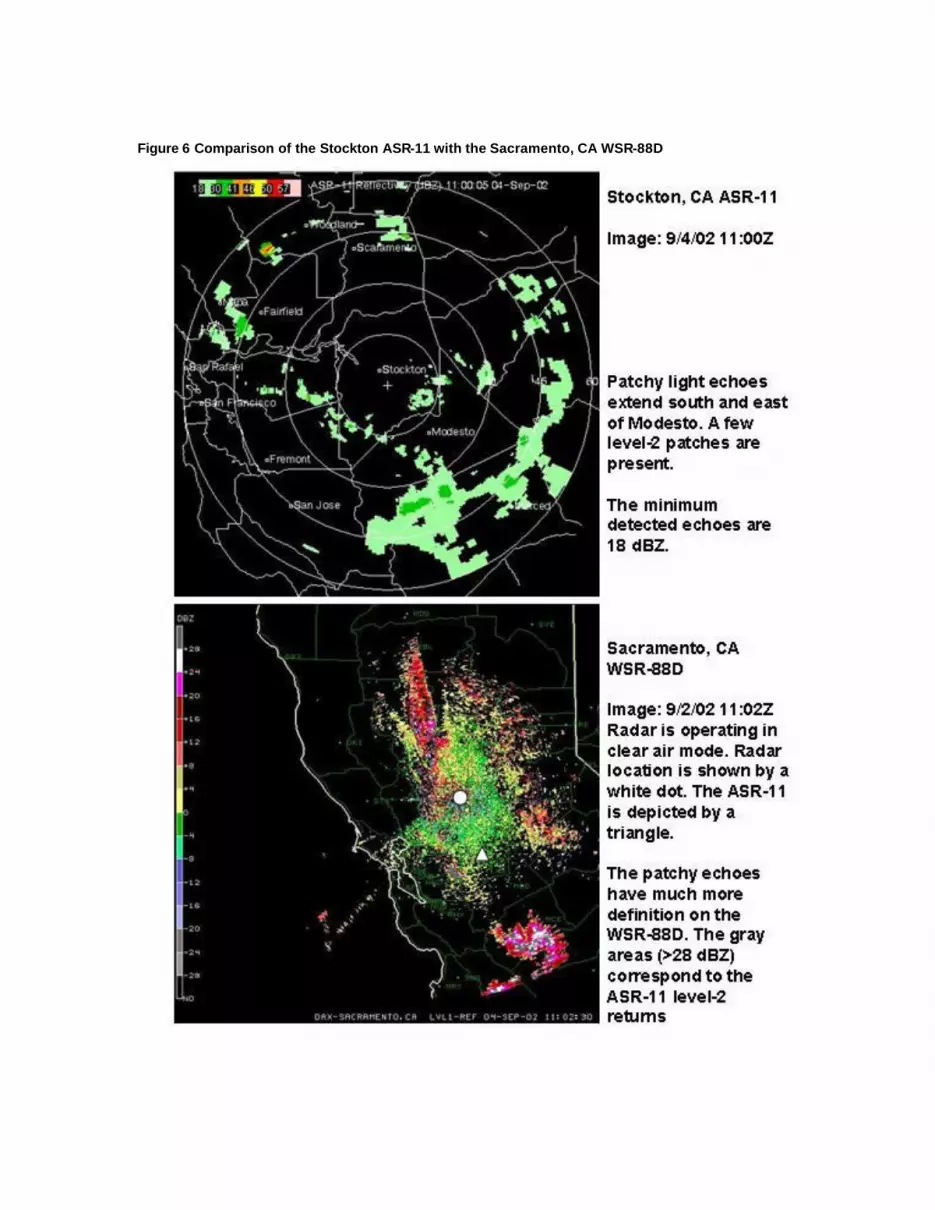
Figure 6 Comparison of the Stockton ASR-11 with the Sacramento, CA WSR-88D

Figure 7 Artifacts of the ARSR-4 as seen from an image at Watford City, ND