exploring the causes of power-converter failure in wind
TRANSCRIPT
energies
Article
Exploring the Causes of Power-Converter Failure inWind Turbines based on Comprehensive Field-Dataand Damage Analysis
Katharina Fischer 1,* , Karoline Pelka 1, Sebastian Puls 2, Max-Hermann Poech 2, Axel Mertens 3,Arne Bartschat 1, Bernd Tegtmeier 1, Christian Broer 1 and Jan Wenske 1
1 Fraunhofer Institute for Wind Energy Systems (Fraunhofer IWES), 30159 Hannover, Germany;[email protected] (K.P.); [email protected] (A.B.);[email protected] (B.T.); [email protected] (C.B.);[email protected] (J.W.)
2 Fraunhofer Institute for Silicon Technology (Fraunhofer ISIT), 25524 Itzehoe, Germany;[email protected] (S.P.); [email protected] (M.-H.P.)
3 Institute for Drive Systems and Power Electronics IAL, Leibniz University Hannover,30167 Hannover, Germany; [email protected]
* Correspondence: [email protected]; Tel.: +49-471-14290-542
Received: 30 December 2018; Accepted: 11 February 2019; Published: 13 February 2019�����������������
Abstract: Power converters are among the most frequently failing components of wind turbines.Despite their massive economic impact, the actual causes and mechanisms underlying these failureshave remained in the dark for many years. In view of this situation, a large consortium of three researchinstitutes and 16 companies, including wind-turbine and component manufacturers, operators andmaintenance-service providers has joined forces to identify the main causes and driving factors ofthe power-converter failures in wind turbines to create a basis for effective remedial measures. Thepresent paper summarizes and discusses the results of this research initiative, which have beenachieved through the evaluation of converter-specific failure and operating data of a large and diverseworldwide wind-turbine fleet, field measurements as well as post-mortem investigation of returnedconverter components. A key conclusion of the work is that the thermal-cycling induced fatigue ofbond-chip contacts and die-attach solder, which is a known issue in other fields of power-electronicsapplications and which has been widely assumed to be the principle damage mechanisms also inwind turbines, is no relevant contributor to the observed converter failures in this application. Instead,the results indicate that environmental factors such as humidity and contamination but also designand quality issues as well as human errors play an important part in the incidence of these failures.
Keywords: reliability; power electronics; power converter; wind power; root-cause analysis;post-mortem analysis; field data
1. Introduction
Power-electronic converters are key components in variable-speed wind turbines (WTs). At thesame time, they are among the most frequently failing components of WTs. This has been shownby numerous system-level studies evaluating the reliability of wind turbines in different parts of theworld. According to the RELIAWIND study based on data from 373 WTs with a total of 1115 WToperating years from 2004–2010, the power converter ranks second with regard to both the failure rateand the resulting downtime [1,2]. A study evaluating >5800 failures in wind farms in China during2010–2012 identified the frequency converter as the by far most frequently failing component [3].Recent system-level reliability data collected within the SPARTA initiative during 2015–2016, which
Energies 2019, 12, 593; doi:10.3390/en12040593 www.mdpi.com/journal/energies
Energies 2019, 12, 593 2 of 27
covers 1045 offshore WTs in the UK with 1219 WT operating years, ranks power converter failuresfourth, with an average of 1.3 failures per WT and year [4].
1.1. State of Research on Power-Converter Reliability in Wind Turbines
Although the issue of high converter unreliability in WTs has existed for more than two decadesand is a relevant contributor to maintenance costs and downtime-related revenue losses, it has todate still not been solved. The main reason is that the causes and mechanisms underlying thefrequent failures have remained largely unclear. For a long time, the scientific literature related topower-converter reliability in the wind application has focused almost exclusively on the failuremechanisms known from other power-electronics applications: the fatigue of bond-wire contacts anddie-attach solder under the long-term impact of temperature cycles due to power cycling and thethermomechanical stress resulting from this (see e.g., [5–8]). Assuming that the same mechanisms werethe dominant life-limiting ones also in power converters in the wind application, the empirical lifetimemodels available for these “classical” failure mechanisms were widely applied, e.g., for reliabilitysimulations and work on remaining-life estimation (see e.g., [9–19]). In this body of work, a particularfocus on the generator-side converter in WTs with doubly-fed induction generator (DFIG) and in WTswith low-speed permanent-magnet synchronous generator (PMSG) is found. As these converters areloaded with low-frequency currents on the generator side and are therefore subject to large temperaturecycles [20], they were expected to be particularly prone to failure.
A wider focus going beyond the above-mentioned fatigue-related damage mechanisms is found,e.g., in [21–25]. However, a recently published survey has made clear that temperature cycles due topower cycling are still perceived as most critical stressor for power converters in wind turbines [26].
1.2. Previous Work of the Authors
An initial field-experience based study of some of the authors (project CONFAIL, see [27,28]) raisedfor the first time the question of whether thermal-cycling induced fatigue was in fact the cause of thepower-converter failures observed in wind turbines. However, as this study was focused on only twoWT models, it was too limited to allow drawing any conclusions for the wind application in general.In view of this, a large consortium of three research institutes and 16 companies, including wind-turbineand component manufacturers, operators and maintenance-service providers, joined forces under thelead of Fraunhofer IWES in a research cluster, the Fraunhofer Innovation Cluster on Power Electronics forRenewables. Using again a field-experience based approach, the research carried out within this clusterhas built on an exploratory analysis of comprehensive converter-failure and operating data, which wasprovided by the project partners, as well as on field measurements and the post-mortem analysis ofpower-converter components returned from the field. This has been complemented by comprehensivemodelling and simulation work for investigating potentially critical effects resulting from the dynamicinteraction of the electrical, mechanical and structural wind-turbine components under the influence ofstochastic wind fields and grid conditions [29–31]. The results of all these different approaches have beenevaluated in an interdisciplinary team in close collaboration with the project partners, with the mainobjective to identify the relevant factors and mechanisms leading to converter failure in wind turbines inorder to create a sound basis for the development of effective countermeasures.
Thanks to the project partners, field data from more than 2700 horizontal-axis, variable-speedWTs of a wide variety of manufacturers, types and operating ages operating at onshore and offshoresites on four different continents could be collected and evaluated. With almost 7400 WT operatingyears covered, the to the authors’ knowledge most comprehensive and up-to-date cross-manufacturercollection of converter-specific failure and operating data worldwide could be established in this way.
Previous publications of the authors based on this data collection are [32–36]. The most relevantfindings, which constitute important background information for the present paper, are summarizedin the following. For details about the analysis methodology underlying these results, the reader isreferred to the respective publications.

Energies 2019, 12, 593 3 of 27
On average, 0.48 a−1 failures of the main power-converter system occurred per WT in theconsidered worldwide turbine fleet. With a mean failure rate of 0.16 a−1 failures per WT, the largestshare of this is accounted for by the core components of the converters denoted “phase module” [35].This phase-module component category includes the power semiconductor modules with theirgate-driver boards, the DC-link capacitors and busbars. As the phase-module categories were identifiedto be not only the weak point in the converter system with respect to failure frequency but also themain driver of repair cost and downtime [32], the focus of all subsequent field-data analysis has beenon examining the phase-module failures and identifying factors influencing these.
A failure-rate comparison between WTs commissioned from 1997 to 2015 has revealed that theiraverage phase-module failure rates have not decreased over successive WT generations [35]. This hasmade clear that the high power-converter unreliability is a problem not limited to old turbine fleetsbut is also a critical issue in contemporary WTs. To understand and counteract the causes of converterfailure is therefore a challenge of unchanged relevance.
A comparison of the average phase-module failure rates in WTs with different generator-converterconcepts and of different manufacturers has revealed major differences between these. The group ofWTs with electrically excited synchronous generator (EESG) and full power converter was found tohave the on average lowest failure rate, while that of WTs with squirrel-cage induction generator andfull power converter (IG + FPC) showed the highest. The group of WTs with doubly-fed inductiongenerator (DFIG) and partially rated converter, which is particularly well represented in the evaluateddatabase, ranked between the other two groups [35]. However, it is important to note that thiscomparison has not taken into consideration the diverse wind regimes (and with that the loadconditions) the WTs in the different groups have been operating in.
In search of spatial or temporal failure patterns, a strong seasonal variation of phase-module failurerates was discovered in WT fleets in India and Scandinavia. In Scandinavia, this pattern was found inWT fleets of three different manufacturers. The observation that periods with increased phase-modulefailure rates coincided with periods of high ambient absolute humidity suggested that moisture andcondensation are factors with a relevant influence on converter failure in wind turbines [35].
An investigation of the operating point preceding phase-module failures showed that thefrequency of these failures was highest in and around full-load operation, i.e., during operationclose to, at or above the rated power of the wind turbine. This observation was made for turbines ofdifferent generator-converter concepts and manufacturers and suggested that high electrical loads area trigger for converter failures [35].
Weibull analysis applied to WTs with known converter-component age revealed a pronouncedinfant-mortality behavior (shape factor b < 1), i.e., failure rates decreasing with the age of the phasemodules [33,36]. Wear-out failure behavior with increasing failure rates, which would have beentypical of fatigue-driven failure mechanisms, was not found in any of the analyzed WT fleets.
Finally, the comprehensive field data was utilized to statistically investigate the effect of differentdesign factors on phase-module reliability. These included the power-converter position inside theturbine (nacelle, tower base or distributed), the converter cooling concept (liquid- vs. air-cooled),the rated power of the converter, its DC-link voltage level and the earthing system (earthed system“terre neutre” TN vs. system “isolé terre” IT, in which all active parts are insulated from earth). LowDC-link voltages, liquid cooling and IT systems were found to have a significant positive effect onreliability [36].
1.3. Contribution and Outline of the Present Paper
The present paper seeks to provide the state of knowledge with respect to the failure causesand relevant influencing factors that has been achieved within the Innovation Cluster. Following anintroduction of the analysis methods (Section 2), it complements the previously published field-dataanalysis results summarized above with deepened statistical analyses and presents the findings ofcomprehensive damage assessments of defect power-converter components carried out at the involved
Energies 2019, 12, 593 4 of 27
research institutes and their industrial partners (Section 3). Taking into account the full picture ofresults obtained, it provides an in-depth discussion of the mechanisms and factors identified to berelevant (or irrelevant) for converter failure in wind turbines (Section 4). The paper closes witha summary of the main conclusions as well as an outlook to future work (Section 5).
2. Investigated Systems and Analysis Methods
2.1. Studied Wind-Turbine Systems
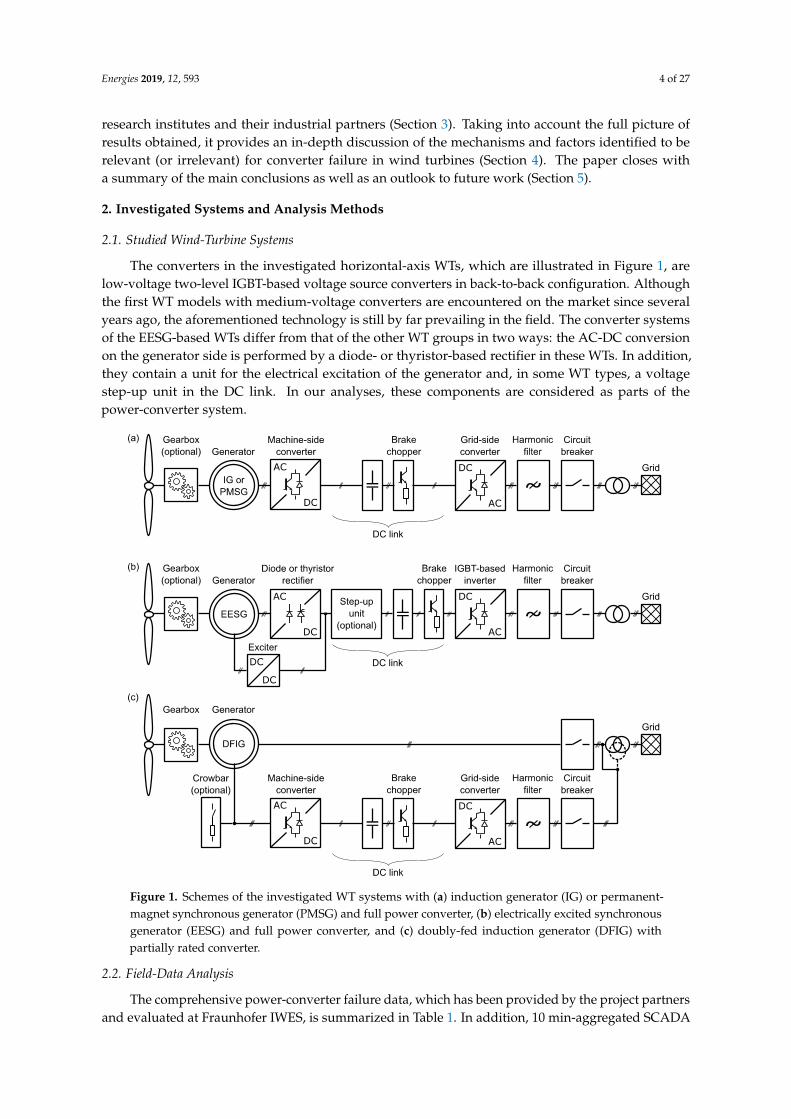
The converters in the investigated horizontal-axis WTs, which are illustrated in Figure 1, arelow-voltage two-level IGBT-based voltage source converters in back-to-back configuration. Althoughthe first WT models with medium-voltage converters are encountered on the market since severalyears ago, the aforementioned technology is still by far prevailing in the field. The converter systemsof the EESG-based WTs differ from that of the other WT groups in two ways: the AC-DC conversionon the generator side is performed by a diode- or thyristor-based rectifier in these WTs. In addition,they contain a unit for the electrical excitation of the generator and, in some WT types, a voltagestep-up unit in the DC link. In our analyses, these components are considered as parts of thepower-converter system.
Energies 2019, 12, x FOR PEER REVIEW 4 of 27
picture of results obtained, it provides an in‐depth discussion of the mechanisms and factors
identified to be relevant (or irrelevant) for converter failure in wind turbines (Section 4). The paper
closes with a summary of the main conclusions as well as an outlook to future work (Section 5).
2. Investigated Systems and Analysis Methods
2.1. Studied Wind‐turbine Systems
The converters in the investigated horizontal‐axis WTs, which are illustrated in Figure 1, are
low‐voltage two‐level IGBT‐based voltage source converters in back‐to‐back configuration. Although
the first WT models with medium‐voltage converters are encountered on the market since several
years ago, the aforementioned technology is still by far prevailing in the field. The converter systems
of the EESG‐based WTs differ from that of the other WT groups in two ways: the AC‐DC conversion
on the generator side is performed by a diode‐ or thyristor‐based rectifier in these WTs. In addition,
they contain a unit for the electrical excitation of the generator and, in some WT types, a voltage step‐
up unit in the DC link. In our analyses, these components are considered as parts of the power‐
converter system.
Figure 1. Schemes of the investigated WT systems with (a) induction generator (IG) or permanent‐
magnet synchronous generator (PMSG) and full power converter, (b) electrically excited synchronous
generator (EESG) and full power converter, and (c) doubly‐fed induction generator (DFIG) with
partially rated converter.
2.2. Field‐data Analysis
The comprehensive power‐converter failure data, which has been provided by the project
partners and evaluated at Fraunhofer IWES, is summarized in Table 1. In addition, 10 min‐aggregated
SCADA data and SCADA status‐logs have been available for analysis from more than half of the
Figure 1. Schemes of the investigated WT systems with (a) induction generator (IG) or permanent-magnet synchronous generator (PMSG) and full power converter, (b) electrically excited synchronousgenerator (EESG) and full power converter, and (c) doubly-fed induction generator (DFIG) withpartially rated converter.
2.2. Field-Data Analysis
The comprehensive power-converter failure data, which has been provided by the project partnersand evaluated at Fraunhofer IWES, is summarized in Table 1. In addition, 10 min-aggregated SCADA
Energies 2019, 12, 593 5 of 27
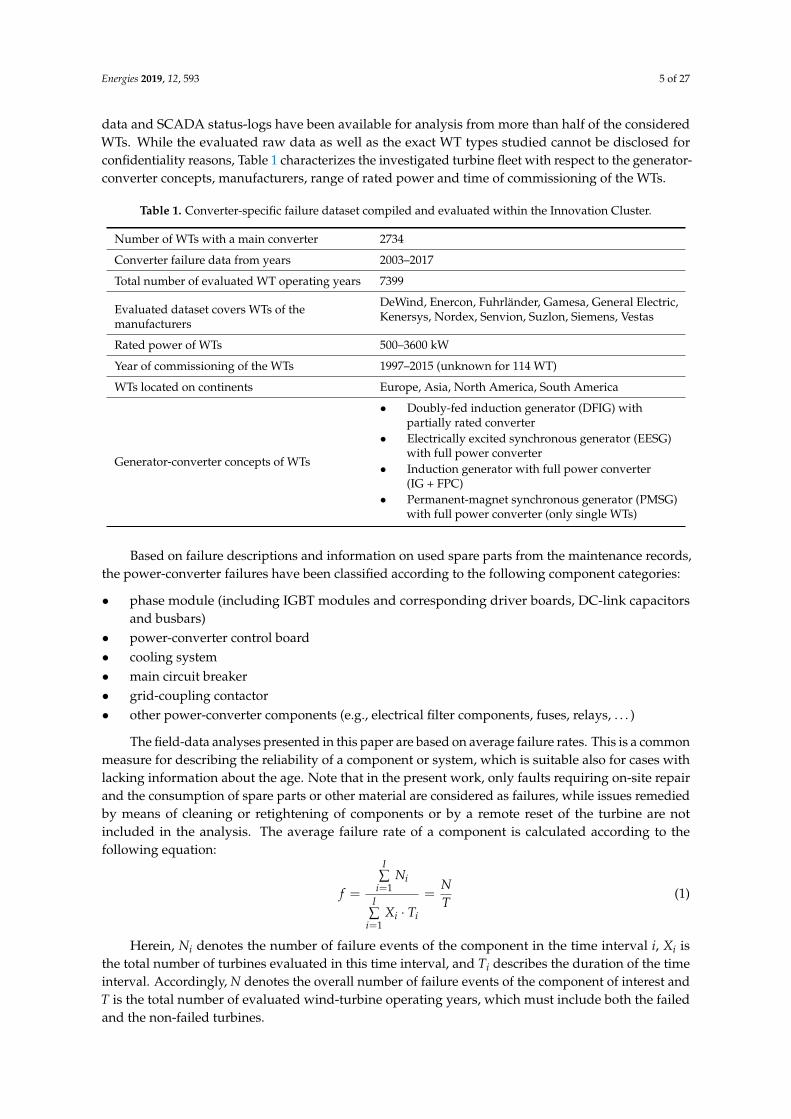
data and SCADA status-logs have been available for analysis from more than half of the consideredWTs. While the evaluated raw data as well as the exact WT types studied cannot be disclosed forconfidentiality reasons, Table 1 characterizes the investigated turbine fleet with respect to the generator-converter concepts, manufacturers, range of rated power and time of commissioning of the WTs.
Table 1. Converter-specific failure dataset compiled and evaluated within the Innovation Cluster.
Number of WTs with a main converter 2734
Converter failure data from years 2003–2017
Total number of evaluated WT operating years 7399
Evaluated dataset covers WTs of themanufacturers
DeWind, Enercon, Fuhrländer, Gamesa, General Electric,Kenersys, Nordex, Senvion, Suzlon, Siemens, Vestas
Rated power of WTs 500–3600 kW
Year of commissioning of the WTs 1997–2015 (unknown for 114 WT)
WTs located on continents Europe, Asia, North America, South America
Generator-converter concepts of WTs
• Doubly-fed induction generator (DFIG) withpartially rated converter
• Electrically excited synchronous generator (EESG)with full power converter
• Induction generator with full power converter(IG + FPC)
• Permanent-magnet synchronous generator (PMSG)with full power converter (only single WTs)
Based on failure descriptions and information on used spare parts from the maintenance records,the power-converter failures have been classified according to the following component categories:
• phase module (including IGBT modules and corresponding driver boards, DC-link capacitorsand busbars)
• power-converter control board• cooling system• main circuit breaker• grid-coupling contactor• other power-converter components (e.g., electrical filter components, fuses, relays, . . . )
The field-data analyses presented in this paper are based on average failure rates. This is a commonmeasure for describing the reliability of a component or system, which is suitable also for cases withlacking information about the age. Note that in the present work, only faults requiring on-site repairand the consumption of spare parts or other material are considered as failures, while issues remediedby means of cleaning or retightening of components or by a remote reset of the turbine are notincluded in the analysis. The average failure rate of a component is calculated according to thefollowing equation:
f =
I∑
i=1Ni
I∑
i=1Xi · Ti
=NT
(1)
Herein, Ni denotes the number of failure events of the component in the time interval i, Xi isthe total number of turbines evaluated in this time interval, and Ti describes the duration of the timeinterval. Accordingly, N denotes the overall number of failure events of the component of interest andT is the total number of evaluated wind-turbine operating years, which must include both the failedand the non-failed turbines.
Energies 2019, 12, 593 6 of 27
As introduced in detail in [35], we provide confidence intervals for failure-rate values in orderto quantify the uncertainty these are afflicted with. For the given case of time-censored data, theconfidence intervals are estimated according to[
χ2( α2 , 2N)
2T,
χ2(1 − α2 , 2N + 2)2T
](2)
provided in [37]. Herein, χ2(α/2,2N) is the (α/2)-quantile of the χ2-distribution with 2N degrees offreedom. In the present paper, the average failure rates are presented with the 90% confidence intervals(α = 0.1).
In order to characterize the load regime of the analyzed wind turbines, their capacity factor CF isused. It is defined as the mean active power fed to the grid divided by the WT rated power.
CF =Pmean
Prated, (3)
which is equivalent to the ratio of the actual electrical energy output over a certain period of time tothe potential energy output over the same period that would result from continuous operation at ratedpower. The capacity factor is calculated using the 10min-averaged SCADA data of the WTs. Onlyinteger multiples of 1-year-periods are included in the calculation of CF in order to avoid a bias due toseasonal wind-speed variations.
2.3. Post-Mortem Analysis of Returned Power-Converter Components
As part of the Innovation Cluster, the project partners provided failed converter components fromin total three different wind-turbine types. These have been investigated at Fraunhofer ISIT and IWESwith regard to the damage appearance in order to obtain indications of the failure modes and causes.
After preparatory work including the disassembly, the removal of the silicone gel coveringthe power semiconductors or the production of metallographic micro-sections, the followinglaboratory-analytical methods have been applied:
• visual inspection• optical microscopy• X-ray transmission• scanning acoustic microscopy (SAM)• scanning electron microscopy (SEM)• diagnostic measurements for defect localization• manual pull-testing of bond contacts
The post-mortem analyses of in total 18 converter components carried out at Fraunhofer ISIT andIWES using the aforementioned methods are complemented with findings from the damage analysisof a large number of returned converter components, which were shared with the Fraunhofer IWESnot only by project partners, but also by converter/module manufacturers outside the InnovationCluster consortium.
3. Results
3.1. Results of the Field-Data Analysis
3.1.1. Converter Failure Rates vs. Wind-Turbine Capacity Factors
The field-data compiled and evaluated in the Innovation Cluster covers WTs with differentgenerator-converter concepts, of a multitude of manufacturers and at sites with a variety of windregimes. The latter has not been taken into consideration in our previous presentations and comparisons
Energies 2019, 12, 593 7 of 27
of converter failure rates. This raises the question if certain groups of WTs (such as e.g., the EESG-basedWTs in our dataset) exhibit particularly low converter failure rates mainly due to the fact that theymight rarely be operating at full load. Taking into consideration the different capacity factors of theinvestigated turbines adds therefore an important piece to the picture.
The following analysis seeks to answer the question if there is a systematic difference in converterfailure rates between turbines operating at low capacity factors and such operating at high capacityfactors. For this purpose, all WTs with at least one year of SCADA data for calculating the capacityfactor are grouped by manufacturer and their average capacity factor (clustered in bins of 10%).Average converter-system and phase-module failure rates are calculated for each of these groups.
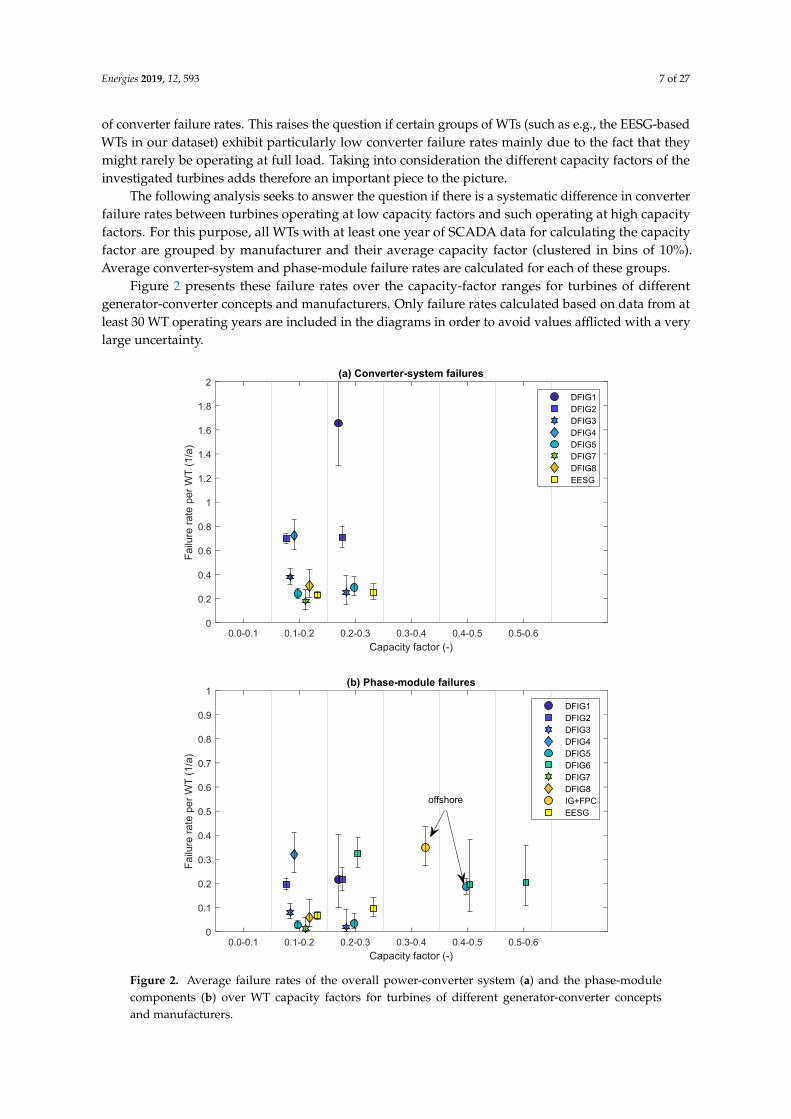
Figure 2 presents these failure rates over the capacity-factor ranges for turbines of differentgenerator-converter concepts and manufacturers. Only failure rates calculated based on data from atleast 30 WT operating years are included in the diagrams in order to avoid values afflicted with a verylarge uncertainty.
Energies 2019, 12, x FOR PEER REVIEW 7 of 27
the EESG‐based WTs in our dataset) exhibit particularly low converter failure rates mainly due to the
fact that they might rarely be operating at full load. Taking into consideration the different capacity
factors of the investigated turbines adds therefore an important piece to the picture.
The following analysis seeks to answer the question if there is a systematic difference in
converter failure rates between turbines operating at low capacity factors and such operating at high
capacity factors. For this purpose, all WTs with at least one year of SCADA data for calculating the
capacity factor are grouped by manufacturer and their average capacity factor (clustered in bins of
10%). Average converter‐system and phase‐module failure rates are calculated for each of these
groups.
Figure 2 presents these failure rates over the capacity‐factor ranges for turbines of different
generator‐converter concepts and manufacturers. Only failure rates calculated based on data from at
least 30 WT operating years are included in the diagrams in order to avoid values afflicted with a
very large uncertainty.
Figure 2. Average failure rates of the overall power‐converter system (a) and the phase‐module
components (b) over WT capacity factors for turbines of different generator‐converter concepts and
manufacturers.
0.0-0.1 0.1-0.2 0.2-0.3 0.3-0.4 0.4-0.5 0.5-0.6
Capacity factor (-)
0
0.2
0.4
0.6
0.8
1
1.2
1.4
1.6
1.8
2
Fai
lure
rat
e pe
r W
T (
1/a)
(a) Converter-system failures
DFIG1DFIG2DFIG3DFIG4DFIG5DFIG7DFIG8EESG
0.0-0.1 0.1-0.2 0.2-0.3 0.3-0.4 0.4-0.5 0.5-0.6
Capacity factor (-)
0
0.1
0.2
0.3
0.4
0.5
0.6
0.7
0.8
0.9
1
Fai
lure
rat
e pe
r W
T (
1/a)
(b) Phase-module failures
offshore
DFIG1DFIG2DFIG3DFIG4DFIG5DFIG6DFIG7DFIG8IG+FPCEESG
Figure 2. Average failure rates of the overall power-converter system (a) and the phase-modulecomponents (b) over WT capacity factors for turbines of different generator-converter conceptsand manufacturers.
Energies 2019, 12, 593 8 of 27
As Figure 2 shows, most WTs represented in the dataset operate at capacity factors between 10%and 30%. From WTs operating at higher capacity factors, only phase-module failure data has beenavailable, so only these are found in Figure 2b. The less data a failure-rate value is based on, the largeris the confidence interval, which is directly related to the higher uncertainty.
Major differences with respect to the average failure rates can be observed among the WT groupsof different manufacturers, with the overall converter failure rates ranging up to 1.66 a−1 per WT andthe maximum phase-module failure rates reaching 0.35 a−1 per WT. The most relevant finding withrespect to the guiding question raised above is that only in single cases (the group of EESG-based WTsand the group of DFIG-based WTs denoted DFIG5), the failure rate increases with the capacity factor.In other cases (namely the WT groups DFIG3 and DFIG6), the WTs operating at higher capacity factorsexperienced the lower phase-module failure rates.
In an overall view, for the majority of investigated WTs, the failure rates of both the phase modulesand the complete converter system show no relevant correlation with the capacity factor and thus withthe average electrical load of the WTs. Instead, the results underline that the manufacturer (and withthat the WT and converter design) has a much stronger impact on the converter reliability than thegenerator-converter concept (DFIG, IG + FPC, EESG) or the capacity factor of a WT.
3.1.2. Seasonal Variation of Phase-module Failure Rates
As presented in [35], we observed a pronounced seasonal pattern in the phase-module failuresin fleets in India and Scandinavia, with maximum failure rates occurring during periods with highabsolute ambient humidity. This has been a strong indication that moisture and/or condensation playan important role in the incidence of converter failures. At the same time, it was surprising to find thatat first sight no such pattern could be identified for the WT fleet in Germany. In view of the fact thatthe evaluated turbine fleets have liquid-cooled converters while air-cooled converters prevail in theGerman fleet, this observation raises the question if the cooling concept of the converter influences thesystem’s susceptibility to humidity.
In the following, the analysis of the seasonal variation of phase-module failure rates is substantiallyextended and deepened: While the results presented in [35] have been limited to the monthlyphase-module failure rates in India and Scandinavia, the following analysis includes the WT fleet inGermany. Furthermore, the analysis is deepened by differentiating between turbines with liquid-cooledvs. air-cooled converter systems and by taking into consideration the operating point of the WTspreceding the failures where this information is available.
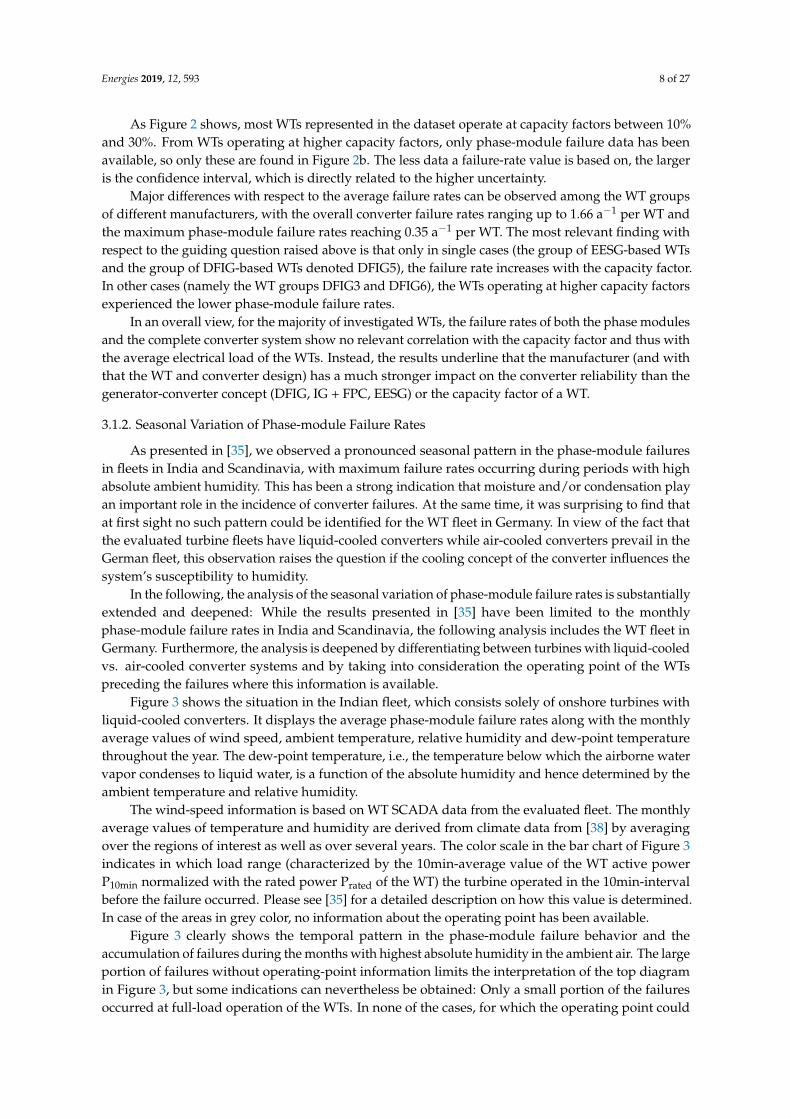
Figure 3 shows the situation in the Indian fleet, which consists solely of onshore turbines withliquid-cooled converters. It displays the average phase-module failure rates along with the monthlyaverage values of wind speed, ambient temperature, relative humidity and dew-point temperaturethroughout the year. The dew-point temperature, i.e., the temperature below which the airborne watervapor condenses to liquid water, is a function of the absolute humidity and hence determined by theambient temperature and relative humidity.
The wind-speed information is based on WT SCADA data from the evaluated fleet. The monthlyaverage values of temperature and humidity are derived from climate data from [38] by averagingover the regions of interest as well as over several years. The color scale in the bar chart of Figure 3indicates in which load range (characterized by the 10min-average value of the WT active powerP10min normalized with the rated power Prated of the WT) the turbine operated in the 10min-intervalbefore the failure occurred. Please see [35] for a detailed description on how this value is determined.In case of the areas in grey color, no information about the operating point has been available.
Figure 3 clearly shows the temporal pattern in the phase-module failure behavior and theaccumulation of failures during the months with highest absolute humidity in the ambient air. The largeportion of failures without operating-point information limits the interpretation of the top diagramin Figure 3, but some indications can nevertheless be obtained: Only a small portion of the failuresoccurred at full-load operation of the WTs. In none of the cases, for which the operating point could
Energies 2019, 12, 593 9 of 27
be determined, the failure initiated in an “overload” situation with P10min > Prated. Instead, mostfailures occurred in low part-load operation. In this operating regime, the losses in the converter arelow and with these also their heating effect, which promotes high relative humidity and the risk ofcondensation inside the converter cabinet. It is interesting to note that the occurrence of converterfailures is not limited to periods in which the turbines feed active power to the grid, but that theseoccur also in zero-load situations (with P10min ≤ 0 kW), e.g., during idling or start of the turbines.Energies 2019, 12, x FOR PEER REVIEW 9 of 27
Figure 3. Seasonal variation of phase‐module failure rates in WTs with liquid‐cooled converters in
India (based on data from 590 WT operating years) with corresponding monthly average wind‐speed
and climate data, including information of the operating point preceding the failures.
Figure 3 clearly shows the temporal pattern in the phase‐module failure behavior and the
accumulation of failures during the months with highest absolute humidity in the ambient air. The
large portion of failures without operating‐point information limits the interpretation of the top
diagram in Figure 3, but some indications can nevertheless be obtained: Only a small portion of the
failures occurred at full‐load operation of the WTs. In none of the cases, for which the operating point
could be determined, the failure initiated in an “overload” situation with P10min > Prated. Instead, most
failures occurred in low part‐load operation. In this operating regime, the losses in the converter are
low and with these also their heating effect, which promotes high relative humidity and the risk of
condensation inside the converter cabinet. It is interesting to note that the occurrence of converter
failures is not limited to periods in which the turbines feed active power to the grid, but that these
occur also in zero‐load situations (with P10min ≤ 0 kW), e.g., during idling or start of the turbines.
In analogy with the previous diagrams, Figure 4 presents the situation observed in the WT fleet
in Scandinavia. It consists of WTs located in both onshore and offshore sites. As in the previous case,
all considered WTs have liquid‐cooled converters. Note that the wind‐speed values are based solely
on the SCADA data of the offshore WTs. As in the present analysis the focus is on the seasonal
variation of the wind speed through the course of the year and not on the exact absolute values of the
wind speed, this is considered an acceptable approximation. The monthly average values of
temperature and humidity are calculated from climate data by [39,40] (data from [27]).
Figure 3. Seasonal variation of phase-module failure rates in WTs with liquid-cooled converters inIndia (based on data from 590 WT operating years) with corresponding monthly average wind-speedand climate data, including information of the operating point preceding the failures.
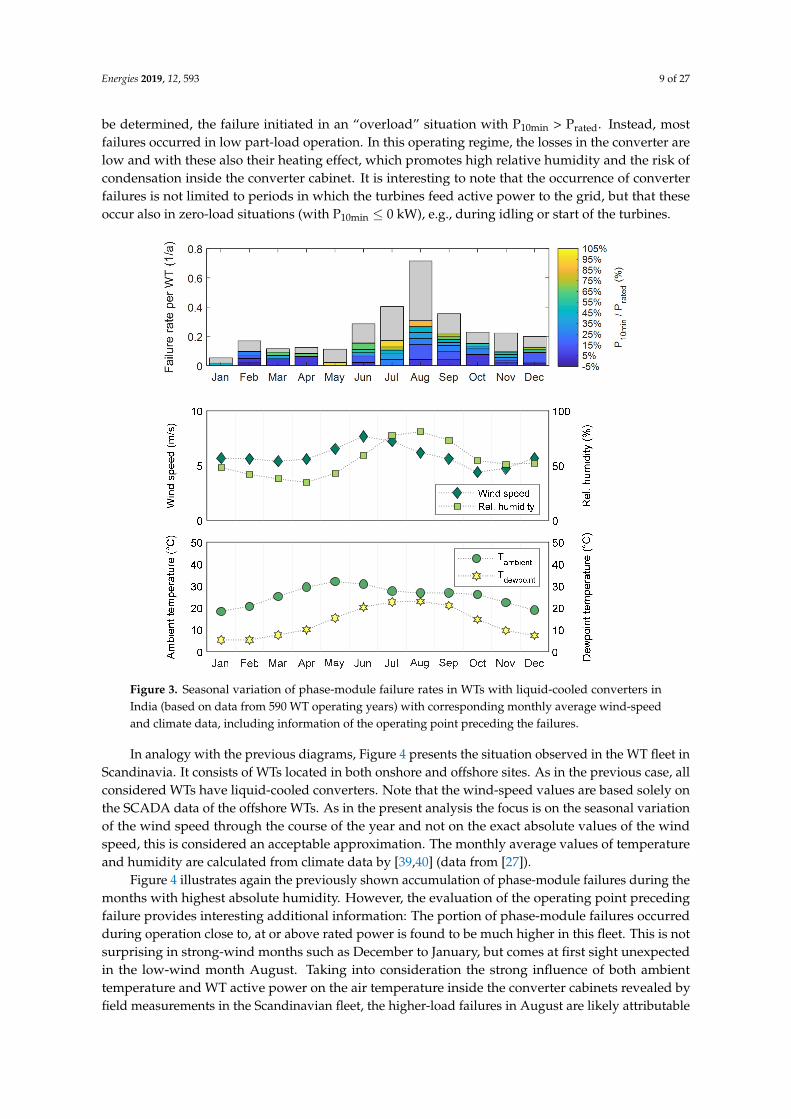
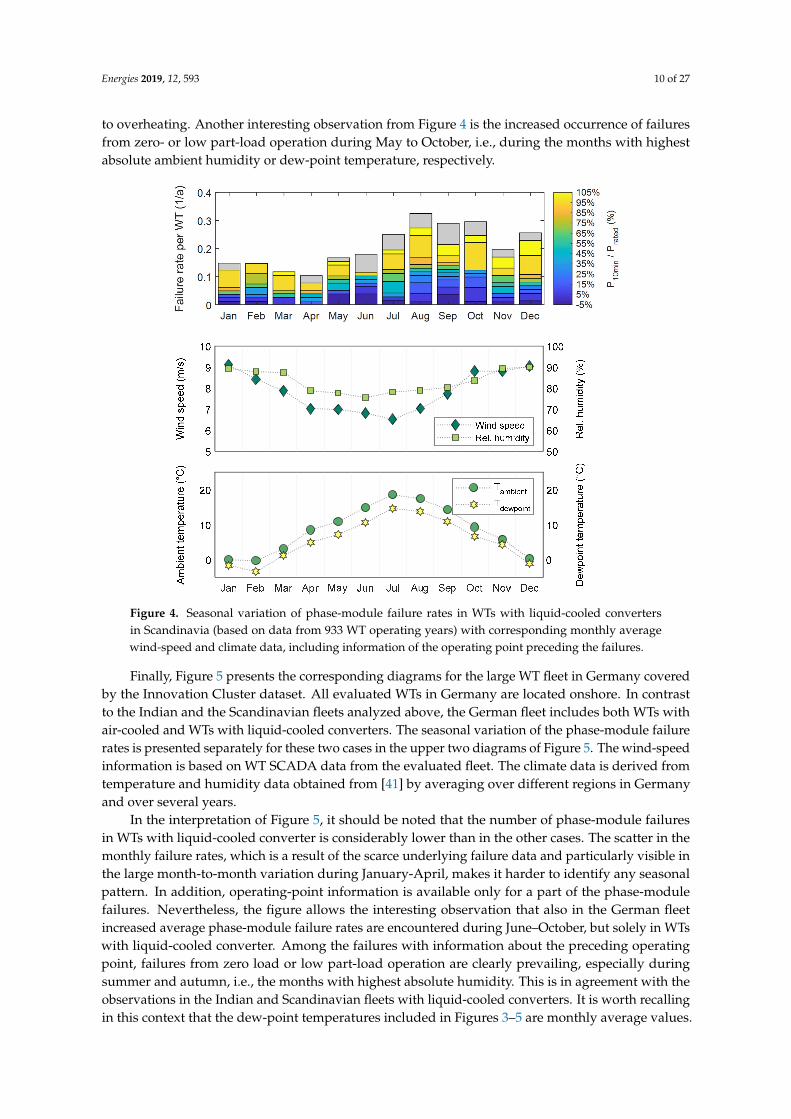
In analogy with the previous diagrams, Figure 4 presents the situation observed in the WT fleet inScandinavia. It consists of WTs located in both onshore and offshore sites. As in the previous case, allconsidered WTs have liquid-cooled converters. Note that the wind-speed values are based solely onthe SCADA data of the offshore WTs. As in the present analysis the focus is on the seasonal variationof the wind speed through the course of the year and not on the exact absolute values of the windspeed, this is considered an acceptable approximation. The monthly average values of temperatureand humidity are calculated from climate data by [39,40] (data from [27]).
Figure 4 illustrates again the previously shown accumulation of phase-module failures during themonths with highest absolute humidity. However, the evaluation of the operating point precedingfailure provides interesting additional information: The portion of phase-module failures occurredduring operation close to, at or above rated power is found to be much higher in this fleet. This is notsurprising in strong-wind months such as December to January, but comes at first sight unexpectedin the low-wind month August. Taking into consideration the strong influence of both ambienttemperature and WT active power on the air temperature inside the converter cabinets revealed byfield measurements in the Scandinavian fleet, the higher-load failures in August are likely attributable
Energies 2019, 12, 593 10 of 27
to overheating. Another interesting observation from Figure 4 is the increased occurrence of failuresfrom zero- or low part-load operation during May to October, i.e., during the months with highestabsolute ambient humidity or dew-point temperature, respectively.Energies 2019, 12, x FOR PEER REVIEW 10 of 27
Figure 4. Seasonal variation of phase‐module failure rates in WTs with liquid‐cooled converters in
Scandinavia (based on data from 933 WT operating years) with corresponding monthly average wind‐
speed and climate data, including information of the operating point preceding the failures.
Figure 4 illustrates again the previously shown accumulation of phase‐module failures during
the months with highest absolute humidity. However, the evaluation of the operating point
preceding failure provides interesting additional information: The portion of phase‐module failures
occurred during operation close to, at or above rated power is found to be much higher in this fleet.
This is not surprising in strong‐wind months such as December to January, but comes at first sight
unexpected in the low‐wind month August. Taking into consideration the strong influence of both
ambient temperature and WT active power on the air temperature inside the converter cabinets
revealed by field measurements in the Scandinavian fleet, the higher‐load failures in August are
likely attributable to overheating. Another interesting observation from Figure 4 is the increased
occurrence of failures from zero‐ or low part‐load operation during May to October, i.e. during the
months with highest absolute ambient humidity or dew‐point temperature, respectively.
Finally, Figure 5 presents the corresponding diagrams for the large WT fleet in Germany covered
by the Innovation Cluster dataset. All evaluated WTs in Germany are located onshore. In contrast to
the Indian and the Scandinavian fleets analyzed above, the German fleet includes both WTs with air‐
cooled and WTs with liquid‐cooled converters. The seasonal variation of the phase‐module failure
rates is presented separately for these two cases in the upper two diagrams of Figure 5. The wind‐
speed information is based on WT SCADA data from the evaluated fleet. The climate data is derived
from temperature and humidity data obtained from [41] by averaging over different regions in
Germany and over several years.
Figure 4. Seasonal variation of phase-module failure rates in WTs with liquid-cooled convertersin Scandinavia (based on data from 933 WT operating years) with corresponding monthly averagewind-speed and climate data, including information of the operating point preceding the failures.
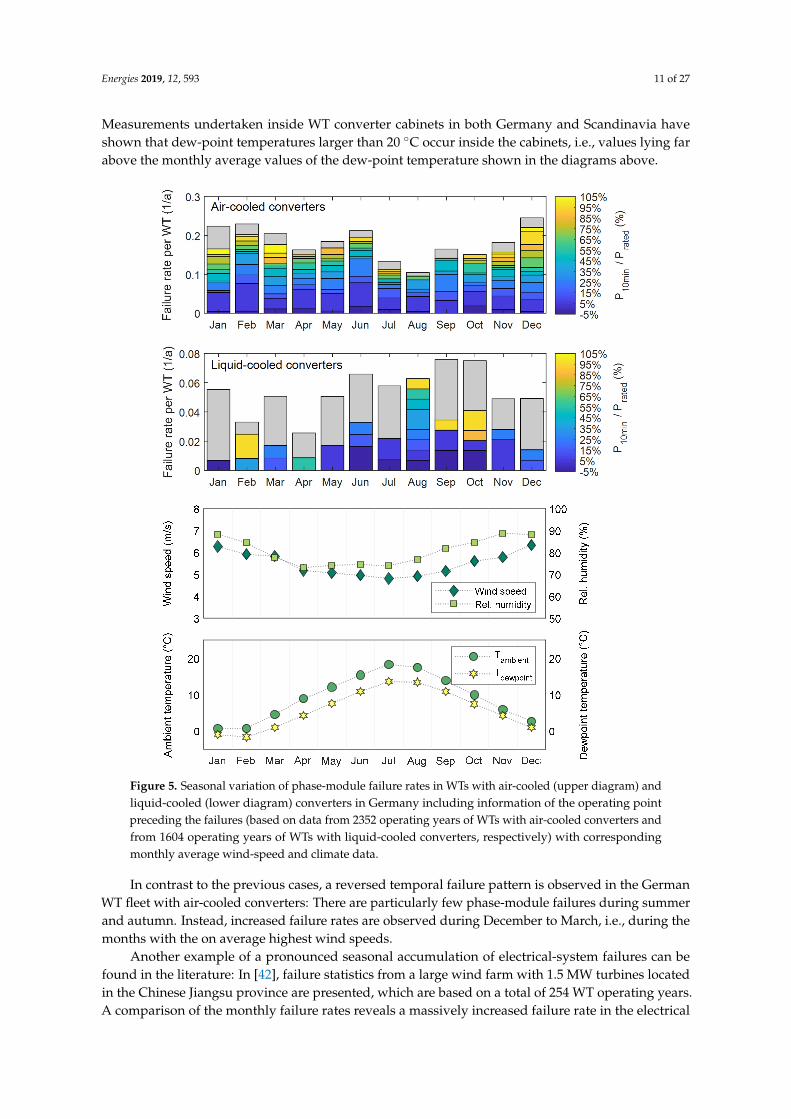
Finally, Figure 5 presents the corresponding diagrams for the large WT fleet in Germany coveredby the Innovation Cluster dataset. All evaluated WTs in Germany are located onshore. In contrastto the Indian and the Scandinavian fleets analyzed above, the German fleet includes both WTs withair-cooled and WTs with liquid-cooled converters. The seasonal variation of the phase-module failurerates is presented separately for these two cases in the upper two diagrams of Figure 5. The wind-speedinformation is based on WT SCADA data from the evaluated fleet. The climate data is derived fromtemperature and humidity data obtained from [41] by averaging over different regions in Germanyand over several years.
In the interpretation of Figure 5, it should be noted that the number of phase-module failuresin WTs with liquid-cooled converter is considerably lower than in the other cases. The scatter in themonthly failure rates, which is a result of the scarce underlying failure data and particularly visible inthe large month-to-month variation during January-April, makes it harder to identify any seasonalpattern. In addition, operating-point information is available only for a part of the phase-modulefailures. Nevertheless, the figure allows the interesting observation that also in the German fleetincreased average phase-module failure rates are encountered during June–October, but solely in WTswith liquid-cooled converter. Among the failures with information about the preceding operatingpoint, failures from zero load or low part-load operation are clearly prevailing, especially duringsummer and autumn, i.e., the months with highest absolute humidity. This is in agreement with theobservations in the Indian and Scandinavian fleets with liquid-cooled converters. It is worth recallingin this context that the dew-point temperatures included in Figures 3–5 are monthly average values.
Energies 2019, 12, 593 11 of 27
Measurements undertaken inside WT converter cabinets in both Germany and Scandinavia haveshown that dew-point temperatures larger than 20 ◦C occur inside the cabinets, i.e., values lying farabove the monthly average values of the dew-point temperature shown in the diagrams above.Energies 2019, 12, x FOR PEER REVIEW 11 of 27
Figure 5. Seasonal variation of phase‐module failure rates in WTs with air‐cooled (upper diagram)
and liquid‐cooled (lower diagram) converters in Germany including information of the operating
point preceding the failures (based on data from 2352 operating years of WTs with air‐cooled
converters and from 1604 operating years of WTs with liquid‐cooled converters, respectively) with
corresponding monthly average wind‐speed and climate data.
In the interpretation of Figure 5, it should be noted that the number of phase‐module failures in
WTs with liquid‐cooled converter is considerably lower than in the other cases. The scatter in the
monthly failure rates, which is a result of the scarce underlying failure data and particularly visible
in the large month‐to‐month variation during January‐April, makes it harder to identify any seasonal
pattern. In addition, operating‐point information is available only for a part of the phase‐module
failures. Nevertheless, the figure allows the interesting observation that also in the German fleet
increased average phase‐module failure rates are encountered during June–October, but solely in
WTs with liquid‐cooled converter. Among the failures with information about the preceding
operating point, failures from zero load or low part‐load operation are clearly prevailing, especially
during summer and autumn, i.e. the months with highest absolute humidity. This is in agreement
with the observations in the Indian and Scandinavian fleets with liquid‐cooled converters. It is worth
recalling in this context that the dew‐point temperatures included in Figure 3 to Figure 5 are monthly
Figure 5. Seasonal variation of phase-module failure rates in WTs with air-cooled (upper diagram) andliquid-cooled (lower diagram) converters in Germany including information of the operating pointpreceding the failures (based on data from 2352 operating years of WTs with air-cooled converters andfrom 1604 operating years of WTs with liquid-cooled converters, respectively) with correspondingmonthly average wind-speed and climate data.
In contrast to the previous cases, a reversed temporal failure pattern is observed in the GermanWT fleet with air-cooled converters: There are particularly few phase-module failures during summerand autumn. Instead, increased failure rates are observed during December to March, i.e., during themonths with the on average highest wind speeds.
Another example of a pronounced seasonal accumulation of electrical-system failures can befound in the literature: In [42], failure statistics from a large wind farm with 1.5 MW turbines locatedin the Chinese Jiangsu province are presented, which are based on a total of 254 WT operating years.A comparison of the monthly failure rates reveals a massively increased failure rate in the electrical
Energies 2019, 12, 593 12 of 27
system during the months July and August. While this is related to high ambient temperatures in thepaper, it can as likely be attributed to the by far highest absolute humidity (as visible in dew-pointtemperature data from this region obtainable e.g., from [38]) being present during these months.
The results presented in this section give further support to the hypothesis that high humidity(i.e., moisture and condensation) has a negative effect on phase-module reliability. Furthermore,in combination with the results presented in [42], they make clear that this effect is encountered inthe most different parts and climate zones of the world. An important new finding has evolvedfrom the separate analysis of WTs with liquid-cooled and air-cooled converters located in Germany.The different failure patterns observed in these two fleets suggest that the high susceptibility tohumidity is an issue mainly related to WTs with liquid-cooled converters.
3.2. Results of the Post-Mortem Analysis of Defect Components
The project partners of the Innovation Cluster provided failed converter components from windturbines of three different manufacturers. These have been examined with respect to the damage aswell as indications of failure mechanisms and possible causes. In the following sections, the results arepresented separately for each of the three WT types.
3.2.1. Analysis of IGBT Modules from a DFIG-based Turbine Type
The most comprehensive post-mortem analysis was performed on liquid-cooled IGBT modules(including driver boards) from a DFIG-based turbine type located in an offshore wind park. Modulesof this type are very widely used in wind turbines. Ten of these modules were subjected to a detaileddamage analysis at Fraunhofer ISIT. Among the ten investigated modules were five modules from thegenerator side and five modules from the grid side of the converter, all without externally visible signsof destruction. The modules were manufactured in the years 2006–2010 and failed during 2014–2015so that it can be taken for granted that all of them experienced several years of operation in the field.
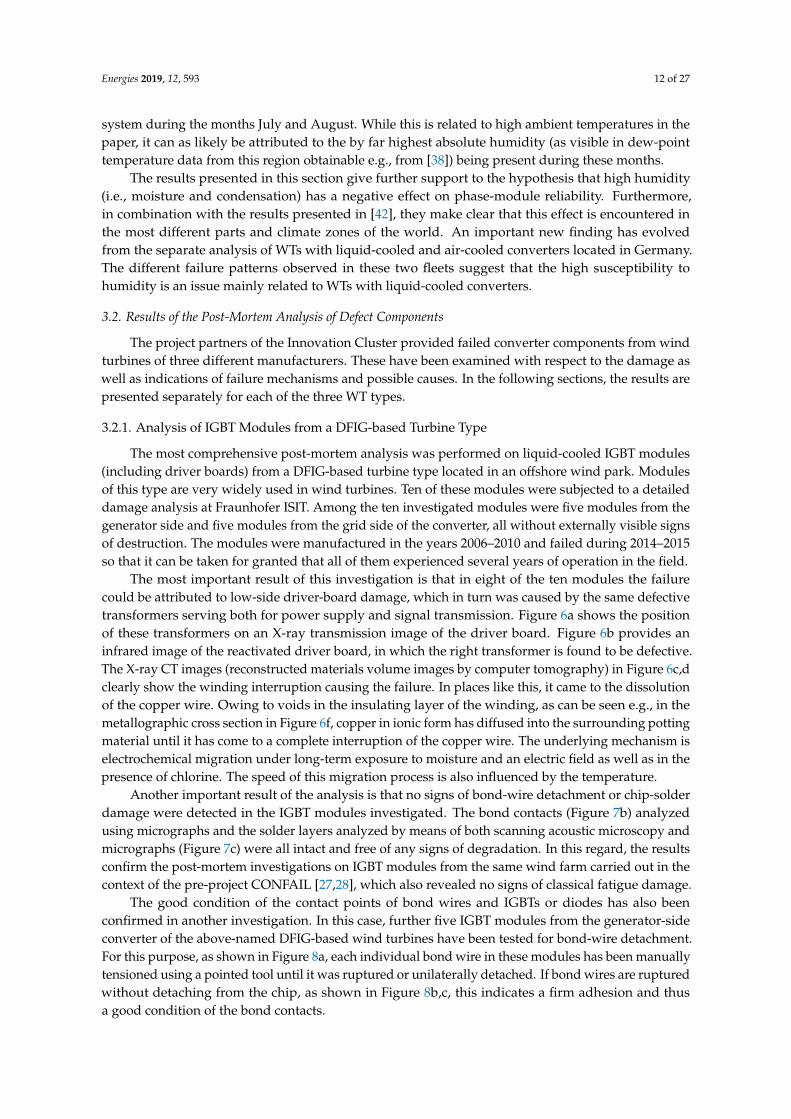
The most important result of this investigation is that in eight of the ten modules the failurecould be attributed to low-side driver-board damage, which in turn was caused by the same defectivetransformers serving both for power supply and signal transmission. Figure 6a shows the positionof these transformers on an X-ray transmission image of the driver board. Figure 6b provides aninfrared image of the reactivated driver board, in which the right transformer is found to be defective.The X-ray CT images (reconstructed materials volume images by computer tomography) in Figure 6c,dclearly show the winding interruption causing the failure. In places like this, it came to the dissolutionof the copper wire. Owing to voids in the insulating layer of the winding, as can be seen e.g., in themetallographic cross section in Figure 6f, copper in ionic form has diffused into the surrounding pottingmaterial until it has come to a complete interruption of the copper wire. The underlying mechanism iselectrochemical migration under long-term exposure to moisture and an electric field as well as in thepresence of chlorine. The speed of this migration process is also influenced by the temperature.
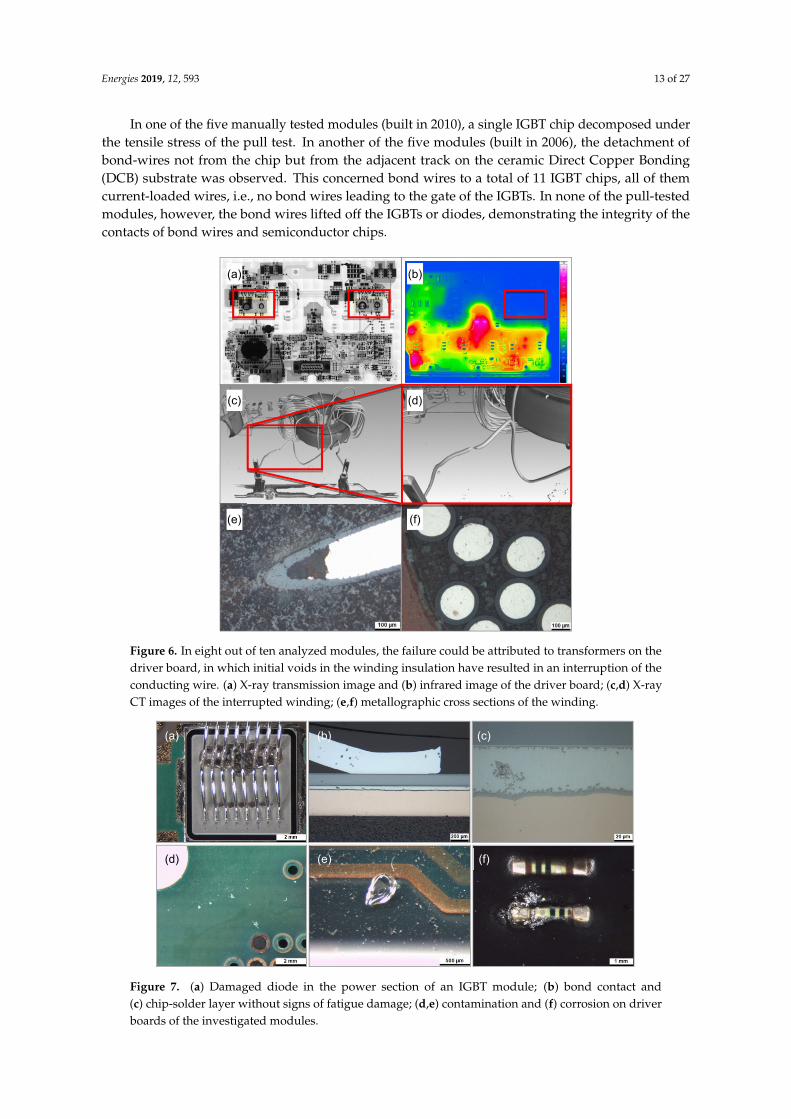
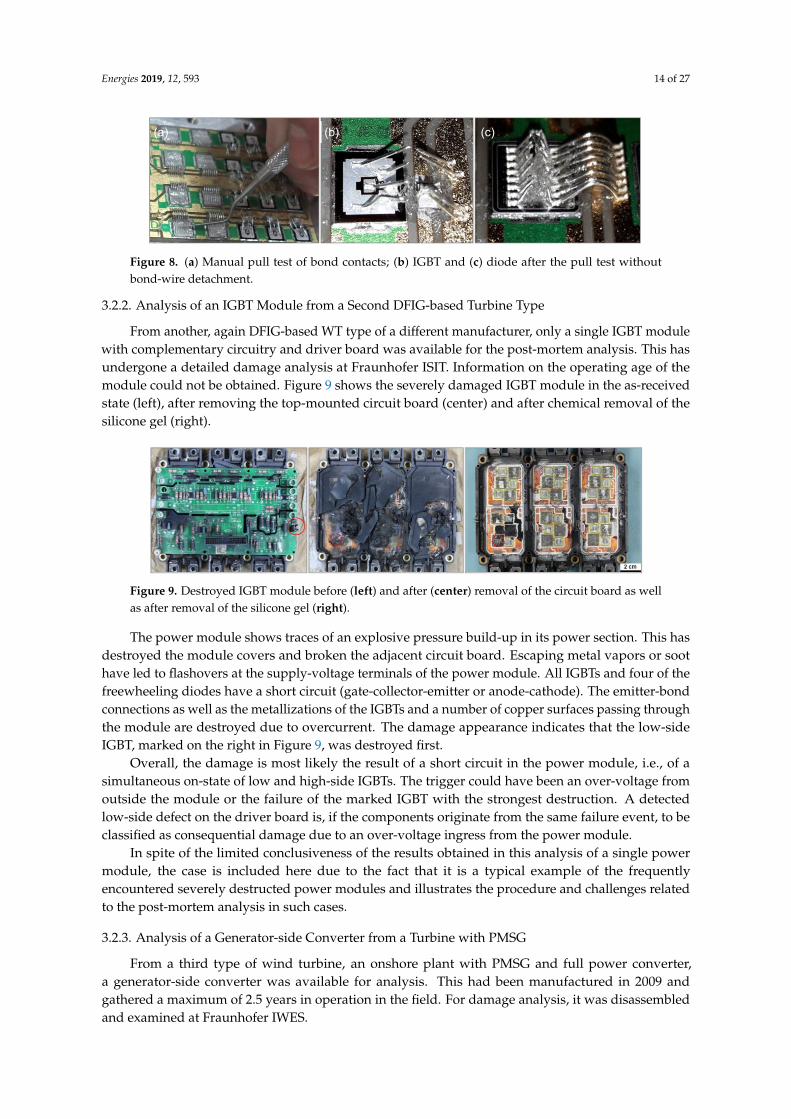
Another important result of the analysis is that no signs of bond-wire detachment or chip-solderdamage were detected in the IGBT modules investigated. The bond contacts (Figure 7b) analyzedusing micrographs and the solder layers analyzed by means of both scanning acoustic microscopy andmicrographs (Figure 7c) were all intact and free of any signs of degradation. In this regard, the resultsconfirm the post-mortem investigations on IGBT modules from the same wind farm carried out in thecontext of the pre-project CONFAIL [27,28], which also revealed no signs of classical fatigue damage.
The good condition of the contact points of bond wires and IGBTs or diodes has also beenconfirmed in another investigation. In this case, further five IGBT modules from the generator-sideconverter of the above-named DFIG-based wind turbines have been tested for bond-wire detachment.For this purpose, as shown in Figure 8a, each individual bond wire in these modules has been manuallytensioned using a pointed tool until it was ruptured or unilaterally detached. If bond wires are rupturedwithout detaching from the chip, as shown in Figure 8b,c, this indicates a firm adhesion and thusa good condition of the bond contacts.
Energies 2019, 12, 593 13 of 27
In one of the five manually tested modules (built in 2010), a single IGBT chip decomposed underthe tensile stress of the pull test. In another of the five modules (built in 2006), the detachment ofbond-wires not from the chip but from the adjacent track on the ceramic Direct Copper Bonding(DCB) substrate was observed. This concerned bond wires to a total of 11 IGBT chips, all of themcurrent-loaded wires, i.e., no bond wires leading to the gate of the IGBTs. In none of the pull-testedmodules, however, the bond wires lifted off the IGBTs or diodes, demonstrating the integrity of thecontacts of bond wires and semiconductor chips.Energies 2019, 12, x FOR PEER REVIEW 13 of 27
Figure 6. In eight out of ten analyzed modules, the failure could be attributed to transformers on the
driver board, in which initial voids in the winding insulation have resulted in an interruption of the
conducting wire. (a) X‐ray transmission image and (b) infrared image of the driver board; (c,d) X‐ray
CT images of the interrupted winding; (e,f) metallographic cross sections of the winding.
Another important result of the analysis is that no signs of bond‐wire detachment or chip‐solder
damage were detected in the IGBT modules investigated. The bond contacts (Figure 7b) analyzed
using micrographs and the solder layers analyzed by means of both scanning acoustic microscopy
and micrographs (Figure 7c) were all intact and free of any signs of degradation. In this regard, the
results confirm the post‐mortem investigations on IGBT modules from the same wind farm carried
out in the context of the pre‐project CONFAIL [27,28], which also revealed no signs of classical fatigue
damage.
The good condition of the contact points of bond wires and IGBTs or diodes has also been
confirmed in another investigation. In this case, further five IGBT modules from the generator‐side
converter of the above‐named DFIG‐based wind turbines have been tested for bond‐wire
detachment. For this purpose, as shown in Figure 8a, each individual bond wire in these modules has
been manually tensioned using a pointed tool until it was ruptured or unilaterally detached. If bond
wires are ruptured without detaching from the chip, as shown in Figure 8b,c, this indicates a firm
adhesion and thus a good condition of the bond contacts.
In one of the five manually tested modules (built in 2010), a single IGBT chip decomposed under
the tensile stress of the pull test. In another of the five modules (built in 2006), the detachment of
bond‐wires not from the chip but from the adjacent track on the ceramic Direct Copper Bonding
(DCB) substrate was observed. This concerned bond wires to a total of 11 IGBT chips, all of them
current‐loaded wires, i.e. no bond wires leading to the gate of the IGBTs. In none of the pull‐tested
modules, however, the bond wires lifted off the IGBTs or diodes, demonstrating the integrity of the
contacts of bond wires and semiconductor chips.
(b)
(c) (d)
(a)
(e) (f)
Figure 6. In eight out of ten analyzed modules, the failure could be attributed to transformers on thedriver board, in which initial voids in the winding insulation have resulted in an interruption of theconducting wire. (a) X-ray transmission image and (b) infrared image of the driver board; (c,d) X-rayCT images of the interrupted winding; (e,f) metallographic cross sections of the winding.
Energies 2019, 12, x FOR PEER REVIEW 14 of 27
Figure 7. (a) Damaged diode in the power section of an IGBT module; (b) bond contact and (c) chip‐
solder layer without signs of fatigue damage; (d,e) contamination and (f) corrosion on driver boards
of the investigated modules.
Figure 8. (a) Manual pull test of bond contacts; (b) IGBT and (c) diode after the pull test without bond‐
wire detachment.
3.2.2. Analysis of an IGBT Module from a Second DFIG‐based Turbine Type
From another, again DFIG‐based WT type of a different manufacturer, only a single IGBT
module with complementary circuitry and driver board was available for the post‐mortem analysis.
This has undergone a detailed damage analysis at Fraunhofer ISIT. Information on the operating age
of the module could not be obtained. Figure 9 shows the severely damaged IGBT module in the as‐
received state (left), after removing the top‐mounted circuit board (center) and after chemical removal
of the silicone gel (right).
Figure 9. Destroyed IGBT module before (left) and after (center) removal of the circuit board as well
as after removal of the silicone gel (right).
(a) (b) (c)
(d) (e) (f)
(a) (b) (c)
Figure 7. (a) Damaged diode in the power section of an IGBT module; (b) bond contact and(c) chip-solder layer without signs of fatigue damage; (d,e) contamination and (f) corrosion on driverboards of the investigated modules.
Energies 2019, 12, 593 14 of 27
Energies 2019, 12, x FOR PEER REVIEW 14 of 27
Figure 7. (a) Damaged diode in the power section of an IGBT module; (b) bond contact and (c) chip‐
solder layer without signs of fatigue damage; (d,e) contamination and (f) corrosion on driver boards
of the investigated modules.
Figure 8. (a) Manual pull test of bond contacts; (b) IGBT and (c) diode after the pull test without bond‐
wire detachment.
3.2.2. Analysis of an IGBT Module from a Second DFIG‐based Turbine Type
From another, again DFIG‐based WT type of a different manufacturer, only a single IGBT
module with complementary circuitry and driver board was available for the post‐mortem analysis.
This has undergone a detailed damage analysis at Fraunhofer ISIT. Information on the operating age
of the module could not be obtained. Figure 9 shows the severely damaged IGBT module in the as‐
received state (left), after removing the top‐mounted circuit board (center) and after chemical removal
of the silicone gel (right).
Figure 9. Destroyed IGBT module before (left) and after (center) removal of the circuit board as well
as after removal of the silicone gel (right).
(a) (b) (c)
(d) (e) (f)
(a) (b) (c)
Figure 8. (a) Manual pull test of bond contacts; (b) IGBT and (c) diode after the pull test withoutbond-wire detachment.
3.2.2. Analysis of an IGBT Module from a Second DFIG-based Turbine Type
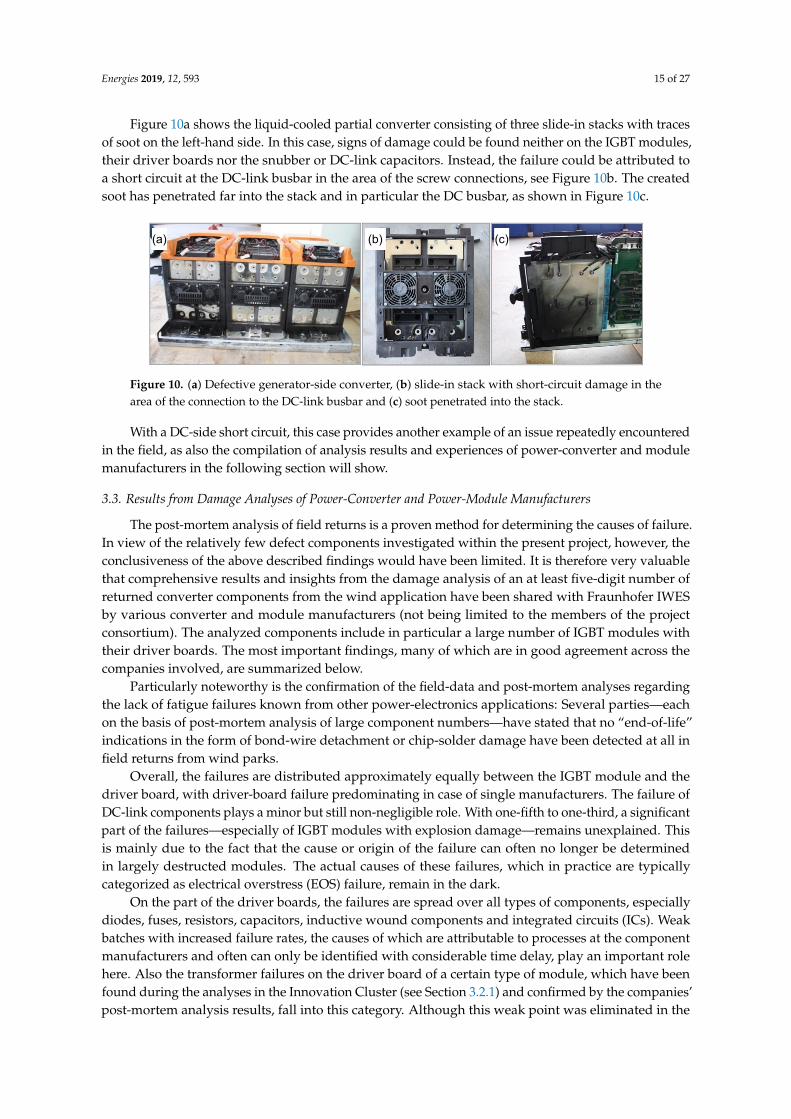
From another, again DFIG-based WT type of a different manufacturer, only a single IGBT modulewith complementary circuitry and driver board was available for the post-mortem analysis. This hasundergone a detailed damage analysis at Fraunhofer ISIT. Information on the operating age of themodule could not be obtained. Figure 9 shows the severely damaged IGBT module in the as-receivedstate (left), after removing the top-mounted circuit board (center) and after chemical removal of thesilicone gel (right).
Energies 2019, 12, x FOR PEER REVIEW 14 of 27
Figure 7. (a) Damaged diode in the power section of an IGBT module; (b) bond contact and (c) chip‐
solder layer without signs of fatigue damage; (d,e) contamination and (f) corrosion on driver boards
of the investigated modules.
Figure 8. (a) Manual pull test of bond contacts; (b) IGBT and (c) diode after the pull test without bond‐
wire detachment.
3.2.2. Analysis of an IGBT Module from a Second DFIG‐based Turbine Type
From another, again DFIG‐based WT type of a different manufacturer, only a single IGBT
module with complementary circuitry and driver board was available for the post‐mortem analysis.
This has undergone a detailed damage analysis at Fraunhofer ISIT. Information on the operating age
of the module could not be obtained. Figure 9 shows the severely damaged IGBT module in the as‐
received state (left), after removing the top‐mounted circuit board (center) and after chemical removal
of the silicone gel (right).
Figure 9. Destroyed IGBT module before (left) and after (center) removal of the circuit board as well
as after removal of the silicone gel (right).
(a) (b) (c)
(d) (e) (f)
(a) (b) (c)
Figure 9. Destroyed IGBT module before (left) and after (center) removal of the circuit board as wellas after removal of the silicone gel (right).
The power module shows traces of an explosive pressure build-up in its power section. This hasdestroyed the module covers and broken the adjacent circuit board. Escaping metal vapors or soothave led to flashovers at the supply-voltage terminals of the power module. All IGBTs and four of thefreewheeling diodes have a short circuit (gate-collector-emitter or anode-cathode). The emitter-bondconnections as well as the metallizations of the IGBTs and a number of copper surfaces passing throughthe module are destroyed due to overcurrent. The damage appearance indicates that the low-sideIGBT, marked on the right in Figure 9, was destroyed first.
Overall, the damage is most likely the result of a short circuit in the power module, i.e., of asimultaneous on-state of low and high-side IGBTs. The trigger could have been an over-voltage fromoutside the module or the failure of the marked IGBT with the strongest destruction. A detectedlow-side defect on the driver board is, if the components originate from the same failure event, to beclassified as consequential damage due to an over-voltage ingress from the power module.
In spite of the limited conclusiveness of the results obtained in this analysis of a single powermodule, the case is included here due to the fact that it is a typical example of the frequentlyencountered severely destructed power modules and illustrates the procedure and challenges relatedto the post-mortem analysis in such cases.
3.2.3. Analysis of a Generator-side Converter from a Turbine with PMSG
From a third type of wind turbine, an onshore plant with PMSG and full power converter,a generator-side converter was available for analysis. This had been manufactured in 2009 andgathered a maximum of 2.5 years in operation in the field. For damage analysis, it was disassembledand examined at Fraunhofer IWES.
Energies 2019, 12, 593 15 of 27
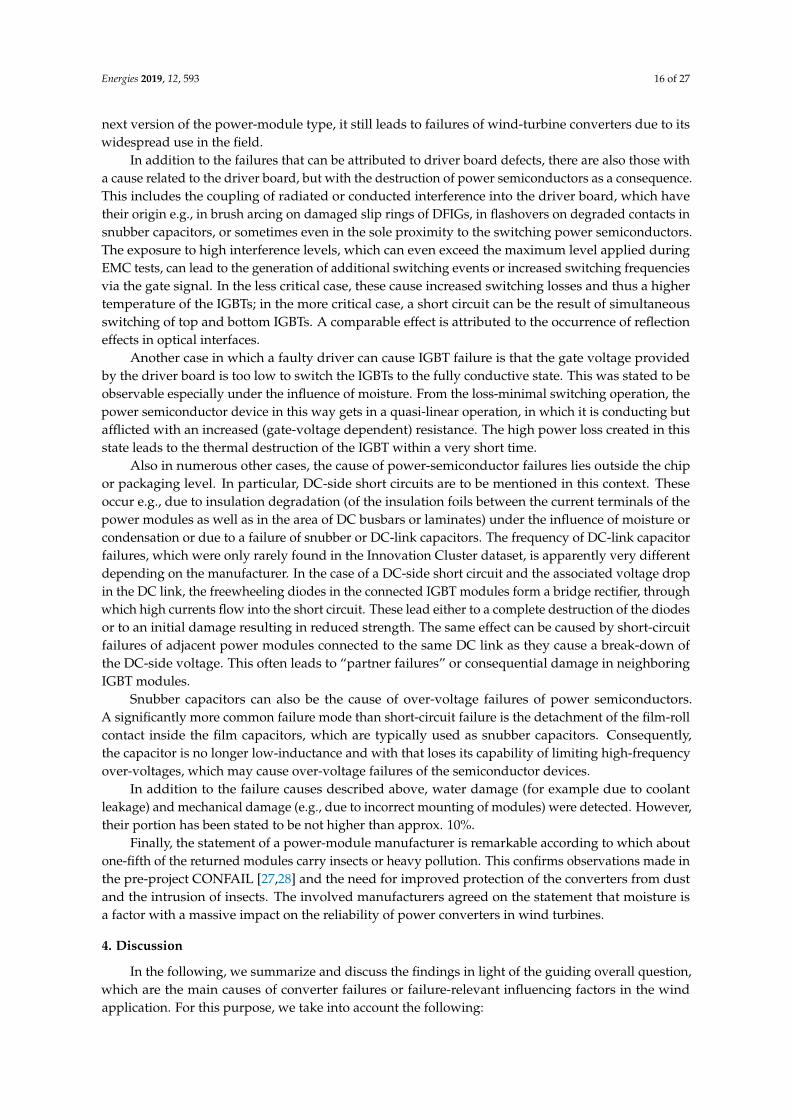
Figure 10a shows the liquid-cooled partial converter consisting of three slide-in stacks with tracesof soot on the left-hand side. In this case, signs of damage could be found neither on the IGBT modules,their driver boards nor the snubber or DC-link capacitors. Instead, the failure could be attributed toa short circuit at the DC-link busbar in the area of the screw connections, see Figure 10b. The createdsoot has penetrated far into the stack and in particular the DC busbar, as shown in Figure 10c.
Energies 2019, 12, x FOR PEER REVIEW 15 of 27
The power module shows traces of an explosive pressure build‐up in its power section. This has
destroyed the module covers and broken the adjacent circuit board. Escaping metal vapors or soot
have led to flashovers at the supply‐voltage terminals of the power module. All IGBTs and four of
the freewheeling diodes have a short circuit (gate‐collector‐emitter or anode‐cathode). The emitter‐
bond connections as well as the metallizations of the IGBTs and a number of copper surfaces passing
through the module are destroyed due to overcurrent. The damage appearance indicates that the
low‐side IGBT, marked on the right in Figure 9, was destroyed first.
Overall, the damage is most likely the result of a short circuit in the power module, i.e. of a
simultaneous on‐state of low and high‐side IGBTs. The trigger could have been an over‐voltage from
outside the module or the failure of the marked IGBT with the strongest destruction. A detected low‐
side defect on the driver board is, if the components originate from the same failure event, to be
classified as consequential damage due to an over‐voltage ingress from the power module.
In spite of the limited conclusiveness of the results obtained in this analysis of a single power
module, the case is included here due to the fact that it is a typical example of the frequently
encountered severely destructed power modules and illustrates the procedure and challenges related
to the post‐mortem analysis in such cases.
3.2.3. Analysis of a Generator‐side Converter from a Turbine with PMSG
From a third type of wind turbine, an onshore plant with PMSG and full power converter, a
generator‐side converter was available for analysis. This had been manufactured in 2009 and
gathered a maximum of 2.5 years in operation in the field. For damage analysis, it was disassembled
and examined at Fraunhofer IWES.
Figure 10a shows the liquid‐cooled partial converter consisting of three slide‐in stacks with
traces of soot on the left‐hand side. In this case, signs of damage could be found neither on the IGBT
modules, their driver boards nor the snubber or DC‐link capacitors. Instead, the failure could be
attributed to a short circuit at the DC‐link busbar in the area of the screw connections, see Figure 10b.
The created soot has penetrated far into the stack and in particular the DC busbar, as shown in Figure
10c.
With a DC‐side short circuit, this case provides another example of an issue repeatedly
encountered in the field, as also the compilation of analysis results and experiences of power‐
converter and module manufacturers in the following section will show.
Figure 10. (a) Defective generator‐side converter, (b) slide‐in stack with short‐circuit damage in the
area of the connection to the DC‐link busbar and (c) soot penetrated into the stack.
3.3. Results from Damage Analyses of Power‐converter and Power‐module Manufacturers
The post‐mortem analysis of field returns is a proven method for determining the causes of
failure. In view of the relatively few defect components investigated within the present project,
however, the conclusiveness of the above described findings would have been limited. It is therefore
very valuable that comprehensive results and insights from the damage analysis of an at least five‐
digit number of returned converter components from the wind application have been shared with
Fraunhofer IWES by various converter and module manufacturers (not being limited to the members
(a) (b) (c)
Figure 10. (a) Defective generator-side converter, (b) slide-in stack with short-circuit damage in thearea of the connection to the DC-link busbar and (c) soot penetrated into the stack.
With a DC-side short circuit, this case provides another example of an issue repeatedly encounteredin the field, as also the compilation of analysis results and experiences of power-converter and modulemanufacturers in the following section will show.
3.3. Results from Damage Analyses of Power-Converter and Power-Module Manufacturers
The post-mortem analysis of field returns is a proven method for determining the causes of failure.In view of the relatively few defect components investigated within the present project, however, theconclusiveness of the above described findings would have been limited. It is therefore very valuablethat comprehensive results and insights from the damage analysis of an at least five-digit number ofreturned converter components from the wind application have been shared with Fraunhofer IWESby various converter and module manufacturers (not being limited to the members of the projectconsortium). The analyzed components include in particular a large number of IGBT modules withtheir driver boards. The most important findings, many of which are in good agreement across thecompanies involved, are summarized below.
Particularly noteworthy is the confirmation of the field-data and post-mortem analyses regardingthe lack of fatigue failures known from other power-electronics applications: Several parties—eachon the basis of post-mortem analysis of large component numbers—have stated that no “end-of-life”indications in the form of bond-wire detachment or chip-solder damage have been detected at all infield returns from wind parks.
Overall, the failures are distributed approximately equally between the IGBT module and thedriver board, with driver-board failure predominating in case of single manufacturers. The failure ofDC-link components plays a minor but still non-negligible role. With one-fifth to one-third, a significantpart of the failures—especially of IGBT modules with explosion damage—remains unexplained. Thisis mainly due to the fact that the cause or origin of the failure can often no longer be determinedin largely destructed modules. The actual causes of these failures, which in practice are typicallycategorized as electrical overstress (EOS) failure, remain in the dark.
On the part of the driver boards, the failures are spread over all types of components, especiallydiodes, fuses, resistors, capacitors, inductive wound components and integrated circuits (ICs). Weakbatches with increased failure rates, the causes of which are attributable to processes at the componentmanufacturers and often can only be identified with considerable time delay, play an important rolehere. Also the transformer failures on the driver board of a certain type of module, which have beenfound during the analyses in the Innovation Cluster (see Section 3.2.1) and confirmed by the companies’post-mortem analysis results, fall into this category. Although this weak point was eliminated in the
Energies 2019, 12, 593 16 of 27
next version of the power-module type, it still leads to failures of wind-turbine converters due to itswidespread use in the field.
In addition to the failures that can be attributed to driver board defects, there are also those witha cause related to the driver board, but with the destruction of power semiconductors as a consequence.This includes the coupling of radiated or conducted interference into the driver board, which havetheir origin e.g., in brush arcing on damaged slip rings of DFIGs, in flashovers on degraded contacts insnubber capacitors, or sometimes even in the sole proximity to the switching power semiconductors.The exposure to high interference levels, which can even exceed the maximum level applied duringEMC tests, can lead to the generation of additional switching events or increased switching frequenciesvia the gate signal. In the less critical case, these cause increased switching losses and thus a highertemperature of the IGBTs; in the more critical case, a short circuit can be the result of simultaneousswitching of top and bottom IGBTs. A comparable effect is attributed to the occurrence of reflectioneffects in optical interfaces.
Another case in which a faulty driver can cause IGBT failure is that the gate voltage providedby the driver board is too low to switch the IGBTs to the fully conductive state. This was stated to beobservable especially under the influence of moisture. From the loss-minimal switching operation, thepower semiconductor device in this way gets in a quasi-linear operation, in which it is conducting butafflicted with an increased (gate-voltage dependent) resistance. The high power loss created in thisstate leads to the thermal destruction of the IGBT within a very short time.
Also in numerous other cases, the cause of power-semiconductor failures lies outside the chipor packaging level. In particular, DC-side short circuits are to be mentioned in this context. Theseoccur e.g., due to insulation degradation (of the insulation foils between the current terminals of thepower modules as well as in the area of DC busbars or laminates) under the influence of moisture orcondensation or due to a failure of snubber or DC-link capacitors. The frequency of DC-link capacitorfailures, which were only rarely found in the Innovation Cluster dataset, is apparently very differentdepending on the manufacturer. In the case of a DC-side short circuit and the associated voltage dropin the DC link, the freewheeling diodes in the connected IGBT modules form a bridge rectifier, throughwhich high currents flow into the short circuit. These lead either to a complete destruction of the diodesor to an initial damage resulting in reduced strength. The same effect can be caused by short-circuitfailures of adjacent power modules connected to the same DC link as they cause a break-down ofthe DC-side voltage. This often leads to “partner failures” or consequential damage in neighboringIGBT modules.
Snubber capacitors can also be the cause of over-voltage failures of power semiconductors.A significantly more common failure mode than short-circuit failure is the detachment of the film-rollcontact inside the film capacitors, which are typically used as snubber capacitors. Consequently,the capacitor is no longer low-inductance and with that loses its capability of limiting high-frequencyover-voltages, which may cause over-voltage failures of the semiconductor devices.
In addition to the failure causes described above, water damage (for example due to coolantleakage) and mechanical damage (e.g., due to incorrect mounting of modules) were detected. However,their portion has been stated to be not higher than approx. 10%.
Finally, the statement of a power-module manufacturer is remarkable according to which aboutone-fifth of the returned modules carry insects or heavy pollution. This confirms observations made inthe pre-project CONFAIL [27,28] and the need for improved protection of the converters from dustand the intrusion of insects. The involved manufacturers agreed on the statement that moisture isa factor with a massive impact on the reliability of power converters in wind turbines.
4. Discussion
In the following, we summarize and discuss the findings in light of the guiding overall question,which are the main causes of converter failures or failure-relevant influencing factors in the windapplication. For this purpose, we take into account the following:
Energies 2019, 12, 593 17 of 27
• the research carried out within the Innovation Cluster,• input from and discussion with various companies, including power-module and converter
manufacturers, wind-turbine operators and maintenance service providers, as well as• information from conferences and literature.
Overall, it can be stated that the failure causes and mechanisms leading to the frequent failureof wind-turbine converters and, in particular, their core components (phase-module category) arecomplex and very diverse. There is no single main cause underlying the high failure rates observedacross turbine fleets of different manufacturers and types. However, a number of relevant influencingfactors have been identified, which are presented below.
4.1. Factors with a Relevant Influence on Converter Failure
4.1.1. Humidity and Condensation
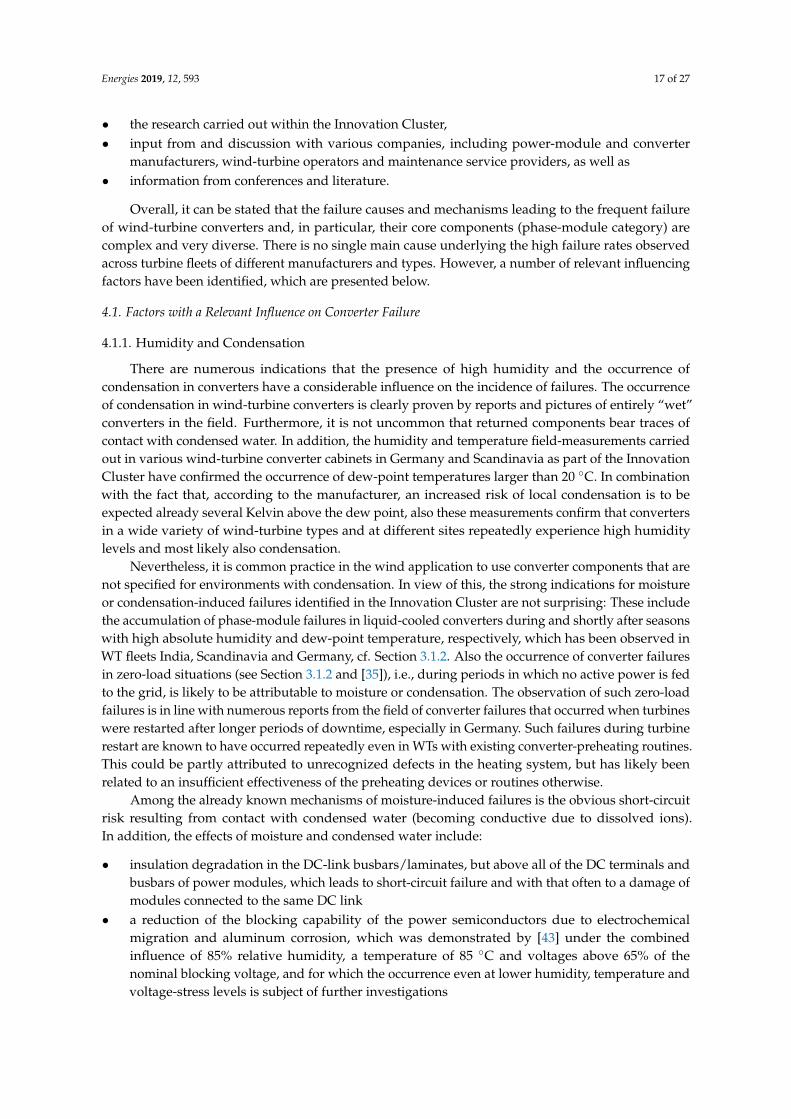
There are numerous indications that the presence of high humidity and the occurrence ofcondensation in converters have a considerable influence on the incidence of failures. The occurrenceof condensation in wind-turbine converters is clearly proven by reports and pictures of entirely “wet”converters in the field. Furthermore, it is not uncommon that returned components bear traces ofcontact with condensed water. In addition, the humidity and temperature field-measurements carriedout in various wind-turbine converter cabinets in Germany and Scandinavia as part of the InnovationCluster have confirmed the occurrence of dew-point temperatures larger than 20 ◦C. In combinationwith the fact that, according to the manufacturer, an increased risk of local condensation is to beexpected already several Kelvin above the dew point, also these measurements confirm that convertersin a wide variety of wind-turbine types and at different sites repeatedly experience high humiditylevels and most likely also condensation.
Nevertheless, it is common practice in the wind application to use converter components that arenot specified for environments with condensation. In view of this, the strong indications for moistureor condensation-induced failures identified in the Innovation Cluster are not surprising: These includethe accumulation of phase-module failures in liquid-cooled converters during and shortly after seasonswith high absolute humidity and dew-point temperature, respectively, which has been observed inWT fleets India, Scandinavia and Germany, cf. Section 3.1.2. Also the occurrence of converter failuresin zero-load situations (see Section 3.1.2 and [35]), i.e., during periods in which no active power is fedto the grid, is likely to be attributable to moisture or condensation. The observation of such zero-loadfailures is in line with numerous reports from the field of converter failures that occurred when turbineswere restarted after longer periods of downtime, especially in Germany. Such failures during turbinerestart are known to have occurred repeatedly even in WTs with existing converter-preheating routines.This could be partly attributed to unrecognized defects in the heating system, but has likely beenrelated to an insufficient effectiveness of the preheating devices or routines otherwise.
Among the already known mechanisms of moisture-induced failures is the obvious short-circuitrisk resulting from contact with condensed water (becoming conductive due to dissolved ions).In addition, the effects of moisture and condensed water include:
• insulation degradation in the DC-link busbars/laminates, but above all of the DC terminals andbusbars of power modules, which leads to short-circuit failure and with that often to a damage ofmodules connected to the same DC link
• a reduction of the blocking capability of the power semiconductors due to electrochemicalmigration and aluminum corrosion, which was demonstrated by [43] under the combinedinfluence of 85% relative humidity, a temperature of 85 ◦C and voltages above 65% of thenominal blocking voltage, and for which the occurrence even at lower humidity, temperature andvoltage-stress levels is subject of further investigations
Energies 2019, 12, 593 18 of 27
• the impairment of moisture-susceptible driver components by corrosion or electrochemicalmigration, which can, besides a full loss of function of the driver board, through an insufficientgate voltage lead to thermal damage of IGBTs (see Section 3.3).
The fact that moisture can cause the impairment of insulation materials and insulation distancesmatches well with the beneficial effect of lower DC-link voltage levels revealed in [36]. Also thissupports the hypothesis that moisture and condensation play a central role for the occurrence ofconverter failures.
4.1.2. Overheating
Another important factor in the context of converter failure is a lack of cooling and the resultingoverheating of converter components. In air-cooled converters, this is caused by defective or ineffectivefans. In the case of liquid-cooled converters, the causes often lie in clogged coolant pipes or airbubbles in the cooling system (e.g., confirmed by [44]). In addition to effects on the power electronics,specifically the overheating of the converter’s control electronics (cf., for example, [45]) and thedestruction of the DC-busbar insulation by high temperatures in the converter cabinet are known issues.
A factor with direct influence on the temperature of IGBTs and diodes is the effectiveness ofthe thermal paste between the DCB substrate, a possible baseplate and the heat sink. At the currentstate of knowledge, it cannot be stated clearly whether converter failures in contemporary turbinesto a relevant extent have their cause in the thermal paste. While in a wind farm installed in 1997with a very old turbine generation, the outpouring of thermal paste accompanied by the ingress ofair was identified to have caused an overheating of the power electronics, this is not known withcertainty from any other turbine type. The impression of an aged thermal paste given in [27,28]is contrasted by measurements of the power-module manufacturer, which instead of degradationshowed an improvement in the thermal conduction properties over time. There is no doubt, however,that a homogeneous application of the thermal paste in the assembly of power modules is crucial toensure an effective dissipation of heat from the semiconductors.
4.1.3. Weak Components
It is to be regarded as certain that components with insufficient strength, e.g., due to manufacturingdefects, are among the main causes of the frequent driver-board failures. This is supported by thepost-mortem analysis results presented in Sections 3.2.1 and 3.3 of this paper, but also e.g., by thedamage analysis of more than 100 failed stacks from wind-turbine converters presented in [23].
In the field of power semiconductors, the analysis of a module manufacturer identified “weakchips” to be the cause of only a small portion of the investigated failures. However, it should be keptin mind that there is a considerable amount of unexplained IGBT-module failures, which could also berelated to weak single components.
Tests during the manufacturing process and the partially applied burn-in testing of powermodules serve to recognize and reject chips or modules without a sufficient strength, so that theirinstallation in the field can be avoided. Nevertheless, numerous zero-time failures (i.e., failures duringcommissioning of the wind turbine) and a clear infant-mortality behavior of phase modules have beenrevealed in the field-data analysis carried out within the Innovation Cluster [33,36]. This suggests thatin addition to problems related to transportation or installation that might explain an instantaneousfailure, there is also an insufficient strength of individual components, e.g., due to variations in theproduction process. Such insufficient strength can also exist in the form of lacking robustness againstenvironmental influences such as moisture. If the components used are not specified for the realconditions experienced in the field (such as the occurrence of condensation), there is de facto an“improper use”, which is among the typical causes of infant-mortality failures named in [46].
Energies 2019, 12, 593 19 of 27
4.1.4. Asymmetric Current Sharing and Uncontrolled Switching of IGBTs
The parallel connection of power semiconductors is generally afflicted with the risk of an unevendistribution of the current and thus of an overload or an accelerated lifetime consumption of the mostheavily loaded devices. Asymmetries can occur on the one hand between power modules, in particularwhen modules of different forward-voltage (VF) classes are combined. Although this is in contrastto the usage instructions, this case has repeatedly been encountered in the field. In addition, contactresistances play an important role in the development of current asymmetries. These are particularlyinfluenced by the screw connections (i.e., their tightening torque) in the power path.
However, current asymmetries can also occur within power modules between parallel-connectedpower semiconductors. As explained, for example in [47], even a small parasitic inductance in theemitter or source line that is different in the parallel current paths causes a current asymmetry inparallel voltage-controlled power semiconductors. Likewise, a parasitic inductance in the gate-drivercircuit is problematic, resulting in a lack of control over the gate voltage [48]. This can result indifferences in the current load of parallel-connected IGBTs of up to a factor of two to three [49].According to the experience of a converter manufacturer, there are also in the wind applicationsignificant (design-dependent) differences in the failure rates of IGBT modules with very symmetricalor asymmetrical internal current sharing.
Finally, electromagnetic interference coupling into the driver circuit of IGBTs, but also reflectionsin optical interfaces, as explained in Section 3.3, can cause uncontrolled additional switching of thepower semiconductors, with undesirable effects on the converter reliability.
4.1.5. Contamination
Another factor that is most likely having a relevant negative effect on converter reliability iscontamination. In the wind application, contamination of the following types is known to occur inpower converters:
• with coal dust (from generator brushes, especially in the absence of an extraction system),• with dust from the environment (e.g., from agriculture, ore dust from mining),• with salt (at offshore and nearshore locations),• with and through insects.
The observation that the heavy contamination of converters in wind turbines is a widespreadproblem is not only visible in the maintenance reports evaluated in the Innovation Cluster. It isalso particularly evident in the information provided by a module manufacturer based on thecomprehensive analysis of returned components (see Section 3.3). From this it can be concluded that theconverter cabinets often do not sufficiently protect the converter components against contamination.Despite formal compliance with protection classes (typically IP54), the protective function of thecabinets is often not given in practice, e.g., if there are large openings in cable feedthroughs, if filterpads are missing or cabinet doors are not completely closed. Particularly in combination with moisture,contamination has the effect to bridge or reduce clearances and creepage distances and can in this waycause malfunction or flash-over/short circuit failure.
4.1.6. Human Error and Maintenance Practice
A relevant cause for the occurrence of converter failures in wind turbines are human errors duringinstallation, commissioning or maintenance work. Known typical cases from the wind application,in which human error led to converter failure are, e.g.,:
• the leakage of coolant onto converter components leading to immediate short-circuit failure ortime-delayed corrosion of the tracks and components of circuit boards in the converter [50],
• incorrectly wired converter heaters in systems without temperature feedback, which preventedconverter preheating and in this way led to condensation failure during cold start-up,
Energies 2019, 12, 593 20 of 27
• wrong valve positions in the converter cooling circuit, resulting in a permanent “overcooling”with subsequent failure due to condensation [44],
• short-circuit failure due to tools or screws remained in the converter after maintenance as well asdue to insufficiently fastened cables, that subsequently loosened owing to vibration,
• too high or too low tightening torque for screw connections, e.g., at the power terminals of IGBTmodules; the former case is a afflicted with enhanced mechanical stress inside the module, thelatter case with the risk of hot spots and asymmetric load distribution due to the resulting highcontact resistance.
Likewise, the maintenance practice has a significant influence on converter reliability. If onlydefective converter modules are replaced after a failure, adjacent modules with an existing but notobvious or measurable damage remain in the field. The same problem arises when used moduleswith a hidden pre-damage are re-used as spare parts. In both cases, there is a risk of an earlysecondary failure.
4.2. Unlikely Causes of Converter Failure
The results of the Innovation Cluster work have not only provided indications what factors doinfluence or very likely affect the incidence of converter failures in wind turbines. They have alsorevealed factors and mechanisms that, at least in an overall view, do not play a relevant role in theconverter failures observed during the past years. These are discussed in the following subsections.
4.2.1. Thermocycling-Induced Fatigue at Chip/Packaging Level
The first and foremost mechanism to name in this context is the thermocycling-inducedfatigue of bond wires, bond-wire contacts and solder layers in power modules observed in otherpower-electronics applications. In the scientific literature, this failure mechanism is widely postulatedto be also the prevailing mechanism leading to failure of WT converters.
However, the results of the Innovation Cluster clearly refute that this failure mechanism plays anysignificant role in the field failures of wind turbine converters today. For example, converters in DFIGsystems that are exposed to particularly severe thermal cycles on the generator side do not generallyshow a lower converter reliability than WTs with other generator-converter concepts; rather, theirphase-module failure rates determined in the Innovation Cluster are significantly lower than those ofWTs with asynchronous generators and full power converters [35]. Nor is there a general predominanceof failures of the generator-side converter part in DFIG systems, which would be expected in thecase of fatigue-dominated failure behavior [35]. While these findings might still be explained witha particularly strong design (with respect to power-cycling life) of the generator-side converter inDFIGs, further evidence results from the failure behavior of the phase-module components determinedin the Weibull analysis presented in [33,36]. Instead of a wear-out failure behavior with an increasingfailure rate, which would be expected in case of degradation or fatigue-related failures, the convertersof all investigated WT types showed a clear infant-mortality behavior. Particularly important in thiscontext is also the finding, that IGBT modules returned from the wind application showed no signs ofbond-wire detachment from chips or of chip delamination (see Section 3.2.1, Section 3.3 and previousdamage analyses described in [28]).
Thus, as a central result of the failure-cause analysis in the Innovation Cluster, it can be stated thatthe fatigue caused by thermal cycles is not among the relevant life-limiting mechanisms in wind-turbineconverters today. Rather, the IGBT modules fail due to other factors before fatigue effects lead to anyrelevant damage.
4.2.2. Transients during Connection to the Grid
Another potentially critical factor investigated within the Innovation Cluster are electricaltransients occurring during turbine start-up in the moment of grid connection, e.g., resulting from
Energies 2019, 12, 593 21 of 27
imperfect synchronization with the grid. If these transients had a major effect on the incidence offailure, phase-module failures would have to be observed especially on WTs with frequent start-stopcycles. This was investigated for WT fleets of five different manufacturers, as presented in [34]. In allcases, turbines with higher numbers of start-stop cycles per year did not experience phase-modulefailures more frequently than WTs with less start-stop cycles. In view of this result, it is unlikely thatelectrical transients occurring during the grid connection of wind turbines play an important role inthe context of converter failure.
4.2.3. Vibration
Vibrations can lead to loosening of plug and screw connections, to fretting corrosion and tofatigue effects due to cyclic mechanical load and are thus as well among the potential failure causesof WT converters. In the case of a single WT type with the converter located in the nacelle, vibrationwas in fact reported as the most likely cause of converter failures. However, taking into account theentire diverse fleet analyzed in the Innovation Cluster, the picture is different. According to the resultspresented in [36], there are no indications that a converter position inside the nacelle is disadvantageouscompared with a position in the tower base. It is therefore most unlikely that vibration is among themain causes of converter failure in wind turbines.
4.2.4. Cosmic Radiation
Power-semiconductor components can basically be destroyed by cosmic rays (i.e., the neutronradiation these cause on the surface of the earth). The radiation intensity depends on solar activity andvaries cyclically with cycle times of approximately 11 years [51]. Cosmic radiation is strongest in thearea of the magnetic poles of the earth and weakest at the equator. In addition, its intensity increaseswith the altitude above sea level.
On the basis of the field data evaluated in the Innovation Cluster, it was investigated whethera temporal correlation between the fluctuation of the neutron radiation flux and the failure ratesof the WT converters or phase modules could be found [34]. Owing to their greatest proximity tothe magnetic north pole and their therefore comparatively strong exposure to cosmic radiation, theanalysis was focused on wind farms in Scandinavia.
The results provide no indication that cosmic radiation is a significant cause of the evaluatedconverter failures. Rather, a temporal variation of the phase-module failure rate is observed, especiallyin Scandinavian wind farms, which speaks against this hypothesis. In addition, theoretical failure-rateestimations for three types of wind turbines have confirmed that cosmic radiation could explain onlya negligible fraction of the converter failures in the Innovation Cluster dataset. However, in view of thesignificant difference in cosmic-radiation sensitivity of IGBTs and diodes of different manufacturersand types, a general conclusion cannot be made. Despite the results obtained from the field dataevaluated in the present work, it cannot be ruled out that in certain WTs (in particular at high altitudes,in multi-MW systems with full converters and thus overall large chip area or in converters with highvoltage stress on the semiconductor switches), cosmic radiation is or could become a relevant cause ofconverter failure.
5. Conclusions
5.1. Summary and Main Conclusions of the Present Work
The present paper summarizes and concludes several years of research carried out in a consortiumof three research institutes and 16 companies. With the objective to shed light on the previously largelyunknown causes and mechanisms of the frequent power-converter failures in wind turbines, field datafrom a large and diverse worldwide WT fleet covering almost 7400 years of WT operation has beencompiled and analyzed. For the same purpose, field-measurement campaigns have been carried out
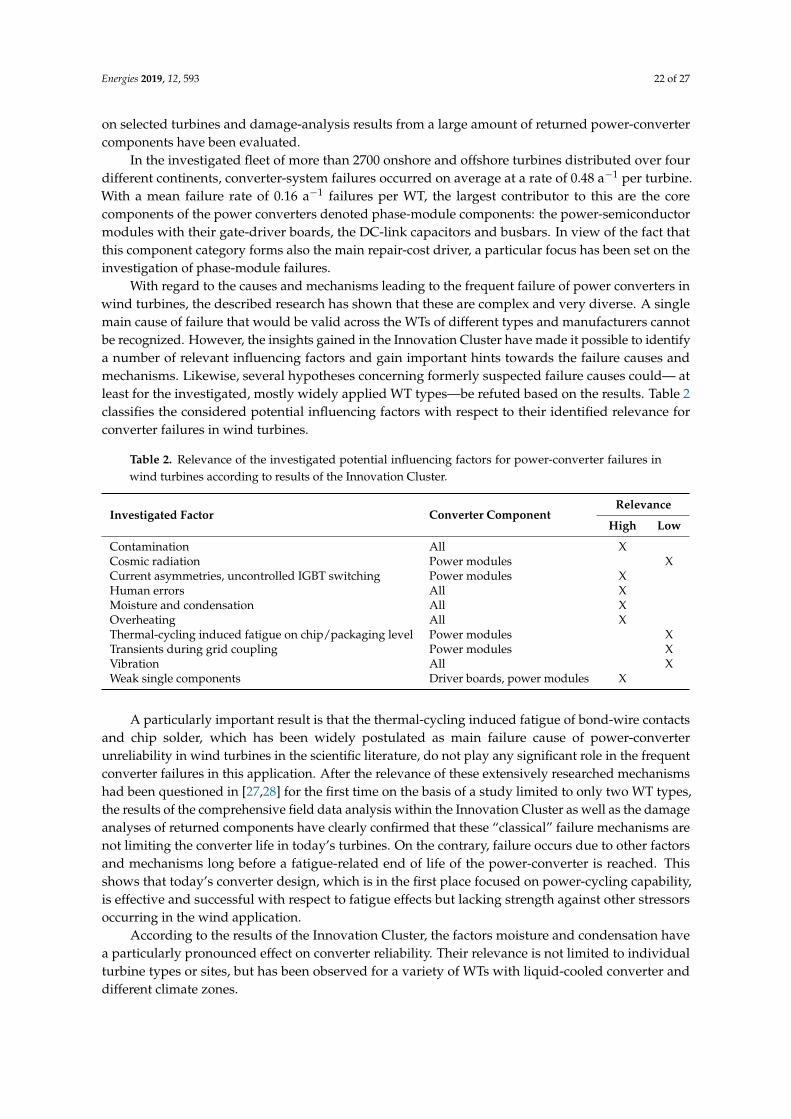
Energies 2019, 12, 593 22 of 27
on selected turbines and damage-analysis results from a large amount of returned power-convertercomponents have been evaluated.
In the investigated fleet of more than 2700 onshore and offshore turbines distributed over fourdifferent continents, converter-system failures occurred on average at a rate of 0.48 a−1 per turbine.With a mean failure rate of 0.16 a−1 failures per WT, the largest contributor to this are the corecomponents of the power converters denoted phase-module components: the power-semiconductormodules with their gate-driver boards, the DC-link capacitors and busbars. In view of the fact thatthis component category forms also the main repair-cost driver, a particular focus has been set on theinvestigation of phase-module failures.
With regard to the causes and mechanisms leading to the frequent failure of power converters inwind turbines, the described research has shown that these are complex and very diverse. A singlemain cause of failure that would be valid across the WTs of different types and manufacturers cannotbe recognized. However, the insights gained in the Innovation Cluster have made it possible to identifya number of relevant influencing factors and gain important hints towards the failure causes andmechanisms. Likewise, several hypotheses concerning formerly suspected failure causes could— atleast for the investigated, mostly widely applied WT types—be refuted based on the results. Table 2classifies the considered potential influencing factors with respect to their identified relevance forconverter failures in wind turbines.
Table 2. Relevance of the investigated potential influencing factors for power-converter failures inwind turbines according to results of the Innovation Cluster.
Investigated Factor Converter ComponentRelevance
High Low
Contamination All XCosmic radiation Power modules XCurrent asymmetries, uncontrolled IGBT switching Power modules XHuman errors All XMoisture and condensation All XOverheating All XThermal-cycling induced fatigue on chip/packaging level Power modules XTransients during grid coupling Power modules XVibration All XWeak single components Driver boards, power modules X
A particularly important result is that the thermal-cycling induced fatigue of bond-wire contactsand chip solder, which has been widely postulated as main failure cause of power-converterunreliability in wind turbines in the scientific literature, do not play any significant role in the frequentconverter failures in this application. After the relevance of these extensively researched mechanismshad been questioned in [27,28] for the first time on the basis of a study limited to only two WT types,the results of the comprehensive field data analysis within the Innovation Cluster as well as the damageanalyses of returned components have clearly confirmed that these “classical” failure mechanisms arenot limiting the converter life in today’s turbines. On the contrary, failure occurs due to other factorsand mechanisms long before a fatigue-related end of life of the power-converter is reached. Thisshows that today’s converter design, which is in the first place focused on power-cycling capability,is effective and successful with respect to fatigue effects but lacking strength against other stressorsoccurring in the wind application.
According to the results of the Innovation Cluster, the factors moisture and condensation havea particularly pronounced effect on converter reliability. Their relevance is not limited to individualturbine types or sites, but has been observed for a variety of WTs with liquid-cooled converter anddifferent climate zones.
Energies 2019, 12, 593 23 of 27
An influencing factor requiring further investigation is the electrical loading of the turbines.Previous analyses of the authors [35] indicated that operation at high electrical loads (i.e., with anactive power close to, at or above the rated power of the WT) are a trigger for converter failure.The present paper has investigated the relationship between the capacity factor, which characterizesthe average electrical load of a turbine, and the power-converter failure rate in turbines of differentgenerator-converter concepts and manufacturers. While the observed failure rates differ largely amongthe WT groups, no relevant correlation with the capacity factor has been found, indicating that in themajority of considered WT types, turbines operating at higher average loads are not generally affectedby converter failures more often than WTs with lower utilized capacity. To better understand the roleof the electrical loading in the context of converter failure, the investigation of strong wind gusts andshort exceedances of the WT rated power is of particular interest.
5.2. Future Work—Recommendations and Outlook
In view of the still high power-converter failure rates in wind turbines and the massive economicimpact these have particularly in offshore wind parks, where the limited accessibility for repairs andthe involved logistics drive up the direct and indirect costs of failures, the full clarification of thefactors and mechanisms leading to these failures and the development of effective remedial measuresshould be given top priority in future research. In order to direct the research to the practically relevantquestions, an application-specific and field-experience based approach is deemed to be vital. Newdesigns or packaging technologies aiming at a further increased power-cycling capability are notexpected to effectively improve the situation in the wind application as long as the failures occurringthere are not caused by fatigue effects. The same applies for advanced control techniques intended toreduce the thermal cycling. However, once the issues causing today’s early failures of converters inwind turbines are fully understood and remedied, it is expected that thermal-cycling induced fatiguewill become the life-limiting factor also in practice so that converters in wind turbines will in fact reachtheir design life. This makes clear that cutting down power-cycling strength in the design for the sakeof cost reduction would be a short-sighted measure that cannot be recommended.
The comprehensive evaluation of field data and converter-failure related experience within theInnovation Cluster has provided important indications about practically relevant failure causes andinfluencing factors in the field. In spite of the large amount of data compiled and evaluated in thisproject, however, certain technologies (such as PMSG-based turbines with fully rated power converter,IGBT- or IGCT-based medium-voltage converters, large turbines with rated capacities above 3.6 MW)have not at all or not in a sufficient amount been covered by the database to allow their analysis.Another limitation is that a verification of the derived hypotheses and an in-depth understandingof certain failure mechanisms cannot be achieved on the basis of field data alone. Therefore, thesubsequent work initiated at Fraunhofer IWES in collaboration with several project partners followsa complementary bottom-up/top-down approach: On the one hand, it seeks to extend the field-dataanalysis to the above-named technologies and additional offshore fleets and includes comprehensivemeasurement campaigns on the spectrum of real loads and environmental stressors occurring in thewind application. On the other hand, it covers laboratory investigations with a particular focus onmoisture- and condensation-induced effects and accelerated testing on both converter-system andcomponent level under combined electrical and environmental loads.
5.3. Recommendations for Documentation of Failure Events
The field data collected and evaluated in the Innovation Cluster is very diverse in format, structure,level of detail and nomenclature. Despite the availability of standardized designation systems such asthe Reference Designation System for Power Plants (RDS-PP) [52], this diversity is still characteristicfor field data from the wind application. The consequence is a high effort required for data processing(import, conversion into a suitable uniform file format, differentiation between failure events andother entries, failure categorization, etc.) before an evaluation by means of mathematical methods is
Energies 2019, 12, 593 24 of 27
possible. Advancing to a standardized, automated recording of failure and operating data is thereforeconsidered an important step to be able to utilize field data more efficiently in the future, in particularalso for root-cause analysis.
In addition, there is great potential for improvement in the documentation about failure eventsand the damaged components. The post-mortem analysis of returned components is particularlyvaluable if the following information is available for every damaged component under investigation:
• wind-turbine ID, type and location• component position within the converter (e.g., grid side or generator side, phase)• timestamp of the failure event• wind speed and turbine power fed to the grid at the time of failure, possibly related conditions
such as grid faults or thunderstorms preceding the failure event• operating time until failure (for re-used components: including previous operating times in
other turbines)• further components damaged during the same failure event
By consequently documenting such “component-tracking” information and providing it foranalysis together with the damaged components, wind-turbine operators and maintenance-serviceproviders can make an important contribution to the improvement of converter reliability in windturbines in the future.
Author Contributions: Conceptualization of the manuscript, K.F.; writing—original draft preparation, K.F.;writing—review and editing, all authors; field-data analysis, K.F., K.P., A.B. and B.T.; damage analyses, S.P.,M.-H.P. and K.F.; root-cause analysis discussions, K.F., A.M., J.W., C.B., A.B., B.T. and K.P.; project coordination,C.B.; funding acquisition, K.F. and J.W.
Funding: This research was to a large part carried out within the “Fraunhofer-InnovationsclusterLeistungselektronik für regenerative Energieversorgung” (Innovation Cluster on Power Electronics forRenewables), which was funded by the German Federal State of Lower Saxony with funds from“Niedersächsisches Vorab” and by Fraunhofer-Gesellschaft. To a minor part, the work was carried out withinthe project HiPE-Wind funded by the German Federal Ministry for Economic Affairs and Energy, grantnumber 0324219B.
Acknowledgments: The authors thank the project partners in the Innovation Cluster, namely Availon, Bender,energy consult, EWE, FeCon, Gothaer Allgemeine Versicherung, ITEC International, juwi Operations &Maintenance, Leine Linde Systems, Semikron, SSB Wind Systems, Suzlon, Vattenfall, Woodward Kempen, wpdwindmanager technik and ZOPF Energieanlagen, for providing the field data and defect components analyzed inthis project, for sharing their experience and/or contributing to the root-cause analysis discussions.
Conflicts of Interest: The authors declare no conflict of interest.
References
1. Gayo, J.B. Final Publishable Summary of Results of Project ReliaWind; Gamesa Innovation and Technology:Egues, Spain, 2011.
2. Matthews, P.; Ahmad, T. Improving Energy Yield Through Co-Ordinated Wind Farm Control. Presented atWind Farm Data Management and Analysis Forum, Hamburg, Germany, 11–13 October 2016.
3. Lin, Y.; Tu, L.; Liu, H.; Li, W. Fault analysis of wind turbines in China. Renew. Sustain. Energy Rev. 2016, 55,482–490. [CrossRef]
4. Portfolio Review 2016; System Performance, Availability and Reliability Trend Analysis. 2017.Available online: https://s3-eu-west-1.amazonaws.com/media.ore.catapult/wp-content/uploads/2017/03/28102600/SPARTAbrochure_20March-1.pdf (accessed on 29 November 2018).
5. Busca, C.; Teodorescu, R.; Blaabjerg, F.; Munk-Nielsen, S.; Helle, L.; Abeyasekera, T.; Rodriguez, P.An overview of the reliability prediction related aspects of high power IGBTs in wind power applications.Microelectron. Reliab. 2011, 51, 1903–1907. [CrossRef]
6. Musallam, M.; Johnson, C.M. Impact of different control schemes on the life consumption of power electronicmodules for variable speed wind turbines. In Proceedings of the 2011 14th European Conference on PowerElectronics and Applications, Birmingham, UK, 30 August–1 September 2011.
Energies 2019, 12, 593 25 of 27
7. Ikonen, M. Power cycling lifetime estimation of IGBT power modules based on chip temperature modeling.Ph.D. Thesis, Lappeenranta University of Technology, Lappeenranta, Finland, 11 December 2012.
8. Ma, K.; Liserre, M.; Blaabjerg, F.; Kerekes, T. Thermal Loading and Lifetime Estimation for Power DeviceConsidering Mission Profiles in Wind Power Converter. IEEE Trans. Power Electron. 2015, 30, 590–602.[CrossRef]
9. Bartram, M.; Bloh, J.; von Doncker, R.W.D. Doubly-fed-machines in wind-turbine systems: is this applicationlimiting the lifetime of IGBT-frequency-converters? In Proceedings of the 2004 IEEE 35th Annual PowerElectronics Specialists Conference (IEEE Cat. No.04CH37551), Aachen, Germany, 20–25 June 2004; Volume 4,pp. 2583–2587.
10. Wang, H.; Liserre, M.; Blaabjerg, F.; de Place Rimmen, P.; Jacobsen, J.B.; Kvisgaard, T.; Landkildehus, J.Transitioning to Physics-of-Failure as a Reliability Driver in Power Electronics. IEEE J. Emerg. Sel. Top. PowerElectron. 2014, 2, 97–114. [CrossRef]
11. Wei, L.; Kerkman, R.J.; Lukaszewski, R.A.; Lu, H.; Yuan, Z. Analysis of IGBT Power Cycling CapabilitiesUsed in Doubly Fed Induction Generator Wind Power System. IEEE Trans. Ind. Appl. 2011, 47, 1794–1801.[CrossRef]
12. Fuchs, F.; Mertens, A. Steady state lifetime estimation of the power semiconductors in the rotor side converterof a 2 MW DFIG wind turbine via power cycling capability analysis. In Proceedings of the 2011 14th EuropeanConference on Power Electronics and Applications, Birmingham, UK, 30 August–1 September 2011; pp. 1–8.
13. Pittini, R.; D’Arco, S.; Hernes, M.; Petterteig, A. Thermal stress analysis of IGBT modules in VSCs for PMSGin large offshore Wind Energy Conversion Systems. In Proceedings of the 2011 14th European Conferenceon Power Electronics and Applications, Birmingham, UK, 30 August–1 September 2011; pp. 1–10.
14. D’Arco, S.; Undeland, T.; Bohlländer, M.; Lutz, J. A simplified algorithm for predicting power cycling lifetimein direct drive wind power systems. In Proceedings of the 9th Internationsl Multi-Conference on Systems,Signals and Devices (SSD), Chemnitz, Germany, 20–23 March 2012; pp. 1–6.
15. Zhou, Q.; Xue, S.; Li, J.; Xiang, C.; Chen, S. Evaluation of wind power converter reliability consideringmulti-time scale and mission profiles. In Proceedings of the 2016 IEEE International Conference on HighVoltage Engineering and Application (ICHVE), Chengdu, China, 19–22 September 2016; pp. 1–4.
16. Smith, C.J.; Crabtree, C.J.; Matthews, P.C. Impact of wind conditions on thermal loading of PMSG windturbine power converters. IET Power Electron. 2017, 10, 1268–1278. [CrossRef]
17. Baygildina, E.; Peltoniemi, P.; Pyrhönen, O.; Ma, K.; Blaabjerg, F. Thermal loading of wind power converterconsidering dynamics of wind speed. In Proceedings of the IECON 2013—39th Annual Conference of theIEEE Industrial Electronics Society, Vienna, Austria, 10–13 November 2013; pp. 1362–1367.
18. Zhou, D.; Blaabjerg, F.; Franke, T.; Tønnes, M.; Lau, M. Comparison of Wind Power Converter Reliabilitywith Low-Speed and Medium-Speed Permanent-Magnet Synchronous Generators. IEEE Trans. Ind. Electron.2015, 62, 6575–6584. [CrossRef]
19. Zhang, G.; Zhou, D.; Blaabjerg, F.; Yang, J. Mission profile resolution effects on lifetime estimation ofdoubly-fed induction generator power converter. In Proceedings of the 2017 IEEE Southern Power ElectronicsConference (SPEC), Puerto Varas, Chile, 4–7 December 2017; pp. 1–6.
20. Konrad, S. Ein Beitrag zur Auslegung und Integration Spannungsgespeister IGBT-Wechselrichter(A Contribution to the Design and Integration of IGBT-Based Voltage Source Converters). Ph.D. Thesis,Technische Universität Ilmenau, Ilmenau, Germany, 1997.
21. Zhu, P.; Liu, Y.; Robert, R.; Hao, X. Offshore wind converter reliability evaluation. In Proceedings of the 8thInternational Conference on Power Electronics—ECCE Asia, Jeju, Korea, 30 May–3 June 2011; pp. 966–971.
22. Wu, R.; Reigosa, P.D.; Iannuzzo, F.; Wang, H.; Blaabjerg, F. A comprehensive investigation on the short circuitperformance of MW-level IGBT power modules. In Proceedings of the 2015 17th European Conference onPower Electronics and Applications (EPE’15 ECCE-Europe), Geneva, Switzerland, 8–10 September 2015;pp. 1–9.
23. Rannestad, B.; Maarbjerg, A.E.; Frederiksen, K.; Munk-Nielsen, S.; Gadgaard, K. Converter Monitoring Unitfor Retrofit of Wind Power Converters. IEEE Trans. Power Electron. 2018, 33, 4342–4351. [CrossRef]
24. Zhou, D.; Blaabjerg, F. Reliability evaluation of power capacitors in a wind turbine system. In Proceedingsof the 2018 IEEE Applied Power Electronics Conference and Exposition (APEC), San Antonio, TX, USA,4–8 March 2018; pp. 3264–3269.
Energies 2019, 12, 593 26 of 27
25. Holzke, W.; Brunko, A.; Groke, H.; Kaminski, N.; Orlik, B. A Condition Monitoring System for PowerSemiconductors in Wind Energy Plants. In Proceedings of the PCIM Europe 2018; International Exhibitionand Conference for Power Electronics, Intelligent Motion, Renewable Energy and Energy Management,Nuremberg, Germany, 5–7 June 2018; pp. 1–7.
26. Falck, J.; Felgemacher, C.; Rojko, A.; Liserre, M.; Zacharias, P. Reliability of Power Electronic Systems:An Industry Perspective. IEEE Ind. Electron. Mag. 2018, 12, 24–35. [CrossRef]
27. Fischer, K.; Stalin, T.; Ramberg, H.; Thiringer, T.; Wenske, J.; Karlsson, R. Investigation of Converter Failure inWind Turbines; Elforsk Report for Chalmers University of Technology, Elforsk: Stockholm, Sweden, 2012.
28. Fischer, K.; Stalin, T.; Ramberg, H.; Wenske, J.; Wetter, G.; Karlsson, R.; Thiringer, T. Field-Experience BasedRoot-Cause Analysis of Power-Converter Failure in Wind Turbines. IEEE Trans. Power Electron. 2015, 30,2481–2492. [CrossRef]
29. Bartschat, A.; Morisse, M.; Mertens, A.; Wenske, J. Analysis of Dynamic Interactions between DifferentDrivetrain Components with a Detailed Wind Turbine Model. J. Phys. Conf. Ser. 2016, 753, 082022. [CrossRef]
30. Morisse, M.; Bartschat, A.; Wenske, J.; Mertens, A. Dependency of the lifetime estimation of power modulesin fully rated wind turbine converters on the modelling depth of the overall system. In Proceedings of the2016 18th European Conference on Power Electronics and Applications (EPE’16 ECCE Europe), Karlsruhe,Germany, 5–9 September 2016; pp. 1–9.
31. Morisse, M.; Bartschat, A.; Wenske, J.; Mertens, A. Converter Lifetime Assessment for Doubly-Fed InductionGenerators Considering Derating Control Strategies at Low Rotor Frequencies. J. Phys. Conf. Ser. 2016, 753,112003. [CrossRef]
32. Fischer, K.; Wenske, J. Towards reliable power converters for wind turbines: Field-data based identificationof weak points and cost drivers. In Proceedings of the Proceedings of EWEA Conference, Paris, France,7–20 November 2015.
33. Pelka, K.; Fischer, K. Failure Behaviour of Power Converters in Wind Turbines. In Proceedings of the 13thGerman Wind Energy Conference DEWEK, Bremen, Germany, 17–18 October 2017.
34. Bartschat, A.; Broer, C.; Coronado, D.; Fischer, K.; Kucka, J.; Mertens, A.; Meyer, R.; Moriße, M.;Pelka, K.; Tegtmeier, B.; et al. Zuverlässige Leistungselektronik für Windenergieanlagen. Abschlussbericht zumFraunhofer-Innovationscluster Leistungselektronik für regenerative Energieversorgung; Fraunhofer Verlag: Stuttgart,Germany, 2018; ISBN 978-3-8396-1326-9.
35. Fischer, K.; Pelka, K.; Bartschat, A.; Tegtmeier, B.; Coronado, D.; Broer, C.; Wenske, J. Reliability of PowerConverters in Wind Turbines: Exploratory Analysis of Failure and Operating Data from a Worldwide TurbineFleet. IEEE Trans. Power Electron. 2018, 1. [CrossRef]
36. Pelka, K.; Fischer, K. Reliability Analysis of Power Converters in Wind Turbines: Assessing the Effect ofTime and Design. Wind Energy 2019, under review for publication.
37. Bain, L.J.; Engelhardt, M. Statistical Analysis of Reliability and Life Testing Models: Theory and Methods, 2nd ed.;Marcel Dekker Inc.: New York, NY, USA, 1991.
38. Weatherbase, Weather Averages. Available online: http://www.weatherbase.com/ (accessed on 30 January2019).
39. Danish Meteorological Institute (DMI). 2011. Available online: https://www.dmi.dk/brug-dmis-data/(accessed on 12 February 2019).
40. Swedish Meteorological and Hydrological Institute (SMHI). 2011. Available online: https://www.smhi.se/en (accessed on 29 November 2018).
41. Deutscher Wetterdienst (DWD); Weather-data and Statistics Express (WESTE-XL). Available online: www.dwd.de/EN (accessed on 29 November 2018).
42. Su, C.; Hu, Z. Reliability assessment for Chinese domestic wind turbines based on data mining techniques.Wind Energy 2018, 21, 198–209. [CrossRef]
43. Zorn, C.; Kaminski, N. Temperature–humidity–bias testing on insulated-gate bipolartransistormodules—Failure modes and acceleration due to high voltage. IET Power Electron. 2015, 8, 2329–2335.[CrossRef]
44. Krogh Nielsen (Vestas), C. Smart Data. Presented at the workshop Advancements In Condition MonitoringAcross A Whole Fleet, Hamburg, Germany, 11 October 2016.
Energies 2019, 12, 593 27 of 27
45. Deutsche Windtechnik Upgrade for Vestas: Cooling for inverter control unit. Available online: https://www.deutsche-windtechnik.com/upgrades-retrofits/upgrade/10-Cooling-for-Inverter-Control-Unit (accessedon 30 January 2019).
46. Dodson, B.; Nolan, D. Reliability Engineering Handbook; Marcel Dekker, Inc.: New York, NY, USA, 1999.47. Bayerer, R. Parasitic inductance hindering utilization of power devices. In Proceedings of the CIPS 2016—9th
International Conference on Integrated Power Electronics Systems, Nuremberg, Germany, 8–10 March 2016;pp. 1–8.
48. Bayerer, R.; Domes, D. Parasitic inductance in gate drive circuits. In Proceedings of the PCIM 2012,Nuremberg, Germany, 8–10 May 2012.
49. Bayerer, R. Streuinduktivität, ein Problem der Leistungselektronik. Presented at Bauelemente derLeistungselektronik und ihre Anwendungen, Bad Nauheim, Germany, 6–7 April 2017.
50. Fukui, R.; Dvorak, P. How to Safeguard AEBI Control Boards against Corrosion. Availableonline: http://www.windpowerengineering.com/maintenance/how-to-safeguard-aebi-control-boards-against-corrosion/ (accessed on 29 November 2018).
51. Steinhilber, F.; Abreu, J.A.; Beer, J.; Brunner, I.; Christl, M.; Fischer, H.; Heikkilä, U.; Kubik, P.W.; Mann, M.;McCracken, K.G.; et al. 9400 years of cosmic radiation and solar activity from ice cores and tree rings.Proc. Natl. Acad. Sci. USA 2012, 109, 5967. [CrossRef] [PubMed]
52. VGB-Standard RDS-PP Application Guideline Part 32: Wind Power Plants; VGB PowerTech: Essen, Germany,2014; ISBN 978-3-86875-693-7.
© 2019 by the authors. Licensee MDPI, Basel, Switzerland. This article is an open accessarticle distributed under the terms and conditions of the Creative Commons Attribution(CC BY) license (http://creativecommons.org/licenses/by/4.0/).