exploring mechanisms of spontaneous functional connectivity in meg: how delayed network interactions...
TRANSCRIPT
NeuroImage 90 (2014) 423–435
Contents lists available at ScienceDirect
NeuroImage
j ourna l homepage: www.e lsev ie r .com/ locate /yn img
Exploring mechanisms of spontaneous functional connectivity in MEG:How delayed network interactions lead to structured amplitudeenvelopes of band-pass filtered oscillations☆
Joana Cabral a,b,⁎, Henry Luckhoo c,d, Mark Woolrich c, Morten Joensson b,e, Hamid Mohseni b, Adam Baker c,d,Morten L. Kringelbach b,e, Gustavo Deco a,f
a Theoretical and Computational Neuroscience Group, Center of Brain and Cognition, Universitat Pompeu Fabra, 08018 Barcelona, Spainb Department of Psychiatry, University of Oxford, OX3 7JX Oxford, UKc Oxford Centre for Human Brain Activity, University of Oxford, OX3 7JX Oxford, UKd Centre for Doctoral Training in Healthcare Innovation, Institute of Biomedical Engineering, Department of Engineering Science, University of Oxford, OX1 3PJ Oxford, UKe CFIN/MindLab, Aarhus University, 8000 Aarhus, Denmarkf Institució Catalana de Recerca i Estudis Avançats (ICREA), 08010 Barcelona, Spain
☆ This is an open-access article distributed under the tAttribution-NonCommercial-No Derivative Works Licensecial use, distribution, and reproduction in any medium, psource are credited.⁎ Corresponding author at: Roc Boronat, 138, 08018 Ba
E-mail address: [email protected] (J. Cabral).
1053-8119/$ – see front matter © 2013 The Authors. Pubhttp://dx.doi.org/10.1016/j.neuroimage.2013.11.047
a b s t r a c t
a r t i c l e i n f oArticle history:Accepted 27 November 2013Available online 7 December 2013
Keywords:Resting stateMEGOscillationsNetworkKuramotoModelingStructural connectivityFunctional connectivity
Spontaneous (or resting-state) brain activity has attracted a growing body of neuroimaging research over the lastdecades.Whole-brain networkmodels haveprovedhelpful to investigate the source of slow(b0.1 Hz) correlatedhemodynamic fluctuations revealed in fMRI during rest. However, the mechanisms mediating resting-statelong-distance correlations and the relationship with the faster neural activity remain unclear. Novel insightscoming from MEG studies have shown that the amplitude envelopes of alpha- and beta-frequency oscillations(~8–30 Hz) display similar correlation patterns as the fMRI signals.In this work,we combine experimental and theoretical work to investigate themechanisms of spontaneousMEGfunctional connectivity. Using a simplemodel of coupled oscillators adapted to incorporate realistic whole-brainconnectivity and conduction delays, we explore how slow and structured amplitude envelopes of band-passfiltered signals – fairly reproducing MEG data collected from 10 healthy subjects at rest – are generated sponta-neously in the space-time structure of the brain network.Our simulation results show that the large-scale neuroanatomical connectivity provides an optimal networkstructure to support a regimewithmetastable synchronization. In this regime, different subsystemsmay tempo-rarily synchronize at reduced collective frequencies (falling in the 8–30 Hz range due to the delays) while theglobal system never fully synchronizes. This mechanism modulates the frequency of the oscillators on a slowtime-scale (b0.1 Hz) leading to structured amplitude fluctuations of band-pass filtered signals. Taken overall,our results reveal that the structured amplitude envelope fluctuations observed in resting-state MEG data mayoriginate from spontaneous synchronization mechanisms naturally occurring in the space-time structure ofthe brain.
© 2013 The Authors. Published by Elsevier Inc. All rights reserved.
Introduction
The biophysical mechanisms mediating spontaneous long-distancefunctional connectivity remain unclear. Typically, resting-state func-tional connectivity is evaluated using functional MRI from restingsubjects (rs-fMRI) (Biswal et al., 1995, 2010) and quantified bydetermining the brain areas that exhibit correlated BOLD (BloodOxygen-Level Dependent) signal fluctuations. A number of studiesin theoretical and computational neuroscience have developed
erms of the Creative Commons, which permits non-commer-rovided the original author and
rcelona, Spain.
lished by Elsevier Inc. All rights reser
whole-brain models of spontaneous activity to investigate the origin ofrs-fMRI functional connectivity and its relationship with the underlyingwhite-matter structural connectivity. In general, models consist in awhole-brain network, where the nodes represent brain areas in thespontaneous state and the links represent the (excitatory) connectionsbetween them. Links are typically scaled in proportion to the number ofwhite-matter fibers detected between areas, using the so-called struc-tural connectome (Hagmann et al., 2007). At the node level, the sponta-neous dynamics is represented using either neuralmassmodels (Honeyet al., 2007, 2009), mean field models (Cabral et al., 2011; Deco et al.,2009, 2013; Ghosh et al., 2008a, 2008b) or even realistic spiking/synap-tic models (Deco and Jirsa, 2012). An important common feature ofresting-state models is that the emergence of structured BOLD signalfluctuations is obtained when the model parameters are such that thesystem operates at the edge of a bifurcation. At this critical working
ved.
424 J. Cabral et al. / NeuroImage 90 (2014) 423–435
point, the global network dynamics reveals correlation patterns that arespatially shaped by the underlying anatomical structure, leading to anoptimal fit with the empirical BOLD functional connectivity. However,the relationship with the faster oscillatory rhythms typically observedwith electroencephalography (EEG) and magnetoencephalography(MEG) in the resting-state has only briefly been addressed in computa-tionalmodels (Cabral et al., 2011; Deco et al., 2009; Ghosh et al., 2008b).
From the experimental side, several studies have aimed to investi-gate the neurophysiological counterpart of resting-state BOLD signalfluctuations using simultaneous fMRI and intra-cranial recordings (Niret al., 2008; Shmuel and Leopold, 2008), simultaneous fMRI and EEG(de Munck et al., 2007; Difrancesco et al., 2008; Goldman et al., 2002;Laufs et al., 2003b; Mantini et al., 2007; Ritter et al., 2009) and, morerecently MEG (Brookes et al., 2011b; de Pasquale et al., 2010; Hippet al., 2012; Liu et al., 2010; Nikouline et al., 2001). Taken overall,results indicate that resting-state BOLD signal fluctuations are drivenby slow modulations in the power (or the amplitude) of brain oscilla-tions in a certain frequency range (note that the average power of anoscillation in a given time window is proportional to its squaredamplitude). However, different frequencies show distinct correlationbehaviors with BOLD signal fluctuations. On one side, intra-cranialrecordings report that the BOLD signal displays a positive correlationwith the firing rate and/or power of gamma-frequency oscillations(40–100 Hz) in the recording site. On the other side, studies usingsimultaneous recordings of EEG-fMRI point to an inverse correlationbetween the BOLD signal and the power of alpha (8–13 Hz) and beta(13–30 Hz) oscillations indicating that the so-called “idle rhythms”may be associated with deactivation and decreased metabolic rate.Moreover, recent MEG studies of resting-state activity have foundslow fluctuations in the power (or amplitude) of neural oscillationsthat correlate across distant brain areas, especially when considering8–30 Hz oscillations—the typical frequency range of alpha and betarhythms (Brookes et al., 2011b; de Pasquale et al., 2010; Hipp et al.,2012; Liu et al., 2010; Luckhoo et al., 2012; Nikouline et al., 2001).Notably, these amplitude modulations yield large-scale functionalnetworks that correspond quantitatively to the resting-state networksderived from rs-fMRI (Brookes et al., 2011b). In general, these reportsindicate that resting-state functional connectivity in BOLD responsescorresponds to a spatially structured amplitude modulation of neuraloscillations in the 8–30 Hz range. However, the mechanism at thegenesis of these structured frequency-specific amplitude fluctuationsremains unknown.
In the present work, we aim to investigate the source of structuredamplitude fluctuations observed in MEG signals at rest. We use awhole-brain network model of spontaneous activity, previously intro-duced in Cabral et al. (2011) to model spontaneous BOLD functionalconnectivity. The model consists in a variant of the Kuramoto modelof coupled oscillators adapted to incorporate the spatial and temporalcharacteristics of the structural connectome. In other words, thecoupling strength between each pair of oscillators is scaled by the num-ber of white-matter fibre tracts detected between the correspondingbrain areas and the time-delays are proportional to the structuraldistance between them (Cabral et al., 2011; Kuramoto, 1984; Yeungand Strogatz, 1999). In our previous research (Cabral et al., 2011), wefound that the optimal fit with resting-state BOLD functional connectiv-ity occurred for a critical range of model parameters where the systemexhibited slow spontaneous fluctuations in the synchrony degree ofsub-groups of brain areas (or clusters), leading to structured BOLDsignal fluctuations. Here, we hypothesize that these fluctuations in thesynchrony degree may alsomodulate the oscillators' frequency, leadingto frequency-specific amplitude fluctuations, making the link betweenfMRI and MEG expressions of resting-state activity. This hypothesis issupported by findings in the literature of the Kuramoto model showingthat the synchronization of coupled oscillatorswith time-delays inducesa suppression of the oscillators' natural frequency (Niebur et al., 1991).Although these findings refer to simpler network structures, they are
helpful to depict the synchronization phenomena occurring in complexcoupled systems like the brain (Breakspear et al., 2010).
Methods
MEG data collection and analysis
Ten normal healthy participants (3 males, 20–39 years old, mean27.9) underwent an eyes-closed resting-state MEG scan lasting 5 minon an Elekta Neuromag Vectorview system (Elekta Neuromag Oy,Helsinki, Finland). Data were collected on 102 magnetometers and102 pairs of orthogonal planar gradiometers at 1000 Hz sampling fre-quency. Head localizationwas achieved using four head position indica-tor (HPI) coils. The HPI coils were continuously energized throughoutthe scan but movement compensation was not performed — insteadthe initial head position was used for co-registration. Each subject'shead shape was recorded using a Polhemus Isotrack system. StructuralMRIs were gathered on a Siemens 3 T MR scanner with a resolution of1x1x1 mm.
Signal space separation (implemented using MaxFilter™) wasapplied to each data-set to reduce interference fromoutside the scannerhelmet (Taulu et al., 2005). The sensor space MEG data were de-noisedusing temporal independent component analysis (ICA) to remove cardi-ac, 50Hzmains and, in some subjects, eyemovement artifacts. TheMEGdata were then visually inspected and any channels with high varianceor obvious artifacts were excluded. Epochs of variable length thatcontained high variance and transient spikes in gamma power wereflagged as bad. Bad epochs were excluded from critical stages (such ascovariance estimation) but included in stages where data continuitywas required (such as the Hilbert transform).
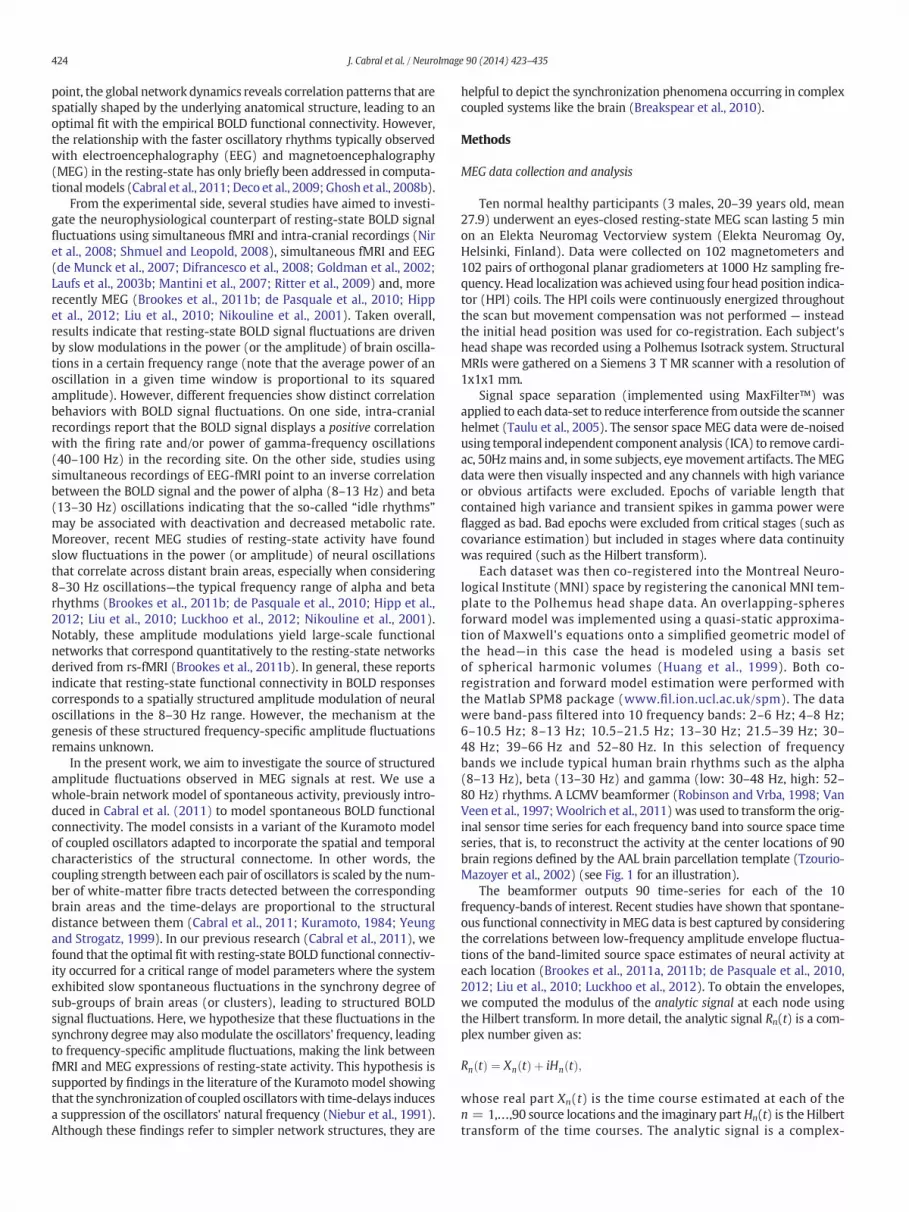
Each dataset was then co-registered into the Montreal Neuro-logical Institute (MNI) space by registering the canonical MNI tem-plate to the Polhemus head shape data. An overlapping-spheresforward model was implemented using a quasi-static approxima-tion of Maxwell's equations onto a simplified geometric model ofthe head—in this case the head is modeled using a basis setof spherical harmonic volumes (Huang et al., 1999). Both co-registration and forward model estimation were performed withthe Matlab SPM8 package (www.fil.ion.ucl.ac.uk/spm). The datawere band-pass filtered into 10 frequency bands: 2–6 Hz; 4–8 Hz;6–10.5 Hz; 8–13 Hz; 10.5–21.5 Hz; 13–30 Hz; 21.5–39 Hz; 30–48 Hz; 39–66 Hz and 52–80 Hz. In this selection of frequencybands we include typical human brain rhythms such as the alpha(8–13 Hz), beta (13–30 Hz) and gamma (low: 30–48 Hz, high: 52–80 Hz) rhythms. A LCMV beamformer (Robinson and Vrba, 1998; VanVeen et al., 1997;Woolrich et al., 2011) was used to transform the orig-inal sensor time series for each frequency band into source space timeseries, that is, to reconstruct the activity at the center locations of 90brain regions defined by the AAL brain parcellation template (Tzourio-Mazoyer et al., 2002) (see Fig. 1 for an illustration).
The beamformer outputs 90 time-series for each of the 10frequency-bands of interest. Recent studies have shown that spontane-ous functional connectivity in MEG data is best captured by consideringthe correlations between low-frequency amplitude envelope fluctua-tions of the band-limited source space estimates of neural activity ateach location (Brookes et al., 2011a, 2011b; de Pasquale et al., 2010,2012; Liu et al., 2010; Luckhoo et al., 2012). To obtain the envelopes,we computed the modulus of the analytic signal at each node usingthe Hilbert transform. In more detail, the analytic signal Rn(t) is a com-plex number given as:
Rn tð Þ ¼ Xn tð Þ þ iHn tð Þ;
whose real part Xn(t) is the time course estimated at each of then = 1,…,90 source locations and the imaginary part Hn(t) is the Hilberttransform of the time courses. The analytic signal is a complex-
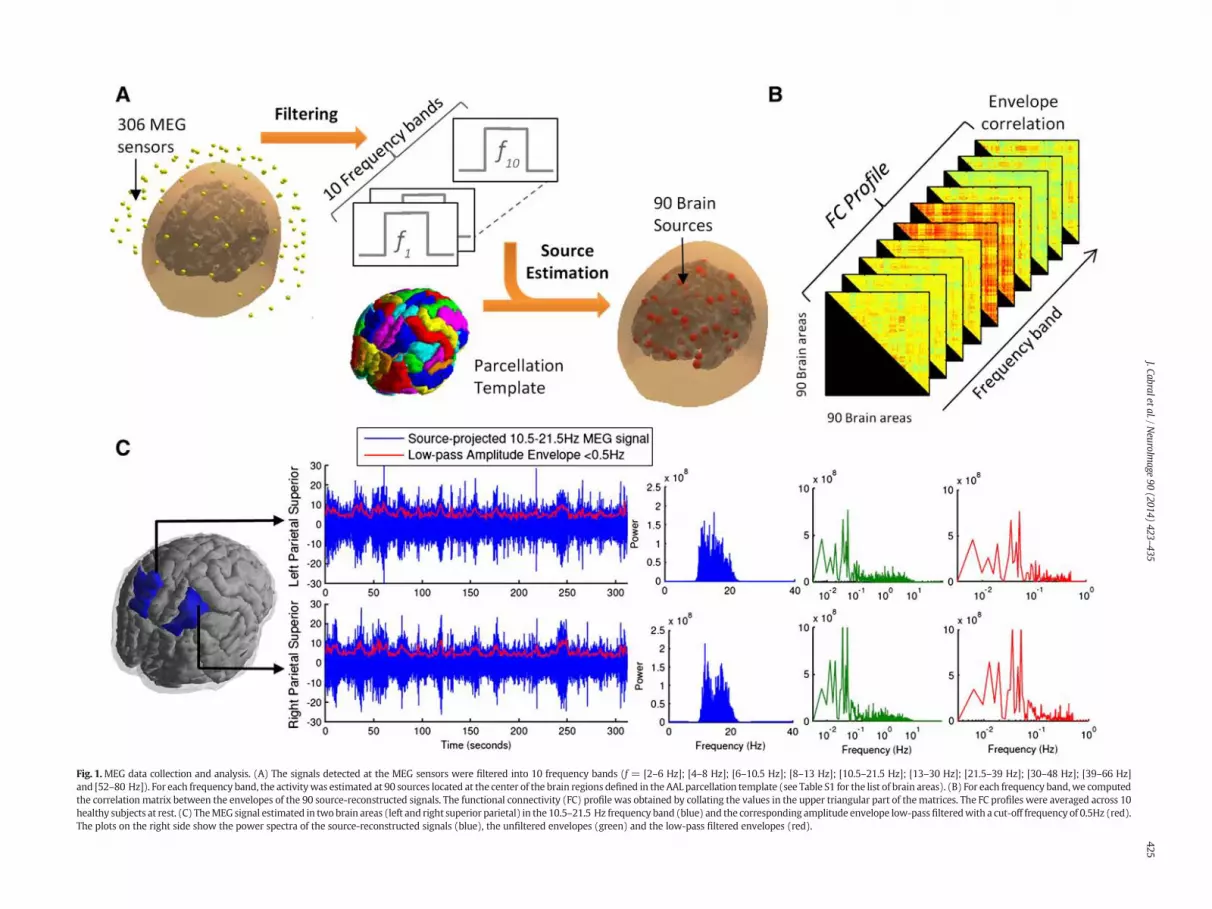
Fig. 1.MEG data collection and analysis. (A) The signals detected at the MEG sensors were filtered into 10 frequency bands (f = [2–6 Hz]; [4–8 Hz]; [6–10.5 Hz]; [8–13 Hz]; [10.5–21.5 Hz]; [13–30 Hz]; [21.5–39 Hz]; [30–48 Hz]; [39–66 Hz]and [52–80 Hz]). For each frequency band, the activitywas estimated at 90 sources located at the center of the brain regions defined in the AAL parcellation template (see Table S1 for the list of brain areas). (B) For each frequency band,we computedthe correlation matrix between the envelopes of the 90 source-reconstructed signals. The functional connectivity (FC) profile was obtained by collating the values in the upper triangular part of thematrices. The FC profiles were averaged across 10healthy subjects at rest. (C) TheMEG signal estimated in twobrain areas (left and right superior parietal) in the 10.5–21.5 Hz frequency band (blue) and the corresponding amplitude envelope low-passfilteredwith a cut-off frequency of 0.5Hz (red).The plots on the right side show the power spectra of the source-reconstructed signals (blue), the unfiltered envelopes (green) and the low-pass filtered envelopes (red).
425J.Cabraletal./N
euroImage
90(2014)
423–435
426 J. Cabral et al. / NeuroImage 90 (2014) 423–435
valued quantity that can be expressed in polar form using Euler'sformula as:
Rn tð Þ ¼ An tð Þeiψ tð Þ
where An(t) is the amplitude – or envelope – of the analytic signal andψn(t) is the phase of the analytic signal.
For each pair of AAL nodes, prior to envelope estimation, the nodetime courses were orthogonalized to remove all zero-lag correlations.This is because MEG functional connectivity between two regions hasa spurious contribution due to signal leakage between the two regions.This signal leakage is zero-lag and so is removed by orthogonalizing thetime series (Brookes et al., 2012; Hipp et al., 2012). Any subsequent cor-relationsmeasured in the envelopes of the orthogonalized nodes cannotbe due to signal leakage.
The low-frequency component of the envelope fluctuations havebeen found to be optimal for measuring spontaneous MEG functionalconnectivity (Brookes et al., 2011a, 2011b; Hipp et al., 2012; Liu et al.,2010; Luckhoo et al., 2012). As such, envelopes were low-pass filteredusing a cut-off frequency of 0.5Hz before estimating correlations. Asshown in Fig. 1C, we find that the envelope fluctuations are intrinsicallyslow, peaking below 0.1Hz, and therefore the main component of thesignal is maintained when low-pass filtering the envelopes below0.5Hz.
For each subject, we obtain a total of 10 frequency-specific zero-lagcorrected envelope correlation matrices, or functional connectivity(FC) matrices. The FC matrices were averaged across the 10 subjectsto give a single set of 10 FC matrices (shown in Fig. 3E).
Structural brain networks
The structural brain networks used in the model were estimatedfrom diffusion tensor imaging (DTI) data using a modified version ofalready published methods (Gong et al., 2009) (see Fig. 2). The datawas obtained from 21 healthy, normal participants (11males and 10 fe-males, age: 22–45 years) different from the 10 healthy subjects fromwhich MEG data was recorded. All scans were performed on the same
Fig. 2.The spatiotemporal structure of the brainnetwork. Interactions between brain areasare mediated by myelinated axonal fibers, which can be detected with tractography fromdiffusion tensor images. Since regions are spatially segregated and the transmission speedis finite, interactions are time-delayed. In our model, each node represents a brain area.Links are weighted in proportion to the number of white matter fibre tracts detectedand time delays are scaled by the distance between areas.
Philips Achieve 1.5 Tesla Magnet. Diffusion MRI was acquired by usinga single-shot echo planar imaging-based sequence with coverageof the whole brain with 33 optimal nonlinear diffusion gradient direc-tions (b = 1200 s/mm2) and 1 non-diffusion weighted volume(b = 0), repetition time (TR) = 9390 ms; echo time (TE) = 65 ms.Twelve healthy participants used a reconstructed matrix of 128 × 128and reconstructed voxel size 2.5 × 2.5 × 2.5 mm3. Nine healthy partic-ipants used a reconstructed matrix of 176 × 176 and reconstructedvoxel size of 1.8 × 1.8 × 2 mm3. We also acquired T1-weightedstructural images with a three-dimensional ‘FLASH’ sequence(TR = 12 ms, TE = 5.6 ms, flip angle = 19°, with elliptical samplingof k-space, giving a voxel size of 1 × 1 × 1 mm in 5.05 min).
The AAL template was used to parcellate the brain into 90 regions(45 for each hemisphere) to define the network nodes. For each partic-ipant, parcellationwas conducted in the diffusion-MRI native space. Theb0 image in diffusion-MRI space was linearly co-registered to theT1-weighted structural image using the Flirt tool (FMRIB, Oxford)(Jenkinson et al., 2002). The transformed T1-weighted image was thenmapped to the T1 template of ICBM152 in MNI space (Collins et al.,1994), inversed and further applied to warp the AAL mask from MNIspace to the diffusion-MRI native space. Interpolation using nearest-neighbor method ensured the preservation of labeling values.
The links between nodes were weighted in proportion to the num-ber of whitematter tracts detected between brain areas. The processingof the diffusion-MRI data was performed using the Fdt toolbox inFSL (www.fmrib.ox.ac.uk/fsl, FMRIB). Pre-processing involved the co-registration of the diffusion-weighted images to a reference volumeusing an affine transformation for the correction of head motion aswell as eddy current induced image distortion. Subsequently, the localprobability distribution of fiber direction at each voxel was estimated(Behrens et al., 2003). We then used the probtrackx algorithm allowingfor automatic estimation of two fiber directions within each voxel,which can significantly improve the tracking sensitivity of non-dominant fibre populations in the human brain (Behrens et al., 2007).
For each voxel in the brain, we applied probabilistic tractography tosample 5000 streamline fibers passing through that voxel. The connec-tivity probability from voxel i to another voxel jwas defined by the pro-portion of fibers passing through voxel i that reach voxel j (Behrenset al., 2007). This was then extended from the voxel level to the regionlevel. The connectivity Cnp from region n to region p is calculated as thenumber of fibers passing through any voxel in region n that connect toany voxel in region p, divided by 5000*N, where N is the number ofvoxels in region n. For each brain region, the connectivity to each ofthe other 89 regions was calculated. Since the connectivity from n to pis not necessarily equal to that from p to n but highly correlated for allsubjects (the least Pearson r = 0.70, p b 10−50), we defined theundirectional connectivity Cnp between regions n and p by averagingthe two. We implemented the calculation of regional connectivityusing in-house Perl scripts.
Model of coupled oscillators with time-delays
To explore the spontaneous behavior of coupled brain areas, weused a variant of the original Kuramoto model, which describes thedynamics of coupled oscillators systems (Acebron et al., 2005; Kuramoto,1984). Different variants of the Kuramotomodel have been used to sim-ulate synchronization phenomena in biological systems (Pikovsky et al.,2001; Strogatz, 2003) and, more recently, neural dynamics (Breakspearet al., 2010; Cabral et al., 2011; Kitzbichler et al., 2009; Yan and Li, 2013).Reducing the dynamics of a brain region to a phase-oscillator involves ahigh degree of abstraction. This approach is supported by a number ofexperimental and theoretical studies showing that neural activity atthe population level usually exhibits oscillations with a moderate levelof synchrony, in particular in the gamma frequency range (30–80 Hz)(Bartos et al., 2007; Borgers and Kopell, 2003; Brunel, 2000; Bruneland Wang, 2003). Such self-sustained oscillations are due to a balance

427J. Cabral et al. / NeuroImage 90 (2014) 423–435
in the firing rates of excitatory and inhibitory neurons in a neural pop-ulation. In this framework, the firing rates describe a closed periodic tra-jectory in phase space—called a limit cycle, and the dynamics can beapproximated by a single dynamical variable, which is the angle – orphase – on this cycle. Therefore, the resulting node model is a phase-oscillator and the whole system is a network of coupled phase-oscillators.
A crucial step toward neurobiological plausibility of themodel is theintroduction of time delays between coupled brain regions. Time delaysarise from finite axonal transmission times, which depend on the inter-areal distance and on themyelination level of the fibre tracts, as well asfrom synaptic and dendritic time constants. Time delays are known toaffect the dynamics of coupled oscillators, especially when they are inthe same order of magnitude as the oscillation period (Baldi and Atiya,1994; Dhamala et al., 2004; Ghosh et al., 2008a; Jirsa, 2009; Knocket al., 2009). For this reason, it is important to consider time-delays inlarge-scale brainmodels where the local nodes display – either dampedor self-sustained – oscillations (Cabral et al., 2011; Deco et al., 2009;Ghosh et al., 2008b).
The influence that one node exerts on another is written as a sinefunction of the delayed phase difference between the two oscillators(Yeung and Strogatz, 1999). Denoting by θn(t) the phase of node n attime t, it then obeys the following dynamical equation:
dθndt
¼ ω þ kXN
p¼1
Cnp sin θp t−τnp� �
−θn tð Þ� �
;n ¼ 1;…;N
This equation differs from the classic Kuramoto model in that thenatural frequency is identical for all oscillators ωn = ω, ∀n ∈ N, thecoupling is heterogeneous and the phase relationships are time-delayed. The natural frequency was assumed to be ω = 2π × 40Hz,the same frequency displayed by the Wilson–Cowan units used in thenetwork model of Deco et al. (2009). Note that a distribution of naturalfrequencies does not alter the results of this work (see Figure S2). Cnp isthe coupling strength from node p to node n, which is proportional tothe number of fibre tracts detected between the two nodes (seeSection 2.3) and normalized so that C ¼ 1. k is the global couplingweight that uniformly scales all connection weights. The delay τnp =Dnp/v is proportional to the Euclidean distance Dnp between the centersof gravity of the AAL brain areas and to the conduction velocity v inmyelinated fibers (which, again for simplicity, we assumed to be homo-geneous (Deco et al., 2009; Ghosh et al., 2008a)). Since the couplingweights Cnp and the distances Dnp between nodes are fixed, the onlytwo free parameters in the model are the global coupling weight kand the conduction velocity v. By increasing or decreasing v, the delaysbecome shorter or longer, shifting the mean of the delay distribution τ.To get a better insight on the effect of delays in the system, we per-formed simulations as a function of the mean of the delay distribu-tion, τ - which is equivalent to varying v since the distances betweennodes are fixed.
The system ofN coupled delay differential equationswas numerical-ly integrated using an Euler scheme (with a sufficiently small time-stepofΔt = 0.1ms). Note that no noisewas added to the system, and there-fore the simulated signals are deterministic. The only randomness intro-duced in the systemwas on the phases at t = 0 (initialized randomly ineach simulation). Note that the main results of the model are indepen-dent of the initial conditions (data not shown). To define the initialhistory (necessary due to the delays), phaseswere estimated for a suffi-ciently large initial period in a non-interacting way. Simulations wererun for 300 s for a range of parameters k and τ, removing the first 20sof simulations to discard the transient dynamics. The neural activityrn(t) at each of the 90 brain regions oscillates around a fixed value,and these oscillations are given by a periodic function f of the phase ateach node n, rn(t) = f(θn(t)). Following the assumption made inCabral et al. (2011), we used the sine function to transform the phases
into neural activity rn(t) = r0 sin(θn(t)) and considered a constant am-plitude r0 = 1.
For each set of parameters k and τ, the simulated neural activity wascompared with empirical data (see Section 2.5). Selecting the set ofparameters k and τ that provided the best fit with experimental data,the model was rerun for 1200 s (20 minutes). All calculations wereperformed using a commercial software package (MATLAB 7.12, TheMathWorks Inc., Natick, MA, 2011).
At the global level, the network synchrony was evaluated by theorder parameter R(t) defined by:
R tð ÞeiΦ tð Þ ¼ 1N
XNn¼1
eiθn tð Þ;
where R(t)measures phase uniformity, varying between 1 for a fully syn-chronized state and 0 for a fully incoherent state.Φ(t) describes the phaseof the global ensemble. To characterize the system's synchronization be-havior in the parameter space of k and τ, we estimated the mean syn-chrony level, R, and the standard deviation, σR, which captures howthe synchrony degree fluctuates in time. Fluctuations in the synchro-ny degree have been associated with the existence of metastable syn-chronized states and therefore σR is indicative of the system'smetastability level (Shanahan, 2010; Wildie and Shanahan, 2012).
The simulated time-series rn(t) were band-pass filtered into thesame 10 frequency bands used to filter the MEG data. Subsequently,the amplitude envelopes were estimated via the Hilbert transform asthe modulus of the analytic signals. These envelopes were low-passfiltered with a cut-off frequency at 0.5Hz as in the real MEG data. TheFC matrices were obtained by computing the envelope correlationmatrices (unlike the realMEG data, there is no signal leakage in the sim-ulations and therefore the simulated signals were not orthogonalized).
Comparison between experimental data and numerical simulation
The values on the upper triangular part of the FCmatrices (see Fig. 1B)were collated over the 10 frequency bands to obtain a vector (with10*N*(N-1)/2 values) representing the FC profile (since the matrices aresymmetric, in this way we ensure to consider only unique entries andexclude the diagonal values). The FC profile was estimated in the sameway from the real MEG FC matrices and the simulated FC matrices. Themodel's performancewas evaluated by computing the Pearson's correla-tion coefficient (ρ) between the real MEG FC profile and the simulatedFC profile obtained for each set of parameters k and τ.
Results
Frequency-specific envelope functional connectivity
The FC profiles obtained from simulations were compared withthe real MEG FC profile for a range of model parameters. As can beobserved in Fig. 3A, the fit between real and simulated FC profiles (seeSection 2.4) is sensitive to the global coupling weight k and the meanof the delay distribution τ. The model shows the best agreement withexperimental data for a limited range of global parameters (area indi-cated within dashed ellipse) reaching correlations up to ρ = 0.41between empirical and simulated FC profiles, which is noteworthygiven the high level of abstraction and simplicity of the model. Thesynchronization behavior of the system is shown for the same rangeof parameters in Fig. 3B–C. In the range of best agreement with empir-ical MEG data, the average synchrony degree of the system is moderate(0.3 bR b 0.4), indicating that it is neither fully synchronized (R closeto 1), neither incoherent (R close to 0). Importantly, in this range ofparameters the synchrony degree exhibits fluctuations over time(0.1 b σR b 0.2). Moreover, as shown in Fig. 3D, the envelopes of8-30Hz oscillations display high fluctuations in this region of parame-ters (In Section 3.2 we investigate the origin of these fluctuations).
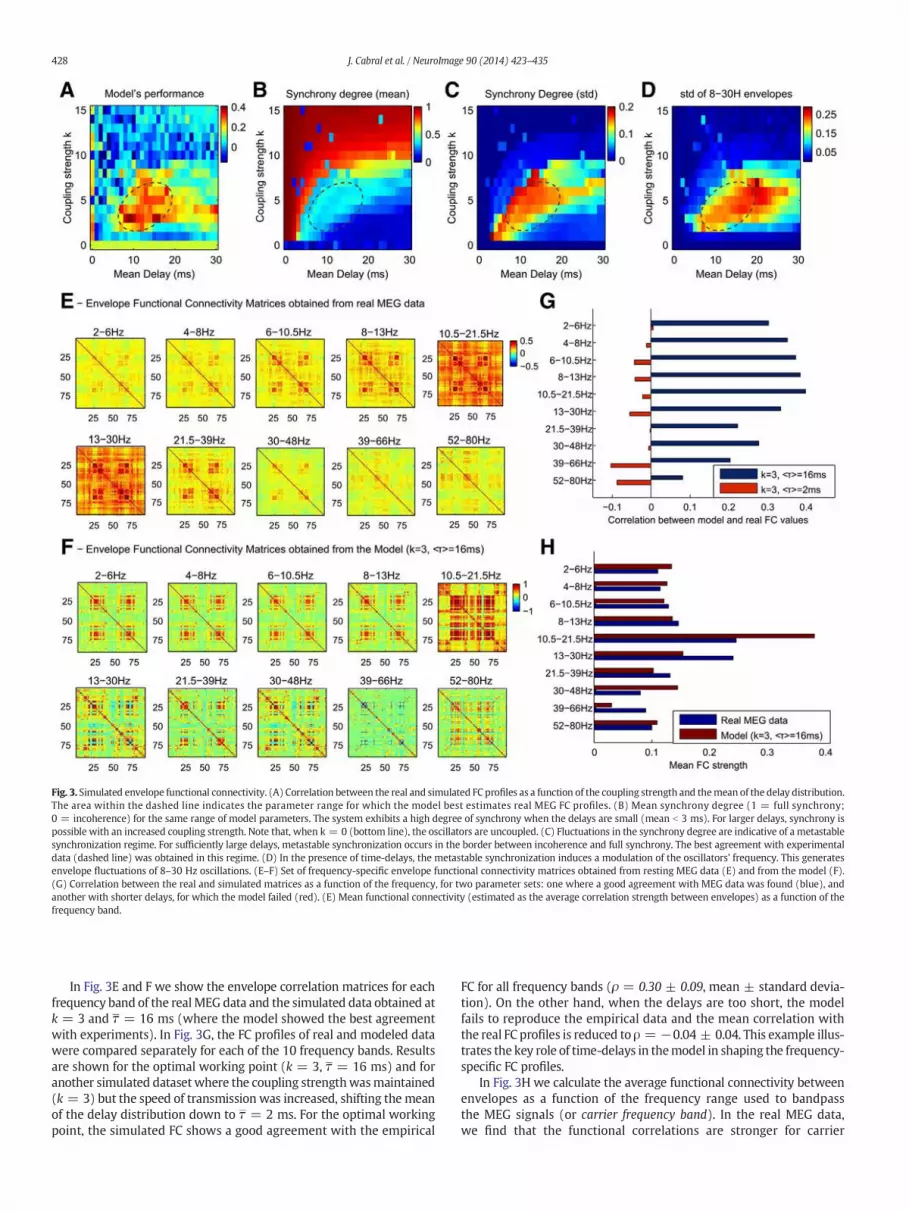
Fig. 3. Simulated envelope functional connectivity. (A) Correlation between the real and simulated FC profiles as a function of the coupling strength and themean of the delay distribution.The area within the dashed line indicates the parameter range for which the model best estimates real MEG FC profiles. (B) Mean synchrony degree (1 = full synchrony;0 = incoherence) for the same range of model parameters. The system exhibits a high degree of synchrony when the delays are small (mean b 3 ms). For larger delays, synchrony ispossible with an increased coupling strength. Note that, when k = 0 (bottom line), the oscillators are uncoupled. (C) Fluctuations in the synchrony degree are indicative of a metastablesynchronization regime. For sufficiently large delays, metastable synchronization occurs in the border between incoherence and full synchrony. The best agreement with experimentaldata (dashed line) was obtained in this regime. (D) In the presence of time-delays, the metastable synchronization induces a modulation of the oscillators' frequency. This generatesenvelope fluctuations of 8–30 Hz oscillations. (E–F) Set of frequency-specific envelope functional connectivity matrices obtained from resting MEG data (E) and from the model (F).(G) Correlation between the real and simulated matrices as a function of the frequency, for two parameter sets: one where a good agreement with MEG data was found (blue), andanother with shorter delays, for which the model failed (red). (E) Mean functional connectivity (estimated as the average correlation strength between envelopes) as a function of thefrequency band.
428 J. Cabral et al. / NeuroImage 90 (2014) 423–435
In Fig. 3E and F we show the envelope correlation matrices for eachfrequency band of the realMEG data and the simulated data obtained atk = 3 and τ = 16 ms (where the model showed the best agreementwith experiments). In Fig. 3G, the FC profiles of real and modeled datawere compared separately for each of the 10 frequency bands. Resultsare shown for the optimal working point (k = 3, τ = 16 ms) and foranother simulated datasetwhere the coupling strengthwasmaintained(k = 3) but the speed of transmission was increased, shifting the meanof the delay distribution down to τ = 2 ms. For the optimal workingpoint, the simulated FC shows a good agreement with the empirical
FC for all frequency bands (ρ = 0.30 ± 0.09, mean ± standard devia-tion). On the other hand, when the delays are too short, the modelfails to reproduce the empirical data and the mean correlation withthe real FC profiles is reduced to ρ = −0.04 ± 0.04. This example illus-trates the key role of time-delays in themodel in shaping the frequency-specific FC profiles.
In Fig. 3H we calculate the average functional connectivity betweenenvelopes as a function of the frequency range used to bandpassthe MEG signals (or carrier frequency band). In the real MEG data,we find that the functional correlations are stronger for carrier

429J. Cabral et al. / NeuroImage 90 (2014) 423–435
frequency bands in the 8-30Hz range (the typical range of alpha- andbeta-frequency oscillations), peaking for the 10.5–21.5 Hz band, cor-roborating previous resting-state MEG studies reporting frequency-dependent functional connectivity during rest with a peak in the low-beta frequency range (Brookes et al., 2011a, 2011b; de Pasquale et al.,2010, 2012; Hipp et al., 2012; Luckhoo et al., 2012). Subsequently, thesame analysis was performed on the simulated data obtained at the op-timal working point. The plot show that the data obtained with themodel exhibits a frequency-specificity similar to the one observed ex-perimentally, displaying stronger FC in the envelopes of 10.5–21.5 Hzoscillations, a frequency much slower than the natural frequency ofthe oscillators (f = 40Hz). These correlated amplitude fluctuations ofoscillations slower than the natural frequency occur due to the delayedphase interactions occurring in the space-time structure of the network(see Section 3.2).
To explore howwell themodel estimates the FC at the regional level,we computed the correlation between the envelopes of a given region(the seed) with all other brain areas, for different frequency bands.The resulting correlation patterns can be interpreted as seed-basedfunctional connectivity maps. The anatomical connectivity and theempirical and simulated functional connectivity at 3 frequency bands(8 to 13 Hz, 10.5 to 21.5 Hz and 39 to 66 Hz) is reported in Fig. 4 fortwo seeds: the left Superior Parietal and the left Superior Motor Area(in Fig. S1 we show examples with other seeds and frequencies). Weobserve that structurally connected brain areas are likely to be function-ally connected. However, the opposite is not true, andmany brain areasappear functionally connected although nowhite-matter tract has beendetected between. However, despite the missing structural links, wefind that the model is able to reproduce some long-distance inter-hemispheric functional connections that are notmediated by any directstructural link, possibly mediated by intermediate connections.
Origin of envelope correlations
In the model, structured envelopes of band-pass filtered signalssimilar to the ones observed in real MEG data emerge spontaneouslyfrom time-delayed network interactions between gamma-band oscilla-tors. However, how these structured envelopes are generated is notstraightforward. Themain advantage of using a simplemodel of coupledoscillators with respect tomore realisticmodels is that the synchroniza-tion phenomena occurring in the system can be analyzed in the lightof the existing literature on coupled oscillators. Although the net-works addressed in analytic studies are far less complex thanthe brain network, they allow for a depiction of the physical mecha-nisms at the genesis of the envelope fluctuations observed in themodel.
As shown in Fig. 3B–D, the envelopes of 8–30Hz oscillations exhibitfluctuations for a range of parameters that fall in the critical boundarybetween incoherence and synchrony. In this border regime, thesynchrony degree fluctuates in time (Fig. 3C). Wildie and Shanahan(2012) have shown that such fluctuations in the synchrony degreeare due to a metastable synchronization regime, where a number of“chimera” states – characterized by coexistent synchronized anddesynchronized subsystems – are formed. In other words, intermittentsynchronization occurs between subsets of nodes, forming metastablecoalitions. However, how this metastable regime generates oscillationsdifferent from the natural frequency of the oscillators (40 Hz) remainsunanswered. To understand this phenomenon, one needs to considerthe work from Niebur et al. (1991), who analyzed the synchronizationfrequency of coupled oscillators with time-delayed nearest-neighborcoupling. They report that “even small delay times lead to a novelform of frequency depression where the system decays to stable stateswhich oscillate at a delay and interaction-dependent reduced collectivefrequency” (Niebur et al., 1991). Combining this finding with themeta-stable regime described before, one can hypothesize that when oscilla-tors are in ametastable synchronized state, their oscillation frequency is
temporarily slowed down. In this way, a system of coupled oscillatorswith time-delays in the metastable regime may display spontaneousfrequency modulation.
In Fig. 5A, the simulated signal rn(t) = sin(θn(t)) is plotted for 2seeds: the left and right superior parietal areas. The signals are uncorre-lated (ρ = 0.06) and have constant amplitude (i.e.−1 ≤ sin(x) ≤ 1). Ifthe signals are modulated in frequency due to metastable synchroniza-tion (as hypothesized) then, when the signals are band-pass filtered inthe range of the reduced collective frequency, they should exhibitcorrelated amplitude fluctuations. Fig. 5B shows the simulated signalsband-pass filtered in two frequency bands: 10.5-21.5Hz (the frequencyat which higher envelope functional connectivity was observed in bothreal and simulated data) and 30-48Hz (which includes the naturalfrequency of the oscillators in the model f = 40Hz). The band-passedsignals, unlike the unfiltered signals, display amplitude fluctuations.Importantly, the envelopes at 10.5-21.5Hz are highly correlated(ρ = 0.79) between the two nodes, indicating that the two nodesbelong to a subsystem whose reduced collective frequency is in thisfrequency range. On the other hand, the envelopes in the 30-48Hzrange are uncorrelated (ρ = 0.03). Observing the envelope of the signalin the 10.5-21.5Hz range on a larger temporal window (Fig. 5C left), itcan be seen that it fluctuates on a very slow time scale, with a peakbelow 0.1Hz (Fig. 5C right). This time-scale of envelope fluctuations isin the same range as the one found in the real MEG data (as shown inFig. 1C).
To investigate the origin of the envelope fluctuations of the band-pass filtered signals, we plot the spectrogram – i.e. frequency versustime - of the unfiltered simulated signal in the same brain area(Fig. 5D). In this plot, temporary increases in the power around 16Hzcan be observed, lasting sometimes for several seconds. For eachtime window and for each frequency bin, the power P is given by P =(A2)/2, where A is the amplitude of the signal. As such, when the signalis band-pass filtered around 16Hz, it displays amplitude fluctuationsthat directly express the power fluctuations around 16Hz observedin the spectrogram. Furthermore, and corroborating our previoushypothesis, those increases in the power around 16Hz appear directlyassociated with periods of increased synchronization in the system(Fig. 5E). Indeed, the synchrony degree of the system (estimated usingthe Kuramoto order parameter) is strongly correlated with the enve-lopes of 10.5-21.5Hz oscillations (ρ = 0.53 and ρ = 0.48 for the leftand right superior parietal). Notably, if only the slow part (b0.5Hz) ofthe envelopes (and order parameter) is considered, the correlationsare further increased (ρ = 0.95 and ρ = 0.92 for the left and rightsuperior parietal). These results demonstrate that the envelope fluctua-tions of band-pass filtered signals observed in the model are caused byslow fluctuations in the synchrony degree due to the spontaneous for-mation and dissolution of metastable chimera states. This mechanismleads to spatially structured frequency specific power fluctuations,which, according to our model results, fairly reproduce spontaneousMEG functional connectivity.
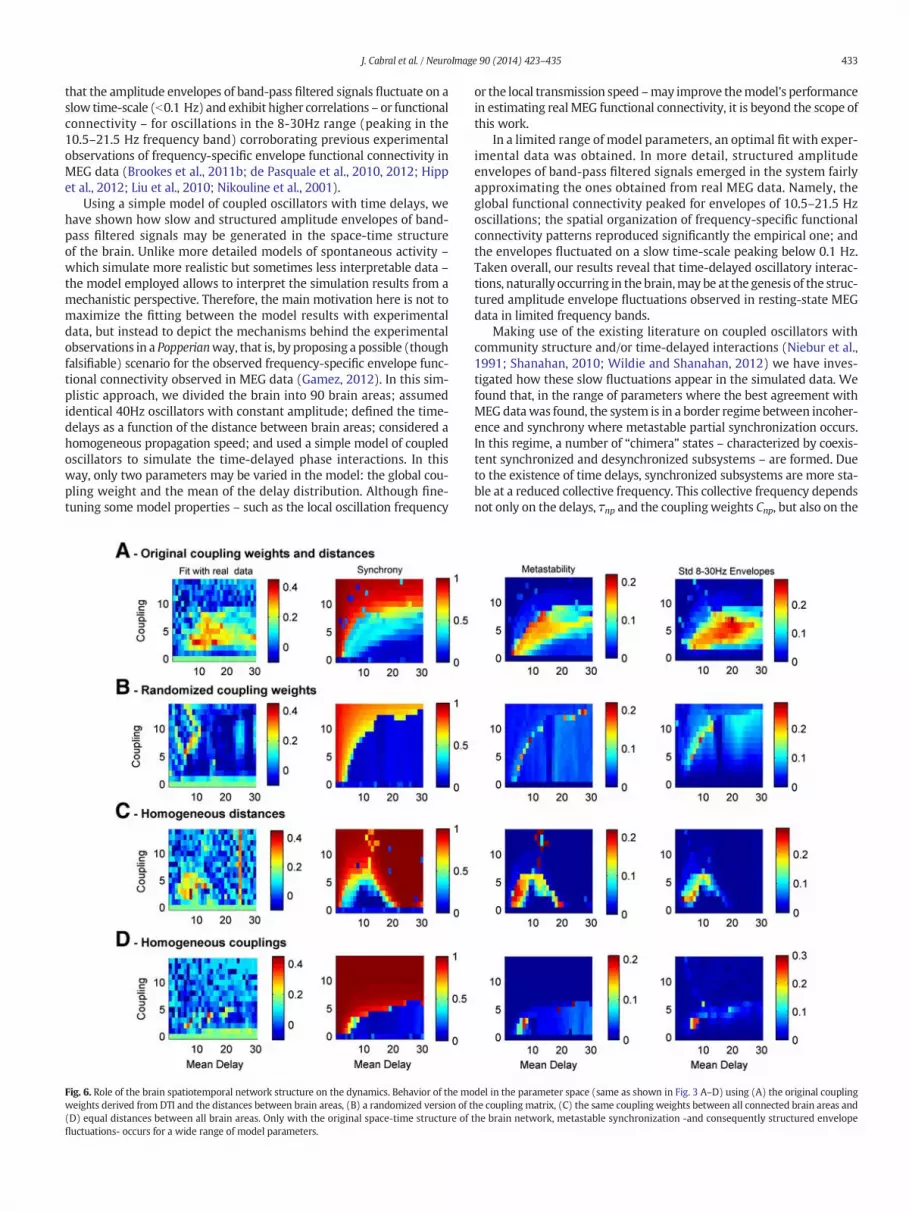
To investigate how much of the brain's space-time structure isresponsible for the observed phenomena, we reran themodel chang-ing different features of the coupling matrix and the distance matrix(Fig. 6). In particular we tested the model using a randomized cou-pling matrix with conserved degree distribution and connectedness(Maslov and Sneppen, 2002; Rubinov and Sporns, 2010), homoge-neous couplingweights (Cnp = 1, ∀Cnp N 0) or homogeneous distancesDnp ¼ D;∀n;p∀N� �
. Randomizing the connectivity matrix (but keepingexactly the same coupling weights and the same distances) not onlydestroys the fit with the empirical functional connectivity but alsoleads to a total disruption of the metastable dynamics. This indicatesthat the connection topology, i.e. the way brain areas are connected toeach other in a non-randomway, is a key ingredient to obtain metasta-ble chimera states in systems of delayed coupled oscillators (Wildie andShanahan, 2012). Furthermore, we found that the use of homogeneouscoupling weights or homogeneous delays significantly reduces the
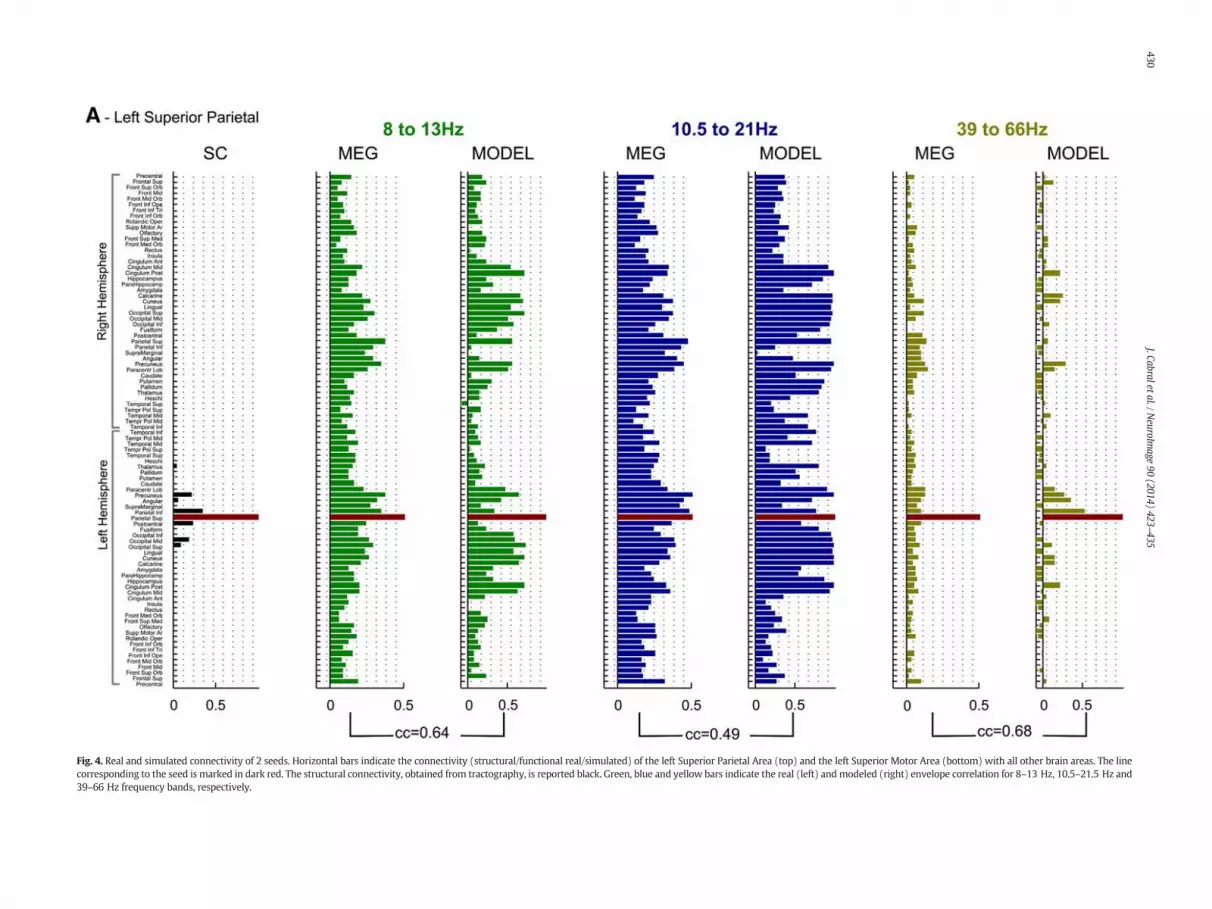
Fig. 4. Real and simulated connectivity of 2 seeds. Horizontal bars indicate the connectivity (structural/functional real/simulated) of the left Superior Parietal Area (top) and the left Superior Motor Area (bottom) with all other brain areas. The linecorresponding to the seed is marked in dark red. The structural connectivity, obtained from tractography, is reported black. Green, blue and yellow bars indicate the real (left) andmodeled (right) envelope correlation for 8–13 Hz, 10.5–21.5 Hz and39–66 Hz frequency bands, respectively.
430J.Cabraletal./N
euroImage
90(2014)
423–435
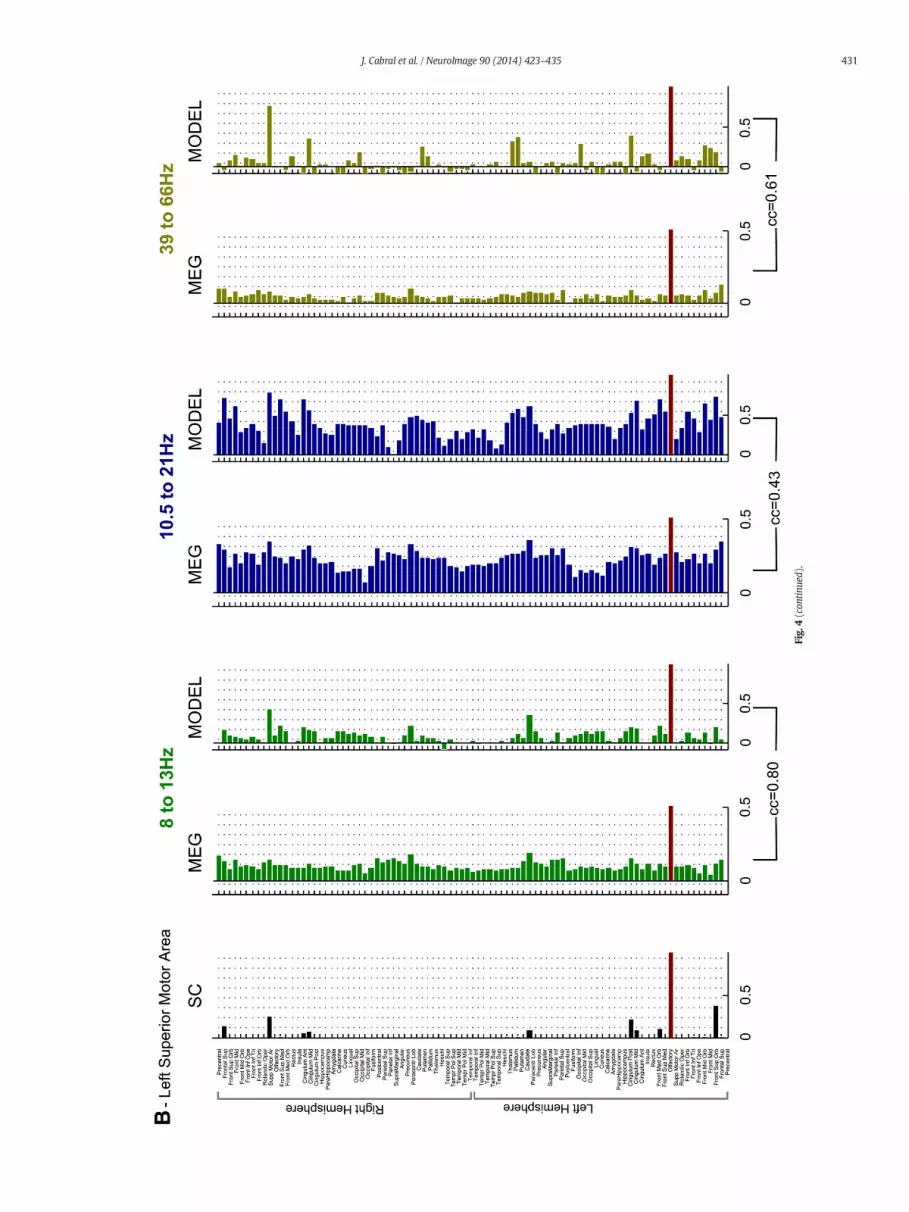
Fig.
4(con
tinue
d).
431J. Cabral et al. / NeuroImage 90 (2014) 423–435

Fig. 5. Slow and structured envelope fluctuations emerge frommetastable synchronization regime. (A) Simulated signal rn(t) = sin(θn(t)) in the left and right Superior Parietal areas. Thetwo signals are uncorrelated (ρ = 0.06 for a 1200 s simulation period). (B) Same signals bandpass filtered in 2 frequency bands: 10.5 to 21.5 Hz and 30 to 48 Hz. The signals band-passedat 10.5–21.5 Hz display correlated envelopes (ρ = 0.79), whereas the envelopes of the signals band-passed at 30–48 Hz are uncorrelated (ρ = 0.03). As in (A), correlationswere estimat-ed for the whole simulation period. (C) (Left) Simulated signal on the Left Superior Parietal Area band-pass filtered between 10.5 and 21.5 Hz (same as in B-top-left, but for a longer timewindow). The amplitude envelope fluctuates on a very slow time scale. (Middle) Power spectrum of the band-pass filtered signal, with a peak at 16Hz. (Right) Power spectrum of the(unfiltered) amplitude envelope, showing a peak below 0.1 Hz. (D) Spectrogram showing the instantaneous frequency of the (unfiltered) simulated signal rn(t) = sin(θn(t)) on theleft Superior Parietal Area (left) and the corresponding time averaged power spectral density function (right). Although most of the power is contained in the 25–50 Hz range, we findintermittent increases in the power around 16 Hz, indicating that oscillations in that frequency range may emerge for periods of several seconds and then disappear. These intermittentincreases in the power are intrinsically related to the amplitude fluctuations of band-pass filtered signals observed in (C). (E) Synchrony degree of the system estimated using theKuramoto order parameter. Due to the metastable synchronization regime, periods of higher synchrony (lasting for several seconds) alternate with periods of lower synchrony. The syn-chrony degree is strongly correlated with the envelope of 10.5–21.5 Hz oscillations (ρ = 0.53) showing that the modulation in the power (and amplitude) of band-pass filtered oscilla-tions is due to themetastable synchronization regime. Moreover, if only the slow part (b0.5 Hz) of the envelope (and order parameter) is considered, the correlation is higher (ρ = 0.95),indicating that the emergence of reduced collective frequencies occurs only when the synchronization is sufficiently long.
432 J. Cabral et al. / NeuroImage 90 (2014) 423–435
range of parameters where a metastable regime is obtained. These re-sults show that the space–time structure of couplings and delays inthe human brain provides an optimal network structure to support a ro-bust metastable dynamics in which different subsystems may tempo-rarily synchronize, while the global system never fully synchronizes.
Discussion
In this study, we have combined experimental and theoretical workto investigate the mechanisms of spontaneous MEG functional connec-tivity. From the MEG data of 10 healthy participants at rest we found
433J. Cabral et al. / NeuroImage 90 (2014) 423–435
that the amplitude envelopes of band-pass filtered signals fluctuate on aslow time-scale (b0.1 Hz) and exhibit higher correlations – or functionalconnectivity – for oscillations in the 8-30Hz range (peaking in the10.5–21.5 Hz frequency band) corroborating previous experimentalobservations of frequency-specific envelope functional connectivity inMEG data (Brookes et al., 2011b; de Pasquale et al., 2010, 2012; Hippet al., 2012; Liu et al., 2010; Nikouline et al., 2001).
Using a simple model of coupled oscillators with time delays, wehave shown how slow and structured amplitude envelopes of band-pass filtered signals may be generated in the space-time structureof the brain. Unlike more detailed models of spontaneous activity –
which simulate more realistic but sometimes less interpretable data –
the model employed allows to interpret the simulation results from amechanistic perspective. Therefore, the main motivation here is not tomaximize the fitting between the model results with experimentaldata, but instead to depict the mechanisms behind the experimentalobservations in a Popperianway, that is, by proposing a possible (thoughfalsifiable) scenario for the observed frequency-specific envelope func-tional connectivity observed in MEG data (Gamez, 2012). In this sim-plistic approach, we divided the brain into 90 brain areas; assumedidentical 40Hz oscillators with constant amplitude; defined the time-delays as a function of the distance between brain areas; considered ahomogeneous propagation speed; and used a simple model of coupledoscillators to simulate the time-delayed phase interactions. In thisway, only two parameters may be varied in the model: the global cou-pling weight and the mean of the delay distribution. Although fine-tuning some model properties – such as the local oscillation frequency
Fig. 6. Role of the brain spatiotemporal network structure on the dynamics. Behavior of the moweights derived from DTI and the distances between brain areas, (B) a randomized version of t(D) equal distances between all brain areas. Only with the original space-time structure offluctuations- occurs for a wide range of model parameters.
or the local transmission speed –may improve themodel's performancein estimating real MEG functional connectivity, it is beyond the scope ofthis work.
In a limited range of model parameters, an optimal fit with exper-imental data was obtained. In more detail, structured amplitudeenvelopes of band-pass filtered signals emerged in the system fairlyapproximating the ones obtained from real MEG data. Namely, theglobal functional connectivity peaked for envelopes of 10.5–21.5 Hzoscillations; the spatial organization of frequency-specific functionalconnectivity patterns reproduced significantly the empirical one; andthe envelopes fluctuated on a slow time-scale peaking below 0.1 Hz.Taken overall, our results reveal that time-delayed oscillatory interac-tions, naturally occurring in the brain,may be at the genesis of the struc-tured amplitude envelope fluctuations observed in resting-state MEGdata in limited frequency bands.
Making use of the existing literature on coupled oscillators withcommunity structure and/or time-delayed interactions (Niebur et al.,1991; Shanahan, 2010; Wildie and Shanahan, 2012) we have inves-tigated how these slow fluctuations appear in the simulated data. Wefound that, in the range of parameters where the best agreement withMEG datawas found, the system is in a border regime between incoher-ence and synchrony where metastable partial synchronization occurs.In this regime, a number of “chimera” states – characterized by coexis-tent synchronized and desynchronized subsystems – are formed. Dueto the existence of time delays, synchronized subsystems are more sta-ble at a reduced collective frequency. This collective frequency dependsnot only on the delays, τnp and the couplingweights Cnp, but also on the
del in the parameter space (same as shown in Fig. 3 A–D) using (A) the original couplinghe coupling matrix, (C) the same coupling weights between all connected brain areas andthe brain network, metastable synchronization -and consequently structured envelope

434 J. Cabral et al. / NeuroImage 90 (2014) 423–435
natural frequency of the oscillators (ωn) and the number of nodes in thesubsystem. Therefore, multiple, more or less stable, collective frequen-cies may emerge spontaneously in the system, due to the natural het-erogeneity of couplings, delays and natural frequencies in the brain.Due to the characteristics of the model, the frequency modulation isexpressed only in the phase of the oscillators while the amplitude iskept constant. The detection of a group of nodes that temporallysynchronize together at a given collective frequency can be achievedby band-pass filtering the signals from all nodes around the collectivefrequency, and identifying the ones that display correlated amplitudefluctuations. Notably, it corresponds to the samemethod used in exper-imental studies to estimate spontaneous functional connectivity anddetect resting-state functional networks from MEG data. Although themodel fairly reproduces the large-scale frequency-specific correlationstructure of spontaneous MEG data, it is important to note that thespontaneous oscillatory activity obtained from encephalographicrecordings appears to displaymore than just changes in phase. Incorpo-rating amplitude changes in the local node model may influencethe connectivity between phases and affect its dynamical behavior(Daffertshofer and van Wijk, 2011). Therefore, it is important to inves-tigate to what extent the mechanisms proposed herein contribute tothe complex dynamics observed in real data using more realisticneural-mass models.
This work proposes a novel generative model for spontaneous brainrhythms, intrinsically shaped by the large-scale space-time structure ofthe neuroanatomical network. In this scenario, the spontaneous alphaand beta oscillations observed in the brain at rest (the so-called “idlerhythms”) would be generated by the temporary large-scale synchroni-zation of certain brain areas at their lowest stable collective frequency(falling in the alpha and beta frequency bands). This is in agreementwith the findings from Nikouline et al. (2001), who reported that thesynchronization between left and right hemisphere beta-band oscilla-tions was stronger when these oscillations had larger amplitude. How-ever, although MEG has the temporal resolution to capture thesefrequency-dependent interactions, the detection of in-phase syn-chronization is largely affected by biases introduced by the sourcereconstruction approach (such as the one used herein) and addition-ally confounded with volume conduction effects. Recently, Hillebrandet al. (2012) proposed to use the phase lag index (PLI) to reliably deter-mine MEG functional connectivity from the phase of the reconstructedsignals. They found that the brain areas displaying higher PLI in thealpha- and beta-frequency bands also had more power in thesefrequency bands. To the extent that the PLI may be interpreted as ameasure of (phase-lagged) synchronization, these results suggest aclose relationship between the degree of synchrony and the power ofalpha and beta oscillations in the brain.
Other theoretical models have been proposed for the generation ofalpha oscillations. Although the latter could (mechanistically) be gener-ated at the neural population level (Wilson and Cowan, 1972), mostscenarios point to the key role of themacroscopic connectivity to gener-ate oscillations in the alpha frequency band (Freyer et al., 2011; Lopesda Silva et al., 1974; Nunez, 2000). In particular, a mechanism for thebi-stable alpha-band activity observed in resting-state cortical record-ings (i.e. high power versus low power) was proposed using a two-state biophysical model with simplified cortico-thalamic connectivity(Freyer et al., 2011). In the current model, we go further by consideringrealistic whole-brain brain connectivity (including the cortico-thalamicprojections) and show thatmultiplemetastable statesmay occur, givingrise to spontaneous brain rhythms at different frequencies. The exis-tence of stable reduced collective frequencies shaped by the brain'sspace-time structure deserves further attention (even beyond sponta-neous activity) as itmay bring a new light to understand the biophysicalmechanisms mediating long-distance functional connectivity in thebrain.
In a previous work, and using the same model, we found thatresting-state BOLD signal fluctuations were intrinsically related to
slow fluctuations in the synchrony degree (Cabral et al., 2011). Here,the analysis was extended to the faster oscillatory dimension revealedby MEG recordings. The new results reinforce the scenario that thebrain at rest is operating in a regime of metastable partial synchroniza-tion, where the synchrony degree of a given subsystem (or functionalnetwork) modulates not only its BOLD signal but also the frequency atwhich the nodes in the system oscillate. In other words, during periodsof lower synchrony, brain areas oscillate in the gamma-band, implyingan acceleration of the temporal dynamics which has been shown tocause BOLD signal increases at the local level (Logothetis et al., 2001).During periods of synchronization, the temporal dynamics is sloweddown and consequently the BOLD signal is decreased (Kilner et al.,2005; Laufs et al., 2003a). Indeed, the elevated energy requirements ofhigh-frequency neural oscillations represent a mechanistic link be-tween the functional connectivity of brain regions and their respectivemetabolic demands (Lord et al., 2013; Pfurtscheller et al., 1996). Takenoverall, and despite its simplicity, the current model provides a unifiedpicture for the phenomena observed in the spontaneous state atdifferent temporal, spatial and spectral scales.
Acknowledgments
The research reported herein was supported by the ERC AdvancedGrant: DYSTRUCTURE (n. 295129), by the FET Flagship Human BrainProject, by the Spanish Research Project SAF2010-16085, by theCONSOLIDER-INGENIO 2010 CSD2007-00012, by the BrainNRG throughthe James S. McDonnell Foundation, by the FP7-ICT BrainScales, by theRCUK Digital Economy – Centre for Doctoral Training in HealthcareInnovation, by theMINDLab Investment Capital for University ResearchFund and by the TrygFonden Charitable Foundation.
Appendix A. Supplementary data
Supplementary data to this article can be found online at http://dx.doi.org/10.1016/j.neuroimage.2013.11.047.
References
Acebron, J.A., Bonilla, L.L., Vicente, C.J.P., Ritort, F., Spigler, R., 2005. The Kuramotomodel: asimple paradigm for synchronization phenomena. Rev. Mod. Phys. 77, 137–185.
Baldi, P., Atiya, A.F., 1994. How delays affect neural dynamics and learning. IEEE Trans.Neural Netw. 5, 612–621.
Bartos, M., Vida, I., Jonas, P., 2007. Synaptic mechanisms of synchronized gamma oscilla-tions in inhibitory interneuron networks. Nat. Rev. Neurosci. 8, 45–56.
Behrens, T.E., Woolrich, M.W., Jenkinson, M., Johansen-Berg, H., Nunes, R.G., Clare, S.,Matthews, P.M., Brady, J.M., Smith, S.M., 2003. Characterization and propagation ofuncertainty in diffusion-weighted MR imaging. Magn. Reson. Med. 50, 1077–1088.
Behrens, T.E., Berg, H.J., Jbabdi, S., Rushworth, M.F., Woolrich, M.W., 2007. Probabilisticdiffusion tractography with multiple fibre orientations: what can we gain?Neuroimage 34, 144–155.
Biswal, B., Yetkin, F.Z., Haughton, V.M., Hyde, J.S., 1995. Functional connectivity in themotor cortex of resting human brain using echo-planar MRI. Magn. Reson. Med. 34,537–541.
Biswal, B.B., Mennes, M., Zuo, X.N., Gohel, S., Kelly, C., Smith, S.M., Beckmann, C.F.,Adelstein, J.S., Buckner, R.L., Colcombe, S., Dogonowski, A.M., Ernst, M., Fair, D.,Hampson, M., Hoptman, M.J., Hyde, J.S., Kiviniemi, V.J., Kotter, R., Li, S.J., Lin, C.P.,Lowe, M.J., Mackay, C., Madden, D.J., Madsen, K.H., Margulies, D.S., Mayberg, H.S.,McMahon, K., Monk, C.S., Mostofsky, S.H., Nagel, B.J., Pekar, J.J., Peltier, S.J., Petersen,S.E., Riedl, V., Rombouts, S.A., Rypma, B., Schlaggar, B.L., Schmidt, S., Seidler, R.D.,Siegle, G.J., Sorg, C., Teng, G.J., Veijola, J., Villringer, A., Walter, M., Wang, L., Weng,X.C., Whitfield-Gabrieli, S., Williamson, P., Windischberger, C., Zang, Y.F., Zhang,H.Y., Castellanos, F.X., Milham, M.P., 2010. Toward discovery science of humanbrain function. Proc. Natl. Acad. Sci. U. S. A. 107, 4734–4739.
Borgers, C., Kopell, N., 2003. Synchronization in networks of excitatory and inhibitoryneurons with sparse, random connectivity. Neural Comput. 15, 509–538.
Breakspear, M., Heitmann, S., Daffertshofer, A., 2010. Generative models of cortical oscil-lations: neurobiological implications of the Kuramotomodel. Front. Hum. Neurosci. 4.
Brookes, M.J., Hale, J.R., Zumer, J.M., Stevenson, C.M., Francis, S.T., Barnes, G.R., Owen, J.P.,Morris, P.G., Nagarajan, S.S., 2011a. Measuring functional connectivity using MEG:methodology and comparison with fcMRI. Neuroimage 56, 1082–1104.
Brookes, M.J., Woolrich, M., Luckhoo, H., Price, D., Hale, J.R., Stephenson, M.C., Barnes, G.R.,Smith, S.M., Morris, P.G., 2011b. Investigating the electrophysiological basis of restingstate networks using magnetoencephalography. Proc. Natl. Acad. Sci. U. S. A. 108,16783–16788.

435J. Cabral et al. / NeuroImage 90 (2014) 423–435
Brookes, M.J., Woolrich, M.W., Barnes, G.R., 2012. Measuring functional connectivity inMEG: a multivariate approach insensitive to linear source leakage. Neuroimage 63,910–920.
Brunel, N., 2000. Dynamics of sparsely connected networks of excitatory and inhibitoryspiking neurons. J. Comput. Neurosci. 8, 183–208.
Brunel, N., Wang, X.J., 2003. What determines the frequency of fast network oscillationswith irregular neural discharges? I. Synaptic dynamics and excitation-inhibitionbalance. J. Neurophysiol. 90, 415–430.
Cabral, J., Hugues, E., Sporns, O., Deco, G., 2011. Role of local network oscillations inresting-state functional connectivity. Neuroimage 57, 130–139.
Collins, D., Neelin, P., Peters, T., Evans, A.C., 1994. Automatic 3D intersubject registration ofMR volumetric data in standardized Talairach space. J. Comput. Assist. Tomogr. 18,192–205.
Daffertshofer, A., van Wijk, B.C., 2011. On the Influence of Amplitude on the Connectivitybetween Phases. Front. Neuroinformatics 5, 6.
deMunck, J.C., Goncalves, S.I., Huijboom, L., Kuijer, J.P., Pouwels, P.J., Heethaar, R.M., Lopesda Silva, F.H., 2007. The hemodynamic response of the alpha rhythm: an EEG/fMRIstudy. Neuroimage 35, 1142–1151.
de Pasquale, F., Della Penna, S., Snyder, A.Z., Lewis, C., Mantini, D., Marzetti, L., Belardinelli, P.,Ciancetta, L., Pizzella, V., Romani, G.L., Corbetta, M., 2010. Temporal dynamics of sponta-neous MEG activity in brain networks. Proc. Natl. Acad. Sci. U. S. A. 107, 6040–6045.
de Pasquale, F., Della Penna, S., Snyder, A.Z., Marzetti, L., Pizzella, V., Romani, G.L., Corbetta,M., 2012. A cortical core for dynamic integration of functional networks in the restinghuman brain. Neuron 74, 753–764.
Deco, G., Jirsa, V.K., 2012. Ongoing cortical activity at rest: criticality, multistability, andghost attractors. J. Neurosci. 32, 3366–3375.
Deco, G., Jirsa, V., McIntosh, A.R., Sporns, O., Kotter, R., 2009. Key role of coupling, delay,and noise in resting brain fluctuations. Proc. Natl. Acad. Sci. U. S. A. 106, 10302–10307.
Deco, G., Ponce-Alvarez, A., Mantini, D., Romani, G.L., Hagmann, P., Corbetta, M., 2013.Resting-state functional connectivity emerges from structurally and dynamicallyshaped slow linear fluctuations. J. Neurosci. 33 (27), 11239–11252. http://dx.doi.org/10.1523/JNEUROSCI.1091-13.2013.
Dhamala, M., Jirsa, V.K., Ding, M., 2004. Enhancement of neural synchrony by time delay.Phys. Rev. Lett. 92, 074104.
Difrancesco, M.W., Holland, S.K., Szaflarski, J.P., 2008. Simultaneous EEG/functionalmagnetic resonance imaging at 4 Tesla: correlates of brain activity to spontaneousalpha rhythm during relaxation. J. Clin. Neurophysiol. 25, 255–264.
Freyer, F., Roberts, J.A., Becker, R., Robinson, P.A., Ritter, P., Breakspear, M., 2011. Biophys-ical mechanisms of multistability in resting-state cortical rhythms. J. Neurosci. 31,6353–6361.
Gamez, D., 2012. From Baconian to Popperian Neuroscience. Neural Syst. Circuits 2, 2.Ghosh, A., Rho, Y., McIntosh, A.R., Kotter, R., Jirsa, V.K., 2008a. Cortical network dynamics
with time delays reveals functional connectivity in the resting brain. Cogn. Neurodyn.2, 115–120.
Ghosh, A., Rho, Y., McIntosh, A.R., Kotter, R., Jirsa, V.K., 2008b. Noise during rest enablesthe exploration of the brain's dynamic repertoire. PLoS Comput. Biol. 4, e1000196.
Goldman, R.I., Stern, J.M., Engel Jr., J., Cohen, M.S., 2002. Simultaneous EEG and fMRI of thealpha rhythm. Neuroreport 13, 2487–2492.
Gong, G., Rosa-Neto, P., Carbonell, F., Chen, Z.J., He, Y., Evans, A.C., 2009. Age- andgender-related differences in the cortical anatomical network. J. Neurosci. 29,15684–15693.
Hagmann, P., Kurant, M., Gigandet, X., Thiran, P., Wedeen, V.J., Meuli, R., Thiran, J.P., 2007.Mapping human whole-brain structural networks with diffusion MRI. PLoS One 2,e597.
Hillebrand, A., Barnes, G.R., Bosboom, J.L., Berendse, H.W., Stam, C.J., 2012. Frequency-dependent functional connectivity within resting-state networks: an atlas-basedMEG beamformer solution. Neuroimage 59, 3909–3921.
Hipp, J.F., Hawellek, D.J., Corbetta, M., Siegel, M., Engel, A.K., 2012. Large-scale cortical cor-relation structure of spontaneous oscillatory activity. Nat. Neurosci. 15, 884–890.
Honey, C.J., Kotter, R., Breakspear, M., Sporns, O., 2007. Network structure of cerebralcortex shapes functional connectivity on multiple time scales. Proc. Natl. Acad. Sci.U. S. A. 104, 10240–10245.
Honey, C.J., Sporns, O., Cammoun, L., Gigandet, X., Thiran, J.P., Meuli, R., Hagmann, P.,2009. Predicting human resting-state functional connectivity from structural connec-tivity. Proc. Natl. Acad. Sci. U. S. A. 106, 2035–2040.
Huang, M.X., Mosher, J.C., Leahy, R.M., 1999. A sensor-weighted overlapping-spherehead model and exhaustive head model comparison for MEG. Phys. Med. Biol. 44,423–440.
Jenkinson, M., Bannister, P., Brady, M., Smith, S., 2002. Improved optimization for therobust and accurate linear registration and motion correction of brain images.Neuroimage 17, 825–841.
Jirsa, V.K., 2009. Neural field dynamics with local and global connectivity and time delay.Philos. Transact. A Math. Phys. Eng. Sci. 367, 1131–1143.
Kilner, J.M., Mattout, J., Henson, R., Friston, K.J., 2005. Hemodynamic correlates of EEG: aheuristic. Neuroimage 28, 280–286.
Kitzbichler, M.G., Smith, M.L., Christensen, S.R., Bullmore, E., 2009. Broadband criticality ofhuman brain network synchronization. PLoS Comput. Biol. 5, e1000314.
Knock, S.A., McIntosh, A.R., Sporns, O., Kotter, R., Hagmann, P., Jirsa, V.K., 2009. The effectsof physiologically plausible connectivity structure on local and global dynamics inlarge scale brain models. J. Neurosci. Methods 183, 86–94.
Kuramoto, Y., 1984. Chemical Oscillations, Waves, and Turbulence. Springer-Verlag, Berlin.Laufs, H., Kleinschmidt, A., Beyerle, A., Eger, E., Salek-Haddadi, A., Preibisch, C., Krakow, K.,
2003a. EEG-correlated fMRI of human alpha activity. Neuroimage 19, 1463–1476.Laufs, H., Krakow, K., Sterzer, P., Eger, E., Beyerle, A., Salek-Haddadi, A., Kleinschmidt, A.,
2003b. Electroencephalographic signatures of attentional and cognitive defaultmodes in spontaneous brain activity fluctuations at rest. Proc. Natl. Acad. Sci. U. S. A.100, 11053–11058.
Liu, Z., Fukunaga, M., de Zwart, J.A., Duyn, J.H., 2010. Large-scale spontaneous fluctuationsand correlations in brain electrical activity observed with magnetoencephalography.Neuroimage 51, 102–111.
Logothetis, N.K., Pauls, J., Augath, M., Trinath, T., Oeltermann, A., 2001. Neurophysiologicalinvestigation of the basis of the fMRI signal. Nature 412, 150–157.
Lopes da Silva, F.H., Hoeks, A., Smits, H., Zetterberg, L.H., 1974. Model of brain rhythmicactivity. The alpha-rhythm of the thalamus. Kybernetik 15, 27–37.
Lord, L.D., Expert, P., Huckins, J.F., Turkheimer, F.E., 2013. Cerebral energymetabolism andthe brain's functional network architecture: an integrative review. J. Cereb. BloodFlow Metab. 33, 1347–1354.
Luckhoo, H., Hale, J.R., Stokes, M.G., Nobre, A.C., Morris, P.G., Brookes, M.J., Woolrich, M.W.,2012. Inferring task-related networks using independent component analysis inmagnetoencephalography. Neuroimage 62, 530–541.
Mantini, D., Perrucci, M.G., Del Gratta, C., Romani, G.L., Corbetta, M., 2007. Electrophysio-logical signatures of resting state networks in the human brain. Proc. Natl. Acad. Sci.U. S. A. 104, 13170–13175.
Maslov, S., Sneppen, K., 2002. Specificity and stability in topology of protein networks.Science 296, 910–913.
Niebur, E., Schuster, H.G., Kammen, D.M., 1991. Collective frequencies andmetastability innetworks of limit-cycle oscillators with time delay. Phys. Rev. Lett. 67, 2753–2756.
Nikouline, V.V., Linkenkaer-Hansen, K., Huttunen, J., Ilmoniemi, R.J., 2001. Interhemi-spheric phase synchrony and amplitude correlation of spontaneous beta oscillationsin human subjects: a magnetoencephalographic study. Neuroreport 12, 2487–2491.
Nir, Y., Mukamel, R., Dinstein, I., Privman, E., Harel, M., Fisch, L., Gelbard-Sagiv, H.,Kipervasser, S., Andelman, F., Neufeld, M.Y., Kramer, U., Arieli, A., Fried, I., Malach,R., 2008. Interhemispheric correlations of slow spontaneous neuronal fluctuationsrevealed in human sensory cortex. Nat. Neurosci. 11, 1100–1108.
Nunez, P.L., 2000. Toward a quantitative description of large-scale neocortical dynamicfunction and EEG. Behav. Brain Sci. 23, 371–398 (discussion 399–437).
Pfurtscheller, G., Stancak Jr., A., Neuper, C., 1996. Event-related synchronization (ERS) inthe alpha band–an electrophysiological correlate of cortical idling: a review. Int.J. Psychophysiol. 24, 39–46.
Pikovsky, A., Rosenblum, M., Kurths, J., 2001. Synchronization: A Universal Concept inNonlinear Sciences. Cambridge University Press.
Ritter, P., Moosmann, M., Villringer, A., 2009. Rolandic alpha and beta EEG rhythms'strengths are inversely related to fMRI-BOLD signal in primary somatosensory andmotor cortex. Hum. Brain Mapp. 30, 1168–1187.
Robinson, S., Vrba, J., 1998. Functional neuroimaging by synthetic aperture magnetome-try. Recent Adv. Biomagn. 302–305.
Rubinov, M., Sporns, O., 2010. Complex networkmeasures of brain connectivity: uses andinterpretations. Neuroimage 52, 1059–1069.
Shanahan, M., 2010. Metastable chimera states in community-structured oscillatornetworks. Chaos 20, 013108.
Shmuel, A., Leopold, D.A., 2008. Neuronal correlates of spontaneous fluctuations in fMRIsignals in monkey visual cortex: implications for functional connectivity at rest.Hum. Brain Mapp. 29, 751–761.
Strogatz, S., 2003. Sync: The Emerging Science of Spontaneous Order, Hyperion (NewYork).
Taulu, S., Simola, J., Kajola, M., 2005. Applications of the Signal Space Separation Method.IEEE Trans. Sign. Proces. 53, 3359–3372.
Tzourio-Mazoyer, N., Landeau, B., Papathanassiou, D., Crivello, F., Etard, O., Delcroix, N.,Mazoyer, B., Joliot, M., 2002. Automated anatomical labeling of activations in SPMusing a macroscopic anatomical parcellation of the MNI MRI single-subject brain.Neuroimage 15, 273–289.
Van Veen, B.D., van Drongelen, W., Yuchtman, M., Suzuki, A., 1997. Localization of brainelectrical activity via linearly constrained minimum variance spatial filtering. IEEETrans. Biomed. Eng. 44, 867–880.
Wildie, M., Shanahan, M., 2012. Metastability and chimera states in modular delay andpulse-coupled oscillator networks. Chaos 22, 043131.
Wilson, H.R., Cowan, J.D., 1972. Excitatory and inhibitory interactions in localized popula-tions of model neurons. Biophys. J. 12, 1–24.
Woolrich, M., Hunt, L., Groves, A., Barnes, G., 2011. MEG beamforming using Bayesian PCAfor adaptive data covariance matrix regularization. Neuroimage 57, 1466–1479.
Yan, B., Li, P., 2013. The emergence of abnormal hypersynchronization in the anatomicalstructural network of human brain. Neuroimage 65, 34–51.
Yeung, M.K.S., Strogatz, S.H., 1999. Time delay in the Kuramoto model of coupled oscilla-tors. Phys. Rev. Lett. 82, 648–651.