explaining the decrease in u.s. deaths from coronary disease, 1980–2000
TRANSCRIPT

T h e n e w e ng l a nd j o u r na l o f m e dic i n e
n engl j med 356;23 www.nejm.org june 7, 20072388
Explaining the Decrease in U.S. Deaths from Coronary Disease, 1980–2000
Earl S. Ford, M.D., M.P.H., Umed A. Ajani, M.B., B.S., M.P.H., Janet B. Croft, Ph.D., Julia A. Critchley, D.Phil., M.Sc., Darwin R. Labarthe, M.D., M.P.H., Ph.D.,
Thomas E. Kottke, M.D., Wayne H. Giles, M.D., M.S., and Simon Capewell, M.D.
From the Division of Adult and Commu-nity Health (E.S.F., U.A.A., W.H.G.) and the Division for Heart Disease and Stroke Pre-vention ( J.B.C., D.R.L.), National Center for Chronic Disease Prevention and Health Promotion, Centers for Disease Control and Prevention, Atlanta; the Institute of Health and Society, Newcastle University, Newcastle upon Tyne (J.A.C.), and the Divi-sion of Public Health, University of Liver-pool, Liverpool (S.C.) — both in the United Kingdom; and HealthPartners Research Foundation, Minneapolis (T.E.K.). Address reprint requests to Dr. Capewell at the Division of Public Health, University of Liverpool, Whelan Building, Quadrangle, Liverpool L69 3GB, United Kingdom, or at [email protected].
N Engl J Med 2007;356:2388-98.Copyright © 2007 Massachusetts Medical Society.
A BS TR AC T
BACKGROUND
Mortality from coronary heart disease in the United States has decreased substan-tially in recent decades. We conducted a study to determine how much of this de-crease could be explained by the use of medical and surgical treatments as opposed to changes in cardiovascular risk factors.
METHODS
We applied a previously validated statistical model, IMPACT, to data on the use and effectiveness of specific cardiac treatments and on changes in risk factors between 1980 and 2000 among U.S. adults 25 to 84 years old. The difference between the observed and expected number of deaths from coronary heart disease in 2000 was distributed among the treatments and risk factors included in the analyses.
RESULTS
From 1980 through 2000, the age-adjusted death rate for coronary heart disease fell from 542.9 to 266.8 deaths per 100,000 population among men and from 263.3 to 134.4 deaths per 100,000 population among women, resulting in 341,745 fewer deaths from coronary heart disease in 2000. Approximately 47% of this decrease was attributed to treatments, including secondary preventive therapies after myo-cardial infarction or revascularization (11%), initial treatments for acute myocardial infarction or unstable angina (10%), treatments for heart failure (9%), revascular-ization for chronic angina (5%), and other therapies (12%). Approximately 44% was attributed to changes in risk factors, including reductions in total cholesterol (24%), systolic blood pressure (20%), smoking prevalence (12%), and physical inactivity (5%), although these reductions were partially offset by increases in the body-mass index and the prevalence of diabetes, which accounted for an increased number of deaths (8% and 10%, respectively).
CONCLUSIONS
Approximately half the decline in U.S. deaths from coronary heart disease from 1980 through 2000 may be attributable to reductions in major risk factors and approxi-mately half to evidence-based medical therapies.
special article
Copyright © 2007 Massachusetts Medical Society. All rights reserved. Downloaded from www.nejm.org at UNIVERSITE PAUL-SABATIER TOULO on November 30, 2007 .
Explaining the Decrease in Deaths from Coronary Disease
n engl j med 356;23 www.nejm.org june 7, 2007 2389
Rates of death from coronary heart disease in the United States underwent pro-found secular changes during the 20th cen-
tury.1,2 After peaking around 1968, age-adjusted rates were cut in half. Two factors may have con-tributed to this decline.
First, there have been substantial decreases in the prevalence of some major cardiovascular risk factors, including smoking, elevated total choles-terol, and high blood pressure.3-8 However, the prevalence of both obesity and diabetes has in-creased alarmingly.9-11
Second, there has been a revolution in the treat-ments for established coronary heart disease, with major breakthroughs in evidence-based therapies, including the use of thrombolysis, coronary-artery bypass grafting (CABG), coronary angioplasty and stents, and angiotensin-converting–enzyme (ACE) inhibitors and statins.
The annual direct and indirect costs for coro-nary heart disease were $142.5 billion in 2006, and they continue to rise.12 Determining the re-spective contributions of prevention and therapy to the declines in mortality from coronary heart disease is therefore becoming increasingly im-portant, for the purposes of both understanding past trends and planning future strategies. Esti-mates of the contribution from reductions in risk factors before 1990 have ranged from 50 to 54% in the United States13,14 and from 44 to 76% in other industrialized countries.15-22 However, to our knowledge, no U.S. studies have considered the dramatic changes since 1990 or have attempt-ed to quantify the relative contributions of spe-cific therapies and trends in risk factors. We therefore applied a model that has been used suc-cessfully in several other countries to examine trends in U.S. deaths from coronary heart dis-ease between 1980 and 2000.
Me thods
Mortality Model and Data Sources
To examine the contributions of various factors to the changes in rates of death from coronary heart disease among U.S. adults 25 to 84 years of age, we used an updated version of the IMPACT mor-tality model, which was previously validated in Europe, New Zealand, and China.18-23 This mod-el has been described in detail elsewhere.18,19,23,24 It incorporates major population risk factors for coronary heart disease (smoking, high blood pres-
sure, elevated total cholesterol, obesity, diabetes, and physical inactivity) and all usual medical and surgical treatments for coronary heart disease.
Wherever possible, data sources specific to the U.S. population were used to construct the U.S. model. When more than one data source was available, we chose the source that we considered to be most representative, least biased, and most up-to-date. Detailed information on the IMPACT model and data sources for the U.S. analysis is provided in the Supplementary Appendix, avail-able with the full text of this article at www.nejm.org.
Deaths Prevented or Postponed
Data on the total U.S. population and age distri-bution in 1980 and 2000 were obtained from the U.S. Census Bureau. Deaths according to age and sex and mortality rates associated with coronary heart disease in 1980 and 2000 were obtained from the National Vital Statistics System of the National Center for Health Statistics. We calculat-ed the number of deaths from coronary heart dis-ease that would have been expected in 2000 if the mortality rates in 1980 had remained unchanged by multiplying the age-specific mortality rates for 1980 by the population for each 10-year age stra-tum in the year 2000 (thus accounting for the aging of the population). Subtracting the number of deaths observed in 2000 from the number ex-pected then yielded the drop in the number of deaths (prevented or postponed) in 2000 that the model would have to explain.
Treatments and Mortality Reductions
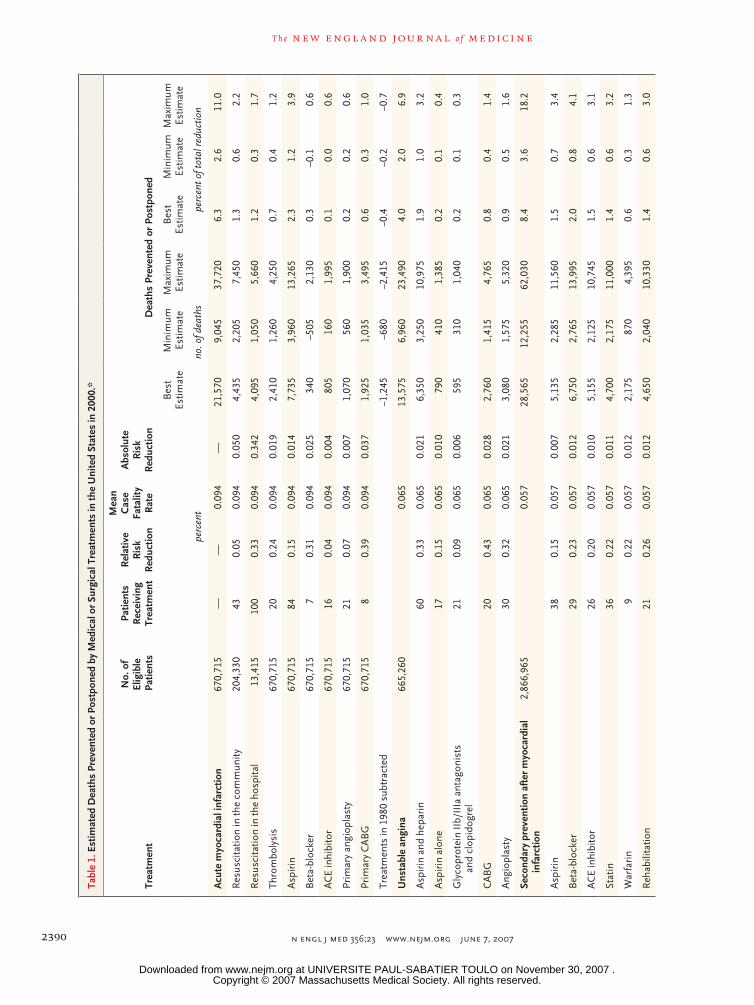
The prevalence of coronary heart disease by diag-nosis, the estimated frequency of use of specific treatments, the case fatality rate by diagnosis, and the risk reduction due to treatment, all stratified by age and sex, were obtained from published sources (Tables 2 through 5 in the Supplemen-tary Appendix). The number of deaths prevented or postponed as a result of each intervention in each group of patients in the year 2000 (Table 1) was calculated by multiplying the number of peo-ple in each diagnostic group by the proportion of those patients who received a particular treatment, by the case fatality rate over a period of 1 year, and by the relative reduction in the 1-year case fatality rate that was accounted for by the treat-ment.19,20 For example, in the United States in 2000, approximately 102,280 men between the
Copyright © 2007 Massachusetts Medical Society. All rights reserved. Downloaded from www.nejm.org at UNIVERSITE PAUL-SABATIER TOULO on November 30, 2007 .
T h e n e w e ng l a nd j o u r na l o f m e dic i n e
n engl j med 356;23 www.nejm.org june 7, 20072390
Tabl
e 1.
Est
imat
ed D
eath
s Pr
even
ted
or P
ostp
oned
by
Med
ical
or
Surg
ical
Tre
atm
ents
in th
e U
nite
d St
ates
in 2
000.
*
Trea
tmen
t
No.
of
Elig
ible
Pat
ient
s
Patie
nts
Rec
eivi
ng
Trea
tmen
t
Rel
ativ
e R
isk
Red
uctio
n
Mea
n
Cas
e Fa
talit
y
Rat
e
Abs
olut
e
Ris
k R
educ
tion
Dea
ths
Prev
ente
d or
Pos
tpon
ed
Bes
t Es
timat
eM
inim
um
Estim
ate
Max
imum
Es
timat
eB
est
Estim
ate
Min
imum
Es
timat
eM
axim
um
Estim
ate
perc
ent
no. o
f dea
ths
perc
ent o
f tot
al re
duct
ion
Acu
te m
yoca
rdia
l inf
arct
ion
670,
715
——
0.09
4—
21,5
709,
045
37,7
206.
32.
611
.0
Res
usci
tatio
n in
the
com
mun
ity20
4,33
043
0.05
0.09
40.
050
4,43
52,
205
7,45
01.
30.
62.
2
Res
usci
tatio
n in
the
hosp
ital
13,4
1510
00.
330.
094
0.34
24,
095
1,05
05,
660
1.2
0.3
1.7
Thro
mbo
lysi
s67
0,71
520
0.24
0.09
40.
019
2,41
01,
260
4,25
00.
70.
41.
2
Asp
irin
670,
715
840.
150.
094
0.01
47,
735
3,96
013
,265
2.3
1.2
3.9
Bet
a-bl
ocke
r67
0,71
57
0.31
0.09
40.
025
340
–505
2,13
00.
3–0
.10.
6
AC
E in
hibi
tor
670,
715
160.
040.
094
0.00
480
516
01,
995
0.1
0.0
0.6
Prim
ary
angi
opla
sty
670,
715
210.
070.
094
0.00
71,
070
560
1,90
00.
20.
20.
6
Prim
ary
CA
BG
670,
715
80.
390.
094
0.03
71,
925
1,03
53,
495
0.6
0.3
1.0
Trea
tmen
ts in
198
0 su
btra
cted
−1,2
45−6
80−2
,415
−0.4
−0.2
−0.7
Uns
tabl
e an
gina
665,
260
0.06
513
,575
6,96
023
,490
4.0
2.0
6.9
Asp
irin
and
hep
arin
600.
330.
065
0.02
16,
350
3,25
010
,975
1.9
1.0
3.2
Asp
irin
alo
ne17
0.15
0.06
50.
010
790
410
1,38
50.
20.
10.
4
Gly
copr
otei
n II
b/II
Ia a
ntag
onis
ts
and
clop
idog
rel
210.
090.
065
0.00
659
531
01,
040
0.2
0.1
0.3
CA
BG
20
0.43
0.06
50.
028
2,76
01,
415
4,76
50.
80.
41.
4
Ang
iopl
asty
30
0.32
0.06
50.
021
3,08
01,
575
5,32
00.
90.
51.
6
Seco
ndar
y pr
even
tion
afte
r m
yoca
rdia
l in
farc
tion
2,86
6,96
50.
057
28,5
6512
,255
62,0
308.
43.
618
.2
Asp
irin
380.
150.
057
0.00
75,
135
2,28
511
,560
1.5
0.7
3.4
Bet
a-bl
ocke
r29
0.23
0.05
70.
012
6,75
02,
765
13,9
952.
00.
84.
1
AC
E in
hibi
tor
260.
200.
057
0.01
05,
155
2,12
510
,745
1.5
0.6
3.1
Stat
in36
0.22
0.05
70.
011
4,70
02,
175
11,0
001.
40.
63.
2
War
fari
n9
0.22
0.05
70.
012
2,17
587
04,
395
0.6
0.3
1.3
Reh
abili
tatio
n21
0.26
0.05
70.
012
4,65
02,
040
10,3
301.
40.
63.
0
Copyright © 2007 Massachusetts Medical Society. All rights reserved. Downloaded from www.nejm.org at UNIVERSITE PAUL-SABATIER TOULO on November 30, 2007 .
Explaining the Decrease in Deaths from Coronary Disease
n engl j med 356;23 www.nejm.org june 7, 2007 2391
Seco
ndar
y pr
even
tion
afte
r C
AB
G
or P
TCA
1,
948,
660
0.01
97,
435
3,07
015
,535
2.2
0.9
4.6
Asp
irin
400.
150.
019
0.00
31,
310
555
2,80
00.
40.
20.
8
Bet
a-bl
ocke
r33
0.23
0.01
90.
004
1,46
059
53,
010
0.4
0.2
0.9
AC
E in
hibi
tor
260.
200.
019
0.00
41,
010
410
2,08
00.
30.
10.
6
Stat
in38
0.22
0.01
90.
004
1,55
066
53,
365
0.5
0.2
1.0
War
fari
n9
0.22
0.01
90.
004
450
180
915
0.1
0.1
0.3
Reh
abili
tatio
n32
0.26
0.01
90.
004
1,65
566
53,
360
0.5
0.2
1.0
Seco
ndar
y-pr
even
tion
trea
tmen
ts in
19
80 s
ubtr
acte
d−1
95
Chr
onic
ang
ina
4,98
7,37
50.
015
17,7
305,
595
40,9
505.
21.
612
.0
CA
BG
, 199
0 to
200
02,
356,
695
100
0.36
0.02
00.
005
14,3
656,
720
34,1
804.
22.
010
.0
With
CA
BG
in 1
980
subt
ract
ed−3
,065
−1,9
60−4
,410
−0.9
−0.6
−1.3
Ang
iopl
asty
, 199
0 to
200
022
,059
,760
100
0.13
0.01
90.
002
4,39
00
6,96
01.
30.
02.
0
Asp
irin
in th
e co
mm
unity
2,11
9,49
524
0.15
0.01
10.
001
1,06
043
52,
195
0.3
0.1
0.6
Stat
ins
in th
e co
mm
unity
2,11
9,49
539
0.23
0.01
10.
002
980
400
2,03
00.
30.
10.
6
Hea
rt fa
ilure
with
hos
pita
l adm
issi
on25
8,74
50.
237
11,7
354,
945
25,0
303.
41.
47.
3
AC
E in
hibi
tor
430.
200.
237
0.04
73,
130
1,37
56,
960
0.9
0.4
2.0
Bet
a-bl
ocke
r31
0.35
0.23
70.
082
4,30
01,
750
8,85
01.
30.
52.
6
Spir
onol
acto
ne7
0.30
0.23
70.
071
825
330
1,66
50.
20.
10.
5
Asp
irin
300.
150.
237
0.03
51,
700
715
3,61
50.
50.
21.
1
Stat
ins
280.
230.
237
0.05
51,
785
780
3,94
00.
50.
21.
2
Hea
rt fa
ilure
in th
e co
mm
unity
1,87
6,40
50.
063
18,5
007,
735
39,1
705.
42.
311
.5
AC
E in
hibi
tor
480.
200.
063
0.00
93,
375
1,55
07,
845
1.0
0.5
2.3
Bet
a-bl
ocke
r30
0.35
0.06
30.
022
7,18
02,
940
14,8
852.
10.
94.
4
Spir
onol
acto
ne8
0.28
0.06
30.
024
1,68
569
03,
500
0.5
0.2
1.0
Asp
irin
300.
150.
063
0.00
93,
105
1,26
56,
405
0.9
0.4
1.9
Stat
in30
0.23
0.06
30.
015
3,15
01,
290
6,53
50.
90.
41.
9
Hyp
erte
nsio
n54
,353
,660
580.
130.
008
0.00
123
,845
1,94
568
,370
7.0
0.6
20.0
Stat
ins
for
lipid
red
uctio
n (p
rim
ary
prev
entio
n)†
96,3
84,6
3020
0.29
0.00
40.
001
16,5
806,
515
35,1
004.
91.
910
.3
Tota
l tre
atm
ents
159,
330
58,0
6534
7,39
546
.619
.294
.3
* Pe
rcen
tage
s m
ay n
ot s
um t
o 10
0 be
caus
e of
rou
ndin
g. D
ata
sour
ces
are
desc
ribe
d in
the
Sup
plem
enta
ry A
ppen
dix.
CA
BG
den
otes
cor
onar
y-ar
tery
byp
ass
graf
ting,
AM
I ac
ute
myo
card
i-al
infa
rctio
n, A
CE
angi
oten
sin-
conv
ertin
g en
zym
e, a
nd P
TCA
per
cuta
neou
s tr
ansl
umin
al c
oron
ary
angi
opla
sty
(with
or
with
out
sten
ting)
.†
The
num
ber
of d
eath
s pr
even
ted
or p
ostp
oned
incl
udes
475
tha
t w
ere
prev
ente
d or
pos
tpon
ed o
win
g to
tre
atm
ent
with
gem
fibro
zil a
nd n
iaci
n fo
r pr
imar
y pr
even
tion
of h
yper
lipid
emia
.
Copyright © 2007 Massachusetts Medical Society. All rights reserved. Downloaded from www.nejm.org at UNIVERSITE PAUL-SABATIER TOULO on November 30, 2007 .
T h e n e w e ng l a nd j o u r na l o f m e dic i n e
n engl j med 356;23 www.nejm.org june 7, 20072392
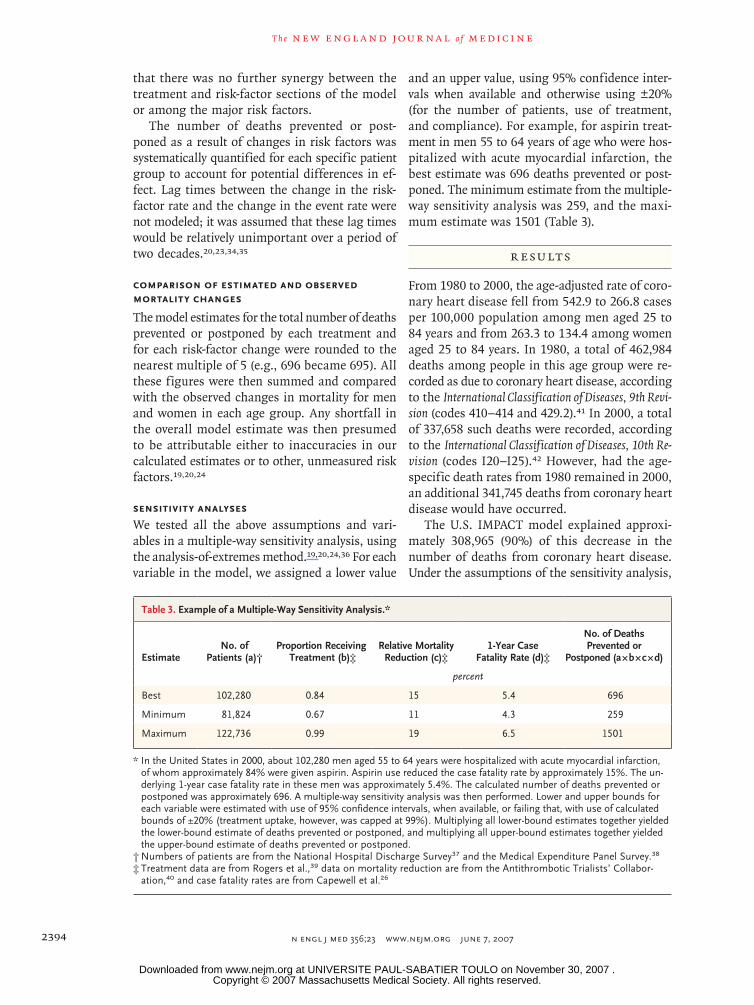
ages of 55 and 64 years were hospitalized with acute myocardial infarction. Some 84% were given aspirin, with an expected mortality reduction of 15%.25 The expected age-specific, 1-year case fa-tality rate was approximately 5.4%.26 The number of deaths prevented or postponed for at least a year by the use of aspirin among men in this age group was then calculated as 102,280 × 0.84 × 0.15 × 0.054 = 696.
Several adjustments were made to these basic analyses. Although most of the therapeutic mea-sures studied were not in use in 1980, in some cases such use was already substantial (e.g., CABG for stable angina pectoris). In such cases, the number of deaths prevented or postponed as a result of the therapy as used in 1980 was calcu-lated and subtracted from the number of deaths for 2000 to calculate the net benefit. We as-sumed that compliance — the proportion of treat-ed patients actually taking therapeutically effec-tive levels of medication — was 100% among hospitalized patients, 70% among symptomatic patients in the community, and 50% among asymptomatic patients in the community.19,24,27,28 To avoid double counting of patients treated, we identified potential overlaps between different groups of patients and made appropriate adjust-ments (Table 9 in the Supplementary Appendix). For example, heart failure develops within 1 year after acute myocardial infarction in approximate-ly one quarter of survivors, and approximately half the patients undergoing CABG have had a previous myocardial infarction.19,24 To address the potential effect on the relative reduction in the case fatality rate for individual patients receiving multiple treatments, we used the Mant and Hicks cumulative-relative-benefit approach29:
relative benefit = 1 − (1 − relative reduction in case fatality rate for treatment A) ×
(1 − relative reduction in case fatality rate for treatment B) × . . . × (1 − relative reduction in case fatality rate for treatment N).
Risk Factors and Mortality Reductions
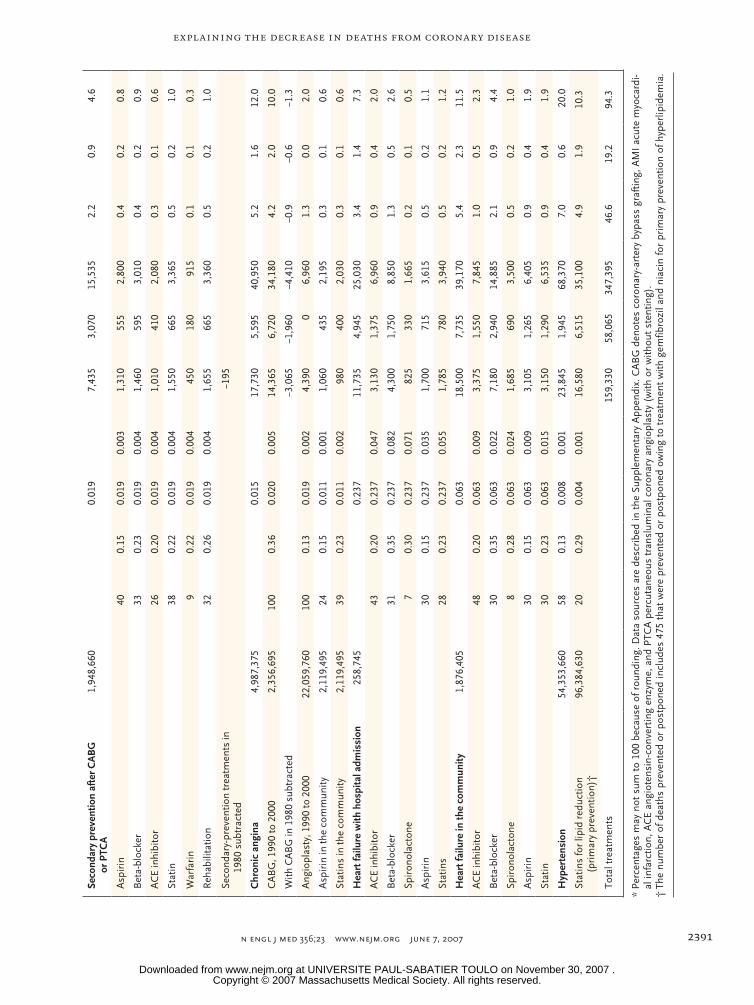
Two approaches were used to calculate the num-bers of deaths prevented or postponed as a result of changes in risk factors. We used a regression approach for systolic blood pressure, cholesterol, and body-mass index. The number of deaths pre-vented or postponed as a result of the change in the prevalence of or mean value for each of these risk factors (Table 2) was estimated as the prod-
uct of three variables: the number of deaths from coronary heart disease in 1980 (the base year), the subsequent reduction in that risk factor (Ta-ble 2 in the Supplementary Appendix), and the regression coefficient quantifying the change in mortality from coronary heart disease per unit of absolute change in the risk factor (Table 6 in the Supplementary Appendix). For example, in 1980, there were 26,352 deaths from coronary heart disease among 12,629,000 women who were 55 to 64 years of age. The mean systolic blood pressure in this group decreased by 3.09 mm Hg between 1980 and 2000. The largest meta-analysis showed an estimated age- and sex-specific reduction in mortality of 50% for every reduction of 20 mm Hg in systolic pressure, yielding a logarithmic (ln) co-efficient of –0.035.33
The number of deaths prevented or postponed as a result of this change was then estimated as follows:
number of deaths = (1 − e(coefficient × change)) × deaths in 1980 = (1 − e(−0.035 × 3.09)) × 26,352 = 2701.
The population-attributable risk fraction was used to determine the effect of changes in the preva-lence of smoking, diabetes, and physical inactiv-ity. The population-attributable risk fraction was calculated conventionally as [P × (RR−1)] ÷ [(1+P) × (RR−1)], where P is the prevalence of the risk fac-tor (Table 2 in the Supplementary Appendix) and RR is the relative risk of death from coronary heart disease associated with that risk factor (Ta-ble 7 in the Supplementary Appendix). The num-ber of deaths prevented or postponed was then estimated as the number of deaths from coronary heart disease in 1980 (the base year) multiplied by the difference between the population-attribut-able risk fraction in 1980 and that in 2000 (Table 2). For example, the prevalence of diabetes among men 65 to 74 years of age increased from 14.5% in 1980 to 20.7% in 2000. Given a relative risk of 1.93, the population-attributable risk fraction in-creased from 0.119 to 0.161. Additional deaths from coronary heart disease in 2000 that were attributable to an increased prevalence of diabe-tes were therefore calculated as follows18,19,23,24:
deaths from coronary heart disease in 1980 = (123,055) × (0.161 – 0.119) = 5168.
Because independent regression coefficients and relative risks for each risk factor were ob-tained from multivariate analyses, we assumed
Copyright © 2007 Massachusetts Medical Society. All rights reserved. Downloaded from www.nejm.org at UNIVERSITE PAUL-SABATIER TOULO on November 30, 2007 .
Explaining the Decrease in Deaths from Coronary Disease
n engl j med 356;23 www.nejm.org june 7, 2007 2393
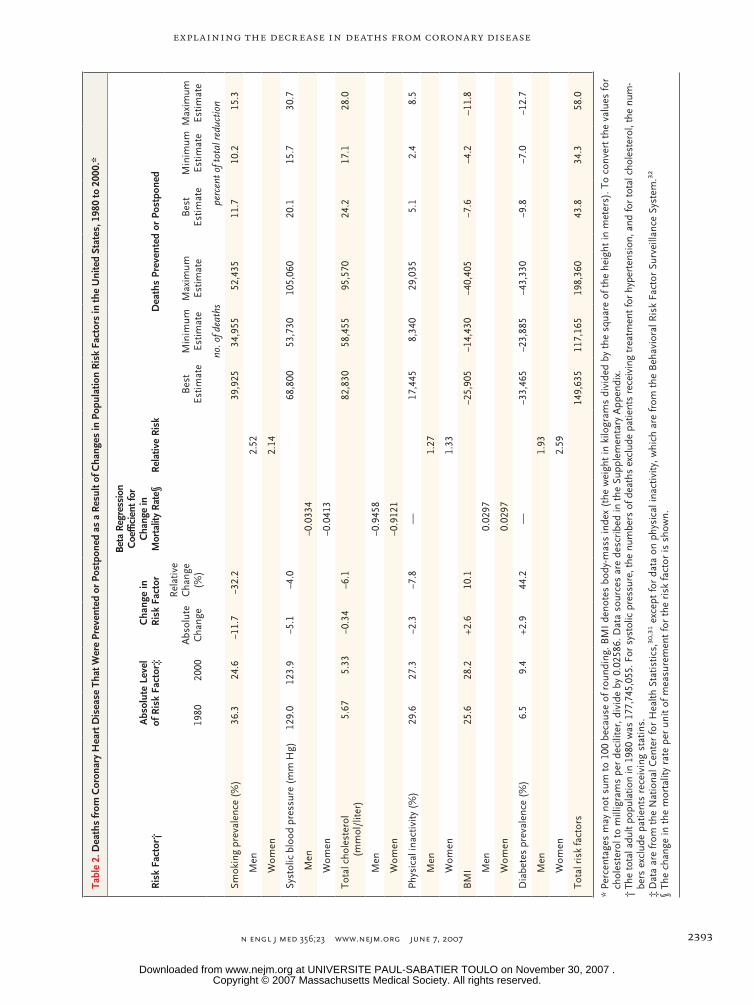
Tabl
e 2.
Dea
ths
from
Cor
onar
y H
eart
Dis
ease
Tha
t Wer
e Pr
even
ted
or P
ostp
oned
as
a R
esul
t of C
hang
es in
Pop
ulat
ion
Ris
k Fa
ctor
s in
the
Uni
ted
Stat
es, 1
980
to 2
000.
*
Ris
k Fa
ctor
†A
bsol
ute
Leve
l of
Ris
k Fa
ctor
‡C
hang
e in
Ris
k Fa
ctor
Bet
a Re
gres
sion
C
oeffi
cien
t for
C
hang
e in
M
orta
lity
Rate
§R
elat
ive
Ris
kD
eath
s Pr
even
ted
or P
ostp
oned
1980
2000
Abs
olut
e C
hang
e
Rel
ativ
e C
hang
e (%
)B
est
Estim
ate
Min
imum
Es
timat
eM
axim
um
Estim
ate
Bes
t Es
timat
eM
inim
um
Estim
ate
Max
imum
Es
timat
e
no. o
f dea
ths
perc
ent o
f tot
al re
duct
ion
Smok
ing
prev
alen
ce (
%)
36.3
24.6
−11.
7−3
2.2
39,9
2534
,955
52,4
3511
.710
.215
.3
Men
2.52
Wom
en2.
14
Syst
olic
blo
od p
ress
ure
(mm
Hg)
12
9.0
123.
9−5
.1−4
.068
,800
53,7
3010
5,06
020
.115
.730
.7
Men
−0.0
334
Wom
en−0
.041
3
Tota
l cho
lest
erol
(m
mol
/lite
r)
5.67
5.33
−0.3
4−6
.182
,830
58,4
5595
,570
24.2
17.1
28.0
Men
−0.9
458
Wom
en−0
.912
1
Phys
ical
inac
tivity
(%
)29
.627
.3−2
.3−7
.8—
17
,445
8,34
029
,035
5.1
2.4
8.5
Men
1.27
Wom
en1.
33
BM
I 25
.628
.2+2
.610
.1−2
5,90
5−1
4,43
0−4
0,40
5−7
.6−4
.2–1
1.8
Men
0.02
97
Wom
en0.
0297
Dia
bete
s pr
eval
ence
(%
)6.
59.
4+2
.944
.2—
−33,
465
−23,
885
−43,
330
−9.8
−7.0
−12.
7
Men
1.93
Wom
en2.
59
Tota
l ris
k fa
ctor
s14
9,63
511
7,16
519
8,36
043
.834
.358
.0
* Pe
rcen
tage
s m
ay n
ot s
um t
o 10
0 be
caus
e of
rou
ndin
g. B
MI
deno
tes
body
-mas
s in
dex
(the
wei
ght
in k
ilogr
ams
divi
ded
by t
he s
quar
e of
the
hei
ght
in m
eter
s). T
o co
nver
t th
e va
lues
for
chol
este
rol t
o m
illig
ram
s pe
r de
cilit
er, d
ivid
e by
0.0
2586
. Dat
a so
urce
s ar
e de
scri
bed
in t
he S
uppl
emen
tary
App
endi
x.†
The
tota
l adu
lt po
pula
tion
in 1
980
was
177
,745
,055
. For
sys
tolic
pre
ssur
e, th
e nu
mbe
rs o
f dea
ths
excl
ude
patie
nts
rece
ivin
g tr
eatm
ent f
or h
yper
tens
ion,
and
for
tota
l cho
lest
erol
, the
num
-be
rs e
xclu
de p
atie
nts
rece
ivin
g st
atin
s.‡
Dat
a ar
e fr
om t
he N
atio
nal C
ente
r fo
r H
ealth
Sta
tistic
s,30
,31 e
xcep
t fo
r da
ta o
n ph
ysic
al in
activ
ity, w
hich
are
from
the
Beh
avio
ral R
isk
Fact
or S
urve
illan
ce S
yste
m.32
§ Th
e ch
ange
in t
he m
orta
lity
rate
per
uni
t of
mea
sure
men
t fo
r th
e ri
sk fa
ctor
is s
how
n.
Copyright © 2007 Massachusetts Medical Society. All rights reserved. Downloaded from www.nejm.org at UNIVERSITE PAUL-SABATIER TOULO on November 30, 2007 .
T h e n e w e ng l a nd j o u r na l o f m e dic i n e
n engl j med 356;23 www.nejm.org june 7, 20072394
that there was no further synergy between the treatment and risk-factor sections of the model or among the major risk factors.
The number of deaths prevented or post-poned as a result of changes in risk factors was systematically quantified for each specific patient group to account for potential differences in ef-fect. Lag times between the change in the risk-factor rate and the change in the event rate were not modeled; it was assumed that these lag times would be relatively unimportant over a period of two decades.20,23,34,35
Comparison of Estimated and Observed Mortality Changes
The model estimates for the total number of deaths prevented or postponed by each treatment and for each risk-factor change were rounded to the nearest multiple of 5 (e.g., 696 became 695). All these figures were then summed and compared with the observed changes in mortality for men and women in each age group. Any shortfall in the overall model estimate was then presumed to be attributable either to inaccuracies in our calculated estimates or to other, unmeasured risk factors.19,20,24
Sensitivity Analyses
We tested all the above assumptions and vari-ables in a multiple-way sensitivity analysis, using the analysis-of-extremes method.19,20,24,36 For each variable in the model, we assigned a lower value
and an upper value, using 95% confidence inter-vals when available and otherwise using ±20% (for the number of patients, use of treatment, and compliance). For example, for aspirin treat-ment in men 55 to 64 years of age who were hos-pitalized with acute myocardial infarction, the best estimate was 696 deaths prevented or post-poned. The minimum estimate from the multiple-way sensitivity analysis was 259, and the maxi-mum estimate was 1501 (Table 3).
R esult s
From 1980 to 2000, the age-adjusted rate of coro-nary heart disease fell from 542.9 to 266.8 cases per 100,000 population among men aged 25 to 84 years and from 263.3 to 134.4 among women aged 25 to 84 years. In 1980, a total of 462,984 deaths among people in this age group were re-corded as due to coronary heart disease, according to the International Classification of Diseases, 9th Revi-sion (codes 410–414 and 429.2).41 In 2000, a total of 337,658 such deaths were recorded, according to the International Classification of Diseases, 10th Re-vision (codes I20–I25).42 However, had the age-specific death rates from 1980 remained in 2000, an additional 341,745 deaths from coronary heart disease would have occurred.
The U.S. IMPACT model explained approxi-mately 308,965 (90%) of this decrease in the number of deaths from coronary heart disease. Under the assumptions of the sensitivity analysis,
Table 3. Example of a Multiple-Way Sensitivity Analysis.*
EstimateNo. of
Patients (a)†Proportion Receiving
Treatment (b)‡Relative Mortality
Reduction (c)‡1-Year Case
Fatality Rate (d)‡
No. of Deaths Prevented or
Postponed (a × b × c × d)
percent
Best 102,280 0.84 15 5.4 696
Minimum 81,824 0.67 11 4.3 259
Maximum 122,736 0.99 19 6.5 1501
* In the United States in 2000, about 102,280 men aged 55 to 64 years were hospitalized with acute myocardial infarction, of whom approximately 84% were given aspirin. Aspirin use reduced the case fatality rate by approximately 15%. The un-derlying 1-year case fatality rate in these men was approximately 5.4%. The calculated number of deaths prevented or postponed was approximately 696. A multiple-way sensitivity analysis was then performed. Lower and upper bounds for each variable were estimated with use of 95% confidence intervals, when available, or failing that, with use of calculated bounds of ±20% (treatment uptake, however, was capped at 99%). Multiplying all lower-bound estimates together yielded the lower-bound estimate of deaths prevented or postponed, and multiplying all upper-bound estimates together yielded the upper-bound estimate of deaths prevented or postponed.
† Numbers of patients are from the National Hospital Discharge Survey37 and the Medical Expenditure Panel Survey.38
‡ Treatment data are from Rogers et al.,39 data on mortality reduction are from the Antithrombotic Trialists’ Collabor-ation,40 and case fatality rates are from Capewell et al.26
Copyright © 2007 Massachusetts Medical Society. All rights reserved. Downloaded from www.nejm.org at UNIVERSITE PAUL-SABATIER TOULO on November 30, 2007 .
Explaining the Decrease in Deaths from Coronary Disease
n engl j med 356;23 www.nejm.org june 7, 2007 2395
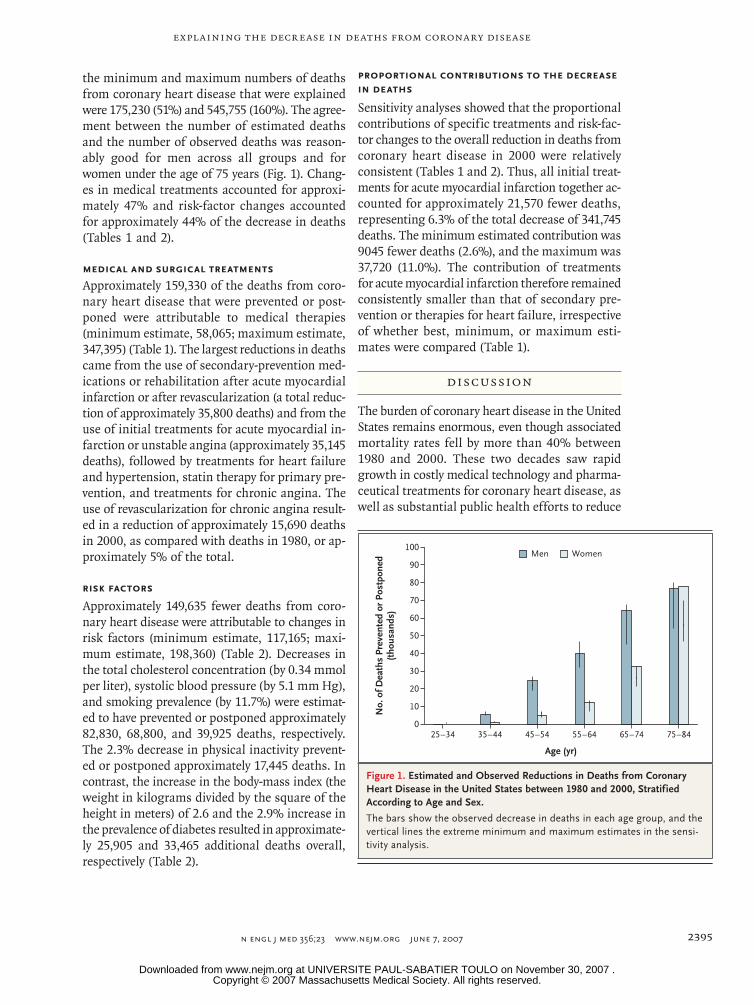
the minimum and maximum numbers of deaths from coronary heart disease that were explained were 175,230 (51%) and 545,755 (160%). The agree-ment between the number of estimated deaths and the number of observed deaths was reason-ably good for men across all groups and for women under the age of 75 years (Fig. 1). Chang-es in medical treatments accounted for approxi-mately 47% and risk-factor changes accounted for approximately 44% of the decrease in deaths (Tables 1 and 2).
Medical and Surgical Treatments
Approximately 159,330 of the deaths from coro-nary heart disease that were prevented or post-poned were attributable to medical therapies (minimum estimate, 58,065; maximum estimate, 347,395) (Table 1). The largest reductions in deaths came from the use of secondary-prevention med-ications or rehabilitation after acute myocardial infarction or after revascularization (a total reduc-tion of approximately 35,800 deaths) and from the use of initial treatments for acute myocardial in-farction or unstable angina (approximately 35,145 deaths), followed by treatments for heart failure and hypertension, statin therapy for primary pre-vention, and treatments for chronic angina. The use of revascularization for chronic angina result-ed in a reduction of approximately 15,690 deaths in 2000, as compared with deaths in 1980, or ap-proximately 5% of the total.
Risk Factors
Approximately 149,635 fewer deaths from coro-nary heart disease were attributable to changes in risk factors (minimum estimate, 117,165; maxi-mum estimate, 198,360) (Table 2). Decreases in the total cholesterol concentration (by 0.34 mmol per liter), systolic blood pressure (by 5.1 mm Hg), and smoking prevalence (by 11.7%) were estimat-ed to have prevented or postponed approximately 82,830, 68,800, and 39,925 deaths, respectively. The 2.3% decrease in physical inactivity prevent-ed or postponed approximately 17,445 deaths. In contrast, the increase in the body-mass index (the weight in kilograms divided by the square of the height in meters) of 2.6 and the 2.9% increase in the prevalence of diabetes resulted in approximate-ly 25,905 and 33,465 additional deaths overall, respectively (Table 2).
Proportional Contributions to the Decrease in Deaths
Sensitivity analyses showed that the proportional contributions of specific treatments and risk-fac-tor changes to the overall reduction in deaths from coronary heart disease in 2000 were relatively consistent (Tables 1 and 2). Thus, all initial treat-ments for acute myocardial infarction together ac-counted for approximately 21,570 fewer deaths, representing 6.3% of the total decrease of 341,745 deaths. The minimum estimated contribution was 9045 fewer deaths (2.6%), and the maximum was 37,720 (11.0%). The contribution of treatments for acute myocardial infarction therefore remained consistently smaller than that of secondary pre-vention or therapies for heart failure, irrespective of whether best, minimum, or maximum esti-mates were compared (Table 1).
Discussion
The burden of coronary heart disease in the United States remains enormous, even though associated mortality rates fell by more than 40% between 1980 and 2000. These two decades saw rapid growth in costly medical technology and pharma-ceutical treatments for coronary heart disease, as well as substantial public health efforts to reduce
22p3
Men Women
No.
of D
eath
s Pr
even
ted
or P
ostp
oned
(tho
usan
ds)
80
90
70
60
40
30
10
50
20
025–34 35–44 45–54 55–64 65–74 75–84
Age (yr)
100
AUTHOR:
FIGURE:
JOB: ISSUE:
4-CH/T
RETAKE
SIZE
ICM
CASE
EMail LineH/TCombo
Revised
AUTHOR, PLEASE NOTE:Figure has been redrawn and type has been reset.
Please check carefully.
REG F
Enon
1st2nd3rd
Ford
1 of 2
06-07-07
ARTIST: ts
35623
Figure 1. Estimated and Observed Reductions in Deaths from Coronary Heart Disease in the United States between 1980 and 2000, Stratified According to Age and Sex.
The bars show the observed decrease in deaths in each age group, and the vertical lines the extreme minimum and maximum estimates in the sensi-tivity analysis.
Copyright © 2007 Massachusetts Medical Society. All rights reserved. Downloaded from www.nejm.org at UNIVERSITE PAUL-SABATIER TOULO on November 30, 2007 .

T h e n e w e ng l a nd j o u r na l o f m e dic i n e
n engl j med 356;23 www.nejm.org june 7, 20072396
the prevalence of major cardiovascular risk fac-tors. Establishing the relative contributions of these two approaches is therefore of considerable importance. We found that reductions in major risk factors probably accounted for approximate-ly half the decrease in deaths from coronary heart disease, as in most other industrialized countries studied.15-22 Earlier U.S. studies likewise suggest-ed a contribution of approximately 54% of the reduction in deaths between 1968 and 197614 and approximately 50% between 1980 and 1990.13
Irrespective of the assumptions used, we found that the largest contributions from medical ther-apies consistently came from secondary preven-tion, followed by treatments for acute coronary syndromes, then heart failure. Revascularization by means of CABG or angioplasty for stable or unstable disease together accounted for approxi-mately 7% of the overall drop in deaths from coro-nary heart disease, a finding that is consistent with the results of previous studies in the United States43 and elsewhere.19-22,44
Although most of the changes in treatments and risk factors between 1980 and 2000 led to reductions in deaths from coronary heart disease, two major exceptions are noteworthy. Our analy-sis estimated that increases in the body-mass index accounted overall for about 26,000 addi-tional deaths from coronary heart disease in 2000 and increases in the prevalence of diabetes for about 33,500 additional deaths; both figures are consistent with the results of other recent stud-ies.45,46 Efforts to address these two risk factors should therefore receive particular attention in fu-ture measures to improve the public health.10,11
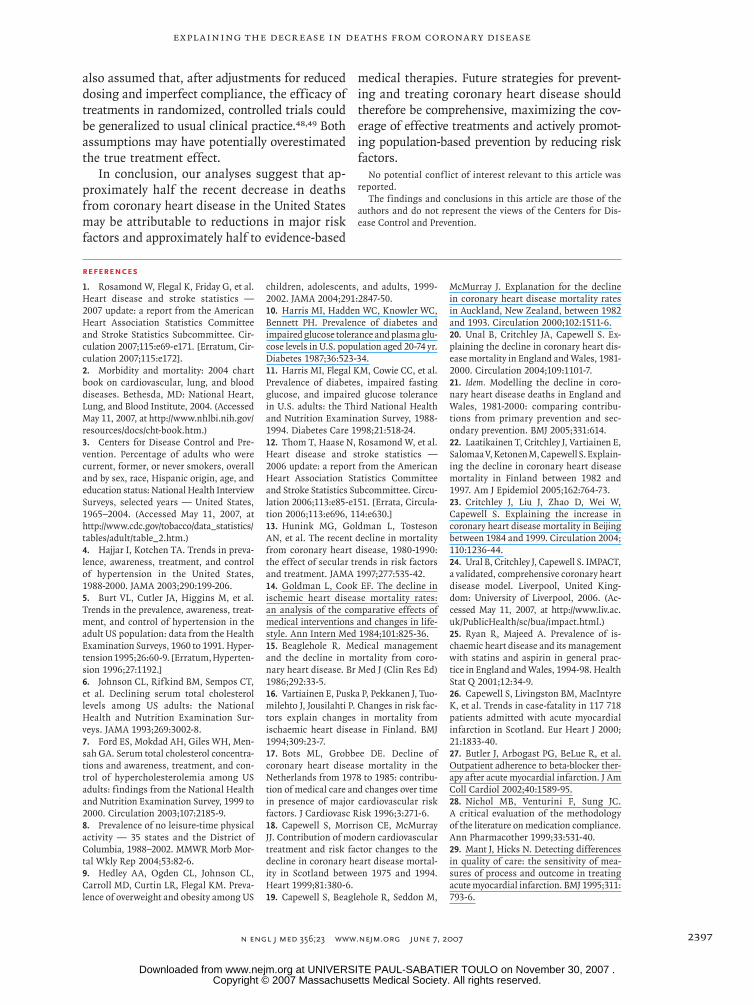
Modeling studies have a number of potential strengths, including the ability to transparent-ly integrate and simultaneously consider huge amounts of data from many sources and then test explicit assumptions by means of sensitivity analy-ses. Our analysis of extremes suggested that the proportional contributions to the overall reduc-tions in deaths from specific treatments and risk-factor changes remained reasonably consistent, ir-respective of whether best, minimum, or maximum estimates were considered (Tables 1 and 2). This was reassuring, as was the general consistency with the results of most studies performed else-where (Fig. 2).15-17,19,20
However, all modeling analyses should be in-terpreted with appropriate caution. All require the gathering of data from numerous sources, each with recognized limitations. We sometimes had to use data from studies that might have been limited by geographic, ethnic, or selection bias or by the need to extrapolate to older age groups. Risk estimates were not necessarily fully indepen-dent of each other. Furthermore, most interac-tions were averaged across broad groups. We therefore made the explicit assumptions detailed in the Supplementary Appendix. Furthermore, we analyzed only the estimated reduction in deaths from coronary heart disease, not life-years gained or improvement in the quality of life.47 Analyses of these changes are warranted, as well as com-parisons among racial and ethnic groups and economic analyses.
The estimates of changes in risk factors re-main imprecise. Furthermore, we did not explicit-ly consider the effect of lag times; however, they may be relatively unimportant over a 20-year pe-riod.20,23,33,35 Although major efforts were made to address overlaps, residual double counting of some individual patients remains possible. We
22p3
Treatments Risk factors Unexplained
The Netherlands, 1978–8517
New Zealand, 1974–8115
United States, 1980–9013
IMPACT Scotland, 1975–9418
IMPACT England and Wales,1981–200020
IMPACT United States, 1980–2000(our study)
IMPACT Finland, 1982–9722
IMPACT New Zealand, 1982–9319
Finland, 1972–9216
0 50 100
Decrease in Deaths (%)
United States, 1968–7614
AUTHOR:
FIGURE:
JOB: ISSUE:
4-CH/T
RETAKE
SIZE
ICM
CASE
EMail LineH/TCombo
Revised
AUTHOR, PLEASE NOTE:Figure has been redrawn and type has been reset.
Please check carefully.
REG F
Enon
1st
2nd3rd
Ford
2 of 2
06-07-07
ARTIST: ts
35623
40 54
40 60
46 44 10
43 50 7
35 55 10
35 60 5
38 52 10
47 44
24 76
23
9
53 24
6
Figure 2. Percentage of the Decrease in Deaths from Coronary Heart Disease Attributed to Treatments and Risk-Factor Changes in Our Study Population and in Other Populations.
In the New Zealand study, 1974 to 1981 (Beaglehole15), the analysis focused on specific treatments and inferred contribution from risk factors. In the Finland study, 1972 to 1992 (Vartiainen et al.16), the analysis focused on risk factors and inferred contribution from treatments.
Copyright © 2007 Massachusetts Medical Society. All rights reserved. Downloaded from www.nejm.org at UNIVERSITE PAUL-SABATIER TOULO on November 30, 2007 .
Explaining the Decrease in Deaths from Coronary Disease
n engl j med 356;23 www.nejm.org june 7, 2007 2397
also assumed that, after adjustments for reduced dosing and imperfect compliance, the efficacy of treatments in randomized, controlled trials could be generalized to usual clinical practice.48,49 Both assumptions may have potentially overestimated the true treatment effect.
In conclusion, our analyses suggest that ap-proximately half the recent decrease in deaths from coronary heart disease in the United States may be attributable to reductions in major risk factors and approximately half to evidence-based
medical therapies. Future strategies for prevent-ing and treating coronary heart disease should therefore be comprehensive, maximizing the cov-erage of effective treatments and actively promot-ing population-based prevention by reducing risk factors.
No potential conflict of interest relevant to this article was reported.
The findings and conclusions in this article are those of the authors and do not represent the views of the Centers for Dis-ease Control and Prevention.
References
Rosamond W, Flegal K, Friday G, et al. Heart disease and stroke statistics — 2007 update: a report from the American Heart Association Statistics Committee and Stroke Statistics Subcommittee. Cir-culation 2007;115:e69-e171. [Erratum, Cir-culation 2007;115:e172].
Morbidity and mortality: 2004 chart book on cardiovascular, lung, and blood diseases. Bethesda, MD: National Heart, Lung, and Blood Institute, 2004. (Accessed May 11, 2007, at http://www.nhlbi.nih.gov/resources/docs/cht-book.htm.)
Centers for Disease Control and Pre-vention. Percentage of adults who were current, former, or never smokers, overall and by sex, race, Hispanic origin, age, and education status: National Health Interview Surveys, selected years — United States, 1965–2004. (Accessed May 11, 2007, at http://www.cdc.gov/tobacco/data_statistics/ tables/adult/table_2.htm.)
Hajjar I, Kotchen TA. Trends in preva-lence, awareness, treatment, and control of hypertension in the United States, 1988-2000. JAMA 2003;290:199-206.
Burt VL, Cutler JA, Higgins M, et al. Trends in the prevalence, awareness, treat-ment, and control of hypertension in the adult US population: data from the Health Examination Surveys, 1960 to 1991. Hyper-tension 1995;26:60-9. [Erratum, Hyperten-sion 1996;27:1192.]
Johnson CL, Rifkind BM, Sempos CT, et al. Declining serum total cholesterol levels among US adults: the National Health and Nutrition Examination Sur-veys. JAMA 1993;269:3002-8.
Ford ES, Mokdad AH, Giles WH, Men-sah GA. Serum total cholesterol concentra-tions and awareness, treatment, and con-trol of hypercholesterolemia among US adults: findings from the National Health and Nutrition Examination Survey, 1999 to 2000. Circulation 2003;107:2185-9.
Prevalence of no leisure-time physical activity — 35 states and the District of Columbia, 1988–2002. MMWR Morb Mor-tal Wkly Rep 2004;53:82-6.
Hedley AA, Ogden CL, Johnson CL, Carroll MD, Curtin LR, Flegal KM. Preva-lence of overweight and obesity among US
1.
2.
3.
4.
5.
6.
7.
8.
9.
children, adolescents, and adults, 1999-2002. JAMA 2004;291:2847-50.
Harris MI, Hadden WC, Knowler WC, Bennett PH. Prevalence of diabetes and impaired glucose tolerance and plasma glu-cose levels in U.S. population aged 20-74 yr. Diabetes 1987;36:523-34.
Harris MI, Flegal KM, Cowie CC, et al. Prevalence of diabetes, impaired fasting glucose, and impaired glucose tolerance in U.S. adults: the Third National Health and Nutrition Examination Survey, 1988-1994. Diabetes Care 1998;21:518-24.
Thom T, Haase N, Rosamond W, et al. Heart disease and stroke statistics — 2006 update: a report from the American Heart Association Statistics Committee and Stroke Statistics Subcommittee. Circu-lation 2006;113:e85-e151. [Errata, Circula-tion 2006;113:e696, 114:e630.]
Hunink MG, Goldman L, Tosteson AN, et al. The recent decline in mortality from coronary heart disease, 1980-1990: the effect of secular trends in risk factors and treatment. JAMA 1997;277:535-42.
Goldman L, Cook EF. The decline in ischemic heart disease mortality rates: an analysis of the comparative effects of medical interventions and changes in life-style. Ann Intern Med 1984;101:825-36.
Beaglehole R. Medical management and the decline in mortality from coro-nary heart disease. Br Med J (Clin Res Ed) 1986;292:33-5.
Vartiainen E, Puska P, Pekkanen J, Tuo-milehto J, Jousilahti P. Changes in risk fac-tors explain changes in mortality from ischaemic heart disease in Finland. BMJ 1994;309:23-7.
Bots ML, Grobbee DE. Decline of coronary heart disease mortality in the Netherlands from 1978 to 1985: contribu-tion of medical care and changes over time in presence of major cardiovascular risk factors. J Cardiovasc Risk 1996;3:271-6.
Capewell S, Morrison CE, McMurray JJ. Contribution of modern cardiovascular treatment and risk factor changes to the decline in coronary heart disease mortal-ity in Scotland between 1975 and 1994. Heart 1999;81:380-6.
Capewell S, Beaglehole R, Seddon M,
10.
11.
12.
13.
14.
15.
16.
17.
18.
19.
McMurray J. Explanation for the decline in coronary heart disease mortality rates in Auckland, New Zealand, between 1982 and 1993. Circulation 2000;102:1511-6.
Unal B, Critchley JA, Capewell S. Ex-plaining the decline in coronary heart dis-ease mortality in England and Wales, 1981-2000. Circulation 2004;109:1101-7.
Idem. Modelling the decline in coro-nary heart disease deaths in England and Wales, 1981-2000: comparing contribu-tions from primary prevention and sec-ondary prevention. BMJ 2005;331:614.
Laatikainen T, Critchley J, Vartiainen E, Salomaa V, Ketonen M, Capewell S. Explain-ing the decline in coronary heart disease mortality in Finland between 1982 and 1997. Am J Epidemiol 2005;162:764-73.
Critchley J, Liu J, Zhao D, Wei W, Capewell S. Explaining the increase in coronary heart disease mortality in Beijing between 1984 and 1999. Circulation 2004; 110:1236-44.
Ural B, Critchley J, Capewell S. IMPACT, a validated, comprehensive coronary heart disease model. Liverpool, United King-dom: University of Liverpool, 2006. (Ac-cessed May 11, 2007, at http://www.liv.ac.uk/PublicHealth/sc/bua/impact.html.)
Ryan R, Majeed A. Prevalence of is-chaemic heart disease and its management with statins and aspirin in general prac-tice in England and Wales, 1994-98. Health Stat Q 2001;12:34-9.
Capewell S, Livingston BM, MacIntyre K, et al. Trends in case-fatality in 117 718 patients admitted with acute myocardial infarction in Scotland. Eur Heart J 2000; 21:1833-40.
Butler J, Arbogast PG, BeLue R, et al. Outpatient adherence to beta-blocker ther-apy after acute myocardial infarction. J Am Coll Cardiol 2002;40:1589-95.
Nichol MB, Venturini F, Sung JC. A critical evaluation of the methodology of the literature on medication compliance. Ann Pharmacother 1999;33:531-40.
Mant J, Hicks N. Detecting differences in quality of care: the sensitivity of mea-sures of process and outcome in treating acute myocardial infarction. BMJ 1995;311: 793-6.
20.
21.
22.
23.
24.
25.
26.
27.
28.
29.
Copyright © 2007 Massachusetts Medical Society. All rights reserved. Downloaded from www.nejm.org at UNIVERSITE PAUL-SABATIER TOULO on November 30, 2007 .
n engl j med 356;23 www.nejm.org june 7, 20072398
Explaining the Decrease in Deaths from Coronary Disease
National Center for Health Statistics. Plan and operation of the second National Health and Nutrition Examination Survey 1976-80. Programs and collection proce-dures, series 1, no. 15. Hyattsville, MD: National Center for Health Statistics, 1981. (DHHS publication no. (PHS) 81-1317).
Idem. NHANES 1999-2000. (Accessed May 11, 2007, at http://www.cdc.gov/nchs/about/major/nhanes/NHANES99_00.htm.)
Mokdad AH, Stroup DF, Giles WH. Public health surveillance for behavioral risk factors in a changing environment: recommendations from the Behavioral Risk Factor Surveillance Team. MMWR Recomm Rep 2003;52(RR-9):1-12.
Lewington S, Clarke R, Qizilbash N, Peto R, Collins R. Age-specific relevance of usual blood pressure to vascular mor-tality: a meta-analysis of individual data for one million adults in 61 prospective studies. Lancet 2002;360:1903-13. [Erra-tum, Lancet 2003;361:1060.]
Critchley JA, Capewell S. Mortality risk reduction associated with smoking cessa-tion in patients with coronary heart dis-ease: a systematic review. JAMA 2003;290: 86-97.
Law MR, Wald NJ, Thompson SG. By how much and how quickly does reduc-tion in serum cholesterol concentration lower risk of ischaemic heart disease? BMJ 1994;308:367-72.
Briggs A, Sculpher M, Buxton M. Un-certainty in the economic evaluation of health care technologies: the role of sen-
30.
31.
32.
33.
34.
35.
36.
sitivity analysis. Health Econ 1994;3:95-104.
Design and operation of the National Hospital Discharge Survey: 1988 redesign. Programs and collection procedures, series 1, no. 39. Hyattsville, MD: National Center for Health Statistics, 2000. (DHHS publi-cation no. (PHS) 2001-1315.)
The Medical Expenditure Panel Survey. Rockville, MD: Agency for Healthcare Re-search and Quality. (Accessed May 11, 2007, at http://www.meps.ahrq.gov/mepsweb.)
Rogers WJ, Canto JG, Lambrew CT, et al. Temporal trends in the treatment of over 1.5 million patients with myocardial infarction in the U.S. from 1990 through 1999: the National Registry of Myocardial Infarction 1, 2 and 3. J Am Coll Cardiol 2000;36:2056-63.
Antithrombotic Trialists’ Collabora-tion. Collaborative meta-analysis of ran-domized trials of antiplatelet therapy for prevention of death, myocardial infarction, and stroke in high risk patients. BMJ 2002; 324:71-86.
Department of Health and Human Ser-vices. International classification of dis-eases, 9th revision, clinical modification: ICD-9-CM. Washington, DC. Department of Health and Human Services, 1980. (DHHS publication no. (PHS) 80-1260.)
International statistical classification of diseases and related health problems, 10th rev., ICD-10. Geneva: World Health Organization, 1992.
Doliszny KM, Luepker RV, Burke GL,
37.
38.
39.
40.
41.
42.
43.
Pryor DB, Blackburn H. Estimated con-tribution of coronary artery bypass graft surgery to the decline in coronary heart disease mortality: the Minnesota Heart Survey. J Am Coll Cardiol 1994;24:95-103.
Cooper K, Davies R, Roderick P, Chase D, Raftery J. The development of a simula-tion model of the treatment of coronary heart disease. Health Care Manag Sci 2002; 5:259-67.
Flegal KM, Graubard BI, Williamson DF, Gail MH. Excess deaths associated with underweight, overweight, and obesity. JAMA 2005;293:1861-7.
Olshansky SJ, Passaro DJ, Hershow RC, et al. A potential decline in life expec-tancy in the United States in the 21st cen-tury. N Engl J Med 2005;352:1138-45.
Unal B, Critchley JA, Fidan D, Capewell S. Life-years gained from modern cardio-logical treatments and population risk factor changes in England and Wales, 1981-2000. Am J Public Health 2005;95: 103-8.
McAlister FA. Relative treatment effects are consistent across the spectrum of un-derlying risks . . . usually. Int J Epidemiol 2002;31:76-7.
Hippisley-Cox J, Coupland C. Effect of combinations of drugs on all cause mortality in patients with ischaemic heart disease: nested case-control analysis. BMJ 2005;330:1059-63. [Erratum, BMJ 2006; 332:912.]Copyright © 2007 Massachusetts Medical Society.
44.
45.
46.
47.
48.
49.
full text of all journal articles on the world wide web
Access to the complete text of the Journal on the Internet is free to all subscribers. To use this Web site, subscribers should go to the Journal’s home page (www.nejm.org) and register by entering their names and subscriber numbers as they appear on their mailing labels. After this one-time registration, subscribers can use their passwords to log on for electronic access to the entire Journal from any computer that is connected to the Internet. Features include a library of all issues since January 1993 and abstracts since January 1975, a full-text search capacity, and a personal archive for saving articles and search results of interest. All articles can be printed in a format that is virtually identical to that of the typeset pages. Beginning 6 months after publication, the full text of all Original Articles and Special Articles is available free to nonsubscribers who have completed a brief registration.
Copyright © 2007 Massachusetts Medical Society. All rights reserved. Downloaded from www.nejm.org at UNIVERSITE PAUL-SABATIER TOULO on November 30, 2007 .