explained and unexplained wage gaps across the main ethno-religious groups in great britain
TRANSCRIPT
1
Explained and unexplained wage gaps across the main ethno-religious
groups in Great Britain
By Simonetta Longhi*, Cheti Nicoletti†, and Lucinda Platt‡
* Institute for Social and Economic Research, University of Essex, Colchester CO43YU; and IZA Bonn; email: [email protected] † Department of Economics and Related Studies, The University of York ‡ Centre for Longitudinal Studies, Institute of Education, University of London
We analyse the difference in average wages (the so called ‘wage gap’) of selected ethno-religious groups in Great Britain at the mean and over the wage distribution with the aim of explaining why such wage gaps differ across minority groups. We distinguish minorities not only by their ethno-religious background, but also by country (UK or abroad) in which people grew up and acquired their qualifications. We find that within all minority ethno-religious groups the second generation achieves higher wages than the first generation, but the amount that is explained by characteristics does not necessarily increase with generation. JEL classifications: C21, J32, J71
1. Introduction
Wage gaps of immigrants and ethnic minorities are well attested across a range of national
contexts, and have often been analysed through decomposition methods. The gap is usually
decomposed into an explained and an unexplained component, to ascertain the extent to
which minorities are disadvantaged by worse personal or job characteristics or by labour
market discrimination (e.g. Reimers, 1983; Schafgans, 1998; Elliott and Lindley, 2008).
Often, the unexplained part turns out to be rather large, and this is partly due to the focus on
minorities that include heterogeneous sub-groups. In the UK, for example, empirical studies
have aggregated all South Asian ethnic groups, which include minorities such as Indians,
who do relatively well compared to the majority, and Pakistanis, who face extremely low
average wages (Dustmann and Fabbri, 2005; Platt, 2006). Important distinctions have been
also found for immigrant minorities both according to the country of origin and to the length
of stay in the country of destination (Hum and Simpson, 1999; McCall, 2001; Card, 2005).
For the UK, research on ethnic disadvantage in access to the labour market has
dominated that on wages (e.g. Heath and McMahon, 1997; Berthoud, 2000; Wheatley Price,
2001; Kan and Heath, 2006); and analyses of wage gaps have focused on immigrants but
2
tended to neglect ethnicity (e.g. Bell, 1997; Shields and Wheatley Price, 1998; Dustmann and
Fabbri, 2005). Most existing information on the sources of ethnic wage gaps in the UK
comes from a series of studies by Blackaby and colleagues, who often find that
characteristics of the minority only explain a very small part of a large gap (Blackaby et al.,
2002). These results prove to be very sensitive to the way ethnic groups are disaggregated:
the higher the level of aggregation the lower the proportion of the gap that can be explained
through characteristics. Elliott and Lindley (2008) use decomposition methods to analyse
wages of immigrants by broad ethnic groups: white, black, south Asian, and others. They
only partly distinguish between generations by also analysing the wages of UK-born non-
white workers and find that immigrants are overrepresented in occupations with lower and
higher wages, but that a significant wage gap remains for both the non-white who are UK
born and for non-white immigrants.
In contrast to the previous literature, we compare fairly homogeneous minority
groups, which we define by a combination of ethnic origin, religion, and age of arrival in the
UK. Groups defined in this way tend to summarise different cultures and migration histories
and display distinctive profiles across a range of characteristics. We focus on three groups
that have a relatively large presence in the UK, and which represent meaningful social
groups: Indian Hindus, Indian Muslims, and Pakistani Muslims.1
In all cases we separate people who grew up in the UK from those who grew up abroad. By
these means we hope to provide a more precise and more easily interpretable estimate of the
unexplained component of wage gaps, although this comes at the cost of reduced sample
sizes. Our reference group for the computation of the wage gaps is that of the majority: UK-
born White British Christian men.
Our analysis can be compared to that of Algan et al. (2009), who compare labour
market outcomes of first and second generation (defined by country of birth) ethnic
minorities to those of white UK born. However, they do not account for within-group
heterogeneity that can be proxied by differences in religious affiliation, and they identify
wage gaps simply by including dummies for ethnicity in the wage regressions, thus assuming
that returns to the other characteristics are the same across groups. We develop this analysis
1 It has to be noted that in this case religious denomination is likely to be a proxy for characteristics of the ethnic minority that are not observed in the data; hence, our results do not necessarily isolate the effects of religion per se (see also Section 2.1).
3
by including religious denomination and by using decomposition methods to quantify and
analyse the wage gaps.
We decompose wage gaps using a combination of weighting and regression
approaches, as proposed by Firpo et al. (2007). The ‘recentered influence function
regression’ is used to extend the Oaxaca-Blinder decomposition from linear regression
models to quantile regressions, while weights are used to relax the linearity assumptions
imposed by regression models adopted in the Oaxaca-Blinder and the recentered influence
function approaches.
Our results suggest that Indian Hindus fare comparatively well in the UK labour
market, while Pakistani Muslims have the largest wage gaps. The experience of Indian
Muslims falls in between that of Indian Hindus and that of Pakistani Muslims, but seems
closer to that of Pakistanis. Unexplained differences in wages decline for second generations
but there are still large unexplained components for some groups. Looking across the
distribution, the results provide some suggestion of a glass ceiling for the most advantaged
minorities, but no evidence of a sticky floor for the least advantaged. Instead, we see that
wage gaps mostly come about through sorting into particular occupations and into part-time
work for less advantaged groups, while the more advantaged minorities are not doing as well
as their occupational distribution might suggest.
2. Previous literature and new contributions
2.1. Heterogeneity within ethnic groups
There is a large literature on wages of ethnic minorities. We focus here only on those studies
using decomposition methods to describe ethnic wage gaps in the UK. Most of the earlier
contributions on ethnic wage gaps in the UK derive from a series of studies by Blackaby and
colleagues. Blackaby et al. (1994) decomposed black/white wage gaps for 1973-1979 and
1983-1989, including immigrant status as one of the characteristics in the decomposition.
Blackaby et al. (1998) repeated the analysis for the 1990s, this time distinguishing between
ethnic groups, including Black, Indian and Pakistani; the wage decomposition included
length of stay in the UK as one of the explanatory factors. Blackaby et al. (2002) returned to
the analysis at more length and showed the importance of taking account of the differential
age structure between minorities and majority and whether or not the minorities were UK
born. However, while they distinguished the first generation according to ethnicity (Black,
Indian, and Pakistani), sample sizes restricted their analysis of UK born ethnic minorities to
4
one aggregate group. In all cases Blackaby et al., found that characteristics only explained a
very small part of a large gap, though with some variation across groups (in this latter case
nearly half of the wage gap of Pakistanis was explained). The analysis was further extended
including more years of data and samples of reference and minority groups matched on age
and region, and concentrating on the UK born only, on the basis that they cannot be expected
to have the potential disadvantages associated with immigration (Blackaby et al., 2002). In
this case, characteristics were found to explain about half of the Black-White wage gap
(chiefly through differences in educational qualifications) but not to contribute at all to
Pakistani or Indian wage gaps. The variation in these results reveals sensitivity to how
immigrants versus UK born are treated and the extent to which ethnic groups are
disaggregated. Given the heterogeneity across ethnic groups, it is not surprising that the
higher the level of aggregation the less it is possible to explain these gaps through
characteristics.
In the UK, ethnic groups are rather heterogeneous and employment patterns vary in
distinctive ways within groups by both religious affiliation and by whether the minority
group member is first generation (immigrant) or second or subsequent generation (Clark and
Drinkwater, 2009). Generation has also been shown to be important in relation to wages
(Shields and Wheatley Price, 1998; Clark and Lindley, 2006), either because of lack of
familiarity with the context of the country of immigration, or through positive selection of
immigrants relative to the second generation, or because of differences in job-relevant skills
such as English language fluency between generations, or as a result of increasing rates of
qualifications across generations (Blackaby et al., 2002; Lindley, 2002a; Shields and
Wheatley Price, 2002; Dustmann and Fabbri, 2003; Dustmann and Theodoropoulos, 2010).
Though several analyses of labour market outcomes include controls for generation or for
time spent in the UK, it is not clear why we should expect the relationship between
generation and employment outcomes to be constant across groups. The immigrant
population shows huge polarisation in wages with some first generation groups (in particular
white migrants) faring extremely well, while for other groups being of the immigrant
generation is a source of labour market disadvantage; simply controlling for generation across
heterogeneous populations is therefore inappropriate and may over or under-state ethnic
group effects.
Increasing attention has been paid to differences in employment, including wages,
across religious groups. This has been explained in terms of religion impacting outcomes
either through the social network provided by religious affiliation or through discrimination
5
based on religion (Clark and Drinkwater, 2007, 2009; Purdam et al., 2007). However,
because of the partial overlap between ethnicity and religious affiliation, analyses based on
religious affiliation alone are hard to interpret. For example, the majority of Hindus are
Indian, though under half of UK Indians are Hindus, 30% are Sikhs and 13% are Muslims.
By contrast, almost all British Pakistanis and Bangladeshis affiliate to Islam and between
them they make up two thirds of UK Muslims. Simply controlling for religious affiliation
may well be misleading, since what is being distinguished (or combined) through religious
differentiation is not clear. In the case of India, people with different religious denomination
are likely to come from different parts of the country: Indians coming from the North are
comparatively more likely to be Muslim, while those coming from the South are more likely
to be Hindu.2 A more precise way of distinguishing the outcomes of different minorities,
may be to examine the experience of specific ethno-religious groups (Brown, 2000; Lindley,
2002b), with discrete histories, and migration backgrounds.
In our analysis we distinguish our minority groups according not only to their
ethnicity, but also to their religious affiliation and whether they are first or second generation
in order to investigate more precisely differences in wage gaps for a set of UK minority
groups. We construct three ethno-religious minority groups: Indian Hindus, Indian Muslims
and Pakistani Muslims. We also distinguish each of these groups between first and second
generation. For the first generation there will be more factors that may be relevant to wages
that we cannot include in our models, thus leading to larger unexplained components; we
would also expect these factors to differ by group: for example, there are substantial
differences in English language fluency across ethnic groups.
2.2. Heterogeneity between ethnic groups and new decomposition method
A further practical issue relates to heterogeneity between groups. Most decomposition
analyses of the wage gap use the Blinder-Oaxaca method. However, because this method
relies on a linear regression assumption and on out-of-sample predictions, it can be applied
only to explain mean differences and can lead to misleading results if the range of possible
values of the characteristics differs between majority and minority (Barsky et al., 2002).
Nevertheless, since it allows a detailed decomposition of the wage gap into the contribution
of each specific covariate, the Blinder-Oaxaca method is still widely used.
2 We are grateful to one referee for pointing this out.
6
Firpo et al. (2007) show how to generalise the Oaxaca decomposition of the mean gap
to quantiles, variance and other summary statistics by using the recentered influence function
(RIF) approach (Firpo et al., 2009). The RIF for a statistic (for example a quantile) is a
transformation of the outcome variable, in our case the log wage, such that its mean equals
the actual statistic. By assuming a linear relationship between the RIF and the explanatory
variables, we can then use the Oaxaca decomposition to explain differences in wages across
quantiles or other statistics. However, the computation of the counterfactual in this approach
is still based on a linearity assumption and possibly on out of the sample predictions.
A method which overcomes this limit is the weighting estimation (DiNardo et al.,
1996; Barsky et al., 2002). This involves the estimation of a model (e.g. logit) for the
probability of belonging to a minority rather than the majority using a set of explanatory
variables, and the use of its predictions to compute the weights, given by the ratio between
the probability of belonging to the majority and the probability of belonging to the minority.
Weighting methods require specifying and estimating a model only for the probability of
belonging to the minority, but do not provide a detailed decomposition.
By combining the RIF regression and weighting approaches we overcome the
limitations of each. We estimate the weighted linear regression of the RIF for each minority
group by using weights to equalise the empirical distributions of the covariates between
groups. This estimation is consistent if either the weights are correctly estimated or the
regression models are correctly specified. This means that we can be confident that our
estimates of explained and unexplained components are robust. The econometric details of
this approach are summarised in the Appendix.
2.3. Interpretation of the results of the decomposition
By using the combined weighting and regression approach, we are able to distinguish that
part of the wage gap which is explicable in terms of different characteristics, from that part
which stems from differences in returns to those characteristics and which is left unexplained.
It is conventional to perceive the explained component as representing legitimate differences
in wages and to attribute the unexplained component to discrimination (e.g. Nielsen, 2000;
Blackaby et al., 2002; Green and Ferber, 2005; Bjerk, 2007). However, it is unlikely that the
wage equation is able to control for all those factors which are relevant to wages other than
employer discrimination. We treat the unexplained component more cautiously as
7
comprising the effect of individual and labour market characteristics we have been unable to
measure directly, but which may include employer discrimination.3
Moreover, we argue that it is important to analyse the explained part of the
decomposition to understand to what extent wage gaps are related to systematic variation in
individual characteristics such as education or to sorting into particular types of occupation,
and the balance between them. If we argue that not all the unexplained component can be
interpreted as discrimination, we also suggest that the explained component is itself likely to
include the impact of discrimination within society as reflected in constraints on occupational
choices or lower educational outcomes in the second generation (Altonji and Blank, 1999).
Another way to look at the role of sorting and of the potential role of discrimination is
to analyse both the explained and the unexplained components at different parts of the wage
distribution. For example, unexplained disadvantage at the top of the distribution is
consistent with employer discrimination and a ‘glass ceiling’, while occupational sorting
among the lower paid fits with restricted employment opportunities or the development of
niche employment, where we would expect direct discrimination within the job to be less.
There is already some evidence of substantial variation in the wage distribution as well as in
the mean, with some groups having a much more concentrated distribution and others a more
extended one (Platt, 2006); however we still do not know the extent to which explanatory
factors and residuals differ across the distribution (though see Longhi and Platt, 2008 for a
preliminary investigation of this issue).
Looking across the distribution helps to determine the extent to which unexplained
differences in wages are more of an issue at the bottom (sticky floors) or the top (glass
ceilings) of the distribution, a distinction which has different policy implications. For these
reasons, we extend our decomposition analysis to consider the whole range of the wage
distribution. We analyse differences in mean gaps and at the 10th, 25th 50th, 75th and 90th
percentiles.
3. Data and descriptive statistics
The empirical analysis is based on 31 pooled quarters of the Labour Force Survey (LFS),
between the second quarter of 2002 (when religious affiliation was first asked) and the third
quarter of 2009. The LFS has a rotating panel design, in which respondents are interviewed
3 There is substantial evidence that employer discrimination does occur (Kan and Heath, 2006; Grewal et al., 2002; Wood et al., 2009), but to attempt to quantify its precise share of overall labour market disadvantage is likely to remain elusive.
8
for up to five successive quarters; we select respondents at their first interviews only,
resulting in unique observations for any individual.4 We also exclude Northern Ireland,
where the ethnicity question is not comparable with the question asked for the rest of the UK.
We focus the analysis on men only.
We combine information on ethnic group categories, on categories for religious
affiliation, on country of birth, year of birth and time of arrival in the UK to identify seven
ethno-religious and generation groups. We analyse wage gaps of six minority groups: Indian
Hindus, Indian Muslims and Pakistani Muslims, breaking each down by whether they were
born in the UK or came while they were still young enough to participate in compulsory
education at age 10 or under (second generation) or whether they arrived in the UK aged 11
or older (first generation). Although this is not the traditional way of defining first and
second generation immigrants, we believe it is a better way to define groups that – in the
labour market – can be seen as relatively homogeneous. People born abroad but raised in the
UK are likely to be more similar to UK born people of the same ethnicity than to people born
and raised abroad. Nevertheless, our general conclusions do not change if we define first and
second generations simply by country of birth.
We use UK born White British Christian as the majority group of reference. Christian
affiliation does not necessarily imply practice among White UK born, but represents a
cultural majority. White British people who do not affiliate to any religion are, however,
very similar to those who claim a Christian religion.
Data on wages refer to hourly wages for those in employment; it is based on usual
hours including paid overtime and usual wage in the main job. We deflate hourly wages to
prices at first quarter 2008 across all waves using the consumer price index provided by the
UK Office for National Statistics (to account for other year-specific characteristics we also
include in the model year dummies). Since there is relatively high non-response on earnings
questions, in addition to those sample weights that aim to render the sample as a whole
representative of the population, the LFS provides separate weights for wage data, which take
into account both non-response and design effects. We adjust wages by these ‘income
weights’ in all the analyses.
To avoid including people who have not yet completed their education alongside
those who have, we focus only on men aged from 23 to 64. Rates of staying on in education
vary across ethnic groups, but by the age of 23 few are still in full-time education.
4 For more details on sample and survey methodology see the LFS User Guide, Vol. 1.
9
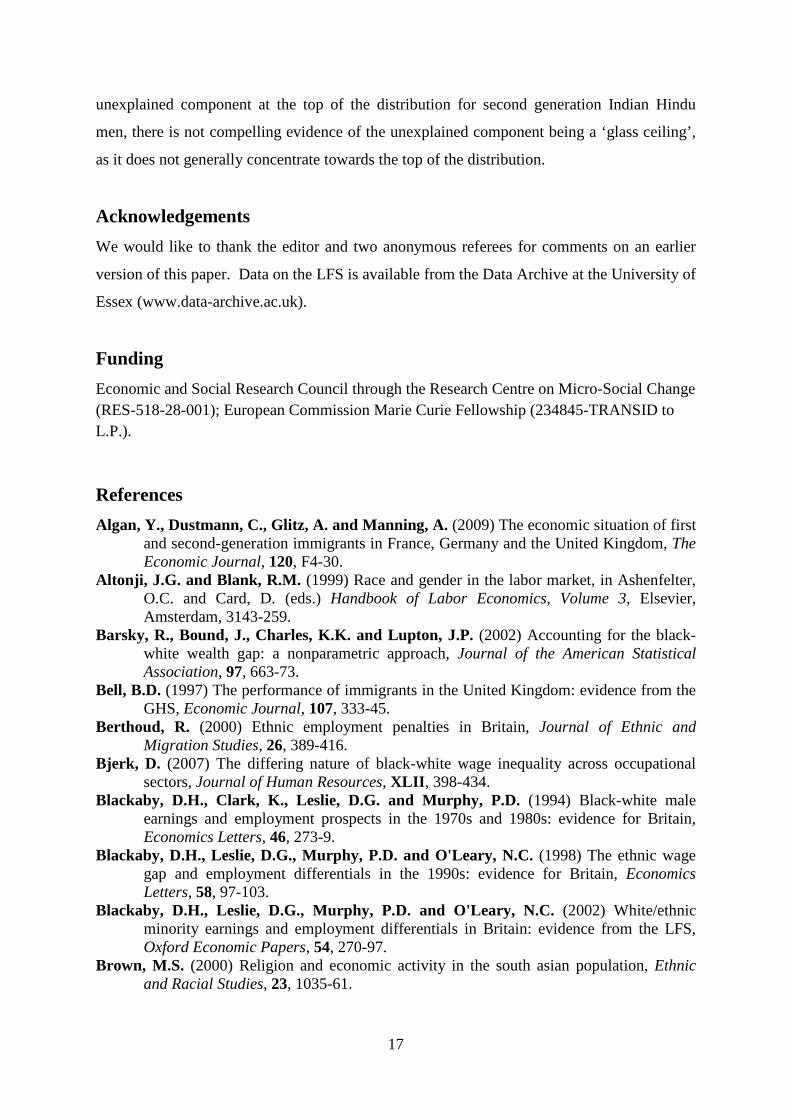
As shown in Table 1, overall, average wages of first and second generation Indian
Hindu men are higher than wages of White British Christian men, while for Indian Muslim
and Pakistani Muslim men there are substantial average wage gaps for both the first and
second generations. For all groups, wages increase between the first and the second
generation; mean gaps of Pakistani Muslim men reduce considerably when moving from the
first to the second generation.
TABLE 1 ABOUT HERE
To reduce the possibility of out-of-sample predictions the explanatory variables (also
shown in Table 1) are defined so as to maximise the overlap between the minority and the
reference category. Hence, because the age ranges of our minority groups – especially for the
second generation – are different from those of the majority, rather than including age in
years we only use a dummy for whether aged over 34. Similarly, instead of including years
of job tenure, we use a dummy for those with five or more years of job tenure.
Among qualification levels, it has to be noted that for migrants ‘other qualifications’
often include those obtained abroad for which it is not always straightforward to identify a
UK equivalent. Possession of other qualifications may, therefore, proxy for a number of
aspects of migrant experience which can result in labour market disadvantage, whether
through lack of recognition (of e.g. experience or skills) or through lack of congruence
between jobs gained and skills, or lack of familiarity with the UK labour market.5
We include dummies for the 1-digit Standard Occupation Classification (SOC), as
well as five occupations at the 3-digit level in which certain minority groups show relatively
high concentrations.6 As shown in Table 1, minority groups appear to be more concentrated
in specific occupations than White British Christians are, though the second generations are
much less concentrated than first generations.
It can be argued that occupations might be endogenous to wages. However, this need
not be a problem for our analysis: our aim is to describe the relationship between wage gaps
and differences in characteristics between ethnic groups rather than to make inference on
causal relationships. The decomposition approach is useful to identify potential determinants 5 Since ‘other qualifications’ might include foreign qualifications of different levels, as a sensitivity analysis we have also estimated our models using years of education instead of qualifications. The explained part of the wage gaps is now slightly smaller, but the general patterns across ethno-religious groups and generations remain unchanged. 6 These have been identified using data for all men aged 16-64 in employment, whether or not their wage data are available.
10
of the wage gap, but remains an exploratory analysis which does not take account of potential
endogeneity issues.
In the next section we summarise the extent to which wage gaps can be explained by
differences in job, worker and firm characteristics across minorities and the White British
Christian majority. The signs have been set so that wage gaps are expressed as positive and
wage advantages (or the reverse of gaps) are expressed as negative. We show differences in
wages at the mean and five quantiles, the amount that is explained according to the combined
weighting and regression approach, the amount unexplained (i.e. the gap minus the
explained), and the amount that is explained according to a generalised Oaxaca
decomposition. Where the wage gap itself is statistically significant and the amount
explained by characteristics is similar for both the combined weighting and regression
approach and the generalised Oaxaca, we use the generalised Oaxaca decomposition to
explore what characteristics are contributing to the explained component of the gap. For
reasons of space we only show the summary results; full tables are available on request.
4. Results
4.1. Decomposition at the mean
From now onwards we consider wages in logs so that wage gaps are approximately equal to
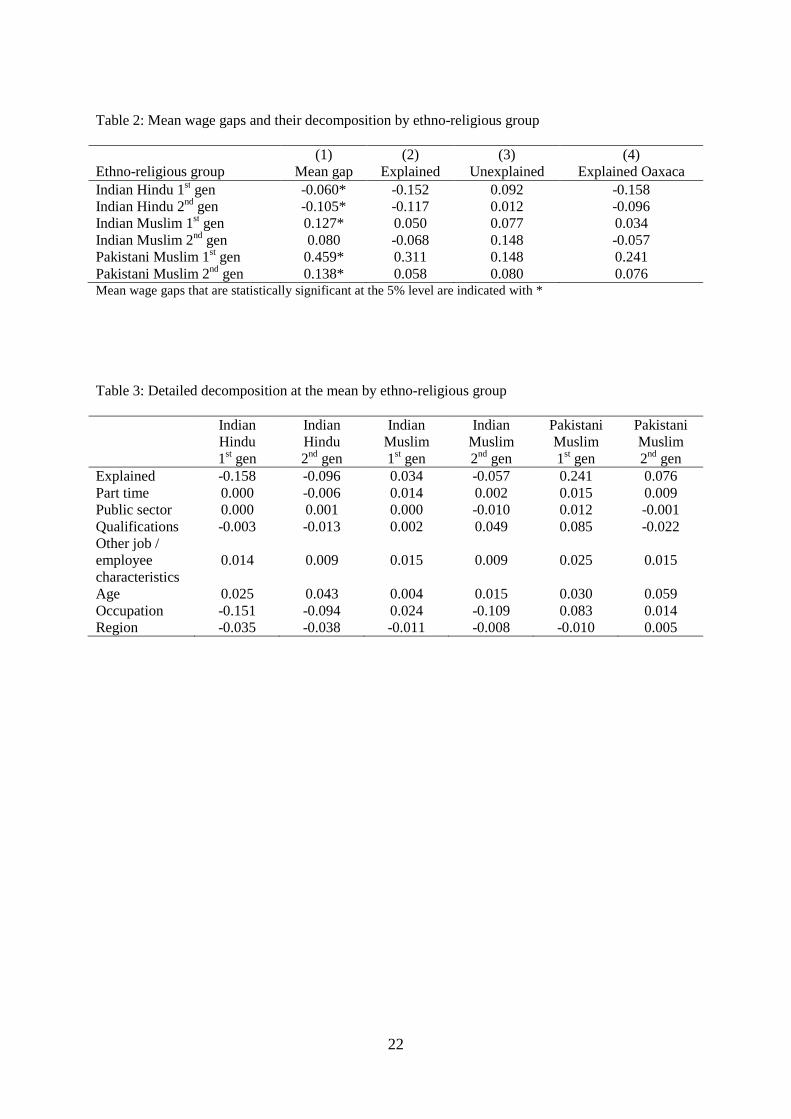
relative rather than the absolute changes in wage. Table 2 summarises the results of the
decomposition at the mean for all the ethno-religious groups, and shows the gap at the mean
in the first column. The second column shows the amount of the gap that is explained
according to the combined weighting and regression decomposition approach; this is the
difference between the counterfactual (the wage that the minority would have if they had the
same characteristics as the majority) and the actual mean wage. The third column shows the
unexplained part, which is the difference between the majority and the counterfactual mean
wage. If differences in the distribution of characteristics were the only cause of the gap, these
two mean wages would coincide since the counterfactual mean equalises the distribution of
characteristics across the minority and the majority. The explained and unexplained
components sum up to the observed mean wage gap. Column (4) shows the explained
component of the wage gap according to the generalized Oaxaca decomposition. When the
two explained components – columns (2) and (4) – are close, it is appropriate to derive the
contribution of particular characteristics to the explained component from the Oaxaca
decomposition, since in such cases the Oaxaca can be seen to correspond to a robust estimate
11
of the contribution of differences in characteristics to wage differences. In general, the
overall decomposition provided by the combined weighting and regression decomposition
and by the generalized Oaxaca are quite close. The divergence is biggest for Pakistani
Muslim first generation, but this is also where the overall gap is largest.
Table 2 shows that while Indian Hindus have an advantage in terms of mean wages
compared to the White British Christian majority, their individual and job characteristics
imply that their wage should be even higher, as their characteristics over-explain their wage
advantage. The detailed decomposition in Table 3 shows the contribution of the individual
and job characteristics to the explained part of the gap. The table shows that it is
occupational distribution that mostly contributes to the ‘over-explanation’ of the wage
advantage: Indian Hindus are over-represented in professional occupations, especially health
professionals, and under-represented in skilled trades. Thus, it would appear that this group,
though making their way into the more highly paid occupations and demonstrating
achievement in absolute terms, are not fully obtaining the levels of wage that might be
expected from those professional occupations. Because occupational distribution and
concentration in fact explains much more than the small wage advantage experienced by this
group, it leaves a substantial unexplained component.
The second generation Indian Hindus experienced a substantial, and statistically
significant, mean wage advantage. Similarly to the first generation, this advantage is over-
explained by their characteristics, though the resulting unexplained element is small,
amounting to less than 2% of the reference wage. From Table 3 we see that qualifications and
occupational distribution account for the majority of the explained part of the wage
advantage. Second generation Indian Hindus tend to have high levels of education and to be
over-represented among health professionals, and under-represented in part-time work.
TABLES 2 AND 3 ABOUT HERE
The remaining four ethno-religious groups all experience wage gaps rather than
advantages. The experiences of the Indian group vary significantly by religious affiliation:
the absolute wage distribution of Indian Muslims is closer to that of Pakistani Muslims than
to that of Indian Hindus. First generation Indian Muslims experience a gap of 13% of the
majority mean wage, and less than half of this gaps is explain by characteristics. Once again
the most important characteristics to explain the wage gap are related to the occupational
distribution: this group is over-represented among health professionals, but also among sales
12
and customer service occupations, and in part-time jobs. As with Indian Hindus,
occupational distribution plays a bigger role than educational qualifications, suggesting that it
is the sorts of jobs that Indian Muslims end up in – given their qualifications – that are more
pertinent to their wage disadvantage than simply their average differences in qualifications.
There is some indication, then, that lower wages may stem from lower access to suitable full-
time work opportunities and some sorting or selection into lower paid occupations. The
second generation experiences a smaller absolute wage gap which is not statistically
significant but which seems to be over-explained by characteristics. We should note that the
sample size for this group is very small, which may impact not only on the statistical
significance but also on the ability to ‘explain’ the gap. Interestingly, however, for second
generation Indian Muslims, by contrast with the first generation, the critical factor in the
explained part of the mean wage gap is qualifications, with occupation counteracting this
impact to a certain extent. Though they have higher qualifications on average than the first
generation, the wage gap of second generation Indian Muslims, relative to the majority, can
be explained by relatively lower qualifications; however, within occupations, second
generation Indian Muslims are not getting the returns that they might expect.
Finally, Pakistani Muslim men experience the largest wage gaps compared to White
British Christians. The decomposition indicates that a substantial proportion of this gap can
be explained by job and individual characteristics. However, there is still a substantial
unexplained component. For the first generation, the most important characteristics that
contribute to the explanation of the gap are over-representation in part-time work, possession
of ‘other’ or ‘no’ qualifications relative to higher qualifications, and over-representation in
less skilled occupations such as process plant and machinery, and elementary occupations.
Even after the extensive explanatory role played by these characteristics, first generation
Pakistani Muslims face an unexplained wage gap amounting to 15% of the reference wage.
This might suggest lack of recognition of foreign qualifications (Hudson et al., 2006) and that
first generation minorities may end up in lower skilled occupations and be constrained to
work part-time.
Pakistani Muslim men from the second generation have a substantially lower mean
wage gap than the first generation, though a lower proportion of it is explained by
characteristics. Concentration in part-time work and over-representation in sales and
administrative and secretarial occupations contribute to the explained part of the gap, but
their qualifications would imply higher wages. The biggest factor contributing to lower
13
wages is the concentration of younger workers in this group, which may suggest that some of
the disadvantage will dissipate with time.
In summary, ethno-religious groups experience very distinctive patterns of wages and
wage gaps. As we would expect, the unexplained component is higher for first than second
generation for Indian Hindus and Pakistani Muslims, but this is not the case for Indian
Muslims. Differences in qualifications, which might be thought to be most directly related to
wages, contribute only little to the explanation of wage gaps, while occupational clustering
and, in some cases, over-representation in part-time work have a larger contribution. The
way the labour market is organised and the sorts of jobs people have access to – or select
into, for whatever reason – are very important in determining wages, and the results are
consistent with the existence of some within employment discrimination that impinges on
wages among the disadvantaged and the advantaged. Focusing on the mean, employer
discrimination may play a role in providing or limiting access to certain jobs, but it appears to
have less of a role in specifically reducing wages. However, there is greater indication of
unexplained downward pressure on wages among the more advantaged groups. This may
suggest that it is at higher levels of wages that employer discrimination is revealed, while at
lower wage levels it is the particular jobs that can be accessed that determines wage gaps. It
is of interest, then, to analyse gaps across the wage distribution, to which we now turn.
4.2. Decomposition over the wage distribution
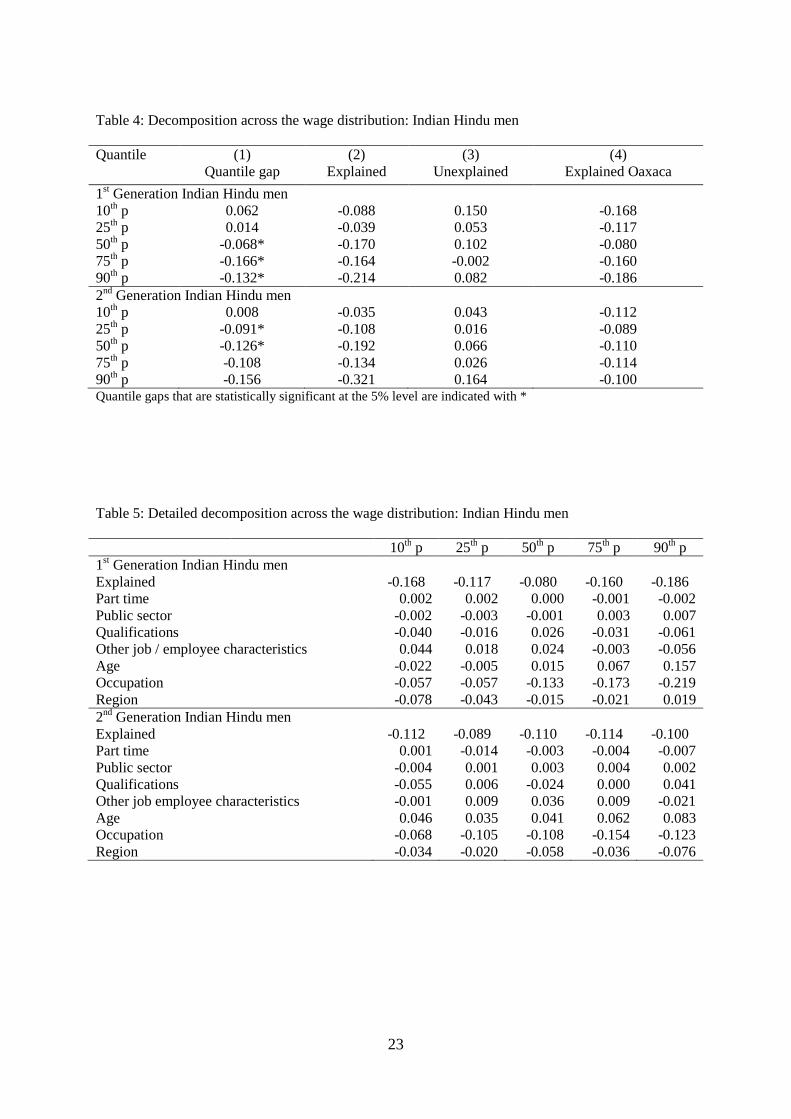
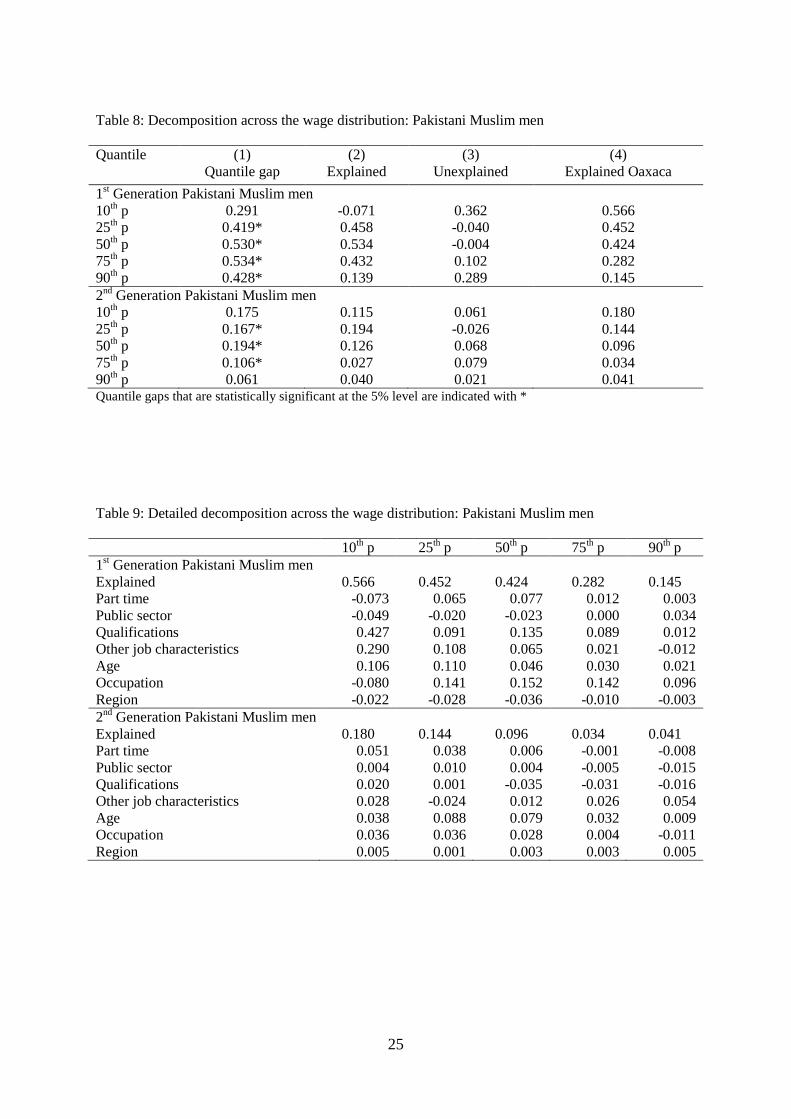
Tables 4, 6 and 8 show the results of the decomposition across the wage distribution for
Indian Hindu men, Indian Muslim men, and Pakistani Muslim men, separately by generation;
the headings are the same as in Table 2. Tables 5, 7, and 9 show the relative contribution of
the individual and job characteristics for the same groups.
Table 4 shows that the wage advantage of Indian Hindu men is statistically significant
from the 50th percentile upward for the first generation and at the 25th and 50th percentile for
the second generation. For both generations it is occupational distribution – and the same
occupations – that contribute to the explanation of the wage advantage, namely over-
representation among health professionals and under-representation among skilled trades
occupations (see Table 5). For the second generation at the 25th percentile, we see from
Table 5 that only under-representation in part time work contributes significantly to the wage
advantage; while at the 50th percentile qualifications are more important. Hence, there is
14
some evidence that qualifications gained from one generation to the next can increase wages
other than through determining occupation, at least around median earnings.
TABLES 4 AND 5 ABOUT HERE
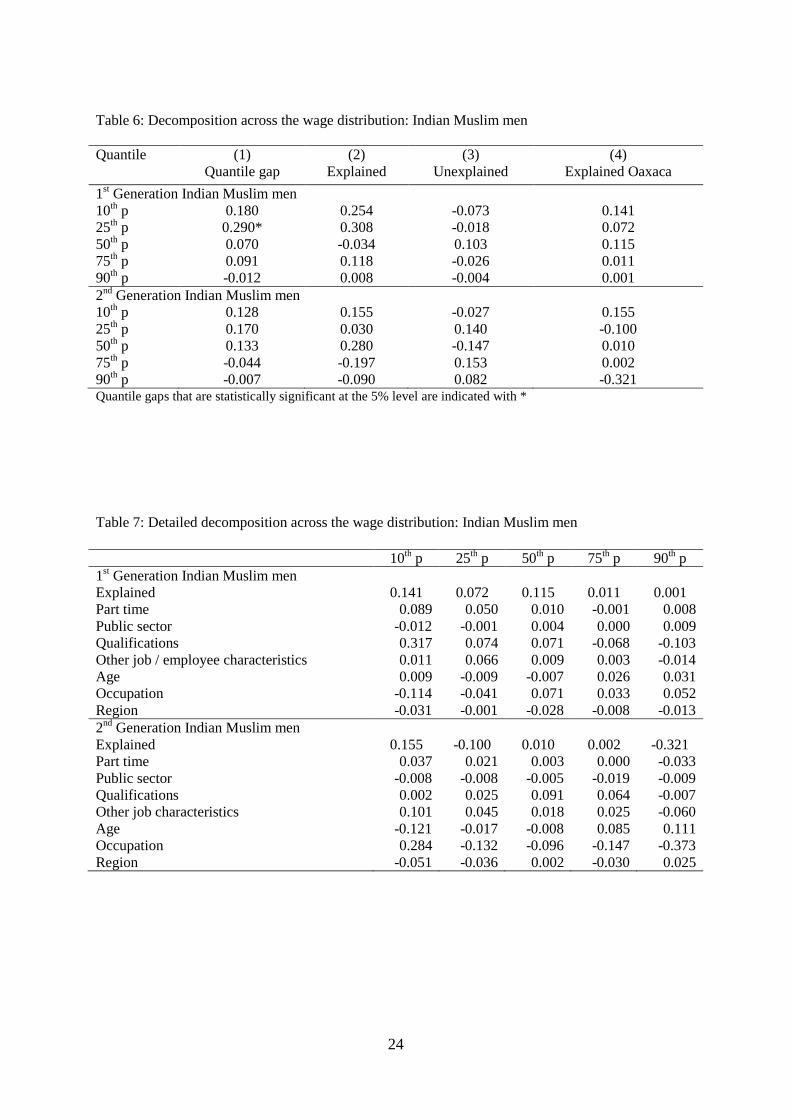
Turning to Indian Muslims and Pakistani Muslims, we find statistically significant
wage gaps at the 25th percentile for Indian Muslims. We find significant gaps from the 25th
percentile upward for first generation Pakistani Muslims; and at the 25th, 50th and 75th
percentiles for second generation Pakistani Muslims (see Tables 6 and 8). The sizes of the
actual gaps show some variation across the quantiles, ranging from 10% to 19% of wages of
the reference group for second generation Pakistani Muslims to between 40% and 55% for
first generation Pakistani Muslims. Indian Muslims have smaller gaps, which are generally
not statistically significant. The proportions explained are high across the board: in most
cases between 60-90% is explained, with the exceptions of the 90th percentile for the first
generation Pakistani Muslims, and the 75th percentile for second generation Pakistani
Muslims, where only 1/3 and 1/4 of the gap, respectively, is accounted for. What can the
decompositions tell us about the differences that are contributing to these wage gaps?
For first generation Indian Muslims, the most important contributions to the wage gap
at the 25th percentile (the only one statistically significant in the top part of Table 6) come
from over-representation in sales and customer service occupations and relatively low-level
qualifications. For second generation Indian Muslims, instead, it is qualifications, and
specifically low rates of level 2 and level 3 qualifications that play the most important role in
determining the explained part of the wage gap (see Table 7). For this group occupational
distribution (under-representation in skilled trades and in process plant and machine
operatives) offsets some of the wage gap.
TABLES 6 AND 7 ABOUT HERE
For first generation Pakistani Muslims the large gap at the 25th percentile (top part of
Table 8) is largely explained, but the only variables to contribute significantly to the gap are
age, and working in smaller firms (see Table 9). Occupational distribution appears to play a
role in the determination of the wage gap, but no particular occupation makes a statistically
significant contribution. At the median of the wage distribution the biggest factors in the
explanation of the gap are possession of ‘other’ and of ‘no’ qualifications, over-
15
representation in part-time work and in particular occupations (process, plant and machine
operatives and elementary occupations). The results are very similar at the 75th percentile.
At the 90th percentile, a much smaller proportion of the gap is explained, leaving an
unexplained component of nearly 30 percent. Under-representation in the public sector
contributes to that part of the gap that is explained, together with under-representation among
functional managers.
For second generation Pakistani Muslims (bottom part of Table 8) the majority of the
gap at the 25th and 50th percentiles is explained by characteristics, and the absolute size of the
gap is not as big as for the first generation. As Table 9 shows, it is, however, harder to point
to individual characteristics that contribute to the explanation of the gap, other than age (or
youth, in this case). As the effects of youth should disappear with age, this is a positive
message. At the 25th percentile over-representation in part-time work also has an effect in
reducing wages. For this group, neither education nor occupational distribution make a
significant contribution to accounting for the wage gap.
TABLES 8 AND 9 ABOUT HERE
In summary, for the explanation of the wage gaps of Indian Muslim men and
Pakistani Muslim men occupational distribution is far more salient for the first than second
generation. Part-time work plays a part in explaining wage differences particularly at the
bottom of the distribution for the second generation as well as for the first. Educational
qualifications matter for wages of first generation Pakistani Muslims, while age (or rather
youth) contributes to the wage gaps for both the first and second generation: this may reflect
both the overall age distribution of the populations but also the extent to which older
members of the first generation leave or are excluded from the labour market altogether.
5. Summary and conclusions
In this paper we analyse wage gaps of ethno-religious groups of male workers in the UK. We
focus on three of the largest UK minorities which also represent meaningful social groups:
Indian Hindu, Indian Muslim, and Pakistani Muslim men, distinguishing between first and
second generation, using White British Christian men as a reference group. The results show
striking differences in wages between ethno-religious groups: Indian Hindus have the highest
wages and Pakistani Muslims the lowest; Indian Muslims fare better than Pakistani Muslims
16
but worse than Indians who are Hindus. Furthermore, the experience of Indian Muslims
appears to be somewhat closer to that of Pakistani Muslims than to Indian Hindus, on
average, thus suggesting the distinctiveness of each ethno-religious group.
As already mentioned, it has to be noted that in the case of India, people with different
religious denominations are likely to come from different parts of the country: while Muslim
Indians are likely to come from the North, Hindu Indians are likely to come from the South.
Hence, the difference in performance between the Indian groups compared might not be due
to religion per se, but to other factors related to the country of origin that we cannot
disentangle from religious denomination. The difference in experience between the two
Indian groups is not necessarily a consequence of religious discrimination, but stems from
other factors that make Indian Muslims a specific group. Indeed, the fact that the experience
of Indian and Pakistani Muslims differs challenges accounts of an overarching Muslim
experience of disadvantage.
Within all three minority ethno-religious groups the second generation achieves
higher wages than the first generation, but the amount that is explained by characteristics
does not necessarily increase with generation. Statistically significant wage gaps are found
for most groups around the middle of the wage distribution, and there is, in general, little
evidence of wage gaps – or advantage – at the extremes of the distribution. In most cases the
majority of the gap can be explained by characteristics, and specifically by sorting into
particular occupations. A portion of the wage advantage for Indian Hindus is explained by
their over-representation in some highly paid occupations such as professionals (especially
health professionals) and under-representation in part-time work; whereas the wage gap for
both Indian Muslims and Pakistani Muslims is partly explained by their concentration in low
paid occupations like sales and customer service, and in part-time work. It is also interesting
that, contrary to expectations, qualifications are not noticeably more important in explaining
differences in wages for the first compared to the second generation. The types of jobs that
people are employed in, given their qualifications, seem more important in accounting for
wage gaps.
Restricting attention to statistically significant wage gaps, the unexplained
components are always below 10% of White British Christians wages with the exception of
first generation Pakistani Muslims, for whom there are substantial unexplained components,
particularly towards the top of the distribution. Once we control for individual
characteristics, the wage advantage of Indian Hindus disappears, revealing a wage penalty,
which is reflected in positive unexplained components. Apart from the substantial
17
unexplained component at the top of the distribution for second generation Indian Hindu
men, there is not compelling evidence of the unexplained component being a ‘glass ceiling’,
as it does not generally concentrate towards the top of the distribution.
Acknowledgements
We would like to thank the editor and two anonymous referees for comments on an earlier
version of this paper. Data on the LFS is available from the Data Archive at the University of
Essex (www.data-archive.ac.uk).
Funding
Economic and Social Research Council through the Research Centre on Micro-Social Change (RES-518-28-001); European Commission Marie Curie Fellowship (234845-TRANSID to L.P.).
References
Algan, Y., Dustmann, C., Glitz, A. and Manning, A. (2009) The economic situation of first and second-generation immigrants in France, Germany and the United Kingdom, The Economic Journal, 120, F4-30.
Altonji, J.G. and Blank, R.M. (1999) Race and gender in the labor market, in Ashenfelter, O.C. and Card, D. (eds.) Handbook of Labor Economics, Volume 3, Elsevier, Amsterdam, 3143-259.
Barsky, R., Bound, J., Charles, K.K. and Lupton, J.P. (2002) Accounting for the black-white wealth gap: a nonparametric approach, Journal of the American Statistical Association, 97, 663-73.
Bell, B.D. (1997) The performance of immigrants in the United Kingdom: evidence from the GHS, Economic Journal, 107, 333-45.
Berthoud, R. (2000) Ethnic employment penalties in Britain, Journal of Ethnic and Migration Studies, 26, 389-416.
Bjerk, D. (2007) The differing nature of black-white wage inequality across occupational sectors, Journal of Human Resources, XLII , 398-434.
Blackaby, D.H., Clark, K., Leslie, D.G. and Murphy, P.D. (1994) Black-white male earnings and employment prospects in the 1970s and 1980s: evidence for Britain, Economics Letters, 46, 273-9.
Blackaby, D.H., Leslie, D.G., Murphy, P.D. and O'Leary, N.C. (1998) The ethnic wage gap and employment differentials in the 1990s: evidence for Britain, Economics Letters, 58, 97-103.
Blackaby, D.H., Leslie, D.G., Murphy, P.D. and O'Leary, N.C. (2002) White/ethnic minority earnings and employment differentials in Britain: evidence from the LFS, Oxford Economic Papers, 54, 270-97.
Brown, M.S. (2000) Religion and economic activity in the south asian population, Ethnic and Racial Studies, 23, 1035-61.
18
Card, D. (2005) Is the new immigration really so bad?, The Economic Journal, 115, F300-23.
Clark, K. and Drinkwater, S. (2007) Segregation preferences and labour market outcomes, Economics Letters, 94, 278-83.
Clark, K. and Drinkwater, S. (2009) Dynamics and diversity: ethnic employment differences in England and Wales, 1991-2001, Research in Labor Economics, 29, 299-333.
Clark, K. and Lindley, J. (2006) Immigrant labour market assimilation and arrival effects: evidence from the Labour Force Survey, Discussion Paper 2228, IZA, Bonn.
DiNardo, J.E., Fortin, N.M. and Lemieux, T. (1996) Labor market institutions and the distribution of wages, 1973-1992: a semiparametric approach, Econometrica, 64, 1001-44.
Dustmann, C. and Fabbri, F. (2003) Language proficiency and labour market performance of immigrants in the UK, The Economic Journal, 113, 695-717.
Dustmann, C. and Fabbri, F. (2005) Immigrants in the British labour market, Fiscal Studies, 26, 423-70.
Dustmann, C. and Theodoropoulos, N. (2010) Ethnic minority immigrants and their children in Britain, Oxford Economic Papers, 62, 209-33.
Elliott, R.J.R. and Lindley, J.K.L. (2008) Immigrant wage differentials, ethnicity and occupational segregation, Journal of the Royal Statistical Society: Series A (Statistics in Society), 171, 645-71.
Firpo, S., Fortin, N.M. and Lemieux, T. (2007) Decomposing wage distributions using recentered influence function regressions, unpublished, available at http://www.nber.org/public_html/confer/2007/si2007/LS/fortin.pdf.
Firpo, S., Fortin, N.M. and Lemieux, T. (2009) Unconditional quantile regressions, Econometrica, 77, 953-73.
Fortin, N.M., Lemieux, T. and Firpo, S. (2011) Decomposition methods in economics, in Ashenfelter, O.C. and Card, D. (eds.) Handbook of Labor Economics, Volume 4A, Elsevier, Amsterdam, 1-102.
Green, C. and Ferber, M. (2005) Do detailed work histories help to explain gender and race/ethnic wage differentials?, Review of Social Economy, 63, 55-85.
Grewal, I., Joy, S., Lewis, J., Swales, K. and Woodfield, K. (2002) Disabled for life? Attitudes towards, and experiences of, disability in Britain, Research Report 173, Department for Work and Pensions, Leeds.
Heath, A. and McMahon, D. (1997) Education and occupational attainments: the impact of ethnic origins, in Karn, V. (ed.) Ethnicity in the 1991 Census: Volume Four: Employment, Education and Housing among the Ethnic Minority Populations of Britain, HMSO, London, 91-113.
Hudson, M., Barnes, H., Ray, K. and Phillips, J. (2006) Ethnic minority perceptions and experiences of Jobcentre Plus, Research Report 349, Department for Work and Pensions, Leeds.
Hum, D. and Simpson, W. (1999) Wage opportunities for visible minorities in Canada, Canadian Public Policy, 25, 379-94.
Kan, M.Y. and Heath, A. (2006) The political values and choices of husbands and wives, Journal of Marriage and the Family, 68, 70-86.
Lindley, J. (2002a) The English language fluency and earnings of ethnic minorities in Britain, Scottish Journal of Political Economy, 49, 467-87.
Lindley, J. (2002b) Race or religion? The impact of religion on the employment and earnings of Britain's ethnic communities, Journal of Ethnic and Migration Studies, 28, 427-42.
19
Longhi, S. and Platt, L. (2008) Pay gaps across equalities areas, Research Report 9, Equality and Human Rights Commission, Manchester.
McCall, L. (2001) Sources of racial wage inequality in metropolitan labour markets: racial, ethnic, and gender differences, American Sociological Review, 66, 520-41.
Nielsen, H.S. (2000) Wage discrimination in Zambia: an extension of the Oaxaca-Blinder decomposition, Applied Economics Letters, 7, 405–8.
Platt, L. (2006) Pay gaps: the position of ethnic minority women and men, Equal Opportunities Commission Report, Manchester.
Purdam, K., Afkhami, R., Crockett, A. and Olsen, W. (2007) Religion in the UK: an overview of equality statistics and evidence gaps, Journal of Contemporary Religion, 22, 147-68.
Reimers, C.W. (1983) Labor market discrimination against hispanic and black men, The Review of Economics and Statistics, 65, 570-9.
Schafgans, M.M.A. (1998) Ethnic wage differences in Malaysia: parametric and semiparametric estimation of the Chinese-Malay wage gap, Journal of Applied Econometrics, 13, 481-504.
Shields, M.A. and Wheatley Price, S. (1998) The earning of male immigrants in England: evidence from the Quarterly LGS, Applied Economics, 30, 1157-68.
Shields, M.A. and Wheatley Price, S. (2002) The English language fluency and occupational success of ethnic minority immigrant men living in English metropolitan areas, Journal of Population Economics, 15, 137-60.
Wheatley Price, S. (2001) The employment adjustment of male immigrants in England, Journal of Population Economics, 14, 193-220.
20
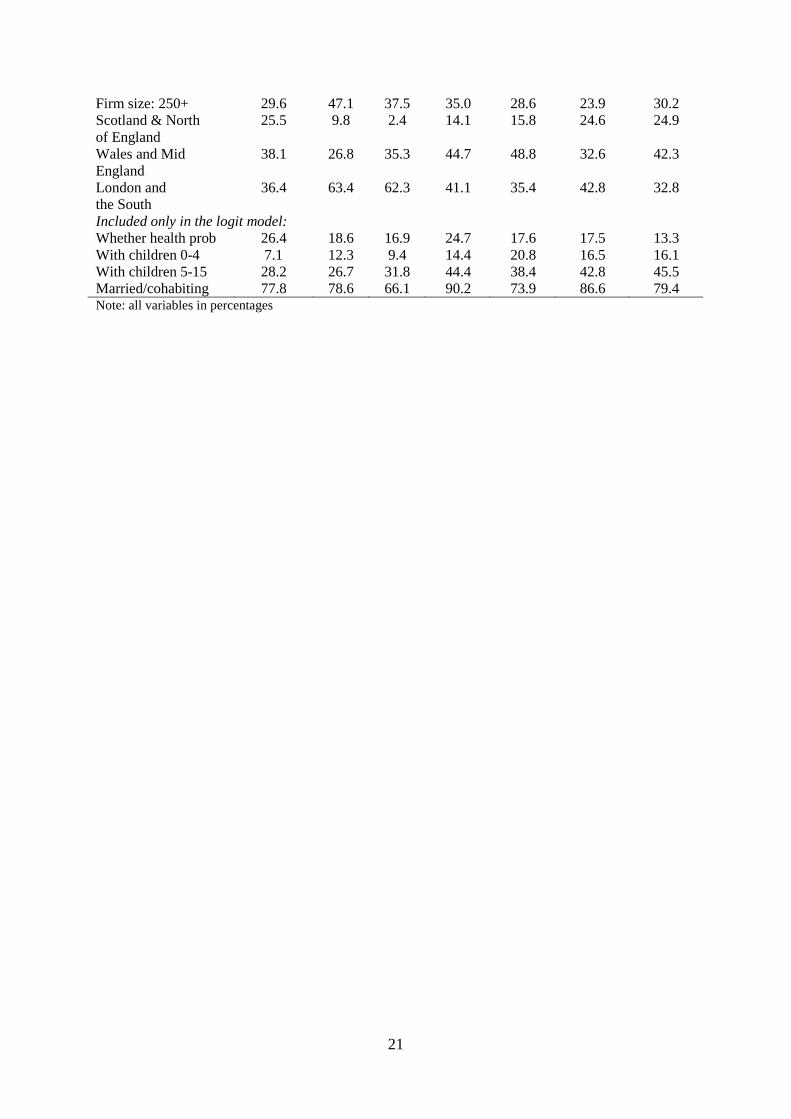
Tables Table 1: Descriptive statistics of the weighted estimation sample White
British Christian
Indian Hindu 1st gen
Indian Hindu 2nd gen
Indian Muslim 1st gen
Indian Muslim 2nd gen
Pakistani Muslim 1st gen
Pakistani Muslim 2nd gen
No of observations 57660 594 271 121 95 404 293 Hourly wage (£) 13.47 14.63 14.99 12.09 13.31 8.41 12.06 Aged 34-64 (Ref: 23-33)
77.0 59.2 51.4 63.6 46.5 58.9 38.1
Working part-time (ref: full-time)
5.0 4.9 2.8 15.6 8.1 24.3 12.0
Public sector (ref: private sector)
21.6 23.8 17.8 24.8 20.2 10.5 18.7
Job tenure > 5 yrs 60.6 39.4 43.0 49.9 51.9 38.4 41.8 Qualifications (NVQ) Level 4 or more 33.0 47.8 61.4 35.4 53.2 22.7 47.4 Level 3 16.9 4.7 13.8 5.7 7.4 3.9 13.5 Level 2 22.2 4.9 13.2 5.4 7.0 5.6 13.1 Less than 2 12.3 1.6 7.5 2.8 15.4 5.1 10.5 Other qualifications 6.3 31.8 1.5 32.2 6.3 39.5 4.0 No qualifications 9.3 9.3 2.6 18.6 10.7 23.2 11.5 Occupations: 1. Managers & senior officials
22.1 14.5 23.6 13.2 25.6 7.8 12.1
2. Professional Occupations
14.1 38.6 27.1 20.4 25.3 10.9 20.1
3. Associate prof. & technical
14.6 10.0 15.5 6.6 9.4 5.8 14.8
4. Administrative & secretarial
5.1 6.9 9.6 7.3 9.0 5.9 7.5
5. Skilled trades Occupations
15.2 5.3 6.9 3.8 1.6 10.0 7.9
6. Personal service Occupations
2.6 1.4 0.7 5.2 4.5 2.3 3.0
7. Sales & customer service occupation
2.9 3.7 5.6 12.2 11.6 11.5 11.9
8. Process, plant & machine operat.
13.5 9.0 5.6 17.5 6.4 25.1 10.3
9. Elementary Occupations
10.1 10.7 5.4 13.8 6.5 20.7 12.5
113. Functional Managers
7.6 5.6 10.9 3.5 10.3 2.3 5.8
213. Information comm. tech. prof.
2.2 15.5 7.9 1.7 2.4 0.9 5.7
221. Health Professionals
0.6 13.6 5.0 10.2 2.7 4.8 2.7
711. Sales assist. retail cashiers
1.5 3.6 3.4 8.3 7.5 10.6 8.0
821. Transport drivers & operat.
5.9 2.6 1.0 4.7 3.1 10.4 4.7
Firm size: 0-25 29.6 21.4 29.7 32.7 41.8 42.5 34.0 Firm size: 26-250 40.7 31.5 32.8 32.2 29.6 33.6 35.8
21
Firm size: 250+ 29.6 47.1 37.5 35.0 28.6 23.9 30.2 Scotland & North of England
25.5 9.8 2.4 14.1 15.8 24.6 24.9
Wales and Mid England
38.1 26.8 35.3 44.7 48.8 32.6 42.3
London and the South
36.4 63.4 62.3 41.1 35.4 42.8 32.8
Included only in the logit model: Whether health prob 26.4 18.6 16.9 24.7 17.6 17.5 13.3 With children 0-4 7.1 12.3 9.4 14.4 20.8 16.5 16.1 With children 5-15 28.2 26.7 31.8 44.4 38.4 42.8 45.5 Married/cohabiting 77.8 78.6 66.1 90.2 73.9 86.6 79.4 Note: all variables in percentages
22
Table 2: Mean wage gaps and their decomposition by ethno-religious group Ethno-religious group
(1) Mean gap
(2) Explained
(3) Unexplained
(4) Explained Oaxaca
Indian Hindu 1st gen -0.060* -0.152 0.092 -0.158 Indian Hindu 2nd gen -0.105* -0.117 0.012 -0.096 Indian Muslim 1st gen 0.127* 0.050 0.077 0.034 Indian Muslim 2nd gen 0.080 -0.068 0.148 -0.057 Pakistani Muslim 1st gen 0.459* 0.311 0.148 0.241 Pakistani Muslim 2nd gen 0.138* 0.058 0.080 0.076 Mean wage gaps that are statistically significant at the 5% level are indicated with * Table 3: Detailed decomposition at the mean by ethno-religious group
Indian Hindu 1st gen
Indian Hindu 2nd gen
Indian Muslim 1st gen
Indian Muslim 2nd gen
Pakistani Muslim 1st gen
Pakistani Muslim 2nd gen
Explained -0.158 -0.096 0.034 -0.057 0.241 0.076 Part time 0.000 -0.006 0.014 0.002 0.015 0.009 Public sector 0.000 0.001 0.000 -0.010 0.012 -0.001 Qualifications -0.003 -0.013 0.002 0.049 0.085 -0.022 Other job / employee characteristics
0.014
0.009
0.015
0.009
0.025
0.015
Age 0.025 0.043 0.004 0.015 0.030 0.059 Occupation -0.151 -0.094 0.024 -0.109 0.083 0.014 Region -0.035 -0.038 -0.011 -0.008 -0.010 0.005
23
Table 4: Decomposition across the wage distribution: Indian Hindu men Quantile (1)
Quantile gap (2)
Explained (3)
Unexplained (4)
Explained Oaxaca
1st Generation Indian Hindu men 10th p 0.062 -0.088 0.150 -0.168 25th p 0.014 -0.039 0.053 -0.117 50th p -0.068* -0.170 0.102 -0.080 75th p -0.166* -0.164 -0.002 -0.160 90th p -0.132* -0.214 0.082 -0.186 2nd Generation Indian Hindu men 10th p 0.008 -0.035 0.043 -0.112 25th p -0.091* -0.108 0.016 -0.089 50th p -0.126* -0.192 0.066 -0.110 75th p -0.108 -0.134 0.026 -0.114 90th p -0.156 -0.321 0.164 -0.100 Quantile gaps that are statistically significant at the 5% level are indicated with * Table 5: Detailed decomposition across the wage distribution: Indian Hindu men 10th p 25th p 50th p 75th p 90th p 1st Generation Indian Hindu men Explained -0.168 -0.117 -0.080 -0.160 -0.186 Part time 0.002 0.002 0.000 -0.001 -0.002 Public sector -0.002 -0.003 -0.001 0.003 0.007 Qualifications -0.040 -0.016 0.026 -0.031 -0.061 Other job / employee characteristics 0.044 0.018 0.024 -0.003 -0.056 Age -0.022 -0.005 0.015 0.067 0.157 Occupation -0.057 -0.057 -0.133 -0.173 -0.219 Region -0.078 -0.043 -0.015 -0.021 0.019 2nd Generation Indian Hindu men Explained -0.112 -0.089 -0.110 -0.114 -0.100 Part time 0.001 -0.014 -0.003 -0.004 -0.007 Public sector -0.004 0.001 0.003 0.004 0.002 Qualifications -0.055 0.006 -0.024 0.000 0.041 Other job employee characteristics -0.001 0.009 0.036 0.009 -0.021 Age 0.046 0.035 0.041 0.062 0.083 Occupation -0.068 -0.105 -0.108 -0.154 -0.123 Region -0.034 -0.020 -0.058 -0.036 -0.076
24
Table 6: Decomposition across the wage distribution: Indian Muslim men Quantile (1)
Quantile gap (2)
Explained (3)
Unexplained (4)
Explained Oaxaca
1st Generation Indian Muslim men 10th p 0.180 0.254 -0.073 0.141 25th p 0.290* 0.308 -0.018 0.072 50th p 0.070 -0.034 0.103 0.115 75th p 0.091 0.118 -0.026 0.011 90th p -0.012 0.008 -0.004 0.001 2nd Generation Indian Muslim men 10th p 0.128 0.155 -0.027 0.155 25th p 0.170 0.030 0.140 -0.100 50th p 0.133 0.280 -0.147 0.010 75th p -0.044 -0.197 0.153 0.002 90th p -0.007 -0.090 0.082 -0.321 Quantile gaps that are statistically significant at the 5% level are indicated with * Table 7: Detailed decomposition across the wage distribution: Indian Muslim men 10th p 25th p 50th p 75th p 90th p 1st Generation Indian Muslim men Explained 0.141 0.072 0.115 0.011 0.001 Part time 0.089 0.050 0.010 -0.001 0.008 Public sector -0.012 -0.001 0.004 0.000 0.009 Qualifications 0.317 0.074 0.071 -0.068 -0.103 Other job / employee characteristics 0.011 0.066 0.009 0.003 -0.014 Age 0.009 -0.009 -0.007 0.026 0.031 Occupation -0.114 -0.041 0.071 0.033 0.052 Region -0.031 -0.001 -0.028 -0.008 -0.013 2nd Generation Indian Muslim men Explained 0.155 -0.100 0.010 0.002 -0.321 Part time 0.037 0.021 0.003 0.000 -0.033 Public sector -0.008 -0.008 -0.005 -0.019 -0.009 Qualifications 0.002 0.025 0.091 0.064 -0.007 Other job characteristics 0.101 0.045 0.018 0.025 -0.060 Age -0.121 -0.017 -0.008 0.085 0.111 Occupation 0.284 -0.132 -0.096 -0.147 -0.373 Region -0.051 -0.036 0.002 -0.030 0.025
25
Table 8: Decomposition across the wage distribution: Pakistani Muslim men Quantile (1)
Quantile gap (2)
Explained (3)
Unexplained (4)
Explained Oaxaca
1st Generation Pakistani Muslim men 10th p 0.291 -0.071 0.362 0.566 25th p 0.419* 0.458 -0.040 0.452 50th p 0.530* 0.534 -0.004 0.424 75th p 0.534* 0.432 0.102 0.282 90th p 0.428* 0.139 0.289 0.145 2nd Generation Pakistani Muslim men 10th p 0.175 0.115 0.061 0.180 25th p 0.167* 0.194 -0.026 0.144 50th p 0.194* 0.126 0.068 0.096 75th p 0.106* 0.027 0.079 0.034 90th p 0.061 0.040 0.021 0.041 Quantile gaps that are statistically significant at the 5% level are indicated with * Table 9: Detailed decomposition across the wage distribution: Pakistani Muslim men 10th p 25th p 50th p 75th p 90th p 1st Generation Pakistani Muslim men Explained 0.566 0.452 0.424 0.282 0.145 Part time -0.073 0.065 0.077 0.012 0.003 Public sector -0.049 -0.020 -0.023 0.000 0.034 Qualifications 0.427 0.091 0.135 0.089 0.012 Other job characteristics 0.290 0.108 0.065 0.021 -0.012 Age 0.106 0.110 0.046 0.030 0.021 Occupation -0.080 0.141 0.152 0.142 0.096 Region -0.022 -0.028 -0.036 -0.010 -0.003 2nd Generation Pakistani Muslim men Explained 0.180 0.144 0.096 0.034 0.041 Part time 0.051 0.038 0.006 -0.001 -0.008 Public sector 0.004 0.010 0.004 -0.005 -0.015 Qualifications 0.020 0.001 -0.035 -0.031 -0.016 Other job characteristics 0.028 -0.024 0.012 0.026 0.054 Age 0.038 0.088 0.079 0.032 0.009 Occupation 0.036 0.036 0.028 0.004 -0.011 Region 0.005 0.001 0.003 0.003 0.005
26
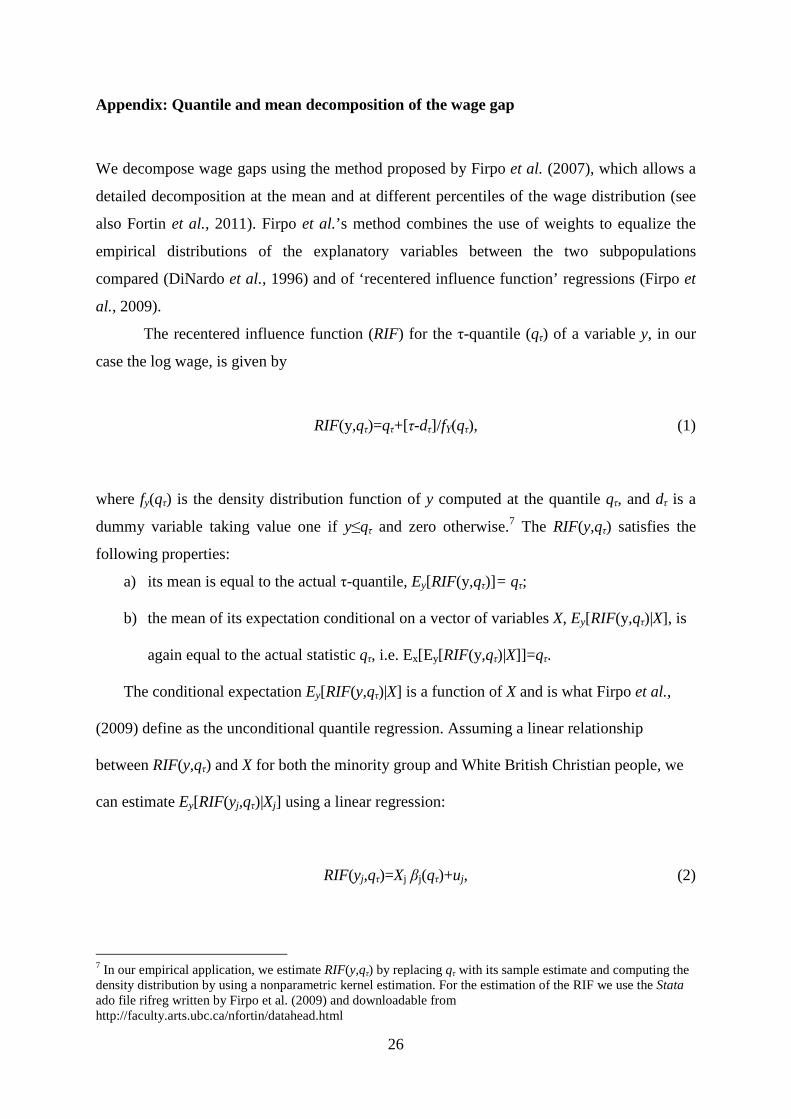
Appendix: Quantile and mean decomposition of the wage gap
We decompose wage gaps using the method proposed by Firpo et al. (2007), which allows a
detailed decomposition at the mean and at different percentiles of the wage distribution (see
also Fortin et al., 2011). Firpo et al.’s method combines the use of weights to equalize the
empirical distributions of the explanatory variables between the two subpopulations
compared (DiNardo et al., 1996) and of ‘recentered influence function’ regressions (Firpo et
al., 2009).
The recentered influence function (RIF) for the τ-quantile (qτ) of a variable y, in our
case the log wage, is given by
RIF(y,qτ)=qτ+[τ-dτ]/fY(qτ), (1)
where fy(qτ) is the density distribution function of y computed at the quantile qτ, and dτ is a
dummy variable taking value one if y≤qτ and zero otherwise.7 The RIF(y,qτ) satisfies the
following properties:
a) its mean is equal to the actual τ-quantile, Ey[RIF(y,qτ)]= qτ;
b) the mean of its expectation conditional on a vector of variables X, Ey[RIF(y,qτ)|X], is
again equal to the actual statistic qτ, i.e. Ex[Ey[RIF(y,qτ)|X]]=qτ.
The conditional expectation Ey[RIF(y,qτ)|X] is a function of X and is what Firpo et al.,
(2009) define as the unconditional quantile regression. Assuming a linear relationship
between RIF(y,qτ) and X for both the minority group and White British Christian people, we
can estimate Ey[RIF(yj,qτ)|Xj] using a linear regression:
RIF(yj,qτ)=Xj βj(qτ)+uj, (2)
7 In our empirical application, we estimate RIF(y,qτ) by replacing qτ with its sample estimate and computing the density distribution by using a nonparametric kernel estimation. For the estimation of the RIF we use the Stata ado file rifreg written by Firpo et al. (2009) and downloadable from http://faculty.arts.ubc.ca/nfortin/datahead.html
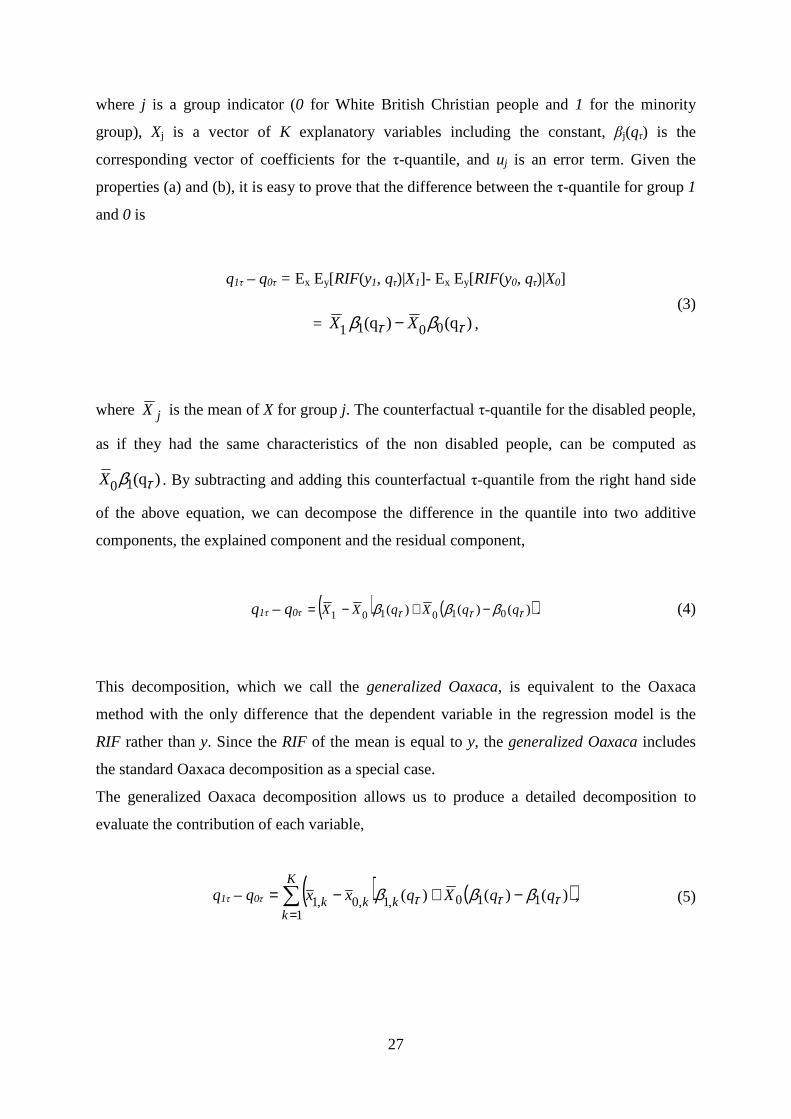
27
where j is a group indicator (0 for White British Christian people and 1 for the minority
group), Xj is a vector of K explanatory variables including the constant, βj(qτ) is the
corresponding vector of coefficients for the τ-quantile, and uj is an error term. Given the
properties (a) and (b), it is easy to prove that the difference between the τ-quantile for group 1
and 0 is
q1τ – q0τ = Ex Ey[RIF(y1, qτ)|X1]- Ex Ey[RIF(y0, qτ)|X0]
= )q()q( 0011 ττ ββ XX − , (3)
where jX is the mean of X for group j. The counterfactual τ-quantile for the disabled people,
as if they had the same characteristics of the non disabled people, can be computed as
)q(10 τβX . By subtracting and adding this counterfactual τ-quantile from the right hand side
of the above equation, we can decompose the difference in the quantile into two additive
components, the explained component and the residual component,
q1τ – q0τ ( ) ( ))()()( 010101 τττ βββ qqXqXX −+−= . (4)
This decomposition, which we call the generalized Oaxaca, is equivalent to the Oaxaca
method with the only difference that the dependent variable in the regression model is the
RIF rather than y. Since the RIF of the mean is equal to y, the generalized Oaxaca includes
the standard Oaxaca decomposition as a special case.
The generalized Oaxaca decomposition allows us to produce a detailed decomposition to
evaluate the contribution of each variable,
q1τ – q0τ ( ) ( ))()()( 110
1,1,0,1 τττ βββ qqXqxx
K
kkkk −+−= ∑
=, (5)
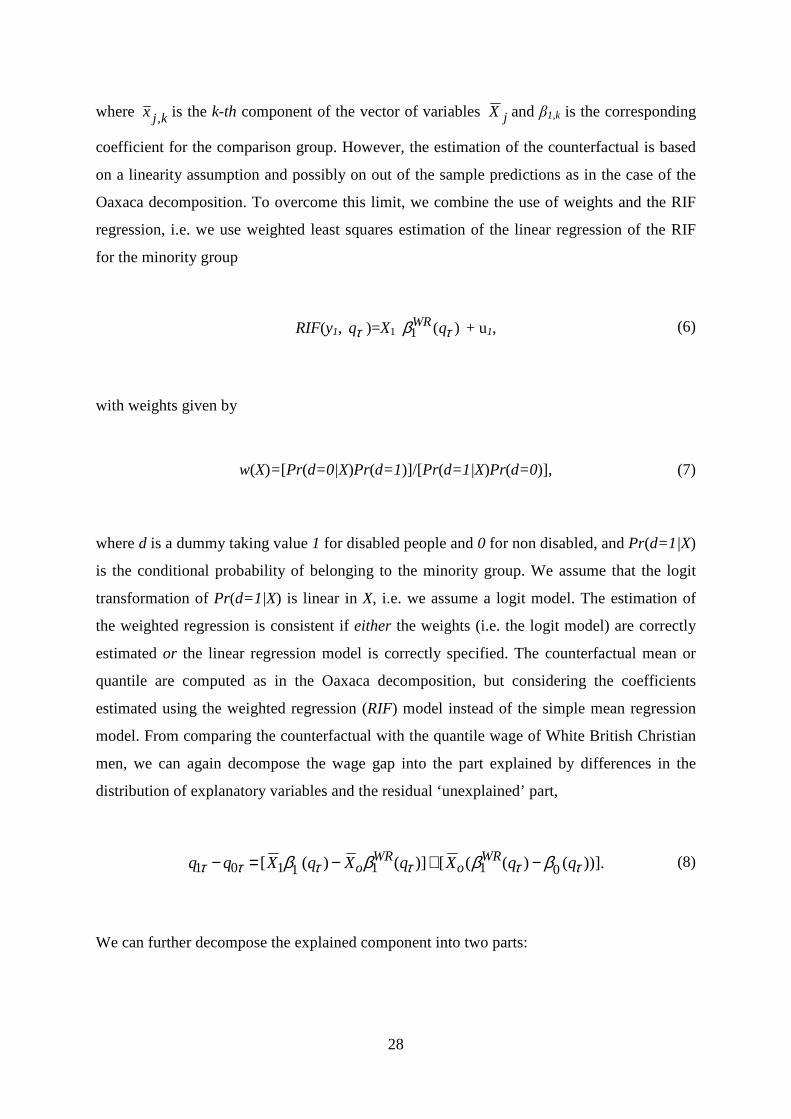
28
where kjx , is the k-th component of the vector of variables jX and β1,k is the corresponding
coefficient for the comparison group. However, the estimation of the counterfactual is based
on a linearity assumption and possibly on out of the sample predictions as in the case of the
Oaxaca decomposition. To overcome this limit, we combine the use of weights and the RIF
regression, i.e. we use weighted least squares estimation of the linear regression of the RIF
for the minority group
RIF(y1, τq )=X1 )(1 τβ qWR + u1, (6)
with weights given by
w(X)= [Pr(d=0|X)Pr(d=1)]/[Pr(d=1|X)Pr(d=0)], (7)
where d is a dummy taking value 1 for disabled people and 0 for non disabled, and Pr(d=1|X)
is the conditional probability of belonging to the minority group. We assume that the logit
transformation of Pr(d=1|X) is linear in X, i.e. we assume a logit model. The estimation of
the weighted regression is consistent if either the weights (i.e. the logit model) are correctly
estimated or the linear regression model is correctly specified. The counterfactual mean or
quantile are computed as in the Oaxaca decomposition, but considering the coefficients
estimated using the weighted regression (RIF) model instead of the simple mean regression
model. From comparing the counterfactual with the quantile wage of White British Christian
men, we can again decompose the wage gap into the part explained by differences in the
distribution of explanatory variables and the residual ‘unexplained’ part,
))].()(([)]()([ 0111101 ττττττ ββββ qqXqXqXqq WRo
WRo −+−=− (8)
We can further decompose the explained component into two parts:
29
( ) ( )[ ],)()()(
)()(
1101
,1,0,1
111
τττ
ττ
βββ
ββ
qqXqxx
qXqX
WRK
kkkk
WRo
−+
−=
−
∑=
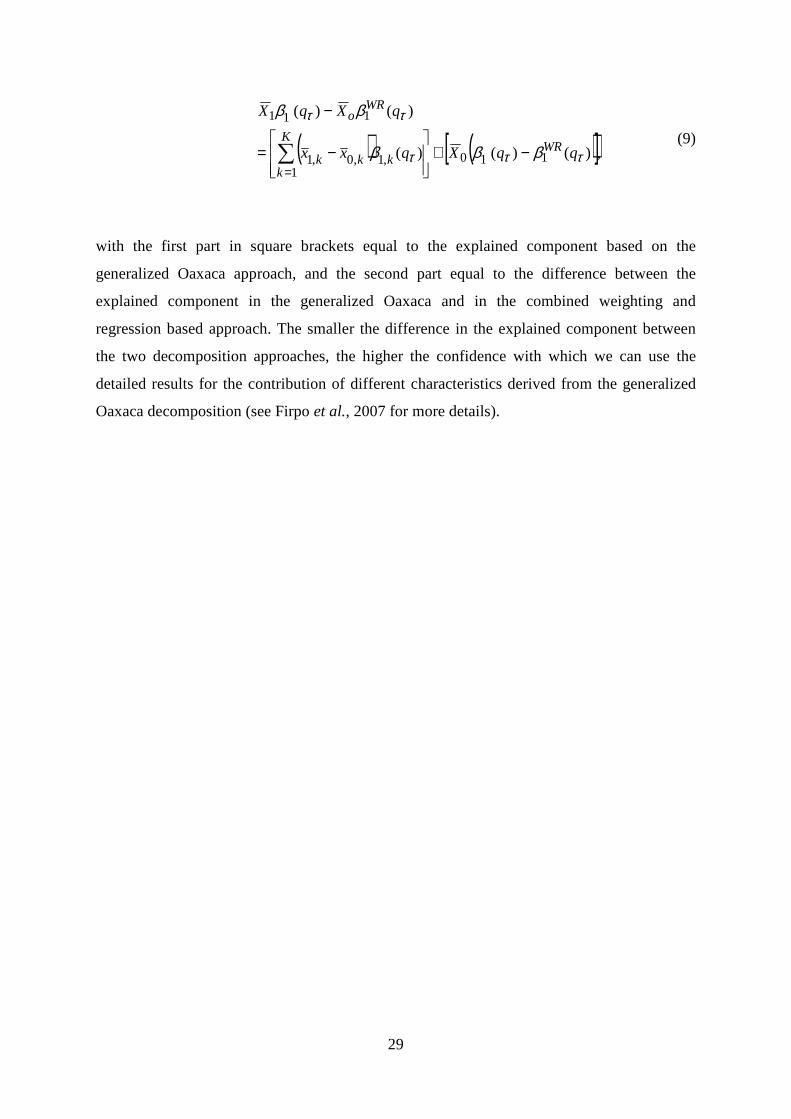
(9)
with the first part in square brackets equal to the explained component based on the
generalized Oaxaca approach, and the second part equal to the difference between the
explained component in the generalized Oaxaca and in the combined weighting and
regression based approach. The smaller the difference in the explained component between
the two decomposition approaches, the higher the confidence with which we can use the
detailed results for the contribution of different characteristics derived from the generalized
Oaxaca decomposition (see Firpo et al., 2007 for more details).