experimental dehydration kinetics of serpentinite using pore volumometry
TRANSCRIPT
Experimental dehydration kinetics of serpentinite using porevolumometry
S. LLANA-FUNEZ,* K. H. BRODIE, E. H. RUTTER AND J. C. ARKWRIGHTRock Deformation Laboratory, School of Earth, Atmospheric and Environmental Sciences, University of Manchester, OxfordRoad, Manchester M13 9PL, UK ([email protected])
ABSTRACT A series of dehydration experiments was carried out on both intact rock and cold-pressed powderedsamples of serpentinite at temperatures in the range 535–610 �C, 100–170 �C above the onset of thebreakdown temperature of 435 �C. Pore water pressures near 120 MPa were servo-controlled using apore volumometer that also allowed dehydration reaction progress to be monitored throughmeasurement of the amount of evolved water. Effective hydrostatic confining pressures were variedbetween 0 and 113 MPa. The reaction rate of intact specimens of initially near-zero porosity wasconstant up to 50–80% reaction progress at any given temperature, but decreased progressively astransformation approached completion. Water expulsion rates were not substantially affected byelevation of effective pressures that remained insufficient to cause major pore collapse. An Arrheniusrelation links reaction rate to temperature with an activation enthalpy of 429 ± 201 and521 ± 52 kJ mol)1 for powdered and intact specimens, respectively. Microstructural study of intactspecimens showed extensive nucleation beginning at pre-existing cracks, veins and grain boundaries, andprogressing into the interior of the lizardite grains. Extrapolation of these data towards equilibriumtemperature provides an upper bound on the kinetics of this reaction in nature.
Key words: effective pressure; experimental petrology; reaction kinetics; serpentinite dehydration;subduction zones.
INTRODUCTION
Experimental studies of metamorphic reaction equili-bria and kinetics have traditionally employed granularspecimens of relatively fine grain size, such that min-eral surfaces or grain boundary areas are maximized tospeed up reaction rates, given that most metamorphicreactions are heterogeneous and nucleate along min-eral interfaces. When fluids are involved, fluid porepressures are maintained at a value equal to �litho-static�, thus stresses in the solids are hydrostatic (iso-tropic). In other words, effective pressure is zero, andhence chemical interactions can be described bystandard hydrostatic thermodynamics. Under zeroeffective pressure, rock materials can only supportsmall or zero differential stress, depending on loadingconfiguration and cohesion of material, and conse-quently generally fail in a brittle manner. The appli-cation of effective pressure produces majorstrengthening of the rock by suppressing the overallvolume increase (dilatancy) associated with cataclasticdeformation (e.g. Paterson, 1978).
In nature, only occasionally does fluid pressureapproach intergranular solid–solid pressure, forexample through compaction and metamorphic dehy-dration reactions, depending on the effectiveness of
drainage paths. Commonly, fluid pressures may be nohigher than 40% of lithostatic pressure (Sibson, 2000).It is highly likely that a great deal of natural rockdeformation occurs concurrently with metamorphicreactions, or as a consequence of changes in mineral-ogy and pore fluid pressure arising from metamorphicreactions. For example, increasing pore pressure as aresult of dehydration reactions in serpentinite orhydrous oceanic crustal rocks is widely invoked toexplain intermediate-depth seismicity in subductionzones, where otherwise it would tend to be suppressedby high overburden pressures (e.g. Raleigh & Paterson,1965; Murrell & Ismail, 1976; Kirby et al., 1991; Me-ade & Jeanloz, 1991). There is growing evidence fromfield and experimental studies that growth of ultrafinenew phases as reaction products may facilitate weak-ening and ductility in rocks through a switch to grain-size sensitive creep (e.g. Rubie, 1983; Rutter & Brodie,1988; Strating & Vissers, 1991; de Ronde et al., 2005),and the generation of porosity or intergranular stressconcentrations through solid-phase volume changesmay facilitate deformability (Poirier, 1982). These, andother types of mechanistic deformation/metamorphisminteractions are considered by Rutter & Brodie (1995).Progress towards understanding these interactionsrequires that reaction kinetics be investigated whenstress states are more complex than simply hydrostaticwith fluid pressure equal to total confining pressure,and rather when pore pressure is less than mean
*Present address: Department of Earth and Ocean Sciences, Uni-
versity of Liverpool, 4 Brownlow Street, Liverpool L69 3GP, UK.
J. metamorphic Geol., 2007, 25, 423–438 doi:10.1111/j.1525-1314.2007.00703.x
� 2007 Blackwell Publishing Ltd 42 3
intergranular solid pressure, and when rocks aredeforming under differential intergranular stresses.
With the aim of establishing the kinetics of ser-pentinite dehydration under conditions where it wouldbe able to support effective hydrostatic pressure anddifferential stresses, a series of drained heatingexperiments on intact rock cores at various tempera-tures and pressures was performed. Intact (initiallyzero porosity) samples can permit pore pressure andtotal pressure to be different, or non-hydrostaticstresses to be applied to the sample, but such samplematerials have generally not been used previously inmetamorphic studies. This experimental series is anessential precursor to a further study of interrelation-ships between the dehydration reaction and concurrentdeformation.
In this study, dehydration kinetics were studied as afunction of temperature, pore pressure and effectivepressure. To monitor the real-time progress of thereaction, the amount of water expelled from a sampleof constant total volume as a function of time wasmeasured using a servo-controlled volumometer. Mostexperiments, except those at the lowest temperatures,could be run until no further reaction occurred. Inaddition, dehydration experiments on granulated ser-pentinite samples prepared by crushing the samesource material were run to evaluate the relativedehydration kinetics compared with intact samples.
A similar experimental approach to the measure-ment of released water volumes in a dehydrationreaction at elevated pressure was used successfully instudies of gypsum dehydration (Ko et al., 1995, 1997;Olgaard et al., 1995; Milsch & Scholz, 2005), and byMiller et al. (2003), who used a volumometer todocument the fluid evolution rate at a single tem-perature on antigorite to forsterite (fo) + talc(ta) + H2O. Previously, Fyfe & Godwin (1962) alsosuccessfully used water expulsion as a tool to trackprogress of reaction in a study of equilibrium in bruciteto periclase dehydration.
CHARACTERIZATION OF THE STARTINGMATERIAL
Specimens used in the experiments were derived fromthree sample blocks Lz1a, Lz1c and Lz1d (minimumdimension 15 · 15 · 5–10 cm), collected from Port-hallow, in the Lizard Complex (SW England), a par-tially preserved and metamorphosed ophiolite bodywithin one of the suture zones of the Variscan-Appa-lachian Orogen in western Europe (e.g. Cook et al.,2002). X-ray diffraction analysis of crushed rocks fromthe blocks showed that the main serpentine phasepresent is lizardite 1-T, with minor amounts of chrys-otile. Other minerals are Fe-oxides, Cr spinels andMg-chlorite. Overall composition and mineralogyimply that the rock was originally a dunite.
Wavelength-dispersive spectrometry (WDS) electronmicroprobe analysis made on several thin sections
showed the serpentinite to contain total iron oxide inthe order of 4 wt%, but with variability between grainsof �±3 wt%. Total Al2O3 content is very small, lowerthan 0.1 wt%, and hence the formula for lizardite inthese rocks can be written as Mg2.85Fe0.15Si2O5(OH)4.However, a larger fraction of Al2O3 has a known sig-nificant effect on the dehydration reaction boundary,increasing the stability of lizardite by as much as 80 �Cat 200 MPa water pressure as Al2O3 increases from 3.7to 9.25 wt% (Chernosky, 1975; Caruso & Chernosky,1979; O’Hanley et al., 1989). Iron oxides are notknown to have a major direct effect on lizardite sta-bility. However, in a natural sample from the Alps, areduction in the activity of Mg by addition of Fe inantigorite was associated with a few degree decrease inthe dehydration reaction temperature at equilibrium(Worden et al., 1991). A small shift in temperature(�15 �C) in the hydration reaction of olivine is alsorelated to iron content in the serpentine produced(Moody, 1976; Wegner & Ernst, 1983).The difficulty in producing synthetic Al-free lizardite
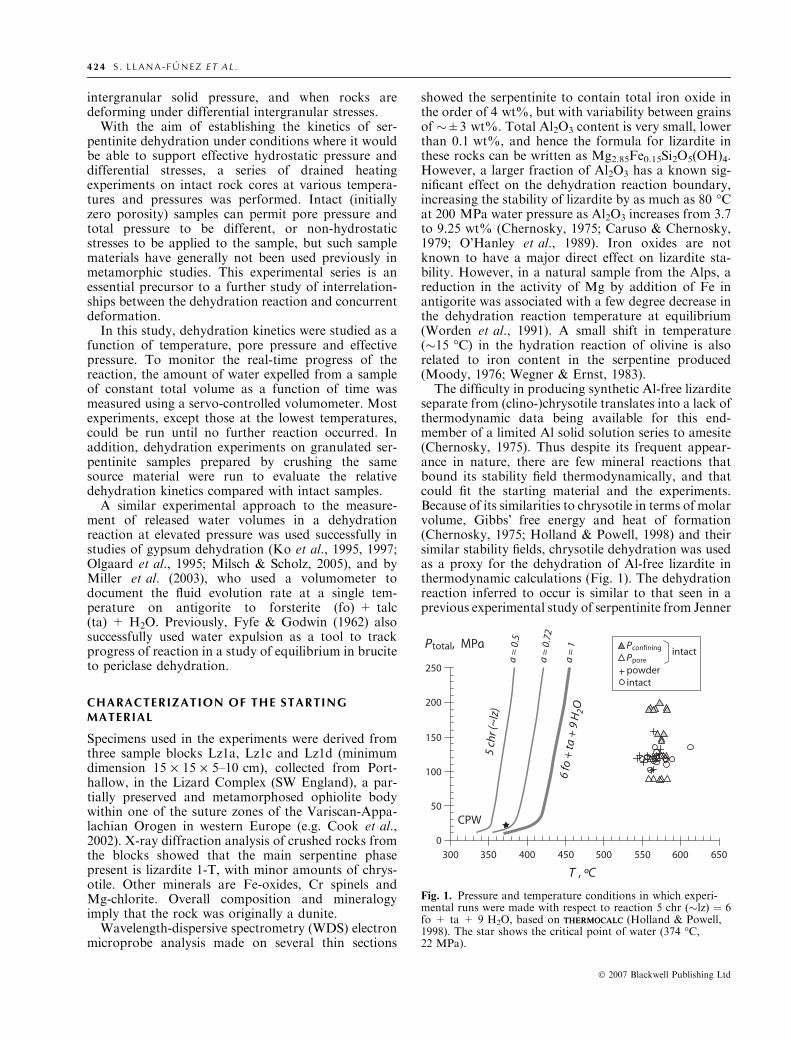
separate from (clino-)chrysotile translates into a lack ofthermodynamic data being available for this end-member of a limited Al solid solution series to amesite(Chernosky, 1975). Thus despite its frequent appear-ance in nature, there are few mineral reactions thatbound its stability field thermodynamically, and thatcould fit the starting material and the experiments.Because of its similarities to chrysotile in terms of molarvolume, Gibbs� free energy and heat of formation(Chernosky, 1975; Holland & Powell, 1998) and theirsimilar stability fields, chrysotile dehydration was usedas a proxy for the dehydration of Al-free lizardite inthermodynamic calculations (Fig. 1). The dehydrationreaction inferred to occur is similar to that seen in aprevious experimental study of serpentinite from Jenner
Fig. 1. Pressure and temperature conditions in which experi-mental runs were made with respect to reaction 5 chr (�lz) ¼ 6fo + ta + 9 H2O, based on THERMOCALCTHERMOCALC (Holland & Powell,1998). The star shows the critical point of water (374 �C,22 MPa).
4 24 S . L L A N A - F U N E Z E T A L .
� 2007 Blackwell Publishing Ltd
(California) that consisted mostly of Al-free lizardite(Rutter & Brodie, 1988). The reaction investigated is:
5serp (lz) ¼ 6foþ 1taþ 9H2O
On the basis that most physical properties and theaverage chemistry of lizardite are similar to those ofchrysotile, a first approximation of the solid volumechange expected through the same reaction but start-ing from chrysotile was made by using the THERMOCALCTHERMOCALC
3.21 thermodynamic data set (Holland & Powell,1998). The phase diagram was obtained using module1 of the software, assuming that chrysotile, forsterite,talc and water were present as reactants and/or pro-ducts under conditions where water was in excess andat pressures up to and equal to various fractions of theconfining pressure. According to the stoichiometry ofthe reaction, the porosity of a fully dehydrated 100%chrysotile specimen at elevated pressure and tempera-ture is about 25%, with resulting solid volume pro-portions of forsterite and talc of about 49% and 26 %,respectively.
The lack of atomic number contrast between chloriteand lizardite in back-scattered electron (BSE) SEMimages means that modal proportions of these miner-als present in the starting material could not be esti-mated. However, the different amounts of Al, Fe andCr in the different phases means that X-ray elementmaps obtained on the SEM could be used to differ-entiate the areas occupied by different phases. Thus themodal analysis of the starting material is: lizardite95 ± 3%, clinochlore 1 ± 1%, magnetite 4 ± 3%and Cr spinel <1%.
Initial porosity of the intact specimens was expectedto be close to zero, i.e. much less than 1% at experi-mental conditions, and this was evident from micro-structural observations. Porosity of the cold-pressedpowder specimens was close to 38% (Arkwright,2005), and hence there would be a significant contrastin the starting material permeability between bothtypes of specimens.
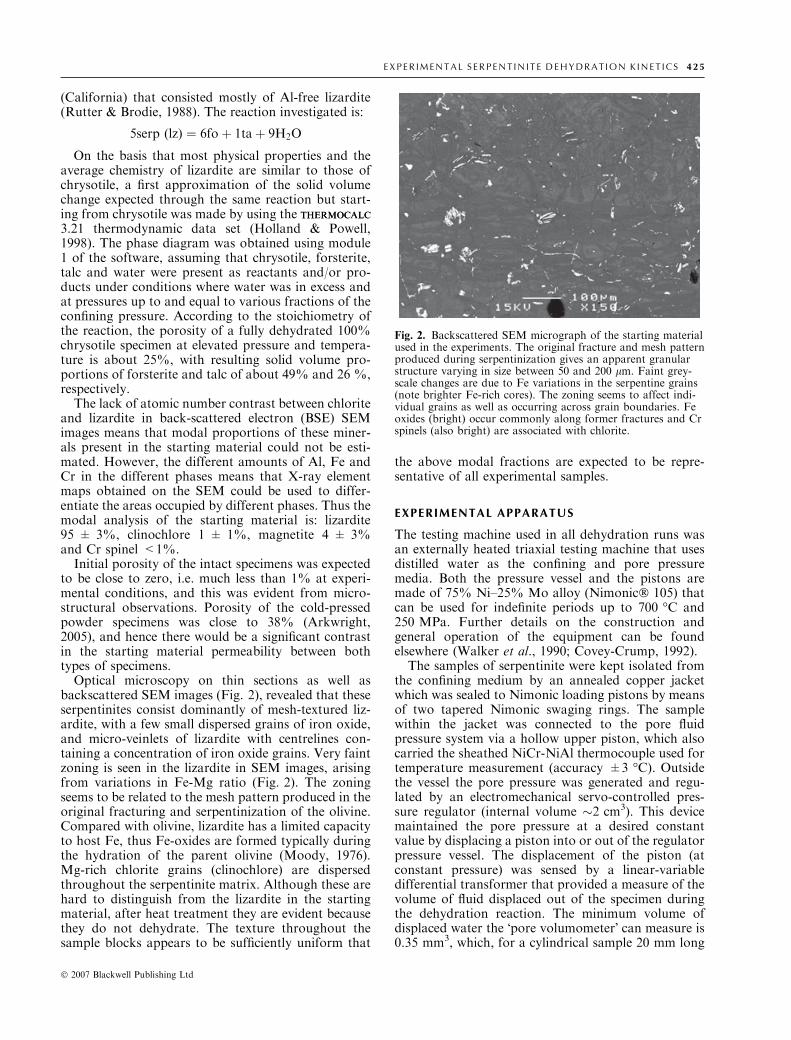
Optical microscopy on thin sections as well asbackscattered SEM images (Fig. 2), revealed that theseserpentinites consist dominantly of mesh-textured liz-ardite, with a few small dispersed grains of iron oxide,and micro-veinlets of lizardite with centrelines con-taining a concentration of iron oxide grains. Very faintzoning is seen in the lizardite in SEM images, arisingfrom variations in Fe-Mg ratio (Fig. 2). The zoningseems to be related to the mesh pattern produced in theoriginal fracturing and serpentinization of the olivine.Compared with olivine, lizardite has a limited capacityto host Fe, thus Fe-oxides are formed typically duringthe hydration of the parent olivine (Moody, 1976).Mg-rich chlorite grains (clinochlore) are dispersedthroughout the serpentinite matrix. Although these arehard to distinguish from the lizardite in the startingmaterial, after heat treatment they are evident becausethey do not dehydrate. The texture throughout thesample blocks appears to be sufficiently uniform that
the above modal fractions are expected to be repre-sentative of all experimental samples.
EXPERIMENTAL APPARATUS
The testing machine used in all dehydration runs wasan externally heated triaxial testing machine that usesdistilled water as the confining and pore pressuremedia. Both the pressure vessel and the pistons aremade of 75% Ni–25% Mo alloy (Nimonic� 105) thatcan be used for indefinite periods up to 700 �C and250 MPa. Further details on the construction andgeneral operation of the equipment can be foundelsewhere (Walker et al., 1990; Covey-Crump, 1992).
The samples of serpentinite were kept isolated fromthe confining medium by an annealed copper jacketwhich was sealed to Nimonic loading pistons by meansof two tapered Nimonic swaging rings. The samplewithin the jacket was connected to the pore fluidpressure system via a hollow upper piston, which alsocarried the sheathed NiCr-NiAl thermocouple used fortemperature measurement (accuracy ±3 �C). Outsidethe vessel the pore pressure was generated and regu-lated by an electromechanical servo-controlled pres-sure regulator (internal volume �2 cm3). This devicemaintained the pore pressure at a desired constantvalue by displacing a piston into or out of the regulatorpressure vessel. The displacement of the piston (atconstant pressure) was sensed by a linear-variabledifferential transformer that provided a measure of thevolume of fluid displaced out of the specimen duringthe dehydration reaction. The minimum volume ofdisplaced water the �pore volumometer� can measure is0.35 mm3, which, for a cylindrical sample 20 mm long
Fig. 2. Backscattered SEM micrograph of the starting materialused in the experiments. The original fracture and mesh patternproduced during serpentinization gives an apparent granularstructure varying in size between 50 and 200 lm. Faint grey-scale changes are due to Fe variations in the serpentine grains(note brighter Fe-rich cores). The zoning seems to affect indi-vidual grains as well as occurring across grain boundaries. Feoxides (bright) occur commonly along former fractures and Crspinels (also bright) are associated with chlorite.
E X P E R I M E N T A L S E R P E N T I N I T E D E H Y D R A T I O N K I N E T I C S 42 5
� 2007 Blackwell Publishing Ltd
and 9.5 mm in diameter, corresponds to a change of0.03 % over its original volume. Use of pore volu-mometry potentially gives a higher quality and con-tinuous record of the kinetics of a dehydration reactioncompared with the inevitably small number of meas-urements that can be made on products of individualruns made on separate specimens. Both pore pressureand confining pressure were measured using straingauge-type pressure transducers accurate to ±1 MPa.
Temperature variation along the sample cylinderwas measured by displacing a thermocouple tip along ahollow sample assembly in a calibration run and foundto be within ±2 �C at the temperatures used. The useof an externally heated vessel leads to excellent tem-perature stability (±1�C). This is essential for high-temperature pore volumometry, but corrections stillhave to be made for the effect of these small fluctua-tions on the specific volume of water. External heatingof the whole pressure vessel also leads to rather longheat-up and cool-down cycle times (1–2 and 3–4 h,respectively), although attainment of test temperaturefrom 400 �C or cooling to 400 �C (effective quenchtime) relative to the reaction equilibrium temperaturecould be reached within about 15–20 min.
EXPERIMENTAL PROCEDURE, TESTCONDITIONS AND DATA PROCESSING
Cores up to 20 mm long and 9.5 mm diameter drilledfrom sample blocks Lz1c and Lz1d were used in theintact specimen tests. Powders from sample block Lz1awere used to fabricate the synthetic specimens, withparticle sizes ranging between 76 and 90 lm aftersieving. After packing the 2–3 g of powder into thecopper jacket, it was cold-pressed under uniaxial loadin a die to 200 MPa. This typically resulted in a por-osity of 38.1 ± 3.3%. Once inside the pressure vessel,the specimen was pressurized to 110 MPa (both con-fining and pore pressure) and heated to the targettemperature and, once achieved, the pore pressure andconfining pressure systems were isolated from eachother. Setting the volumometer at this point allowedthe logging of changes in water volume as the reactionproceeded. For samples tested at nominally zeroeffective pressure (confining pressure ¼ pore pressure),the confining pressure must in fact be slightly(�2 MPa) greater than the pore pressure so that thecopper jacket remains pressed against the outer surfaceof the specimen to prevent pockets of excess watervolume developing within the jacket. This conditionautomatically exists when the desired confining pres-sure is substantially greater than the pore pressure. It ispossible for small pockets of water to become trappedbetween the specimen and jacket during pressurization,heating and thermal equilibration, and these will notbe released until full porosity connectivity is attained inthe early stage of dehydration. In this case it is possiblefor the total amount of water expelled to slightlyexceed that corresponding to total dehydration of the
serpentinite present. An excess of water was measuredin six dehydration runs.Using THERMOCALCTHERMOCALC (Holland & Powell, 1998), equi-
librium values were calculated for the dehydration ofchrysotile to fosterite plus talc plus water for wateractivities ranging between 0.5 and 1 and pressuresranging up to 250 MPa (Table 1). Water activity wascalculated as the ratio between water fugacity at porepressure conditions and the corresponding waterfugacity at confining pressure conditions. The calcu-lation is based on the assumption that pressure of thefluid trapped at the olivine-serpentine contact wouldbe that of the pore fluid reservoir and different fromthe intergranular pressure between the solid grains,although water pressures could be locally at somevalue between these pressure extremes.Figure 1 shows the conditions of temperature and
total pressure for the experiments performed, in rela-tion to the calculated equilibria. In all cases the porewater pressure was controlled at a value near 120 MPa(Table 1). The test temperatures ranged between 535and 610 �C because these temperatures gave a man-ageable range of reaction rates. Thus the thermaloverstep relative to theoretical equilibrium was alwaysin excess of 100 �C, and up to 170 �C when effectivepressure was applied and equilibrium values are basedon the activities of water at each test. These combi-nations of pressure and temperature were limitedaccording to the capabilities of the apparatus used.At the combinations of pore water pressures and
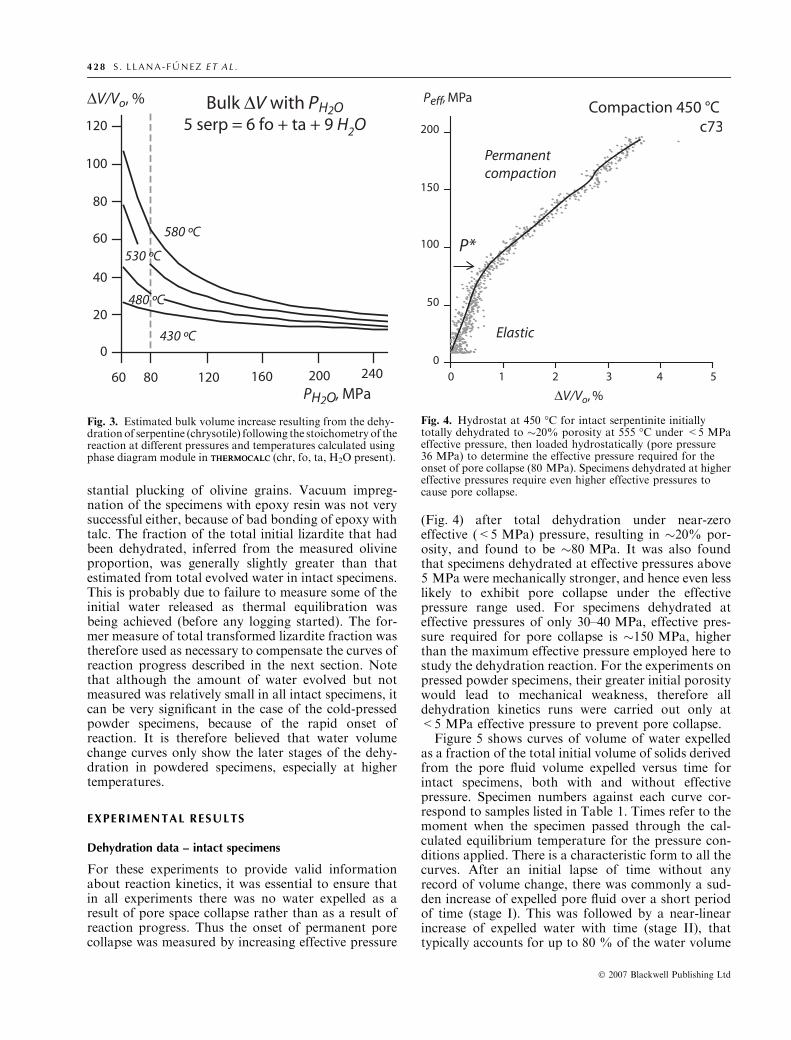
temperatures used, the molar volume of water is on theedge of being very sensitive to pressure variations(Fig. 3). Thus in practice the performance of thepressure controller begins to degrade as pore pressureis reduced below �90 MPa, and the amplitude ofpressure fluctuations due to thermal convection in thehollow upper loading piston increases, causing exces-sive hunting of the servosystem as it tries to follow thepressure fluctuations.In these experiments, as the volume of the solid
reaction products is less than that of the parentserpentinite, pore volume is created. Provided thatthe effective pressure is not sufficiently high to causepore collapse (as was the case in all the experiments,see �Experimental results� below), the pore spacebecomes filled with evolved water at the controlledpore water pressure. Because the reaction produces anet volume increase (solids plus fluid) at the relativelylow pressures used, the excess water is expelled, andthat is what is measured by the pore volumometer.The fluid volume change occurring in the specimen athigh temperature is transmitted as an equal volumechange recorded by the volumometer, despite thevolumometer measuring displacement by liquidwater. Figure 3 shows (from THERMOCALCTHERMOCALC) the addi-tional volume of water with respect to the originalsample volume which is produced in excess of thecreated porosity as a function of pore pressure andtemperature.
4 26 S . L L A N A - F U N E Z E T A L .
� 2007 Blackwell Publishing Ltd
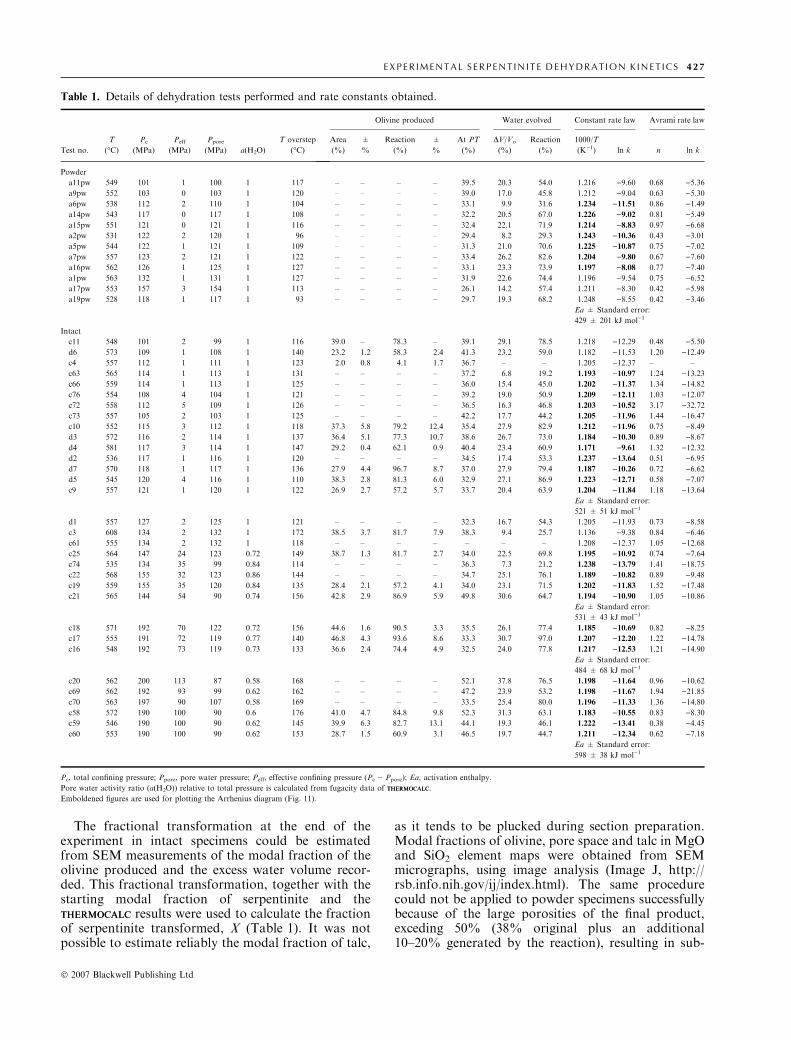
The fractional transformation at the end of theexperiment in intact specimens could be estimatedfrom SEM measurements of the modal fraction of theolivine produced and the excess water volume recor-ded. This fractional transformation, together with thestarting modal fraction of serpentinite and theTHERMOCALCTHERMOCALC results were used to calculate the fractionof serpentinite transformed, X (Table 1). It was notpossible to estimate reliably the modal fraction of talc,
as it tends to be plucked during section preparation.Modal fractions of olivine, pore space and talc in MgOand SiO2 element maps were obtained from SEMmicrographs, using image analysis (Image J, http://rsb.info.nih.gov/ij/index.html). The same procedurecould not be applied to powder specimens successfullybecause of the large porosities of the final product,exceding 50% (38% original plus an additional10–20% generated by the reaction), resulting in sub-
Table 1. Details of dehydration tests performed and rate constants obtained.
Test no.
T
(�C)Pc
(MPa)
Peff
(MPa)
Ppore
(MPa) a(H2O)
T overstep
(�C)
Olivine produced Water evolved Constant rate law Avrami rate law
Area
(%)
±
%
Reaction
(%)
±
%
At PT
(%)
DV/Vo
(%)
Reaction
(%)
1000/T
(K)1) ln k n ln k
Powder
a11pw 549 101 1 100 1 117 – – – – 39.5 20.3 54.0 1.216 )9.60 0.68 )5.36a9pw 552 103 0 103 1 120 – – – – 39.0 17.0 45.8 1.212 )9.04 0.63 )5.30a6pw 538 112 2 110 1 104 – – – – 33.1 9.9 31.6 1.234 )11.51 0.86 )1.49a14pw 543 117 0 117 1 108 – – – – 32.2 20.5 67.0 1.226 )9.02 0.81 )5.49a15pw 551 121 0 121 1 116 – – – – 32.4 22.1 71.9 1.214 )8.83 0.97 )6.68a2pw 531 122 2 120 1 96 – – – – 29.4 8.2 29.3 1.243 )10.36 0.43 )3.01a5pw 544 122 1 121 1 109 – – – – 31.3 21.0 70.6 1.225 )10.87 0.75 )7.02a7pw 557 123 2 121 1 122 – – – – 33.4 26.2 82.6 1.204 )9.80 0.67 )7.60a16pw 562 126 1 125 1 127 – – – – 33.1 23.3 73.9 1.197 )8.08 0.77 )7.40a1pw 563 132 1 131 1 127 – – – – 31.9 22.6 74.4 1.196 )9.54 0.75 )6.52a17pw 553 157 3 154 1 113 – – – – 26.1 14.2 57.4 1.211 )8.30 0.42 )5.98a19pw 528 118 1 117 1 93 – – – – 29.7 19.3 68.2 1.248 )8.55 0.42 )3.46
Ea ± Standard error:
429 ± 201 kJ mol)1
Intact
c11 548 101 2 99 1 116 39.0 – 78.3 – 39.1 29.1 78.5 1.218 )12.29 0.48 )5.50d6 573 109 1 108 1 140 23.2 1.2 58.3 2.4 41.3 23.2 59.0 1.182 )11.53 1.20 )12.49c4 557 112 1 111 1 123 2.0 0.8 4.1 1.7 36.7 – – 1.205 )12.37 – –
c63 565 114 1 113 1 131 – – – – 37.2 6.8 19.2 1.193 )10.97 1.24 )13.23c66 559 114 1 113 1 125 – – – – 36.0 15.4 45.0 1.202 )11.37 1.34 )14.82c76 554 108 4 104 1 121 – – – – 39.2 19.0 50.9 1.209 )12.11 1.03 )12.07c72 558 112 5 109 1 126 – – – – 36.5 16.3 46.8 1.203 )10.52 3.17 )32.72c73 557 105 2 103 1 125 – – – – 42.2 17.7 44.2 1.205 )11.96 1.44 )16.47c10 552 115 3 112 1 118 37.3 5.8 79.2 12.4 35.4 27.9 82.9 1.212 )11.96 0.75 )8.49d3 572 116 2 114 1 137 36.4 5.1 77.3 10.7 38.6 26.7 73.0 1.184 )10.30 0.89 )8.67d4 581 117 3 114 1 147 29.2 0.4 62.1 0.9 40.4 23.4 60.9 1.171 )9.61 1.32 )12.32d2 536 117 1 116 1 120 – – – – 34.5 17.4 53.3 1.237 )13.64 0.51 )6.95d7 570 118 1 117 1 136 27.9 4.4 96.7 8.7 37.0 27.9 79.4 1.187 )10.26 0.72 )6.62d5 545 120 4 116 1 110 38.3 2.8 81.3 6.0 32.9 27.1 86.9 1.223 )12.71 0.58 )7.07c9 557 121 1 120 1 122 26.9 2.7 57.2 5.7 33.7 20.4 63.9 1.204 )11.84 1.18 )13.64
Ea ± Standard error:
521 ± 51 kJ mol)1
d1 557 127 2 125 1 121 – – – – 32.3 16.7 54.3 1.205 )11.93 0.73 )8.58c3 608 134 2 132 1 172 38.5 3.7 81.7 7.9 38.3 9.4 25.7 1.136 )9.38 0.84 )6.46c61 555 134 2 132 1 118 – – – – – – – 1.208 )12.37 1.05 )12.68c25 564 147 24 123 0.72 149 38.7 1.3 81.7 2.7 34.0 22.5 69.8 1.195 )10.92 0.74 )7.64c74 535 134 35 99 0.84 114 – – – – 36.3 7.3 21.2 1.238 )13.79 1.41 )18.75c22 568 155 32 123 0.86 144 – – – – 34.7 25.1 76.1 1.189 )10.82 0.89 )9.48c19 559 155 35 120 0.84 135 28.4 2.1 57.2 4.1 34.0 23.1 71.5 1.202 )11.83 1.52 )17.48c21 565 144 54 90 0.74 156 42.8 2.9 86.9 5.9 49.8 30.6 64.7 1.194 )10.90 1.05 )10.86
Ea ± Standard error:
531 ± 43 kJ mol)1
c18 571 192 70 122 0.72 156 44.6 1.6 90.5 3.3 35.5 26.1 77.4 1.185 )10.69 0.82 )8.25c17 555 191 72 119 0.77 140 46.8 4.3 93.6 8.6 33.3 30.7 97.0 1.207 )12.20 1.22 )14.78c16 548 192 73 119 0.73 133 36.6 2.4 74.4 4.9 32.5 24.0 77.8 1.217 )12.53 1.21 )14.90
Ea ± Standard error:
484 ± 68 kJ mol)1
c20 562 200 113 87 0.58 168 – – – – 52.1 37.8 76.5 1.198 )11.64 0.96 )10.62c69 562 192 93 99 0.62 162 – – – – 47.2 23.9 53.2 1.198 )11.67 1.94 )21.85c70 563 197 90 107 0.58 169 – – – – 33.5 25.4 80.0 1.196 )11.33 1.36 )14.80c58 572 190 100 90 0.6 176 41.0 4.7 84.8 9.8 52.3 31.3 63.1 1.183 )10.55 0.83 )8.30c59 546 190 100 90 0.62 145 39.9 6.3 82.7 13.1 44.1 19.3 46.1 1.222 )13.41 0.38 )4.45c60 553 190 100 90 0.62 153 28.7 1.5 60.9 3.1 46.5 19.7 44.7 1.211 )12.34 0.62 )7.18
Ea ± Standard error:
598 ± 38 kJ mol)1
Pc, total confining pressure; Ppore, pore water pressure; Peff, effective confining pressure (Pc ) Ppore); Ea, activation enthalpy.
Pore water activity ratio (a(H2O)) relative to total pressure is calculated from fugacity data of THERMOCALCTHERMOCALC.
Emboldened figures are used for plotting the Arrhenius diagram (Fig. 11).
E X P E R I M E N T A L S E R P E N T I N I T E D E H Y D R A T I O N K I N E T I C S 42 7
� 2007 Blackwell Publishing Ltd
stantial plucking of olivine grains. Vacuum impreg-nation of the specimens with epoxy resin was not verysuccessful either, because of bad bonding of epoxy withtalc. The fraction of the total initial lizardite that hadbeen dehydrated, inferred from the measured olivineproportion, was generally slightly greater than thatestimated from total evolved water in intact specimens.This is probably due to failure to measure some of theinitial water released as thermal equilibration wasbeing achieved (before any logging started). The for-mer measure of total transformed lizardite fraction wastherefore used as necessary to compensate the curves ofreaction progress described in the next section. Notethat although the amount of water evolved but notmeasured was relatively small in all intact specimens, itcan be very significant in the case of the cold-pressedpowder specimens, because of the rapid onset ofreaction. It is therefore believed that water volumechange curves only show the later stages of the dehy-dration in powdered specimens, especially at highertemperatures.
EXPERIMENTAL RESULTS
Dehydration data – intact specimens
For these experiments to provide valid informationabout reaction kinetics, it was essential to ensure thatin all experiments there was no water expelled as aresult of pore space collapse rather than as a result ofreaction progress. Thus the onset of permanent porecollapse was measured by increasing effective pressure
(Fig. 4) after total dehydration under near-zeroeffective (<5 MPa) pressure, resulting in �20% por-osity, and found to be �80 MPa. It was also foundthat specimens dehydrated at effective pressures above5 MPa were mechanically stronger, and hence even lesslikely to exhibit pore collapse under the effectivepressure range used. For specimens dehydrated ateffective pressures of only 30–40 MPa, effective pres-sure required for pore collapse is �150 MPa, higherthan the maximum effective pressure employed here tostudy the dehydration reaction. For the experiments onpressed powder specimens, their greater initial porositywould lead to mechanical weakness, therefore alldehydration kinetics runs were carried out only at<5 MPa effective pressure to prevent pore collapse.Figure 5 shows curves of volume of water expelled
as a fraction of the total initial volume of solids derivedfrom the pore fluid volume expelled versus time forintact specimens, both with and without effectivepressure. Specimen numbers against each curve cor-respond to samples listed in Table 1. Times refer to themoment when the specimen passed through the cal-culated equilibrium temperature for the pressure con-ditions applied. There is a characteristic form to all thecurves. After an initial lapse of time without anyrecord of volume change, there was commonly a sud-den increase of expelled pore fluid over a short periodof time (stage I). This was followed by a near-linearincrease of expelled water with time (stage II), thattypically accounts for up to 80 % of the water volume
Fig. 4. Hydrostat at 450 �C for intact serpentinite initiallytotally dehydrated to �20% porosity at 555 �C under <5 MPaeffective pressure, then loaded hydrostatically (pore pressure36 MPa) to determine the effective pressure required for theonset of pore collapse (80 MPa). Specimens dehydrated at highereffective pressures require even higher effective pressures tocause pore collapse.
Fig. 3. Estimated bulk volume increase resulting from the dehy-drationof serpentine (chrysotile) following the stoichometry of thereaction at different pressures and temperatures calculated usingphase diagram module in THERMOCALCTHERMOCALC (chr, fo, ta, H2O present).
4 28 S . L L A N A - F U N E Z E T A L .
� 2007 Blackwell Publishing Ltd
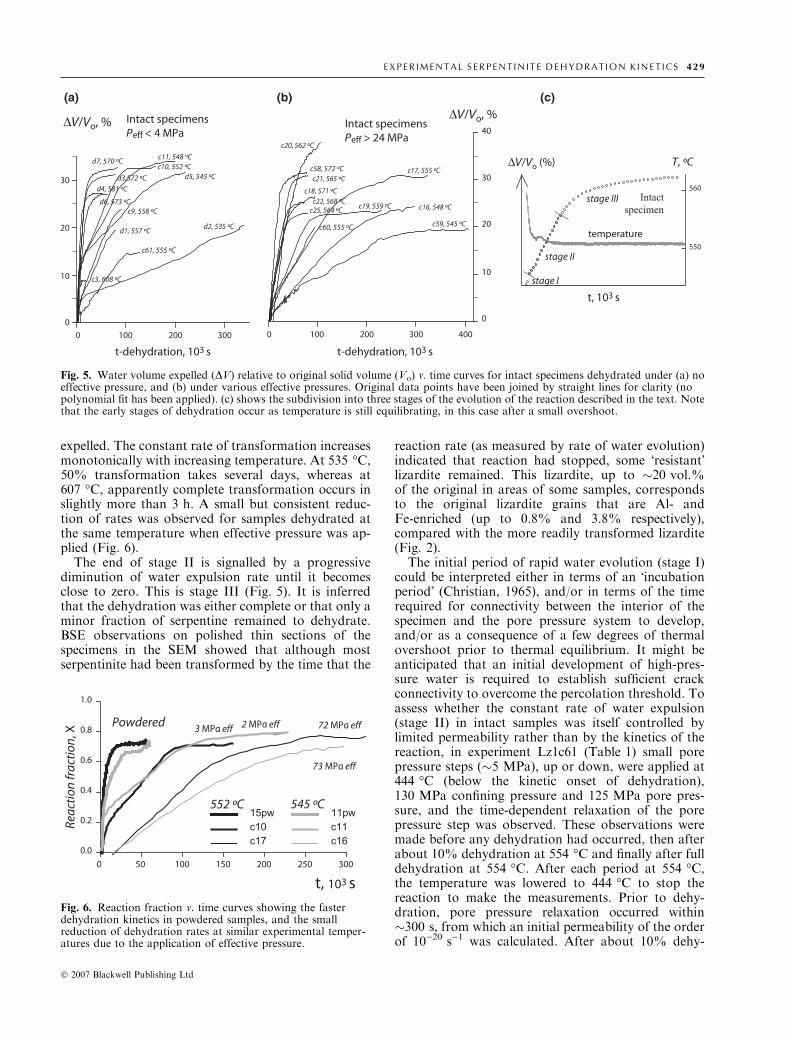
expelled. The constant rate of transformation increasesmonotonically with increasing temperature. At 535 �C,50% transformation takes several days, whereas at607 �C, apparently complete transformation occurs inslightly more than 3 h. A small but consistent reduc-tion of rates was observed for samples dehydrated atthe same temperature when effective pressure was ap-plied (Fig. 6).
The end of stage II is signalled by a progressivediminution of water expulsion rate until it becomesclose to zero. This is stage III (Fig. 5). It is inferredthat the dehydration was either complete or that only aminor fraction of serpentine remained to dehydrate.BSE observations on polished thin sections of thespecimens in the SEM showed that although mostserpentinite had been transformed by the time that the
reaction rate (as measured by rate of water evolution)indicated that reaction had stopped, some �resistant�lizardite remained. This lizardite, up to �20 vol.%of the original in areas of some samples, correspondsto the original lizardite grains that are Al- andFe-enriched (up to 0.8% and 3.8% respectively),compared with the more readily transformed lizardite(Fig. 2).
The initial period of rapid water evolution (stage I)could be interpreted either in terms of an �incubationperiod� (Christian, 1965), and/or in terms of the timerequired for connectivity between the interior of thespecimen and the pore pressure system to develop,and/or as a consequence of a few degrees of thermalovershoot prior to thermal equilibrium. It might beanticipated that an initial development of high-pres-sure water is required to establish sufficient crackconnectivity to overcome the percolation threshold. Toassess whether the constant rate of water expulsion(stage II) in intact samples was itself controlled bylimited permeability rather than by the kinetics of thereaction, in experiment Lz1c61 (Table 1) small porepressure steps (�5 MPa), up or down, were applied at444 �C (below the kinetic onset of dehydration),130 MPa confining pressure and 125 MPa pore pres-sure, and the time-dependent relaxation of the porepressure step was observed. These observations weremade before any dehydration had occurred, then afterabout 10% dehydration at 554 �C and finally after fulldehydration at 554 �C. After each period at 554 �C,the temperature was lowered to 444 �C to stop thereaction to make the measurements. Prior to dehy-dration, pore pressure relaxation occurred within�300 s, from which an initial permeability of the orderof 10)20 s)1 was calculated. After about 10% dehy-
Fig. 5. Water volume expelled (DV) relative to original solid volume (Vo) v. time curves for intact specimens dehydrated under (a) noeffective pressure, and (b) under various effective pressures. Original data points have been joined by straight lines for clarity (nopolynomial fit has been applied). (c) shows the subdivision into three stages of the evolution of the reaction described in the text. Notethat the early stages of dehydration occur as temperature is still equilibrating, in this case after a small overshoot.
Fig. 6. Reaction fraction v. time curves showing the fasterdehydration kinetics in powdered samples, and the smallreduction of dehydration rates at similar experimental temper-atures due to the application of effective pressure.
E X P E R I M E N T A L S E R P E N T I N I T E D E H Y D R A T I O N K I N E T I C S 42 9
� 2007 Blackwell Publishing Ltd
dration, the permeability estimate increased between10- and 100-fold, and after full dehydration, a pressurestep could not be applied quickly enough to observethe time-dependent pressure relaxation. These obser-vations indicate that there was sufficient connectivityof pore fluid within the dehydrating specimen to ensurethat the rate of dehydration was properly indicated bythe volumometer measurements. Tenthorey & Cox(2003) also found that the permeability of intact ser-pentinite increased dramatically as the reaction becameestablished. Thus it is suggested that stage I is due tosome combination of incubation period, the estab-lishment by microcracking or opening of grainboundaries of a sufficiently enhanced connectivity andperhaps also may initially reflect higher rates corre-sponding to initial higher temperatures if the furnaceslightly overshoots the target temperature (Fig. 5).
Dehydration data – powdered specimens
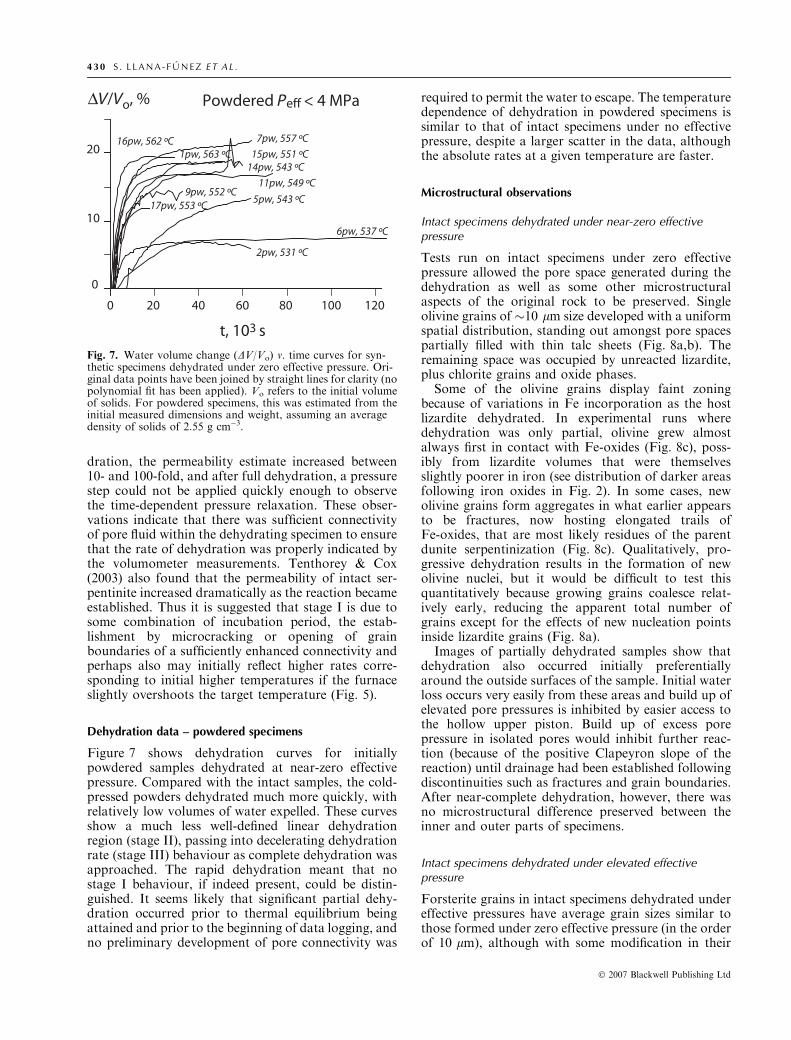
Figure 7 shows dehydration curves for initiallypowdered samples dehydrated at near-zero effectivepressure. Compared with the intact samples, the cold-pressed powders dehydrated much more quickly, withrelatively low volumes of water expelled. These curvesshow a much less well-defined linear dehydrationregion (stage II), passing into decelerating dehydrationrate (stage III) behaviour as complete dehydration wasapproached. The rapid dehydration meant that nostage I behaviour, if indeed present, could be distin-guished. It seems likely that significant partial dehy-dration occurred prior to thermal equilibrium beingattained and prior to the beginning of data logging, andno preliminary development of pore connectivity was
required to permit the water to escape. The temperaturedependence of dehydration in powdered specimens issimilar to that of intact specimens under no effectivepressure, despite a larger scatter in the data, althoughthe absolute rates at a given temperature are faster.
Microstructural observations
Intact specimens dehydrated under near-zero effectivepressure
Tests run on intact specimens under zero effectivepressure allowed the pore space generated during thedehydration as well as some other microstructuralaspects of the original rock to be preserved. Singleolivine grains of �10 lm size developed with a uniformspatial distribution, standing out amongst pore spacespartially filled with thin talc sheets (Fig. 8a,b). Theremaining space was occupied by unreacted lizardite,plus chlorite grains and oxide phases.Some of the olivine grains display faint zoning
because of variations in Fe incorporation as the hostlizardite dehydrated. In experimental runs wheredehydration was only partial, olivine grew almostalways first in contact with Fe-oxides (Fig. 8c), poss-ibly from lizardite volumes that were themselvesslightly poorer in iron (see distribution of darker areasfollowing iron oxides in Fig. 2). In some cases, newolivine grains form aggregates in what earlier appearsto be fractures, now hosting elongated trails ofFe-oxides, that are most likely residues of the parentdunite serpentinization (Fig. 8c). Qualitatively, pro-gressive dehydration results in the formation of newolivine nuclei, but it would be difficult to test thisquantitatively because growing grains coalesce relat-ively early, reducing the apparent total number ofgrains except for the effects of new nucleation pointsinside lizardite grains (Fig. 8a).Images of partially dehydrated samples show that
dehydration also occurred initially preferentiallyaround the outside surfaces of the sample. Initial waterloss occurs very easily from these areas and build up ofelevated pore pressures is inhibited by easier access tothe hollow upper piston. Build up of excess porepressure in isolated pores would inhibit further reac-tion (because of the positive Clapeyron slope of thereaction) until drainage had been established followingdiscontinuities such as fractures and grain boundaries.After near-complete dehydration, however, there wasno microstructural difference preserved between theinner and outer parts of specimens.
Intact specimens dehydrated under elevated effectivepressure
Forsterite grains in intact specimens dehydrated undereffective pressures have average grain sizes similar tothose formed under zero effective pressure (in the orderof 10 lm), although with some modification in their
Fig. 7. Water volume change (DV/Vo) v. time curves for syn-thetic specimens dehydrated under zero effective pressure. Ori-ginal data points have been joined by straight lines for clarity (nopolynomial fit has been applied). Vo refers to the initial volumeof solids. For powdered specimens, this was estimated from theinitial measured dimensions and weight, assuming an averagedensity of solids of 2.55 g cm)3.
4 30 S . L L A N A - F U N E Z E T A L .
� 2007 Blackwell Publishing Ltd
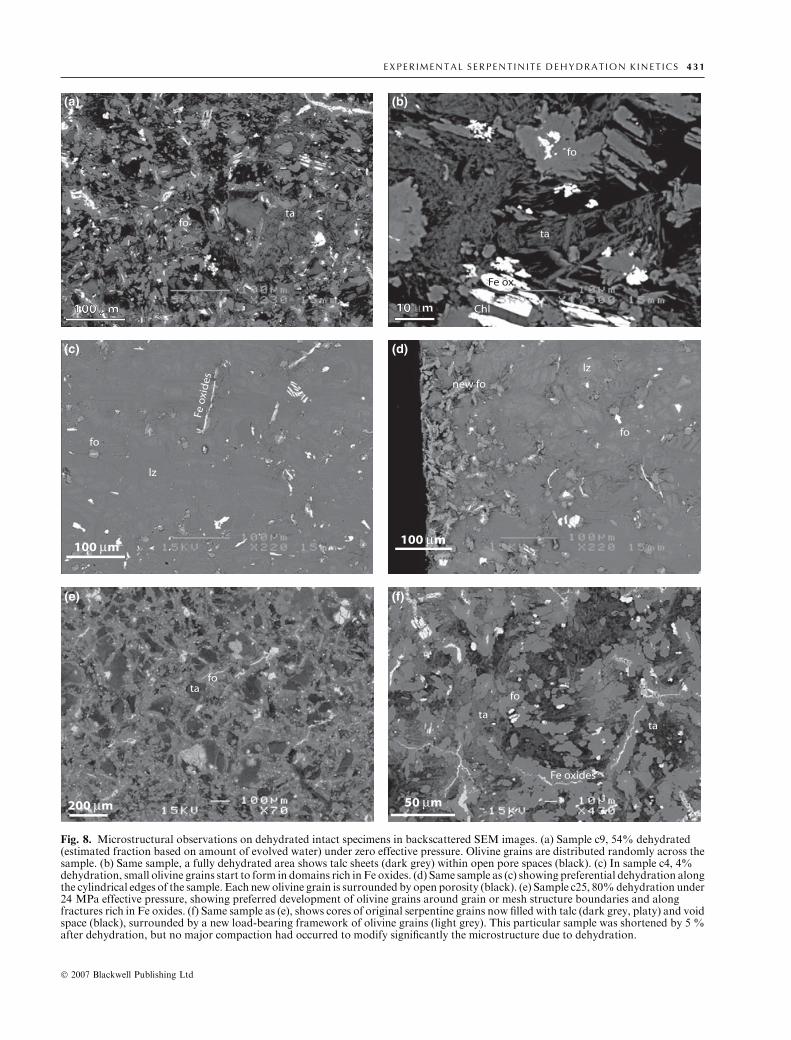
Fig. 8. Microstructural observations on dehydrated intact specimens in backscattered SEM images. (a) Sample c9, 54% dehydrated(estimated fraction based on amount of evolved water) under zero effective pressure. Olivine grains are distributed randomly across thesample. (b) Same sample, a fully dehydrated area shows talc sheets (dark grey) within open pore spaces (black). (c) In sample c4, 4%dehydration, small olivine grains start to form in domains rich inFe oxides. (d) Same sample as (c) showing preferential dehydration alongthe cylindrical edges of the sample. Each newolivine grain is surrounded by open porosity (black). (e) Sample c25, 80%dehydration under24 MPa effective pressure, showing preferred development of olivine grains around grain or mesh structure boundaries and alongfractures rich in Fe oxides. (f) Same sample as (e), shows cores of original serpentine grains now filled with talc (dark grey, platy) and voidspace (black), surrounded by a new load-bearing framework of olivine grains (light grey). This particular sample was shortened by 5 %after dehydration, but no major compaction had occurred to modify significantly the microstructure due to dehydration.
E X P E R I M E N T A L S E R P E N T I N I T E D E H Y D R A T I O N K I N E T I C S 43 1
� 2007 Blackwell Publishing Ltd
arrangement. They tend to form a �connected� network(Fig. 8e), isolating spaces occupied by the mixture oftalc sheets and pore spaces (Fig. 8f) and, occasionally,relict grains of lizardite. Such networks seem to followeither pre-existing grain boundaries and/or the meshfractures created on original primary olivine during theserpentinization, perhaps because effective pressuresuppresses the density of imperfections within graininteriors that are suitable nucleation points. Subse-quent mechanical testing showed that the formation ofa framework of connected olivine in this way resultedin mechanical strengthening relative to samples dehy-drated at near-zero effective pressure.
Dehydration of powdered synthetic specimens
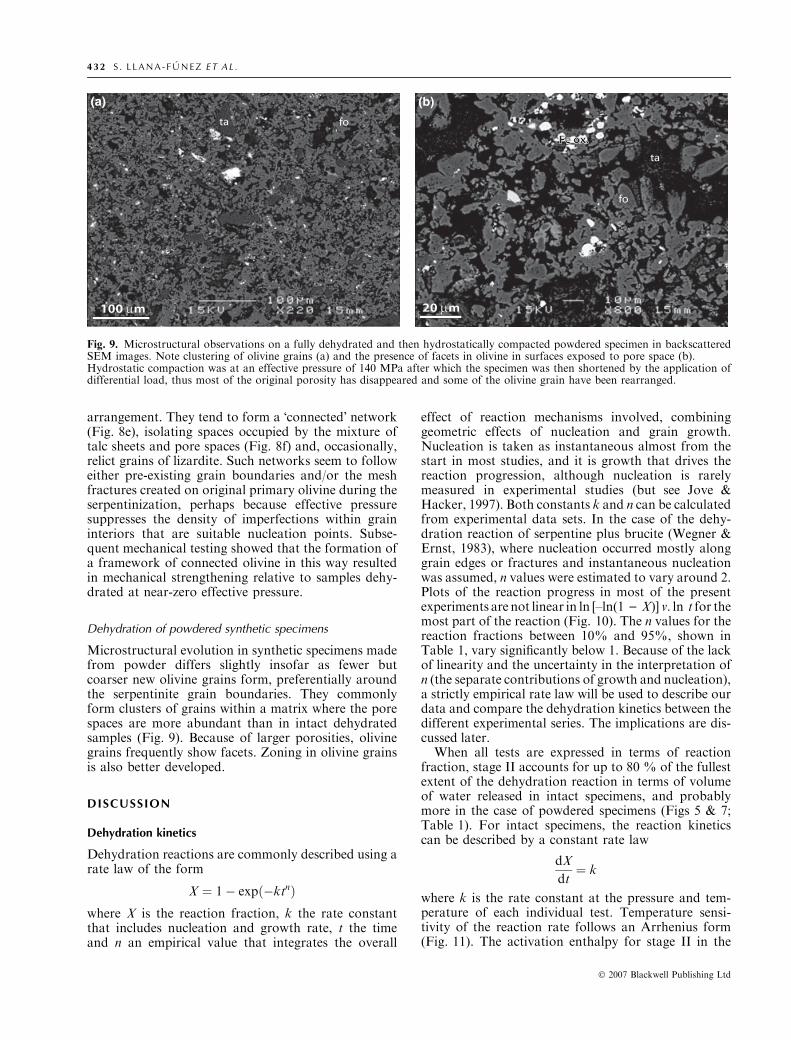
Microstructural evolution in synthetic specimens madefrom powder differs slightly insofar as fewer butcoarser new olivine grains form, preferentially aroundthe serpentinite grain boundaries. They commonlyform clusters of grains within a matrix where the porespaces are more abundant than in intact dehydratedsamples (Fig. 9). Because of larger porosities, olivinegrains frequently show facets. Zoning in olivine grainsis also better developed.
DISCUSSION
Dehydration kinetics
Dehydration reactions are commonly described using arate law of the form
X ¼ 1� expð�ktnÞwhere X is the reaction fraction, k the rate constantthat includes nucleation and growth rate, t the timeand n an empirical value that integrates the overall
effect of reaction mechanisms involved, combininggeometric effects of nucleation and grain growth.Nucleation is taken as instantaneous almost from thestart in most studies, and it is growth that drives thereaction progression, although nucleation is rarelymeasured in experimental studies (but see Jove &Hacker, 1997). Both constants k and n can be calculatedfrom experimental data sets. In the case of the dehy-dration reaction of serpentine plus brucite (Wegner &Ernst, 1983), where nucleation occurred mostly alonggrain edges or fractures and instantaneous nucleationwas assumed, n values were estimated to vary around 2.Plots of the reaction progress in most of the presentexperiments are not linear in ln [–ln(1 ) X)] v. ln t for themost part of the reaction (Fig. 10). The n values for thereaction fractions between 10% and 95%, shown inTable 1, vary significantly below 1. Because of the lackof linearity and the uncertainty in the interpretation ofn (the separate contributions of growth and nucleation),a strictly empirical rate law will be used to describe ourdata and compare the dehydration kinetics between thedifferent experimental series. The implications are dis-cussed later.When all tests are expressed in terms of reaction
fraction, stage II accounts for up to 80 % of the fullestextent of the dehydration reaction in terms of volumeof water released in intact specimens, and probablymore in the case of powdered specimens (Figs 5 & 7;Table 1). For intact specimens, the reaction kineticscan be described by a constant rate law
dX
dt¼ k
where k is the rate constant at the pressure and tem-perature of each individual test. Temperature sensi-tivity of the reaction rate follows an Arrhenius form(Fig. 11). The activation enthalpy for stage II in the
Fig. 9. Microstructural observations on a fully dehydrated and then hydrostatically compacted powdered specimen in backscatteredSEM images. Note clustering of olivine grains (a) and the presence of facets in olivine in surfaces exposed to pore space (b).Hydrostatic compaction was at an effective pressure of 140 MPa after which the specimen was then shortened by the application ofdifferential load, thus most of the original porosity has disappeared and some of the olivine grain have been rearranged.
4 32 S . L L A N A - F U N E Z E T A L .
� 2007 Blackwell Publishing Ltd
intact samples under zero effective pressure, given by)R(d ln X/d1/T), where R is the gas constant and T isin Kelvin, was calculated to be 521 ± 52 kJ mol)1.The activation enthalpy in powdered specimens isapparently slightly lower, 429 ± 201 kJ mol)1. It
could be the same within the rather larger limits ofexperimental uncertainty, but the absolute reactionrates are significantly faster. The application ofeffective pressures in the range 70–113 MPa to intactsamples increases the apparent activation enthalpyslightly (averaged over that pressure range) to 551 ±39 kJ mol)1. It should be noted that the centroids ofthe intact-specimen data on the ln(k) v. 1/T plot atboth high and low effective pressures are not signifi-cantly different from each other, and given the simi-larities in the slopes relative to experimental errors, it islikely that there is no significant difference between theapparent activation enthalpies. Therefore, a �global�activation enthalpy is reported for all the data ob-tained from intact samples over the effective pressurerange 0–113 MPa of 528 ± 34 kJ mol)1.
Stage III displays a decelerating rate of reaction(first- or higher-order kinetics) as the transformationapproaches completion, implying a progressive dilu-tion of concentration of reaction points within thevolume of the specimen. There was no attempt toquantify this part of the dehydration.
Potential influence of effective pressure changes fordehydration in intact samples
Most dehydration equilibrium values have previouslybeen determined under hydrostatic conditions of totalfluid pressure ¼ water pressure, with no solid–solidpressure between grains. In a more general situation,water is only one component of the total fluid phase, sothat the partial pressure of water can be less than thetotal fluid pressure. Greenwood (1961) and Barnes &Ernst (1963) demonstrated experimentally that thisshifts dehydration equilibria to lower temperaturesthan when Pwater ¼ Ptotal (Fig. 12). It can therefore beanticipated that under circumstances where local nor-mal stress between solid-phase particles is higher thanthe pore water pressure in rocks undergoing dehydra-
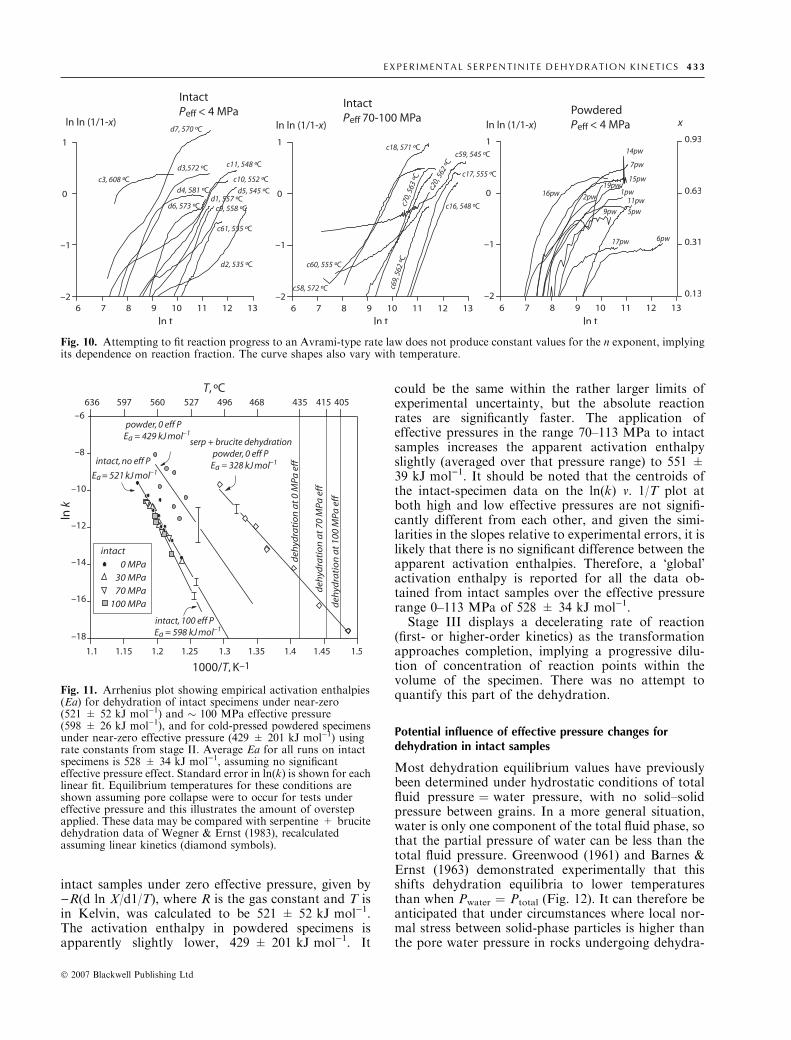
Fig. 10. Attempting to fit reaction progress to an Avrami-type rate law does not produce constant values for the n exponent, implyingits dependence on reaction fraction. The curve shapes also vary with temperature.
Fig. 11. Arrhenius plot showing empirical activation enthalpies(Ea) for dehydration of intact specimens under near-zero(521 ± 52 kJ mol)1) and � 100 MPa effective pressure(598 ± 26 kJ mol)1), and for cold-pressed powdered specimensunder near-zero effective pressure (429 ± 201 kJ mol)1) usingrate constants from stage II. Average Ea for all runs on intactspecimens is 528 ± 34 kJ mol)1, assuming no significanteffective pressure effect. Standard error in ln(k) is shown for eachlinear fit. Equilibrium temperatures for these conditions areshown assuming pore collapse were to occur for tests undereffective pressure and this illustrates the amount of overstepapplied. These data may be compared with serpentine + brucitedehydration data of Wegner & Ernst (1983), recalculatedassuming linear kinetics (diamond symbols).
E X P E R I M E N T A L S E R P E N T I N I T E D E H Y D R A T I O N K I N E T I C S 43 3
� 2007 Blackwell Publishing Ltd
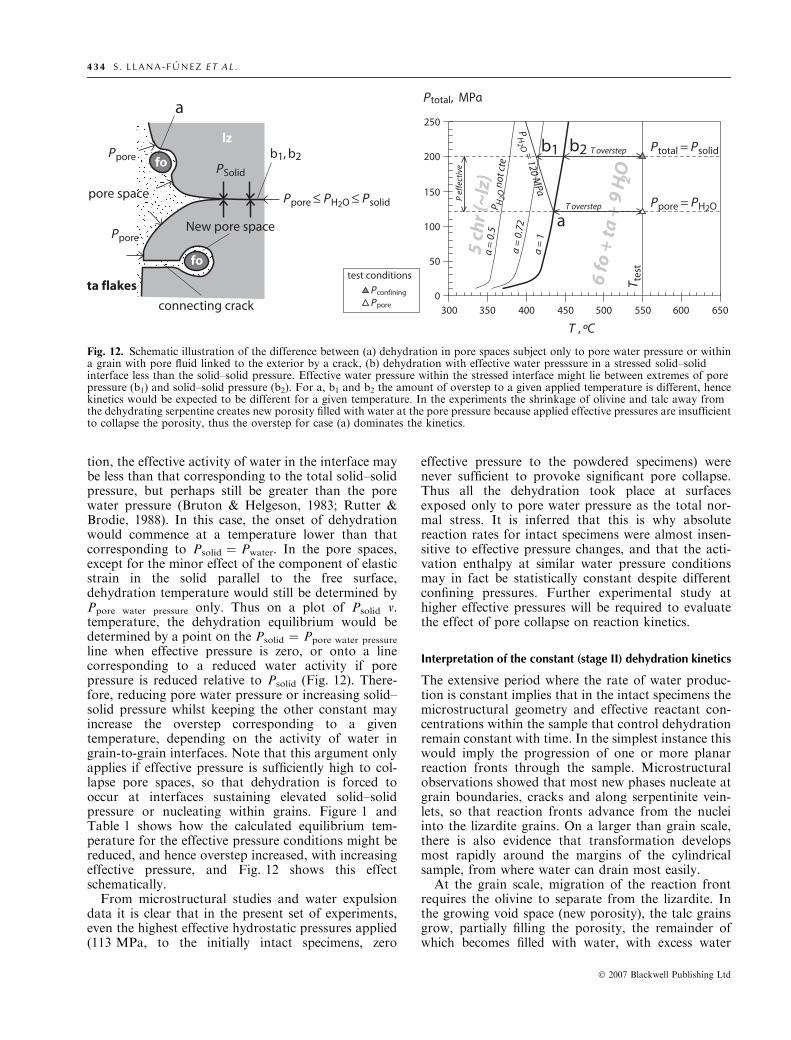
tion, the effective activity of water in the interface maybe less than that corresponding to the total solid–solidpressure, but perhaps still be greater than the porewater pressure (Bruton & Helgeson, 1983; Rutter &Brodie, 1988). In this case, the onset of dehydrationwould commence at a temperature lower than thatcorresponding to Psolid ¼ Pwater. In the pore spaces,except for the minor effect of the component of elasticstrain in the solid parallel to the free surface,dehydration temperature would still be determined byPpore water pressure only. Thus on a plot of Psolid v.temperature, the dehydration equilibrium would bedetermined by a point on the Psolid ¼ Ppore water pressure
line when effective pressure is zero, or onto a linecorresponding to a reduced water activity if porepressure is reduced relative to Psolid (Fig. 12). There-fore, reducing pore water pressure or increasing solid–solid pressure whilst keeping the other constant mayincrease the overstep corresponding to a giventemperature, depending on the activity of water ingrain-to-grain interfaces. Note that this argument onlyapplies if effective pressure is sufficiently high to col-lapse pore spaces, so that dehydration is forced tooccur at interfaces sustaining elevated solid–solidpressure or nucleating within grains. Figure 1 andTable 1 shows how the calculated equilibrium tem-perature for the effective pressure conditions might bereduced, and hence overstep increased, with increasingeffective pressure, and Fig. 12 shows this effectschematically.
From microstructural studies and water expulsiondata it is clear that in the present set of experiments,even the highest effective hydrostatic pressures applied(113 MPa, to the initially intact specimens, zero
effective pressure to the powdered specimens) werenever sufficient to provoke significant pore collapse.Thus all the dehydration took place at surfacesexposed only to pore water pressure as the total nor-mal stress. It is inferred that this is why absolutereaction rates for intact specimens were almost insen-sitive to effective pressure changes, and that the acti-vation enthalpy at similar water pressure conditionsmay in fact be statistically constant despite differentconfining pressures. Further experimental study athigher effective pressures will be required to evaluatethe effect of pore collapse on reaction kinetics.
Interpretation of the constant (stage II) dehydration kinetics
The extensive period where the rate of water produc-tion is constant implies that in the intact specimens themicrostructural geometry and effective reactant con-centrations within the sample that control dehydrationremain constant with time. In the simplest instance thiswould imply the progression of one or more planarreaction fronts through the sample. Microstructuralobservations showed that most new phases nucleate atgrain boundaries, cracks and along serpentinite vein-lets, so that reaction fronts advance from the nucleiinto the lizardite grains. On a larger than grain scale,there is also evidence that transformation developsmost rapidly around the margins of the cylindricalsample, from where water can drain most easily.At the grain scale, migration of the reaction front
requires the olivine to separate from the lizardite. Inthe growing void space (new porosity), the talc grainsgrow, partially filling the porosity, the remainder ofwhich becomes filled with water, with excess water
Fig. 12. Schematic illustration of the difference between (a) dehydration in pore spaces subject only to pore water pressure or withina grain with pore fluid linked to the exterior by a crack, (b) dehydration with effective water presssure in a stressed solid–solidinterface less than the solid–solid pressure. Effective water pressure within the stressed interface might lie between extremes of porepressure (b1) and solid–solid pressure (b2). For a, b1 and b2 the amount of overstep to a given applied temperature is different, hencekinetics would be expected to be different for a given temperature. In the experiments the shrinkage of olivine and talc away fromthe dehydrating serpentine creates new porosity filled with water at the pore pressure because applied effective pressures are insufficientto collapse the porosity, thus the overstep for case (a) dominates the kinetics.
4 34 S . L L A N A - F U N E Z E T A L .
� 2007 Blackwell Publishing Ltd
volume being expelled. The pore volumometry hasshown that at the effective hydrostatic pressures usedin these experiments, the new pore space does notcollapse. This pore space is also preserved in themicrostructure of the dehydrated specimens. The pro-gress of the reaction therefore requires diffusivetransfer of Mg and silica across the water-filled spaceso that the talc and olivine can grow (Fig. 8d).Although some of these components, when in theaqueous phase, will be lost from the system propor-tionate to the evolved water that is expelled, the con-centration of all components, in the small volume offluid phase around the mineral grains, is expected toremain near-constant as the consumption of the lizar-dite proceeds. If, as seems likely, the overall reaction israte-limited by processes at one or other of the solid–fluid interfaces, it should be expected that the dehy-dration runs at near-constant rate only if the overallgeometry remains constant (Wood & Walther, 1983).
Although some of the dehydration involves theeffective advance of planar interfaces (e.g. along veinsand cracks), shrinkage of three-dimensional lizarditegrains as they are progressively consumed and themigration of reaction inwards from the outer parts ofthe cylindrical sample would be expected progressivelyto decrease the surface area at which reaction takesplace and hence to reduce the overall rate sooner thanis observed. However, slowing of the reaction can beoffset to a degree if new reactive surface area is created,for example by nucleation of new olivine grainsthroughout the dehydration period, and it is inferredthat this is responsible for the observed extensive linearrelease of water (e.g. Fig. 8a,f)
In the more porous aggregates prepared from cru-shed powder there is no initial requirement to establishcontinuous drainage networks, hence no stage I is seen.Olivine nucleates around all grains of lizardite. Thewell-connected, large and increasing volume of porewater can dilute the concentration of aqueous com-ponents and favour rapid consumption of lizardite, thesmaller initial fraction of which should favour earlytransition into decelerating reaction rate (stage III).
Comparison with other studies
Experimental results on lizardite dehydration bearcomparison with dehydration reactions in other min-erals such as gypsum, for which pore volumometry hasalso been used to follow reaction progress. Gypsumdehydration produces only one mineral phase, in con-trast to lizardite producing both forsterite and talc.This may have consequences for reaction kinetics ifinterface processes at the product phase surface arerate-controlling. Gypsum dehydration has been used asan analogue to infer mechanical response to meta-morphism (Ko et al., 1995, 1997; Olgaard et al., 1995;Stretton, 1996). For solid samples, Olgaard et al. (1995)found gypsum dehydration to occur in three stages: aninitial stage where rates increase with time as new
nucleation points become available, an intermediate(inflexion point) stage where fluid expulsion rate ishighest, and a final stage where progressive depletion inmineral reactants reduces dehydration rate with time(Wong et al., 1997). In the present case an initialaccelerating stage is not seen, perhaps due to the lowinitial porosity and permeability that may delay fluidescape. A constant rate of dehydration (our stage II),was not seen in dehydration tests in gypsum (but see Koet al., 1995), with merely an inflection point betweenaccelerating and decelerating reactions (e.g. Ko et al.,1997), as has been regarded as common or character-istic of dehydration reactions (Fyfe et al., 1978; Wood& Walther, 1983; Rubie & Thompson, 1985).
Wegner & Ernst (1983) carried out one of the mostcomprehensive studies of dehydration kinetics underpressure in the MgO-SiO2-H2O system. They studiedboth the forward and reverse reactions in the systemserpentine (mixed lizardite + chrysotile) + brucite toolivine + H2O, using powdered aggregates with waterpressure ¼ total pressure and with degree of reactionestimated from weight change in the condensedassemblage. Similar rates of reaction were observedcompared with the present study for similar amountsof overstep, with degrees of transformation up to 90%.Although a nonlinear rate law was used by them tocharacterize the dehydration reaction, the form of theirdata could be equally well fit by a constant rate law upto 70% transformation (Fig. 11) with an activationenthalpy of 328 ± 12 kJ mol)1.
A more complete study of dehydration kinetics oflaumontite to produce wairakite plus water usingpowdered samples included analysis of nucleation andmeasurements of grain growth of waikarite grains(Jove & Hacker, 1997). This reaction is controlledby the precipitation of wairikite at the interfaces.Although they were able to distinguish a change inreaction mechanism between low and high tempera-tures at 100 MPa, they found an overall activationenergy of 72 kJ mol)1, implying a much lower reactionrate sensitivity to temperature than has been found forserpentinite dehydration.
Geological implications
Extrapolation to lower temperature oversteps
The temperature overstep range in the present experi-ments was varied between 100 and 150 �C (or 170 �C ifminimum activities of water are used). These tempera-tures were apparently sufficiently far from equilibriumand the experimental temperature range sufficientlysmall that an Arrhenius-type of temperature sensitivityapplies. Extrapolation to lower temperature, towardsequilibrium, should eventually become nonlinear asapparent reaction rate must drop to zero at equilibrium(Fyfe et al., 1978; Rubie & Thompson, 1985). There-fore, a linear extrapolation will give an upper bound onreaction rate for small temperature oversteps. Assum-
E X P E R I M E N T A L S E R P E N T I N I T E D E H Y D R A T I O N K I N E T I C S 43 5
� 2007 Blackwell Publishing Ltd
ing behaviour to be independent of effective pressure(no pore collapse), for the present material, it is ex-pected that a minimum of 19 years would be requiredfor the reaction to go to completion for an overstep ofjust 10 �C in an intact rock under no effective pressure.The time scale is very rapid in geological terms. On thebasis of experiments on granulated materials, it hasbeen argued that dehydration reactions in general willbe completed rapidly after only a small overstep (e.g.Walther & Wood, 1984, 1986; Jove & Hacker, 1997).However, when sufficient effective pressure (and/ortime) is applied to cause pore collapse, it is expected thatthe equilibrium will shift to lower temperatures, so thatan extrapolation in rate longer by five orders of mag-nitude would be required. Thus taking the temperaturedependence shown in Fig. 11, the complete dehydrationtime for a 10 �C overstep rises to 0.63 Ma for rocks at100 MPa effective pressure. This effect on kinetics byreduction of water activity has been suggested for thewairakite dehydration reaction (Jove & Hacker, 1997).
Extrapolations to lower temperatures obviouslydepend on the processes of dehydration and themicrostructural development occurring in natureremaining the same as in the experiments (Rubie &Thompson, 1985). In the present experimental seriesthe large overstep leads to formation of a relativelylarge number of nucleation points. With sufficienttime, however, even after a small overstep the reactionmay go to completion from growth of only a smallnumber of nuclei, probably affecting rate-controllingmechanisms substantially.
Serpentinite dehydration in nature
This reaction is of geological importance in: (a) thecontact metamorphism of serpentinized (ophiolitic)peridotite in orogenic belts, typically caused by theintrusion of orogenic granitoids, (b) dehydration ofserpentinized oceanic mantle in a transform faultagainst the end of an adjacent ridge segment, and (c)dehydration of serpentinized oceanic mantle duringsubduction.
An example of (a) above is provided by the aureoleof the Bergell granitoid in the Western Alps, whereserpentinites (antigorite) have undergone dehydrationto large grains of olivine surrounded by talc, probablyunder pressure/temperature conditions comparablewith our experiments (Trommsdorff & Evans, 1972;Mellini et al., 1987). Because the reaction is endo-thermic, at a point in the thermal aureole of an igneousintrusion where the reaction has started but not goneto completion, the temperature remains constant untilsufficient heat has flowed to it to complete the reaction.Because this reaction can go to completion so rapidly(in geological terms) under isothermal conditions, therate of advance of the isograd must be entirely deter-mined by the much slower conductive heat flux, bothto raise the temperature of the aureole rocks and toprovide the heat of reaction. In the Bergell aureole, the
small number of large olivine grains implies low ratesof nucleation, as would be expected just above equi-librium, compared with our experiments in which thereis a high density of nuclei produced because of thelarge temperature overstep. This type of differencebetween the microstructures of naturally and experi-mentally dehydrated serpentinites indicates that cau-tion is required in the extrapolation of experimentalkinetic data to the near-equilibrium regime of naturaldehydration, and the observed extensive linear reactionkinetics may not apply.Serpentinization of the shallow parts of oceanic
transform faults is known to occur, and the displace-ment of serpentinized peridotite against the hot adja-cent ridge segment is likely to promote dehydration.Weins & Stein (1983) and Engeln et al. (1986) found thedepth limit of seismicity on oceanic transform faults tobe anomalously shallow, and Behn et al. (2002) arguedthat transform faults must be anomalously weak zones.Rutter & Brodie (1987) showed on the basis of rockdeformation experiments that dehydration of serpen-tinite might favour mechanical weakening and sup-pression of seismicity beneath the 400 �C isotherm.Heating of the oceanic slab in a subduction zone is
also expected to cause dehydration of serpentinizedperidotite. Evidence of this type of prograde meta-morphic evolution in serpentinites has been reported inophiolites in the Voltri Massif of the Western Alps,where prograde shear zones in mylonitic serpentinitesproduced the breakdown of antigorite into olivine andclinohumite simultaneously with high-pressure meta-morphism in neighbouring gabbroic rocks (Strating &Vissers, 1991; Hermann et al., 2000). In the subductionenvironment, dehydration is likely to begin at suffi-ciently high effective mean pressures (e.g. >200 MPa)that pore collapse can occur as the dehydration pro-ceeds. If the system remains undrained, however, mostof the reaction may be completed at low effectivepressure because pore pressure will rise to becomeequal to overburden pressure early during the progressof the reaction, even though the reaction overallinvolves a volume reduction at high total pressure. Ifthe system becomes drained, on the other hand, forcinggrain boundaries together is likely to influence both thekinetics (slowing the reaction) and equilibrium of thereaction relative to what can be observed in ourexperiments. Although our dehydration kinetics datawere obtained at pressures much lower than encoun-tered in subduction zones and under effective pressurestoo low to cause pore collapse, they are likely to pro-vide an upper bound on subduction reaction rates and,as for the case of contact metamorphism, imply thatoverall kinetics are likely to be limited by the heat flux.
SUMMARY AND CONCLUSIONS
A series of dehydration experiments was carried out onboth intact and crushed + cold-pressed samples ofserpentinite comprising 95 % lizardite, plus minor
4 36 S . L L A N A - F U N E Z E T A L .
� 2007 Blackwell Publishing Ltd
chlorite and Fe-oxides. Temperatures in the range535–610 �C were used, representing oversteps of100–170 �C relative to equilibrium. Pore water pres-sure (�110 MPa) was servo-controlled using a porevolumometer, that also allowed dehydration reactionprogress to be monitored through measurement of theamount of evolved water. Under these conditions thenet volume change of reaction is positive. Effectivehydrostatic confining pressures were varied between 0and 113 MPa (total pressures up to 200 MPa).
Intact specimens displayed a constant reaction rateat any given temperature for most of the dehydration,giving way to a decreasing rate as transformationapproached completion. Absolute rate was not greatlyaffected by increasing effective pressure although itseemed to produce a minor but consistent reduction ofreaction rates. Effective pressures used were neversufficient to induce mechanical pore collapse. Porewater pressure, acting in the dilatant interfacesbetween reactants and products, is the pressure termthat controls reaction kinetics.
Absolute rate in powdered specimens was about 10times greater than for intact specimens at the samewater pressures. An Arrhenius relation links reactionrate to temperature with an average activation energyof 429 ± 201 and 528 ± 34 kJ mol)1 in powderedand intact specimens respectively. Microstructuralstudy of intact specimens showed rapid and wide-spread nucleation beginning at cracks, veins and grainboundaries and progressing into the interior of thelizardite grains.
Extrapolation of the kinetic data towards equilib-rium provides an upper bound on natural rates, andsuggests that serpentinite dehydration reactions willproceed rapidly under geological conditions, so thatthe degree of reaction is likely to be controlled entirelyby the conductive heat flux in the local environment.
ACKNOWLEDGEMENTS
This work was supported by UK NERC grant NER/A/S/2003/00305. Experimental Officer R. Hollowayensured the maintenance of the Nimonic 2 testingmachine. G. Droop is thanked for informal discussionson Alpine serpentinites and their metamorphism, andC. Horsfall for introducing S.L.-F. to THERMO-CALC. Efforts by H. Williams to prepare qualitypolished blocks are also acknowledged. C. Holyoke,editor D. Whitney and an anonymous referee arethanked for helpful and constructive reviews.
REFERENCES
Arkwright, J. C., 2005. An experimental study into themechancial behaviour of serpentinite under dehydration con-ditions. PhD Thesis, University of Manchester, Manchester.
Barnes, H. L. & Ernst, W. G., 1963. Ideality and ionization inhydrothermal fluids – system MgO-H2O-NaOH. AmericanJournal of Science, 261, 129–150.
Behn, M. D., Lin, J. & Zuber, M. T., 2002. Evidence for weakoceanic transform faults. Journal of Geophysical Research, 29,2207–2210.
Bruton, C. J. & Helgeson, H. C., 1983. Calculation of the che-mical and thermodynamic consequences of differencesbetween fluid and geostatic pressure in hydrothermal systems.American Journal of Science, 283A, 540–588.
Caruso, L. J. & Chernosky, J. V., 1979. The stability of lizardite.Canadian Mineralogist, 17, 757–769.
Chernosky, J. V., 1975. Aggregate refractive indices and unit cellparameters of synthetic serpentine in the system MgO-Al2O3-SiO2-H2O. American Mineralogist, 60, 200–208.
Christian, J. W., 1965. The Theory of Transformations in Metalsand Alloys: An Advanced Textbook in Physical Metallurgy.Pergamon Press, Oxford, New York.
Cook, C. A., Holdsworth, R. E. & Styles, M. T., 2002. Theemplacement of peridotites and associated oceanic rocks fromthe Lizard Complex southwest England. Geological Magazine,139, 27–45.
Covey-Crump, S. J., 1992. Application of a State VariableDescription of Inelastic Deformation to Geological Materials.University College London, London.
Engeln, J. F., Wiens, D. A. & Stein, S., 1986. Mechanismsand depths of Atlantic transform earthquakes. Journal ofGeophysical Research-Solid Earth and Planets, 91, 548–577.
Fyfe, W. S. & Godwin, L. H., 1962. Further studies on approachto equilibrium in simple hydrate systems, MgO-H2O andAl2O3-H2O. American Journal of Science, 260, 289–293.
Fyfe, W. S., Price, N. J. & Thompson, A. B., 1978. Fluids in theEarth’s Crust: Their Significance in Metamorphic, Tectonic andChemical Transport Processes. Elsevier Scientific Pub. Co.,New York.
Greenwood, H., 1961. System NaAlSi2O6-H2O-Argon – totalpressure and water pressure in metamorphism. Journal ofGeophysical Research, 66, 3923–3946.
Hermann, J., Muntener, O. & Scambelluri, M., 2000. Theimportance of serpentinite mylonites for subductionand exhumation of oceanic crust.Tectonophysics, 327, 225–238.
Holland, T. J. B. & Powell, R., 1998. An internally consistentthermodynamic data set for phases of petrological interest.Journal of Metamorphic Geology, 16, 309–343.
Jove, C. & Hacker, B. R., 1997. Experimental investigation oflaumontite fi wairakite plus H2O: a model diagenetic reac-tion. American Mineralogist, 82, 781–789.
Kirby, S. H., Durham, W. B. & Stern, L. A., 1991. Mantle phasechanges and deep-earthquake faulting in subducting litho-sphere. Science, 252, 216–225.
Ko, S. C., Olgaard, D. L. & Briegel, U., 1995. The transitionfrom weakening to strengthening in dehydrating gypsum –evolution of excess pore pressures. Geophysical ResearchLetters, 22, 1009–1012.
Ko, S. C., Olgaard, D. L. & Wong, T. F., 1997. Generation andmaintenance of pore pressure excess in a dehydrating system.1. Experimental and microstructural observations. Journal ofGeophysical Research-Solid Earth, 102, 825–839.
Meade, C. & Jeanloz, R., 1991. Deep-focus earthquakesand recycling of water into the Earth’s mantle. Science, 252,68–72.
Mellini, M., Trommsdorff, V. & Compagnoni, R., 1987.Antigorite polysomatism – behavior during progressivemetamorphism. Contributions to Mineralogy and Petrology,97, 147–155.
Miller, S. A., van der Zee, W., Olgaard, D. L. & Connolly, J. A.D., 2003. A fluid-pressure feedback model of dehydrationreactions: experiments, modelling, and application to sub-duction zones. Tectonophysics, 370, 241–251.
Milsch, H. H. & Scholz, C. H., 2005. Dehydration-inducedweakening and fault slip in gypsum: Implications for thefaulting process at intermediate depth in subduction zones.Journal of Geophysical Research-Solid Earth, 110, 1–16.
E X P E R I M E N T A L S E R P E N T I N I T E D E H Y D R A T I O N K I N E T I C S 43 7
� 2007 Blackwell Publishing Ltd
Moody, J. B., 1976. Serpentinization: a review. Lithos, 9, 125–138.
Murrell, S. A. F. & Ismail, I. A. H., 1976. Effect of decom-position of hydrous minerals on mechanical-properties ofrocks at high-pressures and temperatures. Tectonophysics, 31,207–258.
O’Hanley, D. S., Chernosky, J. V. & Wicks, F. J., 1989. Thestability of lizardite and chrysotile. Canadian Mineralogist, 27,483–493.
Olgaard, D. L., Ko, S. C. & Wong, T. F., 1995. Deformationand pore pressure in dehydrating gypsum under transientlydrained conditions. Tectonophysics, 245, 237–248.
Paterson, M. S., 1978. Experimental Rock Deformation: TheBrittle Field. Springer-Verlag, Berlin, New York.
Poirier, J. P., 1982. On transformation plasticity. Journal ofGeophysical Research, 87, 6791–6797.
Raleigh, C. B. & Paterson, M. S., 1965. Experimentaldeformation of serpentinite and its tectonic implications.Journal of Geophysical Research, 70, 3965–3985.
de Ronde, A. A., Stutnitz, H., Tullis, J. & Heilbronner, R., 2005.Reaction-induced weakening of plagioclase-olivine compo-sites. Tectonophysics, 409, 85–106.
Rubie, D. C., 1983. Reaction-enhanced ductility – the role ofsolid-solid univariant reactions in deformation of the crustand mantle. Tectonophysics, 96, 331–352.
Rubie, D. C. & Thompson, A. B., 1985. Kinetics of meta-morphic reactions at elevated temperatures and pressures: anappraisal of available experimental data. In: MetamorphicReaction Kinetics, Textures, and Deformation (eds Thompson,A.B. & Rubie, D.C.), pp. 27–79, Springer, Berlin.
Rutter, E. H. &Brodie, K. H., 1987. On themechanical propertiesof oceanic transform faults. Annales Tectonicae, 1, 87–96.
Rutter, E. H. & Brodie, K. H., 1988. Experimental syntectonicdehydration of serpentinite under conditions of controlledpore water-pressure. Journal of Geophysical Research-SolidEarth and Planets, 93, 4907–4932.
Rutter, E. H. & Brodie, K. H., 1995. Mechanistic interactionsbetween deformation and metamorphism. Geological Journal,30, 227–240.
Sibson, R. H., 2000. Tectonic controls on maximum sustainableoverpressure: fluid redistribution from stress transitions.Journal of Geochemical Exploration, 69, 471–475.
Strating, E. H. H. & Vissers, R. L. M., 1991. Dehydration-in-duced fracturing of eclogite-facies peridotites – implicationsfor the mechanical-behavior of subducting oceanic litho-sphere. Tectonophysics, 200, 187–198.
Stretton, I., 1996. An experimental investigation of the defor-mation properties of gypsum. PhD Thesis, University ofManchester, Manchester.
Tenthorey, E. & Cox, S. F., 2003. Reaction-enhanced perme-ability during serpentinite dehydration. Geology, 31, 921–924.
Trommsdorff, V. & Evans, B. W., 1972. Progressive meta-morphism of antigorite schist in Bergell Tonalite Aureole(Italy). American Journal of Science, 272, 423–437.
Walker, A. N., Rutter, E. H. & Brodie, K. H., 1990. Experi-mental study of grain-size sensitive flow of synthetic, hot-pressed calcite rocks. In: Deformation Mechanisms, Rheologyand Tectonics, Special Publication 54 (eds Knipe, R. J. &Rutter, E.H.), pp. 259–284. Geological Society, London.
Walther, J. V. & Wood, B. J., 1984. Rate and mechanism inprograde metamorphism. Contributions to Mineralogy andPetrology, 88, 246–259.
Walther, J. V. & Wood, B. J., 1986. Mineral-fluid reaction rates.In: Fluid-rock Interactions during Metamorphism (eds Walther,J.V. & Wood, B.J.), pp. 194–212, Springer, Berlin.
Wegner, W. W. & Ernst, W. G., 1983. Experimentallydetermined hydration and dehydration reaction rates in thesystem MgO-SiO2-H2O. American Journal of Science, 283-A,151–180.
Weins, D. A. & Stein, S., 1983. Age dependence of oceanic in-traplate seismicity and implications for lithospheric evolution.Journal of Geophysical Research, 88, 6455–6468.
Wong, T. F., Ko, S. C. & Olgaard, D. L., 1997. Generation andmaintenance of pore pressure excess in a dehydrating system.2. Theoretical analysis. Journal of Geophysical Research-SolidEarth, 102, 841–852.
Wood, B. J. & Walther, J. V., 1983. Rates of hydrothermalreactions. Science, 222, 413–415.
Worden, R. H., Droop, G. T. R. & Champness, P. E., 1991. Thereaction antigorite ¼ olivine + talc + H2O in the BergellAureole, N Italy. Mineralogical Magazine, 55, 367–377.
Received 14 September 2006; revision accepted 17 January 2007.
4 38 S . L L A N A - F U N E Z E T A L .
� 2007 Blackwell Publishing Ltd