excess post-hypoxic oxygen consumption is independent from lactate accumulation in two cyprinid...
TRANSCRIPT
Comparative Biochemistry and Physiology, Part A 165 (2013) 54–60
Contents lists available at SciVerse ScienceDirect
Comparative Biochemistry and Physiology, Part A
j ourna l homepage: www.e lsev ie r .com/ locate /cbpa
Excess post-hypoxic oxygen consumption is independent from lactateaccumulation in two cyprinid fishes
J. Genz a,⁎, M.B. Jyde b, J.C. Svendsen c,d,1, J.F. Steffensen d, H. Ramløv b
a University of Manitoba, Department of Biological Sciences, 369 Duff Roblin, 190 Dysart Road, Winnipeg, Manitoba R3T 2N2, Canadab Roskilde University, Department of Science, Systems and Models, Build. 18.1, P.O. Box 260, DK-4000 Roskilde, Denmarkc Technical University of Denmark, National Institute of Aquatic Resources, Freshwater Fisheries, Vejlsøvej 39, DK-8600 Silkeborg, Denmarkd University of Copenhagen, Marine Biological Laboratory, Biological Institute, Strandpromenaden 5, DK-3000 Helsingør, Denmark
Abbreviations/symbols: ADP, adenosine diphosphate;(MO2max/MO2std); ATP, adenosine triphosphate; EPHOC, esumption (mg O2 kg−1); MO2max, maximal oxygen consumMO2post-anoxia, oxygen consumption rate (mg O2 kg−1 h−
MO2std, standard metabolic rate (mg O2 kg−1 h−1); O2s
phosphocreatine; Scrit, critical oxygen saturation.⁎ Corresponding author. Tel.: +1 204 474 8499; fax:
E-mail address: [email protected] (J. Genz1 Present address: Fisheries and Oceans Canada, Fresh
Crescent, Winnipeg, MB R3T 2N6, Canada.
1095-6433/$ – see front matter © 2013 Elsevier Inc. Allhttp://dx.doi.org/10.1016/j.cbpa.2013.02.002
a b s t r a c t
a r t i c l e i n f oArticle history:Received 15 November 2012Received in revised form 1 February 2013Accepted 3 February 2013Available online 8 February 2013
Keywords:Common carpCrucian carpAnoxiaAnaerobic metabolism
Carassius carassius responds to hypoxic conditions by conversion of lactate into ethanol, which is excretedover the gills. However, a closely related species, Cyprinus carpio, does not possess the ability to produce eth-anol and would be expected to accumulate lactate during hypoxic exposure. While the increase in oxygenconsumption in fish required following strenuous exercise or low environmental oxygen availability hasbeen frequently considered, the primary contributing mechanism remains unknown. This study utilizedthe close relationship but strongly divergent physiology between C. carpio and C. carassius to examine thepossible correlation between excess post-hypoxic oxygen consumption (EPHOC) and lactate accumulation.No difference in the EPHOC:O2 deficit ratio was observed between the two species after 2.5 h anoxia, withratios of 2.0±0.6 (C. carpio) and 1.3±0.3 (C. carassius). As predicted, lactate accumulation dynamics did sig-nificantly differ between the species in both plasma and white muscle following anoxic exposure. Significantlactate accumulation was seen in both plasma and muscle in C. carpio, but there was no accumulation of lac-tate in white muscle tissue of C. carassius. These findings indicate that lactate accumulated as a consequenceof 2.5 h anoxic exposure is not a major determinant of the resulting EPHOC.
© 2013 Elsevier Inc. All rights reserved.
1. Introduction
Three cyprinid teleosts, the crucian carp (Carassius carassius (L)),goldfish (Carassius auratus (L)), and bitterling (Cyprinus amarus(Bloch)), are unique among vertebrates for their ability to convert lac-tate into ethanol as the end product of anaerobic metabolism(Shoubridge and Hochachka, 1980; Johnston and Bernard, 1983;Wissing and Zebe, 1988). The produced ethanol is freely diffusibleover the cell membrane and is excreted from the fish via the gills(Shoubridge and Hochachka, 1980; van den Thillart et al., 1983;Stecyk et al., 2004). This rare adaptation is instrumental in a greatly en-hanced tolerance to hypoxic conditions. Indeed, C. carassius can survivemore than 24 h of anoxia at room temperature, and at least 4.5 months
AMS, aerobic metabolic scopexcess post-hypoxic oxygen con-ption rate (mg O2 kg−1 h−1);1) following anoxic exposure;
at, oxygen saturation (%); PCr,
+1 204 474 7604.).water Institute, 501 University
rights reserved.
at near-zero temperatures (Holopainen and Hyvärinen, 1985; Piironenand Holopainen, 1986; Nilsson and Renshaw, 2004). In contrast, thecommon carp (Cyprinus carpio), a cyprinid species closely related to C.carassius, does not possess the ability to produce ethanol (Nilsson,1988), yet is regarded as a good anaerobe tolerating anoxic exposureof at least 1 h at 20 °C (van Waarde et al., 1990; van Raaij et al.,1996), and surviving less severe hypoxia (0.5 mg O2 L−1) for at least7 days at 22–23 °C (Zhou et al., 2000).
The comparison of the hypoxia tolerance strategies between thesetwo species is based on the distinct differences in metabolic responsesto oxygen limitation each species employs. Standard metabolic rate(MO2std) is the minimum oxygen requirement for the maintenance ofunimpaired physiological reactions in postprandial unstressed animalsat rest. When the oxygen saturation (O2sat (%)) in the water is too lowto support these basal requirements by aerobic metabolism, phospho-creatine (PCr) acts as an “energy buffer”, stabilizing the [ATP] by rapidlyregenerating ATP from ADP. The capacity to maintain the [ATP] by PCrhydrolysis is limited (van Ginneken et al., 1995; Dalla Via et al., 1997)and anaerobic glycolysis is therefore the principal ATP-generating path-way that can function during long periods of anoxia (Bickler and Buck,2007). Due to the lowATP yield fromanaerobic glycolysis, cells compen-sate for the diminished aerobic energy production by a substantialrise in glucose consumption rates resulting in lactate accumulation(Hochachka, 1986). For every mole of glucosyl-units used to support

55J. Genz et al. / Comparative Biochemistry and Physiology, Part A 165 (2013) 54–60
anaerobic glycolysis, 2 mol of lactate is produced; deviations from a 2:1ratio therefore indicate sources additional to glycogen depletion. This isthe response to low oxygen saturation observed in most teleost fishspecies, including C. carpio. In conjunction with this process, C. carassiusconverts lactate into ethanol, which addresses the problem ofacidification by ATP hydrolysis associated with lactate production(Hochachka and Mommsen, 1983) and, combined with one of the larg-est known glycogen stores of any vertebrate (Hyvärinen et al., 1985) al-lows C. carassius to maintain a relatively high glycolytic rate forextended periods (Nilsson, 1990). The conversion of lactate to ethanolin C. carassiushappens exclusively inmuscle tissue and lactate producedin tissues other than themuscle is transported via the blood to themus-cle tissue for fermentation (Johnston and Bernard, 1983; Nilsson, 1988).
Fish can increase their oxygen consumption rate by several foldcompared to MO2std until reaching their maximum capacity (MO2max)wherein all aerobic activities are undertaken. During recovery from an-oxia, oxygen consumption increases aboveMO2std for an extended peri-od of time, but studies that quantify the total metabolic cost of recoveryfrom severe hypoxia are rare (van den Thillart and Verbeek, 1991;Maxime et al., 2000; Svendsen et al., 2012). The accumulated excesspost hypoxic oxygen consumption (EPHOC,mg O2 kg−1) has classicallybeen attributed to the lactate load, but evidence suggests that EPHOC isonly partially related to the lactate load, and that resynthesis of glyco-gen from lactate during recovery is not the major component of the in-creased O2 consumption. Instead, the EPHOC has been attributed tore-synthesis of ATP and PCr in addition to glycogen, and also the buffer-ing of protons generated from ATP utilization (van den Thillart andVerbeek, 1991; Virani and Rees, 2000; Mandic et al., 2008). However,the relative contributions of these processes to EPHOC in fish, and inparticular the role of lactate, remain an area of ongoing investigation.
The present study examines the hypothesis that EPHOC associatedwith acute exposure to anoxia (≤1% O2sat) is positively correlated to lac-tate accumulation. Utilizing the close phylogenetic relationship, yet dis-tinct difference in hypoxia tolerance physiology between C. carpio andC. carassius this study investigates the link between lactate load andEPHOC. Because lactate is converted to ethanol in C. carassius, but notin C. carpio, it was hypothesized that 1) acute exposure to anoxiawould cause substantial lactate accumulation in C. carpio, while itwould be limited in C. carassius; and 2) the lactate accumulation wouldresult in greater EPHOC relative to the produced O2 deficit in C. carpio,compared to C. carassius. In this study, we therefore quantified 1) con-centration of lactate in muscle and plasma during exposure to anoxiain juvenile C. carassius and C. carpio, and 2) EPHOC (mg O2 kg−1) afterexposure to 2.5 h anoxia.
2. Materials and methods
2.1. Experimental animals
A total of 34 juvenile C. carpio and 33 C. carassius (110–130 mm)were collected from a pond near Slagelse, Denmark (55°17′58 N11°27′47 E) in April 2009. At capture water temperature was12.5–14.0 °C. Fish were transferred to the University of Copenhagen,Marine Biological Laboratory, Helsingør, Denmark and kept indoors ina 400 L tank supplied with a continuous flow of unchlorinated tapwater. Water was filtered using a mechanical filter pump (1100 L h−1)connected to the tank, and water temperature was kept at 15±0.1 °Cand continually aerated to maintain normoxic conditions. The fishwere kept in a 12L:12D light regime and were fed to satiation 2–4times per week with commercial fish pellets (Ecolife 3 mm, Biomar,Denmark). Prior to experimentation, fish were acclimated to theseconditions for 4 months. No fish was used more than once. Allmethods applied in the present study were in agreement withcurrent Danish regulations for the treatment and welfare of experi-mental animals.
2.2. Respirometry
2.2.1. Equipment setupThe setup consisted of a static respirometer and amixing pump sub-
merged in a 50 L opaque tank on a wet table, filled with unchlorinatedtap water maintained at 15±0.1 °C. The respirometer was made oftransparent Perspex tubing and was fitted with two outlet and twoinlet ports. The mouth of the outlet tube, through which water left therespirometer,was elevated slightly above thewater surface level to pre-vent the ambient water from entering the respirometer. Inside the res-pirometer, a plate positioned 5 mm from the ports propagated watermixing and prevented the fish from disturbing the inflow and outflow.A perforated tubewas inserted into the respirometer tominimize spon-taneous activity associated with exposure to decreased O2sat levels, abehavior that has been previously observed in C. carpio (Vianen et al.,2001). The tank was positioned behind a black curtain to minimizestressful stimuli.
Measurements of O2 consumption rate (MO2;mg O2 kg−1 h−1)werecarried out every 7 min 50 s using computerized intermittent-flow respi-rometry allowing long term (>48 h) repeated measurements as previ-ously described (Steffensen et al., 1984; Steffensen, 1989). The repeatedrespirometric loops consisted of a 3 min 20 s flushing phase duringwhich a pump flushed the respirometer with ambient water throughone set of ports. The second set of ports and a pump allowed the waterin the respirometer to be re-circulated in a closed circuit phase for4 min 30 s, divided into awaiting period (2 min) and ameasurement pe-riod (2 min 30 s).
Oxygen partial pressure was measured at 1 s−1 by a fiber opticsensor (Fibox 3 connected to a dipping probe; PreSens, Regensburg,Germany) located in the recirculated loop. The flush pump was con-trolled by AutoResp software (Loligo Systems Aps, Tjele, Denmark)that also calculated the oxygen consumption rate in the measuringphase using the oxygen partial pressure and standard equations(Schurmann and Steffensen, 1997). Preliminary testing demonstratedthat the duration of the measurement period (2 min 30 s) in combi-nation with the mass of the experimental fish (19.5±0.7 g) and thevolume of the respirometer and re-circulated loop (0.335 L) ensuredthat the coefficient of determination (r2) associated with the MO2
measurements was always >0.90 as in previous studies (Behrensand Steffensen, 2007; Campbell et al., 2008). Moreover, in normoxiathe respiration of the fish never reduced the O2sat to less than 84%(approx. 17.5 kPa).
Water for the flush pump was supplied from one of two differenttanks containing either normoxic or hypoxic water maintained at15±0.1 °C. Adequate water quality in the system was maintainedby an internal filter pump and an ultraviolet light sterilizer runningcontinually. Prior to initiation of an experiment the adjustable tankwas reduced to ≤2.5% O2sat (approx. 0.5 kPa) by circulating waterfrom the tank through a vertical cylinder (0.25 m in diameter, 1 mhigh) where the water was exposed to a stream of nitrogen bubbles(Behrens and Steffensen, 2007). To minimize diffusion of O2 fromthe ambient air, water surfaces were covered by floating bubblewrap.The O2sat in the adjustable tank was measured using a Mini DO probe(Loligo Systems Aps., Tjele, Denmark) connected to a relay that con-trolled the O2sat in the tank via a solenoid valve regulating nitrogengas delivery to the cylinder similar to the procedure described by(Jordan and Steffensen, 2007). The O2sat in the normoxic tank wasmaintained at a constant high normoxic level (≥95% O2sat, approx.19.8 kPa) using air stones. The desired O2sat in the hypoxic tank wasadjusted and stabilized before the flush pump started supplyingwater from this tank. In this way, the experiment was not influencedby any delays caused by the time required to reduce the O2sat in thehypoxic tank. The shift from normoxic to hypoxic water was madeby manually closing the valve regulating outflow from the normoxictank and opening the valve from the adjustable tank, which hadbeen previously brought to ≤2.5% O2sat as described above. Both
140
160
)
56 J. Genz et al. / Comparative Biochemistry and Physiology, Part A 165 (2013) 54–60
valves were situated outside the tank to eliminate disturbance of thefish, and preliminary tests confirmed that the procedure did not influ-ence the metabolic rate of the fish. During the flush phase, the flushpump exchanged greater than 8 times the volume of water in the res-pirometer, which is sufficient to replace >99% of the water(Steffensen, 1989). Using this arrangement, the O2sat inside the respi-rometer reached the designated O2sat level in b3.5 min and was im-mediately followed by MO2 measurements.
2.2.2. Experimental protocol of MO2 measurementsEPHOC following anoxia was determined in two size-matched
groups of 9 C. carpio (19.5±1.1 g) and 8 C. carassius (19.5±0.7 g).Fish were fasted for 24 h prior to experimentation. IndividualMO2max was tested in normoxia by transfer of the fish from the hold-ing tank to a bucket and chasing to exhaustion, according to Richardset al. (2002). This protocol has been used to induce MO2max in severalteleost species as an alternative to swimming the fish in the respi-rometer (Peake and Farrell, 2006; Jordan and Steffensen, 2007;Killen et al., 2007). Upon exhaustion, identified by no further re-sponse to manual stimulation (after 5–6 min), fish were transferredto the respirometer where MO2 measurements were started immedi-ately. After the MO2 max measurements, fish were acclimated to therespirometer for 24–48 h.
Preliminary testing confirmed previous work that indicated themaximum survival time for C. carpio exposed to anoxia at 15 °C wasapprox. 2.5 h (Stecyk and Farrell, 2002), and 2.5 h was consequentlyused as the duration of anoxic exposure. Tests with the two differentspecies were carried out in random order. It was not possible to reducetheO2sat in the hypoxic tank to less than 2.5% (0.5 kPa). Therefore, to in-duce anoxia in the respirometer, theflush pumpwas turned off after thefirst flush period of the experiment. Shutting off the water exchangecaused the fish to induce anoxia (≤1% O2sat, approx. 0.2 kPa) in the res-pirometer in ≤15 min. After the anoxic exposure the flush pump wasengaged and the respirometer flushed with normoxic water. Due tothe lag time of the fiber optic sensor adjusting from ≤0.1 to >95%O2sat, the flush period of the first respirometric loop was extended by3 min and the measurement discarded. Collection of MO2 data every7 min and 50 s continued for >12 h after the exposure to anoxia.
2.2.3. Acquisition and analysis of respirometry dataBecause of the rapid turnover of water, both the exact rate of change
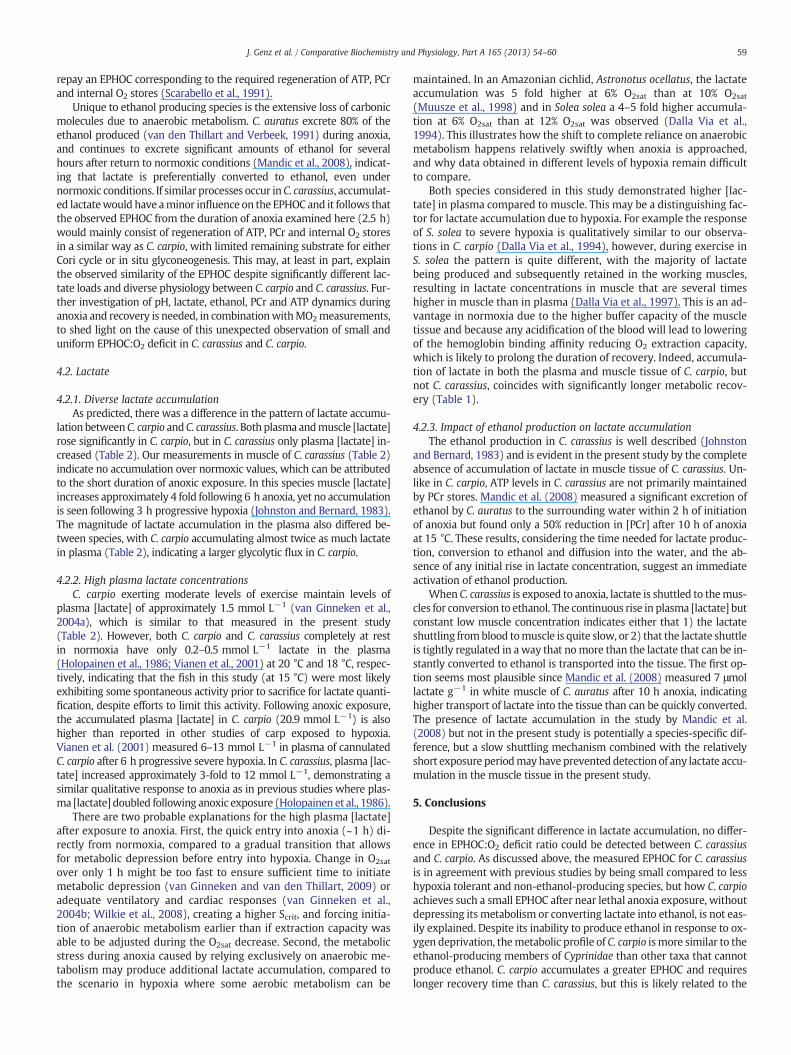
of the O2sat and the response time of the O2 consumption rate of the fishwere unknown during the flush periods; because of these uncertaintiesthe flush periods used to modify the O2sat inside the respirometer werenot included in the calculations.MO2std was defined as themean of thelast seven measurements (54 min 50 s) (Fig. 1) before onset of hyp-oxia, similar to previously employed procedures (Scarabello et al.,1991; Svendsen et al., 2010). The EPHOC protocol involved rapid
Time (h)
MO
2 (m
gO
2 kg
-1 h
-1)
0
50
100
150
200
250
300
350
0 2 4 6 8 10 12 14 16 18
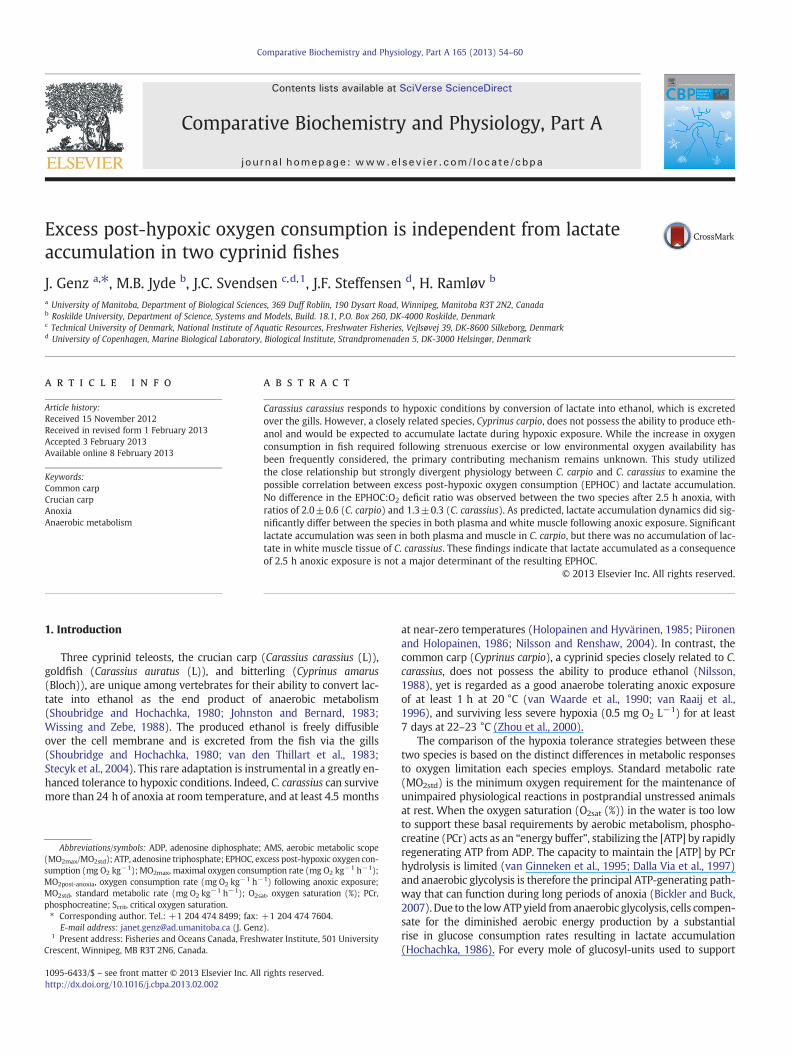
Fig. 1. Representative trace of the time course of MO2 measurements (mg O2 kg−1 h−1)during acclimation in a static respirometer. Data were collected using a 23.7 g commoncarp (Cyprinus carpio) at 15 °C. Each datum represents a 7 min 50 s period. MO2 iscorrected for background respiration.
changes of the O2sat inside the respirometer during single flush pe-riods (from normoxia to anoxia and vice versa). The oxygen deficit(mg O2 kg−1) accumulated during the anoxic period was quantifiedas the MO2std during the 2.5 h. Individual recovery periods wereregarded as completed when the first MO2 datum in the post anoxiarecovery period (MO2post-anoxia) was within a 95% confidence inter-val (CI) of the MO2std (Fig. 2) as previously described (Bushnellet al., 1994; Svendsen et al., 2010). The metabolic cost of recovery(mg O2 kg−1) was determined by subtracting the MO2std fromMO2post-anoxia, following Jordan and Steffensen (2007). Aerobic metabolicscope was calculated as the difference between MO2max and MO2std,following Farrell and Richards (2009).
2.3. Measurements of plasma and muscle lactate
2.3.1. Equipment setupTwogroups of 25 sizematchedC. carpio and C. carassius (20.9±0.5 g)
were used for the time series measurements of lactate development inplasma andwhitemuscle. A 180 L aquariumwas fittedwith black plasticon all sides to prevent visual disturbance, filled with unchlorinated tapwater, and fittedwith an internal filter pump to ensure adequatemixing.The temperature was kept at 15±0.1 °C and the water was maintainednormoxic by continuous aeration by air stones. The O2sat was monitoredusing a Mini DO probe (Oxyguard International, Birkerød, Denmark)connected to a relay controlling the O2sat in the tank via a solenoidvalve that regulated nitrogen gas delivery to multiple air stones on thebottom of the aquarium. All holes around tubes and cables into theaquariumwere coveredwith plastic film. The sealed container facilitatedprecise regulation of O2sat from≥95% to 1%. To allow individual samplingwith a minimum of disturbance of the remaining fish in the aquarium,each fish was inserted in a small cage made from plastic mesh tube(40 mm diameter). A nylon string was fitted to each cage and a smallweight kept the cage on the bottom and made it impossible for the fishto move the cage.
2.3.2. Experimental protocol of lactate samplingFish were fasted for 24 h before being transferred from the hold-
ing tank to the aquarium and inserted in the cages. Acclimation tothe aquarium under normoxia lasted for 36 h, and fish were not fedduring this time. Five fish of each species were sampled immediatelybefore the onset of hypoxia as a normoxic baseline. Within 1 h anoxiawas reached (1±0.2% O2sat, approx. 0.2 kPa) by nitrogen bubbling.Subsequently, a fish was sampled every 4 min. Alternating between
Recovery (h)
0 1 2 30
20
40
60
80
100
120
MO
2 (m
gO
2 kg
-1 h
-1
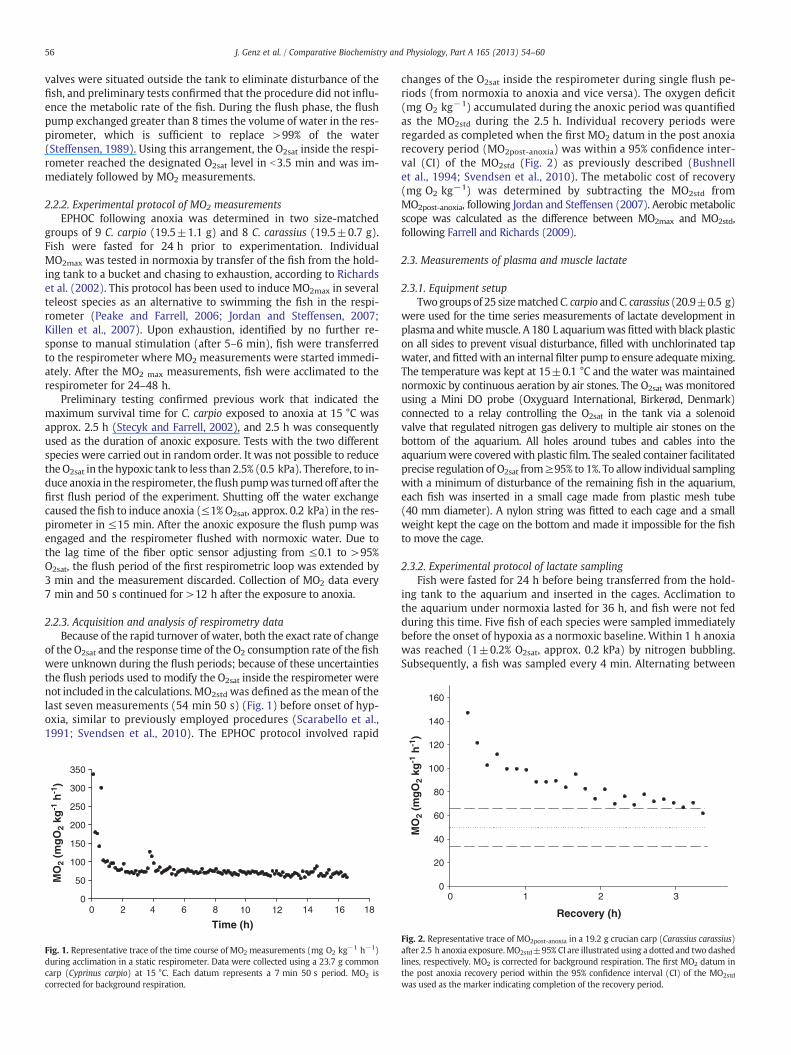
Fig. 2. Representative trace of MO2post-anoxia in a 19.2 g crucian carp (Carassius carassius)after 2.5 h anoxia exposure.MO2std±95% CI are illustrated using a dotted and two dashedlines, respectively. MO2 is corrected for background respiration. The first MO2 datum inthe post anoxia recovery period within the 95% confidence interval (CI) of the MO2std
was used as the marker indicating completion of the recovery period.
Table 1Observations of metabolic parameters in normoxia and during recovery from 2.5 h acuteanoxic exposure in crucian carp (Carassius carassius, n=8, 19.5±0.6 g) and commoncarp (Cyprinus carpio, n=9, 19.5±1.1 g) at 15 °C. Asterisks indicate significant differencesbetween species using two tailed Student's t-test, * Pb0.05; *** Pb0.0001; NS, notsignificant.
C. carassius C. carpio P
MO2standard (mg O2 kg−1 h−1) 43.7±5.3 66.5±6.2 *MO2max (mg O2 kg−1 h−1) 213.7±7.3 329.5±10.3 ***AMS (MO2max/MO2std) 5.2±0.4 5.4±0.6 NSO2 deficit (mg O2 kg−1) 108.5±13.1 164.9±15.5 *EPHOC (mg O2 kg−1) 124.4±18.9 281.1±53.5 *EPHOC:O2 deficit 1.3±0.3 2.0±0.6 NSTime to recovery (h) 3.8±0.7 7.0±1.4 *% of MO2max 65.4±8.3 61.6±7.6 NS
Table 2Lactate development during 2.7 h acute anoxic exposure at 15 °C in crucian carp(Carassius carassius) and common carp (Cyprinus carpio) (20.8±0.5 g combined meanbody mass). Concentrations at 2.5 h anoxia were calculated from the linear regression(see Fig. 3). Asterisks (*) indicate statistical differences between species (Pb0.01).
Lactate parameters Plasma (mmol L−1) Muscle (μmol g−1)
C. carassius C. carpio P C. carassius C. carpio P
Normoxia 3.8±0.5 3.3±0.4 NS 2.1±0.1 1.7±0.3 NS2.5 h anoxia 12.0 20.9 – 2.6 9.0 –
Increase (fold) 3.16 6.33 – 1.23 5.28 –
Slope (h−1) 1.45±0.45 3.92±0.82 * 0.05±0.18 1.20±0.41 *
57J. Genz et al. / Comparative Biochemistry and Physiology, Part A 165 (2013) 54–60
each species, a total of 20 C. carpio and 20 C. carassius were sampled,giving a total anoxic exposure period of 2 h 40 min.
At sampling, the lid was lifted slightly and a cage retracted fromthe tank by the nylon string. The cage was immediately transferredto a 2.5% benzocaine solution (Sigma-Aldrich Chemicals, USA) madefrom a 4% ethanol stock solution. At complete anesthesia (≤1 min),the fish were removed from the cages, patted dry and weighed tothe nearest 0.1 g. Blood samples were collected by severing the tailfrom the body and collecting the blood flowing from the caudal veinwith a heparinized 1 mL syringe (LEO Pharma A/S, Ballerup, Den-mark). The blood sample was transferred to a 0.5 mL centrifugetube and centrifuged at 2000 g for 30 s to isolate the plasma. A tissuesample was taken as a cross section of the trunk musculature posteri-or to the dorsal fin and wrapped in aluminum foil. Both the tissue andplasma samples were flash frozen in liquid N2 and stored at −80 °Cuntil analysis.
2.3.3. Determination of lactate concentrationExtraction of lactate from the tissue samples was carried out fol-
lowing procedures previously described (Viant et al., 2003; Lin etal., 2007). The frozen muscle samples were ground to a fine powderin a N2-cooled mortar. The frozen, powdered tissue (100 mg) wasweighed in a N2-cooled 1.5 mL centrifuge tube and extracted using5 mL g−1 (wet mass) ice cold 6% perchloric acid. Samples werekept on ice throughout the extraction procedure. Samples werevortexed for 15 s three times, centrifuged (10,000 g, 10 min, 4 °C),and the supernatant was removed and neutralized to pH 7.5 with2 M K2CO3, testing pH using small drops of sample on pH paper (pHpaper range: 5.5–9.0). Samples were kept on ice for an additional30 min to facilitate complete precipitation. Following centrifugation(10,000 g, 10 min, 4 °C), the supernatant was removed and storedat −80 °C. Muscle extracts and plasma were analyzed for lactateusing a commercial kit (Biomedical Research Service, NY, USA). Themeasurements were corrected using internal lactate standards insamples from fish of both species sampled in normoxic conditions.
2.4. Statistical analysis
All values are reported as mean±standard error of the mean(SEM). Means were compared using Student's t-test (two-tailed)after testing the assumptions of normal distribution of data and ho-mogeneity of variance. Means of data found not to be normally dis-tributed were compared using the Mann–Whitney test. Least squarelinear regression analysis was performed using SigmaPlot 10.0 (SystatSoftware Inc. San Jose, CA, USA), and regression line slopes were com-pared using analysis of covariance. Statistical analyses were carriedout using SPSS 15.0 (IBM SPSS, Armonk, NY, USA). Means were con-sidered significantly different when Pb0.05.
3. Results
3.1. Oxygen consumption rates
MO2std differed significantly between C. carassius and C. carpio(Table 1, Pb0.02). Similarly, MO2max in C. carassius was significantlylower than the MO2max measured in C. carpio (Pb0.0001). Despitethe overall greater oxygen consumption seen in C. carpio, aerobicmetabolic scope (AMS, MO2max/MO2std) did not differ betweenthese two species (P>0.8). As a consequence of the different MO2std
the accumulated O2 deficit during the anoxic period was greater inC. carpio than C. carassius (Pb0.02), and there was also a significantdifference in EPHOC (Pb0.02). Although both EPHOC and O2 deficitwere lower in C. carassius than C. carpio, the ratio of EPHOC:O2 deficitdid not differ between species (P>0.48). The average time to com-plete metabolic recovery was longer for C. carpio (7.0±1.4 h) thanfor C. carassius (3.8±0.7 h) (Pb0.034). As was the case with the
AMS, the utilized metabolic scope was similar for the two species,and during the recovery phase neither of the species utilized theirfull metabolic scope, with the highest measurements of MO2
representing 65.4±8.3% of MO2max in C. carassius and 61.6±7.6% inC. carpio (P>0.7).
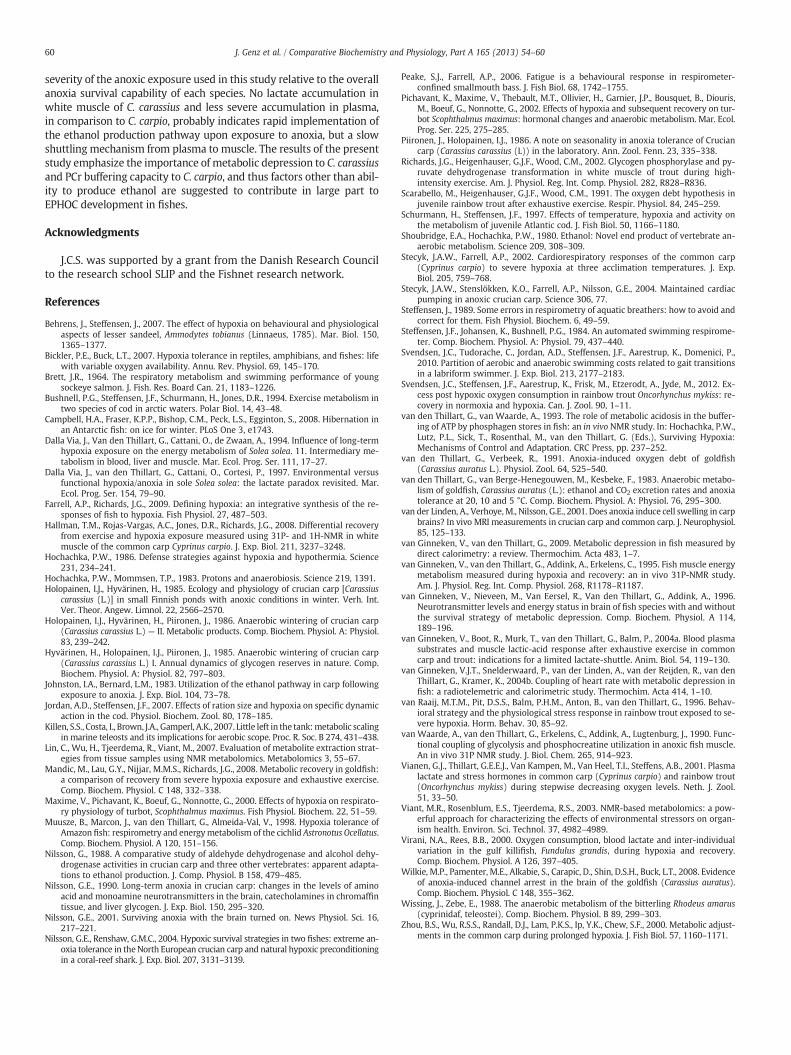
3.2. Lactate accumulation
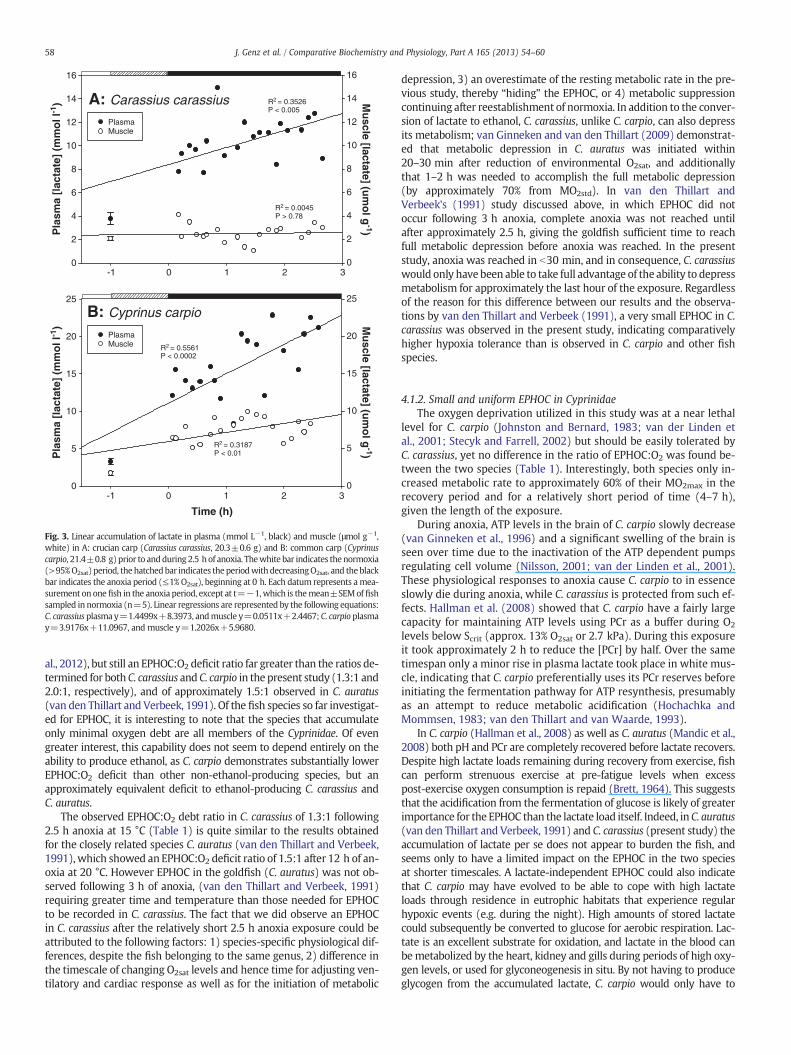
Parameters describing the production and accumulation of lactateduring anoxic exposure are summarized in Table 2. Concentrations of lac-tate prior to anoxic exposure did not differ between species in plasma(3.8±0.5 in C. carassius vs. 3.3±0.4 mM in C. carpio, P>0.48) normuscle(2.1±0.1 vs. 1.7±0.3 μmol g−1; P>0.26). While the lactate concentra-tion in the plasma rose significantly in both species, in the muscle tissuethe concentration of lactate increased only in C. carpio (Fig. 3). In conse-quence the accumulation of lactate in C. carassiuswas significantly higherin plasma than in muscle (Pb0.0001), with plasma [lactate] increasing 3fold to 12 mmol L−1 (Table 2, Fig. 3A).C. carpioplasma [lactate] increased6 fold to 21 mmol L−1, and the lactate accumulation in plasma wassignificantly higher than in muscle (Pb0.0001; Table 2), with muscle[lactate] increasing 5 fold to a final concentration of 8.97 μmol g−1
(Table 2, Fig. 3B). The lactate accumulation was faster in C. carpio thanin C. carassius in both plasma (mmol L−1 h−1, Pb0.01) and muscle(μmol g−1 h−1, Pb0.01).
4. Discussion
4.1. Respirometry
4.1.1. Extent of EPHOC in various speciesTo our knowledge, EPHOC following exposure to oxygen levels below
Scrit has been quantified for only three other fish species: C. auratus (vanden Thillart and Verbeek, 1991) Scophthalmus maximus (Maxime et al.,2000), and Oncorhynchus mykiss (Svendsen et al., 2012). Several speciesof flatfish are moderately hypoxia tolerant (Dalla Via et al., 1994;Pichavant et al., 2002), and in hypoxia trials on S. maximus, a benthic flat-fish found in temperate seas, the EPHOC:O2 deficit ratio was 16:1(Maxime et al., 2000), which is only half of the ratio of up to 35:1 ob-served in the hypoxia intolerant rainbow trout (O. mykiss) (Svendsen et
B: Cyprinus carpio
Time (h)
0
5
10
15
20
25
0
5
10
15
20
25
PlasmaMuscle
PlasmaMuscle
A: Carassius carassius
0
2
4
6
8
10
12
14
16
-1 0 1 2 3
-1 0 1 2 3
Pla
sma
[lac
tate
] (m
mo
l l-1
)P
lasm
a [l
acta
te]
(mm
ol l
-1)
0
2
4
6
8
10
12
14
16
R2 = 0.5561
R2 = 0.0045
R2 = 0.3526
R2 = 0.3187
P < 0.0002
P < 0.01
P > 0.78
P < 0.005
Mu
scle [lactate] (um
ol g
-1)M
uscle [lactate] (u
mo
l g-1)
Fig. 3. Linear accumulation of lactate in plasma (mmol L−1, black) and muscle (μmol g−1,white) in A: crucian carp (Carassius carassius, 20.3±0.6 g) and B: common carp (Cyprinuscarpio, 21.4±0.8 g)prior to andduring 2.5 hof anoxia. Thewhite bar indicates thenormoxia(>95%O2sat) period, thehatchedbar indicates theperiodwithdecreasingO2sat, and the blackbar indicates the anoxia period (≤1% O2sat), beginning at 0 h. Each datum represents amea-surement on onefish in the anoxia period, except at t=−1,which is themean±SEMof fishsampled in normoxia (n=5). Linear regressions are represented by the following equations:C. carassius plasma y=1.4499x+8.3973, andmuscle y=0.0511x+2.4467; C. carpio plasmay=3.9176x+11.0967, and muscle y=1.2026x+5.9680.
58 J. Genz et al. / Comparative Biochemistry and Physiology, Part A 165 (2013) 54–60
al., 2012), but still an EPHOC:O2 deficit ratio far greater than the ratios de-termined for bothC. carassius and C. carpio in the present study (1.3:1 and2.0:1, respectively), and of approximately 1.5:1 observed in C. auratus(van den Thillart and Verbeek, 1991). Of the fish species so far investigat-ed for EPHOC, it is interesting to note that the species that accumulateonly minimal oxygen debt are all members of the Cyprinidae. Of evengreater interest, this capability does not seem to depend entirely on theability to produce ethanol, as C. carpio demonstrates substantially lowerEPHOC:O2 deficit than other non-ethanol-producing species, but anapproximately equivalent deficit to ethanol-producing C. carassius andC. auratus.
The observed EPHOC:O2 debt ratio in C. carassius of 1.3:1 following2.5 h anoxia at 15 °C (Table 1) is quite similar to the results obtainedfor the closely related species C. auratus (van den Thillart and Verbeek,1991), which showed an EPHOC:O2 deficit ratio of 1.5:1 after 12 h of an-oxia at 20 °C. However EPHOC in the goldfish (C. auratus) was not ob-served following 3 h of anoxia, (van den Thillart and Verbeek, 1991)requiring greater time and temperature than those needed for EPHOCto be recorded in C. carassius. The fact that we did observe an EPHOCin C. carassius after the relatively short 2.5 h anoxia exposure could beattributed to the following factors: 1) species-specific physiological dif-ferences, despite the fish belonging to the same genus, 2) difference inthe timescale of changing O2sat levels and hence time for adjusting ven-tilatory and cardiac response as well as for the initiation of metabolic
depression, 3) an overestimate of the resting metabolic rate in the pre-vious study, thereby “hiding” the EPHOC, or 4) metabolic suppressioncontinuing after reestablishment of normoxia. In addition to the conver-sion of lactate to ethanol, C. carassius, unlike C. carpio, can also depressits metabolism; van Ginneken and van den Thillart (2009) demonstrat-ed that metabolic depression in C. auratus was initiated within20–30 min after reduction of environmental O2sat, and additionallythat 1–2 h was needed to accomplish the full metabolic depression(by approximately 70% from MO2std). In van den Thillart andVerbeek's (1991) study discussed above, in which EPHOC did notoccur following 3 h anoxia, complete anoxia was not reached untilafter approximately 2.5 h, giving the goldfish sufficient time to reachfull metabolic depression before anoxia was reached. In the presentstudy, anoxia was reached in b30 min, and in consequence, C. carassiuswould only have been able to take full advantage of the ability to depressmetabolism for approximately the last hour of the exposure. Regardlessof the reason for this difference between our results and the observa-tions by van den Thillart and Verbeek (1991), a very small EPHOC in C.carassius was observed in the present study, indicating comparativelyhigher hypoxia tolerance than is observed in C. carpio and other fishspecies.
4.1.2. Small and uniform EPHOC in CyprinidaeThe oxygen deprivation utilized in this study was at a near lethal
level for C. carpio (Johnston and Bernard, 1983; van der Linden etal., 2001; Stecyk and Farrell, 2002) but should be easily tolerated byC. carassius, yet no difference in the ratio of EPHOC:O2 was found be-tween the two species (Table 1). Interestingly, both species only in-creased metabolic rate to approximately 60% of their MO2max in therecovery period and for a relatively short period of time (4–7 h),given the length of the exposure.
During anoxia, ATP levels in the brain of C. carpio slowly decrease(van Ginneken et al., 1996) and a significant swelling of the brain isseen over time due to the inactivation of the ATP dependent pumpsregulating cell volume (Nilsson, 2001; van der Linden et al., 2001).These physiological responses to anoxia cause C. carpio to in essenceslowly die during anoxia, while C. carassius is protected from such ef-fects. Hallman et al. (2008) showed that C. carpio have a fairly largecapacity for maintaining ATP levels using PCr as a buffer during O2
levels below Scrit (approx. 13% O2sat or 2.7 kPa). During this exposureit took approximately 2 h to reduce the [PCr] by half. Over the sametimespan only a minor rise in plasma lactate took place in white mus-cle, indicating that C. carpio preferentially uses its PCr reserves beforeinitiating the fermentation pathway for ATP resynthesis, presumablyas an attempt to reduce metabolic acidification (Hochachka andMommsen, 1983; van den Thillart and van Waarde, 1993).
In C. carpio (Hallman et al., 2008) as well as C. auratus (Mandic et al.,2008) both pH and PCr are completely recovered before lactate recovers.Despite high lactate loads remaining during recovery from exercise, fishcan perform strenuous exercise at pre-fatigue levels when excesspost-exercise oxygen consumption is repaid (Brett, 1964). This suggeststhat the acidification from the fermentation of glucose is likely of greaterimportance for the EPHOC than the lactate load itself. Indeed, inC. auratus(van den Thillart and Verbeek, 1991) and C. carassius (present study) theaccumulation of lactate per se does not appear to burden the fish, andseems only to have a limited impact on the EPHOC in the two speciesat shorter timescales. A lactate-independent EPHOC could also indicatethat C. carpio may have evolved to be able to cope with high lactateloads through residence in eutrophic habitats that experience regularhypoxic events (e.g. during the night). High amounts of stored lactatecould subsequently be converted to glucose for aerobic respiration. Lac-tate is an excellent substrate for oxidation, and lactate in the blood canbemetabolized by the heart, kidney and gills during periods of high oxy-gen levels, or used for glyconeogenesis in situ. By not having to produceglycogen from the accumulated lactate, C. carpio would only have to
59J. Genz et al. / Comparative Biochemistry and Physiology, Part A 165 (2013) 54–60
repay an EPHOC corresponding to the required regeneration of ATP, PCrand internal O2 stores (Scarabello et al., 1991).
Unique to ethanol producing species is the extensive loss of carbonicmolecules due to anaerobic metabolism. C. auratus excrete 80% of theethanol produced (van den Thillart and Verbeek, 1991) during anoxia,and continues to excrete significant amounts of ethanol for severalhours after return to normoxic conditions (Mandic et al., 2008), indicat-ing that lactate is preferentially converted to ethanol, even undernormoxic conditions. If similar processes occur inC. carassius, accumulat-ed lactatewould have aminor influence on the EPHOC and it follows thatthe observed EPHOC from the duration of anoxia examined here (2.5 h)would mainly consist of regeneration of ATP, PCr and internal O2 storesin a similar way as C. carpio, with limited remaining substrate for eitherCori cycle or in situ glyconeogenesis. This may, at least in part, explainthe observed similarity of the EPHOC despite significantly different lac-tate loads and diverse physiology between C. carpio and C. carassius. Fur-ther investigation of pH, lactate, ethanol, PCr and ATP dynamics duringanoxia and recovery is needed, in combinationwithMO2measurements,to shed light on the cause of this unexpected observation of small anduniform EPHOC:O2 deficit in C. carassius and C. carpio.
4.2. Lactate
4.2.1. Diverse lactate accumulationAs predicted, there was a difference in the pattern of lactate accumu-
lation betweenC. carpio andC. carassius. Bothplasmaandmuscle [lactate]rose significantly in C. carpio, but in C. carassius only plasma [lactate] in-creased (Table 2). Our measurements in muscle of C. carassius (Table 2)indicate no accumulation over normoxic values, which can be attributedto the short duration of anoxic exposure. In this species muscle [lactate]increases approximately 4 fold following 6 h anoxia, yet no accumulationis seen following 3 h progressive hypoxia (Johnston and Bernard, 1983).The magnitude of lactate accumulation in the plasma also differed be-tween species, with C. carpio accumulating almost twice as much lactatein plasma (Table 2), indicating a larger glycolytic flux in C. carpio.
4.2.2. High plasma lactate concentrationsC. carpio exerting moderate levels of exercise maintain levels of
plasma [lactate] of approximately 1.5 mmol L−1 (van Ginneken et al.,2004a), which is similar to that measured in the present study(Table 2). However, both C. carpio and C. carassius completely at restin normoxia have only 0.2–0.5 mmol L−1 lactate in the plasma(Holopainen et al., 1986; Vianen et al., 2001) at 20 °C and 18 °C, respec-tively, indicating that the fish in this study (at 15 °C) were most likelyexhibiting some spontaneous activity prior to sacrifice for lactate quanti-fication, despite efforts to limit this activity. Following anoxic exposure,the accumulated plasma [lactate] in C. carpio (20.9 mmol L−1) is alsohigher than reported in other studies of carp exposed to hypoxia.Vianen et al. (2001) measured 6–13 mmol L−1 in plasma of cannulatedC. carpio after 6 h progressive severe hypoxia. In C. carassius, plasma [lac-tate] increased approximately 3-fold to 12 mmol L−1, demonstrating asimilar qualitative response to anoxia as in previous studies where plas-ma [lactate] doubled following anoxic exposure (Holopainen et al., 1986).
There are two probable explanations for the high plasma [lactate]after exposure to anoxia. First, the quick entry into anoxia (~1 h) di-rectly from normoxia, compared to a gradual transition that allowsfor metabolic depression before entry into hypoxia. Change in O2sat
over only 1 h might be too fast to ensure sufficient time to initiatemetabolic depression (van Ginneken and van den Thillart, 2009) oradequate ventilatory and cardiac responses (van Ginneken et al.,2004b; Wilkie et al., 2008), creating a higher Scrit, and forcing initia-tion of anaerobic metabolism earlier than if extraction capacity wasable to be adjusted during the O2sat decrease. Second, the metabolicstress during anoxia caused by relying exclusively on anaerobic me-tabolism may produce additional lactate accumulation, compared tothe scenario in hypoxia where some aerobic metabolism can be
maintained. In an Amazonian cichlid, Astronotus ocellatus, the lactateaccumulation was 5 fold higher at 6% O2sat than at 10% O2sat
(Muusze et al., 1998) and in Solea solea a 4–5 fold higher accumula-tion at 6% O2sat than at 12% O2sat was observed (Dalla Via et al.,1994). This illustrates how the shift to complete reliance on anaerobicmetabolism happens relatively swiftly when anoxia is approached,and why data obtained in different levels of hypoxia remain difficultto compare.
Both species considered in this study demonstrated higher [lac-tate] in plasma compared to muscle. This may be a distinguishing fac-tor for lactate accumulation due to hypoxia. For example the responseof S. solea to severe hypoxia is qualitatively similar to our observa-tions in C. carpio (Dalla Via et al., 1994), however, during exercise inS. solea the pattern is quite different, with the majority of lactatebeing produced and subsequently retained in the working muscles,resulting in lactate concentrations in muscle that are several timeshigher in muscle than in plasma (Dalla Via et al., 1997). This is an ad-vantage in normoxia due to the higher buffer capacity of the muscletissue and because any acidification of the blood will lead to loweringof the hemoglobin binding affinity reducing O2 extraction capacity,which is likely to prolong the duration of recovery. Indeed, accumula-tion of lactate in both the plasma and muscle tissue of C. carpio, butnot C. carassius, coincides with significantly longer metabolic recov-ery (Table 1).
4.2.3. Impact of ethanol production on lactate accumulationThe ethanol production in C. carassius is well described (Johnston
and Bernard, 1983) and is evident in the present study by the completeabsence of accumulation of lactate in muscle tissue of C. carassius. Un-like in C. carpio, ATP levels in C. carassius are not primarily maintainedby PCr stores. Mandic et al. (2008) measured a significant excretion ofethanol by C. auratus to the surrounding water within 2 h of initiationof anoxia but found only a 50% reduction in [PCr] after 10 h of anoxiaat 15 °C. These results, considering the time needed for lactate produc-tion, conversion to ethanol and diffusion into the water, and the ab-sence of any initial rise in lactate concentration, suggest an immediateactivation of ethanol production.
When C. carassius is exposed to anoxia, lactate is shuttled to themus-cles for conversion to ethanol. The continuous rise in plasma [lactate] butconstant low muscle concentration indicates either that 1) the lactateshuttling fromblood tomuscle is quite slow, or 2) that the lactate shuttleis tightly regulated in away that nomore than the lactate that can be in-stantly converted to ethanol is transported into the tissue. The first op-tion seems most plausible since Mandic et al. (2008) measured 7 μmollactate g−1 in white muscle of C. auratus after 10 h anoxia, indicatinghigher transport of lactate into the tissue than can be quickly converted.The presence of lactate accumulation in the study by Mandic et al.(2008) but not in the present study is potentially a species-specific dif-ference, but a slow shuttling mechanism combined with the relativelyshort exposure periodmayhave prevented detection of any lactate accu-mulation in the muscle tissue in the present study.
5. Conclusions
Despite the significant difference in lactate accumulation, no differ-ence in EPHOC:O2 deficit ratio could be detected between C. carassiusand C. carpio. As discussed above, the measured EPHOC for C. carassiusis in agreement with previous studies by being small compared to lesshypoxia tolerant and non-ethanol-producing species, but how C. carpioachieves such a small EPHOC after near lethal anoxia exposure, withoutdepressing its metabolism or converting lactate into ethanol, is not eas-ily explained. Despite its inability to produce ethanol in response to ox-ygen deprivation, themetabolic profile of C. carpio ismore similar to theethanol-producing members of Cyprinidae than other taxa that cannotproduce ethanol. C. carpio accumulates a greater EPHOC and requireslonger recovery time than C. carassius, but this is likely related to the
60 J. Genz et al. / Comparative Biochemistry and Physiology, Part A 165 (2013) 54–60
severity of the anoxic exposure used in this study relative to the overallanoxia survival capability of each species. No lactate accumulation inwhite muscle of C. carassius and less severe accumulation in plasma,in comparison to C. carpio, probably indicates rapid implementation ofthe ethanol production pathway upon exposure to anoxia, but a slowshuttling mechanism from plasma to muscle. The results of the presentstudy emphasize the importance of metabolic depression to C. carassiusand PCr buffering capacity to C. carpio, and thus factors other than abil-ity to produce ethanol are suggested to contribute in large part toEPHOC development in fishes.
Acknowledgments
J.C.S. was supported by a grant from the Danish Research Councilto the research school SLIP and the Fishnet research network.
References
Behrens, J., Steffensen, J., 2007. The effect of hypoxia on behavioural and physiologicalaspects of lesser sandeel, Ammodytes tobianus (Linnaeus, 1785). Mar. Biol. 150,1365–1377.
Bickler, P.E., Buck, L.T., 2007. Hypoxia tolerance in reptiles, amphibians, and fishes: lifewith variable oxygen availability. Annu. Rev. Physiol. 69, 145–170.
Brett, J.R., 1964. The respiratory metabolism and swimming performance of youngsockeye salmon. J. Fish. Res. Board Can. 21, 1183–1226.
Bushnell, P.G., Steffensen, J.F., Schurmann, H., Jones, D.R., 1994. Exercise metabolism intwo species of cod in arctic waters. Polar Biol. 14, 43–48.
Campbell, H.A., Fraser, K.P.P., Bishop, C.M., Peck, L.S., Egginton, S., 2008. Hibernation inan Antarctic fish: on ice for winter. PLoS One 3, e1743.
Dalla Via, J., Van den Thillart, G., Cattani, O., de Zwaan, A., 1994. Influence of long-termhypoxia exposure on the energy metabolism of Solea solea. 11. Intermediary me-tabolism in blood, liver and muscle. Mar. Ecol. Prog. Ser. 111, 17–27.
Dalla Via, J., van den Thillart, G., Cattani, O., Cortesi, P., 1997. Environmental versusfunctional hypoxia/anoxia in sole Solea solea: the lactate paradox revisited. Mar.Ecol. Prog. Ser. 154, 79–90.
Farrell, A.P., Richards, J.G., 2009. Defining hypoxia: an integrative synthesis of the re-sponses of fish to hypoxia. Fish Physiol. 27, 487–503.
Hallman, T.M., Rojas-Vargas, A.C., Jones, D.R., Richards, J.G., 2008. Differential recoveryfrom exercise and hypoxia exposure measured using 31P- and 1H-NMR in whitemuscle of the common carp Cyprinus carpio. J. Exp. Biol. 211, 3237–3248.
Hochachka, P.W., 1986. Defense strategies against hypoxia and hypothermia. Science231, 234–241.
Hochachka, P.W., Mommsen, T.P., 1983. Protons and anaerobiosis. Science 219, 1391.Holopainen, I.J., Hyvärinen, H., 1985. Ecology and physiology of crucian carp [Carassius
carassius (L.)] in small Finnish ponds with anoxic conditions in winter. Verh. Int.Ver. Theor. Angew. Limnol. 22, 2566–2570.
Holopainen, I.J., Hyvärinen, H., Piironen, J., 1986. Anaerobic wintering of crucian carp(Carassius carassius L.) — II. Metabolic products. Comp. Biochem. Physiol. A: Physiol.83, 239–242.
Hyvärinen, H., Holopainen, I.J., Piironen, J., 1985. Anaerobic wintering of crucian carp(Carassius carassius L.) I. Annual dynamics of glycogen reserves in nature. Comp.Biochem. Physiol. A: Physiol. 82, 797–803.
Johnston, I.A., Bernard, L.M., 1983. Utilization of the ethanol pathway in carp followingexposure to anoxia. J. Exp. Biol. 104, 73–78.
Jordan, A.D., Steffensen, J.F., 2007. Effects of ration size and hypoxia on specific dynamicaction in the cod. Physiol. Biochem. Zool. 80, 178–185.
Killen, S.S., Costa, I., Brown, J.A., Gamperl, A.K., 2007. Little left in the tank:metabolic scalingin marine teleosts and its implications for aerobic scope. Proc. R. Soc. B 274, 431–438.
Lin, C., Wu, H., Tjeerdema, R., Viant, M., 2007. Evaluation of metabolite extraction strat-egies from tissue samples using NMR metabolomics. Metabolomics 3, 55–67.
Mandic, M., Lau, G.Y., Nijjar, M.M.S., Richards, J.G., 2008. Metabolic recovery in goldfish:a comparison of recovery from severe hypoxia exposure and exhaustive exercise.Comp. Biochem. Physiol. C 148, 332–338.
Maxime, V., Pichavant, K., Boeuf, G., Nonnotte, G., 2000. Effects of hypoxia on respirato-ry physiology of turbot, Scophthalmus maximus. Fish Physiol. Biochem. 22, 51–59.
Muusze, B., Marcon, J., van den Thillart, G., Almeida-Val, V., 1998. Hypoxia tolerance ofAmazon fish: respirometry and energymetabolism of the cichlid Astronotus Ocellatus.Comp. Biochem. Physiol. A 120, 151–156.
Nilsson, G., 1988. A comparative study of aldehyde dehydrogenase and alcohol dehy-drogenase activities in crucian carp and three other vertebrates: apparent adapta-tions to ethanol production. J. Comp. Physiol. B 158, 479–485.
Nilsson, G.E., 1990. Long-term anoxia in crucian carp: changes in the levels of aminoacid and monoamine neurotransmitters in the brain, catecholamines in chromaffintissue, and liver glycogen. J. Exp. Biol. 150, 295–320.
Nilsson, G.E., 2001. Surviving anoxia with the brain turned on. News Physiol. Sci. 16,217–221.
Nilsson, G.E., Renshaw, G.M.C., 2004. Hypoxic survival strategies in two fishes: extreme an-oxia tolerance in theNorth European crucian carp and natural hypoxic preconditioningin a coral-reef shark. J. Exp. Biol. 207, 3131–3139.
Peake, S.J., Farrell, A.P., 2006. Fatigue is a behavioural response in respirometer-confined smallmouth bass. J. Fish Biol. 68, 1742–1755.
Pichavant, K., Maxime, V., Thebault, M.T., Ollivier, H., Garnier, J.P., Bousquet, B., Diouris,M., Boeuf, G., Nonnotte, G., 2002. Effects of hypoxia and subsequent recovery on tur-bot Scophthalmus maximus: hormonal changes and anaerobic metabolism. Mar. Ecol.Prog. Ser. 225, 275–285.
Piironen, J., Holopainen, I.J., 1986. A note on seasonality in anoxia tolerance of Cruciancarp (Carassius carassius (L)) in the laboratory. Ann. Zool. Fenn. 23, 335–338.
Richards, J.G., Heigenhauser, G.J.F., Wood, C.M., 2002. Glycogen phosphorylase and py-ruvate dehydrogenase transformation in white muscle of trout during high-intensity exercise. Am. J. Physiol. Reg. Int. Comp. Physiol. 282, R828–R836.
Scarabello, M., Heigenhauser, G.J.F., Wood, C.M., 1991. The oxygen debt hypothesis injuvenile rainbow trout after exhaustive exercise. Respir. Physiol. 84, 245–259.
Schurmann, H., Steffensen, J.F., 1997. Effects of temperature, hypoxia and activity onthe metabolism of juvenile Atlantic cod. J. Fish Biol. 50, 1166–1180.
Shoubridge, E.A., Hochachka, P.W., 1980. Ethanol: Novel end product of vertebrate an-aerobic metabolism. Science 209, 308–309.
Stecyk, J.A.W., Farrell, A.P., 2002. Cardiorespiratory responses of the common carp(Cyprinus carpio) to severe hypoxia at three acclimation temperatures. J. Exp.Biol. 205, 759–768.
Stecyk, J.A.W., Stenslökken, K.O., Farrell, A.P., Nilsson, G.E., 2004. Maintained cardiacpumping in anoxic crucian carp. Science 306, 77.
Steffensen, J., 1989. Some errors in respirometry of aquatic breathers: how to avoid andcorrect for them. Fish Physiol. Biochem. 6, 49–59.
Steffensen, J.F., Johansen, K., Bushnell, P.G., 1984. An automated swimming respirome-ter. Comp. Biochem. Physiol. A: Physiol. 79, 437–440.
Svendsen, J.C., Tudorache, C., Jordan, A.D., Steffensen, J.F., Aarestrup, K., Domenici, P.,2010. Partition of aerobic and anaerobic swimming costs related to gait transitionsin a labriform swimmer. J. Exp. Biol. 213, 2177–2183.
Svendsen, J.C., Steffensen, J.F., Aarestrup, K., Frisk, M., Etzerodt, A., Jyde, M., 2012. Ex-cess post hypoxic oxygen consumption in rainbow trout Oncorhynchus mykiss: re-covery in normoxia and hypoxia. Can. J. Zool. 90, 1–11.
van den Thillart, G., van Waarde, A., 1993. The role of metabolic acidosis in the buffer-ing of ATP by phosphagen stores in fish: an in vivo NMR study. In: Hochachka, P.W.,Lutz, P.L., Sick, T., Rosenthal, M., van den Thillart, G. (Eds.), Surviving Hypoxia:Mechanisms of Control and Adaptation. CRC Press, pp. 237–252.
van den Thillart, G., Verbeek, R., 1991. Anoxia-induced oxygen debt of goldfish(Carassius auratus L.). Physiol. Zool. 64, 525–540.
van den Thillart, G., van Berge-Henegouwen, M., Kesbeke, F., 1983. Anaerobic metabo-lism of goldfish, Carassius auratus (L.): ethanol and CO2 excretion rates and anoxiatolerance at 20, 10 and 5 °C. Comp. Biochem. Physiol. A: Physiol. 76, 295–300.
van der Linden, A., Verhoye,M., Nilsson, G.E., 2001. Does anoxia induce cell swelling in carpbrains? In vivo MRI measurements in crucian carp and common carp. J. Neurophysiol.85, 125–133.
van Ginneken, V., van den Thillart, G., 2009. Metabolic depression in fish measured bydirect calorimetry: a review. Thermochim. Acta 483, 1–7.
van Ginneken, V., van den Thillart, G., Addink, A., Erkelens, C., 1995. Fish muscle energymetabolism measured during hypoxia and recovery: an in vivo 31P-NMR study.Am. J. Physiol. Reg. Int. Comp. Physiol. 268, R1178–R1187.
van Ginneken, V., Nieveen, M., Van Eersel, R., Van den Thillart, G., Addink, A., 1996.Neurotransmitter levels and energy status in brain of fish species with and withoutthe survival strategy of metabolic depression. Comp. Biochem. Physiol. A 114,189–196.
van Ginneken, V., Boot, R., Murk, T., van den Thillart, G., Balm, P., 2004a. Blood plasmasubstrates and muscle lactic-acid response after exhaustive exercise in commoncarp and trout: indications for a limited lactate-shuttle. Anim. Biol. 54, 119–130.
van Ginneken, V.J.T., Snelderwaard, P., van der Linden, A., van der Reijden, R., van denThillart, G., Kramer, K., 2004b. Coupling of heart rate with metabolic depression infish: a radiotelemetric and calorimetric study. Thermochim. Acta 414, 1–10.
van Raaij, M.T.M., Pit, D.S.S., Balm, P.H.M., Anton, B., van den Thillart, G., 1996. Behav-ioral strategy and the physiological stress response in rainbow trout exposed to se-vere hypoxia. Horm. Behav. 30, 85–92.
van Waarde, A., van den Thillart, G., Erkelens, C., Addink, A., Lugtenburg, J., 1990. Func-tional coupling of glycolysis and phosphocreatine utilization in anoxic fish muscle.An in vivo 31P NMR study. J. Biol. Chem. 265, 914–923.
Vianen, G.J., Thillart, G.E.E.J., Van Kampen, M., Van Heel, T.I., Steffens, A.B., 2001. Plasmalactate and stress hormones in common carp (Cyprinus carpio) and rainbow trout(Oncorhynchus mykiss) during stepwise decreasing oxygen levels. Neth. J. Zool.51, 33–50.
Viant, M.R., Rosenblum, E.S., Tjeerdema, R.S., 2003. NMR-based metabolomics: a pow-erful approach for characterizing the effects of environmental stressors on organ-ism health. Environ. Sci. Technol. 37, 4982–4989.
Virani, N.A., Rees, B.B., 2000. Oxygen consumption, blood lactate and inter-individualvariation in the gulf killifish, Fundulus grandis, during hypoxia and recovery.Comp. Biochem. Physiol. A 126, 397–405.
Wilkie, M.P., Pamenter, M.E., Alkabie, S., Carapic, D., Shin, D.S.H., Buck, L.T., 2008. Evidenceof anoxia-induced channel arrest in the brain of the goldfish (Carassius auratus).Comp. Biochem. Physiol. C 148, 355–362.
Wissing, J., Zebe, E., 1988. The anaerobic metabolism of the bitterling Rhodeus amarus(cyprinidaf, teleostei). Comp. Biochem. Physiol. B 89, 299–303.
Zhou, B.S., Wu, R.S.S., Randall, D.J., Lam, P.K.S., Ip, Y.K., Chew, S.F., 2000. Metabolic adjust-ments in the common carp during prolonged hypoxia. J. Fish Biol. 57, 1160–1171.