evolutionary history of the bank vole myodes glareolus: a morphometric perspective
TRANSCRIPT

Evolutionary history of the bank vole Myodes glareolus:
a morphometric perspective
RONAN LEDEVIN1*, JOHAN R. MICHAUX2,3, VALÉRIE DEFFONTAINE4,5,HEIKKI HENTTONEN6 and SABRINA RENAUD1
1Paléoenvironnements et Paléobiosphère, UMR 5125, CNRS, Université Lyon 1, 69622 Villeurbanne,
France2Université de Liège, B22, Boulevard du Rectorat, 4000 Liège, Belgium3Centre de Biologie et de Gestion des Populations, UMR 1062, Campus international Agropolis de
Baillarguet, 34988 Montferrier-sur-Lez cedex, France4Zoogeography Research Unit, University of Liège, 4000 Liège, Belgium5Present address: Unit of Animal Genomics; GIGA-R; University of Liège; 4000 Liège, Belgium6Finnish Forest Research Institute, Vantaa Research Unit, PO Box 18, FI-01301 Vantaa, Finland
Received 22 November 2009; revised 20 January 2010; accepted for publication 20 January 2010bij_1445 681..694
The bank vole experienced a complex history during the Quaternary. Repeated isolation in glacial refugia led tothe differentiation of several lineages in less than 300 000 years. We investigated if such a recent differentiationled to a significant divergence of phenotypic characters between European lineages, which might provide insightinto processes of intraspecific differentiation. The size and shape of the first and third upper molars, and first lowermolar, of bank voles genetically attributed to different lineages were quantified using an outline analysis of theirocclusal surface. The three teeth present similar trends of decreasing size towards high latitudes. This trend, theinverse of Bergmann’s rule, is interpreted as the result of a balance between metabolic efficiency and foodavailability, favouring small body size in cold regions. Molar shape appeared to differ between lineages despitegenetic evidence of suture zones. A mosaic pattern of evolution between the different teeth was evidenced. Theanalysis of such phenotypic features appears as a valuable complement to genetic analyses, providing a comple-mentary insight into evolutionary processes, such as selective pressures, that have driven the differentiation of thelineages. It may further allow the integration of the paleontological dimension of the bank vole phylogeographichistory. © 2010 The Linnean Society of London, Biological Journal of the Linnean Society, 2010, 100, 681–694.
ADDITIONAL KEYWORDS: biogeography – Clethrionomys – Fourier analysis – molars – shape – size.
INTRODUCTION
Most of the species from the Northern Palaearctic andNearctic regions have a complex genetic structureshaped by repeated isolations of populations duringthe Quaternary (e.g. Hadly et al., 1998; Barnes et al.,2002). The accumulation of genetic divergencethrough time between populations led to the differ-entiation of lineages within species (Hewitt, 2000) ifthe isolation was prolonged, and/or if the contraction
and expansion of populations were repeated in thesame regions through successive climatic stages(Carstens & Knowles, 2007). Evidence of lineage dif-ferentiation during the Quaternary period was foundin a wide range of species from large mammals likethe brown bear (Sommer & Benecke, 2005) to smallmammals like the field vole (Jaarola & Searle, 2004),mostly using molecular analyses based on the varia-tions in mitochondrial DNA (mtDNA) (e.g. Avise,2000). Expectations regarding the phenotypic differ-entiation among these phylogeographic lineages arebalanced. Significant phenotypic differences betweengenetic lineages were found in a wide range of taxa
*Corresponding author.E-mail: [email protected]
Biological Journal of the Linnean Society, 2010, 100, 681–694. With 7 figures
© 2010 The Linnean Society of London, Biological Journal of the Linnean Society, 2010, 100, 681–694 681
from mammals to insects (Good et al., 2003; Garnieret al., 2005). In contrast, many species present amorphological homogeneity contrasting with a pro-nounced intraspecific genetic divergence (e.g. Austinet al., 2002; Jockusch & Wake, 2002). Such discrepantpatterns of genetic and phenotypic differentiationmight result from differences in selection regimes.Genetic markers are often considered as neutralregarding the differentiation of phylogeographic lin-eages. In contrast, adaptation to similar environ-ments can lead to phenotypic convergence or promotestabilizing selection despite genetic divergence(Rychlik, Ramalhinho & Polly, 2006), and inversely,competition for resources or habitat shift may lead toa significant phenotypic differentiation despitereduced genetic differences (Caumul & Polly, 2005;Renaud, Chevret & Michaux, 2007).
The present paper investigates if phenotypic char-acters combined with genetic analyses might allow usto decipher the evolutionary history of the bank voleMyodes glareolus (Schreber, 1780), formerly known asClethrionomys glareolus (Wilson & Reeder, 2005).This arvicoline rodent is associated with forest habi-tats and suffered repeated isolation and expansionphases during the Quaternary. This shaped a complexintraspecific genetic structure (Kotlík et al., 2006;Deffontaine et al., 2005, 2009). The first question to beaddressed is whether or not phenotypic charactershave diverged according to this genetic structure. Ifsuch morphological differentiation is evidenced, thenquestions about the processes of phenotypic differen-tiation may be addressed: did the morphologicaldivergence between lineages occur as a result of theaccumulation of genetic differences, or did selectiveprocesses contribute to the observed pattern of mor-phological differentiation?
To answer these questions the size and shape of thefirst upper molar (UM1), the third upper molar(UM3), and the first lower molar (LM1) were selectedas relevant characters to be considered. These teethwere chosen because UM1 and LM1 are the mostwidely used teeth in paleontological and biogeo-graphic studies (Kitahara, 1995; Chaline et al., 1999;Luo et al., 2004; Martin, Crockett & Marcolini, 2006;Tougard et al., 2008). We added UM3 because a fewstudies have used it for systematic purposes (Kaneko,1992) and evolutionary studies (Barnosky, 1993), andbecause this tooth displays a large intraspecific varia-tion (Bauchau & Chaline, 1987; Guérécheau et al.,2010).
The patterns of morphological differentiation in thebank vole molars were investigated based on speci-mens from Europe and Russia, covering most of thedocumented lineages. The shape of the teeth wasquantified by Fourier analyses of their occlusalsurface outline. The emerging pattern of morphologi-
cal differentiation was compared with the phylogeo-graphic structure based on previous mtDNA analyses(Deffontaine et al., 2005).
MATERIAL AND METHODS
MATERIAL
Molecular analyses
Among the published sequences in GenBank, weselected specimens matching our own samplingto provide a phylogenetic reconstruction to be com-pared with the morphological data set. A total of75 mitochondrial cytochrome b (cyt b) haplotypesequences previously published were downloadedfrom the GenBank database, and were used for thegenetic analyses (accession numbers: AJ867979,AF367074, AF367079, AF367080, AF367081,AF367082, AF367083, AF367084, AF429781,AF429782, AF429783, AF429784, AF429785,AF429786, AF429787, AF429788, AF429789,AF429790, AJ639661, AJ639708, AY062900,AY062901, AY062902, AY062903, AY062904,AY062905, AY062906, AY062907, AY185786,AY185800, VYD021, VYD023, VYD024, VYD029,VYD033, VYD034, VYD041, VYD042, VYD043,VYD051, VYD052, VYD053, VYD055, VYD057,VYD058, VYD076, VYD077, VYD092, VYD123,VYD124, VYD125, VYD128, VYD145, VYD146).
These haplotypes correspond to 154 M. glareolus
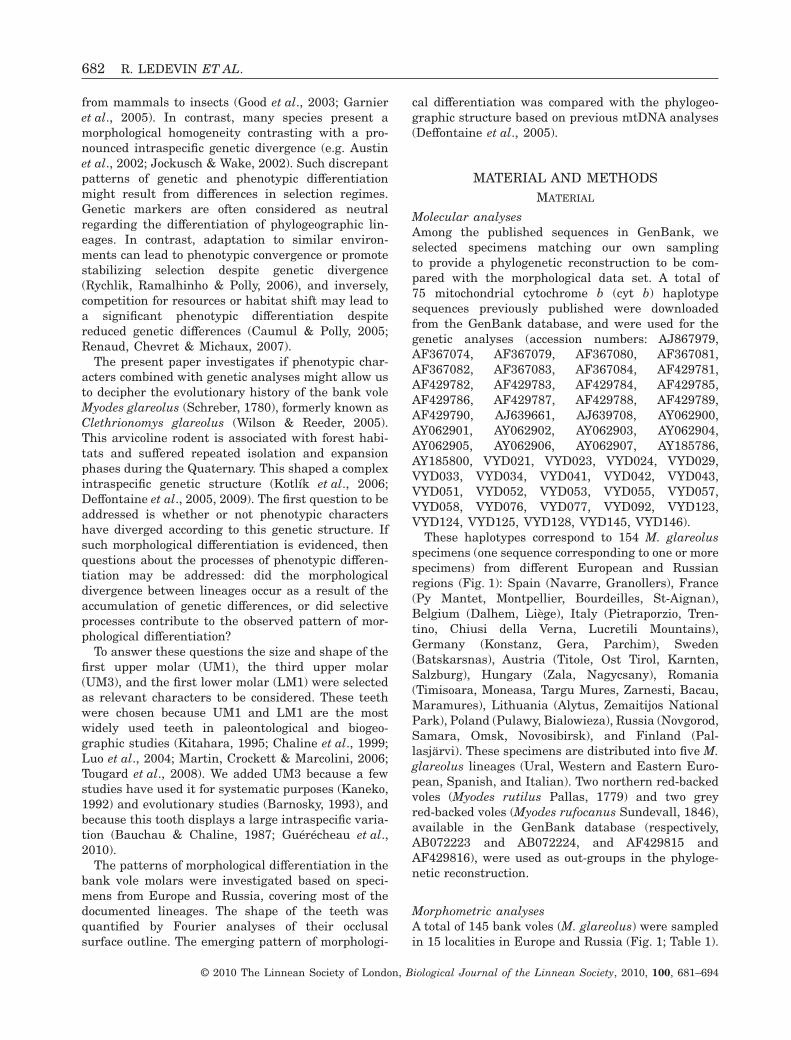
specimens (one sequence corresponding to one or morespecimens) from different European and Russianregions (Fig. 1): Spain (Navarre, Granollers), France(Py Mantet, Montpellier, Bourdeilles, St-Aignan),Belgium (Dalhem, Liège), Italy (Pietraporzio, Tren-tino, Chiusi della Verna, Lucretili Mountains),Germany (Konstanz, Gera, Parchim), Sweden(Batskarsnas), Austria (Titole, Ost Tirol, Karnten,Salzburg), Hungary (Zala, Nagycsany), Romania(Timisoara, Moneasa, Targu Mures, Zarnesti, Bacau,Maramures), Lithuania (Alytus, Zemaitijos NationalPark), Poland (Pulawy, Bialowieza), Russia (Novgorod,Samara, Omsk, Novosibirsk), and Finland (Pal-lasjärvi). These specimens are distributed into five M.
glareolus lineages (Ural, Western and Eastern Euro-pean, Spanish, and Italian). Two northern red-backedvoles (Myodes rutilus Pallas, 1779) and two greyred-backed voles (Myodes rufocanus Sundevall, 1846),available in the GenBank database (respectively,AB072223 and AB072224, and AF429815 andAF429816), were used as out-groups in the phyloge-netic reconstruction.
Morphometric analyses
A total of 145 bank voles (M. glareolus) were sampledin 15 localities in Europe and Russia (Fig. 1; Table 1).
682 R. LEDEVIN ET AL.
© 2010 The Linnean Society of London, Biological Journal of the Linnean Society, 2010, 100, 681–694
A total of 79 specimens were genetically attributed toa lineage, documenting five of the known mtDNAphylogroups (Fig. 2): the Spanish, Italian, WesternEuropean, Eastern European, and Ural lineages.Localities where mtDNA analyses evidenced theco-occurrence of several lineages were discarded fromour sampling to avoid mixing lineages that might blurany morphometric differentiation between them. Inlocalities without evidences of mixing, all availablespecimens were considered, including those that werenot genetically identified. For each animal three mor-phological characters were considered, when intact:UM1, UM3, and LM1. For comparison purposes, 31specimens of the related red vole (M. rutilus Pallas,1779) were included in the study.
PHYLOGENETIC RECONSTRUCTIONS
We used MODELTEST 3.0 (Posada & Crandall, 1998)to determine the most suitable model of DNA substi-tution for the cyt b data set studied. Phylogeneticreconstructions were performed using the maximumlikelihood criterion (ML; Felsenstein, 1981) imple-mented in PHYML (Guindon & Gascuel, 2003). Phy-logenetic trees were rooted with cyt b sequences fromtwo northern red-backed voles (M. rutilus) and twogrey red-backed voles (M. rufocanus). The robustnessof the tree was assessed by bootstrap support (BP)(1000 random pseudoreplicates).
Figure 1. Geographic distribution of the bank vole(Myodes glareolus) samples and genetic lineages. Thisstudy includes five bank vole mitochondrial lineages: theSpanish, Italian, Western European, Eastern European,and Ural groups. The symbols correspond to species andlineages within M. glareolus.
Table 1. Sampling localities with their label and country of origin. The lineage of most specimens was geneticallyidentified, and the number of first upper (UM1), third upper (UM3), and first lower (LM1) molars measured is indicated
Species Country Locality Label Lineage
Number of measured features
UM1 UM3 LM1
Myodes
glareolus
Austria Pfunds, Ventetal, Zemmtal AUS W 11 16 13Belgium Blégnie, Dahlem, Liège, Virelles BEL W 23 24 22Finland Pallasjärvi FIN UR 11 12 12France Loiret FR W 2 2 2Germany Langenberg GER W 3 3 3Hungary Bak HG W 4 4 3Italy Tuscany IT IT 10 10 10Lithuania Alytus LIT E 4 4 4Poland Lublin POL E 3 9 5Romania Sovata ROM E 9 9 9Russia Bashkiria RS_BA UR 25 25 23Russia Zhiguli RS_JU E 4 4 4Russia Ozerki RS_SA E 7 8 7Slovenia Delnice, Livek SLN W 3 3 2Spain Asturias SP SP 12 12 12
Myodes
rutilus
Finland Pallasjärvi RUT_FIN – 24 27 24Russia Shigaevo RUT_EK – 4 4 4
Total 159 176 173
MORPHOMETRICS OF BANK VOLE MOLARS 683
© 2010 The Linnean Society of London, Biological Journal of the Linnean Society, 2010, 100, 681–694
Mean sequence divergences among the four mainM. glareolus (Western, Eastern, Spanish, and Italian)genetic lineages were calculated in MEGA v.4(Tamura et al., 2007), using the corrected K2P dis-tance matrix (Kimura, 1981), as proposed by MOD-ELTEST 3.0. The Ural group was not considered inthis analysis as it displays M. rutilus mtDNA.
SHAPE ANALYSIS
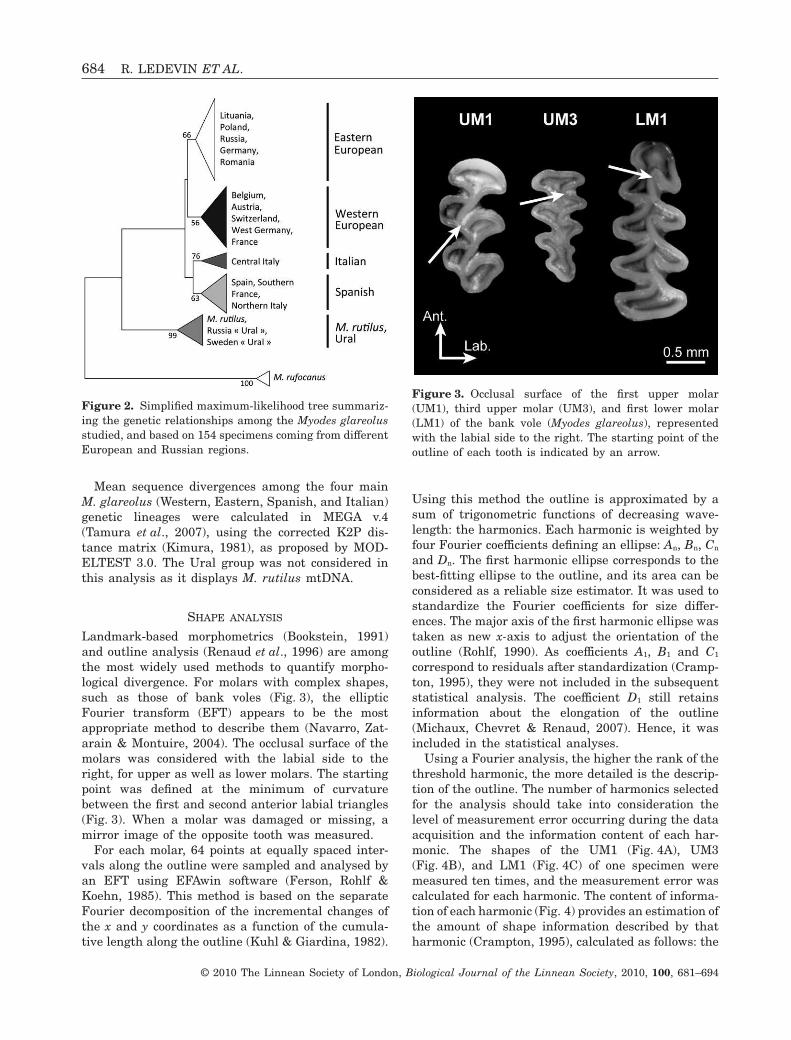
Landmark-based morphometrics (Bookstein, 1991)and outline analysis (Renaud et al., 1996) are amongthe most widely used methods to quantify morpho-logical divergence. For molars with complex shapes,such as those of bank voles (Fig. 3), the ellipticFourier transform (EFT) appears to be the mostappropriate method to describe them (Navarro, Zat-arain & Montuire, 2004). The occlusal surface of themolars was considered with the labial side to theright, for upper as well as lower molars. The startingpoint was defined at the minimum of curvaturebetween the first and second anterior labial triangles(Fig. 3). When a molar was damaged or missing, amirror image of the opposite tooth was measured.
For each molar, 64 points at equally spaced inter-vals along the outline were sampled and analysed byan EFT using EFAwin software (Ferson, Rohlf &Koehn, 1985). This method is based on the separateFourier decomposition of the incremental changes ofthe x and y coordinates as a function of the cumula-tive length along the outline (Kuhl & Giardina, 1982).
Using this method the outline is approximated by asum of trigonometric functions of decreasing wave-length: the harmonics. Each harmonic is weighted byfour Fourier coefficients defining an ellipse: An, Bn, Cn
and Dn. The first harmonic ellipse corresponds to thebest-fitting ellipse to the outline, and its area can beconsidered as a reliable size estimator. It was used tostandardize the Fourier coefficients for size differ-ences. The major axis of the first harmonic ellipse wastaken as new x-axis to adjust the orientation of theoutline (Rohlf, 1990). As coefficients A1, B1 and C1
correspond to residuals after standardization (Cramp-ton, 1995), they were not included in the subsequentstatistical analysis. The coefficient D1 still retainsinformation about the elongation of the outline(Michaux, Chevret & Renaud, 2007). Hence, it wasincluded in the statistical analyses.
Using a Fourier analysis, the higher the rank of thethreshold harmonic, the more detailed is the descrip-tion of the outline. The number of harmonics selectedfor the analysis should take into consideration thelevel of measurement error occurring during the dataacquisition and the information content of each har-monic. The shapes of the UM1 (Fig. 4A), UM3(Fig. 4B), and LM1 (Fig. 4C) of one specimen weremeasured ten times, and the measurement error wascalculated for each harmonic. The content of informa-tion of each harmonic (Fig. 4) provides an estimation ofthe amount of shape information described by thatharmonic (Crampton, 1995), calculated as follows: the
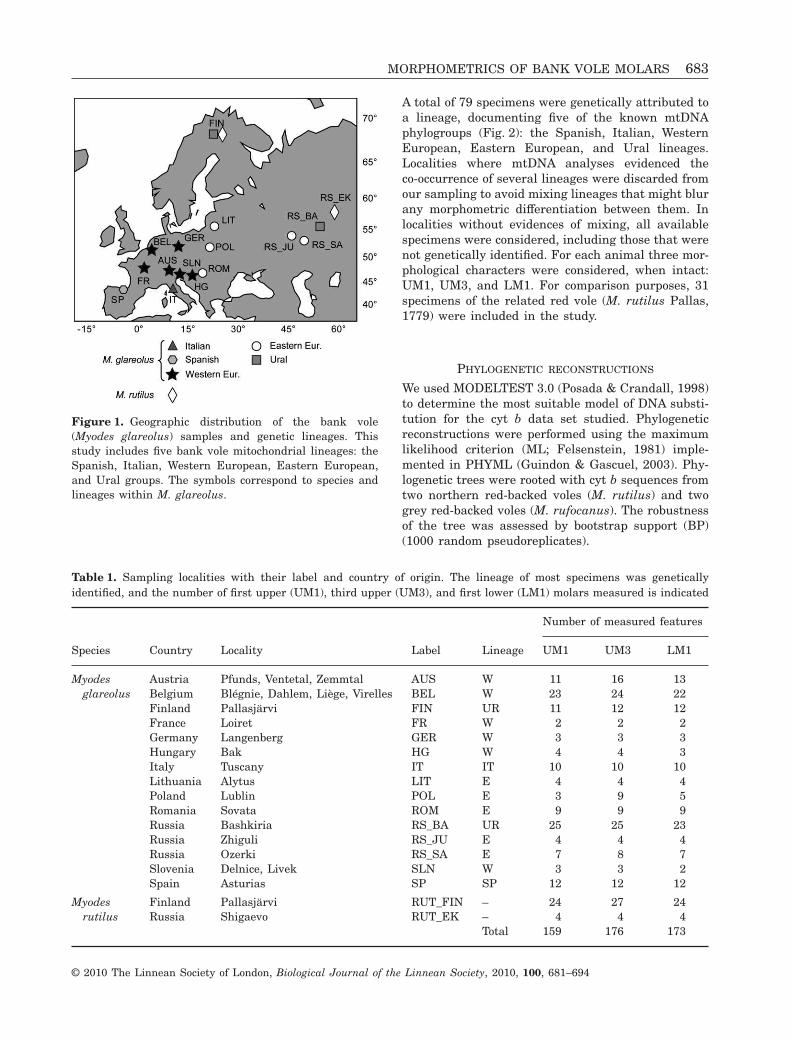
Figure 2. Simplified maximum-likelihood tree summariz-ing the genetic relationships among the Myodes glareolus
studied, and based on 154 specimens coming from differentEuropean and Russian regions.
Figure 3. Occlusal surface of the first upper molar(UM1), third upper molar (UM3), and first lower molar(LM1) of the bank vole (Myodes glareolus), representedwith the labial side to the right. The starting point of theoutline of each tooth is indicated by an arrow.
684 R. LEDEVIN ET AL.
© 2010 The Linnean Society of London, Biological Journal of the Linnean Society, 2010, 100, 681–694

amplitude of each harmonic n [= √(An2+ Bn
2+ Cn
2+
Dn2)] is cumulated over the total range of harmonics,
and the information brought by each harmonic is thenestimated as the percentage of this sum represented bythe amplitude of rank n. For the three teeth used here,more than 90% of the information content is reachedby considering the first ten harmonics, in agreementwith previous studies on arvicoline molars (Marcolini,2006), showing that considering this set of harmonicsoffers a good compromise between measurement error(less than 15%), the number of variables, and informa-tion content. Therefore, a data set of 37 variables (40Fourier coefficients minus A1, B1, and C1) was retainedfor subsequent analyses.
A visualization of shape changes can be provided bythe reconstruction of outlines using the inverseFourier method (Rohlf & Archie, 1984).
STATISTICAL ANALYSIS
The size of the three molars, estimated by the squareroot of the 2D outline area, was investigated usingunivariate statistics. Unfortunately the body size wasnot available for comparison. Inter- and intraspecificdifferences in size as well as the occurrence of sexualdimorphism were tested by analyses of variance(ANOVA) completed by Student’s t-tests for pairwisedifferences.
Multivariate analyses were used to investigate theshape of the molars, estimated by the set of 37Fourier coefficients. Multivariate analyses of variance(MANOVA) were performed on these variables tominimize the influence of intragroup variation, and toevidence the patterns of among-group differentiationon a few synthetic canonical shape axes. Pairwisecomparisons between lineages were also performed
Figure 4. Measurement error (black diamonds) and information content (white diamonds) as a function of the harmonicrank for (A) the first upper molar (UM1), (B) the third upper molar (UM3), and (C) the first lower molar (LM1). Themeasurement error corresponds to the coefficient of variation of the harmonic amplitude for one specimen measured tentimes. The percentage of information corresponds to the contribution of each harmonic (amplitude %) to the total ofinformation (i.e. the sum of all harmonic amplitudes = 100%). For the three molars, considering the first ten harmonicsprovides more than 90% of the information content (dotted lines), and a measurement error of less than 15%, which wasthus chosen as the common threshold.
MORPHOMETRICS OF BANK VOLE MOLARS 685
© 2010 The Linnean Society of London, Biological Journal of the Linnean Society, 2010, 100, 681–694

using a Hottelling T2 test (test considered: Wilks’Lambda). Finally, multivariate regressions were per-formed between size and shape to test for an allom-etric effect.
Statistics were performed using Systat v.11 andNTsys-pc 2.1 (Rohlf, 2000).
RESULTS
PHYLOGENETIC ANALYSES
The ML tree is presented Figure 2. The ML analyseswere performed using the K2P model estimated usingMODELTEST 3.0, with the proportion of invariablesites set to 0.52 and with a gamma distribution shapeparameter of 0.69. As previously observed (Deffontaineet al., 2005), the studied M. glareolus sequences aredivided into five main lineages. The Eastern andWestern European groups (bootstrap/BP values: 66and 56%, respectively) associate animals from: (1)Russia, Germany, Romania, Lithuania, and Poland;and (2) Belgium, Austria, Switzerland, Germany, andFrance, respectively. Two other groups correspond tothe Mediterranean peninsular lineages (Spanish andItalian, BP values: 63 and 76%, respectively). Finally,some bank vole sequences from Russia and Sweden arecloser to red-backed vole sequences than to other M.
glareolus sequences forming the previously describedbank vole ‘Ural group’ (Deffontaine et al., 2005). TheWestern and Eastern European lineages seem to bemore closely related as compared with the two Medi-terranean peninsular populations, which are associ-ated together. However, these relationships do nothave strong support (BP < 50) and should be takenwith caution, as the four lineages are genetically soclose that it is difficult to precisely define their rela-tionships. The levels of genetic divergence among thefour European lineages summarized in Table 2 evi-dence such difficulties, as these results suggest theWestern European group is more closely related to theMediterranean peninsular populations (1.01% K2Pdistance) than to the Eastern lineage (1.34%). Asimilar result was already observed in Deffontaineet al. (2005) on the basis of a more complete data set.
In contrast, the low levels of genetic divergence (0.73%)between the Italian and Spanish groups tend toconfirm a close relationship between them.
SEXUAL DIMORPHISM IN MOLAR SIZE AND SHAPE
Molar size and shape differences between males andfemales were tested in 25 specimens trapped in thesame Russian locality of Bashkiria (Table 1). Nosexual dimorphism was evident on UM1 (ANOVA:P = 0.462), UM3 (P = 0.280), or LM1 size (P = 0.060).No evidence of sexual dimorphism in molar shapewas found (MANOVA: PUM1 = 0.654, PUM3 = 0.748, andPLM1 = 0.606). Therefore, males and females werepooled together in the subsequent analyses.
INTERSPECIFIC MORPHOLOGICAL DIFFERENCES
Significant size differences between M. glareolus andM. rutilus were found for the three molars (P < 0.001),with the molars of M. rutilus being smaller than thoseof M. glareolus (Fig. 5). The two species further differin shape (P < 0.001). The level of interspecific differ-ence was compared with variation among M. glare-
olus specimens by performing an analysis includingthe M. rutilus sample and the five M. glareolus lin-eages as groups. In all cases, the two species differalong the first axis (Fig. 6). The molars of M. rutilus
were characterized by a larger anterior part of UM1,a more developed posterior lingual triangle on UM3,and a shorter anterior part and less marked triangleson LM1.
The intraspecific differences within M. glareolus
emerge along the second canonical axis, which repre-sents from half to a third of the variation expressedby the first axes (Fig. 6). The molar shape of the Urallineage is clearly associated with other M. glareolus
lineages, and is particularly close to the EasternEuropean lineage.
To investigate the intraspecific differences thatemerged from this analysis in more detail, furtheranalyses were performed on bank vole samples alone.
INTRASPECIFIC DIFFERENTIATION OF M. GLAREOLUS
Size differences among lineages
Differences in molar size among lineages were in-vestigated (Table 3). Size is significantly differentbetween lineages in most of the cases (P < 0.01). TheEastern European and Ural lineages are the leastdifferentiated, only showing a weak size difference inUM3 and LM1 (P = 0.012 and P = 0.020, respectively).By contrast, the Western European and Spanishgroups show a high differentiation in UM3 size(P = 0.003), but not in UM1 (P = 0.164) and LM1(P = 0.474). These differences among lineages corre-
Table 2. Mean sequence divergence among genetic lin-eages calculated in MEGA v.4 (Tamura et al., 2007), usingthe corrected K2P distance matrix. The Ural group wasnot considered in this analysis as it displays red volemitochondrial DNA
#WESTERN #ITALIAN #SPANISH
#ITALIAN 0.0101#SPANISH 0.0105 0.0073#EASTERN 0.0134 0.0155 0.0165
686 R. LEDEVIN ET AL.
© 2010 The Linnean Society of London, Biological Journal of the Linnean Society, 2010, 100, 681–694

spond to an overall decrease in molar size from Medi-terranean peninsulas (Spanish or Italian groups) tonorthernmost localities, where a convergence betweenthe Ural lineage and M. rutilus was observed(ANOVA, UM1, P = 0.750; UM3, P = 0.760; LM1,P = 0.236; Fig. 5). This is confirmed by a significantand negative relationship between molar size andlatitude (P < 0.001).
Patterns of shape differentiation
Since interlineage differences are tenuous comparedwith intragroup variability, a canonical analysis was
performed on the Fourier coefficients of each molarto focus on differences among lineages that weresignificant in the three molars (P < 0.001). The pat-terns of differentiation were visualized on the firstthree canonical axes (Fig. 7). Even if the groupingvariable corresponds to the lineages, the averagevalue per locality has been represented. Clear pat-terns of shape differentiation emerge on the threeteeth, supported by two-by-two comparisons betweenlineages (Table 4).
The analysis of UM1 evidenced a segregation of theSpanish and Italian lineages from the other groups(Fig. 7A) along the first and second shape axes,respectively (CA1 = 45.6% and CA2 = 22.4% of theamong-group variance). The Italian lineage is close tothe Eastern European group along CA1, but is clearlydifferentiated along CA2. The Spanish lineage differ-entiates in the CA1–CA2 plane, with the shapetending to be more similar to the Western Europeangroup than to the others, but still with a significantdivergence (P = 0.008; Table 3). The Eastern Euro-pean and Western European groups weakly differ-entiate along the first and third shape axes(CA3 = 19.2%) with a low level of divergence(P = 0.012). The Ural group, being close to theEastern European lineage in morphospace, still dif-ferentiates along CA1 from the other lineages, and issignificantly different from the other groups. Finally,despite its extreme average position along CA2, theItalian lineage is only weakly differentiated from theother groups (P < 0.05 or non significant), possiblybecause of its limited sample size. The differencesobserved on the reconstructed outlines are tenuous.The main regions of variation are the re-entrant
Figure 5. Geographical differences in the size of theocclusal surface of (A) the first upper molar (UM1), (B) thethird upper molar (UM3), and (C) the first lower molar(LM1). The square-root of the two-dimensional outlinearea is used as the size estimator. Each dot corresponds tothe mean of a geographical group ± the confidence inter-val. The symbols correspond to species and to lineageswithin Myodes glareolus.
Table 3. Two-by-two tests (Student’s t-tests) of size differ-ences between lineages for the first upper (UM1), thirdupper (UM3), and first lower (LM1) molars
UM1 UM3 LM1
E_W 0.001*** 0.004** < 0.001***E_IT < 0.001*** < 0.001*** < 0.001***E_SP < 0.001*** < 0.001*** 0.001***E_UR 0.146 0.012* 0.020*W_IT < 0.001*** < 0.001*** < 0.001***W_SP 0.164 0.003** 0.474W_UR < 0.001*** < 0.001*** < 0.001***IT_SP 0.030* 0.373 0.005**IT_UR < 0.001*** < 0.001*** < 0.001***SP_UR < 0.001*** < 0.001*** < 0.001***
Probabilities are given with significance thresholds(***P < 0.001; **P < 0.01; *P < 0.05). E, Eastern Europeangroup; W, Western European group; IT, Italian group; SP,Spanish group; UR, Ural group.
MORPHOMETRICS OF BANK VOLE MOLARS 687
© 2010 The Linnean Society of London, Biological Journal of the Linnean Society, 2010, 100, 681–694

Figure 6. Shape differences between Myodes rutilus and Myodes glareolus. The variations are displayed on the first twoaxes of a canonical analysis on the Fourier coefficients of the molar outline. The grouping variable used for the analysisincludes six groups: the five lineages of Myodes glareolus and the sample of Myodes rutilus. To have a betterrepresentation of the intraspecific variability, each dot corresponds to the mean by localities. Reconstructed outlinesvisualize the difference between the two species.
Table 4. Two-by-two tests of shape differences between lineages for the first upper (UM1), third upper (UM3), and firstlower (LM1) molars
UM1 UM3 LM1
FCs Res. FCs Res. FCs Res.
E_W 0.012* 0.027* < 0.001*** < 0.001*** 0.024* 0.503E_IT 0.447 0.215 0.205 0.121 0.091 0.231E_SP 0.005** 0.0002*** 0.066 0.028* 0.151 0.060E_UR 0.006** 0.076 0.033* 0.111 0.098 0.247W_IT 0.027* 0.040* 0.146 0.007** 0.036* 0.027*W_SP 0.008** 0.004** 0.007** < 0.001*** < 0.001*** < 0.001***W_UR < 0.001*** < 0.001*** < 0.001*** < 0.001*** < 0.001*** 0.018*IT_SP 0.471 0.361 0.527 0.337 0.434 0.602IT_UR 0.030* 0.072 0.017* 0.216 0.030* 0.430SP_UR < 0.001*** 0.003** 0.003** 0.034* 0.029* 0.009**
Shape was estimated by the set of Fourier coefficients (FCs), and differences were tested using a Hottelling T2 test. Totest the occurrence of an allometric effect on the shape of the molars, a multivariate regression was performed. Thetwo-by-two tests were performed on the residuals (Res) and compared with the previous results. Probabilities are givenwith significance thresholds (***P < 0.001; **P < 0.01; *P < 0.05). E, Eastern European group; W, Western Europeangroup; IT, Italian group; SP, Spanish group; UR, Ural group.
688 R. LEDEVIN ET AL.
© 2010 The Linnean Society of London, Biological Journal of the Linnean Society, 2010, 100, 681–694
angles between each triangle, the size of the trianglesand the posterior part of the molar, which is more orless rounded (Fig. 7A).
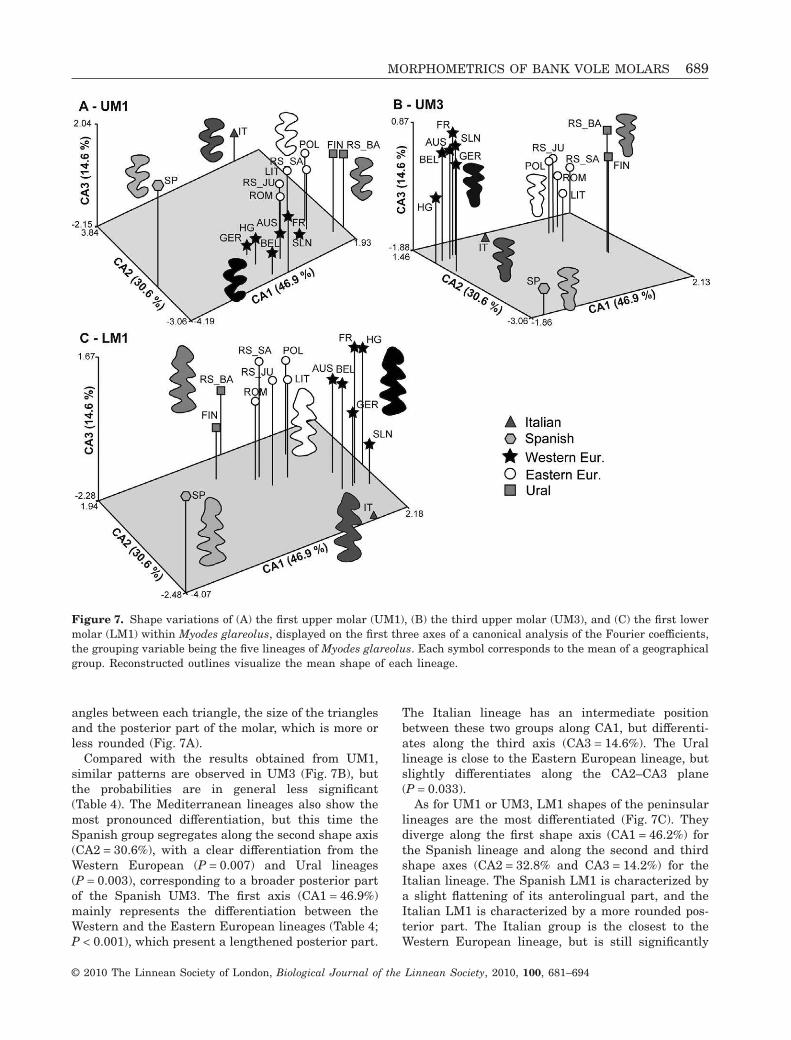
Compared with the results obtained from UM1,similar patterns are observed in UM3 (Fig. 7B), butthe probabilities are in general less significant(Table 4). The Mediterranean lineages also show themost pronounced differentiation, but this time theSpanish group segregates along the second shape axis(CA2 = 30.6%), with a clear differentiation from theWestern European (P = 0.007) and Ural lineages(P = 0.003), corresponding to a broader posterior partof the Spanish UM3. The first axis (CA1 = 46.9%)mainly represents the differentiation between theWestern and the Eastern European lineages (Table 4;P < 0.001), which present a lengthened posterior part.
The Italian lineage has an intermediate positionbetween these two groups along CA1, but differenti-ates along the third axis (CA3 = 14.6%). The Urallineage is close to the Eastern European lineage, butslightly differentiates along the CA2–CA3 plane(P = 0.033).
As for UM1 or UM3, LM1 shapes of the peninsularlineages are the most differentiated (Fig. 7C). Theydiverge along the first shape axis (CA1 = 46.2%) forthe Spanish lineage and along the second and thirdshape axes (CA2 = 32.8% and CA3 = 14.2%) for theItalian lineage. The Spanish LM1 is characterized bya slight flattening of its anterolingual part, and theItalian LM1 is characterized by a more rounded pos-terior part. The Italian group is the closest to theWestern European lineage, but is still significantly
Figure 7. Shape variations of (A) the first upper molar (UM1), (B) the third upper molar (UM3), and (C) the first lowermolar (LM1) within Myodes glareolus, displayed on the first three axes of a canonical analysis of the Fourier coefficients,the grouping variable being the five lineages of Myodes glareolus. Each symbol corresponds to the mean of a geographicalgroup. Reconstructed outlines visualize the mean shape of each lineage.
MORPHOMETRICS OF BANK VOLE MOLARS 689
© 2010 The Linnean Society of London, Biological Journal of the Linnean Society, 2010, 100, 681–694
different (Table 4; P = 0.036). The Eastern andWestern European lineages are weakly differentiated(P = 0.024) on the CA1–CA2 plane. The Ural lineageis close to the Eastern European lineage but slightlyshifted along CA1. Overall, the analysis of LM1evidences weaker among-lineage differentiation thanin UM1 and UM3. However, LM1 is the onlytooth supporting the Western-Spanish differentiation(P < 0.001).
Possible effect of an allometric component on the
size and shape differentiation patterns
Our results indicate that the Spanish, Italian, andUral lineages were clearly divergent from the otherlineages in shape, but were also the most divergent insize. The possible influence of an allometric compo-nent on the shape differentiation of these lineageswas tested using a multivariate regression betweensize and shape variables. It was significant for thethree molars (P < 0.001). However, canonical analysesperformed on residuals showed very similar results tothose obtained on raw Fourier coefficients (Table 4).Thus, the patterns of shape differentiation were notattributable to allometric effects.
DISCUSSION
A GEOGRAPHICAL TREND IN SIZE
The best-known trend in biogeography is Berg-mann’s rule (Bergmann, 1847) stating that warm-blooded animals tend to increase in size in coldenvironments, with larger animals obtaining asmaller surface-to-volume ratio and thereby improv-ing heat conservation in a cold climate. Yet, somegroups tend to depart from this general trend, espe-cially carnivores (Meiri, Dayan & Simberloff, 2004)and small mammals (Meiri & Dayan, 2003). Assum-ing that molar size can be considered a proxy forbody size at the interpopulation scale of variation,as suggested in wood mice (Renaud & Michaux,2007), our data evidenced that the bank vole may bea further exception to Bergmann’s rule. This trendemerged between lineages, with Mediterraneangroups tending to be larger than northern ones.Several factors may contribute to this apparentlysurprising trend. First, predators such as stoats(Erlinge, 1987) and pine martens (Zalewski, 2005)also tend to become smaller towards high latitudes,possibly as an adaptation to winter conditionsincluding snow cover. Being one of the main prey ofthese predators, the concomitant decrease in size ofbank voles may be an adaptive response to preda-tion pressure, with bank voles finding shelters inburrows narrower than their predators (Sundell &Norrdahl, 2002). The size decrease is particularly
marked in the Ural lineage, strikingly convergingtowards the size of the northern red-backed vole M.
rutilus. High-latitude environments are character-ized by low primary production and low food avail-ability, especially in winter (Yom-Tov & Geffen,2006), so a smaller body size may represent anadaptation to reduce the total energy requirement(Ellison et al., 1993). Furthermore, as mtDNA isinvolved in metabolic activity, the introgression ofM. rutilus mtDNA in the Ural lineage might be ofselective advantage, by allowing bank voles todisplay a metabolism similar to that of their cold-adapted relative. An association between the occur-rence of M. rutilus mitochondrial DNA, smaller bodysize, and reduced basal metabolic rate has beenrecently evidenced in Finnish bank voles (Boratyn-ski, Koskela & Mappes, 2009), supporting the inter-pretation of a complex adaptation to cold conditionsin the Ural lineages through evolutionary trade-offsbetween metabolic rate and body size.
INTER- AND INTRASPECIFIC DIFFERENTIATION
Molars of arvicoline rodents have long been recog-nized for their taxonomic value at the interspecificlevel (e.g. Kaneko, 1992; Kitahara, 1995; Chalineet al., 1999). In the arvicoline genus Myodes, 12species are currently recognized (Wilson & Reeder,2005) in which differentiation occurred during thesecond pulse of the arvicoline radiation, around2.6 Mya (Chaline et al., 1999; Conroy & Cook, 1999).The obvious morphological differentiation observed inthe present study between M. glareolus and M.
rutilus confirms that this time span has been longenough for important differences in molar shape toaccumulate between species (e.g. Renvoisé et al.,2009). The existence of intraspecific differencesamong lineages of M. glareolus was less expectedbecause of their recent divergence time, estimated to250–300 Kya (Deffontaine et al., 2005). Furthermore,genetic analyses pointed to a low divergence of thelineages (maximum 1.6% genetic differentiation;Table 2). Cases of morphological differentiation in aneven shorter time span are known, but they usuallycorrespond to peculiar conditions such as small, iso-lated populations in insular conditions (Renaud &Millien, 2001) or fragmented populations as a resultof anthropization (Mikulová & Frynta, 2001). Thecontext of divergence between bank vole lineages isvery different, as they came into contact regularlyduring interglacial periods, allowing for significantgene flow between large populations. In a similarcontext, evidences of molar shape differentiationamong wood mice (Apodemus sylvaticus) lineageswere found, with the level of differentiation being low,however, despite a date of divergence of around 1 Mya
690 R. LEDEVIN ET AL.
© 2010 The Linnean Society of London, Biological Journal of the Linnean Society, 2010, 100, 681–694
(Renaud & Michaux, 2007). Compared with the woodmouse, the bank vole lineages present an even morerecent date of divergence, and it is thus remarkablethat we evidenced a significant difference betweenlineages in the shape of all molars considered. Yet inagreement with the low genetic divergence, the mor-phological differentiation is tenuous and of the sameorder of magnitude than local sources of variationwithin populations (Guérécheau et al., 2010). Thequestion of the processes leading to this differentia-tion will be addressed in the following sections.
MOSAIC EVOLUTION BETWEEN MORPHOLOGICAL
CHARACTERS
Many studies have considered patterns of differentia-tion in arvicoline molars, but usually each studyfocused on a single tooth (e.g. Marcolini, 2006;Tougard et al., 2008). An originality of this study wasto consider several teeth, and compare their patternsof differentiation. As the different molars share asimilar genetic background involved in the dental rowdevelopment (Kavanagh, Evans & Jernvall, 2007),they cannot be considered as independent characters,and a concerted evolution among molars is expected.Accordingly, many similarities were observed betweenthe patterns of shape differentiation among teeth.The Spanish and Italian lineages were always themost divergent groups. The Eastern and WesternEuropean groups were generally close to each other atthe centre of the morphological space, and finally theUral lineage was closely related to the Eastern Euro-pean lineage. These results complement our inter-pretation of the phylogenetic reconstructions thatpresent relatively low bootstraps.
However, even if common features emerged fromthe patterns of shape differentiation of the threeteeth, some discrepancies also occurred. Dependingon the molar, the Italian lineage appeared to beclose either to the Eastern European group (UM1),the Western European group (LM1), or intermediatebetween the two groups (UM3). The differentiationbetween the Western and Eastern European lin-eages was most pronounced on the UM3. These dis-crepancies between the patterns of differentiation ofthe three teeth suggest that a mosaic evolutionoccurred, despite the overall concerted evolution.This may be because of slightly different evolution-ary rates for the different characters, as previouslyobserved in rodent teeth (Barnosky, 1993). It sug-gests a more pronounced divergence of UM1, mainlyduring the Ural lineage differentiation, whereasUM3 diverged faster than the other teeth betweenWestern and Eastern European groups, and LM1diverged faster than the other teeth betweenWestern and Spanish lineages.
MOLAR SHAPE PROVIDING HINTS ABOUT BANK
VOLE PHYLOGEOGRAPHIC HISTORY
The Mediterranean lineages as sources of endemism
For a long time the Mediterranean peninsulas wereconsidered as the main refugia and sources of north-ward recolonization for temperate forest speciesduring the Quaternary period (Lugon-Moulin &Hausser, 2002; Sommer & Benecke, 2005). An alter-native view is to consider these regions as zones ofendemism (Bilton et al., 1998). Considering the Medi-terranean peninsulas as sources of recolonizationwould lead to the expectation of the Western andEastern European molar shapes being close to theItalian and Spanish ones. On the contrary, our resultspresent a marked divergence of the peninsularlineages from the Western and Eastern Europeangroups, thus bringing support to the second hypoth-esis of Mediterranean endemism. In agreement,genetic analyses showed that the two Mediterraneanlineages were independent compared with the otherpopulations from Western and Eastern Europe. Fur-thermore, the lack of shape similarities between theItalian and Spanish lineages, despite a low degree ofgenetic divergence (0.73% K2P distance; Table 2), evi-denced the absence of parallel evolution, even if theyshare similar Mediterranean environments. It sug-gests that molar shape in the two groups differedrather by accumulation of neutral differences in iso-lated populations than by parallel adaptation to theirenvironments.
Western and Eastern European lineages
During the Quaternary period, repeated cooling andfluctuations of ice sheets caused shifts in speciesdistribution (Bilton et al., 1998; Hewitt, 2000).Whereas bank vole populations were isolated inrefugia during glacial periods, leading to a differen-tiation between lineages, the deglaciation phasesinduced an expansion with two possible scenarios.The lineages might have been isolated by geographi-cal barriers, decreasing their dispersal ability andleading to endemism, as illustrated by the Mediter-ranean lineages. Alternatively, lineages might havecome into contact, with gene flow in suture zonesswamping out the differentiation accumulated duringglaciation phases. The Western and Eastern lineagesin bank voles appear to be relevant to this last case.Given the genetic evidence, their suture zone rangesover a thousand kilometres in Central Europe, withthe occurrence of Eastern mtDNA in Germany andthe occurrence of Western mtDNA as far as Romania(Deffontaine et al., 2005). The morphometric results,however, point to a weak but significant differentia-tion between the two lineages, in agreement with thelevel of genetic divergence larger than between the
MORPHOMETRICS OF BANK VOLE MOLARS 691
© 2010 The Linnean Society of London, Biological Journal of the Linnean Society, 2010, 100, 681–694
endemic Mediterranean lineages (1.34% K2P distancebetween Eastern and Western lineages vs. 0.73%between Spanish and Italian lineages). This suggeststhat despite extensive mixing nowadays, the repeatedisolations during glaciation periods were importantenough to shape the pattern of differentiation stillobserved today.
Ural lineage
The distinctiveness of the Ural lineage is that it hasM. rutilus mtDNA despite the fact that its overallmorphology, and all nuclear markers investigated sofar, are typical of the bank vole (Tegelström, 1987;Potapov et al., 2007; Henttonen & Kaikusalo, pers.com.). In agreement, the molar shape of the Uralgroup is clearly related to other bank voles. Moreover,the Eastern European lineage is morphologicallyclose to the Ural group, supporting the Eastern Euro-pean group as the closest relative of the Ural lineage,as suggested on the basis of molecular analyses (Def-fontaine et al., 2005). The introgression of M. rutilus
mtDNA within a bank vole lineage is likely to haveresulted from hybridization between the two species,a process that can still occur in natura and in labo-ratory experiments (Osipova & Soktin, 2006; Potapovet al., 2007). Despite the possibility of hybridizationbetween the two species, hybrids were not evidencedin our data: all specimens clearly shared typical bankvole morphology, whereas modern hybrids would havebeen expected to be morphologically intermediatebetween parental forms (e.g. Albertson & Kocher,2005). The absence of such intermediate hybridshapes suggests that either hybridization is very rarein the wild, or that hybrids are strongly counter-selected compared with parental species (Arnold &Hodges, 1995). Hence, the occurrence of M. rutilus
mtDNA within the Ural bank vole might be the resultof an ancient hybridization process, as observed in themountain hare (Melo-Ferreira et al., 2005). Our dataon size suggest another, non-exclusive scenario. Theconvergence in size between Ural M. glareolus and M.
rutilus was interpreted to be the result of a selectiveadvantage of an M. rutilus-like size together with M.
rutilus mtDNA in a northern environment. This doesnot exclude the occurrence of a disruptive selectionfavouring either the M. rutilus or the M. glareolus
phenotype for features coded by nuclear DNA. A selec-tion of the red vole mtDNA might therefore occurwithout much introgression of the nuclear genome(Potapov et al., 2007).
As a conclusion, morphometric analyses cancomplement phylogenetic analyses. Two scenarios ofpost-glacial expansion were evidenced depending onthe lineage: endemism of the Mediterranean lineages,characterized by a high morphological interlineagesdivergence, and a differentiation between the Western
and Eastern European lineages despite a low geneticdivergence and a large area of sympatry.
Moreover, if the Ural lineage was defined on thebasis of mtDNA, molecular analyses based on mtDNAwere not able to describe its history because of anintrogression from M. rutilus to M. glareolus. In thiscontext, morphological data efficiently complementedgenetic data, and confirmed the introgression of M.
rutilus mtDNA into an otherwise M. glareolus
genome. They also suggested the Eastern group as itsclosest relative and hence provide insight into thetemporal dynamics that led to the emergence of thecomplex Ural lineage.
ACKNOWLEDGEMENTS
We would like to thank Jean-Pierre Quéré andPascale Chevret for their great support and criticalcomments on this manuscript, and ChristelleTougard, Elodie Renvoisé, and an anonymousreviewer for their useful comments. We are verygrateful to R. Libois, C. Nieberding, T. Basillo, V.Ivashkina, J. Niemimaa, L. Popa, R. Rosoux, and O.Osipova for their contribution to the sampling work.This work benefited from the support of the GDR2474 ‘Morphométrie et Evolution des Formes’, fromthe Rhône-Alpes Emergence programme, and fromthe Belgian FRS-FNRS.
REFERENCES
Albertson RC, Kocher TD. 2005. Genetic architecture setslimits on transgressive segregation in hybrid cichlid fishes.Evolution 59: 686–690.
Arnold ML, Hodges SA. 1995. Are natural hybrids fit orunfit relative to their parents? Trends in Ecology and Evo-
lution 10: 67–71.Austin JD, Lougheed SC, Neidrauer L, Chek AA, Boaga
PT. 2002. Cryptic lineages in a small frog: the post-glacialhistory of the spring peeper, Pseudacris crucifer (Anura:Hylidae). Molecular Phylogenetics and Evolution 25: 316–329.
Avise JC. 2000. Phylogeography: the history and formation of
species. Cambridge: Harvard University Press, 1–464.Barnes I, Matheus P, Shapiro B, Jensen D, Cooper A.
2002. Dynamics of Pleistocene Population Extinctions inBeringian Brown Bears. Science 295: 2267–2270.
Barnosky AD. 1993. Mosaic evolution at the population levelin Microtus pennsylvaticus. In: Martin RA, Barnosky AD,eds. Morphological change in Quaternary mammals of
North America. Cambridge University Press, 24–58.Bauchau V, Chaline J. 1987. Variabilité de la troisième
molaire supérieure de Clethrionomys glareolus (Arvicolidae,Rodentia) et sa signification évolutive. Mammalia 51: 587–598.
692 R. LEDEVIN ET AL.
© 2010 The Linnean Society of London, Biological Journal of the Linnean Society, 2010, 100, 681–694

Bergmann C. 1847. Über die Verhältnisse der Wärmeökon-omie der Thiere zu ihrer Grösse. Gottinger Studien 3: 595–708.
Bilton DT, Mirol PM, Mascheretti S, Fredga K, Zima J,
Searle JB. 1998. Mediterranean Europe as an area ofendemism for small mammals rather than a source fornorthwards postglacial colonization. Proceedings of the
Royal Society of London 265: 12919–12926.Bookstein FL. 1991. Morphometric tools for landmark data:
geometry and biology. Cambridge: Cambridge UniversityPress, 1–414.
Boratynski Z, Koskela E, Mappes T. 2009. The effect ofmtDNA introgression on phenotype – body mass and basalmetabolic rate. 12th Congress European Society for Evolu-tionary Biology. Abstract with program, 24–36 poster.
Carstens BC, Knowles LL. 2007. Shifting distributions andspeciation: species divergence during rapid climate change.Molecular Ecology 16: 619–627.
Caumul R, Polly PD. 2005. Phylogenetic and environmentalcomponents of morphological variation : skull, mandible andmolar shape in marmots (Marmota, Rodentia). Evolution
59: 2460–2472.Chaline J, Brunet-Lecomte P, Montuire S, Viriot L,
Courant F. 1999. Anatomy of the arvicoline radiation(Rodentia): palaeogeographical, palaeoecological history andevolutionary data. Annales Zoologici Fennici 36: 239–267.
Conroy CJ, Cook JA. 1999. MtDNA Evidence for RepeatedPulses of Speciation Within Arvicoline and Murid Rodents.Journal of Mammalian Evolution 6: 221–245.
Crampton JS. 1995. Elliptic Fourier shape analysis of fossilbivalves: some practical considerations. Lethaia 28: 179–186.
Deffontaine V, Ledevin R, Fontaine MC, Quéré JP,
Renaud S, Libois R, Michaux JR. 2009. A relict bankvole lineage highlights the biogeographic history of thePyrenean region in Europe. Molecular Ecology 18: 2489–2502.
Deffontaine V, Libois R, Kotlík P, Sommer R, Nieberd-
ing C, Paradis E, Searle JB, Michaux JR. 2005. Beyondthe Mediterranean peninsulas: evidence of central Euro-pean glacial refugia for a temperate forest mammal species,the bank vole (Clethrionomys glareolus). Molecular Ecology
14: 1727–1739.Ellison GTH, Taylor PJ, Nix HA, Bronner GN, McMahon
JP. 1993. Climatic adaptation of body size among pouchedmice (Saccostomus campestris: Cricetidae) in the southernAfrican subregion. Global Ecology and Biogeography Letters
3: 41–47.Erlinge S. 1987. Why do European stoats Mustela erminea
not follow Bergmann’s rule? Holarctic Ecology 10: 33–39.Felsenstein J. 1981. Evolutionary trees from DNA
sequences: a maximum likelihood approach. Journal of
Molecular Evolution 17: 368–376.Ferson S, Rohlf FJ, Koehn R. 1985. Measuring shape
variation of two-dimensional outlines. Systematic Zoology
34: 59–68.Garnier S, Magniez-Jannin F, Rasplus J-Y, Alibert P.
2005. When morphometry meets genetics: inferring thephylogeography of Carabus solieri using Fourier analyses of
pronotum and male genitalia. Journal of Evolutionary
Biology 18: 269–280.Good JM, Demboski JR, Nagorsen DW, Jack S. 2003.
Phylogeography and Introgressive Hybridization: Chip-munks (Genus: Tamias) in the Northern Rocky Mountains.Evolution 57: 1900–1916.
Guérécheau A, Ledevin R, Henttonen H, Deffontaine V,
Michaux JR, Chevret P, Renaud S. 2010. Seasonalvariation in molar outline of bank voles: An effect of wear?Mammalian Biology 75: 311–319.
Guindon S, Gascuel O. 2003. A simple fast and accuratealgorithm to estimate large phylogenies by maximum like-lihood. Systematic Biology 52: 696–704.
Hadly EA, Kohn MH, Leonard JA, Wayne RK. 1998. Agenetic record of population isolation in pocket gophersduring Holocene climatic change. Proceedings of the
National Academy of Sciences, USA 95: 6893–6896.Hewitt GM. 2000. The genetic legacy of the Quaternary ice
ages. Nature 405: 907–913.Jaarola M, Searle JB. 2004. A highly divergent mitochon-
drial DNA lineage of Microtus agrestis in southern Europe.Heredity 92: 228–234.
Jockusch E, Wake DB. 2002. Falling apart and merging:diversification of slender salamanders (Plethodontidae:Batrachoseps) in the American West. Biological Journal of
the Linnean Society 76: 361–391.Kaneko Y. 1992. Identification and Morphological Character-
istics of Clethrionomys rufocanus, Eothenomys shanseius, E.
inez and E. eva from the USSR, Mongolia, and Northern andCentral China. Journal of Mammalian Society of Japan 16:
71–95.Kavanagh KD, Evans AR, Jernvall J. 2007. Predicting
evolutionary patterns of mammalian teeth from develop-ment. Nature 449: 427–432.
Kimura M. 1981. Estimation of evolutionary distancesbetween homologous nucleotide sequences. Proceedings of
the National Academy of Sciences, USA 78: 454–458.Kitahara E. 1995. Taxonomic status of Anderson’s red-
backed vole on the Kii peninsula, Japan, based on skull anddental characters. Journal of Mammalian Society of Japan
20: 9–28.Kotlík P, Deffontaine V, Mascheretti S, Zima J, Michaux
JR, Searle JB. 2006. A northern glacial refugium for bankvoles (Clethrionomys glareolus). Proceedings of the National
Academy of Sciences, USA 103: 14860–14864.Kuhl FP, Giardina CR. 1982. Elliptic Fourier features of a
closed contour. Computer Graphics and Image Processing
18: 259–278.Lugon-Moulin N, Hausser J. 2002. Phylogeographical
structure, postglacial recolonization and barriers to geneflow in the distinctive Valais chromosome race of thecommon shrew (Sorex araneus). Molecular Ecology 11: 785–794.
Luo J, Yang D, Suzuki H, Wang Y, Chene W-J, Camp-
bell KL, Zhang Y-P. 2004. Molecular phylogeny and bio-geography of oriental voles: genus Eothenomys (Muridae,Mammalia). Molecular Phylogenetics and Evolution 3:
349–362.
MORPHOMETRICS OF BANK VOLE MOLARS 693
© 2010 The Linnean Society of London, Biological Journal of the Linnean Society, 2010, 100, 681–694

Marcolini F. 2006. Fourier analysis applied to Mimomys
(Arvicolidae, Rodentia, Mammalia) first Lower molar – bio-chronological implications. Mathematical Geology 38: 667–678.
Martin RA, Crockett CP, Marcolini F. 2006. Variation ofthe schmelzmuster and other enamel characters in molarsof the primitive Pliocene vole Ogmodontomys from Kansas.Journal of Mammalian Evolution 13: 223–241.
Meiri S, Dayan T. 2003. On the validity of Bergmann’s rule.Journal of Biogeography 30: 331–351.
Meiri S, Dayan T, Simberloff D. 2004. Carnivores, biasesand Bergmann’s rule. Biological Journal of the Linnean
Society 81: 579–588.Melo-Ferreira J, Boursot P, Suchentrunk F, Ferrand N,
Alves PC. 2005. Invasion from the cold past: extensiveintrogression of mountain hare (Lepus timidus) mitochon-drial DNA into three other hare species in northern Iberia.Molecular Ecology 14: 2459–2464.
Michaux J, Chevret P, Renaud S. 2007. Morphologicaldiversity of Old World rats and mice (Rodentia, Muridae)mandible in relation with phylogeny and adaptation.Journal of Zoological Systematics and Evolutionary
Research 45: 263–279.Mikulová P, Frynta D. 2001. Test of character displacement
in urban populations of Apodemus sylvaticus. Canadian
Journal of Zoology 79: 794–801.Navarro N, Zatarain X, Montuire S. 2004. Effects of mor-
phometric descriptor change on statistical classification andmorphospaces. Biological Journal of the Linnean Society 83:
243–260.Osipova OV, Soktin AA. 2006. Bank and red vole hybrid-
ization under experimental conditions. Doklady Biological
Sciences 410: 381–383.Posada D, Crandall KA. 1998. Modeltest: testing the model
of DNA substitution. Bioinformatics 14: 817–818.Potapov SG, Illiarionova NA, Andreeva TA, Baskevitch
MI, Okulova NM, Lavrenchenko LA, Orlov VN. 2007.
Transfer of Mitochondrial Genome of the Northern Red-backed Vole (Clethrionomys rutilus) to the Bank Vole(Clethrionomys glareolus) in Northwestern Europe. Doklady
Biological Sciences 417: 435–438.Renaud S, Chevret P, Michaux J. 2007. Morphological
vs. molecular evolution: ecology and phylogeny both shapethe mandible of rodents. Zoologica Scripta 36: 525–535.
Renaud S, Michaux JR. 2007. Mandibles and molars of thewood mouse, Apodemus sylvaticus (L.): integrated latitudi-nal signal and mosaic insular evolution. Journal of Bio-
geography 34: 339–355.Renaud S, Michaux J, Jaeger J-J, Auffray J-C. 1996.
Fourier analysis applied to Stephanomys (Rodentia,Muridae) molars: nonprogressive evolutionary pattern in agradual lineage. Paleobiology 22: 255–265.
Renaud S, Millien V. 2001. Intra- and interspecific morpho-logical variation in the field mouse species Apodemus argen-
teus and A. speciosus in the Japanese archipelago: the roleof insular isolation and biogeographic gradients. Biological
Journal of the Linnean Society 74: 557–569.Renvoisé E, Evans AR, Jebrane A, Labruère C, Laffont
R, Montuire S. 2009. Evolution of mammal toothpatterns : new insights from a developmental predictionmodel. Evolution 63: 1327–1340.
Rohlf FJ. 1990. Fitting curves to outlines. In: Rohlf FJ,Bookstein FL, eds. proceedings of the michigan morphomet-
rics workshop. Spec. Publ. 2. University of MichiganMuseum of Zoology: Ann Arbor, 169–176.
Rohlf FJ. 2000. NTSYS-pc, numerical taxonomy and multi-
variate analysis system. New York: Exeter Software.Rohlf FJ, Archie JW. 1984. A comparison of Fourier
methods for the description of wing shape in mosquitoes(Diptera: Culicidae). Systematic Zoology 33: 302–317.
Rychlik L, Ramalhinho G, Polly PD. 2006. Response toenvironmental factors and competition: skull, mandible andtooth shapes in Polish water shrews (Neomys, Soricidae,Mammalia). Journal of Zoological Systematics and Evolu-
tionary Research 44: 339–351.Sommer RS, Benecke N. 2005. The recolonization of Europe
by brown bears Ursus arctos Linnaeus, 1758 after the LastGlacial Maximum. Mammal Review 35: 156–164.
Sundell J, Norrdahl K. 2002. Body size-dependent refugesin voles: an alternative explanation of the Chitty effect.Annales Zoologici Fennici 39: 325–333.
Tamura K, Dudley J, Nei M, Kumar S. 2007. MEGA4:Molecular Evolutionary Genetics Analysis (MEGA) softwareversion 4.0. Molecular Biology and Evolution 24: 1596–1599.
Tegelström H. 1987. Transfer of mitochondrial DNA from thenorthern red-backed vole (Clethrionomys rutilus) to thebank vole (C. glareolus). Journal of Molecular Ecology 24:
218–227.Tougard C, Brunet-Lecomte P, Fabre M, Montuire S.
2008. Evolutionary history of two allopatric Terricola
species (Arvicolinae, Rodentia) from molecular, morphologi-cal, and palaeontological data. Biological Journal of the
Linnean Society 93: 309–323.Wilson DE, Reeder DM. 2005. Mammal species of the world,
a taxonomic and geographic reference, Vol. 1–2. Baltimore,Maryland: The Johns Hopkins University Press, 1-2142.
Yom-Tov Y, Geffen E. 2006. Geographic variation in bodysize: the effects of ambient temperature and precipitation.Oecologia 148: 213–218.
Zalewski A. 2005. Geographical and seasonal variation infood habits and prey size of European pine martens. In:Harrison DJ, Fuller AK, Proulx G, eds. Martens and fishers
(martes) in human-altered environments. Springer Science& Business Media: Springer-Verlag, 77–98.
694 R. LEDEVIN ET AL.
© 2010 The Linnean Society of London, Biological Journal of the Linnean Society, 2010, 100, 681–694