evidence of chaos in the rainfall-runoff process
TRANSCRIPT
Full Terms & Conditions of access and use can be found athttp://www.tandfonline.com/action/journalInformation?journalCode=thsj20
Download by: [46.195.18.72] Date: 12 December 2015, At: 14:05
Hydrological Sciences Journal
ISSN: 0262-6667 (Print) 2150-3435 (Online) Journal homepage: http://www.tandfonline.com/loi/thsj20
Evidence of chaos in the rainfall-runoff process
BELLIE SIVAKUMAR , RONNY BERNDTSSON , JONAS OLSSON & KENJI JINNO
To cite this article: BELLIE SIVAKUMAR , RONNY BERNDTSSON , JONAS OLSSON & KENJI JINNO(2001) Evidence of chaos in the rainfall-runoff process, Hydrological Sciences Journal, 46:1,131-145, DOI: 10.1080/02626660109492805
To link to this article: http://dx.doi.org/10.1080/02626660109492805
Published online: 29 Dec 2009.
Submit your article to this journal
Article views: 258
View related articles
Citing articles: 32 View citing articles
Ilydrological Sciences-Journal-des Sciences Hydrologiques, 46( 1 ) February 2001 131
Evidence of chaos in the rainfall-runoff process
BELLIE SIVAKUMAR Department of Land, Air, and Water Resources, University of California, Davis, California 95616, USA e-mail: shellic(g*ucdavis.edu
RONNY BERNDTSSON Department of Water Resources Engineering, Lund University, PC) Box 118, S-22100 Lund, Sweden e-mail: [email protected]
JONAS OLSSON & KENJI JINNO Institute of Environmental Systems, Kyushu University, Fukuoka 812-8581, Japan e-mail: ionas ("Hosa.civil.kviishu-u.ac.jp; jinno(gHosa. ci vil.kvushu-u.ac.jp
Abstract The transformation of rainfall into runoff is one of the most important processes in hydrology. In the past few decades, a wide variety of automated or computer-based approaches have been applied to model this process. However, many such approaches have an important limitation in that they treat the rainfall-runoff process as a realization of only a few parameters of linear relationships rather than the process as a whole. What is required, therefore, is an approach that can capture not only the overall appearance but also the intricate details of the nonlinear behaviour of the process. The purpose of this study is to investigate the possibility of understanding the dynamics of the rainfall-runoff process from a new perspective, as a chaotic process. The possible existence of chaotic behaviour in the rainfall-runoff process is studied by investigating the rainfall and runoff time series: (a) separately; and (b) jointly (using the runoff coefficient). Monthly rainfall and runoff observed over a period of 131 years (January 1807-December 1937) at the Gôta River basin in the south of Sweden are analysed. The correlation dimension method is employed to identify the presence of chaos. The correlation dimensions obtained for the rainfall and runoff time series are 6.4 and 5.5, respectively. The finite dimensions obtained for the rainfall and runoff time series indicate the possible existence of chaos in these processes, implying that the joint rainfall-runoff process might also exhibit chaotic behaviour. The correlation dimension of about 7.8 obtained for the runoff coefficient also indicates the possible presence of chaos and supports the above results.
Key words rainfall-runoff models; runoff coefficient; chaotic dynamics; Gôta River. Sweden; nonlinear analysis; time series analysis; correlation dimension
Preuve de l'existence de chaos dans le processus pluie-débit Résumé La transformation de la pluie en débit est l'un des plus importants processus hydrologiques. Au cours des dernières décennies un grand nombre d'approches automatisées ou informatisées ont été mises en œuvre pour modéliser ce processus. Ces approches demeurent toutefois limitées, car elles traitent le processus pluie-débit comme dépendant de quelques paramètres attachés à des relations linéaires au lieu de considérer ce processus comme un tout. Une approche permettant de saisir non seulement les grands traits du processus mais aussi la complexité des détails résultant de son comportement non linéaire est nécessaire. Le but de la présente étude est de chercher à comprendre la dynamique du processus pluie-débit dans une nouvelle perspective, celle des processus chaotiques. On a cherché à mettre en évidence l'existence éventuelle d'un comportement chaotique en étudiant des séries chronologiques de pluies et de débits: (a) séparément; et (b) conjointement (en utilisant le coefficient de ruissellement). Nous avons étudié les pluies et les débits mensuels observés pendant une période de 131 ans (Janvier 1807-Décembre 1937) sur le bassin de la rivière Gôta dans la partie méridionale de la Suède. La méthode de la dimension
Open for discussion until I August 2001
Dow
nloa
ded
by [
46.1
95.1
8.72
] at
14:
05 1
2 D
ecem
ber
2015
132 Bellie Sivakumar et ai
de corrélation a été utilisée pour déceler l'existence du chaos. Les dimensions estimées pour la pluie et le débit ont été respectivement égales à 6.4 et à 5.5, ce qui indique la possibilité d'existence de chaos dans les processus correspondants et pourrait impliquer que le processus conjoint pluie-débit soit également chaotique. La dimension de corrélation proche de 7.8 obtenue pour le coefficient de corrélation conforte les résultats précédents.
Mots clefs modèles pluie-débit; coefficient de ruissellement; dynamique chaotique; Rivière Gota, Suède; analyse non-linéaire; analyse de séries chronologiques; dimension de corrélation
INTRODUCTION
Understanding the dynamics of the rainfall-runoff process constitutes one of the most important problems in hydrology, with obvious relevance for the management of water resources. Adequate knowledge of the rainfall-runoff process is needed for, among other things, (a) optimal design of water storage and drainage networks; (b) management of extreme events, such as floods and droughts; and (c) determination of the rate of pollution transport.
During the past few decades, a great deal of research has been devoted to the development of approaches to understand the dynamics of the rainfall-runoff process and significant progress has been achieved (e.g. Sorooshian & Gupta, 1983; Duan et al, 1992). Notwithstanding the progress, most of these approaches, e.g. stochastic modelling, are based on the assumption that the process can be described by only a few statistical features of the parameters involved, rather than by the process as a whole. Also, such stochastic approaches are based on the beliefs that: (a) the rainfall-runoff process is influenced by random phenomena and, therefore, is stochastic; (b) small distortions in the data have little or no effect on the ability to predict; and (c) the modelling (and calibration) problem would simply disappear with the availability of more field measurements. Such beliefs have now become obvious questions with the advent of chaos theory, which recognizes that: (a) seemingly highly irregular behaviour may be the result of a simple deterministic system with a few nonlinear interdependent variables; (b) small initial distortions might grow exponentially and, therefore, details may be quite important; and (c) the availability of more data may not solve the modelling problem.
The advent of chaos theory has created concerns among the hydrological community that stochastic approaches, which have been employed over the years to model hydrological processes (such as rainfall, runoff, and rainfall-runoff), might have limitations. The observation of chaotic behaviour in hydrological processes (e.g. Hense, 1987; Rodriguez-Iturbe et al, 1989; Sharifi et al, 1990; Islam et al, 1993; Tsonis et al, 1993; Berndtsson et al, 1994; Jayawardena & Lai, 1994; Georgakakos et al, 1995; Porporato & Ridolfi, 1996, 1997; Puente & Obregon, 1996; Sangoyomi et al, 1996; Sivakumar, 1999; Sivakumar et al, 1999; Stehlik, 1999; Krasovskaia et al, 1999) supports such concerns. Following the ideas gained from chaos theory, and the fact that hydrological processes could possess chaotic dynamics, it is reasonable to conjecture that any small disturbances (or errors) in the initial conditions, say, in rainfall, could ultimately undermine one's ability to model and predict long-term dynamics of the rainfall-runoff process. What is required, therefore, is an approach that seeks to understand the whole and unique rainfall-runoff process, capturing not only the overall appearance of the records (in a smooched fashion), but also the
Dow
nloa
ded
by [
46.1
95.1
8.72
] at
14:
05 1
2 D
ecem
ber
2015
Evidence of chaos in the rainfall—runoff process 133
intricate details of the (nonlinear) rainfall-runoff process explicitly. In this regard, the notion of chaos theory and the related methods of nonlinear dynamics could provide a suitable alternative. The aim of this study is to investigate whether the dynamics of the rainfall-runoff process could be understood from a chaotic dynamic perspective.
Although the ideas gained from chaos theory have found their applications in various hydrological processes, such as rainfall and runoff, to the authors' knowledge, none of the studies thus far have attempted to apply them to the process of transformation of rainfall into runoff. The past studies investigating the existence of chaos in rainfall and runoff processes analysed time series observed in different basins in the same or different geographical locations. In other words, the studies have been limited either to the rainfall process alone (e.g. Hense, 1987; Rodriguez-Iturbe et al, 1989; Sharifi et al., 1990; Islam et al, 1993; Tsonis et al, 1993; Berndtsson et al, 1994; Jayawardena & Lai, 1994; Georgakakos et al, 1995; Puente & Obregon, 1996; Sivakumar, 1999; Sivakumar et al, 1999a), or to the runoff process alone (e.g. Jayawardena & Lai, 1994; Porporato & Ridolfi, 1996, 1997; Liu et al, 1998; Wang & Gan, 1998, Stehlik, 1999; Krasovskaia et al, 1999), but not to the rainfall-runoff process as a whole in a basin. As a result, none of these studies could provide information regarding the possibility of the existence of chaotic behaviour in the rainfall-runoff process in a particular basin. The purpose of this study is to attempt to address this issue. Both the rainfall and runoff time series observed in the same catchment, the Gôta River basin in the south of Sweden, are analysed to investigate the possibility of the existence of chaos in the rainfall-runoff process. First, the (chaotic) behaviour of the dynamics of the rainfall and runoff time series is investigated separately. The underlying assumption is that the individual behaviour of the dynamics of the rainfall (input) and the runoff (output) processes could provide important information about the behaviour of the dynamics of the joint rainfall-runoff process. The runoff coefficient is considered as the parameter connecting rainfall and runoff and, therefore, representing the joint rainfall-runoff process. The correlation dimension method (e.g. Grassberger & Procaccia, 1983a,b) is employed to investigate the presence of chaos.
The organization of this paper is as follows. First, the con-elation dimension method employed herein to investigate chaos is reviewed. Details of the study area and data considered are furnished. Then the analyses of the data using the correlation dimension method and a discussion of the results are presented. Finally, the important conclusions drawn from this study and the scope for further research are discussed.
THE CORRELATION DIMENSION METHOD
The dimension of a time series is a representation of its variability or irregularity. The correlation dimension measures the extent to which the presence of a data point affects the position of the other points lying on the attractor (a geometric object which characterizes the long-term behaviour of a system in the phase-space). The correlation dimension method uses the correlation integral (or function) to distinguish chaotic and stochastic systems. Although there exist many algorithms for the computation of the con-elation dimension of a time series, the Grassberger-Procaccia algorithm (Grassberger & Procaccia, 1983a,b) has been the most widely employed, particularly
Dow
nloa
ded
by [
46.1
95.1
8.72
] at
14:
05 1
2 D
ecem
ber
2015
134 Bellie Sivakumar et al.
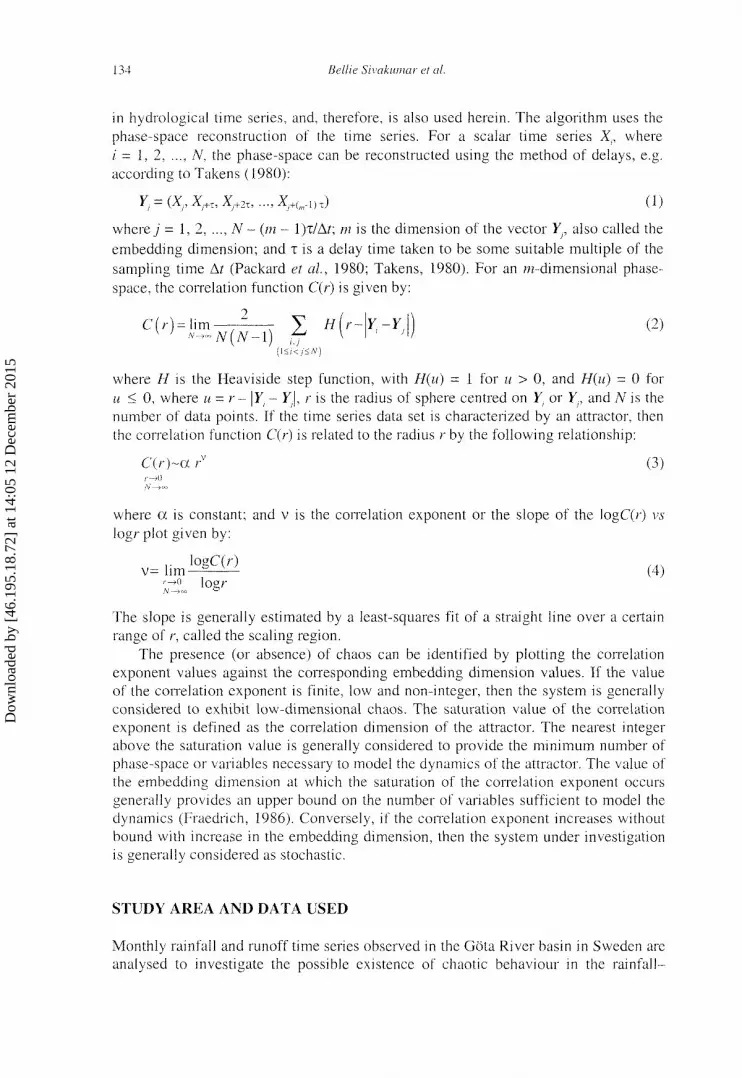
in hydrological time series, and, therefore, is also used herein. The algorithm uses the phase-space reconstruction of the time series. For a scalar time series X.t, where /' = 1,2, ..., N, the phase-space can be reconstructed using the method of delays, e.g. according to Takens (1980):
F = (Xr X.+T, Xj+2x, •••, Xj+(nri) T) ( 1 )
where./ = 1, 2, ..., N - (in - l)x/À?; m is the dimension of the vector Y also called the embedding dimension; and T is a delay time taken to be some suitable multiple of the sampling time At (Packard et al, 1980; Takens, 1980). For an m-dimensional phase-space, the correlation function C(r) is given by:
C(r )= l i m — r ? — - Y / / ( r - | F - F I) (2)
(l<i<j<N)
where H is the Heaviside step function, with H(u) = 1 for u > 0, and H(u) = 0 for u < 0, where u = r— \Y.. - F|, r is the radius of sphere centred on F or Y, and A' is the number of data points. If the time series data set is characterized by an attractor, then the correlation function C(r) is related to the radius r by the following relationship:
C(r)~a rv (3)
where a is constant; and v is the correlation exponent or the slope of the logC(r) vs logr plot given by:
,. logC(r) ... v= hm fa — (4)
The slope is generally estimated by a least-squares fit of a straight line over a certain range of r, called the scaling region.
The presence (or absence) of chaos can be identified by plotting the correlation exponent values against the corresponding embedding dimension values. If the value of the correlation exponent is finite, low and non-integer, then the system is generally considered to exhibit low-dimensional chaos. The saturation value of the correlation exponent is defined as the correlation dimension of the attractor. The nearest integer above the saturation value is generally considered to provide the minimum number of phase-space or variables necessary to model the dynamics of the attractor. The value of the embedding dimension at which the saturation of the correlation exponent occurs generally provides an upper bound on the number of variables sufficient to model the dynamics (Fraedrich, 1986). Conversely, if the correlation exponent increases without bound with increase in the embedding dimension, then the system under investigation is generally considered as stochastic.
STUDY AREA AND DATA USED
Monthly rainfall and runoff time series observed in the Gôta River basin in Sweden are analysed to investigate the possible existence of chaotic behaviour in the rainfall-
Dow
nloa
ded
by [
46.1
95.1
8.72
] at
14:
05 1
2 D
ecem
ber
2015

Evidence of chaos in the rainfall-runoff'process 135
runoff process. The Gôta River basin is located in the south of Sweden, approximately between 58° and 60°N and 13° and 16°E. The total area of the basin is about 50 132 km", with a lake percentage of 18.6%. The climate in this region varies between boreal and more temperate, without a frequently recurring permanent snow cover during winter.
Rainfall and runoff time series observed over a period of 131 years (January 1807— December 1937) are investigated. The runoff comes from natural and unregulated conditions. It is appropriate to note, at this point, that recent studies have shown that noise (e.g. measurement error) affects the performance of many techniques of identification, modelling, and prediction of deterministic chaotic systems (e.g. Schreiber & Kantz, 1996; Kantz & Schreiber, 1997). For example, the presence of noise may result in an overestimation of the correlation dimension. The influence of measurement error on the estimates of the correlation dimension and nonlinear prediction has been studied by Porporato & Ridolfi (1997) for river-flow time series, and by Sivakumar et al. (1999b) for rainfall time series. The studies by Sivakumar (1999, 2000) reveal that while the presence of small levels of noise significantly influences the prediction accuracy estimates, the correlation dimension estimates do not seem to be significantly influenced, even when the noise levels are high. This suggests that the correlation dimension method may be used as a preliminary approach for the investigation of the existence of chaos in hydrological data, before attempting detailed analysis such as application of noise reduction procedures. In this context, no attempt is made, in the present study, to reduce the noise present in the rainfall and runoff time series, and the raw data are analysed.
On the other hand, it is believed that the estimation of the correlation dimension requires a large number of data points (data size). Such a belief is based on the assumption that the data size required (to observe a large scaling region in the logC(r) v\v logr plots) is a function of the embedding dimension used to obtain the vectors by phase-space reconstruction (e.g. Nerenberg & Essex, 1990). However, this is not entirely true, since the data size required may largely depend on the dynamics of the phenomenon. In practice, for a particular data size, the number of reconstructed vectors may not differ much whether an embedding dimension of, for example, 4 or 10 is used and, therefore, the dimension estimate may not be influenced much. For example, according to Nerenberg & Essex (1990), for a 4 and 10-dimensional embedding phase-space the number of points required is respectively about 4000 (102+04 4) and 1000 000 (102+04>10). However, a fairly accurate estimation of the con-elation dimension can be obtained with as low as 5000 points even for an embedding dimension of 10, as a large scaling region can be evident (see Sivakumar (2000) for further details). These observations suggest that the data size may not be a function of the embedding dimension. Also, a recent study by Sivakumar el al. (submitted) investigated the reliability of the correlation dimension estimation in short hydro-logical time series, by evaluating its accuracy using the prediction results obtained from two methods: (a) the phase-space reconstruction method; and (b) the artificial neural networks technique. The results reveal that the accuracy of the correlation dimension depends primarily on whether the length of the time series would be sufficient to represent the changes that the system undergoes over a period of time, rather than the data size in terms of the number of values in the time series. This suggests that the correlation dimension could be a reliable indicator of low-
Dow
nloa
ded
by [
46.1
95.1
8.72
] at
14:
05 1
2 D
ecem
ber
2015
136 Bellie Sivakumar et al.
dimensional chaos in short hydrological time series. The authors contend that the rainfall and runoff series analysed herein, with a 131-year monthly record, is sufficient to reasonably represent the changes in the system with time.
ANALYSES, RESULTS AND DISCUSSION
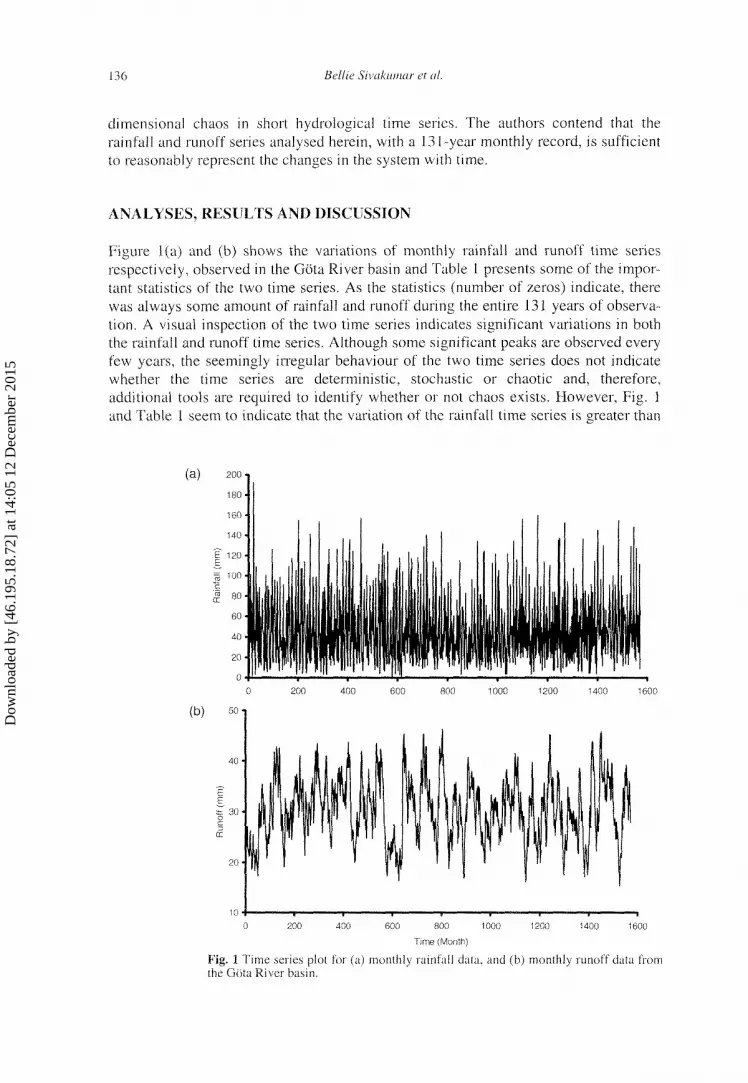
Figure 1(a) and (b) shows the variations of monthly rainfall and runoff time series respectively, observed in the Gôta River basin and Table 1 presents some of the important statistics of the two time series. As the statistics (number of zeros) indicate, there was always some amount of rainfall and runoff during the entire 131 years of observation. A visual inspection of the two time series indicates significant variations in both the rainfall and runoff time series. Although some significant peaks are observed every few years, the seemingly irregular behaviour of the two time series does not indicate whether the time series are deterministic, stochastic or chaotic and, therefore, additional tools are required to identify whether or not chaos exists. However, Fig. 1 and Table 1 seem to indicate that the variation of the rainfall time series is greater than
600
600 800 1000
Time (Month)
Fig. 1 Time series plot for (a) monthly rainfall data, and (b) monthly runoff data from the Gota River basin.
Dow
nloa
ded
by [
46.1
95.1
8.72
] at
14:
05 1
2 D
ecem
ber
2015

Evidence of chaos in the rainfall-runoff process 137
Table 1 Statistics of rainfall and runoff data observed at the Gota River basin.
Parameter
Number of data Mean Standard deviation Variance Maximum value Minimum value Number of zeros
Rainfall (mm)
1572 45,61 28.81
830,28 192.50
1.00 0
Runoff (mm
1572 30.53
6.15 37.79 46.30 15.40 0
that of the runoff time series, suggesting that the rainfall time series may yield a higher dimension than that of the runoff time series. In the following, the analyses of the time series using the correlation dimension method (and the autocorrelation function as well) are presented together with the results obtained.
The correlation functions and hence the exponents are computed, as explained earlier, for the monthly rainfall and runoff time series. The delay time, x, for the phase-space reconstruction, is computed using the autocorrelation function method, and is taken as the lag time at which the autocorrelation function first crosses the zero line (e.g. Holzfuss & Mayer-Kress, 1986). The autocorrelation function, r(x), for different lag time values t, is calculated according to, for example, Tsonis (1992):
1 ,V-T ;V-T
r x ;V-T , / ,v-t v y x y J J y x
f N-T Y
?x«-^ 2X (5)
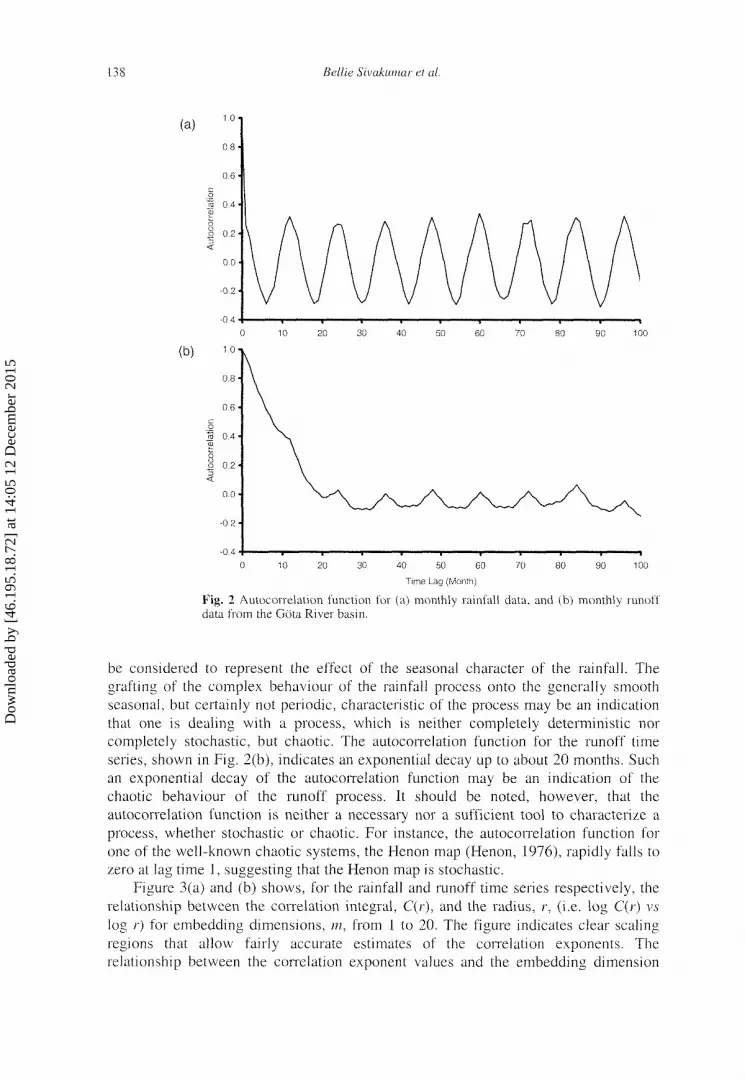
where X, is the (discrete) time series, with ; - 1, 2, ..., N. Figure 2(a) and (b) shows the variations of the autocorrelation function against the lag time for the rainfall and runoff time series, respectively. The first zero values which the autocorrelation function attains are at lag times 3 and 20 respectively and, therefore, these values are used as the delay time in the phase-space reconstruction.
It is relevant to note at this point, that the autocorrelation function is also useful in determining the degree of dependence present in the values of a time series and, thus, in identifying the behaviour of the time series. For a purely random process, the autocorrelation function fluctuates about zero, indicating that the process at any certain instance has no "memory" of the past at all. For a periodic process, the autocorrelation function is also periodic, indicating the strong relationship between values that repeat over and over again. The autocorrelation function of a signal from a chaotic process decays exponentially with increasing lag, because the states of a chaotic process are neither completely dependent (i.e. deterministic) nor completely independent (i.e. stochastic) of each other (e.g. Tsonis, 1992). The autocorrelation function for the rainfall time series, shown in Fig. 2(a), with a lag time of about 3-6 months, suggests that the rainfall series may not be stochastic. However, it is important to underline that the initial abrupt fall of the autocorrelation function may be an indication of a complex behaviour, characterized by a time scale of about 3-6 months. On the other hand, the regular behaviour of the autocorrelation function after the initial abrupt behaviour may
Dow
nloa
ded
by [
46.1
95.1
8.72
] at
14:
05 1
2 D
ecem
ber
2015
138 Bellie Sivakumar et al.
(a)
0.8
0.6
(b)
40 SO 60 70 80 90 100
Time Lag (Month)
Fig. 2 Autocorrelation function for (a) monthly rainfall data, and (b) monthly runoff data from the Gota River basin.
be considered to represent the effect of the seasonal character of the rainfall. The grafting of the complex behaviour of the rainfall process onto the generally smooth seasonal, but certainly not periodic, characteristic of the process may be an indication that one is dealing with a process, which is neither completely deterministic nor completely stochastic, but chaotic. The autocorrelation function for the runoff time series, shown in Fig. 2(b), indicates an exponential decay up to about 20 months. Such an exponential decay of the autocorrelation function may be an indication of the chaotic behaviour of the runoff process. It should be noted, however, that the autocorrelation function is neither a necessary nor a sufficient tool to characterize a process, whether stochastic or chaotic. For instance, the autocorrelation function for one of the well-known chaotic systems, the Henon map (Henon, 1976), rapidly falls to zero at lag time 1, suggesting that the Henon map is stochastic.
Figure 3(a) and (b) shows, for the rainfall and runoff time series respectively, the relationship between the correlation integral, C(r), and the radius, r, (i.e. log C(r) vs log r) for embedding dimensions, m, from 1 to 20. The figure indicates clear scaling regions that allow fairly accurate estimates of the correlation exponents. The relationship between the correlation exponent values and the embedding dimension
Dow
nloa
ded
by [
46.1
95.1
8.72
] at
14:
05 1
2 D
ecem
ber
2015

Evidence of chaos in the rainfall-runoff process 139
Fig. 3 LogC(r) vs log/- for (a) monthly rainfall data, and (b) monthly runoff data from the Gôta River basin.
values for the rainfall and runoff time series is shown in Fig. 4(a) and (b), respectively. It can be seen that, for both the time series, the correlation exponent value increases with the embedding dimension up to certain value, and then saturates beyond that value. The saturation of the correlation exponent beyond a certain embedding dimension value is an indication of the existence of deterministic dynamics. The saturation value of the correlation exponent (or correlation dimension) for the rainfall time series is about 6.4 and for the runoff time series is about 5.5. The finite and low con-elation dimensions obtained for the rainfall and runoff time series may be an indication that the two time series exhibit low-dimensional chaotic behaviour.
As mentioned previously, the underlying assumption behind investigating the dynamics of the behaviour of the rainfall and runoff time series separately is that the individual behaviour of the rainfall (input) and the runoff (output) processes could provide important information about the behaviour of the dynamics of the joint rainfall-runoff process. It should be noted, however, that such an assumption may not always be valid and, therefore, the above interpretation needs to be supported further. In this regard, the investigation of any parameter that connects the rainfall and runoff time series could be useful. The present study, therefore, also investigates one such
Dow
nloa
ded
by [
46.1
95.1
8.72
] at
14:
05 1
2 D
ecem
ber
2015

140 Bellie Sivakumar et al.
s-
LU c 4 -o
"S o O
2 -
0 | | i i i i i i i i i
0 2 4 6 8 10 12 14 16 18 20
0 2 4 6 8 10 12 14 16 18 20
Embedding Dimension
Fig. 4 Relationship between correlation exponent and embedding dimension for (a) monthly rainfall data, and (b) monthly runoff data from the Gôta River basin.
parameter, the runoff coefficient, for the existence of chaos to verify the above results, and the details are given below.
The runoff coefficient is given by the ratio of the runoff to the rainfall with a concentration time (between rainfall and runoff). The authors' experience with the Gôta River basin indicates that the concentration time is about 5-6 months. Possible reasons for such a long concentration time could be the following: (a) the large size and the flat nature of the basin; (b) the presence of a large percentage of lakes; and (c) the occurrence of snow and ice over a 3-4 month period. A concentration time of 6 months is used in this study. The variation of the monthly runoff coefficient is shown in Fig. 5(a). The runoff coefficient series is highly variable, and is more variable than rainfall and runoff (Fig. 1), suggesting that the correlation dimension of the runoff coefficient may be higher than that of the rainfall and runoff time series. It is relevant to note, at this point, that not only are several values of the runoff coefficient greater than 1.0, but also the (long-term) mean is. This certainly is in contradiction to the definition of runoff coefficient, as the runoff coefficient should always be less than 1.0. Although one possible reason for this situation could be attributed to an inappropriate selection of the concentration time, it is important to note that similar observations are also made when several other concentration times are considered. Therefore, the problem seems to lie inherently with the resolution of the original data used. With low-
Dow
nloa
ded
by [
46.1
95.1
8.72
] at
14:
05 1
2 D
ecem
ber
2015

Evidence of chaos in the rainfall-runoff process 141
2 ?
E SJ=
3 C
S»
uoi|BiajJoooinv jueuodxg uogeiejjoo
K
II
luspiifOOQ ^ouny (J)0 Boi
H e :
^ fc ^
Dow
nloa
ded
by [
46.1
95.1
8.72
] at
14:
05 1
2 D
ecem
ber
2015
142 Bellie Sivakumar et al.
resolution monthly data, and considering the nature/characteristics of the Gôta basin, such a problem may occur irrespective of the concentration time used. Therefore, it is necessary to find another parameter connecting rainfall and runoff to better represent the rainfall-runoff process. Investigations in this direction are under way, details of which will be reported elsewhere.
Figure 5(b) shows the autocorrelation function for the runoff coefficient series, which indicates a lag time of about 3-6 months, suggesting that the time series may be chaotic. It is interesting to note that the autocorrelation function obtained for the runoff coefficient series seems to have the same trend as that obtained for the rainfall time series (Fig. 2(a)), i.e. an initial abrupt behaviour for about 3-6 months followed by a regular behaviour. Such an observation provides support to the earlier assumption regarding the concentration time of 6 months and its use in the calculation of the runoff coefficient. The first zero value the autocorrelation function attains is at lag time 3 and, therefore, this value is used as the delay time in the phase-space reconstruction.
Figure 5(c) shows the plots of logC(r) vs logr for embedding dimensions from 1 to 20 for the runoff coefficient, whereas the relationship between the correlation exponent values and the embedding dimension values is shown in Fig. 5(d). Saturation of the correlation exponent beyond a certain embedding dimension value is observed for the runoff coefficient series (Fig. 5(d)). The correlation dimension value obtained is about 7.8, suggesting the existence of chaotic behaviour in the runoff coefficient, and possibly also in the rainfall-runoff process.
As previously mentioned, the (correlation) dimension of a time series represents the variability or irregularity of the values in the series. A time series with a high variability provides a higher dimension, which, in turn, indicates the higher complexity of the dynamics of the process. A low dimension would be the result of low variability, indicating the lower complexity of the dynamics of the process. The correlation dimensions obtained in the present study for the rainfall, runoff, and runoff coefficient series, respectively 6.4, 5.5, and 7.8, indicate that the runoff coefficient series is the most variable of the three, whereas the runoff is the least variable. The results support the earlier claim regarding the variability of the processes, from the time series plots, shown in Figs 1(a), (b), and 5(a). Another interesting observation is that, although the autocorrelation functions for the rainfall and runoff coefficient time series, shown in Figs 2(a) and 5(b) have the same trend, significant differences in their correlation dimensions are observed. A possible explanation for this is that the autocorrelation function measures only the linear, rather than nonlinear, dependence between successive points in the time series and, thus, may not be able to capture its nonlinear intricate details (e.g. Frazer & Swinney, 1986), which are captured by the correlation dimension. All these observations indicate the suitability of the correlation dimension as an indicator to represent the variability of the rainfall, runoff, and rainfall-runoff processes.
The correlation dimensions obtained for the rainfall and runoff indicate that the minimum number of variables essential to understand the dynamics of the rainfall and runoff processes is 7 and 6 respectively. It should not be construed, based on the number of variables influencing the rainfall and runoff processes separately (i.e. 7 and 6 respectively), that the number of variables influencing the rainfall-runoff process is. for example, 13 (7+6). It is important to note, however, that any variable influencing the rainfall process may also influence the runoff process and vice versa, as both the
Dow
nloa
ded
by [
46.1
95.1
8.72
] at
14:
05 1
2 D
ecem
ber
2015

Evidence of chaos in the rainfall-runoff process 143
rainfall and runoff processes are components of the hydrological (or meteorological) cycle. This is explained as follows: the variables influencing the rainfall process may be, for example, evaporation, condensation, atmospheric pressure, which are, in turn, influenced by temperature, soil conditions, vegetation conditions, and climatic conditions. The variables influencing the runoff process may be the amount and intensity of rainfall, infiltration, evaporation, and basin characteristics, which are, in turn, influenced by temperature, soil and vegetation conditions. Therefore, the number of variables influencing the rainfall-runoff process may be much fewer than the total of the variables influencing the rainfall and runoff processes separately. At this point, it is not known how many variables influence the rainfall-runoff process and also what these variables may be. However, the correlation dimension of a parameter, such as the runoff coefficient, that connects both the rainfall and runoff, might provide some answers to the above questions. The correlation dimension of about 7.8 obtained for the runoff coefficient series seems to indicate that the number of variables essential to model the rainfall-runoff process is 8. Such a conclusion, however, has to be substantiated with further evidence.
CONCLUSIONS AND SCOPE FOR FURTHER STUDY
The present study was aimed at investigating the possibility of understanding the rainfall-runoff process from a new perspective, the chaotic dynamics perspective. Monthly rainfall and runoff time series observed over a period of 131 years (January 1807-December 1937) at the Gôta River basin in the south of Sweden were analysed separately and jointly (using the runoff coefficient) to investigate the possible existence of chaos in the rainfall-runoff process. The correlation dimension method was employed to identify chaos.
The results indicated a correlation dimension value of about 6.4 for the rainfall time series and about 5.5 for the runoff time series. The observation of finite and low correlation dimensions for the rainfall and runoff time series indicated that the two time series possibly exhibited low-dimensional chaotic behaviour. The analysis of the runoff coefficient, a parameter connecting rainfall and runoff, yielded a correlation dimension of about 7.8. The finite and low correlation dimension obtained for the runoff coefficient indicated the possible presence of chaos in the rainfall-runoff process, supporting the above interpretation. The results from the present study suggested that the dynamics of the rainfall-runoff process could be understood from the ideas gained from the theory of chaos.
Although the results from the present study could not allow one to conclude with a definitive answer regarding the existence of chaotic dynamics in the dynamics of the rainfall-runoff process in the basin, the study indicates that such an existence should not be excluded. It is necessary, therefore, to continue investigation to confirm the existence of a dominant chaotic component in the rainfall-runoff process. Additional chaos identification methods, such as the nonlinear prediction method, may be employed to complete the analysis towards confirming the present results. If confirmed, the presence of chaotic behaviour could provide interesting openings, viewed from a new perspective, for a better comprehension of the mechanism of the rainfall-runoff process. It is relevant to note here that the availability of additional variables (i.e. data),
Dow
nloa
ded
by [
46.1
95.1
8.72
] at
14:
05 1
2 D
ecem
ber
2015

144 Bellie Sivakumar et al.
such as evaporation and infiltration (influenced by, for example, temperature, vegetation and soil characteristics), could be useful in understanding the dynamics of the rainfall-runoff process. If such variables are also found to exhibit chaotic behaviour, then a multivariate time series analysis (e.g. Cao et al, 1998) may be carried out from a chaotic perspective to understand not only the rainfall-runoff process but also the entire water balance in the basin. The possibility of recovering one variable, which may be difficult to measure but is of direct physical interest, from a relatively easily measurable variable in the same dynamic system, has been demonstrated by Abarbanel et al. (1994) by reconstructing the phase-space. Such an approach seems to have a great practical potential in studying the water-balance equation in a basin. All these observations only indicate the possibility (and suitability) of understanding the rainfall-runoff process and the water balance in a basin from the ideas gained from the chaos theory and of extending the application of chaos theory to such problems as well.
REFERENCES
Abarbanel, H. D. I., Carroll, T. A., Pecora, L. M., Sidorowich, J. J, & Tsimring, L. S. (1994) Predicting physical variables in time-delay embedding. Phys. Rev. E. 49(3), 1840-1853.
Berndtsson, R.. Jinno, K., Kawamura, A., Olsson, J. & Xu, S. (I994) Dynamical systems theory applied to long-term temperature and precipitation time series. Trends in l/ydrol. 1, 291-297.
Cao, L., Mees, A. & Judd, K. (1998) Dynamics from multivariate lime scries. Physica D 111, 75-88. Duan, Q-, Sorooshian, S. & Gupta, V. (1992) Effective and efficient global optimization for conceptual rainfall-runoff
models. Wat. Resour. Res. 28(4), 1015-1031. Fraedrich, K. (1986) Estimating the dimensions of weather and climate attractors. J. Armos. Set. 43(5), 419-432. Frazer. A. M. & Svvinney, H. L. (1986) Independent coordinates for strange attractors from mutual information. Phys. Rev.
A. 33(2), 1134-1140. Georgakakos, K. P., Sharifi, M B. & Sturdevant, P. L. (1995) Analysis of high-resolution rainfall data. In: New
Uncertainty Concepts in Hydrology and Water Resourees (ed. by Z. W. Kundzewicz), 114-120. Cambridge Univ. Press, New York, USA.
Grassberger, P. & Procaccia, 1. (1983a) Measuring the strangeness of strange attractors. Physica D 9, 189-208. Grassberger, P. & Procaccia, I. ( 1983b) Characterization of strange attractors. Phys. Rev. Lett. 50(5), 346-349. Henon, M. (1976) A two-dimensional mapping with a strange attraetor. Commun, Math. Phys. 50, 69-77. Hense. A. (1987) On the possible existence of a strange attraetor for the southern oscillation. Beitr. Phys. Almas. 60(1),
34-47. Holzfuss, J. & Mayer-Kress, G. (I986) An approach to error-estimation in the application of dimension algorithms. In:
Dimensions and Entropies in Chaotic Systems (ed. by G. Mayer-Kress), 114-122. Springer-Verlag, New York, USA. Islam, S., Bras, R. L. & Rodriguez-lturbe, I. (1993) A possible explanation for low correlation dimension estimates for the
atmosphere. J. Appl. Met. 32, 203-208. Jayawardcna, A. W. & Lai, F. (1994) Analysis and prediction of chaos in rainfall and stream flow time series. ./- llrilrol.
153, 23-52. Kantz, H. & Sehreiber, T. (1997) Nonlinear Time Series Analysis. Cambridge University Press, Cambridge, UK. Krasovskaia, I., Gottsehalk, L. & Kundzewicz, Z. W. (1999) Dimensionality of Scandinavian river flow regimes. IJvdrol.
Sci. J. 44(5), 705-723. Liu, Q., Islam, S., Rodriguez-lturbe, I. & Le, Y. (1998) Phase-space analysis of daily streamllow: characterization and
prediction. Adv. Wat. Resour. 21, 463-475. Ncrenbere, M. A. H, & Essex, C. (1990) Correlation dimension and systematic eeometric effects. Phys. Rev. A 42(12).
7065-7074. Packard, N. H„ Crutchfield, J. P., Farmer, J. D. & Shaw, R. S. (1980) Geometry from a time series. Phys. Rev. Lett. 45(9),
712-716. Porporato. A. & Ridolfi, L. (1996) Clues to the existence of deterministic chaos in river flow. /;;/. J. Mod. Phvs. IS 10.
1821-1862. Porporato, A. & Ridolfi, L. (1997) Nonlinear analysis of river flow time sequences. Wat. Resour. Res. 33(6), 1353-1367. Puente, C. E. & Obregon, N. (1996) A deterministic geometric representation of temporal rainfall: Results for a storm in
Boston. Wat. Resour. Res 32(9), 2825-2839. Rodriguez-lturbe, I., De Power, F. B., Sharifi, M. B. & Georaakakos, K. P. (1989) Chaos in rainfall. Wat. Resour. Res.
25(7), 1667-1675.
Dow
nloa
ded
by [
46.1
95.1
8.72
] at
14:
05 1
2 D
ecem
ber
2015

Evidence of chaos in the rainfall-runoff process 145
Sangoyomi, T. B., Lall, L. & Abarbanel, H. D. I. (1996) Nonlinear dynamics of the Great Sail Lake: Dimension estimation. Wat: Resour. Res. 32(1), 149-159.
Sehreiber, T. & Kant/,, H. (1996) Observing and predicting chaotic signals: Is 2% noise too much'.' In: Predictability of Complex Dynamical Systems (ed. by Yu. A. Kravtsov &. J. B. Kadtke), 43-65. Springer Series in Synergetics, Springer-Vcrlag, Berlin, Germany.
Sharifi, M. B., Georgakakos, K. P. & Rodriguez-Ilurbe, I. (1990) Evidence of deterministic chaos in the pulse of storm rainfall. J. Atmos. Set. 47, 888-893.
Sivakumar, B. ( 1999) Identification of chaos and influence of noise on prediction: Singapore rainfall. PhD Thesis, Dept of Civil Engng, National University of Singapore, Singapore.
Sivakumar, B. (2000) Chaos theory in hydrology: important issues and interpretations../. Hydro!. 227(1-4), 1-20. Sivakumar, B., Lions, S. Y., Liaw, C. Y. & Phoon, K. K. (1999a) Singapore rainfall behaviour: Chaotic?./. Hydro!. EMC/IC
ASCE 4(1), 38-48. Sivakumar, B., Phoon, K. K., Liong, S. Y. & Liaw, C. Y. (1999b) A systematic approach to noise reduction in chaotic
hydrological time series. J. Ilydrol. 219(3/4), 103-135. Sivakumar, B., Persson, M., Berndlsson, R. & Uvo, C. B. (submitted) Is correlation dimension a reliable indicator of low-
dimensional chaos in short hydrological lime series? Wat. Resour. Res. (submitted). Sorooshian, S. & Gupta, V. K. (1983) Automatic calibration of conceptual rainfall-runoff models: The question of
parameter observability and uniqueness. Wat. Resour. Res. 19(1), 251-259.
Stehlik, J. (1999) Deterministic chaos in runoff series. J. Ilydrol. Hydromeeh. 47(4), 271- 287.
Takcns, F. (1980) Detecting strange attractors in turbulence. In: Dynamical Systems and Turbulence, Lecture Notes in Mathematics 898 (ed. by D. A. Rand & L. S. Young), 366-381.' Springer-Verlag, Berlin, Germany.
Tsonis, A. A. (1992) Chaos: from Theory to Applications. Plenum Press, New York, USA. Tsonis, A. A., Eisner, J. B. & Georgakakos, K. P. (1993) Estimating the dimension of weather and climate attractors:
important issues about the procedure and interpretation. /. Atmos. Sci. 50, 2549-2555. Wang, Q. & Can, T. Y. (I998) Biases of correlation dimension estimates of streamflow data in the Canadian prairies. Wat.
Resour. Res. 34(9), 2329-2339.
Received 14 February 2000; accepted 25 September 2000
Dow
nloa
ded
by [
46.1
95.1
8.72
] at
14:
05 1
2 D
ecem
ber
2015