everything hertz: methodological issues in short-term frequency-domain hrv
TRANSCRIPT
REVIEW ARTICLEpublished: 07 May 2014
doi: 10.3389/fphys.2014.00177
Everything Hertz: methodological issues in short-termfrequency-domain HRVJames A. J. Heathers*
Psychophysiology Group, Department of Psychology, University of Sydney, Sydney, NSW, Australia
Edited by:
Karin Trimmel, Medical University ofVienna, Austria
Reviewed by:
Alessandro Capucci, Universita’Politecnica delle Marche, ItalySteven Pogwizd, University ofAlabama at Birmingham, USAShien-Fong Lin, Indiana UniversitySchool of Medicine, USA
*Correspondence:
James A. J. Heathers,Psychophysiology Group,Department of Psychology,University of Sydney, Building A18,Griffith-Taylor Building, University ofSydney, Sydney, NSW 2006,Australiae-mail: [email protected]
Frequency analysis of the electrocardiographic RR interval is a common method ofquantifying autonomic outflow by measuring the beat-to-beat modulation of the heart(heart rate variability; HRV). This review identifies a series of problems with the methodsof doing so—the interpretation of low-frequency spectral power, the multiple use ofequivalent normalized low frequency (LFnu), high frequency (HFnu) and ratio (LF/HF)terms, and the lack of control over extraneous variables, and reviews research in thecalendar year 2012 to determine their prevalence and severity. Results support themathematical equivalency of ratio units across studies, a reliance on those variablesto explain autonomic outflow, and insufficient control of critical experimental variables.Research measurement of HRV has a substantial need for general methodologicalimprovement.
Keywords: heart rate variability, autonomic nervous system, sympatho-vagal balance, sympathetic nervous
system, parasympathetic nervous system
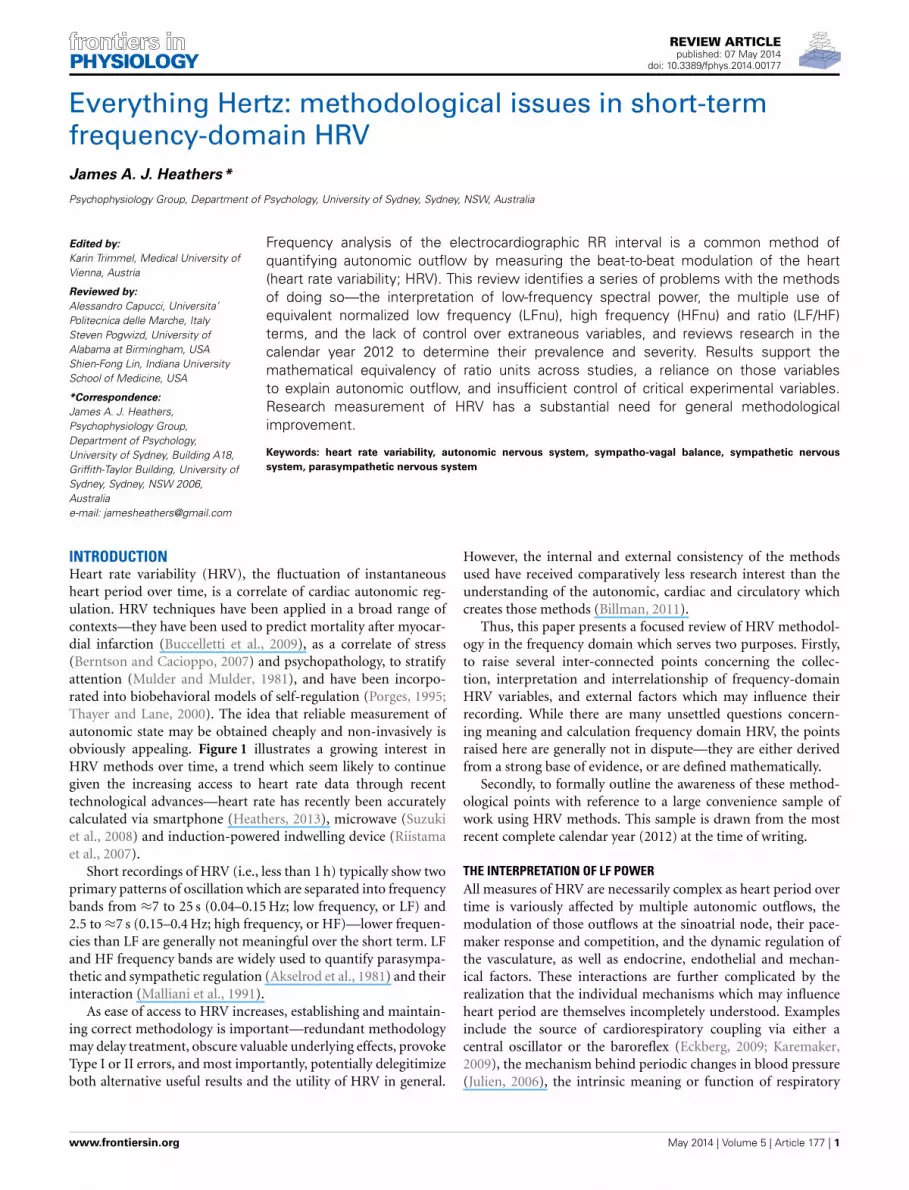
INTRODUCTIONHeart rate variability (HRV), the fluctuation of instantaneousheart period over time, is a correlate of cardiac autonomic reg-ulation. HRV techniques have been applied in a broad range ofcontexts—they have been used to predict mortality after myocar-dial infarction (Buccelletti et al., 2009), as a correlate of stress(Berntson and Cacioppo, 2007) and psychopathology, to stratifyattention (Mulder and Mulder, 1981), and have been incorpo-rated into biobehavioral models of self-regulation (Porges, 1995;Thayer and Lane, 2000). The idea that reliable measurement ofautonomic state may be obtained cheaply and non-invasively isobviously appealing. Figure 1 illustrates a growing interest inHRV methods over time, a trend which seem likely to continuegiven the increasing access to heart rate data through recenttechnological advances—heart rate has recently been accuratelycalculated via smartphone (Heathers, 2013), microwave (Suzukiet al., 2008) and induction-powered indwelling device (Riistamaet al., 2007).
Short recordings of HRV (i.e., less than 1 h) typically show twoprimary patterns of oscillation which are separated into frequencybands from ≈7 to 25 s (0.04–0.15 Hz; low frequency, or LF) and2.5 to ≈7 s (0.15–0.4 Hz; high frequency, or HF)—lower frequen-cies than LF are generally not meaningful over the short term. LFand HF frequency bands are widely used to quantify parasympa-thetic and sympathetic regulation (Akselrod et al., 1981) and theirinteraction (Malliani et al., 1991).
As ease of access to HRV increases, establishing and maintain-ing correct methodology is important—redundant methodologymay delay treatment, obscure valuable underlying effects, provokeType I or II errors, and most importantly, potentially delegitimizeboth alternative useful results and the utility of HRV in general.
However, the internal and external consistency of the methodsused have received comparatively less research interest than theunderstanding of the autonomic, cardiac and circulatory whichcreates those methods (Billman, 2011).
Thus, this paper presents a focused review of HRV methodol-ogy in the frequency domain which serves two purposes. Firstly,to raise several inter-connected points concerning the collec-tion, interpretation and interrelationship of frequency-domainHRV variables, and external factors which may influence theirrecording. While there are many unsettled questions concern-ing meaning and calculation frequency domain HRV, the pointsraised here are generally not in dispute—they are either derivedfrom a strong base of evidence, or are defined mathematically.
Secondly, to formally outline the awareness of these method-ological points with reference to a large convenience sample ofwork using HRV methods. This sample is drawn from the mostrecent complete calendar year (2012) at the time of writing.
THE INTERPRETATION OF LF POWERAll measures of HRV are necessarily complex as heart period overtime is variously affected by multiple autonomic outflows, themodulation of those outflows at the sinoatrial node, their pace-maker response and competition, and the dynamic regulation ofthe vasculature, as well as endocrine, endothelial and mechan-ical factors. These interactions are further complicated by therealization that the individual mechanisms which may influenceheart period are themselves incompletely understood. Examplesinclude the source of cardiorespiratory coupling via either acentral oscillator or the baroreflex (Eckberg, 2009; Karemaker,2009), the mechanism behind periodic changes in blood pressure(Julien, 2006), the intrinsic meaning or function of respiratory
www.frontiersin.org May 2014 | Volume 5 | Article 177 | 1
Heathers Methodology in HRV
FIGURE 1 | Published research with “heart rate variability” in the title.
At the time of writing, the value for 2013 was extrapolated from thepublications Jan 1st through April 30th.
sinus arrhythmia (Hayano et al., 1996; Tzeng et al., 2009; Ben-Talet al., 2012; Elstad, 2012).
Irrespective of this, the power spectral density of high fre-quency HRV is strongly associated with cardiovagal activity(Akselrod et al., 1981; Kamath and Fallen, 1993; Malik, 1996).Respiratory variation observed in heart period is linearly relatedto parasympathetic control of heart rate (Katona and Jih, 1975),and its modulation forms the theoretical center of most HRVanalysis. However, it should be noted that HF HRV is not abol-ished by vagotomy (Tzeng et al., 2005, 2007), and shows acomplex and only somewhat dose-dependent relationship withmuscarinic blockade (Picard et al., 2009).
Alternatively, the debate over the characterization, meaningand utility of LF HRV is ongoing issue (Akselrod et al., 1981;Porges and Byrne, 1992; Hopf et al., 1995; Introna et al., 1995;Sleight et al., 1995; Eckberg, 1997; Grasso et al., 1997; Mallianiet al., 1998; Sleight and Bernardi, 1998; Houle and Billman, 1999;Notarius et al., 1999; Notarius and Floras, 2001; Elghozi andJulien, 2007; Billman, 2011, 2013; Goldstein et al., 2011; Paganiet al., 2012; Reyes del Paso et al., 2013).
To fully describe the physiology involved above is beyond thescope of this review. Within the present context, we may con-fine ourselves to addressing one common claim about frequencyanalysis—the involvement of the SNS in vasomotor control(Julien, 2006), and the strong relationship between the barore-flex and LF power (Goldstein et al., 2011) has occasionally beenextrapolated to the position that LF power is proportional to car-diac sympathetic nerve activity. The direct evidence against thisclaim is strong even if confined to just non-invasive or minimallyinvasive studies in humans.
For instance, beta-adrenergic antagonists have shown diver-gent effects on LF power. Jokkel et al. (1995), for instance,report an approximate doubling of LF power in response to
total beta-adrenergic blockade with propanolol (a non-selectiveβ-blocker). A modest increase in LF power (Chiladakis et al.,2004) or no difference to baseline (Taylor et al., 1998) have beenreported subsequent to treatment with atenolol (a β1-antagonist).
Likewise, cardiac 6-[18F] fluorodopamine imaging in humans(Goldstein et al., 1990, 1993), which radiolabels catecholaminestorage vesicles, has repeatedly shown no relationship betweenradioactivity subsequent to cardiac sympathetic activity andLF-HRV power (Alvarenga et al., 2006; Moak et al., 2007; Rahmanet al., 2011). Likewise, there are dissociations between other mea-surements of SNS via impedance cardiograph (Goedhart et al.,2008), salivary alpha-amylase (Nater et al., 2007; Kobayashiet al., 2012), circulating epinephrine/norepinephrine (Sloanet al., 1996), and muscle sympathetic nerve activity (Grassi andEsler, 1999). This evidence has been recently covered at length(Goldstein et al., 2011; Reyes del Paso et al., 2013).
The connection between LF power and sympathetic activity,while frequently cited as representative of (Pagani et al., 1984,1986), is a misrepresentation of the initial claim that normalizedLF power is representative of relative sympathetic power as a mea-sure of sympathovagal balance. This, and related theory, is dealtwith below.
THE LF/HF RATIOThe ratio of low-frequency power to high-frequency power(LF/HF ratio), as popularized by (Pagani et al., 1984, 1986), iscommonly used as a measure of sympathovagal balance—theputative balance between the mutually opposing branches of theautonomic nervous system. While widely used, this approachhas been criticized on a number of grounds. The disconnectionbetween this understanding of short-term spectral power withinthe heart series and the known physiology related to that power(Eckberg, 1997; Goldstein et al., 2011; Billman, 2013), and theresponse to those criticisms (Malliani et al., 1998; Pagani et al.,2012), have been covered in detail. As above, much of this is anatural extension of the argument that the numerator (i.e., LFpower) reflects sympathetic outflow poorly, if at all.
From a methodological perspective, however, it is most con-cerning that there may be no mathematical basis on which tocompare LF and HF power. Values of HRV are typically internallyconsistent, in that changes within a frequency band on individ-ual sequential measurements may be directional or proportional.That is to say, it is meaningful that an individual under acute stressexperiences a reduction in HF power from baseline, and thatadditive stress provokes additive change. However, those changeshave less bearing on other measured quantities (i.e., a loss of HFpower is compared to a loss of LF power; a loss of HF powerbetween individuals, etc.). This is subsequent to considerationssuch that (a) fluctuations in HRV should more correctly be con-sidered fluctuations in the modulation of autonomic tone, not achange in autonomic outflow (e.g., Katona et al., 1977), (b) theproperties of interaction and competition between muscarinicand adrenergic outflow at the sinoatrial node are both non-linear(e.g., Levy, 1984) and mediated by neuropeptide co-transmitters(e.g., Revington and McCloskey, 1990), and c) changes in bothlow- and high- frequency power are mediated by both SNS andPNS (e.g., Taylor et al., 2001). This is often expressed simply
Frontiers in Physiology | Cardiac Electrophysiology May 2014 | Volume 5 | Article 177 | 2

Heathers Methodology in HRV
by characterizing HRV as a qualitative, not quantitative, variable(Notarius and Floras, 2001; Billman, 2011).
However, the possibility of measuring sympathovagal balancein the manner above has been repeatedly classed as heuristic(Malliani et al., 1998; Sleight and Bernardi, 1998; Malliani, 2005).This position has a great deal of merit, as it is inevitable thatcomplex or poorly understood phenomena will be demonstrablyrelated to other dependent or independent variables in advance ofour ability to explain why this is so. In other words, a metric maybe useful well before it appears meaningful. One argument relatedto the above is the clear interrelationship during graded ortho-static tilt between (1) tilt angle, (2) sympathetic outflow, and (3)LF/HF ratio, the conclusion being that as all of these positivelycovary, then LF/HF ratio well describes, and is capable of predict-ing tilt angle (Montano et al., 1994). This may be the case, butonly indicates an association between these factors, rather than areason for their association.
Orthostasis provides an interesting comparative example.Figure 2 graphs mean pre-ejection period (PEP) against the angleof graded tilt with an overlaid quadratic regression (assuming thatthe relationship between cardiovascular response to tilt vs. angleis curvilinear). In this situation, the heuristic value of adjusted orunadjusted PEP is substantial, perhaps equivalent of some reportsof spectral power (Bahjaoui-Bouhaddi et al., 2000), even withoutconsidering the individual regressions.
It seems very likely that predictions made in the manner ofMalliani et al. (1997), where normalized units were successfullyemployed in a model to delineate posture, would be successfulwith PEP. Thus, as the following are clearly demonstrated:
(1) there is a predictable, positive relationship between PEP andpositive tilt
(2) this relationship parallels an established positive relation-ship between SNS outflow and positive tilt (e.g., Chosy andGraham, 1965; Iwase et al., 1987)
FIGURE 2 | The curvilinear relationship between pre-ejection period
(PEP) and tilt angle during orthstatic stress. Data from Chan et al. (2007)(1) and Stafford et al. (1970) (2).
. . . we may draw a heuristic conclusion:(3) PEP is positively related to sympathetic outflow.
However, the normal relationship between PEP and SNS out-flow is precisely the opposite. Sympathetic activity, as measuredby circulating catecholamines (Chosy and Graham, 1965) or byMSNA (Iwase et al., 1987), increases reliably during orthostatictilt. In other contexts, this might well accompany a decrease inPEP (Newlin and Levenson, 1979). However, our model here failsto account for the effects of preload—the initial stretching of themyocardium due to passive factors prior to the cardiac cycle—which increases proportionally with tilt angle independently ofsympathetic drive (Stafford et al., 1970). Thus, a heuristic vari-able formed between two robust associations may be preciselypredictive but ultimately misleading. This is precisely the criti-cism leveled by Grassi and Esler (1999); that LF/HF ratio fails todescribe SNS outflow outside of the demonstration provided bychanges in orthostasis.
Finally, the source of LF power is well characterized—LF powergenerally reflects the activity of the baroreflex in response to vaso-motor tone. This is broadly accepted consequential to the classicaldemonstrations of the close correspondence between blood pres-sure waves and sympathetic modulation (Guyton and Harris,1951), which are reflected in the heart period by the compen-sation of the baroreflex. This interpretation is not in dispute; acomprehensive summary is given in Berntson et al. (1997).
THE REDUNDANCY OF NORMALIZED UNITS AND LF/HF RATIONormalized HRV values (LFnu, HFnu) are calculated from theraw values of either short-term frequency band (LF or HF)divided by the total spectral power (typically LF + HF), withthe value of this typically expressed as a percentage or decimal.These variables have a long history (e.g., Lombardi et al., 1987)in quantifying HRV, and have been used to quantify propor-tional sympathetic and parasympathetic activity respectively (e.g.,Pagani et al., 1986). They are of particular interest in reviewingthe available literature as they provide a degree of interpretabilitybetween studies, as proportional change between defined fre-quency bands can be seen as roughly equivalent regardless ofthe spectral method used. Unlike raw power, this allows directcomparison between frequency and autoregressive methods forcalculating spectral power, between spectral power expressed asms2 or bpm2, and between different algorithms for calculation,windowing methods, time periods, etc. These differences oftenresult in baseline spectral values which are multiple orders ofmagnitude apart between studies (Sandercock, 2007).
However, the typical use of normalized units presents a seriesof significant redundancies. Firstly, LFnu and HFnu are triviallyequivalent, as LFnu = 1-HFnu. This implies that calculationscannot be duplicated, as LFnu calculations are perfectly linearlyrelated (i.e., computationally identical) to HFnu (Chemla et al.,2005). Reporting both values provides no additional informationover reporting one, and change in one is identical to change inthe other. In this manner, it is necessarily incorrect to refer toHFnu and LFnu as separate concepts. Instead, this model mustdescribe a single autonomic continuum along which individualpoints represent the admixture of low and high frequency power.
www.frontiersin.org May 2014 | Volume 5 | Article 177 | 3

Heathers Methodology in HRV
Furthermore, reporting calculations where only one normalizedvalue is significant should be considered inconsistent.
There are exceptions to the above. Firstly, when normal-ized values are calculated from an expanded power spectrum;occasionally, Very Low Frequency (VLF; 0.003–0.04 Hz) may beincluded in the denominator of normalized units (i.e., LFnu =LF/VLF + LF + HF), likewise power about the HF cutoff(i.e., >0.4 Hz), or the total power of the observed spectrum (TP;0–0.5 Hz) may be used as the denominator (i.e., LFnu = LF/TP;this is sometimes called LF%). However, in short recordings, theinclusion of these longer timescales is a significant problem as thecontribution from very low frequencies is undersampled in themanner described below, and the Nyquist criterion prevents anymeaningful contribution at frequencies higher than HF.
Secondly, when the autoregressive method is used to quantifyspectral bands, often, the individual components identifiedfor LF and HF bands sum to less than the measure of “totalpower”—the additive model minus the component at VLF. Inthis case, LFnu + HFnu will be less than 1, but most likely veryclose to it. As far as I am aware, there is no evidence to indicatethat this establishes LFnu and HFnu as separate theoreticalentities rather than measurement error. If the autoregressivemodel is a poor fit for the available data, then LFnu + HFnu maybe significantly less than 1.
In addition, it is trivial to transform the LF/HF ratio as directlyproportional to a normalized value of either spectral band (Burr,2007):
IfLF
HF= α,
i.e. HF = LF
α
then,
LFnu = LF
LF + HF
= LF
LF + LFα
= 1
1 + 1α
i.e. LFnu = 1
1 + ( LFHF
)−1
and HFnu = 1
1 + ( LFHF
)
Graphically, the function above is shown in Figure 3A—it ismonotonically increasing at all positive non-zero values, non-linear, and well approximated by logarithmic regression overa typically observed range (r2 > 0.99). As the distribution ofthe LF/HF ratio is often positively skewed, it is frequently log-transformed to meet criteria of normality (e.g., Kobayashi et al.,2012). In this case, the non-linear relationship becomes sig-nificantly attenuated and very closely approximates linearity(Figure 3B)—thus a linear regression has an identical coefficient,constant term and r2-value.
In this manner, any given value of LFnu or HFnu has adirectly equivalent LF/HF value. It should be emphasized thatthis is not a conceptual similarity but an equivalence at the levelof definition—for example, an LF/HF ratio of 0.6 is preciselyequivalent to LFnu = 37.5% or HFnu = 62.5%. Consequently,individual normalized values contain no more information thanindividual LF/HF ratio values, and on this basis it is unclearhow “sympathetic balance” (LFnu) is mathematically different to“parasympathetic modulation” (HFnu) or how either is concep-tually different to “sympathovagal balance” (LF/HF).
Similarly, due to the non-normal distribution of typicaldata, HRV variables are occasionally presented as median andinterquartile range. As rank order is preserved in a monotonicincreasing relationship, medians and inter-quartile values shouldremain direct transformations of each other, and statistical calcu-lations on rank order should be identical between normalized andratio values; a full description of this and other redundancies canbe seen in Burr (2007).
However, due to the moderate non-linearity, mean (LF/HF)is not identical to mean (LFnu). This relationship is explored in
FIGURE 3 | The direct equivalence of normalized to ratio values with logarithmic regression (A), and of normalized to log-ratio values with linear
regression (B). Values drawn from LFnu 0.2 to 0.8, n = 25.
Frontiers in Physiology | Cardiac Electrophysiology May 2014 | Volume 5 | Article 177 | 4

Heathers Methodology in HRV
Figure 4, where LFnu and LF/HF values from realistic artificialsamples reveal a convergence toward the central value of LFnuwith larger sample size, and a consistent predictive value betweenmeans. Thus, it is likely that statistical comparisons under stan-dard parametric assumptions for LF nu and LF/HF would besimilar without being identical.
FIGURE 4 | A comparison of LFnu vs. LF/HF sample means, with (A)
n = 15, (B) n = 30, (C) n = 100. Points are means derived fromapproximately typical pseudorandom (Mersenne Twister) normallydistributed values of LF ms2 (mean = 600, SD = 200) and HF ms2
(mean = 800, SD = 200). The values are distributed near the point of meanequivalence, LFnu = 0.429. r2-values range from 0.833 to 0.902.
INTERPRETING NORMALIZED UNITS IN THE ABSENCE OF RAW POWERNormalized units, which report frequency power proportional tothe total observed power, possess an additional problem—thatseveral different patterns of change in individual spectral bandsmay result in identical changes in proportion. This is illustrated inFigure 5, where a hypothetical participant with a baseline LFnu =0.33 increases to LFnu = 0.5 after experimental intervention. Thischange in normalized units therefore represents not one possi-ble change, but a continuum of possible changes which variouslyencompass (1) an increase, decrease or no change in (2) eithertotal power, raw LF or raw HF power. Any point on the line ofidentity described in Figure 5 fulfills the criteria of LFnu = 0.5,but the individual points represent entirely different outcomes(Billman, 2013).
In other words, the reporting of HRV solely as a propor-tion directly obscures the underlying interpretation. It is preciselythis form of interpretability which the seminal Task Force paper(Malik, 1996) sought to preserve within normalized values by rec-ommending that research should always report both normalizedand raw values for clarity.
This is not merely a hypothetical scenario, and one of ourrecent papers illustrates this clearly (Krygier et al., 2013). Inthis study, comparisons of HRV metrics are drawn from a sam-ple of meditators at rest and during Vipassana meditation, andboth before and after an intense intervention—around 100 hof intensive training over 10 days. While the overall interac-tion was not significant, an intriguing and significant increase inHFnu was observed, as reported in previous research on simi-lar forms of meditation (e.g., Sarang and Telles, 2006; Wu andLo, 2008; An et al., 2010). A naïve characterization might be thata beneficial change representing an “increase in vagal tone” ora “favourable autonomic balance” was introduced by meditative
FIGURE 5 | The outcome of a hypothetical experiential effect—a
participant with LFnu = 0.33 (LF ms2 = 500, HF ms2 = 1000) increases
to LFnu = 0.5, which is defined by any point on the line of identity (i.e.,
LF ms2 = HF ms2). The arrows and operations on the line designate wherevalues may be smaller, equal to, or greater for the corresponding spectralregions (LF, low frequency; HF, high frequency; and TP, total power).
www.frontiersin.org May 2014 | Volume 5 | Article 177 | 5

Heathers Methodology in HRV
training, but follow-up analyses revealed that normalized changewas specifically mediated by (a) a profound increase in HRV atbreathing frequency during meditation in untrained participants,and (b) a profound decrease in HRV at Mayer wave frequencyduring meditation when trained (Figure 6).
These changes precisely mirror the subjective reports of howmeditative practice proceeds. Naïve practitioners of Vipassana,instructed to observe the breathing cycle rather than alter it,invariably “over-breathe,” which typically corresponds to anincreased tidal volume and reduced respiratory rate. Within thelower portion of the HF spectra, this increases observed HF power(Hirsch and Bishop, 1981; Brown et al., 1993). However, thisproblem is mastered within a few days as participants practice theability to passively observe normal respiratory cycles.
The above is a single unreplicated finding, and due to thenature of the task, breathing could not be consciously controlled(a potential confound, as breath has its own relationship to atten-tion; see Vlemincx et al., 2012). Thus, while the above explanationis speculative, two points remain regardless: (1) the reference toindividual frequency bands has greater explanatory power thanthe original naïve interpretation, especially considering changesin respiratory parameters, mood, attention, etc. are reliably pre-dicted by spectral power in individual frequencies, and (2) thechanges described within individual frequency bands may beentirely inconsistent with, and obscured by, the reporting of lonenormalized HRV values.
TIME RESOLUTION OF LF POWERWhile an RR series does not consist entirely of cyclical processes(Peng et al., 1995), frequency analysis approximates the action ofautonomic outflow to the heart by quantifying cyclical informa-tion present. In doing so, the number of times a cyclical frequencycan be observed during an electrocardiographic recording varies
linearly with the length of the recording, and inversely with theperiod of the frequency.
Consequently, HF HRV may be successfully recorded overperiods of time as short as 60 s (Malik, 1996) as this gives adequateresolution to cycles within the heart period driven by respira-tory sinus arrhythmia, typically around 0.25 Hz at rest. LF HRVrequires a longer period in order for the spectral information tobe reliably present. In short recordings, these frequencies may beinsufficiently sampled—a signal at 0.04 Hz (i.e., with a period of25 s) is observed 2.4 times per minute.
A heuristic rule which has been occasionally stated requiresthe sampling period to contain 10 complete cycles of the lowestobserved frequency in order for the underlying information tobe successfully approximated (Malik, 1996; Berntson et al., 1997)but there appears to be no analytical exposition of this. This hasloosely translated into an accepted standard of a 5 min recordingto measure short-term HRV, as a 5 min recording by this defi-nition can resolve frequencies down to 0.033 Hz. Consequently,power from the LF spectrum down to 0.04 Hz is necessarilyincluded in both normalized and LF/HF ratio calculations ofHRV. Thus, both measurements should be taken over a minimumof 5 min.
EXTRANEOUS VARIABLES TO RECORDING BASELINE HEART PERIODStudies which measure variables that may be broadly affectedby incidental day-to-day factors are usually carefully controlled.In human populations, research is often conducted specific toage group, experimental environment, time of day, medicationstatus, environmental stimulants (i.e., caffeine or other methylx-anthines), and so on. In longer studies or those requiring stren-uous activity, standardized food and drink is provided. Studiesin HRV are especially subject to these concerns—due to the auto-nomic innervation of the viscera, there are several instances where
FIGURE 6 | Adapted from Krygier et al. (2013), Figure 1, with permission. The devolution of the normalized results (top panel) into raw power (bottompanel) reveals two specific effects inconsistent with the overall interpretation of an alteration in autonomic balance. ∗p < 0.05.
Frontiers in Physiology | Cardiac Electrophysiology May 2014 | Volume 5 | Article 177 | 6

Heathers Methodology in HRV
artifacts to short-term HRV measurement at rest may reliablyarise from demographic variables, and the normal activities ofdaily living. Of course, controlling daily activity is not possibleor even desirable in some patient groups, especially if long termmonitoring is required (i.e., if measured over 24 h) but in labo-ratory or naturalistic experiments, it is ideal to observe potentialchanges in autonomic activity with as few confounding variablespresent as possible.
These variables are occasionally recognized; most research, forinstance, is aware that HRV declines with age (O’Brien et al.,1986), is broadly affected by cardiovascular, vasoactive and psy-chotropic medication (e.g., beta-blockers; Sandrone et al., 1994),and is affected by both circadian rhythm (e.g., Massin et al., 2000)and wakefulness (Walker et al., 2009). Less frequently recognizedis the finding that the autonomic innervation of the viscera meansthe consequences of feeding (i.e., the acute consumption of foodand water, gastric distension and bladder filling) directly affectHRV.
Of these, the most attention has been paid to water con-sumption (May and Jordan, 2011) subsequent to the finding thatpatients with severe hypotension due to autonomic failure deriveda significant reduction in symptoms from drinking water, andthis subjective improvement was observed parallel to substan-tial increases in blood pressure (Jordan et al., 2000). A similareffect can be observed when the baroreflex loop is opened insinoaortically denervated mice (McHugh et al., 2010).
In normal participants, the same presumed pressor effect takesplace, and can be observed in muscle sympathetic outflow (Scottet al., 2001), but changes in blood pressure are immediatelybuffered by the efferent vagal baroreflex, and the immediate con-sequence is a moderate to large compensatory increase in heartperiod and HF-HRV. Healthy participants approximately dou-ble baseline HF-HRV, while the effects on HR are significantwithin 10 min after ingestion, peak at around 15–20 min andreturn to baseline by 45 min (Routledge et al., 2002). Recent work(Mendonca et al., 2013) has suggested that these effects onlybecome negligent at VO2 maximum.
Eating and subsequent digestion have autonomic conse-quences which appear to be mediated both by gastric distention(Rossi et al., 1998) and by exposure to food-related stimuli(Nederkoorn et al., 2000). Mechanical and electrical stimuli tothe stomach are both powerful hypotensive stimuli (Pozo et al.,1985), and this effect is abolished by vagotomy (Liu et al., 2004).In addition, the digestive process provokes vagal withdrawal asmeasured by HRV for at least 60 min after a meal (Lu et al.,1999), and increases sympathetic outflow to the skeletal musclesbut not the heart (Fagius and Berne, 1994; Cox et al., 1995). Dueto the relationship between the thermic effect of food and sympa-thetic outflow, this response is heavily affected by macronutrientcomposition (Welle et al., 1981; Schwartz et al., 1985).
Finally, bladder distension has been observed to provoke arobust series of pressor-mediated responses in humans (Fagiusand Karhuvaara, 1989), where bladder distention predicts anincrease in muscle sympathetic nerve outflow and blood pres-sure. Ben-Dror et al. (2012) subsequently delineated a linearrise in lnLF power with acute bladder filling in healthy con-trols drinking water. While this may have been confounded with
the osmopressor effect (as above), a similar effect was observedusing filling cystometry (i.e., causing bladder distension withoutdrinking; Mehnert et al., 2009).
REVIEW PARAMETERSIn order to confirm both the nature and the extent of the prob-lems outlined above, a substantial body of work is drawn fromthe recent HRV literature (i.e., from 2012). This allows the pos-sibility of (a) sufficiently characterizing HRV research as it ispresently performed with reference to the methodological issuesraised, (b) confirming the presence and relevance of the mathe-matical relationships defined above, and (c) observing the extentof experimental controls currently employed.
METHODSA non-systematic review was conducted: Google Scholar andPubMed databases were searched using the terms “heart rate vari-ability” or “HRV” through either the title or abstract, with a daterestriction of 01/01/12 through 31/12/12. Full text articles wereobtained.
REVIEW PROCESSNon-English language journals, 24 h studies (title/abstract:“Holter,” “24 hr”), animal (title/abstract: “mouse,” “rat,” “dog,”etc.), developmental (title/abstract: “neonatal,” “infant,” “child,”etc.), geriatric (title/abstract: “elderly,” “geriatric,” etc.), and con-ference abstract, qualitative or discussion papers (title/abstract:“editorial,” “conference,” “review,” etc.) were excluded, as werepapers which were formally published in 2011 or 2013 (n = 293).The remaining papers (n = 573) were superficially reviewed to setinitial criteria for inclusion.
SELECTION CRITERIAAgePre-natal, infant, child and youth (mean age <18 years) samples,and elderly/geriatric samples (mean age > 65) were excluded.
Time periodConsistent recording for more than 1 h was not consideredshort-term and excluded. 24 h or Holter monitor studies wereincluded only if a short-term period was additionally analyzedand reported to the daily record.
Descriptive workReviews, meta-analyses, position papers or commentaries, corre-spondence, etc. were excluded if descriptive of HRV phenomenainstead of primary research, and included if they reported datafrom novel primary research.
BreathingPaced breathing at speeds above 0.15 Hz was included. Breathingprotocols slower than 0.15 Hz likely to affect the fundamentaldistribution of spectral power were excluded.
Healthy baseline conditionIf plural baseline conditions were included within-subjects overone or multiple sessions, the first criteria reported—either bytime, or if unclear, by listed order—was considered the baseline.
www.frontiersin.org May 2014 | Volume 5 | Article 177 | 7

Heathers Methodology in HRV
If plural conditions were averaged to make a global value, this wasconsidered equal to the total recorded time. If a baseline includedplural subsequent measurement periods, i.e., two recordings of3 min separated by task, then the first was used. Subsequent peri-ods (i.e., “first 5 mins, second 5 mins”) were recorded as a singlevalue if given otherwise the first period was used. Studies com-bining the averages of multiple time periods (i.e., the averageof spectral values from two 3 min periods) were not recorded.Baselines immediately before surgery requiring general anes-thesia were not considered resting, due to anticipatory anxiety.Multiple healthy groups from the same study were included if (a)listed separately at all points, and (b) were taken from baselinesadministered before random assignment into groups, or afterassignment in benign circumstances. If sub-clinical groups fromhealthy populations were defined (i.e., “high normal” anxiety vs.“low normal” anxiety) then the low pathology group was used.Unless specifically stated as standing or supine, it was assumedthat participants or patients were seated.
RECORDED INFORMATIONLF powerThe genesis of LF power provided was classified as being either(a) sympathetically mediated, (b) resulting from “both parasym-pathetic and sympathetic modulation,” (c) representing the gainof the baroreflex, or (d) other (parasympathetically mediated/notstated). Studies specifically measuring the LF response to gradedtilt or postural change were taken as implying a relationshipbetween LF and baroreflex outflow, as this is an orthostaticmanipulation. If the basis of LF was derived from a referencewithout an explicit statement of what LF power was to represent,the interpretation within the reference was used according to theabove criteria.
CONTROL OF EXTRANEOUS VARIABLESCircadianCircadian factors were considered controlled if both between andwithin subject comparisons were identical within a 24hr period,and confined to an hour or a time window of up to 4 h (i.e., “9 amto 1 pm” or “beginning in the early morning”).
Illness/MedicationWork addressing serious, debilitating, psychiatric or otherchronic illness, or any illness whose primary etiology was car-diovascular or circulatory, was included only if a control groupwas available, as baseline HRV level or collection/analysis tech-nique may be affected. Non-life threatening illness treatable withstandard pharmacotherapy (such as asthma) or post-treatmentgroups which did not require major pharmacotherapy or surgery(e.g., recovered phobics) were included. The exclusion or sta-tistical control of any medication apart from the contraceptivepill or unscheduled analgesics (e.g., Paracetamol, Ibuprofen) wasconsidered controlled.
Food/WaterMeals were regarded as controlled either if participants wererecorded during a fasted state, or if a standard meal was pro-vided or prescribed for study inclusion, likewise water. A fasted
state was assumed for participants measured at baseline beforetilt-table testing. Water provided ad libitum was not consideredcontrolled.
BladderBladder emptying was only recorded if it was explicitly stated, asno pre-surgical population was included.
ContentWith the exclusion criteria as above, the review proceededpseudo-randomly (i.e., sequentially in alphabetical order by thesurname of the first author) until 100 samples were recorded.
ANALYSISComparisons between values were modeled respectivelyas the regressions HFnu = a/(b + c.(LF/HF)), LFnu =a/(b + c.(HF/LF)); all used the least-squares method andassumed initial conditions of any nominal constant = 1. Therelationship between LFnu and HFnu was modeled by linearregression.
Relative standard errors (RSE; the standard error of the meandivided by the mean) were taken as measures of adjusted reliabil-ity for individual studies, and calculated from LF/HF ratios whichwere given in milliseconds squared, LFnu and HFnu values.
All calculations were performed in GraphPad Prism 5.
RESULTSFrom n = 378 papers, n = 97 papers were accepted (n = 3 stud-ies contained multiple baseline groups which met inclusion crite-ria), to give a total of n = 100 records of HRV at baseline. The listof these papers is included as supplementary material. If data wasprovided, participant age, sample size, HFnu mean and standarddeviation (calculated from SEM if necessary), LFnu (likewise), ormedian and inter-quartile range were recorded separately. LF%and HF% were not recorded, as the inclusion of VLF powerwithin short term calculations is problematic. All forms of spec-tral analysis (i.e., autoregressive method, FFT/DFT, Lomb-ScarglePeriodogram, wavelet analysis etc.) were included as equivalentspectral analytical methods, as normalized units and/or LF/HFratio were the recorded variables. The characterization of theacceptance/rejection criteria and use of spectral power is shownin Tables 1, 2.
Extraneous controls varied substantially between measures: ofthe 97 separate studies accepted, 81% controlled for medicationor health status, 76% for nicotine use, 58% for time of recording,45% controlled for food intake, 23% controlled for water intake,and 4% for micturition. Of the above n = 97 studies, 91 (94%)analyzed some version of LF power, and 74 (76%) reported atleast one normalized or ratio unit measure. 50 papers specificallyreported the LF/HF ratio: 13/50 (26%) reported log-correctedunits and 37/50 (74%) reported uncorrected units.
The time periods used for HRV recording were primarily 5 min(n = 40; 41%), or 10 min (n = 20; 21%). Recording times under5 min were uncommon (n = 13; 13%), with n = 10 (10%) ofthese using a measure of LF power.
Remaining figures are descriptive of the parameters of review;Figure 7 describes the primary interpretation given to ratio or
Frontiers in Physiology | Cardiac Electrophysiology May 2014 | Volume 5 | Article 177 | 8

Heathers Methodology in HRV
Table 1 | Inclusion and exclusion criteria for reviewed studies.
375 Reviewed
278 Excluded
26 24 h or Holter monitor study
6 Animal
1 Duplicate record in database
11 Elderly, geriatric, or palliative sample
7 Elite or high level athletes
86 Exclusive to patient population
1 Incorrect calendar year (i.e., published 2013)
32 Infant, child or teenage sample
50 Letter, review, commentary, etc.
23 No resting baseline given
17 Non-linear, non-standard, etc. measures
13 Time domain measures only
5 Unavailable at the time of review
97 Included
97 Met criteria
3 Multiple or duplicate usable records
Table 2 | Reporting of raw vs. adjusted values, single vs. multiple
normalized or ratio units.
Reported No raw
raw values values
Single nu/Ratio unit 26 4 30
Multiple nu/Ratio units 26 18 44
52 22 n = 74
normalized power. The number of points available for each indi-vidual comparison below is noted separately per figure. Figure 8shows the means and relevant interquartile values assumed to beprecisely equivalent due to equal rank order with the inverse-term regression relating LF/HF and nu units overlaid. Figure 9describes the sum and interrelationship of normalized valuesassumed to be precisely equal to unity. The relationship betweenmean normalized units and mean LF/HF ratio is shown inFigure 10, and their precision is shown in Figure 11.
DISCUSSIONOverall, the use of frequency analysis over short-term heart raterecordings to characterize autonomic state or sympathovagal bal-ance is problematic. Relevant research frequently truncates or failsto explain the source of HRV power. Commonly co-investigatedvariables are reported as separate concepts, but are mathemati-cally redundant as predicted. This redundancy is precise betweenindividual values and moderate between group means. Time peri-ods employed for recording are generally sufficient. Confoundingvariables which have the potential to substantially alter between-and within-subject variance are infrequently controlled.
OVERALL PRECISION AND EXPERIMENTAL CONTROLThe control of extraneous factors affecting recording in par-ticipants is perhaps the most problematic of the results here,because it may irreparably affect the veracity of between-subjects
FIGURE 7 | Venn diagram for the various explanations given as the
source of LF power. SNS, sympathetic nervous system; BAL, a balance ofparasympathetic and sympathetic influences; BAR, the activity of thebaroreflex; PNS, parasympathetic nervous system.
experimental models. Of course, depending on the circum-stances, it may not be possible or even desirable to controlall the listed variables—for instance, patient populations mustremain on medication, opportunistic recording at any timeof day is necessary to observe an episodic phenomenon, etc.However, the fact remains that circadian rhythm, medication,health status, food, water and bladder filling all potentially pos-sess the ability to modify the variance of a normative group,even if only problematic in a minority of participants. Someof these external factors (medication, health status, and nico-tine use) are well controlled, but a minority of work con-trolled for gastric or bladder filling. The amount that thisaffects a normative sample of HRV needs to be determinedexperimentally.
For experimentation within subjects, the situation is a lot lessclear. Obviously, if within-subject measurement involves an inter-vention over multiple recording periods in time, the potentialcontamination presents precisely as it would between subjects.However, if a task effect is being observed in sequential record-ing periods during the same experiment, the problem may besubstantially reduced. That is, in the presence of a strong arti-fact, the absolute or proportional change in HRV in response toa drug, task, intervention etc. may occur reliably but simply froman altered baseline.
Say, for instance, that gastric activity subsequent to feed-ing increases LF spectral power in an experimental participant
www.frontiersin.org May 2014 | Volume 5 | Article 177 | 9
Heathers Methodology in HRV
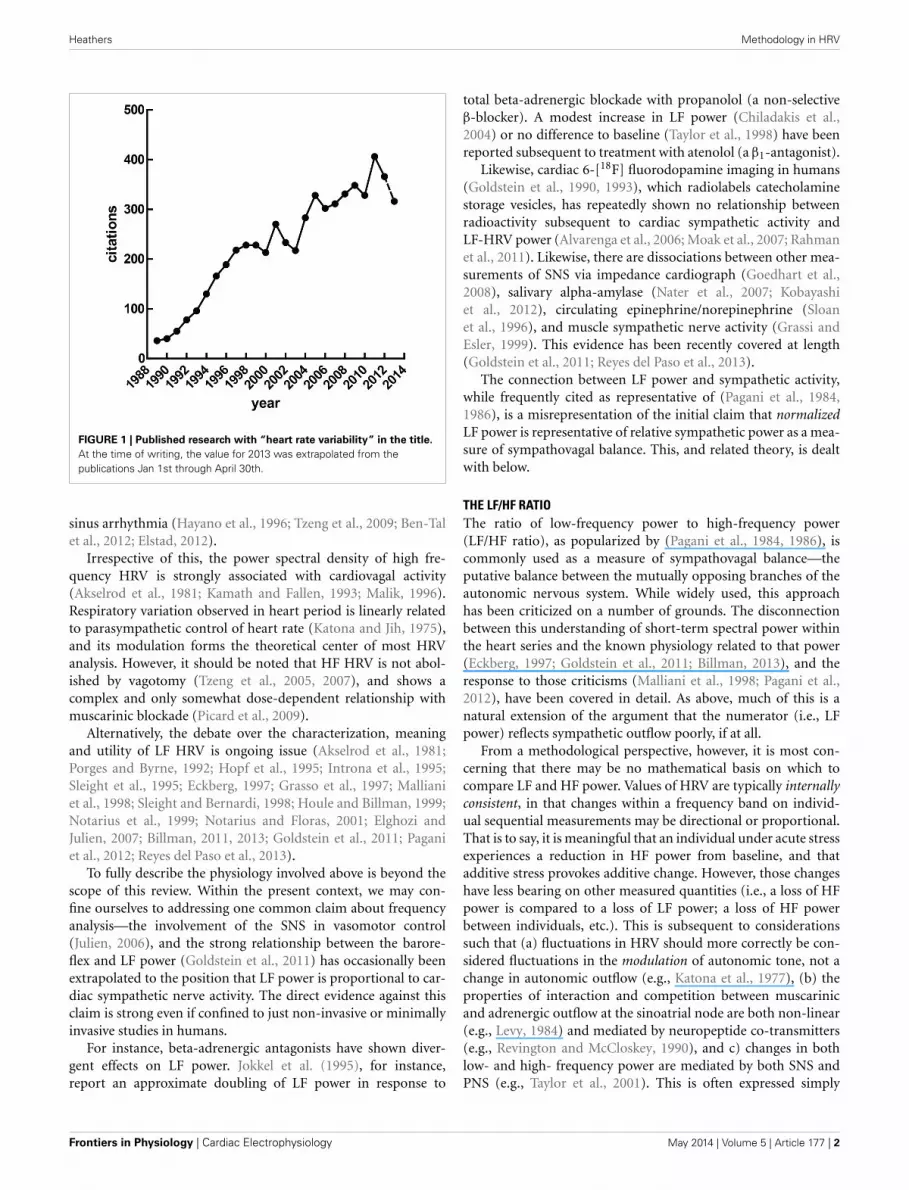
FIGURE 8 | The relationship of precisely equivalent values, i.e., median and
interquartile range (IQR) between LFnu (A) or HFnu (B) and LF/HF ratio.
Regression estimates: (A) a = 1.00, b = 0.94, c = 1.06, r2 = 0.985, n = 7; (B)
a = 1.00, b = 0.98, c = 1.05, r2 = 0.981, n = 7. Values were uncommon as fewstudies reported both normalized and LF/HF ratio values in median/IQR format.The dashed line represents the mathematical identity as previously defined.
FIGURE 9 | The cumulative sums of the normalized components
when (A) both were specified, and (B) their interrelationship
(slope = −1.003 ± 0.1103, r2 = 0.761, n = 20). The dashed line in (B)
represents the mathematical identity as previously defined. Points markedas diamonds are LFnu + HFnu <90%, and marked where relevant onFigure 10.
who is then subjected to social stress, which is also expected toincrease LF power. If that power rises to a proportional level,i.e., rises by the same absolute or proportional amount thatit otherwise would in the absence of feeding, then any poten-tial source of error has been substantially ameliorated by thedesign.
The problem in this instance would be amplified if therewas an interaction between the altered baseline and task. If theresponse is attenuated or amplified, i.e., there is an interactionbetween the task effect and the source of artifact, then the sit-uation is concerning, doubly so if a small sample is being used.To a small sample with normative values (e.g., Nunan et al.,2010; LF = 519 ms2, HF = 657 ms2), a mean increase in HF ms2
subsequent to drinking (Routledge et al., 2002; HF +686 ms2)has the potential to destroy the fidelity of an entire measure-ment at baseline. If this change interacts with any given task-related effect, the sample quickly runs the risk of becominguninterpretable.
NORMALIZED AND LF/HF VARIABLES; CO-REPORTING ANDEQUIVALENCECo-reporting of equivalent ratio values is reasonably common,observed in over half (59%) of the studies which employed nor-malized units or LF/HF. The definition of these measures asredundant is borne out by the results. The argument mightbe made that this is not problematic, as HRV studies typicallyemploy a range of time and frequency domain measures which aremulticollinear. This is impossible to avoid, as most HRV methodssome manner of apportioning a meaning to some quantity of theavailable variance in a heart period series, and cross from time tofrequency domain readily as the integral of the total power spec-trum is equal to the variance. These interrelationships are oftenvery high—Massin et al. (1999) report, for example, that RMSSD,pNN50 and HF power are mutually correlated above 0.9.
However, there are several problems with this line of argumentwhen applied to multiple ratio measures. It is generally acceptedthat multiple similar measures of HRV might be employed to the
Frontiers in Physiology | Cardiac Electrophysiology May 2014 | Volume 5 | Article 177 | 10

Heathers Methodology in HRV
FIGURE 10 | The relationship of mean ratios to approximate mean
normalized values, where (A) LF r2 = 0.363; (B) HF r2 = 0.685, n = 20.
The dashed lines represent the mathematical identities as previouslydefined.
same end to address the same phenomenon may differ slightly—for example, in a group undergoing an experimental intervention,RMSSD may be significantly increased by task and HF powernot. Were this the case, the result would be taken as equivocalsupport for a change in cardiac vagal modulation, and the differ-ence in the result between the similar calculatory methods wouldbe addressed. Alternatively, if LFnu was significant and LF/HFnot, this might be interpreted as a change in relative sympatheticactivity, but no change in sympathovagal balance. Secondly, othermeasures which may be closely correlated attempt to measure the
FIGURE 11 | Relative standard error (i.e., the standard error divided by
the mean, which forms the sample-sized adjusted coefficient of
variation) for LFnu (n = 29), HFnu (n = 30) and LF/HF (n = 30), shown
here by median, interquartile range and min/max.
same phenomenon but use entirely disparate methods. However,normalized and ratio values are mathematically, not theoretically,related. There is no equivalent transform which might imply, say,an RMSSD value from a value of HF spectral power.
Thirdly, it is unclear which of the ratio measures best repre-sents the comparison they are both attempting to capture. Forinstance, normalized units are more likely to obey parametricassumptions, but LF/HF may exhibit significant skew and kurtosis(Kobayashi et al., 2012). This is directly confirmed in Figure 11,as the relative standard error of both normalized units is sub-stantially lower than LF/HF. If the relationship is mathematicallyequivalent, and we also accept a degree of measurement error,how should we interpret an instance where one value is significantand the other not? Is it inconsistent to report both if one works?If a sample of LF/HF obeys standard parametric assumptions,should it still be log-transformed?
Lastly, it is by no means uncommon for normalized spectralbands and the LF/HF ratio to form the entirety of an analysis inan attempt to measure relative sympathetic and parasympatheticcontributions, and their interrelationship. This is rarely the casewith other interrelated variables.
NORMALIZED VARIABLES AND UNITYOverall, the predictions from the mathematical equivalence inthe introduction were borne out—the curvilinear relationshipbetween normalized and ratio figures were observed. In somecomparisons, however, slight to significant departure can beseen contingent on normalized values adding to unity—this wasthe case for a minority of studies observed, with 4 of the 34observed sums of LFnu and HFnu below 90%. These departuresare reflected in Figure 9, and are marked as diamonds between allgraphs for continuity.
There are multiple, non-mutually exclusive possibilities forthis discontinuity which are not simply calculatory error. The firstis the use of an alternative definition of adjusted LF power, i.e.,LF/(total power). As the contribution from VLF power is usually
www.frontiersin.org May 2014 | Volume 5 | Article 177 | 11
Heathers Methodology in HRV
significant, this may explain the larger error but not the prepon-derance of values from 95 to 99% of the sum LFnu + HFnu.The second is that there are small but significant contributionsto spectral power above 0.4 Hz, which are included in total powerbut not included as part of the HF frequency band—this mightexplain the frequent values close to 1, but not the significant devi-ations from it. The third is confusion in the calculation of theautoregressive method between the dominant power componentsin each spectral band which frequently overlap into the othersegments, and the power spectral density of all components butstrictly within the defined power band.
This non-equivalence is responsible for the shift in the distri-bution that can be seen in Figure 9—the bulk of the points aredistributed as expected, but lie rightwards of the line of defini-tion, where the ratio value is slightly bigger than predicted. Theregression of the data conforms to this.
It cannot be concluded precisely what this difference repre-sents. The best case scenario for the use of normalized units wouldbe that this difference is borne of the fact that the individual spec-tral powers retain some statistical independence, and describe aportion of the relevant variance in their spectral bands withoutabsolute covariation.
The worst case scenario is that this is simply a calculatorycuriosity which has no specific meaning, borne of the arbitrarydistinction between the whole spectral element (say, the powerunder the peak which provides the bulk of LF power) and thetruncated version (say, the PSD from precisely 0.04 to 0.15 Hz ofall components). If the “true” sum of LFnu and HFnu is always1, then their statistical equivalence is complete—in comparisons,the metrics they return for continuous or directional compari-son (e.g., Spearman’s r, Student’s t) to other variables will differby sign, and F-values not at all. If this is the case, then this errorhas previously allowed the precise equivalence of LFnu or HFnuto be partially obscured, and normalized/ratio units substantiallyobscured, by providing values which are somewhat divergent andgiving the appearance of independence.
DISPERSION OF RATIO VALUESLF/HF ratio shows an obvious decrease in precision over eithernormalized variables (Figure 11). This is likely due to the volatil-ity of the LF/HF ratio during normal sympathetic dominance asHF approaches zero, as recently suggested (Billman, 2013). Twoexamples from the sample set reviewed demonstrate this potentialvolatility. Muralikrishnan et al. (2012) report a range of auto-nomic measures on Ishant Yoga practitioners vs. normal controls.At supine rest, the normal sample was described thus: n = 14,μ = 1.86, and SD = 6.35. As LF/HF ratio cannot be less thanzero, this sample must contain one or more participants with aratio of 15 or more, most likely due to HF power being minimal(a common occurrence when breathing rates are slow; see Saboulet al., 2014). As a consequence, the description of this sample bymean and standard deviation is unintelligible, as the distributionhas profound positive skew.
Similarly, Chen et al. (2012) compared HRV metrics of resus-citated cardiac arrest patients, patients with sepsis and healthycontrols. The raw LF and HF power of healthy controls rangedbetween approximately 12–100 times greater than all patient
groups. For instance, post-cardiac arrest patients had both LFand HF spectral power of approximately 5 ms2, and healthy con-trols approximately 100 ms2. As a consequence, both of thesegroups had a median LF/HF ratio of 1. Alternatively, a differencewas found between non-surviving (LF/HF = 0.2) and surviving(LF/HF = 3.1) cardiac arrest patients. However, none of the fourspectral powers involved in this calculation had a median above7.6 ms2.
None of the values above defined by ratio would be meaning-ful by themselves, and in the context of the original papers areappropriately reported and interpreted with both measures of theraw spectral power and total power. But as seen in Table 2, this isnot the case for approximately 30% of published work.
LIMITATIONSThere are several limitations to the present work, the most obvi-ous of which is that it makes no attempt to propose a methodby which spectral power should be assessed. There are a pro-found amount of variables to consider regarding such a question;whether spectral assumptions are appropriate in the first instance,which variant of spectral analysis is sufficient or optimal, howheartbeat series should be interpolated (if at all), how the seriesshould be corrected (if at all) or windowed, and so forth.
On the same basis, this work records neither outcomes nor dif-ferences between free and paced breathing, specific time of day ofrecording, or participant age. The data set as reviewed is incapableof sustaining the scale of such a meta-analysis—for instance,Nunan et al. (2010) initially reviewed over 3000 individual piecesof research to draw a sample of n = 44 in which different meth-ods of spectral analysis and the values they return within LF andHF bands could be compared, a requirement to meta-analyticallycompare regular measures of HRV spectral power to normalizedor ratio variables. This relationship would almost certainly inter-act with the use of HRV to predict, investigate or stratify clinicalconditions, as HRV values may be profoundly affected especiallyby autonomic and circulatory diseases. As a consequence, thiswork cannot speak to whether normalized or ratio units are capa-ble of sustaining conclusions which are similar to those from rawvalues. Regardless of the basis on which they are characterized,or their internal consistency, or the manner of their usage, theymay still reliably report the same or similar conclusions to othermethods.
Finally, this work cannot determine the dispersion of valuesover the time of day or lifespan, or any relationship between thesevariables and the methodology used. This would be a worthy topicof future investigation, as HRV is used differentially within par-ticular fields which are defined by time or age at recording (forinstance, chronobiology or antenatal care), and the methodologybetween them is rarely compared.
CONCLUSIONThis review has concentrated on commonly used methodology,and hence the internal and external consistency, for collectingHRV by frequency analysis over the short term. In general, thenature of commonly used HRV metrics are not well under-stood, and these measurement are intimately related both ona mathematical level and in practice. Regardless of this, they
Frontiers in Physiology | Cardiac Electrophysiology May 2014 | Volume 5 | Article 177 | 12
Heathers Methodology in HRV
are frequently treated as independent concepts and deployedredundantly. Additionally, insufficient attention is paid to theenvironment of data collection. None of these are trivial concerns;rather, they call into question the accuracy of the existing litera-ture on HRV and warrant the re-establishment of an authoritativesource for correct methodology and practice.
FUNDING SOURCEThe author was supported by an Australian Postgraduate Awardscholarship at the University of Sydney.
SUPPLEMENTARY MATERIALThe Supplementary Material for this article can be foundonline at: http://www.frontiersin.org/journal/10.3389/fphys.2014.00177/abstract
REFERENCESAkselrod, S., Gordon, D., Ubel, F. A., Shannon, D. C., Berger, A. C., and Cohen,
R. J. (1981). Power spectrum analysis of heart rate fluctuation: a quantita-tive probe of beat-to-beat cardiovascular control. Science 213, 220–222. doi:10.1126/science.6166045
Alvarenga, M. E., Richards, J. C., Lambert, G., and Esler, M. D. (2006).Psychophysiological mechanisms in panic disorder: a correlative analysis ofnoradrenaline spillover, neuronal noradrenaline reuptake, power spectral anal-ysis of heart rate variability, and psychological variables. Psychosom. Med. 68,8–16. doi: 10.1097/01.psy.0000195872.00987.db
An, H., Kulkarni, R., Nagarathna, R., and Nagendra, H. (2010). Measures of heartrate variability in women following a meditation technique. Int. J. Yoga 3, 6–9.doi: 10.4103/0973-6131.66772
Bahjaoui-Bouhaddi, M., Cappelle, S., Henriet, M. T., Dumoulin, G., Wolf, J. P., andRegnard, J. (2000). Graded vascular autonomic control versus discontinuouscardiac control during gradual upright tilt. J. Auton. Nerv. Syst. 79, 149–155.doi: 10.1016/S0165-1838(99)00068-5
Ben-Dror, I., Weissman, A., Leurer, M. K., Eldor-Itskovitz, J., and Lowenstein, L.(2012). Alterations of heart rate variability in women with overactive bladdersyndrome. Int. Urogynecol. J. 23, 1081–1086. doi: 10.1007/s00192-012-1738-7
Ben-Tal, A., Shamailov, S. S., and Paton, J. F. (2012). Evaluating the phys-iological significance of respiratory sinus arrhythmia: looking beyondventilation-perfusion efficiency. J. Physiol. 590, 1989–2008. doi: 10.1113/jphys-iol.2011.222422
Berntson, G., Bigger, J. Jr., Eckberg, D., Grossman, P., Kaufmann, P., Malik, M.,et al. (1997). Heart rate variability: origins, methods, and interpretive caveats.Psychophysiology 34, 623. doi: 10.1111/j.1469-8986.1997.tb02140.x
Berntson, G. G., and Cacioppo, J. T. (2007). “Heart rate variability: stress and psy-chiatric conditions,” in Dynamic Electrocardiography, eds M. Malik and J. Camm(Oxford, UK: Blackwell Publishing), 57–64.
Billman, G. E. (2011). Heart rate variability–a historical perspective. Front. Physiol.2:86. doi: 10.3389/fphys.2011.00086
Billman, G. E. (2013). The LF/HF ratio does not accurately measure cardiacsympatho-vagal balance. Front. Physiol. 4:26. doi: 10.3389/fphys.2013.00026
Brown, T. E., Beightol, L. A., Koh, J., and Eckberg, D. L. (1993). Important influenceof respiration on human RR interval power spectra is largely ignored. J. Appl.Physiol. 75, 2310–2317.
Buccelletti, E., Gilardi, E., Scaini, E., Galiuto, L., Persiani, R., Biondi, A., et al.(2009). Heart rate variability and myocardial infarction: systematic literaturereview and metanalysis. Eur. Rev. Med. Pharmacol. Sci. 13, 299–307.
Burr, R. L. (2007). Interpretation of normalized spectral heart rate variabilityindices in sleep research: a critical review. Sleep 30, 913–919.
Chan, G. S., Middleton, P. M., Celler, B. G., Wang, L., and Lovell, N. H. (2007).Change in pulse transit time and pre-ejection period during head-up tilt-induced progressive central hypovolaemia. J. Clin. Monit. Comput. 21, 283–293.doi: 10.1007/s10877-007-9086-8
Chemla, D., Young, J., Badilini, F., Maison-Blanche, P., Affres, H., Lecarpentier, Y.,et al. (2005). Comparison of fast Fourier transform and autoregressive spectralanalysis for the study of heart rate variability in diabetic patients. Int. J. Cardiol.104, 307–313. doi: 10.1016/j.ijcard.2004.12.018
Chen, W. L., Shen, Y. S., Huang, C. C., Chen, J. H., and Kuo, C. D.(2012). Postresuscitation autonomic nervous modulation after cardiac arrestresembles that of severe sepsis. Am. J. Emerg. Med. 30, 143–150. doi:10.1016/j.ajem.2010.11.013
Chiladakis, J. A., Georgiopoulou, E., and Alexopoulos, D. (2004). Autonomic effectsof nebivolol versus atenolol in healthy subjects. Cardiovasc. Drugs Ther. 18,469–473. doi: 10.1007/s10557-004-6224-0
Chosy, J. J., and Graham, D. T. (1965). Catecholamines in vasovagal fainting.J. Psychosom. Res. 9, 189. doi: 10.1016/0022-3999(65)90032-2
Cox, H., Kaye, D., Thompson, J., Turner, A., Jennings, G., Itsiopoulos, C., et al.(1995). Regional sympathetic nervous activation after a large meal in humans.Clin. Sci. (Lond.) 89, 145.
Eckberg, D. L. (1997). Sympathovagal balance: a critical appraisal. Circulation 96,3224–3232. doi: 10.1161/01.CIR.96.9.3224
Eckberg, D. L. (2009). Point:counterpoint: respiratory sinus arrhythmia is due toa central mechanism vs. respiratory sinus arrhythmia is due to the barore-flex mechanism. J. Appl. Physiol. 106, 1740–1742. doi: 10.1152/japplphys-iol.91107.2008
Elghozi, J. L., and Julien, C. (2007). Sympathetic control of short-term heartrate variability and its pharmacological modulation. Fundam. Clin. Pharm. 21,337–347. doi: 10.1111/j.1472-8206.2007.00502.x
Elstad, M. (2012). Respiratory variations in pulmonary and systemic bloodflow in healthy humans. Acta Physiol. 205, 341–348. doi: 10.1111/j.1748-1716.2012.02419.x
Fagius, J., and Berne, C. (1994). Increase in muscle nerve sympathetic activity inhumans after food intake. Clin. Sci. 86, 159–167.
Fagius, J., and Karhuvaara, S. (1989). Sympathetic activity and blood pressureincreases with bladder distension in humans. Hypertension 14, 511–517. doi:10.1161/01.HYP.14.5.511
Goedhart, A. D., Willemsen, G., Houtveen, J. H., Boomsma, D. I., and De Geus,E. J. (2008). Comparing low frequency heart rate variability and preejectionperiod: two sides of a different coin. Psychophysiology 45, 1086–1090. doi:10.1111/j.1469-8986.2008.00710.x
Goldstein, D., Chang, P., Eisenhofer, G., Miletich, R., Finn, R., Bacher, J., et al.(1990). Positron emission tomographic imaging of cardiac sympathetic inner-vation and function. Circulation 81, 1606–1621. doi: 10.1161/01.CIR.81.5.1606
Goldstein, D. S., Bentho, O., Park, M. Y., and Sharabi, Y. (2011). Low-frequencypower of heart rate variability is not a measure of cardiac sympathetictone but may be a measure of modulation of cardiac autonomic outflowsby baroreflexes. Exp. Physiol. 96, 1255–1261. doi: 10.1113/expphysiol.2010.056259
Goldstein, D. S., Eisenhofer, G., Dunn, B. B., Armando, I., Lenders, J.,Grossman, E., et al. (1993). Positron emission tomographic imaging of car-diac sympathetic Innervation using 6-[18F] Fluorodopamine: initial findingsin humans. J. Am. Coll. Cardiol. 22, 1961–1971. doi: 10.1016/0735-1097(93)90786-Z
Grassi, G., and Esler, M. (1999). How to assess sympathetic activity in humans.J. Hypertens. 17, 719–734. doi: 10.1097/00004872-199917060-00001
Grasso, R., Schena, F., Gulli, G., and Cevese, A. (1997). Does low-frequency vari-ability of heart period reflect a specific parasympathetic mechanism? J. Auton.Nerv. Syst. 63, 30–38. doi: 10.1016/S0165-1838(96)00128-2
Guyton, A. C., and Harris, J. W. (1951). Pressoreceptor-autonomic oscillation: aprobable cause of vasomotor waves. Am. J. Physiol. 165, 158–166.
Hayano, J., Yasuma, F., Okada, A., Mukai, S., and Fujinami, T. (1996). Respiratorysinus arrhythmia. A phenomenon improving pulmonary gas exchange andcirculatory efficiency. Circulation 94, 842–847. doi: 10.1161/01.CIR.94.4.842
Heathers, J. A. (2013). Smartphone-enabled pulse rate variability: an alternativemethodology for the collection of heart rate variability in psychophysiologicalresearch. Int. J. Psychophys. 89, 297–304. doi: 10.1016/j.ijpsycho.2013.05.017
Hirsch, J., and Bishop, B. (1981). Respiratory sinus arrhythmia in humans: howbreathing pattern modulates heart rate. Am. J. Physiol. Heart Circ. Physiol. 241,H620–H629.
Hopf, H. B., Skyschally, A., Heusch, G., and Peters, J. (1995). Low-frequency spec-tral power of heart rate variability is not a specific marker of cardiac sympatheticmodulation. Anesthesiology 82, 609–619. doi: 10.1097/00000542-199503000-00002
Houle, M. S., and Billman, G. E. (1999). Low-frequency component of the heartrate variability spectrum: a poor marker of sympathetic activity. Am. J. Physiol.Heart Circ. Physiol. 276, H215–H223.
www.frontiersin.org May 2014 | Volume 5 | Article 177 | 13

Heathers Methodology in HRV
Introna, R., Yodlowski, E., Pruett, J., Montano, N., Porta, A., and Crumrine, R.(1995). Sympathovagal effects of spinal anesthesia assessed by heart rate vari-ability analysis. Anesth. Analg. 80, 315–321. doi: 10.1097/00000539-199502000-00019
Iwase, S., Mano, T., and Saito, M. (1987). Effects of graded head-up tilting onmuscle sympathetic activities in man. Physiologist 30, S62.
Krygier, J., Heathers, J. A., Shahrestani, S., Abbott, M., Gross, J. J., and Kemp, A.H. (2013). Mindfulness meditation, well-being, and heart rate variability: a pre-liminary investigation into the impact of intensive Vipassana meditation. Int. J.Psychophys. 89, 305–313. doi: 10.1016/j.ijpsycho.2013.06.017
Jokkel, G., Bonyhay, I., and Kollai, M. (1995). Heart rate variability after completeautonomic blockade in man. J. Auton. Nerv. Syst. 51, 85–89. doi: 10.1016/0165-1838(95)80010-8
Jordan, J., Shannon, J. R., Black, B. K., Ali, Y., Farley, M., Costa, F., et al. (2000). Thepressor response to water drinking in humans a sympathetic reflex? Circulation101, 504–509. doi: 10.1161/01.CIR.101.5.504
Julien, C. (2006). The enigma of Mayer waves: facts and models. Cardiovasc. Res.70, 12–21. doi: 10.1016/j.cardiores.2005.11.008
Kamath, M. V., and Fallen, E. L. (1993). Power spectral analysis of heart ratevariability: a noninvasive signature of cardiac autonomic function. Crit. Rev.Biomed. Eng. 21, 245–311.
Karemaker, J. M. (2009). Counterpoint: respiratory sinus arrhythmia is due to thebaroreflex mechanism. J. Appl. Physiol. 106, 1742–1743. doi: 10.1152/japplphys-iol.91107.2008a
Katona, P. G., and Jih, F. (1975). Respiratory sinus arrhythmia: noninvasive measureof parasympathetic cardiac control. J. Appl. Physiol. 39, 801–805.
Katona, P. G., Lipson, D., and Dauchot, P. J. (1977). Opposing central and periph-eral effects of atropine on parasympathetic cardiac control. Am. J. Physiol. HeartCirc. Physiol. 232, H146–H151.
Kobayashi, H., Park, B. J., and Miyazaki, Y. (2012). Normative references of heartrate variability and salivary alpha-amylase in a healthy young male population.J. Physiol. Anthropol. 31:9. doi: 10.1186/1880-6805-31-9
Levy, M. (1984). Cardiac sympathetic-parasympathetic interactions. Fed. Proc. 432598–2602.
Liu, J., Qiao, X., and Chen, J. D. (2004). Vagal afferent is involved in short-pulse gastric electrical stimulation in rats. Dig. Dis. Sci. 49, 729–737. doi:10.1023/B:DDAS.0000030081.91006.86
Lombardi, F., Sandrone, G., Pernpruner, S., Sala, R., Garimoldi, M., Cerutti, S.,et al. (1987). Heart rate variability as an index of sympathovagal interaction afteracute myocardial infarction. Am. J. Cardiol. 60, 1239–1245. doi: 10.1016/0002-9149(87)90601-1
Lu, C. L., Zou, X., Orr, W. C., and Chen, J. D. (1999). Postprandial changes of sym-pathovagal balance measured by heart rate variability. Dig. Dis. Sci. 44, 857–861.doi: 10.1023/A:1026698800742
Malik, M. (1996). Task force of the european society of cardiology the north amer-ican society of pacing and electrophysiology. Heart rate variability. Circulation93, 1043–1065.
Malliani, A. (2005). Heart rate variability: from bench to bedside. Eur. J. Intern.Med. 16, 12–20. doi: 10.1016/j.ejim.2004.06.016
Malliani, A., Pagani, M., Furlan, R., Guzzetti, S., Lucini, D., Montano, N.,et al. (1997). Individual recognition by heart rate variability of two differ-ent autonomic profiles related to posture. Circulation 96, 4143–4145. doi:10.1161/01.CIR.96.12.4143
Malliani, A., Pagani, M., Lombardi, F., and Cerutti, S. (1991). Cardiovascular neu-ral regulation explored in the frequency domain. Circulation 84, 482–492. doi:10.1161/01.CIR.84.2.482
Malliani, A., Pagani, M., Montano, N., and Mela, G. S. (1998). Sympathovagal bal-ance: a reappraisal. Circulation 98, 2640a–2643. doi: 10.1161/01.CIR.98.23.2640
Massin, M. M., Derkenne, B., and von Bernuth, G. (1999). Correlations betweenindices of heart rate variability in healthy children and children with congenitalheart disease. Cardiology 91, 109–113. doi: 10.1159/000006889
Massin, M. M., Maeyns, K., Withofs, N., Ravet, F., and Gérard, P. (2000). Circadianrhythm of heart rate and heart rate variability. Arch. Dis. Child. 83, 179–182.doi: 10.1136/adc.83.2.179
May, M., and Jordan, J. (2011). The osmopressor response to water drink-ing. Am. J. Physiol. Regul Integr Comp Physiol. 300, R40–R46. doi:10.1152/ajpregu.00544.2010
McHugh, J., Keller, N. R., Appalsamy, M., Thomas, S. A., Raj, S. R., Diedrich,A., et al. (2010). Portal osmopressor mechanism linked to transient receptor
potential vanilloid 4 and blood pressure control. Hypertension 55, 1438–1443.doi: 10.1161/HYPERTENSIONAHA.110.151860
Mehnert, U., Knapp, P. A., Mueller, N., Reitz, A., and Schurch, B. (2009). Heart ratevariability: an objective measure of autonomic activity and bladder sensationsduring urodynamics. Neurourol. Urodyn. 28, 313–319. doi: 10.1002/nau.20641
Mendonca, G. V., Teixeira, M. S., Heffernan, K. S., and Fernhall, B. (2013).Chronotropic and pressor effects of water ingestion at rest and in response toincremental dynamic exercise. Exp. Physiol. 98, 1133–1143. doi: 10.1113/exp-physiol.2013.071886
Moak, J. P., Goldstein, D. S., Eldadah, B. A., Saleem, A., Holmes, C., Pechnik,S., et al. (2007). Supine low-frequency power of heart rate variability reflectsbaroreflex function, not cardiac sympathetic innervation. Heart Rhythm 4,1523–1529. doi: 10.1016/j.hrthm.2007.07.019
Montano, N., Ruscone, T. G., Porta, A., Lombardi, F., Pagani, M., and Malliani,A. (1994). Power spectrum analysis of heart rate variability to assess thechanges in sympathovagal balance during graded orthostatic tilt. Circulation 90,1826–1831. doi: 10.1161/01.CIR.90.4.1826
Mulder, G., and Mulder, L. J. (1981). Information processing and cardiovascularcontrol. Psychophysiology 18, 392–402. doi: 10.1111/j.1469-8986.1981.tb02470.x
Muralikrishnan, K., Balakrishnan, B., Balasubramanian, K., and Visnegarawla, F.(2012). Measurement of the effect of Isha Yoga on cardiac autonomic nervoussystem using short-term heart rate variability. J. Ayurveda Integr. Med. 3, 91–96.doi: 10.4103/0975-9476.96528
Nater, U. M., Rohleder, N., Schlotz, W., Ehlert, U., and Kirschbaum, C.(2007). Determinants of the diurnal course of salivary alpha-amylase.Psychoneuroendocrino 32, 392–401. doi: 10.1016/j.psyneuen.2007.02.007
Nederkoorn, C., Smulders, F. T. Y., and Jansen, A. (2000). Cephalic phaseresponses, craving and food intake in normal subjects. Appetite 35, 45–55. doi:10.1006/appe.2000.0328
Newlin, D. B., and Levenson, R. W. (1979). Pre-ejection period: measuringbeta-adrenergic influences upon the heart. Psychophysiology 16, 546–552. doi:10.1111/j.1469-8986.1979.tb01519.x
Notarius, C., and Floras, J. (2001). Limitations of the use of spectral analysis ofheart rate variability for the estimation of cardiac sympathetic activity in heartfailure. Europace 3, 29–38. doi: 10.1053/eupc.2000.0136
Notarius, C. F., Butler, G. C., Ando, S., Pollard, M. J., Senn, B. L., and Floras, J.S. (1999). Dissociation between microneurographic and heart rate variabilityestimates of sympathetic tone in normal subjects and patients with heart failure.Clin. Sci. 96, 557–565. doi: 10.1042/CS19980347
Nunan, D., Sandercock, G. R., and Brodie, D. A. (2010). A quantitative sys-tematic review of normal values for short-term heart rate variability inhealthy adults. Pacing Clin. Electrophysiol. 33, 1407–1417. doi: 10.1111/j.1540-8159.2010.02841.x
O’Brien, I., O’Hare, P., and Corrall, R. (1986). Heart rate variability in healthy sub-jects: effect of age and the derivation of normal ranges for tests of autonomicfunction. Br. Heart J. 5, 348–354.
Pagani, M., Lombardi, F., Guzzetti, S., Rimoldi, O., Furlan, R., Pizzinelli, P., et al.(1986). Power spectral analysis of heart rate and arterial pressure variabilities asa marker of sympatho-vagal interaction in man and conscious dog. Circ. Res.59, 178–193. doi: 10.1161/01.RES.59.2.178
Pagani, M., Lombardi, F., Guzzetti, S., Sandrone, G., Rimoldi, O., Malfatto, G., et al.(1984). Power spectral density of heart rate variability as an index of sympatho-vagal interaction in normal and hypertensive subjects. J. Hypertens Suppl. 2,S383–S385.
Pagani, M., Lucini, D., and Porta, A. (2012). Sympathovagal balance from heartrate variability: time for a second round? Exp. Physiol. 97, 1141–1142. doi:10.1113/expphysiol.2012.066977
Peng, C. K., Havlin, S., Stanley, H. E., and Goldberger, A. L. (1995). Quantificationof scaling exponents and crossover phenomena in nonstationary heartbeat timeseries. Chaos 5, 82–87. doi: 10.1063/1.166141
Picard, G., Tan, C. O., Zafonte, R., and Taylor, J. A. (2009). Incongruous changes inheart period and heart rate variability with vagotonic atropine: implications forrehabilitation medicine. PM&R 1, 820–826. doi: 10.1016/j.pmrj.2009.07.017
Porges, S. W. (1995). Orienting in a defensive world: mammalian modificationsof our evolutionary heritage. A polyvagal theory. Psychophysiology 32, 301–318.doi: 10.1111/j.1469-8986.1995.tb01213.x
Porges, S. W., and Byrne, E. A. (1992). Research methods for measurementof heart rate and respiration. Biol. Psychol. 34, 93–130. doi: 10.1016/0301-0511(92)90012-J
Frontiers in Physiology | Cardiac Electrophysiology May 2014 | Volume 5 | Article 177 | 14
Heathers Methodology in HRV
Pozo, F., Fueyo, A., Esteban, M. M., Rojo-Ortega, J. M., and Marin, B. (1985). Bloodpressure changes after gastric mechanical and electrical stimulation in rats. Am.J. Physiol. 249, G739–G744.
Rahman, F., Pechnik, S., Gross, D., Sewell, L., and Goldstein, D. S. (2011). Lowfrequency power of heart rate variability reflects baroreflex function, not cardiacsympathetic innervation. Clin. Auton. Res. 21, 133–141. doi: 10.1007/s10286-010-0098-y
Revington, M., and McCloskey, D. (1990). Sympathetic-parasympathetic interac-tions at the heart, possibly involving neuropeptide Y, in anaesthetized dogs.J. Physiol. 428, 359–370.
Reyes del Paso, G. A., Langewitz, W., Mulder, L. J., Roon, A., and Duschek, S.(2013). The utility of low frequency heart rate variability as an index of sympa-thetic cardiac tone: a review with emphasis on a reanalysis of previous studies.Psychophysiology 50, 477–487. doi: 10.1111/psyp.12027
Riistama, J., Vaisanen, J., Heinisuo, S., Harjunpaa, H., Arra, S., Kokko, K., et al.(2007). Wireless and inductively powered implant for measuring electrocardio-gram. Med. Biol. Eng. Comput. 45, 1163–1174. doi: 10.1007/s11517-007-0264-0
Rossi, P., Andriesse, G. I., Oey, P. L., Wieneke, G. H., Roelofs, J. M., and Akkermans,L. M. (1998). Stomach distension increases efferent muscle sympathetic nerveactivity and blood pressure in healthy humans. J. Neurol. Sci. 161, 148–155. doi:10.1016/S0022-510X(98)00276-7
Routledge, H., Chowdhary, S., Coote, J., and Townend, J. (2002). Cardiac vagalresponse to water ingestion in normal human subjects. Clin. Sci. (Lond.) 103,157–162. doi: 10.1042/CS20010317
Saboul, D., Pialoux, V., and Hautier, C. (2014). The breathing effect of the LF/HFratio in the heart rate variability measurements of athletes. Eur. J. Sport Sci. 14,S282–S288. doi: 10.1080/17461391.2012.691116
Sandercock, G. (2007). Normative values, reliability and sample size estimates inheart rate variability. Clin. Sci. 113, 129–130. doi: 10.1042/CS20070137
Sandrone, G., Mortara, A., Torzillo, D., La Rovere, M. T., Malliani, A., andLombardi, F. (1994). Effects of beta blockers (atenolol or metoprolol) on heartrate variability after acute myocardial infarction. Am. J. Cardiol. 74, 340–345.doi: 10.1016/0002-9149(94)90400-6
Sarang, P. S., and Telles, S. (2006). Oxygen consumption and respiration duringand after two yoga relaxation techniques. Appl. Psychophysiol. Biofeedback 31,143–153. doi: 10.1007/s10484-006-9012-8
Schwartz, R. S., Ravussin, E., Massari, M., O’Connell, M., and Robbins, D. C.(1985). The thermic effect of carbohydrate versus fat feeding in man. Metab.Clin. Exp. 34, 285–293 doi: 10.1016/0026-0495(85)90014-9
Scott, E. M., Greenwood, J. P., Gilbey, S. G., Stoker, J. B., and Mary, D. (2001). Wateringestion increases sympathetic vasoconstrictor discharge in normal humansubjects. Clin. Sci. 100, 335–342. doi: 10.1042/CS20000177
Sleight, P., and Bernardi, L. (1998). Sympathovagal balance. Circulation 98,2640–2640. doi: 10.1161/01.CIR.98.23.2640
Sleight, P., La Rovere, M. T., Mortara, A., Pinna, G., Maestri, R., Leuzzi, S., et al.(1995). Physiology and pathophysiology of heart rate and blood pressure vari-ability in humans: is power spectral analysis largely an index of baroreflex gain?Clin. Sci. 88, 103–109.
Sloan, R. P., Shapiro, P., Bagiella, E., Bigger, J., Lo, E., and Gorman, J. (1996).Relationships between circulating catecholamines and low frequency heartperiod variability as indices of cardiac sympathetic activity during mental stress.Psychosom. Med. 58, 25–31.
Stafford, R., Harris, W., and Weissler, A. (1970). Left ventricular systolic time inter-vals as indices of postural circulatory stress in man. Circulation 41, 485–492. doi:10.1161/01.CIR.41.3.485
Suzuki, S., Matsui, T., Imuta, H., Uenoyama, M., Yura, H., Ishihara, M., et al.(2008). A novel autonomic activation measurement method for stress mon-itoring: non-contact measurement of heart rate variability using a compactmicrowave radar. Med. Biol. Eng. Comput. 46, 709–714. doi: 10.1007/s11517-007-0298-3
Taylor, J. A., Carr, D. L., Myers, C. W., and Eckberg, D. L. (1998). Mechanismsunderlying very-low-frequency RR-interval oscillations in humans. Circulation98, 547–555. doi: 10.1161/01.CIR.98.6.547
Taylor, J. A., Myers, C. W., Halliwill, J. R., Seidel, H., and Eckberg, D. L. (2001).Sympathetic restraint of respiratory sinus arrhythmia: implications for vagal-cardiac tone assessment in humans. Am. J. Physiol. Heart Circ. Physiol. 280,H2804–H2814
Thayer, J. F., and Lane, R. D. (2000). A model of neurovisceral integration inemotion regulation and dysregulation. J. Affect. Disord. 61, 201–216. doi:10.1016/S0165-0327(00)00338-4
Tzeng, Y.-C., Galletly, D. C., and Larsen, P. D. (2005). Paradoxical respiratorysinus arrhythmia in the anesthetized rat. Auton. Neurosci. 118, 25–31. doi:10.1016/j.autneu.2004.12.003
Tzeng, Y. C., Larsen, P. D., and Galletly, D. C. (2007). Mechanism of cardioven-tilatory coupling: insights from cardiac pacing, vagotomy, and sinoaorticdenervation in the anesthetized rat. Am. J. Physiol. Heart Circ. Physiol. 292,H1967–H1977. doi: 10.1152/ajpheart.01049.2006
Tzeng, Y. C., Sin, P. Y., and Galletly, D. C. (2009). Human sinus arrhythmia: incon-sistencies of a teleological hypothesis. Am. J. Physiol. Heart Circ. Physiol. 296,H65–H70. doi: 10.1152/ajpheart.00716.2008
Vlemincx, E., Van Diest, I., and Van Den Bergh, O. (2012). A sigh following sus-tained attention and mental stress: effects on respiratory variability. Physiol.Behav. 107, 1–6. doi: 10.1016/j.physbeh.2012.05.013
Walker, A. D., Muth, E. R., Odle-Dusseau, H. N., Moore, D. W., and Pilcher, J.J. (2009). The effects of 28 hours of sleep deprivation on respiratory sinusarrhythmia during tasks with low and high controlled attention demands.Psychophysiology 46, 217–224. doi: 10.1111/j.1469-8986.2008.00718.x
Welle, S., Lilavivat, U., and Campbell, R. G. (1981). Thermic effect of feedingin man: increased plasma norepinephrine levels following glucose but notprotein or fat consumption. Metab. Clin. Exp. 30, 953–958. doi: 10.1016/0026-0495(81)90092-5
Wu, S.-D., and Lo, P.-C. (2008). Inward-attention meditation increases parasympa-thetic activity: a study based on heart rate variability. Biomed. Res. 29, 245–250.doi: 10.2220/biomedres.29.245
Conflict of Interest Statement: The authors declare that the research was con-ducted in the absence of any commercial or financial relationships that could beconstrued as a potential conflict of interest.
Received: 01 July 2013; accepted: 17 April 2014; published online: 07 May 2014.Citation: Heathers JAJ (2014) Everything Hertz: methodological issues in short-termfrequency-domain HRV. Front. Physiol. 5:177. doi: 10.3389/fphys.2014.00177This article was submitted to Cardiac Electrophysiology, a section of the journalFrontiers in Physiology.Copyright © 2014 Heathers. This is an open-access article distributed under the termsof the Creative Commons Attribution License (CC BY). The use, distribution or repro-duction in other forums is permitted, provided the original author(s) or licensor arecredited and that the original publication in this journal is cited, in accordance withaccepted academic practice. No use, distribution or reproduction is permitted whichdoes not comply with these terms.
www.frontiersin.org May 2014 | Volume 5 | Article 177 | 15