evaluation of steerable filter for detection of fibers in flowing suspensions
TRANSCRIPT

Evaluation of a steerable filter for detection of
fibres in flowing suspensions
By Allan Carlsson†, Fredrik Lundell† & L. Daniel
Soderberg†,‡
†Linne Flow Centre, KTH Mechanics, SE - 100 44 Stockholm, Sweden‡STFI-Packforsk AB, SE - 114 86 Stockholm, Sweden
Steerable filters are concluded to be useful in order to determine the orientationof fibres captured in digital images. The fibre orientation is a key variable inthe study of flowing fibre suspensions. Here digital image analysis based on afilter within the class of steerable filters is evaluated for suitability of findingthe position and orientation of fibres suspended in flowing suspensions. Insharp images with small noise levels the steerable filter succeeds in determiningthe orientation of artificially generated fibres with well-defined angles. Theinfluence of reduced image quality on the orientation has been quantified. Theeffect of unsharpness and noise is studied and the results show that the errorin orientation is less than 1◦ for moderate levels. A set of images with fibressuspended in a shear flow is also analyzed. The fibre orientation distributionis determined in the flow-vorticity plane. In this analysis a comparison isalso made to a robust, but computationally more expensive, method involvingconvolutions with an oriented elliptic filter. A good agreement is found whencomparing the resulting fibre orientation distributions obtained with the twomethods.
1. Introduction
Flowing fibre suspensions are found in a variety of applications such as fibre-reinforced composites processing and paper manufacturing. The final proper-ties of the products of these applications are often strongly correlated to thefibre orientation. An example image from a flowing fibre suspension is shown infigure 1. In this specific image fibres are suspended in a shear flow over a solidwall and the image plane is parallel to the wall. From images like figure 1 quan-tities such as local fibre concentration and fibre velocities, both translationaland rotational, could be of interest. To obtain these measures it is essentialto be able to determine the position and orientation of individual fibres. It isusually preferred to extract this information by digital image analysis.
151

152 Allan Carlsson, Fredrik Lundell & L. Daniel Soderberg
Figure 1. Fibres in a suspension flowing over a solid surface.
A reliable approach of finding the position and orientation of fibres cap-tured in images is to use oriented filters (a short introduction to image filteringis given in section 2). A typical approach is to construct a filter with a shapethat resembles the shape of the fibres and compute the convolution of the filterwith the images containing fibres. A high value of the convolution at a certainposition indicates that the image has a local resemblance with the filter at thatposition. To find the orientation of the fibres the filter is rotated to differentorientations and a convolution is computed for each orientation. This courseof action was for instance used by Holm & Soderberg (2007) to find the ori-entation of fibres in a shear flow. Although the method is reliable it can beexpensive from a computational perspective since the angular resolution will beproportional to the number of convolutions performed. From a computationalpoint of view Freeman & Adelson (1991) introduced a more efficient approach,for general feature detection, i.e. not restricted to fibres. The term steerablefilter was introduced in order to describe a class of filters in which a filter ofarbitrary orientation can be obtained from a linear combination of a limitedamount of basis filters. This implies that, instead of computing several convo-lutions of a filter rotated to different orientations with an image, it is sufficientto compute the convolutions of the basis filters with the image. In this mannerthe orientation dependency is eliminated from the convolutions and thereby itis possible to cut down on the computational load and still have a good angularresolution.
A method for designing filters, within the class of steerable filters, for2D feature detection, was proposed by Jacob & Unser (2004). Among others

Evaluation of a steerable filter for detection of fibres in suspensions 153
a filter for ridge detection was designed. This filter was used by Carlsson,Lundell & Soderberg (2007) to find the orientation distribution of fibres in ashear flow. In the present study this ridge detector is evaluated. The ability tofind the orientation of fibres as well as the sensitivity to noise and unsharpness isstudied. This is done by capturing images of a picture containing printed fibreswith well-defined orientations. The paper is finally concluded by a comparisonof the method with a more traditional approach, using an elliptic filter, on acase where fibres have been suspended in a shear flow.
2. Image filtering for analysis of fibre images
The image filtering considered in this study will be based on the 2D convolutionoperator. The discrete convolution of an image f(m,n) with a filter matrixh(x, y) is given by
I(m,n) = f(m,n) ∗ h(x, y) =∞∑
x=−∞
∞∑
y=−∞
f(m− x, n− y)h(x, y). (1)
As seen in equation (1) the convolution is given by a sum of products. Theconvolution I will also be referred to as the intensity throughout this text. Thefilter matrix can be regarded as a function that transforms the original imageby giving some weight to the neighboring pixels for each pixel in the image.Note that the convolution is written as sums over infinite intervals. This canbe done since the elements of h(x, y) are essentially zero apart from in a regionin the centre of the matrix. However, in practice the sums are computed overfinite intervals.
Image filtering can be used for various applications. There are for instancefilters to make an image appear more sharp or blurry. There are also filtersthat emphasize specific features of an image, like for instance rod-like objectssuch as fibres. These are the kind of filters that are of interest for this study.
2.1. Elliptic Mexican hat for detection of fibres
The perhaps most obvious way to detect fibres in an image is to let h(x, y) inequation (1) resemble a fibre. This can be obtained by an elliptic “Mexicanhat” here defined as
h(x, y) =
(
4
[
( x
a√
2
)2
+( y
b√
2
)2]
− 2
)
e−
((
x
a√
2
)
2
+(
y
b√
2
)
2)
, (2)
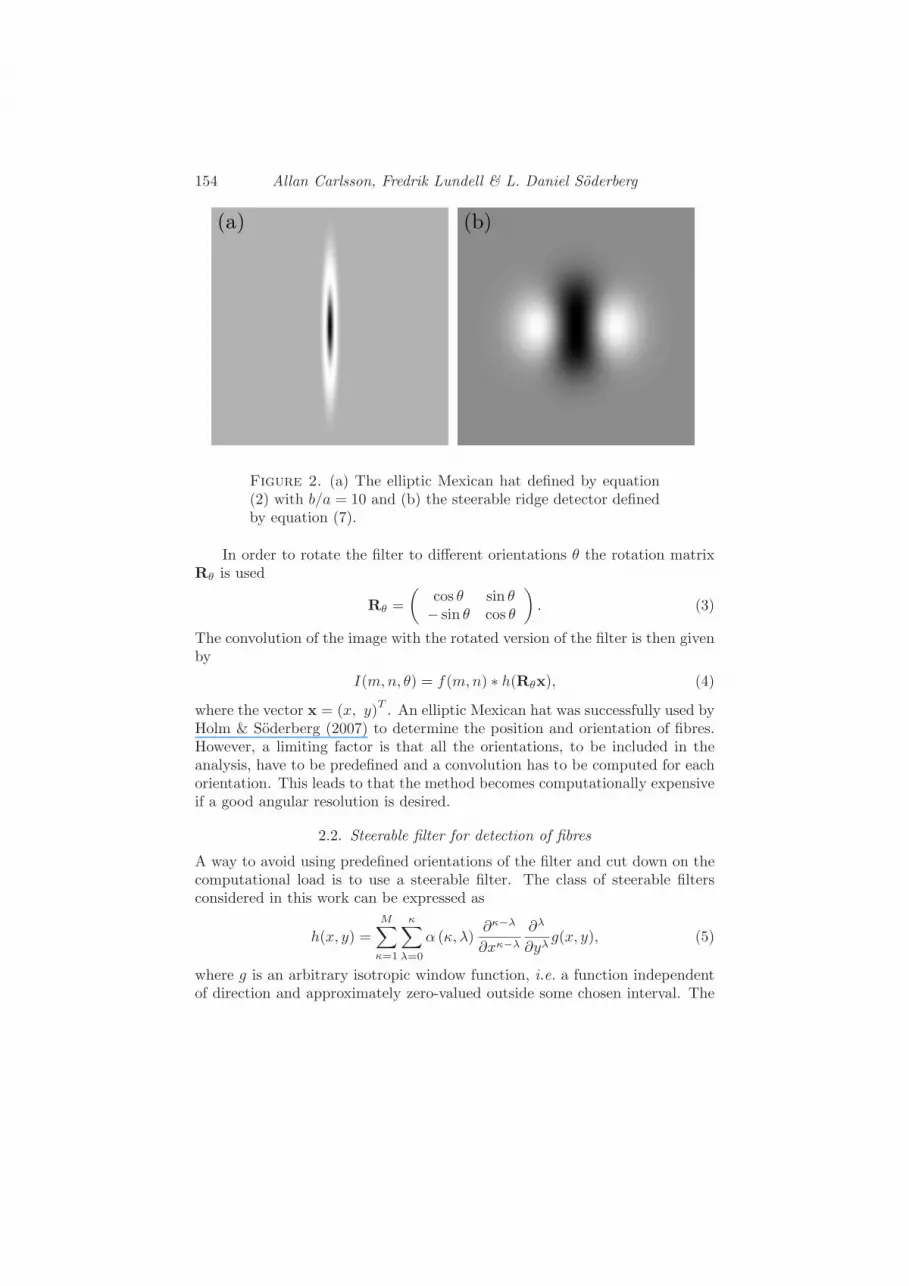
where a and b are constants defining the shape of the filter. Putting h = 0defines the ellipse (x/a)2 + (y/b)2 = 1. Thus, by letting 2a and 2b be equal tothe fibre width and length, respectively, a filter suitable for detection of suchfibres is generated. In figure 2 (a) the filter is shown for b/a = 10.
154 Allan Carlsson, Fredrik Lundell & L. Daniel Soderberg
(a) (b)
Figure 2. (a) The elliptic Mexican hat defined by equation(2) with b/a = 10 and (b) the steerable ridge detector definedby equation (7).
In order to rotate the filter to different orientations θ the rotation matrixRθ is used
Rθ =
(
cos θ sin θ− sin θ cos θ
)
. (3)
The convolution of the image with the rotated version of the filter is then givenby
I(m,n, θ) = f(m,n) ∗ h(Rθx), (4)
where the vector x = (x, y)T. An elliptic Mexican hat was successfully used by
Holm & Soderberg (2007) to determine the position and orientation of fibres.However, a limiting factor is that all the orientations, to be included in theanalysis, have to be predefined and a convolution has to be computed for eachorientation. This leads to that the method becomes computationally expensiveif a good angular resolution is desired.
2.2. Steerable filter for detection of fibres
A way to avoid using predefined orientations of the filter and cut down on thecomputational load is to use a steerable filter. The class of steerable filtersconsidered in this work can be expressed as
h(x, y) =
M∑
κ=1
κ∑
λ=0
α (κ, λ)∂κ−λ
∂xκ−λ
∂λ
∂yλg(x, y), (5)
where g is an arbitrary isotropic window function, i.e. a function independentof direction and approximately zero-valued outside some chosen interval. The

Evaluation of a steerable filter for detection of fibres in suspensions 155
derivatives of g with respect to x and y, which are henceforth called gκ,λ, arecalled basis filters and α (κ, λ) are constants defining the shape of the steerablefilter. Since g is isotropic a rotated version of a steerable filter can be obtainedfrom a linear combination of a limited set of basis filters. For a general Mth
order detector M(M + 3)/2 basis filters gκ,λ, together with their constantsα (κ, λ), are required to define a steerable filter.
The orientations at which the highest intensities will be found, from theconvolution of a steerable filter with an image, at all positions in the image,can be obtained through the convolutions of the basis filters with the image.Choosing the window function to be a Gaussian, Jacob & Unser (2004) derivedan optimal ridge detector for M = 2, using the Dirac delta function to modelthe ridge. The Gaussian is defined as
g (x, y) = e−(x2+y2). (6)
The resulting steerable filter is shown in figure 2 (b) and is defined by
h(x, y) =
√
3
4π
(
∂2g
∂x2− 1
3
∂2g
∂y2
)
. (7)
It can be shown that the convolution of any rotated version of the steerablefilter h(x, y), in equation (7), with the image f(m,n) can be written
I(m,n, θ) = f(m,n) ∗ h(Rθx)
=
√
3
4π
(
f2,0 −1
3f2,2
)
cos2 θ +
√
16
3πf2,1 cos θ sin θ
+
√
3
4π
(
f2,2 −1
3f2,0
)
sin2 θ, (8)
where θ is the angle by which the filter is rotated and fκ,λ are the convolutionsof the image with the basis filters given by
fκ,λ(m,n) = f(m,n) ∗(
∂κ−λ
∂xκ−λ
∂λ
∂yλg(x, y)
)
. (9)
For each pixel (m,n) there is an orientation maximizing the intensity I(m,n, θ).This orientation can be found by solving ∂I/∂θ = 0 with I given by equation(8). The orientation θ that corresponds to the highest intensity is determinedby putting both solutions into equation (8). As indicated by equation (8) only 3convolutions (f2,0, f2,1 and f2,2) have to be performed, for this specific steerablefilter, in order to attain the intensity for all orientations of the filter. Conse-quently, as compared to the Mexican hat, where the number of convolutions isequal to the number of orientations, the computational load is reduced.
When used for fibre detection the size of the steerable filter is scaled byfinding the two x-positions satisfying h(x, y = 0) = 0 and set the difference ofthe two x-positions to be equal to the fibre width. Note that, in contrast tothe Mexican hat, the steerable filter is only scaled with the width and not the

156 Allan Carlsson, Fredrik Lundell & L. Daniel Soderberg
length of the fibres. As a result of only scaling with the width of the fibresthe convolution of the filter with the image results in high intensities at severalpositions along the fibres. To determine the orientation of an individual fibrean averaging procedure has been imposed over all high intensity values thatcorrespond to the fibre. A threshold value is introduced, defining how high theintensity has to be in order to belong to a fibre. Based on the orientation ofthe fibre at the position with the highest intensity a search algorithm is usedto find other positions of high intensity which belong to the same fibre. Thedetermined orientation θa of the fibre is given by the average of all the angles atthe positions, belonging to the fibre, where the intensity exceeds the threshold.Also the intensity Ia of the fibre is given by the average of intensities belongingto these positions.
3. Measurement & analysis procedure
To evaluate if the steerable filter h(x, y) defined in equation (7), is capableto determine the orientation of fibres, two different experiments have beencarried out. In the first experiment the filter is used in order to detect fibres,with predefined orientations, in an artificially generated image. In the otherexperiment fibres suspended in a viscous shear flow is studied. The data isanalysed with the steerable filter and for comparison also with the Mexicanhat, defined in equation (2).
3.1. Artificial fibres with predefined angles
A picture containing 91 artificial fibres was generated and printed on a topquality printer. The orientations of the artificial fibres are well defined and onedegree apart. The orientations are θk = 0, 1, 2, ..., 90◦, where θk is the angletaken clockwise from the vertical direction, i.e. θk = 0 and 90◦ when a fibre isoriented in the vertical and horizontal direction, respectively.
A test image is acquired by taking photographs of the printout describedabove. In figure 3 the test image is shown for various degrees of sharpness andnoise levels. A CCD-camera (Prosilica GE680) with a lens of focal length 50mm (Fujinon HF50HA-1B) was used. The relative aperture was set as low aspossible to N = 2.3. The camera was placed at a distance from the pictureof about 2.2 m to obtain sharp images with a width of the fibres w close to 2pixels, similar to the width of the fibres in figure 1. The actual width of thefibres will depend on the precise distance between the picture and the camera.The steerable filter is scaled to the actual width of the artificial fibres. Togenerate a test image 100 images are captured and the average is calculated inorder to reduce noise. The averaged amplitude of each fibre was also adjustedso that all fibres had the same amplitude. This was done to reduce effects dueto light variations.

Evaluation of a steerable filter for detection of fibres in suspensions 157
3.1a. Unsharp images. To investigate how sensitive the method is to unsharp-ness the test image was gradually traversed out of focus. For each distance,between the picture and the camera, a new set of 100 images was captured toperform the same procedure as explained above, for the original sharp test im-age. Two measurements (series A & B) were carried out. In serie A the picturewas mainly located at distances farther away from the camera lens than theplane of focus and in serie B the picture was mainly closer than the plane offocus. Both series include a total of 24 different distances between the cameraand the picture.
To quantify how sharp an image is the term circle of confusion will beintroduced. Consider a point light source that is located at some distance fromthe camera. A fraction of the light rays, from the source, will hit the lens ofthe camera and ideally, due to the curvature of the lens, the rays will convergeto a single point inside the camera. If the point source is located in the planeof focus this single point, inside the camera, will be on the sensor plane. If thepoint source is located farther away from the camera than the plane of focusthe light will still converge to a single point in the camera, although in front ofthe sensor plane. At the sensor plane it will have diverged to a diffuse circle,generally referred to as the circle of confusion. A similar effect is found for apoint source located closer to the camera than the plane of focus. However, inthis case a circle of confusion is generated since the light has yet to convergewhen it reaches the sensor plane.
In this study the diameter d of the circle of confusion is used to characterizehow sharp the test images are. By using trigonometric relations and the thinlens formula, see for instance Meyer-Arendt (1995), it is possible to derive ananalytical expression for d given by
dj =F 2 (sj − s0)
Nsj (s0 − F ), (10)
where F is the focal length of the lens and N = F/D is the relative aperturewith the entrance pupil diameter given by D. Furthermore, s0 and sj is thedistance from the lens to the plane of focus and to the picture, respectively.The significance of d should be coupled to how large it is in comparison to thefibre width w. Therefore d is normalized with w in the analysis.
3.1b. Images with noise. The method has also been evaluated for its sensitivityto noise. This was done by adding noise to the images. If the original test imageis denoted by f ′(m,n) the resulting image f(m,n) is given by the relation
f(m,n) = f ′(m,n) + η(m,n), (11)
where η(m,n) is the noise. A random zero-mean Gaussian distribution hasbeen used to model the noise, i.e. the probability density function of the added

158 Allan Carlsson, Fredrik Lundell & L. Daniel Soderberg
(a) (b)
(c) (d)
Figure 3. Test image with different noise levels and degreesof sharpness: (a) σs = 0 and d/w = 0, (b) σs = 1/4 andd/w = 0, (c) σs = 0 and d/w = −0.15 and (d) σs = 1/4 andd/w = −0.15.
noise amplitude is given by
P (η) =1
σ√
2πe(−
η2
2σ2). (12)
The generated noise is uncorrelated over the image. The variable σs quantifiesthe noise level and is defined as the standard deviation σ of the Gaussiannoise, normalized with the difference in amplitude between the fibres and itssurroundings. A total of 500 images were generated for each noise level understudy and analyzed with the steerable filter algorithm.

Evaluation of a steerable filter for detection of fibres in suspensions 159
3.2. Fibres suspended in a shear flow
A fibre suspension with black-dyed cellulose acetate fibres with a length todiameter ratio of rp = 10, suspended in a viscous shear layer, has been studiedexperimentally, see Carlsson, Lundell & Soderberg (2007) for details. The fibresuspension, driven by gravity, was flowing down a slightly inclined plane togenerate the shear layer. To visualize the fibres a CCD-camera (SONY DFW-X700) was mounted to capture images in a plane parallel to the solid wall.In the present study 100 statistically independent images is analyzed, usingtwo different feature detection algorithms. The fibre orientation distribution iscalculated with the Mexican hat and the steerable filter, defined in the previoussection.
4. Results & Discussion
The steerable filter described in section 2 is evaluated to find the artificiallygenerated fibres shown in figure 3 and the sensitivity to unsharpness and noiseis quantified. Furthermore the method is compared to a robust, but more timeconsuming, method by analyzing measurements performed on a flowing fibresuspension.
4.1. Artificial fibres with predefined angles
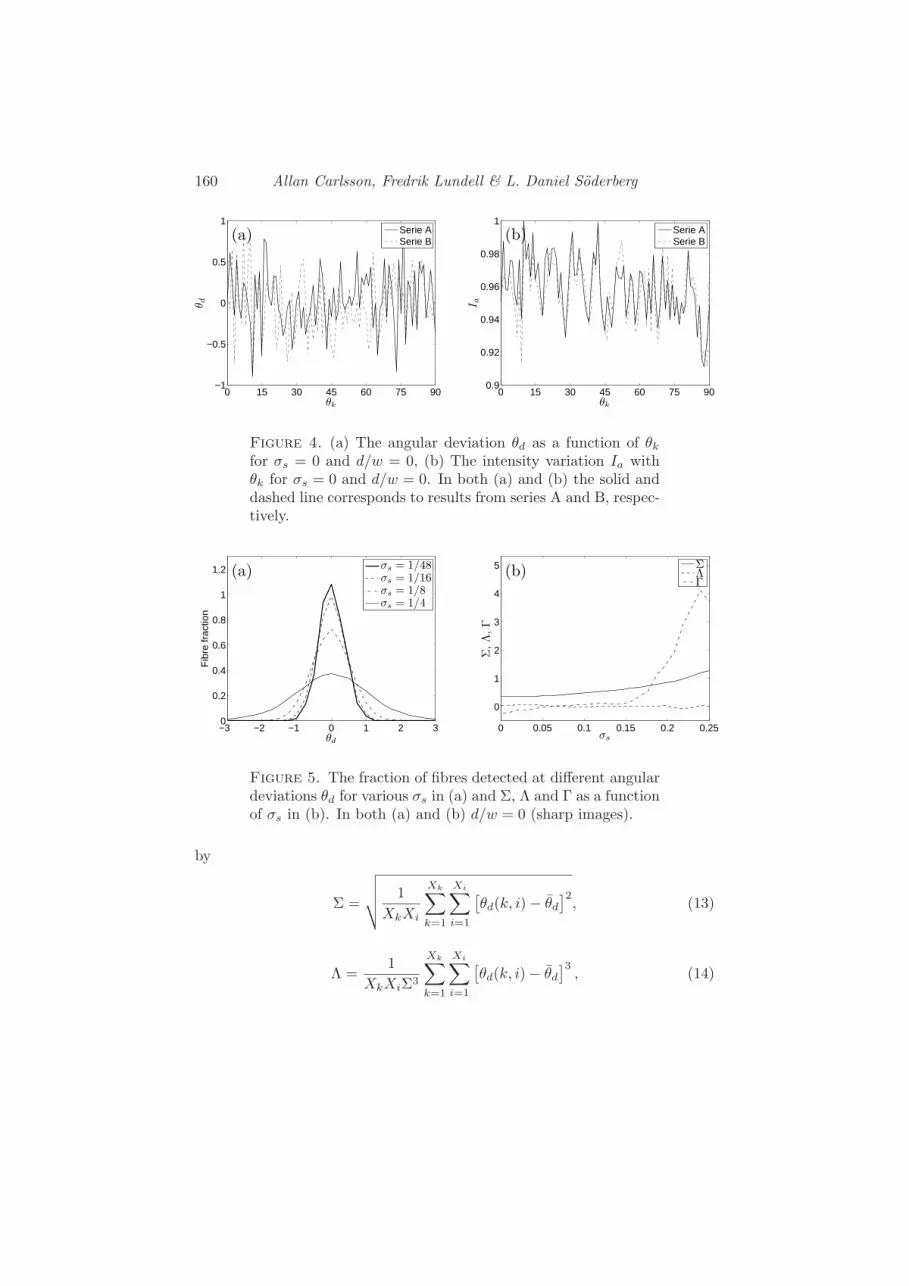
In figure 4 results from analyzing the test image, with σs = 0 and d/w = 0, forseries A and B are shown. In (a) the angular deviation θd = θa−θk is presented.Again, θa is the determined angle of a fibre and θk is the predefined angle inthe test image of the corresponding fibre. In 4 (b) the intensity, normalizedwith the maximum value among the fibres, Ia is shown as a function of θk. Thesolid and dashed line represents the results from series A and B, respectively.The steerable filter detects all of the fibres with a maximum angular deviationless than 1 degree. In figure 4 (b) it is seen that the intensity fluctuationsare moderate. The difference between the maximum and minimum intensitydiffers with less than 10%. There seem to be a periodicity of Ia in θk of about 10degrees. This is most likely a remaining effect of light variations due to the factthat there are 10 fibres in each row of the test image. Since the light settingsare similar in series A and B there is a correlation between the intensities foundin these measurements. Going back to figure 4 (a) it is noted there is no strongcorrelation between the results of series A and B indicating that there are nopreferred orientations of the steerable filter.
4.1a. Sensitivity to noise and unsharpness. In figure 5 (a) the probability den-sity function (PDF) of θd is shown for various σs with d/w = 0 and in (b) thecorresponding standard deviation Σ, skewness Λ and excess kurtosis Γ defined
160 Allan Carlsson, Fredrik Lundell & L. Daniel Soderberg
0 15 30 45 60 75 90−1
−0.5
0
0.5
1
θk
θ d
(a) Serie ASerie B
0 15 30 45 60 75 900.9
0.92
0.94
0.96
0.98
1
θk
I a
(b) Serie ASerie B
Figure 4. (a) The angular deviation θd as a function of θk
for σs = 0 and d/w = 0, (b) The intensity variation Ia withθk for σs = 0 and d/w = 0. In both (a) and (b) the solid anddashed line corresponds to results from series A and B, respec-tively.
−3 −2 −1 0 1 2 30
0.2
0.4
0.6
0.8
1
1.2
θd
Fib
re fr
actio
n
(a) σs = 1/48σs = 1/16σs = 1/8σs = 1/4
0 0.05 0.1 0.15 0.2 0.25
0
1
2
3
4
5
σs
Σ,Λ
,Γ
(b) ΣΛΓ
Figure 5. The fraction of fibres detected at different angulardeviations θd for various σs in (a) and Σ, Λ and Γ as a functionof σs in (b). In both (a) and (b) d/w = 0 (sharp images).
by
Σ =
√
√
√
√
1
XkXi
Xk∑
k=1
Xi∑
i=1
[
θd(k, i) − θd
]2, (13)
Λ =1
XkXiΣ3
Xk∑
k=1
Xi∑
i=1
[
θd(k, i) − θd
]3, (14)

Evaluation of a steerable filter for detection of fibres in suspensions 161
−0.15 −0.1 −0.05 0 0.05 0.1 0.150.5
0.6
0.7
0.8
0.9
1
d/w
I a
(a) Serie ASerie B
−0.15 −0.1 −0.05 0 0.05 0.1 0.150
0.5
1
1.5
2
d/w
Σ
(b) Serie ASerie B
Figure 6. (a) The normalized mean intensity Ia and (b) thestandard deviation Σ for different degrees of sharpness d/w.In both (a) and (b) σs = 0.
Γ =1
XkXiΣ4
Xk∑
k=1
Xi∑
i=1
[
θd(k, i) − θd
]4 − 3 (15)
are shown as a function of σs. In equations (13), (14) and (15) the number offibres per image is Xk = 91 and the number of images is Xi = 1 and 500 forσs = 0 and σs 6= 0, respectively. Furthermore, θd(k, i) denotes the computedangular deviation of fibre k in image i and θd is the angular deviation averagedover both the Xk fibres and the Xi images. When σs = 0 the mean angulardeviation θd = 0.04 and −0.03◦ for series A and B, respectively. This could bedue to a small angular offset imposed when capturing the test images or dueto that 91 fibres are not sufficient to ensure a convergence to θd = 0. Sincethe results from series A and B are similar, the results in figure 5 are based ondata from both series. It is seen, in figure 5, that the PDF of θd is symmetricalaround θd = 0, which is also verified by Λ being close to zero for all σs. Forsmall σs, Σ grows slowly with σs and remains below one degree for σs less thanabout 0.2. The growth of Σ is however increasing with σs and is larger thanone degree for the higher σs under study. For σs < 0.15 the excess kurtosis Γis close to zero. A more rapid increase of Γ is found for higher σs as the PDFbecomes more flat.
In figure 6 (a) the mean intensity Ia is shown for various degrees of sharp-ness. In these results σs = 0. The intensity has been averaged over all Xk
fibres and normalized to be equal to one at d = 0. The intensity has also beenused to determine the position of the plane of focus, i.e. the curves have beentranslated to have a maximum intensity at d = 0. It is noted that the resultsare not symmetric around d/w = 0. This is most likely due to the pixelizationof the filter, i.e. when the filter is transformed from a continuous to a discreteform in order to compute the convolutions numerically. Recall that the fibre
162 Allan Carlsson, Fredrik Lundell & L. Daniel Soderberg
0.5
0.50.5
0.75
0.75
0.751
1
1
22
25
d/w
σs
−0.1 −0.05 0 0.05 0.1 0.150
0.05
0.1
0.15
0.2
0.25
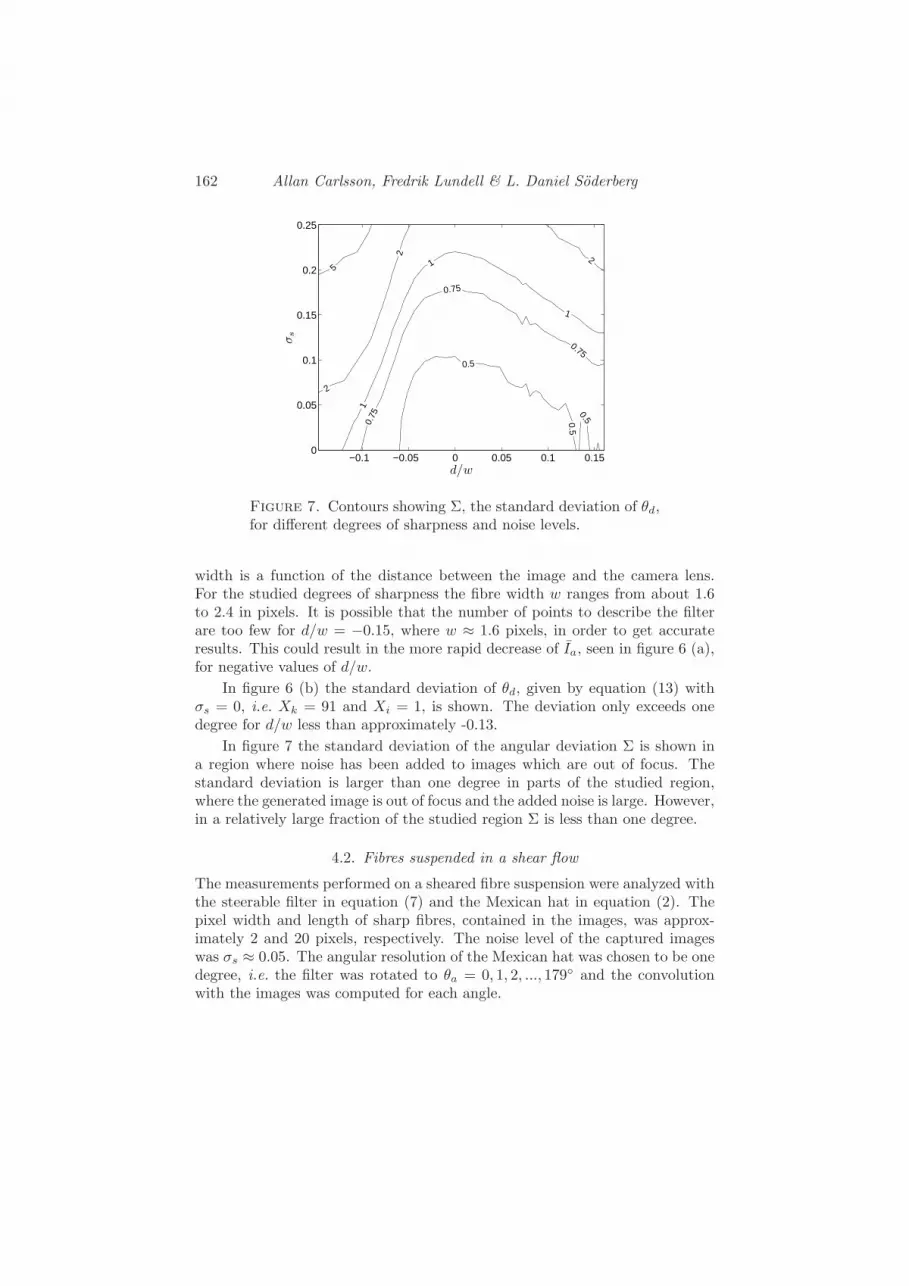
Figure 7. Contours showing Σ, the standard deviation of θd,for different degrees of sharpness and noise levels.
width is a function of the distance between the image and the camera lens.For the studied degrees of sharpness the fibre width w ranges from about 1.6to 2.4 in pixels. It is possible that the number of points to describe the filterare too few for d/w = −0.15, where w ≈ 1.6 pixels, in order to get accurateresults. This could result in the more rapid decrease of Ia, seen in figure 6 (a),for negative values of d/w.
In figure 6 (b) the standard deviation of θd, given by equation (13) withσs = 0, i.e. Xk = 91 and Xi = 1, is shown. The deviation only exceeds onedegree for d/w less than approximately -0.13.
In figure 7 the standard deviation of the angular deviation Σ is shown ina region where noise has been added to images which are out of focus. Thestandard deviation is larger than one degree in parts of the studied region,where the generated image is out of focus and the added noise is large. However,in a relatively large fraction of the studied region Σ is less than one degree.
4.2. Fibres suspended in a shear flow
The measurements performed on a sheared fibre suspension were analyzed withthe steerable filter in equation (7) and the Mexican hat in equation (2). Thepixel width and length of sharp fibres, contained in the images, was approx-imately 2 and 20 pixels, respectively. The noise level of the captured imageswas σs ≈ 0.05. The angular resolution of the Mexican hat was chosen to be onedegree, i.e. the filter was rotated to θa = 0, 1, 2, ..., 179◦ and the convolutionwith the images was computed for each angle.

Evaluation of a steerable filter for detection of fibres in suspensions 163
−90 −60 −30 0 30 60 900
0.01
0.02
0.03
0.04
0.05
0.06
θ
Fib
re fr
actio
n
(a) Steerable filterMexican hat
−15 −10 −5 0 5 10 150
0.05
0.1
0.15
0.2
0.25
0.3
θm − θs
Fib
re fr
actio
n
(b)
Figure 8. (a) Fibre orientation distribution based on analysiswith a steerable filter (solid line) and with an elliptic Mexicanhat (dashed line), (b) the distribution of the angular differenceθm − θs, where θm and θs are the orientations obtained by theMexican hat and the steerable filter, respectively.
The fibre orientation θ is analyzed in a plane parallel to a wall and isdefined to be zero in the flow direction. The number of detected fibres, bythe two different filters, depends on arbitrarily predefined threshold values ofintensity and will generally not be the same. The thresholds are adjusted sothat the same number of fibres is found in each image.
In figure 8 (a) a total of 6644 detected fibres is collected into bins with arange of 3 degrees and are presented as a function of the fibre orientation θ.Approximately the same orientation distribution is obtained with both meth-ods. In figure 8 (b) a distribution of the angular difference of individual fibresare shown. For most fibres the orientation, determined with the different meth-ods, is almost the same, but occasionally the angular difference is as much as5 degrees. The experimental measurements and results are discussed in detailby Carlsson et al. (2007). For this study it is concluded that there is a goodagreement between the two different algorithms and that steerable filters is anefficient method to detect and determine the orientation of fibres in flowingsuspensions.
5. Conclusions
A ridge detector within the class of steerable filters has been shown to bean accurate and computationally efficient method of locating and determiningthe orientation of fibres suspended in flowing suspensions. In an image con-taining 91 artificially generated sharp fibres the orientation of the fibres wasdetermined, with a standard angular deviation Σ well below one degree. Azero-mean Gaussian noise was added to the image. The standard deviation

164 Allan Carlsson, Fredrik Lundell & L. Daniel Soderberg
remained below one degree for σs < 0.2, whereas a more rapid increase ofΣ was seen for larger σs. The method was also evaluated for sensitivity tounsharpness. Also here Σ was smaller than one degree for reasonable levels.
The steerable filter was compared to an oriented elliptic Mexican hat on aset of data from measurements on fibres suspended in a shear flow. Approxi-mately the same orientation distribution was obtained with both methods andfor the majority of fibres the angular difference was small, also for individualfibres. It is noted that to obtain these results the number of convolutions perimage were 3 and 180 for the steerable filter and the Mexican hat, respectively.Thus, compared to the Mexican hat, the steerable filter is a very time efficientmethod.
Another feature of the steerable filter, which could be of use, is that itis only scaled with the width of the fibres. The angle θ is given for all posi-tions along the fibres and in principle this makes it possible to determine thecurvature of deformed fibres.

References
Carlsson, A., Lundell, F. & Soderberg, L. D. 2007 Fiber orientation controlrelated to papermaking. J. Fluids Eng. 129 (4), 457–465.
Freeman, W. T. & Adelson, E. H. 1991 The design and use of steerable filters.IEEE T. Pattern Anal. 13 (9), 891–906.
Holm, R. & Soderberg, D. 2007 Shear influence on fibre orientation. Rheol. Acta46, 721–729.
Jacob, M. & Unser, M. 2004 Design of steerable filters for feature detection usingCanny-like criteria. IEEE T. Pattern Anal. 26 (8), 1007–1019.
Meyer-Arendt, J. R. 1995 Introduction to classical and modern optics., 4th edn.Prentice-Hall.
165