evaluation of introduced cassava processing technologies
TRANSCRIPT
EVALUATION OF INTRODUCED CASSAVA PROCESSING TECHNOLOGIES
ON PRODUCTION AND CONSUMPTION USING GOAL PROGRAMMING
APPROACH
BY
MEDA THEODORY
A DISSERTATION SUBMITTED IN PARTIAL FULFILMENT OF THE
REQUIREMENTS FOR THE DEGREE OF MASTER OF SCIENCE IN
AGRICULTURAL ECONOMICS OF SOKOINE UNIVERSITY OF
AGRICULTURE. MOROGORO, TANZANIA.
2010

ABSTRACT
This study which evaluates the introduced cassava processing technologies on production
and consumption using goal programming approach was conducted in Tongwe village
(Muheza district) in Tanga region and Mikongeni village (Kibaha district) in Pwani region.
Data for the study were collected from a sample of 120 households, 2 focus group
discussions and by experimentation. The results of the study show that, the introduced
cassava processing technologies are both technically and economically efficient. The
machines such as engine powered chipper and grater consume 5 litres of fuel (petrol) to
process about 1- 1.2 tonnes of fresh cassava. To process 5 kg of fresh cassava the machines
take 3 minutes. Moreover, it takes about 1-3 days to obtain a final product (cassava flour)
whereas traditional processing technology (sun-drying) takes about 6 days and wet and
solid-state fermentation takes about 12 days. Analysis of the partial budget revealed that
mechanized processing technologies generate an average profit of TZS 316.43 per
kilogram dry weight compared to traditional processing technologies. Analysis of the
consumer’s preferences with respect to processing methods by probit regression analysis,
factors such as quality of the products, household size, quantity consumed per year and
price of those products were significant at α = 0.05 level, suggesting that there is an
increase in consumption behaviour. To estimate future trend of demand and hence
production for processed cassava flour using goal programming approach indicated that
about 128 571.4 tonnes can be produced in the two districts, if farmers use the said
technology in full scale. The study concluded that, the use of mechanized processing
technologies is more profitable. Therefore, the study recommended that, the farmers do
adopt manual chipping machine for small-scale farming, moreover engine powered chipper
and cassava grater for large-scale farming rather than using traditional processing
technologies.
ii

DECLARATION
I, Meda Theodory, do hereby declare to the Senate of Sokoine University of Agriculture
that this dissertation is my own original work and that it has neither been submitted nor is
it being concurrently submitted for degree award in any other Institution.
Meda Theodory Date
(MSc. Student)
The above declaration is confirmed
Dr. Joseph P. Hella Date
(Principal Supervisor)
Prof. Silayo, C.K. Valerian Date
(Associate Supervisor)
iii

COPYRIGHT
All rights reserved. No part of this dissertation may be reproduced, stored in any retrieved
system, or transmitted in any form, or by any other means, without prior written
permission of the author or Sokoine University of Agriculture on behalf of the author.
iv

ACKNOWLEDGEMENTS
I very humbly thank the almighty LORD, for granting me life, strength and the entire
blessing.
I am greatly indebted to my Principal Supervisor, Dr. J. P. Hella (Department of
Agricultural Economics and Agribusiness) and Associate Supervisor, Prof. V. C. K. Silayo
(Department of Agricultural Engineering and Land Planning) of Sokoine University of
Agriculture (SUA), for their tireless and consistent guidance and encouragement
throughout my study, particularly during proposal formulation and writing of this work.
Indeed, I remain indebted to my beloved parents, Mr. Theodory M. Mrimi and Mrs.
Bibyana M. Mrimi, my fiancée Buzo Honi Maige, my son Greyson and my daughter
Gladness for their patience, inspiration and heartfelt encouragement during my whole
process of study.
My sincere appreciation would be incomplete without mentioning those who assisted me in
data collection. First of all, I would record appreciation to Mrs Tabu Maghembe
(Agricultural Field Officer at Muheza district) and secondly to Mr. Charles S. Francis
(Agricultural Field Officer at Kibaha district) for the job well done. Several colleagues
assisted me in one way or another. It is difficult to mention all of them, but I am grateful to
them all.
Heartfelt thanks are also due to Mr. Ponsian Sewando my class and roommate for the
extended days of cooperation during data collection, analysis to draft writing of this work.
His useful comments on the draft of this dissertation were just too great. However, I remain
sorely responsible for any error recorded in this presentation.
v

DEDICATION
This work is dedicated to my beloved parents; My father Theodory M. Mrimi and beloved
mother Bibyana M. Mrimi who laid a good foundation of my education.
vi
TABLE CONTENTS
ABSTRACT..........................................................................................................................ii
DECLARATION.................................................................................................................iii
COPYRIGHT......................................................................................................................iv
ACKNOWLEDGEMENTS.................................................................................................v
DEDICATION.....................................................................................................................vi
TABLE CONTENTS.........................................................................................................vii
LIST OF TABLES...............................................................................................................xi
LIST OF FIGURES...........................................................................................................xii
APPENDICES...................................................................................................................xiii
LIST OF ABBREVIATIONS AND ACRONYMS.........................................................xiv
CHAPTER ONE...................................................................................................................1
1.0 INTRODUCTION.......................................................................................................1
1.1 Background Information............................................................................................1
1.2 Problem Statement......................................................................................................3
1.3 Justification of the Study............................................................................................4
1.4 Objective of the Study.................................................................................................5
1.4.1 General objective............................................................................................5
1.4.2 Specific objectives..........................................................................................5
1.5 Hypothesis....................................................................................................................5
1.6 Organisation of the Dissertation................................................................................5
vii
CHAPTER TWO..................................................................................................................7
2.0 LITERATURE REVIEW...........................................................................................7
2.1 Cassava Processing Technologies...............................................................................7
2.2 Cassava Processing Efficiency....................................................................................9
2.3 Costs of the Machines.................................................................................................9
2.3.1 Interest..........................................................................................................10
2.3.2 Insurance......................................................................................................11
2.3.3 Housing cost.................................................................................................11
2.3.4 Depreciation.................................................................................................12
2.3.5 Taxes.............................................................................................................14
2.3.6 Operational Costs.........................................................................................14
2.4 Demand for Cassava.................................................................................................14
2.5 Consumer’s Preference for Cassava Processing Technologies Products..............16
2.5.1 Quality of cassava products..........................................................................16
2.5.2 Consumer’s income......................................................................................17
2.5.3 Education of the consumer...........................................................................17
2.5.4 Household size.............................................................................................18
2.6 Meaning and Interpretation of Net Present Value Analysis..................................18
2.7 Sensitivity Analysis for Testing Viability of the Project.........................................19
2.8 Partial Budget Analysis for the Project...................................................................20
2.9 Projection Future Production of Cassava Resulting from Introducing
Mechanized Cassava Processing Technologies.......................................................21
CHAPTER THREE...........................................................................................................24
3.0 METHODOLOGY....................................................................................................24
3.1 Description of the Study Area..................................................................................24
viii

3.1.1 Location of the study area............................................................................24
3.1.2 Topography...................................................................................................24
3.1.3 Climate.........................................................................................................28
3.1.4 Economic activity.........................................................................................28
3.2 Research Design.........................................................................................................29
3.2.1 Sampling procedure and sample size...........................................................29
3.2.2 Theoretical and conceptual frame work.......................................................29
3.2.3 Data collection..............................................................................................30
3.3 Data Analysis.............................................................................................................31
3.3.1 Analytical technique.....................................................................................31
3.3.1.1 Net present value (NPV) of the machines..................................31
3.3.1.2 Probit regression analysis for estimating consumer’s
preference...................................................................................32
3.3.1.3 Goal programming approach......................................................33
3.4 Limitation of the Study Methodology.....................................................................35
CHAPTER FOUR..............................................................................................................36
4.0 RESULTS AND DISCUSSIONS..............................................................................36
4.1 Social-economic Characteristics of the Respondents.............................................36
4.1.1 Age of the respondents.................................................................................36
4.1.2 Gender of the respondents............................................................................36
4.1.3 Household size of the respondents...............................................................37
4.1.4 Education of the respondents.......................................................................38
4.2 Cassava Processing Technologies Used in Study Area...........................................38
4.2.1 The technology applied by the respondents the sampled villages...............41
4.2.2 Technical efficiency of cassava processing technologies.............................42
ix

4.2.3 Economic efficiency of cassava processing technologies............................43
4.3 Comparative Cost of Cassava Processing Machines..............................................44
4.3.1 Operating costs of the machines...................................................................45
4.3.2 Net present value of the machines................................................................46
4.3.4 Sensitivity analysis to test viability of the project........................................47
4.3.5 Analysis of change from local to mechanized technology...........................48
4.3.5.1 The added returns for using the mechanized technology...........48
4.3.5.2 The reduced costs for using the mechanized technology...........48
4.3.5.3 The added costs for using the mechanized technology..............50
4.3.5.4 The reduced returns for using the mechanized technology........50
4.4 Analysis of Consumer’s Preference of cassava flour by method of preparation.51
4.5 Projection of Future Production of Cassava Resulting from Mechanized
Cassava Processing....................................................................................................53
4.5.1 Formation of coefficient matrix for constraints...........................................54
4.5.2 Values of the program..................................................................................55
4.6 Final Evaluation Plan of the Mechanized Cassava Processing Technologies......56
CHAPTER FIVE................................................................................................................58
5.0 CONCLUSION AND RECOMMENDATIONS.....................................................58
5.1 Conclusion..................................................................................................................58
5.2 Recommendations.....................................................................................................60
5.2.1 Mechanical processing technologies for cassava.........................................60
5.2.2 Cassava production......................................................................................61
5.2.3 Cassava consumption...................................................................................62
REFERENCES...................................................................................................................64
APPENDICES....................................................................................................................76
x

LIST OF TABLES
Table 1: Social-economic characteristics......................................................................37
Table 2: The technology applied or used by the respondents in the sample villages....41
Table 3: Technical efficiency of cassava processing technologies................................42
Table 4: Economic efficiency of cassava processing technologies...............................43
Table 5: Model specification of processing machines..................................................44
Table 6: Operational costs per year...............................................................................46
Table 7: Net present values of machines.......................................................................46
Table 8: Benefit-Cost ratio analysis of the machines....................................................47
Table 9: Partial budget analysis resulting from a change to mechanized technology...49
Table 10: Profit made by each machine..........................................................................51
Table 11: Probit regression analysis results for consumer’s preference.........................52
Table 12: Coefficient matrix for optimization of cassava production.............................55
Table 13: Final evaluation of the mechanized cassava processing technologies............57
xi

LIST OF FIGURES
Figure 1: Mechanical processing technology for cassava.................................................8
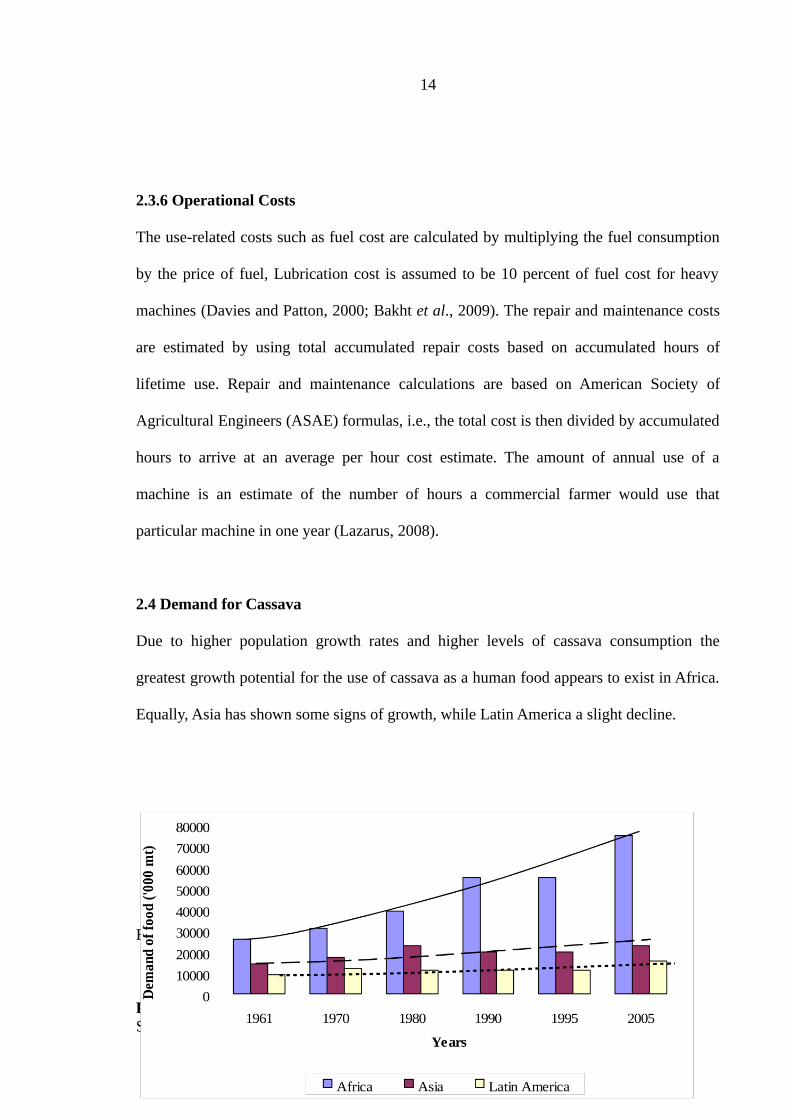
Figure 2: Regional trends in the use of cassava as food, 1961-2005..............................15
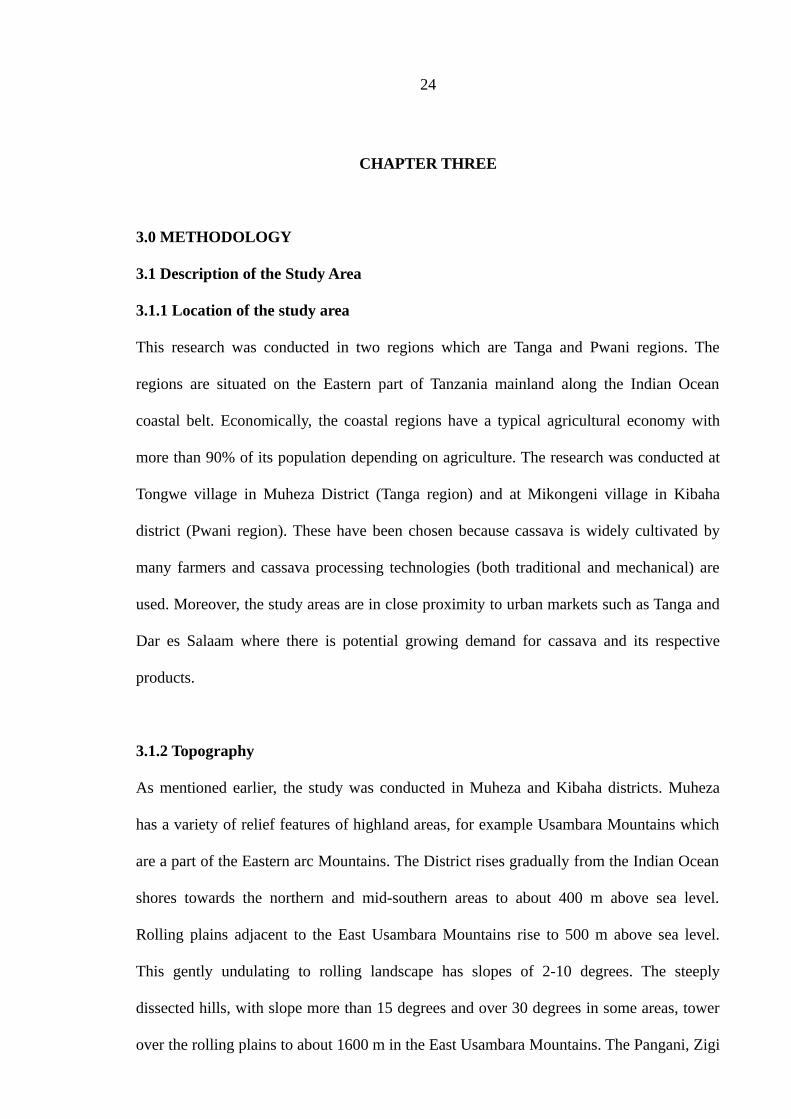
Figure 3: Map of Muheza district to show the study area...............................................26
Figure 4: Map of Pwani region to show the study area...................................................27
Figure 5: Factors determining cassava consumption and production.............................30
Figure 6: Chunks that underwent solid-state fermentation............................................39
Figure 7: Wet-fermentation staff done by soaking in water............................................39
Figure 8: Manual cassava chipping machine...................................................................40
Figure 9: Engine powered cassava chipping machine.....................................................40
Figure 10: Cassava grating machine ...........................................................................40
Figure 11: Cassava press ............................................................................................40
Figure 12: Cassava chips on drying process ....................................41
Figure 13: Grated cassava..................................................................................................41
xii

APPENDICES
Appendix 1: Farmer’s Questionnaire for Cassava............................................................76
Appendix 2: Observations for cassava processing machines............................................78
Appendix 3: Guideline for FGD on cassava processing technologies..............................80
Appendix 4: Matrix for optimal plan for cassava production...........................................81
Appendix 5: NPV analysis for manual chipping machine................................................83
Appendix 6: NPV analysis for engine powered chipping.................................................84
Appendix 7: NPV analysis for cassava grater machine....................................................85
Appendix 8: Sensitivity analysis for the mechanized processing technologies................86
xiii

LIST OF ABBREVIATIONS AND ACRONYMS
ARMA - Auto Regressive Moving AverageASAE - American Society of Agricultural EngineersBCR - Benefit Cost RatioCIAT - International Centre for Tropical AgricultureCNG - CyanoglucosideDRC - Democratic Republic of CongoFAO - Food and Agriculture OrganizationFDG - Focus Group DiscussionFig - FigureGDP - Gross Domestic ProductGP - Goal ProgrammingHQCF - High Quality Cassava FlourIITA - International Institute for Tropical AgricultureIRR - Internal Rate of ReturnLGP - Lexicographic Goal ProgrammingMAFS - Ministry of Agriculture and Food SecurityMCDA - Multi-Criteria Decision AnalysisMCDM - Multiple Criteria Decision MakingMOA - Ministry of AgricultureMOFP - Ministry of Finance and PlanningNBS - National Bureau of Statistics NPV - Net Present ValueNPW - Net Present Worth
NSGRP National Strategy for Growth and Reduction of Poverty
(Mpango wa Kukuza Uchumi na Kupunguza Umaskini Tanzania)OLS - Ordinary least squarePANTIL - Programme for Agricultural and Natural Resources Transformation for
Improved LivelihoodSNAL - Sokoine National Agricultural LibrarySUA - Sokoine University of AgricultureTAC - Trading Agent CompetitionTADENA - Tanzania Development Navigation TrustTARPII - Tanzania Agricultural Research Project Phase IITZS - Tanzanian ShillingsURT - United Republic of Tanzania
xiv

xv

CHAPTER ONE
1.0 INTRODUCTION
1.1 Background Information
Cassava (Manihot esculenta Crantz) is the starchy root crop that is grown almost entirely
within the tropics. Although it is one of the most important crops in the tropical countries,
it is little known elsewhere in some parts within the tropics, and considered to be a low
grade substance crop (Cock, 2001).
Cassava ranks second in the list of staple food crops in developing countries after maize
(Nweke, 2003). In sub-Saharan Africa, cassava is grown chiefly as human food, but it is
also an important animal feed and has several industrial uses. Being one of cheapest source
of food energy, cassava gives a carbohydrate production per hectare which is about 40%
higher than rice and 25% more than maize. Thus cassava plays a major role in meeting
developing countries’ rising demand for consumption of both food and animal feed
(Tonukari, 2004).
The total area harvested in the world in 2005 was about 16 millions hectares, with 57% in
Africa, 25% in Asia and 18% in Latin America. About 15% of the world’s population of
cassava is exported to Europe and Japan as chips, pellets and/or starch. The starch is used
in food industries, textiles, paper industries and in beer brewing. The remaining 85% of the
world production is used within the producing countries for food (58%), animal feed (28%)
and industrial uses (3%) where the wastage is about 11% (CIAT, 1993).
The area of land planted with cassava is greatest in Africa, but yields are lower than other
continents, where in 2005 Africa, Asia and Latin America had 12 354 000, 3 429 000 and
1

2 649 000 hectares of land planted with cassava whereas productions were 109 755, 56 082
and 34 094 (000 metric tonnes) respectively (Prakash, 2008). Africa is the only part of the
world where per capital food production has been declining in the last two decades,
although cassava production has nearly double during the same period (De Bruijin and
Fresco, 1999). Most cassava in Africa is produced by female farmers for food and is
consumed near to where it is grown. There is a growing commercial market for cassava in
Africa and men are gradually being involved in the production of cassava in Nigeria,
Ghana and Democratic Republic of Congo (DRC) (FAO, 1995).
Cassava for human consumption is greatest in Africa, averaging to 409.5 g of fresh and
dried cassava per capita per day. The highest consumption is found in Angola with 787 g
per capita per day (Nhassico et al., 2008). The starch roots are the most commonly
consumed part, but the leaves are also consumed as preferred green vegetable in many
cassava-growing communities, especially in Central Africa (Hahn, 1998).
Both the tuber and leaves of cassava contain Cyanogenic glucosides, which may lead to
toxicity if cassava is not properly processed. Safe consumption of cassava thus depends on
successful removal of cyanogens. Depending on the processing methods used, the
percentage of cyanide reduction varies from 70 to 100% (Nwapa, 1986). In order to
minimize the cyanogens content, cassava is processed by different traditional methods,
which includes fermentation (wet and solid-state) and drying. However, in solid state
fermentation and drying, there is proliferation of spoilage and pathogenic micro-organisms
on cassava, some of which may produce mycotoxins (Nwapa, 1986). The resulting flour is
coloured thus not appealing to the consumer. This dissertation sought to evaluate the
introduced cassava processing technologies on production and consumption using goal
programming approach.
2

1.2 Problem Statement
In Tanzania, cassava is grown in most parts of the country. However, chief growing areas
are Tanga, Mwanza, Pwani and Lindi regions. In recent years, cassava is also grown in
other parts of the country as a result of Government efforts to stimulate local self-
sufficiency in food supply (Nang’ayo et al., 2007); as such, making cassava the most
important root crop in the country. Despite its importance, Tanzania is estimated to produce
6.3 million tons of cassava per year.
Cassava is very high in starch and can grow even in areas with marginal rainfall, with
possibility of contributing greatly to livelihood support. This led to insistence from policy
makers and other bodies in the past to grow cassava as a food security crop. The main
inherent problems with cassava include high perishability of the edible roots within 2-3
days after harvesting, high level cyanogenic glucosides in some variation (Mlingi and
Ndunguru, 2003) and low nutritional value as it is mainly composed of starch. These have
led to marginalization of the crop in terms of production and consumption, which have
made it more of a subsistence crop. In addition, there exists stigma in some transects of
Tanzanians to regard cassava as a poor man’s food, therefore reduced production and
consumption of cassava and increased vulnerability of cassava farmers to poverty (Mlingi
and Ndunguru, 2003).
One solution to the perishability problem has been to leave the crop in the field and harvest
in piecemeal only where there is need but this is uneconomical because it ties up the land
unnecessarily. Another one has been to transfer the risk by selling the crop to businessman
while still in the field at price set arbitrary and often very low, which gives very little
income to farmers and thus a disincentive to increased cassava production. A noble
solution has been to process the roots into shelf-stable product, for example flour but the
3

methods used are still inadequate as in most area they are tedious, rudimentary and
unhygienic, often leading to insufficient processing and poor quality products
(Silayo at al., 2004). However, mechanical chipping of cassava roots instead of manual
chipping has been introduced, but the technology has not yet been reached by majority of
cassava growers in terms of knowledge and physical ownership. The cyanide problem has
been successfully dealt with through proper processing, e.g. dry and wet fermentation
(Silayo at al., 2004). In recent years, the Programme for Agricultural and Natural
Resources Transformation for Improved Livelihood (PANTIL) introduced the solutions of
selection of low cyanide varieties and the processing machines which grant cassava prior
to subsequent processing. Grating and chipping machines have been introduced in few
villages in Pwani, Dar-es-salaam and Tanga regions as a detoxification-method. It is
envisaged that the merits against traditional (wet and solid-state fermentation) methods in
terms of efficiency and hence act as stimulant for future production and consumption is not
yet established. Therefore, this research was proposed to establish the effectiveness of the
technologies and evaluate the future cassava production and consumption due to the
introduction of the cassava processing technologies.
1.3 Justification of the Study
This study will simulate the mechanical methods for cassava processing in those villages,
where this technology has been introduced. Its effectiveness on cyanogenic glucosides
removal and hygienic conditions will lead to high quality cassava flours which will
increase consumption as well as boost the cassava production, also increase the income for
the farmers hence raise the living standards.
The introduced cassava processing technologies go hand in hand with the development
Vision 2025 and the accompanied “National Strategy for Growth and Reduction of
4

Poverty” (NSGRP) with a Swahili acronym MKUKUTA, both of which aim at
modernizing agriculture for increasing contribution to the national Gross Domestic Product
(GDP) (Mbogoro, 2005).
1.4 Objective of the Study
1.4.1 General objective
The overall objective of the study was to evaluate the introduced cassava processing
technologies on production and consumption using goal programming approach.
1.4.2 Specific objectives
Specifically the study sought to:
(i) Assess the efficiency of cassava processing technologies in Tanzania.
(ii) Establish the comparative operating costs of cassava processing machines.
(iii) Study the consumer preference for cassava products versus different processing
technologies.
(iv) Project future production of cassava resulting from introducing mechanized
cassava processing technologies.
1.5 Hypothesis
(i) There is no significant difference in social economic factors affecting consumer
preferences behaviour between mechanical processed and other technologies
processed products.
1.6 Organisation of the Dissertation
This report is organized in five chapters. After this chapter, chapter two provides a review
of cassava processing technologies and theories for future projection for production while
5

chapter three presents the methodology including the description of the study area,
sampling design, data collection tools and data analysis. Chapter four presents the results
and discussions, followed by chapter five which present conclusion and recommendations
based on the findings of the study.
6

CHAPTER TWO
2.0 LITERATURE REVIEW
2.1 Cassava Processing Technologies
Three cassava processing technologies have been reviewed in this study, which includes
traditional processing technology, wet and dry (solid-state) fermentation and mechanical
processing technologies which have been recently introduced in Tanzania.
Traditional cassava processing technologies used in Africa probably originated from
tropical America, particularly north-eastern Brazil and may have been adapted from
indigenous techniques for processing yams (Jones, 2003). The processing methods include
peeling, boiling, steaming, slicing, soaking or seeping, pounding, roasting and drying.
These traditional methods give low product yields, which are also of low quality
(Montagnac et al., 2009).
Wet and dry (solid-state) fermentation cassava processing technology is a combination of
two processing technologies that means wet fermentation and dry (solid-state)
fermentation, reported to be very efficient in cyanide removal (Montagnac et al., 2009) but
resulted in high losses in nutrients of high value, such as proteins, carbohydrates, minerals,
and vitamins (Hotz and Gibson, 2007).
Mechanical processing technologies for cassava involve using chipping and grating
machines, pressing devices, mills, gari fryers, and sifters (IITA, 1996). The technologies
involves chipping, grating and crushing which are usually very efficient in cyanide
removal because they completely rupture plant cells of cassava and allow direct contact
between linamarase and linamarin (Cardoso et al., 2005). The process for the mechanical
7

processing technology can be visualized in chronological manner as presented in
Fig. 1 below.
Figure 1: Mechanical processing technology for cassava.
To
dr yi ng
pr oc es s
8
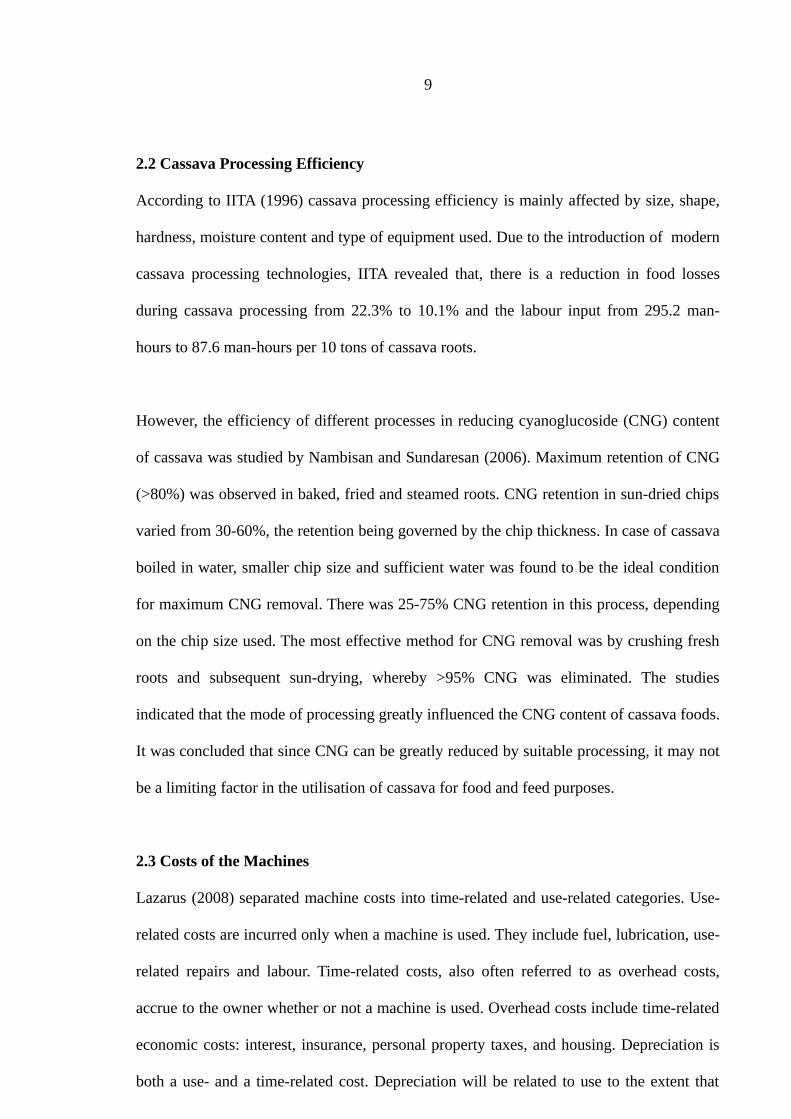
2.2 Cassava Processing Efficiency
According to IITA (1996) cassava processing efficiency is mainly affected by size, shape,
hardness, moisture content and type of equipment used. Due to the introduction of modern
cassava processing technologies, IITA revealed that, there is a reduction in food losses
during cassava processing from 22.3% to 10.1% and the labour input from 295.2 man-
hours to 87.6 man-hours per 10 tons of cassava roots.
However, the efficiency of different processes in reducing cyanoglucoside (CNG) content
of cassava was studied by Nambisan and Sundaresan (2006). Maximum retention of CNG
(>80%) was observed in baked, fried and steamed roots. CNG retention in sun-dried chips
varied from 30-60%, the retention being governed by the chip thickness. In case of cassava
boiled in water, smaller chip size and sufficient water was found to be the ideal condition
for maximum CNG removal. There was 25-75% CNG retention in this process, depending
on the chip size used. The most effective method for CNG removal was by crushing fresh
roots and subsequent sun-drying, whereby >95% CNG was eliminated. The studies
indicated that the mode of processing greatly influenced the CNG content of cassava foods.
It was concluded that since CNG can be greatly reduced by suitable processing, it may not
be a limiting factor in the utilisation of cassava for food and feed purposes.
2.3 Costs of the Machines
Lazarus (2008) separated machine costs into time-related and use-related categories. Use-
related costs are incurred only when a machine is used. They include fuel, lubrication, use-
related repairs and labour. Time-related costs, also often referred to as overhead costs,
accrue to the owner whether or not a machine is used. Overhead costs include time-related
economic costs: interest, insurance, personal property taxes, and housing. Depreciation is
both a use- and a time-related cost. Depreciation will be related to use to the extent that
9

increased annual usage shortens years of life and/or reduces salvage value while not
entirely use-related, the time-related costs are prorated over a 12 year economic life except
where otherwise indicated. Computation of machinery overhead costs based on American
Society of Agricultural Engineers (ASAE) formulas are as follows:
2.3.1 Interest
If the operator borrows money to buy a machine, the lender will determine the interest rate
to charge (Davies and Patton, 2000). But if the farmer uses his or her own capital, the rate
will depend on the opportunity cost for that capital elsewhere in the farm business. If only
part of the money is borrowed, an average of the two rates should be used (Molenhuis,
2008). For example, assume an average interest rate of 8%, bearing in mind that inflation
reduces the real cost of investing capital in farm machinery, and loans can be repaid with
cheaper dollars, the interest rate can be adjusted by subtracting the expected rate of
inflation which is 3%, so the adjusted or “real” interest rate is 5%. Therefore interest rate
per year can be calculated as follows;
IRyearTshsDPSVPC
yearInterest 2
)/(/ ...……………………………(1)
Where:
PC = Purchase costs,SV = Salvage value,DP = Depreciation,IR = Real interest rate.
Therefore, the interest cost hinders small farmers to purchase the farm machinery or run
the machine.
2.3.2 Insurance
10

In law and economics, insurance is a form of risk management primarily used to hedge
against the risk of a contingent loss. Insurance is defined as the equitable transfer of the
risk of a loss, from one entity to another, in exchange for a premium, and can be thought of
as a guaranteed small loss to prevent a large, possibly devastating loss. The insurance rate
is a factor used to determine the amount to be charged for a certain amount of insurance
coverage, called the premium. Risk management, the practice of appraising and controlling
risk, has evolved as a discrete field of study and practice (Ritter, 2002). Moreover,
insurance per annum can calculated as follows;
INRyearTshsDPSVPC
yearInsurance 2
)/(/ …………………………… (2)
Where:
PC = Purchase costs,SV = Salvage value,DP = Depreciation,INR = Insurance rate.
Therefore, insurance should be carried on farm machinery to allow for replacement in case
of a disaster such as fire or tornado calamites. If insurance is not carried, the risk is
assumed by the rest of the farm business (Ritter, 2002).
2.3.3 Housing cost
There is a tremendous variation in housing for farm machinery. Providing shelter, tools,
and maintenance equipment for machinery will result in fewer repairs in the field and less
deterioration of mechanical parts and appearance from weathering. Therefore, should
produce greater reliability in the field and a higher trade-in value (Edwards, 2005).
Housing cost per year can be calculated as follows;
11

SSmmPyearH 22// ………………………………...………………………………(3)
Where:
H = Housing,P = Price,SS = Shelter space required.
Therefore, the housing cost must be carries on by the farmer so as to protect the machines,
thus yields benefits in the form of longer machine lives, reduced repairs, better appearance
and greater convenience in working on machinery, hence more profit in the business
resulted from good farm management (Dalsted, 2008).
2.3.4 Depreciation
Depreciation is a cost resulting from wear, obsolescence, and age of a machine. The degree
of mechanical wear may cause the value of a particular machine to be somewhat above or
below the average value for similar machines when it is traded or sold (Dumler et al.,
2000). The introduction of new technology or a major design change may make an older
machine suddenly obsolete, causing a sharp decline in its remaining value. But age and
accumulated hours of use usually are the most important factors in determining the
remaining value of a machine (Edwards, 2005).
Before an estimate of annual depreciation can be calculated, an economic life of a machine
and a salvage value at the end of the economic life must be specified. The economic life of
a machine is the number of years for which costs are to be estimated (Burton, 2005).
It is often less than the machine’s service life because most farmers trade a machine for a
different one before it is completely worn out. A good rule of thumb is to use an economic
life of 10 to 12 years for most new farm machines and a 15-year life for tractors, unless it
is known that the machine will be traded sooner.
12

Salvage value is an estimate of the sale value of the machine at the end of its economic
life. It is the amount, the farmer can expect to receive as a trade-in allowance, an estimate
of the used market value if he or she expects to sell the machine outright, or zero if the
farmer plans to keep the machine until it is worn out (Edwards, 2005). Actual market value
will vary from these values depending on the condition of the machine, the current market
for used machinery, and local preferences or dislikes for certain models. Therefore,
depreciation per year can be calculated as follows;
LS
SVPCyearonDepreciati
/ ………………………………………………………… (4)
Where:
PC = Purchase costs,SV = Salvage value andLS = Life span of machine.
Therefore, depreciation is a non-cash expense of machinery ownership that must be
recognized by the farmer. This is the amount of money that a farmer must put away every
year so as to be able to replace the machine at the end of its expected life and also can be
used in studies of taxation policy, investment behaviour, and a host of farm management
studies, furthermore most often used to provide reliable estimates of what farm equipment
either is worth or will be worth (Wu and Perry, 2004).
2.3.5 Taxes
Taxes per year, in countries where farm machinery is taxed as personal property, such taxes
could be calculated in a manner that depends on how taxes are a ssessed but in other
countries there is no tax for farm machineries. For example Tanzania, there are no taxes for
farm machinery so as to encourage agricultural mechanization (MOFP, 2009).
13
2.3.6 Operational Costs
The use-related costs such as fuel cost are calculated by multiplying the fuel consumption
by the price of fuel, Lubrication cost is assumed to be 10 percent of fuel cost for heavy
machines (Davies and Patton, 2000; Bakht et al., 2009). The repair and maintenance costs
are estimated by using total accumulated repair costs based on accumulated hours of
lifetime use. Repair and maintenance calculations are based on American Society of
Agricultural Engineers (ASAE) formulas, i.e., the total cost is then divided by accumulated
hours to arrive at an average per hour cost estimate. The amount of annual use of a
machine is an estimate of the number of hours a commercial farmer would use that
particular machine in one year (Lazarus, 2008).
2.4 Demand for Cassava
Due to higher population growth rates and higher levels of cassava consumption the
greatest growth potential for the use of cassava as a human food appears to exist in Africa.
Equally, Asia has shown some signs of growth, while Latin America a slight decline.
14

Application of simple time trends to these data suggests that by the year 2015 African
consumption could be approximately 91 million tonnes, Asia 26 million tonnes and Latin
America 19 million tonnes per annum. This estimate represents an increase of
approximately 21 million tonnes over the 1995 consumption level, and is close to the Food
and Agriculture Organization (FAO) estimate of a 26 million tonnes increase between 1995
to 2005 (Figure 2).
In Tanzania, the situational analysis showed that there is a big potential demand for
cassava. The current supply of fresh unpeeled cassava for immediate domestic
consumption is far below demand, with unsatisfied market. Peeled and dried cassava chips
as raw materials for human food and processing industries are in short supply.
The same is experienced for unpeeled dried chips as raw materials for livestock feeds
industries. Moreover, a long term potential is the market for fresh unpeeled cassava roots
for starch processing industries (if well invested in) (TAC, 2004).
Demographic changes provide both a challenge and an opportunity for increased demand
for cassava as a human food. On the other hand, the increasing urban population provides
an opportunity to sell more cassava if the product is of good quality and competitive price.
Domestically therefore, growing urbanization offers opportunities to develop new, or
unexploited markets for cassava (Poonte, 2001). Increased demand for cassava and its
products caused the emergence of different cassava processing technologies in different
cassava growing areas in the world.
15

2.5 Consumer’s Preference for Cassava Processing Technologies Products
2.5.1 Quality of cassava products
In recent years, Sokoine University of Agriculture (SUA) and the Ministry of Agriculture
and Food Security (MAFS) under a joint project (TARPII-SUA) in Tanzania, implemented
two cassava post-harvest researches. One of these was on processing of cassava for human
consumption (Project 029) implemented in Magindu village (Kibaha district) and
Songabatini village (Muheza district). The few successes realized included introduction,
testing and adoption of chipping and grating machines by two farmers groups in these
villages, invention of Kebab-looking food product (kibabu), and formulation of wheat-
cassava flour buns, chapatti and futari (Laswai, et al., 2005; Silayo et al., 2004).
Another TARPII-SUA research was cassava processing for livestock feeds (Project 010)
for which cassava was established to be a good ingredient in the formulation of poultry and
pig feeds which were highly needed by livestock keepers. This project was implemented in
Miswe and Zogowale villages (Kibaha).
In additional to that, in Ghana and Nigeria there is high quality traditionally processed
cassava products such as agbelima, fufu, gari and kokonte which are mostly preferred by
the people (Onumah, 2006; Jumah et al., 2008) have shown that traditional fufu accounts
for the largest share 40% of the Ghanaian household budget for cassava food products.
2.5.2 Consumer’s income
In Africa, cassava is a marginalized crop in food policy debates because it is burdened with
the stigma of being an inferior, a low protein food that is uncompetitive with glamour
crops such a imported rice and wheat. Many food policy analysts consider cassava an
16
inferior food because it is assumed its per capita consumption will decline with increase of
per capita income (Nweke, 2003).
2.5.3 Education of the consumer
The consumers’ education level also affected their preference for certain food products.
Generally, people tend to process cassava roots mainly into traditional foods as fufu
(Nigeria) or bada/Makopa (Tanzania). Widowati and Hartojo (2000) in their study on
production and use of cassava flour in Indonesia revealed that more than 70% of those with
formal education processed cassava into traditional foods while those with higher
education level seemed to use cassava flour for preparing more alternative cassava
products as buns, chapatti and chips.
2.5.4 Household size
Household size played a very important role in explaining preference in cassava processed
products. Jumah et al. (2008) found that the mean household size to be four and the
number of persons consuming certain cassava products per household was found to be
three. This implies that over 70% of the persons in households were consuming cassava
products. Other factors which have been seen to influence the preference for cassava
processed products were age, sex and how frequently cassava products were eaten or
quantity consumed (Tomlins et al., 2007).
2.6 Meaning and Interpretation of Net Present Value Analysis
The concept of net present value (NPV), or discounted cash flow, has been mostly used in
investment’s analysis because it incorporates the timing and magnitude of cash flows
17

within the analysis (Fleming et al., 2006). The technique has also been used by Sherrick et
al. (2000) to select one of the two projects, which were competing in terms of equivalent
incremental cash flows or benefits between the two options and were cancelled by
evaluating the NPV of one project minus the other. Moreover, NPV analysis has been also
used in the economic evaluation of different projects or investment (Goliath, 2004;
Carpenter, 2003). At this juncture, the meaning and interpretation of NPV analysis has to
be discussed in detail as follows.
NPV is an indicator of how much value an investment or project adds to the firm. With a
particular project, if Ct is a positive value, the project is in the status of discounted cash
inflow at time t. If Ct is a negative value, the project is in the status of discounted cash
outflow at time t, where appropriately risked projects with a positive NPV could be
accepted. This does not necessarily mean that they should be undertaken since NPV at the
cost of capital may not account for opportunity cost in comparison with other available
investments. In financial theory, if there is a choice between two mutually exclusive
alternatives, the one yielding the higher NPV should be selected. The following
summarises the NPVs in various situations.
If NPV > 0, it means that the investment would add value to the firm, thus the project may
be accepted. If NPV < 0, it means that the investment would subtract value from the firm,
thus the project should be rejected and if NPV = 0, it means that the investment would
neither gain nor loose value for the firm, thus the decision may be indifferent whether to
accept or reject the project. In the late case, the decision should be based on other criteria,
for instance, strategic positioning or other factors not explicitly included in the calculation.
However, when NPV = 0 it does not mean that a project is only expected to break even, in
the sense of undiscounted profit or loss (earnings). It will show net total positive cash flow
18
and earnings over its life but can not be acceptable without testing the viability of the
project. Therefore, there is a need to call for sensitivity analysis to test for the project
viability.
2.7 Sensitivity Analysis for Testing Viability of the Project
This is a technique whereby the viability of a project is tested against possible variations in
the size and timing of the estimated costs and benefits. The analysis shows how “sensitive”
the project viability is to various changes in variables (Saltelli et al., 2008). The process of
sensitivity analysis is used to recalculate the NPV, Internal Rate of Return (IRR) and
Benefit Cost Ratio (BCR) all based on estimates of project costs and benefits which are
subject to varying degrees of uncertainty and risk.
When projects are implemented the actual flows of costs and benefits may be significantly
different from the estimates. This study utilized a sensitivity analysis to determine what
size change in a variable would cause the project to become non-viable. These changes are
called “switching values” (Howlett and Nagu, 2001). However, such sensitivity analysis
becomes increasingly unhelpful in representing the combined effects of multiple sources of
uncertainty as the numbers of parameters increase (NICE, 2008). This limitation
necessitates the use of partial budget for further analysis.
2.8 Partial Budget Analysis for the Project
Partial budgeting analysis is a planning and decision-making framework used to compare
the costs and benefits of alternatives faced by a farm business (Roth and Hyde, 2002). It
focuses only on the changes in income and expenses that would result from implementing
a specific alternative (Tigner, 2006). A partial budget only includes resources that will be
changed. It does not consider the resources in the businesses that are left unchanged. Only
19

the change under consideration is evaluated for its ability to increase or decrease income in
the farm business (Dalsted and Gutierrez, 2009). The partial budget framework can be used
to analyze a number of important farm decisions, including adopting a new technology,
changing enterprises, choosing to specialize, hiring custom work, leasing instead of buying
machinery, modifying production practices and making capital improvements. The
structure of the analysis depends upon the nature of the decision being analyzed (Roth and
Hyde, 2002).
The partial budget analysis has been used by Jefferies et al. (1970) for analyzing the
potential economic returns of alternative range practices and they suggested that, partial
budget analysis is suitable for field use by ranchers and range technicians. Also the partial
budget analysis has been used to determine the economic benefits of antibiotic treatment of
chronic subclinical mastitis caused by Streptococcus uberis or Streptococcus dysgalactiae
(Swinkels et al., 2005). Furthermore this analysis has been also employed in a new
technology and new production techniques of catfish farming (Aquaculture) in evaluating a
proposed change to an existing aquaculture operation, the basic issue to be addressed is
whether or not the long-term profitability of the farm will be improved (Hanson et al.,
2007). Therefore, the partial budget analysis has been used in this study to evaluate the
economic benefits of an introduced cassava processing technologies.
2.9 Projection Future Production of Cassava Resulting from Introducing Mechanized
Cassava Processing Technologies
Itharattana (2003) attempted to forecast cassava production in Thailand at two levels,
national and regional levels. Ordinary Least Square (OLS) was used to estimate the
coefficients in each equation. Cobb-Douglas type was applied in the planted area equation
while time series model was used in the yield one. Applying the model for the ex-ante
20

forecast, the total production was expected to be almost the same in 2002 when compared
with the previous year.
Weaknesses in the model still remain in terms of some specification errors. Thus, to make
ex-ante forecast more useful, some policy variables should be added to reflect the real
situation more. The situation above shows that there is need to employ goal programming
approach for solving the multi-objective function.
The approach has been used in river flow forecasting which constitutes one of the most
important applications in hydrology. Several methods have been developed for this purpose
and one of the most famous techniques is the auto regressive moving average (ARMA)
model. In the research reported here, the goal was used to minimize the error for a specific
season of the year as well as for the complete series of years. Goal programming (GP) was
used to estimate the ARMA model parameters. Shaloo Bridge station on the Karun River
with 68 years of observed stream flow data was selected to evaluate the performance of the
proposed (GP) approach. The results when compared with the usual method of maximum
likelihood estimation were favourable with respect to the new proposed algorithm (GP
approach) (Mohammadi et al., 2006).
In literature, most of fishery related studies have used lexicographic goal programming
(LGP) model for the fishery planning problem and the solution under the decision-maker’s
priority structure is considered as the optimal solution (Sharma et al., 2006). However, in
different complex decision-making situations, the desired solution may not be acceptable
under the imposed priority structure; that is, a better solution is always expected for which
a number of priority structures may be considered (Sharma et al., 2003).
21

In this research, the LGP model was presented to evaluate the introduced cassava
processing technologies (mechanical processing) and related activities and their economic
impact on cassava production in Tanzania. The LGP model was designed to illustrate how
LGP can be used for future projection in cassava production due to the introduced cassava
processing technology and related activities with multiple objectives. The technique allows
finding the optimal solution, based on the priorities of the goals in a decision-making
environment. In this study, the LGP used to examine a set of goals and objectives as they
relate to cassava production.
A major strength of goal programming is its simplicity and ease of use. This account for
the large number of goal programming applications in many and diverse fields (Jones and
Tamiz, 2002). As weighted or non pre-emptive goal programmes can be solved by widely
available linear programming computer packages, finding a solution tool is not difficult in
most cases. Lexicographic goal programmes can be solved as a series of linear
programming models (Ignizio and Cavalier, 1994; Ignizio, 1976).
Goal programming can hence handle relatively large numbers of variables, constraints and
objectives. A debated weakness is the ability of goal programming to produce solutions
that are not Pareto efficient. This violates a fundamental concept of decision theory that,
there is no rational decision maker will knowingly choose a solution that is not Pareto
efficient. However, techniques are available (Tamiz et al., 1999; Romero, 1991; Hannan,
1980) to detect when this occurs and project the solution onto the Pareto efficient solution
in an appropriate manner. The setting of appropriate weights in the goal programming
model is another area that has caused debate, with some authors (Gass, 1987) suggesting
the use of the Analytic Hierarchy Process (AHP) or interactive methods (Ciptomulyono,
2008; White, 1996) for this purpose.
22

23
CHAPTER THREE
3.0 METHODOLOGY
3.1 Description of the Study Area
3.1.1 Location of the study area
This research was conducted in two regions which are Tanga and Pwani regions. The
regions are situated on the Eastern part of Tanzania mainland along the Indian Ocean
coastal belt. Economically, the coastal regions have a typical agricultural economy with
more than 90% of its population depending on agriculture. The research was conducted at
Tongwe village in Muheza District (Tanga region) and at Mikongeni village in Kibaha
district (Pwani region). These have been chosen because cassava is widely cultivated by
many farmers and cassava processing technologies (both traditional and mechanical) are
used. Moreover, the study areas are in close proximity to urban markets such as Tanga and
Dar es Salaam where there is potential growing demand for cassava and its respective
products.
3.1.2 Topography
As mentioned earlier, the study was conducted in Muheza and Kibaha districts. Muheza
has a variety of relief features of highland areas, for example Usambara Mountains which
are a part of the Eastern arc Mountains. The District rises gradually from the Indian Ocean
shores towards the northern and mid-southern areas to about 400 m above sea level.
Rolling plains adjacent to the East Usambara Mountains rise to 500 m above sea level.
This gently undulating to rolling landscape has slopes of 2-10 degrees. The steeply
dissected hills, with slope more than 15 degrees and over 30 degrees in some areas, tower
over the rolling plains to about 1600 m in the East Usambara Mountains. The Pangani, Zigi
24

and Mkulumuzi rivers flow into the Indian Ocean and form the main drainage of the
district. The rivers also dissect the lowlands (Fig. 2).
Kibaha district is within the eastern zone of Tanzania which lies at an altitude of about 60
m above the sea level. The district is covered by sand loam soils and heavy clay
waterlogged soils which are suitable for cassava, paddy, vegetables and pulse production.
The Ruvu river that discharge water into the Indian Ocean, contributes much to the main
drainage of Kibaha district. For more information about the location of the study area see
Fig. 3.
25
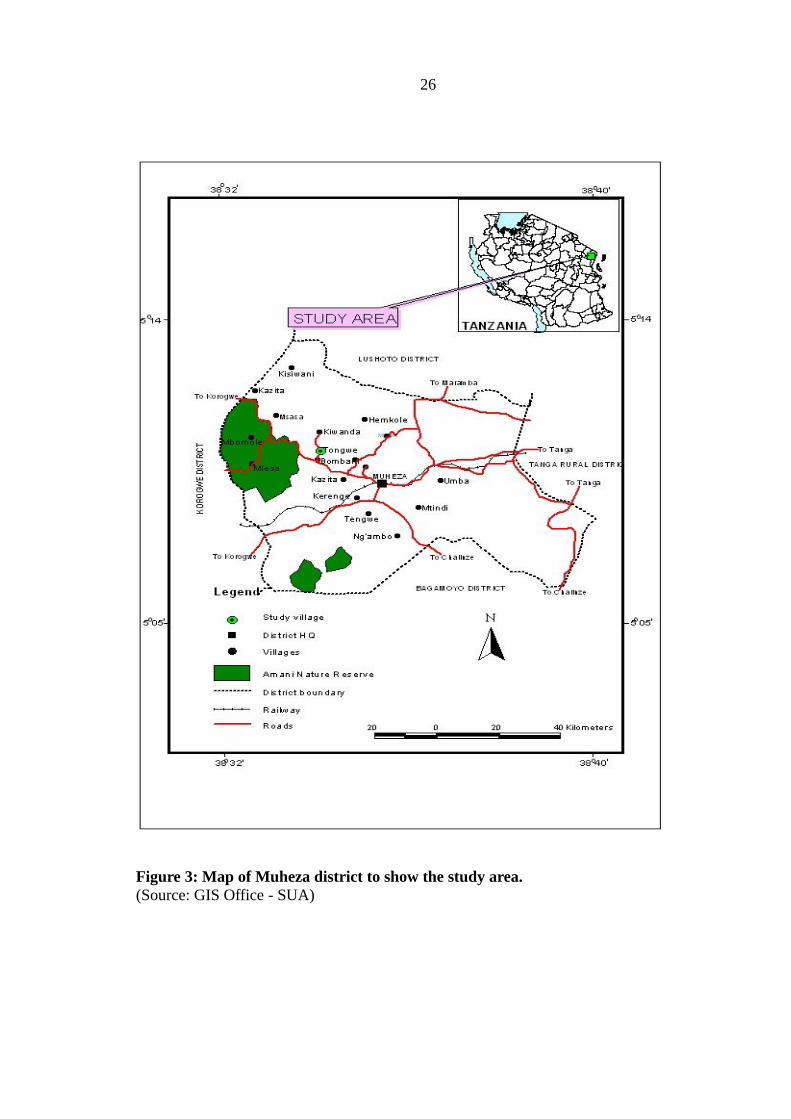
Figure 3: Map of Muheza district to show the study area.(Source: GIS Office - SUA)
26

Figure 4: Map of Kibaha district to show the study area.(Source: GIS Office – SUA)
27

3.1.3 Climate
The weather of the two regions is generally hot due to the influence of the ocean. The
regions experience a tropical climate with an average temperature of 280C. There are two
rain seasons, the main and short rain seasons, with the average of 1000 mm per year. The
main rain seasons lasts for roughly 120 days between March and June. The rain is usually
heavy and spread throughout the regions. This is also the main crop planting season for all
crops, but especially so for the seasonal crops such as maize, paddy and cotton. The short
rain season lasts for about 60 days between October and December. The rains are not
evenly distributed and they are not very much reliable, suitable for short- term crops such
as maize, cassava and paddy (NBS, 1997).
3.1.4 Economic activity
Economically, Pwani and Tanga regions have a typical agriculture economy with more
than 90% of its population depending on agriculture. In the year 1996 Gross regional
income of Pwani and Tanga regions were estimated as TZS 20.8 billions and TZS 92.8
billions respectively. Pwani region has lowest GDP per capita (TZS 28 149) while Tanga
region has a GDP per capita of TZS 60 021. In 1994, Pwani and Tanga regions ranked last
and 9th in the contribution to the National GDP, in which their contributions were 1% and
5.5% respectively according to NBS (1997). In 2002/03, Pwani and Tanga regions were
among the most prominent cassava producing regions, contributing to about 17% of the
total cassava produced in the country.
Cassava ranks the second after maize in terms of household producing it, area planted, and
production volume in the country (MOA, 2003). In 2001/02 the crop contributed about
29% of food produced in the country preceded by maize which contributed about 49% of
total volume of food (NBS, 2007).
28
3.2 Research Design
The research design for this study was a cross –sectional, where data were collected at a
single point in time. The reason for choosing this design is simply because it is flexible,
economical and easy to manipulate data and information (Bailey, 1994).
3.2.1 Sampling procedure and sample size
Purposeful sampling was used to select two villages where there is an on-going PANTIL
cassava project. In this respect the village close to Kibaha town (Pwani region) and the
other village more than 10 km off Muheza town (Tanga region), which situated along
Arusha – Tanga main road were chosen, the villages were Mikongeni and Tongwe
respectively. Then proportionate stratified sampling based on their income (i.e. those with
low income versus those with high income) was employed. Thereafter, random sampling
was employed to get a sample of 30 respondents from each stratum. Ultimately sample of
120 respondents were used for this study. A sample size of 30 respondents is deemed large
enough (Wooldridge, 2008). The Central Limit Theorem (CLT) states that the average from
a random sample for any population, with finite variance, has an asymptotic standard
normal distribution. Most estimators encountered in statistics and econometrics can be
written as functions of sample averages (Wooldridge, 2002). Therefore, the t-statistic was
used as inference test of the model, based on the law of large numbers and the Central
Limit theorem (CLT).
3.2.2 Theoretical and conceptual frame work
A conceptual framework helps to prevent fragmentation of knowledge statements.
According to Kitani (1999), conceptual framework binds facts and provides guidance
towards collection of realistic data and information.
29

Fig. 5 presents the conceptual framework for this study. The factors such as household
income, household size, quantity consumed per year, quality of the product, age, education
level and price of the products influence the consumer preference for the mechanically
processed cassava products. The consumer preference influences consumption of cassava.
Cassava consumption and other factors such as varieties in use, access to the market and
processing costs lead to improvement in cassava production.
Figure 5: Factors determining cassava consumption and production.
3.2.3 Data collection
Structured questionnaires with both closed and open-ended questions, group discussions
and observation were used as methods for collecting primary data. Data were collected
through interview of the sampled households and key informants who were the village
chairmen and agricultural field officers to each village. The key variables asked were the
30

farmers (household) characteristics, household sources of income, cassava production,
processing (traditional, wet and solid-state fermentation and mechanical) and consumption.
The experimentations were used to collect information on efficiency (in terms of
operational, time, fuel consumption) of the mechanical processing technology from the
study area. The experiments were conducted by taking 5 kg of chunks/pieces of pealed
cassava into each machine (manual cassava chipper, engine powered cassava chipper and
cassava grater). The time used to process the cassava by each machine was recorded by
using stopwatch as a pilot, and then the experiments were repeated four times, whereas
deep stick was used to measure the fuel level. Secondary data were collected by reviewing
document from the respective District Agriculture Departments, Ministry of Agriculture,
Food Security and Cooperatives, International Institute for Tropical Agriculture (IITA)
reports, Sokoine National Agricultural Library (SNAL) and Internet.
3.3 Data Analysis
3.3.1 Analytical technique
Both the descriptive and quantitative analyses were employed in this study, based on the
objectives stated. Descriptive analysis employed the use of means, percentages, and
frequencies. The quantitative analysis involved the use of net present value, probit
regression analysis and goal programming approach for forecasting the future of cassava
production.
3.3.1.1 Net present value (NPV) of the machines
Net present value (NPV) or net present worth (NPW) (Lin and Nagalingam, 2000) is
defined as the total present value of a time series of cash flows. It is a standard method for
using the time value of money to appraise long-term projects. Used for capital budgeting,
31

and widely throughout economics, it measures the excess or shortfall of cash flows, in
present value terms, once financing charges are met and has been expressed as follows.
nn
o
n
tt
t
r
RC
r
CNPV
111 ………………………………………………………(5)
Where;
NPV = Net present value,Ct = Net cash flow,Co = Initial investment,r = Discount rate in (%),t = Time of cash flow andRn = Salvage value.
3.3.1.2 Probit regression analysis for estimating consumer’s preference
The study employed the probit regression analysis to determine the significance of the
number of factors which contribute to the consumer’s preference (Eastwood et al., 1987)
for cassava processed products to the household. Variables included in the model were
income of the household, family size, number of years in schooling, gender of the
household head, quality of the processed products, age of the household head and price of
the processed products. In estimating probit regression model, the maximum likelihood
estimation techniques were commonly used (Hennessy and Rehman, 2008; Victor, 2007;
Feleke et al., 2005). The consumer’s preference for mechanically processed products by
the household was estimated by maximum likelihood methods as shown in equation (6) as
follows;
88332211 ... …………………………………………..(6)
Where;
32
Y = Preference for mechanical processed products (1= technology
preference; 0 otherwise),α = Constant,X1 = Income of the household (low, high),X2 = Quantity consumed by the household in bags,X3 = Family size,X4 = Price of processed cassava products,X5 = Quality of the processed products (1= Mechanical processing
technology; 0 otherwise),X6 = Number of years in schooling,X7 = Gender of the household head (1= male; 0 = otherwise),X8 = Age of the household head,ε = The error term.
3.3.1.3 Goal programming approach
Goal programming is a branch of multi-objective optimization, which in turn is a branch of
multi-criteria decision analysis (MCDA), also known as multiple-criteria decision making
(MCDM). It can be thought of as an extension or generalization of linear programming to
handle multiple, normally conflicting objective measures (Pournamdarin, 2008). Each of
these measures is given a goal or target value to be achieved. Unwanted deviations from
this set of target values are then minimized in an achievement function. This can be a
vector or a weighted sum dependent on the goal programming variant used as satisfaction
of the target which deemed to satisfy the decision makers (Andrew et al., 2008; Diaz-
Balterio and Romero, 2008). This approach was used to project the future production of
cassava resulting in a change of cassava processing technologies and consumption
behavior; and the linear programming software package (LP-WYE) was used for the
analysis and it was formulated as follows;
Objective function
Max QZ
Subject to _rrrr uugQC , r =1 to k
Non-negativity
, 0r ru u , r =1 to k ……………………………………………………..(7)
33

Where;
QZ = The production function for cassava maximization (Objective
function)G r = The goal or target valueur + = The positive deviation from the goal or target value setur
- = The negative deviation from the goal or target value set Q = Is a summation of Q1 and Q2 which are bitter and sweet varieties
respectivelyC r(Q) = The constraints of the objective function were as follows:
The consumption is given the first priority level i.e.
COCOCOo UUGQC ……………..…………..…..............…………………(8)
The variety is given the second priority level i.e.
VVV UUGQV ………………...………………………….……………...(9)
The access to market is given the third priority level i.e.
mmm UUGQM ………………………………………….…....……….….(10)
The cost of processing is given the fourth priority level i.e.
cccc UUGQC ………………...……………………….……….………(11)
The price of the processed products is given the fifth priority level i.e.
pppp UUGQP ……...…………….….…………………..…...………...(12)
Where:
Co(Q) = Consumption function, Gco= Goal set for consumption, V(Q)= Variety
function, Gv= Goal set for variety production, M(Q) = The quantity of Cassava
accessed to the market, Gm = Goal set for quantity to be accessible to the market,
Cc(Q) = Cost processing function, Gc = Goal set for processing cost, Pp(Q) = The
price function of the processed product, Gp = Goal set for the price for the
processed products, U+s, U-s are the non-negativity deviation from the goal setting.
34
3.4 Limitation of the Study Methodology
Research regarding mechanical cassava processing technologies in particular, few has been
carried out in Tanzania. It was thus very difficult to access relevant materials pertaining to
the theme of this study, mainly in machine costs evaluation.
Most of the data were obtained through interviewing farmers and practical experimentation
in those three technologies whose replies were subject to error due to inadequate
knowledge, or faulty memory or because of untruthful replies evolved by consideration of
pride or suspicious in case of the farmer’s interview. Conversion units were also the
problem since some farmers use local units (e.g. acre, bags, debe, tins). However
estimation had been done to convert local units into standard ones such as kilogram (kg).
This research work is based in Tongwe and Mikongeni Villages in Muheza and Kibaha
districts. The results of the study are based on cross-sectional data collection from limited
number of observations (farmers) in selected area of Tongwe and Mikongeni village.
Therefore, conclusion drawn from the study cannot be generalized for the whole country in
most cases. Furthermore, the study gives what could be happening if mechanical cassava
processing technologies are carried out through the entire country.
35

CHAPTER FOUR
4.0 RESULTS AND DISCUSSIONS
4.1 Social-economic Characteristics of the Respondents
Characteristics of respondents interviewed have important social and economic
implications towards factors influencing cassava production and consumption. For
example, family characteristics such as age usually influence the quantity of the
agricultural output. Therefore, this section describes the characteristics of sampled
respondents, focusing on age, gender, household size and education level.
4.1.1 Age of the respondents
The distribution of farmers according to age is presented in Table 1. Results show that
majority of the respondents (67.5%) were above 36 years of age and people with active age
(17 to 55 years) constituted 80.8% of total respondents. Meanwhile, respondents aged
above 55 years were 19.2%. Basing on the information above, it is clear that in the study
area the working force is available and able to work in agriculture as their main economic
activity but large percentage (48.3%) of the sampled cassava farmers are falling in the age
of 35 to 55 years (Table 1).
4.1.2 Gender of the respondents
Result in Table 1, show that, about 63% of the respondents were male and the remaining
37% were female. Skewed results were expected since men are the household heads to
whom the interview was directed. As far as cassava production is concern as observed by
TADENA (2004), access and use of land for cassava production is not gender biased.
Either of the sexes can get involved in cassava production. There is no bias when it comes
to providing access to farmland for women. Likewise, there are no important cultural
36

beliefs and practices that are likely to affect the development of cassava (Table 1). The
results also show that 32% and 38% of the men and women respectively within sampled
households were using mechanized cassava processing technology.
Table 1: Social-economic characteristics
Variable Categories Frequency PercentageAge 17-35 39
5823
120
32.548.336-55
>55 19.2Total 100.0
Gender Male 75 62.5Female 45 37.5Total 120 100.0
Household size 1-3 28 23.3 4-6 71 59.2 >6 21 17.5
Total 120 100.0
Education level No formal education 22 18.3Standard four (iv) 3 2.5Primary education 74 61.7Secondary education 21 17.5Total 120 100.0
4.1.3 Household size of the respondents
Results in Table 1, shows that about 23.3% of the households have 1-3 members and 59%
of the household sizes have members ranging between 4 and 6 and only 17.5% of the
sampled households were above 6 household’s members. Therefore, majority of the
households (76.7%) have 4 members and above, which signifies that there is enough work
force due to the fact that majority of population in the study area fall in the age of 17-55
years.
37
4.1.4 Education of the respondents
Education is one of the factors that influence cassava production. A farmer with formal
education is likely to be innovative or adoptive to new technologies than a farmer with no
formal education whereas other factors remain constant. The study revealed a moderate
rate of literacy in the study area. Results on level of education showed that respondents in
the study area have attained formal education. The majority of sampled household heads in
the study area (61.7%) and (17.5%) had attained primary education and secondary
education respectively. These findings support the observation by the assessment of
agricultural marketing information needs study (URT, 2004), which found that there is a
large number of farmers with primary education and above. This shows that, the introduced
cassava processing technology could be easily adopted in the study area because most of
the farmers have formal education although the adoption depends with the efficiency of the
technology and its profitability to the farmers.
4.2 Cassava Processing Technologies Used in Study Area
In Tanzania there are main three technologies that are commonly used for processing
cassava; these are traditional sun drying of plain chunks (Makopa), traditional wet and
solid-state fermentation and mechanical processing technology.
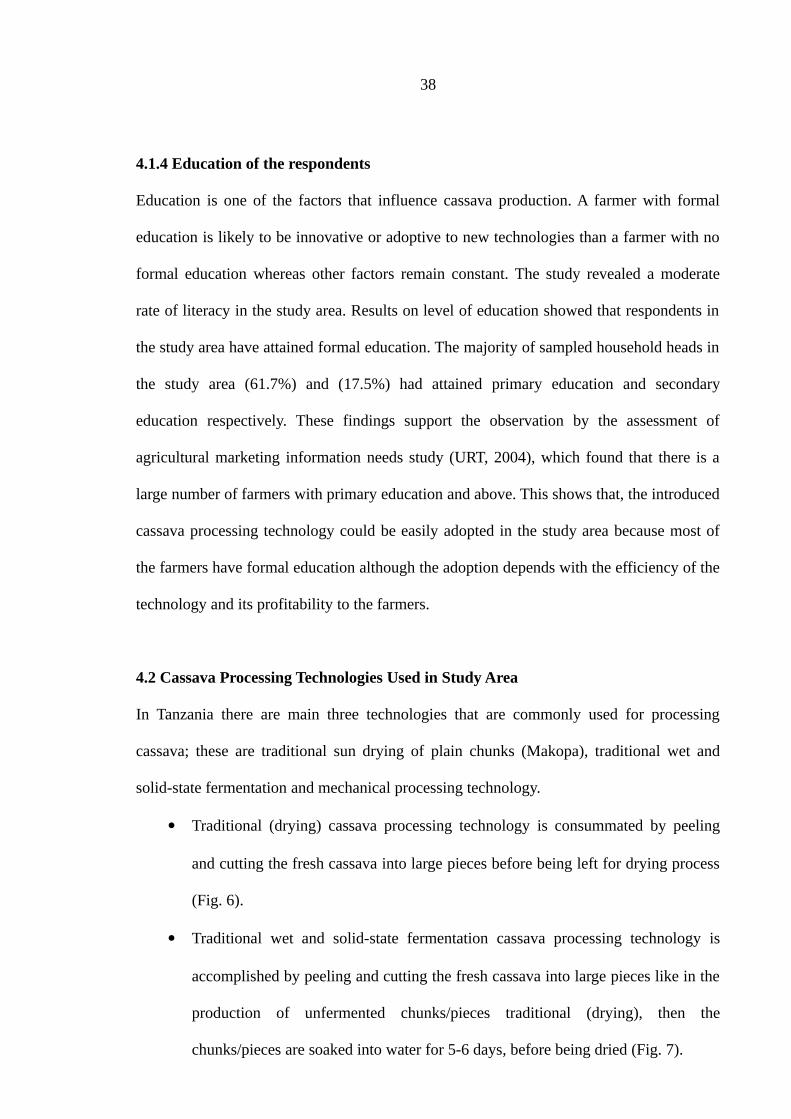
Traditional (drying) cassava processing technology is consummated by peeling
and cutting the fresh cassava into large pieces before being left for drying process
(Fig. 6).
Traditional wet and solid-state fermentation cassava processing technology is
accomplished by peeling and cutting the fresh cassava into large pieces like in the
production of unfermented chunks/pieces traditional (drying), then the
chunks/pieces are soaked into water for 5-6 days, before being dried (Fig. 7).
38
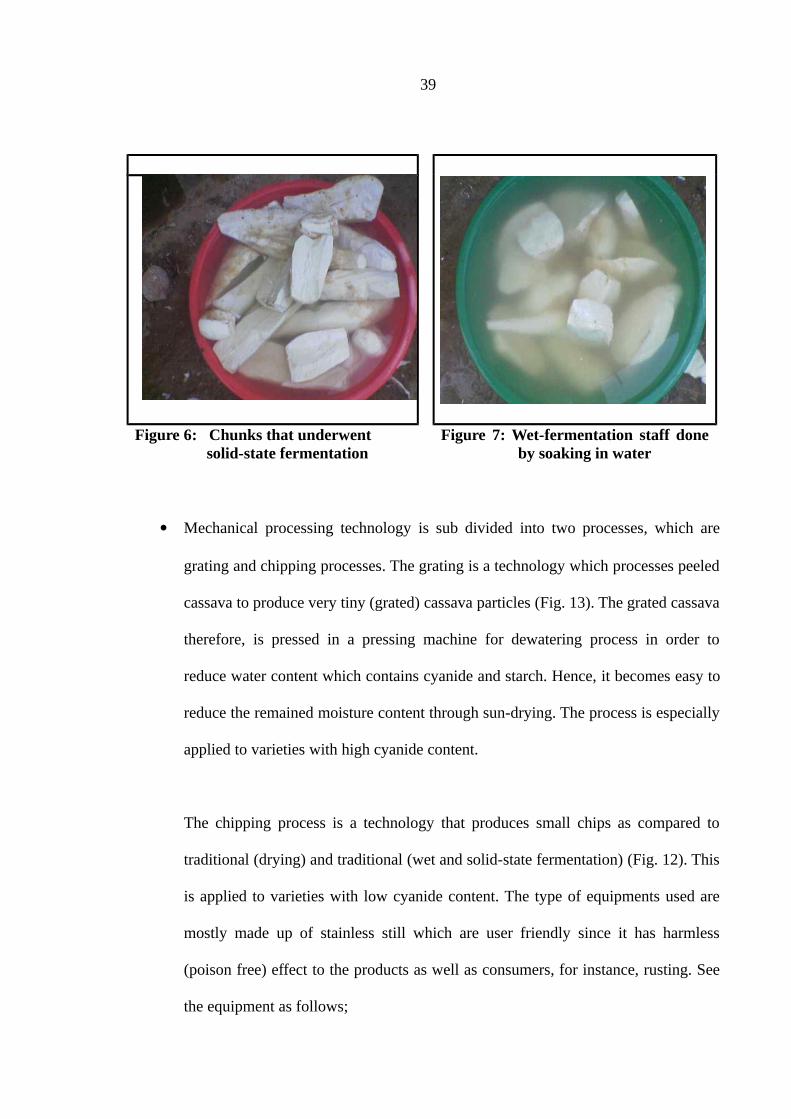
Figure 6: Chunks that underwent solid-state fermentation
Figure 7: Wet-fermentation staff done by soaking in water
Mechanical processing technology is sub divided into two processes, which are
grating and chipping processes. The grating is a technology which processes peeled
cassava to produce very tiny (grated) cassava particles (Fig. 13). The grated cassava
therefore, is pressed in a pressing machine for dewatering process in order to
reduce water content which contains cyanide and starch. Hence, it becomes easy to
reduce the remained moisture content through sun-drying. The process is especially
applied to varieties with high cyanide content.
The chipping process is a technology that produces small chips as compared to
traditional (drying) and traditional (wet and solid-state fermentation) (Fig. 12). This
is applied to varieties with low cyanide content. The type of equipments used are
mostly made up of stainless still which are user friendly since it has harmless
(poison free) effect to the products as well as consumers, for instance, rusting. See
the equipment as follows;
39
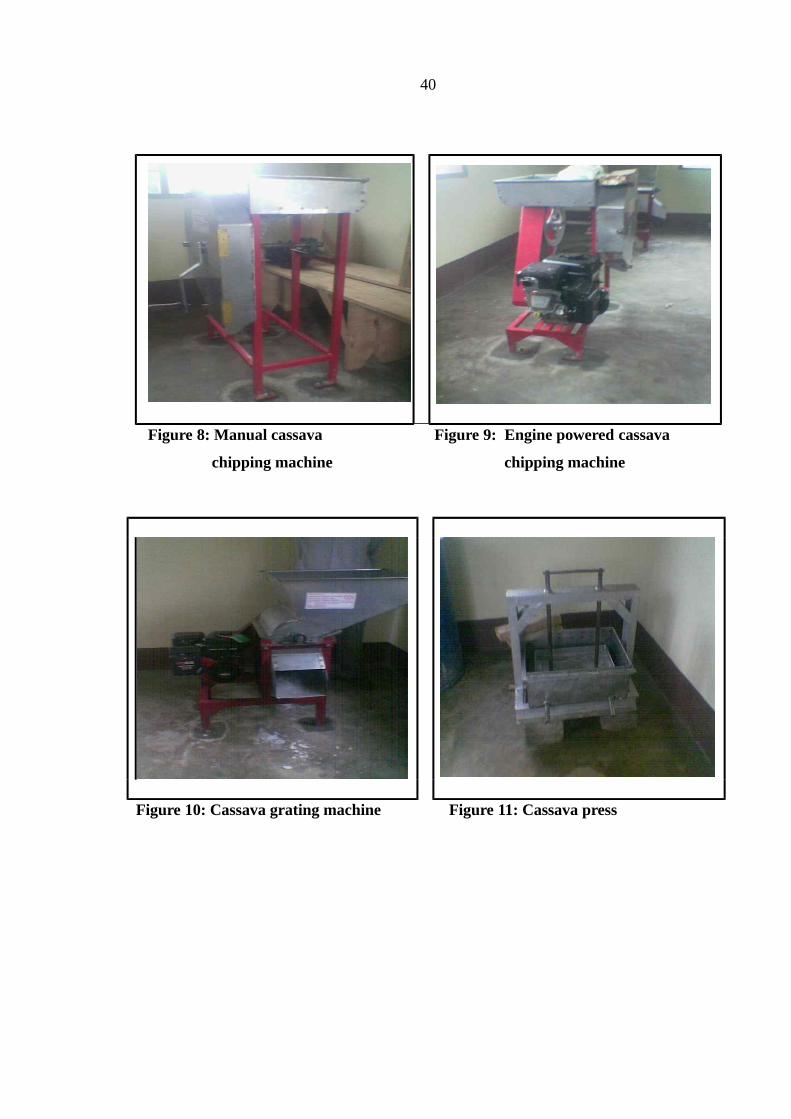
Figure 8: Manual cassava Figure 9: Engine powered cassava
chipping machine chipping machine
Figure 10: Cassava grating machine Figure 11: Cassava press
40

Figure 12: Cassava chips on drying process
Figure 13: Grated cassava
4.2.1 The technology applied by the respondents the sampled villages
Results in the Table 2, show that, 37.5% of the sampled farmers used the traditional
processing technology (drying). In the study area, the traditional processing technology
(drying) is mostly used because the farmers were not aware with mechanical processing
technology. During the survey it was observed (through observation) that other farmers
(non project participants) were admiring the way the machines were working efficiently.
However, non project participants prefer the mechanical processing technology to other
local processing technologies. This is due its short duration to obtain the final product
(cassava flour), high quality and seems to reduce the cyanide content at more than 95%
(IITA, 1996). The results of the technology applied were as follows;
Table 2: The technology applied or used by the respondents in the sample villages
Technology applied or used Village where respondent live Total PercentageMikongeni Tongwe
Mechanical 14 27 41 34.2Traditional 26 19 45 37.5Wet and Solid-state fermentation 20 14 34 28.3Total 60 60 120 100.0
4.2.2 Technical efficiency of cassava processing technologies
41
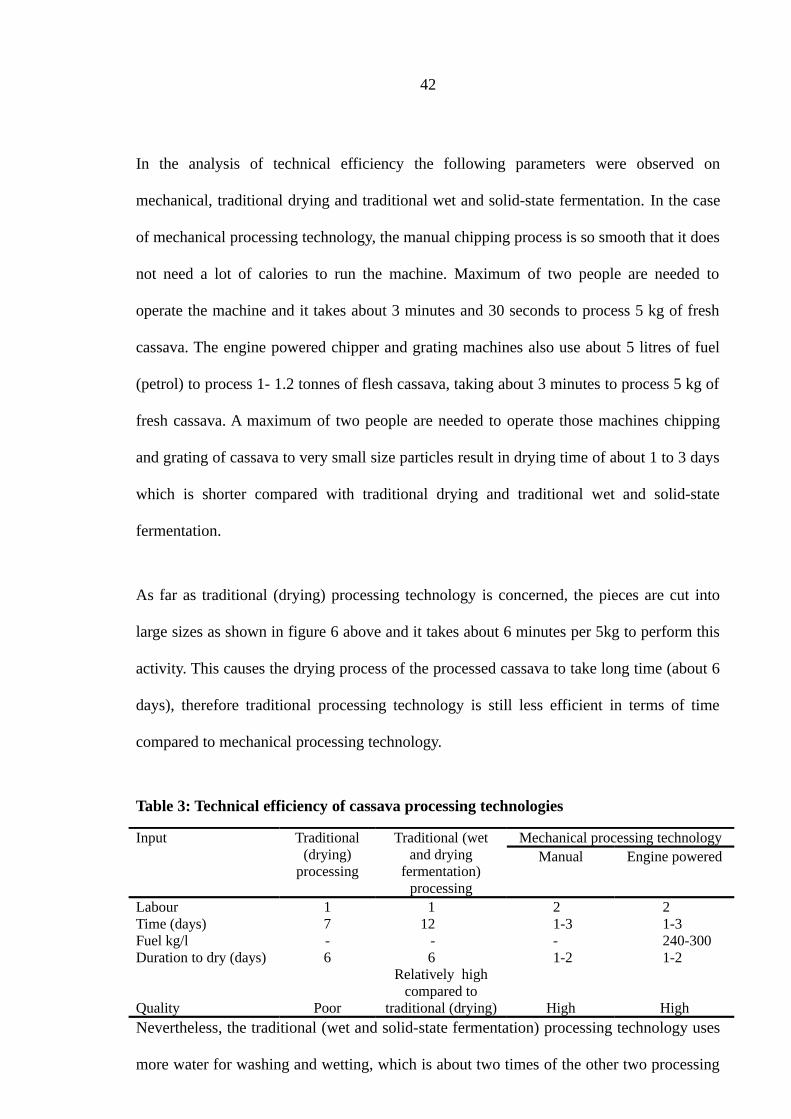
In the analysis of technical efficiency the following parameters were observed on
mechanical, traditional drying and traditional wet and solid-state fermentation. In the case
of mechanical processing technology, the manual chipping process is so smooth that it does
not need a lot of calories to run the machine. Maximum of two people are needed to
operate the machine and it takes about 3 minutes and 30 seconds to process 5 kg of fresh
cassava. The engine powered chipper and grating machines also use about 5 litres of fuel
(petrol) to process 1- 1.2 tonnes of flesh cassava, taking about 3 minutes to process 5 kg of
fresh cassava. A maximum of two people are needed to operate those machines chipping
and grating of cassava to very small size particles result in drying time of about 1 to 3 days
which is shorter compared with traditional drying and traditional wet and solid-state
fermentation.
As far as traditional (drying) processing technology is concerned, the pieces are cut into
large sizes as shown in figure 6 above and it takes about 6 minutes per 5kg to perform this
activity. This causes the drying process of the processed cassava to take long time (about 6
days), therefore traditional processing technology is still less efficient in terms of time
compared to mechanical processing technology.
Table 3: Technical efficiency of cassava processing technologies
Input Traditional (drying)
processing
Traditional (wet and drying
fermentation) processing
Mechanical processing technologyManual Engine powered
Labour 1 1 2 2Time (days) 7 12 1-3 1-3Fuel kg/l - - - 240-300Duration to dry (days) 6 6 1-2 1-2
Quality Poor
Relatively high compared to
traditional (drying) High HighNevertheless, the traditional (wet and solid-state fermentation) processing technology uses
more water for washing and wetting, which is about two times of the other two processing
42
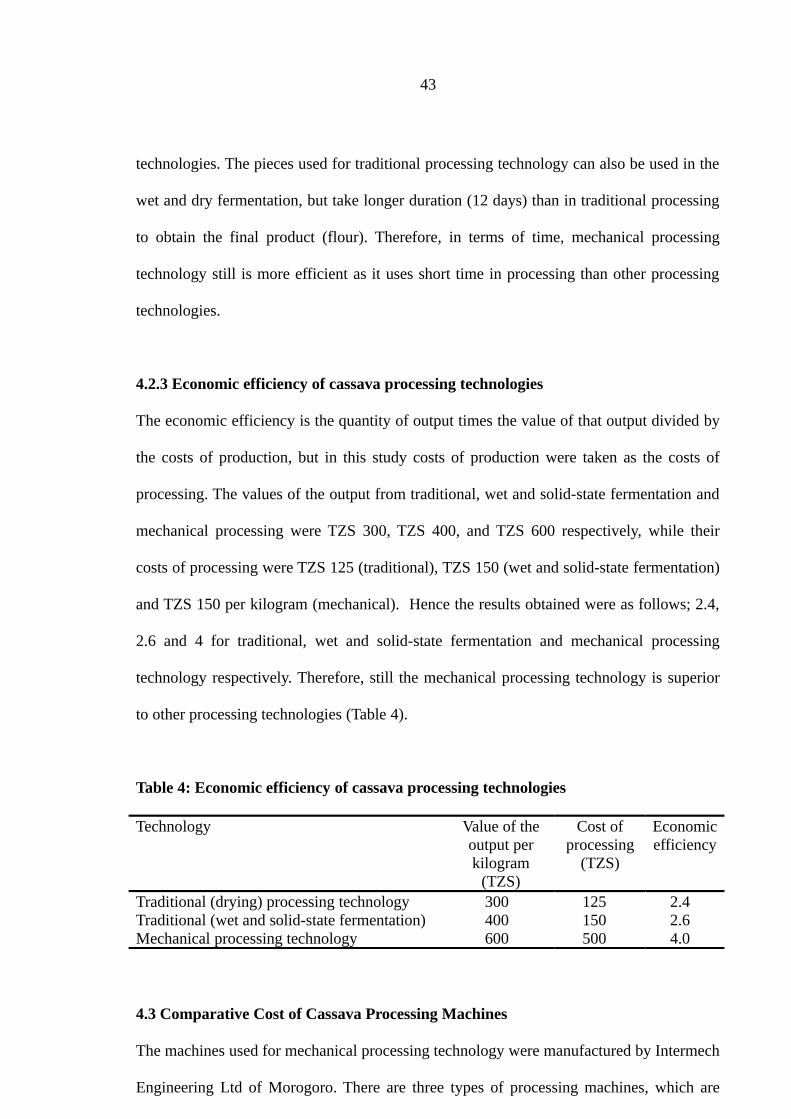
technologies. The pieces used for traditional processing technology can also be used in the
wet and dry fermentation, but take longer duration (12 days) than in traditional processing
to obtain the final product (flour). Therefore, in terms of time, mechanical processing
technology still is more efficient as it uses short time in processing than other processing
technologies.
4.2.3 Economic efficiency of cassava processing technologies
The economic efficiency is the quantity of output times the value of that output divided by
the costs of production, but in this study costs of production were taken as the costs of
processing. The values of the output from traditional, wet and solid-state fermentation and
mechanical processing were TZS 300, TZS 400, and TZS 600 respectively, while their
costs of processing were TZS 125 (traditional), TZS 150 (wet and solid-state fermentation)
and TZS 150 per kilogram (mechanical). Hence the results obtained were as follows; 2.4,
2.6 and 4 for traditional, wet and solid-state fermentation and mechanical processing
technology respectively. Therefore, still the mechanical processing technology is superior
to other processing technologies (Table 4).
Table 4: Economic efficiency of cassava processing technologies
Technology Value of the output per kilogram
(TZS)
Cost of processing
(TZS)
Economic efficiency
Traditional (drying) processing technology 300 125 2.4Traditional (wet and solid-state fermentation) 400 150 2.6Mechanical processing technology 600 500 4.0
4.3 Comparative Cost of Cassava Processing Machines
The machines used for mechanical processing technology were manufactured by Intermech
Engineering Ltd of Morogoro. There are three types of processing machines, which are
43

chipping machines, grating machines and pressing machine. The chipping machines are of
two models, that is manually chipping machine and engine powered chipping machine.
Description of each is presented in Table 5.
Table 5: Model specification of processing machines
Machine Model specification
Function Life span (years)
Price (TZS)
Manual Cassavachipping
5-7 300 000
Engine powered (5.5hp)
Cassavachipping
5-7 950 000
Engine powered (5.5hp)
Cassavagrating
5-7 1 210 000
Hydraulic Press grated cassava to remove significant amount of liquid (containing cyanide and starch)
5-7 495 000
The prices of those machines which are manual chipping, engine powered chipping, grater,
and cassava presser are TZS 300 000, TZS 950 000, TZS 1 210 000 and TZS 495 000
respectively, each with a life span of 5-7 years as shown in Table 5.
4.3.1 Operating costs of the machines
44
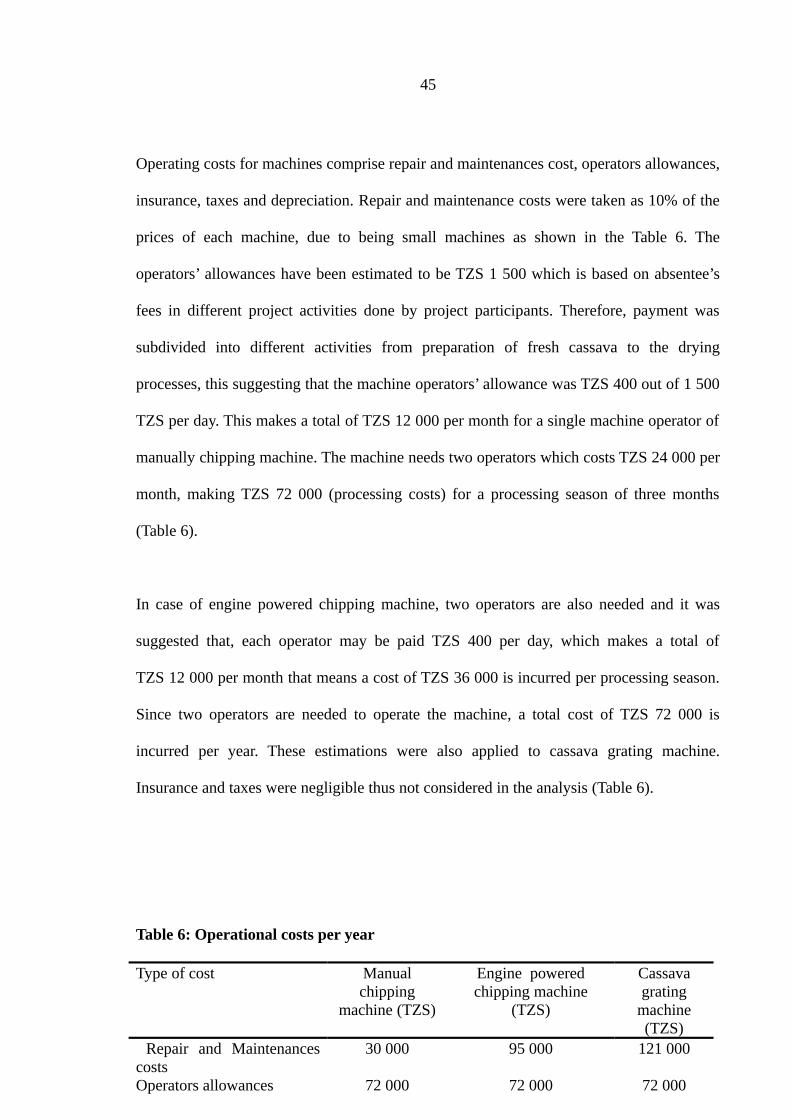
Operating costs for machines comprise repair and maintenances cost, operators allowances,
insurance, taxes and depreciation. Repair and maintenance costs were taken as 10% of the
prices of each machine, due to being small machines as shown in the Table 6. The
operators’ allowances have been estimated to be TZS 1 500 which is based on absentee’s
fees in different project activities done by project participants. Therefore, payment was
subdivided into different activities from preparation of fresh cassava to the drying
processes, this suggesting that the machine operators’ allowance was TZS 400 out of 1 500
TZS per day. This makes a total of TZS 12 000 per month for a single machine operator of
manually chipping machine. The machine needs two operators which costs TZS 24 000 per
month, making TZS 72 000 (processing costs) for a processing season of three months
(Table 6).
In case of engine powered chipping machine, two operators are also needed and it was
suggested that, each operator may be paid TZS 400 per day, which makes a total of
TZS 12 000 per month that means a cost of TZS 36 000 is incurred per processing season.
Since two operators are needed to operate the machine, a total cost of TZS 72 000 is
incurred per year. These estimations were also applied to cassava grating machine.
Insurance and taxes were negligible thus not considered in the analysis (Table 6).
Table 6: Operational costs per year
Type of cost Manual chipping
machine (TZS)
Engine powered chipping machine
(TZS)
Cassava grating
machine (TZS)
Repair and Maintenances costs
30 000 95 000 121 000
Operators allowances 72 000 72 000 72 000
45

Insurance - - -InterestTaxes - - -Depreciation 40 000 129 300 164 300Total 142 000 296 300 357 300
The depreciation cost was associated with tear and wear of the machine and was estimated
by using straight line method. The machines with life span of 7 years have the salvage
values of TZS 20 000, TZS 45 000 and TZS 60 000 for manual, engine powered, and
cassava grating machines respectively.
4.3.2 Net present value of the machines
The Net Present Value (NPV) was used to test the worthiness of using the machines based
on 7 years. The variables used were initial cost, average running cost, and average income
discounting factor as shown in Table 7. Detailed information is attached in Appendices 5 to
7.
Table 7: Net present values of machines
Variables Manual chipping machine
Engine powered chipping machine
Cassava grating machine
Initial cost (TZS) 300 000 950 000 1 210 000Discounted cost (TZS) 140 571 308 115 345 247Discounted benefit (TZS) 456 193 456 193 456 193Discounting factor (%)1
(No of years) 20.0
(7) 20.0
(7) 20.0
(7)NPV 1 465 481 1 844 168 2 093 064Decision acceptable acceptable acceptable
1 Base on commercial banks recommendation
The results obtained in Table 7, show that all the NPVs for the three machines were
positive, suggesting that any of the machines can be accepted. Furthermore, to ascertain the
machine, BCR analysis was conducted and results are presented in Table 8.
Table 8: Benefit-Cost ratio analysis of the machines
46

Machine Discounted
benefits
Costs Benefit-Cost Ratio
Manual chipping machine 456 193 140 571 3.25Engine powered chipping machine 456 193 308 115 1.48Cassava grating machine 456 193 345 247 1.32
Therefore, the manual chipping machine has highest benefit-cost ratio (3.25), which means
that, benefits outweighs the costs hence more profit is realized using manual chipping
machine as compared to other machines. However, the NPV and BCR for machines do not
cover all costs and benefits of the project. In order to cover these costs and benefits
sensitivity analysis was carried out to evaluate the project viability.
4.3.4 Sensitivity analysis to test viability of the project
Sensitivity analysis was employed for the mechanized technology with a projection of
seven years to see the viability of the project. The NPV, IRR and BCR were calculated and
the results were 743 585, 42% and 1.66 respectively as shown in Appendix 8; the value for
BCR shows that the benefits outweigh the costs, which means that the project is viable.
Furthermore, the changes to various key variables such as sales prices and operating
expenses were done, where the decline of 5% of sales price caused the NPV to be 565 467
and IRR was 36% whereas an increase of 5% of the operating expenses caused NPV to be
564 230 with IRR of 36% (Appendix 5). Therefore the project is also viable since the
changes of key variables also caused a small change in NPV and IRR was constant, that
means consistence exists. Since the sensitivity analysis does not estimate the profit of the
machines, partial budget analysis was employed to determine the profit realized by each
machine as compared to traditional processing technologies.
4.3.5 Analysis of change from local to mechanized technology
47

The partial budget analysis was applied to calculate the economic benefits for mechanized
cassava processing technology. The seven components (added costs, reduced returns,
reduced costs, added returns, totals of the first two and the second two, and a net
difference) were taken into consideration as follows.
4.3.5.1 The added returns for using the mechanized technology
Table 4 revealed that, there are added returns from introduced cassava processing
technology, since processed cassava produced high quality cassava products hence the
price rose from TZS 400 to TZS 600 per kilogram. The difference in price was TZS 200
which caused the added returns of TZS 200 000 per tonne. Also according to IITA (1996),
the food losses were reduced from 22.3% to 10.1% of the fresh cassava, hence caused an
added returns of TSZ 73 200 per tonne. Therefore, signified the total added returns of TZS
273 000.
4.3.5.2 The reduced costs for using the mechanized technology
This section considers the reduction in operating costs. The study revealed that, there is a
reduction of time (6-9 days) to obtain a final product (cassava flour) by using the
introduced cassava processing technology. Thus introduced technology can be used to
process fresh cassava two to three more times compared to local processing technologies
for the same period. The extra processing cost per kilogram compared to local
technologies is TZS 200 which leads to TZS 200 000 processing cost per tonne, times two
which is the lowest number of times the introduced processing technology can be done
compared to local processing technologies, gives a total reduced cost of TZS 400 000.
Therefore, the reduced cost per day is about TZS 50 000 (Table 9).
Table 9: Partial budget analysis resulting from a change to mechanized technology
48
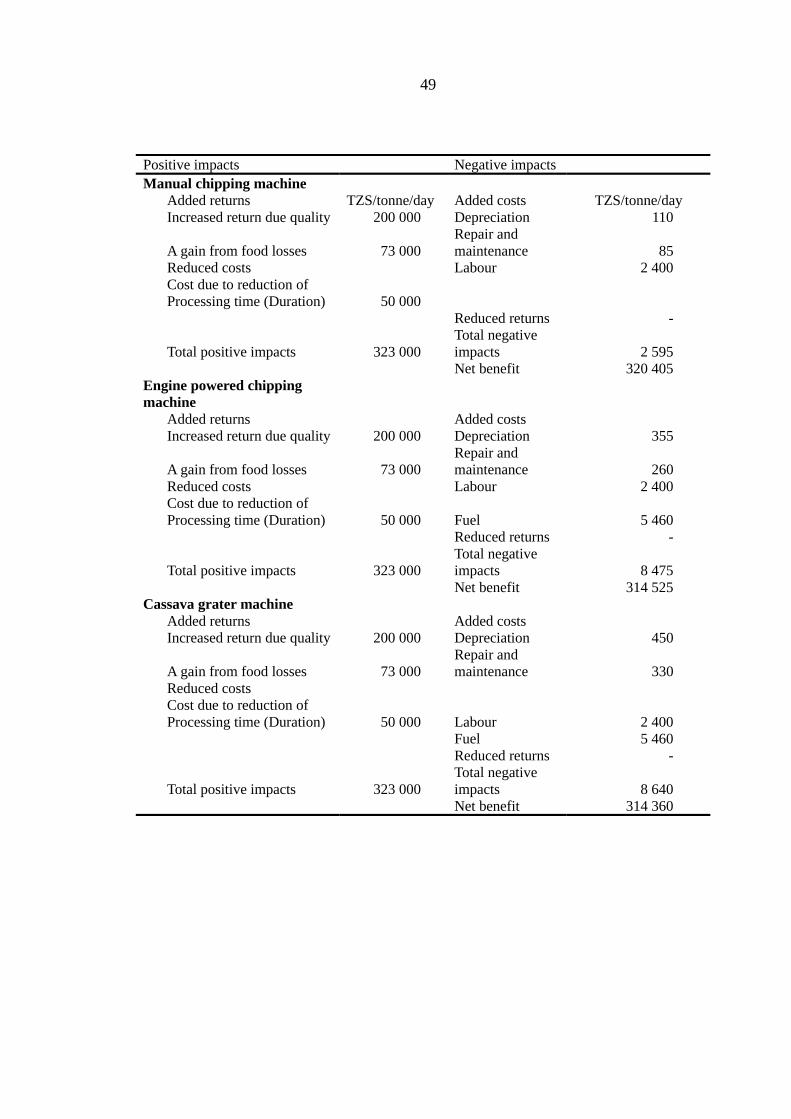
Positive impacts Negative impactsManual chipping machine
Added returns TZS/tonne/day Added costs TZS/tonne/dayIncreased return due quality 200 000 Depreciation 110
A gain from food losses 73 000Repair and maintenance 85
Reduced costs Labour 2 400Cost due to reduction of Processing time (Duration) 50 000
Reduced returns -
Total positive impacts 323 000Total negative impacts 2 595Net benefit 320 405
Engine powered chipping machine
Added returns Added costsIncreased return due quality 200 000 Depreciation 355
A gain from food losses 73 000Repair and maintenance 260
Reduced costs Labour 2 400Cost due to reduction of Processing time (Duration) 50 000 Fuel 5 460
Reduced returns -
Total positive impacts 323 000Total negative impacts 8 475Net benefit 314 525
Cassava grater machineAdded returns Added costsIncreased return due quality 200 000 Depreciation 450
A gain from food losses 73 000Repair and maintenance 330
Reduced costsCost due to reduction of Processing time (Duration) 50 000 Labour 2 400
Fuel 5 460Reduced returns -
Total positive impacts 323 000Total negative impacts 8 640Net benefit 314 360
49
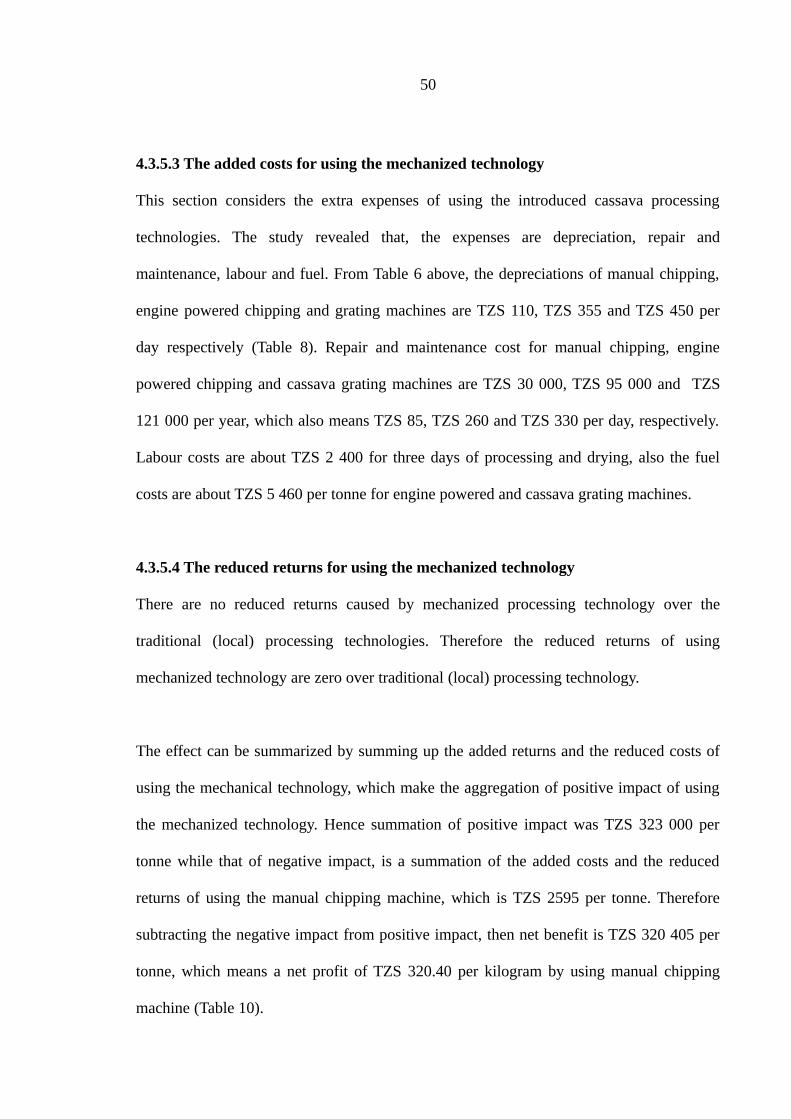
4.3.5.3 The added costs for using the mechanized technology
This section considers the extra expenses of using the introduced cassava processing
technologies. The study revealed that, the expenses are depreciation, repair and
maintenance, labour and fuel. From Table 6 above, the depreciations of manual chipping,
engine powered chipping and grating machines are TZS 110, TZS 355 and TZS 450 per
day respectively (Table 8). Repair and maintenance cost for manual chipping, engine
powered chipping and cassava grating machines are TZS 30 000, TZS 95 000 and TZS
121 000 per year, which also means TZS 85, TZS 260 and TZS 330 per day, respectively.
Labour costs are about TZS 2 400 for three days of processing and drying, also the fuel
costs are about TZS 5 460 per tonne for engine powered and cassava grating machines.
4.3.5.4 The reduced returns for using the mechanized technology
There are no reduced returns caused by mechanized processing technology over the
traditional (local) processing technologies. Therefore the reduced returns of using
mechanized technology are zero over traditional (local) processing technology.
The effect can be summarized by summing up the added returns and the reduced costs of
using the mechanical technology, which make the aggregation of positive impact of using
the mechanized technology. Hence summation of positive impact was TZS 323 000 per
tonne while that of negative impact, is a summation of the added costs and the reduced
returns of using the manual chipping machine, which is TZS 2595 per tonne. Therefore
subtracting the negative impact from positive impact, then net benefit is TZS 320 405 per
tonne, which means a net profit of TZS 320.40 per kilogram by using manual chipping
machine (Table 10).
50

Table 10: Profit made by each machine
Machine Total positive impact
(TZS/tonne/day)
Total negative impact
(TZS/tonne/day)
Profit made per kilogram
(TZS)Manual chipping machine 323 000 2 595 320.40Engine powered chipping machine 323 000 8 475 314.53Cassava grating machine 323 000 8 640 314.36
Table 10 indicates that the total positive impact made by engine powered and cassava
grating machines was TZS 323 000 per tonne and the total negative impacts were TZS 8
475 and TZS 8 640 per tonne. Therefore subtracting the negative impact from positive
impact, then net benefit are TZS 314 525 and TZS 314 360 per tonne, which means a net
profit of TZS 314.53 and TZS 314.36 per kilogram for engine powered chipping and
cassava grating machines respectively.
4.4 Analysis of Consumer’s Preference of Cassava Flour by Method of Preparation
As noted in the methodology, the analysis was done to examine the consumer’s preference
for cassava mechanically processing products. The study revealed that, there were
consumers of the mechanical processed products versus non users. Consequently, the
analysis was centred on variation of variables in relation to cassava consumption versus
different technologies.
The results from the consumer’s preference for mechanically processed cassava products in
Table 11, show the likelihood ratio statistic of the suggested model was significant (P <
0.05), correctly predicting participation in 74.2% of the cases. Therefore the most
significant influencing consumer’s preferences factors for mechanically processed products
of cassava were quality of the product, quantity consumed, household size and price of the
processed products.
51

The quality of the products was one of the most influencing factors for consumer’s
preference for mechanically processed products; it is positively related to the consumer’s
preference and statistically significant (p < 0.01). Being of high quality products increased
the probability by 0.497 (marginal effect) to opt for mechanically processed products. This
result was confirmed by Onumah (2006), Laswai et al. (2005) and Silayo et al. (2004) who
found that the high quality processed products were mostly preferred by people.
Table 11: Probit regression analysis results for consumer’s preference
Variable Coefficients Std. Error Probability Marginal effects
Age 0.016 0.216 0.464 0.003Gender - 0.399 0.492 0.418 -0.074Education 0.052 0.076 0.499 0.009Household size 1.199 0.355 0.001* 0.223Income level 0.396 0.451 0.379 0.074Quality of products 2.312 0.591 0.000** 0.497Quantity consumed 0.893 0261 0.001* 0.166Price -1.099 0.523 0.036* -0.291Constant -3.630 1.375 0.008Log likelihood value = -26.24, Likelihood ratio statistics 2
8 = 94.11, Pseudo R2 = 64.19%, % of correct
prediction = 74.2%, Number of observation (N) = 120, **statistically significant at P < 0.01, *statistically significant at P < 0.05.
The quantity consumed by the household was statistically significant (p < 0.05) and
positively related to the consumer’s preference for cassava mechanically processed
products (Table 11). This implies that a unit increase in quantity consumed increases the
probability to prefer mechanically processed products by 0.166 (marginal effect).
Table 11 also indicates that household size was statistically significant (p < 0.05) and
positively correlated to preference of the mechanically processed cassava products. This
suggests that an increase in household size by one unit (person), increases the probability
of preference to mechanically processed products by 0.223 (marginal effect).
52
The price of the product was statistically significant (p < 0.05) but negatively related to
cassava mechanically processed products. This means that an increase in one unit for price
caused a decrease in probability option to cassava mechanically processed products by
0.219 (marginal effect). This conforms with the Law of Supply and Demand which states
that the high the price the low the quantity demanded and vice versa, at a given point in
time ceteris peribus. Also there are other factors which contributed slightly with positive
relationship but not significant like age and education whereas gender had a negative
relationship.
Therefore, after having studied the consumer’s behaviour the study aimed at projecting the
future production of cassava in the study area, as a combined effect of introduced cassava
processing technologies.
4.5 Projection of Future Production of Cassava Resulting from Mechanized Cassava
Processing
The projection for the future production in cassava of the two districts (Muheza and
Kibaha) was done by using goal programming approach. Muheza district is superior to
Kibaha district in cassava production, but the total production of the two districts was
taken as the bench mark for future projection for cassava production. According to the
respective District Agricultural and Livestock Development Officers (DALDO), the
production of Muheza and Kibaha districts were estimated at 75 000 and 5000 tonnes,
respectively which make a total of 80 000 tonnes.
The study categorised production into two categories, that is sweet and bitter varieties of
cassava, and results of production found to be with a proportionality of 5:3 respectively.
According to this proportionality, the sweet varieties had production of about 50 000
53

tonnes and about 30 000 tonnes for the production of bitter varieties. This shows that,
sweet varieties are more produced than bitter varieties due to their immediate consumption.
4.5.1 Formation of coefficient matrix for constraints
Any maximization function must involve constraints; the constraints used to maximize
production of cassava in this study were consumption of cassava, varieties for cassava
production, access to the market for cassava products, costs of cassava processing and
prices for processed cassava. Therefore the coefficient matrix formed was as follows: the
consumption of bitter and sweet varieties ratio was 1 500:2 000 tonnes and the goal or
targeted value for this was set at 30 000 tonnes per year per village with the positive and
negative deviations of 500 tonnes (Table 12).
The second constraint was variety, in good management (agronomic) bitter variety can
produce up to 8 tonnes per acre and 7 tonnes for sweet variety, which in combination they
can produce 15 tonnes, therefore the goal or targeted value set for that one was 18 tonnes
with a positive deviation and negative deviation of 3 tonnes. The important concept to bear
in mind here is that, bitter varieties produce more yield than sweet varieties.
The third constraint was access to the market. Table 12 shows that the constraint has
400:500 ratio of bitter and sweet variety accessed to market respectively, with a goal or
targeted value of 20 000 tonnes from a bench mark of 15 000 tonnes. Also the positive and
negative deviations were 5000 tonnes.
The fourth constraint was cost of processing. The observation made shows that there was
no difference in cost of processing of neither bitter varieties nor sweet varieties and
thereafter it was estimated to cost 150 TZS per kilogram which implies 150 000 TZS per
54

tonne as processing cost. The positive and negative deviations were 50 000 TZS
(Table 12).
Table 12: Coefficient matrix for optimization of cassava production
Constraints Bitter variety in
tonnes (Q1)
Sweet variety in
tonnes (Q2)
Positive deviation
from targeted
value(U+)
Negative deviation
from targeted
value (U-)
Total
Consumption (t) 1 500 2 000 500 500 30 000Variety productivity (t/acre) 8 7 3 3 18Access to market (t) 400 500 5 000 5 000 20 000Cost of processing (TZS/kg) 150 150 50 000 50 000 150 000Price per tonne (TZS) 500 500 100 000 100 000 500 000Total for each variety 30 000 50 000 - - -
The last constraint was the price of the processed products. The cassava flour processed
from bitter varieties is more preferred, than the sweet cassava flour. Because it is difficult
to differentiate them in the market, hence their prices were the same. The bitter cassava
flour was TZS 500 per kilogram whereas TZS 500 also for sweet cassava flour. Therefore,
taking the maximum price per tonne, a cost of about TZS 500 000 with a positive and
negative deviations of TZS 100 000. This information is summarized in the Table 12
above.
4.5.2 Values of the program
The coefficients matrix formed (Appendix 4) ready for maximization process was
estimated using linear programming software. Results indicates that the pivot value was
7.00 and the optimum solution found after first iterations and the maximum value for
cassava production was 128 571.4 tonnes, which is the projection for future production of
cassava for the two districts.
55

Appendix 4 also shows that, the disposal or slack variables were consumption, access to
the market, processing costs and price of the processed products. Since the maximization
of cassava production realistically did not use the entire quantity of each constraint
available, provisions must be made for the non-use constraints in the final plan. These
variables allow the non-use or changes to be made.
Furthermore, the objective of the study was to maximize production subject to those
constraints mentioned above, with a goal or targeted value to be achieved. Therefore, the
final (optimal) plan was to produce sweet varieties 2.57 times (Appendix 4) the previous
production, setting aside the bitter varieties. This is due to reasons that, many farmers do
not feel like to produce bitter varieties because the varieties take long time to mature in the
field and tedious work in processing.
4.6 Final Evaluation Plan of the Mechanized Cassava Processing Technologies
The final evaluation for processing machines based on the analyses applied in this study
were initial costs, net present value (NPV) and partial budget and benefit-costs ratio
whereas the machines were manual chipper, engine powered chipper and cassava grater.
The final evaluation is summarized in Table 13.
Therefore, based on the results obtained in this research, the final evaluation is that, for
small scale production at farmer’s level it is better to use manual chipping machine
because, it is first of cheaper compared to other machines. Secondly, it has a positive NPV
(1 465 481) which can be accepted like other machines, that is engine powered chipper and
cassava grater.
56
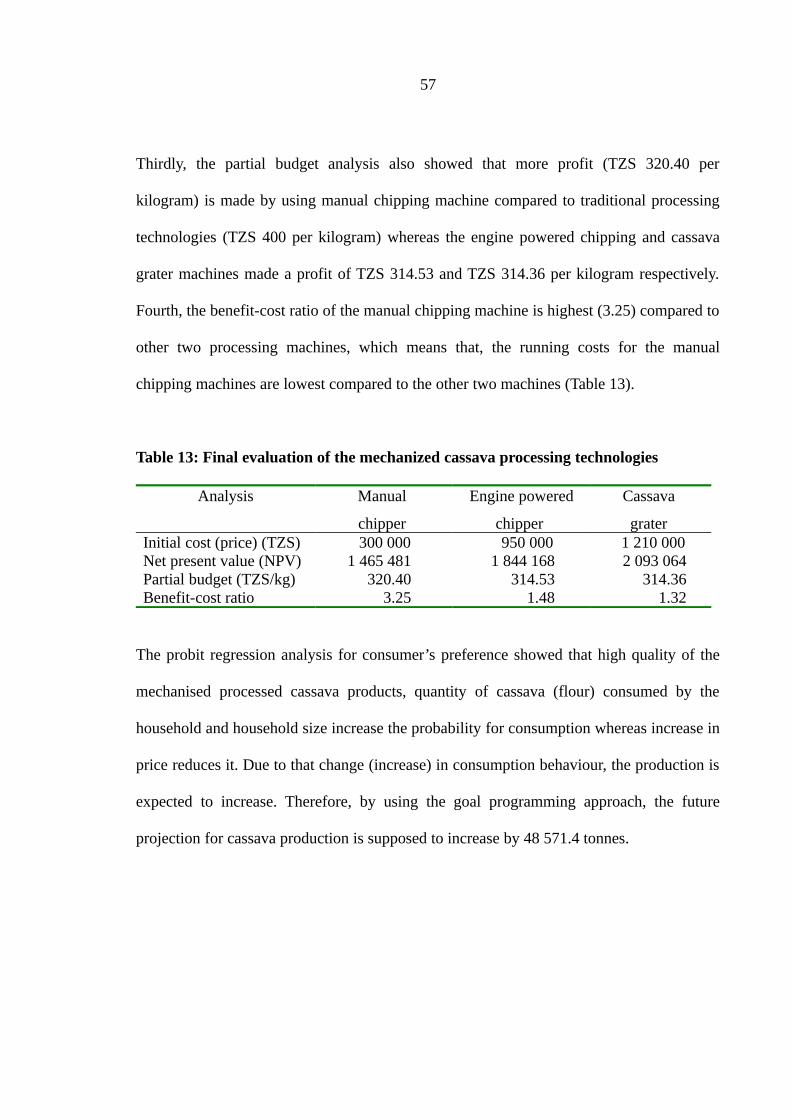
Thirdly, the partial budget analysis also showed that more profit (TZS 320.40 per
kilogram) is made by using manual chipping machine compared to traditional processing
technologies (TZS 400 per kilogram) whereas the engine powered chipping and cassava
grater machines made a profit of TZS 314.53 and TZS 314.36 per kilogram respectively.
Fourth, the benefit-cost ratio of the manual chipping machine is highest (3.25) compared to
other two processing machines, which means that, the running costs for the manual
chipping machines are lowest compared to the other two machines (Table 13).
Table 13: Final evaluation of the mechanized cassava processing technologies
Analysis Manual
chipper
Engine powered
chipper
Cassava
grater Initial cost (price) (TZS) 300 000 950 000 1 210 000Net present value (NPV) 1 465 481 1 844 168 2 093 064Partial budget (TZS/kg) 320.40 314.53 314.36Benefit-cost ratio 3.25 1.48 1.32
The probit regression analysis for consumer’s preference showed that high quality of the
mechanised processed cassava products, quantity of cassava (flour) consumed by the
household and household size increase the probability for consumption whereas increase in
price reduces it. Due to that change (increase) in consumption behaviour, the production is
expected to increase. Therefore, by using the goal programming approach, the future
projection for cassava production is supposed to increase by 48 571.4 tonnes.
57

CHAPTER FIVE
5.0 CONCLUSION AND RECOMMENDATIONS
5.1 Conclusion
The quantitative analysis indicates that the mechanical cassava processing technologies are
most efficiency compared to other two traditional processing technologies, which are
traditional (drying) and traditional (wet and solid-state fermentation). The technical
efficiency carried out showed that, there is a reduction in processing time from 12 days to
1-3 days. That means during the dry season, drying can take 10-12 hours, therefore within
a single day the final product (cassava flour) can be obtained. During wet (rainy) season,
the drying process can take 2 to 3 days to obtain the cassava flour. Furthermore, the
economic efficiency of the mechanical cassava processing technologies was 4, the highest
compared to 2.6 and 2.4 of the other two traditional processing technologies. This shows
that the mechanical cassava processing technology is producing the products of high
quality, hence high value with the comparison of the other two traditional cassava
processing technologies.
Comparative costs of processing machines, for instance time-related costs such as interest,
taxes and insurances costs are not paid. Other costs are use-related costs or operational
costs which include fuel, lubrication, use-related repairs and labour also are minimal. The
fuel consumption for engine operated machine was found to five litres for 1.5 tonnes of the
peeled cassava roots. The manually operated chipping machine is so smooth to run
therefore little labour costs. In order the machines to operate efficiently, two people are
needed as the operators. The average running costs for machines differ from one machine
to another. The manual chipping machine was having the lowest (TZS 140 571) average
58

running cost per year whereas the engine powered and cassava grater machines were TZS
308 115 and TZS 345 247 per year respectively.
In additional to that, the benefit-cost analysis carried revealed that, manual chipping,
engine powered and cassava grater machines were having the benefit-cost ratio of 3.25,
1.48 and 1.32 respectively. That means more profit is made using manual chipping
machine followed by engine powered machine, and the last is cassava grater machine.
Moreover, the use manual chipping, engine powered and cassava grater machine made a
profit of TZS 320.40, TZS 314.53 and TZS 314.36 per kilogram respectively compared to
other traditional processing technologies.
Based on the results of the probit regression analysis it can be concluded that quality of
mechanically processed products, household size and quantity consumed per year were
important factors that increase the probability of consumers’ preference for mechanically
processed cassava products versus different processing technologies in the study areas. On
the other hand, price of the product was significant factor that reduce the probability of
consumers’ preference for mechanically processed cassava products versus different
processing technologies in the study areas. Other factors such as age of household head,
gender of the household head, education level and income level were not significant.
The introduction of mechanized processing technologies have resulted into the change in
cassava consumption behaviour, hence increase in demand of the product. This has further
stimulated production of cassava in the study areas. Based on goal programming approach
the projection of the future production of cassava will be 128 571.4 from 80 000 (current
production) tonnes per year.
59

5.2 Recommendations
Based on the observation that there is a potential improvement on cassava processing,
which will ultimately have a positive impact on the rural livelihood in alleviating poverty
due to increase in production, the following are worthwhile recommendations to be
considered in improving mechanical processing technologies, production and consumption
of cassava.
5.2.1 Mechanical processing technologies for cassava
Measures should be taken to improve the financial resources needed by cassava grower to
engage in mechanical processing technologies rather than selling raw produce. This could
be done through provision of credit facilities, which will improve their economies of scale
in cassava processing and production.
(i) Small farmers should be encouraged to use manual chipping machines which
have the lowest buying price and average running costs compared to engine
powered chipper and cassava grater. The enterprises or processing companies
are recommended to use engine powered chipper and cassava grater because
they might have large scale processing which is not suitable to have manual
chipping machine.
(ii) In order to minimize the problem of shortage of processing machines in the
study area, private sector including traders with capital need to be encouraged
to invest in provision of processing services to farmers. The government and
financial institutions should play a major role in offering favourable conditions
for credits.
60

(iii) Furthermore, the group’s formation can solve the limited number of processing
facilities where the growers can raise enough capital by mobilizing the little
resources they have to finance processing machines/equipments. This will
reduce transportation costs to the processing machine especially from most
remote villages.
(iv) The development of less expensive and more efficient cassava processing
machines or industry at the village level should be given priority. This is
particularly important for the rural areas where hydroelectric power supply is
almost non-exist. The government and other financial institutions should
encourage Small Industry Development Organizations (SIDO), so that they can
improve the designs of their machines and work for more improved designs for
cassava processing.
(v) Training on cassava processing and packaging should be provided in order to
cope with the growing market for cassava products.
5.2.2 Cassava production
Because of being attacked by diseases and pests, the study recommends that there is need
for farmers to be provided with resistant varieties and appropriate farming practices as well
as training from Agricultural Research Centres. This will boost cassava production in
different parts in Tanzania and most of its people will be food secure, which ultimately
have a positive impact to the rural livelihood and poverty alleviation.
(i) Farmers are encouraged to plant more of bitter varieties because they produce
high yield per hectare, they are highly resistant to diseases compared to sweet
61

varieties and are less attacked by wild animals (pigs and rats) even though they
take long time to mature.
(ii) More research should be conducted on the diseases affecting cassava
production and that treatment for those diseases is made clear to the farmers.
5.2.3 Cassava consumption
The specific government policies and programs should be made to enhance cassava
consumption which can focus on three main areas; food security, income generation and
nutrition. Hence the following areas may be vital:
(i) Organizations like program against Malnutrition and the Ministry of
Agriculture, Cooperatives and Food Security to look at ways of improving
and promoting on how cassava can be prepared and consumed to increase its
attractiveness.
(ii) Farmers and other consumers should be made aware of the new products
which can be made cassava/cassava flour such as kibabu/kibabu, bans or
maandazi, chapatti, biscuits, chips and bread/cakes. Education like programs
may be used to help consumers adopt these new foods that use cassava as
principal ingredients.
(iii) Development and enhancement of quality and standards of cassava to ensure
food and feed safety.
62

(iv) Improvement on value addition, such as to support producers and processors
and also ensure that marketing is improved. One way would be making sure
transport costs are minimized by maintaining good roads from production to
consumption areas.
(v) Enhanced deliberate nutrition programs that can lead to increased use of
cassava in the diet; like feeding programs in hospital and schools.
(vi) Deliberate promotional campaign programs on the nutritional aspects of
cassava products.
63

REFERENCES
Andrew, J. H., Stefan, H. and Elisabeth, B. (2008). A multi-objective model for
environmental investment decision making. Computer and Operations Research
35(1): 253 - 266.
Bailey, K. D. (1994). Methods of Social Research Fourth Edition. Free Press Macmillan
Inc., New York. 588pp.
Bakht, G. M. K., Ahmadi, H. A., Akram, A. and Karimi, M. (2009). Repair and
maintenance cost models for Mf285 tractor: A case study in central region of Iran.
Advances in Biological Research 3 (1-2): 19 - 23.
Burton, P. (2005). How to Calculate Machinery Ownership and Operating Costs.
[http://agbiopubs.sdstate.edu/articles/EC920e.pdf] site visited on 12/07/2009.
Cardoso, A. P., Mirione, E., Ernesto, M., Massaza, F., Cliff, J., Haque, M. R. and Bradbury,
J. H. (2005). Processing of cassava roots to remove cyanogens. Journal of Food
Composition and Analysis 18: 451 - 460.
Carpenter, R. E. (2003). Slot Machine Gambling in Maryland: An Economic Analysis.
Maryland Institute for Policy Analysis and Research. University of Maryland,
Baltimore County. 14pp.
CIAT (1993). Annual report on the Latest Facts about Cassava as an Ancient Crop. First
Track Ltd, Cali, Columbia. 12pp.
64

Ciptomulyono, U. (2008). Fuzzy goal programming approach for deriving priority weights
in the analytical hierarchy process (AHP) method. Journal of Applied Sciences
Research 4(2): 171 - 177.
Cock, J. H. (2001). Cassava: New potential of a neglected crop; Entertainment Co. Ltd.,
Colorado, USA. 231pp.
Dalsted, N. (2008). Agriculture and Business Management Notes. Dept. of Ag. & Resource
Economics, Colorado State University. 5pp.
Dalsted, N. and Gutierrez, P. (2009). Risk and Resilience in Agriculture: Partial Budget.
Colorado State University. 5pp.
Davies, L. and Patton, D. (2000). Farm Budgets and Costs. [http://www.dpi.nsw.gov.au/
agriculture/farm-business/budgets] site visited on 16/06/2009.
De Bruijin, G. and Fresco, L. (1999). The importance of cassava in the world food
production. Netherlands. Journal of Agricultural science 7(11): 21 - 34.
Diaz-Balterio, L. and Romero, C. (2008). Making forestry decision with multiple criteria.
A review and an assessment. Forest Ecology and Management 255: 3222 - 3241.
Dumler, T. J., Burton, R. O. and Kastens, T. L. (2000). Management implications of farm
tractor depreciation methods. Journal of American Society of Farm Managers and
Rural Appraisers 1: 3 - 10.
65
Eastwood, D. B., Brooker, J. R. and Orr, R. H. (1987). Consumer preferences for local
versus out-of-state grown selected fresh produce: The case of Knoxville, Tennessee.
Southern Journal of Agricultural Economics 19(1): 183 - 194.
Edwards, W. (2005). Estimating Farm Machinery Costs. [http://www.extension.iastate.
edu/Publications/PM710.pdf] site visited on 12/07/2009.
FAO (2007). Respective Study of Agriculture Development Food and Nutrition.
[http://www.fao.org/docrep/010/ah864e06.htm] site visited on 11/06/2009.
.
FAO (1995). Respective Study of Agriculture Development Food and Nutrition. In:
Marketing Development Bureau, Vol. 2. Ministry of Agriculture and Livestock
Development , Dar es salaam. 3pp.
Feleke, S. T., Kilmer, R. L. and Gladwin, C. H. (2005). Determinants of food security in
southern Ethiopia at household level. Agricultural Economics 33: 351 - 363.
Fleming, M. R., Claypool, D. A., Miller, S. D. and Held, L. J. (2006). Precision application
of herbicide for control of skeleton leaf bursage in Winter Wheat. Journal of
American Society of Farm Managers and Rural Appraisers 131 - 135.
Gass, S. I. (1987). A process for determining priorities and weights for large scale linear
goal programmes. Journal of the Operational Research Society 37: 779 - 785.
66
Goliath Business News (2004). Streambank stabilization: an economic analysis from the
landowner's perspective. [http://goliath.ecnext.com/coms2/browse_R_J035] site
visited on 25/07/2009.
Hahn, K. (1998). An overview of African traditional cassava processing and utilization.
Outlook on agriculture 18 (3): 22 - 34.
Hannan, E. L. (1980). Non- dominance in goal programming: Canadian Journal of
Operation Research and Information Processing 18: 300 - 309.
Hanson, T., Anderson, J. D., Ibendahl, G., Steeby, J. and Avery, J. (2007). Partial Budgeting
as a Decision-Making Tool for Catfish Producers. [http://msucares
.com/index.html] site visited on 26/07/2009.
Hennessy, T. C. and Rehman, T. (2008). Assessing the impact of the decoupling reform of
the common agricultural policy on Irish farmers’ off-farm labour market
participation decisions. Journal of Agricultural Economics 59(1): 41 - 56.
Hotz, C. and Gibson R. S. (2007). Traditional food-processing and preparation practices to
enhance the bioavailability of micronutrients in plant-based diets. Journal of food
Nutrition 137: 1097 - 1100.
Howlett, D. and Nagu, J. (Eds.) (2001). Agricultural Project Planning in Tanzania.
Development and Project Planning Centre University of Bradford, united Kingdom
and Institute of Development Management Mzumbe, Tanzania. 149pp.
67

Ignizio, J. P. (1976). Goal programming and extensions, Lexington Books, Lexington, MA.
[http://en.wikipedia.org/wiki/Goal_programming#cite_note-IG-3] site visited on
17/03/2009.
Ignizio, J. P. and Cavalier, T. M. (1994). Linear programming, Prentice Hall. [http://en
.wikipedia.org/wiki/Goal_programming#cite_note-DFJ-7] site visited on
17/03/2009.
IITA (1996). Improving Postharvest Systems: Archival Report, Crop Improvement
Division. International Institute of Tropical Agriculture. Ibadan, Nigeria.
[http://www.fao.org/inpho/content/ch 12-o4 html] site visited on 19/03/2009.
Itharattana, K. (2003). Forecast of area, yield and production of Thai cassava roots.
Proceedings of the Expert Consultation on Root Crop Statistics. [http://www.fao.
org/DOCREP/005/Y9422E/Y9422E00.HTM] site visited on 12/05/009.
Jefferies, N. W., Quenemoen, M. E. and Bucher, R. F. (1970). Extension range
management specialists and farm management specialists. Journal of Range
Management 23(1): 72 - 74.
Jones, W. O. (2003). Manioc in Africa. Stanford University Press, Stanford. 315pp.
Jones, D. F. and Tamiz, M. (2002). Goal programming in the period 1990-2000, in
Multiple Criteria Optimization: State of the art annotated bibliographic surveys, M.
Ehrgott and X.Gandibleux (Eds.) 129 - 170pp.
68
Jumah, A., Johnson, P. T., Quayson, E. T., Tortoe, C. and Yeboah, C. O. (2008). Market
testing of a major cassava flour product in the Accra metropolitan area
international. Journal of Consumer Studies 32: 687 - 691.
Kitani, J. Z. (1999). The role of gender based indigenous knowledge in developing coping
strategies against deforestation in Mwanza district. Dissertation for Award of MSc
Degree at Sokoine University of Agriculture, Morogoro, Tanzania. 81pp.
Laswai, H. S., Silayo, V. C. K., Mpagalile, J. J., Ballegu, W. R. and John, J. (2005).
Improvement and popularization of diversified cassava products for income
generation and food Security: A case study of Kibabu. African Journal of Food,
Agriculture and Nutrition Development (AJFAND) 6(1): 1 - 15.
Lazarus, W. (2008). Machinery Cost Estimates. University of Minnesota- Extension.
[http://www.extension.umn.edu/distribution/businessmanagement] site visited on
28/09/2008.
Lin, G. C. I. and Nagalingam, S. V. (2000). CIM justification and optimisation. London:
Taylor & Francis. 36pp.
Mbogoro, D. K. (2005). Vision 2025: Engineering contribution in poverty reduction.
Proceedings of the 3rd Annual Engineers’ Day, Karimjee Hall, Dar es Salaam,
18th -19th March 2005. 6pp.
69
Mlingi, N. V. and Ndunguru, G. T. (2003). A review of post-harvest activities on cassava in
Tanzania. Paper presented in the 13th Symposium of International Society for
Tropical Root Crops (ISTRC), 10th -14th November 2003, AICC Arusha, Tanzania.
506 - 513pp.
MOA (2003). Agricultural Statistics. United Republic of Tanzania. [http://www.
agriculture.go.tz] site visited on 5/08/2009.
MOFP (2009). Budget Speech for the Year 2009/2010. Presented at National Assembly by
the Minister for Finance and Planning, June 2009, Dodoma, Tanzania. 83pp.
Mohammadi, K., Eslami, H. R. and Kahawita, R. (2006). Parameter estimation of an
ARMA model for river flow forecasting using goal programming. Journal of
Hydrology 331(1-2): 293 - 299.
Molenhuis, J. (2008). Guide to Cost of Production Budgeting. [http://www.Energrow.
ca/Doc/Guide%20to%20Cost%20of%20Production.pdf] site visited on 10/05/2009.
Montagnac, J. A., Davis, C. R. and Tanumihardjo, S. A. (2009). Processing techniques to
reduce toxicity and anti-nutrients of cassava for use as a staple food.
Comprehensive Review in Food Science and Food Safety 8: 17 - 27.
Nambisan, B. and Sundaresan, S. (2006). Effect of processing on the cyanoglucoside
content of cassava. Journal of the Science of Food and Agriculture 36
(11): 1197 - 1203.
70

NBS (1997). Coast region social economic profile. The planning commission, Dar es
Salaam and Regional commissioner office, Coast, Kibaha. 17pp.
NBS (2007). Agricultural Statistics-Crop production. United Republic of Tanzania.
[http://www.nbs.go.tz] site visited on 5/08/2009.
Nang’ayo, F., Omanga, G., Bokanga, M., Odera, M., Muchiri, N., Ali, Z. and Werehire, P.
(2007). A strategy for Industrialization of Cassava in Africa: Proceedings of a small
group meeting, Ibadan, Nigeria, 14th -18th November 2005. 25pp.
Nhassico, D., Muquingue, H., Cliff, J., Cumbana, A. and Bradbury, J. H. (2008). Review
rising African cassava production, diseases due to high cyanide intake and control
measures. Journal of the Science of Food and Agriculture 88: 2043 - 2049.
NICE (2008). Guide to the methods of technology appraisal. [http://www.nice.org.uk/
niceMedia/pdf/TAP_ Methods.pdf] site visited on 10/08/2009.
Nwapa, F. (1986). Cassava Song. Tana Press. Enugu, Nigeria. 96pp.
Nweke, F. (2003). New Challenges in the Cassava Transformation in Nigeria and Ghana; at
Pretoria 2003. In: InWEnt, IFPRI, NEPAD, CTA Conference, Successes in African
Agriculture. 107pp.
Onumah, G. (2006). Promoting Small and Micro Enterprise (SME) Development in the
Cassava Sub-sector. Natural Resources Institute, University of Greenwich at
Medway, England. 43pp.
71

Poonte, S. (2001). Policy reform, market features and inputs use in Africa smallholders
agriculture. European Journal of Development Research 113: 1 - 29.
Pournamdarian, A. (2008). Multi-Criteria Decision Making by Using Inner Product of
Vectors. [http://knol.google.com/k/ali-pournamdarian/multi-criteria-decision-
making-by-using/uhvrtfzaegen/4#] site visited on 04/03/2010.
Prakash, A. (2008). Competitive Commercial Agriculture in Sub-Saharan Africa (CCAA)
Study. [http://siteresources.worldbank.org/INTAFRICA/Resources/257994-121545
Z1788567/cassavaprofile.pdf] site visited on 08/03/2010.
Ritter, R. (2002). The Oxford Style Manual. Oxford University Press [http://en.wikipedia.
org/wiki/Insurance] site visited on 30/03/2009.
Romero, C. (1991). Handbook of critical issues in goal programming. Pergamon Press,
Oxford [http://en.wikipedia.org/wiki/Goal_programming#cite_note-10] site visited
on 17/03/2009.
Roth, S. and Hyde, J. (2002). Partial Budgeting for Agricultural Businesses. The
Pennsylvania State University, U.S.A. 7pp.
Saltelli, A., Ratto, M., Andres, T., Campolongo, F., Cariboni, J., Gatelli, D., Saisana, M.
and Tarantola, S. (2008). Sensitivity Analysis. [http://sensitivityanalysis.jrc.ec.
europa.eu/] site visited on 22/07/2009.
72

Sharma, D. K., Alade, J. A. and Acquah, E. T. (2006). An economic impact if Maryland’s
Coastal Bays: A goal programming approach. International Business and
Economics Research Journal 5: 41 - 50.
Sharma, D. K., Alade, J. A. and May, E. (2003). A multi-criteria decision making approach
to socioeconomic impact of fish resource utilization in Maryland coastal bays
region. Review of Business Research 1(1): 238 - 246.
Sherrick, B. J., Ellinger, P. N. and Lins, D. A. (2000). Time value of money and investment
analysis. Farm Analysis Solution Tools (FAST) 1: 17 - 34.
Silayo, V. C. K., Mpagalile, J. J., Ballegu, W. R. W., Mtunda, K., Chilosa, D., Nyborg, I.
and Makungu, P. J. (2004). Processing and utilization of cassava. Swahili
monograph. TARPII-SUA project. 33pp.
Swinkels, J. M., Rooijendijk, J. G. A., Zadoks, R. N. and Hogeveen, H. (2005). Use of
partial budgeting to determine the economic benefits of antibiotic treatment of
chronic subclinical mastitis caused by Streptococcus uberis or Streptococcus
dysgalactiae. Journal of Dairy Research 72: 75 - 85.
TAC (2004). Promoting Use of Appropriate Technologies and Entrepreneurial Skills in
Cassava Production, Processing and Marketing in Tanzania Annual Report.
TADENA, Dar es salaam, Tanzania. 16pp.
73

TADENA (2004). Promoting the use of Appropriate Technologies and Entrepreneurial
Skills in Cassava Production and Processing in Tanzania. Twende Associates
Reports. 8pp.
Tamiz, M., Mirrazavi, S. K. and Jones, D. F. (1999). Extensions of Pareto efficiency
analysis to integer goal programming. Omega 27: 179 - 188.
Tigner, R. (2006). Partial Budgeting: A Tool to Analyze Farm Business Changes, Iowa
State University, University Extension. 3pp.
Tomlins, K., Sanni, L., Oyewole, O., Dipeolu, A., Ayinde, I., Adebayo, K. and Westby, A.
(2007). Consumer acceptability and sensory evaluation of a fermented cassava
product (Nigerian fufu). Journal of the Science of Food and Agriculture 87:
1949 - 1956.
Tonukari, N. J. 2004. Cassava and the future of starch. Electronic Journal
of Biotechnology 7(1): 5 - 8.
URT (2004). Assessment of Agricultural Marketing Information Needs. Final report for
Ministry of Cooperatives and Marketing. Dar es Salaam, Tanzania. 58pp.
Victor, A. (2007). The dynamics of horticultural export value chain on the livelihood of
small farm households in southern Ghana. African Journal of Agricultural
Research 2(9): 435 - 440.
74

White, B. J. (1996). Developing products and their rhetoric from a single hierarchical
model, 1996. In: Proceedings of the Annual Conference of the Society for Technical
Communication 43: 223 - 224. [http://en.wikipedia.org/wiki/Goal_ programming]
site visited on 17/03/2009.
Widowati, S. and Hartojo, K. (2000). Production and Use of Cassava Flour: A New
Product of Future Potential in Indonesia. Proceedings of the 6th Regional Cassava
Workshop Ho Chi Minh City, Vietnam, 21st - 25th February, 2000. 9pp.
Wooldridge, M. J. (2008). Introductory Econometrics: A Modern Approach. Mass: MIT
Press. 865pp.
Wooldridge, M. J. (2002). Econometric Analysis of Cross Sectional Data and Panel Data.
Cambridge, Mass: MIT Press. 776pp.
Wu, J. and Perry, G. M. (2004). Estimating farm equipment depreciation: Which functional
form is best? American Journal of Agricultural Economics 86(2): 483 - 491.
75

APPENDICES
Appendix 1: Farmer’s Questionnaire for Cassava
Questionnaire No……………………. Date of interview………………….. Interviewer’s
name………………… Farmer’s name……………………….
Division……………… Ward………………..Village………………………
Section 1 Farmer’s characteristics
Age of respondent………………………………………
Gender of the respondent……………………………….
Level of education of the respondents
1=No formal education [ ] 2=Primary education [ ] 3=Secondary education[ ]
4=Post secondary education [ ]
Household composition
Age group(years) Male FemaleBelow 1717 – 50Above 50
Main source of income
1=Sales of the crops [ ] 2=sales of the livestock [ ] 3=Off- farm income [ ]
1.6 What about the income of the household? 1= Low [ ] 2= High [ ]
Section 2. Cassava production, processing and consumption
2.1 Cropping pattern 1=Monocropping [ ] 2= Mixed cropping [ ]
2.2 What is the total land area (farm size) for crop production.........................ha
2.3 What is the total land for cassava production...............................................ha
2.5 Please indicate type, amount and price of agrochemicals do you use in cassava
production
Agrochemicals Type Amount(kg/lit) Price in TshFertilizer/ManureInsecticidesPesticides and control
2.6 If you don’t use one or all of the above agrochemicals, please indicate the reasons
1=Expensive [ ] 2=Not available [ ] 3=Others (specify) [ ]
2.7 Which cassava variety do you produce?
1= Sweet variety [ ] 2= Bitter variety [ ] 3= Both [ ]
76

2.8 Do you process your cassava roots? 1=Yes [ ] 2=No [ ]
2.8.1 If No in question 2.8 above, give reasons and possible solution
Reasons Possible solutions
2.9 Which processing technology do you prefer?
1= Mechanical processing technology [ ] 2= Traditional processing technology [ ]
3= Wet and solid-state fermentation processing [ ]
2.10 Which processing technology do you use?
1= Mechanical processing technology [ ] 2= Tradition processing technology [ ]
3= Wet and solid-state fermentation processing [ ]
2.11 If any of the above indicate as shown below
Technology
(Indicate no.
given above)
Time used to
process(days/hrs)
Labour in processing
(Manday)
Cost for
processing (Tsh)
2.12 Which processing technology do have high quality product?
1= Mechanical processing technology [ ] 2= Tradition processing technology [ ]
3= Wet and solid-state fermentation processing [ ]
2.13 Production and consumption of cassava
Variety Production(bags) Self- consumption(bags) Sales(Tsh/bag)Sweet cassava Bitter cassavaTotal
2.14 What are the major problems facing you in cassava production?
i) ………………………………………
ii) ………………………………………
2.15 What should be done to improve cassava production?
i)………………………………………ii) ………………………
Thank you for your cooperation
Appendix 2: Observations for cassava processing machines
Station name …………………………. Division……………………………
77

Ward…………………………………..Village………………………………
Section 1: Station characteristics
2.1 Type of processing
1= Chipping [ ] 2= Grating [ ] 3=Both [ ]
2.2 Years in business……..years
2.3 How do you receive cassava for processing?
1=Delivered to you [ ] 2= you go by yourself [ ]
2.4 Apart from cassava are there other agricultural products, which you normally process?
1=Yes [ ] 2=No [ ]
2.4.1 If yes, mention them ……………………………………………………………..
2.5 At what price do you process cassava produce from farmers?
Cassava root ……..Tsh/Kg. Processed cassava ………Tsh/kg
2.5.1 Give the total revenue for processing cassava in 2007/2008 …………..Tsh.
2.6 What are the costs of the machine and operation incurred per year?
Type of cost Tsh/day/month Amount(Tshs)/yearServices/Maintenances Operators allowancesInsuranceInterestTaxesDepreciation Total2.7 What quantity of cassava do you process?
1)……….Kg/day 2)……….Kg/season 3)……….Kg/year
2.8 Is the above quantity maximum for you to process for one season?
1=Yes [ ] 2=No [ ]
2.9 If no what quantity can you process for one season…….kg and for one
year………….kg
3.0 If it is manually operated, how many labourers are required per day the same
amount as that of engine powered?..........................labourers.
3.1 How about energy required to operate the manually operated machine?
1= Low [ ] 2= High [ ]
3.2 If it is engine powered machine, how much fuel does it require to process one kg of
cassava?................L/kg
3.1 Point out the most serious problems you face in processing your product
……………………………………………………………………………..
78

…………………………………………………………………………….
Thank you for your cooperation
79

Appendix 3: Guideline for FGD on cassava processing technologies
Village name………………………… Discussion date ……………………..
1.0 Situation on cassava processing
1.1What are the types of cassava processing technologies do you use in your village?
1.2 Which is mostly used by the farmers?
1.3 Why is it mostly used?
1.4 Which cassava processing technology is mostly preferably than the others?
2.0 Efficiency of cassava processing technologies
2.1 Which cassava processing technology is efficient in terms of?
(i) Labour?
(ii) Time?
(iii) Cyanide/ Bitterness removal?
(iv) Other costs?
3.0 Quality of the processed products
3.1 Which cassava processing technology produces the high quality products?
3.2 Why it produces the high quality products?
4.0 Suggestion for improvements
4.1 In your opinion, what are the improvements to be done in those technologies?
80

Appendix 4: Matrix for optimal plan for cassava production
Coefficients matrix Bitter Sweet Positive Negative tonne tonne deviation deviation (Q1) (Q2) (U+) (U-) Net Revenues 30000 50000
1 Consmptn tone 30000 > 1500 2000 500 500 2 Variety tone 18 > 8 7 3 3 3 AccMrk tone 20000 > 400 500 5000 5000 4 Costp shs % 150000 > 150 150 50000 50000 5 Prc shs % 500000 > 500 500 100000 100000
Evolution of the optimal plan for: Cassava production
***********************************************************************Iteration Incoming Outgoing Pivot Net RevenueNumber variable variable value
1 Sweet Variety 7.00 0.00
- - Optimum solution found after 1 Iterations - -
Press <RETURN > to continue . . ?
- - Maximum value of Net Revenue = 128571.429 - -
The Plan : N.R. range for which each activity level stays constant********** (with the incoming variable) Level Lower limit Present Upper limit N.R.Sweet tone 2.571 26250.000(Bitter) 50000.000 OPEN-----------------------------------------------------------------------------------------------------Press <RETURN > to continue . . ?
Activities not in optimal plan****************************** Present N.R. needed N.R. before entry
Bitter tone 30000.000 57142.857----------------------------------------------------------------------------------------------------
81
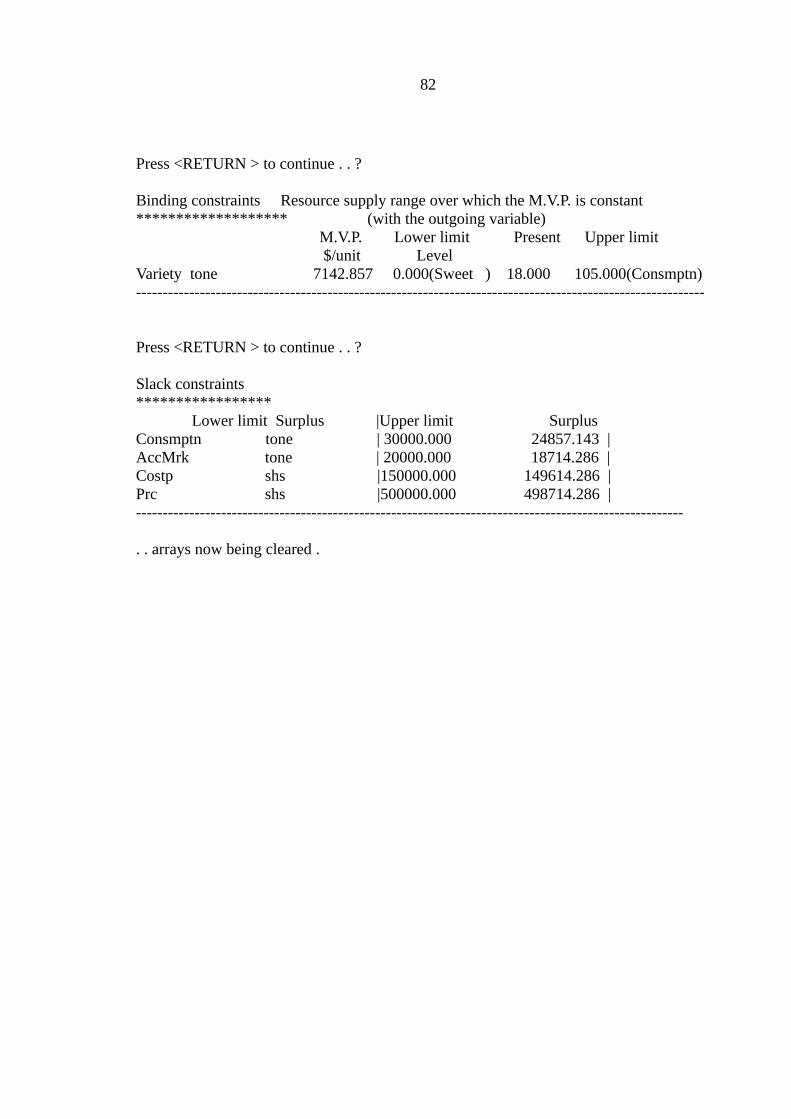
Press <RETURN > to continue . . ?
Binding constraints Resource supply range over which the M.V.P. is constant******************* (with the outgoing variable) M.V.P. Lower limit Present Upper limit $/unit LevelVariety tone 7142.857 0.000(Sweet ) 18.000 105.000(Consmptn)-----------------------------------------------------------------------------------------------------------
Press <RETURN > to continue . . ?
Slack constraints***************** Lower limit Surplus |Upper limit SurplusConsmptn tone | 30000.000 24857.143 |AccMrk tone | 20000.000 18714.286 |Costp shs |150000.000 149614.286 |Prc shs |500000.000 498714.286 |-------------------------------------------------------------------------------------------------------
. . arrays now being cleared .
82

Appendix 5: NPV analysis for manual chipping machine
Years 0 1 2 3 4 5 6 7Initial cost 300000 Running cost 72000 72000 72000 72000 72000 72000 72000Annual depreciation 67500 57857 48214 38571 28928 19285 9642Repair and maintenance 30000 30000 30000 30000 30000 30000 30000Tax and Insurance 0 0 0 0 0 0 0Total costs 169500 159857 150214 140571 130928 121285 111642REVENUE 300000 375000 412500 453750 499125 549037.5 603941NET BENEFIT 130500 215142 262285 313178 368196 427751 492298Salvage value 232500 174642 126428 87857 58928 39642. 30000Discount factor 0.8333 0.6944 0.5787 0.4822 0.4018 0.3348 0.2790Disc. Cash outflow 302500 270684 224950 193400 171651 156529 145763 NPV 1465481
83
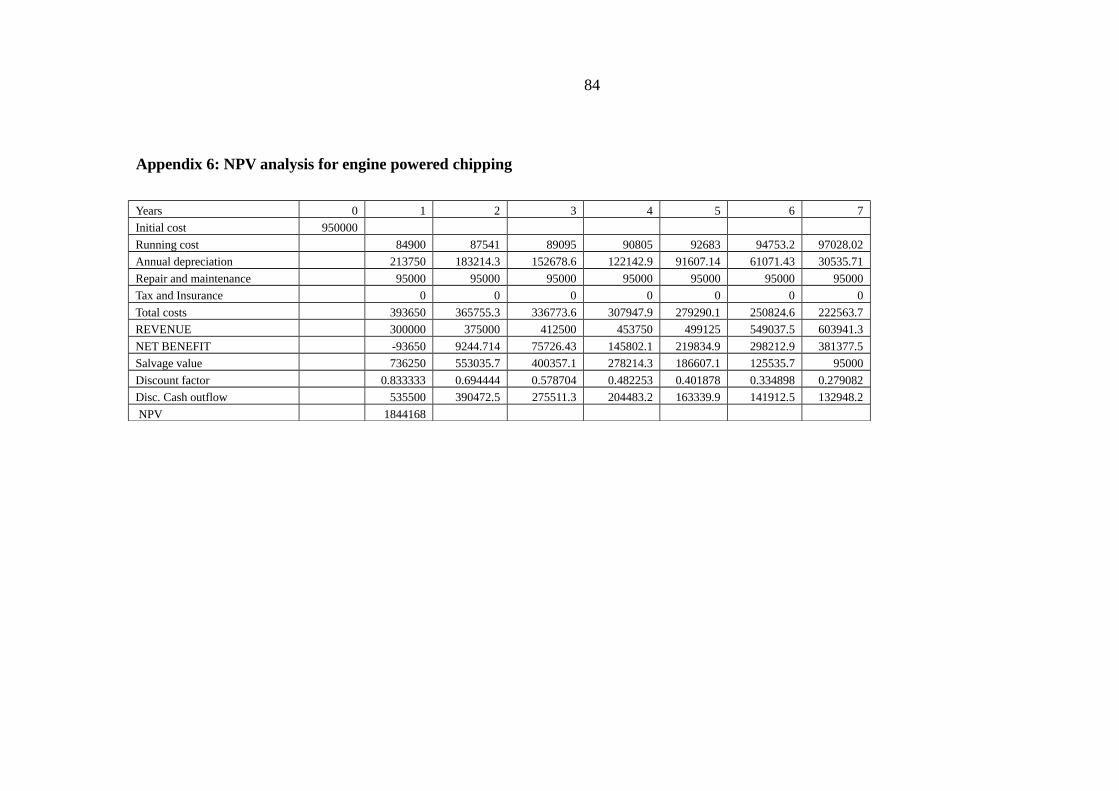
Appendix 6: NPV analysis for engine powered chipping
Years 0 1 2 3 4 5 6 7
Initial cost 950000
Running cost 84900 87541 89095 90805 92683 94753.2 97028.02
Annual depreciation 213750 183214.3 152678.6 122142.9 91607.14 61071.43 30535.71
Repair and maintenance 95000 95000 95000 95000 95000 95000 95000
Tax and Insurance 0 0 0 0 0 0 0
Total costs 393650 365755.3 336773.6 307947.9 279290.1 250824.6 222563.7
REVENUE 300000 375000 412500 453750 499125 549037.5 603941.3
NET BENEFIT -93650 9244.714 75726.43 145802.1 219834.9 298212.9 381377.5
Salvage value 736250 553035.7 400357.1 278214.3 186607.1 125535.7 95000
Discount factor 0.833333 0.694444 0.578704 0.482253 0.401878 0.334898 0.279082
Disc. Cash outflow 535500 390472.5 275511.3 204483.2 163339.9 141912.5 132948.2
NPV 1844168
84

Appendix 7: NPV analysis for cassava grater machine
Years 0 1 2 3 4 5 6 7Initial cost 1210000 Running cost 84900 87541 89095 90805 92683 94753.2 97028.02Annual depreciation 272250 233357.1 194464.3 155571.4 116678.6 77785.71 38892.86Repair and maintenance 121000 95000 95000 95000 95000 95000 95000Tax and Insurance 0 0 0 0 0 0 0Total costs 478150 415898.1 378559.3 341376.4 304361.6 267538.9 230920.9REVENUE 300000 375000 412500 453750 499125 549037.5 603941.3NET BENEFIT -178150 -40898.1 33940.71 112373.6 194763.4 281498.6 373020.4Salvage value 937750 704392.9 509928.6 354357.1 237678.6 159892.9 121000Discount factor 0.833333 0.694444 0.578704 0.482253 0.401878 0.334898 0.279082Disc. Cash outflow 633000 460760.2 314739.2 225082.3 173788.7 147821.1 137872 NPV 2093064
85
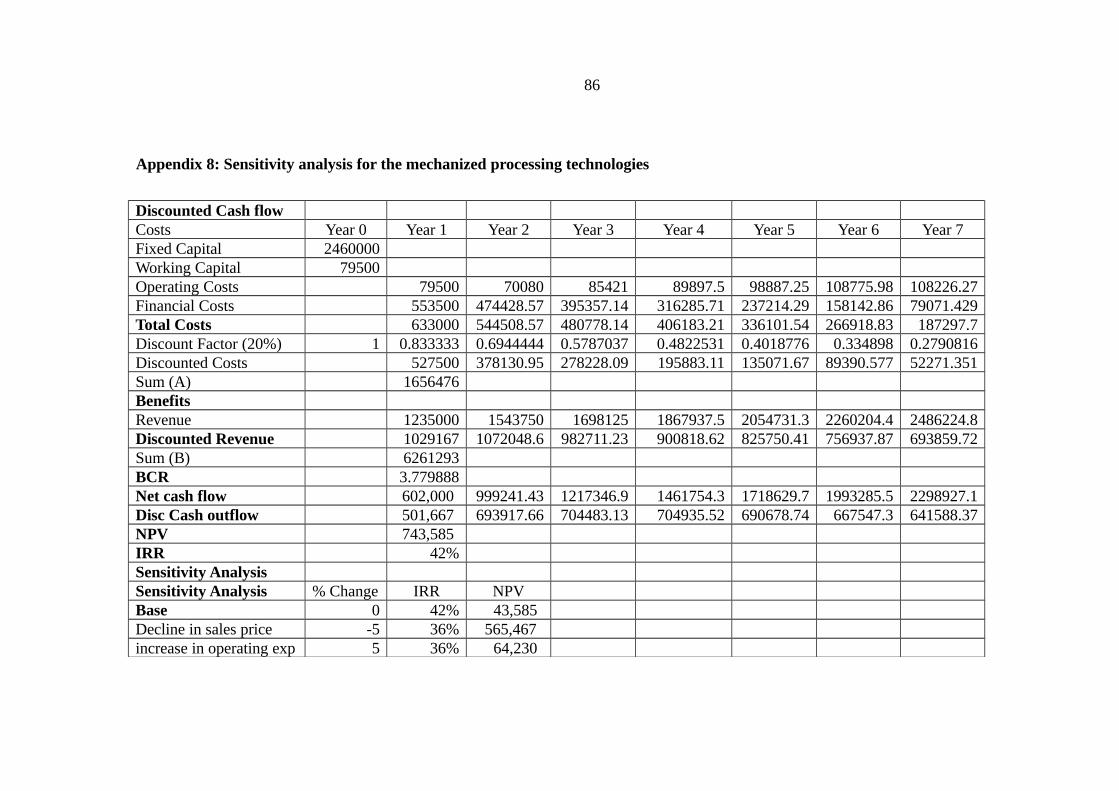
Appendix 8: Sensitivity analysis for the mechanized processing technologies
Discounted Cash flow Costs Year 0 Year 1 Year 2 Year 3 Year 4 Year 5 Year 6 Year 7Fixed Capital 2460000 Working Capital 79500 Operating Costs 79500 70080 85421 89897.5 98887.25 108775.98 108226.27Financial Costs 553500 474428.57 395357.14 316285.71 237214.29 158142.86 79071.429Total Costs 633000 544508.57 480778.14 406183.21 336101.54 266918.83 187297.7Discount Factor (20%) 1 0.833333 0.6944444 0.5787037 0.4822531 0.4018776 0.334898 0.2790816Discounted Costs 527500 378130.95 278228.09 195883.11 135071.67 89390.577 52271.351Sum (A) 1656476 Benefits Revenue 1235000 1543750 1698125 1867937.5 2054731.3 2260204.4 2486224.8Discounted Revenue 1029167 1072048.6 982711.23 900818.62 825750.41 756937.87 693859.72Sum (B) 6261293 BCR 3.779888 Net cash flow 602,000 999241.43 1217346.9 1461754.3 1718629.7 1993285.5 2298927.1Disc Cash outflow 501,667 693917.66 704483.13 704935.52 690678.74 667547.3 641588.37NPV 743,585 IRR 42% Sensitivity Analysis Sensitivity Analysis % Change IRR NPV Base 0 42% 43,585 Decline in sales price -5 36% 565,467 increase in operating exp 5 36% 64,230
86