evaluation of different stool extraction methods for
TRANSCRIPT
1Erben V, et al. bmjnph 2021;0. doi:10.1136/bmjnph-2020-000202
Open access
Evaluation of different stool extraction methods for metabolomics measurements in human faecal samples
Vanessa Erben ,1,2 Gernot Poschet,3 Petra Schrotz- King ,1 Hermann Brenner1,4,5
To cite: Erben V, Poschet G, Schrotz- King P, et al. Evaluation of different stool extraction methods for metabolomics measurements in human faecal samples. BMJ Nutrition, Prevention & Health 2021;0. doi:10.1136/bmjnph-2020-000202
► Additional supplemental material is published online only. To view, please visit the journal online (http:// dx. doi. org/ 10. 1136/ bmjnph- 2020- 000202).
1Division of Preventive Oncology, National Center of Tumor Diseases, Heidelberg, Germany2Medical Faculty Heidelberg, University Heidelberg, Heidelberg, Germany3Centre for Organismal Studies (COS), Heidelberg University, Heidelberg, Germany4Division of Clinical Epidemiology and Aging Research, German Cancer Research Centre, Heidelberg, Germany5German Cancer Consortium (DKTK), Heidelberg, Germany
Correspondence toPetra Schrotz- King, Division of Preventive Oncology, National Center of Tumor Diseases, Heidelberg 69120, Germany; petra. schrotz- king@ nct- heidelberg. de
Received 16 November 2020Accepted 14 June 2021
Original research
© Author(s) (or their employer(s)) 2021. Re- use permitted under CC BY- NC. No commercial re- use. See rights and permissions. Published by BMJ.
ABSTRACTBackground Metabolomics analysis of human stool samples is of great interest for a broad range of applications in biomedical research including early detection of colorectal neoplasms. However, due to the complexity of metabolites there is no consensus on how to process samples for stool metabolomics measurements to obtain a broad coverage of hydrophilic and hydrophobic substances.Methods We used frozen stool samples (50 mg) from healthy study participants. Stool samples were processed after thawing using eight different processing protocols and different solvents (solvents such as phosphate- buffered saline, isopropanol, methanol, ethanol, acetonitrile and solvent mixtures with or without following evaporation and concentration steps). Metabolites were measured afterwards using the MxP Quant 500 kit (Biocrates). The best performing protocol was subsequently applied to compare stool samples of participants with different dietary habits.Results In this study, we were able to determine up to 340 metabolites of various chemical classes extracted from stool samples of healthy study participants with eight different protocols. Polar metabolites such as amino acids could be measured with each method while other metabolite classes, particular lipid species (better with isopropanol and ethanol or methanol following a drying step), are more dependent on the solvent or combination of solvents used. Only a small number of triglycerides or acylcarnitines were detected in human faeces. Extraction efficiency was higher for protocols using isopropanol (131 metabolites>limit of detection (LOD)) or those using ethanol or methanol and methyl tert- butyl ether (MTBE) including an evaporation and concentration step (303 and 342 metabolites>LOD, respectively) than for other protocols. We detected significant faecal metabolite differences between vegetarians, semivegetarians and non- vegetarians.Conclusion For the evaluation of metabolites in faecal samples, we found protocols using solvents like isopropanol and those using ethanol or methanol, and MTBE including an evaporation and concentration step to be superior regarding the number of detected metabolites of different chemical classes over others tested in this study.
INTRODUCTIONMetabolomics analysis of human stool samples is of great interest for a broad range of appli-cations in biomedical research including
early detection of colorectal cancer (CRC) as a non- invasive alternative to colonoscopy. Metabolomics might be promising for this purpose as metabolites are closely related to the phenotype and depict current meta-bolic processes happening in an organism. Stool is directly associated with the gut and may reflect changes in metabolism very early through its transit in the gut.1
Faecal mass consists to a great proportion of water and bacteria but also food compo-nents or metabolites.2 Faecal samples show great variability in their material content and characteristics, which makes it difficult to standardise the process from collection to processing and analysis including the analytical platform.3 The latter also defines the sensitivity of the analysis and the type of analytes available for analyses. Apart from the aforementioned differences of stool samples, faecal metabolomics might be affected by different confounding factors such as diet, the host and microbial metab-olism. Metabolic changes in stool might be derived directly from the development of cancer or precancerous cells (host metabo-lism) or from a change in the gut microbiota (microbial metabolism) which both result in
What this paper adds
► A broad range of metabolites can be extracted in hu-man stool samples with 8 different methodologies.
► Polar metabolites were measured equally well with all protocols applied.
► Other metabolites are highly dependent on the ex-traction method.
► Extraction methods using (1) isopropanol or (2) etha-nol or methanol and methyl tert- butyl ether including an evaporation and concentration step seem to be preferable (yielding the highest number and a broad range of metabolites).
► These methods should be considered in order to get comparable results across different studies.
on May 26, 2022 by guest. P
rotected by copyright.http://nutrition.bm
j.com/
BM
JNP
H: first published as 10.1136/bm
jnph-2020-000202 on 2 July 2021. Dow
nloaded from
2 Erben V, et al. bmjnph 2021;0. doi:10.1136/bmjnph-2020-000202
BMJ Nutrition, Prevention & Health
a distinct metabolic phenotype that might be character-istic for the disease.1 The microbiota itself was found to be differently present in patients with colorectal neoplasms or CRC compared with healthy individuals.4 5 Moreover, it was shown that diet has a clear effect on the microbial composition and metabolism.6 The metabolic profile of CRC or its precursors may help in the understanding of disease development, progression and early detection.7
Some studies have already found faecal metabolomics biomarkers for early detection of CRC but metabolite selection strongly varied1 8–10 and as different studies were using different processing methods, no direct compar-ison is possible. There is no consensus how to process stool samples for metabolomics measurements to get reliable and reproducible results.11–14 A review by Deda et al focused on the existing various stool preparation protocols and found the metabolites to be dependent on the extraction method.11 In this study, we used the MxP Quant 500 Kit (Biocrates Life Sciences AG, Innsbruck, Austria) to determine and quantify a very broad range of metabolite classes in human faeces. In total, we used eight different stool preparation protocols to assess the best coverage for stool metabolite profiles. The protocol yielding the highest multitude of extracted metabolites was used to analyse and compare additional stool samples of healthy study participants with different dietary habits.
SUBJECTS AND METHODSStudy designThe GEKKO study (Gebt dem Krebs keine Chance—Onkocheck) is an ongoing study in southwest Germany including people participating in screening colonos-copy (Arm A) or with diagnosed primary cancer (Arm B). The study was approved by the ethics committees of the Medical Faculty Heidelberg and of the physicians’ boards of Baden- Württemberg and Rhineland Palatinate. The GEKKO study Arm A was designed to evaluate novel early detection markers of CRC. People undergoing a screening colonoscopy at a gastroenterology practice in or around Heidelberg, Germany, who are over the age of 30 years, with no history of CRC, no inflammatory bowel disease, no colonoscopy within the last 5 years and speaking and understanding the German language are invited to participate.
After written informed consent was received, partici-pants are asked to fill in a questionnaire regarding life-style and demographic data and to provide blood, stool, saliva and urine samples for research purposes prior to colonoscopy. Biosamples are processed and then stored at −80°C until needed. Colonoscopy reports are provided from the physicians to the study centre. Participants are grouped according to their most advanced finding at colonoscopy. From the individuals with no polyps or any findings at colonoscopy, those with incomplete colonos-copy (coecum not reached) or poor bowel preparation were excluded. For this analysis, three participants of the GEKKO study Arm A were selected between the age of
50 and 79 years with no polyps or any findings at colo-noscopy to test eight different stool preparation protocols and to define the best analytical outcome.
In a further step, stool samples from additional healthy GEKKO participants (n=18) of approximately the same age (50–65 years) with different dietary habits (vege-tarians, semivegetarians and non- vegetarians) were processed with the protocol that performed best with respect to numbers of detected metabolites and sample handling, and results were compared between groups. Information on dietary habits of the study participants was extracted from the questionnaire. Vegetarians were defined as never eating meat, processed meat and poultry. Semivegetarians were defined as eating meat, processed meat and poultry less than once a week. Other participants reporting to consume either meat or processed meat or poultry more often were categorised as non- vegetarians.15
Sample collection and handlingNative stool samples were collected by the participants at home from a normal bowel movement prior to bowel preparation for colonoscopy with standard stool collec-tion tubes provided with a small spoon for collecting the stool. The stool samples were then directly frozen by the participants at −20°C at home. The participants were asked to document date and time of sampling and the storage temperature. The stool samples were taken by the participant in a freeze- cool transport container and in an isolated envelope to the gastroenterologists’ prac-tices, directly frozen again at −20°C and within the week of receipt delivered by a transport service on dry ice to the GEKKO study laboratory at the National Center for Tumor Diseases in Heidelberg, where they were immedi-ately frozen at −80°C.
Processing of the samplesFor this analysis, we used native frozen stool samples from three individuals of the GEKKO study, testing eight different stool processing protocols, each in triplicate, which results in a total of 72 measurements. A frozen stool sample was collected by the participant into a stan-dard collection tube with a plastic spoon, which takes on average 1 g of stool or even more. The amount can vary though, in spite of detailed visual and written instruc-tions, depending on how much the participant loads onto and how often the participant fills the spoon. One frozen stool sample per participant was cut in a plastic petri dish on dry ice with a scalpel into 24 pieces of 50 mg frozen stool, each transferred into a separate vial and weighed on a precision scale. For this procedure one complete stool sample was used up in most cases per participant. Stool samples continued to be frozen until processing. The eight processing protocols were then tested in tripli-cates using the 24 stool samples prepared for each partic-ipant. It was not possible to thaw and homogenise the stool samples for aliquoting due to the viscous consistency of stool, which makes it difficult to handle, and the fast degradation process of its components upon- thawing.
on May 26, 2022 by guest. P
rotected by copyright.http://nutrition.bm
j.com/
BM
JNP
H: first published as 10.1136/bm
jnph-2020-000202 on 2 July 2021. Dow
nloaded from
3Erben V, et al. bmjnph 2021;0. doi:10.1136/bmjnph-2020-000202
BMJ Nutrition, Prevention & Health
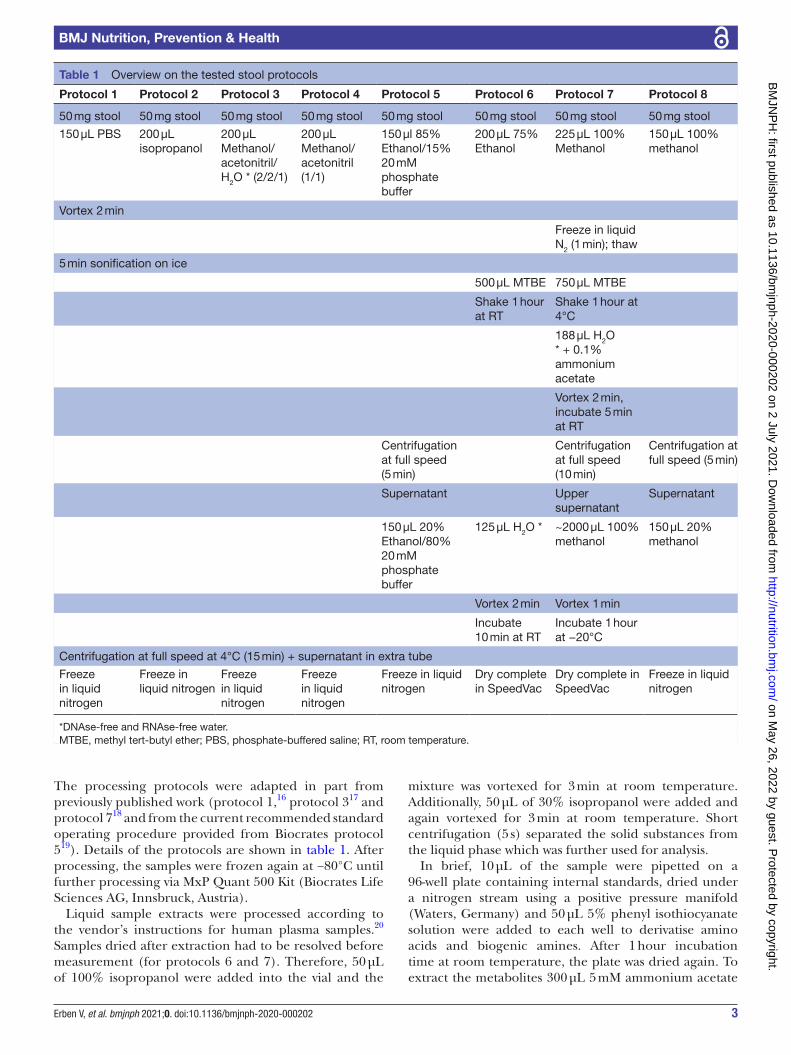
The processing protocols were adapted in part from previously published work (protocol 1,16 protocol 317 and protocol 718 and from the current recommended standard operating procedure provided from Biocrates protocol 519). Details of the protocols are shown in table 1. After processing, the samples were frozen again at −80°C until further processing via MxP Quant 500 Kit (Biocrates Life Sciences AG, Innsbruck, Austria).
Liquid sample extracts were processed according to the vendor’s instructions for human plasma samples.20 Samples dried after extraction had to be resolved before measurement (for protocols 6 and 7). Therefore, 50 µL of 100% isopropanol were added into the vial and the
mixture was vortexed for 3 min at room temperature. Additionally, 50 µL of 30% isopropanol were added and again vortexed for 3 min at room temperature. Short centrifugation (5 s) separated the solid substances from the liquid phase which was further used for analysis.
In brief, 10 µL of the sample were pipetted on a 96- well plate containing internal standards, dried under a nitrogen stream using a positive pressure manifold (Waters, Germany) and 50 µL 5% phenyl isothiocyanate solution were added to each well to derivatise amino acids and biogenic amines. After 1 hour incubation time at room temperature, the plate was dried again. To extract the metabolites 300 µL 5 mM ammonium acetate
Table 1 Overview on the tested stool protocols
Protocol 1 Protocol 2 Protocol 3 Protocol 4 Protocol 5 Protocol 6 Protocol 7 Protocol 8
50 mg stool 50 mg stool 50 mg stool 50 mg stool 50 mg stool 50 mg stool 50 mg stool 50 mg stool
150 µL PBS 200 µL isopropanol
200 µL Methanol/ acetonitril/ H2O * (2/2/1)
200 µL Methanol/ acetonitril (1/1)
150 µl 85% Ethanol/15% 20 mM phosphate buffer
200 µL 75% Ethanol
225 µL 100% Methanol
150 µL 100% methanol
Vortex 2 min
Freeze in liquid N2 (1 min); thaw
5 min sonification on ice
500 µL MTBE 750 µL MTBE
Shake 1 hour at RT
Shake 1 hour at 4°C
188 µL H2O * + 0.1% ammonium acetate
Vortex 2 min, incubate 5 min at RT
Centrifugation at full speed (5 min)
Centrifugation at full speed (10 min)
Centrifugation at full speed (5 min)
Supernatant Upper supernatant
Supernatant
150 µL 20% Ethanol/80% 20 mM phosphate buffer
125 µL H2O * ~2000 µL 100% methanol
150 µL 20% methanol
Vortex 2 min Vortex 1 min
Incubate 10 min at RT
Incubate 1 hour at −20°C
Centrifugation at full speed at 4°C (15 min) + supernatant in extra tube
Freeze in liquid nitrogen
Freeze in liquid nitrogen
Freeze in liquid nitrogen
Freeze in liquid nitrogen
Freeze in liquid nitrogen
Dry complete in SpeedVac
Dry complete in SpeedVac
Freeze in liquid nitrogen
*DNAse- free and RNAse- free water.MTBE, methyl tert- butyl ether; PBS, phosphate- buffered saline; RT, room temperature.
on May 26, 2022 by guest. P
rotected by copyright.http://nutrition.bm
j.com/
BM
JNP
H: first published as 10.1136/bm
jnph-2020-000202 on 2 July 2021. Dow
nloaded from
4 Erben V, et al. bmjnph 2021;0. doi:10.1136/bmjnph-2020-000202
BMJ Nutrition, Prevention & Health
in methanol were pipetted to each filter and incubated for 30 min. The extract was eluted into a new 96- well plate using positive pressure, diluted according to the vendor’s guidelines and measured via liquid chromatography mass spectrometry/mass spectrometry (LC-MS/MS) or flow injection analysis (FIA- MS/MS) analyses.
For metabolite measurements, a QTRAP6500+ (Sciex, Germany) MS/MS system with electrospray ionisa-tion source connected to an UPLC I- class Plus (Waters, Germany) chromatography system was used.21 22
The LC column, the conditions for LC separation and FIA analyses as well as individual multiple reaction monitoring (MRM) parameters for each metabolite and respective internal standards were provided by the vendor of the kit (Biocrates). Quality controls, standards, blanks and zero samples were run throughout the analytical measurement of the samples. For quantification either a seven point calibration curve or one point calibration was
used depending on the metabolite class according to the manual. Data were generated using the Analyst (Sciex) software suite and transferred to the software MetIDQ (version Oxygen; Biocrates Life Sciences AG, Innsbruck, Austria) for further processing of the data.
In total, 630 metabolites can be measured via this kit. The limit of detection (LOD) for each compound is defined as three times the background noise. The lower limit of quanti-tation (LLOQ) is at least 10 times the background noise. At LLOQ measured metabolite concentrations can be consid-ered as reliable. Data are normalised with a tissue factor for quantification under the following assumption: 1 mg frozen tissue equals 1 µL tissue or stool.23 Tissue and faeces are comparable as wet tissue has a water content of approx-imately 75% which is in the range of wet stool.24 A specific dilution factor (given by the tissue/stool to solvent ratio) was applied to the calculated concentration values (µM) to achieve comparable absolute concentrations and correct
Table 2 Number of metabolites that were measured with each protocol according to chemical class
Protocol Total 1 2 3 4 5 6 7 8
Analyte class
Total 630 131 251 100 149 132 303 342 137
Alkaloids 1 1 1 1 1 1 1 1 1
Amine oxides 1 0 0 0 0 0 0 0 0
Amino acids 20 20 19 19 19 19 20 20 19
Amino acid related 30 25 22 23 23 22 26 25 23
Bile acids 14 11 14 14 14 14 14 14 14
Biogenic amines 9 8 6 6 6 6 7 7 6
Carbohydrates and related 1 1 0 0 0 0 1 0 0
Carboxylic acids 7 4 2 3 2 2 3 4 2
Cresols 1 1 1 1 1 1 1 1 1
Fatty acids 12 3 9 7 9 7 10 10 7
Hormones and related 4 1 2 2 2 1 2 2 2
Indoles and derivatives 4 4 3 4 4 2 4 3 4
Nucleobases and related 2 2 2 2 2 2 2 2 2
Vitamins and cofactors 1 1 1 1 1 1 1 1 1
Acylcarnitines 40 6 2 2 2 2 4 6 2
Glycerophospholipide (lysophasphatidylcholines and phosphatidylcholines)
90 5 25 7 18 10 27 38 10
Sphingomyelins 15 3 5 1 3 3 6 7 3
Cholesteryl esters 22 3 3 0 0 0 4 6 0
Ceramides 28 0 22 0 15 10 24 26 6
Dihydroceramides 8 0 2 0 0 0 1 2 0
Glycosylceramides (monohexosylceramides, dihexosylceramides, and Trihexosylceramides)
34 1 17 0 7 7 24 22 4
Diglycerides 44 6 14 4 11 5 17 18 4
Triglycerides 242 25 79 3 9 17 104 127 26
Metabolism indicators 232 66 72 85 78 86 99 96 84
on May 26, 2022 by guest. P
rotected by copyright.http://nutrition.bm
j.com/
BM
JNP
H: first published as 10.1136/bm
jnph-2020-000202 on 2 July 2021. Dow
nloaded from
5Erben V, et al. bmjnph 2021;0. doi:10.1136/bmjnph-2020-000202
BMJ Nutrition, Prevention & Health
for slight differences in sample weight and the individual extraction volume.25 Concentrations are given in pmol of the metabolite/mg stool mass.
All metabolites were identified and quantified using isotopically labelled internal standards (3 hours, 13C, 15N) and MRM using optimised MS conditions as provided by Biocrates. Metabolite annotation was done via retention time and compound- specific MRMs. The following metabo-lites are measurable using the MxP Quant 500 Kit: 1 alkaloid (trigonelline), 1 amine oxide (trimethylamine N- oxide), 20 amino acids, 30 other amino acid- related metabolites, 14 bile acids, 9 biogenic amines, hexoses (including glucose), 7 carboxylic acids, 1 cresol (p- cresol sulfate), 12 fatty acids, 4 hormone and related metabolites, 4 indoles and deriva-tives, 2 nucleobases and related molecules, 1 metabolite from the group of vitamins and cofactors, 40 acylcarnitines, 14 lysophosphatidylcholines, 76 phosphatidylcholines, 15 sphingomyelins, 28 ceramides, 8 dihydroceramides, 19 hexo-sylceramides, 9 dihexosylceramides, 6 trihexosylceramides, 22 cholesteryl esters, 44 diglycerides and 242 triglycerides. All the related isobaric and isomeric lipid species can be measured but cannot be distinguished by this method.
Statistical analysesWe measured 630 metabolites and calculated a range of sums and ratios of metabolites indicating metabolic pathways and syntheses using the MetIDQ software. The so- called ‘metabolism indicators’ are sums and ratios calculated from the measured metabolites and are indic-ative for a specific pathway or synthesis happening in the body. Metabolism indicators have been described previ-ously in blood samples but not in stool samples.
Metabolites with the mean below the LOD were excluded and described as not measured and metabolism
indicators with more than half of the values below the LOD were marked as below LOD in the following. We assessed the number of metabolites and their respective chemical classes for each processing method. Addition-ally, we calculated means and intersample variabilities between the three stool samples of each participant. We used the estimated values below the LOD to avoid imputa-tion in the data for the calculations.20 For each protocol, variability of concentrations measured in the three stool aliquots from same participant was quantified by the mean coefficient of variation (‘mean intraindividual CV’) among the three participants. The distribution of mean intraindividual CVs (in %) are displayed in a bar chart.
We described the study population that was used to apply the best protocol and used analysis of variance (ANOVA) to detect differences in metabolite concentra-tions between people with different dietary habits (vege-tarians, semivegetarians, non- vegetarians). We assessed the false discovery rate (FDR) to account for over- optimistic results and remove false- positives.
A p value <0.05 (two- sided testing) was considered to indicate statistical significance. Statistical analyses were conducted using SAS Enterprise Guide V.7.1 (SAS Insti-tute Inc, Cary, North C, USA).
RESULTSExtraction of metabolites using different stool processing protocolsWe measured metabolites with the MxP Quant 500 kit using eight different protocols for stool processing from three healthy participants of the GEKKO study (free of neoplasms). We were able to extract metabolites with
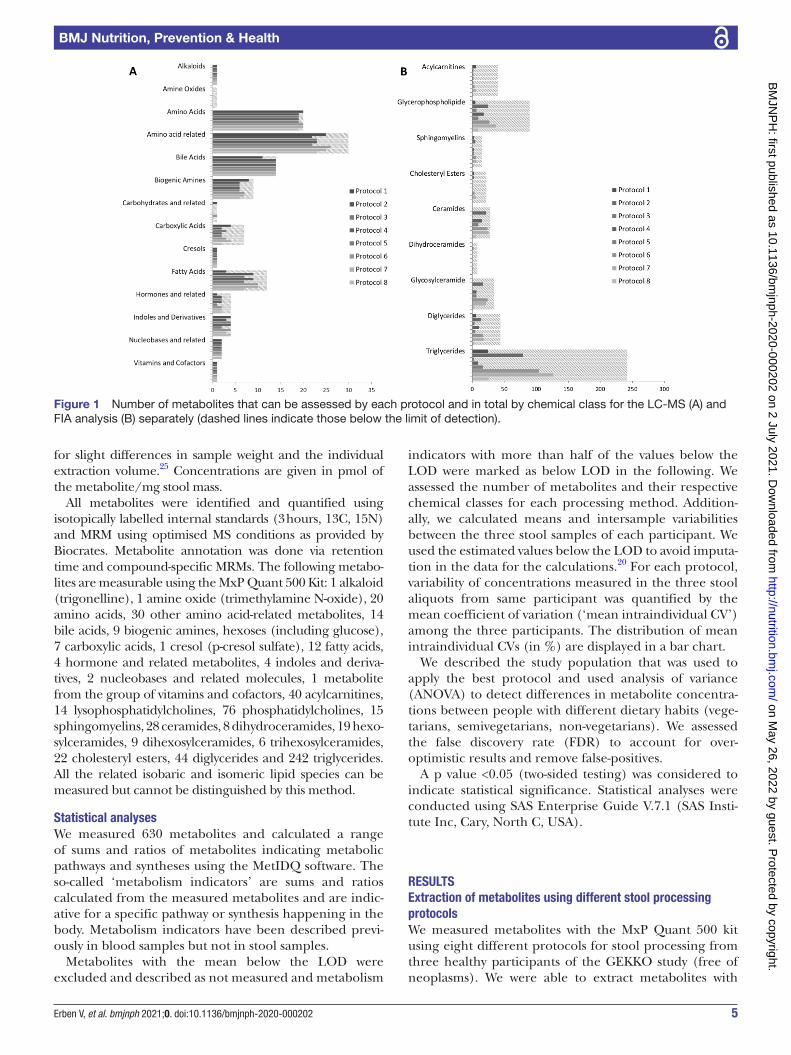
Figure 1 Number of metabolites that can be assessed by each protocol and in total by chemical class for the LC- MS (A) and FIA analysis (B) separately (dashed lines indicate those below the limit of detection).
on May 26, 2022 by guest. P
rotected by copyright.http://nutrition.bm
j.com/
BM
JNP
H: first published as 10.1136/bm
jnph-2020-000202 on 2 July 2021. Dow
nloaded from
6 Erben V, et al. bmjnph 2021;0. doi:10.1136/bmjnph-2020-000202
BMJ Nutrition, Prevention & Health
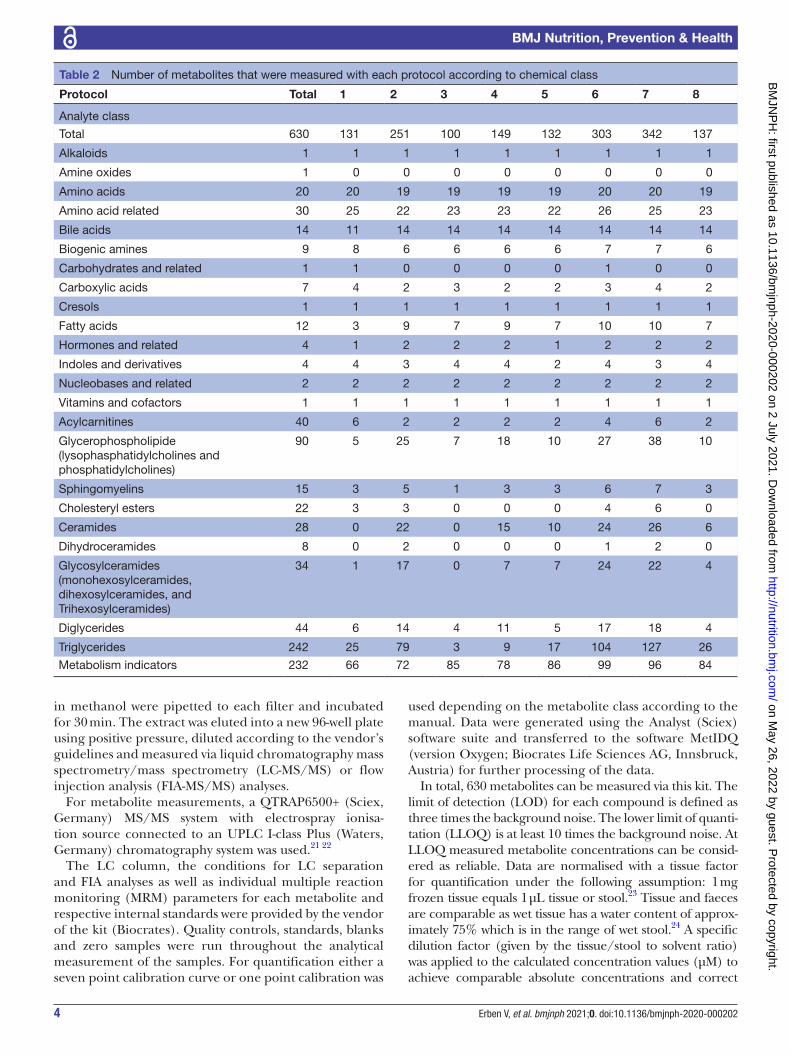
each protocol but the number of detectable metabo-lites varied (table 2, figure 1). The highest number of metabolites using (1) a simple single- step extraction protocol was detected using isopropanol (protocol 2) and even more compounds could be detected using (2) a multistep protocol when we dried the liquid extracts after extraction and reconstituted the samples in a small volume to increase metabolite concentrations (protocols 6 and 7).
The evaluated solvents differ in their polarity and therefore in their extraction efficacy to solve metabo-lites of the different chemical classes studied. With the MxP Quant 500 kit, 630 metabolites can be determined of 14 classes of small molecules and 12 lipid classes. In addition, a range of sum and ratios that describe certain pathways and syntheses in the organism is calculated via the MetIDQ software from the obtained data. Despite differences in absolute concentration polar metabolites were well detectable with each extraction method. Amino acids and amino acid- related products were detected with concentrations above LOD in the analysed stool samples by all evaluated extraction protocols. Concentrations for amine oxides or carbohydrates and related products were always below the LOD. Large differences in extraction efficiency were seen for polar- lipids such as glycerophos-pholipids and glycosylceramides which were better detect-able in samples extracted with isopropanol or method 6 or 7. Major differences were observed for non- polar lipids such as for triglycerides as none of the compounds were above the LOD using phosphate- buffered saline (PBS) for preparation whereas more than 50 could be measured using isopropanol or ethanol or methanol in combina-tion with concentrating the liquid extract.
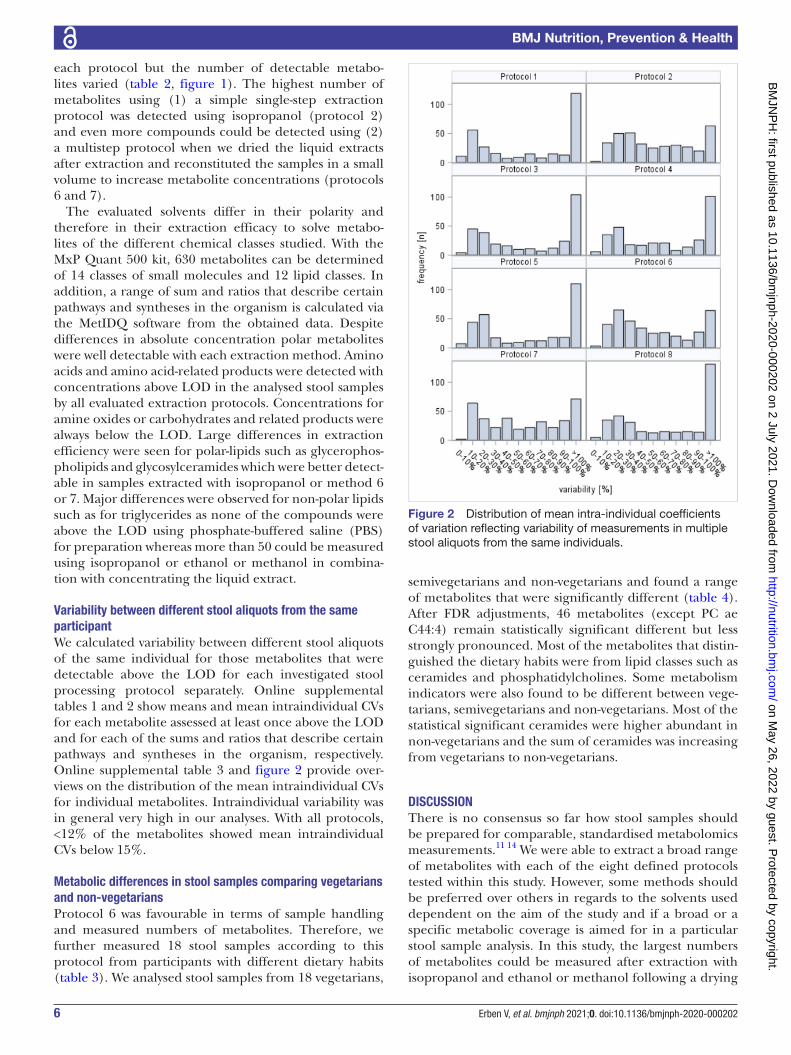
Variability between different stool aliquots from the same participantWe calculated variability between different stool aliquots of the same individual for those metabolites that were detectable above the LOD for each investigated stool processing protocol separately. Online supplemental tables 1 and 2 show means and mean intraindividual CVs for each metabolite assessed at least once above the LOD and for each of the sums and ratios that describe certain pathways and syntheses in the organism, respectively. Online supplemental table 3 and figure 2 provide over-views on the distribution of the mean intraindividual CVs for individual metabolites. Intraindividual variability was in general very high in our analyses. With all protocols, <12% of the metabolites showed mean intraindividual CVs below 15%.
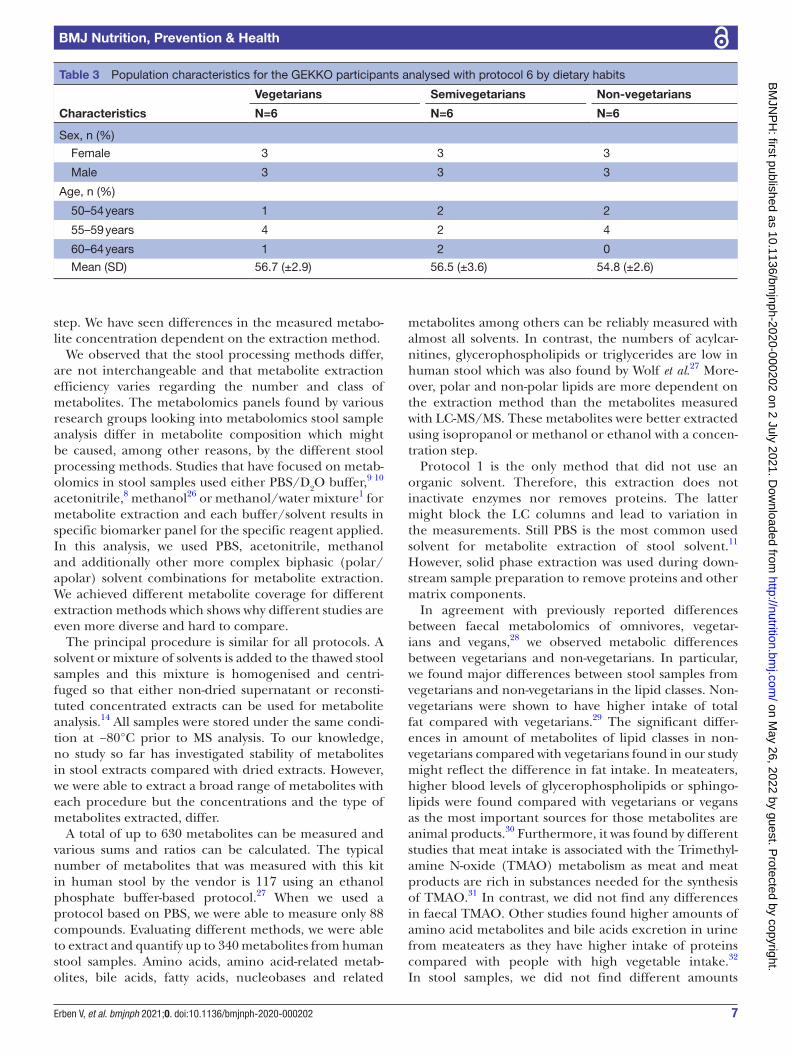
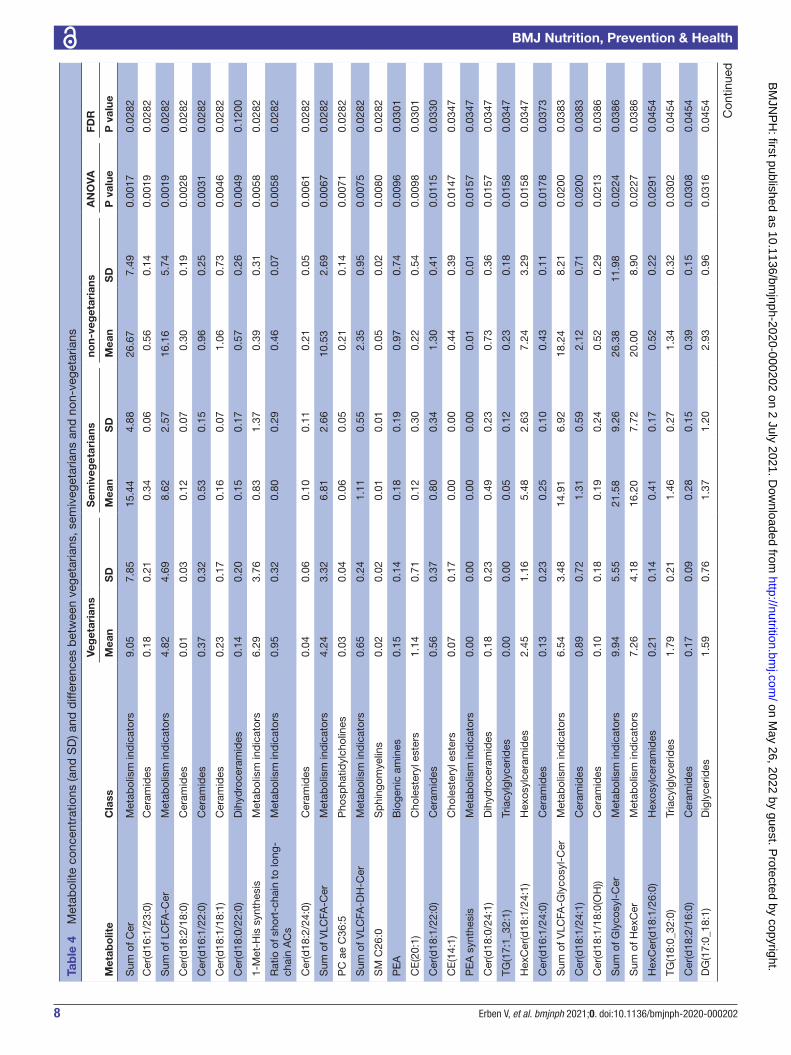
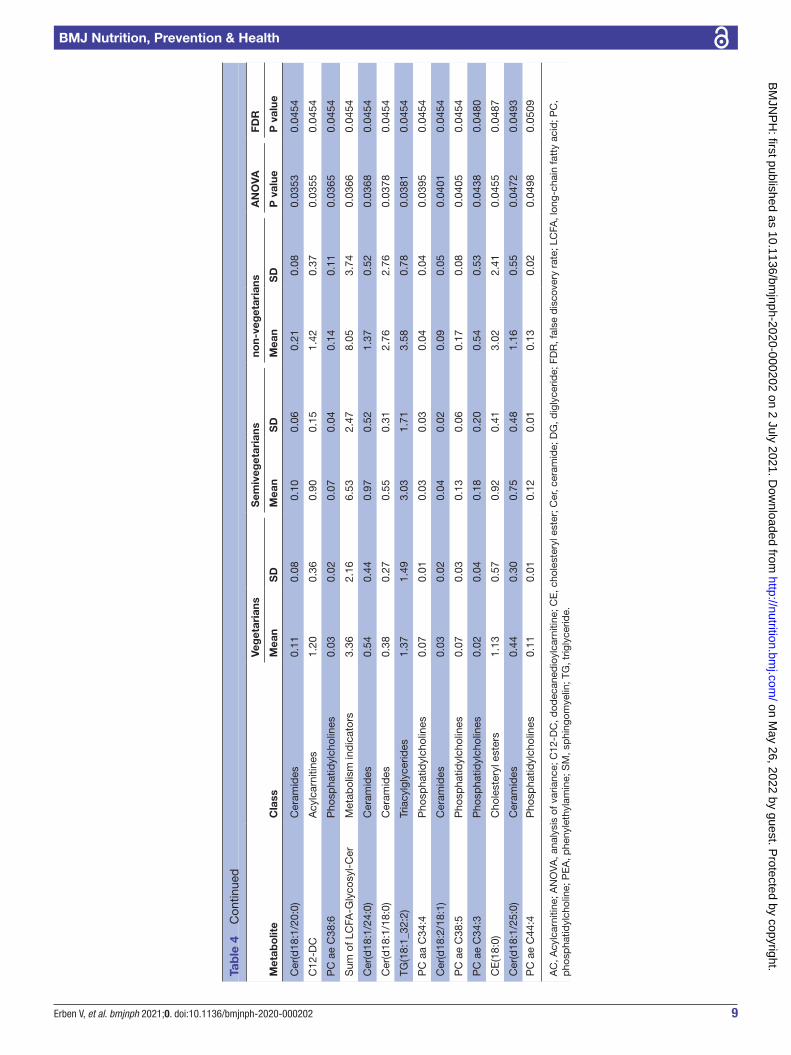
Metabolic differences in stool samples comparing vegetarians and non-vegetariansProtocol 6 was favourable in terms of sample handling and measured numbers of metabolites. Therefore, we further measured 18 stool samples according to this protocol from participants with different dietary habits (table 3). We analysed stool samples from 18 vegetarians,
semivegetarians and non- vegetarians and found a range of metabolites that were significantly different (table 4). After FDR adjustments, 46 metabolites (except PC ae C44:4) remain statistically significant different but less strongly pronounced. Most of the metabolites that distin-guished the dietary habits were from lipid classes such as ceramides and phosphatidylcholines. Some metabolism indicators were also found to be different between vege-tarians, semivegetarians and non- vegetarians. Most of the statistical significant ceramides were higher abundant in non- vegetarians and the sum of ceramides was increasing from vegetarians to non- vegetarians.
DISCUSSIONThere is no consensus so far how stool samples should be prepared for comparable, standardised metabolomics measurements.11 14 We were able to extract a broad range of metabolites with each of the eight defined protocols tested within this study. However, some methods should be preferred over others in regards to the solvents used dependent on the aim of the study and if a broad or a specific metabolic coverage is aimed for in a particular stool sample analysis. In this study, the largest numbers of metabolites could be measured after extraction with isopropanol and ethanol or methanol following a drying
Figure 2 Distribution of mean intra- individual coefficients of variation reflecting variability of measurements in multiple stool aliquots from the same individuals.
on May 26, 2022 by guest. P
rotected by copyright.http://nutrition.bm
j.com/
BM
JNP
H: first published as 10.1136/bm
jnph-2020-000202 on 2 July 2021. Dow
nloaded from
7Erben V, et al. bmjnph 2021;0. doi:10.1136/bmjnph-2020-000202
BMJ Nutrition, Prevention & Health
step. We have seen differences in the measured metabo-lite concentration dependent on the extraction method.
We observed that the stool processing methods differ, are not interchangeable and that metabolite extraction efficiency varies regarding the number and class of metabolites. The metabolomics panels found by various research groups looking into metabolomics stool sample analysis differ in metabolite composition which might be caused, among other reasons, by the different stool processing methods. Studies that have focused on metab-olomics in stool samples used either PBS/D2O buffer,9 10 acetonitrile,8 methanol26 or methanol/water mixture1 for metabolite extraction and each buffer/solvent results in specific biomarker panel for the specific reagent applied. In this analysis, we used PBS, acetonitrile, methanol and additionally other more complex biphasic (polar/apolar) solvent combinations for metabolite extraction. We achieved different metabolite coverage for different extraction methods which shows why different studies are even more diverse and hard to compare.
The principal procedure is similar for all protocols. A solvent or mixture of solvents is added to the thawed stool samples and this mixture is homogenised and centri-fuged so that either non- dried supernatant or reconsti-tuted concentrated extracts can be used for metabolite analysis.14 All samples were stored under the same condi-tion at −80°C prior to MS analysis. To our knowledge, no study so far has investigated stability of metabolites in stool extracts compared with dried extracts. However, we were able to extract a broad range of metabolites with each procedure but the concentrations and the type of metabolites extracted, differ.
A total of up to 630 metabolites can be measured and various sums and ratios can be calculated. The typical number of metabolites that was measured with this kit in human stool by the vendor is 117 using an ethanol phosphate buffer- based protocol.27 When we used a protocol based on PBS, we were able to measure only 88 compounds. Evaluating different methods, we were able to extract and quantify up to 340 metabolites from human stool samples. Amino acids, amino acid- related metab-olites, bile acids, fatty acids, nucleobases and related
metabolites among others can be reliably measured with almost all solvents. In contrast, the numbers of acylcar-nitines, glycerophospholipids or triglycerides are low in human stool which was also found by Wolf et al.27 More-over, polar and non- polar lipids are more dependent on the extraction method than the metabolites measured with LC- MS/MS. These metabolites were better extracted using isopropanol or methanol or ethanol with a concen-tration step.
Protocol 1 is the only method that did not use an organic solvent. Therefore, this extraction does not inactivate enzymes nor removes proteins. The latter might block the LC columns and lead to variation in the measurements. Still PBS is the most common used solvent for metabolite extraction of stool solvent.11 However, solid phase extraction was used during down-stream sample preparation to remove proteins and other matrix components.
In agreement with previously reported differences between faecal metabolomics of omnivores, vegetar-ians and vegans,28 we observed metabolic differences between vegetarians and non- vegetarians. In particular, we found major differences between stool samples from vegetarians and non- vegetarians in the lipid classes. Non- vegetarians were shown to have higher intake of total fat compared with vegetarians.29 The significant differ-ences in amount of metabolites of lipid classes in non- vegetarians compared with vegetarians found in our study might reflect the difference in fat intake. In meateaters, higher blood levels of glycerophospholipids or sphingo-lipids were found compared with vegetarians or vegans as the most important sources for those metabolites are animal products.30 Furthermore, it was found by different studies that meat intake is associated with the Trimethyl-amine N- oxide (TMAO) metabolism as meat and meat products are rich in substances needed for the synthesis of TMAO.31 In contrast, we did not find any differences in faecal TMAO. Other studies found higher amounts of amino acid metabolites and bile acids excretion in urine from meateaters as they have higher intake of proteins compared with people with high vegetable intake.32 In stool samples, we did not find different amounts
Table 3 Population characteristics for the GEKKO participants analysed with protocol 6 by dietary habits
Characteristics
Vegetarians Semivegetarians Non- vegetarians
N=6 N=6 N=6
Sex, n (%)
Female 3 3 3
Male 3 3 3
Age, n (%)
50–54 years 1 2 2
55–59 years 4 2 4
60–64 years 1 2 0
Mean (SD) 56.7 (±2.9) 56.5 (±3.6) 54.8 (±2.6)
on May 26, 2022 by guest. P
rotected by copyright.http://nutrition.bm
j.com/
BM
JNP
H: first published as 10.1136/bm
jnph-2020-000202 on 2 July 2021. Dow
nloaded from
8 Erben V, et al. bmjnph 2021;0. doi:10.1136/bmjnph-2020-000202
BMJ Nutrition, Prevention & Health
Tab
le 4
M
etab
olite
con
cent
ratio
ns (a
nd S
D) a
nd d
iffer
ence
s b
etw
een
vege
taria
ns, s
emiv
eget
aria
ns a
nd n
on- v
eget
aria
ns
Met
abo
lite
Cla
ss
Veg
etar
ians
Sem
iveg
etar
ians
non-
veg
etar
ians
AN
OVA
FDR
Mea
nS
DM
ean
SD
Mea
nS
DP
val
ueP
val
ue
Sum
of C
erM
etab
olis
m in
dic
ator
s9.
057.
8515
.44
4.88
26.6
77.
490.
0017
0.02
82
Cer
(d16
:1/2
3:0)
Cer
amid
es0.
180.
210.
340.
060.
560.
140.
0019
0.02
82
Sum
of L
CFA
- Cer
Met
abol
ism
ind
icat
ors
4.82
4.69
8.62
2.57
16.1
65.
740.
0019
0.02
82
Cer
(d18
:2/1
8:0)
Cer
amid
es0.
010.
030.
120.
070.
300.
190.
0028
0.02
82
Cer
(d16
:1/2
2:0)
Cer
amid
es0.
370.
320.
530.
150.
960.
250.
0031
0.02
82
Cer
(d18
:1/1
8:1)
Cer
amid
es0.
230.
170.
160.
071.
060.
730.
0046
0.02
82
Cer
(d18
:0/2
2:0)
Dih
ydro
cera
mid
es0.
140.
200.
150.
170.
570.
260.
0049
0.12
00
1- M
et- H
is s
ynth
esis
Met
abol
ism
ind
icat
ors
6.29
3.76
0.83
1.37
0.39
0.31
0.00
580.
0282
Rat
io o
f sho
rt- c
hain
to
long
- ch
ain
AC
sM
etab
olis
m in
dic
ator
s0.
950.
320.
800.
290.
460.
070.
0058
0.02
82
Cer
(d18
:2/2
4:0)
Cer
amid
es0.
040.
060.
100.
110.
210.
050.
0061
0.02
82
Sum
of V
LCFA
- Cer
Met
abol
ism
ind
icat
ors
4.24
3.32
6.81
2.66
10.5
32.
690.
0067
0.02
82
PC
ae
C36
:5P
hosp
hatid
ylch
olin
es0.
030.
040.
060.
050.
210.
140.
0071
0.02
82
Sum
of V
LCFA
- DH
- Cer
Met
abol
ism
ind
icat
ors
0.65
0.24
1.11
0.55
2.35
0.95
0.00
750.
0282
SM
C26
:0S
phi
ngom
yelin
s0.
020.
020.
010.
010.
050.
020.
0080
0.02
82
PE
AB
ioge
nic
amin
es0.
150.
140.
180.
190.
970.
740.
0096
0.03
01
CE
(20:
1)C
hole
ster
yl e
ster
s1.
140.
710.
120.
300.
220.
540.
0098
0.03
01
Cer
(d18
:1/2
2:0)
Cer
amid
es0.
560.
370.
800.
341.
300.
410.
0115
0.03
30
CE
(14:
1)C
hole
ster
yl e
ster
s0.
070.
170.
000.
000.
440.
390.
0147
0.03
47
PE
A s
ynth
esis
Met
abol
ism
ind
icat
ors
0.00
0.00
0.00
0.00
0.01
0.01
0.01
570.
0347
Cer
(d18
:0/2
4:1)
Dih
ydro
cera
mid
es0.
180.
230.
490.
230.
730.
360.
0157
0.03
47
TG(1
7:1_
32:1
)Tr
iacy
lgly
cerid
es0.
000.
000.
050.
120.
230.
180.
0158
0.03
47
Hex
Cer
(d18
:1/2
4:1)
Hex
osyl
cera
mid
es2.
451.
165.
482.
637.
243.
290.
0158
0.03
47
Cer
(d16
:1/2
4:0)
Cer
amid
es0.
130.
230.
250.
100.
430.
110.
0178
0.03
73
Sum
of V
LCFA
- Gly
cosy
l- C
erM
etab
olis
m in
dic
ator
s6.
543.
4814
.91
6.92
18.2
48.
210.
0200
0.03
83
Cer
(d18
:1/2
4:1)
Cer
amid
es0.
890.
721.
310.
592.
120.
710.
0200
0.03
83
Cer
(d18
:1/1
8:0(
OH
))C
eram
ides
0.10
0.18
0.19
0.24
0.52
0.29
0.02
130.
0386
Sum
of G
lyco
syl-
Cer
Met
abol
ism
ind
icat
ors
9.94
5.55
21.5
89.
2626
.38
11.9
80.
0224
0.03
86
Sum
of H
exC
erM
etab
olis
m in
dic
ator
s7.
264.
1816
.20
7.72
20.0
08.
900.
0227
0.03
86
Hex
Cer
(d18
:1/2
6:0)
Hex
osyl
cera
mid
es0.
210.
140.
410.
170.
520.
220.
0291
0.04
54
TG(1
8:0_
32:0
)Tr
iacy
lgly
cerid
es1.
790.
211.
460.
271.
340.
320.
0302
0.04
54
Cer
(d18
:2/1
6:0)
Cer
amid
es0.
170.
090.
280.
150.
390.
150.
0308
0.04
54
DG
(17:
0_18
:1)
Dig
lyce
rides
1.59
0.76
1.37
1.20
2.93
0.96
0.03
160.
0454 Con
tinue
d
on May 26, 2022 by guest. P
rotected by copyright.http://nutrition.bm
j.com/
BM
JNP
H: first published as 10.1136/bm
jnph-2020-000202 on 2 July 2021. Dow
nloaded from
9Erben V, et al. bmjnph 2021;0. doi:10.1136/bmjnph-2020-000202
BMJ Nutrition, Prevention & Health
Met
abo
lite
Cla
ss
Veg
etar
ians
Sem
iveg
etar
ians
non-
veg
etar
ians
AN
OVA
FDR
Mea
nS
DM
ean
SD
Mea
nS
DP
val
ueP
val
ue
Cer
(d18
:1/2
0:0)
Cer
amid
es0.
110.
080.
100.
060.
210.
080.
0353
0.04
54
C12
- DC
Acy
lcar
nitin
es1.
200.
360.
900.
151.
420.
370.
0355
0.04
54
PC
ae
C38
:6P
hosp
hatid
ylch
olin
es0.
030.
020.
070.
040.
140.
110.
0365
0.04
54
Sum
of L
CFA
- Gly
cosy
l- C
erM
etab
olis
m in
dic
ator
s3.
362.
166.
532.
478.
053.
740.
0366
0.04
54
Cer
(d18
:1/2
4:0)
Cer
amid
es0.
540.
440.
970.
521.
370.
520.
0368
0.04
54
Cer
(d18
:1/1
8:0)
Cer
amid
es0.
380.
270.
550.
312.
762.
760.
0378
0.04
54
TG(1
8:1_
32:2
)Tr
iacy
lgly
cerid
es1.
371.
493.
031.
713.
580.
780.
0381
0.04
54
PC
aa
C34
:4P
hosp
hatid
ylch
olin
es0.
070.
010.
030.
030.
040.
040.
0395
0.04
54
Cer
(d18
:2/1
8:1)
Cer
amid
es0.
030.
020.
040.
020.
090.
050.
0401
0.04
54
PC
ae
C38
:5P
hosp
hatid
ylch
olin
es0.
070.
030.
130.
060.
170.
080.
0405
0.04
54
PC
ae
C34
:3P
hosp
hatid
ylch
olin
es0.
020.
040.
180.
200.
540.
530.
0438
0.04
80
CE
(18:
0)C
hole
ster
yl e
ster
s1.
130.
570.
920.
413.
022.
410.
0455
0.04
87
Cer
(d18
:1/2
5:0)
Cer
amid
es0.
440.
300.
750.
481.
160.
550.
0472
0.04
93
PC
ae
C44
:4P
hosp
hatid
ylch
olin
es0.
110.
010.
120.
010.
130.
020.
0498
0.05
09
AC
, Acy
lcar
nitin
e; A
NO
VA, a
naly
sis
of v
aria
nce;
C12
- DC
, dod
ecan
edio
ylca
rniti
ne; C
E, c
hole
ster
yl e
ster
; Cer
, cer
amid
e; D
G, d
igly
cerid
e; F
DR
, fal
se d
isco
very
rat
e; L
CFA
, lon
g- ch
ain
fatt
y ac
id; P
C,
pho
spha
tidyl
chol
ine;
PE
A, p
heny
leth
ylam
ine;
SM
, sp
hing
omye
lin; T
G, t
rigly
cerid
e.
Tab
le 4
C
ontin
ued
on May 26, 2022 by guest. P
rotected by copyright.http://nutrition.bm
j.com/
BM
JNP
H: first published as 10.1136/bm
jnph-2020-000202 on 2 July 2021. Dow
nloaded from
10 Erben V, et al. bmjnph 2021;0. doi:10.1136/bmjnph-2020-000202
BMJ Nutrition, Prevention & Health
of amino acids or bile acids between vegetarians and non- vegetarians.
There are some limitations of this study. First, various solvents have different abilities to dissolve and extract the metabolites of different classes and therefore there will be different results for each sample processing methodology which are not comparable. There is a very broad range of chemical classes in metabolomics and not all metabo-lites can be extracted equally well with the same methods. Second, stool composition varies greatly depending on antibiotic use,33 diet or the water content that can be in a range from 63% to 85%.14 This might have introduced great variability. Drying the original stool samples taken out of the freezer before processing offers the advan-tage of referring to similar actual weights, avoiding bias due to difference in the water content among different samples.13 It is difficult though to imagine study partic-ipants to dry their stool samples and then freeze them in small amounts with equal weights for standardisation and avoiding freeze–thaw cycles. One would also need to collect more wet weight stool to get enough dry weight stool for a standardised metabolomics analyses. In addi-tion, it is still an obstacle for many people to collect their stool samples for study purposes, freeze them at home and finally transport them in a freezing device to their physician. There is a need for a standardised protocol for stool sampling to account for the interperson variability of water content (for normalisation of metabolites) in the stool samples. Stable internal standards need to be defined that can be detected in stool together with param-eters of food consumption.
In addition, large heterogeneity of stool composi-tion even within a single bowel movement of the same person requires careful attention. In our study, we aimed to quantify such heterogeneity by assessing variability of measurements in different stool aliquots taken from the same bowel movement from each participant. The large mean intraindividual coefficients of variation most likely primarily reflect heterogeneity of stool composition and point to the need of homogenising stool or combining measurements from multiple stool aliquots taken from different parts of a bowel movement to reduce the impact of such intra- individual variation.
Other points are contaminations and variations intro-duced into the stool samples that can result from toilet water or from urine, which we tried to minimise using a stool collection aid.34 Even though a broad range of up to 630 metabolites were measured, other important metab-olites such as short- chain fatty acid, important products from the microbiome,35 cannot be assessed and are not included in this kit. If these specific chemical classes are of interest, one has to use other kits or suitable analytical methods. Further limitations are the small samples size and inclusion of healthy individuals only.
A major strength of this study is that we have tested various metabolite extraction protocols on the same analytical platform. Stool samples are very promising in metabolomics research for CRC as they directly represent
the microbial activities and the cellular environment in the gut.7 The stool samples were only frozen once which should ensure good metabolite stability: composition might locally differ since the 50 mg were cut- off as frozen biomass from the total stool sample without thawing and mixing the complete stool sample.
In conclusion, we found a broad range of metabolites measurable in human stool samples. Some chemical classes (polar metabolites) can be measured equally well with all protocols, whereas others are highly dependent on the extraction method. The extraction methods using (1) isopropanol or (2) ethanol or methanol and methyl tert- butyl ether including drying of the supernatant seem to be preferable over others for further metabolomics analyses regarding the number of detectable metabo-lites and should be recommended if a great number of metabolites shall be measured in large cohorts with good sample handling efficiency. To our knowledge, this is the first study in stool metabolomics comparing eight different protocols for metabolite extraction with a novel highly standardised and quality controlled, quantitative and reproducible assay. Furthermore, we were evaluating one methodology, the for our purpose most favourable protocol, to compare metabolites composition of stool samples of participants with different dietary habits.
There is urgent need for a consensus on standard procedures for and optimised processing of the samples for stool metabolomics and for quantitative and repro-ducible assays to get comparable results across different studies and laboratories.
Acknowledgements We gratefully acknowledge all the participants of the GEKKO study, the excellent cooperation and support of the participating partner practices and clinics, as mentioned on our website (https://www. nct- heidelberg. de/ gekko), the commitment of their physicians and staff who make this study possible with their constant efforts in prevention and early detection of cancer. We thank the GEKKO Team at the National Center for Tumor Diseases (NCT) for outstanding engagement: Dr med Ulrike Bussas, Susanne Jakob, Maria Kuschel, Birgit Brandstetter, Dr med Marie- Luise Groß, Dr Anton Gies for recruiting study participants, acquiring biosamples, data collection and documentation; Ursula Klos, Sabine Serick, Anna Beierle, Rosa Orihuela Vicente and many part- time students for processing and biobanking the samples in the laboratory. We thank Astrid Zimmermann, Elena Voge, Dr Utz Benscheid, Folke Thormann, Anja Wolf, Rahel Bauer, Markus Eckstein, Friedemann Ringwald and Claudia El- Idrissi for their contribution in data collection, monitoring and documentation. Dr Alexia Arnold, Ronja Sienknecht, Madeleine Brandt and Miriam Eckers for administrative and organisational support; and the Bundesfreiwillige from the Internationaler Bund (Bildungszentrum Heidelberg) for being interested and supportive young people.
Contributors HB planned and designed the GEKKO study. VE, PS- K and HB designed this specific analysis. GP designed the protocols. VE and GP processed the samples. HB and PS- K conducted the study. VE analysed the data. VE and HB drafted the manuscript. All authors critically reviewed the manuscript and approved the final draft.
Funding This trial is conducted in the context of the NCT Early Detection and Prevention Programme (POC, NCT 3.0), funded by the German Federal Ministry of Education and Research, the German Cancer Aid, The German Cancer Research Center (GCRC/DKFZ) and the University Clinic Heidelberg (UKHD). There is no external sponsor. This funding source has no role in the study design, and has no role in data collection, data analysis and interpretation, or decision to submit results for presentation or publication.
Competing interests The authors disclose no potential conflict of interests. We received the MxP® Quant 500 Kit (Biocrates Life Sciences AG, Innsbruck, Austria) used in this study free of charge and thank Biocrates for their kind support.
on May 26, 2022 by guest. P
rotected by copyright.http://nutrition.bm
j.com/
BM
JNP
H: first published as 10.1136/bm
jnph-2020-000202 on 2 July 2021. Dow
nloaded from
11Erben V, et al. bmjnph 2021;0. doi:10.1136/bmjnph-2020-000202
BMJ Nutrition, Prevention & Health
Patient consent for publication Not required.
Provenance and peer review Not commissioned; externally peer reviewed.
Data availability statement All data relevant to the study are included in the article or uploaded as supplementary information.
Supplemental material This content has been supplied by the author(s). It has not been vetted by BMJ Publishing Group Limited (BMJ) and may not have been peer- reviewed. Any opinions or recommendations discussed are solely those of the author(s) and are not endorsed by BMJ. BMJ disclaims all liability and responsibility arising from any reliance placed on the content. Where the content includes any translated material, BMJ does not warrant the accuracy and reliability of the translations (including but not limited to local regulations, clinical guidelines, terminology, drug names and drug dosages), and is not responsible for any error and/or omissions arising from translation and adaptation or otherwise.
Open access This is an open access article distributed in accordance with the Creative Commons Attribution Non Commercial (CC BY- NC 4.0) license, which permits others to distribute, remix, adapt, build upon this work non- commercially, and license their derivative works on different terms, provided the original work is properly cited, appropriate credit is given, any changes made indicated, and the use is non- commercial. See: http:// creativecommons. org/ licenses/ by- nc/ 4. 0/.
ORCID iDsVanessa Erben http:// orcid. org/ 0000- 0002- 6555- 4894Petra Schrotz- King http:// orcid. org/ 0000- 0003- 4339- 3492
REFERENCES 1 Phua LC, Chue XP, Koh PK, et al. Non- Invasive fecal metabonomic
detection of colorectal cancer. Cancer Biol Ther 2014;15:389–97. 2 Rose C, Parker A, Jefferson B, et al. The characterization of feces
and urine: a review of the literature to inform advanced treatment technology. Crit Rev Environ Sci Technol 2015;45:1827–79.
3 Zhgun ES, Ilina EN. Fecal metabolites as non- invasive biomarkers of gut diseases. Acta Naturae 2020;12:4–14.
4 Weir TL, Manter DK, Sheflin AM, et al. Stool microbiome and metabolome differences between colorectal cancer patients and healthy adults. PLoS One 2013;8:e70803.
5 Youssef O, Lahti L, Kokkola A, et al. Stool microbiota composition differs in patients with stomach, colon, and rectal neoplasms. Dig Dis Sci 2018;63:2950–8.
6 Louis P, Hold GL, Flint HJ. The gut microbiota, bacterial metabolites and colorectal cancer. Nat Rev Microbiol 2014;12:661–72.
7 Chetwynd AJ, Ogilvie LA, Nzakizwanayo J, et al. The potential of nanoflow liquid chromatography- nano electrospray ionisation- mass spectrometry for global profiling the faecal metabolome. J Chromatogr A 2019;1600:127–36.
8 Amiot A, Dona AC, Wijeyesekera A, et al. (1)H NMR Spectroscopy of Fecal Extracts Enables Detection of Advanced Colorectal Neoplasia. J Proteome Res 2015;14:3871–81.
9 Bezabeh T, Somorjai R, Dolenko B, et al. Detecting colorectal cancer by 1H magnetic resonance spectroscopy of fecal extracts. NMR Biomed 2009;22:593–600.
10 Lin Y, Ma C, Liu C, et al. Nmr- Based fecal metabolomics fingerprinting as predictors of earlier diagnosis in patients with colorectal cancer. Oncotarget 2016;7:29454–64.
11 Deda O, Gika HG, Wilson ID, et al. An overview of fecal sample preparation for global metabolic profiling. J Pharm Biomed Anal 2015;113:137–50.
12 Gratton J, Phetcharaburanin J, Mullish BH, et al. Optimized sample handling strategy for metabolic profiling of human feces. Anal Chem 2016;88:4661–8.
13 Deda O, Chatziioannou AC, Fasoula S, et al. Sample preparation optimization in fecal metabolic profiling. J Chromatogr B Analyt Technol Biomed Life Sci 2017;1047:115–23.
14 Karu N, Deng L, Slae M, et al. A review on human fecal metabolomics: methods, applications and the human fecal metabolome database. Anal Chim Acta 2018;1030:1–24.
15 Orlich MJ, Singh PN, Sabaté J, et al. Vegetarian dietary patterns and the risk of colorectal cancers. JAMA Intern Med 2015;175:767–76.
16 Bjerrum JT, Wang Y, Hao F, et al. Metabonomics of human fecal extracts characterize ulcerative colitis, Crohn's disease and healthy individuals. Metabolomics 2015;11:122–33.
17 Ivanisevic J, Zhu Z- J, Plate L, et al. Toward 'omic scale metabolite profiling: a dual separation- mass spectrometry approach for coverage of lipid and central carbon metabolism. Anal Chem 2013;85:6876–84.
18 Lee DY, Kind T, Yoon Y- R, et al. Comparative evaluation of extraction methods for simultaneous mass- spectrometric analysis of complex lipids and primary metabolites from human blood plasma. Anal Bioanal Chem 2014;406:7275–86.
19 Biocrates Life Sciences AG. Analysis of Human Fecal Samples with the MxP(R) Quant 500 Kit. Innsbruck, Austria: Biocrates Life Sciences AG, 2019.
20 Siskos AP, Jain P, Römisch- Margl W, et al. Interlaboratory reproducibility of a targeted metabolomics platform for analysis of human serum and plasma. Anal Chem 2017;89:656–65.
21 Ramsay SL, Stöggl WM, Weinberger KM. Patent EP1897014B1 2006.
22 Ramsay SL, Guggenbichler W, Weinberger KM. Patent EP1875401B1 2006.
23 Bogumil R, Röhring C, Prehn C. A High- Throughput Method for Targeted Metabolomics Analysis of Different Tissue Samples using the Absolute IDQ(tm) Kit. Application Note 1004-1. Innsbruck, Austria: Biocrates Life Sciences AG, 2009.
24 Wu H, Southam AD, Hines A, et al. High- Throughput tissue extraction protocol for NMR- and MS- based metabolomics. Anal Biochem 2008;372:204–12.
25 Zukunft S, Prehn C, Röhring C, et al. High- Throughput extraction and quantification method for targeted metabolomics in murine tissues. Metabolomics 2018;14:18.
26 Goedert JJ, Sampson JN, Moore SC, et al. Fecal metabolomics: assay performance and association with colorectal cancer. Carcinogenesis 2014;35:2089–96.
27 Wolf B, Heischmann S, Dearth S. Spotlight. The MxP Quant 500 kit. MetaboNews: the metabolomics innovation center (TMIC), metabolomics Society 2019:4–9.
28 De Filippis F, Pellegrini N, Vannini L, et al. High- Level adherence to a Mediterranean diet beneficially impacts the gut microbiota and associated metabolome. Gut 2016;65:1812–21.
29 Rizzo NS, Jaceldo- Siegl K, Sabate J, et al. Nutrient profiles of vegetarian and nonvegetarian dietary patterns. J Acad Nutr Diet 2013;113:1610–9.
30 Schmidt JA, Rinaldi S, Ferrari P, et al. Metabolic profiles of male meat eaters, fish eaters, vegetarians, and vegans from the EPIC- Oxford cohort. Am J Clin Nutr 2015;102:1518–26.
31 Guasch- Ferré M, Bhupathiraju SN, Hu FB. Use of metabolomics in improving assessment of dietary intake. Clin Chem 2018;64:82–98.
32 Wei R, Ross AB, Su M, et al. Metabotypes related to meat and vegetable intake reflect microbial, lipid and amino acid metabolism in healthy people. Mol Nutr Food Res 2018;62:1800583.
33 Pérez- Cobas AE, Gosalbes MJ, Friedrichs A, et al. Gut microbiota disturbance during antibiotic therapy: a multi- omic approach. Gut 2013;62:1591–601.
34 Wu W- K, Chen C- C, Panyod S, et al. Optimization of fecal sample processing for microbiome study - The journey from bathroom to bench. J Formos Med Assoc 2019;118:545–55.
35 Ueyama J, Oda M, Hirayama M, et al. Freeze- Drying enables homogeneous and stable sample preparation for determination of fecal short- chain fatty acids. Anal Biochem 2020;589:113508.
on May 26, 2022 by guest. P
rotected by copyright.http://nutrition.bm
j.com/
BM
JNP
H: first published as 10.1136/bm
jnph-2020-000202 on 2 July 2021. Dow
nloaded from