evaluation of an integrated testbed environment for the web of things
TRANSCRIPT
467
International Journal on Advances in Intelligent Systems, vol 8 no 3 & 4, year 2015, http://www.iariajournals.org/intelligent_systems/
2015, © Copyright by authors, Published under agreement with IARIA - www.iaria.org
Evaluation of an Integrated Testbed Environment for the Web of Things
Mina Younan Computer Science Department
Faculty of Computers and Information
Minia University Minia, Egypt
E-mail: [email protected]
Sherif Khattab, Reem Bahgat Computer Science Department
Faculty of Computers and Information
Cairo University
Giza, Egypt
E-mails: {s.khattab, r.bahgat}@fci-cu.edu.eg
Abstract – Sensor networks research is still active due to the
proliferation of devices equipped with sensors and actuators.
Although simulators (e.g., Cooja) and Web sites (e.g.,
Thingspeak) allow building Internet of Things (IoT) and Web
of Things (WoT) applications, they are not compatible with
many testing purposes, especially for the WoT. Younan et al
recently proposed a testbed architecture for the WoT. It
augments IoT by Web applications and allows for generating
datasets and using them offline and online. In this paper, we
present an evaluation of the WoT testbed by empirically
measuring the accuracy of the generated dataset and by
qualitatively comparing the testbed to the state-of-the-art in
WoT and IoT measurement platforms.
Keywords – Internet of Things (IoT); Web of Things (WoT);
Entities of Interest (EoIs); Testbed evaluation.
I. INTRODUCTION
Nowadays research in the area of Wireless Sensor
Networks (WSN) sheds the light on the role of simulators
and testbeds to enhance the research results [1]. This is
gaining importance due to the increasing number of devices
and things connected to the Internet, which is expected to
reach the order of billions by 2020 [2] [3] as soon as the
Internet Protocol (IP) becomes the core standard in the
fields of embedded devices. As a result, the number of
human Internet users may well be less than the number of
devices connected to it.
Research on the Internet of Things (IoT) focuses on the
infrastructure needed for connecting things and devices to
the Internet. IoT addresses the connectivity challenge by
using IP and IPv6 for embedded devices (i.e., 6LoWPAN)
[4]. IoT devices, sensors and actuators, allow the state of
things (e.g., places and other devices) to be inferred [3] [5].
In a sense, IoT devices convert things to Smart Things
(SThs) and things‟ environments to smart spaces. Entities of
Interest (EoIs), things, devices, resources, discovery, and
addressing are main terms in the IoT [6].
On the other hand, the Web of Things (WoT)
“virtualizes‟‟ the IoT infrastructure and focuses on the
application layer needed for building useful applications
over the IoT layer. Services, such as searching for SThs and
EoIs, in addition to Web-based applications for controlling
and monitoring services in smart spaces using friendly user
interfaces, are core power features in the WoT.
Muhammad et al. [7] summarize the differences
between emulators, simulators, and physical testbeds. They
conclude that physical testbeds provide more accurate
results. For instance, MoteLab [5] is a testbed for WSNs. It
addresses challenges related to sensors‟ deployment and the
time consumed for building a WSN. It features a Web
application to be accessed remotely. The need for WSN
testbeds is highlighted by challenges and research topics,
which shed light on a specific set of features to be
embedded within the testbed and its tools [7] [8].
However, there has been no general method for testing
and benchmarking research in the WoT [1] [7] [8] [9],
especially for searching in the WoT. The problem of how to
find SThs and EoIs with their dynamic states that change
according to environment events [10] [11] has sheer
importance in drawing conclusions, deductions, and analysis
in various fields. In the WoT search problem, not only
datasets about sensor readings are needed, but integrating
the readings with information and meta-data about the
underlying infrastructure is needed as well.
In our previous work [1], a testbed architecture for the
WoT is proposed, which achieves the integration between
the sensors‟ readings and the underlying infrastructure. The
testbed addresses the general needs of WoT testing and
focuses on the Web search problem and its related issues,
such as crawling (i.e., preparing WoT pages for crawling).
The testbed can be used as a WoT application, which
monitors real devices in real-time and can be used as a WoT
simulator to do the same process on WoT datasets instead of
devices. It aims at collecting datasets that contain
information about things (i.e., properties and readings)
formatted using multiple markup languages. The collected
datasets are designed to help in testing in many problem
domains [10] [12].
In this paper, we present a detailed analysis of the
testbed presented in [1] using a case study on crawling the
WoT. Empirical evaluation of the WoT testbed is presented
and its features are discussed in the light of other IoT and
WoT testbeds in the literature. In particular, the accuracy of
the dataset is measured and evaluated; this is important in
order to make accurate decisions about the states of the
468
International Journal on Advances in Intelligent Systems, vol 8 no 3 & 4, year 2015, http://www.iariajournals.org/intelligent_systems/
2015, © Copyright by authors, Published under agreement with IARIA - www.iaria.org
simulated EoIs specially that most of the EoIs‟ states depend
on the synchronization of more than one STh reading. For
completeness, the testbed architecture and its
implementation are also described in this paper.
The remainder of the paper is organized as follows. In
the next section, the related work regarding the creation of
searchable IoT and WoT domains using IoT and WoT
simulators and datasets is discussed. Discussion of IoT and
WoT testbeds is presented in Section III. Section IV
describes the testbed architecture of [1] and its
implementation, followed by the evaluation of the dataset‟s
time-accuracy in Section V. A case study is presented in
Section VI. Finally, conclusions and important ideas for
future work are presented in Section VII.
II. RELATED WORK
In the light of the WoT challenges and dataset
requirements discussed in [1], this section discusses the
usage of sensor datasets in the literature. To summarize our
observations, if the research is only interested in values
measured by sensors or in states of EoIs (e.g., being online
or offline), then the used dataset is based on the WoT level
(dynamic information), whereas if the research is interested
in the sensor network infrastructure, then the used dataset is
based on the IoT level (static information). Because the
SThs may be movable objects, i.e., their location may be
changing frequently, and then the research may need an
additional type of information, which is called quasi-
dynamic information about SThs. In this case, such a
property about SThs will be considered as a special type of
their readings (dynamic information). An integrated dataset
contains information about both sensor readings and
network infrastructure, that is, it is based on both IoT and
WoT levels.
Several studies [7] [8] [9] [13] discuss and compare
between existing simulators and testbeds using general
criteria, such as the number of nodes, heterogeneity of
hardware, and mobility, but none of them discusses WoT
features, such as STh‟s logical path, supported formats in
which EoIs‟ states are presented, and accuracy of the
datasets generated by the testbeds. In the next section, we
present a comparison of testbeds and measurement
platforms that combines both IoT and WoT features.
A. IoT Simulation
There is no general way for simulating IoT [7] [9] [13].
Moreover, there are situations in which simulators and real
datasets containing raw information (e.g., sensor readings
[14]) or information about the IoT layer are not enough for
modeling an environment under testing, as the datasets miss
the sense of one or more of the challenges mentioned earlier
and thus, miss the main factors for accurate WoT
evaluation. Also, many datasets are not actually related to
the problem under investigation, but were generated for
testing and evaluating different algorithms or methods in
other researches. For instance, an evaluation of WSNs‟
simulators according to a different set of criteria, such as the
Graphical User Interface (GUI) support, the simulator
platform, and the available models and protocols, concludes
that there is no general way for simulating WSNs, and hence
IoT and WoT [9] [13]. None of these criteria address the
previous challenges. So, it is desirable to embed the unique
IoT and WoT challenges within the datasets and to make
simulators support as much of these challenges.
WSN Simulators. Several studies [7] [9] [13] summarize
the differences between existing simulators according to a
set of criteria. The Cooja simulator gives users the ability to
simulate WSNs easily using a supported GUI [9] [13] and
different types of sensors (motes) for different sensor
targets. Sensor applications are written in the nesC [15]
language after being built in the TinyOS [16] (e.g., the
RESTful client server application [17]). However, there are
limitations and difficulties for testing the extensible
discovery service [12] and sensor similarity search [18] in
Cooja, because there is no information about the network
infrastructure and entities. In particular, static information
about sensors is written in different formats, and schematics
information of the buildings and locations of sensors can be
presented.
WSN Physical Testbeds. Physical testbeds produce
accurate research results [7]. Different testbeds are found in
this field due to different technologies and network scales.
MoteLab [5] supports two ways for accessing the WSNs, (1)
by retrieving stored information from a database server (i.e.,
offline) and (2) by direct access to the physical nodes
deployed in the environment under test (i.e., online).
However, the WoT challenges mentioned previously are not
fully supported in MoteLab. User accessibility in MoteLab
is similar to what is done in the testbed proposed in [1].
SmartCampus [19] tackles gaps of experimentation
realism, supporting heterogeneity (devices), and user
involvement [8] in IoT testbeds. CookiLab [20] gives users
(researchers) the ability to access real sensors deployed in
Harvard University. However, it does not support logical
paths as a property for sensor nodes and entities (WoT
features).
Nam et al. [21] present an Arduino [22] based smart
gateway architecture for building IoT, which is similar to
the architecture of the testbed environment proposed in [1]
(e.g., periodic sensor reporting). They build an application
that discovers all connected Arduinos and lists the devices
connected on each Arduino. However, the framework does
not cover all scenarios that WoT needs, especially for
searching. For example, information of logical paths and
properties of entities and information of the devices that the
components simulate or measure are missing.
At Intel Berkeley research lab [14], 54 sensors were
deployed, and sensor readings were recorded in the form of
plain text. The dataset includes information about the
sender, the receiver, probability of successful sending (i.e.,
some sensor readings were missed) and a quasi-dynamic
469
International Journal on Advances in Intelligent Systems, vol 8 no 3 & 4, year 2015, http://www.iariajournals.org/intelligent_systems/
2015, © Copyright by authors, Published under agreement with IARIA - www.iaria.org
information about sensors (coordinates). However, the time
accuracy of the dataset was not measured.
B. WoT Simulation
Using websites (e.g., [23] [24] [25]), a WoT environment
can be built online by attaching SThs like Arduinos [22].
These websites monitor the states of devices and provide
RESTful services (GET, PUT, UPDATE, DELETE) [26]
for uploading and accessing reading feeds. Moreover, the
values (sensor readings) are visualized for users. The
services of the aforementioned websites are similar to
services of the testbed environment in [1]. However, these
websites are limited by available service usage and formats
of the responses, which are hardcoded and embedded within
the website code or at least not exposed to users. The
testbed architecture in [1], which is built specially for
testing WoT, provides more general services, such as
monitoring live information fed from attached SThs,
visualizing sensor readings and states of EoIs over time,
controlling actuators, triggering action events, and periodic
sensor reporting.
C. Service Architecture for WoT
Web services are considered as the main method for
accessing WoT devices [27]. Mayer et al. [28] propose a
hierarchical infrastructure for building WoT to enhance the
performance of the searching service. The searching
scenario starts by getting a list of sensors that can answer a
query according to their static properties and predicted
values. Then, the identified sensors are queried to check
their current values, which are used for ranking the search
results. The searching scenario is integrated into the
proposed testbed.
Mayer and Guinard [12] and Mayer [29] implement an
algorithm, called extensible discovery service [12], for
solving the problem of using multiple formats (e.g.,
Microformats and Microdata) in the WoT. They implement
their algorithms as a Web application that asks the users
about a sensor page URL and retrieves information about
devices if and only if the page is written in one of a set of
pre-defined formats. However, their work does not result in
a dataset. The proposed testbed in [1] allows such an
algorithm to be tested to measure its performance. The
required dataset contains sensor information written in
different formats so that the algorithm is tested in parsing
and retrieving information about sensors and entities.
The present paper substantially extends the work
presented in [1] by discussing WoT testbed features in the
light of other IoT and WoT testbeds in the literature,
considering testbed evaluation by measuring the dataset
time accuracy, and presenting a case study for crawling the
WoT.
To summarize, up to our knowledge, none of the
previously proposed testbeds fulfills the full requirements
for testing and evaluating the Web search process in the
WoT. The proposed testbed environment in [1] aimed at
filling this gap. It is not the main focus of the testbed to be
yet another WSN testbed but to integrate WoT and IoT
features for virtualizing things and entities, retrofitting on
the benefits of existing physical testbeds [1]. Making
decisions about EoIs‟ states depends on more than one
sensor reading, so evaluation of datasets generated by the
testbed focuses on the time accuracy (synchronization time)
and dataset integrity, as will be indicated in details in
Section V.
III. COMPARISON OF STATE-OF-THE-ART IOT AND WOT
TESTBEDS
From WSN to the IoT, and then moving forward to the
WoT, one purpose is sought for, that is monitoring and
controlling the surrounding environment. All of these
platforms have the same network infrastructure, but data
manipulation (accessing and representing sensory data)
differs from one platform to another according to the user
interests. WSN testbeds aim at improving algorithms and
solutions for resource constrained devices, while IoT
testbeds aim at integrating these devices (SThs) into
globally interconnected networks [8]. The main goal of the
WoT testbeds, including the integrated WoT testbed [1], is
to improve the usability of the information produced by the
IoT and to provide more services that raise this usability by
increasing the primary beneficiaries of the WoT
technologies. The information generated from the testbeds
can be widely used in different industries if and only if
people and machines can understand this information.
Different criteria have been set for WSN and IoT
testbed assessment and evaluation [7] [8] [13]. Because WoT
is the application layer on top of IoT that presents sensory
data in an abstract form using available web tools and
services, most of the future requirements described in [8]
are important to be hosted in WoT testbeds. Federation is
one of the most important factors that have to be met in
WoT testbeds, whereby WoT testbeds host more than one
WoT system for evaluating many services such as a
searching service. Another requirement is heterogeneity of
connected devices and formats that are embedded in web
pages to represent SThs. Heterogeneity of data formats
means that WoT systems hosted in a single testbed can use
different pages with different formats. Semantic
technologies in testbeds enhance the scale and heterogeneity
requirements.
Different studies have defined different criteria sets for
comparing testbeds in WSN and IoT [7] [8] [9]. In the light
of those studies, the proposed testbed should cover most of
existing IoT testbeds‟ features in addition to other
WoT requirements, such as accessing data through RESTful
services, getting high-level states instead of raw sensory
data, and searching in real-time for SThs and EoIs.
The comparison of testbeds in this section is divided
into two main categories according to the testbed
architecture: (1) infrastructure layer and (2) software layer,
where testing and evaluation services are done.

470
International Journal on Advances in Intelligent Systems, vol 8 no 3 & 4, year 2015, http://www.iariajournals.org/intelligent_systems/
2015, © Copyright by authors, Published under agreement with IARIA - www.iaria.org
A. Elements of the infrastructure layer
Elements of this layer concerning the IoT environment
are as follows:
1) the number of nodes and possibility of discovering new
nodes (scalability): the number of nodes in WSN testbeds
should be more than 10, but in IoT it should be more than
1000. Because WoT is a layer above the IoT, as it was
mentioned previously, then the SThs number should be
sufficiently large. WoT testbed could be accessed offline
and online. So, deploying additional SThs can be done
manually by registering the STh‟s in online mode using
simple GUI, or dynamically when the gateways receive
acknowledgement messages from the SThs. In addition to
the GUI that testbed supports for giving users the ability to
add additional devices online like Thingspeak and Xively,
sharing datasets that simulate physical components
(accessing WoT testbed in offline mode) gives users the
ability to virtually increase the deployed number of SThs.
2) the environment properties: environment properties
relate to a certain physical phenomenon (e.g., temperature,
light, and humidity). The WoT testbed supports virtual
environment in offline mode, whereby real-time information
was generated from real SThs and stored in dataset files.
3) availability and portability: this element means the
ability to deploy and re-deploy the testbed in different
places. The WoT testbed is a physical testbed as well as a
simulator, whereby it can be used for monitoring one place
or environment (online or offline). Monitoring other places
needs node preparation, using the same software for
configuring, discovering devices, and collecting data from
them.
TABLE I. A COMPARISON BETWEEN WSN/IOT TESTBEDS AND SIMULATORS AND THE WOT TESTBED PROPOSED IN [1] .
Criteria Current WSN/IoT/WoT Testbeds and Simulators Integrated WoT Testbed [1]
Sca
lab
ilit
y
Number of deployed
nodes
Simulators Testbeds
Prototype is done over 30 sensor nodes.
For enhancing scalability, testbed supports:
o GUI for registering additional SThs o Sharing datasets
A large number of nodes can
be deployed (e.g., Cooja simulator [17])
Senslab [30] deployed 1000 nodes.
Thingspeak [24] and Xively [23]:
Number of nodes depends on number of channels to which resources are
attached.
Possibility to discover new
nodes
Manually. Node configuration is done automatically or manually (e.g., Thingspeak and
Xively), according to network topology.
Manually
Dynamically
Environment Produce randomly-modeled
information (e.g., Cooja [17])
Physical testbeds produce real information
(e.g., MoteLab [5]).
Physical environment in online mode.
Virtual environment in offline mode
Availability/ Portability
By sharing saved simulation projects.
Difficult to move from one place to another
It is a physical testbed and simulator in one (online or offline).
Hardware/Software heterogeneity
E.g., Cooja [17] E.g., MoteLab [5] Different SThs‟ types.
Different formats (i.e., different WoT
environments are deployed in one testbed) Add different types of motes in the same experiment
All motes write their information in the same format.
Repeatability/ Reproducibility
Save projects
Users have to build new applications to
work on these datasets generated from physical testbeds
Run in offline mode on the generated datasets.
No need to build new applications to work
on the datasets.
Real-time
Information
Random information Real-time information Real-time information
Datasets (historical data) are written in multiple formats. datasets (historical data) are written in a certain format (e.g., plain text)
WoT
Dataset
sharing
share saved projects (e.g.,
Cooja [17])
share results and evaluation measurements
through web applications (e.g., MoteLab [5])
Output of the testbed is simple to be manipulated with other testbeds.
It supports RESTful services to publish data
directly in a simple way.
User
involvement
Users intervene deeply Environmental conditions
are absent (Thingspeak [24]
and Xively [23] achieve this target but in limited
formats).
Working interactively through a web
application or published APIs
Scheduling „batch’ tasks to be executed on the testbeds (e.g., MoteLab [5]).
Users can:
deploy nodes manually or automatically
generate datasets by selecting criteria or rules on the DsC application.
SThs attributes
Static attributes are like serial and model numbers and brand. Dynamic attributes are like the physical location (longitude and latitude).
Support logical path as a main SThs attribute.
SThs Formats
Most of them support a single format. Generate different types of SThs formats (Microdata, Microformats, and RDF).

471
International Journal on Advances in Intelligent Systems, vol 8 no 3 & 4, year 2015, http://www.iariajournals.org/intelligent_systems/
2015, © Copyright by authors, Published under agreement with IARIA - www.iaria.org
4) the hardware heterogeneity: the ability to include
different types of sensors. The WoT testbed supports
different types of devices in different formats.
B. Elements of the software layer:
Elements of this layer concerning the WoT
environment are as follows:
1) software heterogeneity: the ability to run the testbed on
multiple operating systems and to support multiple
formats for SThs data and definitions.
2) re-usability (repeatability and reproducibility): the
ability to save an experiment to rerun it later.
3) real-time information: measures if the testbeds produce
imitative information (as in simulators) or real
information in the real-time (as in physical testbeds).
4) WoT features: WoT features include data sharing, user
involvement, GUI, RESTful APIs, STh‟s attributes and
formats. These features identify the tasks that the users
can do on testbeds, the possibility to support data
visualization (high-level knowledge), and the possibility
to share datasets. In the WoT testbed, users can deploy
nodes manually (configuring SThs and EoIs using a
GUI) or automatically when SThs receive
acknowledgement messages, they also generate datasets
by selecting criteria or rules on the DsC application. On
the other hand, Users intervene deeply in simulators,
whereby they build networks and create sensor nodes or
channels, but environment conditions in simulators are
absent. Xively [23] and Thingspeak [24] achieve this
target but support less accessibility for resources in
limited formats. When users work on physical testbeds,
they have two choices: (1) working interactively on the
physical testbed, which monitors and controls a certain
environment, through a web application or published
APIs or (2) scheduling „batch‟ tasks to be executed on
the testbeds (e.g., MoteLab [5]).
From Table I, we argue that WoT research needs a
special type of testbeds, of which is the integrated WoT
testbed [1], to support absent WoT features needed to
leverage existing testbeds to the WoT level.
IV. THE INTEGRATED WOT TESTBED
The proposed testbed architecture in [1] transforms the
physical control of devices in a surrounding physical
environment to an emulated control for those devices
keeping the same sense of events and features that existed in
the physical environment. These events and features are
embedded in datasets that can be later replayed. The
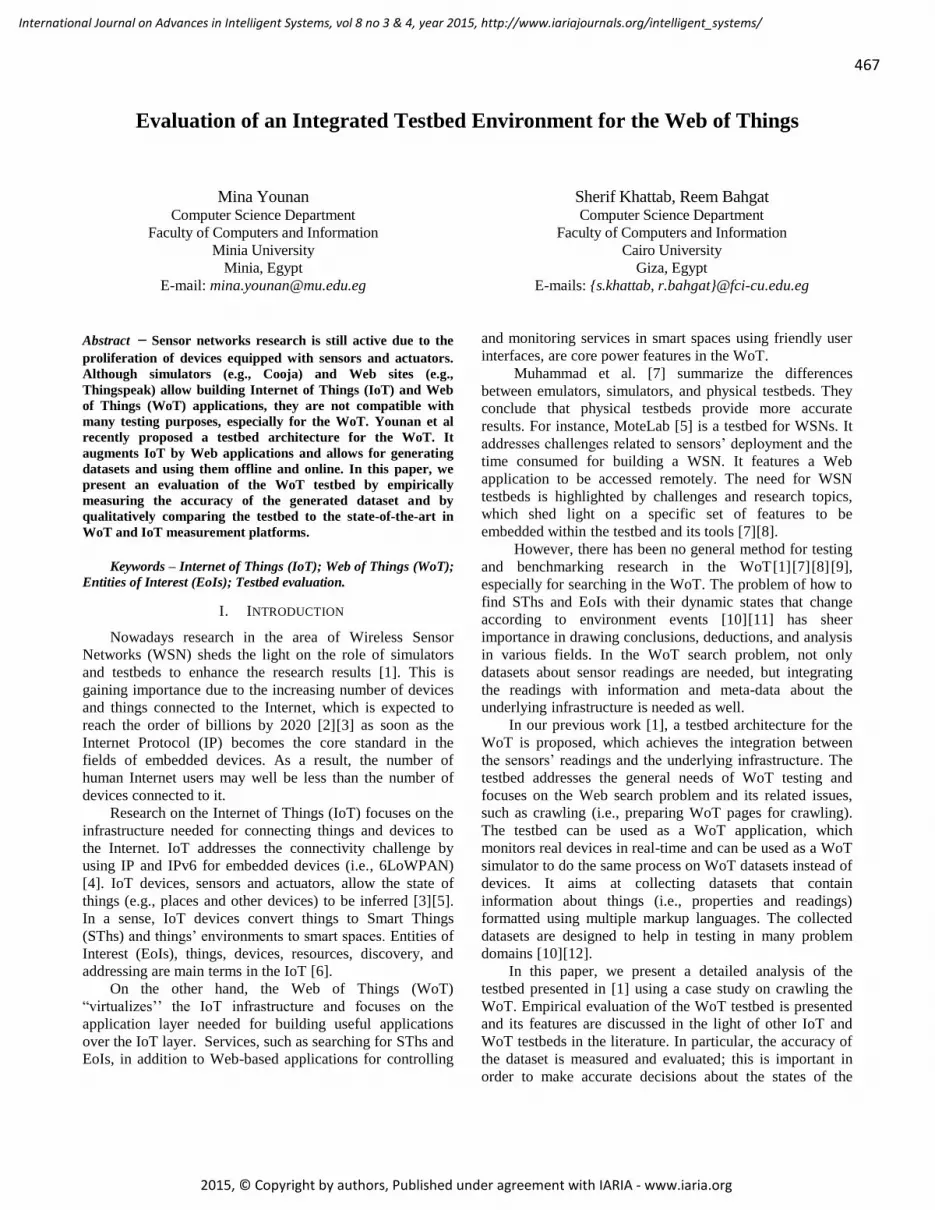
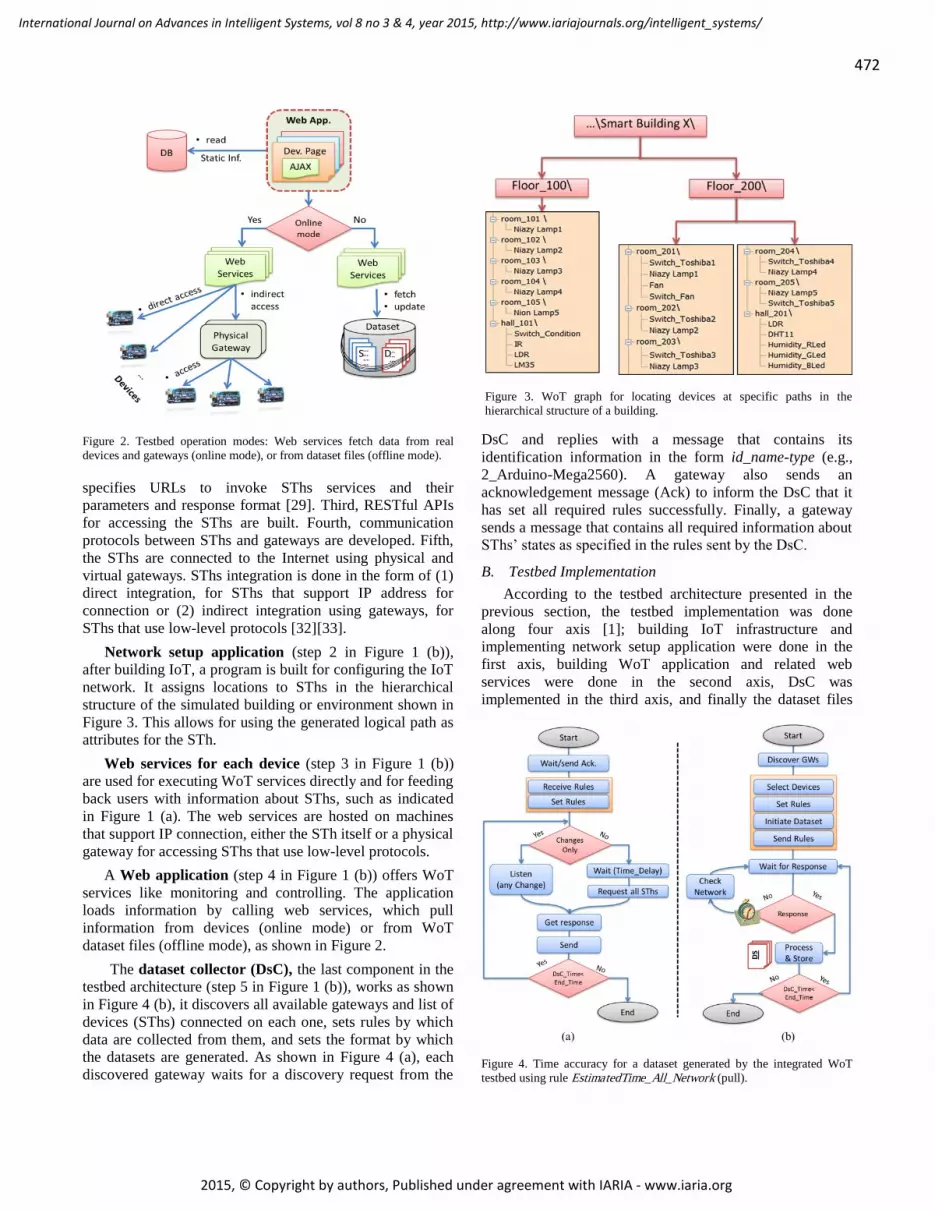
proposed architecture has two modes of operation: online
and offline (Figure 2). In online mode, datasets are
generated, “real” physical information is recorded, and a
Web application offers WoT services by accessing the real
devices for monitoring and controlling them. In offline
mode, the Web application accesses the datasets to replay
the events monitoring information.
A. Testbed Architecture
The testbed architecture, shown in Figure 1 (b), is
divided into five parts, as follows.
An IoT infrastructure (e.g., modeling a smart home) is
shown in step 1 Figure 1 (b). To build the IoT [31], the steps
are briefly as follows. First, things are converted to SThs by
attaching smart equipment (e.g., sensors and actuators), as
shown in Figure 1 (a). Second, the static and dynamic
information of SThs is described. SThs representation
Figure 1. Testbed Architecture: (a) Integrating smart things (SThs) in the IoT - (b) Testbed environment architecture for simulating a physical environment .
472
International Journal on Advances in Intelligent Systems, vol 8 no 3 & 4, year 2015, http://www.iariajournals.org/intelligent_systems/
2015, © Copyright by authors, Published under agreement with IARIA - www.iaria.org
specifies URLs to invoke SThs services and their
parameters and response format [29]. Third, RESTful APIs
for accessing the SThs are built. Fourth, communication
protocols between SThs and gateways are developed. Fifth,
the SThs are connected to the Internet using physical and
virtual gateways. SThs integration is done in the form of (1)
direct integration, for SThs that support IP address for
connection or (2) indirect integration using gateways, for
SThs that use low-level protocols [32] [33].
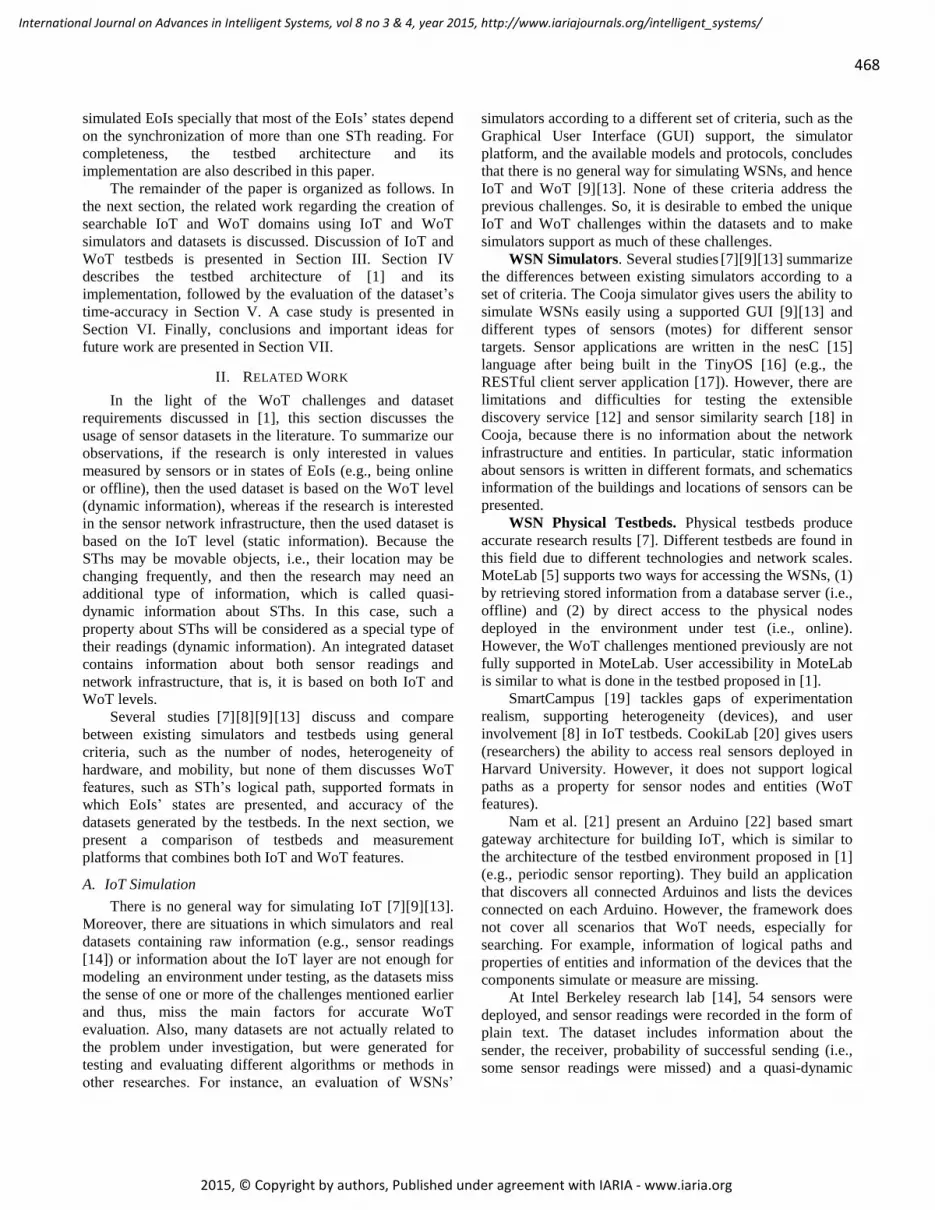
Network setup application (step 2 in Figure 1 (b)),
after building IoT, a program is built for configuring the IoT
network. It assigns locations to SThs in the hierarchical
structure of the simulated building or environment shown in
Figure 3. This allows for using the generated logical path as
attributes for the STh.
Web services for each device (step 3 in Figure 1 (b))
are used for executing WoT services directly and for feeding
back users with information about SThs, such as indicated
in Figure 1 (a). The web services are hosted on machines
that support IP connection, either the STh itself or a physical
gateway for accessing SThs that use low-level protocols.
A Web application (step 4 in Figure 1 (b)) offers WoT
services like monitoring and controlling. The application
loads information by calling web services, which pull
information from devices (online mode) or from WoT
dataset files (offline mode), as shown in Figure 2.
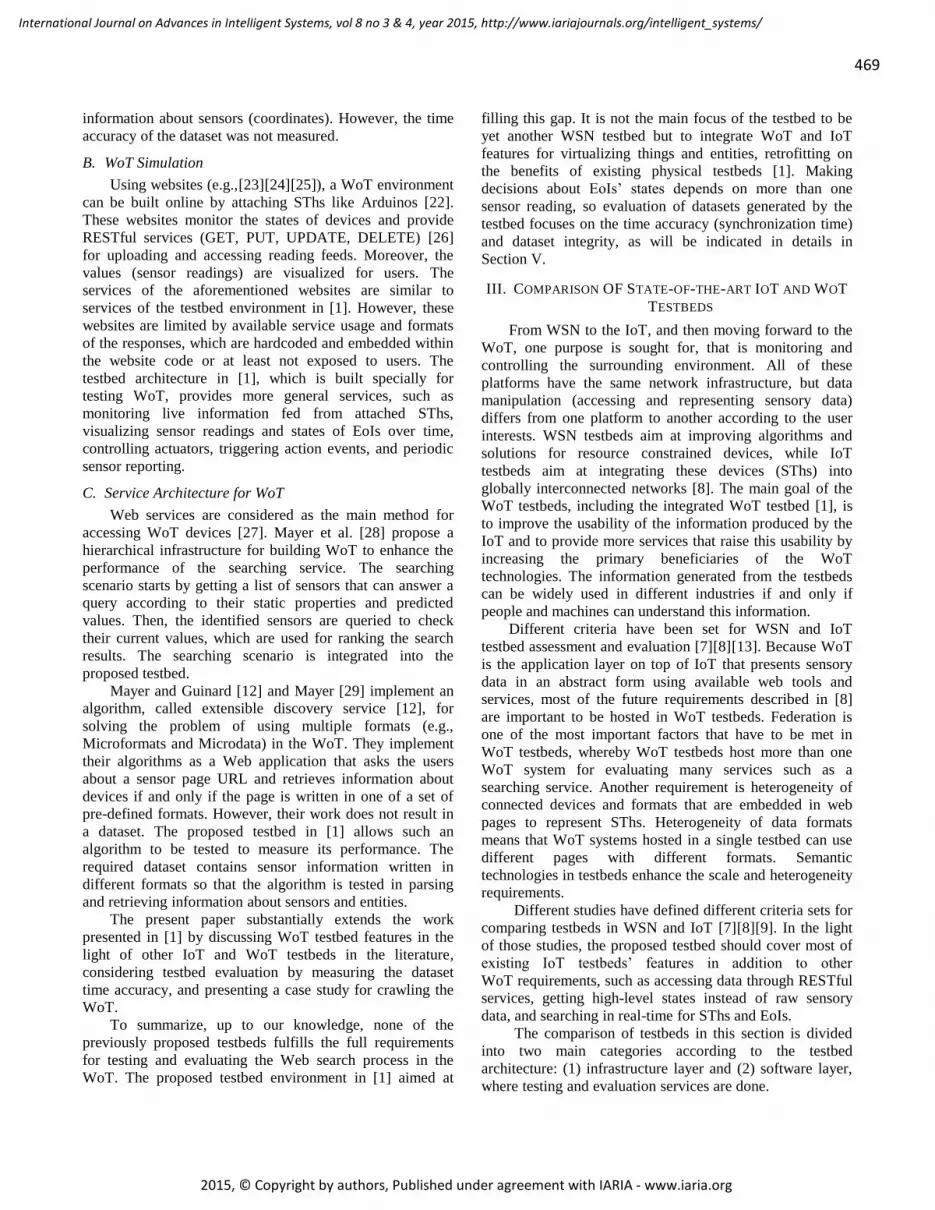
The dataset collector (DsC), the last component in the
testbed architecture (step 5 in Figure 1 (b)), works as shown
in Figure 4 (b), it discovers all available gateways and list of
devices (SThs) connected on each one, sets rules by which
data are collected from them, and sets the format by which
the datasets are generated. As shown in Figure 4 (a), each
discovered gateway waits for a discovery request from the
DsC and replies with a message that contains its
identification information in the form id_name-type (e.g.,
2_Arduino-Mega2560). A gateway also sends an
acknowledgement message (Ack) to inform the DsC that it
has set all required rules successfully. Finally, a gateway
sends a message that contains all required information about
SThs‟ states as specified in the rules sent by the DsC.
B. Testbed Implementation
According to the testbed architecture presented in the
previous section, the testbed implementation was done
along four axis [1]; building IoT infrastructure and
implementing network setup application were done in the
first axis, building WoT application and related web
services were done in the second axis, DsC was
implemented in the third axis, and finally the dataset files
Figure 4. Time accuracy for a dataset generated by the integrated WoT
testbed using rule EstimatedTime_All_Network (pull).
Figure 2. Testbed operation modes: Web services fetch data from real
devices and gateways (online mode), or from dataset files (offline mode).
Figure 3. WoT graph for locating devices at specific paths in the
hierarchical structure of a building.
473
International Journal on Advances in Intelligent Systems, vol 8 no 3 & 4, year 2015, http://www.iariajournals.org/intelligent_systems/
2015, © Copyright by authors, Published under agreement with IARIA - www.iaria.org
were generated.
1) Building the IoT infrastructure
This step will be executed the first time around; but, if a
dataset that is generated by this testbed exists, then building
WoT begins from the next step by attaching the dataset with
the web application to work in offline mode. Building the
IoT infrastructure was done in a simple way [27] [34] using
widely-available components. The SECE server [21] gets
information from the IoT according to events and actions
that happen in the environment. It offers the collected
information in a friendly user interface. A testbed
environment for the WoT is built using these connections.
Building the IoT infrastructure [31] [35] was done in five
steps, as mentioned above. Connecting devices and entities
to the internet is done after converting them to SThs and
EoIs, the network setup application is used for configuring
the SThs and EoIs, where each STh and EoI has a unique
URL following the hierarchical structure shown in Figure 3.
Whereas it is desirable to build IoT using devices that
support direct IP connection rather than devices that support
only low-level protocols, the latter devices needed gateways
for integrating them into the IoT. The IoT infrastructure was
built using Arduinos, on which sensors and actuators were
connected. Arduino has two interfaces: a Serial Peripheral
Interface (SPI) bus and an Internal Integrated Circuit (I2C),
which allows modules, like Ethernet and Secure Digital
(SD) cards, to communicate with the microcontroller [35].
The Arduinos connected more than one device using digital
and analog pins. In a sense, the Arduinos acted as physical
gateways and IP addresses were set for them. They were
attached to the network using Ethernet or XBee [34] [36]
[37] connections. Digi‟s Configuration and Test Utility
Software (Digi‟s X-CTU) [38] was used to interface with
radio‟s firmware of connected XBee modules.
Table II lists the components that were used for building
a simple instance of the testbed. A large number of
components, which could be connected on Arduinos are
available and have different purposes. They could be used
for building more complex testbed instances with different
targets.
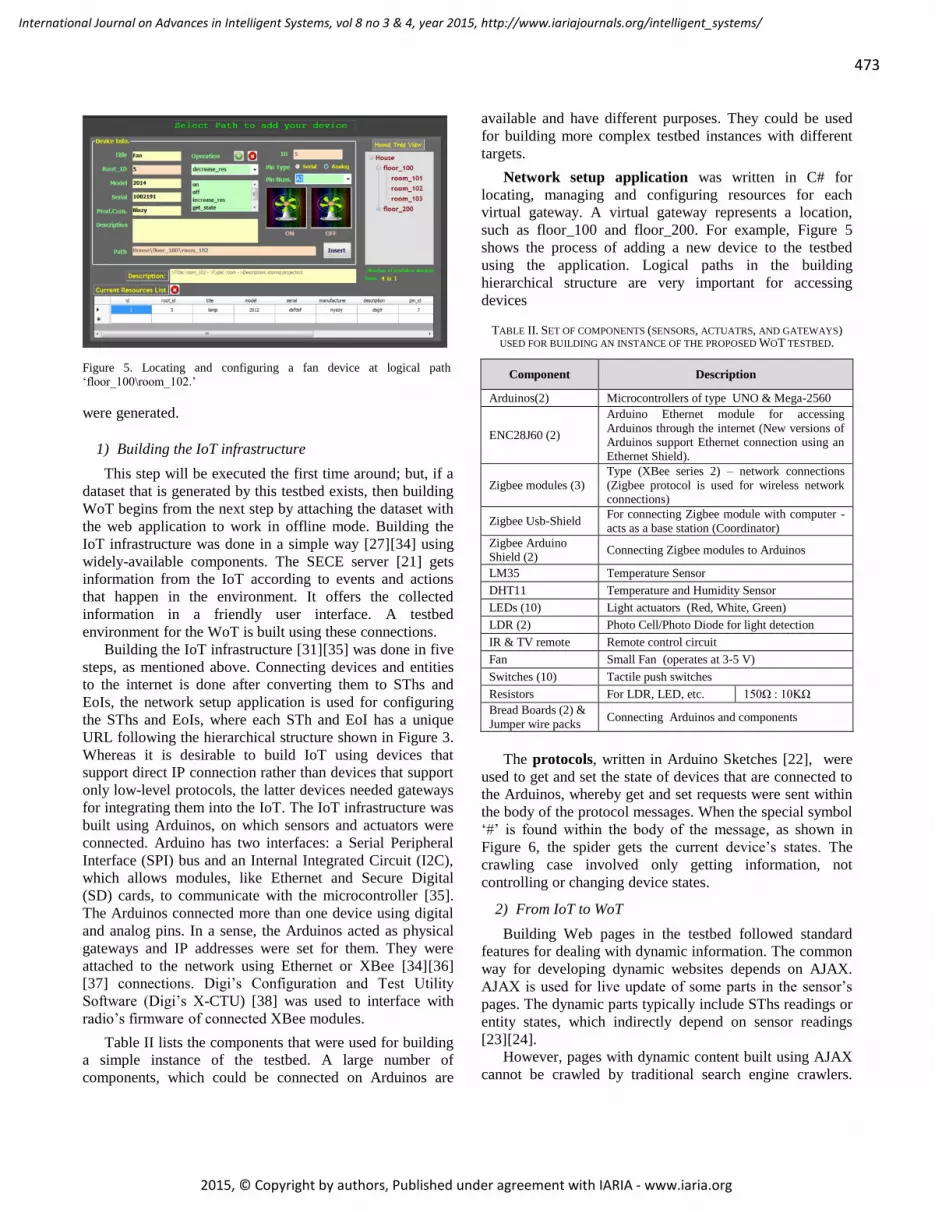
Network setup application was written in C# for
locating, managing and configuring resources for each
virtual gateway. A virtual gateway represents a location,
such as floor_100 and floor_200. For example, Figure 5
shows the process of adding a new device to the testbed
using the application. Logical paths in the building
hierarchical structure are very important for accessing
devices
TABLE II. SET OF COMPONENTS (SENSORS, ACTUATRS, AND GATEWAYS)
USED FOR BUILDING AN INSTANCE OF THE PROPOSED WOT TESTBED.
Component Description
Arduinos(2) Microcontrollers of type UNO & Mega-2560
ENC28J60 (2)
Arduino Ethernet module for accessing
Arduinos through the internet (New versions of Arduinos support Ethernet connection using an
Ethernet Shield).
Zigbee modules (3)
Type (XBee series 2) – network connections
(Zigbee protocol is used for wireless network connections)
Zigbee Usb-Shield For connecting Zigbee module with computer -
acts as a base station (Coordinator)
Zigbee Arduino Shield (2)
Connecting Zigbee modules to Arduinos
LM35 Temperature Sensor
DHT11 Temperature and Humidity Sensor
LEDs (10) Light actuators (Red, White, Green)
LDR (2) Photo Cell/Photo Diode for light detection
IR & TV remote Remote control circuit
Fan Small Fan (operates at 3-5 V)
Switches (10) Tactile push switches
Resistors For LDR, LED, etc. 150Ω : 10KΩ
Bread Boards (2) &
Jumper wire packs Connecting Arduinos and components
The protocols, written in Arduino Sketches [22], were
used to get and set the state of devices that are connected to
the Arduinos, whereby get and set requests were sent within
the body of the protocol messages. When the special symbol
„#‟ is found within the body of the message, as shown in
Figure 6, the spider gets the current device‟s states. The
crawling case involved only getting information, not
controlling or changing device states.
2) From IoT to WoT
Building Web pages in the testbed followed standard
features for dealing with dynamic information. The common
way for developing dynamic websites depends on AJAX.
AJAX is used for live update of some parts in the sensor‟s
pages. The dynamic parts typically include SThs readings or
entity states, which indirectly depend on sensor readings
[23] [24].
However, pages with dynamic content built using AJAX
cannot be crawled by traditional search engine crawlers.
Figure 5. Locating and configuring a fan device at logical path ‘floor_100\room_102.’
474
International Journal on Advances in Intelligent Systems, vol 8 no 3 & 4, year 2015, http://www.iariajournals.org/intelligent_systems/
2015, © Copyright by authors, Published under agreement with IARIA - www.iaria.org
Some search engines, such as Google, suggest practical
solutions for optimizing the crawling process [39] of
dynamic content. Alternative URLs that lead to pages with
static information are indexed by default or instead of pages
that contain dynamic information. According to Google
optimization rules, Web sites in our testbed use AJAX in
some parts in device‟s web page but for crawling,
corresponding Web services are accessed instead to get
current STh value or EoI state, in addition to all possible
states with corresponding occurrence probabilities. Another
technique not implemented in our testbed is to render pages
on the fly (i.e., crawlers have browsing processes embedded
in their code [40]). Still, it is difficult to crawl pages that
need to send some data first before loading their content.
Moreover, the time consumed by the crawling process itself
becomes high and the crawling process needs to be done
frequently; information in WoT may be updated in less than
a minute.
Using Ethernet, RESTful APIs can access Arduino
components. Devices are programmed as clients to push
sensor data to services and as services to enable remote
control of devices over the Web. Because it is desirable to
have a Web page for each device and because Arduino acts
as a gateway for managing at least one component, a
website is built and can be hosted on an SD card connected
to the Arduino. The website is accessed using an IP address,
assigned to the Arduino. Another alternative is to host the
website on a different server for adding more capabilities
like storage capacity. In the latter case, Arduinos are
accessed using RESTful APIs. The selection of either
alternative is determined by the amount of information that
needs to be stored and accessed over time.
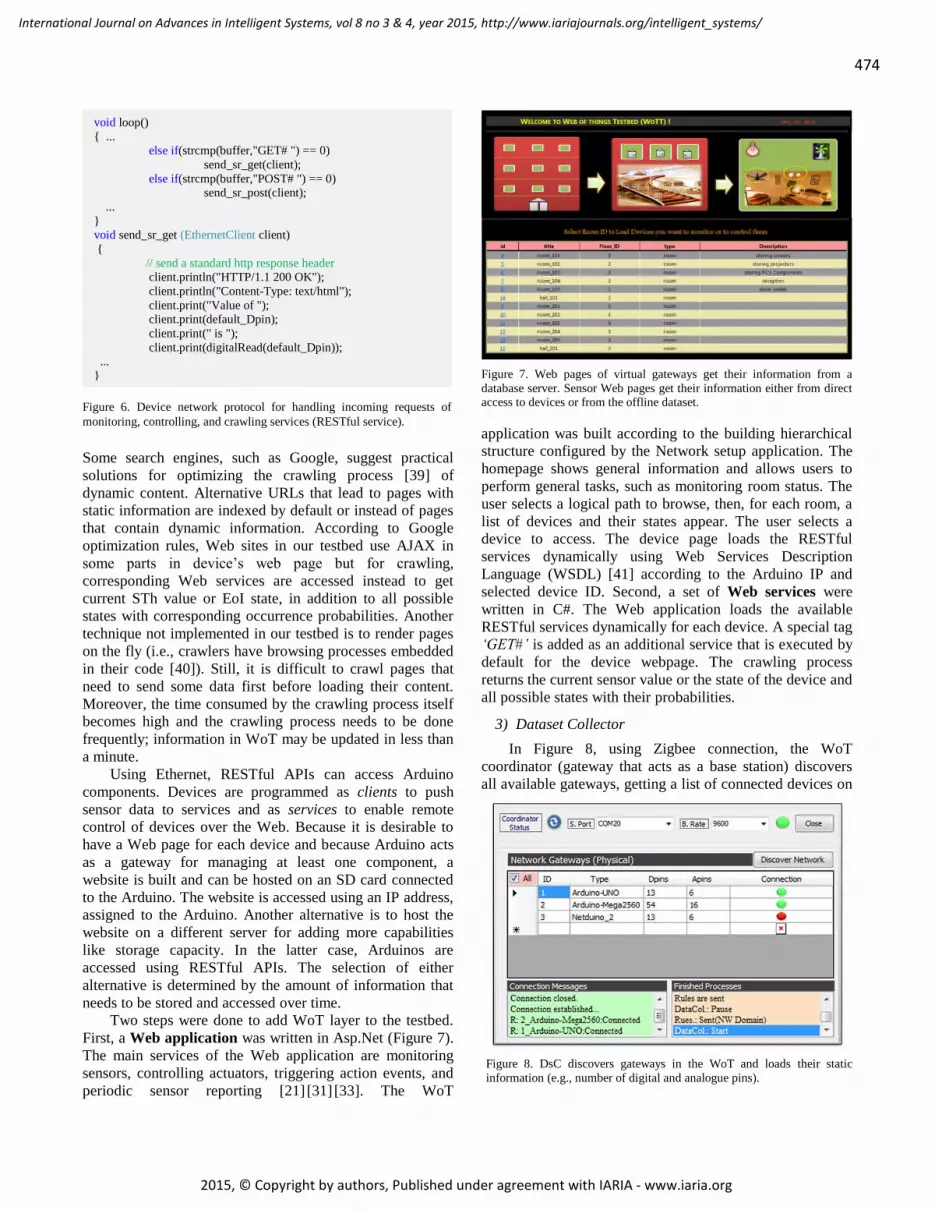
Two steps were done to add WoT layer to the testbed.
First, a Web application was written in Asp.Net (Figure 7).
The main services of the Web application are monitoring
sensors, controlling actuators, triggering action events, and
periodic sensor reporting [21] [31] [33]. The WoT
application was built according to the building hierarchical
structure configured by the Network setup application. The
homepage shows general information and allows users to
perform general tasks, such as monitoring room status. The
user selects a logical path to browse, then, for each room, a
list of devices and their states appear. The user selects a
device to access. The device page loads the RESTful
services dynamically using Web Services Description
Language (WSDL) [41] according to the Arduino IP and
selected device ID. Second, a set of Web services were
written in C#. The Web application loads the available
RESTful services dynamically for each device. A special tag
‘GET#’ is added as an additional service that is executed by
default for the device webpage. The crawling process
returns the current sensor value or the state of the device and
all possible states with their probabilities.
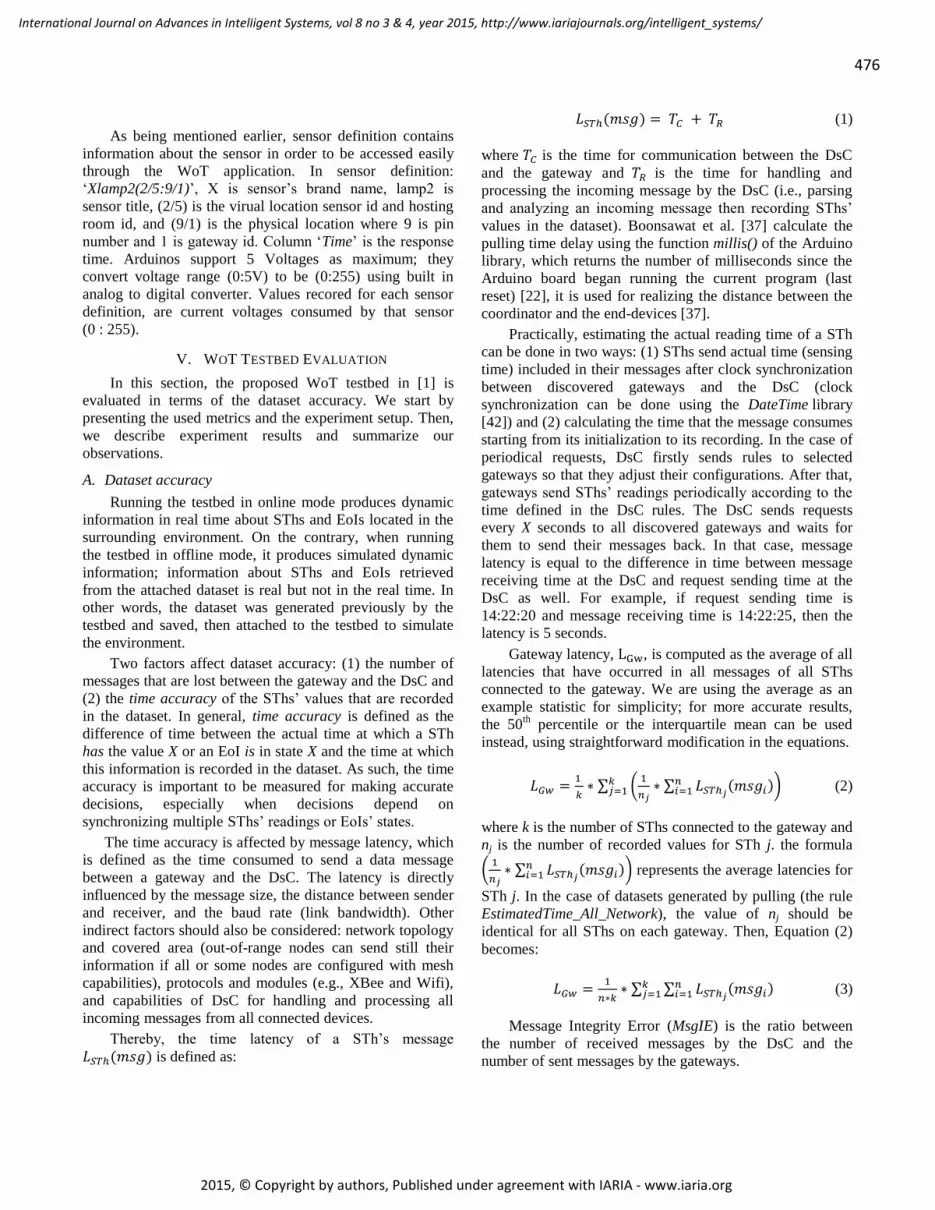
3) Dataset Collector
In Figure 8, using Zigbee connection, the WoT
coordinator (gateway that acts as a base station) discovers
all available gateways, getting a list of connected devices on
void loop()
{ ... else if(strcmp(buffer,"GET# ") == 0)
send_sr_get(client);
else if(strcmp(buffer,"POST# ") == 0) send_sr_post(client);
...
} void send_sr_get (EthernetClient client)
{
// send a standard http response header client.println("HTTP/1.1 200 OK");
client.println("Content-Type: text/html");
client.print("Value of "); client.print(default_Dpin);
client.print(" is ");
client.print(digitalRead(default_Dpin)); ...
}
Figure 6. Device network protocol for handling incoming requests of
monitoring, controlling, and crawling services (RESTful service).
Figure 8. DsC discovers gateways in the WoT and loads their static
information (e.g., number of digital and analogue pins).
Figure 7. Web pages of virtual gateways get their information from a
database server. Sensor Web pages get their information either from direct access to devices or from the offline dataset.

475
International Journal on Advances in Intelligent Systems, vol 8 no 3 & 4, year 2015, http://www.iariajournals.org/intelligent_systems/
2015, © Copyright by authors, Published under agreement with IARIA - www.iaria.org
each gateway (Figure 9 (a)). The DsC application generates
files written in different formats for the static information of
the IoT testbed including the building hierarchy and the
devices located in the hierarchy (Figure 9 (b)). The dynamic
information is collected using a set of rules, such as shown
in Figure 9 (c). The rules instruct the gateways to send back
specific information about a specific list of devices
according to a specific action or event done by other
devices. The gateways feed the DsC with device readings
according to these rules. If the rule ChangesOnly is selected,
the DsC stores only changes on device state. If the rule
TimeSlot was selected, the DsC stores periodical feeds of
device state. One of the most important rules is that if a
certain device type is selected for analysis of device
readings and making decisions according to the analysis
results, rules can be set to collect data from all devices of
that type across all the gateways in WoT.
4) Generated Dataset Files
A simple dataset was generated by the testbed according
to the rules: (1) every_2500 ms for updating dataset every
2500 millisecond (i.e., DsC pulls information from the
network), it could be replaced by rule ChangesOnly for
storing changes on devices‟ states only (i.e., devices push
information to DsC), (2) All_Network for pulling
information from all discovered gateways in the network,
(3) All_types means all devices on selected gateways, (4)
2014-12-1-h0_to_2015-1-1-h0 for storing dataset from
1/12/2014 to 1/1/2015, and (5) TD for triggering all
dependences related to selected devices. The dataset
generated according to limited time slot (date and time) by
DsC, as shown in Figure 9 (b), contains static information
about IoT infrastructure and dynamic information about
sensing and actuating activities.
The static information of each device, such as logical
path and device type, is stored in a file named using the
device ID, the EoI ID, and device name (e.g., 22_9_Fan).
Static information about a fan written in Microformats is
shown in Figure 10.
The dynamic information, such as sensor readings, is
stored in a file named using the collection-rule title and the
date and time of collection (e.g., Network_Time_All_2014-
12-1-h0). This file contains readings collected from all
devices in the WoT testbed. A subset of data stored in that
file would look like Table III, where monitoring is set to
rule time only.
TABLE III. SAMPLE READINGS GENERATED FROM ALL SENSORS OF TYPE
'LAMP' IN THE ENTIRE NETWORK AS A TIME SERIES. CONSUMED VOLTAGES
ARE MAPPED FROM (0:5) TO (0:255).
Time XLamp2
(2/5:9/1) XLamp3
(3/6:10/1) XLamp4
(4/7:11/1) XLamp5
(8/8:12/1) 03:01 PM 66 77 83 71
03:02 PM 66 80 83 68
03:04 PM 66 68 65 69
03:06 PM 67 71 69 67
03:08 PM 68 80 85 70
… … … … …
10:12 PM 65 80 85 70
Figure 9. Dataset collector: (a) DsC loads list of devices connected on discovered gateways in the WoT . (b) Static information about the IoT testbed are
generated in different formats. (c) Rules are defined to control the way gateways send dynamic information (readings).
<div class ="hproduct ">
<span class =" fn">22_Fan</span>
<span class =" identifier">, <span class =" type ">Fan</span> Sfan123
<span class =" value ">0</span>
</span> <span class =" category ">
<a href =http://www.XXX.com rel =" tag"> Fan </a>
</span> <span class =" brand ">Brand Name</span>
<span class =" description "> characterized by …
</span> <span class =" Photo ">Fan</span>
<a href =http://www.XXX.com/?s=wsn
class =" URL"> More information about this device.
</a>
</div>
Figure 10. Static information about a fan written in Microformats.
476
International Journal on Advances in Intelligent Systems, vol 8 no 3 & 4, year 2015, http://www.iariajournals.org/intelligent_systems/
2015, © Copyright by authors, Published under agreement with IARIA - www.iaria.org
As being mentioned earlier, sensor definition contains
information about the sensor in order to be accessed easily
through the WoT application. In sensor definition:
„Xlamp2(2/5:9/1)‟, X is sensor‟s brand name, lamp2 is
sensor title, (2/5) is the virual location sensor id and hosting
room id, and (9/1) is the physical location where 9 is pin
number and 1 is gateway id. Column „Time‟ is the response
time. Arduinos support 5 Voltages as maximum; they
convert voltage range (0:5V) to be (0:255) using built in
analog to digital converter. Values recored for each sensor
definition, are current voltages consumed by that sensor
(0 : 255).
V. WOT TESTBED EVALUATION
In this section, the proposed WoT testbed in [1] is
evaluated in terms of the dataset accuracy. We start by
presenting the used metrics and the experiment setup. Then,
we describe experiment results and summarize our
observations.
A. Dataset accuracy
Running the testbed in online mode produces dynamic
information in real time about SThs and EoIs located in the
surrounding environment. On the contrary, when running
the testbed in offline mode, it produces simulated dynamic
information; information about SThs and EoIs retrieved
from the attached dataset is real but not in the real time. In
other words, the dataset was generated previously by the
testbed and saved, then attached to the testbed to simulate
the environment.
Two factors affect dataset accuracy: (1) the number of
messages that are lost between the gateway and the DsC and
(2) the time accuracy of the SThs‟ values that are recorded
in the dataset. In general, time accuracy is defined as the
difference of time between the actual time at which a STh
has the value X or an EoI is in state X and the time at which
this information is recorded in the dataset. As such, the time
accuracy is important to be measured for making accurate
decisions, especially when decisions depend on
synchronizing multiple SThs‟ readings or EoIs‟ states.
The time accuracy is affected by message latency, which
is defined as the time consumed to send a data message
between a gateway and the DsC. The latency is directly
influenced by the message size, the distance between sender
and receiver, and the baud rate (link bandwidth). Other
indirect factors should also be considered: network topology
and covered area (out-of-range nodes can send still their
information if all or some nodes are configured with mesh
capabilities), protocols and modules (e.g., XBee and Wifi),
and capabilities of DsC for handling and processing all
incoming messages from all connected devices.
Thereby, the time latency of a STh‟s message
is defined as:
(1)
where is the time for communication between the DsC
and the gateway and is the time for handling and
processing the incoming message by the DsC (i.e., parsing
and analyzing an incoming message then recording SThs‟
values in the dataset). Boonsawat et al. [37] calculate the
pulling time delay using the function millis() of the Arduino
library, which returns the number of milliseconds since the
Arduino board began running the current program (last
reset) [22], it is used for realizing the distance between the
coordinator and the end-devices [37].
Practically, estimating the actual reading time of a STh
can be done in two ways: (1) SThs send actual time (sensing
time) included in their messages after clock synchronization
between discovered gateways and the DsC (clock
synchronization can be done using the DateTime library
[42]) and (2) calculating the time that the message consumes
starting from its initialization to its recording. In the case of
periodical requests, DsC firstly sends rules to selected
gateways so that they adjust their configurations. After that,
gateways send SThs‟ readings periodically according to the
time defined in the DsC rules. The DsC sends requests
every X seconds to all discovered gateways and waits for
them to send their messages back. In that case, message
latency is equal to the difference in time between message
receiving time at the DsC and request sending time at the
DsC as well. For example, if request sending time is
14:22:20 and message receiving time is 14:22:25, then the
latency is 5 seconds.
Gateway latency, , is computed as the average of all
latencies that have occurred in all messages of all SThs
connected to the gateway. We are using the average as an
example statistic for simplicity; for more accurate results,
the 50th
percentile or the interquartile mean can be used
instead, using straightforward modification in the equations.
∑ (
∑
)
(2)
where k is the number of SThs connected to the gateway and
nj is the number of recorded values for STh j. the formula
(
∑
) represents the average latencies for
STh j. In the case of datasets generated by pulling (the rule
EstimatedTime_All_Network), the value of nj should be
identical for all SThs on each gateway. Then, Equation (2)
becomes:
∑ ∑
(3)
Message Integrity Error (MsgIE) is the ratio between
the number of received messages by the DsC and the
number of sent messages by the gateways.
477
International Journal on Advances in Intelligent Systems, vol 8 no 3 & 4, year 2015, http://www.iariajournals.org/intelligent_systems/
2015, © Copyright by authors, Published under agreement with IARIA - www.iaria.org
(∑
(
)) (4)
where l is number of discovered gateways in the testbed,
is the number of messages sent by gateway GWi (in the
pulling case, all gateways ideally send an equal number of
messages), is the start recording time, is the finish
recording time ( and are in milliseconds), and p is the
interval for sending and receiving messages periodically.
The formula (
) represents the number of messages
that should be received and handled by the DsC when there
is no error.
Synchronizing DsC‟s clock with all discovered
gateways produces no clock synchronization errors. In that
case, the actual reading time of each STh reading can be
written inside the message and recorded into the dataset.
But, when messages do not contain the reading time due to
difficulties in clock synchronization, then the receiving time
is used to estimate the STh reading time. So, the
Synchronization Time Error (SynTE) is computed as
follows:
(
∑
) (5)
where is the latency of gateway i, l the number of
discovered gateways in the WoT testbed, and p the interval
between two consecutive messages that come from the same
gateway (i.e., gateway waits the time interval p to send one
message containing all SThs‟ readings).
Because dataset Accuracy ( ) depends on two
factors as mentioned above (time accuracy in which STh
reading is written and integrity of dataset contents), then
is computed by the following equation:
( ) (6)
B. Experiment setup
A large number of SThs in the WoT testbed produces
less dataset accuracy due to network communication
overhead and overwhelming the capabilities of the DsC to
handle and process all incoming messages. Receiving a
single message from each gateway (responsible for a group
of SThs) is more desirable and is adopted in our testbed.
Evaluation of the WoT testbed was done by running the
DsC application on a machine (base-station) with 8 GB
RAM and core-i5 CPU running at 2.3 GHz. The DsC and
gateways send and receive at a baud rate of 9600 bps. The
first gateway (of type Arduino-Uno) is at a distance of 10m
from the DsC, the second gateway (of type Arduino-
Mega256) is at a distance of 15m, and the third one (of type
Netduino2) is connected directly to the DsC through the SPI
bus. All nodes in the testbed instance were configured in a
star topology, so the maximum number of nodes in each
path is 2 and the number of edges is one (i.e., a direct link
between the DsC and each gateway in the network). The
gateway of type Arduino-Uno had message size ≈ 6 bytes
and Arduino-Mega ≈ 10 bytes.
Two fundamental approaches were used for getting
sensor data in the testbed, pull and push [10], represented as
the rules EstimatedTime_All_Network and ChangesOnly,
respectively. In this paper, we focus more on the pull
approach and measure the time accuracy as the time interval
between reading and recording SThs‟ values. We note that
the rule EstimatedTime_All_Network (pull) generates more
data and is expected to affect the time accuracy more than
the ChangesOnly rule; the dataset from pull contains the
information generated by the rule ChangesOnly (push) in
addition to repetitions of steady readings over the time.
C. Results using EstimatedTime_All_Network rule
DsC pulls SThs‟ information by implementing the rule
EstimatedTime_All_Network to generate a dataset for all
connected devices on all the discovered gateways. Each
discovered gateway in the WoT periodically sends one
message every 1000 ms containing all SThs‟ values (i.e., the
expected number of messages that all selected gateways can
send is not known at the beginning).
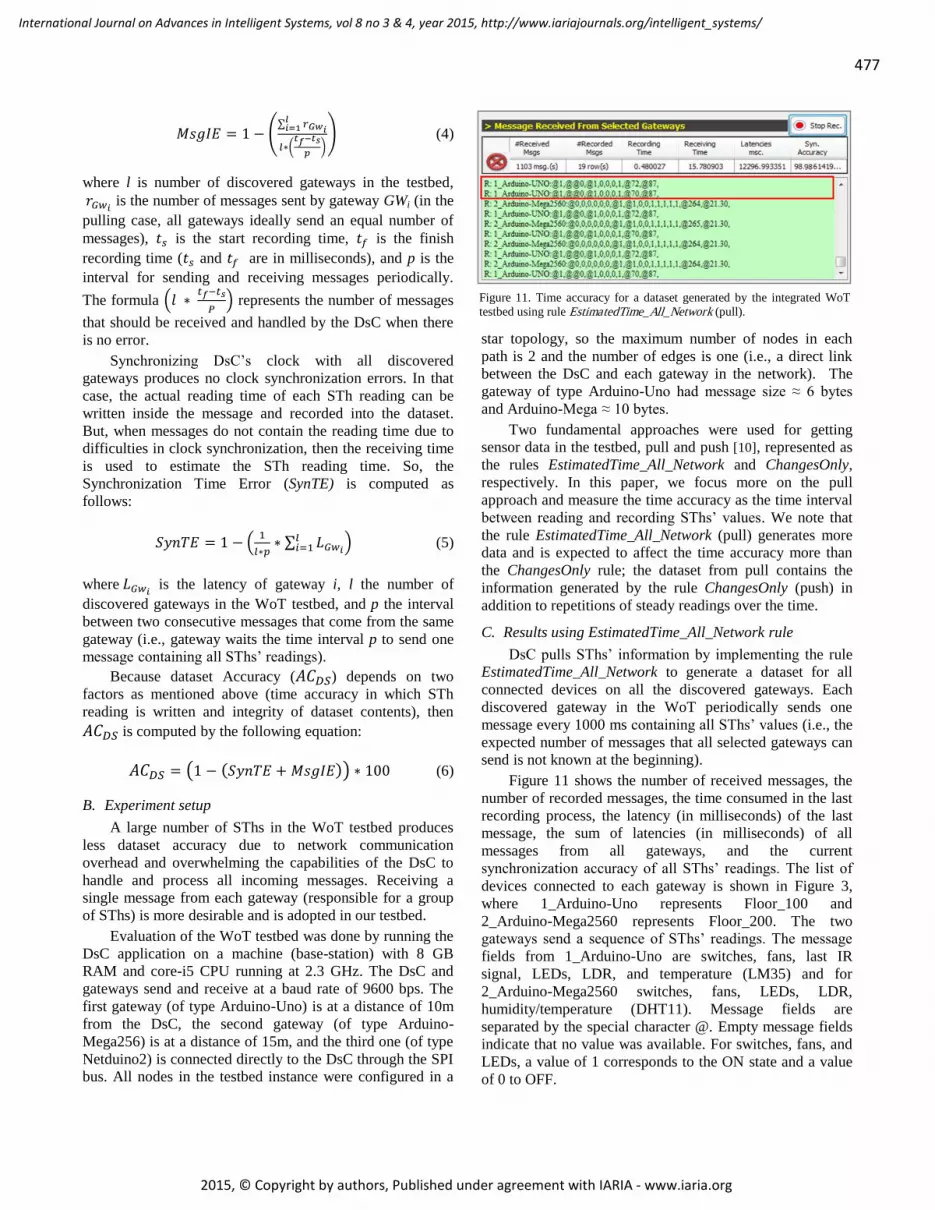
Figure 11 shows the number of received messages, the
number of recorded messages, the time consumed in the last
recording process, the latency (in milliseconds) of the last
message, the sum of latencies (in milliseconds) of all
messages from all gateways, and the current
synchronization accuracy of all SThs‟ readings. The list of
devices connected to each gateway is shown in Figure 3,
where 1_Arduino-Uno represents Floor_100 and
2_Arduino-Mega2560 represents Floor_200. The two
gateways send a sequence of SThs‟ readings. The message
fields from 1_Arduino-Uno are switches, fans, last IR
signal, LEDs, LDR, and temperature (LM35) and for
2_Arduino-Mega2560 switches, fans, LEDs, LDR,
humidity/temperature (DHT11). Message fields are
separated by the special character @. Empty message fields
indicate that no value was available. For switches, fans, and
LEDs, a value of 1 corresponds to the ON state and a value
of 0 to OFF.
Figure 11. Time accuracy for a dataset generated by the integrated WoT
testbed using rule EstimatedTime_All_Network (pull).
478
International Journal on Advances in Intelligent Systems, vol 8 no 3 & 4, year 2015, http://www.iariajournals.org/intelligent_systems/
2015, © Copyright by authors, Published under agreement with IARIA - www.iaria.org
As shown in Figure 11, the DsC received two messages
back-to-back from the gateway 1_Arduino-Uno. This was
due to gateway 1_Arduino-Uno being closer to the DsC
than the other gateway as indicated by a stronger Received
Signal Strength Indicator (RSSI). RSSI was measured in
decibels using Digi‟s X-CTU software to determine signal
noise, and its value ranges from 0 to 120; the closer it is to
zero, the stronger is the signal.
Figure 11 shows an example of applying Equation (6)
to calculate the . In this experiment, p=1000 ms,
=05:01:10 and =05:10:22. The total number of received
messages from all gateways was 1103 messages, and the
total latency time was approximately 12297 ms, yielding
about 11.14 ms of latency per message. The latency
included the processing time at the DsC for each received
message and the network delay. The testbed produced the
dataset with ≈ 98.98%, where SynTE =0.999% and
MsgIE = 0.011%. We note that when reading time is sent
with SThs‟ values, then SynTE=0%, but the message size
will increase, which in turn may increase message loss rate
and MsgIE. Results of [43] confirm our measurements.
D. Results using ChangesOnly rule
When the ChangesOnly rule is used, message size has a
direct relation to the number of SThs that detect change at
the same time or within the same check period. This is
because SThs push their information only when certain
changes happen in their states and gateways check
periodically for changes in SThs‟ values. The maximum
message size is reached when all SThs of a certain gateway
detect change at the same time, which is equivalent to the
message size in the pull approach.
We ran an experiment in which gateways check SThs‟
values for change every 1000 ms. we found that most of the
time message size was small, so we decided to send the
reading time within the message. Implementing the system
this way produced SynTE = 0% with a small MsgIE and
with small message parsing and processing overhead at the
DsC. Because the expected number of messages is not
known at the beginning, MsgIE can be measured using
Equation 4 provided that all gateways send their total
number of sent messages periodically in SYNC messages.
E. Results Discussion
As can be concluded from the previous results, dataset
accuracy depends on the network overhead, which in turn
depends on the pull period, p, and on the number of
gateways and SThs in the testbed. The DsC application
allows for setting the pull period, as shown in Figure 9 (c).
If the number of SThs is too large and state changes occur
only sporadically affecting a limited number of SThs then it
is desirable to use the ChangesOnly rule to produce more
accurate and smaller dataset.
As mentioned previously, there are two methods to
estimate actual STh reading time. The first method requires
clock synchronization between the DsC and all testbed
gateways. SThs‟ readings are recorded in the dataset with
the time written within the message. But recording the
reading time within the message increases message size and
time required for parsing and analyzing the message body,
which then causes increased network overload, especially
when the number of gateways and SThs connected to them
is large. The messages thus come from gateways with low
RSSI and can be lost easily. The first method is desirable if
accuracy of data synchronization is critical, especially when
the ChangesOnly rule is used for dataset generation.
The second method consumes less time for parsing and
analyzing message body and reduces message size. It can be
used with the EstimatedTime_All_Network rule. If dataset
accuracy is not critical or time scale of reading accuracy is
larger than that of which latency occurs (e.g., if device
synchronization is sensitive on the days‟ time scale and the
delay in recording messages is in seconds or minutes), then
the second method can be used. The second method can be
augmented by a mechanism to estimate message latency
using echo request and reply.
Table IV summarizes the differences between the two
methods.
TABLE IV. COMPARISON OF ACTUAL STH READING-TIME ESTIMATION
METHODS.
Criteria in-message calculated
Main idea Synchronizing DsC‟s clock with all selected gateways
Computing time
difference between reading time and
recording time
Reading and
receiving time delay
Reading time is sent within the message body.
Recording time= reading
time
Recording time =
actual reading time + latency
Dataset
accuracy
depends only on MsgIE, which depends mainly on
weak RSSI
depends on SynTE and
MsgIE
Dataset error
in the pull
case
Dataset accuracy is estimated using Equation (6)
SynTE = 0% SynTE is estimated
using Equation (5)
Dataset error in the push
case
All gateways send their total number of sent
messages to measure MsgIE using Equation (4).
SynTE = 0% SynTE is estimated
using Equation (5)
Pros More accurate
Smaller messages
faster message
parsing and analysis
Cons
Larger messages (by about 2 bytes)
slower message parsing and analysis
SynTE > 0%
VI. CASE STUDY
In this section, a case study of the proposed WoT
testbed is described.
A. Using WoT Dataset for information analysis
Using the generated dataset, researchers can analyze
sensor data collected using multiple controlled scenarios. A
479
International Journal on Advances in Intelligent Systems, vol 8 no 3 & 4, year 2015, http://www.iariajournals.org/intelligent_systems/
2015, © Copyright by authors, Published under agreement with IARIA - www.iaria.org
lot of experiment scenarios can be achieved on the testbed,
such as comparing the state of devices on certain gateways
(e.g., gateways of a room), comparing state of devices on all
gateways (e.g., all gateways of a building), getting live time
of each device and high level power consumption in daily
live to provide suggestions related to energy efficiency
achievement (i.e., Energy awareness through interactive
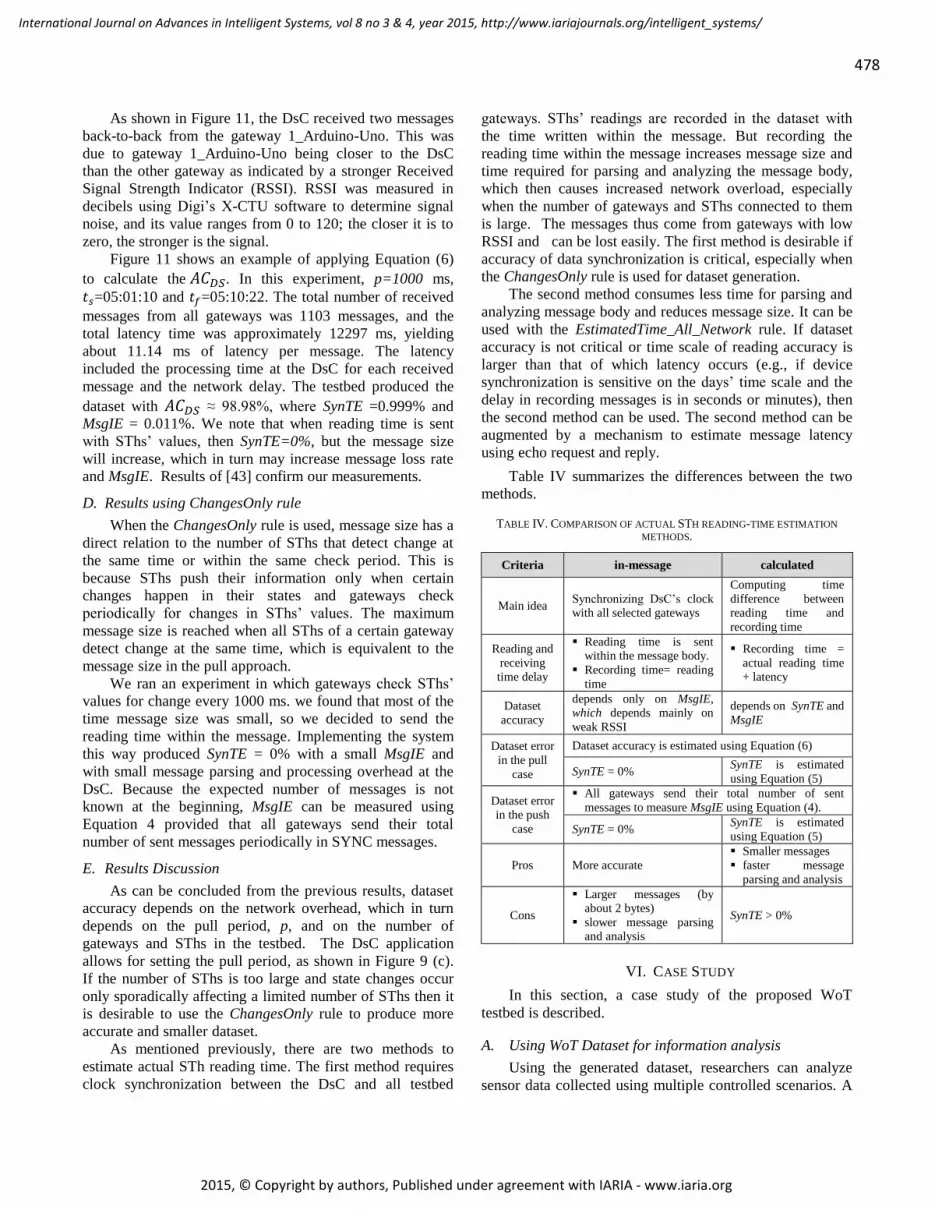
user feedback). Figure 12 shows a comparison between
devices of type „Lamp‟ for analysis of power consumption.
Y-axis represents consumed voltages percent and X-axis
represents time.
Estimation on timing accuracy of the data hasn‟t been
measured yet, but after enlarging WoT scale, DsC can
estimate timing accuracy by calculating request and receive
time for each device. In general, such a dataset, especially
composed of dynamic information, will be helpful for
computing Fuzzy-based sensor similarity [18], and for
running prediction algorithms on real information that are
used in searching about SThs and EoIs in the WoT.
Providing information about SThs and EoIs in multiple
formats with additional attributes like logical paths expands
experimental work in this area.
B. Browsing WoT
Building simple and physical WoT (offline or online)
will be helpful and more accurate than using simulators.
Figure 2 shows a scenario of calling RESTful web services
for pulling information about buildings and their devices
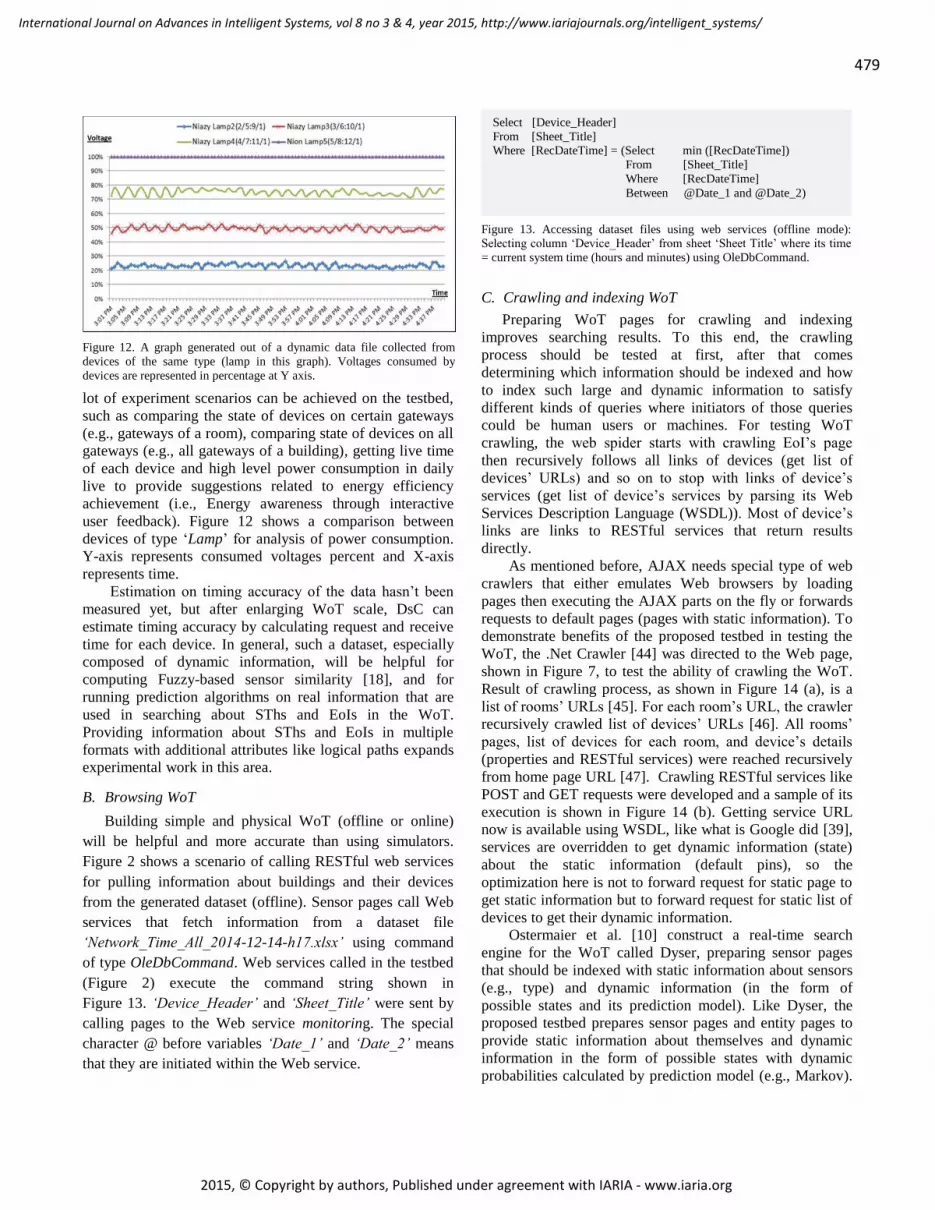
from the generated dataset (offline). Sensor pages call Web
services that fetch information from a dataset file
‘Network_Time_All_2014-12-14-h17.xlsx’ using command
of type OleDbCommand. Web services called in the testbed
(Figure 2) execute the command string shown in
Figure 13. ‘Device_Header’ and ‘Sheet_Title’ were sent by
calling pages to the Web service monitoring. The special
character @ before variables ‘Date_1’ and ‘Date_2’ means
that they are initiated within the Web service.
C. Crawling and indexing WoT
Preparing WoT pages for crawling and indexing
improves searching results. To this end, the crawling
process should be tested at first, after that comes
determining which information should be indexed and how
to index such large and dynamic information to satisfy
different kinds of queries where initiators of those queries
could be human users or machines. For testing WoT
crawling, the web spider starts with crawling EoI‟s page
then recursively follows all links of devices (get list of
devices‟ URLs) and so on to stop with links of device‟s
services (get list of device‟s services by parsing its Web
Services Description Language (WSDL)). Most of device‟s
links are links to RESTful services that return results
directly.
As mentioned before, AJAX needs special type of web
crawlers that either emulates Web browsers by loading
pages then executing the AJAX parts on the fly or forwards
requests to default pages (pages with static information). To
demonstrate benefits of the proposed testbed in testing the
WoT, the .Net Crawler [44] was directed to the Web page,
shown in Figure 7, to test the ability of crawling the WoT.
Result of crawling process, as shown in Figure 14 (a), is a
list of rooms‟ URLs [45]. For each room‟s URL, the crawler
recursively crawled list of devices‟ URLs [46]. All rooms‟
pages, list of devices for each room, and device‟s details
(properties and RESTful services) were reached recursively
from home page URL [47]. Crawling RESTful services like
POST and GET requests were developed and a sample of its
execution is shown in Figure 14 (b). Getting service URL
now is available using WSDL, like what is Google did [39],
services are overridden to get dynamic information (state)
about the static information (default pins), so the
optimization here is not to forward request for static page to
get static information but to forward request for static list of
devices to get their dynamic information.
Ostermaier et al. [10] construct a real-time search
engine for the WoT called Dyser, preparing sensor pages
that should be indexed with static information about sensors
(e.g., type) and dynamic information (in the form of
possible states and its prediction model). Like Dyser, the
proposed testbed prepares sensor pages and entity pages to
provide static information about themselves and dynamic
information in the form of possible states with dynamic
probabilities calculated by prediction model (e.g., Markov).
Figure 12. A graph generated out of a dynamic data file collected from
devices of the same type (lamp in this graph). Voltages consumed by
devices are represented in percentage at Y axis.
Select [Device_Header]
From [Sheet_Title] Where [RecDateTime] = (Select min ([RecDateTime])
From [Sheet_Title]
Where [RecDateTime]
Between @Date_1 and @Date_2)
Figure 13. Accessing dataset files using web services (offline mode): Selecting column ‘Device_Header’ from sheet ‘Sheet Title’ where its time
= current system time (hours and minutes) using OleDbCommand.

480
International Journal on Advances in Intelligent Systems, vol 8 no 3 & 4, year 2015, http://www.iariajournals.org/intelligent_systems/
2015, © Copyright by authors, Published under agreement with IARIA - www.iaria.org
Dyser prototype supports only probabilities of the possible
states not the prediction model itself as indicated in its
architecture.
According to the methodology used for searching for
SThs and EoIs, information should be prepared. For
instance, in the case of integrating the WoT with traditional
search engines, semi-static information about the WoT
should be written in rich format. Microformats and
Microdata are embedded in HTML pages (WoT pages). But,
in the case of special search engines that support queries
written in SPARQL query language, information should be
stored as RDF triples.
D. Reusing Testbed for Different IoT
The proposed testbed architecture allows the
implementation of different purposes in the WoT. If
someone has to operate the testbed for a certain environment
(for example, energy saving of smart home, detect
something unacceptable happening at a shopping mall, etc.),
and because the proposed testbed operates in two modes
(online and offline), then reusing this testbed depends on the
operation mode.
For online mode, new IoT infrastructure, which is built
by attaching resources support information about measuring
physical phenomena and actuating EoIs, is replaced by the
IoT part shown in Figure 1 (b) and registered by Network
setup application. New IoT should speak the same language
as the DsC (gateways make it easy for supporting
heterogeneity in devices).
For offline mode, such as shown in Figure 15, because
the dataset represents the IoT itself where it hosts
information about SThs, EoIs, and sensing and actuating
processes, then IoT part will be replaced by that dataset to
be accessed by web services as indicated in Figure 2. So,
offline mode could be used for retesting previously built
IoT. Moreover, it could be used like Docklight [48] for
discovering nodes in the network and testing packet transfer
delay between the coordinator and endpoint nodes in a star
topology.
VII. CONCLUSION AND FUTURE WORK
WoT has become one of the most trendy research
directions due to facilities and services provided in many
domains. Sensors can provide great benefits if their readings
are presented in a meaningful and friendly way to users and
machines. Searching for SThs and EoIs is one of the most
important services in the WoT. In this work, we presented
an evaluation of our integrated WoT testbed architecture by
empirically measuring the dataset accuracy of the generated
dataset and by qualitatively comparing our testbed to the
state-of-the-art in WoT and IoT measurement platforms.
The dataset generated from the testbed is expected to help
research on the crawling, indexing, and searching processes
in WoT. From the evaluation results, we argue that dataset
quality depends on time accuracy of SThs‟ readings.
An interesting problem for direct future work is how to
enable the DsC to help testbed users to calculate an optimal
time interval for receiving and processing messages,
according to message size, the number of discovered
gateways in the testbed, and the number of SThs connected
to them, with the goal of increasing accuracy of the dataset.
The problem of searching for SThs and EoIs depends on
the standardization of formats used for representing SThs
properties and services they offer. So, providing semantic
discovery services based on the application of multiple
discovery strategies [12] and enriching SThs meta-data may
enhance the performance of searching services in the WoT.
Creating standardized RESTful service description
embedded in HTML using microdata is feasible and
desirable [29]. Still, a few important issues remain here:
security in the WoT, the methodologies by which WoT
builders select an appropriate topology to cover an
environment with certain conditions, achieving high
performance and high accuracy, whereby the key service in
the WoT is to give users the ability to get interesting
knowledge in quickly, accurately and in an abstract form,
and how to index WoT data streams.
Figure 14. A Web spider case study for the WoT testbed. (a) Crawling pages of virtual gateways. (b) Crawling RESTful services that are
loaded dynamically using WSDL.
Figure 15. Testbed is running in offline mode (attaching IoT dataset).

481
International Journal on Advances in Intelligent Systems, vol 8 no 3 & 4, year 2015, http://www.iariajournals.org/intelligent_systems/
2015, © Copyright by authors, Published under agreement with IARIA - www.iaria.org
REFERENCES
[1] M. Younan, S. Khattab, and R. Bahgat, "An Integrated
Testbed Environment for the Web of Things," in ICNS 2015 :
The Eleventh International Conference on Networking and
Services, ISBN: 978-1-61208-404-6, Rome, Italy, May,
2015, pp. 69-78.
[2] M. Blockstrand, T. Holm, L.-Ö. Kling, R. Skog, and B.
Wallin. (2011, Feb.) Operator opportunities in the internet of
things – getting closer to the vision of more than 50 billion
connected devices. [Online].
http://www.ericsson.com/news/110211_edcp_244188811_c
[3] L. Coetzee and J. Eksteen, "The Internet of Things – Promise
for the Future ? An Introduction," in IST-Africa Conference,
Gaborone, May 2011, pp. 1-9.
[4] WS4D Initiative. (2010, Aug.) WS4D-uDPWS - The Devices
Profile for Web Services (DPWS) for highly resource-
constrained devices. [Online].
http://code.google.com/p/udpws/wiki/IntroductionGeneral
[5] G. Werner-Allen, P. Swieskowski, and M. Welsh, "MoteLab:
A Wireless Sensor Network Testbed," in Information
Processing in Sensor Networks, 2005. IPSN 2005. Fourth
International Symposium on, Boise, ID, USA, 2005, pp. 483-
488.
[6] S. Haller, "The Things in the Internet of Things," Poster at
the (IoT 2010). Tokyo, Japan, vol. 5, no. 26, p. 4, Nov. 2010.
[7] I. Muhammad, A. Md Said, and H. Hasbulla, "A Survey of
Simulators, Emulators and Testbeds for Wireless Sensor
Networks," in nformation Technology (ITSim), 2010
International Symposium in, vol. 2, Kuala Lumpur, June
2010, pp. 897-902.
[8] A. Gluhak, S. Krco, M. Nati, D. Pfisterer, N. Mitton, and T.
Razafindralambo, "A Survey on Facilities for Experimental
Internet of Things Research.," IEEE Communications
Magazine, Institute of Electrical and Electronics Engineers
(IEEE), no. <10.1109/MCOM.2011.6069710>. <inria-
00630092>, pp. 58-67, 2011, 49 (11).
[9] J. Miloš , N. Zogović, and G. Dimić, "Evaluation of Wireless
Sensor Network Simulators," in the 17th
Telecommunications Forum (TELFOR 2009), Belgrade,
Serbia, 2009, pp. 1303-1306.
[10] B. Ostermaier, B. M. Elahi, K. Römer, M. Fahrmair, and W.
Kellerer, "A Real-Time Search Engine for the Web of
Things," in The 2nd IEEE International Conference on the
Internet of Things (IoT), Tokyo,Japan, Nov. 2010, pp. 1-8.
[11] shodan search engine. [Online]. www.shodanhq.com,
(Accessed: 10 April 2015).
[12] S. Mayer and D. Guinard, "An Extensible Discovery Service
for Smart Things," in Proceedings of the 2nd International
Workshop on the Web of Things (WoT 2011), ACM, San
Francisco, CA, USA, June 2011, pp. 7-12.
[13] H. Sundani, H. Li, V. K. Devabhaktuni, M. Alam, and P.
Bhattacharya, "Wireless Sensor Network Simulators - A
Survey and Comparisons," International Journal Of Computer
Networks (IJCN), vol. 2, no. 6, pp. 249-265, Feb. 2011.
[14] P. Bodik, C. Guestrin, W. Hong, S. Madden, M. Paskin, and
R. Thibaux. (2004, Apr.) Intel Lab Data. [Online].
http://www.select.cs.cmu.edu/data/labapp3/index.html,
(Accessed: 10 April 2015).
[15] D. Gay, P. Levis, D. Culler, E. Brewer, M. Welsh, and R. von
Behren, "The nesC language: A holistic approach to
networked embedded systems," in PLDI '03 Proceedings of
the ACM SIGPLAN 2003 conference on Programming
language design and implementation, New York, NY, USA,
May 2003, pp. 1-11.
[16] P. Levis, S. Madden, J. Polastre, R. Szewczyk, K.
Whitehouse, and A. Woo, "TinyOS: An Operating System for
Sensor Networks," in Ambient Intelligence, W. Weber, J. M.
Rabaey, and E. Aarts, Eds. Springer Berlin Heidelberg, 2005,
ch. 2, pp. 115-148.
[17] h. b. T. AS IS. Contiki: The Open Source OS for the Internet
of Things. [Online]. http://www.contiki-os.org/
[18] C. Truong, K. Romer, and K. Chen, "Sensor Similarity
Search in the Web of Things," in In World of Wireless,
Mobile and Multimedia Networks (WoWMoM), 2012 IEEE
International Symposium, San Francisco, CA, June 2012, pp.
1-6.
[19] M. Nati, A. Gluhak, H. Abangar, and W. Headley,
"SmartCampus: A user-centric testbed for Internet of Things
experimentation," in Wireless Personal Multimedia
Communications (WPMC), 2013 16th International
Symposium on, Atlantic City, NJ, June 2013, pp. 1-6.
[20] G. Mujica, V. Rosello, J. Portilla, and T. Riesgo, "Hardware-
Software Integration Platform for a WSN Testbed Based on
Cookies Nodes," in IECON 2012 - 38th Annual Conference
on IEEE Industrial Electronics Society , Montreal, QC,
October. 2012, pp. 6013-6018.
[21] H. Nam, J. Janak, and H. Schulzrinne, "Connecting the
Physical World with Arduino in SECE," Computer Science
Technical Reports, Department of Computer Science,
Columbia University, New York, Technical Reporting
CUCS-013-13, 2013.
[22] Arduino. [Online]. http://www.arduino.cc/, (Accessed: 10
April 2014).
[23] I. LogMeIn. Xively. [Online]. http://www.Xively.com ,
(Accessed: 10 April 2014).
[24] Powered by ioBridge. ThingSpeak- The open data platform
for the Internet of Things.. [Online].
http://www.thingspeak.com, (Accessed: 10 April 2015).
[25] X. Inc. (2012, Jan.) XMPro Internet of Things. [Online].
482
International Journal on Advances in Intelligent Systems, vol 8 no 3 & 4, year 2015, http://www.iariajournals.org/intelligent_systems/
2015, © Copyright by authors, Published under agreement with IARIA - www.iaria.org
http://xmpro.com/xmpro-iot/, (Accessed: 10 April 2015).
[26] Dr. M. Elkstein. (2014, Nov.) Learn REST: A Tutorial.
[Online]. http://rest.elkstein.org/2008/02/what-is-rest.html ,
(Accessed: 10 April 2015).
[27] C. Pfister, "The Internet of Things," in Getting Started with
the Internet of Things: Connecting Sensors and
Microcontrollers to the Cloud, B. Jepson, Ed. United States
of America.: O‟Reilly Media, Inc., 2011, ch. 4, pp. 29-41.
[28] S. Mayer, D. Guinard, and V. Trifa, "Searching in a Web-
based Infrastructure for Smart Things," in Proceedings of the
3rd International Conference on .,the Internet of Things (IoT
2012),IEEE, Wuxi, China, October 2012, pp. 119-126.
[29] S. Mayer, "Service Integration - A Web of Things
Perspective," in W3C Workshop on Data and Services
Integration, Citeseer, Bedford, MA, USA, October 2011, pp.
1-5.
[30] SensLab. [Online]. http://www.senslab.info.
[31] D. Guinard, "A Web of Things Application Architecture -
Integrating the Real-World into the Web," PhD Thesis,
Computer Science, Eidgenössische Technische Hochschule
ETH Zürich, Zürich, 2011.
[32] D. Guinard, V. Trifa, S. Karnouskos, and D. Savio,
"Interacting with the SOA-Based Internet of Things:
Discovery, Query, Selection, and On-Demand Provisioning
of Web Services," Services Computing, IEEE Transactions
on, vol. 3, no. 3, pp. 223-235, Sep. 2010.
[33] D. Guinard and V. Trifa, "Towards the Web of Things: Web
mashups for embedded devices," in in Workshop on
Mashups, Enterprise Mashups and Lightweight Composition
on the Web (MEM 2009), in proceedings of WWW
(International World Wide Web Conferences), Madrid,
Spain, 2009, p. 15.
[34] R. Faludi, Building Wireless Sensor Networks, 1st ed., B.
Jepson, Ed. Tokyo, United States of America: O‟Reilly
Media, Inc., 1005 Gravenstein Highway North, Sebastopol,
CA 95472., 2011.
[35] A. McEwen and H. Cassimally, Designing the Internet of
Things, 1st ed., C. Hutchinson, Ed. John Wiley & Sons,
November 2013,
https://books.google.com.eg/books?id=oflQAQAAQBAJ.
[36] Digi International Inc. Official XBee website- Connect
Devices to the Cloud. [Online]. http://www.digi.com/xbee,
(Accessed: April 2015).
[37] V. Boonsawat, J. Ekchamanonta, K. Bumrungkhet, and S.
Kittipiyakul, "XBee wireless sensor networks for temperature
monitoring.," in the second conference on application
research and development (ECTI-CARD 2010), Chon Buri,
Thailand, May, 2010, pp. 221-226.
[38] Digi International Inc. Digi. [Online].
http://www.digi.com/products/xbee-rf-solutions/xctu-
software/xctu, (Accessed: November 2015).
[39] Google. (2010, Jan.) Search Engine Optimization (SEO) -
Starter Guide
[40] P. Suganthan G C, "AJAX Crawler," in Data Science &
Engineering (ICDSE), 2012 International Conference on.
IEEE, Cochin, Kerala, July 2012, pp. 27-30.
[41] wikipedia, Web Services Description Language. [Online].
http://en.wikipedia.org/wiki/Web_Services_Description_Lan
guage, (Accessed: November 2014).
[42] M. Margolis. Electronic Projects Components Available
WorldWide (PJRC)-DateTime Library. [Online].
https://www.pjrc.com/teensy/td_libs_DateTime.html,
(Accessed: April 2015).
[43] G. Randolph and N. Hirsch. (2010, Mar.) PIC32MX: XBee
Wireless Round-trip Latency. [Online].
http://hades.mech.northwestern.edu/index.php/PIC32MX:_X
Bee_Wireless_Round-trip_Latency
[44] H. Mostafa. (2006, Mar.) Code Project. [Online].
http://www.codeproject.com/Articles/13486/A-Simple-
Crawler-Using-C-Sockets, (Accessed: 10 April 2015).
[45] http://localhost:62912/R_Devices.aspx?Id=4, (Accessed: 10
November 2015)
[46] http://localhost:62912/D_Details.aspx?Id=1, (Accessed: 10
November 2015)
[47] http://localhost:62912/Default.aspx, (Accessed: 10 November
2015)
[48] Flachmann und Heggelbacher GbR. (2015, Aug.) docklight.
[Online]. http://docklight.de/, (Accessed: 10 November 2015)