evaluation of adaptive systems
TRANSCRIPT

A Dissertation Presented to the Faculty I of the University of TrierIn Partial Fulfillment of the Requirements for the Degree
Doktor der Naturwissenschaften
Evaluation of Adaptive Systems
by
Stephan WeibelzahlGraduate Programme Human and Machine Intelligence
Kunzenweg 21
University of Education Freiburg
79117 Freiburg
October 2002

Stephan WeibelzahlEvaluation of Adaptive SystemsTrier, 2003
Gutachter: Prof. Dr. Gerhard Weber, Prof. Dr. Karl F. Wender, Prof. Dr. AnthonyJamesonDissertationsort: Trier
Contents
Introduction 13
1. Adaptive Systems 171.1. Functions and Definition of Adaptivity . . . . . . . . . . . . . . . . 171.2. Models of Adaptivity . . . . . . . . . . . . . . . . . . . . . . . . . 20
1.2.1. Acquisition of Input Data . . . . . . . . . . . . . . . . . . . 221.2.2. Inference of User Properties . . . . . . . . . . . . . . . . . 241.2.3. Adaptation Decision . . . . . . . . . . . . . . . . . . . . . 24
2. Empirical Evaluation 252.1. Software Evaluation . . . . . . . . . . . . . . . . . . . . . . . . . . 252.2. Advantages: Why Empirical Evaluations are needed . . . . . . . . . 272.3. Limits: Where Empirical Evaluations fail . . . . . . . . . . . . . . 272.4. Usability as Evaluation Criterion . . . . . . . . . . . . . . . . . . . 28
3. Current Evaluations of Adaptive Systems 313.1. Systematic Synopsis . . . . . . . . . . . . . . . . . . . . . . . . . 313.2. Current Methods and Criteria . . . . . . . . . . . . . . . . . . . . 353.3. Problems in Evaluating Adaptive Systems . . . . . . . . . . . . . . 433.4. Developing a Database of Empirical Evaluations . . . . . . . . . . 44
3.4.1. Aims . . . . . . . . . . . . . . . . . . . . . . . . . . . . . 443.4.2. Online Interface . . . . . . . . . . . . . . . . . . . . . . . 453.4.3. Implementation and Maintenance . . . . . . . . . . . . . . 45
4. A Framework for the Evaluation of Adaptive Systems 494.1. Objectives and Scope of the Framework . . . . . . . . . . . . . . . 494.2. Framework-Structure . . . . . . . . . . . . . . . . . . . . . . . . . 50
4.2.1. Evaluation of Input Data . . . . . . . . . . . . . . . . . . . 504.2.2. Evaluation of Inference . . . . . . . . . . . . . . . . . . . . 524.2.3. Evaluation of Adaptation Decision . . . . . . . . . . . . . . 53
3

Contents
4.2.4. Evaluation of Total Interaction . . . . . . . . . . . . . . . . 534.3. Evaluation Procedure . . . . . . . . . . . . . . . . . . . . . . . . . 554.4. Methods and Criteria for the Evaluation Framework . . . . . . . . . 55
4.4.1. Categorization of Current Methods and Criteria . . . . . . . 564.4.2. Structural Characteristics of the Domain Model . . . . . . 564.4.3. Behavioral Complexity . . . . . . . . . . . . . . . . . . . . 66
4.5. The Framework as Categorization Grid . . . . . . . . . . . . . . . . 734.6. Related Work . . . . . . . . . . . . . . . . . . . . . . . . . . . . . 75
5. Empirical Evaluation of an Adaptive Web-Based Learning Course77
5.1. NetCoach Courses . . . . . . . . . . . . . . . . . . . . . . . . . . 775.1.1. Assessing the learner . . . . . . . . . . . . . . . . . . . . . 795.1.2. Inference Mechanism . . . . . . . . . . . . . . . . . . . . 805.1.3. Adaptation Decision . . . . . . . . . . . . . . . . . . . . . 835.1.4. Overview of existing courses . . . . . . . . . . . . . . . . . 84
5.2. The HTML-Tutor . . . . . . . . . . . . . . . . . . . . . . . . . . . 855.2.1. Course Description . . . . . . . . . . . . . . . . . . . . . . 855.2.2. Overview of Evaluation Studies with the HTML-Tutor . . . 89
5.3. Evaluation of Input Data . . . . . . . . . . . . . . . . . . . . . . . 915.3.1. Method and Criteria . . . . . . . . . . . . . . . . . . . . . 915.3.2. Results . . . . . . . . . . . . . . . . . . . . . . . . . . . . 945.3.3. Discussion of Input Data . . . . . . . . . . . . . . . . . . . 96
5.4. Evaluation of Inference . . . . . . . . . . . . . . . . . . . . . . . . 965.4.1. Assessing the Learner’s Current Knowledge . . . . . . . . 975.4.2. Assessing the Learner’s Behavior . . . . . . . . . . . . . . 1005.4.3. Discussion of Inference . . . . . . . . . . . . . . . . . . . . 104
5.5. Evaluation of Adaptation Decision . . . . . . . . . . . . . . . . . . 1045.5.1. Adapting to the Learners’ Prior Knowledge . . . . . . . . . 1055.5.2. Comparison of Different Adaptation Decisions . . . . . . . 1095.5.3. Discussion of Adaptation Decision . . . . . . . . . . . . . . 115
5.6. Evaluation of Total Interaction . . . . . . . . . . . . . . . . . . . . 1165.6.1. System Behavior . . . . . . . . . . . . . . . . . . . . . . . 1165.6.2. User Behavior and Usability . . . . . . . . . . . . . . . . . 1185.6.3. Discussion of Total Interaction . . . . . . . . . . . . . . . . 118
6. Discussion 1196.1. Generalization of experimental results . . . . . . . . . . . . . . . . 119
6.1.1. Implications for Adaptive Learning Systems . . . . . . . . . 119
4

Contents
6.1.2. Implications for Adaptive Systems in General . . . . . . . . 1216.2. Discussion of the Evaluation Framework . . . . . . . . . . . . . . . 121
6.2.1. Experiences with the Framework . . . . . . . . . . . . . . . 1226.2.2. Applicability of the Framework to Other Systems . . . . . . 122
6.3. Future Perspectives . . . . . . . . . . . . . . . . . . . . . . . . . . 123
Appendix 125
A. Description of the HTML Tutor 127A.1. Table of Contents . . . . . . . . . . . . . . . . . . . . . . . . . . . 127A.2. Structure of Prerequisite Relations . . . . . . . . . . . . . . . . . . 132A.3. Structure of Inference Relations . . . . . . . . . . . . . . . . . . . 133
B. Post-Test 135
C. The C-Contingency-Coefficient 139
Bibliography 141
Author Index 163
5

Contents
6

List of Figures
1.1. Benyon and Murray’s proposal for an architecture of adaptive systems 211.2. Jameson’s proposal for an architecture of adaptive systems . . . . . 231.3. Architecture of adaptive systems . . . . . . . . . . . . . . . . . . . 23
3.1. Relation of evaluation studies and evaluated systems . . . . . . . . 323.2. Description of the system categorization . . . . . . . . . . . . . . . 333.3. Description of the study categorization . . . . . . . . . . . . . . . . 343.4. Additional information for experimental studies . . . . . . . . . . . 353.5. Alphabetical index of evaluation studies and system (part I) . . . . . 403.6. Alphabetical index of evaluation studies and system (part II) . . . . 413.7. Online interface of EASy–D . . . . . . . . . . . . . . . . . . . . . 46
4.1. Framework for the evaluation of adaptive systems . . . . . . . . . . 514.2. Categorization of current criteria . . . . . . . . . . . . . . . . . . . 574.3. Categorization of current methods . . . . . . . . . . . . . . . . . . 584.4. Example of a state-transition-network . . . . . . . . . . . . . . . . 68
5.1. Snapshot of the HTML-Tutor . . . . . . . . . . . . . . . . . . . . . 785.2. Architecture of NetCoach courses . . . . . . . . . . . . . . . . . . 805.3. Example of a student’s overlay model . . . . . . . . . . . . . . . . 835.4. Example of a three test items types . . . . . . . . . . . . . . . . . . 875.5. Example of a feedback to a false answer . . . . . . . . . . . . . . . 885.6. Empirical difficulty of test items . . . . . . . . . . . . . . . . . . . 945.7. Retest reliability of test items . . . . . . . . . . . . . . . . . . . . . 955.8. Example of a multiple choice test item . . . . . . . . . . . . . . . . 965.9. Congruence of assumptions and external test . . . . . . . . . . . . . 995.10. Mean proportion of correct responses to test items . . . . . . . . . . 1025.11. Duration of interaction in dependence of pre-tests . . . . . . . . . . 1065.12. Correct responses in the post-test in dependence of pre-tests . . . . 1075.13. Dropouts in HTML-Tutor . . . . . . . . . . . . . . . . . . . . . . . 111
7

List of Figures
5.14. Dropouts in RR2000 . . . . . . . . . . . . . . . . . . . . . . . . . 112
8
List of Tables
3.1. Criteria and designs of evaluation studies (part I) . . . . . . . . . . 373.2. Criteria and designs of evaluation studies (part II) . . . . . . . . . . 383.3. Sample sizes of evaluation studies. . . . . . . . . . . . . . . . . . . 393.4. Classes of measures . . . . . . . . . . . . . . . . . . . . . . . . . . 42
4.1. Example of adaptation frequencies . . . . . . . . . . . . . . . . . . 544.2. Mean values of subjective ratings and structural information of eight
NetCoach courses . . . . . . . . . . . . . . . . . . . . . . . . . . . 644.3. Correlations of structural measures with subjective ratings of course
users. . . . . . . . . . . . . . . . . . . . . . . . . . . . . . . . . . 654.4. Comparison of four complexity measures . . . . . . . . . . . . . . 714.5. Correlation of behavioral complexity with related measures . . . . . 724.6. Categorization of evaluation studies according to the evaluation
framework . . . . . . . . . . . . . . . . . . . . . . . . . . . . . . . 74
5.1. Adaptive and adaptable features of NetCoach . . . . . . . . . . . . 795.2. Possible states of a concept with a test group . . . . . . . . . . . . . 825.3. Adaptation decisions in adaptive learning systems . . . . . . . . . . 845.4. Comparison of the HTML-Tutor with other NetCoach courses . . . 865.5. Overview of evaluation studies with HTML-Tutor . . . . . . . . . . 905.6. Frequency of learning objectives . . . . . . . . . . . . . . . . . . . 925.7. Number of selected learning objectives . . . . . . . . . . . . . . . . 935.8. Congruence and incongruence of assumptions about the learner’s
knowledge and an external test . . . . . . . . . . . . . . . . . . . . 985.9. Comparison of user behavior in dependence of the assumed know-
ledge state . . . . . . . . . . . . . . . . . . . . . . . . . . . . . . . 1035.10. Frequency of result types for 38 concepts in HTML-Tutor . . . . . . 1045.11. Statistical results of 2-factor MANOVA for the effects of pre-tests . 1085.12. Mean values of number of visited concepts, visited concepts per
minute and subjective ratings . . . . . . . . . . . . . . . . . . . . . 113
9

List of Tables
5.13. Statistical results of four 2-factor ANOVAs with different adaptationdecisions for the HTML-Tutor . . . . . . . . . . . . . . . . . . . . 114
5.14. Statistical results of two 2-factor ANOVAs with different adaptationdecisions for RR2000 . . . . . . . . . . . . . . . . . . . . . . . . . 115
5.15. Number of requested pages . . . . . . . . . . . . . . . . . . . . . . 117
10

Preface
This dissertation project was started in October 1999 when I moved to Freiburg ona scholarship. Since then several people have gotten involved in my project and it ismy pleasure to thank them for their support.
First of all, very special thanks go to Gerhard Weber, who gave me invaluablefeedback whenever I needed it, and who supported me in every stage of the project.This book would probably not exist without his outstanding scientific experienceand wisdom. His award-winning authoring system NetCoach was the basis of all theevaluation studies that are presented in this work.
The scholarship of the German Research Foundation (DFG) provided me with awide scope of possibilities, thus, I was allowed to explore what I was interested in.What could be better? The graduate school on Human and Artificial Intelligence letme get a glimpse of very different research areas in computer science, psychology,cognitive science, and linguistics. I would also like to thank Gerhard Strube that Iwas allowed to attend the center of cognitive science at the University of Freiburgfor about five months. His doctoral seminar that I visited for the last three yearshas been an interesting discussion forum for various topics of cognitive science andtheory of science.
Many people gave me thoughtful advice and feedback on early dissertation pro-posals and drafts of this thesis: Daniel Friedmann, Eelco Herder, Anthony Jameson,Hans-Christian Kuhl, Stefan Lippitsch, Pia Schnorpfeil, Dr. Pia Weibelzahl, andmany others. Many anonymous reviewers had useful remarks of great worth on thepapers that I submitted to several conferences and workshops, which certainly im-proved the quality of this work.
Finally, I would like to thank Pia and Luisa for all the things they have done tomake it possible for me to complete this thesis.
Stephan WeibelzahlOctober 2002
11

12

Introduction
“Adaptive systems are systems which can alter aspects of their structure,functionality or interface in order to accommodate the differing needs ofindividuals or groups of users and the changing needs of users over time”(Benyon and Murray, 1993, p. 199).
In the early beginnings of the adaptive systems development this new approach ofsoftware individualization promised to improve human-computer interaction consid-erably. Many frequently occurring problems of usability and learnability seemed tobe easily solved. However, even today, after elaborating significantly the modelingtechniques, it is not obvious whether this promise has been kept, because only fewempirical evidence exists that supports this claim.
In fact, empirical evaluations of adaptive systems are hard to find—e.g., only aquarter of the articles published inUser Modeling and User Adapted Interaction(UMUAI) report significant empirical evaluations (Chin, 2001). Many of them in-clude a simple evaluation study with small sample sizes and often without any sta-tistical methods. Several reasons have been identified as responsible for this absence(e.g., Eklund, 1999; Höök, 2000). Besides some structural problems (e.g., shortdevelopment cycle) one of the major issues is methodological: What has to be doneto guarantee the success of adaptation? Straightforward approaches (e.g., asking theusers whether they enjoyed the interaction) frequently failed to proof an advantageof adaptive systems or suffer from low test quality.
Aim
The aim of this PhD thesis is to explore a methodology for the empirical evaluationof adaptive systems. Such a methodology consists of at least two components: First,a group of criteria that are proofed to be reliable and valid to measure adaptivity suc-cess. Probably, only a combination of several criteria will be adequately meaningful.Secondly, a specification of experimental designs and procedures is needed to applythose criteria.
13

The proposed approach is designed to be independent of the domain. We certainlydo not ignore the fact, that there are domain specific differences between systems(i.e., there are criteria that evaluate system specific goals). However, we claim thatsuch a general approach yields a methodology that is transferable to many systemsand would enable researchers to
• find system deficits and failures, e.g., to uncover wrong assumptions about theuser in the user model
• show that adaptivity in their system is useful and successful
• justify the efforts spent on making systems adaptive, because the developmentof an adaptive system still requires more exertion than building a non-adaptivesystem, though software tools simplified the implementation considerably
• point out deficits of non-adaptive systems, because the comparison of adaptiveand non-adaptive versions of a system could also identify problems of thestandard interface.
Overview
After introducing and defining adaptivity (Chapter 1) and software evaluation (Chap-ter 2), we offer a synopsis of current evaluations (Chapter 3) to outline the state ofthe art. We argue that few studies comply with methodological standards. Severalreasons for this deficit are identified (Section 3.3).
Based on this overview of current evaluations, we introduce a framework for theevaluation of adaptive systems (Chapter 4). This framework defines four layers thathave to be evaluated separately to guarantee the success of adaptivity.
The framework is then applied to the evaluation of an adaptive learning system—theHTML-Tutor—to demonstrate the framework’s usefulness (Chapter 5). Severalstudies have been conducted to evaluate each layer.
Finally, the framework is discussed in terms of its applicability, advantages andlimitations (Chapter 6).
Note that several chapters are based on workshops, conferences, and journal pa-pers that have been published by the author previously. These articles include (inchronological order)
• Weibelzahl, S. and Weber, G. (2000). Evaluation adaptiver Systeme und Ver-haltenskomplexität. In Müller, M. E. (Ed.),Adaptivität und Benutzermodel-lierung in interaktiven Softwaresystemen, ABIS-2000, Osnabrück.
14

• Weibelzahl, S. and Lauer, C. U. (2001). Framework for the evaluation of adap-tive CBR-systems. In Vollrath, I., Schmitt, S., and Reimer, U. (Eds.),Experi-ence Management as Reuse of Knowledge. Proceedings of the Ninth GermanWorkshop on Case Based Reasoning, GWCBR2001, pages 254–263. Baden-Baden: Shaker.
• Weibelzahl, S. (2001). Evaluation of adaptive systems. In Bauer, M., Gmy-trasiewicz, P. J., and Vassileva, J. (Eds.),User Modeling: Proceedings of theEighth International Conference, UM2001, pages 292–294. Berlin: Springer.
• Weber, G., Kuhl, H.-C., and Weibelzahl, S. (2001). Developing adaptive inter-net based courses with the authoring system NetCoach. In Reich, S., Tza-garakis, M. M., and de Bra, P. (Eds.),Hypermedia: Openness, StructuralAwareness, and Adaptivity, pages 226–238. Berlin: Springer.
• Weibelzahl, S. and Weber, G. (2001). A database of empirical evaluations ofadaptive systems. In Klinkenberg, R., Rüping, S., Fick, A., Henze, N., Herzog,C., Molitor, R., and Schröder, O. (Eds.),Proceedings of Workshop Lernen— Lehren — Wissen — Adaptivität (LLWA 01); research report in computerscience nr. 763, pages 302–306. University of Dortmund.
• Weibelzahl, S. and Weber, G. (2001). Mental models for navigation in adap-tive web-sites and behavioral complexity. In Arnold, T. and Herrmann, C. S.(Eds.),Proceedings of the Fifth Annual Meeting of the German Cognitive Sci-ence Society, KogWis 2001, pages 74–75. Leipzig: Leipziger Universitätsver-lag.
• Weibelzahl, S. and Weber, G. (2002). Adapting to prior knowledge of learners.In de Bra, P., Brusilovsky, P., and Conejo, R. (Eds.),Proceedings of the SecondInternational Conference on Adaptive Hypermedia and Adaptive Web BasedSystems, Málaga, Spain, AH2002, pages 448–451. Berlin: Springer.
• Weibelzahl, S., Lippitsch, S., and Weber, G. (2002). Advantages, opportuni-ties, and limits of empirical evaluations: Evaluating adaptive systems.Kün-stliche Intelligenz, 3/02, 17–20.
• Weibelzahl, S., Lippitsch, S., and Weber, G. (2002). Supporting the authoringof Adaptive Hypermedia with structural information? In Henze, N., Kókai,G., Schröder, O., and Zeidler, J. (Eds.),Personalization for the Mobile World.Proceedings of the German Workshop on Adaptivity and User Modeling inInteractive Systems, ABIS02, pages 99–105, Hannover.
15

These peer reviewed papers were a good starting point for integrating these variousaspects in a complete dissertation on the evaluation of adaptive systems.
16

1. Adaptive Systems
1.1. Functions and Definition of Adaptivity
The idea of individualizing software with user models can be traced back to theearly 80’s. While systems traditionally considered only one typical user or a fewuser stereotypes, it became more and more popular to see users as individuals withidiosyncratic preferences, needs, and tasks (Rich, 1983). Nielsen (1989) even foundthat the top three effects of the largest effects found in hypertext systems were dueto individual differences between users. Thus, an individualized system promisedto solve the most urging problems. Since these first ideas, many systems have beendeveloped in different domains, solving different problems with varying degrees ofadaptation.
Before we give an overview of these different functions of existing systems, it isimperative to define more precisely what adaptive systems are and delimit them fromsimilar concepts.
According to Oppermann (1994) a system is called adaptive "if it is able to changeits own characteristics automatically according to the user’s needs" (p. 456). Adap-tive systems consider the way the user interacts with the system and modify theinterface presentation or the system behavior accordingly. Jameson (2001) adds animportant characteristic:
A user-adaptive system is an interactive system which adapts its behav-ior to each individual user on the basis of nontrivial inferences frominformation about that user (Jameson, 2001, p. 4).
In this definition adaptivity is limited to nontrivial inferences to exclude straightfor-ward adaptations (e.g., a user might set the font color of the interface to blue andthus the system might display the font in blue). However, it is obvious that this kindof adaptations is trivial and is used regularly in all kinds of systems. We would thusrefrain from calling this behavior adaptive. In the remainder of this book a systemadaptivity
17

1. Adaptive Systems
is called adaptive only if it is an interactive system that changes its behavior de-pending on the individual user’s behavior on the basis of nontrivial inferences frominformation about the user.
Comparing this definition to those first two definitions it is important to note thatwe included an additional requirement: adaptive systems receive the informationabout the user from observations of the user. This is in accordance with Jameson’smodel of adaptation (Jameson, 2001) and we think that it is important to mentionthis fact in the definition.
Adaptivity is often confused with adaptability. A system is called adaptable, “ifadaptabilityit provides the user with tools that make it possible to change the system character-istics” (Oppermann, 1994, p. 455). For example, adaptable systems are not basedon intelligent algorithms that infer how to adapt on their own, rather they offer theflexibility to change the interface or the behavior manually according to one’s needsor preferences. The adaptation decision is left to the user.
Both adaptivity and adaptability are often summarized by the term personalizationpersona-lization (Jameson, 2001). Especially in e-commerce the demand for individually tailored
products and services is growing constantly and adaptability as well as adaptivityare used increasingly.
Adaptive Systems are used in many domains to solve different tasks. The follow-functionsing list of functions, adopted from Jameson (2001), is neither meant to be complete,nor does it describe distinct categories. Rather it should outline how adaptivity isapplied in different domains and why it might be feasible to use adaptive systems fora specific task.
Help the user to find information: When searching large information spacessuch as the web or literature databases, users are frequently either over-whelmed by the amount of retrieved documents or do not get any results be-cause the query was too narrow. For example, by taking into consideration theuser’s relevance feedback on previous retrievals it is possible to improve bothprecision and recall of retrieved documents (Vogt, Cottrell, Belew and Bartell,1999).
Tailor information to user: Billsus and Pazzani (1999) introduced an adaptivesystem that compiles a daily news program that is tailored to the individualpreferences. These preferences are automatically learned from feedback inprevious interactions. Electronic shops might tailor the product descriptionand the way of presentation to the customer’s needs and expertise (Jörding,1999).
18
1.1. Functions and Definition of Adaptivity
Recommend products: Adaptive e-commerce systems are an important field ofapplication. Building a user model of the customer’s needs and preferencesenables the system to customize the sales interaction and to suggest suitableproducts (Ardissono and Goy, 1999). An electronic shopping guide mighteven be aware of the user’s current location in the shop (Bohnenberger, Jame-son, Krüger and Butz, 2002).
Help with routine tasks: Frequently occurring interactive tasks such as sortingincoming e-mail or formatting the layout of paragraphs can be supported byadaptive systems (e.g., Cohen, 1996; Segal and Kephart, 1999).
Adapt an interface: Usually the visual interface, i.e., the screen or display, isadapted; however, for users with motor disabilities it can be useful to adaptthe input interface. A system that learns and models the user’s keyboard skillsmay minimize or eliminate keystroke errors (Trewin and Pain, 1997).
Give help: Depending on the user’s expertise or knowledge a system can providehelp on commands (Chin, 1989). A well known example of help provisionbased on the users background, actions, and queries is the LUMIÈRE projectthat developed lifelike characters who assist in the interaction with word pro-cessing software (Horvitz, Breese, Heckerman, Hovel and Rommelse, 1998).
Support learning: There are many systems that support the learning process bothwith standalone applications (Weber and Möllenberg, 1995) as well as withInternet based courses and trainings (Brusilovsky, Eklund and Schwarz, 1998;de Bra and Calvi, 1998; Henze, Nejdl and Wolpers, 1999). Frequently appliedmethods for adaptation to the learner include adaptive annotation of links,adaptive hiding of links, and adaptive curriculum sequencing in dependenceof the learners current knowledge. An overview of different adaptation meth-ods and systems can be found in Brusilovsky (1996) and Brusilovsky (2001).
Conduct a dialog: The robustness of automatic dialogs via telephone (e.g., aticket service) will be enhanced if the user’s intentions are modeled (Horvitzand Paek, 2001).
Support collaboration: By modeling the user’s goals, interests, and availabilityit may become easier to find collaborators in a distributed workspace environ-ment (Bull, Greer, McCalla, Kettel and Bowes, 2001; Greer, McCalla, Collins,Kumar, Meagher and Vassileva, 1998).
19

1. Adaptive Systems
Though adaptive systems perform very different tasks and adapt in very differentways it is possible to subsume them in a single model that describes the architectureof these systems abstractly.
1.2. Models of Adaptivity
In addition to the definition of adaptive systems above, this chapter will derive amodel of adaptivity. The evaluation framework that is proposed in this thesis is sup-posed to hold for all adaptive systems. Thus, a clear model is required that enablesresearches to categorize their systems and which is a prerequisite for the comparisonof different systems.
We will introduce three models (or architectures) of adaptive systems that haveexistingarchitectures been proposed in the literature: a very early architecture by Benyon and Murray
(1993), a proposal by Oppermann (1994), and a very similar model proposed byJameson (2001). These architectures represent different points of views and focuson different aspects. For adaptive hypermedia, several reference models have beendeveloped (e.g., de Bra, Houben and Wu, 1999; Koch and Wirsing, 2002; Ohene-Djan, 2002), but currently these are not generally applicable to adaptive systems andare rather intended to support software engineers in developing systems. Thus, thesereference models are not taken into consideration here.
Benyon and Murray (1993) introduced an architecture of adaptive systems thatfocuses on the components of adaptivity. It is designed to support developers inBenyon and
Murray’smodel
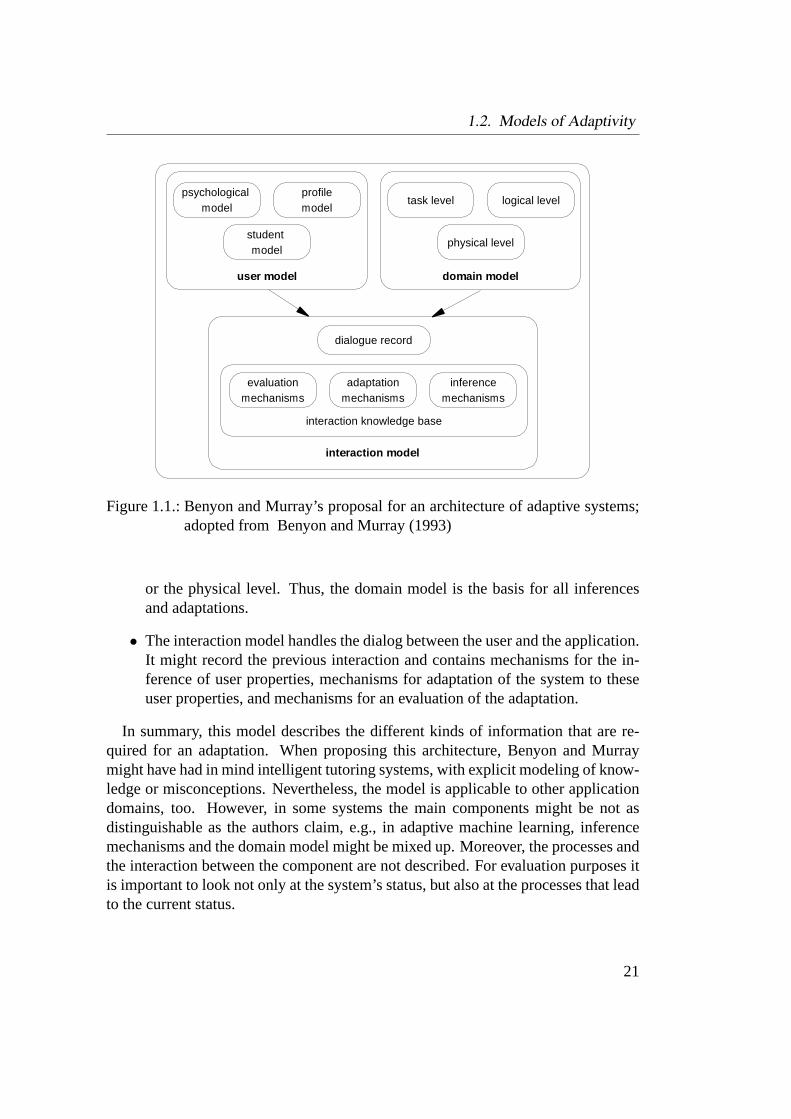
selecting appropriate representation techniques. The architecture basically consistsof three main components: the user model, the domain model, and the interactionmodel (see Figure 1.1).
• The user model represents the system’s beliefs about the user. It consists ofthree interlinking components: First, the student model, which contains thesystem’s assumptions about the user’s beliefs about the domain. For example,the system might assume that the user knows how to open a text file. Thus,this information is dependent on the application and the domain. The model’ssecond component is the profile model, which holds information about theuser’s background, interests and general knowledge. And the third component,the psychological model, holds domain independent cognitive and affectivetraits of the user.
• The domain model defines the aspects of the system and the world that areimportant for inferences, e.g., functions that might be altered. These aspectsmight be described at different levels, such as the task level, the logical level,
20
1.2. Models of Adaptivity
psychological model
profilemodel
student model
user model
task level logical level
physical level
domain model
evaluationmechanisms
adaptationmechanisms
inferencemechanisms
interaction knowledge base
dialogue record
interaction model
Figure 1.1.: Benyon and Murray’s proposal for an architecture of adaptive systems;adopted from Benyon and Murray (1993)
or the physical level. Thus, the domain model is the basis for all inferencesand adaptations.
• The interaction model handles the dialog between the user and the application.It might record the previous interaction and contains mechanisms for the in-ference of user properties, mechanisms for adaptation of the system to theseuser properties, and mechanisms for an evaluation of the adaptation.
In summary, this model describes the different kinds of information that are re-quired for an adaptation. When proposing this architecture, Benyon and Murraymight have had in mind intelligent tutoring systems, with explicit modeling of know-ledge or misconceptions. Nevertheless, the model is applicable to other applicationdomains, too. However, in some systems the main components might be not asdistinguishable as the authors claim, e.g., in adaptive machine learning, inferencemechanisms and the domain model might be mixed up. Moreover, the processes andthe interaction between the component are not described. For evaluation purposes itis important to look not only at the system’s status, but also at the processes that leadto the current status.
21

1. Adaptive Systems
A much more process oriented architecture was introduced by Oppermann (1994).Oppermann’smodel Its main idea is to distinguish between an afferential, an inferential, and an efferential
component.
• The afferential component gathers the observation data. The system observesthe users behavior, e.g., key strokes, commands, errors, movements, or navi-gation, which is the basis for further adaptation.
• The inferential component is the core of the system. An intelligent mechanisminfers user characteristics from the raw data.
• Finally, the efferential component decides how the system should be adapted,i.e., how the system behavior should be changed. The adaptation might con-cern the presentation of objects, functions or tools, default values for parame-ters, sequences of dialogue, or system messages.
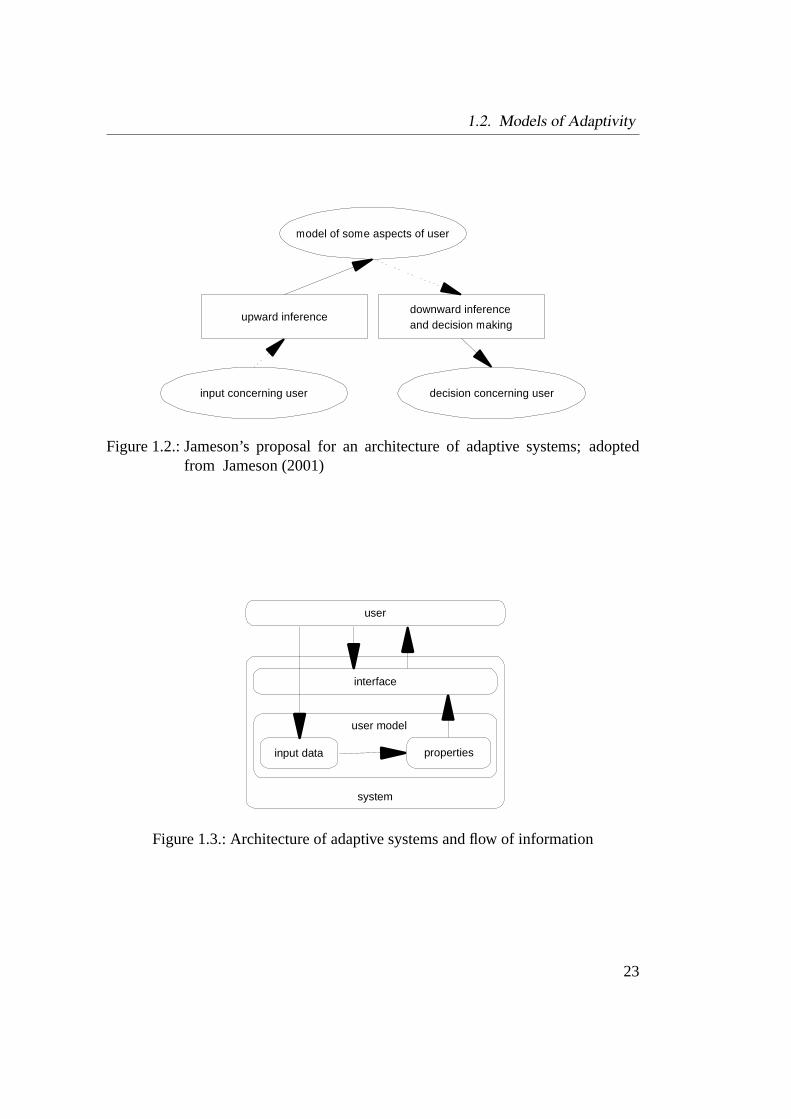
A very similar model was proposed by Jameson (2001). The author also distin-Jameson’smodel guishes an afference, called upward inference, on the one hand, and an efference,
called downward inference, on the other hand (see Figure 1.2). Thus, the empha-sis of this model is on the inference mechanisms, while Oppermann focuses on thecomponents. An important fact that is considered in both models is the distinctionbetween the inference of user characteristics and the concrete adaptation decision.Opposed to Benyon and Murray’s model, they do not describe the structure or con-tent of the components in more detail, e.g., different kinds of aspects of the users.
For the evaluation of adaptive systems, a process-oriented model is feasible, be-evaluationmodel cause it provides better insights into the actual data processing and thus offers obvi-
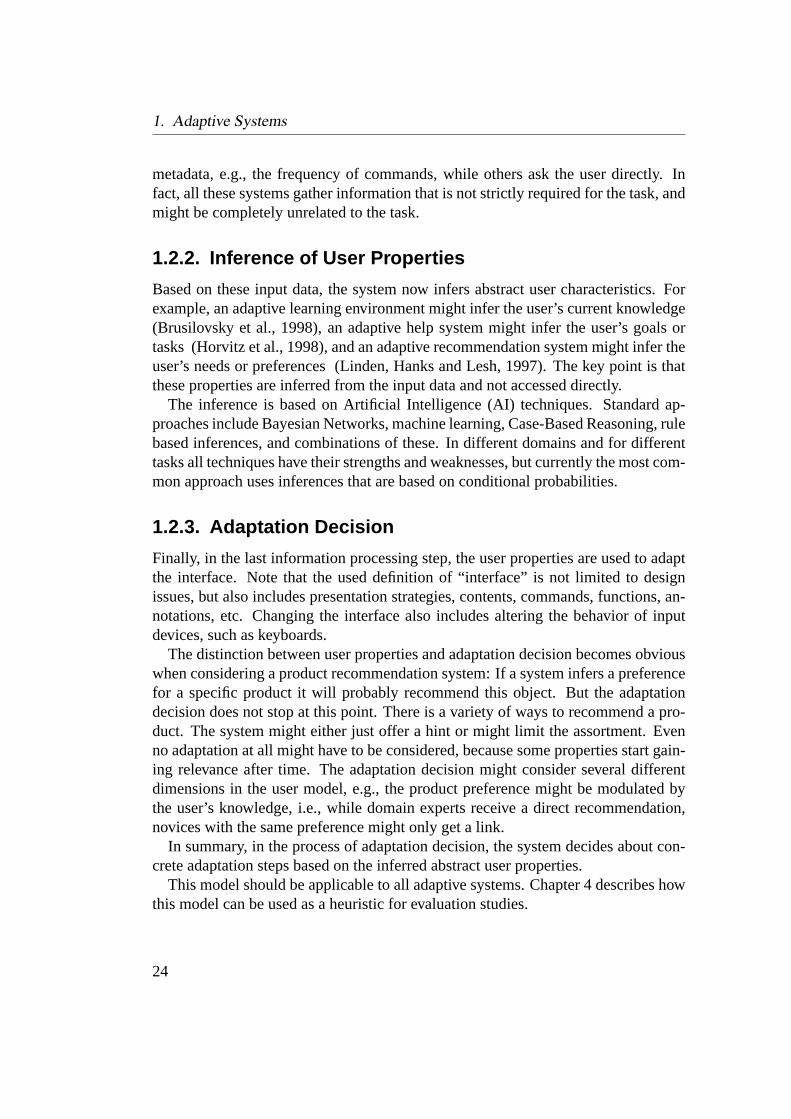
ous starting points for evaluations. Based on the above models, we propose a newmodel that is especially designed for evaluation purposes. We focus on the infer-ences that are involved in the adaptation, but add another information processingstep explicitly, namely the user observation. The following sections describe thismodel, which is shown in Figure 1.3, in more detail.
1.2.1. Acquisition of Input Data
In classical (non-adaptive) systems the user interacts with the machine via the inter-face by entering input data, which are strictly task related. One of the main char-acteristics of adaptive systems is, as seen in the definitions above, that they acquireadditional input data. The system might observe the user in different ways, e.g.,a system might monitor the interaction by recording key strokes or error types, byregistering navigation behavior and so forth. Some systems also monitor a kind of
22
1.2. Models of Adaptivity
model of some aspects of user
input concerning user decision concerning user
upward inferencedownward inferenceand decision making
Figure 1.2.: Jameson’s proposal for an architecture of adaptive systems; adoptedfrom Jameson (2001)
user
system
interface
user model
input data properties
Figure 1.3.: Architecture of adaptive systems and flow of information
23
1. Adaptive Systems
metadata, e.g., the frequency of commands, while others ask the user directly. Infact, all these systems gather information that is not strictly required for the task, andmight be completely unrelated to the task.
1.2.2. Inference of User Properties
Based on these input data, the system now infers abstract user characteristics. Forexample, an adaptive learning environment might infer the user’s current knowledge(Brusilovsky et al., 1998), an adaptive help system might infer the user’s goals ortasks (Horvitz et al., 1998), and an adaptive recommendation system might infer theuser’s needs or preferences (Linden, Hanks and Lesh, 1997). The key point is thatthese properties are inferred from the input data and not accessed directly.
The inference is based on Artificial Intelligence (AI) techniques. Standard ap-proaches include Bayesian Networks, machine learning, Case-Based Reasoning, rulebased inferences, and combinations of these. In different domains and for differenttasks all techniques have their strengths and weaknesses, but currently the most com-mon approach uses inferences that are based on conditional probabilities.
1.2.3. Adaptation Decision
Finally, in the last information processing step, the user properties are used to adaptthe interface. Note that the used definition of “interface” is not limited to designissues, but also includes presentation strategies, contents, commands, functions, an-notations, etc. Changing the interface also includes altering the behavior of inputdevices, such as keyboards.
The distinction between user properties and adaptation decision becomes obviouswhen considering a product recommendation system: If a system infers a preferencefor a specific product it will probably recommend this object. But the adaptationdecision does not stop at this point. There is a variety of ways to recommend a pro-duct. The system might either just offer a hint or might limit the assortment. Evenno adaptation at all might have to be considered, because some properties start gain-ing relevance after time. The adaptation decision might consider several differentdimensions in the user model, e.g., the product preference might be modulated bythe user’s knowledge, i.e., while domain experts receive a direct recommendation,novices with the same preference might only get a link.
In summary, in the process of adaptation decision, the system decides about con-crete adaptation steps based on the inferred abstract user properties.
This model should be applicable to all adaptive systems. Chapter 4 describes howthis model can be used as a heuristic for evaluation studies.
24
2. Empirical Evaluation
Empirical software evaluations can provide important hints to failures in interactivesystems that can not be uncovered otherwise. What are the goals of evaluation?How can software be improved by the results of empirical evaluations? What kind offailures are uncovered and which remain undiscovered? The advantages and limits ofempirical evaluations are outlined and usability is introduced as the most importantcriterion for this kind of evaluations.
2.1. Software Evaluation
The term evaluation is most frequently used for determining the worth or merit ofdefinitionan ‘evaluand’. Worthen, Sanders and Fitzpatrick (1997) define evaluation as the“identification, clarification, and application of defensible criteria to determine anevaluation object’s value, quality, utility, effectiveness, or significance in relationto those criteria” (p. 5). Sometimes its meaning is limited to the assessment ofsocial intervention programs, such as curricula, only (Rossi and Freeman, 1993).However, for the evaluation of adaptive systems we certainly prefer a broader sense.An evaluation of an interactive system ensures that it behaves as expected by thedesigner and that it meets the requirements of the user (Dix, Finlay, Abowd andBeale, 1998).
Accordingly, three main goals of software evaluation are distinguished (Dix et al.,goals1998):
• To assess the extent of system’s functionality.Does the system comply withthe user’s requirements? Which functional capabilities are offered to the user?How effectively does the system support the user’s task?
• To assess the effect of the interface on the user.This goal covers many of theusability aspects introduced in the previous chapter. How easy is the systemto learn and is the user satisfied with the system?
25
2. Empirical Evaluation
• To identify specific problems with the system.The last goal can be seen as akind of feedback loop. Evaluations can give valuable hints for improvementsby uncovering unexpected behavior of the system and by identifying incon-gruencies between user expectations and system design.
Both, assessing the value of and improving the object are important goals, whichformative andsummativeevaluation
is often referred to as formative and summative evaluation (Scriven, 1967). Bothaspects will be considered in this work, i.e., software evaluation is not just the lastphase in the software development process, but should be seen as an important sourceof information throughout the complete software life cycle (Nielsen, 1993).
Performing an evaluation requires an extended procedure. Several evaluation stepsevaluationsteps have been proposed. Exemplarily, we list the most essential steps for the evaluation
of software according to Totterdell and Boyle (1990):
• Identifying the purposes or objectives of the evaluation.A well planned studyincludes a clear specification of the commissioner, the audience who is sup-posed to receive the results, and most importantly the criteria. In other words,there should be a clear objective before the data are collected.
• Specifying experimental design.The criteria need to be translated in suitablemethods, subjects, tasks, measurements, experimental settings, and resources.Many different evaluation designs and according techniques have been pro-posed for different criteria and settings. An overview of evaluation techniquesfor the evaluation of software and interfaces is given by Howard and Murray(1987) and Dix et al. (1998) among other authors.
• Collecting results.Depending on the method, the results are collected by usinglog-files, behavior observation, and questionnaires.
• Analyzing data. Both quantitative and qualitative analysis may be applied.Note that the analysis highly depends on a proper specification of the cri-teria and methods used. Thus, both methods and criteria will be emphasizedthroughout this work. It will be shown that the specification of methods forthe evaluation of adaptive systems raises specific problems.
• Drawing conclusions.Finally, the interpretation of the results may be used torecommend the system or to recommend modifications.
This general procedure structure was used implicitly and explicitly for all of ourstudies that are described in this work. However, we do not give details for all steps inall studies, because most aspects are covered by common scientific behavior anyway
26
2.2. Advantages: Why Empirical Evaluations are needed
(e.g., specifying criteria and setting hypotheses), and because many specificationsoccur again and again.
2.2. Advantages: Why Empirical Evaluations areneeded
Some areas of Artificial Intelligence apply empirical methods regularly. For ex-ample, planning and search algorithms are benchmarked in standard domains, andmachine learning algorithms are usually tested with real data sets. However, lookingthe need for
evaluationsat an applied area such as user modeling, empirical studies are rare. For instance,only a quarter of the articles published inUser Modeling and User Adapted Inter-action (UMUAI) report empirical evaluations of significant scientific value (Chin,2001). Many of them include a simple evaluation study with small sample sizes andoften without any statistical methods.
On the other hand, empirical research is absolutely necessary for an estimationof the effectiveness, efficiency, and usability of a system that applies AI techniquesin real world scenarios. Especially user modeling techniques which are based onhuman-computer interaction require empirical evaluations. Otherwise certain typesof errors will remain undiscovered. Undoubtedly, verification, formal correctness,and tests are important methods for software engineering, however, we argue thatempirical evaluation—seen as an important complement—can improve AI tech-niques considerably. Moreover, the empirical approach is an important way to both,legitimize the efforts spent, and to give evidence to the usefulness of an approach.
Of especial interest is the evaluation of adaptive systems, because the potentiallack of consistency has been criticized (Benyon, 1993). The flexibility of adaptiveadaptivity vs.
consistencysystems that is usually praised as their enormous advantage could also be a majorthreat to usability issues (Edmonds, 1987; Thimbleby, 1990; Woods, 1993). Asseen above, the definition of usability includes dimensions such as learnability andmemorability. If a system changes its behavior over time it might happen that re-membering the functions and command usage become even more difficult, which isthe “price of flexibility” (Woods, 1993) that the user has to pay. Obviously formaltechniques such as verification cannot solve such subjective psychological issues.
2.3. Limits: Where Empirical Evaluations fail
The hypothesis testing procedure is responsible for an important limitation of em-pirical research. Empirical studies are very good at identifying design errors and
27
2. Empirical Evaluation
false assumptions but they do not suggest new theories or approaches directly. Evenan explorative study requires some hypotheses about possible impact factors. Thus,empirical evaluations have to be combined with theoretical grounds to yield usefulresults.
When evaluating adaptive systems—as opposed to AI systems in general—at leasttwo additional problems emerge:
First, defining adequate control groups is difficult for those systems that either can-adequatecontrol groups not switch off the adaptivity, or where a non-adaptive version appears to be absurd
because adaptivity is an inherent feature of these systems (Höök, 2000). Comparingalternative adaptation decisions might relieve this situation in many cases, as thisallows for estimates on the effect size that can be traced back to the adaptivity it-self. But the underlying problem remains: What is a fair comparison condition foradaptive systems?
Second, adequate criteria for adaptivity success are not well defined or commonlyadequatecriteria accepted: On the one hand, objective standard criteria (e.g., duration, number of
interaction steps, knowledge gain) regularly failed to find a difference between adap-tive and non-adaptive versions of a system. Usually, these criteria have not beenproven to be valid indicators of interaction quality or adaptivity success. On theother hand, subjective criteria that are standard in human-computer interaction re-search (e.g., usability questionnaires, eye tracking) have been very rarely applied touser modeling. Probably, the effects of adaptivity in most systems are rather subtleand require precise measurement.
In summary, empirical research offers a lot of opportunities that could inspirecurrent research in AI in general and in user modeling in particular. Empirical studiesare able to identify errors in AI systems that would otherwise remain undiscovered.However, it has been largely neglected so far.
2.4. Usability as Evaluation Criterion
What is bad with the system and why? How good is the system? According toOppermann (1994) these are the two types of questions that can be answered byempirical evaluations. While the first question assesses the system’s absolute quality,the second question implies comparing different alternatives under certain aspects ortesting a given system against fixed criteria.
The popular construct usability provides approaches to answer these questionsand is thus the most important criterion for software evaluations. The InternationalStandards Organisation (1998) defines usability in the following way: “A system isdefinitionusable when it allows the user to achieve his task with effectiveness, efficiency and
28
2.4. Usability as Evaluation Criterion
satisfaction in a given context of use.” A software is usable when the user can achievehis task with a minimum of resources required and when the system is pleasant touse. Thus, an evaluation has to check a least three dimensions of usability and todimensionsdefine criteria for each of them:
• Effectiveness: A system is effective if the objectives of the users are achievedand if they can fulfill their individual goals.
• Efficiency: A system is more efficient than another if the resources requiredto achieve these goals, for example the time needed to achieve the task arelimited. Users should be enabled to complete tasks with high productivity.
• Satisfaction: Users are satisfied if the system is pleasant to use, for examplethe criterion of satisfaction can be the inverse ratio to the number of negativeremarks said by the user during the test.
In addition to this standard, several other dimensions of usability have been pro-posed (e.g., Nielsen, 1993), including:
• Learnability: To smooth the first contact with the system it should be easy tolearn, i.e., the usage of commands and functions should be easy to understand.
• Memorability: In addition, the system’s functions and commands should alsobe easy to remember so that the user doesn’t have to learn it again when re-turning after an interval.
• Few and non-catastrophic errors: Users should make only a few errors, whenworking with the system, and should be able to recover from errors easily.
To measure the usability of an adaptive system we have to define criteria for eachdimension. Several criteria have been proposed. The next section lists the criteriaand methods that are used in current evaluations.
29

2. Empirical Evaluation
30

3. Current Evaluations ofAdaptive Systems
In order to explore the state of the art of adaptive systems evaluation, we compiled asynopsis of current evaluation studies. The methods and criteria that have been foundin these studies are categorized and problems of current evaluations are identified.
3.1. Systematic Synopsis
The overview of current publications affirmed our claim that only few studies arebased on proper experimental designs and statistical methods.
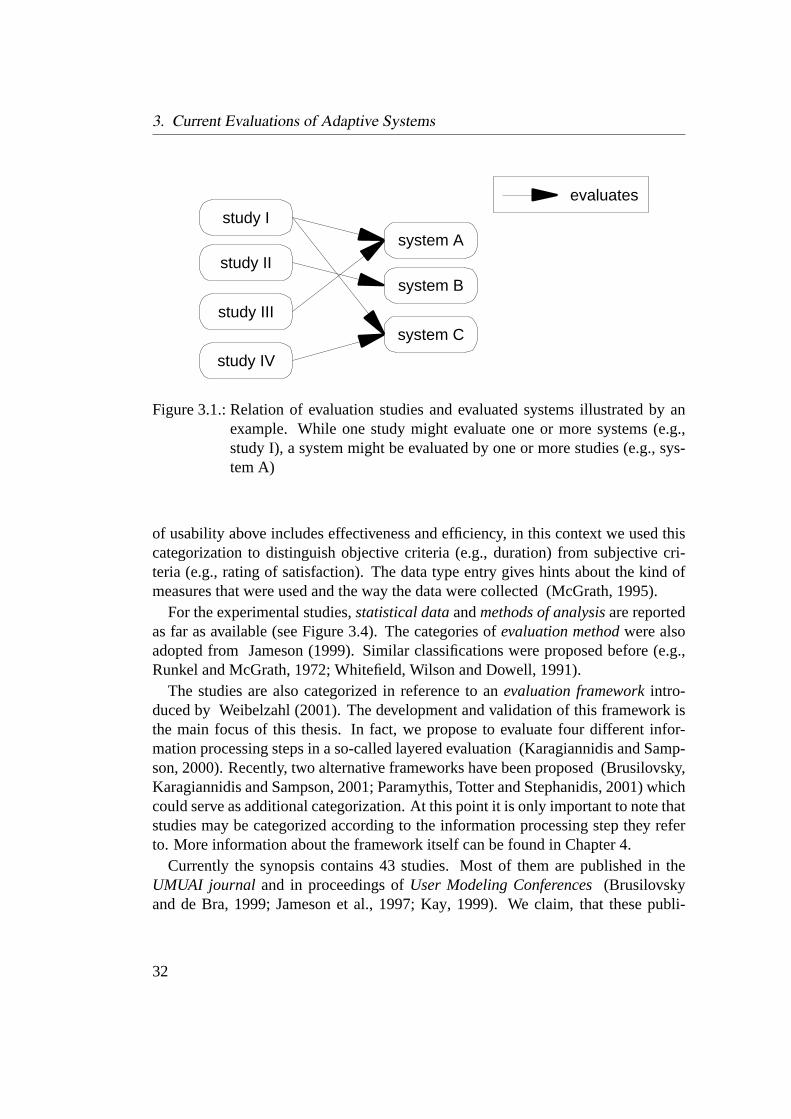
The synopsis is separated into two kinds of entries: experimental studies on theone hand and adaptive systems on the other hand. While each study evaluates one ormore systems, a system which is categorized by a specific function and an adaptationmechanism might be evaluated in several studies. A simple illustration of this n:mrelation is shown in Figure 3.1. Due to this relation of entities it was impossibleto use a standard literature database with some additional meta-tags for informationspecific for adaptivity. The distinction between evaluation studies and evaluatedsystems required a new approach.
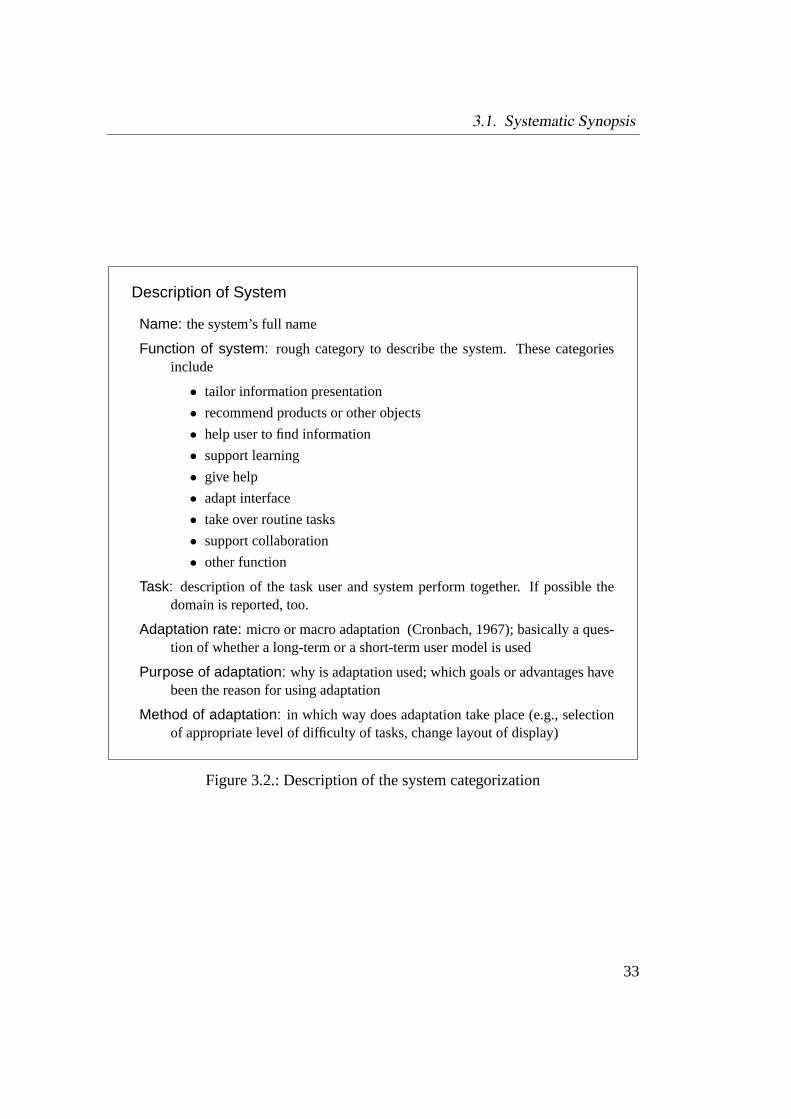
Each evaluated system is described in terms of itsname, thefunctionit fulfills, the systemstaskthat it performs, and a briefdescription of the adaptation mechanism. This wayof characterizing an adaptive system and most of the categories are adopted fromJameson (1999). See Figure 3.2 for a detailed description of the categories.
The purposeand themethod of adaptationare important to help the reader un-derstand what the system does. To find related systems the functioning and task areprobably more important.
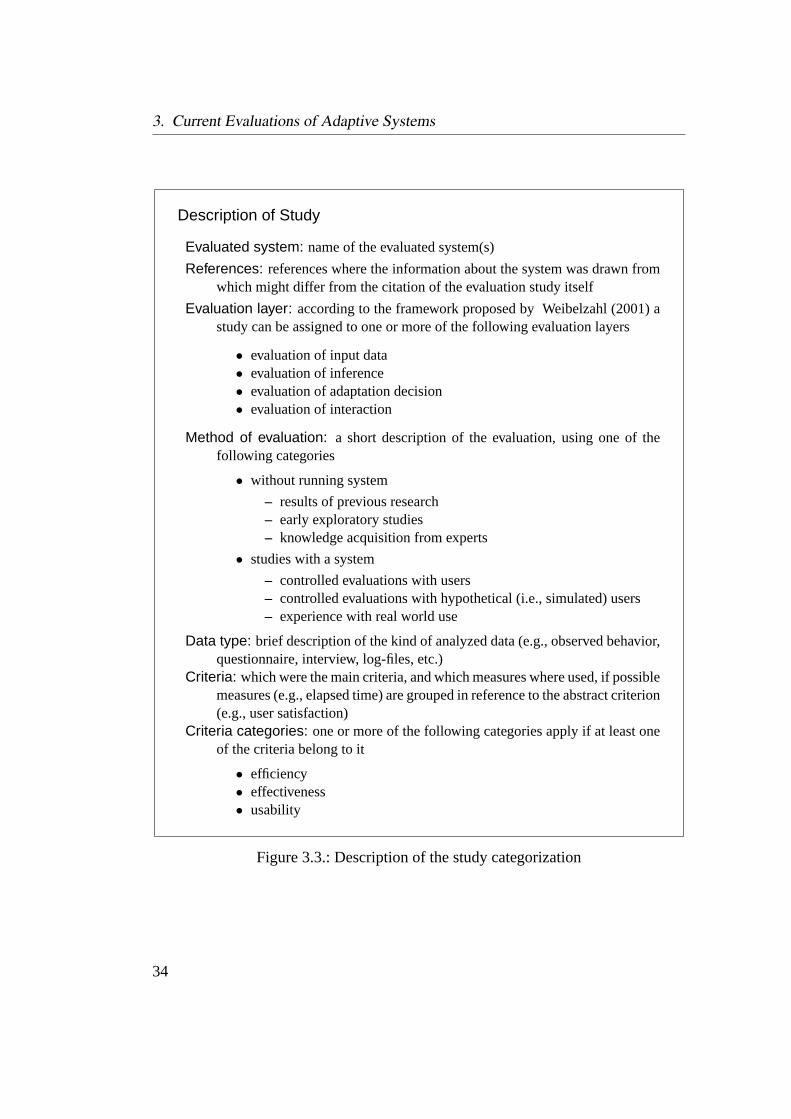
For each study the synopsis provides acitation, a referenceto the evaluated sys- studiestem, and a detailed description of theevaluation design(see Figure 3.3). The criteriahave been categorized in efficiency, effectiveness, and usability (Draper, Brown,Henderson and McAteer, 1996; Mark and Greer, 1993). Although the definition
31
3. Current Evaluations of Adaptive Systems
study I
study II
study III
system A
system B
system C
study IV
evaluates
Figure 3.1.: Relation of evaluation studies and evaluated systems illustrated by anexample. While one study might evaluate one or more systems (e.g.,study I), a system might be evaluated by one or more studies (e.g., sys-tem A)
of usability above includes effectiveness and efficiency, in this context we used thiscategorization to distinguish objective criteria (e.g., duration) from subjective cri-teria (e.g., rating of satisfaction). The data type entry gives hints about the kind ofmeasures that were used and the way the data were collected (McGrath, 1995).
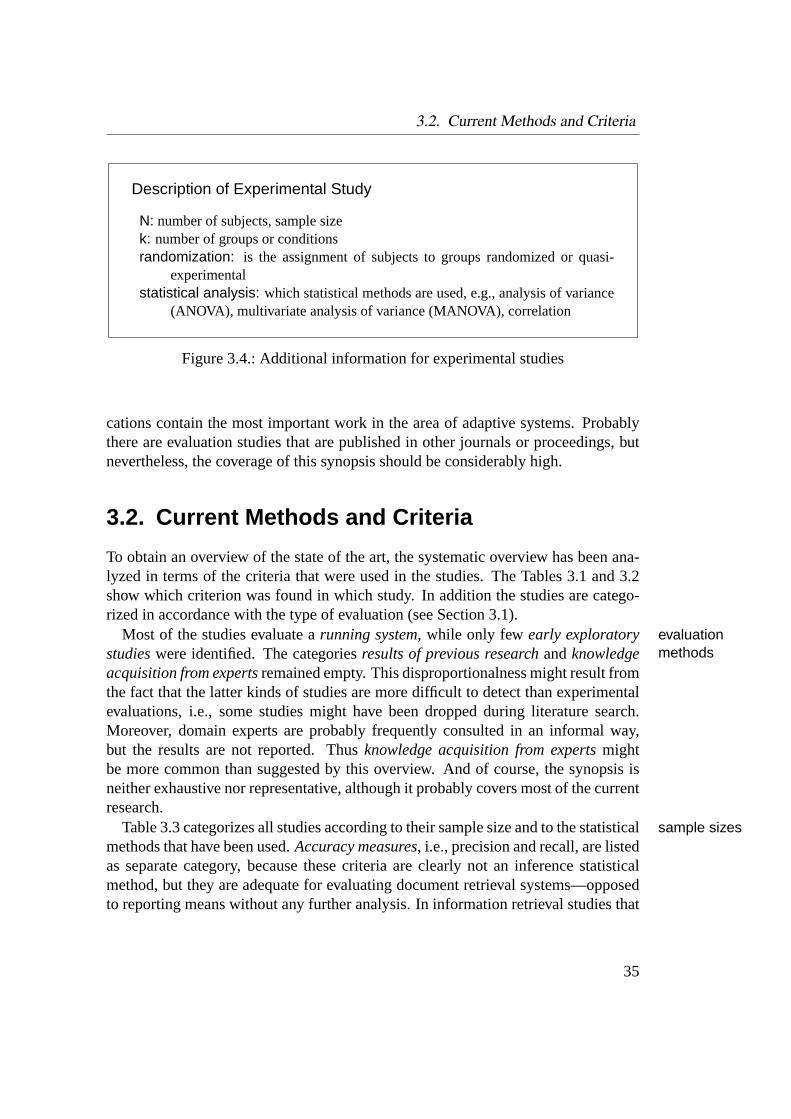
For the experimental studies,statistical dataandmethods of analysisare reportedas far as available (see Figure 3.4). The categories ofevaluation methodwere alsoadopted from Jameson (1999). Similar classifications were proposed before (e.g.,Runkel and McGrath, 1972; Whitefield, Wilson and Dowell, 1991).
The studies are also categorized in reference to anevaluation frameworkintro-duced by Weibelzahl (2001). The development and validation of this framework isthe main focus of this thesis. In fact, we propose to evaluate four different infor-mation processing steps in a so-called layered evaluation (Karagiannidis and Samp-son, 2000). Recently, two alternative frameworks have been proposed (Brusilovsky,Karagiannidis and Sampson, 2001; Paramythis, Totter and Stephanidis, 2001) whichcould serve as additional categorization. At this point it is only important to note thatstudies may be categorized according to the information processing step they referto. More information about the framework itself can be found in Chapter 4.
Currently the synopsis contains 43 studies. Most of them are published in theUMUAI journal and in proceedings ofUser Modeling Conferences(Brusilovskyand de Bra, 1999; Jameson et al., 1997; Kay, 1999). We claim, that these publi-
32
3.1. Systematic Synopsis
Description of System
Name: the system’s full name
Function of system: rough category to describe the system. These categoriesinclude
• tailor information presentation
• recommend products or other objects
• help user to find information
• support learning
• give help
• adapt interface
• take over routine tasks
• support collaboration
• other function
Task: description of the task user and system perform together. If possible thedomain is reported, too.
Adaptation rate: micro or macro adaptation (Cronbach, 1967); basically a ques-tion of whether a long-term or a short-term user model is used
Purpose of adaptation: why is adaptation used; which goals or advantages havebeen the reason for using adaptation
Method of adaptation: in which way does adaptation take place (e.g., selectionof appropriate level of difficulty of tasks, change layout of display)
Figure 3.2.: Description of the system categorization
33
3. Current Evaluations of Adaptive Systems
Description of Study
Evaluated system: name of the evaluated system(s)
References: references where the information about the system was drawn fromwhich might differ from the citation of the evaluation study itself
Evaluation layer: according to the framework proposed by Weibelzahl (2001) astudy can be assigned to one or more of the following evaluation layers
• evaluation of input data• evaluation of inference• evaluation of adaptation decision• evaluation of interaction
Method of evaluation: a short description of the evaluation, using one of thefollowing categories
• without running system
– results of previous research– early exploratory studies– knowledge acquisition from experts
• studies with a system
– controlled evaluations with users– controlled evaluations with hypothetical (i.e., simulated) users– experience with real world use
Data type: brief description of the kind of analyzed data (e.g., observed behavior,questionnaire, interview, log-files, etc.)
Criteria: which were the main criteria, and which measures where used, if possiblemeasures (e.g., elapsed time) are grouped in reference to the abstract criterion(e.g., user satisfaction)
Criteria categories: one or more of the following categories apply if at least oneof the criteria belong to it
• efficiency• effectiveness• usability
Figure 3.3.: Description of the study categorization
34
3.2. Current Methods and Criteria
Description of Experimental Study
N: number of subjects, sample sizek: number of groups or conditionsrandomization: is the assignment of subjects to groups randomized or quasi-
experimentalstatistical analysis: which statistical methods are used, e.g., analysis of variance
(ANOVA), multivariate analysis of variance (MANOVA), correlation
Figure 3.4.: Additional information for experimental studies
cations contain the most important work in the area of adaptive systems. Probablythere are evaluation studies that are published in other journals or proceedings, butnevertheless, the coverage of this synopsis should be considerably high.
3.2. Current Methods and Criteria
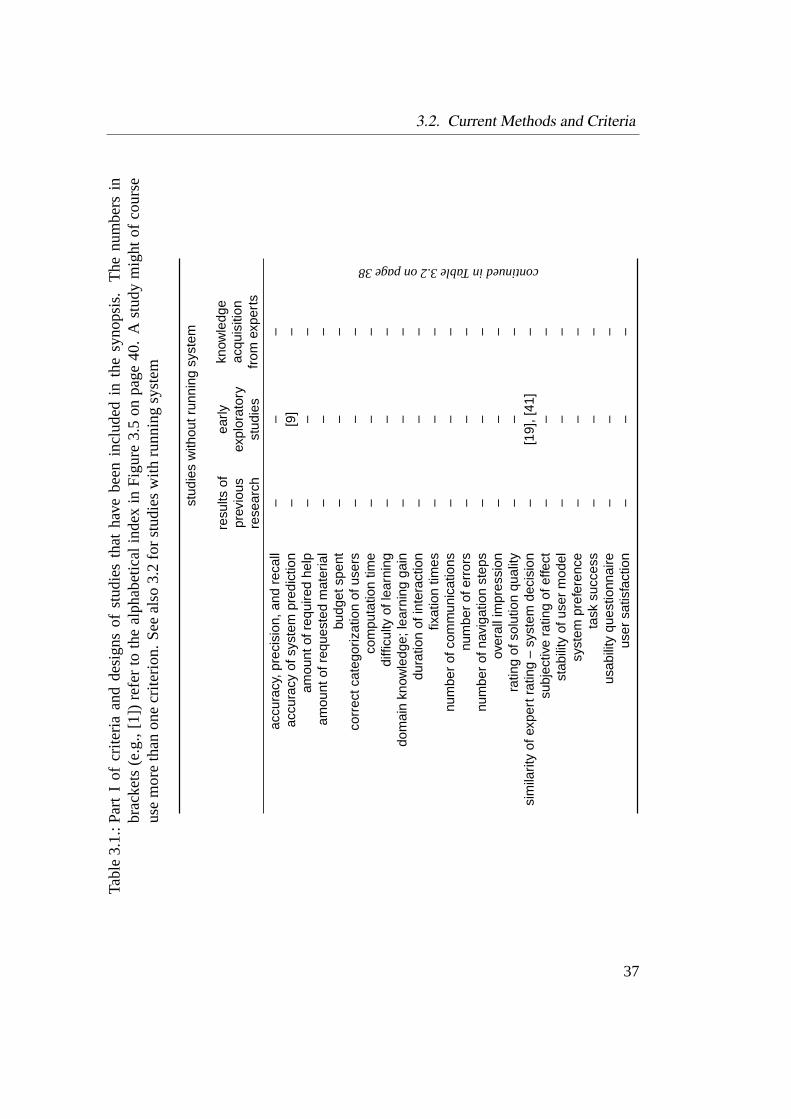
To obtain an overview of the state of the art, the systematic overview has been ana-lyzed in terms of the criteria that were used in the studies. The Tables 3.1 and 3.2show which criterion was found in which study. In addition the studies are catego-rized in accordance with the type of evaluation (see Section 3.1).
Most of the studies evaluate arunning system, while only fewearly exploratory evaluationmethodsstudieswere identified. The categoriesresults of previous researchandknowledge
acquisition from expertsremained empty. This disproportionalness might result fromthe fact that the latter kinds of studies are more difficult to detect than experimentalevaluations, i.e., some studies might have been dropped during literature search.Moreover, domain experts are probably frequently consulted in an informal way,but the results are not reported. Thusknowledge acquisition from expertsmightbe more common than suggested by this overview. And of course, the synopsis isneither exhaustive nor representative, although it probably covers most of the currentresearch.
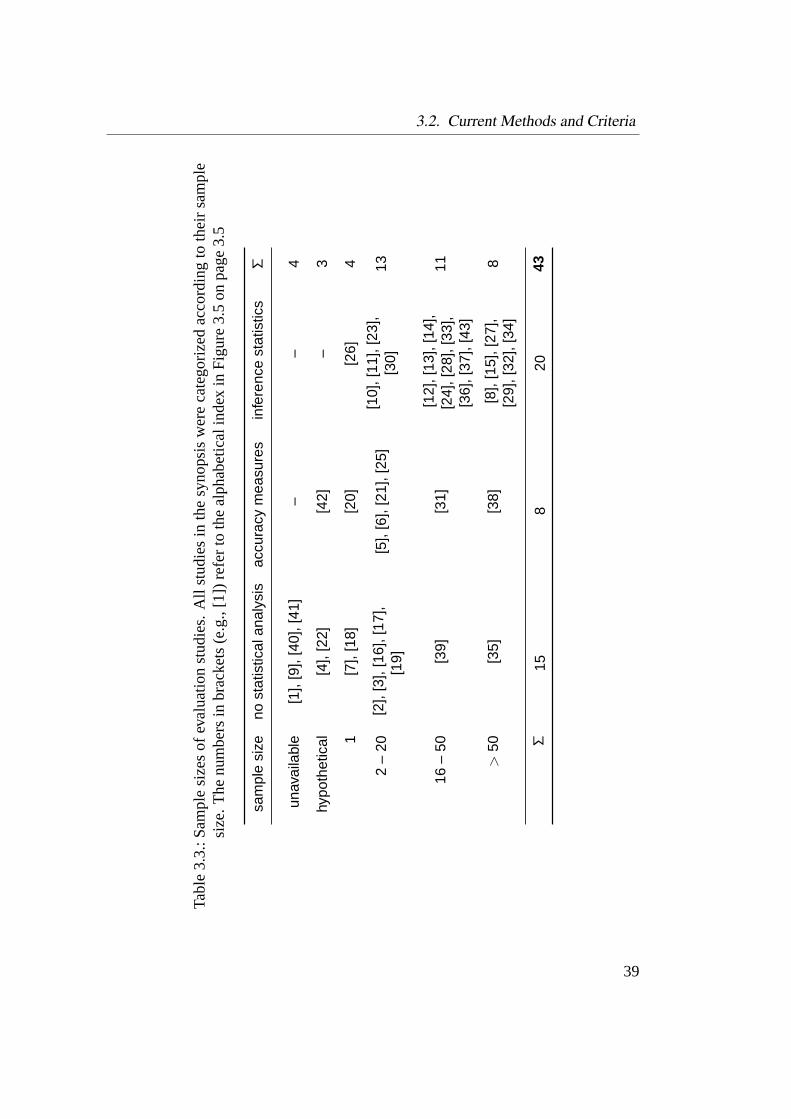
Table 3.3 categorizes all studies according to their sample size and to the statisticalsample sizesmethods that have been used.Accuracy measures, i.e., precision and recall, are listedas separate category, because these criteria are clearly not an inference statisticalmethod, but they are adequate for evaluating document retrieval systems—opposedto reporting means without any further analysis. In information retrieval studies that
35

3. Current Evaluations of Adaptive Systems
examined several users (e.g., [31]) it would be preferable to have additional measuresof the results’ certainty.
From a methodological point of view we have to accept that about a quarter(11/43) of the studies examines either only a single user, hypothetical users, or thesample size is not reported (Table 3.3). Thus, these studies have very limited valuefor evaluating adaptivity success. Representative samples are not required, but gen-eralized predictions are impossible with minimal sample sizes. Hypothetical usershelp to verify that the system behaves in the expected way, but general statementsare difficult here, too. Not to report the sample size at all, as found in four stud-ies, should be considered a malpractice, because interpreting the results becomessomewhat arbitrary.
In fact, only 14 out of 43 studies are of high quality in terms of sample size andstatistical analysis. Most of them have been carried out for adaptive learning sys-tems, probably because learning gain cannot be evaluated other than empirically,and education has a tradition of empirical approaches.
A wide range of criteria has been found. The most frequent measures includeac-criteriacuracy, domain knowledge, andduration of interaction. As stated above, evaluationof learning systems are more frequent, and usually these evaluations assess both thelearners’ knowledge and the duration that was required to acquire this knowledge.Precision and recall of information retrieval are probably very common, because thequality of such a system obviously depends on these measures. Other criteria havebeen used in one to three studies each. This is an insufficient base for comparingapproaches or inference mechanisms across studies. At best, it would be possibleto compare information retrieval systems and learning systems respectively. In fact,some recent discussions1 have aimed at establishing a competition of implementingthe same learning content with different approaches.
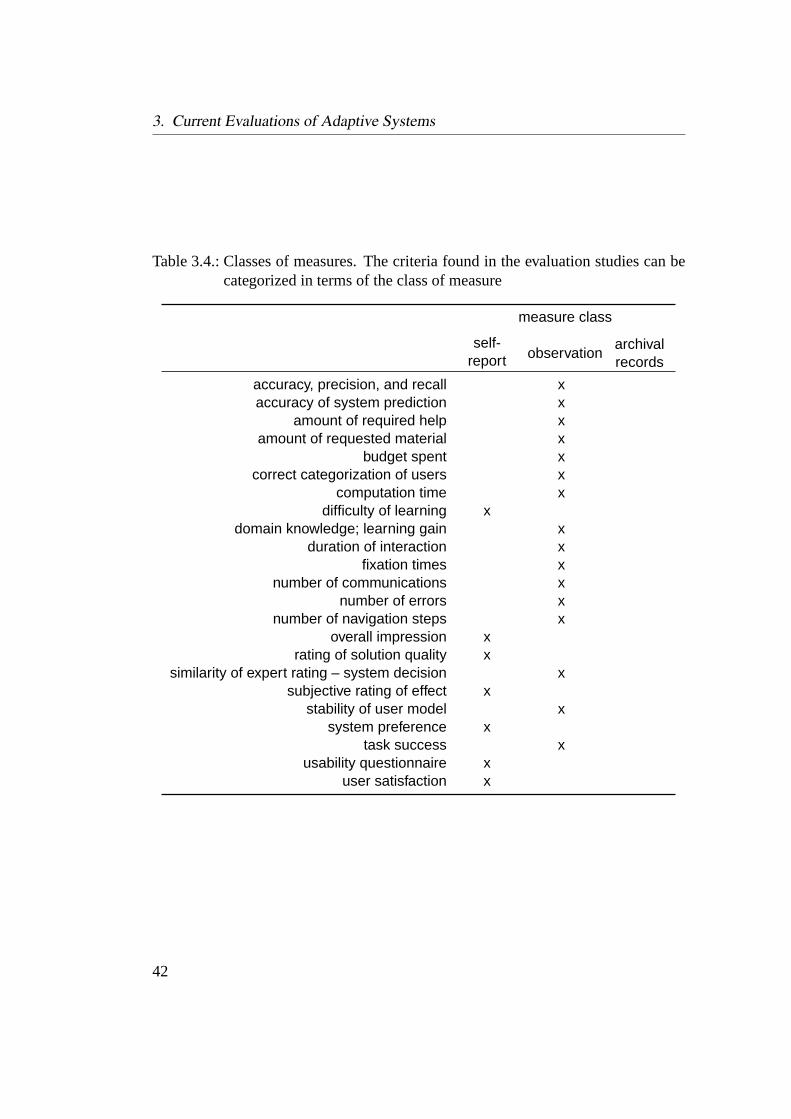
The criteria can also be categorized in terms of the class of measure (McGrath,1995). Table 3.4 shows which measures are self-reports, observations, or archivalrecords. While not surprisingly no archival records were used at all, only few ofthe criteria assess the user’s subjective experience with self-reports. These includeself-reportsdifficulty of learning, rating of solution quality, subjective rating of effect, usabilityquestionnaire, anduser satisfaction. Only the usability questionnaires have beenstandardized and externally validated. All other self-report measures are more or lessad hoc questions or rating scales. Effect sizes of different treatments or reliabilitymeasures are not known.
1see e.g., discussion on possible competition areas at the Workshop of Adaptive Systems for Web-Based Education (http://sirius.lcc.uma.es/WASWE2002/) at the Second International Conferenceon Adaptive Hypermedia and Adaptive Web Based Systems (AH2002) or the Learning Open(http://www.LearningOpen.com) project of Neil Heffernan.
36
3.2. Current Methods and CriteriaTa
ble
3.1.
:Par
tI
ofcr
iteria
and
desi
gns
ofst
udie
sth
atha
vebe
enin
clud
edin
the
syno
psis
.T
henu
mbe
rsin
brac
kets
(e.g
.,[1
])re
fer
toth
eal
phab
etic
alin
dex
inF
igur
e3.
5on
page
40.
Ast
udy
mig
htof
cour
seus
em
ore
than
one
crite
rion.
See
also
3.2
for
stud
ies
with
runn
ing
syst
em
stud
ies
with
outr
unni
ngsy
stem
resu
ltsof
prev
ious
rese
arch
early
expl
orat
ory
stud
ies
know
ledg
eac
quis
ition
from
expe
rts
accu
racy
,pre
cisi
on,a
ndre
call
––
–
continuedinTable3.2onpage38
accu
racy
ofsy
stem
pred
ictio
n–
[9]
–am
ount
ofre
quire
dhe
lp–
––
amou
ntof
requ
este
dm
ater
ial
––
–bu
dget
spen
t–
––
corr
ectc
ateg
oriz
atio
nof
user
s–
––
com
puta
tion
time
––
–di
fficu
ltyof
lear
ning
––
–do
mai
nkn
owle
dge;
lear
ning
gain
––
–du
ratio
nof
inte
ract
ion
––
–fix
atio
ntim
es–
––
num
ber
ofco
mm
unic
atio
ns–
––
num
ber
ofer
rors
––
–nu
mbe
rof
navi
gatio
nst
eps
––
–ov
eral
lim
pres
sion
––
–ra
ting
ofso
lutio
nqu
ality
––
–si
mila
rity
ofex
pert
ratin
g–
syst
emde
cisi
on–
[19]
,[41
]–
subj
ectiv
era
ting
ofef
fect
––
–st
abili
tyof
user
mod
el–
––
syst
empr
efer
ence
––
–ta
sksu
cces
s–
––
usab
ility
ques
tionn
aire
––
–us
ersa
tisfa
ctio
n–
––
37
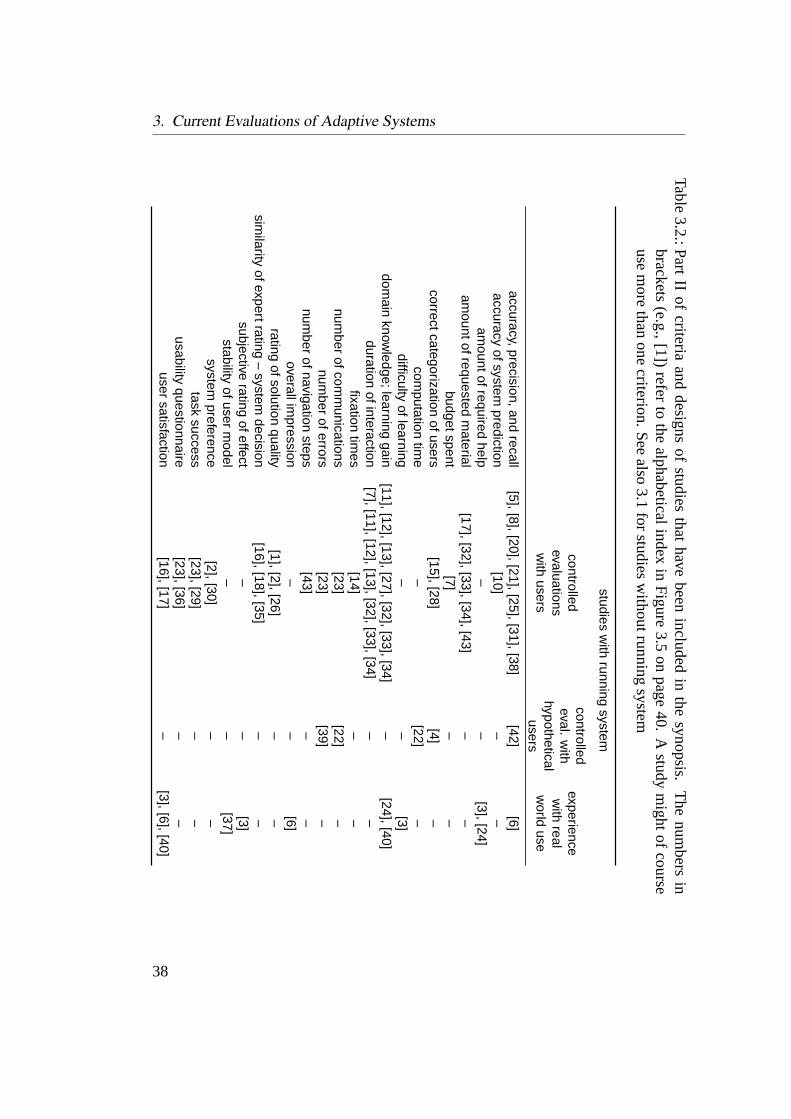
3. Current Evaluations of Adaptive SystemsTable
3.2.:Part
IIof
criteriaand
designsof
studiesthat
havebeen
includedin
thesynopsis.
The
numbers
inbrackets
(e.g.,[1])
referto
thealphabeticalindex
inF
igure3.5
onpage
40.A
studym
ightof
courseuse
more
thanone
criterion.S
eealso
3.1for
studiesw
ithoutrunningsystem
studiesw
ithrunning
system
controlledevaluationsw
ithusers
controlledeval.
with
hypotheticalusers
experiencew
ithreal
world
use
accuracy,precision,andrecall
[5],[8],[20],[21],[25],[31],[38][42]
[6]accuracy
ofsystemprediction
[10]–
–am
ountofrequiredhelp
––
[3],[24]am
ountofrequestedm
aterial[17],[32],[33],[34],[43]
––
budgetspent[7]
––
correctcategorizationofusers
[15],[28][4]
–com
putationtim
e–
[22]–
difficultyoflearning
––
[3]dom
ainknow
ledge;learninggain
[11],[12],[13],[27],[32],[33],[34]–
[24],[40]duration
ofinteraction[7],[11],[12],[13],[32],[33],[34]
––
fixationtim
es[14]
––
number
ofcomm
unications[23]
[22]–
number
oferrors[23]
[39]–
number
ofnavigationsteps
[43]–
–overallim
pression–
–[6]
ratingofsolution
quality[1],[2],[26]
––
similarity
ofexpertrating–
systemdecision
[16],[18],[35]–
–subjective
ratingofeffect
––
[3]stability
ofuserm
odel–
–[37]
systempreference
[2],[30]–
–task
success[23],[29]
––
usabilityquestionnaire
[23],[36]–
–user
satisfaction[16],[17]
–[3],[6],[40]
38
3.2. Current Methods and Criteria
Tabl
e3.
3.:S
ampl
esi
zes
ofev
alua
tion
stud
ies.
All
stud
ies
inth
esy
nops
isw
ere
cate
goriz
edac
cord
ing
toth
eir
sam
ple
size
.T
henu
mbe
rsin
brac
kets
(e.g
.,[1
])re
fer
toth
eal
phab
etic
alin
dex
inF
igur
e3.
5on
page
3.5
sam
ple
size
nost
atis
tical
anal
ysis
accu
racy
mea
sure
sin
fere
nce
stat
istic
sΣ
unav
aila
ble
[1],
[9],
[40]
,[41
]–
–4
hypo
thet
ical
[4],
[22]
[42]
–3
1[7
],[1
8][2
0][2
6]4
2–
20[2
],[3
],[1
6],[
17],
[19]
[5],
[6],
[21]
,[25
][1
0],[
11],
[23]
,[3
0]13
16–
50[3
9][3
1][1
2],[
13],
[14]
,[2
4],[
28],
[33]
,[3
6],[
37],
[43]
11
>50
[35]
[38]
[8],
[15]
,[27
],[2
9],[
32],
[34]
8
Σ15
820
43
39

3. Current Evaluations of Adaptive Systems
1. Ambrosini, Cirillo and Mi-carelli (1997), HUMOS andWIFS
2. Bares and Lester (1997),UCam
3. Beck, Stern and Woolf (1997),MFD
4. Berthold and Jameson (1999),READY
5. Billsus and Pazzani (1999),News Dude
6. Bueno and David (2001),METIORE
7. Chin and Porage (2001), Iona
8. Chiu, Webb and Kuzmycz(1997), FOIL-IOAM
9. Chu-Carroll and Brown(1998), Initiative Prediction
10. Corbett and Bhatnagar (1997),APT
11. study I in Corbett (2001),APT
12. study II in Corbett (2001),APT
13. study III in Corbett (2001),APT
14. Crosby, Iding and Chin (2001)
15. Draier and Gallinari (2001)
16. Encarnação and Stoev (1999),ORIMUHS
17. Fischer and Ye (2001), Code-Broker
18. Goren-Bar, Kuflik, Lev andShova (2001), SOM
19. Green and Carberry (1999),Initiative in Answer Genera-tion
20. experiment 1 in Kim, Hall andKeane (2001), RLRSD
21. experiment 2 in Kim, Hall andKeane (2001), RLRSD
22. Lesh, Rich and Sidner (1999),Collagen
23. Litman and Pan (1999), TOOT
24. Luckin and du Boulay (1999),VIS
25. Magnini and Strapparava(2001), SiteIF
26. Marinilli, Micarelli and Scia-rrone (1999), Information Fil-tering System
27. Mitrovic (2001), SQL-Tutor
continued on page 41
Figure 3.5.: Alphabetical index of studies that have been included in the synopsisand name of evaluated system (part I). The index is continued in Figure3.6 on page 41
40

3.2. Current Methods and Criteria
continued from page 40
28. Müller, Großmann-Hutter,Jameson, Rummer and Wit-tig (2001), READY
29. Noh and Gmytrasiewicz(1997), RMM
30. Paris, Wan, Wilkinson andWu (2001), Tiddler
31. Semerano, Ferilli, Fanizziand Abbattista (2001), CDLLearning Server
32. experiment 1 in Specht andKobsa (1999), AST
33. experiment 2 in Specht andKobsa (1999), AST
34. field study in Specht andKobsa (1999), AST
35. Sison, Numao and Shimura(1998), MMD
36. Strachan, Anderson, Sneesbyand Evans (1997), P-TIMS
37. Spooner and Edwards (1997),Babel
38. Theo (2001), ELFI
39. Trewin and Pain (1997), KeyBoard Skills
40. Villamañe, Gutiérrez, Ar-ruabarrena, Pérez, López-Cudrado, Sanz, Sanz andVadillo (2001), HEZINET
41. Virvou and du Boulay (1999),RESCUER
42. Vogt, Cottrell, Belew andBartell (1999), User lenses
43. Weber and Specht (1997a),ELM-ART II
Figure 3.6.: Part II of the alphabetical index of studies that have been included in thesynopsis (continued from page 40)
41
3. Current Evaluations of Adaptive Systems
Table 3.4.: Classes of measures. The criteria found in the evaluation studies can becategorized in terms of the class of measure
measure class
self-report observation
archivalrecords
accuracy, precision, and recall xaccuracy of system prediction x
amount of required help xamount of requested material x
budget spent xcorrect categorization of users x
computation time xdifficulty of learning x
domain knowledge; learning gain xduration of interaction x
fixation times xnumber of communications x
number of errors xnumber of navigation steps x
overall impression xrating of solution quality x
similarity of expert rating – system decision xsubjective rating of effect x
stability of user model xsystem preference x
task success xusability questionnaire x
user satisfaction x
42

3.3. Problems in Evaluating Adaptive Systems
All other measures are directly observable , e.g., duration of interaction, or numberobservationsof navigation or dialog steps. These measures are easy to assess and do not distort theresults. However, some of them are difficult to interpret. For example, a reduction ofinteraction duration might be caused by either an interface that is more easy to handleor by annoyed users who tried to minimize the interaction as much as possible.
3.3. Problems in Evaluating Adaptive Systems
Based on the synopsis of evaluation studies, we tried to identify problems and diffi-culties in evaluating adaptive systems that might be responsible for the lack of signi-ficant studies. Several reasons have been proposed responsible for this shortcoming(e.g., Eklund, 1999).
One structural reason is that computer science has little tradition in empirical re-search and, thus, evaluations of adaptive systems are usually not required for pub-lication. Empirical methods are not even part of most curricula. New publicationrequirements of journals and reviewers could raise the amount and quality of evalu-ation studies considerably.
Second, the development cycle of software products is short. Evaluations mightbecome obsolete as soon as a new version has been developed. The resources con-sumed by the evaluation cannot be put to use for further development. However,evaluations should be seen as important feedback for the design process, that is ap-plied throughout the whole life cycle. Proper chosen methods and criteria mightassure that the results are meaningful for a longer period of time.
Third, adaptive systems have an inherent property which makes system compar-isons difficult. In some cases, we cannot simply switch off the adaptivity and makea non-adaptive system of it, because adaptivity is an essential part of that system(Höök, 2000). We run into trouble if the adaptive system is not an extended versionof a preexisting non-adaptive system (as in the following example), but designedfrom scratch. Defining an adequate control group might be difficult here, becauseswitching off the adaptivity in these systems might result in a rather useless pro-duct. We will introduce an evaluation method that might relieve this problem bycomparing different possible adaptation decisions.
Fourth, evaluation in this area only considered the system’s precision without tak-ing the behavior and cognitions of users into account. Only recently there have beensome proposals on evaluation of adaptivity in general (Karagiannidis and Sampson,2000).
Fifth, the expected effect sizes are pretty low for some systems compared to thehuge that stems from the individual difference. For example, an adaptive learning
43

3. Current Evaluations of Adaptive Systems
system that annotates links according to the user’s current knowledge might improvethe learning gain or the navigation, but we would certainly expect that the improve-ment of such a relatively simple mechanism is small in comparison to the obviousdifferences of learners in general. Adaptivity will usually smooth and improve theinteraction, but will not lift it to a new level. From an empirical point of view, theseeffects are difficult to detect, because they have to be separated from the backgroundnoise.
Finally, what is successful adaptation at all? Is it possible to define adaptivitysuccess without referring to a specific domain and system? We will propose a newcriterion, called behavioral complexity, that might hold for many different domains,but in general, a comparison of different approaches will usually be limited to certainuser properties in certain domains. For example, a possible evaluation domain mightbe: Using a stereotype approach is useful for the adaptation to customer preferencesin the traveling domain, but adapting to prior knowledge in learning environments ismore successful with Bayesian Networks.
3.4. Developing a Database of EmpiricalEvaluations
The synopsis of studies can be used as a fundament of a searchable online database,that provides an overview of the state of the art to the scientific community andencourages other scientists to evaluate their own system.
3.4.1. Aims
First of all, the systematic synopsis was established to get an overview of the stateof the art. We wanted to identify currently used methods and criteria, as well asexploring the
state of the art omissions and problems in current evaluations. The results are reported in this the-sis. However, the main reason, why we decided to put the synopsis online with aninteractive database, was to encourage empirical evaluations of adaptive systems. Byencouraging
evaluations providing a searchable categorized set of studies, interested people get suggestionsof experimental designs, criteria, and other experimental issues.
Such a database will help to identify pitfalls in the planning process as well asin the analysis of collected data. Moreover, it will help to identify omissions in thestate of the art in the future, e.g., a certain category of systems might appear to benot evaluated at all.
44
3.4. Developing a Database of Empirical Evaluations
For people outside the community the database will serve as reference for the use-fulness (or insufficiency) of adaptive systems in general, of certain types of systems,or of a specific system as it describes the current state of the art.
3.4.2. Online Interface
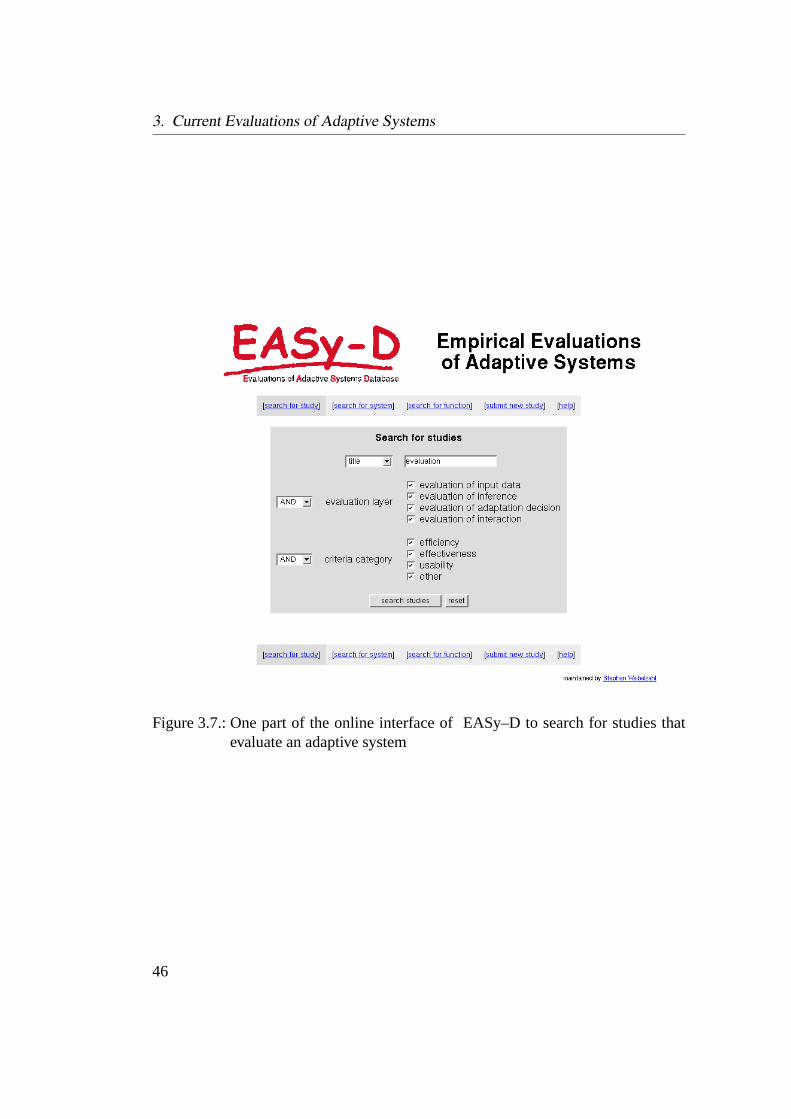
The database is called EASy–D (evaluation of adaptive systems database) and isavailable online at http://www.softwareevaluation.de. Users may search for either asystem or a study. For finding a related system it is most important to search forsearching for
systemsa specific function. The user might just check the required function categories andretrieve the relevant systems. Searching for a specific name, and full text search aresupported, too. The presentation of results includes the complete information that isavailable about each reported system, as well as a link to all studies that evaluatedthis system.
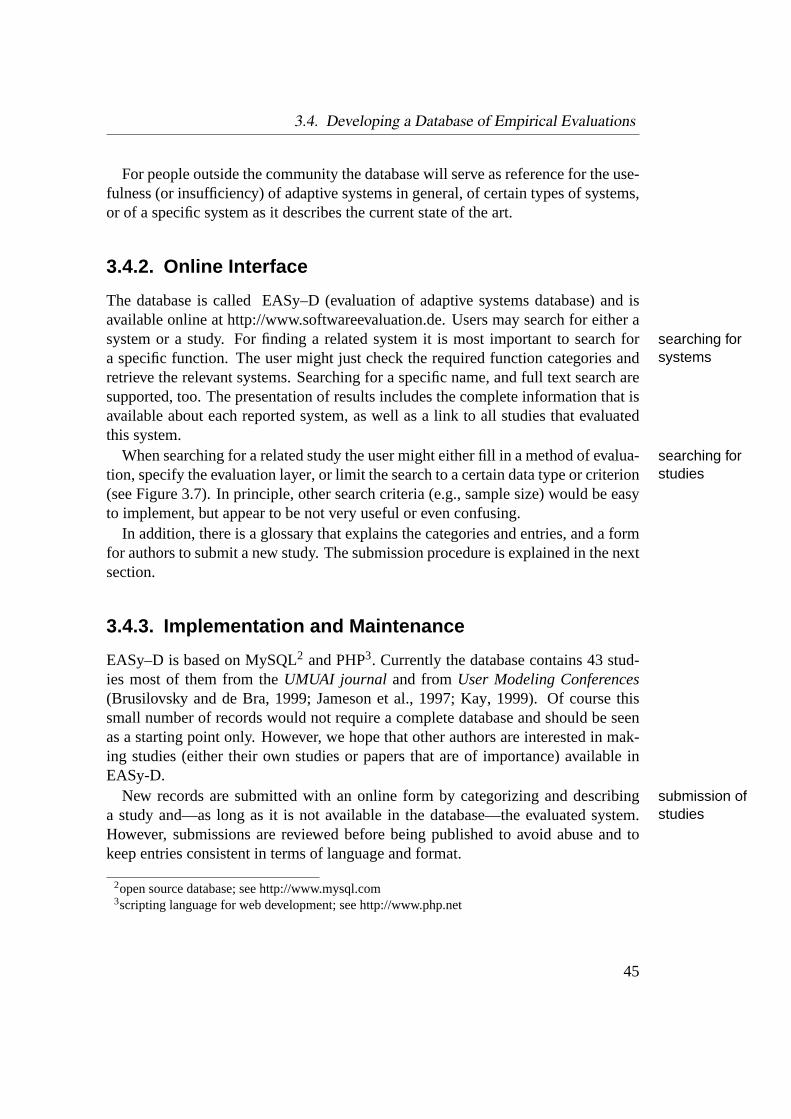
When searching for a related study the user might either fill in a method of evalua-searching forstudiestion, specify the evaluation layer, or limit the search to a certain data type or criterion
(see Figure 3.7). In principle, other search criteria (e.g., sample size) would be easyto implement, but appear to be not very useful or even confusing.
In addition, there is a glossary that explains the categories and entries, and a formfor authors to submit a new study. The submission procedure is explained in the nextsection.
3.4.3. Implementation and Maintenance
EASy–D is based on MySQL2 and PHP3. Currently the database contains 43 stud-ies most of them from theUMUAI journal and fromUser Modeling Conferences(Brusilovsky and de Bra, 1999; Jameson et al., 1997; Kay, 1999). Of course thissmall number of records would not require a complete database and should be seenas a starting point only. However, we hope that other authors are interested in mak-ing studies (either their own studies or papers that are of importance) available inEASy-D.
New records are submitted with an online form by categorizing and describingsubmission ofstudiesa study and—as long as it is not available in the database—the evaluated system.
However, submissions are reviewed before being published to avoid abuse and tokeep entries consistent in terms of language and format.
2open source database; see http://www.mysql.com3scripting language for web development; see http://www.php.net
45
3. Current Evaluations of Adaptive Systems
Figure 3.7.: One part of the online interface of EASy–D to search for studies thatevaluate an adaptive system
46

3.4. Developing a Database of Empirical Evaluations
Compared to a usual literature search users of EASy–D may search for systemfunctions and evaluation methods very easily. Moreover, the studies are presented ina standardized way which gives a quick overview of the study. Another advantage isthat related studies that evaluate the same system or a system with the same functionare identified quickly.
We hope that this database will become the central contact point for researcherswho are planning empirical evaluations of their adaptive systems and invite every-body to enhance EASy–D by submitting studies or giving feedback.
47

3. Current Evaluations of Adaptive Systems
48

4. A Framework for theEvaluation of AdaptiveSystems
Based on the systematic overview of current evaluations, we developed a frameworkthat both categorizes existing studies and offers a systematic approach for evalua-tions.
4.1. Objectives and Scope of the Framework
In developing a framework for the evaluation of adaptive systems, we pursued twoobjectives: First, to specify what has to be evaluated to guarantee the success ofadaptive systems, and second, to have a grid that facilitates the specification of cri-teria and methods that are useful for the evaluation.
The first goal is very obvious. Currently, there is no guideline or comprehensiveevaluationtargetsoverview of what and how to evaluate an adaptive system. A framework like the
one proposed here could help to systemize current approaches and offer hints howto identify failures and misconceptions in systems.
The second goal is important to encourage further evaluations. Once suitableencouragingevaluationscriteria and methods have been specified and collected it becomes much easier to
establish an evaluation of a new system. Researchers can choose the required studydesign. This, in turn, could make evaluations more comparable which would evenallow comparisons of different systems.
As far as we can see, the framework is applicable to all adaptive systems with nolimitation of the domain or inference mechanism. Probably, systems with explicitscopeuser models and simple inferences can be evaluated more easily, because failurescan be backtracked in a straightforward way.
Both, formative and summative evaluations are supported (Scriven, 1967). Whileformative andsummativeevaluations
parts of the framework can be used even in very early stages of the software engi-
49
4. A Framework for the Evaluation of Adaptive Systems
neering process even before anything else has been implemented, other parts look atthe performance of the complete system. Thus, the framework can be integrated withexisting software engineering models to identify very early failures and aberrationsin the architecture and design.
Certainly, this framework focuses on empirical evaluations. Other software eval-uation issues such as verification of algorithms are excluded. We do not doubt theadvantages of formal methods for software testing. However, when evaluating thereal world value of an adaptive system an empirical approach is inevitable.
In summary, we propose a systematic approach for the evaluation of adaptive sys-tems that will encourage and categorize future evaluations.
4.2. Framework-Structure
The basic idea of the framework is to use the model of adaptive systems, introducedrationalein chapter 1.2, to evaluate each information processing step on its own (Figure 4.1).In fact, we distinguish four evaluation steps (Weibelzahl, 2001; Weibelzahl andLauer, 2001):
1. Evaluation of reliability and external validity of input data acquisition
2. Evaluation of the inference mechanism and accuracy of user properties
3. Evaluation of adaptation decisions
4. Evaluation of total interaction
4.1 System behavior
4.2 User behavior and usability
The next sections describe these evaluation steps in more detail. All steps togethercan be seen as a so called “layered evaluation” (Karagiannidis and Sampson, 2000),layered
evaluation i.e., a previous step is a prerequisite to the following steps. This procedure is outlinedin chapter 4.3.
4.2.1. Evaluation of Input Data
To build a user model the system acquires direct or indirect input from the user (e.g.,appearance of specific behavior, utterances, answers, etc.). These data are the basisof all further inferences. Thus, its reliability and validity are of high importance.
While in some cases the reliability of the input data is unquestionable, there mayreliability ofinput data arise serious problems in other systems. This is illustrated with two examples: An
50

4.2. Framework-Structure
user
system
interface
user model
input data properties
1
2
3
4
Figure 4.1.: Framework for the evaluation of adaptive systems. Each informationprocessing step has to be evaluated on its own in a so called layeredevaluation
adaptive user support system (Encarnação and Stoev, 1999) might exploit actionsequences. Registering the number of sessions that the user completed or the numberof undoactions is probably highly reliable. There is no subjective judgment or othernoise involved in this observation. As opposed to that, an adaptive news broker(Billsus and Pazzani, 1999) has to care about the reliability much more. For example,users might provide feedback about a specific news story by selecting one of fourcategories:interesting, not interesting, I already know this, andtell me more aboutthis. But the answer depends on many uncontrollable factors. The user might haveread the story only roughly and might have overlooked some new facts. Or shemight read the same story somewhere else afterwards. Or, just for the moment, shemight not be interested in this kind of stories. Several other threats to reliability doarise here, and further inferences might be highly biased if the data quality is neitherassured nor considered in the inference process.
Similar problems occur in terms of external validity. For instance, in adaptivevalidity ofinput datalearning systems, visited pages are usually treated as read and sometimes even
as known (Brusilovsky et al., 1998; de Bra and Calvi, 1998; Weber, Kuhl andWeibelzahl, 2001). However, users might have scanned the page only shortly fora specific information, without paying attention to other parts of the page. Relyingon such input data might also cause maladaptations. Again, it is important to checkthe validity in order to know which inferences are allowed or possible.
51

4. A Framework for the Evaluation of Adaptive Systems
Anyway, in some systems the external validity is not of importance. For example,the number of mouse clicks is assessed objectively and no further interpretation isrequired to use this data as input for the inference of user properties.
For testing the data reliability the empirical test theory offers sufficient criteria andmethods. The reliability of questionnaires, test items, and user feedback is assessedwith retest- or split-half reliability measures. For instance, users of the news storybroker could be asked about the same story after a while again. If the users’ interestremains stable the data are assumed to be reliable. By observing the users’ interact-ion with a learning system or by asking questions about the content of a read page itis possible to assure that read pages are actually known.
4.2.2. Evaluation of Inference
Based on the input, properties of the user are inferred. The inference itself is derivedin many different ways ranging from simple rule based algorithms to Bayesian Net-works or Cased-Based Reasoning systems. Similar to the first step we can evaluatethe validity of the inference, too. In fact this means to check whether the inferredvalidity of
inference user properties do really exist.
An interesting method to do this, has been used in some of the evaluations listedin chapter 3.2 (e.g., Encarnação and Stoev, 1999; Green and Carberry, 1999; Sisonet al., 1998; Virvou and du Boulay, 1999). Comparing the system’s assumptionsabout the user with expert ratings or an external test may uncover false assumptions.For example, a system that adapts to key press errors (Trewin and Pain, 1997) can beevaluated in at least two ways. The system should either be able to detect differentgroups of users (e.g., subjects with disabilities vs. control group) or its assumptionsabout the users must be congruent with an expert’s assessment. The assumptionsof an adaptive learning system about the user’s knowledge may be assessed in anexternal knowledge test.
The decision whether an a-priori or post-hoc approach is chosen depends on theavailability of measurements and user groups; e.g., a knowledge test must be appliedafter the treatment, because the interaction influences the user’s learning gain.
The quality of this comparison strategy certainly depends on the validity of theexternal test. There might be user properties that cannot be assessed directly or thatcannot be assessed in another way than the one that is used by the system.
Note that this evaluation step checks the ‘correctness’ of the system’s assumptionsonly. The usefulness of the properties is completely ignored here.
52
4.2. Framework-Structure
4.2.3. Evaluation of Adaptation Decision
During the so called downward inference, the system decides how to adapt the inter-face, e.g., how to change the layout, what additional information should be provided,which commands to offer, or how to tailor the presentation.
Usually there are several possibilities of adaptation given the same user proper-comparingadaptationdecisions
ties. Besides the way the system adapts usually it is often possible to ignore the usermodel completely or to use a single stereotype for all users. In addition, for mostsystems there are even more adaptation decisions. For instance, a product recom-mendation system might have inferred a strong preference for a specific product. Itmight now either recommend this product to the customer, only limit the possibleselection to this product, indicate that there is a suggestion without naming it, oreven recommend another product randomly. Comparing these alternative decisionsmight help to explore a kind of baseline that indicates what usual (non-intelligent)behavior could achieve and whether adaptation really has advantages. Most currentevaluations compare the adaptive system with a non-adaptive version. However, thiscomparison might not be fair, because the non-adaptive version might be worse thanwhat can be achieved with standard methods.
The aim of this evaluation step is to figure out whether the chosen adaptation de-cision is the optimal one, given that the user properties have been inferred correctly.
4.2.4. Evaluation of Total Interaction
The last step evaluates the total interaction and thus, it assesses the whole system ina summative evaluation. We can observe the system behavior and the user behavior,i.e., the usability and the performance.
System Behavior
Several dimensions of the system behavior may be evaluated. The most importantis probably the frequency of adaptation. How often does adaptation occur duringfrequency of
adaptationthe interaction? For instance, an adaptive help system for UNIX (Virvou and duBoulay, 1999) might be perfect in identifying certain typing errors, but if these kindsof errors never occur in usual interactions the system cannot adapt.
Moreover, the frequency of certain adaptation types is important, too. For exam-frequency ofadaptationtypes
ple, a system might always chose the same adaptation decision. A product recom-mendation system might always come up with the same product, even if users differ,and different user properties are inferred, because not all combinations of user prop-
53
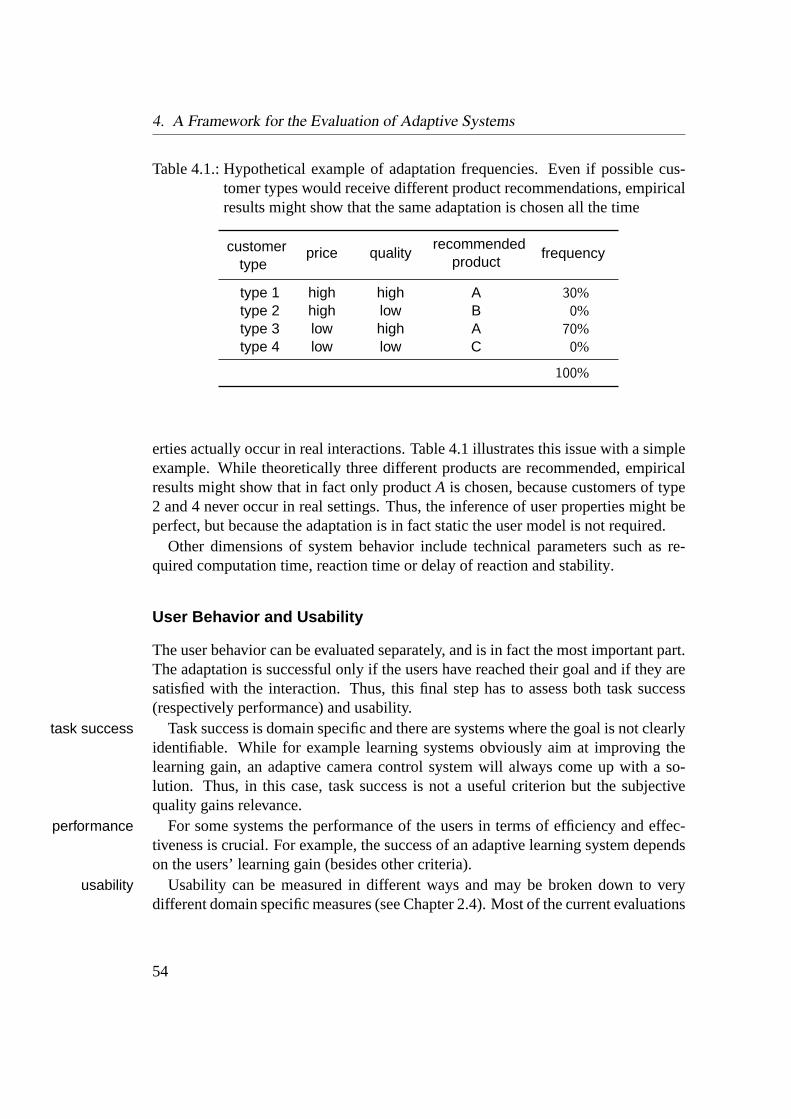
4. A Framework for the Evaluation of Adaptive Systems
Table 4.1.: Hypothetical example of adaptation frequencies. Even if possible cus-tomer types would receive different product recommendations, empiricalresults might show that the same adaptation is chosen all the time
customertype
price qualityrecommended
productfrequency
type 1 high high A 30%type 2 high low B 0%type 3 low high A 70%type 4 low low C 0%
100%
erties actually occur in real interactions. Table 4.1 illustrates this issue with a simpleexample. While theoretically three different products are recommended, empiricalresults might show that in fact only productA is chosen, because customers of type2 and 4 never occur in real settings. Thus, the inference of user properties might beperfect, but because the adaptation is in fact static the user model is not required.
Other dimensions of system behavior include technical parameters such as re-quired computation time, reaction time or delay of reaction and stability.
User Behavior and Usability
The user behavior can be evaluated separately, and is in fact the most important part.The adaptation is successful only if the users have reached their goal and if they aresatisfied with the interaction. Thus, this final step has to assess both task success(respectively performance) and usability.
Task success is domain specific and there are systems where the goal is not clearlytask successidentifiable. While for example learning systems obviously aim at improving thelearning gain, an adaptive camera control system will always come up with a so-lution. Thus, in this case, task success is not a useful criterion but the subjectivequality gains relevance.
For some systems the performance of the users in terms of efficiency and effec-performancetiveness is crucial. For example, the success of an adaptive learning system dependson the users’ learning gain (besides other criteria).
Usability can be measured in different ways and may be broken down to veryusabilitydifferent domain specific measures (see Chapter 2.4). Most of the current evaluations
54

4.3. Evaluation Procedure
use duration of interaction and non-standardized questionnaires for the assessmentof user satisfaction and subjective system preference.
As additional criterion we will introducebehavioral complexitywhich is a new behavioralcomplexitymeasure that is especially tailored for adaptivity success (see Chapter 4.4.3).
4.3. Evaluation Procedure
The evaluation steps of the framework should be seen as a so called layered evalu-layeredevaluationation (Karagiannidis and Sampson, 2000). The evaluation of all previous steps is
prerequisite to the current step. For example, we might find that a system infers in-correct user properties. This might have two reasons: either the inference itself hasa failure, or the input data are unreliable. Thus, we first have to evaluate the inputdata, and will then be able to trace back the incorrect user properties to one of thesereasons. The same holds for the evaluation steps 3 and 4. If there is no differencebetween an adaptive and a non-adaptive version of a system, this might be caused bywrong adaptation decisions, incorrect user properties, or unreliable input data.
In some systems one of the steps might be redundant. For example, a system mightacquire the number of mouse-clicks as input. These data are probably perfectlyreliable and of high validity. In this case an empirical evaluation of this step is notrequired.
In summary, while step 1 through 3 are part of a formative evaluation that provideshints for shortcomings, step 4 represents a global summative evaluation of the com-plete system. All four steps are interdependent and are required for a full evaluation.
4.4. Methods and Criteria for the EvaluationFramework
The ChapterCurrent Methods and Criteria(3.2) has already listed many of the pos-sibilities that may be applied within this framework. The following chapter cat-egorizes these criteria according to the framework and introduces two new criteria,structural characteristicsof the domain model of adaptive hypermedia, and so calledbehavioral complexity. Recently, the computation of several structural characteris-tics of the domain model in adaptive hypermedia has been proposed to evaluate theadaptivity degree of these systems. Thus, these measures could be useful for theevaluation of interaction (step 4 in the framework) in adaptive hypertext systems.
55
4. A Framework for the Evaluation of Adaptive Systems
Behavioral complexity may be used both for the evaluation of the adaptation deci-sion, when comparing different adaptations, and for the evaluation of the interaction.Both criteria are validated empirically and discussed in terms of their usefulness forthe evaluation of adaptive systems.
4.4.1. Categorization of Current Methods and Criteria
The criteria, found in current evaluations (Chapter 3.2) may be assigned to the stepsof the evaluation framework. An overview is given in Figure 4.2 and 4.3. Moreover,we added some criteria and methods that have been mentioned in the description ofthe evaluation framework. Certainly, some criteria apply for more than one evalu-ation step. In fact, the criteria for the evaluation of adaptation decision and for theevaluation of interaction are equal. These steps differ mainly in the methods and ob-jectives. For example, while decision evaluation might compare the usability of fourdifferent adaptive versions of a systems, the interaction evaluation might estimatethe system’s usability in real world use for different user groups.
Of course, both tables overlap to a certain degree. Methods and criteria are notorthogonal, and some methods are closely coupled with a criterion. For instance, thecomparison of user properties with an external assessment are measured in terms ofcongruency of both values.
4.4.2. Structural Characteristics of the Domain Model
Metrics for characteristics of the domain structure might be interesting criteria forthe evaluation of adaptive hypermedia.
One of the central components of adaptive hypermedia systems is the underlyingdomain model. Different relations between the knowledge concepts determine theadaptation mechanism. Predicting the adaptivity degree of a system based on struc-tural characteristics of the domain model, without empirical tests, would be verycomfortable. At least two purposes could be accomplished in an easy way:
First, structural characteristics could serve as easy criterion for the evaluation ofstructuralinformation forthe evaluationof interaction
interaction (step 4 of the proposed framework). Both, the system behavior and usa-bility could be estimated before any learner interacted with the system. The higherthe adaptivity degree, the better the adaptation to different types of users, and “thelarger will be the amount of users that can use the presentation in a personalizedway” (Cini and de Lima, 2002, p. 498).
Second, such a criterion could be interesting for authoring support. Existing adap-structuralinformation for
authoringsupport
tive learning environments (Brusilovsky et al., 1998; Carro, Pulido and Rodríguez,2001; de Bra and Calvi, 1998; Murray, Shen, Piemonte, Condit and Thibedeau, 2000;
56
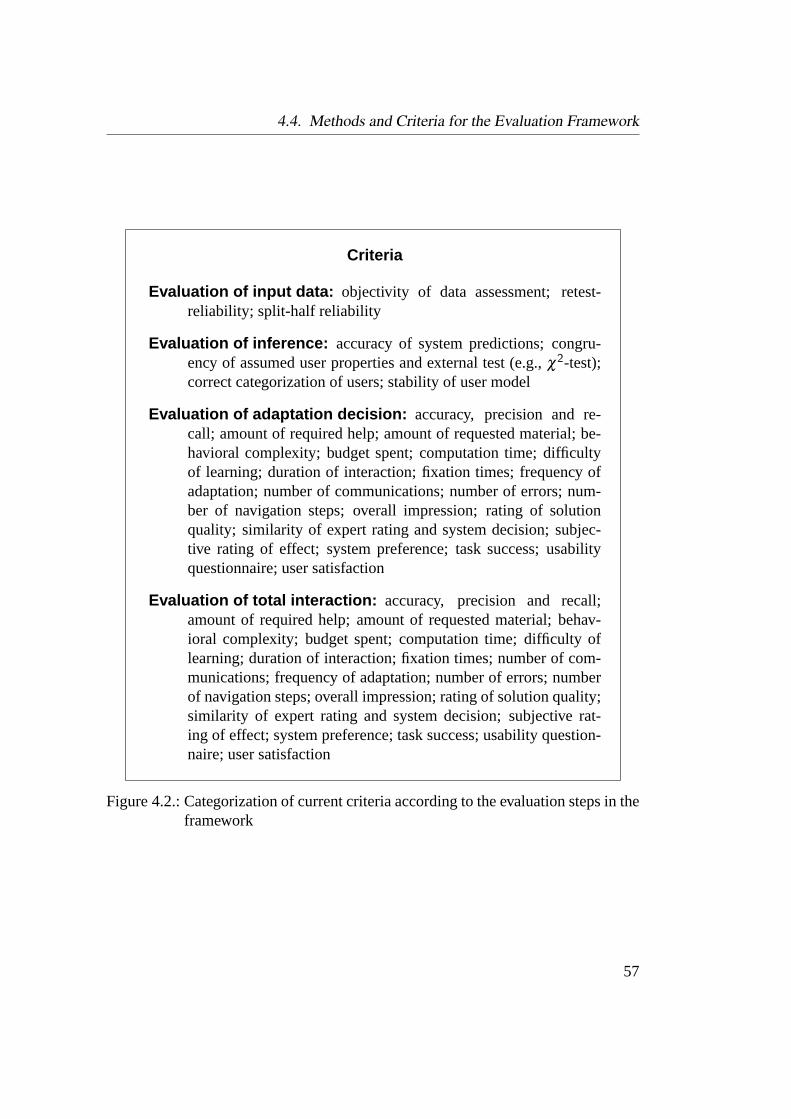
4.4. Methods and Criteria for the Evaluation Framework
Criteria
Evaluation of input data: objectivity of data assessment; retest-reliability; split-half reliability
Evaluation of inference: accuracy of system predictions; congru-ency of assumed user properties and external test (e.g.,χ2-test);correct categorization of users; stability of user model
Evaluation of adaptation decision: accuracy, precision and re-call; amount of required help; amount of requested material; be-havioral complexity; budget spent; computation time; difficultyof learning; duration of interaction; fixation times; frequency ofadaptation; number of communications; number of errors; num-ber of navigation steps; overall impression; rating of solutionquality; similarity of expert rating and system decision; subjec-tive rating of effect; system preference; task success; usabilityquestionnaire; user satisfaction
Evaluation of total interaction: accuracy, precision and recall;amount of required help; amount of requested material; behav-ioral complexity; budget spent; computation time; difficulty oflearning; duration of interaction; fixation times; number of com-munications; frequency of adaptation; number of errors; numberof navigation steps; overall impression; rating of solution quality;similarity of expert rating and system decision; subjective rat-ing of effect; system preference; task success; usability question-naire; user satisfaction
Figure 4.2.: Categorization of current criteria according to the evaluation steps in theframework
57
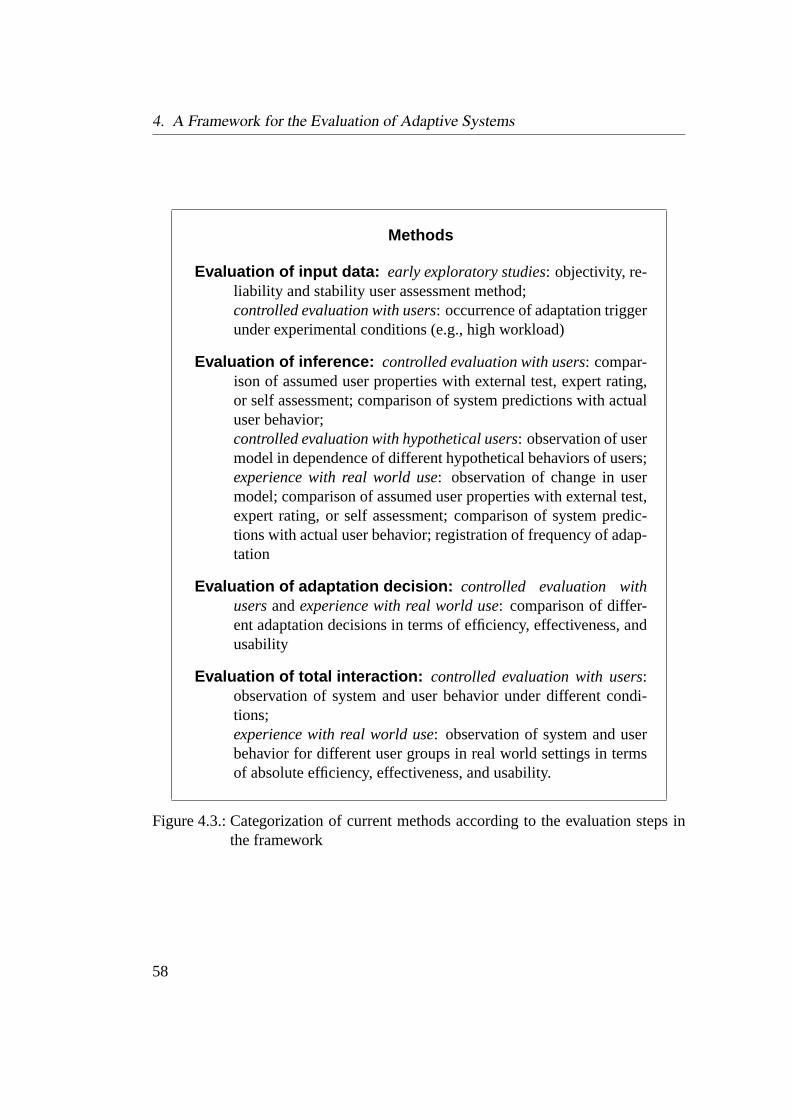
4. A Framework for the Evaluation of Adaptive Systems
Methods
Evaluation of input data: early exploratory studies: objectivity, re-liability and stability user assessment method;controlled evaluation with users: occurrence of adaptation triggerunder experimental conditions (e.g., high workload)
Evaluation of inference: controlled evaluation with users: compar-ison of assumed user properties with external test, expert rating,or self assessment; comparison of system predictions with actualuser behavior;controlled evaluation with hypothetical users: observation of usermodel in dependence of different hypothetical behaviors of users;experience with real world use: observation of change in usermodel; comparison of assumed user properties with external test,expert rating, or self assessment; comparison of system predic-tions with actual user behavior; registration of frequency of adap-tation
Evaluation of adaptation decision: controlled evaluation withusersandexperience with real world use: comparison of differ-ent adaptation decisions in terms of efficiency, effectiveness, andusability
Evaluation of total interaction: controlled evaluation with users:observation of system and user behavior under different condi-tions;experience with real world use: observation of system and userbehavior for different user groups in real world settings in termsof absolute efficiency, effectiveness, and usability.
Figure 4.3.: Categorization of current methods according to the evaluation steps inthe framework
58
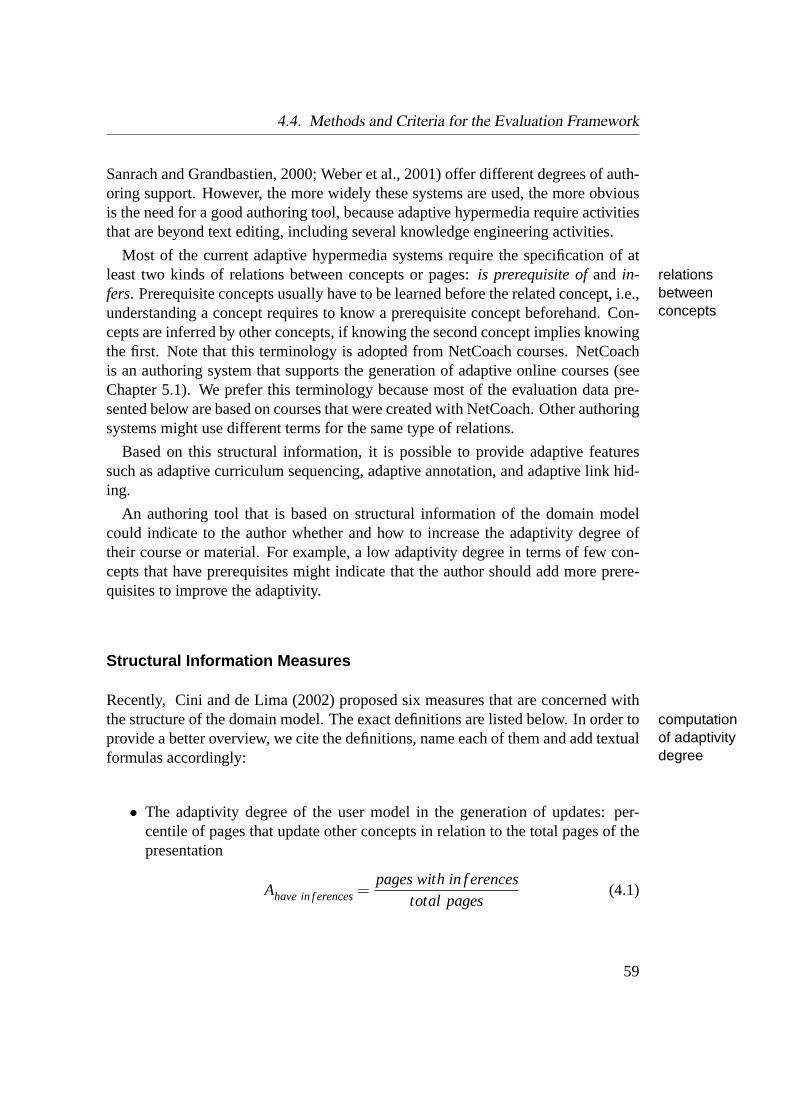
4.4. Methods and Criteria for the Evaluation Framework
Sanrach and Grandbastien, 2000; Weber et al., 2001) offer different degrees of auth-oring support. However, the more widely these systems are used, the more obviousis the need for a good authoring tool, because adaptive hypermedia require activitiesthat are beyond text editing, including several knowledge engineering activities.
Most of the current adaptive hypermedia systems require the specification of atleast two kinds of relations between concepts or pages:is prerequisite ofand in- relations
betweenconcepts
fers. Prerequisite concepts usually have to be learned before the related concept, i.e.,understanding a concept requires to know a prerequisite concept beforehand. Con-cepts are inferred by other concepts, if knowing the second concept implies knowingthe first. Note that this terminology is adopted from NetCoach courses. NetCoachis an authoring system that supports the generation of adaptive online courses (seeChapter 5.1). We prefer this terminology because most of the evaluation data pre-sented below are based on courses that were created with NetCoach. Other authoringsystems might use different terms for the same type of relations.
Based on this structural information, it is possible to provide adaptive featuressuch as adaptive curriculum sequencing, adaptive annotation, and adaptive link hid-ing.
An authoring tool that is based on structural information of the domain modelcould indicate to the author whether and how to increase the adaptivity degree oftheir course or material. For example, a low adaptivity degree in terms of few con-cepts that have prerequisites might indicate that the author should add more prere-quisites to improve the adaptivity.
Structural Information Measures
Recently, Cini and de Lima (2002) proposed six measures that are concerned withthe structure of the domain model. The exact definitions are listed below. In order tocomputation
of adaptivitydegree
provide a better overview, we cite the definitions, name each of them and add textualformulas accordingly:
• The adaptivity degree of the user model in the generation of updates: per-centile of pages that update other concepts in relation to the total pages of thepresentation
Ahave in f erences=pages with in f erences
total pages(4.1)
59
4. A Framework for the Evaluation of Adaptive Systems
• The adaptivity degree in the restrictions of the adaptation model: percentile ofpages that have restrictions for their presentation in relation to the total pagesof the presentation
Ahave prerequisites=pages with prerequisites
total pages(4.2)
• The user adaptable behavior degree in the presentation: percentile of conceptswhich can be altered directly by the user and are used as requirements to re-strict other concepts in relation to the total number of concepts which can bealtered directly by the user
Aadaptable=adaptable concepts that are prerequisites
adaptable concepts(4.3)
• The content adaptation degree in the pages: percentile of pages that have con-ditional fragments in relation to the total number of pages
Ahave conditional f ragments=pages with conditional f ragments
total pages(4.4)
• The adaptive navigation degree in the pages: percentile of pages that haveconditional links in relation to the total pages of the presentation
Ahave conditional links=pages with conditional links
total pages(4.5)
• The existence of an adaptive navigational map
The rational of theAhave ... measures is, that only pages (or concepts) thathaveany relation to other concepts increase the adaptivity. All other pages are static.However, we argue that adaptivity degree could be interpreted the other way roundas well: the more concepts thatareprerequisite of another concept the more differentadaptive suggestions may occur during interaction. Accordingly, the more conceptsthat are inferred by other concepts, the more pages might be skipped to reach alearning objective. Thus, we propose to consider the followingAare ... measures aswell:
• Percentile of concepts that are prerequisites of pages in relation to the totalconcepts. The more concepts, prerequisite of at least one concept, exist themore different guiding suggestions may occur.
Aare prerequisites=concepts that are prerequisite
total concepts(4.6)
60
4.4. Methods and Criteria for the Evaluation Framework
• Percentile of concepts that are inferred by pages in relation to the total con-cepts. The more concepts are inferred by a page the more changes may occurin the user model.
Aare in f erred=concepts that are in f erred by other concepts
total concepts(4.7)
Both,Aare prerequisites andAare inferred can be influenced by making implicit relationsexplicit without changing the structure. For instance, ifA is prerequisite ofB andBis prerequisite ofC, thenA is also prerequisite ofC. Adding this last relation wouldincreaseAare prerequisites, but the domain model would remain the same. Thus, forthe computation of the above measures we also considered these indirect relations,because NetCoach uses them for the adaptation mechanism as well.
Moreover, we could also compare the number of relations that have been specifiedby the author. I.e., instead of counting the concepts that are or have prerequisites wecould register how many prerequisites there are. The absolute number of relationsshould be standardized by the number of possible relations.
• Relative amount of prerequisites in relation to the maximum number of possi-ble prerequisites
Aprerequisite rate=total prerequisites
Pmax(4.8)
• Relative amount of inferences in relation to the maximum number of possibleinferences
Ain f erence rate=total in f erences
Imax(4.9)
In NetCoach courses, for which we present some empirical data below, themaximum of prerequisitesPmax and the maximum of inferencesImax that canbe specified depends on the number of conceptsn only, while cyclic prerequi-sites are disallowed.
Pmax= Imax=n× (n−1)
2(4.10)
The prerequisite measures obviously require that the user is free to navigate troughthe course. Otherwise a course with the maximal amount of prerequisites would becompletely rigid, and not adaptive at all.
61

4. A Framework for the Evaluation of Adaptive Systems
Empirical Validation of Structural Information Measures
The previous section lists many different measures, but which of them are useful?Should we urge authors of courses with low adaptivity degree to specify more con-cept relations to get better adaptivity?
We collected some empirical data from eight different NetCoach courses in dif-empiricalsetting ferent domains to answer this question. Most of these courses are part of the PSI
project (Lippitsch, Weibelzahl and Weber, 2003) which develops adaptive onlinecourses based on the authoring system NetCoach (Weber et al., 2001) to introducestudents to pedagogical psychology. The course subjects include interpersonal com-munication (Kommunikation), student assessment (Leistungsbeurteilung), empiricalmethods (Methoden), social perception (Personenwahrnehmung), cognitive devel-opmental psychology (Piaget), problem solving (Problemloesen), and psycholgicalfields (Psychologie).
Students had to complete these courses as part of their curriculum. In addition,all courses, including theHTML-Tutor, which introduces publishing on the web, areavailable online for everybody. At the end of each course a questionnaire was pre-subjective
rating sented and the learners had to rate the course in terms of several dimensions, includ-ing navigation, orientation, adaptation in general, annotation, and page suggestionson a 10-point scale:
• Navigation:navigating through the course is . . .(difficult . . . easy)
• Orientation:during interaction I knew my current location (chapter, page) inthe course.(never . . . always)
• Adaptation in general:the course adapted to your learning progress. Do youthink this was successful?(not successful at all . . . very successful)
• Annotation: in the table of contents on the left hand side, chapters were an-notated with different colors in accordance with your current knowledge level.The system intended to improve your orientation throughout the course by this.(not successful at all . . . very successful)
• Page suggestions:the system tried to suggest pages to you that are adequatefor your knowledge level. Has this been successful?(not successful at all. . . very successful)
In addition, the learners had to rate their impression of the interaction with thesystem in respect to four dimensions on a 10-point scale: terrible . . . wonderful;difficult . . . easy; monotonous . . . stimulating; rigid . . . flexible. We will call the meanvalue of these four scalesoverall impressionof a course.
The upper part of Table 4.2 shows the mean values of these ratings for all courses.empiricalresults
62

4.4. Methods and Criteria for the Evaluation Framework
In addition, we computed six of the structural measures for each course separately.The other measures cannot be applied to NetCoach courses, because there are nei-ther conditional fragments, nor conditional links. Moreover, all pages are adaptablein terms of their knowledge status directly by the user, and thusAadaptable is equalto Aare inferred. Both, conditional fragments and conditional links are specific forAHA! courses, which have been the main targets of Cini and de Lima (2002).AHA!(Adaptive Hypermedia Architecture) supports authors in implementing adaptive hy-pertexts, similar to NetCoach. Note that many of the structural measures that areconcerned with inferences are 0. In six of the eight courses it was impossible tospecify any inference. Thus, the following results for the inference measures arelimited. However, other courses in different domains will have few inferences aswell, because the condition of implying a complete concept is hard to fulfill.
Given these data, it is possible to correlate the structural course measures withthe subjective ratings, in order to estimate the relation between these variables. Theresults are shown in Table 4.3.
Despite the very big sample size, all bivariate correlations are quite low (|r| ≤ .1),i.e., onlyr2 < 1% or less of the variance in one variable can be explained by the other.Taking an effect size ofr = .1 for granted (which is very low) the correlations havea test power of1−β > .95, i.e., even very small effects would probably have beendetected. Nevertheless, four correlation are significant, all of which are very low.In summary, we found some statistically significant correlations, but the empiricaleffect size is probably not of importance for educational purposes.
Discussion of Structural Information Measures
There are at least three possible interpretations of these results. First, the fact thatwe failed to find considerable relations between the learners’ subjective ratings andthe structure of the courses might indicate, that all of the proposed measures areuseless for authors. The specified content structure does not provide hints for furtherimprovement of course adaptivity. At least it seems not to be related to the subjectiveimpression of the users. Nevertheless, adaptivity degree might be useful for authorsto get a kind of summary of their presentation.
However, and this is the second interpretation, the subjective ratings might havebeen useless to indicate what the structural measures should detect. The learners’answers in the questionnaire might have been influenced by the overall impressionof the system regardless of the factual adaptivity success. As shown in Table 4.3, theoverall impression correlates highly with the subjective adaptivity success measures,but not with the structural measures. However, a partial correlation with control foroverall impression improves only slightly the relation between subjective ratings and
63

4. A Framework for the Evaluation of Adaptive Systems
Table 4.2.: Mean values of subjective ratings and structural information of eight Net-Coach courses on a 10-point scale (0-9). The sample sizes for the subjec-tive ratings are shown in table 4.3
Kom
mun
ikat
ion
Leis
tung
sbeu
rtei
lung
Met
hode
n
Per
sone
nwah
rneh
mun
g
Pia
get
Pro
blem
loes
en
Psy
chol
ogie
HT
ML-
Tuto
r
subj
ectiv
era
tings
navigation 7.35 7.24 7.09 7.53 7.06 7.22 6.77 6.86
orientation 7.1 7.06 7.37 7.78 7.37 7.82 6.98 7.12
adaptation 6.26 5.64 6.14 6.3 5.72 6.3 6.02 5.95
suggestions 6.51 5.94 6.32 6.53 5.94 6.55 6.39 5.91
annotation 6.5 6.07 5.99 6.64 6.2 6.3 5.52 6.09
overall impression 5.54 4.59 5.30 5.53 4.68 5.78 5.42 6.07
stru
ctur
e
Aare prerequisites 0.63 0.96 0.97 0.92 0.72 0.76 0.96 0.95
Ahave prerequisites 0.97 0.98 0.97 0.95 0.95 0.96 0.96 0.92
Aprerequisite rate 0.79 1 1 0.95 0.79 0.83 1 0.88
Aare inferred 0 0 0.15 0 0 0 0 0.37
Ahave inferences 0 0 0.13 0 0 0 0 0.1
Ainference rate 0 0 0.02 0 0 0 0 0.04
64
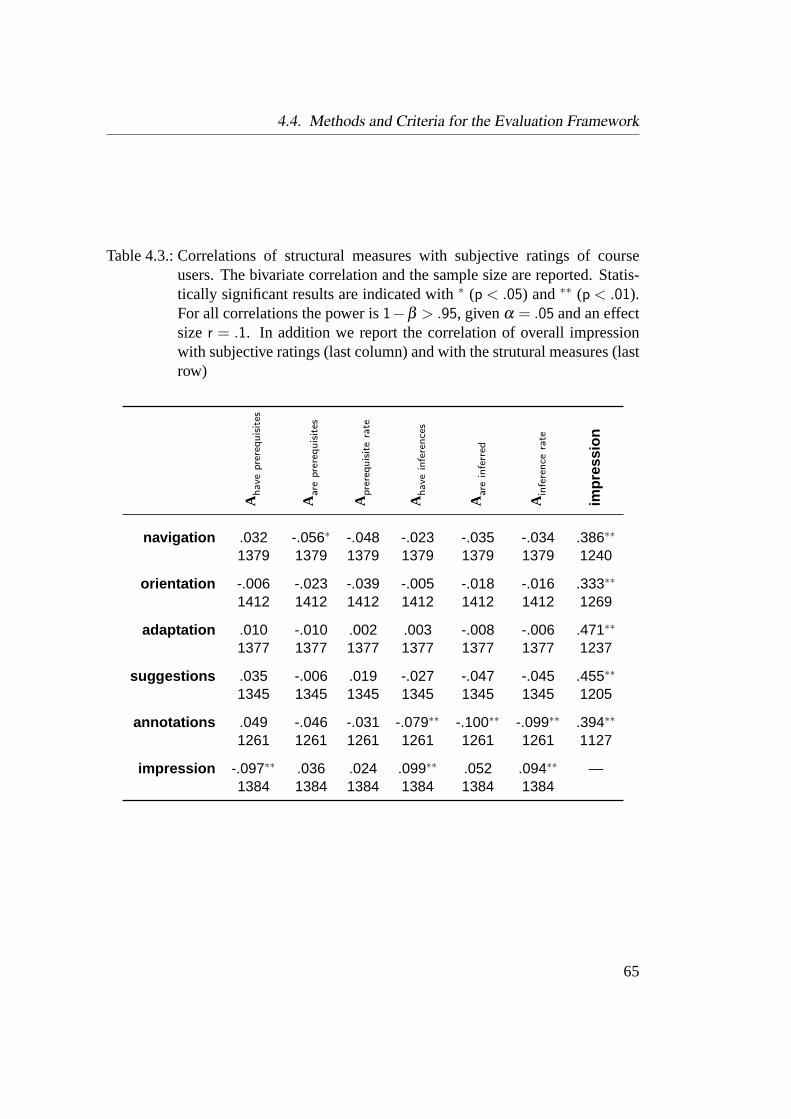
4.4. Methods and Criteria for the Evaluation Framework
Table 4.3.: Correlations of structural measures with subjective ratings of courseusers. The bivariate correlation and the sample size are reported. Statis-tically significant results are indicated with∗ (p < .05) and∗∗ (p < .01).For all correlations the power is1−β > .95, givenα = .05 and an effectsize r = .1. In addition we report the correlation of overall impressionwith subjective ratings (last column) and with the strutural measures (lastrow)
Ahave
pre
requisites
Aar
epre
requisites
Apre
requisite
rate
Ahave
infe
rence
s
Aar
ein
ferr
ed
Ain
fere
nce
rate
impr
essi
on
navigation .032 -.056∗ -.048 -.023 -.035 -.034 .386∗∗
1379 1379 1379 1379 1379 1379 1240
orientation -.006 -.023 -.039 -.005 -.018 -.016 .333∗∗
1412 1412 1412 1412 1412 1412 1269
adaptation .010 -.010 .002 .003 -.008 -.006 .471∗∗
1377 1377 1377 1377 1377 1377 1237
suggestions .035 -.006 .019 -.027 -.047 -.045 .455∗∗
1345 1345 1345 1345 1345 1345 1205
annotations .049 -.046 -.031 -.079∗∗ -.100∗∗ -.099∗∗ .394∗∗
1261 1261 1261 1261 1261 1261 1127
impression -.097∗∗ .036 .024 .099∗∗ .052 .094∗∗ —1384 1384 1384 1384 1384 1384
65

4. A Framework for the Evaluation of Adaptive Systems
course structure. The highest bivariate correlation (Ahave prerequisite correlated withannotation) is raised to.095. All partial correlations with other structural measuresare negative. This is, in fact, an implicit problem of the evaluation of adaptivity. Theperfect adaptation is not even noticed by the user and can thus not be reported.
Third, we have to consider the fact, that adaptation is never independent of thecontent. As opposed to the idea, that more concept relations and a higher adaptiv-ity degree result in a better course, each content might have its own ideal structure.Adaptivity degree might be an inherent property of a content that cannot be influ-enced. While some contents have many internal dependencies, others might haveonly very few. Increasing the adaptivity degree by specifying additional relationswill not improve the adaptivity any more, or might even yield mal-adaptations.
Thus, the proposed structural measures might be interesting to compare the degreeof possible adaptivity across contents, but our data do not support the claim, that theyare useful for authoring support and evaluation.
A better way of supporting authors in specifying relations might be to visualizethe domain (e.g., as a network or a matrix) or to check the relations for consistencyautomatically (Wu, Houben and de Bra, 1999), in order to avoid loops and otherfailures that would disturb the adaptation process.
4.4.3. Behavioral Complexity
Several of the evaluations report only weak differences between adaptive and non-adaptive versions of systems in terms of measures like duration or learning gain(Specht, 1998; Weber and Specht, 1997a). Many criteria suffer from low reliabilityor at least have not shown to be reliable. Thus, we claim that only those criteria thatare specific for adaptivity and that are validated are acceptable.
The basic idea of our approach is that adaptivity aims at reducing the complexityreduction ofinteractioncomplexity
of interaction. The users should achieve their goals more easily. Adaptivity shifts thedivision of labor between user and system (Jameson, 1999). The system may takeover routine tasks, such as planning-, sorting-, or selecting tasks or it may reduce thecomplexity of the task itself. Here are some examples that illustrate what is meant bycomplexity reduction. An adaptive help system (Encarnação and Stoev, 1999) mayinfer the user’s current goals and select help texts accordingly. Thus, an overview ofall the topics is not forced upon the user. An adaptive product presentation system(Jörding, 1999) simplifies the search for information by offering the products in themost suitable way. An adaptive learning system (Specht, 1998) supports the user’snavigation by link annotation and curriculum sequencing. Thus, learners do not haveto pay attention to the navigation itself and may focus on the learning task.
66

4.4. Methods and Criteria for the Evaluation Framework
Device Representation
To control a device the user needs a cognitive representation of the device. This issometimes called a mental model (Norman, 1983). According to Schoppek (2002)two main types of knowledge are discussed in the literature for controlling a dynamicsystem: first, input-output knowledge (I-O-knowledge) represents specific input val-I-O-knowledgeues together with the corresponding output values. Second, structural knowledge isdefined as general knowledge about the variables of a system and their causal rela-tions. The author proposes that both knowledge types are required, but the impact ofstructural
knowledgeeach type depends on the system size, and in turn its complexity. While for very largesystems with several thousands of states general knowledge about the structure canbe helpful for controlling it, for rather small systems it appears to be sufficient to ac-quire I-O-knowledge. Experimental results show that uninstructed subjects did noteven try to identify general rules, while I-O-knowledge is acquired spontaneously(Schoppek, 2002). In accordance with this approach, Broadbent, Fitzgerald andBroadbent (1986) describe the interaction with small systems as a kind of lookuptable, where the users try to reach their goals by anticipating the device behaviorbased on the result of previous interaction steps.
Most of the adaptive systems described in this thesis probably belong to the smallor mid-sized system, thus I-O-knowledge is probably very important here. Its roleis even more emphasized if we consider, that many adaptive systems are single-use system, i.e., they are used only once to complete a certain task, e.g., learninga specific content or finding a product. Often the interaction is too short to extractexplicit rules.
If we accept that I-O-knowledge is crucial (though of course not sufficient) fordefining the user’s device knowledge, a description of the interaction behavior be-comes important. According to Kieras and Polson (1999) the concrete behavior ofa user can be described as a state-transition-network. The system changes its currentinteraction as
state-transitionnetworks
state when the user initiates an action. For example, mouse-clicks, commands, orthe selection from a menu initiate such a transition and the system enters a new stateor returns to a previous visited state. Text-editing skills can be modeled with such anetwork (Bovair, Kieras and Polson, 1990).
The analysis of protocol data yields an individual transition network for every user.protocolanalysisUsers that are familiar with the system are able to find the shortest path through the
network to reach the final state (Borgman, 1999). Other users that have incompleteor even incorrect knowledge have to enrich the entire concrete task solving processwith a lot of heuristics or trial and error strategies (Rauterberg and Fjeld, 1998).They will return to a previous state if they realize that the chosen transition did notresult in the effect they wanted.
67

4. A Framework for the Evaluation of Adaptive Systems
resultsoverview
search criteriasection I
search criteriasection II
search criteriasection III
detailed viewproduct 1
detailed viewproduct 2
start
next search
new search details
next
details
backsearch
end
Figure 4.4.: Example of an state-transition-network for the interaction of a user withthe product recommendation system CASTLE. States are represented byrectangles, transitions by ellipses
By exploring the system the users can increase their knowledge about the sys-tem’s functions, but this exploration also results in a more complex network with anincreased number of states and transitions, an increased number of cycles within thenetwork, and a higher network density.
Figure 4.4 shows an example of a state-transition-network for the interaction ofa user with an adaptive online product recommendation system called CASTLE(Weibelzahl, 1999). Basically, each state represents a page with different searchforms or presentation modes. The user navigates between the states with differentlinks, e.g., a search button. Note that this is not an one-to-one representation of theinteraction. State and transitions that have been used more than once result in a sin-gle node only. Thus, the same network is derived regardless of whether the user usedthe same path once or several times.
Other methods have been proposed to model the knowledge that is required forcontrolling a device, and the user’s goals and tasks, referred to as cognitive task
68

4.4. Methods and Criteria for the Evaluation Framework
analysis (de Haan, van der Veer and van Vliet, 1991; Dix et al., 1998; Grant andcognitive taskanalysisMayes, 1991). Some of these methods, such asGoals, Operators, Methods and Se-
lection , GOMS (Arend, 1991) or thetask action grammar, TAG (Reisner, 1984),might help to identify the relevant states and transitions. However, they are lim-ited to error-free behavior and might thus fail to represent the complete interaction(Rasmussen, 1997). State-transition-networks allow for representation of more thanone best wayof task completion, which means they are able to distinguish betweentask and activity (Juvina, Trausan-Matu, Iosif, van der Veer, Marhan and Chisalita,2002).
In summary, we propose to model the interaction between user and system as astate-transition-network, which allows inferences about the user’s knowledge. Weclaim, that adaptivity aims at reducing the interaction complexity which can be mea-sured by means of these networks.
Measurement of Behavioral Complexity
If adaptivity reduces the interaction complexity, adaptivity effects can be measuredby assessing the complexity of the state-transition-networks.
Rauterberg (1992) compares four different complexity measures, that are derivedcomplexitymeasuresfrom graph theory (Curtis, Sheppard, Milliman, Borst and Love, 1979; McCabe,
1976). The most simple measure isCstate. Here, complexity equals the number ofstates found in a network.
Cstate= S (4.11)
But obviously, complexity of devices must consider the relations between the states,too. Otherwise, a system that bundles all functions on a single page would be cate-gorized as less complex, while intuitively at least clusters of functions that belongtogether should be separated to improve the usability. Thus,Cfan computes the rela-tion of states andtransitions, which represents a kind of structural complexity.
Cf an =TS
(4.12)
The third measure extracts the number of cycles in the network. Thus, it indicateshow often a user returned to a previous state.
Ccycle= T−S+P (4.13)
For the examples cited throughout this thesis the constantP always equals 1, and isused for correction purposes only.
69
4. A Framework for the Evaluation of Adaptive Systems
The fourth complexity measure (Cdensity) shows the network’s density in relationto the maximal possible density.
Cdensity=T
S× (S−1)(4.14)
The following equations compute these four complexity measures for the examplenetwork shown in Figure 4.4. The number of states equalingS = 6, andT = 8transitions have been used.
Cstate = 6 (4.15)
Cfan =8
6= 1,33 (4.16)
Ccycle = 8−6+1 = 3 (4.17)
Cdensity =8
6× (6−1)= 0,27 (4.18)
All four measures have been applied to software-evaluation. According to Rauter-software-evaluation
withcomplexity
berg (1992) all of them discern between novices and experts. The latter showed lesscomplex behavior when completing a task with a database system. However, op-posed to what was expected,Cstate andCdensity varied with different tasks, i.e., theyare only useful for experimental settings with constant tasks. Comparing differenttasks with these measures is impossible. For the evaluation of adaptive systems thisis not a serious limitation, because adaptivity aims at simplifying a constant task.
Empirical Validation of Behavioral Complexity
In a laboratory experiment Weibelzahl and Weber (2000) compared four measuresof complexity for the interaction with an adaptive product recommendation system.CASTLE recommends vacation homes in France (Weibelzahl, 1999; Weibelzahland Weber, 1999). It adapts to the user’s needs and preferences by referring to theexperience with similar customers. It will suggest vacation homes that are similar tothose that have been booked by customers who have indicated similar preferences.
Participants were ask to find a suitable vacation home under one of two conditions.methodWhile group 1was supported by the user modeling component,group 2received noindividual recommendations but was allowed to use the same functions as the firstgroup when searching the electronic catalog. Afterwards, both groups had to fill inselected items of theQuestionnaire of User Interaction Satisfaction, QUIS(Chin,Diehl and Norman, 1988).
70

4.4. Methods and Criteria for the Evaluation Framework
Table 4.4.: Comparison of four complexity measures for two groups of users. Par-ticipants ingroup 1were supported by an adaptive version of CASTLE,while group 2received no individual recommendations. Sample size (N),mean (x), standard deviation (σ ), statistical significance of the mean dif-ference (α), and effect size (d) are reported
group N x σ α d
Cstate
1 25 18.36 3.28.029∗ 0.712 17 20.70 3.31
Cfan
1 25 1.47 0.17.985 —2 17 1.47 0.21
Ccycle
1 25 9.88 4.05.003∗ 0.992 17 13.88 4.04
Cdensity
1 25 0.087 0.015.029∗ 4.272 17 0.100 0.023
The experimental group required less time to find a suitable home and was moresatisfied with the interaction. However, the results of this first evaluation study werenot statistically significant.
The same data set was reanalyzed in terms of behavioral complexity. Table 4.4resultsreveals the differences between the groups for the four complexity measures.
Users who had been supported by the adaptive system produced behavior of re-treatmenteffectsduced complexity compared to users that completed the same task (“Find a suitable
vacation home in this electronic catalog”) with a non-adaptive version. Certainly,the absolute value of the measures does not matter, only the differences betweenthe groups is of importance here. In fact,Cstate, Ccycle, andCdensity can discern thedifferent treatments.
For further validation of the measures we explored the relation of behavioral com-externalvalidityplexity to thetotal duration of interactionand to thesubjective satisfaction with the
interactionbased on the QUIS items. Higher values indicate higher interaction satis-faction. Furthermore, we expected that participants who are experienced in the useof computers and the internet will show less complex behavior. Subjects assessedtheir experience on a five grade scale.
71
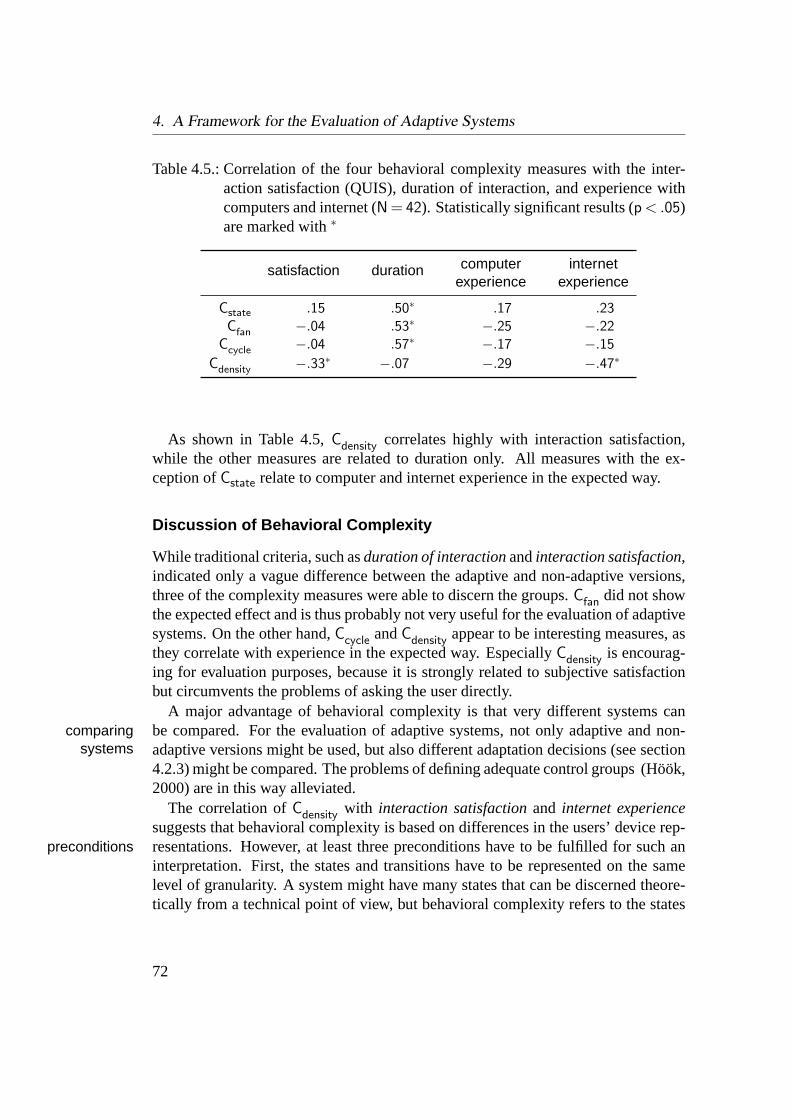
4. A Framework for the Evaluation of Adaptive Systems
Table 4.5.: Correlation of the four behavioral complexity measures with the inter-action satisfaction (QUIS), duration of interaction, and experience withcomputers and internet (N = 42). Statistically significant results (p < .05)are marked with∗
computer internetsatisfaction durationexperience experience
Cstate .15 .50∗ .17 .23Cfan −.04 .53∗ −.25 −.22
Ccycle −.04 .57∗ −.17 −.15
Cdensity −.33∗ −.07 −.29 −.47∗
As shown in Table 4.5,Cdensity correlates highly with interaction satisfaction,while the other measures are related to duration only. All measures with the ex-ception ofCstate relate to computer and internet experience in the expected way.
Discussion of Behavioral Complexity
While traditional criteria, such asduration of interactionandinteraction satisfaction,indicated only a vague difference between the adaptive and non-adaptive versions,three of the complexity measures were able to discern the groups.Cfan did not showthe expected effect and is thus probably not very useful for the evaluation of adaptivesystems. On the other hand,Ccycle andCdensity appear to be interesting measures, asthey correlate with experience in the expected way. EspeciallyCdensity is encourag-ing for evaluation purposes, because it is strongly related to subjective satisfactionbut circumvents the problems of asking the user directly.
A major advantage of behavioral complexity is that very different systems canbe compared. For the evaluation of adaptive systems, not only adaptive and non-comparing
systems adaptive versions might be used, but also different adaptation decisions (see section4.2.3) might be compared. The problems of defining adequate control groups (Höök,2000) are in this way alleviated.
The correlation ofCdensity with interaction satisfactionand internet experiencesuggests that behavioral complexity is based on differences in the users’ device rep-resentations. However, at least three preconditions have to be fulfilled for such anpreconditionsinterpretation. First, the states and transitions have to be represented on the samelevel of granularity. A system might have many states that can be discerned theore-tically from a technical point of view, but behavioral complexity refers to the states
72

4.5. The Framework as Categorization Grid
and transitions that are perceived by the user. For hypertext systems the definitionof states and transitions is not too complicated, because web pages are usually staticand clearly separated. In stand-alone applications, with a continuous interaction,states and transitions have to be defined carefully. Cognitive task analysis suggestsadequate granularity.
Second, all users must solve the same task, i.e., aim for the same goal state. Think-ing aloud or explicit instruction assures this fact. Otherwise the complexity measuresbecome useless for comparisons.
Third, the complexity measures imply that all transitions have the same costs, i.e.,all transitions can be learned equally. In CASTLE the transitions are very simi-lar. But an adaptive system could in principle replace three easy to learn steps byone very difficult to learn command, e.g., offering a command-line interface insteadof several selection forms. Obviously, the aggregated version would result in lowerbehavioral complexity, but from a cognitive point of view the selection task is prefer-able. Thus, we either have to make sure that the transitions have the same costs, orthe complexity formulas have to be extended by weights for different transitions.
Several other metrics have been proposed to assess the complexity or the structurerelated workof navigation behavior in hypertext (see e.g., Pitkow and Pirolli, 1999, and Herder,2002, for an overview). Most of these measures are designed to assess the structureof a complete site. However, if we see the user behavior as an overlay of the site-structure, the same metrics are applicable for individual navigation as well.
Similar to the graph density (Cdensity), Botafogo, Rivlin and Shneiderman (1992)introduced acompactnessmeasure which is based on the distance between all pages.Thestratummetric indicates the linearity of the graph which is similar to the numberof cycles (Ccycle). Moreover, the depth of a node (Botafogo et al., 1992), i.e., thedistance from the root node, and the size of the cycles in the graph (Buckley andHarary, 1990) might be important characteristics of the behavior, especially becauseshorter navigation paths can improve the user satisfaction (Smyth and Cotter, 2002).The usefulness of these measures for the evaluation of adaptive systems needs to stillbe explored.
4.5. The Framework as Categorization Grid
The evaluation framework can be used as both, a structured approach for evaluationstudies, and a categorization grid for existing studies. We categorized the currentevaluation studies in accordance with this framework to see which evaluation stepshave been applied regularly, and where we can identify omissions.
73
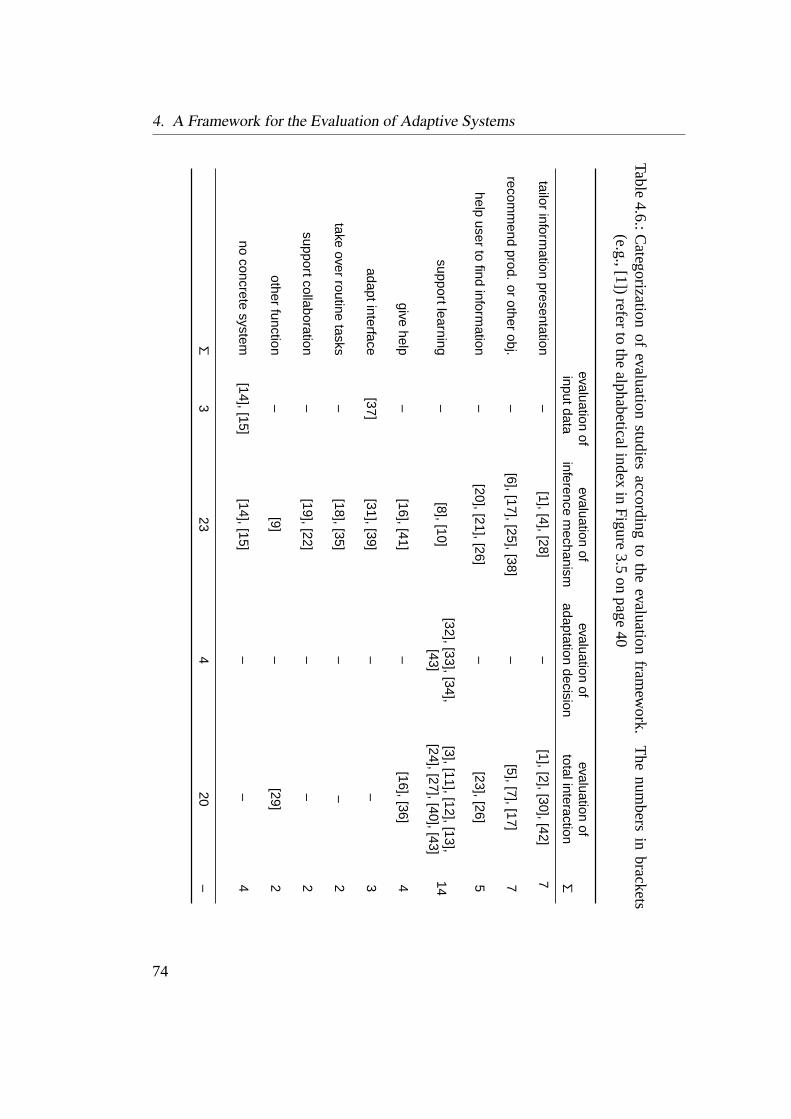
4. A Framework for the Evaluation of Adaptive Systems
Table4.6.:C
ategorizationof
evaluationstudies
accordingto
theevaluation
framew
ork.T
henum
bersin
brackets(e.g.,[1])
referto
thealphabeticalindex
inF
igure3.5
onpage
40
evaluationof
evaluationof
evaluationof
evaluationof
inputdatainference
mechanism
adaptationdecision
totalinteractionΣ
tailorinform
ationpresentation
–[1],[4],[28]
–[1],[2],[30],[42]
7
recomm
endprod.
orother
obj.–
[6],[17],[25],[38]–
[5],[7],[17]7
helpuser
tofind
information
–[20],[21],[26]
–[23],[26]
5
supportlearning–
[8],[10][32],[33],[34],
[43][3],[11],[12],[13],[24],[27],[40],[43]
14
givehelp
–[16],[41]
–[16],[36]
4
adaptinterface[37]
[31],[39]–
–3
takeover
routinetasks
–[18],[35]
––
2
supportcollaboration–
[19],[22]–
–2
otherfunction
–[9]
–[29]
2
noconcrete
system[14],[15]
[14],[15]–
–4
Σ3
234
20–
74
4.6. Related Work
As shown in Table 4.6 almost all studies evaluate either theinference mechanismor thetotal interaction. Differentadaptation decisionsare examined only for adap-tive learning systems. In other words, for all other systems it has not been consideredthat the same user properties could have been used in another way than the one al-ready implemented.
Three studies are related to the evaluation of input data. These studies are con-cerned with visual search, access log analysis and keyboard skills. Only the last oneis part of an existing system.
However, the synopsis did not contain studies about the evaluation of input datafor any other task. For instance, for an adaptive product recommendation systemutterances are not always that clear and customers might even try to cheat the system.Thus, some basic studies about the reliability of customer data is urgently required,but also for other user properties.
This analysis suggests two important requirements for further evaluations. First,input dataevaluationsthe input data of adaptive systems are evaluated in only a few studies. More in-
vestigations that demonstrate the quality of these data are necessary for all kinds ofadaptive systems. The assessment of input data is the first information processingstep and all further inferences rely on this data. This is actually a lack in currentevaluations that should be considered in the future.
Secondly, different adaptation decisions need to be evaluated on a larger scale, too.adaptationdecisionWhile there are some studies for adaptive learning systems, evaluations for other
system functions are completely missing. In fact the chosen adaptation decisionoften seems obvious, but only by looking at alternatives can it be revealed whetherthis is the optimal decision. A recent study (Jameson and Schwarzkopf, 2002)demonstrates that users may differ markedly in their responses to different adaptationdecisions.
4.6. Related Work
Recently, two other frameworks for the evaluation of adaptive systems have beenproposed (Brusilovsky et al., 2001; Paramythis et al., 2001). The main idea be-hind all three frameworks is to break down the monolithic evaluation process intoseveral components which can be evaluated separately. Early thoughts on how todefine different measures for different components of the adaptation process havebeen formulated by Totterdell and Boyle (1990).
The main difference between the three approaches is the number of componentsthat are identified. Brusilovsky et al. (2001) demonstrated the benefits of the layeredBrusilovsky,
Karagiannidisand Sampson
evaluation approach with two evaluation steps. The authors distinguish theinteract-
75
4. A Framework for the Evaluation of Adaptive Systems
ion assessmentfrom theadaptation decision. The evaluation of the first layer coversboth the low level monitoring (i.e., the observation of the user) and the high-levelinferences. Thus, this approach is very similar to the one proposed in this work,though we claim that several distinctions that are found in our framework only (e.g.,input data assessment vs. inference of user properties) are relevant and should notbe skipped.
Paramythis et al. (2001) proposed distinguishing five components that are veryParamythis,Totter and
Stephanidissimilar to the steps found in our framework:interaction monitoring, interpretation/ inferences, modeling, adaptation decision making, applying adaptation. Thus, incomparison with our framework there are two differences. First,inferencesandmod-eling are two distinct components here. However, the authors are not quite clear inrespect to the fact that inference module represents a process while the modelingmodule is a component. Second, the last component (applying adaptations) has beensubsumed underadaptation decisionin our model as it is done usually in the litera-ture as the authors admit. However, in some cases a distinction of these componentsmight be feasible. In addition to these ‘standard components’ the authors specifythree ‘optional components’. Two of them can be seen as shortcuts in the standardcycle (explicit provided knowledgeinstead ofinferred knowledgeand transparentmodelsinstead of automaticadaptation decision making). The third additional com-ponent is used for systems with second level adaptation (Totterdell and Rautenbach,1990). Thus, the underlying model of this approach is very similar to our frameworkthough it provides some additional modules for special system architectures. How-ever, the proposed evaluation procedure is a little bit different. Instead of the layeredevaluation approach, the authors define eight ‘modules’ consisting of one or morecomponents that could be evaluated in combination. Finally, even these modulesmay be evaluated in combination. In fact, the main difference to our framework is,that this approach is more explicit about involved components and procedures, butends up with a confusing amount of different modules.
76

5. Empirical Evaluation of anAdaptive Web-Based LearningCourse
In order to demonstrate the usefulness of the evaluation framework and to showwhich kind of failures are detected by which methods and criteria, the frameworkhas been applied to an existing adaptive system. TheHTML-Tutor, an adaptivelearning course for HTML and publishing on the web, was object of several eval-uation studies. First, we will introduce the underlying architecture of this adaptivesystem. Afterwards, we present the results of evaluation studies for each step of theframework.
5.1. NetCoach Courses
TheHTML-Tutor is based on the authoring system NetCoach. A considerable num-ber of courses has been developed by this tool. Though, the appearance of the Net-Coach courses may look very different, the underlying structure and the inferencemechanism is always the same.
NetCoach is an authoring system that supports the generation of adaptive onlinecourses (Weber et al., 2001). It is derived from ELM-ART1, one of the first andby now most comprehensive adaptive web-based educational systems (Weber andSpecht, 1997a).
While authors generate the content by filling in templates and forms, the coursefunctions including user management, adaptation, communication facilities, and tu-toring is provided by NetCoach. All NetCoach courses share the same structure.Similar to chapters and subchapters in a book, the learning material (i.e., texts, im-ages, animations) is stored in a hierarchical tree-structure of concepts. Learners maynavigate through this structure freely.
1cogpsy.uni-trier.de/projects/ELM/elmart.html
77

5. Empirical Evaluation of an Adaptive Web-Based Learning Course
Figure 5.1.: Snapshot of theHTML-Tutor
Figure 5.1 shows a snapshot of the course interface for learners. The chapterlearners’interface overview on the left hand side unfolds and folds depending on the currently visited
part. The links are annotated with colored bullets. The panel of buttons in the upperpart of the window is visible at all times and provides functions such as searching, in-specting the glossary, and help texts. The main frame displays the learning material,tests, and suggestions on which page to go to next.
In fact, the courses adapt to the learners’ knowledge, to the learning objectives,adaptive andadaptable
featuresand to the navigation behavior. This adaptation mechanism is detailed in the follow-ing sections. Moreover, the courses are adaptable to individual preferences such ascolors, warnings, etc.. For example, a learner might adjust whether she gets a warn-ing when she visits a page that requires additional prior knowledge. Table 5.1 givesan overview of the adaptive and adaptable features.
78

5.1. NetCoach Courses
Table 5.1.: Adaptive and adaptable features of NetCoach
adapting to what? how?
preferences learner may change colors, the kind of warningsand annotations, etc.
learning objective learner decides which predefined learning objec-tive to fulfill (e.g., complete course, overview, spe-cific contents only)
knowledge learner has to answer test items (in pre-test orpost-test) that check whether a concept is knownor not
navigation all visited pages are registered. As long as noother information is available (i.e., a test group),visited pages are assumed to be known by thelearner.
5.1.1. Assessing the learner
The courses assess the learner’s objective, they administer pre-tests and tests andregister the navigation behavior (see Figure 5.2).
In the beginning of a course the learner is asked about her objective. A learningobjectivesobjective consists of a set of concepts that have to be successfully worked on by thelearner. Thus, objectives are especially useful for learners who do not want to com-plete the whole course. For instance, the objectiveI want to get an introduction onthis topicmight include the introductory high level chapters only, while the secondobjectiveI am familiar with . . . but I want to know more about . . .would omit thefirst chapter and guide the learner to more advanced sections directly.
The crucial parts of NetCoach to assess the learner’s knowledge are the so calledteststest groups. A test group consists of a set of weighted test items that are related toa concept. There are forced choice, multiple choice, and gap filling items. All ofthem are evaluated online automatically. The same items can be administered eitheras pre-test or as post-test. Pre-tests are presented optionally before the content of achapter has been presented (If you already have prior knowledge about this chapteryou may want to complete the pre-test). Post-tests are administered after the learnerhas read a chapter, usually in small groups of items (e.g., two in a row). These tests
79
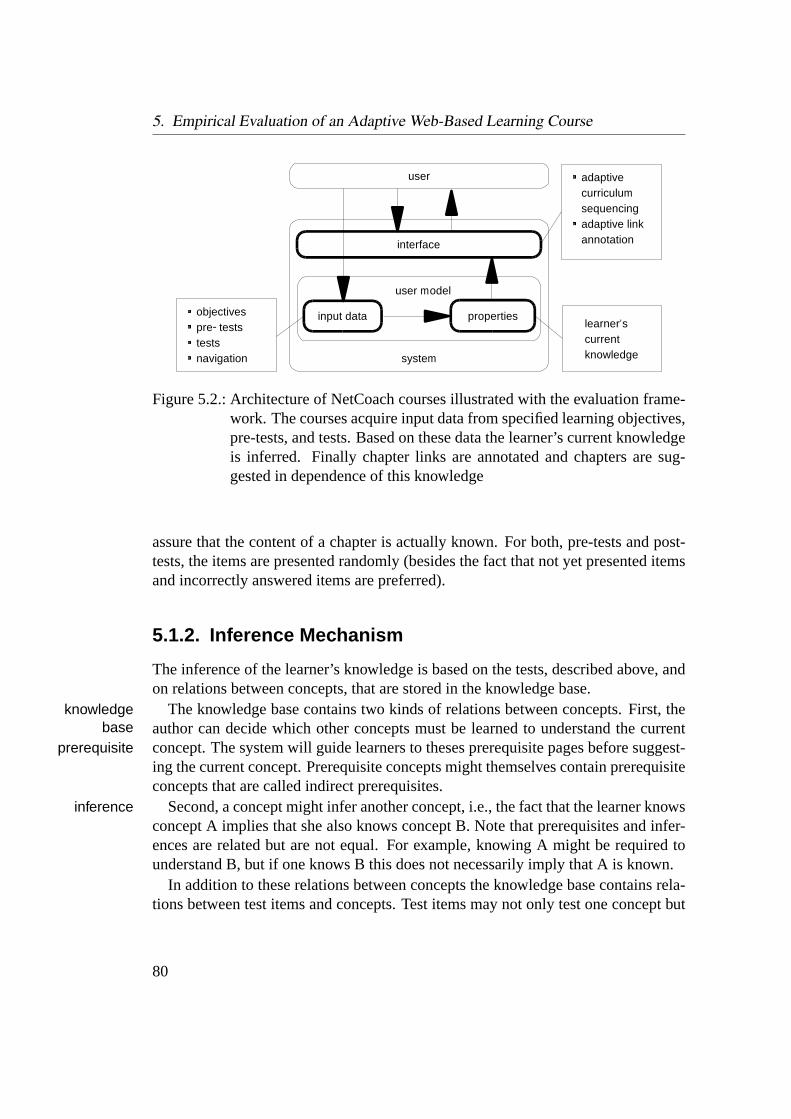
5. Empirical Evaluation of an Adaptive Web-Based Learning Course
user
system
interface
user model
input data propertieslearner’s current knowledge
adaptive curriculum sequencingadaptive link annotation
objectives pre− teststestsnavigation
Figure 5.2.: Architecture of NetCoach courses illustrated with the evaluation frame-work. The courses acquire input data from specified learning objectives,pre-tests, and tests. Based on these data the learner’s current knowledgeis inferred. Finally chapter links are annotated and chapters are sug-gested in dependence of this knowledge
assure that the content of a chapter is actually known. For both, pre-tests and post-tests, the items are presented randomly (besides the fact that not yet presented itemsand incorrectly answered items are preferred).
5.1.2. Inference Mechanism
The inference of the learner’s knowledge is based on the tests, described above, andon relations between concepts, that are stored in the knowledge base.
The knowledge base contains two kinds of relations between concepts. First, theknowledgebase author can decide which other concepts must be learned to understand the current
concept. The system will guide learners to theses prerequisite pages before suggest-prerequisiteing the current concept. Prerequisite concepts might themselves contain prerequisiteconcepts that are called indirect prerequisites.
Second, a concept might infer another concept, i.e., the fact that the learner knowsinferenceconcept A implies that she also knows concept B. Note that prerequisites and infer-ences are related but are not equal. For example, knowing A might be required tounderstand B, but if one knows B this does not necessarily imply that A is known.
In addition to these relations between concepts the knowledge base contains rela-tions between test items and concepts. Test items may not only test one concept but
80
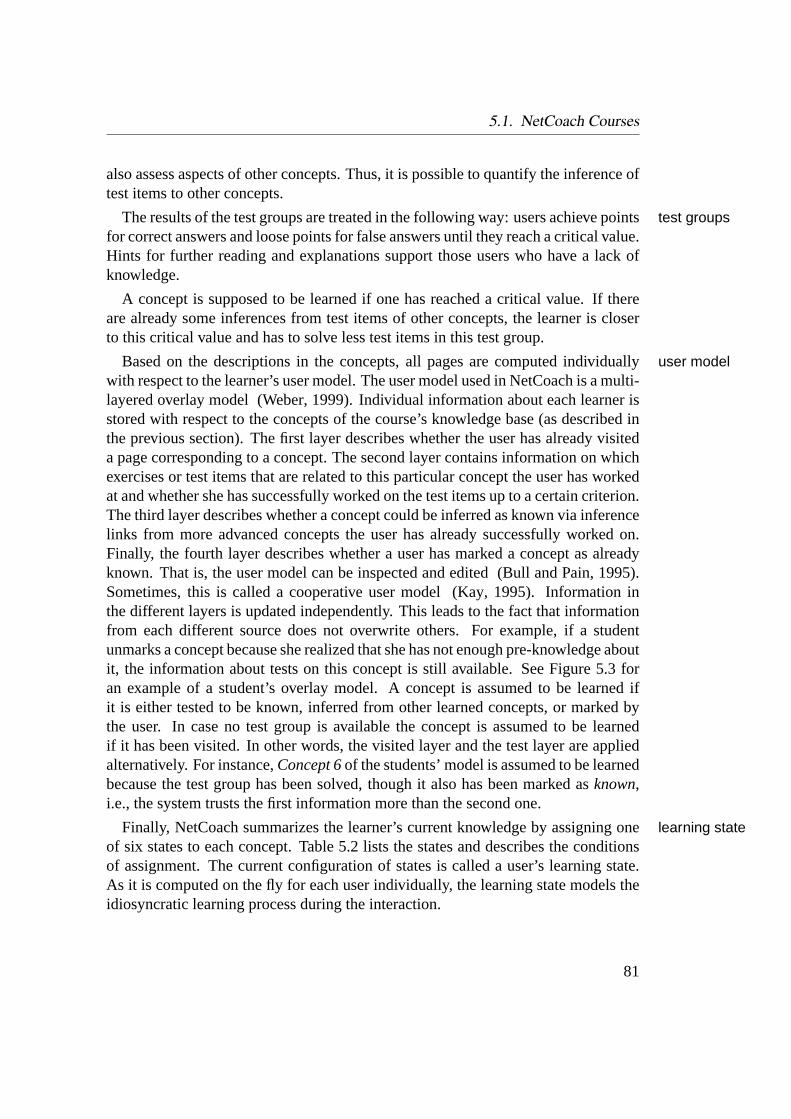
5.1. NetCoach Courses
also assess aspects of other concepts. Thus, it is possible to quantify the inference oftest items to other concepts.
The results of the test groups are treated in the following way: users achieve pointstest groupsfor correct answers and loose points for false answers until they reach a critical value.Hints for further reading and explanations support those users who have a lack ofknowledge.
A concept is supposed to be learned if one has reached a critical value. If thereare already some inferences from test items of other concepts, the learner is closerto this critical value and has to solve less test items in this test group.
Based on the descriptions in the concepts, all pages are computed individuallyuser modelwith respect to the learner’s user model. The user model used in NetCoach is a multi-layered overlay model (Weber, 1999). Individual information about each learner isstored with respect to the concepts of the course’s knowledge base (as described inthe previous section). The first layer describes whether the user has already visiteda page corresponding to a concept. The second layer contains information on whichexercises or test items that are related to this particular concept the user has workedat and whether she has successfully worked on the test items up to a certain criterion.The third layer describes whether a concept could be inferred as known via inferencelinks from more advanced concepts the user has already successfully worked on.Finally, the fourth layer describes whether a user has marked a concept as alreadyknown. That is, the user model can be inspected and edited (Bull and Pain, 1995).Sometimes, this is called a cooperative user model (Kay, 1995). Information inthe different layers is updated independently. This leads to the fact that informationfrom each different source does not overwrite others. For example, if a studentunmarks a concept because she realized that she has not enough pre-knowledge aboutit, the information about tests on this concept is still available. See Figure 5.3 foran example of a student’s overlay model. A concept is assumed to be learned ifit is either tested to be known, inferred from other learned concepts, or marked bythe user. In case no test group is available the concept is assumed to be learnedif it has been visited. In other words, the visited layer and the test layer are appliedalternatively. For instance,Concept 6of the students’ model is assumed to be learnedbecause the test group has been solved, though it also has been marked asknown,i.e., the system trusts the first information more than the second one.
Finally, NetCoach summarizes the learner’s current knowledge by assigning onelearning stateof six states to each concept. Table 5.2 lists the states and describes the conditionsof assignment. The current configuration of states is called a user’s learning state.As it is computed on the fly for each user individually, the learning state models theidiosyncratic learning process during the interaction.
81
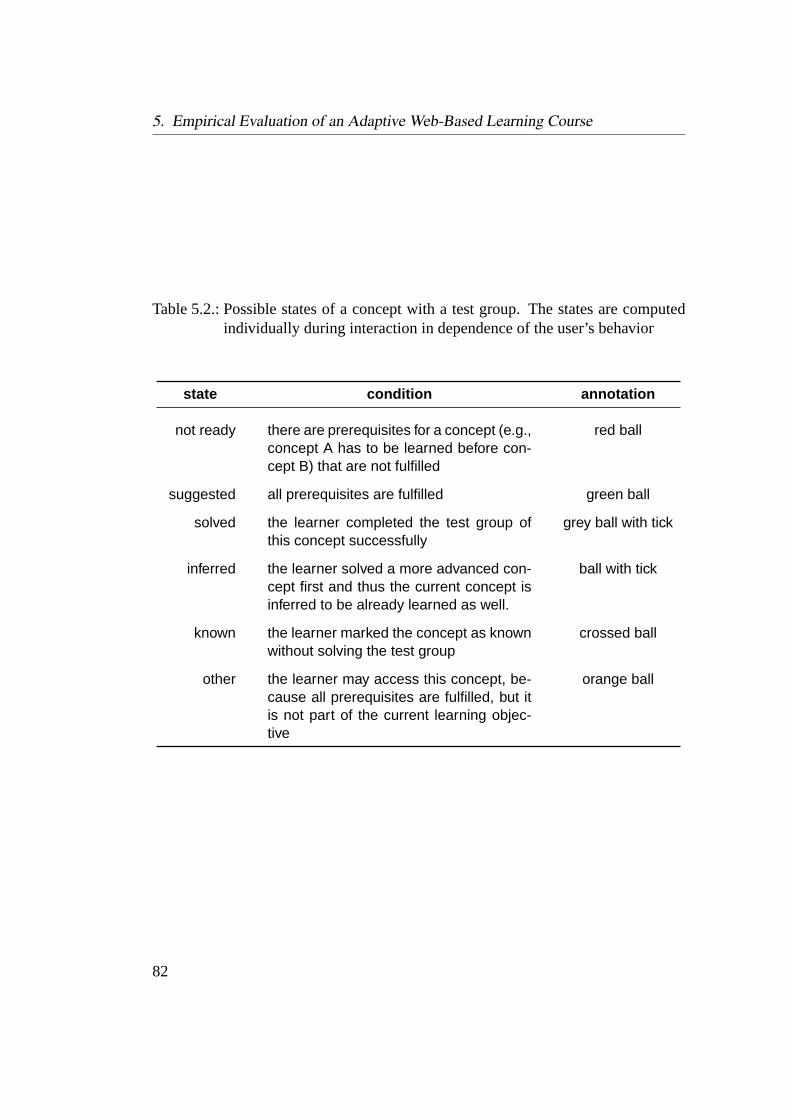
5. Empirical Evaluation of an Adaptive Web-Based Learning Course
Table 5.2.: Possible states of a concept with a test group. The states are computedindividually during interaction in dependence of the user’s behavior
state condition annotation
not ready there are prerequisites for a concept (e.g.,concept A has to be learned before con-cept B) that are not fulfilled
red ball
suggested all prerequisites are fulfilled green ball
solved the learner completed the test group ofthis concept successfully
grey ball with tick
inferred the learner solved a more advanced con-cept first and thus the current concept isinferred to be already learned as well.
ball with tick
known the learner marked the concept as knownwithout solving the test group
crossed ball
other the learner may access this concept, be-cause all prerequisites are fulfilled, but itis not part of the current learning objec-tive
orange ball
82

5.1. NetCoach Courses
1 2 3 4concept
visited
tests
inferred
marked
learned
5 6
Figure 5.3.: Example of a student’s overlay model. NetCoach infers the student’scurrent learning state from four independently updated layers. Conceptswithout tests are treated as learned if they have been visited. Adoptedfrom Weber et al. (2001)
In summary, the inference of a user’s current learning state is done in three steps.First, the items of the pre-tests and tests are evaluated. Points are weighted by afactor and accordingly assigned to test groups . Second, if a test group has beensolved because the critical value has been reached, that chapter is assumed to belearned and other chapters might be inferred to have been learned in accordance withthe knowledge base. Third, each chapter is assigned to one of six learning states thatdescribe the learner’s knowledge of that concept.
5.1.3. Adaptation Decision
Finally, the learning state is used for adaptation. The two adaptation decisions usedin NetCoach courses areadaptive link annotationandadaptive curriculum sequenc-ing.
Links to other concepts in the overview (left hand side in Figure 5.1) are annotatedlink annotationwith colored bullets that correspond to the learning state. Thus the learners cansee, which concepts are assumed to be learned, which are recommended, and whichare not yet ready. Table 5.2 gives an example of the default color configuration.However, NetCoach authors are free to predefine other colors.
83
5. Empirical Evaluation of an Adaptive Web-Based Learning Course
Table 5.3.: Adaptation decisions in adaptive learning systems. Comparison of auth-oring systems for adaptive hypermedia courses in reference to differentadaptation decisions that are used for adaptation
Net-Coach
AHA ECSAI-Web
Inter-book
Meta-Links
adaptive guidance yes yes yes yes yesadaptive annotation yes yes yes yes yes
adaptive hiding of links yesadaptive navigation maps yes yesadaptive text presentation yes yes
In addition, NetCoach suggests the next concept to be learned. The system selectsthe next concept in the hierarchy with the statesuggested, i.e, that has no unfulfilledcurriculum
sequencing prerequisites, and that is part of the learning objective. Concepts that are assumedto be learned are skipped. The learner can either choose a link to the recommendedconcept (Continue with the next suggested page) or follow the suggested-arrowinthe navigation bar on each page. Learners who visit a page with the statenot readywarningsget a warning and are informed that the system assumes that they should study theprerequisites first.
Several systems have been proposed that apply intelligent inference mechanismsto adapt to learners, e.g., AHA! (de Bra and Calvi, 1998), Hyperbook (Henze andNejdl, 1999; Henze et al., 1999), ECSAIWeb (Sanrach and Grandbastien, 2000),Interbook (Brusilovsky et al., 1998), and MetaLinks (Murray, 2000).
As shown in Table 5.3 NetCoach implements the most commonly used adaptivefeatures, but does not adapt the text presentation (as e.g., AHA) and refrains fromhiding links. We argue that the student should have full freedom of navigation andcontent access while the adaptive system should provide hints and suggestions onlyto scaffold the learner (e.g., Hübscher and Puntambekar, 2002).
5.1.4. Overview of existing courses
Several courses have been developed with NetCoach. They are used at different uni-versities in Germany and in some companies. Up to now, most courses are writtenin German, though some are written in English, French, Spanish, and Italian. Net-Coach does not require any programming knowledge, thus many different authors
84

5.2. The HTML-Tutor
from many disciplines developed courses in different domains including program-ming, spelling rules, cognitive and pedagogical psychology, medicine, and productpresentation. At the University of Education in Freiburg, students develop simplecourses on their own and test these courses with pupils in secondary schools. Net-Coach has been used for ‘learning on demand’ settings, as well as for supplementingcourses at universities and adult education. For instance, two courses on program-ming LISP and HTML are available world-wide for training purposes, while severalcourses on pedagogical psychology are used by students to prepare lessons and ex-ams (Lippitsch et al., 2003). The students can thus work at their own pace until theyacquired enough knowledge to attend the seminar session. The teachers save timebecause they do not have to present the complete content and can thus start at once toanswer open questions and to discuss further issues. Nevertheless, they may controlthe performance of every student with the tutor interface. Other courses are used forfurther education in big companies, e.g., to inform the staff about the features of newproducts.
According to these different learning settings, the courses differ widely in terms ofthe offered functions. For instance, while document sharing is an interesting featurefor closed groups, such as university seminars, this function is switched off for publiccourses like theHTML-Tutor. NetCoach is very flexible in terms of changing theinterface in accordance with the requirements of learner groups and the courses maylook quite different on the surface but in fact, the adaptation works in the same wayfor all of them.
The following empirical evaluations mostly focus on theHTML-Tutor, but manyof the results might thus be generalized to the other NetCoach courses, too.
5.2. The HTML-Tutor
Before outlining the evaluation studies that we performed with theHTML-Tutor, thecontent and structure of the course is described in more detail.
5.2.1. Course Description
TheHTML-Tutor teaches programming HTML and publishing in the Internet. It isbased on a static online version written by Partl (1999). The 138 concepts (whichequals about 120 printed pages) of the static version were extended by 125 test items.A table of contents is shown in Appendix A.1.
The topic has two properties that make it especially suitable for online courses.conceptrelationsFirst, there are very clear relations between concepts. For example, to understand
85

5. Empirical Evaluation of an Adaptive Web-Based Learning Course
Table 5.4.: Comparison of theHTML-Tutorwith other NetCoach courses. Note thatfor the computation of the number of prerequisites per concept pure test-concepts were excluded
HTML-Tutor RR2000 Piaget
concepts 138 141 42learning objectives 12 11 1
test groups 49 110 13test items 125 1399 63
prerequisites per concept 1.50 0.99 1.05
how to format a paragraph in HTML learners should know how HTML pages arestructured in principle and what HTML tags look like. In turn, a learner who knowshow to format a paragraph obviously has some knowledge about the syntax of tags.Accordingly theHTML-Tutor implements a prerequisite relation between the chap-ters ‘structure of HTML files’ and ‘paragraphs and line breaks’, as well as an infer-ence relation between the latter chapter and ‘format of markup tags’.
A total of 207 prerequisites and 52 inferences has been specified. The structure ofprerequisites is outlined in Appendix A.2. For each chapter (shown in the table rows)prerequisite
structure a dot indicates for which other chapter (columns) this chapter is a prerequisite. Dotsare spread over the upper right half of the table only, because NetCoach forbids toset a subsequent chapter as prerequisite. A diagonal means that the structure is verylinear, because, in this case, the previous chapter is always prerequisite of the sub-sequent one. Structures that are very close to this diagonal can be found in courseslike Piaget, an introduction to the developmental psychology of Jean Piaget, wherethe inherent dependencies are much weaker. TheHTML-Tutor obviously deviatesfrom this linear structure considerably. Accordingly, the number of prerequisites perconcept is lower in other NetCoach courses. See Table 5.4 for a comparison of theHTML-Tutor to PiagetandRR2000, which is a course for learning the new Germanspelling rules.
The structure of inferences is outlined in Appendix A.3. It looks quite differentinferencestructure from the prerequisite structure because an inference relation is usually specified from
summary chapters in the end of a larger content block which results in a kind ofvertical lines. There are no inferences for the last chapters, because these sectionsprovide a kind of supplemental information (history of HTML; future perspectives;
86
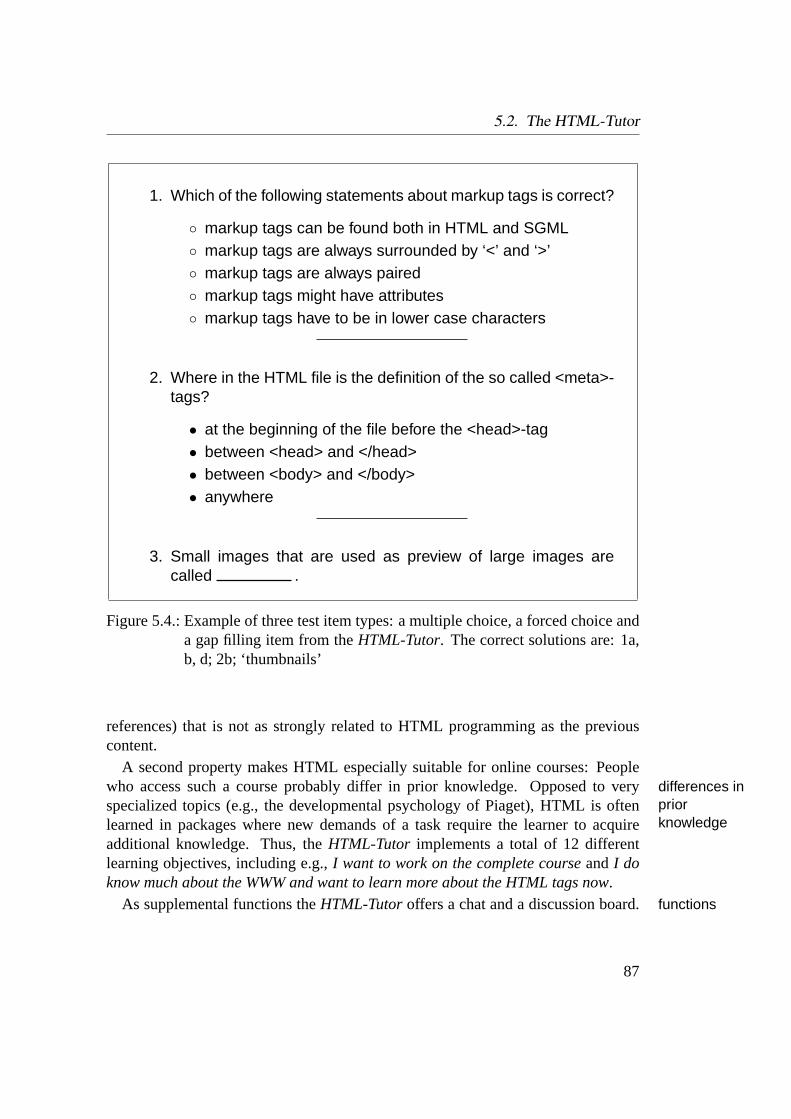
5.2. The HTML-Tutor
1. Which of the following statements about markup tags is correct?
◦ markup tags can be found both in HTML and SGML◦ markup tags are always surrounded by ‘<’ and ‘>’◦ markup tags are always paired◦ markup tags might have attributes◦ markup tags have to be in lower case characters
2. Where in the HTML file is the definition of the so called <meta>-tags?
• at the beginning of the file before the <head>-tag• between <head> and </head>• between <body> and </body>• anywhere
3. Small images that are used as preview of large images arecalled .
Figure 5.4.: Example of three test item types: a multiple choice, a forced choice anda gap filling item from theHTML-Tutor. The correct solutions are: 1a,b, d; 2b; ‘thumbnails’
references) that is not as strongly related to HTML programming as the previouscontent.
A second property makes HTML especially suitable for online courses: Peoplewho access such a course probably differ in prior knowledge. Opposed to verydifferences in
priorknowledge
specialized topics (e.g., the developmental psychology of Piaget), HTML is oftenlearned in packages where new demands of a task require the learner to acquireadditional knowledge. Thus, theHTML-Tutor implements a total of 12 differentlearning objectives, including e.g.,I want to work on the complete courseandI doknow much about the WWW and want to learn more about the HTML tags now.
As supplemental functions theHTML-Tutoroffers a chat and a discussion board.functions
87
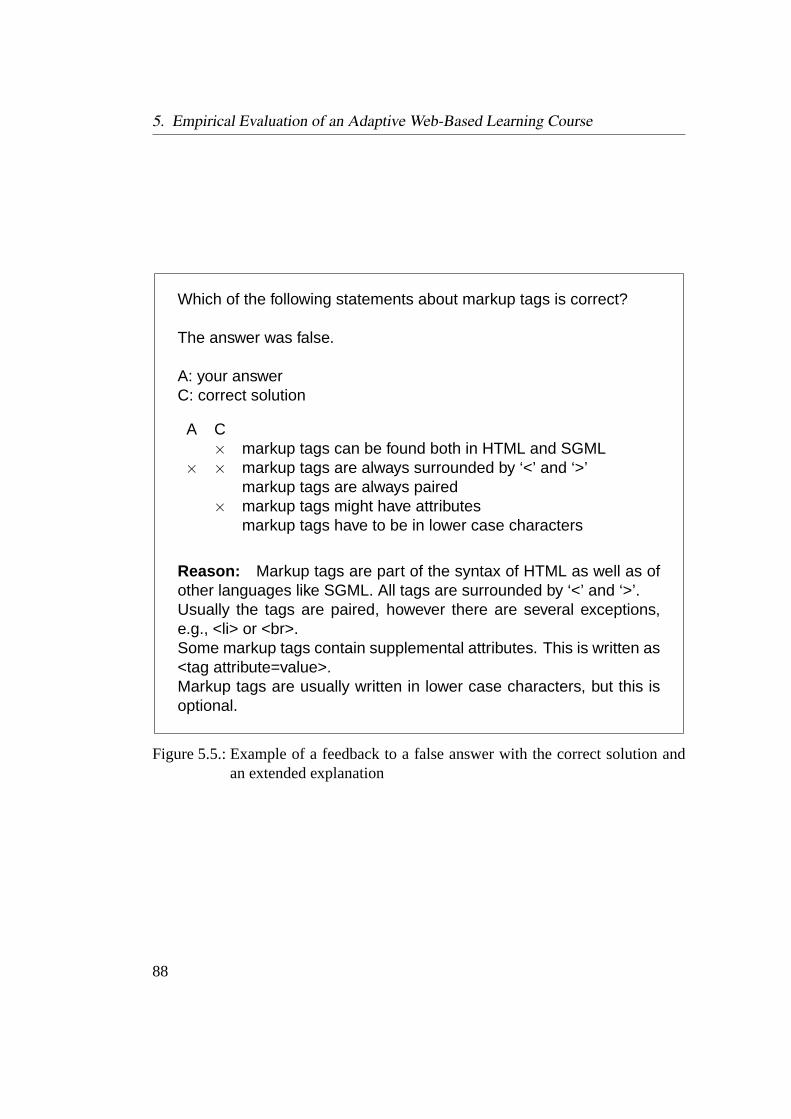
5. Empirical Evaluation of an Adaptive Web-Based Learning Course
Which of the following statements about markup tags is correct?
The answer was false.
A: your answerC: correct solution
A C× markup tags can be found both in HTML and SGML
× × markup tags are always surrounded by ‘<’ and ‘>’markup tags are always paired
× markup tags might have attributesmarkup tags have to be in lower case characters
Reason: Markup tags are part of the syntax of HTML as well as ofother languages like SGML. All tags are surrounded by ‘<’ and ‘>’.Usually the tags are paired, however there are several exceptions,e.g., <li> or <br>.Some markup tags contain supplemental attributes. This is written as<tag attribute=value>.Markup tags are usually written in lower case characters, but this isoptional.
Figure 5.5.: Example of a feedback to a false answer with the correct solution andan extended explanation
88

5.2. The HTML-Tutor
However, both are used sparsely. Moreover, learners may search for a term in the ma-terial, browse the table of contents and inspect their user model (see Section 5.1.2).Finally there is a glossary that explains the most important terms.
The 125 test items are forced choice, multiple choice and gap filling. Figure 5.4test itemsshows translations of examples for the three item types. In case of a false answerthe answer is presented to the user again in conjunction with the correct solution andwith an extended explanation (Figure 5.5).
The course has been online since September 2000 and has been accessed by sev-eral thousand users. For evaluation purposes we used both this online version withadditional experimental conditions as well as an almost identical seminar versionwith different learning objectives.
If not specified otherwise, the following studies rely on the online users who havevisited the course until the 23th of November 2001. For some of the studies weexcluded learners who had worked with the course for less than 15 minutes in orderto filter persons who just wanted to have a look at the course, but did not reallyinteract with it.
5.2.2. Overview of Evaluation Studies with the HTML-Tutor
The evaluation studies described in this work were designed to form a completeevaluation of theHTML-Tutor according to the proposed framework. Thus, eachstudy is assigned to one of the four evaluation layers.
The input datawere evaluated by computing the difficulty and retest-reliabilityof test items. We found that the item difficulties are equally spread across the fullrange. The retest-reliability of some items is low which might be caused by themeasurement design.
The inferencemechanism was evaluated in two studies. First, we compared theassumptions of theHTML-Tutor about the learners (i.e., the user model) with theresults of an external assessment. The congruence of these measurements is consid-erably high, though a few incongruencies were uncovered. Second, we demonstratedthat users who had worked on a page in one of five NetCoach courses, including theHTML-Tutor, made more mistakes when answering test items on this page if theywere assumed to benot preparedfor this page according to the user model.
Two aspects of theadaptation decisionare evaluated. First, we were able to showthat adapting to prior-knowledge by pre-tests saves time for the users, but keeps thelearning gain stable. Second, we compared four different adaptation decisions thatare all based on the same information in the user model.
Finally, theinteraction in general is evaluated in terms of several dimensions ofthe system behavior, the user behavior, and the interaction quality.
89
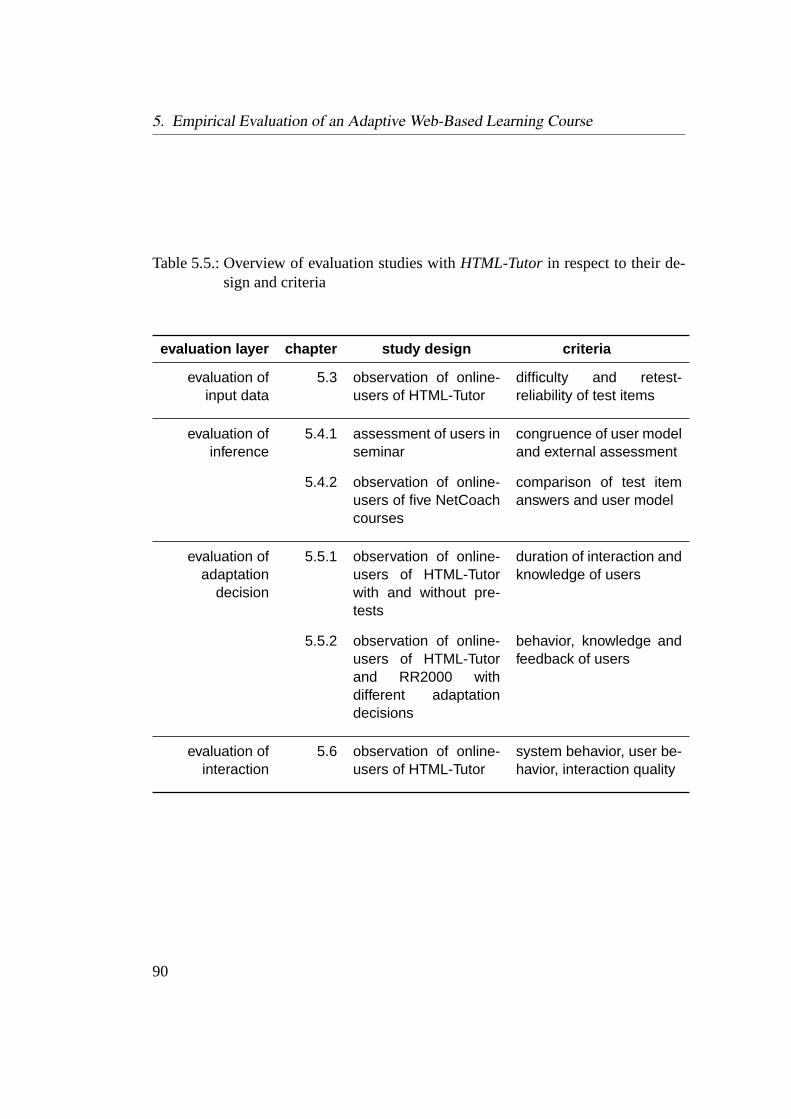
5. Empirical Evaluation of an Adaptive Web-Based Learning Course
Table 5.5.: Overview of evaluation studies withHTML-Tutor in respect to their de-sign and criteria
evaluation layer chapter study design criteria
evaluation ofinput data
5.3 observation of online-users of HTML-Tutor
difficulty and retest-reliability of test items
evaluation ofinference
5.4.1 assessment of users inseminar
congruence of user modeland external assessment
5.4.2 observation of online-users of five NetCoachcourses
comparison of test itemanswers and user model
evaluation ofadaptation
decision
5.5.1 observation of online-users of HTML-Tutorwith and without pre-tests
duration of interaction andknowledge of users
5.5.2 observation of online-users of HTML-Tutorand RR2000 withdifferent adaptationdecisions
behavior, knowledge andfeedback of users
evaluation ofinteraction
5.6 observation of online-users of HTML-Tutor
system behavior, user be-havior, interaction quality
90
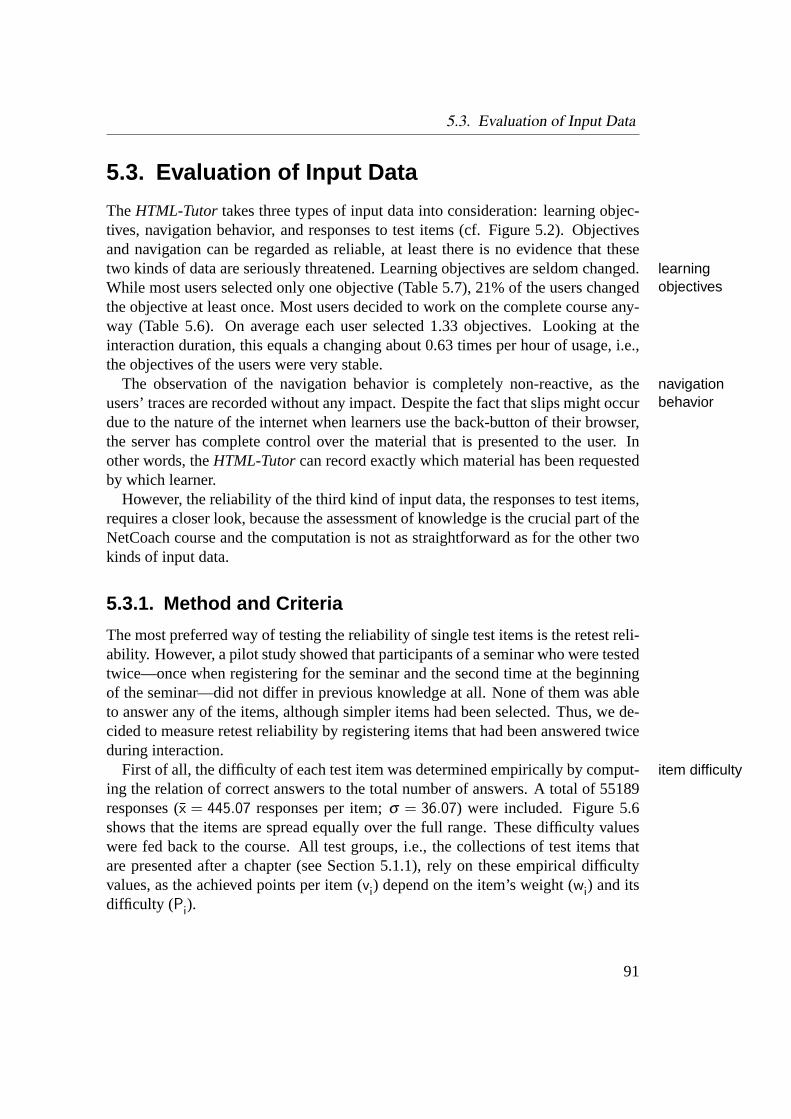
5.3. Evaluation of Input Data
5.3. Evaluation of Input Data
TheHTML-Tutor takes three types of input data into consideration: learning objec-tives, navigation behavior, and responses to test items (cf. Figure 5.2). Objectivesand navigation can be regarded as reliable, at least there is no evidence that thesetwo kinds of data are seriously threatened. Learning objectives are seldom changed.learning
objectivesWhile most users selected only one objective (Table 5.7), 21% of the users changedthe objective at least once. Most users decided to work on the complete course any-way (Table 5.6). On average each user selected 1.33 objectives. Looking at theinteraction duration, this equals a changing about 0.63 times per hour of usage, i.e.,the objectives of the users were very stable.
The observation of the navigation behavior is completely non-reactive, as thenavigationbehaviorusers’ traces are recorded without any impact. Despite the fact that slips might occur
due to the nature of the internet when learners use the back-button of their browser,the server has complete control over the material that is presented to the user. Inother words, theHTML-Tutorcan record exactly which material has been requestedby which learner.
However, the reliability of the third kind of input data, the responses to test items,requires a closer look, because the assessment of knowledge is the crucial part of theNetCoach course and the computation is not as straightforward as for the other twokinds of input data.
5.3.1. Method and Criteria
The most preferred way of testing the reliability of single test items is the retest reli-ability. However, a pilot study showed that participants of a seminar who were testedtwice—once when registering for the seminar and the second time at the beginningof the seminar—did not differ in previous knowledge at all. None of them was ableto answer any of the items, although simpler items had been selected. Thus, we de-cided to measure retest reliability by registering items that had been answered twiceduring interaction.
First of all, the difficulty of each test item was determined empirically by comput-item difficultying the relation of correct answers to the total number of answers. A total of 55189responses (̄x = 445.07 responses per item;σ = 36.07) were included. Figure 5.6shows that the items are spread equally over the full range. These difficulty valueswere fed back to the course. All test groups, i.e., the collections of test items thatare presented after a chapter (see Section 5.1.1), rely on these empirical difficultyvalues, as the achieved points per item (vi) depend on the item’s weight (wi) and itsdifficulty (Pi).
91

5. Empirical Evaluation of an Adaptive Web-Based Learning Course
Table5.6.:F
requencyofthe12
learningobjectives
intheH
TM
L-T
uto
r.T
hetable
shows
howm
anyusers
selectedthe
objectiveatleastonce.1714
usersselected2197
objectives(̄x=
1.33).Taking
theduration
ofinteractioninto
consideration,theusers
changedtheir
objectiveonly0.63
times
perhour
onaverage
objectivepages
frequency
#1Iw
anttow
orkon
thecom
pletecourse
1331168
#2Iw
anttoprintthis
course1
316#3
Iwantto
lookup
acertain
tag1
87#4
Iwantto
knoww
hatWW
Wand
HT
ML
is23
53#5
Idoknow
theW
WW
,butIwantto
learneverything
aboutHT
ML
94221
#6Iw
anttopublish
apiece
ofinformation
quickly29
27#7
Iwantto
publishvolum
inousinform
ationin
astructured
way
5677
#8Iw
anttocom
pilehotlinks
tocoolsites
197
#9Iw
antmy
pagesto
lookcolorfuland
modern
8949
#10Iw
anttoattractm
anyreaders
5726
#11Iw
anttoknow
more
aboutthebackground
ofWW
Wand
HT
ML
1347
#12Iw
anttouse
thiscourse
form
yteaching
1119
Σ2197
92

5.3. Evaluation of Input Data
Table 5.7.: Number of selected learning objectives.1714 users selected2197 ob-jectives. The table shows how many users selected how many of the12learning objectives during the interaction with the course
objectives frequency
1 13492 2223 994 325 106 17 08 1
> 8 0
Σ 1714
NetCoach computes the user’s scoreS in a test groupt in the following way:
vi = ai×wi× (Pi +0.5) with
vi score for test item iai ∈ {0;1}, 1 if answer was correct, else 0wi ∈ [0.5;1.5] weight of test item iPi ∈ [0;1] difficulty of test item i
St =nt
∑i=1
vi withSt score for test group tnt number of answered test items in test group t
The score in a test group equals the sum of scores that has been achieved by ans-wering test items in this test group so far. Note that the adjustment of the difficultyvalues by 0.5 is used to simplify authoring, as the default values (wi = 1 andPi = .5)result in a score of1× 1× 1 = 1 per item, which is easier to handle. Computation-ally it has no impact. Negative scores for false test items can be achieved by settingai to negative values in the case that the answer is not correct, but theHTML-Tutorregisters positive evidence only (i.e.,ai = 0 for false answers).
93
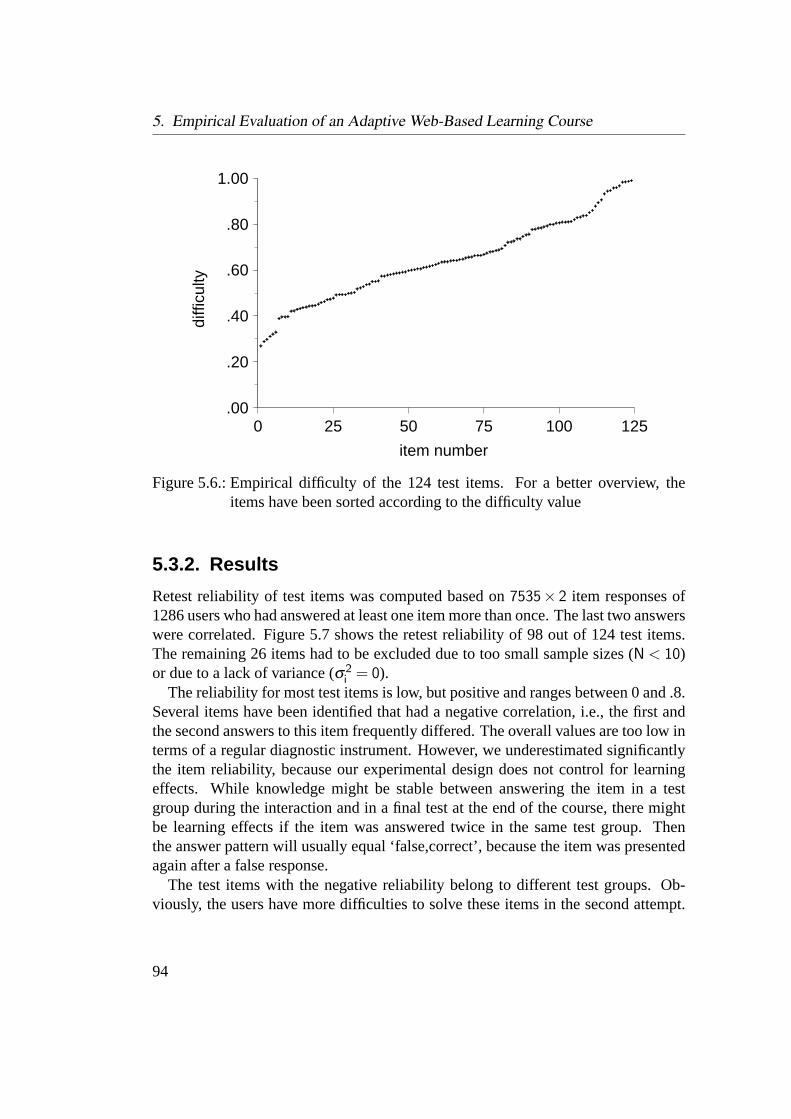
5. Empirical Evaluation of an Adaptive Web-Based Learning Course
0 25 50 75 100 125.00
.20
.40
.60
.80
1.00
item number
diffi
culty
Figure 5.6.: Empirical difficulty of the 124 test items. For a better overview, theitems have been sorted according to the difficulty value
5.3.2. Results
Retest reliability of test items was computed based on7535× 2 item responses of1286 users who had answered at least one item more than once. The last two answerswere correlated. Figure 5.7 shows the retest reliability of 98 out of 124 test items.The remaining 26 items had to be excluded due to too small sample sizes (N < 10)or due to a lack of variance (σ2
i = 0).The reliability for most test items is low, but positive and ranges between 0 and .8.
Several items have been identified that had a negative correlation, i.e., the first andthe second answers to this item frequently differed. The overall values are too low interms of a regular diagnostic instrument. However, we underestimated significantlythe item reliability, because our experimental design does not control for learningeffects. While knowledge might be stable between answering the item in a testgroup during the interaction and in a final test at the end of the course, there mightbe learning effects if the item was answered twice in the same test group. Thenthe answer pattern will usually equal ‘false,correct’, because the item was presentedagain after a false response.
The test items with the negative reliability belong to different test groups. Ob-viously, the users have more difficulties to solve these items in the second attempt.
94
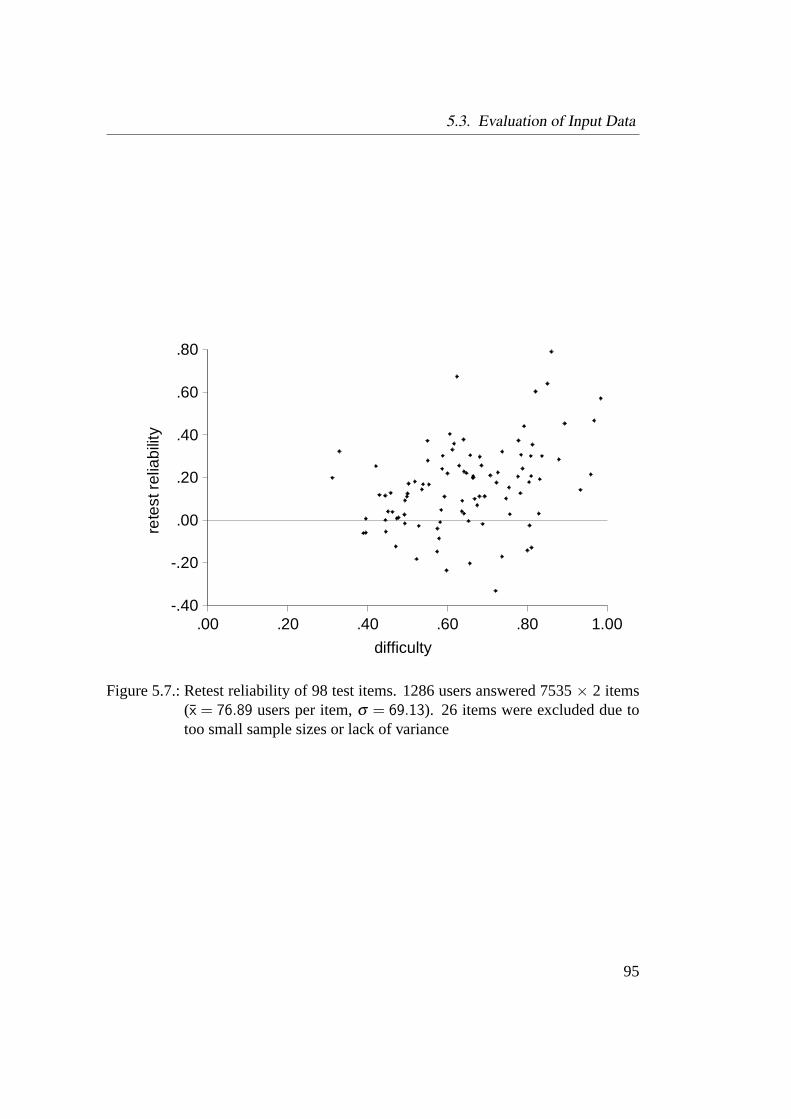
5.3. Evaluation of Input Data
.00 .20 .40 .60 .80 1.00-.40
-.20
.00
.20
.40
.60
.80
difficulty
rete
st r
elia
bilit
y
Figure 5.7.: Retest reliability of 98 test items. 1286 users answered 7535× 2 items(x̄ = 76.89 users per item,σ = 69.13). 26 items were excluded due totoo small sample sizes or lack of variance
95
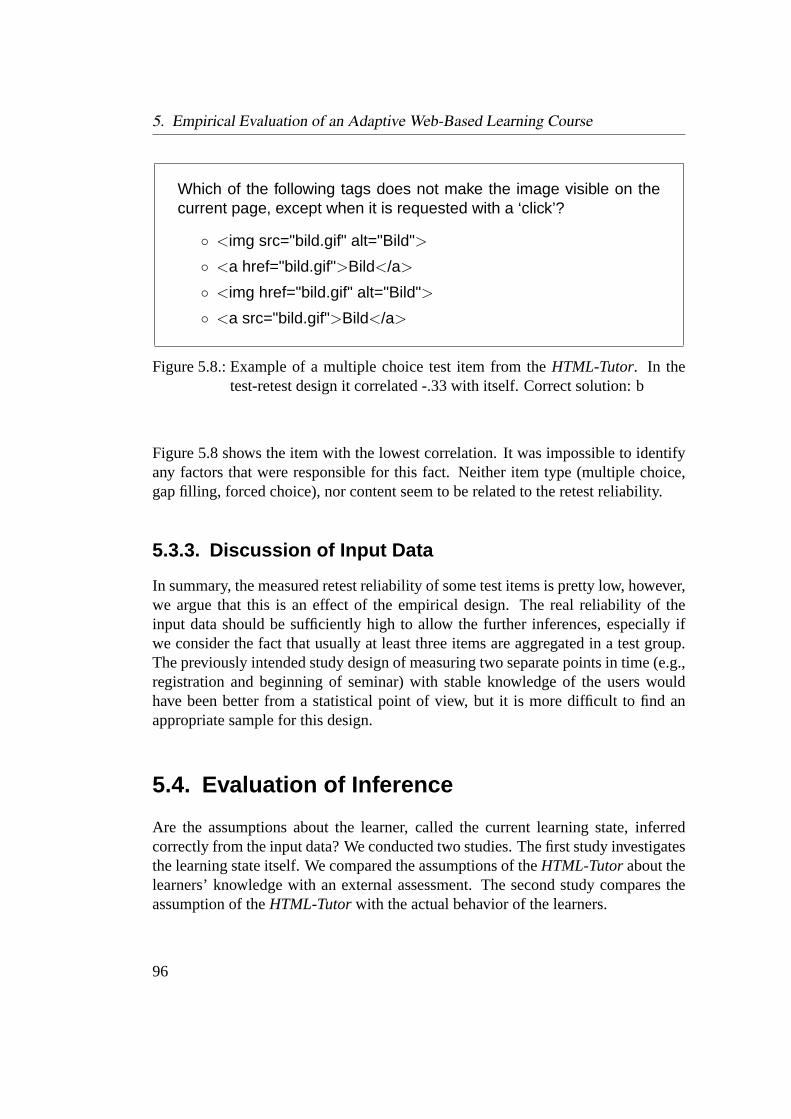
5. Empirical Evaluation of an Adaptive Web-Based Learning Course
Which of the following tags does not make the image visible on thecurrent page, except when it is requested with a ‘click’?
◦ <img src="bild.gif" alt="Bild">
◦ <a href="bild.gif">Bild</a>
◦ <img href="bild.gif" alt="Bild">
◦ <a src="bild.gif">Bild</a>
Figure 5.8.: Example of a multiple choice test item from theHTML-Tutor. In thetest-retest design it correlated -.33 with itself. Correct solution: b
Figure 5.8 shows the item with the lowest correlation. It was impossible to identifyany factors that were responsible for this fact. Neither item type (multiple choice,gap filling, forced choice), nor content seem to be related to the retest reliability.
5.3.3. Discussion of Input Data
In summary, the measured retest reliability of some test items is pretty low, however,we argue that this is an effect of the empirical design. The real reliability of theinput data should be sufficiently high to allow the further inferences, especially ifwe consider the fact that usually at least three items are aggregated in a test group.The previously intended study design of measuring two separate points in time (e.g.,registration and beginning of seminar) with stable knowledge of the users wouldhave been better from a statistical point of view, but it is more difficult to find anappropriate sample for this design.
5.4. Evaluation of Inference
Are the assumptions about the learner, called the current learning state, inferredcorrectly from the input data? We conducted two studies. The first study investigatesthe learning state itself. We compared the assumptions of theHTML-Tutorabout thelearners’ knowledge with an external assessment. The second study compares theassumption of theHTML-Tutorwith the actual behavior of the learners.
96
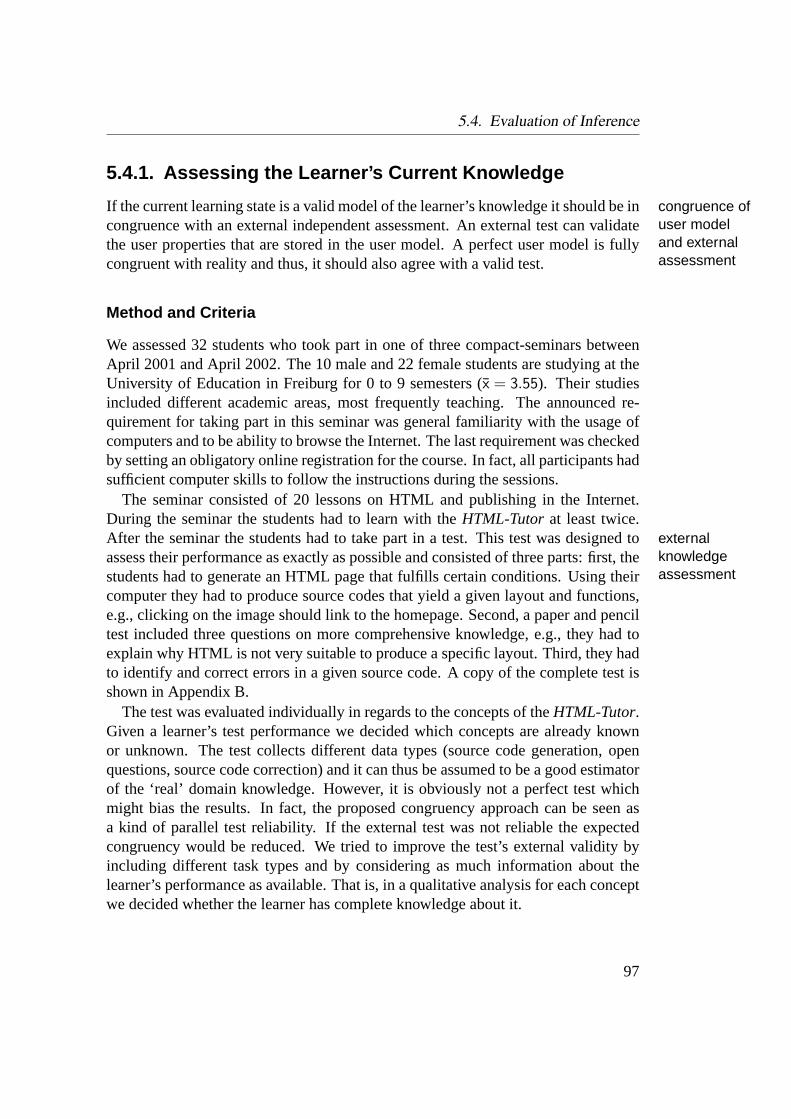
5.4. Evaluation of Inference
5.4.1. Assessing the Learner’s Current Knowledge
If the current learning state is a valid model of the learner’s knowledge it should be incongruence ofuser modeland externalassessment
congruence with an external independent assessment. An external test can validatethe user properties that are stored in the user model. A perfect user model is fullycongruent with reality and thus, it should also agree with a valid test.
Method and Criteria
We assessed 32 students who took part in one of three compact-seminars betweenApril 2001 and April 2002. The 10 male and 22 female students are studying at theUniversity of Education in Freiburg for 0 to 9 semesters (x̄ = 3.55). Their studiesincluded different academic areas, most frequently teaching. The announced re-quirement for taking part in this seminar was general familiarity with the usage ofcomputers and to be ability to browse the Internet. The last requirement was checkedby setting an obligatory online registration for the course. In fact, all participants hadsufficient computer skills to follow the instructions during the sessions.
The seminar consisted of 20 lessons on HTML and publishing in the Internet.During the seminar the students had to learn with theHTML-Tutor at least twice.After the seminar the students had to take part in a test. This test was designed toexternal
knowledgeassessment
assess their performance as exactly as possible and consisted of three parts: first, thestudents had to generate an HTML page that fulfills certain conditions. Using theircomputer they had to produce source codes that yield a given layout and functions,e.g., clicking on the image should link to the homepage. Second, a paper and penciltest included three questions on more comprehensive knowledge, e.g., they had toexplain why HTML is not very suitable to produce a specific layout. Third, they hadto identify and correct errors in a given source code. A copy of the complete test isshown in Appendix B.
The test was evaluated individually in regards to the concepts of theHTML-Tutor.Given a learner’s test performance we decided which concepts are already knownor unknown. The test collects different data types (source code generation, openquestions, source code correction) and it can thus be assumed to be a good estimatorof the ‘real’ domain knowledge. However, it is obviously not a perfect test whichmight bias the results. In fact, the proposed congruency approach can be seen asa kind of parallel test reliability. If the external test was not reliable the expectedcongruency would be reduced. We tried to improve the test’s external validity byincluding different task types and by considering as much information about thelearner’s performance as available. That is, in a qualitative analysis for each conceptwe decided whether the learner has complete knowledge about it.
97
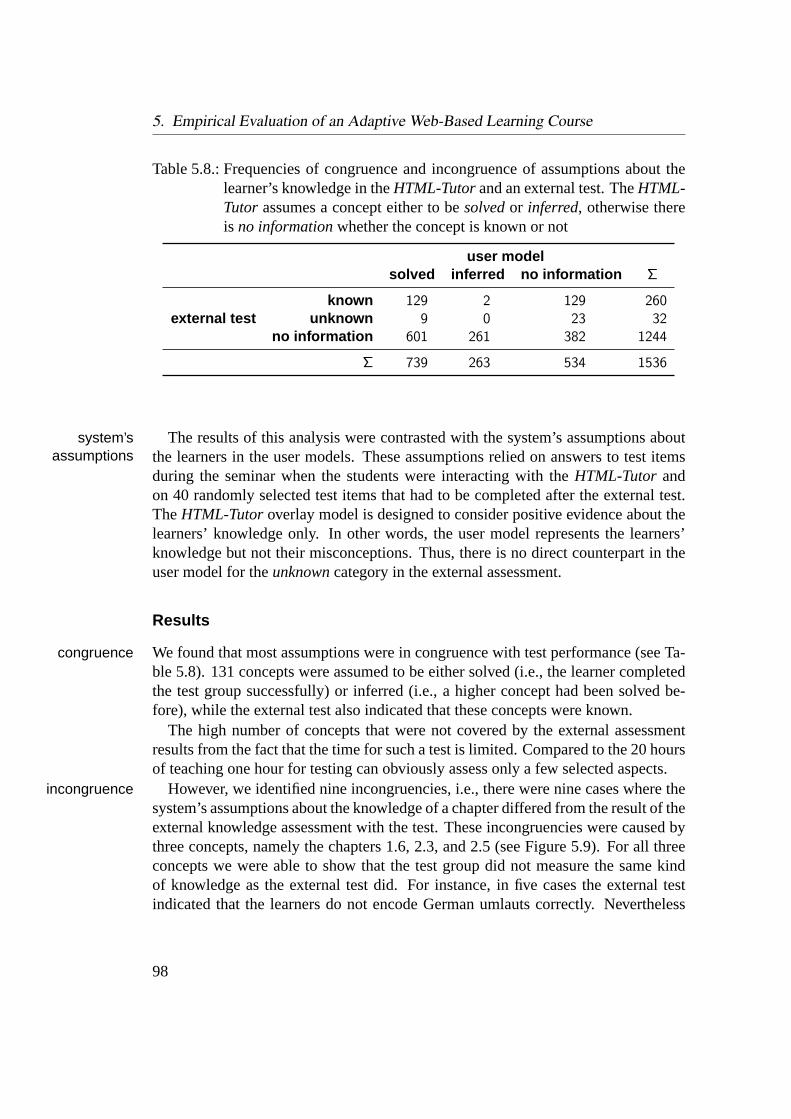
5. Empirical Evaluation of an Adaptive Web-Based Learning Course
Table 5.8.: Frequencies of congruence and incongruence of assumptions about thelearner’s knowledge in theHTML-Tutorand an external test. TheHTML-Tutor assumes a concept either to besolvedor inferred, otherwise thereis no informationwhether the concept is known or not
user modelsolved inferred no information Σ
known 129 2 129 260external test unknown 9 0 23 32
no information 601 261 382 1244
Σ 739 263 534 1536
The results of this analysis were contrasted with the system’s assumptions aboutsystem’sassumptions the learners in the user models. These assumptions relied on answers to test items
during the seminar when the students were interacting with theHTML-Tutor andon 40 randomly selected test items that had to be completed after the external test.TheHTML-Tutoroverlay model is designed to consider positive evidence about thelearners’ knowledge only. In other words, the user model represents the learners’knowledge but not their misconceptions. Thus, there is no direct counterpart in theuser model for theunknowncategory in the external assessment.
Results
We found that most assumptions were in congruence with test performance (see Ta-congruenceble 5.8). 131 concepts were assumed to be either solved (i.e., the learner completedthe test group successfully) or inferred (i.e., a higher concept had been solved be-fore), while the external test also indicated that these concepts were known.
The high number of concepts that were not covered by the external assessmentresults from the fact that the time for such a test is limited. Compared to the 20 hoursof teaching one hour for testing can obviously assess only a few selected aspects.
However, we identified nine incongruencies, i.e., there were nine cases where theincongruencesystem’s assumptions about the knowledge of a chapter differed from the result of theexternal knowledge assessment with the test. These incongruencies were caused bythree concepts, namely the chapters 1.6, 2.3, and 2.5 (see Figure 5.9). For all threeconcepts we were able to show that the test group did not measure the same kindof knowledge as the external test did. For instance, in five cases the external testindicated that the learners do not encode German umlauts correctly. Nevertheless
98

5.4. Evaluation of Inference
1.5 1.6 2.2 2.3 2.5 2.8 2.12 3.2.4 3.4 4.3 5.3.50
5
10
15
20 congruent
incongruent
chapter
freq
uenc
y
Figure 5.9.: Frequencies of congruence and incongruence ofHTML-Tutor assump-tions about the learner and an external test, grouped by concepts. Thenine identified incongruencies (Table 5.8) were caused by three differentconcepts
99
5. Empirical Evaluation of an Adaptive Web-Based Learning Course
they were able to respond to test items on this topic correctly. Obviously there isa mismatch between the declarative knowledge (as measured by the test items) andthe displayed performance in real world settings. Similar results were found forthe second concept (chapter 1.6): in test items the students were able to produce acorrect structure of an HTML page, but when they had to work on their own, twostudents skipped the header of the page which resulted in an incorrect page. The thirdconcept (chapter 2.3) introduces the line break tags (<br>). One student encodedthem correctly when answering the test items, but sometimes forgot to do so whengenerating a page.
Evaluations of adaptive learning systems usually observed the impact of adaptivityon the user’s behavior (e.g., Brusilovsky and Eklund, 1998, or Weber and Specht,1997a) or the learning gain (Specht, 1998). Contrasting the user model and theexternal assessment provides important information about the system’s quality. Thestudy gave valuable hints for further improvements: it will be necessary to measureperformance knowledge in test groups if we want to guarantee that the learners willapply their knowledge afterwards. Comparing assumed user properties with externalassessment results provides important information about mal-adaptations.
To get a measure of how close the relation of user model and external assessmentcontingencyis, it is possible to compute theχ2-contingency-coefficient based on the data givenin table 5.8 (the exact formulas are listed in Appendix C). A contingency-value ofCcorr = .24 suggests, that the two assessment methods are related, but do not measurethe same. However, this coefficient must not be interpreted in the same way as usualcorrelations. We suggest to useCcorr for comparisons of different adaptive systemsor of different versions of the same system, to estimate which system’s user model iscloser to the external assessment. However, from a formative evaluation perspectiveit is more important to know which concepts are incongruent rather than how closethe assessments are related, because this provides hints for further improvements.
5.4.2. Assessing the Learner’s Behavior
Adaptive link annotation and adaptive curriculum sequencing try to prevent learnersfrom working at inadequate material. Users should perform worse on concepts thathave the statusnot readyin the user model. In an online experiment we observed thebehavior of subjects in reference to their current learning state.
Method and Criteria
We collected data from five online courses in different domains that had all been de-veloped with the NetCoach authoring tool. These courses included theHTML-Tutor
100
5.4. Evaluation of Inference
as well as four introductory courses on psychology such as problem solving (Pro-blemloesen), Piaget’s developmental psychology (Piaget), communication (Kommu-nikation), and interpersonal perception (Personenwahrnehmung). 3501 users (bothstudents and visitors from the internet) interacted at least 15 minutes with one ofthe courses. Everyone was free to choose which concepts to work at. For eachcomparison of
test itemanswers anduser model
concept, we observed both the learners’ behavior and their learning state. For eachtest group we specified the minimum number of items that were required to solve thetest group. The mean proportion of correct answers (c) was computed for those whowere assumed to be prepared for this concept (pre) (i.e, the current learning state ofthis concept was eithersuggestedor solved) and for those who were assumed to havesome missing prerequisites (¬pre) (i.e., the current learning state of this concept wasnot ready).
Experimental Results and Discussion
Figure 5.10 shows that learners who are supposed to be prepared for a concept per-formed better on the test items than those who were not fully prepared. Note that allstudents had the same information about the concept, the only difference betweenthe groups is that the latter did not fulfill all prerequisites for this concept, becausethe learners did not follow the suggested path. For two courses (PiagetandProblem-loesen) we were not able to demonstrate a statistical difference between the groups(see Table 5.9). However, the statistical analysis makes obvious that the effect is notin the opposite direction.
From a statistical point of view, it would have been desirable to reduce the variancewithin the groups to get a clearer picture of the relevant effects. A considerableamount of variance is probably caused by varying difficulties of the test groups.While some test groups are easy to solve and therefore the mean proportion of correctanswers is high, other test groups are more difficult. Thus, we computed separatet-tests for every concept in theHTML-Tutoras well. Naturally, not all users workedon every concept which decreases the sample size rapidly and statistical significancebecomes difficult to reach. The 38 concepts can be categorized in reference to thedirection of the mean difference and to the significance of the result. As shown inTable 5.10 most concepts conformed with our hypothesis. Note that a concept-wiseanalysis for the other courses was not possible because sample sizes were too small.
In summary, the study suggests that NetCoach courses model the learner’s know-ledge correctly. The assumed learning state predicts at least parts of the learner’sperformance. However, the effect sizes are rather small. But if it was possible to im-prove the learning process by adapting to the user’s knowledge this approach shouldat least be considered when a new learning environment is designed.
101

5. Empirical Evaluation of an Adaptive Web-Based Learning Course
Kommu-nikation
Personen-wahr-nehmung
Piaget Problem-lösen
HTML-Tutor
.00
.10
.20
.30
.40
.50
.60
.70
.80
prepared
not prepared
Figure 5.10.: Mean proportion of correct responses to test items for learners thatwere assumed to be prepared or not prepared for this concept. Theerror bars indicate± one standard deviation. See Table 5.9 for detailedresults
102
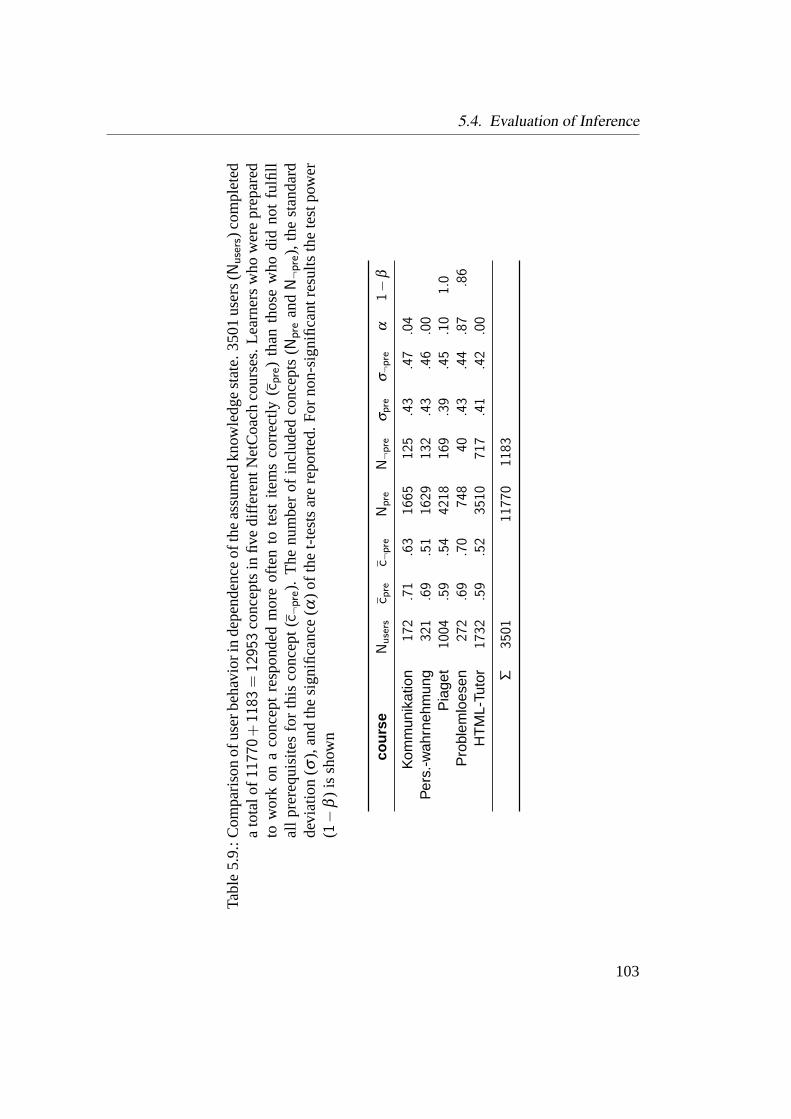
5.4. Evaluation of Inference
Tabl
e5.
9.:C
ompa
rison
ofus
erbe
havi
orin
depe
nden
ceof
the
assu
med
know
ledg
est
ate.
3501
user
s(
Nuse
rs)c
ompl
eted
ato
talo
f117
70+
1183
=12
953
conc
epts
infiv
edi
ffere
ntN
etC
oach
cour
ses.
Lear
ners
who
wer
epr
epar
edto
wor
kon
aco
ncep
tre
spon
ded
mor
eof
ten
tote
stite
ms
corr
ectly
(c p
re)
than
thos
ew
hodi
dno
tfu
lfill
allp
rere
quis
ites
for
this
conc
ept
(c ¬
pre).
The
num
ber
ofin
clud
edco
ncep
ts(
Npr
ean
dN¬p
re),
the
stan
dard
devi
atio
n(σ
),an
dth
esi
gnifi
canc
e(
α)
ofth
et-
test
sar
ere
port
ed.
For
non-
sign
ifica
ntre
sults
the
test
pow
er(1−
β)
issh
own
cour
seN
use
rsc p
rec ¬
pre
Npre
N¬p
reσ
pre
σ¬p
reα
1−
β
Kom
mun
ikat
ion
172
.71
.63
1665
125
.43
.47
.04
Per
s.-w
ahrn
ehm
ung
321
.69
.51
1629
132
.43
.46
.00
Pia
get
1004
.59
.54
4218
169
.39
.45
.10
1.0
Pro
blem
loes
en27
2.6
9.7
074
840
.43
.44
.87
.86
HT
ML-
Tuto
r17
32.5
9.5
235
1071
7.4
1.4
2.0
0
Σ35
0111
770
1183
103
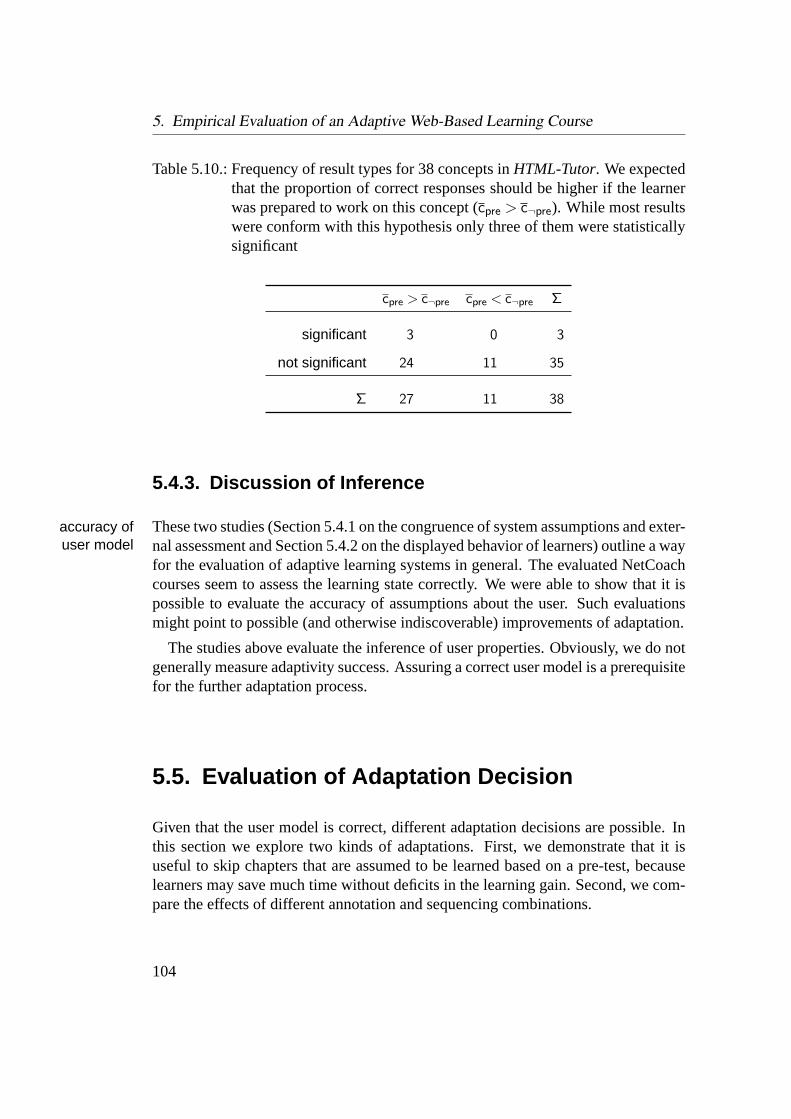
5. Empirical Evaluation of an Adaptive Web-Based Learning Course
Table 5.10.: Frequency of result types for 38 concepts inHTML-Tutor. We expectedthat the proportion of correct responses should be higher if the learnerwas prepared to work on this concept (cpre > c¬pre). While most resultswere conform with this hypothesis only three of them were statisticallysignificant
cpre > c¬pre cpre < c¬pre Σ
significant 3 0 3
not significant 24 11 35
Σ 27 11 38
5.4.3. Discussion of Inference
These two studies (Section 5.4.1 on the congruence of system assumptions and exter-accuracy ofuser model nal assessment and Section 5.4.2 on the displayed behavior of learners) outline a way
for the evaluation of adaptive learning systems in general. The evaluated NetCoachcourses seem to assess the learning state correctly. We were able to show that it ispossible to evaluate the accuracy of assumptions about the user. Such evaluationsmight point to possible (and otherwise indiscoverable) improvements of adaptation.
The studies above evaluate the inference of user properties. Obviously, we do notgenerally measure adaptivity success. Assuring a correct user model is a prerequisitefor the further adaptation process.
5.5. Evaluation of Adaptation Decision
Given that the user model is correct, different adaptation decisions are possible. Inthis section we explore two kinds of adaptations. First, we demonstrate that it isuseful to skip chapters that are assumed to be learned based on a pre-test, becauselearners may save much time without deficits in the learning gain. Second, we com-pare the effects of different annotation and sequencing combinations.
104

5.5. Evaluation of Adaptation Decision
5.5.1. Adapting to the Learners’ Prior Knowledge
Online learning courses are used by people that differ widely in prior domain know-ledge. Especially in further education and learning on demand settings, some learn-ers will have a partial background of the course-topic while others are completebeginners.
However, regardless of prior knowledge, everyone should have the same know-opportunitiesledge after course completion. On the one hand, users might get bored if they haveto work on topics that they are already familiar with. On the other hand, they areprobably not able to estimate whether they do really know everything on a topic ofa course without having seen the chapters. Thus, letting users decide on their ownwhether they have enough knowledge or not might result in incomplete knowledgeacquisition.
Moreover, prior knowledge has an impact on the learning gain. When constructinga hypertext, authors should consider the users’ prior knowledge (Park and Hannafin,1993). It might be useful to adapt the hypertext’s structure (McDonald and Steven-son, 1998) or to provide different advisements (Shin, Schallert and Savenye, 1994).
In any case, such adaptations require the assessment of prior knowledge. Net-Coach courses provide both a mechanism to assess the user’s prior knowledge andto adapt the course accordingly. We evaluated the pre-test mechanism, i.e., the adap-tation decision to skip chapters based on a pre-test, with theHTML-Tutor.
Method and Criteria
We observed a total of 140 users who accessed the public course from all over theworld. Two groups of users were distinguished: the first group (no pre-test) ignoredpre-test
conditionsthe pre-test and completed the chapters as usual, while the second group (pre-testpresented) decided to answer the pre-test. A random selection of test items fromsubordinated chapters was presented to this group. Consequently most of them wereadvised to omit at least some subchapters.
At the end of the course, users completed a final test that included several testknowledgetestitems on the pre-test chapters. If the pre-test assessment was successful the second
group should know as much as the first group about the chapters, even though theydid not read the contents. Moreover, we computed the time that each learner requiredto complete the chapters.
Obviously, 140 users are only a small subset of those observed in the previousstudies. However, for this evaluation we had to select those who completed the finaltest, i.e., they completed the whole course, which takes a least 6–8 hours. Mostusers cancel before they reach this final objective. This is typical for online courses,
105
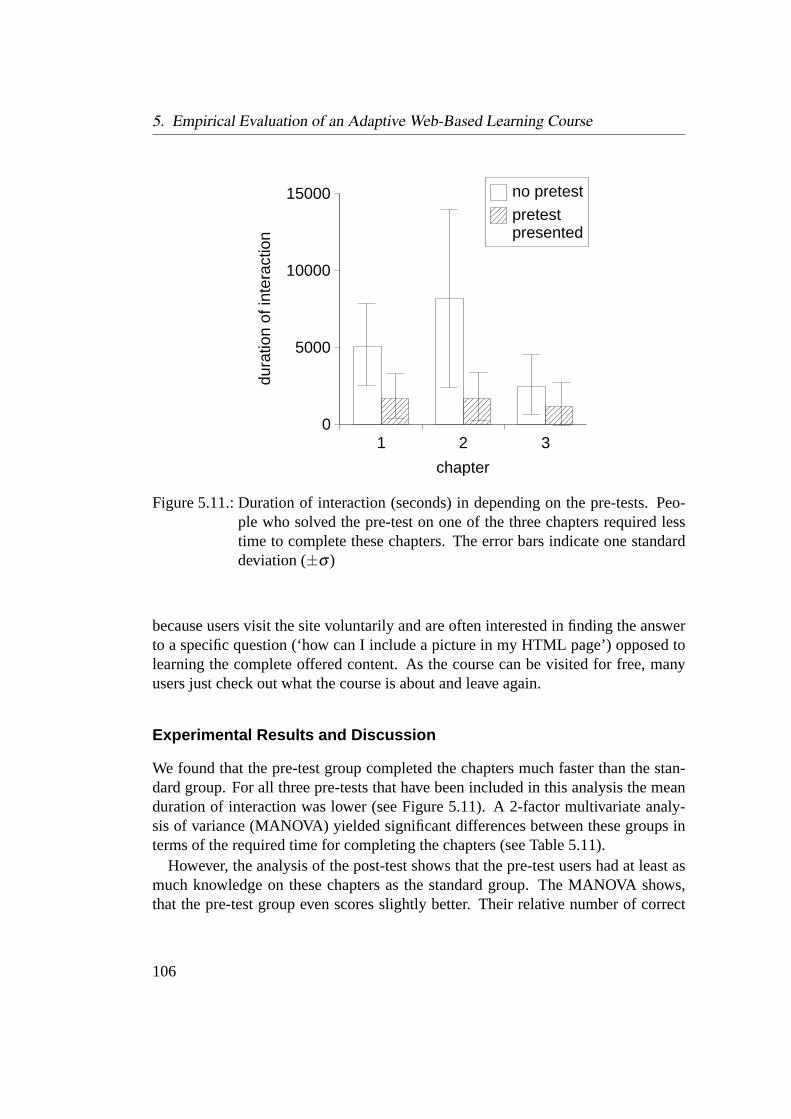
5. Empirical Evaluation of an Adaptive Web-Based Learning Course
1 2 30
5000
10000
15000 no pretest
pretest presented
chapter
dura
tion
of in
tera
ctio
n
Figure 5.11.: Duration of interaction (seconds) in depending on the pre-tests. Peo-ple who solved the pre-test on one of the three chapters required lesstime to complete these chapters. The error bars indicate one standarddeviation (±σ )
because users visit the site voluntarily and are often interested in finding the answerto a specific question (‘how can I include a picture in my HTML page’) opposed tolearning the complete offered content. As the course can be visited for free, manyusers just check out what the course is about and leave again.
Experimental Results and Discussion
We found that the pre-test group completed the chapters much faster than the stan-dard group. For all three pre-tests that have been included in this analysis the meanduration of interaction was lower (see Figure 5.11). A 2-factor multivariate analy-sis of variance (MANOVA) yielded significant differences between these groups interms of the required time for completing the chapters (see Table 5.11).
However, the analysis of the post-test shows that the pre-test users had at least asmuch knowledge on these chapters as the standard group. The MANOVA shows,that the pre-test group even scores slightly better. Their relative number of correct
106
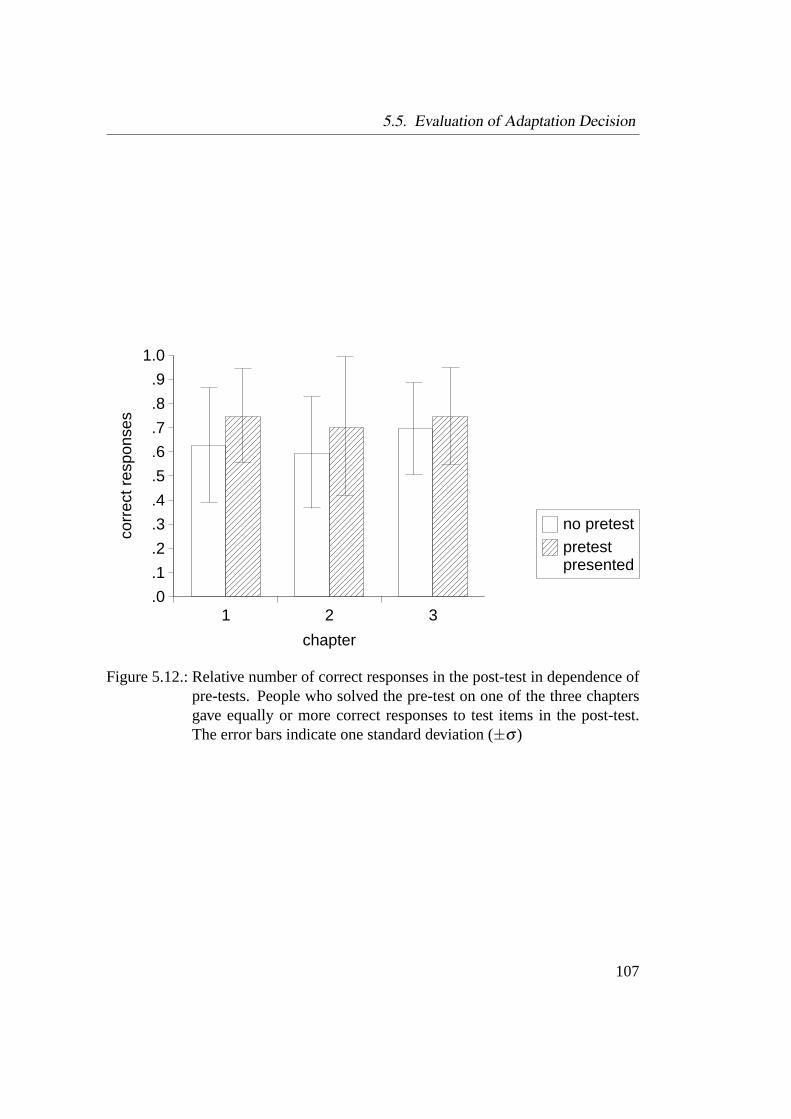
5.5. Evaluation of Adaptation Decision
1 2 3.0
.1
.2
.3
.4
.5
.6
.7
.8
.9
1.0
no pretestpretest presented
chapter
corr
ect r
espo
nses
Figure 5.12.: Relative number of correct responses in the post-test in dependence ofpre-tests. People who solved the pre-test on one of the three chaptersgave equally or more correct responses to test items in the post-test.The error bars indicate one standard deviation (±σ )
107
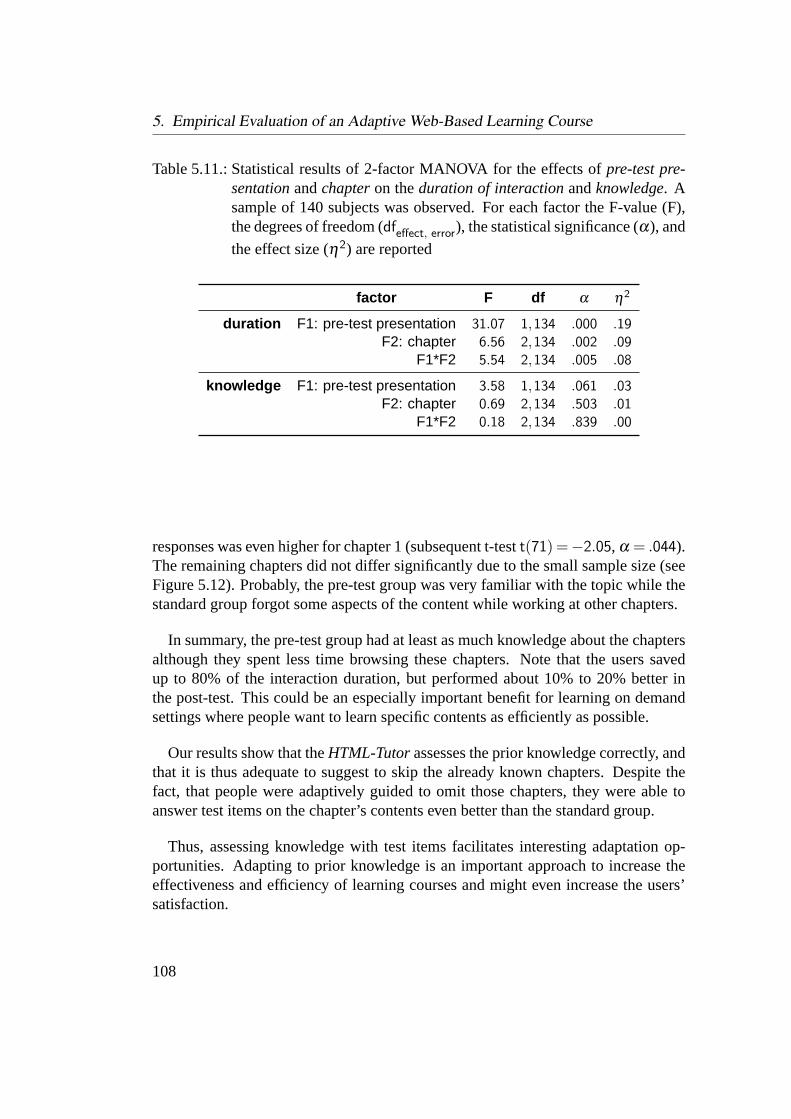
5. Empirical Evaluation of an Adaptive Web-Based Learning Course
Table 5.11.: Statistical results of 2-factor MANOVA for the effects ofpre-test pre-sentationandchapteron theduration of interactionandknowledge. Asample of 140 subjects was observed. For each factor the F-value (F),the degrees of freedom (dfeffect, error), the statistical significance (α), and
the effect size (η2) are reported
factor F df α η2
duration F1: pre-test presentation 31.07 1,134 .000 .19F2: chapter 6.56 2,134 .002 .09
F1*F2 5.54 2,134 .005 .08
knowledge F1: pre-test presentation 3.58 1,134 .061 .03F2: chapter 0.69 2,134 .503 .01
F1*F2 0.18 2,134 .839 .00
responses was even higher for chapter 1 (subsequent t-testt(71) =−2.05, α = .044).The remaining chapters did not differ significantly due to the small sample size (seeFigure 5.12). Probably, the pre-test group was very familiar with the topic while thestandard group forgot some aspects of the content while working at other chapters.
In summary, the pre-test group had at least as much knowledge about the chaptersalthough they spent less time browsing these chapters. Note that the users savedup to 80% of the interaction duration, but performed about 10% to 20% better inthe post-test. This could be an especially important benefit for learning on demandsettings where people want to learn specific contents as efficiently as possible.
Our results show that theHTML-Tutorassesses the prior knowledge correctly, andthat it is thus adequate to suggest to skip the already known chapters. Despite thefact, that people were adaptively guided to omit those chapters, they were able toanswer test items on the chapter’s contents even better than the standard group.
Thus, assessing knowledge with test items facilitates interesting adaptation op-portunities. Adapting to prior knowledge is an important approach to increase theeffectiveness and efficiency of learning courses and might even increase the users’satisfaction.
108
5.5. Evaluation of Adaptation Decision
5.5.2. Comparison of Different Adaptation Decisions
To estimate the effect that stems from the adaptation, it is possible to compare dif-ferent adaptation decisions. In principle a wide range of different decisions may beapplied, however, in this study we only compared four combinations of annotationand sequencing.
Method and Criteria
In a 2×2-factor design we observed how users behavewith andwithout annotation,andwith andwithout curriculum sequencing. Between July and September 2002, allonline users of theHTML-Tutor were assigned randomly to one of these four con-ditions. When annotation is switched off, all links to chapters are presented in thesame color regardless of the users’ current knowledge. In thewithout sequencingcondition the system behaved in quite the same way as the standardHTML-Tutorversion besides the fact that the ‘next’ button was not available, and the system didnot suggest pages in any other way. As the fourth condition (with both annotationand sequencing) is identical to the standard version, we included the data of the pre-vious sessions in the analysis, too, after checking that the mean values and variancesof the two samples were equal.
First, the number of dropouts was registered. We counted the number of usersdropoutswho completed the seven subsections of the first chapter. The completion rate wascomputed for each subsection separately.
Second, we observed the user behavior in terms of the number of concepts thatnumber ofconceptshave been visited during interaction. Moreover, we computed the number of con-
cepts that have been visited in relation to the duration of interaction.These measures were also assessed forRR2000, the course on German spelling
rules. Between October 1999 and June 2000 a total of 5703 users visited the course.Analogous to theHTML-Tutor sample they were assigned randomly to one of thefour conditions. We expected that the more linear structure ofRR2000(as shown inTable 5.4) will result in smaller differences between the adaptation conditions.
In addition, we evaluated the feedback questionnaire that was presented at the endoverallimpressionof the HTML-Tutor. As already described in Chapter 4.4.2, we extracted the users’
overall impression of the system by computing the mean value of four usability rat-ings on a 10-point scale. The satisfaction with the adaptation was assessed by themean value of four questions that are concerned with the effect of different adapta-subjective
adaptivitysuccess
tion aspects (see Chapter 4.4.2 for the exact formulation of these rating scales). Theusers had to rate the success of the adaptation in terms of the page suggestions, the
109
5. Empirical Evaluation of an Adaptive Web-Based Learning Course
annotation, and the number of items in a test group, as well as the general adaptivitysuccess.
Experimental Results and Discussion
We only found slight differences between the four adaptation conditions. The distri-bution of dropouts across the subsections with test groups in the first chapter is showndropoutsin Figure 5.13. Though the non-adaptive condition (without annotationandwithoutsequencing) yields the most dropouts, there is no statistical difference between thefour groups (repeated measurement ANOVA withN = 13733 for annotation and se-quencing). Obviously, the adaptation did not stimulate the users very much to keepon working. InRR2000, the no-annotation-groups even completed slightly morechapters (repeated measurement ANOVA withN = 5703, F1, 5699 = 6.57, α = .010,andη2 = 0.001). The peaks in the dropout curve (Figure 5.14) result from the factthat some users skipped subsections and turned directly to subsequent sections.
For the analysis of the number of concepts and the subjective ratings users whointeracted less than 15 minutes were excluded to get a more homogenous sample andto assure that the users really worked with the courses.
The number of concepts that have been visited was equal for all four adaptationnumber ofconcepts conditions. While the mean values differ slightly (Table 5.12), the analysis of vari-
ance reveals that users in all conditions requested about the same amount of material,i.e., they visited a equivalent number of concepts (Table 5.13).
Surprisingly, the number of concepts per minute is increased if people receiveconcepts perminute annotations but no sequencing. The statistical analysis manifests this difference,
though the effect size is very small. InRR2000, the adaptation conditions had noimpact at all. In other words, the users in this course requested the same amountof material and browsed the chapters at the same pace regardless of the adaptation(Table 5.14).
These results do not agree with previous studies. While Klein (2000) found nopreviousstudies difference for different types of sequencing and annotation conditions, Weber and
Specht (1997b) report that especially unexperienced users benefit from annotationand sequencing. However, even a sample split according to the self reported expe-rience with computers and the internet did not change our results. All three studieshave been conducted with NetCoach courses in different domains. While Klein(2000) implemented a huge course on cognitive psychology (INCOPS), Weber andSpecht (1997b) explored programming in LISP. The different contents, its structure,or characteristics of the samples might be responsible for these inconsistent findings.Nevertheless, the value of adaptive annotation in hypermedia has been reported sev-eral times (see Eklund and Brusilovsky, 1998, for an overview) with similar ex-
110
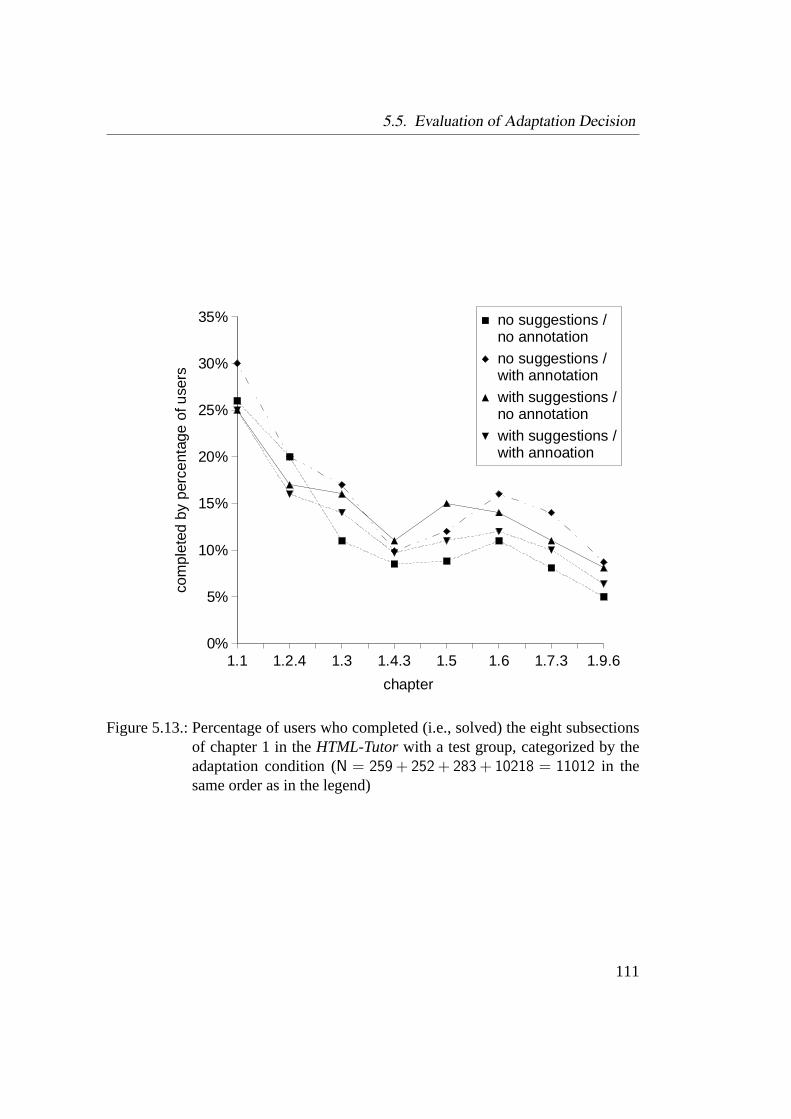
5.5. Evaluation of Adaptation Decision
1.1 1.2.4 1.3 1.4.3 1.5 1.6 1.7.3 1.9.60%
5%
10%
15%
20%
25%
30%
35% no suggestions / no annotation
no suggestions / with annotation
with suggestions / no annotation
with suggestions / with annoation
chapter
com
plet
ed b
y pe
rcen
tage
of u
sers
Figure 5.13.: Percentage of users who completed (i.e., solved) the eight subsectionsof chapter 1 in theHTML-Tutor with a test group, categorized by theadaptation condition (N = 259 + 252 + 283 + 10218 = 11012 in thesame order as in the legend)
111
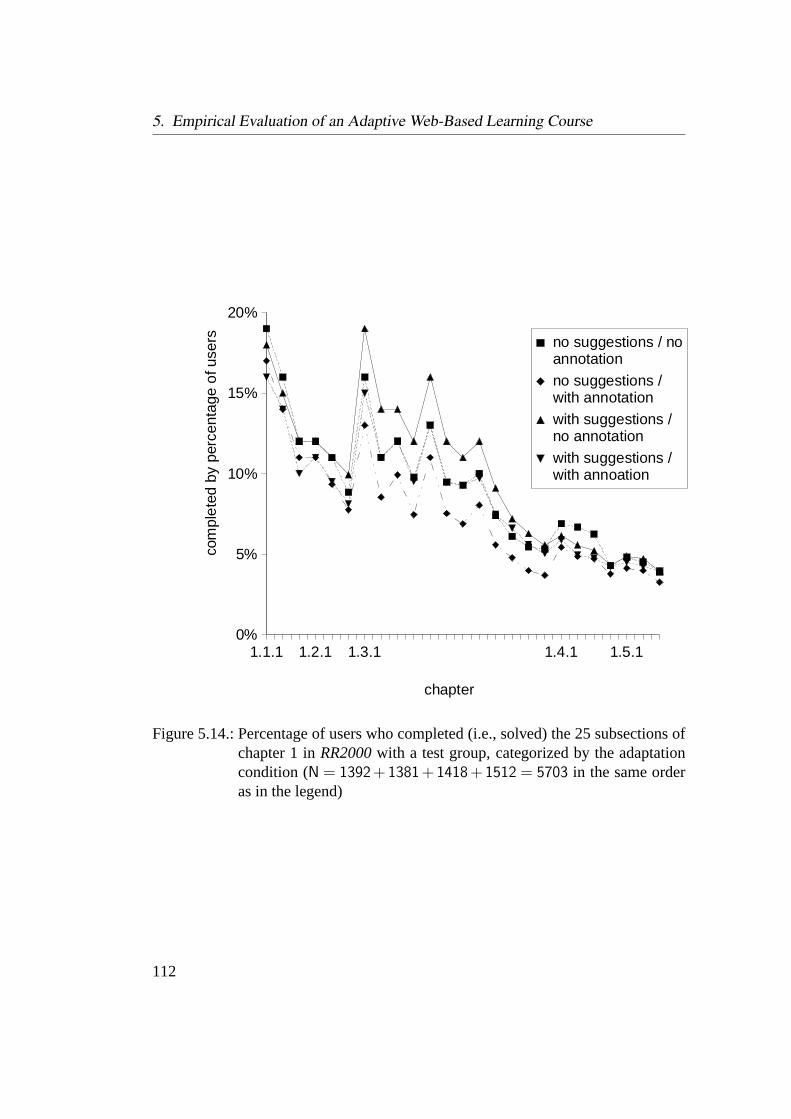
5. Empirical Evaluation of an Adaptive Web-Based Learning Course
1.1.1 1.2.1 1.3.1 1.4.1 1.5.10%
5%
10%
15%
20%
no suggestions / no annotation
no suggestions / with annotation
with suggestions / no annotation
with suggestions / with annoation
chapter
com
plet
ed b
y pe
rcen
tage
of u
sers
Figure 5.14.: Percentage of users who completed (i.e., solved) the 25 subsections ofchapter 1 inRR2000with a test group, categorized by the adaptationcondition (N = 1392+ 1381+ 1418+ 1512 = 5703 in the same orderas in the legend)
112
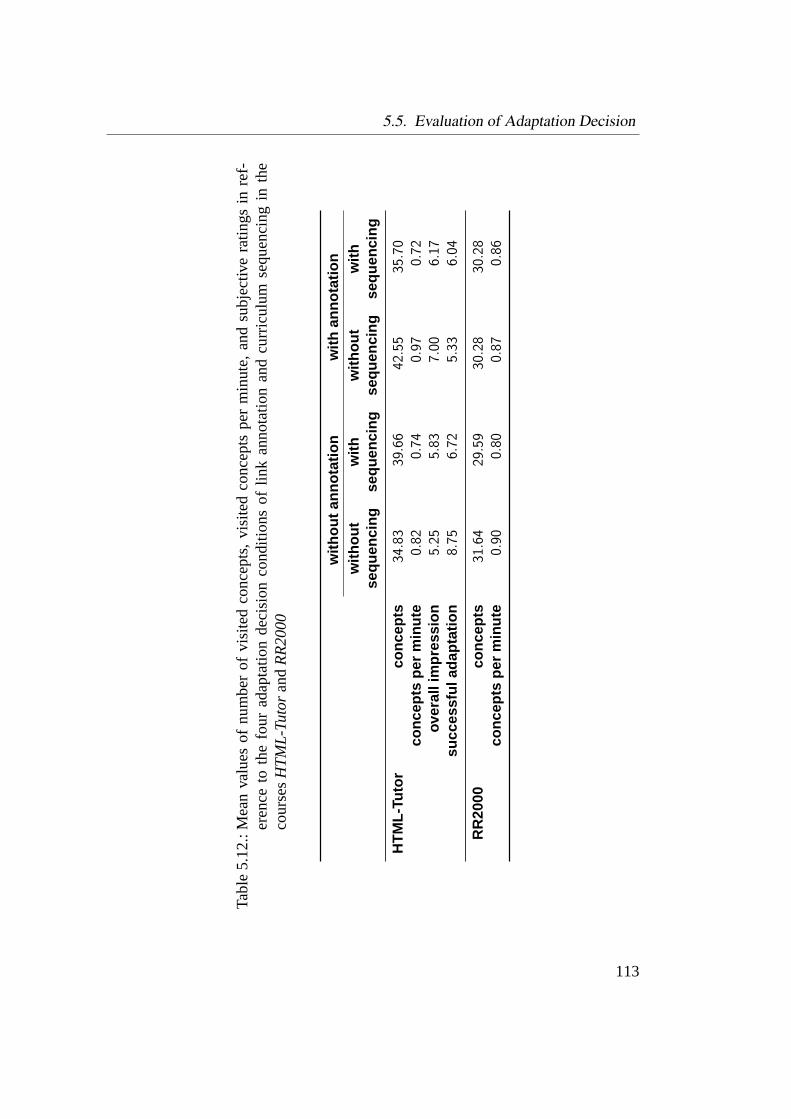
5.5. Evaluation of Adaptation Decision
Tabl
e5.
12.:
Mea
nva
lues
ofnu
mbe
rof
visi
ted
conc
epts
,vi
site
dco
ncep
tspe
rm
inut
e,an
dsu
bjec
tive
ratin
gsin
ref-
eren
ceto
the
four
adap
tatio
nde
cisi
onco
nditi
ons
oflin
kan
nota
tion
and
curr
icul
umse
quen
cing
inth
eco
urse
sHT
ML
-Tu
tora
ndR
R2
00
0
with
outa
nnot
atio
nw
ithan
nota
tion
with
out
with
with
out
with
sequ
enci
ngse
quen
cing
sequ
enci
ngse
quen
cing
HT
ML-
Tuto
rco
ncep
ts34
.83
39.6
642
.55
35.7
0co
ncep
tspe
rm
inut
e0.
820.
740.
970.
72ov
eral
lim
pres
sion
5.25
5.83
7.00
6.17
succ
essf
ulad
apta
tion
8.75
6.72
5.33
6.04
RR
2000
conc
epts
31.6
429
.59
30.2
830
.28
conc
epts
per
min
ute
0.90
0.80
0.87
0.86
113
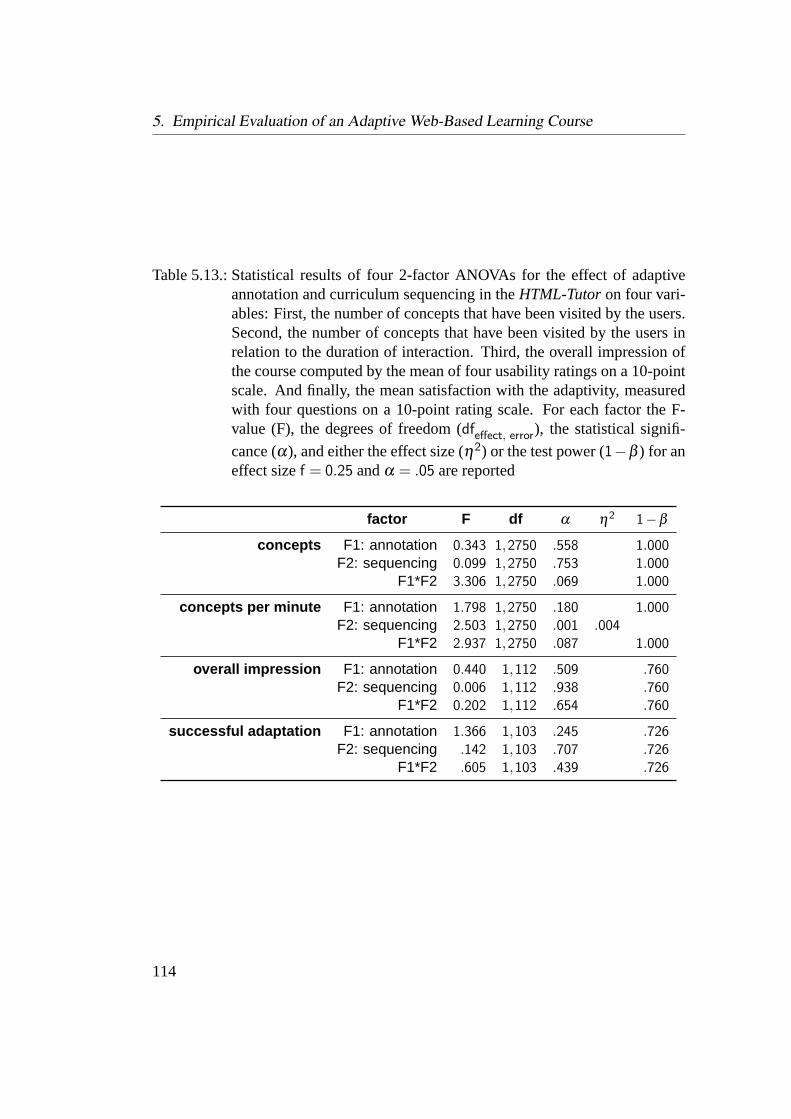
5. Empirical Evaluation of an Adaptive Web-Based Learning Course
Table 5.13.: Statistical results of four 2-factor ANOVAs for the effect of adaptiveannotation and curriculum sequencing in theHTML-Tutoron four vari-ables: First, the number of concepts that have been visited by the users.Second, the number of concepts that have been visited by the users inrelation to the duration of interaction. Third, the overall impression ofthe course computed by the mean of four usability ratings on a 10-pointscale. And finally, the mean satisfaction with the adaptivity, measuredwith four questions on a 10-point rating scale. For each factor the F-value (F), the degrees of freedom (dfeffect, error), the statistical signifi-
cance (α), and either the effect size (η2) or the test power (1−β ) for aneffect sizef = 0.25 andα = .05 are reported
factor F df α η2 1−β
concepts F1: annotation 0.343 1,2750 .558 1.000F2: sequencing 0.099 1,2750 .753 1.000
F1*F2 3.306 1,2750 .069 1.000
concepts per minute F1: annotation 1.798 1,2750 .180 1.000F2: sequencing 2.503 1,2750 .001 .004
F1*F2 2.937 1,2750 .087 1.000
overall impression F1: annotation 0.440 1,112 .509 .760F2: sequencing 0.006 1,112 .938 .760
F1*F2 0.202 1,112 .654 .760
successful adaptation F1: annotation 1.366 1,103 .245 .726F2: sequencing .142 1,103 .707 .726
F1*F2 .605 1,103 .439 .726
114

5.5. Evaluation of Adaptation Decision
Table 5.14.: Statistical results of two 2-factor ANOVAs for the effect of adaptive an-notation and curriculum sequencing inRR2000on two variables: First,the number of concepts that have been visited by the users. Second, thenumber of concepts that have been visited by the users in relation tothe duration of interaction. For both factors the F-value (F), the degreesof freedom (dfeffect, error), the statistical significance (α), and either the
effect size (η2) or the test power (1−β ) for an effect sizef = 0.25 andα = .05 are reported
factor F df α η2 1−β
concepts F1: annotation 0.049 1,1508 .825 1.000F2: sequencing 0.457 1,1508 .499 1.000
F1*F2 0.449 1,1508 .503 1.000
concepts per minute F1: annotation 0.206 1,1508 .650 1.000F2: sequencing 1.272 1,1508 .260 1.000
F1*F2 0.669 1,1508 .414 1.000
perimental designs. We argue, that further explorations are required to identify theunderlying mechanisms.
Neither overall impression nor subjective adaptivity success differed across thesubjectiveratingsfour conditions (Table 5.13). However, the sample size for this analysis was quite
small due to a data assessment failure and thus the test power remains too small fordefinite statements. Nevertheless, asking the users for adaptivity success seems toinduce weird effects. The group who interacted with a completely non-adaptive sys-tem (without annotation and without sequencing) rated the success of the adaptationvery high. In other words, though this group could not observe anything that actuallyadapted, they were quite satisfied with the result. We argue, that subjective ratingsare obviously not useful for evaluation here, because there is no baseline of what issuccessful or unsuccessful as long as the users have not seen another version thatbehaves differently.
5.5.3. Discussion of Adaptation Decision
In summary, the differences between the various adaptation mechanisms are small interms of the explored criteria. Even if we take into account that adaptation strategieslike annotation and sequencing are quite simple, and that the used criteria might be
115

5. Empirical Evaluation of an Adaptive Web-Based Learning Course
misleading, it is somewhat surprising that even the no-adaptation condition scoredwell. We argue that this emphasizes the necessity of the evaluation framework andof the selection of adequate criteria even more. As the previous evaluation stephas shown, the inferred user properties are correct the results suggest to test otheradaptation decisions that are based on the same user properties as well or to definemore specific criteria that are able to extract the underlying effects better than themeasures that have been used here.
However, the effects of the adaptation to prior knowledge are evident. This is aclear advantage of the adaptivity that is especially of importance in settings werelearners differ widely in prior knowledge, e.g., in further education. This mightbecome a crucial field of application for adaptive learning systems.
5.6. Evaluation of Total Interaction
As a final evaluation step, we present some summative data how the system and theusers behave in real world settings and how this influences the usability.
5.6.1. System Behavior
First, we observed the system behavior in real interactions. Does the system reallyadapt to the user or is the behavior still quite static, because learners do not differ asmuch as expected?
We observed a total of 2438 users, who interacted with theHTML-Tutor for atleast 900 seconds. This time limit was chosen to sort out visitors who were lookingfor different contents and to assure, that the users really learned with the system.
856 of these learners had at least one concept in their user model that wassolvedsolvedconcepts but not read, i.e., they never visited this page. This happens if users work on pre-
tests. Thus 35% of the users had an advantage of the adaptation, because they wereallowed to skip these chapters.
379 of the learners in the sample had at least one concept in their user model thatinferredconcepts wasinferredto be learned but that was neithersolvedin a test group nor visited. That
is, 15% of the users profited directly from these inferences, because they had not towork on these chapters to reach the learning objective.
The 2438 users worked on 84702 chapters. 2144 (2.5%) of these chapters wereinferredfrom other chapters and have never been visited. 4754 (5.6%) chapters weresolvedin pre-tests and have not been visited. Thus, the system made predictions for8.1% of the chapters.
116
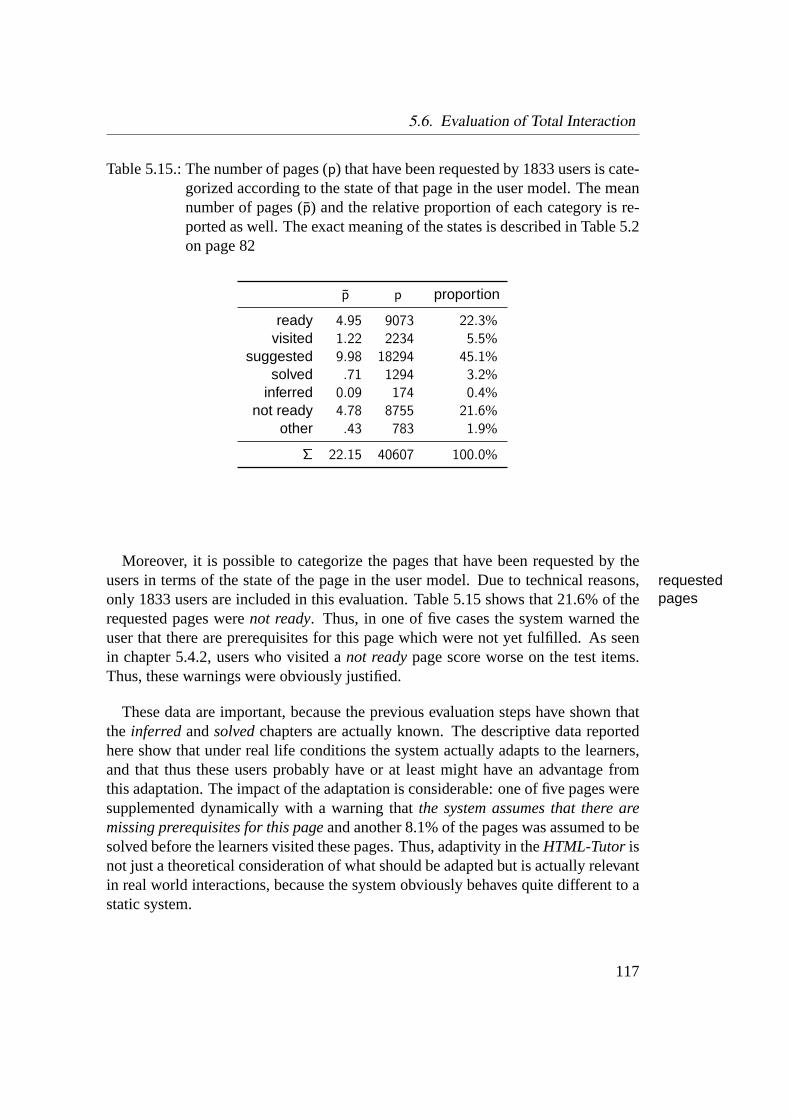
5.6. Evaluation of Total Interaction
Table 5.15.: The number of pages (p) that have been requested by 1833 users is cate-gorized according to the state of that page in the user model. The meannumber of pages (p̄) and the relative proportion of each category is re-ported as well. The exact meaning of the states is described in Table 5.2on page 82
p̄ p proportion
ready 4.95 9073 22.3%visited 1.22 2234 5.5%
suggested 9.98 18294 45.1%solved .71 1294 3.2%
inferred 0.09 174 0.4%not ready 4.78 8755 21.6%
other .43 783 1.9%
Σ 22.15 40607 100.0%
Moreover, it is possible to categorize the pages that have been requested by theusers in terms of the state of the page in the user model. Due to technical reasons,requested
pagesonly 1833 users are included in this evaluation. Table 5.15 shows that 21.6% of therequested pages werenot ready. Thus, in one of five cases the system warned theuser that there are prerequisites for this page which were not yet fulfilled. As seenin chapter 5.4.2, users who visited anot readypage score worse on the test items.Thus, these warnings were obviously justified.
These data are important, because the previous evaluation steps have shown thatthe inferredandsolvedchapters are actually known. The descriptive data reportedhere show that under real life conditions the system actually adapts to the learners,and that thus these users probably have or at least might have an advantage fromthis adaptation. The impact of the adaptation is considerable: one of five pages weresupplemented dynamically with a warning thatthe system assumes that there aremissing prerequisites for this pageand another 8.1% of the pages was assumed to besolved before the learners visited these pages. Thus, adaptivity in theHTML-Tutorisnot just a theoretical consideration of what should be adapted but is actually relevantin real world interactions, because the system obviously behaves quite different to astatic system.
117
5. Empirical Evaluation of an Adaptive Web-Based Learning Course
5.6.2. User Behavior and Usability
On average the users interacted with the course for 60.5 minutes, while some learn-duration ofinteraction ers worked for up to 14 hours. Usually, the users followed the system suggestions
(45.1%), and only few returned to pages that they had seen before (see Table 5.15).In Chapter 5.5.1 we already demonstrated that many learners benefited from the
adaptation to prior knowledge, because they saved much time without skipping re-levant content. The number of dropouts and the amount of requested material hasbeen reported in Chapter 5.5.2: the users worked on 13.68 concepts on average andcompleted 1.30 concepts per minute.
By evaluating the subjective feedback we found that the learners rated the sys-tem quite good. The overall impression of the system on a 10-point scale (0–9)overall
impression equals 6.17 (Table 5.12) which is better than the feedback of users to other Net-Coach courses (Table 4.2). The rating of the adaptivity success is also quite goodadaptivity
success (6.04), though the variation of adaptation conditions showed no effect here (Chapter5.5.2).
5.6.3. Discussion of Total Interaction
In summary, the subjective ratings are good, but it is not clear whether this is aneffect of successful adaptivity or just an overall impression, because the differentadaptation conditions did not differ in terms of these ratings. As already outlinedabove, subjective ratings are problematic for the evaluation of adaptivity success ifthe users do not have any baseline or scale of what successful or unsuccessful means.
However, it is evident that the adaptivity has an important impact on the systembehavior, i.e., the interaction changes considerably due to the assumptions of thesystem.
118

6. Discussion
6.1. Generalization of experimental results
Finally, we discuss the implications of the results reported above for other NetCoachcourses and other adaptive learning systems as well as for adaptive systems in gen-eral.
6.1.1. Implications for Adaptive Learning Systems
The results differ in terms of their impact. While the effects of adaptation to priorknowledge are rather high, adaptive annotation and guiding seem to influence theusers only slightly. However, we did not expect that changing the color of but-tons would have an extreme impact on the learning gain, though some findings onthese adaptation techniques are rather encouraging (Eklund and Brusilovsky, 1998).Learning depends on many factors and supporting the navigation and sequencing ofmaterial is only one of many aspects that are important for a smooth interaction andthe learning process.
The HTML-Tutor seems to assess the learner’s knowledge correctly. We found,that the congruence of the user models with an external assessment is pretty high,and the adaptation to prior-knowledge would not be that successful if there wereimportant misinterpretations. Thus, other adaptation decisions than the used onesother
adaptationdecisions
might be considered. For example, instead of just pointing out that there are miss-ing prerequisites the system could provide short summaries of the prerequisite pages(Lippitsch, Weibelzahl and Weber, 2002). This could help the learner to estimatewhether she is already familiar with the topic or not. This can be seen as a generaltrend: current intelligent systems tend to support the user and ask for confirmationof assumptions instead of patronizing the learner as if the system was omniscient.Furthermore, adaptation decisions that are based on the learners’ knowledge includedifferent ways of guiding (e.g., forcing the user to go to the suggested page or expli-citly explaining, why a certain page is suggested). These adaptation decisions should
119

6. Discussion
be tested not only with NetCoach courses but with other adaptive learning systemsas well.
Second, the fact that NetCoach assesses the knowledge properly imposes the ques-tion whether techniques that are used in other systems are equally successful. Theother
assessmentmethods
studies reported above demonstrate that test items may assess the learners’ know-ledge correctly. Simple methods like “visited pages are known” might fail here, butempirical evidence is required for such a claim. On the other hand, more complextechniques, such as modeling the user’s knowledge with an adaptive test that is basedon the item response theory (Guzmán and Conejo, 2002) need to support their claimthat these systems assess the knowledge more exactly.
Third, some of the studies report results across domains. However, it is not obvi-generalizationacross
domainsous which domains the results are transferable to. HTML is a very structured con-tent with clear knowledge dependencies. Other contents are much more linear, andguiding and annotation will probably be of less importance there. For instance, theRR2000course on German spelling rules is for the most part a collection of subjectsthat are quite independent. Only some subchapters are interdependent, e.g., severalsections are prerequisite for a summary with a test group.
We claim that a formal method that could categorize a content in terms of itsusefulness and appropriateness for adaptation would be highly appreciated. It wouldallow for estimations of whether a domain or subject should be presented in an adap-tive way or not. However, as long as such a method is not available (and we doubtwhether the development of such a method is possible at all) empirical evaluations indifferent domains are still required and absolutely necessary. Adaptive learning sys-tems will become standard only if their usefulness and efficiency has been proved.We hope that the reported studies and especially the evaluation framework will en-courage further investigations.
Finally, the studies contribute to the discussion of costs and benefits of adaptivecosts andbenefits learning systems. Throughout this work we explored and discussed the accuracy
and success of adaptivity. Apart from this scientific point of view, in economicsettings the relation of efforts and achievements is of importance. Do the resultsthat are reported here justify the efforts that are needed to implement the adaptivity?Annotation and curriculum sequencing as a supplemental feature seem to have onlya small impact, which is not sufficient to be added to an existing system. However,there are two important exceptions.
First, the additional efforts that are needed to generate a NetCoach course are verylittle. As described above, the authoring system supports the complete course gener-ation process. Authors prepare the material as usual. The only additional task is towrite test items and to specify prerequisite and inference relations between chapters.Thus, the efforts for adaptivity in NetCoach courses (and probably other author-
120
6.2. Discussion of the Evaluation Framework
ing systems) are pretty low, and a good course should be based on such relationsimplicitly, anyway. Even for big courses like theHTML-Tutor the specification ofrelations required low efforts in comparison to the authoring of the material. Thepossible benefit will justify these efforts and the individual feedback is definitely acomfortable feature for the learners.
Second, curriculum obviously has a high potential in terms of adaptation to priorknowledge. We demonstrated that learners might save a lot of time if they are advisedto skip chapters that are already known. For on-the-job training and further educationthis is a factor of high relevance, because the efficiency of learning is considerablyincreased. We claim that the adaptation to prior knowledge will be an important fieldof application for adaptive learning systems.
6.1.2. Implications for Adaptive Systems in General
It might be surprising for some readers, that the straightforward adaptation tech-niques that are used in NetCoach yield quite good results. This challenges morecomplex techniques that require more knowledge engineering or more costly imple-mentations. Are there user properties that actually require a more complex approach,because a simple rule based technique is unable to model it exactly? And is this ex-actness of importance for the interaction? For example, it is possible to adapt to theproblem solving skills of learners by simulating the learning process with a cogni-tive model (Corbett and Anderson, 1992). For teaching programming this approachyielded impressive results (Corbett, 2001). However, a less elaborate approach couldalso support the learners to a certain degree. Is it really necessary to run a full blowncognitive model in the background to adapt to the learner? We argue, that the eval-uation framework could be useful to answer these questions by comparing differentmodeling approaches (or inference mechanisms) in terms of their correctness (eval-uation of inference) as well as in regard of the impact on the interaction (evaluationof interaction). This would allow to estimate the effects that are actually achieved bythe adaptation in different ways.
6.2. Discussion of the Evaluation Framework
This work applied the complete evaluation framework to an adaptive learning sys-tem. In this chapter we summarize our experiences with the framework and considerthe applicability of the framework to other adaptive systems.
121
6. Discussion
6.2.1. Experiences with the Framework
Undoubtedly, good evaluations require a certain amount of efforts, and an elaboratedefforts ofevaluation
studiesand detailed evaluation as it is presented in this work is certainly impossible for everyadaptive system. However, we argue that the complete procedure is not requiredall the time. Once evaluations become more frequent, it would be possible to takeprevious evaluations of the same system or of other systems as a basis for furtherinvestigations. For example, if several studies proved that knowledge on HTML canbe assessed very accurately with test items, subsequent evaluations of other systemswith the same assessment method could focus on different variations of adaptationdecisions.
Furthermore, in our experience step 3, the evaluation of adaptation decisionoverlappingsteps (Chapter 5.5), and step 4, the evaluation of interaction (Chapter 5.6), are very simi-
lar. The main difference is the perspective on the results, but the methods and criteriamight overlap. While the first one compares different possibilities, the latter is a kindof summary that estimates the quality of the total interaction. Thus, it might be dif-ficult to categorize some studies definitely. However, the framework aims at theopposite direction: What has to be done to guarantee successful adaptivity? Theframework gives clear answers to this question.
Finally, the layered evaluation has passed the test. Especially for the last two steps,layeredevaluationapproach
the results were much more non-ambiguous to interpret because the previous studiesdemonstrated that the underlying data are accurate. For example, the description ofthe system behavior gets much more importance if the high frequency of adaptedpages refers to adaptations that are proved to be valid and useful.
6.2.2. Applicability of the Framework to Other Systems
In general we claim that the evaluation framework should be applicable to all adap-tive systems. We present some minor limitations that might be of interest for plan-ning further evaluations.
As already stated above, in some cases the evaluation of input data is not re-evaluation ofinput data quired because the reliability is guaranteed anyway. For example, the number of
mouse clicks is well defined and can be assessed without limitations objectively andreliably.
Second, there might be limitations in the evaluation of inference for some kindsevaluation ofinference of inference mechanisms. For example, adaptive systems that are based on machine
learning algorithms do not represent the user properties explicitly, but connect inputdata and adaptation decision directly, separated for every adaptivity feature (e.g.,Krogsæter, Oppermann and Thomas, 1994; Pohl, 1997, 1998). Thus, it is obviously
122
6.3. Future Perspectives
not possible to compare the user model with an external assessment and step 2 (eval-uation of inference) and 3 (evaluation of adaptation decision) have to be integrated.However, in these systems the evaluation of input data is probably even more impor-tant, because the inference rules have also been learned on the basis of these data.As second example we introduce adaptation techniques that use Bayesian Networks.It might be difficult to test the complete assumptions of these networks, i.e., not onlyparameter values of user properties but probability distributions. For example, a sys-tem might infer a .95-probability of the fact that the user knows the command ‘more’(Jameson, 1996). An external assessment would usually categorize this user prop-erty as eitherknownor unknownwithout any probabilities. However, these systemsusually use a cut-off value for the subsequent adaptation decision, i.e., only if theprobability exceeds .90 it is assumed that the user actually knows the command andthe adaptation takes place regardless of the exact probability value. Thus, a com-parison of user model and external assessment could also be limited to these cut-offvalues.
Different adaptation decisions are probably applicable in all adaptive systems. Inevaluation ofadaptationdecision
some cases the possible variation might be little, but it will still help to estimate theeffect that stems from the adaptivity.
Finally, the implementation of EASy–D (Chapter 3.4) demonstrated that manydifferent evaluations can be categorized according to the framework which supportsour claim that the framework is independent of the domain and system type.
6.3. Future Perspectives
As future perspective on how the approaches that are described in this work couldproceed we outline four aspects.
First, as introduced before, the NetCoach courses as well as other adaptive learn-exploringadaptationdecisions
ing systems might be improved if different adaptation decisions are compared inmore detail. Adaptive annotation, adaptive curriculum sequencing, adaptive feed-back, or adaptive testing might take place in different flavors and with many un-derlying rationale. The appropriateness of these adaptation decisions for differentkind of learners, in different setting with different contents could improve adaptivesystems considerably.
Second, we claim that future evaluations should emphasize at the same time theevaluatingacrossdifferentcontents
consideration of different contents. For instance, evaluations of adaptive learn-ing systems should include courses of different topics and evaluations of adaptiveproduct recommendation systems should contain different product categories. Thequality of the results and the possibility to generalize the effects is obvious. We
123
6. Discussion
strongly encourage this kind of investigations, because this would not only demon-strate the adaptivity effects but also explore how much the adaptivity depends on thecontext. As adaptivity may depend on the domain or topic this kind of design wouldhelp to abstract from this factor or at least help to explore the limits of an approach.We guess that this dependency is much stronger than sometimes suggested, thoughthe empirical basis for this claim is currently quite thin (Chapter 5.5.2).
Third, in addition to the adaptive support of the user it will be more and moreadaptivity foreveryone important to support those people who implement and maintain these systems. This
holds especially for adaptive learning systems, where authors as well as tutors needto understand and predict how the adaptivity mechanism will behave and how theycan use these functions. For example, a tutor might observe that a learner skipsseveral subsections after working on a pre-test. The tutor should be advised whetherthe system suggested to skip these sections or not. Authors must be able to predicthow the system behavior will change if they add new concept relations. But alsoeditors of an adaptive news system, authors of adaptive help texts etc. should besupported. In some cases this might be in an adaptive way again (e.g., by consideringthe authors experience), in other cases a more appropriate way might be to visualizeor explain the adaptivity results. For instance, an adaptive learning system mightprovide the structure of concept relations (similar to the tables in Appendix A.2 andA.3), which might help to understand the system behavior.
Finally, we propose to announce a kind of competition for the best adaptivity ap-adaptivitycompetitions proach. Certainly, this is a major but also appealing task. A procedure that has been
found to be successful in other communities, could become a regular approach forthe user modeling and adaptive hypermedia scientists, too. Standard domains ortasks as well as suitable criteria are announced and different adaptation mechanismsand approaches can be compared directly. This would both allow to explore advan-tages and disadvantages of different approaches as well as making adaptivity morepopular (or at least noticed by a broader audience) as the results of these competi-tions are much easier to explain to non-experts than a conglomerate of studies thatare not directly related. We would highly appreciate it if such competitions could beestablished at future User Modeling Conferences.
124

Appendix
125

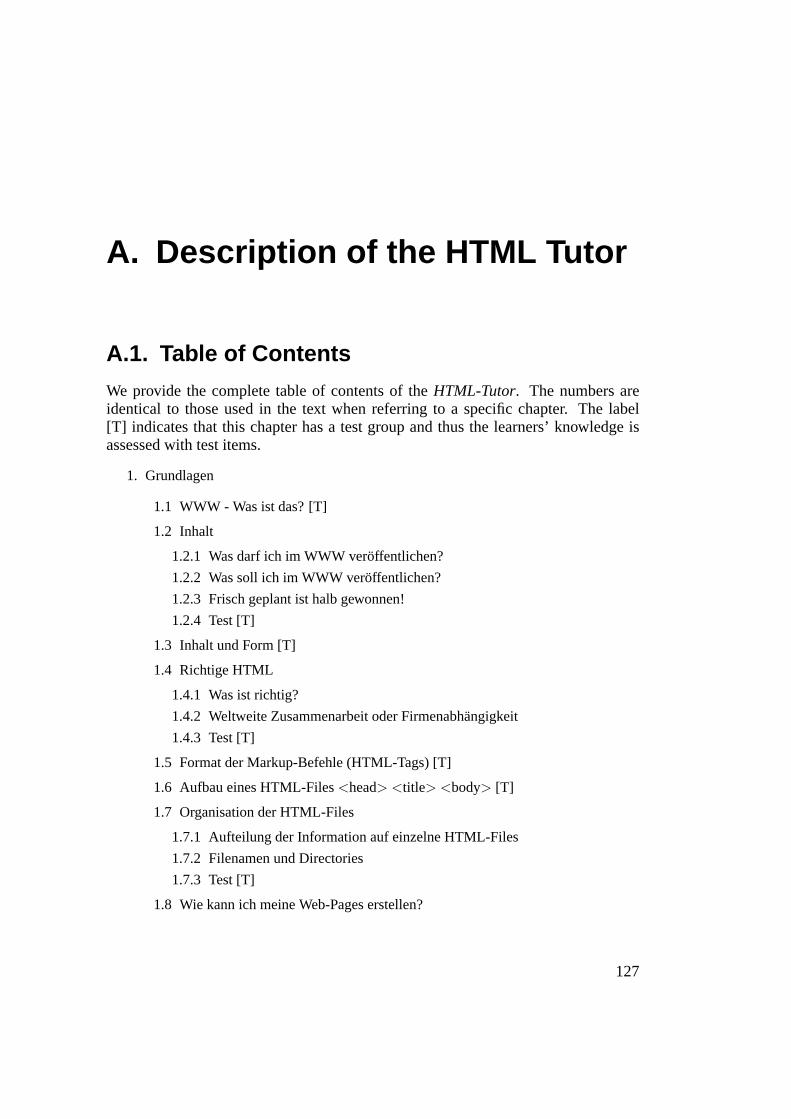
A. Description of the HTML Tutor
A.1. Table of Contents
We provide the complete table of contents of theHTML-Tutor. The numbers areidentical to those used in the text when referring to a specific chapter. The label[T] indicates that this chapter has a test group and thus the learners’ knowledge isassessed with test items.
1. Grundlagen
1.1 WWW - Was ist das? [T]
1.2 Inhalt
1.2.1 Was darf ich im WWW veröffentlichen?
1.2.2 Was soll ich im WWW veröffentlichen?
1.2.3 Frisch geplant ist halb gewonnen!
1.2.4 Test [T]
1.3 Inhalt und Form [T]
1.4 Richtige HTML
1.4.1 Was ist richtig?
1.4.2 Weltweite Zusammenarbeit oder Firmenabhängigkeit
1.4.3 Test [T]
1.5 Format der Markup-Befehle (HTML-Tags) [T]
1.6 Aufbau eines HTML-Files<head> <title> <body> [T]
1.7 Organisation der HTML-Files
1.7.1 Aufteilung der Information auf einzelne HTML-Files
1.7.2 Filenamen und Directories
1.7.3 Test [T]
1.8 Wie kann ich meine Web-Pages erstellen?
127

A. Description of the HTML Tutor
1.8.1 Statisch oder dynamisch
1.8.2 Methoden und Software für HTML-Files
1.8.3 Integrierte Systeme und Umwandlungsprogramme
1.8.4 Verwendung von MS-Word
1.8.5 Direktes Editieren, Muster-Files und Nachbearbeitung
1.8.6 HTML-Editoren
1.8.7 Test [T]
1.9 Wie kann ich meine HTML-Files im WWW veröffentlichen?
1.9.1 Erstellen der HTML-Files
1.9.2 Testen und Validieren
1.9.3 Abspeichern der HTML-Files
1.9.4 Bekanntmachen der HTML-Files
1.9.5 Aktualisieren der Informationen
1.9.6 Löschen von HTML-Files
1.9.7 Test [T]
2. Textelemente
2.1 Aufbau des HTML-Files<head> <title> <body> [T]
2.2 Absätze<p> und Zeilenumbruch [T]
2.3 Zeilenwechsel<br> [T]
2.4 Seitenwechsel [T]
2.5 Buchstaben und Sonderzeichen [T]
2.6 hervorgehobene Wörter<em> <strong> [T]
2.7 hervorgehobene Absätze<blockquote> [T]
2.8 Überschriften<h1> <h2> <h3> [T]
2.9 Listen und Aufzählungen [T]
2.9.1 nicht numerierte Listen<ul>
2.9.2 numerierte Listen<ol>
2.9.3 Beschreibungen<dl>
2.9.4 Test [T]
2.10 formatierte Texteingabe<pre> [T]
2.11 Tabellen<table> [T]
2.12 Mathematik und Chemie<sub> <sup> [T]
128

A.1. Table of Contents
3. Hypertext-Links
3.1 Verweise zu anderen Informationen<a href> [T]
3.2 URL (Uniform Resource Locator)
3.2.1 absolute URLs im WWW
3.2.2 relative URLs im WWW
3.2.3 URLs für andere Internet-Services
3.2.4 Test [T]
3.3 Listen von Verweisen
3.4 Markierungen innerhalb eines HTML-Files<a name> [T]
3.5 Inhaltsverzeichnisse [T]
4. Bilder und Töne
4.1 Bilder - ja oder nein? [T]
4.2 die Wirkung auf die Menschen [T]
4.3 Inline-Bilder<img> <object> [T]
4.4 Inline-Objekte<object> [T]
4.5 externe Bilder, Töne, Filme [T]
4.6 kleine und große Bilder (thumbnails) [T]
5. Layout und Spezialeffekte
5.1 Schönes Layout mit HTML - wie geht das?
5.1.1 Logisches Markup und Layout-Hinweise
5.1.2 Wenn die Glocken locken...
5.1.3 Norm oder nicht Norm, das ist hier die Frage
5.1.4 Test [T]
5.2 Klassen (class) und Style-Sheets<style> [T]
5.3 Spezialeffekte
5.3.1 Schrift
5.3.1.1 Schriftarten
5.3.1.2 Schriftgrößen
5.3.1.3 Test [T]
5.3.2 Farben
5.3.2.1 Wie werden Farben sichtbar?
129

A. Description of the HTML Tutor
5.3.2.2 Farben mit<em> <strong> class<style>
5.3.2.3 Farben mit<body> <em> <strong> <font>
5.3.2.4 Test [T]
5.3.3 Anordnung (align)
5.3.3.1 linksbündig, rechtsbündig, zentriert
5.3.3.2 Chaos oder Harmonie
5.3.3.3 unten, oben, neben Bildern
5.3.3.4 Test [T]
5.3.4 Abstände
5.3.4.1 horizontale Abstände
5.3.4.2 Einrückungen
5.3.4.3 vertikale Abstände
5.3.4.4 Test [T]
5.3.5 Trennlinien<hr> [T]
5.3.6 Numerierungen<ol> [T]
5.3.7 Frames<frameset> <frame> <noframes> [T]
5.3.8 Navigationshilfen<link> [T]
5.3.9 Schlagwörter für Suchhilfen<meta> [T]
5.4 Interaktion mit dem Benutzer - mehr Leben ins World Wide Web
5.4.1 CGI-Programme am Server
5.4.2 Aktionen am Server (CGI, SSI, ASP)
5.4.3 Zugriffe zählen
5.4.4 Formulare<form>
5.4.5 Image-Maps<map> usemap
5.4.6 Aktionen am Client (Java, JavaScript, Active-X, DHTML)
5.4.7 Java-Applets<applet> <param> <object>
5.4.8 JavaScript<script> <noscript>
5.4.9 Paßwort-Schutz und Sicherheit (SSL, https)
5.4.10 Dynamische Web-Pages und Datenbanken
5.4.11 Electronic Mail (mailto)
5.4.12 Test [T]
6. Geschichte und Geschichten
6.1 Vom Elektronengehirn zum World Wide Web
• Ein Auto im Dschungel?
130

A.1. Table of Contents
6.2 Von der Textverarbeitung zur Hypertext Markup Language
6.3 Test [T]
7. Entwicklungen für die Zukunft
7.1 XML - die einfachere SGML
7.2 XHTML - die neue HTML
7.3 MathML für Mathematik
7.4 CML für Chemie
7.5 WAP und WML für Handys
7.6 Test [T]
8. Referenzen
9. Abschlußübung
9.1 Teil 1 [T]
9.2 Teil 2 [T]
10. Abschlußtest [T]
• Anhang
– Copyright
– Kurs drucken
– Liste der HTML-Befehle
– Wanted: neue Testfragen
• Feedback
131

A. Description of the HTML Tutor
A.2. Structure of Prerequisite RelationsStructure of prerequisite relations in theHTML-Tutor. Each row and each column shows oneof the 138 chapters (main chapters 1 to 10; subchapters are not labeled). A dot () indicatesthat this chapter (vertical) is prerequisite of another chapter (horizontal). Certainly, the tablecannot list all chapter names, thus a list of the complete names is presented in Appendix A.1
. . . is prerequisite of chapter1 2 3 4 5 6 7 89 10
chapter . . .
1
2
3
4
5
6
7
8910
132
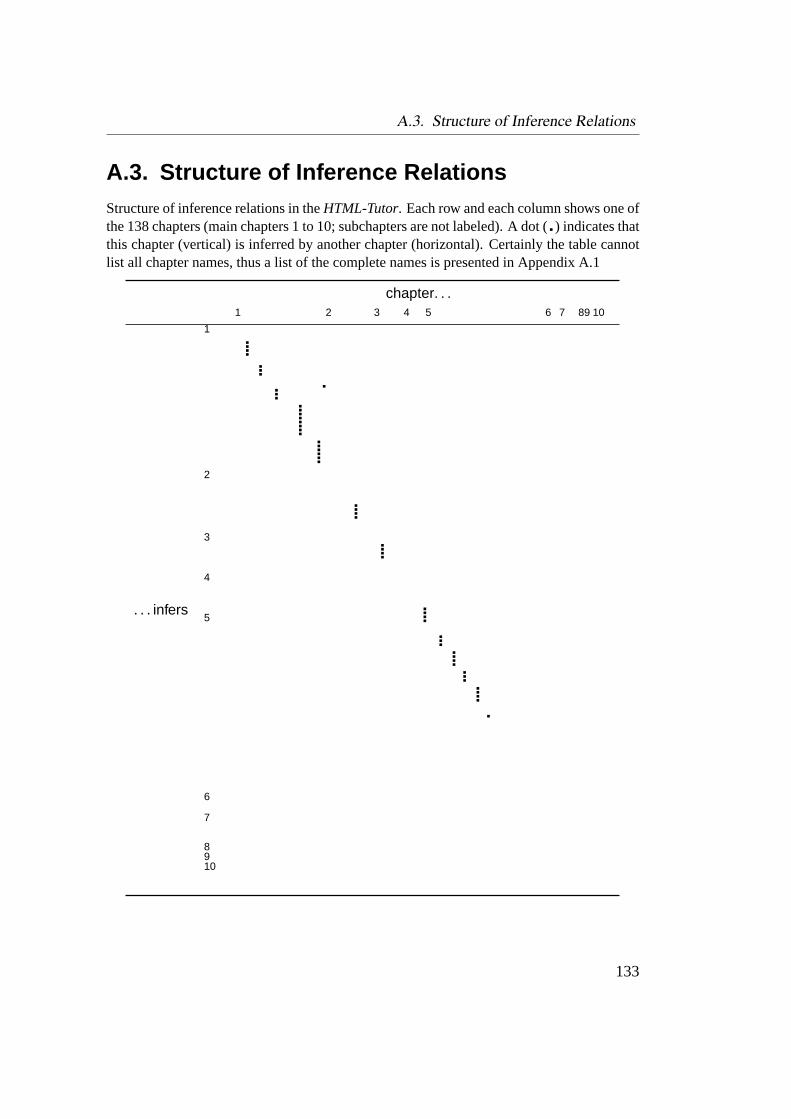
A.3. Structure of Inference Relations
A.3. Structure of Inference RelationsStructure of inference relations in theHTML-Tutor. Each row and each column shows one ofthe 138 chapters (main chapters 1 to 10; subchapters are not labeled). A dot () indicates thatthis chapter (vertical) is inferred by another chapter (horizontal). Certainly the table cannotlist all chapter names, thus a list of the complete names is presented in Appendix A.1
chapter. . .1 2 3 4 5 6 7 89 10
. . . infers
1
2
3
4
5
6
7
8910
133

A. Description of the HTML Tutor
134

B. Post-Test
Chapter 5.4.1 contains a study on the assessment of the learners’ knowledge with an externaltest. Below we give a translation of this test. Afterwards, the original version is display onpages 136 to 138.
Final Test1. Please, create an HTML file calledabschluss1.html. When looking at this file with a
WWW browser, this page should look similar toFigure 1.
• The horizontal line takes one half of the page width.
• Style-sheets are not required. It will be sufficient to use simple HTML tags.
• Section ‘Kapitel 3’ is a little bit tricky. Only those who like riddles should tryto solve it.
2. Create a second HTML file calledabschluss2.html, please. When looking at this filewith a WWW browser, this second page should look similar toFigure 2.
• The link ‘Tabellen’ points to the table (‘Kapitel 2’) inabschluss1.html.
• Include the picturelogo.gif in your file. You will find this image in the directorypublic_html/schluss/imgon your network drive.
• Clicking on the image will direct the user to the Homepage of the University ofEducation Freiburg.
3. Transfer the filesabschluss1.htmland abschluss2.htmlto the directory pub-lic_html/schlusson your network drive.
4. Please explain, why HTML is not appropriate for enforcing a specific layout.
5. Listing 1shows the source code of a HTML file. Please, identify all mistakes. Indicatethe line number and the correct syntax (or what was probably meant).
Example:line 27: <p>this is correct</p>
135

B. Post-Test
136

137
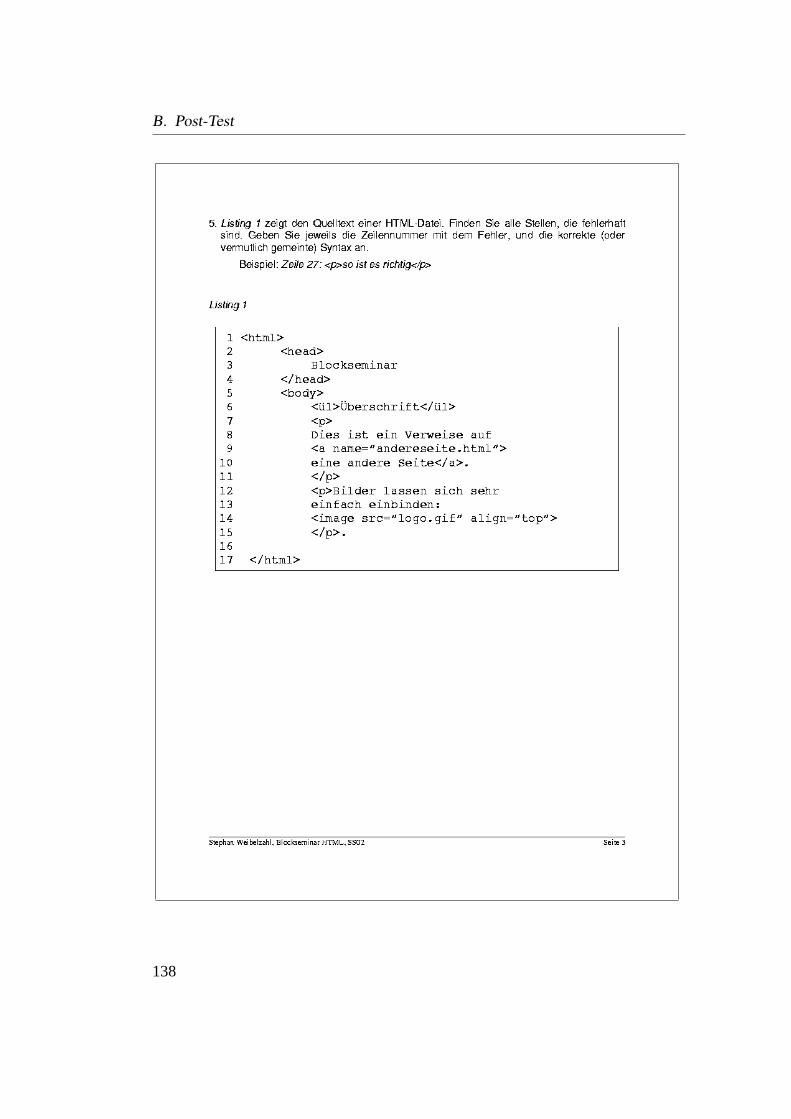
B. Post-Test
138
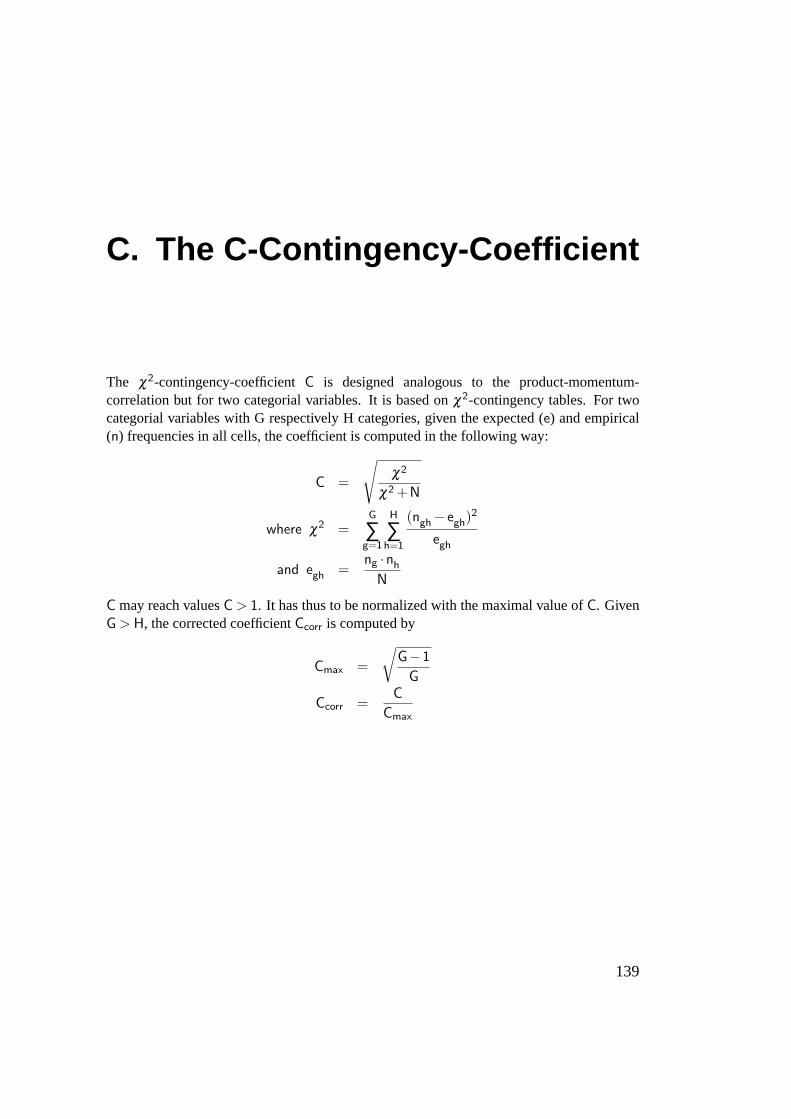
C. The C-Contingency-Coefficient
The χ2-contingency-coefficientC is designed analogous to the product-momentum-correlation but for two categorial variables. It is based onχ2-contingency tables. For twocategorial variables with G respectively H categories, given the expected (e) and empirical(n) frequencies in all cells, the coefficient is computed in the following way:
C =
√χ2
χ2 +N
where χ2 =
G
∑g=1
H
∑h=1
(ngh− egh)2
egh
and egh =ng ·nh
N
C may reach valuesC > 1. It has thus to be normalized with the maximal value ofC. GivenG > H, the corrected coefficientCcorr is computed by
Cmax =
√G−1
G
Ccorr =C
Cmax
139

C. The C-Contingency-Coefficient
140

Bibliography
Ambrosini, L., Cirillo, V., and Micarelli, A. (1997). A hybrid architecture for user-adaptedinformation filtering on the World Wide Web. In Jameson, A., Paris, C., and Tasso, C.(Eds.),User Modeling: Proceedings of the Sixth International Conference, UM97, pages59–61. Vienna, New York: Springer. Available from http://um.org.
Ardissono, L. and Goy, A. (1999). Tailoring the interaction with users in electronic shops.In Kay, J. (Ed.),User Modeling: Proceedings of the Seventh International Conference,UM99, pages 35–44. Vienna, New York: Springer.
Arend, U. (1991). Analysing complex tasks with an extended GOMS* model. In Tauber,M. J. and Ackermann, D. (Eds.),Mental Models and Human Computer Interaction, vol-ume 2, pages 115–133. North-Holland: Elsevier.
Bares, W. H. and Lester, J. C. (1997). Cinematographic user models for automated realtimecamera control in dynamic 3D environments. In Jameson, A., Paris, C., and Tasso, C.(Eds.),User Modeling: Proceedings of the Sixth International Conference, UM97, pages215–226. Vienna, New York: Springer. Available from http://um.org.
Beck, J., Stern, M., and Woolf, B. P. (1997). Using the student model to control problemdifficulty. In Jameson, A., Paris, C., and Tasso, C. (Eds.),User Modeling: Proceedings ofthe Sixth International Conference, UM97, pages 277–288. Vienna, New York: Springer.Available from http://um.org.
Benyon, D. R. (1993). Adaptive systems; a solution to usability problems.User Modellingand User Adapted Interaction, 3(1), 65–87.
Benyon, D. R. and Murray, D. M. (1993). Adaptive systems; from intelligent tutoring toautonomous agents.Knowledge-Based Systems, 6(4), 197–219.
Berthold, A. and Jameson, A. (1999). Interpreting symptoms of cognitive load in speechinput. In Kay, J. (Ed.),User Modeling: Proceedings of the Seventh International Confer-ence, UM99, pages 235–244. Vienna, New York: Springer.
141
Bibliography
Billsus, D. and Pazzani, M. J. (1999). A hybrid user model for news story classification.In Kay, J. (Ed.),User Modeling: Proceedings of the Seventh International Conference,UM99, pages 98–108. Vienna, New York: Springer.
Bohnenberger, T., Jameson, A., Krüger, A., and Butz, A. (2002). User acceptance of adecision-theoretic, location-aware shopping guide. In Gil, Y. and Leake, D. B. (Eds.),IUI 2002: International Conference on Intelligent User Interfaces, pages 178–179. NewYork: ACM.
Borgman, C. (1999). The user’s mental model of an information retrieval system: an exper-iment on a prototype online catalog.International Journal of Human-Computer Studies,51(2), 435–452.
Botafogo, R. A., Rivlin, E., and Shneiderman, B. (1992). Structural analysis of hypertexts:Identifying hierarchies and useful metrics.ACM Transactions on Information Systems,10(2), 142–180.
Bovair, S., Kieras, D. E., and Polson, P. G. (1990). The acquisition and performance of text-editing skill: A cognitive complexity analysis.Human Computer Interaction, 5, 1–48.
Broadbent, D. E., Fitzgerald, P., and Broadbent, M. H. P. (1986). Implicit and explicitknowledge in the control of complex systems.British Journal of Psychology, 77, 33–50.
Brusilovsky, P. (1996). Methods and techniques of adaptive hypermedia.User Modelingand User-Adapted Interaction, 6(2–3), 87–129.
Brusilovsky, P. (2001). Adaptive hypermedia.User Modeling and User-Adapted Interaction,11(1-2), 87–110.
Brusilovsky, P. and de Bra, P. (Eds.). (1999).Proceedings of the Second Workshopon Adaptive Systems and User Modeling on the World Wide Web. available athttp://wwwis.win.tue.nl/asum99/contents.html.
Brusilovsky, P. and Eklund, J. (1998). A study of user-model based link annotation in educa-tional hypermedia.Journal of Universal Computer Science, special issue on assessmentissues for educational software, 4(4), 429–448.
Brusilovsky, P., Eklund, J., and Schwarz, E. (1998). Web-based education for all: A tool fordeveloping adaptive courseware. InComputer Networks and ISDN Systems. Proceedingsof the Seventh International World Wide Web Conference, 14-18 April 1998, volume 30,pages 291–300.
Brusilovsky, P., Karagiannidis, C., and Sampson, D. G. (2001). The benefits of layeredevaluation of adaptive applications and services. In Weibelzahl, S., Chin, D. N., and
142
Bibliography
Weber, G. (Eds.),Empirical Evaluation of Adaptive Systems. Proceedings of workshop atthe Eighth International Conference on User Modeling, UM2001, pages 1–8, Freiburg.
Buckley, F. and Harary, F. (1990).Distance in graphs. Redwood City: Addison-Wesley.
Bueno, D. and David, A. A. (2001). METIORE: A personalized information retrieval system.In Bauer, M., Vassileva, J., and Gmytrasiewicz, P. (Eds.),User Modeling: Proceedings ofthe Eighth International Conference, UM2001, pages 168–177. Berlin: Springer.
Bull, S., Greer, J. E., McCalla, G. I., Kettel, L., and Bowes, J. (2001). User modelling inI-help: What, why, when and how. In Bauer, M., Vassileva, J., and Gmytrasiewicz, P.(Eds.),User Modeling: Proceedings of the Eighth International Conference, UM2001,pages 117–126. Berlin: Springer.
Bull, S. and Pain, H. (1995). “Did I say what I think I said, and do you agree with me?” In-specting and questioning the student model. In Greer, J. E. (Ed.),Artificial Intelligence inEducation, Proceedings of AI-ED’95, Seventh World Conference on Artificial Intelligencein Education, 16-19 August 1995. Washington, DC, AACE, pages 501–508.
Carro, R. M., Pulido, E., and Rodríguez, P. (2001). TANGOW: a model for internet basedlearning. International Journal of Continuing Engineering Education and Life-LongLearning, 11(1-2).
Chin, D. N. (1989). KNOME: Modeling what the user knows in UC. In Kobsa, A. andWahlster, W. (Eds.),User Models in Dialog Systems, pages 74–107. Berlin: Springer.
Chin, D. N. (2001). Empirical evaluation of user models and user-adapted systems.UserModeling and User-Adapted Interaction, 11(1-2), 181–194.
Chin, D. N. and Porage, A. (2001). Acquiring user preferences for product customization.In Bauer, M., Vassileva, J., and Gmytrasiewicz, P. (Eds.),User Modeling: Proceedings ofthe Eighth International Conference, UM2001, pages 95–104. Berlin: Springer.
Chin, J. P., Diehl, V. A., and Norman, K. L. (1988). Development of an instrument measur-ing user satisfaction of the human-computer interface. InProceedings of ACM CHI’88Conference on Human Factors in Computing, pages 213–218.
Chiu, B. C., Webb, G. I., and Kuzmycz, M. (1997). A comparison of first-order and zeroth-order induction for Input-Output Agent Modelling. In Jameson, A., Paris, C., and Tasso,C. (Eds.),User Modeling: Proceedings of the Sixth International Conference, UM97,pages 347–358. Vienna, New York: Springer. Available from http://um.org.
Chu-Carroll, J. and Brown, M. K. (1998). An evidential model for tracking initiative incollaborative dialogue interactions.User Modeling and User-Adapted Interaction, 8(3-4), 215–253.
143

Bibliography
Cini, A. and de Lima, J. V. (2002). Adaptivity conditions evaluation for the user of hy-permedia presentations built with AHA! In de Bra, P., Brusilovsky, P., and Conejo, R.(Eds.),Proceedings of the Second International Conference on Adaptive Hypermedia andAdaptive Web Based Systems, Málaga, Spain, AH2002, pages 497–500. Berlin: Springer.
Cohen, W. W. (1996). Learning to classify English text with ILP methods. In Raedt, L. D.(Ed.),Advances in Inductive Logic Programming, pages 124–143. IOS Press.
Corbett, A. T. (2001). Cognitive computer tutors: Solving the two-sigma problem. In Bauer,M., Vassileva, J., and Gmytrasiewicz, P. (Eds.),User Modeling: Proceedings of the EighthInternational Conference, UM2001, pages 137–147, Berlin. Springer.
Corbett, A. T. and Anderson, J. R. (1992). The LISP intelligent tutoring system: Researchin skill acquisition. In Larkin, J., Chabay, R., and Scheftic, C. (Eds.),Computer AssistedInstruction and Intelligent Tutoring Systems: Establishing Communication and Collabo-ration, pages 73–110. Hillsdale: Erlbaum.
Corbett, A. T. and Bhatnagar, A. (1997). Student modeling in the ACT programming tutor:Adjusting a procedural learning model with declarative knowledge. In Jameson, A., Paris,C., and Tasso, C. (Eds.),User Modeling: Proceedings of the Sixth International Confer-ence, UM97, pages 243–254. Vienna, New York: Springer. Available from http://um.org.
Cronbach, L. J. (1967). How can instruction be adapted to individual differences. In Gagné,R. M. (Ed.),Learning and individual differences. Ohio: Columbus.
Crosby, M. E., Iding, M. K., and Chin, D. N. (2001). Visual search and background com-plexity: Does the forest hide the trees? In Bauer, M., Vassileva, J., and Gmytrasiewicz,P. (Eds.),User Modeling: Proceedings of the Eighth International Conference, UM2001,pages 225–227. Berlin: Springer.
Curtis, B., Sheppard, S. B., Milliman, P., Borst, M. A., and Love, T. (1979). Measuring thePsychological Complexity of Software Maintenance Tasks with the Halstead and McCabemetrics.IEEE Transactions on Software Engineering, 5(2), 96–104.
de Bra, P. and Calvi, L. (1998). AHA! An open adaptive hypermedia architecture.The NewReview of Hypermedia and Multimedia, 4, 115–139.
de Bra, P., Houben, G.-J., and Wu, H. (1999). AHAM: A Dexter-based reference model foradaptive hypermedia. In Tochtermann, K., Westbomke, J., Wiil, U. K., and Leggett, J.(Eds.),Proceedings of the ACM Conference on Hypertext and Hypermedia, pages 147–156, Darmstadt.
de Haan, G., van der Veer, G. C., and van Vliet, J. C. (1991). Formal modelling techniquesin human-computer interaction.Acta Psychologica, 78(1-3), 26–76.
144

Bibliography
Dix, A. J., Finlay, J. E., Abowd, G. D., and Beale, R. (1998).Human-Computer Interaction.Harlow, England: Prentice Hall.
Draier, T. and Gallinari, P. (2001). Characterizing sequences of user actions for access loganalysis. In Bauer, M., Vassileva, J., and Gmytrasiewicz, P. (Eds.),User Modeling:Proceedings of the Eighth International Conference, UM2001, pages 228–230. Berlin:Springer.
Draper, S. W., Brown, M. I., Henderson, F. P., and McAteer, E. (1996). Integrative evalua-tion: an emerging role for classroom studies of CAL.Computers and Education, 26(1-3),17–32.
Edmonds, E. A. (1987). Adapation, response and knowledge.Knowledge-Based Systems,1(1). Editorial.
Eklund, J. (1999).A Study of Adaptive Link Annotation in Educational Hypermedia. PhDthesis, University of Sydney.
Eklund, J. and Brusilovsky, P. (1998). The value of adaptivity in hypermedia learning envi-ronments: A short review of empirical evidence. In Brusilovsky, P. and de Bra, P. (Eds.),Proceedings of Second Adaptive Hypertext and Hypermedia Workshop at the Ninth ACMInternational Hypertext Conference Hypertext’98, Pittsburgh, PA, June 20, 1998, Com-puting Science Reports, Report No. 98/12, pages 13–19. Eindhoven: Eindhoven Univer-sity of Technology.
Encarnação, L. M. and Stoev, S. L. (1999). Application-independent intelligent user supportsystem exploiting action-sequence based user modeling. In Kay, J. (Ed.),User Modeling:Proceedings of the Seventh International Conference, UM99, pages 245–254. Vienna,New York: Springer.
Fischer, G. and Ye, Y. (2001). Personalizing delivered information in a software reuse en-vironment. In Bauer, M., Vassileva, J., and Gmytrasiewicz, P. (Eds.),User Modeling:Proceedings of the Eighth International Conference, UM2001, pages 178–187. Berlin:Springer.
Goren-Bar, D., Kuflik, T., Lev, D., and Shova, P. (2001). Automating personal categorizationusing artificial neural networks. In Bauer, M., Vassileva, J., and Gmytrasiewicz, P. (Eds.),User Modeling: Proceedings of the Eighth International Conference, UM2001, pages188–198. Berlin: Springer.
Grant, S. and Mayes, T. (1991). Cognitive Task Analysis? In Weir, G. R. S. and Alty, J. L.(Eds.),Human-Computer Interaction and Complex Systems, pages 147–167. San Diego:Academic Press.
145

Bibliography
Green, N. and Carberry, S. (1999). A computational mechanism for initiative in answergeneration.User Modeling and User-Adapted Interaction, 9(1-2), 93–132.
Greer, J. E., McCalla, G. I., Collins, J., Kumar, V. S., Meagher, P., and Vassileva, J. (1998).Supporting peer help and collaboration in distributed workplace environments.Interna-tional Journal of Artificial Intelligence in Education, 9, 159–177.
Guzmán, E. and Conejo, R. (2002). Simultaneous evaluation of multiple topics in SIETTE.In Cerri, S. A., Gouardères, G., and Paraguaçu, F. (Eds.),Proceedings of the Sixth Inter-national Conference on Intelligent Tutoring Systems, ITS 2002, volume 2363 ofLNCS,pages 739–748. Berlin: Springer.
Henze, N. and Nejdl, W. (1999). Adaptivity in the KBS Hyperbook System. In2nd Work-shop on User Modeling and Adaptive Systems on the WWW, May 11th, Toronto, Canada.Held in conjunction with the World Wide Web Conference (WWW 8), and the SeventhInternational Conference on User Modeling (UM 99).
Henze, N., Nejdl, W., and Wolpers, M. (1999). Modeling constructivist teaching functional-ity and structure in the KBS hyperbook system. InProceedings of the Computer SupportedCollaborative Learning Conference (CSCL’99), Stanford.
Herder, E. (2002). Structure-based adaptation to the mobile context. In Henze, N., Kókai,G., Schröder, O., and Zeidler, J. (Eds.),Personalization for the Mobile World. Proceedingsof the German Workshop on Adaptivity and User Modeling in interactive Systems, ABIS2002, pages 22–26, Hannover.
Höök, K. (2000). Steps to take before intelligent user interfaces become real.InteractingWith Computers, 12(4), 409–426.
Horvitz, E., Breese, J., Heckerman, D., Hovel, D., and Rommelse, K. (1998). The Lumièreproject: Bayesian user modeling for inferring the goals and needs of software users. InProceedings of the Fourteenth Conference on Uncertainty in Artificial Intelligence, Madi-son, WI, pages 256–265. San Francisco: Morgan Kaufmann.
Horvitz, E. and Paek, T. (2001). Harnessing models of user’s goals to mediate clarificationdialog in spoken language systems. In Bauer, M., Vassileva, J., and Gmytrasiewicz, P.(Eds.),User Modeling: Proceedings of the Eighth International Conference, UM2001.Berlin: Springer.
Howard, S. and Murray, M. D. (1987). A taxonomy of evaluation techniques for HCI. InBullinger, H.-J. and Shackel, B. (Eds.),Human-Computer Interaction Interact’87, pages453–459.
146
Bibliography
Hübscher, R. and Puntambekar, S. (2002). Adaptive navigation for learners in hypermedia isscaffolded navigation. In de Bra, P., Brusilovsky, P., and Conejo, R. (Eds.),Proceedings ofthe Second International Conference on Adaptive Hypermedia and Adaptive Web BasedSystems, Málaga, Spain, AH2002, pages 184–192. Berlin: Springer.
International Standards Organisation (1998).ISO 9241. Ergonomic requirements for officework with visual display terminals (VDTs) – Part 11: Guidance on usability(1 ed.).
Jameson, A. (1996). Numerical uncertainty management in user and student modeling: Anoverview of systems and issues.User Modeling and User-Adapted Interaction, 5, 193–251.
Jameson, A. (1999). User-adaptive systems: An integrative overview. Tutorial presented atthe Seventh International Conference on User Modeling, Banff, Canada, June 20th 1999.
Jameson, A. (2001).Systems That Adapt to Their Users: An Integrative Perspective. Saar-brücken: Saarland University.
Jameson, A., Paris, C., and Tasso, C. (Eds.). (1997).User Modeling: Proceedings of theSixth International Conference, UM97. Vienna, New York: Springer.
Jameson, A. and Schwarzkopf, E. (2002). Pros and cons of controllability: An empiricalstudy. InProceedings of the Second International Conference on Adaptive Hyperme-dia and Adaptive Web Based Systems, Málaga, Spain, AH2002, pages 193–202. Berlin:Springer.
Jörding, T. (1999). Temporary user modeling for adaptive product presentation in the web.In Kay, J. (Ed.),User Modeling: Proceedings of the Seventh International Conference,UM99, pages 333–334. Vienna, New York: Springer.
Juvina, I., Trausan-Matu, S., Iosif, G., van der Veer, G. C., Marhan, A.-M., and Chisalita, C.(2002). Analysis of web browsing behavior - a great potential for psychological research.In Pribeanu, C. and Vanderdonckt, J. (Eds.),Task Models and Diagrams for User InterfaceDesign: Proceedings of the First International Workshop on Task Models and Diagramsfor User Interface Design - TAMODIA 2002, 18-19 July 2002, Bucharest, Romania, pages170–178. INFOREC Publishing House Bucharest.
Karagiannidis, C. and Sampson, D. G. (2000). Layered evaluation of adaptive applicationsand services. In Brusilovsky, P. and Stock, C. S. O. (Eds.),Proceedings of InternationalConference on Adaptive Hypermedia and Adaptive Web-Based Systems, AH2000, Trento,Italy, pages 343–346. Berlin: Springer.
Kay, J. (1995). The UM toolkit for cooperative user models.User Models and User AdaptedInteraction, 4(3), 149–196.
147

Bibliography
Kay, J. (Ed.). (1999).User Modeling: Proceedings of the Seventh International Conference,UM99. Vienna, New York: Springer.
Kieras, D. E. and Polson, P. G. (1999). An approach to the formal analysis of user complexity.International Journal of Human-Computer Studies, 51(2), 405–434.
Kim, S., Hall, W., and Keane, A. (2001). Using document structure for personal ontolo-gies and user modeling. In Bauer, M., Vassileva, J., and Gmytrasiewicz, P. (Eds.),UserModeling: Proceedings of the Eighth International Conference, UM2001, pages 240–242.Berlin: Springer.
Klein, B. (2000).Didaktisches Design hypermedialer Lernumgebungen: Die adaptive Lern-umgebung "incops" zur Einführung in die Kognitionspsychologie. Marburg: Tectum.
Koch, N. and Wirsing, M. (2002). The Munich Reference Model for adaptive hypermediaapplications. In de Bra, P., Brusilovsky, P., and Conejo, R. (Eds.),Proceedings of the Sec-ond International Conference on Adaptive Hypermedia and Adaptive Web Based Systems,Málaga, Spain, AH2002, pages 213–222. Berlin: Springer.
Krogsæter, M., Oppermann, R., and Thomas, C. G. (1994). A user interface integratingadaptability and adaptivity. In Oppermann, R. (Ed.),Adaptive User Support, pages 97–125. Hillsdale: Lawrence Erlbaum.
Lesh, N., Rich, C., and Sidner, C. L. (1999). Using plan recognition in human-computercollaboration. In Kay, J. (Ed.),User Modeling: Proceedings of the Seventh InternationalConference, UM99, pages 23–32. Vienna, New York: Springer.
Linden, G., Hanks, S., and Lesh, N. (1997). Interactive assessment of user preference mod-els: The Automated Travel Assistant. In Jameson, A., Paris, C., and Tasso, C. (Eds.),User Modeling: Proceedings of the Sixth International Conference, UM97, pages 67–78.Vienna, New York: Springer. Available from http://um.org.
Lippitsch, S., Weibelzahl, S., and Weber, G. (2002). Improving structural salience by contentadaptation with summaries. In Henze, N., Kókai, G., Schröder, O., and Zeidler, J. (Eds.),Personalization for the Mobile World. Proceedings of the German Workshop on Adaptivityand User Modeling in Interactive Systems, ABIS02, pages 35–38, Hannover.
Lippitsch, S., Weibelzahl, S., and Weber, G. (2003). Adaptive learning courses in peda-gogical psychology. The PSI project and the authoring system NetCoach.KünstlicheIntelligenz, 3/03.
Litman, D. and Pan, S. (1999). Empirically evaluating an adaptable spoken dialogue system.In Kay, J. (Ed.),User Modeling: Proceedings of the Seventh International Conference,UM99, pages 54–64. Vienna, New York: Springer.
148

Bibliography
Luckin, R. and du Boulay, B. (1999). Capability, potential and collaborative assistance.In Kay, J. (Ed.),User Modeling: Proceedings of the Seventh International Conference,UM99, pages 139–148. Vienna, New York: Springer.
Magnini, B. and Strapparava, C. (2001). Improving user modeling with content-based tech-niques. In Bauer, M., Vassileva, J., and Gmytrasiewicz, P. (Eds.),User Modeling: Pro-ceedings of the Eighth International Conference, UM2001, pages 74–83. Berlin: Springer.
Marinilli, M., Micarelli, A., and Sciarrone, F. (1999). A case-based approach to adaptiveinformation filtering for the WWW. In Brusilovsky, P. and De Bra, P. (Eds.),Proceedingsof the Second Workshop on Adaptive Systems and User Modeling on the World Wide Web,pages 81–87. available at http://wwwis.win.tue.nl/asum99/.
Mark, M. A. and Greer, J. E. (1993). Evaluation methodologies for intelligent tutoringsystems.Journal of Artificial Intelligence and Education, 4(2/3), 129–153.
McCabe, T. (1976). A complexity measure. InIEEE Transactions on Software Engineering,SE-2, pages 308–320.
McDonald, S. and Stevenson, R. J. (1998). Effects of text structure and prior knowledge ofthe learner on navigation in hypertext.Human Factors, 40(1), 18–27.
McGrath, J. E. (1995). Methodology matters: Doing research in the behavioral and socialsciences. In Baecker, R. M., Grudin, J., Buxton, W. A. S., and Greenberg, S. (Eds.),Readings in Human-Computer Interaction(2 ed.)., pages 152–169. San Francisco, CA:Morgan Kaufmann.
Mitrovic, A. (2001). Investigating students’ self-assessment skills. In Bauer, M., Vassileva,J., and Gmytrasiewicz, P. (Eds.),User Modeling: Proceedings of the Eighth InternationalConference, UM2001, pages 247–250. Berlin: Springer.
Müller, C., Großmann-Hutter, B., Jameson, A., Rummer, R., and Wittig, F. (2001). Recog-nizing time pressure and cognitive load on the basis of speech: An experimental study.In Bauer, M., Vassileva, J., and Gmytrasiewicz, P. (Eds.),User Modeling: Proceedings ofthe Eighth International Conference, UM2001, pages 24–33. Berlin: Springer. Availablefrom http://dfki.de/∼jameson/abs/MuellerGJ+01.html.
Murray, T. (2000). Evaluating the need for intelligence in an adaptive hypermedia system. InGauthier, G., Frasson, C., and VanLehn, K. (Eds.),Intelligent Tutoring Systems, Proceed-ings of the 5th International Conference, ITS 2000, Montreal, Canada, pages 373–382.Berlin: Springer.
Murray, T., Shen, T., Piemonte, J., Condit, C., and Thibedeau, J. (2000). Adaptivity in theMetaLinks hyper-book authoring framework. InWorkshop Proceedings of Adaptive andIntelligent Web-Based Education Systems workshop at ITS 2000.
149
Bibliography
Nielsen, J. (1989). The matters that really matter for hypertext usability. InProceedings ofthe ACM Hypertext’89 Conference, Pittsburgh, pages 239–248.
Nielsen, J. (1993).Usability Engineering. San Diego: Morgan Kaufmann.
Noh, S. and Gmytrasiewicz, P. J. (1997). Agent modeling in antiair defense: A case study.In Jameson, A., Paris, C., and Tasso, C. (Eds.),User Modeling: Proceedings of the SixthInternational Conference, UM97, pages 389–400. Vienna, New York: Springer. Availablefrom http://um.org.
Norman, D. A. (1983). Some observations on mental models. In Gentner, D. and Stevens,A. L. (Eds.),Mental Models, pages 7–14. Hillsdale: Lawrence Erlbaum.
Ohene-Djan, J. (2002). Ownership transfer via personalisation as a value-adding strategy forweb-based education. In Brusilovsky, P., Henze, N., and Millán, E. (Eds.),Proceedingsof the workshop on adaptive systems for web-based education, held at the Second Inter-national Conference on Adaptive Hypermedia and Adaptive Web Based Systems, Málaga,Spain, AH2002, pages 27–41. Universidad de Málaga.
Oppermann, R. (1994). Adaptively supported adaptability.International Journal of HumanComputer Studies, 40(3), 455–472.
Paramythis, A., Totter, A., and Stephanidis, C. (2001). A modular approach to the evaluationof adaptive user interfaces. In Weibelzahl, S., Chin, D. N., and Weber, G. (Eds.),EmpiricalEvaluation of Adaptive Systems. Proceedings of workshop at the Eighth InternationalConference on User Modeling, UM2001, pages 9–24, Freiburg.
Paris, C., Wan, S., Wilkinson, R., and Wu, M. (2001). Generating personal travel guides- and who wants them? In Bauer, M., Vassileva, J., and Gmytrasiewicz, P. (Eds.),UserModeling: Proceedings of the Eighth International Conference, UM2001, pages 151–153.Berlin: Springer.
Park, I. and Hannafin, M. J. (1993). Empirically-based guidelines for the design of interactivemultimedia.Educational Technology Research & Development, 41(3), 63–85.
Partl, H. (1999). HTML-Einführung, Hypertext Markup Language die Sprache des WorldWide Web. ZID BOKU Wien.
Pitkow, J. E. and Pirolli, P. L. T. (1999). Mining longest repeated subsequences to predictworld wide web surfing. InSecond USENIX Symposium on Internet Technologies andSystems, pages 139–150, Berkeley. USENIX Association.
150

Bibliography
Pohl, W. (1997). LaboUr—machine learning for user modeling. In Smith, M. J., Salvendy,G., and Koubek, R. J. (Eds.),Design of Computing systems: Social and Ergonomic Con-siderations. Proceedings of the Seventh International Conference on Human-ComputerInteraction, volume B, pages 27–30. Amsterdam: Elsevier.
Pohl, W. (1998). User-adapted interaction, user modeling, and machine learning. In Timm,U. J. and Rössel, M. (Eds.),Proceedings of the Sixth German Workshop on Adaptivity andUser Modeling in Interactive Systems, ABIS98, Erlangen.
Rasmussen, J. (1997). Merging paradigms: Decision making, management, and cognitivecontrol. In Flin, R., Salas, E., Strub, M. E., and Marting, L. (Eds.),Decision making understress: Emerging paradigms and applications, pages 67–85. Aldershot: Ashgate.
Rauterberg, M. (1992). A method of a quantitative measurement of cognitive complexity. Invan der Veer, G. C., Tauber, M., Bagnara, S., and Antalovits, M. (Eds.),Human-ComputerInteraction: Tasks and Organisation, pages 295–307. Rom: CUD.
Rauterberg, M. and Fjeld, M. (1998). Task analysis in human-computer interaction — sup-porting action regulation theory by simulation.Zeitschrift für Arbeitswissenschaft, 52(3),152–161.
Reisner, P. (1984). Formal grammar as a tool for analyzing ease of use. In Thomas, J. C. andSchneider, M. L. (Eds.),Human Factors in Computing Systems, pages 53–78. Norwood:Ablex.
Rich, E. A. (1983). Users are individuals: Individualizing user models.International Journalof Man-Machine Studies, 18, 199–214.
Rossi, P. H. and Freeman, H. E. (1993).Evaluation. Beverly Hills: Sage.
Runkel, P. J. and McGrath, J. E. (1972).Research on Human Behavior: A systematic guideto method. New York: Holt, Rinehart & Winston.
Sanrach, C. and Grandbastien, M. (2000). ECSAIWeb: A web-based authoring system tocreate adaptive learning systems. In Brusilovsky, P., Stock, O., and Strapparava, C. (Eds.),Adaptive Hypermedia and Adaptive Web-Based Systems. International Conference, AH2000, pages 214–226. Berlin: Springer.
Schoppek, W. (2002). Examples, rules, and strategies in the control of dynamic systems.Cognitive Science Quaterly, 2(1), 63–92.
Scriven, M. (1967). The methodology of evaluation. In Tyler, R. W., Gagné, R. M., andScriven, M. (Eds.),Perspectives of curriculum evaluation, American Educational Re-search Association Monograph Series on Evaluation, pages 39–83. Chicago: Rand Mc-Nally.
151
Bibliography
Segal, R. B. and Kephart, J. O. (1999). Mailcat: An intelligent assistant for organizing e-mail. In Proceedings of the Third International Conference on Autonomous Agents, pages276–282.
Semerano, G., Ferilli, S., Fanizzi, N., and Abbattista, F. (2001). Learning interaction modelsin a digital library service. In Bauer, M., Vassileva, J., and Gmytrasiewicz, P. (Eds.),UserModeling: Proceedings of the Eighth International Conference, UM2001, pages 44–53.Berlin: Springer.
Shin, E. C., Schallert, D. L., and Savenye, W. C. (1994). Effects of learner control, ad-visement, and prior knowledge on young students’ learning in a hypertext environment.Educational Technology Research & Development, 42(1), 33–46.
Sison, R. C., Numao, M., and Shimura, M. (1998). Discovering error classes from discrep-ancies in novice behaviors via multistrategy conceptual clustering.User Modeling andUser-Adapted Interaction, 8(1-2), 103–129.
Smyth, B. and Cotter, P. (2002). The plight of the navigator: solving the navigation problemfor wireless portals. In de Bra, P., Brusilovsky, P., and Conejo, R. (Eds.),Proceedings ofthe Second International Conference on Adaptive Hypermedia and Adaptive Web BasedSystems, Málaga, Spain, AH2002, pages 328–337. Berlin: Springer.
Specht, M. (1998). Empirical evaluation of adaptive annotation in hypermedia. In Ottmann,T. and Tomek, I. (Eds.),Proceedings of the 10th World Conference on EducationalTelecommunications, ED-MEDIA & ED-Telecom ’98, Freiburg, Germany, pages 1327–1332, Charlottesville, VA. AACE.
Specht, M. and Kobsa, A. (1999). Interaction of domain expertise and interface design inadaptive educational hypermedia. In Brusilovsky, P. and De Bra, P. (Eds.),Proceedings ofthe Second Workshop on Adaptive Systems and User Modeling on the World Wide Web,pages 89–93. available at http://wwwis.win.tue.nl/asum99/.
Spooner, R. I. W. and Edwards, A. D. N. (1997). User modelling for error recovery: Aspelling checker for dyslexic users. In Jameson, A., Paris, C., and Tasso, C. (Eds.),UserModeling: Proceedings of the Sixth International Conference, UM97, pages 147–157.Vienna, New York: Springer. Available from http://um.org.
Strachan, L., Anderson, J., Sneesby, M., and Evans, M. (1997). Pragmatic user modellingin a commercial software system. In Jameson, A., Paris, C., and Tasso, C. (Eds.),UserModeling: Proceedings of the Sixth International Conference, UM97, pages 189–200.Vienna, New York: Springer. Available from http://um.org.
Theo, G. (2001). Getting the right information to the right person. In Bauer, M., Vassileva,J., and Gmytrasiewicz, P. (Eds.),User Modeling: Proceedings of the Eighth InternationalConference, UM2001, pages 257–259. Berlin: Springer.
152

Bibliography
Thimbleby, A. (1990).User Interface Design. Workingham: Addison Wesley.
Totterdell, P. A. and Boyle, E. (1990). The evaluation of adaptive systems. In Browne, D.,Totterdell, P., and Norman, M. (Eds.),Adaptive User Interfaces, pages 161–194. London:Academic Press.
Totterdell, P. A. and Rautenbach, P. (1990). Adaptation as a problem of design. In Browne,D., Totterdell, P., and Norman, M. (Eds.),Adaptive User Interfaces, pages 61–84. London:Academic Press.
Trewin, S. and Pain, H. (1997). Dynamic modelling of keyboard skills: Supporting userswith motor disabilities. In Jameson, A., Paris, C., and Tasso, C. (Eds.),User Modeling:Proceedings of the Sixth International Conference, UM97, pages 135–146. Vienna, NewYork: Springer. Available from http://um.org.
Villamañe, M., Gutiérrez, J., Arruabarrena, R., Pérez, T. A., López-Cudrado, J., Sanz, S.,Sanz, S., and Vadillo, J. A. (2001). Use and evaluation of HEZINET; A system for basquelanguage learning. In Lee, C. H., Lajoie, S., Mizoguchi, R., Yoo, Y. D., and du Boulay,B. (Eds.),Proceedings of the Ninth International Conference on Computers in Educa-tion/ScoolNet, 2001 (ICCE-2001), Nov. 12-15, Seoul Korea., pages 93–101.
Virvou, M. and du Boulay, B. (1999). Human plausible reasoning for intelligent help.UserModeling and User-Adapted Interaction, 9(4), 323–377.
Vogt, C. C., Cottrell, G. W., Belew, R. K., and Bartell, B. T. (1999). User lenses – achieving100% precision on frequently asked questions. In Kay, J. (Ed.),User Modeling: Proceed-ings of the Seventh International Conference, UM99, pages 86–96. Vienna, New York:Springer.
Weber, G. (1999). Adaptive learning systems in the World Wide Web. In Kay, J. (Ed.),Usermodeling: Proceedings of the Seventh International Conference, UM99, pages 371–378.Vienna: Springer.
Weber, G., Kuhl, H.-C., and Weibelzahl, S. (2001). Developing adaptive internet basedcourses with the authoring system NetCoach. In Reich, S., Tzagarakis, M. M., and deBra, P. (Eds.),Hypermedia: Openness, Structural Awareness, and Adaptivity, pages 226–238. Berlin: Springer.
Weber, G. and Möllenberg, A. (1995). ELM programming environment: A tutoring sys-tem for LISP beginners. In Wender, K. F., Schmalhofer, F., and Böcker, H.-D. (Eds.),Cognition and computer programming, pages 373–408. Norwood, NJ: Ablex PublishingCorporation.
153

Bibliography
Weber, G. and Specht, M. (1997a). User modeling and adaptive navigation support inWWW-based tutoring systems. In Jameson, A., Paris, C., and Tasso, C. (Eds.),UserModeling: Proceedings of the Sixth International Conference, UM97, pages 289–300.Vienna, New York: Springer. Available from http://um.org.
Weber, G. and Specht, M. (1997b). User modeling and adaptive navigation support inWWW-based tutoring systems. In Jameson, A. and Tasso, C. (Eds.),User Modeling: Pro-ceedings of the Sixth International Conference, UM97, pages 289–300. Vienna: Springer.
Weibelzahl, S. (1999). Conception, implementation, and evaluation of a case based learningsystem for sales support in the internet. Master’s thesis, University of Trier. available athttp://home.ph-freiburg.de/weibelza/.
Weibelzahl, S. (2001). Evaluation of adaptive systems. In Bauer, M., Gmytrasiewicz, P. J.,and Vassileva, J. (Eds.),User Modeling: Proceedings of the Eighth International Confer-ence, UM2001, pages 292–294. Berlin: Springer.
Weibelzahl, S. and Lauer, C. U. (2001). Framework for the evaluation of adaptive CBR-systems. In Vollrath, I., Schmitt, S., and Reimer, U. (Eds.),Experience Management asReuse of Knowledge. Proceedings of the Ninth German Workshop on Case Based Reason-ing, GWCBR2001, pages 254–263. Baden-Baden: Shaker.
Weibelzahl, S., Lippitsch, S., and Weber, G. (2002a). Advantages, opportunities, and limitsof empirical evaluations: Evaluating adaptive systems.Künstliche Intelligenz, 3/02, 17–20.
Weibelzahl, S., Lippitsch, S., and Weber, G. (2002b). Supporting the authoring of Adap-tive Hypermedia with structural information? In Henze, N., Kókai, G., Schröder, O.,and Zeidler, J. (Eds.),Personalization for the Mobile World. Proceedings of the GermanWorkshop on Adaptivity and User Modeling in Interactive Systems, ABIS02, pages 99–105, Hannover.
Weibelzahl, S. and Weber, G. (1999). Benutzermodellierung von Kundenwünschen durchFallbasiertes Schließen. In Jörding, T. (Ed.),Adaptivität und Benutzermodellierung ininteraktiven Softwaresystemen, ABIS-99, Magdeburg. availabe at http://www-mmt.inf.tu-dresden.de/joerding/abis99/proceedings.html.
Weibelzahl, S. and Weber, G. (2000). Evaluation adaptiver Systeme und Verhaltenskom-plexität. In Müller, M. E. (Ed.),Adaptivität und Benutzermodellierung in interaktivenSoftwaresystemen, ABIS-2000, Osnabrück.
Weibelzahl, S. and Weber, G. (2001a). A database of empirical evaluations of adaptivesystems. In Klinkenberg, R., Rüping, S., Fick, A., Henze, N., Herzog, C., Molitor, R., andSchröder, O. (Eds.),Proceedings of Workshop Lernen – Lehren – Wissen – Adaptivität
154

Bibliography
(LLWA 01); research report in computer science nr. 763, pages 302–306. University ofDortmund.
Weibelzahl, S. and Weber, G. (2001b). Mental models for navigation in adaptive web-sitesand behavioral complexity. In Arnold, T. and Herrmann, C. S. (Eds.),Proceedings ofthe Fifth Annual Meeting of the German Cognitive Science Society, KogWis 2001, pages74–75. Leipzig: Leipziger Universitätsverlag.
Weibelzahl, S. and Weber, G. (2002). Adapting to prior knowledge of learners. In de Bra, P.,Brusilovsky, P., and Conejo, R. (Eds.),Proceedings of the Second International Confer-ence on Adaptive Hypermedia and Adaptive Web Based Systems, Málaga, Spain, AH2002,pages 448–451. Berlin: Springer.
Whitefield, A., Wilson, F., and Dowell, J. (1991). A framework for a human factors evalua-tion. Behaviour & Information Technology, 10(1), 65–79.
Woods, D. D. (1993). The price of flexibility. InProceedings of the 1993 InternationalWorkshop on Intelligent User Interfaces, pages 19–25, Orlando.
Worthen, B., Sanders, J., and Fitzpatrick, J. (1997).Program Evaluation(2nd ed.). NewYork: Longman.
Wu, H., Houben, G.-J., and de Bra, P. (1999). Authoring support for adaptive hypermediaapplications. InProceedings of the Ed-Media 99 Conference, pages 364–369.
155

Bibliography
156
Index
Aaccuracy . . . . . . . . .18, 35–39, 42, 57, 104acquisition of input data . . . . . . . . . 22–24adaptability . . . . . . . . . . . . . . . . . . . . . . . . 18adaptation decision 18, 22, 24, 28, 34, 43,
50, 53, 56, 72, 74–76, 83–84, 89,90, 104–116, 119, 122, 123
adaptation method . . . . . . . . .seemethod,adaptation
adaptive systemarchitecture . . . . . . . . . . . . . . . . 20–22definition . . . . . . . . . . . . . . . . . . .17–18functions . . . . . . . . . . . . . . . . . . . 18–20model . . . . . . . . . . . . . . . . . . . . . .20–24
adaptivity degree . . . . . . . . . . . . . . . . 56–66adaptivity success . 28, 36, 44, 49, 55, 62,
104, 109, 115, 118, 122afferential component . . . . . . . . . . . . . . . 22AHA! . . . . . . . . . . . . . . . . . . . . . . . . . . 63, 84AI . . . . . . . . . . . .seeArtificial Intelligenceanalysis . . . . . . . . . . . . . . . . . . . . . . . . . . . 26
statistical . . . . . . . . . . . . 35, 36, 39, 44analysis of variance . . . 35, 110, 114, 115annotation . . . . . . . . . . . . . . 19, 24, 44, 59,
62, 64, 66, 78, 79, 83, 100–104,109–116, 119, 120, 123
ANOVA . . . . . . . .seeanalysis of varianceapplicability . . . . . . . . . . . . . . . . . . 122–123APT . . . . . . . . . . . . . . . . . . . . . . . . . . . . . . 40architecture . . . . . . . . . . 20–22, 50, 76, 77Artificial Intelligence . . . . . . . . 24, 27, 28assessment . . . . . . . . . . . . . . . . . . . . 57, 105
external . 52, 56–58, 89, 90, 97–100,104, 119, 123
assumptions of system . . . . . . . . . . . 20, 28AST . . . . . . . . . . . . . . . . . . . . . . . . . . . . . . 41audience . . . . . . . . . . . . . . . . . . . . . . . . . . . 26author 59, 61–63, 66, 77, 80, 83, 105, 124authoring 56, 59, 66, 77, 84, 93, 100, 120
BBabel . . . . . . . . . . . . . . . . . . . . . . . . . . . . . 41Bayesian Network . . . . . . .24, 44, 52, 123behavior . . . . . . . . . . . . . . . . . . . . 18, 34, 43
learner . . . . . . . . . . . . . . . . . . .100–104system 17, 50, 53–54, 56, 58, 89, 90,
116–118, 124user . 50, 53–55, 58, 67, 89, 90, 100,
109, 118
Ccase-based reasoning . . . . . . . . . . . . 24, 52CASTLE . . . . . . . . . . . . . . . . . . . 68, 70, 73categorization grid . . . . . . . . . . . . . . . . . . 73CDL Learning Server . . . . . . . . . . . . . . . 41characteristic
structural . . . . . . . . . . . . 55, 56, 59–66chat . . . . . . . . . . . . . . . . . . . . . . . . . . . . . . . 87CodeBroker . . . . . . . . . . . . . . . . . . . . . . . . 40cognition . . . . . . . . . . . . . . . . . . . 43, 67, 73cognitive task analysis . . . . . . . . . . . 69, 73collaboration . . . . . . . . . . . . .19, 33, 73, 74collaborator . . . . . . . . . . . . . . . . . . . . . . . . 19Collagen . . . . . . . . . . . . . . . . . . . . . . . . . . .40commissioner . . . . . . . . . . . . . . . . . . . . . . 26
157

Index
communityscientific . . . . . . . . . . . . . . . . . . 45, 124
compactness . . . . . . . . . . . . . . . . . . . . . . . 73competition . . . . . . . . . . . . . . . . . . . 36, 124complexity
behavioral . . . . . . . . . . . 55, 57, 66–73complexity measure . . . . . . . . . . . . . 69–72component . . . . . . . . . . . . . . . . . . . . . . . . . 76computation time . . . . . 37, 38, 42, 54, 57concept . . . . . . . . . . . . . . . . . . . . . 56, 59, 60congruence . . . . . . . . . . . . 56, 97–100, 119consistency . . . . . . . . . . . . . . . . . . . . . . . . 27content . . . . . . . . . . . . . . . . . . . . . . . . . . . . 66contingency-coefficient . . . . . . . . 100, 139control group . . . . . . . . . . . . . . . . 28, 43, 52correctness
formal . . . . . . . . . . . . . . . . . . . . . . . . .27costs . . . . . . . . . . . . . . . . . . . . . . . . . . . . . 120criterion . . . . . . 25, 29, 31–32, 34–43, 49,
54–59, 90adaptation decision . . . . . . . 105–106,
109–110, 122behavioral complexity . . . . . . . 66–73evaluation . . . . . . . . . . . . . . 13, 26, 28inference . . . . . . . . . . 97–98, 100–101input data . . . . . . . . . . . . . . . . . . 91–93interaction . . . . . . . . . . . 116–118, 122structural information . . . . . . . 59–66usability . . . . . . . . . . . . . . . . . . . 28–29
curriculum sequencing . . . . . . . . . . 19, 59,66, 83, 100–104, 109–116, 119,120, 123
customer . . . . . . . . . . . . . . . . . . . .18, 70, 75cycle . . . . . . . . . . . . . . . . . . . . . . . . . . .69, 73
Ddata quality . . . . . . . . . . . . . . . . . . . . . . . . 51database . . . . . . . . . . . . . 18, 44, 45, 47, 70definition of adaptive systems . . . . . . . . 17density . . . . . . . . . . . . . . . . . . . . . . . . . 70, 73design . . . . . . . . . . . . . . . . . . .24–27, 43, 50
evaluation . . . . . . . . . . . . . . . . . . . . . 31experimental . . . . . . . . . . . . 26, 31, 44
differencesindividual . . . . . . . . . . . . . . . . . . . . . 17
difficulty . . . . . . . . . . . . . . . . . . . . . . . . . . .91discussion board . . . . . . . . . . . . . . . . . . . .87division of labor . . . . . . . . . . . . . . . . . . . . 66document retrieval . . . . . . . . . . . . . . . . . . 35dropout . . . . . . . . . . . . . . . . . . . . . . 109, 110duration 32, 36–38, 42, 43, 55, 57, 66, 71,
90, 91, 105, 109, 110, 114, 118
Ee-commerce . . . . . . . . . . . . . . . . . . . . . . . .18EASy-D . . . . . . . . . . . . . . . . . . . 44–47, 123ECSAIWeb . . . . . . . . . . . . . . . . . . . . . . . . 84education
further . . . . . . . . . . . . . . . . . . . 116, 121education further . . . . . . . . . . . . . . . . . . 105effect . . . . . . . . . . . . . . . . . . . 36–38, 42, 57effectiveness . 27–29, 31, 34, 54, 58, 108efferential component . . . . . . . . . . . . . . . 22efficiency . . . . 27–29, 31, 34, 54, 58, 108,
120, 121ELFI . . . . . . . . . . . . . . . . . . . . . . . . . . . . . . 41ELM-ART . . . . . . . . . . . . . . . . . . . . . 41, 77error . . . . . . . . . . . . . . . . . 29, 37, 38, 42, 57evaluation
definition . . . . . . . . . . . . . . . . . . . . . . 25empirical . . . . . . . . . . . . . . . . . . .25–28formative . . . . . . . . . . .26, 49, 55, 100goals . . . . . . . . . . . . . . . . . . . . . . 25–26layered . . . . . . . . . 32, 50, 55, 75, 122method . . . . . . . . . . . . . . . . . . . . . . . . 56procedure . . . . . . . . . . . . . . . . . . 26–27steps . . . . . . . . . . . . . . . . . . . 26–27, 50summative . . . . . . . . . . .26, 49, 53, 55technique . . . . . . . . . . . . . . . . . . . . . . 26
evaluation step . . . . . . . . . . . . . . . . . . . . . 56exactness . . . . . . . . . . . . . . . . . . . . . . . . . 121exercise . . . . . . . . . . . . . . . . . . . . . . . . . . . 81
158

Index
experience . . . . . . . . . . . . . .71, 72, 97, 110expert . . 34, 35, 37, 38, 42, 52, 57, 58, 70expertise . . . . . . . . . . . . . . . . . . . . . . . 18, 19eye tracking . . . . . . . . . . . . . . . . . . . . . . . . 28
Ffeedback . 18, 43, 47, 51, 52, 89, 90, 118,
121, 123fixation . . . . . . . . . . . . . . . . . .37, 38, 42, 57flexibility . . . . . . . . . . . . . . . . . . . . . . . . . . 27FOIL-IOAM . . . . . . . . . . . . . . . . . . . . . . . 40formative evaluation . . . . .seeevaluation,
formativefragment
conditional . . . . . . . . . . . . . . . . . 60, 63framework . . . . 20, 32, 49–56, 73, 75, 77,
121–123function 31, 33, 45, 47, 68, 69, 77, 85, 87,
124
Ggeneralization . . . . . . . . . . . . . . . . 119–121goal . . . . . . . . . . 19, 24, 29, 33, 54, 66, 68GOMS . . . . . . . . . . . . . . . . . . . . . . . . . . . . 69guideline . . . . . . . . . . . . . . . . . . . . . . . . . . 49guiding . . . . . . . . . . . . . . . . . . . . . . 119, 120
Hhelp . . . . . . . . . . . . . . . . . . . . . . . . 37, 38, 42help system 18, 19, 24, 33, 51, 53, 66, 73,
74, 124heuristic . . . . . . . . . . . . . . . . . . . . . . . . . . . 67HEZINET . . . . . . . . . . . . . . . . . . . . . . . . . 41HTML-Tutor . . . . 62, 77, 85–89, 91–118human-computer interaction . . . . . .27, 28HUMOS . . . . . . . . . . . . . . . . . . . . . . . . . . .40Hyperbook . . . . . . . . . . . . . . . . . . . . . . . . .84hypermedia . . . . . 20, 36, 55, 56, 110, 124hypertext . . . . . . . . . . . . . . . . . . 17, 73, 105
Iimpression . . . . . . . . 37, 38, 42, 57, 62, 63
improvement . . . . . . . . . . . . . . . . . . . . . .100incongruence . . . . . . . . . . . . . . . . . . 97–100INCOPS . . . . . . . . . . . . . . . . . . . . . . . . . .110inference . . 21, 50–52, 55, 75, 76, 82, 83,
116downward . . . . . . . . . . . . . . . . . . 22, 53evaluation of . . . . .34, 50, 52, 89, 90,
96–104, 122nontrivial . . . . . . . . . . . . . . . . . . . . . . 17relation . . . . . . . . . 59, 63, 80, 86, 120rule based . . . . . . . . . . . . . . . . . . . . . 24upward . . . . . . . . . . . . . . . . . . . . . . . . 22
inference of user properties . . . . . . . . . . 24inferential component . . . . . . . . . . . . . . . 22information
structural . . . . . . . . . . . . . . . . . . .59–66Information Filtering System . . . . . . . . 40information retrieval . . . . . . . . . . . . . . . . 36information tailoring . . . . . . . . . . . . . . . . 18Initiative in Answer Generation . . . . . . 40Initiative Prediction . . . . . . . . . . . . . . . . . 40input data . 22, 24, 34, 50–52, 55, 74, 75,
79–80, 89–96, 122intelligent tutoring system (ITS) . . . . . 21intention . . . . . . . . . . . . . . . . . . . . . . . . . . . 19interaction . . . 53, 54, 62, 66, 67, 73, 109,
116, 119, 121evaluation of . 34, 50, 53–56, 74, 89,
90, 116–118, 122interaction assessment . . . . . . . . . . . . . . 76interaction quality . . . . . . . . . . . . . . . . . . 28Interbook . . . . . . . . . . . . . . . . . . . . . . . . . . 84interest . . . . . . . . . . . . . . . . . . . . . 19, 20, 52interface . . . . . . 17, 22, 24, 53, 73, 74, 85interface adaptation . . . . . . . . . . . . . . . . . 19interview . . . . . . . . . . . . . . . . . . . . . . . . . . 34Iona . . . . . . . . . . . . . . . . . . . . . . . . . . . . . . . 40ISO . . . . . . . . .seeInternational Standards
Organisationitem
forced choice . . . . . . . . 79, 87, 89, 96
159

Index
gap filling . . . . . . . . . . . 79, 87, 89, 96multiple choice . . . . . . 79, 87–89, 96
item response theory . . . . . . . . . . . . . . . 120ITS . . . . . .seeintelligent tutoring system
Kkeyboard skills . . . . . . . . . . . . . . 19, 41, 75knowledge . . . . 19–21, 24, 36, 44, 52, 67,
78–80, 85, 87, 94, 101, 109structural . . . . . . . . . . . . . . . . . . . . . . 67
knowledge base . . . . . . . . . . . . . . . . . . . . 80knowledge state . . . . . . . . . . . . . . . . . . . . 63Kommunikation . . . . . . . . . . . 62, 100–104
Llayer
evaluation . . . . . . . . . . . . . . 34, 45, 76user model . . . . . . . . . . . . . . . . . . . . .81
learnability . . . . . . . . . . . . . . . . . . . . . 27, 29learner . . . . . . . . . . . . . . . . . . . . . . . . . 78–80learning . . . . . . . . . . . . . . . . . . . . .36–38, 42
support . . . . . . . . . . . . . . . . . 19, 24, 33learning gain . 36–38, 42, 44, 54, 66, 100,
105learning on demand . . . . . . . .85, 105, 108learning state . . 81, 83, 96, 100–104, 117learning system . . . 36, 44, 52, 54, 56, 66,
73–75, 116, 119, 120, 123, 124Leistungsbeurteilung . . . . . . . . . . . . . . . .62linearity . . . . . . . . . . . . . . . 73, 86, 109, 120link . . . . . . . . . . . . . . . . . . . . . . . . . . . . . . . 68
conditional . . . . . . . . . . . . . . . . . 60, 63link hiding . . . . . . . . . . . . . . . . . . 19, 59, 84log-file . . . . . . . . . . . . . . . . . . . . . . . . . 26, 34LUMIÈRE . . . . . . . . . . . . . . . . . . . . . . . . . 19
Mmachine learning . . . . . . . . 21, 24, 27, 122MANOVA . . . seemultivariate analysis of
variancemeasure
structural . . . . . . . . . . . . . . . . . . .59–66
mechanismadaptation . . . . . . 31, 56, 61, 78, 124inference . . . . .36, 49, 50, 73, 74, 77,
80–84, 122memorability . . . . . . . . . . . . . . . . . . . 27, 29MetaLinks . . . . . . . . . . . . . . . . . . . . . . . . . 84method
adaptation . . . . . . . . . . . . . . 19, 31, 33adaptation decision . . . . . . . 105–106,
109–110, 122empirical . . . . . . . . . . . . . . . 27, 43, 62evaluation 26, 32, 34–45, 47, 49, 52,
55–59formal . . . . . . . . . . . . . . . . . . . . 50, 120inference . . . . . . . . . . 97–98, 100–101input data . . . . . . . . . . . . . . . . . . 91–93interaction . . . . . . . . . . . 116–118, 122statistical . . . . . . . . . . . . 27, 31, 32, 35task analysis . . . . . . . . . . . . . . . . . . . 68
Methoden . . . . . . . . . . . . . . . . . . . . . . . . . .62METIORE . . . . . . . . . . . . . . . . . . . . . . . . . 40MFD . . . . . . . . . . . . . . . . . . . . . . . . . . . . . . 40misconception . . . . . . . . . . . . . . . . . . 21, 98MMD . . . . . . . . . . . . . . . . . . . . . . . . . . . . . 41model
cognitive . . . . . . . . . . . . . . . . . . . . . 121domain . . . . . . . . . . . . . . . . . . . . 20, 56interaction . . . . . . . . . . . . . . . . . . . . . 20mental . . . . . . . . . . . . . . . . . . . . . . . . 67overlay . . . . . . . . . . . . . . . . . . . . . . . . 81profile . . . . . . . . . . . . . . . . . . . . . . . . . 20psychological . . . . . . . . . . . . . . . . . . 20student . . . . . . . . . . . . . . . . . . . . . . . . 20
modeling . . . . . . . . . . . . . . . . . . . . . . . . . . 76motor disabilities . . . . . . . . . . . . . . . . . . . 19multivariate analysis of variance 35, 106,
108
Nnavigation . 37, 38, 42–44, 57, 60–62, 64,
66, 68, 73, 78, 79, 84, 91, 119
160
Index
need . . . . . . . . . . . . . . . . . . . . 17, 18, 24, 70NetCoach . . . . . . . . . . . . . . . . . . . . . . . . . 59,
61–63, 77–85, 91, 100, 101, 104,105, 110, 118–121, 123
News Dude . . . . . . . . . . . . . . . . . . . . . . . . 40news system . . . . . . . . . . . . . . . . . . . . 18, 51novice . . . . . . . . . . . . . . . . . . . . . . . . . . . . . 70
Oobjective . 26, 56, 60, 78, 79, 87, 91, 105,
116objectivity . . . . . . . . . . . . . . . . . . . . . . 57, 58observation 18, 22, 26, 36, 42, 43, 51, 58,
89–91orientation . . . . . . . . . . . . . . . . . . . . . .62, 64ORMIHUS . . . . . . . . . . . . . . . . . . . . . . . . 40
PP-TIMS . . . . . . . . . . . . . . . . . . . . . . . . . . . 41performance . . . . . . . . . . . . . 50, 54, 97, 98personalization . . . . . . . . . . . . . . . . . . . . . 18Personenwahrnehmung . . . . 62, 100–104Piaget . . . . . . . . . . . . . . . . .62, 86, 100–104post-test . . . . . . . . . . . . . . . . . . 79, 105–108pre-test . . . . . . 79, 83, 105–108, 116, 124precision . . . . . . . . . . . . . 35–38, 42, 43, 57preference . 17, 18, 24, 44, 53, 57, 70, 78prerequisite . . 59, 60, 80, 82, 84, 86, 101,
117, 119, 120prior knowledge . . . 78, 87, 91, 105–108,
116, 118, 119, 121probability . . . . . . . . . . . . . . . . . . . . 24, 123Problemloesen . . . . . . . . . . . . 62, 100–104product presentation . . . . . . . . . . . . . . . . 66product recommendation . 18, 24, 33, 53,
68, 70, 73, 74, 123productivity . . . . . . . . . . . . . . . . . . . . . . . . 29property 21, 44, 52, 53, 56, 75, 100, 121,
122protocol . . . . . . . . . . . . . . . . . . . . . . . . . . . 67PSI . . . . . . . . . . . . . . . . . . . . . . . . . . . . . . . 62Psychologie . . . . . . . . . . . . . . . . . . . . . . . . 62
Qquestionnaire . .26, 28, 34, 36–38, 42, 52,
55, 57, 62, 63, 70, 109QUIS . . . . . . . . . . . . . . . . . . . . . . . . . . 70, 71
Rrate
adaptation . . . . . . . . . . . . . . . . . . . . . 33rating . . . . . . . . . . . . . . . . . . . . . . . . . . 62, 63
subjective . . . . . . . . . . . . . . . . . . . . 115rating scale . . . . . . . . . . . . . . . . . . . . . . . 109READY . . . . . . . . . . . . . . . . . . . . . . . . . . . 40recall . . . . . . . . . . . . . . . . . . . .35–38, 42, 57recommendation . . . . . . . . . 18, 24, 33, 53record
archival . . . . . . . . . . . . . . . . . . . . 36, 42reference model . . . . . . . . . . . . . . . . . . . . 20relation . . . . . . . . . . . . . . . . . . . . . . . . 59–61relevance feedback . . . . . . . . . . . . . . . . . 18reliability . . . . . 50, 52, 55, 57, 58, 66, 75,
89–91, 94, 122representation . . . . . . . . . . . . 20, 67, 68, 72RESCUER . . . . . . . . . . . . . . . . . . . . . . . . .41RLRSD . . . . . . . . . . . . . . . . . . . . . . . . . . . 40RMM . . . . . . . . . . . . . . . . . . . . . . . . . . . . . 41routine task . . . . . . . . . . . . . . . . . . . . . . . . 19RR2000 . . . . . . . . . . . . . .90, 109–116, 120
Ssample size . . . . . . . . . . . . . . 35, 36, 39, 45satisfaction 25, 29, 34, 36–38, 42, 57, 71,
73, 108, 109, 114search
visual . . . . . . . . . . . . . . . . . . . . . . . . . 75self-report . . . . . . . . . . . . . . . . . . . . . . 36, 42setting
experimental . . . . . . . . . . . . . . . . . . . 26SiteIF . . . . . . . . . . . . . . . . . . . . . . . . . . . . . 40software engineering . . . . . . . . . . . . 27, 50software evaluation . . . . . . . . . . 25–29, 70SOM . . . . . . . . . . . . . . . . . . . . . . . . . . . . . . 40specification . . . . . . . . . . . . . . . . . . . . . . . 26
161

Index
SQL-Tutor . . . . . . . . . . . . . . . . . . . . . . . . . 40stability . . . . . . . . . . 37, 38, 42, 54, 57, 58state . . . . . . . . . . . . . . . . . . . . . . . . 67, 68, 72state-transition-network . . . . . . . . . . . . . 67stereotype . . . . . . . . . . . . . . . . . . .17, 44, 53stratum . . . . . . . . . . . . . . . . . . . . . . . . . . . . 73structure . . . . . . . .59–66, 73, 77, 100, 105
linear . . . . . . . . . . . . . . . . . . . . . 86, 109study
experimental . . . . . . . . . . . . . . . . . . . 31exploratory . . . . . . . . . . . . . 34, 35, 37
submission . . . . . . . . . . . . . . . . . . . . . . . . .45suggestion . . . 53, 60, 62, 64, 78, 84, 101,
109, 118summary . . . . . . . . . . . . . . . . . . . . . . . . . 119summative evaluation . . . .seeevaluation,
summativesynopsis . . . . . . . . . . . . . . . . . . . . 31–43, 75system
adaptable . . . . . . . . . . . . . . . . . . . . . . 18dynamic . . . . . . . . . . . . . . . . . . . . . . . 67interactive . . . . . . . . . . . . . . . . . . 17, 18
system quality . . . . . . . . . . . . . . . . . . . . . .28
TTAG . . . . . . . . . . .seetask action grammartask 17, 18, 20, 22, 24, 25, 28, 31, 33, 54,
68–70, 97routine . . . . . . . . . . .19, 33, 66, 73, 74
task action grammar . . . . . . . . . . . . . . . . 69teacher . . . . . . . . . . . . . . . . . . . . . . . . . . . . 85test . . . . . . . . . . . . . . . . . . . . 78, 79, 83, 105
adaptive . . . . . . . . . . . . . . . . . 120, 123test group . . . .79, 81, 83, 91, 93, 94, 100,
101, 110, 116test item . . .79, 81, 83, 85, 89, 91, 93, 94,
98, 100, 105, 120, 122test theory . . . . . . . . . . . . . . . . . . . . . . . . . 52testing . . . . . . . . . . . . . . . . . . 27, 28, 50, 52Tiddler . . . . . . . . . . . . . . . . . . . . . . . . . . . . 41TOOT . . . . . . . . . . . . . . . . . . . . . . . . . . . . . 40
training . . . . . . . . . . . . . . . . . . . . . . . 19, 121transition . . . . . . . . . . . . . . . . . . . 67, 68, 72tutor . . . . . . . . . . . . . . . . . . . . . . . . . . . . . 124
UUcam . . . . . . . . . . . . . . . . . . . . . . . . . . . . . 40UMUAI . . . . seeUser Modeling and User
Adapted Interactionusability . . . . . . . . . . . . . 25, 27–29, 31, 34,
36, 50, 53–58, 69, 70, 109, 114,116, 118
dimensions . . . . . . . . . . . . . . . . . . . . 29usefulness . . . . . . . . . . . . . . . . . . . . . 45, 120user
hypothetical . . . . . . . . . . . . .34, 36, 38User lenses . . . . . . . . . . . . . . . . . . . . . . . . 41user model . . . . . . . 17, 20, 24, 49, 50, 53,
57, 81, 89, 90, 97, 98, 100, 101,104, 116, 123
User Modeling and User Adapted Inter-action . . . . . . . . . . . . . . . . . 27, 32,45
user property . . . . . . . . . . . . . . . . . . . . . . . 24
Vvalidity . . . . . . . . . . . . . . . . . . 50, 52, 55, 97verification . . . . . . . . . . . . . . . . . . . . . 27, 50VIS . . . . . . . . . . . . . . . . . . . . . . . . . . . . . . . 40
Wwarning . . . . . . . . . . . . . . . . 78, 79, 84, 117WIFS . . . . . . . . . . . . . . . . . . . . . . . . . . . . . 40word processing . . . . . . . . . . . . . . . . . . . . 19
162
Author Index
AAbbattista, Fabio . . . . . . . .seeSemerano,
Giovanni, 41Abowd, Gregory D. .seeDix, Alan J., 25,
26, 68Ambrosini, Leonardo . . . . . . . . . . . . . . .40Anderson, John . .seeStrachan, Linda, 41Anderson, John R.seeCorbett, Albert T.,
121Antonio Pérez, Tomás .seePérez, Tomás
AntonioAntonio Vadillo, Jose . .seeVadillo, Jose
AntonioArdissono, Liliana . . . . . . . . . . . . . . . . . .19Arend, Udo . . . . . . . . . . . . . . . . . . . . . . . .68Arruabarrena, Rosa . . . . . .seeVillamañe,
Mikel, 41
BBar, Dina Goren- . . .seeGoren-Bar, DinaBares, William H. . . . . . . . . . . . . . . . . . .40Bartell, Brian T.seeVogt, Christopher C.,
18, 41Beale, RusselseeDix, Alan J., 25, 26, 68Beck, Joseph . . . . . . . . . . . . . . . . . . . . . . .40Belew, Richard K. .seeVogt, Christopher
C., 18, 41Benyon, David R. . . . . . . . .13, 20, 21, 27Berthold, Andrè . . . . . . . . . . . . . . . . . . . .40Bhatnagar, AkshatseeCorbett, Albert T.,
40Billsus, Daniel . . . . . . . . . . . . . .18, 40, 51Bohnenberger, Thorsten . . . . . . . . . . . . .19Borgman, Christine . . . . . . . . . . . . . . . . .67
Borst, M. A. . . . . . . . . .seeCurtis, Bill, 69Botafogo, Rodrigo A. . . . . . . . . . . . . . . .73Boulay, Benedict du . . . . . . . .seeLuckin,
Rosemary, 40Bovair, Susan . . . . . . . . . . . . . . . . . . . . . .67Bowes, Jeff . . . . . . . . .seeBull, Susan, 19Boyle, E. .seeTotterdell, Peter A., 26, 75Breese, Jack . . . .seeHorvitz, Eric, 19, 24Broadbent, Donald E. . . . . . . . . . . . . . . .67Broadbent, Margret H. P. .seeBroadbent,
Donald E., 67Brown, M. I. . . . . . .seeDraper, S. W., 31Brown, Michael K. . . . . .seeChu-Carroll,
Jennifer, 40Brusilovsky, Peter .19, 24, 32, 51, 56, 75,
84, 100Brusilovsky, PeterseeEklund, John, 110,
119Buckley, Fred . . . . . . . . . . . . . . . . . . . . . .73Bueno, David . . . . . . . . . . . . . . . . . . . . . .40Bull, Susan . . . . . . . . . . . . . . . . . . . . .19, 81Butz, Andreas . . . . . . .seeBohnenberger,
Thorsten, 19
CCalvi, Licia .seede Bra, Paul, 19, 51, 56,
84Carberry, Sandra . .seeGreen, Nancy, 40,
52Carro, Rosa M. . . . . . . . . . . . . . . . . . . . . .56Carroll, Jennifer Chu- . .seeChu-Carroll,
JenniferCheung Chiu, Bark . . . . . .seeChiu, Bark
Cheung
163
Author Index
Chin, David N. . . . . . . . . . . .13, 19, 27, 40Chin, David N.seeCrosby, Martha E., 40Chin, John P. . . . . . . . . . . . . . . . . . . . . . . .70Chisalita, Cristina . . . .seeJuvina, Ion, 69Chiu, Bark Cheung . . . . . . . . . . . . . . . . .40Christine Shin, E. .seeShin, E. ChristineChu-Carroll, Jennifer . . . . . . . . . . . . . . .40Cini, Alessandra . . . . . . . . . . . . .56, 59, 62Cirillo, Vincenzo . . . . . . . .seeAmbrosini,
Leonardo, 40Cohen, W. W. . . . . . . . . . . . . . . . . . . . . . .19Collins, Jason . . . . .seeGreer, Jim E., 19Condit, Chris . . . . . .seeMurray, Tom, 56Conejo, Ricardo . .seeGuzmán, Eduardo,
120Corbett, Albert T. . . . . . . . . . . . . . .40, 121Cotter, Paul . . . . . . .seeSmyth, Barry, 73Cottrell, Garrison W. . . . . . . . . . .seeVogt,
Christopher C., 18, 41Cronbach, Lee J. . . . . . . . . . . . . . . . . . . .33Crosby, Martha E. . . . . . . . . . . . . . . . . . .40Cudrado, Javier López- . . . . . . . . . . . . .see
López-Cudrado, JavierCurtis, Bill . . . . . . . . . . . . . . . . . . . . . . . . .69
DDavid, Amos A. . . .seeBueno, David, 40de Bra, Paul . . . . . . . . . .19, 20, 51, 56, 84de Bra, Paul . . . . . .seeWu, Hongjing, 66de Haan, Geert . . . . . . . . . . . . . . . . . . . . .68de Lima, José Valdeni . . . . . . . . .seeCini,
Alessandra, 56, 59, 62Diehl, Virginia A. . .seeChin, John P., 70Dix, Alan J. . . . . . . . . . . . . . . . . .25, 26, 68Djan, James Ohene- . . . .seeOhene-Djan,
JamesDowell, J. . . . . . . . .seeWhitefield, A., 32Draier, Thomas . . . . . . . . . . . . . . . . . . . . .40Draper, S. W. . . . . . . . . . . . . . . . . . . . . . . .31du Boulay, BenedictseeBoulay, Benedict
du
du Boulay, Benedict . .seeVirvou, Maria,41, 52, 53
EEdmonds, Earnest A. . . . . . . . . . . . . . . .27Edwards, Alistair D. N. . . . .seeSpooner,
Roger I. W., 41Eklund, John . . . . . . . . . .13, 43, 110, 119Eklund, John .seeBrusilovsky, Peter, 19,
24, 51, 56, 84, 100Encarnação, L. Miguel . . . .40, 51, 52, 66Evans, Mark . . . .seeStrachan, Linda, 41
FFanizzi, Nicola .seeSemerano, Giovanni,
41Ferilli, Stefano .seeSemerano, Giovanni,
41Finlay, Janet E. .seeDix, Alan J., 25, 26,
68Fischer, Gerhard . . . . . . . . . . . . . . . . . . . .40Fitzgerald, Peter .seeBroadbent, Donald
E., 67Fitzpatrick, J. . . . . . . .seeWorthen, B., 25Fjeld, Morten .seeRauterberg, Matthias,
67Freeman, H. E. . . . . . .seeRossi, P. H., 25
GGallinari, Patrick seeDraier, Thomas, 40Gmytrasiewicz, Piotr J.seeNoh, Sanguk,
41Goren-Bar, Dina . . . . . . . . . . . . . . . . . . . .40Goy, Anna . . .seeArdissono, Liliana, 19Grandbastien, Monique . . . .seeSanrach,
Charun, 56, 84Grant, Simon . . . . . . . . . . . . . . . . . . . . . . .68Green, Nancy . . . . . . . . . . . . . . . . . . .40, 52Greer, Jim E. . . . . . . . . . . . . . . . . . . . . . . .19Greer, Jim E. .seeBull, Susan,seeMark,
Mary A., 19, 31
164
Author Index
Großmann-Hutter, Barbara . .seeMüller,Christian, 41
Gutiérrez, Julián . .seeVillamañe, Mikel,41
Guzmán, Eduardo . . . . . . . . . . . . . . . . .120
HHall, Wendy . . . . . .seeKim, Sanghee, 40Hanks, Steve . . . . . .seeLinden, Greg, 24Hannafin, Michael J. . .seePark, Innwoo,
105Harary, Frank . . . . .seeBuckley, Fred, 73Heckerman, David .seeHorvitz, Eric, 19,
24Henderson, F. P. . . .seeDraper, S. W., 31Henze, Nicola . . . . . . . . . . . . . . . . . .19, 84Herder, Eelco . . . . . . . . . . . . . . . . . . . . . .73Höök, Kristina . . . . . . . . . . .13, 28, 43, 72Horvitz, Eric . . . . . . . . . . . . . . . . . . . .19, 24Houben, Geert-JanseeWu, Hongjing,see
de Bra, Paul, 20, 66Hovel, David . . .seeHorvitz, Eric, 19, 24Howard, S. . . . . . . . . . . . . . . . . . . . . . . . . .26Hübscher, Roland . . . . . . . . . . . . . . . . . .84
IIding, Marie K.seeCrosby, Martha E., 40International Standards Organisation .28Iosif, Gheorghe . . . . . .seeJuvina, Ion, 69
JJameson, Anthony17, 18, 20, 22, 23, 31,
32, 66, 75, 123Jameson, Anthony .seeBerthold, Andrè,
seeBohnenberger, Thorsten, 19,40
Jameson, AnthonyseeMüller, Christian,41
Jörding, Tanja . . . . . . . . . . . . . . . . . .18, 66Juvina, Ion . . . . . . . . . . . . . . . . . . . . . . . . .69
KKaragiannidis, Charalampos . .32, 43, 50,
55Karagiannidis, Charalampos . . . . . . . .see
Brusilovsky, Peter, 32, 75Kay, Judy . . . . . . . . . . . . . . . . . . . . . . . . . .81Keane, Andy . . . . .seeKim, Sanghee, 40Kephart, Jeffrey O.seeSegal, Richard B.,
19Kettel, Lori . . . . . . . . .seeBull, Susan, 19Kieras, David E. . . . . . . . . . . . . . . . . . . . .67Kieras, David E. . .seeBovair, Susan, 67Kim, Sanghee . . . . . . . . . . . . . . . . . . . . . .40Klein, Benedikt . . . . . . . . . . . . . . . . . . .110Kobsa, Alfred . . .seeSpecht, Marcus, 41Koch, Nora . . . . . . . . . . . . . . . . . . . . . . . .20Krogsæter, Mete . . . . . . . . . . . . . . . . . .122Krüger, Antonio . . . . .seeBohnenberger,
Thorsten, 19Kuflik, Tsvi . . . .seeGoren-Bar, Dina, 40Kuhl, Hans-Christian . . . . . . . .seeWeber,
Gerhard, 51, 56, 62, 77, 83Kumar, Vive S. . . . .seeGreer, Jim E., 19Kuzmycz, Mark .seeChiu, Bark Cheung,
40
LLauer, Christoph Ulrich .seeWeibelzahl,
Stephan, 50Lesh, Neal . . . . . . . . . . . . . . . . . . . . . . . . .40Lesh, Neal . . . . . . . .seeLinden, Greg, 24Lester, James C. . .seeBares, William H.,
40Lev, Dror . . . . . .seeGoren-Bar, Dina, 40Linden, Greg . . . . . . . . . . . . . . . . . . . . . . .24Lippitsch, Stefan . . . . . . . . . . .61, 85, 119Litman, Diane . . . . . . . . . . . . . . . . . . . . . .40López-Cudrado, Javier . . .seeVillamañe,
Mikel, 41Love, Tom . . . . . . . . . .seeCurtis, Bill, 69Luckin, Rosemary . . . . . . . . . . . . . . . . . .40
165

Author Index
MMagnini, Bernado . . . . . . . . . . . . . . . . . .40Marhan, Ana-Maria . .seeJuvina, Ion, 69Marinilli, Mauro . . . . . . . . . . . . . . . . . . . .40Mark, Mary A. . . . . . . . . . . . . . . . . . . . . .31Matu, Stefan Trausan-seeTrausan-Matu,
StefanMayes, Terry . . . . . .seeGrant, Simon, 68McAteer, E. . . . . . . .seeDraper, S. W., 31McCabe, T. . . . . . . . . . . . . . . . . . . . . . . . .69McCalla, Gordon I. .seeBull, Susan,see
Greer, Jim E., 19McDonald, Sharon . . . . . . . . . . . . . . . .105McGrath, Joseph E. . . . . . . . . . . . . .32, 36McGrath, Joseph E. .seeRunkel, P. J., 32Meagher, P. . . . . . . .seeGreer, Jim E., 19Micarelli, Alessandro . . . .seeAmbrosini,
Leonardo,seeMarinilli, Mauro,40
Miguel Encarnação, L. . .seeEncarnação,L. Miguel
Milliman, Phil . . . . . . .seeCurtis, Bill, 69Mitrovic, Antonija . . . . . . . . . . . . . . . . . .40Möllenberg, Antje . .seeWeber, Gerhard,
19Müller, Christian . . . . . . . . . . . . . . . . . . .41Murray, Dianne M. . .seeBenyon, David
R., 13, 20, 21Murray, M. D. . . . . . . .seeHoward, S., 26Murray, Tom . . . . . . . . . . . . . . . . . . .56, 84
NNejdl, Wolfgang . .seeHenze, Nicola, 19,
84Nielsen, Jakob . . . . . . . . . . . . . . .17, 26, 29Noh, Sanguk . . . . . . . . . . . . . . . . . . . . . . .41Norman, D. A. . . . . . . . . . . . . . . . . . . . . .66Norman, Kent L. . . .seeChin, John P., 70Numao, Masayuki . .seeSison, Raymund
C., 41, 52
OOhene-Djan, James . . . . . . . . . . . . . . . . .20Oppermann, Reinhard .17, 18, 20, 22, 28Oppermann, Reinhard . . .seeKrogsæter,
Mete, 122
PPaek, Tim . . . . . . . . .seeHorvitz, Eric, 19Pain, Helen .seeBull, Susan,seeTrewin,
Shari, 19, 41, 52, 81Pan, Shimei . . . . . .seeLitman, Diane, 40Paramythis, Alexandros . . . . . . . . . .32, 75Paris, Cecile . . . . . . . . . . . . . . . . . . . . . . .41Park Woolf, Beverly .seeWoolf, Beverly
ParkPark, Innwoo . . . . . . . . . . . . . . . . . . . . .105Partl, Hubert . . . . . . . . . . . . . . . . . . . . . . .85Pazzani, Michael J. . .seeBillsus, Daniel,
18, 40, 51Pérez, Tomás Antonio . . .seeVillamañe,
Mikel, 41Piemonte, Janette . .seeMurray, Tom, 56Pirolli, Peter L. T. .seePitkow, James E.,
73Pitkow, James E. . . . . . . . . . . . . . . . . . . .73Pohl, Wolfgang . . . . . . . . . . . . . . . . . . .122Polson, Peter G. . .seeBovair, Susan,see
Kieras, David E., 67Porage, Asanga . .seeChin, David N., 40Pulido, E. . . . . . . .seeCarro, Rosa M., 56Puntambekar, Sadhana . . . .seeHübscher,
Roland, 84
RRasmussen, Jens . . . . . . . . . . . . . . . . . . . .68Rautenbach, P.seeTotterdell, Peter A., 76Rauterberg, Matthias . . . . . . . . .67, 69, 70Reisner, P. . . . . . . . . . . . . . . . . . . . . . . . . .68Rich, Charles . . . . . . . .seeLesh, Neal, 40Rich, Elaine A. . . . . . . . . . . . . . . . . . . . . .17Rivlin, Ehud . .seeBotafogo, Rodrigo A.,
73
166

Author Index
Rodríguez, P. . . . .seeCarro, Rosa M., 56Rommelse, KoosseeHorvitz, Eric, 19, 24Rossi, P. H. . . . . . . . . . . . . . . . . . . . . . . . .25Rummer, Ralf . .seeMüller, Christian, 41Runkel, P. J. . . . . . . . . . . . . . . . . . . . . . . .32
SSampson, Demetrios G. .seeBrusilovsky,
Peter, seeKaragiannidis, Char-alampos, 32, 43, 50, 55, 75
Sanders, J. . . . . . . . . .seeWorthen, B., 25Sanrach, Charun . . . . . . . . . . . . . . . .56, 84Sanz, Sara . . . . .seeVillamañe, Mikel, 41Sanz, Silvia . . .seeVillamañe, Mikel, 41Savenye, Wilhelmina C. . . . .seeShin, E.
Christine, 105Schallert, Diane L.seeShin, E. Christine,
105Schoppek, Wolfgang . . . . . . . . . . . .66, 67Schwarz, Elmar . .seeBrusilovsky, Peter,
19, 24, 51, 56, 84Schwarzkopf, Eric . . . . . . . .seeJameson,
Anthony, 75Sciarrone, Filippo .seeMarinilli, Mauro,
40Scriven, Michael . . . . . . . . . . . . . . . .26, 49Segal, Richard B. . . . . . . . . . . . . . . . . . . .19Semerano, Giovanni . . . . . . . . . . . . . . . .41Shen, Tina . . . . . . . .seeMurray, Tom, 56Sheppard, Sylvia B. . .seeCurtis, Bill, 69Shimura, MasamichiseeSison, Raymund
C., 41, 52Shin, E. Christine . . . . . . . . . . . . . . . . .105Shneiderman, BenseeBotafogo, Rodrigo
A., 73Shova, Peretz . . .seeGoren-Bar, Dina, 40Sidner, Candace L. . . .seeLesh, Neal, 40Sison, Raymund C. . . . . . . . . . . . . . .41, 52Smyth, Barry . . . . . . . . . . . . . . . . . . . . . . .73Sneesby, MurrayseeStrachan, Linda, 41Specht, Marcus . . . . . . . . . . . . .41, 66, 100
Specht, Marcus .seeWeber, Gerhard, 41,66, 77, 100, 110
Spooner, Roger I. W. . . . . . . . . . . . . . . . .41Stephanidis, ConstantineseeParamythis,
Alexandros, 32, 75Stern, Mia . . . . . . . . .seeBeck, Joseph, 40Stevenson, Rosemary J. . .seeMcDonald,
Sharon, 105Stoev, Stanislav L. . . .seeEncarnação, L.
Miguel, 40, 51, 52, 66Strachan, Linda . . . . . . . . . . . . . . . . . . . .41Strapparava, CarloseeMagnini, Bernado,
40
TTheo, Gloria . . . . . . . . . . . . . . . . . . . . . . .41Thibedeau, J. . . . . . .seeMurray, Tom, 56Thimbleby, A. . . . . . . . . . . . . . . . . . . . . . .27Thomas, Christoph G. . . .seeKrogsæter,
Mete, 122Totter, Alexandra . . . . . . .seeParamythis,
Alexandros, 32, 75Totterdell, Peter A. . . . . . . . . . . .26, 75, 76Trausan-Matu, StefanseeJuvina, Ion, 69Trewin, Shari . . . . . . . . . . . . . . . .19, 41, 52
UUlrich Lauer, Christoph . . . . . .seeLauer,
Christoph Ulrich
VVadillo, Jose Antonio . . . .seeVillamañe,
Mikel, 41Valdeni de Lima, José .seede Lima, José
Valdenivan der Veer, Gerrit C. . .seeJuvina, Ion,
seede Haan, Geert, 68, 69van Vliet, J. C. . . .seede Haan, Geert, 68Vassileva, Julita . . . .seeGreer, Jim E., 19Villamañe, Mikel . . . . . . . . . . . . . . . . . . .41Virvou, Maria . . . . . . . . . . . . . . .41, 52, 53Vogt, Christopher C. . . . . . . . . . . . . .18, 41
167
Author Index
WWan, Stephen . . . . . .seeParis, Cecile, 41Webb, Geoffrey I. . . . . . . .seeChiu, Bark
Cheung, 40Weber, Gerhard19, 41, 51, 56, 62, 66, 77,
81, 83, 100, 110Weber, GerhardseeLippitsch, Stefan,see
Weibelzahl, Stephan, 61, 70, 85,119
Weibelzahl, Stephan . . .32, 34, 50, 67, 70Weibelzahl, Stephan . . . . . .seeLippitsch,
Stefan,seeWeber, Gerhard, 51,56, 61, 62, 77, 83, 85, 119
Whitefield, A. . . . . . . . . . . . . . . . . . . . . . .32Wilkinson, Ross . . . .seeParis, Cecile, 41Wilson, F. . . . . . . . .seeWhitefield, A., 32Wirsing, Martin . . . . .seeKoch, Nora, 20Wittig, Frank . .seeMüller, Christian, 41Wolpers, Martin . .seeHenze, Nicola, 19,
84Woods, D. D. . . . . . . . . . . . . . . . . . . . . . .27Woolf, Beverly ParkseeBeck, Joseph, 40Worthen, B. . . . . . . . . . . . . . . . . . . . . . . . .25Wu, Hongjing . . . . . . . . . . . . . . . . . . . . . .66Wu, Hongjing . . . . . .seede Bra, Paul, 20Wu, Mingfang . . . . .seeParis, Cecile, 41
YYe, Yunwen . . . .seeFischer, Gerhard, 40
168

Hiermit versichere ich, dass ich diese Dissertation selbständig verfaßt und keine anderenals die angegebenen Hilfsmittel verwendet habe.
Stephan Weibelzahl