evaluating the efficiency of spectral resolution of univariate methods manipulating ratio spectra...
TRANSCRIPT

Spectrochimica Acta Part A: Molecular and Biomolecular Spectroscopy 137 (2015) 1363–1373
Contents lists available at ScienceDirect
Spectrochimica Acta Part A: Molecular andBiomolecular Spectroscopy
journal homepage: www.elsevier .com/locate /saa
Evaluating the efficiency of spectral resolution of univariate methodsmanipulating ratio spectra and comparing to multivariate methods: Anapplication to ternary mixture in common cold preparation
http://dx.doi.org/10.1016/j.saa.2014.09.0551386-1425/� 2014 Elsevier B.V. All rights reserved.
⇑ Corresponding author. Mobile: +20 1001655988.E-mail address: [email protected] (O. Ali).
Azza Aziz Moustafa a, Hesham Salem c, Maha Hegazy a, Omnia Ali b,⇑a Analytical Chemistry Department, Faculty of Pharmacy, Cairo University, Kasr-El Aini Street, 11562 Cairo, Egyptb Analytical Chemistry Department, Faculty of Pharmacy, October University for Modern Sciences and Arts (MSA), 11787 6th October City, Egyptc Analytical Chemistry Department, Faculty of Pharmacy, Deraya University, 14511 Cairo, Egypt
h i g h l i g h t s
� Resolve of ternary mixture withextremely overlapped spectra.� Univariate methods manipulating
ratio spectra: DD-RD, DD-DR, DRZC,MCR.� Multivariate methods: PCR, PLS.� Comparative study between
univariate and multivariate methods.� Methods were applied in bulk powder
and pharmaceutical formulations.
g r a p h i c a l a b s t r a c t
a r t i c l e i n f o
Article history:Received 2 July 2014Received in revised form 16 August 2014Accepted 19 September 2014Available online 28 September 2014
Keywords:Univariate methodsMultivariate methodsRatio spectraChlorpheniramine maleatePseudoephedrine HClIbuprofen
a b s t r a c t
Simple, accurate, and selective methods have been developed and validated for simultaneous determina-tion of a ternary mixture of Chlorpheniramine maleate (CPM), Pseudoephedrine HCl (PSE) and Ibuprofen(IBF), in tablet dosage form. Four univariate methods manipulating ratio spectra were applied, method Ais the double divisor-ratio difference spectrophotometric method (DD-RD). Method B is double divisor-derivative ratio spectrophotometric method (DD-RD). Method C is derivative ratio spectrum-zero crossingmethod (DRZC), while method D is mean centering of ratio spectra (MCR). Two multivariate methods werealso developed and validated, methods E and F are Principal Component Regression (PCR) and Partial LeastSquares (PLSs). The proposed methods have the advantage of simultaneous determination of the mentioneddrugs without prior separation steps. They were successfully applied to laboratory-prepared mixtures andto commercial pharmaceutical preparation without any interference from additives. The proposed meth-ods were validated according to the ICH guidelines. The obtained results were statistically compared withthe official methods where no significant difference was observed regarding both accuracy and precision.
� 2014 Elsevier B.V. All rights reserved.
Introduction tion alkylamine antihistamine used in the prevention of the symp-
Chlorpheniramine maleate (CPM) (3-(4-chlorophenyl)-N,N-dimethyl-3-pyridin-2-yl-propan-1-amine (Fig. 1) is a first-genera-
toms of allergic conditions such as rhinitis and urticarial thatcauses a moderate degree of sedation [1]. Pseudoephedrine hydro-chloride (PSE), also known as [(+)-threo-a-[1-methylamino) ethyl]benzyl alcohol] hydrochloride (Fig. 1), is a useful bronchodilatorand nasal decongestant. It shrinks swollen mucosa membranes,increases nasal airway passages, reduces nasal congestion, and

1364 A.A. Moustafa et al. / Spectrochimica Acta Part A: Molecular and Biomolecular Spectroscopy 137 (2015) 1363–1373
diminishes tissue hyperemia [2]. Ibuprofen (IBF) [(2S)-2-(4-Isobu-tylphenyl) propanoic acid] (Fig. 1), is a non-steroidal anti-inflam-matory drug (NSAID) used for relieving pain, helping with feverand reducing inflammation [3].
CPM, PSE and IBF are commonly combined in one formulationfor symptomatic treatment of coughs and the common cold.
Literature survey represented that CPM, PSE and IBF can bedetermined in binary mixtures by several methods including, spec-trophotometric methods [4,5], HPTLC, mass spectroscopic methods[6–8], HPLC [9], capillary electrophoresis [10,11].
After comprehensive literature survey, the ternary mixture wasanalyzed by liquid chromatography with experimental design[12–14].
Among the previous years, univariate spectrophotometricmethods manipulating ratio spectra have attracted the attentionof analysts who are interested in the quantitative spectral resolu-tion of complex mixtures.
Derivative spectrophotometry has been applied as the manipu-lating tool for ratio spectra in different aspects. Salinas et al. [15]introduced the derivative of ratio spectra, which was applied for bin-ary mixtures [16]. Then Nevado et al. [17] introduced the derivativeof ratio spectra using zero-crossing point applied for the analysis ofternary mixtures [18]. Later on, Dinc and Onur [19] developed thederivative of ratio spectra using double-divisor (DR-DD) appliedfor ternary mixtures [20]. Then Afkhami and Bahram [21] developedthe successive derivative of ratio spectra (SDR) for the analysis ofternary mixtures [22]. Recently, other manipulating ratio spectratechniques were developed such as: ratio difference spectrophoto-metric method (RDSM) [23], Extended Ratio Subtraction Method(EXRSM) [24], constant center spectrophotometric method (CCSM)[25–27], Successive spectrophotometric resolution technique(SSRT) [28,29], amplitude modulation (AM) [30] and mean centeringof ratio spectra (MCR) [31–33].
The aim of this work is to develop sensitive, accurate, precise,fast and inexpensive manipulating ratio spectra methods for theanalysis of the mentioned ternary mixture. Those methods are:the novel double divisor-ratio difference spectrophotometricmethod (DD-RD), double divisor-derivative ratio spectrophotomet-ric method (DD-RD), ratio spectra zero-crossing derivative spectro-photometry (DRZC) and successive mean centering of ratio spectra(MCR). Those spectrophotometric methods are compared to twochemometric methods, Principal Component Regression (PCR)and Partial Least Squares (PLSs), to evaluate their efficiency forthe analysis of the ternary mixture without prior separation.
Fig. 1. Chemical structure of (a) Chlorpheniramine ma
Theory of the novel double divisor ratio difference spectrophotometricmethod (DD-RD)
Lotfy and Hegazy [23] developed a ratio difference methodwhich was further modified and used for determination of ternarymixture [34] in which the severely overlapped spectra could beresolved without prior separation.
The most striking feature of the DD-RD method is its simplicity,rapidity and accuracy. The utility of the DD-RD method is to calcu-late the unknown concentration of a component present in a ter-nary mixture containing the component of interest and othertwo unwanted interfering components. For the determination ofconcentration of component of interest by the DD-RD method,the only requirement is the contribution of the three componentsat the two selected wavelengths k1 and k2 where the ratio spectraof the interfering components show the same amplitudes (con-stant) whereas the component of interest shows significant differ-ence in these two amplitude values at these two selectedwavelengths with respect to concentration.
Ratio difference method began with scanning the zero orderabsorption spectra of their laboratory-prepared mixtures (X, Yand Z).
For determination of X: the spectrum of the previous mixtureswas divided by the absorption spectrum of a binary mixture ofequal concentrations of Y and Z as follows:
ðX þ Y þ ZÞ=ðY þ ZÞ0 ¼ ½X=ðY þ ZÞ0� þ ½ðY þ ZÞ=ðY þ ZÞ0� ðconstantÞ
The difference in amplitude was calculated between theselected k1 and k2, so the constant [(Y + Z)/(Y + Z)0] will be can-celed. To optimize this method, it was necessary to test the influ-ence of the divisor and its concentration. The concentration of (X)can be calculated using the corresponding regression equationobtained by plotting the difference in the amplitudes at k1 andk2 of the ratio spectra of X/(Y + Z)0 against its corresponding con-centrations. By the same procedure we can get Y and Z by changingthe double divisor.
Experimental
Apparatus and software
Shimadzu – UV 1800 double beam UV–Visible spectrophotom-eter (Japan) with matched 1 cm quartz cells at 200–400 nm range
leate, (b) Pseudoephedrine HCl and (c) Ibuprofen.

A.A. Moustafa et al. / Spectrochimica Acta Part A: Molecular and Biomolecular Spectroscopy 137 (2015) 1363–1373 1365
was used for all absorbance measurements. Spectra were automat-ically obtained by Shimadzu UV-Probe 2.32 system software. ForMCR and chemometrics calculations, Matlab� Version 7.9 andPLS toolbox 2.0 were used.
Chemicals and solvents
Pure samplesChlorpheniramine maleate (CPM) and Pseudoephedrine HCl
(PSE) were kindly supplied by Egyptian International Pharmaceuti-cal Industries Co. (EIPICO), Cairo, Egypt; Ibuprofen (IBF) was kindlysupplied by GlaxoWellcome, Egypt; Their purity were found to be99.86 ± 0.67, 100.11 ± 0.39 and 100.05 ± 0.24 for CPM, PSE and IBFaccording to their official methods [35], respectively.
Market sampleSinlerg� coated tablets, each tablet is labeled to contain 2 mg of
CPM, 30 mg of PSE, 200 mg of IBF (Batch number: 212314), wasmanufactured by Eva Pharma for pharmaceuticals and medicalappliance S.A.E, Haram, Giza, Egypt.
SolventsSpectroscopic analytical grade methanol was supplied from
(S.d. fine-chem limited – Mumbai).
Standard solutions
Stock solutionsStock solution of concentration 1 mg/mL for CPM was prepared
using methanol as a solvent, Stock solutions of concentration 5 mg/mL for both PSE and IBF were prepared using methanol as asolvent.
Working solutionsFor univariate methods; the solutions were freshly prepared by
dilution from the stock solutions with the same solvent to obtain aconcentration of 0.4 mg/mL for CPM and 2 mg/mL for both PSE andIBF.
For multivariate analysis; working solutions were freshly pre-pared by dilution from the stock solutions with the same solventto obtain a concentration of 0.1, 1.0, 2.0 mg/mL for CPM, PSE andIBF, respectively.
Wavelength (nm)
Abs
orba
nce
Fig. 2. Zero order absorption spectra of 10,150, 1000 lg/mL of Chlorpheniraminemaleate (—), Pseudoephedrine HCl (— — —) and Ibuprofen (� � � �), respectively, usingmethanol as a blank.
Procedure
Univariate methodsSpectral characteristics and linearity. Aliquots of CPM (0.1–1.2 mg),PSE (1.0–10 mg) and IBF (1.0–11.0 mg) were separately transferredinto series of 10-mL volumetric flasks from their working solution(0.4 mg/mL) for CPM and (2 mg/mL) for PSE and IBF, the volumeswere completed with methanol. The absorption spectra werescanned for the prepared solutions at 200–400 nm and stored inthe computer.
Double divisor-ratio difference spectrophotometric method (DD-RD).The stored spectra of CPM were divided by the spectrum of a bin-ary mixture of IBF and PSE (100 lg/mL of each) as a double divisor(DD) and stored in the computer as ratio spectra. Calibration curvefor CPM was constructed by plotting the difference between theamplitudes of ratio spectra at 248 nm and 253.5 nm versus thecorresponding concentration and the regression equation wascomputed.
For the determination of PSE, the stored spectra of PSE weredivided by the spectrum of a binary mixture of CPM and IBF(100 lg/mL of each) and stored in the computer as ratio spectra.Calibration curve for PSE was constructed by plotting the differ-ence between the amplitudes of ratio spectra at 257 nm and260.5 nm versus the corresponding concentration and the regres-sion equation was computed.
For the determination of IBF, the stored spectra of IBF weredivided by the spectrum of a binary mixture of CPM and PSE(100 lg/mL of each) and stored in the computer as ratio spectra.Calibration curve for IBF was constructed by plotting the differencebetween the amplitudes of ratio spectra at 254 nm and 264 nmversus the corresponding concentration and the regression equa-tion was computed.
Double divisor-derivative ratio spectrophotometric method (DD-DR).In this method, to determine drug X, the stored spectra of the mix-ture of X, Y and Z were divided by the sum of the spectra of Y and Z(have equal concentrations) as ‘double divisor’ and their ratio spec-tra were obtained [19]. Derivatives of the ratio spectra are plotted.At the results of the above mentioned procedure, calibration curveis plotted between the coincident amplitudes in a maximum orminimum point of the wavelength and the correspondingconcentration.
A mixture of PSE and IBF (100 lg/mL of each) was selected fordetermination of CPM. While a mixture of CPM and IBF (100 lg/mL of each) and a mixture of CPM and PSE (100 lg/mL of each)were chosen for determination of PSE and IBF, respectively.
For the determination of CPM and PSE, the selected double divi-sor for each drug was used, third derivative of the ratio spectra ofpure CPM and PSE and their ternary mixture were obtained atDk = 10 and scaling factor = 100 for CPM and Dk = 5 and scalingfactor = 100 for PSE. The amplitude at 263 and 247 nm are selectedfor the measurement of CPM and PSE, respectively.
For the determination of IBF, the second derivative of the ratiospectrum were obtained at Dk = 5 and scaling factor = 10 by usingits selected double divisor. The amplitude of the second derivativeof the ratio spectra was measured at 242.5 nm.
Linear correlations were obtained between peak amplitudes atthe selected wavelengths and the corresponding concentrationsand the regression equation was computed.
Derivative ratio spectrum-zero crossing method (DRZC). By using IBF(200 lg/mL) as a divisor, the amounts of CPM and PSE were deter-mined by measuring the third derivative ratio amplitudes at282.5 nm (zero-crossing point for PSE) and 267 nm (zero-crossingpoint for CPM), respectively.
1366 A.A. Moustafa et al. / Spectrochimica Acta Part A: Molecular and Biomolecular Spectroscopy 137 (2015) 1363–1373
For the determination of IBF, CPM (60 lg/mL) used as a divisor;the amount of IBF was determined by measuring the third deriva-tive ratio amplitudes at 265.5 nm (zero-crossing point for PSE).
Calibration curves were obtained by measuring the derivativeratio amplitudes against the corresponding concentrations ofCPM, PSE and IBF.
Mean centering of ratio spectra (MCR). For the determination ofCPM and PSE, the stored scanned spectra of CPM, PSE and IBF(230–300 nm) were exported to Matlab� for subsequent calcula-tion. The spectra of CPM and PSE were divided by the spectrumof 200 lg/mL IBF, the obtained ratio spectra (CPM/IBF) and (PSE/IBF) were mean centered and then the mean centered ratio spectradivided by mean centered ratio of PSE/IBF (200/200 lg/mL) andCPM/IBF (60/200 lg/mL), respectively, which were then meancentered.
For the determination of IBF, the stored scanned spectra of IBFand PSE were exported to Matlab� for subsequent calculation.The spectra of IBF were divided by the spectrum of 200 lg/mLPSE, the obtained ratio spectra were mean centered and then themean centered ratio spectra divided by mean centered ratio ofCPM/PSE which were then mean centered.
The calibration curves for CPM, PSE and IBF were constructed byplotting the mean centered values at 270.5, 257 and 272.5 nm,respectively, versus the corresponding concentration and theregression equations were computed.
Analysis of laboratory-prepared mixtures. Into a series of 10-mLvolumetric flasks, aliquots of CPM, PSE and IBF were transferredfrom their corresponding standard working solutions (400 lg/mL) for CPM and the working solutions of (2000 lg/mL) for eachof PSE and IBF, the volume was completed with methanol. Thatprepares mixtures containing different ratios of the three drugs.The absorption spectra of laboratory prepared mixtures werescanned and stored. Then procedures for different methods wereperformed as described in linearity. The concentrations of CPM,PSE and IBF were calculated by substituting in the correspondingregression equations.
Application to pharmaceutical preparation. Ten Sinlerg� tablets[each tablet labeled to contain 2 mg of CPM, 30 mg of PSE,200 mg of IBF] were accurately weighted powdered and mixedwell. An amount of the powdered tablet equivalent to one tabletwas accurately weighed and transferred into a beaker, extract with(3 � 10) mL methanol and sonicated for 60 min (for each extrac-tion). The solution was filtered into a 50-mL volumetric flask andcompleted to volume with methanol. Three different solutionswere prepared from the previous prepared tablet solution havingthe concentrations of (20, 300 and 2000 lg/mL of CPM, PSE andIBF) for CPM, (10, 150 and 1000 lg/mL of CPM, PSE and IBF) forPSE and (4, 60 and 400 lg/mL of CPM, PSE and IBF) for IBF. Forassessment of the accuracy of the method, standard addition tech-nique was also applied.
Multivariate methodsConstruction of the PCR and PLS calibration models. A five level, threefactor calibration design [36] was applied using five concentrationlevels coded from +2 to �2 for each of the three components to beanalyzed.
A calibration set of seventeen different laboratory-preparedmixtures of CPM, PSE and IBF in different ratios was prepared bytransferring different aliquots from the working standard solutionof 100, 1000 and 2000 lg/mL for CPM, PSE and IBF, respectively,into 10-mL volumetric flasks and the volumes were completedwith methanol. The absorption spectra of the prepared mixtureswere recorded in the range of 235–300 nm at 1 nm intervals with
respect to a blank of methanol. The recorded spectra were thentransferred to Matlab� for subsequent data analysis and thecalibration models (PCR, PLS) were constructed.
Assay of external validation set. Eight laboratory-prepared mixturescontaining different ratios of CPM, PSE and IBF were recorded inthe range of 235–300 nm were chosen to be used as an externalvalidation set. The concentrations of CPM, PSE and IBF were calcu-lated using the optimized PCR and PLS calibration models.
Results and discussion
In this work a comparative study of different univariate spectro-photometric methods manipulating ratio spectra versus chemo-metric methods has been introduced for determination of ternarymixture with extremely overlapped spectra. The proposed meth-ods were found to simple, accurate, reproducible, and selectivefor simultaneous estimation of CPM, PSE and IBF in pure formand in pharmaceutical preparation.
The absorption spectra of the three compounds, CPM, PSE andIBF overlapped closely in the region 200–300 nm in Fig. 2. For thisreason, the determination of the above compounds was not possi-ble from direct measurements of absorbance in the zero-orderspectra. On the other hand, also the classical derivative spectro-photometric method was tested (from first to fourth) for simulta-neous determination of CPM, PSE and IBF.
Univariate methods
Double divisor-ratio difference spectrophotometric method (DD-RD)This is a developed method having the ability for solving
severely overlapped spectra without prior separation mean whileit does not require any sophisticated apparatus or computer pro-grams [23]. For the determination of concentration of componentof interest by the DD-RD method, the only requirement is the con-tribution of the three components at the two selected wavelengthsk1 and k2 where the ratio spectrum of the interfering componentsshows the same amplitudes (constant) whereas the component ofinterest shows significant difference in these two amplitude valuesat these two selected wavelengths with respect to concentration[34]. The overlapped spectra of the cited components suggestedthat the DD-RD method was a suitable method for the determina-tion of CPM, PSE and IBF in presence of each other.
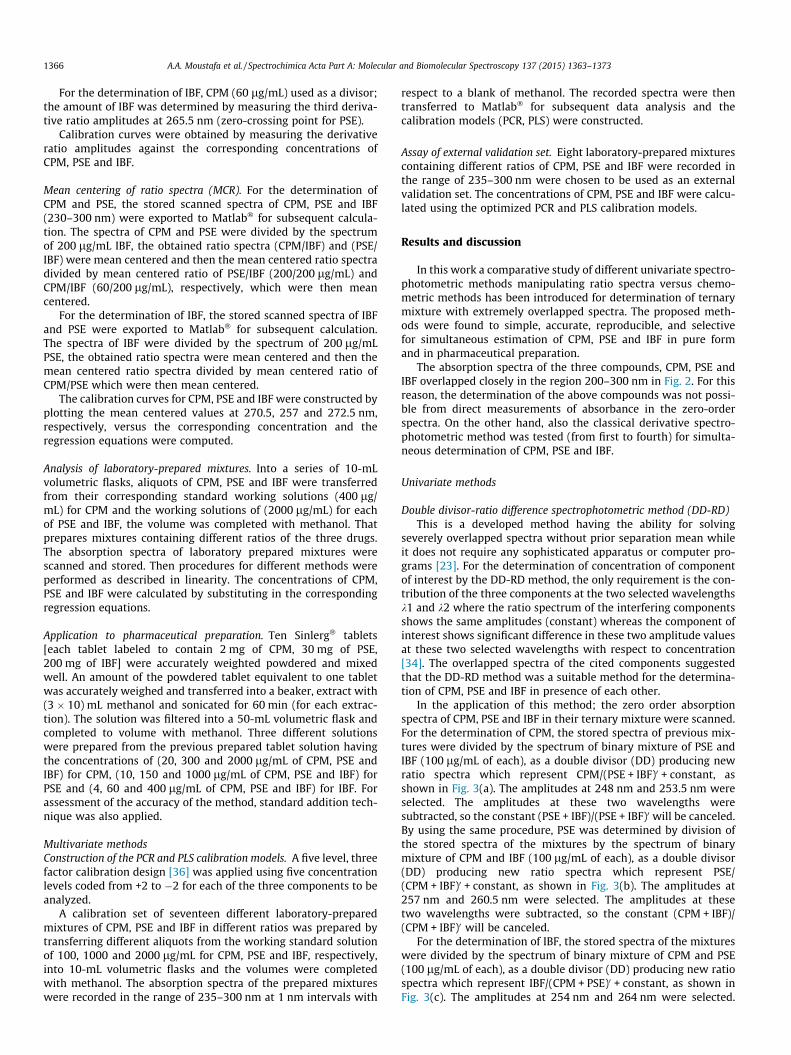
In the application of this method; the zero order absorptionspectra of CPM, PSE and IBF in their ternary mixture were scanned.For the determination of CPM, the stored spectra of previous mix-tures were divided by the spectrum of binary mixture of PSE andIBF (100 lg/mL of each), as a double divisor (DD) producing newratio spectra which represent CPM/(PSE + IBF)0 + constant, asshown in Fig. 3(a). The amplitudes at 248 nm and 253.5 nm wereselected. The amplitudes at these two wavelengths weresubtracted, so the constant (PSE + IBF)/(PSE + IBF)0 will be canceled.By using the same procedure, PSE was determined by division ofthe stored spectra of the mixtures by the spectrum of binarymixture of CPM and IBF (100 lg/mL of each), as a double divisor(DD) producing new ratio spectra which represent PSE/(CPM + IBF)0 + constant, as shown in Fig. 3(b). The amplitudes at257 nm and 260.5 nm were selected. The amplitudes at thesetwo wavelengths were subtracted, so the constant (CPM + IBF)/(CPM + IBF)0 will be canceled.
For the determination of IBF, the stored spectra of the mixtureswere divided by the spectrum of binary mixture of CPM and PSE(100 lg/mL of each), as a double divisor (DD) producing new ratiospectra which represent IBF/(CPM + PSE)0 + constant, as shown inFig. 3(c). The amplitudes at 254 nm and 264 nm were selected.
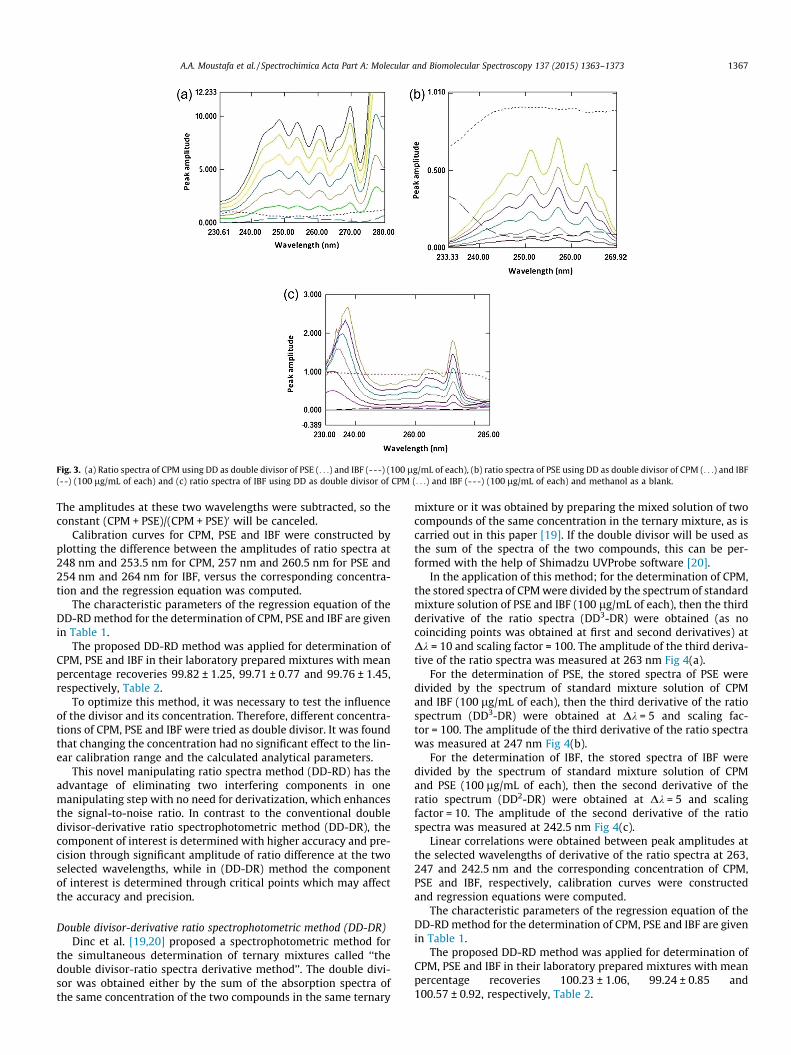
Fig. 3. (a) Ratio spectra of CPM using DD as double divisor of PSE (. . .) and IBF (---) (100 lg/mL of each), (b) ratio spectra of PSE using DD as double divisor of CPM (. . .) and IBF(--) (100 lg/mL of each) and (c) ratio spectra of IBF using DD as double divisor of CPM (. . .) and IBF (---) (100 lg/mL of each) and methanol as a blank.
A.A. Moustafa et al. / Spectrochimica Acta Part A: Molecular and Biomolecular Spectroscopy 137 (2015) 1363–1373 1367
The amplitudes at these two wavelengths were subtracted, so theconstant (CPM + PSE)/(CPM + PSE)0 will be canceled.
Calibration curves for CPM, PSE and IBF were constructed byplotting the difference between the amplitudes of ratio spectra at248 nm and 253.5 nm for CPM, 257 nm and 260.5 nm for PSE and254 nm and 264 nm for IBF, versus the corresponding concentra-tion and the regression equation was computed.
The characteristic parameters of the regression equation of theDD-RD method for the determination of CPM, PSE and IBF are givenin Table 1.
The proposed DD-RD method was applied for determination ofCPM, PSE and IBF in their laboratory prepared mixtures with meanpercentage recoveries 99.82 ± 1.25, 99.71 ± 0.77 and 99.76 ± 1.45,respectively, Table 2.
To optimize this method, it was necessary to test the influenceof the divisor and its concentration. Therefore, different concentra-tions of CPM, PSE and IBF were tried as double divisor. It was foundthat changing the concentration had no significant effect to the lin-ear calibration range and the calculated analytical parameters.
This novel manipulating ratio spectra method (DD-RD) has theadvantage of eliminating two interfering components in onemanipulating step with no need for derivatization, which enhancesthe signal-to-noise ratio. In contrast to the conventional doubledivisor-derivative ratio spectrophotometric method (DD-DR), thecomponent of interest is determined with higher accuracy and pre-cision through significant amplitude of ratio difference at the twoselected wavelengths, while in (DD-DR) method the componentof interest is determined through critical points which may affectthe accuracy and precision.
Double divisor-derivative ratio spectrophotometric method (DD-DR)Dinc et al. [19,20] proposed a spectrophotometric method for
the simultaneous determination of ternary mixtures called ‘‘thedouble divisor-ratio spectra derivative method’’. The double divi-sor was obtained either by the sum of the absorption spectra ofthe same concentration of the two compounds in the same ternary
mixture or it was obtained by preparing the mixed solution of twocompounds of the same concentration in the ternary mixture, as iscarried out in this paper [19]. If the double divisor will be used asthe sum of the spectra of the two compounds, this can be per-formed with the help of Shimadzu UVProbe software [20].
In the application of this method; for the determination of CPM,the stored spectra of CPM were divided by the spectrum of standardmixture solution of PSE and IBF (100 lg/mL of each), then the thirdderivative of the ratio spectra (DD3-DR) were obtained (as nocoinciding points was obtained at first and second derivatives) atDk = 10 and scaling factor = 100. The amplitude of the third deriva-tive of the ratio spectra was measured at 263 nm Fig 4(a).
For the determination of PSE, the stored spectra of PSE weredivided by the spectrum of standard mixture solution of CPMand IBF (100 lg/mL of each), then the third derivative of the ratiospectrum (DD3-DR) were obtained at Dk = 5 and scaling fac-tor = 100. The amplitude of the third derivative of the ratio spectrawas measured at 247 nm Fig 4(b).
For the determination of IBF, the stored spectra of IBF weredivided by the spectrum of standard mixture solution of CPMand PSE (100 lg/mL of each), then the second derivative of theratio spectrum (DD2-DR) were obtained at Dk = 5 and scalingfactor = 10. The amplitude of the second derivative of the ratiospectra was measured at 242.5 nm Fig 4(c).
Linear correlations were obtained between peak amplitudes atthe selected wavelengths of derivative of the ratio spectra at 263,247 and 242.5 nm and the corresponding concentration of CPM,PSE and IBF, respectively, calibration curves were constructedand regression equations were computed.
The characteristic parameters of the regression equation of theDD-RD method for the determination of CPM, PSE and IBF are givenin Table 1.
The proposed DD-RD method was applied for determination ofCPM, PSE and IBF in their laboratory prepared mixtures with meanpercentage recoveries 100.23 ± 1.06, 99.24 ± 0.85 and100.57 ± 0.92, respectively, Table 2.
Tabl
e1
Resu
lts
ofre
gres
sion
and
valid
atio
npa
ram
eter
sof
the
prop
osed
spec
trop
hoto
met
ric
met
hods
for
the
dete
rmin
atio
nof
CPM
,PSE
and
IBF.
Val
idat
ion
para
met
ers
DD
-RD
DD
-DR
RSZ
DM
CR
CPM
PSE
IBF
CPM
PSE
IBF
CPM
PSE
IBF
CPM
PSE
IBF
Lin
eari
tyra
nge
( lg/
mL)
10–1
2010
0–10
0010
0–11
0010
–120
100–
1000
100–
1100
10–1
2010
0–10
0010
0–11
0010
–120
100–
1000
100–
1100
Slop
e�
0.02
520.
0002
0.00
040.
0031
0.00
120.
0006
0.05
50.
0009
0.00
112.
913
0.00
150.
0056
SEsl
ope
2.60
6�
10�
58.
916�
10�
73.
165�
10�
62.
56�
10�
58.
305�
10�
54.
64�
10�
60.
0004
3.73
7�
10�
67.
988
x10�
60.
0325
1.57
3x1
0�5
3.86
4x1
0�5
Inte
rcep
t0.
0029
0.00
220.
0112
0.02
15�
0.00
81�
0.00
030.
1035
0.01
190.
0258
8.43
1�
0.03
97�
0.14
66SE
inte
rcep
t0.
0020
0.00
050.
0020
0.00
210.
0050
0.00
290.
0340
0.00
230.
0051
2.52
20.
0095
0.02
45C
orre
lati
onco
effi
cien
t(r
)0.
9998
11
0.99
990.
9999
0.99
990.
9999
0.99
990.
9999
0.99
980.
9998
0.99
99SE
ofre
sidu
als
0.00
230.
0007
0.00
270.
0023
0.00
650.
0039
0.03
940.
0029
0.00
672.
923
0.01
230.
0326
LOD
( lg/
mL)
2.62
15.9
22.
202.
4517
.88
21.4
52.
3610
.63
20.1
01.
144
27.0
619
.21
LOQ
( lg/
mL)
7.93
48.2
56.
687.
4254
.17
65.0
07.
1632
.22
60.9
13.
4782
.00
58.2
1A
ccu
racy
(mea
n±
SD)
101.
23±
0.34
100.
29±
0.77
100.
08±
1.23
100.
47±
1.01
100.
72±
0.99
100.
85±
0.63
100.
23±
1.48
99.7
6±
0.42
99.9
1±
1.16
100.
89±
1.31
99.8
9±
1.36
100.
73±
1.49
Prec
isio
n(R
SD,%
)In
tra-
day
0.23
80.
337
0.13
20.
347
0.15
30.
413
0.26
10.
376
0.25
50.
322
0.12
60.
411
Inte
r-da
y0.
856
0.94
50.
891
0.92
60.
959
0.98
80.
909
0.84
61.
024
0.84
90.
898
0.97
1
1368 A.A. Moustafa et al. / Spectrochimica Acta Part A: Molecular and Biomolecular Spectroscopy 137 (2015) 1363–1373
To optimize this method, it was necessary to test the influenceof variables:
(a) The divisor and its concentration [19,37]: different concen-trations of CPM, PSE and IBF were tried as double divisor.It was found that changing the concentration had no signif-icant effect on the linear calibration range and the calculatedanalytical parameters.
(b) Different Dk values were tried where selected Dk showed asuitable signal to noise ratio and the spectra showed goodresolution.
(c) Different scaling factor values were tried where selectedscaling factor was suitable to enlarge the signal of drug tofacilitate its measurement and to diminish errors in readingsignal.
The disadvantage of this manipulating ratio spectra method isthe probability of the occurrence of the coinciding points of thepure compound and its ternary mixture in critical points awayfrom the maximum or minimum amplitude points, as in case ofCPM, which may affect the precision and robustness of theobtained results.
Derivative ratio spectrum-zero crossing method (DRZC)Nevado et al. [17], developed a method for the resolution of ter-
nary mixtures of compounds by the derivative ratio spectra-zerocrossing method. In the method, the simultaneous determinationof three compounds in ternary mixtures are realized by the mea-surements of the amplitude at the zero-crossing points in thederivative spectrum of the ratio spectra.
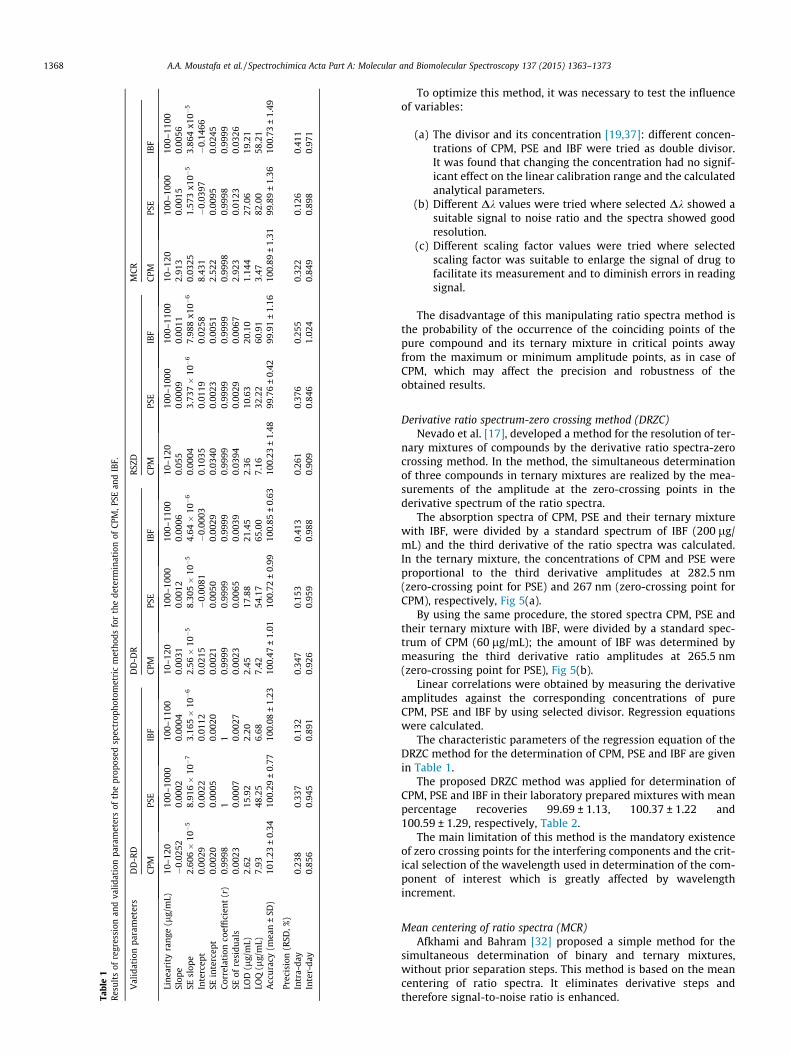
The absorption spectra of CPM, PSE and their ternary mixturewith IBF, were divided by a standard spectrum of IBF (200 lg/mL) and the third derivative of the ratio spectra was calculated.In the ternary mixture, the concentrations of CPM and PSE wereproportional to the third derivative amplitudes at 282.5 nm(zero-crossing point for PSE) and 267 nm (zero-crossing point forCPM), respectively, Fig 5(a).
By using the same procedure, the stored spectra CPM, PSE andtheir ternary mixture with IBF, were divided by a standard spec-trum of CPM (60 lg/mL); the amount of IBF was determined bymeasuring the third derivative ratio amplitudes at 265.5 nm(zero-crossing point for PSE), Fig 5(b).
Linear correlations were obtained by measuring the derivativeamplitudes against the corresponding concentrations of pureCPM, PSE and IBF by using selected divisor. Regression equationswere calculated.
The characteristic parameters of the regression equation of theDRZC method for the determination of CPM, PSE and IBF are givenin Table 1.
The proposed DRZC method was applied for determination ofCPM, PSE and IBF in their laboratory prepared mixtures with meanpercentage recoveries 99.69 ± 1.13, 100.37 ± 1.22 and100.59 ± 1.29, respectively, Table 2.
The main limitation of this method is the mandatory existenceof zero crossing points for the interfering components and the crit-ical selection of the wavelength used in determination of the com-ponent of interest which is greatly affected by wavelengthincrement.
Mean centering of ratio spectra (MCR)Afkhami and Bahram [32] proposed a simple method for the
simultaneous determination of binary and ternary mixtures,without prior separation steps. This method is based on the meancentering of ratio spectra. It eliminates derivative steps andtherefore signal-to-noise ratio is enhanced.

Table 2Result obtained for the determination of CPM, PSE and IBF in laboratory prepared mixtures by the proposed spectrophotometric methods.
Concentration (lg/ml) Recoverya (%)
DD-RD DD-DR RSZD MCR
CPM PSE IBF CPM PSE IBF CPM PSE IBF CPM PSE IBF CPM PSE IBF
10b 150b 1000b 100.69 99.33 98.3 101.61 98.94 101.72 99.18 100.07 98.47 99.48 101.78 100.7920 200 600 98.62 99.5 100.08 100.81 100.04 101.19 98.86 98.94 101.85 101.42 98.81 100.5740 400 1100 98.45 101 101.64 99.59 100.44 100.05 98.61 101.97 101.17 98.84 100.13 99.96
100 100 100 100.07 99 100.5 98.87 98.42 100.5 100.88 101.22 101.09 100.77 100.55 100.5460 300 1000 101.26 99.67 98.3 100.27 98.36 99.38 100.95 99.67 100.38 100.64 101.07 98.83
Mean 99.82 99.71 99.76 100.23 99.24 100.57 99.69 100.37 100.59 100.23 100.47 100.14±SD 1.25 0.77 1.45 1.06 0.85 0.92 1.13 1.22 1.29 1.04 1.11 0.79
a Average of three determinations.b Ratio of CPM, PSE and IBF in Sinlerg� tablets.
263 nm
242.5 nm
247 nm
(a) (b)
(c)
Fig. 4. (a) The third derivative of the ratio spectra of CPM using PSE and IBF (100 lg/mL of each) as double divisor and methanol as a blank, (b) the third derivative of the ratiospectra of PSE using CPM and IBF (100 lg/mL of each) as double divisor and methanol as a blank and (c) the second derivative of the ratio spectra of IBF using CPM and PSE(100 lg/mL of each) as double divisor and methanol as a blank.
A.A. Moustafa et al. / Spectrochimica Acta Part A: Molecular and Biomolecular Spectroscopy 137 (2015) 1363–1373 1369
The absorption spectra of the prepared solutions of CPM, PSEand IBF were exported to Matlab� for subsequent calculation. Fordetermination of CPM, the recorded spectra were divided by thespectrum of 200 lg/mL IBF to obtain the first ratio spectra whichwas then mean centered. These vectors were then divided by themean centered ratio of (PSE/IBF) and then mean centering of thesecond ratio spectra were then obtained, Fig. 6(a). By the sameway, the recorded spectra of PSE were divided by the spectrumof 200 lg/mL IBF and the obtained ratio spectra were mean cen-tered, these vectors (mean centered ratio spectra) were dividedby the mean centered ratio of (CPM/IBF) to obtain the second ratiospectra which were then mean centered, Fig. 6(b). For IBF, thescanned spectra of its prepared solutions were divided by standardspectrum of 200 lg/mL PSE and the obtained ratio spectra weremean centered, Fig. 6(c). These vectors were divided by the meancentered ratio of (CPM/PSE) and the second ratio spectra were thenmean centered.
The mean centered values of the second ratio spectra at270.5 nm for CPM, 257 nm for PSE and 272.5 nm for IBF,were measured and plotted against the corresponding concentra-tion of each drug to construct their respective calibrationequations.
The characteristic parameters of the regression equation of theMCR method for the determination of CPM, PSE and IBF are givenin Table 1.
The proposed MCR method was applied for determination ofCPM, PSE and IBF in their laboratory prepared mixtures with meanpercentage recoveries 100.23 ± 1.04, 100.47 ± 1.11 and100.14 ± 0.79, respectively, Table 2.
This manipulating ratio spectra method can be applied forresolving ternary mixtures with no limitations other than the con-tribution of the three components at the selected wavelengths. Theadvantage of this method is the elimination of derivative steps andtherefore signal-to-noise ratio is enhanced.
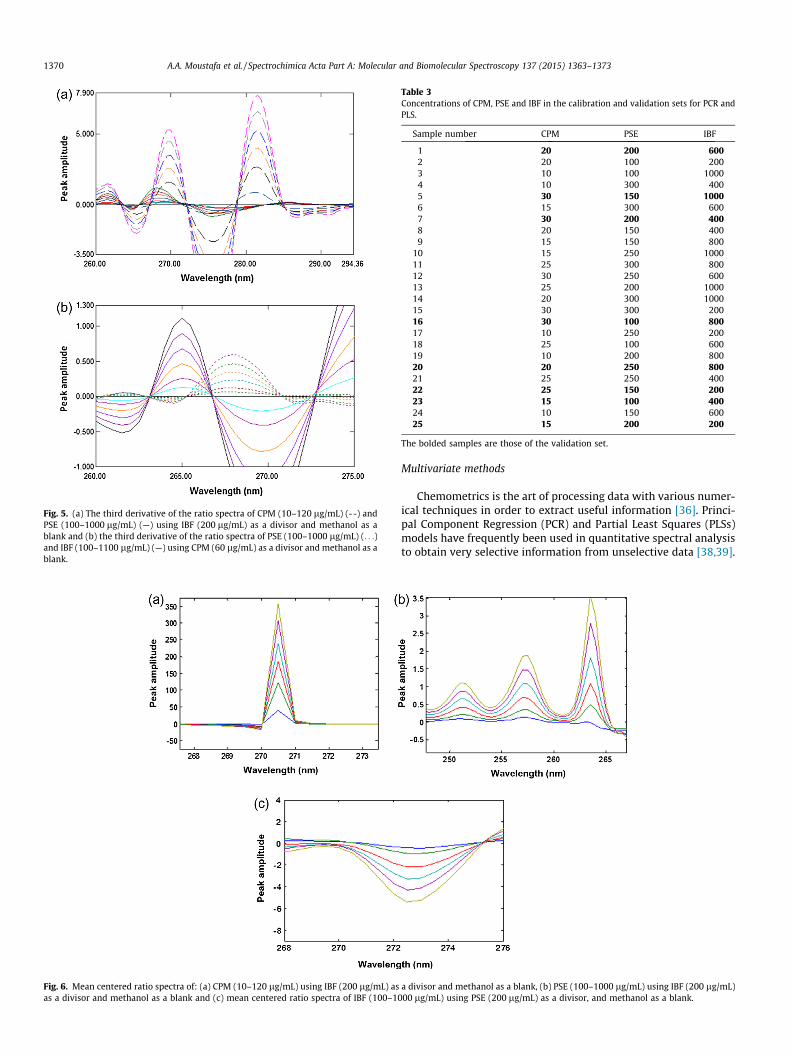
Fig. 5. (a) The third derivative of the ratio spectra of CPM (10–120 lg/mL) (--) andPSE (100–1000 lg/mL) (—) using IBF (200 lg/mL) as a divisor and methanol as ablank and (b) the third derivative of the ratio spectra of PSE (100–1000 lg/mL) (. . .)and IBF (100–1100 lg/mL) (—) using CPM (60 lg/mL) as a divisor and methanol as ablank.
Fig. 6. Mean centered ratio spectra of: (a) CPM (10–120 lg/mL) using IBF (200 lg/mL) asas a divisor and methanol as a blank and (c) mean centered ratio spectra of IBF (100–10
Table 3Concentrations of CPM, PSE and IBF in the calibration and validation sets for PCR andPLS.
Sample number CPM PSE IBF
1 20 200 6002 20 100 2003 10 100 10004 10 300 4005 30 150 10006 15 300 6007 30 200 4008 20 150 4009 15 150 800
10 15 250 100011 25 300 80012 30 250 60013 25 200 100014 20 300 100015 30 300 20016 30 100 80017 10 250 20018 25 100 60019 10 200 80020 20 250 80021 25 250 40022 25 150 20023 15 100 40024 10 150 60025 15 200 200
The bolded samples are those of the validation set.
1370 A.A. Moustafa et al. / Spectrochimica Acta Part A: Molecular and Biomolecular Spectroscopy 137 (2015) 1363–1373
Multivariate methods
Chemometrics is the art of processing data with various numer-ical techniques in order to extract useful information [36]. Princi-pal Component Regression (PCR) and Partial Least Squares (PLSs)models have frequently been used in quantitative spectral analysisto obtain very selective information from unselective data [38,39].
a divisor and methanol as a blank, (b) PSE (100–1000 lg/mL) using IBF (200 lg/mL)00 lg/mL) using PSE (200 lg/mL) as a divisor, and methanol as a blank.

A.A. Moustafa et al. / Spectrochimica Acta Part A: Molecular and Biomolecular Spectroscopy 137 (2015) 1363–1373 1371
Due to the overlapped spectra of cited drugs, Fig. 1, the previouschemometric methods have been used to analyze this ternary mix-ture. The concentrations details are given in Table 3. Wavelengthsless than 230 nm were rejected due to the noisy content. An appro-priate choice of the number of principal components or factors isnecessary for PCR and PLS calibrations. The number of factorsshould account as much as possible for the experimental datawithout resulting in over fitting. Various criteria have been devel-oped to select the optimum number [41]. Cross-validation meth-ods leaving out one sample at a time was employed [41].
In order to build the PCR and PLS models, the raw data of thecalibration samples were mean centered [42] as a pre-processingstep and the ‘random subsets’ cross-validation method was used[43]. The optimum number of factors was selected by followingthe criterion of Haaland and Thomas [44].
The predicted concentrations were compared with the knownconcentrations of the compounds in each calibration sample. The
Fig. 7. Root mean square error of validation (RMSECV) plot of the cross validation resuconstruct the (a) PCR and (b) PLS calibration.
Table 4Percentage recoveries of CPM, PSE and IBF in the validation set using PCR and PLS models
Sample no. CPM PSE
Conc. (lg/mL) Recovery (%) Conc. (lg/mL)
PCR PLS
1 20 101.67 100.85 2002 30 99.50 99.96 1503 30 99.46 99.84 2004 30 99.73 101.19 1005 20 98.09 98.52 2506 25 99.26 100.17 1507 15 100.37 99.89 1008 15 100.52 100.14 200
Mean 99.83 100.07RMSEP 0.0746 0.0623
Table 5Summary of results obtained by applying the diagnostic tools for model validation of PCR
Validation parameters predicted versus known conc. plot: CPM
PCR
1-Slope 0.98652-SE slope 0.01243-Intercept 0.24964-SE intercept 0.29525-Correlation coefficient (r) 0.99956-SE of regression 0.2155
root mean squares error of cross-validation (RMSECV) was calcu-lated for each method for examining the errors in the predictedconcentrations. The selected model was that with the smallestnumber of factors such that RMSECV for that model was not signif-icantly greater than RMSECV from the model with additional fac-tor. A number of factors were found to be optimum for themixture of CPM, PSE and IBF using PLS and PCR, Fig. 7(a) and (b).
In order to assess the predictive ability of each of the developedmodels, it was applied on an external validation set for determina-tion of the three components. The recoveries, mean recoveries andRMSEP [45] are summarized in Table 4.
The validation of the developed PCR and PLS models wasassessed using several diagnostic tools. The predicted concentra-tions of the validation samples were plotted against the true con-centration values. This was used to determine whether themodel accounted for the concentration variation in the validationset. All plots had a slope of nearly one and an intercept close to
lts of the training set as a function of the number of principal components used to
.
IBF
Recovery (%) Conc. (lg/mL) Recovery (%)
PCR PLS PCR PLS
98.71 99.31 600 102.74 100.9299.57 101.04 1000 99.54 99.88
101.12 99.23 400 99.53 99.40100.34 98.99 800 98.89 98.48101.06 99.37 800 98.67 100.86
99.85 100.95 200 101.75 98.1598.78 100.45 400 100.73 99.06
101.03 99.43 200 99.618 98.97
100.06 99.85 100.18 99.470.6247 0.4048 2.8193 2.0334
and PLS chemometric methods.
PSE IBF
PLS PCR PLS PCR PLS
1.0080 1.0180 0.9862 0.9883 1.00200.0112 0.0124 0.0086 0.0106 0.0081�0.1648 �2.641 1.930 5.949 �2.829
0.2668 2.173 1.512 6.564 4.9610.9996 0.9996 0.9998 0.9997 0.99980.1906 1.7023 1.2224 1.4808 1.3215
1372 A.A. Moustafa et al. / Spectrochimica Acta Part A: Molecular and Biomolecular Spectroscopy 137 (2015) 1363–1373
zero. The results in Table 5 indicate the high predictive abilities ofthe two models.
Method validation
Validation was done according to ICH recommendations [46].Linearity, accuracy, selectivity, range and precision (repeatabilityand intermediate precision) were determined. Satisfactory resultswere obtained within global validation reference values as follows:
Range and linearity
The linearity of the proposed methods was evaluated by pro-cessing the different calibration curves on three different days.The calibration curves were constructed within concentrationranges that were selected on the basis of the drugs concentrationduring the assay of the dosage form. The corresponding concentra-
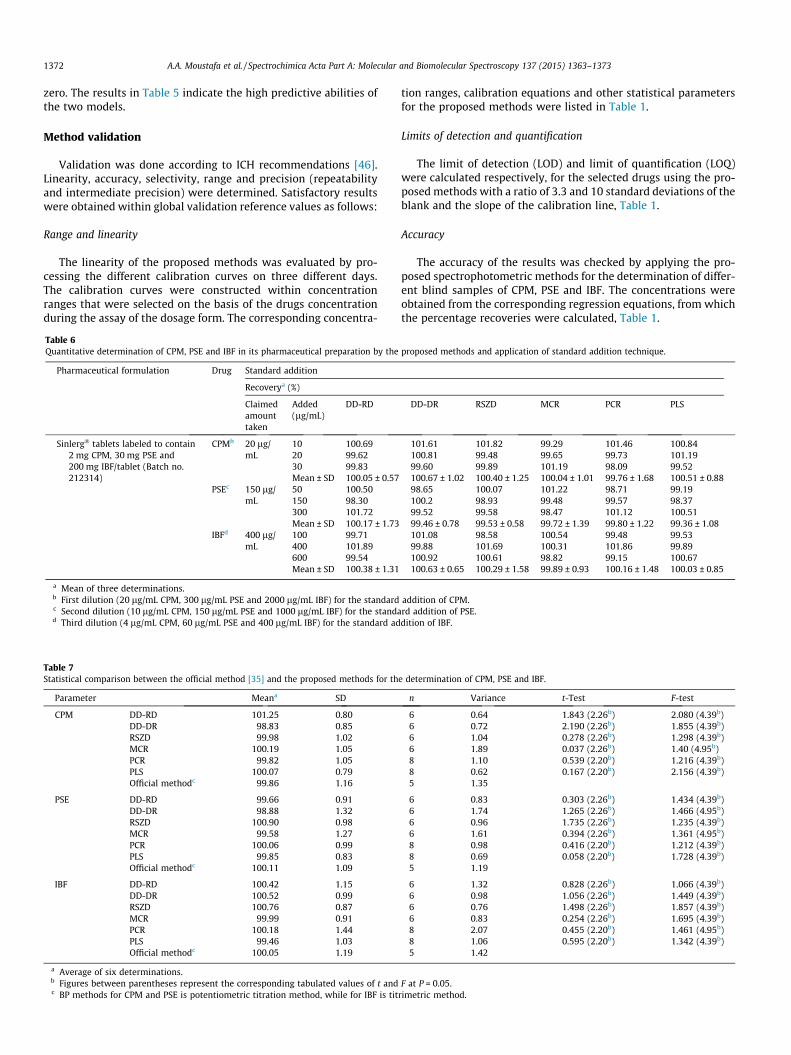
Table 6Quantitative determination of CPM, PSE and IBF in its pharmaceutical preparation by the
Pharmaceutical formulation Drug Standard addition
Recoverya (%)
Claimedamounttaken
Added(lg/mL)
DD-RD
Sinlerg� tablets labeled to contain2 mg CPM, 30 mg PSE and200 mg IBF/tablet (Batch no.212314)
CPMb 20 lg/mL
10 100.6920 99.6230 99.83Mean ± SD 100.05 ± 0.57
PSEc 150 lg/mL
50 100.50150 98.30300 101.72Mean ± SD 100.17 ± 1.73
IBFd 400 lg/mL
100 99.71400 101.89600 99.54Mean ± SD 100.38 ± 1.31
a Mean of three determinations.b First dilution (20 lg/mL CPM, 300 lg/mL PSE and 2000 lg/mL IBF) for the standardc Second dilution (10 lg/mL CPM, 150 lg/mL PSE and 1000 lg/mL IBF) for the standad Third dilution (4 lg/mL CPM, 60 lg/mL PSE and 400 lg/mL IBF) for the standard ad
Table 7Statistical comparison between the official method [35] and the proposed methods for th
Parameter Meana SD
CPM DD-RD 101.25 0.80DD-DR 98.83 0.85RSZD 99.98 1.02MCR 100.19 1.05PCR 99.82 1.05PLS 100.07 0.79Official methodc 99.86 1.16
PSE DD-RD 99.66 0.91DD-DR 98.88 1.32RSZD 100.90 0.98MCR 99.58 1.27PCR 100.06 0.99PLS 99.85 0.83Official methodc 100.11 1.09
IBF DD-RD 100.42 1.15DD-DR 100.52 0.99RSZD 100.76 0.87MCR 99.99 0.91PCR 100.18 1.44PLS 99.46 1.03Official methodc 100.05 1.19
a Average of six determinations.b Figures between parentheses represent the corresponding tabulated values of t andc BP methods for CPM and PSE is potentiometric titration method, while for IBF is tit
tion ranges, calibration equations and other statistical parametersfor the proposed methods were listed in Table 1.
Limits of detection and quantification
The limit of detection (LOD) and limit of quantification (LOQ)were calculated respectively, for the selected drugs using the pro-posed methods with a ratio of 3.3 and 10 standard deviations of theblank and the slope of the calibration line, Table 1.
Accuracy
The accuracy of the results was checked by applying the pro-posed spectrophotometric methods for the determination of differ-ent blind samples of CPM, PSE and IBF. The concentrations wereobtained from the corresponding regression equations, from whichthe percentage recoveries were calculated, Table 1.
proposed methods and application of standard addition technique.
DD-DR RSZD MCR PCR PLS
101.61 101.82 99.29 101.46 100.84100.81 99.48 99.65 99.73 101.1999.60 99.89 101.19 98.09 99.52100.67 ± 1.02 100.40 ± 1.25 100.04 ± 1.01 99.76 ± 1.68 100.51 ± 0.8898.65 100.07 101.22 98.71 99.19100.2 98.93 99.48 99.57 98.3799.52 99.58 98.47 101.12 100.5199.46 ± 0.78 99.53 ± 0.58 99.72 ± 1.39 99.80 ± 1.22 99.36 ± 1.08101.08 98.58 100.54 99.48 99.5399.88 101.69 100.31 101.86 99.89100.92 100.61 98.82 99.15 100.67100.63 ± 0.65 100.29 ± 1.58 99.89 ± 0.93 100.16 ± 1.48 100.03 ± 0.85
addition of CPM.rd addition of PSE.dition of IBF.
e determination of CPM, PSE and IBF.
n Variance t-Test F-test
6 0.64 1.843 (2.26b) 2.080 (4.39b)6 0.72 2.190 (2.26b) 1.855 (4.39b)6 1.04 0.278 (2.26b) 1.298 (4.39b)6 1.89 0.037 (2.26b) 1.40 (4.95b)8 1.10 0.539 (2.20b) 1.216 (4.39b)8 0.62 0.167 (2.20b) 2.156 (4.39b)5 1.35
6 0.83 0.303 (2.26b) 1.434 (4.39b)6 1.74 1.265 (2.26b) 1.466 (4.95b)6 0.96 1.735 (2.26b) 1.235 (4.39b)6 1.61 0.394 (2.26b) 1.361 (4.95b)8 0.98 0.416 (2.20b) 1.212 (4.39b)8 0.69 0.058 (2.20b) 1.728 (4.39b)5 1.19
6 1.32 0.828 (2.26b) 1.066 (4.39b)6 0.98 1.056 (2.26b) 1.449 (4.39b)6 0.76 1.498 (2.26b) 1.857 (4.39b)6 0.83 0.254 (2.26b) 1.695 (4.39b)8 2.07 0.455 (2.20b) 1.461 (4.95b)8 1.06 0.595 (2.20b) 1.342 (4.39b)5 1.42
F at P = 0.05.rimetric method.

A.A. Moustafa et al. / Spectrochimica Acta Part A: Molecular and Biomolecular Spectroscopy 137 (2015) 1363–1373 1373
Accuracy of the method was further assured by the use of thestandard addition technique, it was performed by the addition ofknown amounts of pure CPM, PSE and IBF to known concentrationsof the pharmaceutical formulation. The resulting mixtures wereassayed, and the results obtained were compared with theexpected results, Table 6. The good recoveries of the standard addi-tion technique suggested good accuracy of the proposed methods.
Precision
RepeatabilityThree concentrations of CPM (20, 60, and 100 lg/mL), PSE (200,
600, and 1000 lg/mL) and IBF (200, 500, and 1000 lg/mL) wereanalyzed three times intra-daily using the proposed spectrophoto-metric methods. The percentage recoveries and relative standarddeviation were calculated, Table 1.
Intermediate precisionThe previous procedures were repeated inter-daily three times
on three different days for the analysis of the three chosen concen-trations. The percentage recoveries and relative standard deviationwere calculated, Table 1.
Selectivity
Selectivity of the methods was achieved by the analysis ofdifferent laboratory prepared mixtures of CPM, PSE and IBF withinthe linearity range. Satisfactory results were shown in Table 2.
Statistical analysis
Results obtained from the proposed methods were compared tothose obtained by applying the official methods [35] for CPM, PSEand IBF, official potentiometric titration method for CPM and PSEand reported titrimetric method for IBF showing no significant dif-ference as observed from the calculated t- and F values, Table 7.
Conclusion
The present work is concerned with the simultaneous determi-nation of CPM, PSE and IBF, in pure form or in its pharmaceuticalformulation. The proposed novel manipulating ratio spectramethod, the double divisor-ratio difference spectrophotometricmethod (DD-RD), proved to be advantageous over the conventionalmanipulating ratio spectra methods: double divisor-derivativeratio spectrophotometric method (DD-RD) and ratio spectra zero-crossing derivative spectrophotometry (DRZC). The novel method(DD-RD) proved to be of equal accuracy, sensitivity and precisionas for successive mean centering of ratio spectra method (MCR)and the chemomoetric methods, PCR and PLS, but with minimalmanipulating steps and no need for special software. The proposedspectrophotometric and chemometric methods are considered tobe sensitive, selective, accurate and precise furthermore they donot require any hazardous solvents, long sample preparation,sophisticated techniques or instruments. These methods can deter-mine CPM, PSE and IBF in its tablets without interference fromexcipients. They can be considered useful and promising for devel-oping routine quality control analysis of pharmaceuticals withoutany preliminary separation step. They are valid for application inlaboratories lacking liquid chromatographic instruments.
References
[1] S.U. Yasuda, A. Wellstein, P. Likhari, J.T. Barbey, R.L. Woosley, Clin. Pharmacol.Ther. 58 (1995) 210.
[2] Goodman and Gilman’s The Pharmaceutical Basis of Therapeutics, nineth ed.,Macmillan Publishing Company, New York, 1996, pp. 224.
[3] A. Van Esch, H.A. Van Steensel-Moll, E.W. Steyerberg, M. Offringa, J.D.Habbema, G. Derksen-Lubsen, Arch. Pediatr. Adolesc. Med. 149 (6) (1995)632–637.
[4] J.L. Murtha, T.N. Julian, G.W. Radebaugh, J. Pharm. Sci. 77 (8) (1988) 715–718.[5] I.M. Palabiyik, E. Dinç, F. Onur, J. Pharm. Biomed. Anal. 34 (3) (2004) 473–483.[6] X. Chen, Y. Zhang, D. Zhong, Biomed. Chromatogr. 18 (4) (2004) 248–253.[7] H.-G. Lou, H. Yuan, Z.-R. Ruan, B. Jiang, J. Chromatogr. B 878 (7) (2010) 682–
688.[8] J.A. Thompson, F.H. Leffert, J. Pharm. Sci. 69 (6) (1980) 707–710.[9] M. Louhaichi, S. Jebali, M. Loueslati, N. Adhoum, L. Monser, Talanta 78 (3)
(2009) 991–997.[10] Y. Dong, . Chen, Y. Chen, X. Chen, Z. Hu, J. Pharm. Biomed. Anal. 39 (1) (2005)
285–289.[11] Y. Liu, W. Zhou, Anal. Sci. 22 (7) (2006) 999.[12] ç.B. As, Ö.A. Dönmez, A.B. an, S. Sungur, J. Anal. Chem. 65 (7) (2010) 743–748.[13] B.A. Özlem, A. Dönmez, A. Bozdogan, S. Sungur, Innovations in Chemical
Biology, Springer, 2009. p. 285–290.[14] B.J. Stojanovic, Chromatographia 76 (5–6) (2013) 227–240.[15] F. Salinas, J.J.B. Nevado, A.E. Mansilla, Talanta 37 (3) (1990) 347–351.[16] Y.N. Hassan, S.M. Elgizawy, H.M. Lotfy, S.S. Saleh, Int. Res. J. Pure Appl. Chem. 3
(2) (2013) 90–110.[17] J.J.B. Nevado, C.C. Guiberteau, F. Salinas, Talanta 39 (1992) 533–547.[18] J.J. Berzas Nevado, J.R. Flores, C.G. Cabanillas, M.J.V. Llerena, A.M.C. Salcedo,
Talanta 46 (1998) 933–942.[19] E. Dinc, F. Onur, Anal. Chim. Acta 359 (1–2) (1998) 93–106.[20] E. Dinc, Talanta 48 (1999) 1145–1157.[21] A. Afkhami, M. Bahram, Spectrochim. Acta Part A Mol. Biomol. Spectrosc. 61
(2005) 869–877.[22] N.W. Ali, N.S. Abdelwahab, M. Abdelkawy, A.A. Emam, Bulletin of Faculty of
Pharmacy, vol. 50, Cairo University, 2012.[23] H.M. Lotfy, M.A.M. Hegazy, Spectrochim. Acta Part A Mol. Biomol. Spectrosc.
96 (2012) 259–270.[24] H.M. Lotfy, M.A.M. Hegazy, Spectrochim. Acta Part A Mol. Biomol. Spectrosc.
113 (2013) 107–114.[25] H.M. Lotfy, Int. J. Pharm. Pharm. Sci. 4 (4) (2012) 673–679.[26] A. Samir, H.M. Lotfy, H. Salem, M. Abdelkawy, Spectrochim. Acta Part A Mol.
Biomol. Spectrosc. 128 (2014) 127–136.[27] H.M. Lotfy, S.S. Saleh, N.Y. Hassan, S.M. Elgizawy, Anal. Chem. Lett. 3 (2) (2013)
70–84.[28] H.A. Merey, N.K. Ramadan, S.S. Diab, A.A. Moustafa, Spectrochim. Acta Part A
Mol. Biomol. Spectrosc. 125 (2014) 138–146.[29] H.M. Lotfy, S.M. Tawakkol, N.M. Fahmy, M.A. Shehata, Spectrochim. Acta Part A
Mol. Biomol. Spectrosc. 121 (2014) 313–323.[30] H.M. Lotfy, S.S. Saleh, N.Y. Hassan, H. Salem, Spectrochim. Acta Part A Mol.
Biomol. Spectrosc. 126 (2014) 112–121.[31] A. Afkhami, M. Bahram, Anal. Chim. Acta 526 (2) (2004) 211–218.[32] A. Afkhami, M. Bahram, Talanta 66 (2005) 712–720.[33] H.M. Lotfy, M.A. Hegazy, M.R. Rezk, Y.R. Omran, Spectrochim. Acta Part A Mol.
Biomol. Spectrosc. 126 (2014) 197–207.[34] M.A.M. Hegazy, M.S. Eissab, Osama Ibrahim AbdEl-Sattarc, M.M. AbdEl-Kawya,
J. Pharm. Anal. 4 (2) (2014) 132–143.[35] British Pharmacopoeia, The Stationery Office on behalf of the Medicines and
Healthcare products Regulatory Agency (MHRA)-� Crown Copyright, 2009.[36] R.G. Brereton, Chemometrics: Data Analysis for the Laboratory and Chemical
Plant, Wiley, 2003.[37] E.M. Hassan, M.S. Mahrous, R.N. Shdeed, J. Pharm. Biomed. Sci. 01 (2011) 73–
80.[38] R. Kramer, Chemometric Techniques for Quantitative Analysis, Marcel Dekker
Inc., New York, 1998, pp. 51–142.[39] S. Donahue, C. Brown, B. Caputo, M. Modell, Anal. Chem. 60 (1988)
1873–1878.[40] H. Martens, T. Naes, Multivariate calibration: A user-friendly guide to
multivariate calibration and classification, John Wiley & Sons, New York, 1989.[41] A.E. Mansilla, I.D. Meras, F. Salinas, J. Pharmaceut. Biomed. Anal. 17 (8) (1998)
1325–1334.[42] T. Pham-Gia, Q. Duong, J. Math. Comput. Model. 12 (12) (1989) 1613–1625.[43] R.G. Brereton, Analyst 125 (11) (2000) 2125–2154.[44] D.M. Haaland, E.V. Thomas, Anal. Chem. 60 (1988) 1193–1202.[45] N.E. Wagieh, M.A. Hegazy, M. Abdelkawy, E.A. Abdelaleem, Talanta 80 (5)
(2010) 2007–2015.[46] ICH Validation of Analytical Procedures: Text and Methodology Q2(Rl), in:
International Conference on Harmonization, Geneva, 2005.