evaluating patients' experiences with individual physicians: a randomized trial of mail,...
TRANSCRIPT
Evaluating Patient's Experiences with Individual Physicians: A Randomized Trial of Mail,Internet, and Interactive Voice Response Telephone Administration of SurveysAuthor(s): Hector P. Rodriguez, Ted von Glahn, William H. Rogers, Hong Chang, GaryFanjiang and Dana Gelb SafranSource: Medical Care, Vol. 44, No. 2 (Feb., 2006), pp. 167-174Published by: Lippincott Williams & WilkinsStable URL: http://www.jstor.org/stable/3768387 .
Accessed: 04/05/2013 18:49
Your use of the JSTOR archive indicates your acceptance of the Terms & Conditions of Use, available at .http://www.jstor.org/page/info/about/policies/terms.jsp
.JSTOR is a not-for-profit service that helps scholars, researchers, and students discover, use, and build upon a wide range ofcontent in a trusted digital archive. We use information technology and tools to increase productivity and facilitate new formsof scholarship. For more information about JSTOR, please contact [email protected].
.
Lippincott Williams & Wilkins is collaborating with JSTOR to digitize, preserve and extend access to MedicalCare.
http://www.jstor.org
This content downloaded from 128.97.228.61 on Sat, 4 May 2013 18:49:01 PMAll use subject to JSTOR Terms and Conditions
ORIGINAL ARTICLE
Evaluating Patients' Experiences with Individual Physicians A Randomized Trial of Mail, Internet, and Interactive Voice Response
Telephone Administration of Surveys
Hector P. Rodriguez, MPH, *t Ted von Glahn,t William H. Rogers, PhD, *? Hong Chang, PhD, *? Gary Fanjiang, MD, MBA,f and Dana Gelb Safran, ScD*?
Background: There is increasing interest in measuring patients' experiences with individual physicians, and empirical evidence supports this area of measurement. However, the high cost of data collection remains a significant barrier. Survey modes with the potential to lower costs, such as Internet and interactive voice response (IVR) telephone, are attractive alternatives to mail, but their comparative response rates and data quality have not been tested. Methods: We randomly assigned adult patients from the panels of 62 primary care physicians in California to complete a brief, vali- dated patient questionnaire by mail, Intemet (web), or IVR. After 2 invitations, web and IVR nonrespondents were mailed a paper copy of the survey ("crossover" to mail). We analyzed and compared (n = 9126) the response rates, respondent characteristics, substantive re- sponses, and costs by mode (mail, web and IVR) and evaluated the impact of "crossover" respondents. Results: Response rates were higher by mail (50.8%) than web (18.4%) or IVR (34.7%), but after crossover mailings, response rates in each arm were approximately 50%. Mail and web produced identical scores for individual physicians, but IVR scores were significantly lower even after adjusting for respondent characteris- tics. There were no significant physician-mode interactions, indicat- ing that statistical adjustment for mode resolves the IVR effect. Web and IVR costs were higher than mail. Conclusions: The equivalence of individual physician results in mail and web modes is noteworthy, as is evidence that IVR results
From the *Health Institute, Institute for Clinical Research and Health Policy Studies, Tufts-New England Medical Center, Boston, Massachusetts; tPhD Program in Health Policy, Harvard University, Cambridge, Mas- sachusetts; :Pacific Business Group on Health, San Francisco, Califor- nia; ?Department of Medicine, Tufts University, Boston, Massachusetts; and ?Department of Pediatric Gastroenterology and Nutrition, Tufts-New England Medical Center, Boston, Massachusetts.
Supported by the California HealthCare Foundation (Grant 02-2334). The Foundation, based in Oakland, is an independent philanthropy committed to improving California's health care delivery and financing systems. Formed in 1996, its goal is to ensure that all Californians have access to affordable, quality health care.
Reprints: Dana Gelb Safran, ScD, The Health Institute, Institute for Clinical Research and Health Policy Studies, Tufts-New England Medical Center, 750 Washington Street, Box 345, Boston, MA 02111. E-mail: dsafran@ tufts-nemc.org.
Copyright ? 2006 by Lippincott Williams & Wilkins ISSN: 0025-7079/06/4402-0167
are comparable after adjustment for mode. However, the higher overall cost of web and IVR, as the result of the need for mailings to support these modes, suggests that they do not presently solve cost concerns related to obtaining physician-specific information from patients.
Key Words: patient surveys, performance assessment, mode trial, Internet-administered surveys, interactive voice response (IVR)
(Med Care 2006;44: 167-174)
In its landmark report Crossing the Quality Chasm, the Institute of Medicine hailed patient-centered care as 1 of 6
pillars of high quality health care.1 Since that time, patient- centered care has moved from being a boutique concept in health care to a widely sought goal for clinicians and health care organizations nationwide. However, achieving patient- centered care can be challenging without effective tools for measuring, monitoring, and improving patients' experiences. To date, most widely applied surveys have focused on pa- tients' experiences with their health plans or with medical groups. However, there is burgeoning interest in measuring patients' experiences with individual physicians, and efforts are underway to develop a national standard in this area.2-5 Several recent initiatives have helped to establish the sound- ness of measures developed and tested for this purpose and conclude that sample sizes of several dozen patients per physician are required to establish highly reliable mea- sures.6'7 Thus, the cost of traditional methods of mail- and telephone-based data collection remains a considerable bar- rier to widespread implementation. Survey modes with po- tential to lower costs, such as Intemet-based surveys8-10 and interactive voice response (IVR) telephone interviews,'1112 are attractive alternatives to mail, but their comparative response rates and data quality have not been tested.
We conducted an experiment involving adult patients drawn from the panels of 62 primary care physicians (PCPs) in California, with a portion of each physician's patients randomly assigned to complete the study questionnaire by mail, Internet, and IVR telephone interview. We further tested the effect of a mixed-mode protocol wherein nonre- spondents to web and IVR were invited to "crossover" to
Medical Care * Volume 44, Number 2, February 2006 167
This content downloaded from 128.97.228.61 on Sat, 4 May 2013 18:49:01 PMAll use subject to JSTOR Terms and Conditions
Rodriguez et al Medical Core * Volume 44, Number 2, February 2006~~~~~~~~~~~~~~~~~~~~~~~~~~~
complete a mailed survey. We compared the response rates and substantive physician-level results achieved by each mode before and after the crossover mailings (ie, "pure mode" and "mixed mode" results). In addition, the costs associated with using each survey mode were compared.
METHODS
Sampling The starting sample for the study included 22,152
patients from the practices of 62 physicians drawn from 5 physician network organizations in California. Physicians in internal medicine, family practice, or general medicine spe- cialties with minimum panel sizes of 560 patients were eligible for inclusion in the study. Adult patients of the sampled physicians were eligible if they were registered to that physician's primary care panel and had at least 1 visit with the physician between April and December 2002. Where possible, we sampled 565 patients per physician and ran- domly assigned patients across modes using the following allocations: mail (n = 115), web (n = 250), and IVR (n =
200) surveys. The allotment for each mode took into account expected differences in response rates by mode and the study's aim of obtaining 37 completed surveys from each mode for each physician. For physicians with fewer than 565 eligible patients, patients were assigned randomly to mail and 1 other mode. Of the 62 physicians, 12 had patients assigned to all 3 modes, 49 had patients assigned to 2 modes, and 1 physician had patients assigned only to the web mode.
Data Collection Data collection began in late May 2003 and ended in
mid-July 2003. An invitation letter was sent by mail to the home address of all targeted respondents (n = 22,152). Invitations were on medical group letterhead, signed by the medical director, and were personalized for the specific patient, including reference to the patient's primary care physician by name. Letters had English text on one side and Spanish on the other. In the mail arm of the study, the letter was accompanied by a paper copy of the survey and a postage-paid return envelope. In the web arm, the letter indicated the web address at which the patient could access the survey, and provided a unique login code. For the IVR arm, the letter provided a toll-free telephone number that the patient could call to access the survey and a unique login code. The login codes for web and IVR respondents linked to a database with the name of the PCP to whom the patient was registered to populate the first question on the survey with that physician's name. This was used to confirm or correct the identity of the patient's primary physician. For mail respon- dents, the physician's name was imprinted as part of the first question in the survey.
A second invitation letter was sent to nonrespondents 1 week after the first and again invited participation through the same mode. For the web and IVR sample, a third mailing was mailed to nonrespondents 2 weeks after the second and included a paper copy of the survey and a postage-paid return envelope ("crossover" to mail).
Study Questionnaire The study questionnaire was an abbreviated version of
the Ambulatory Care Experiences Survey (ACES).13 Previ- ous analyses have demonstrated that the ACES questions and composite measures have excellent psychometric properties and achieve physician-level reliability of at least 0.70 with samples of approximately 45 patients per physician.7 The abbreviated ACES survey administered here included 16 items to measure 3 domains of care (the quality of physician- patient interaction, integration of care, and access to care), a summary indicator of the patient's willingness to recommend the physician to family or friends, and a set of items to characterize the respondent's sociodemographic profile and health status.
The questionnaire sent to mail respondents was printed on 2 sheets of paper (4 sides). The web format was visually comparable to mail, but if questions were overlooked, web respondents were prompted to complete the overlooked ques- tions (though permitted to skip them) before continuing. The IVR telephone interview was a computerized audio version of the survey. Each question was read aloud, and respondents were asked to press the number corresponding to their answer on a touch-tone telephone. Respondents were able to select their answer after the question was read but before all the response options were voiced, thus differentiating this format from the 2 visual modes (ie, mail and web) where respon- dents saw the entire response continuum and then selected their answer.
Analyses A total of 11,198 completed surveys were received.
There were 517 duplicate cases, wherein the respondent completed both the originally-assigned mode and a mailed survey. In these cases, we used data from the originally assigned mode for analysis.
Response rates for each arm of the trial were computed for both the "pure mode" and "mixed mode" protocols, where "mixed mode" response rates considered both individuals who completed the survey in the originally-assigned mode and those who responded to the crossover mailing (excluding duplicates). Response rates were calculated as the number of responses received divided by the number targeted in the starting sample. Individuals found to be ineligible (ie, bad address, death) were excluded from the denominator for response rate calculations.
We investigated item nonresponse to understand whether there were any differences in missing data by mode, and to evaluate whether there were differences in "survey abandon- ment" by mode. Because there were no screener questions in the survey, any differences in missing data by mode may be attributed to either the mode itself or to differences in respon- dent characteristics. For each respondent, a survey comple- tion rate was calculated as the percent of items answered, excluding the demographics section. We then compared the average completion rate by mode, testing differences in completion rates with an overall F-test. To analyze survey abandonment, all respondents who skipped the last survey question were analyzed further to document the point in the survey at which they began to skip consecutive and remaining
2006 Lippincott Williams & Wilkins
Rodriguez et al Medical Care ? Volume 44, Number 2, February 2006
168
This content downloaded from 128.97.228.61 on Sat, 4 May 2013 18:49:01 PMAll use subject to JSTOR Terms and Conditions
Medical Care * Volume 44, Number 2, February 2006 Effect of Survey Mode on Data Quality~~~~~~~~~~~~~~~~~~~~~~~~~~~~~~
survey items. Abandonment rates were calculated for each mode and modes were compared for differences in abandon- ment rates using an overall F-test. Dummy variables for each mode were used to make pairwise comparisons using F-tests for both the overall missing data and survey abandonment analyses.
We compared respondent characteristics and physician- level results by mode using both pure mode and mixed mode samples. The analytic sample included 9126 unique respon- dents. We excluded those who indicated that the physician named in the survey was not their primary physician (n = 660), those who failed to answer the physician confirmation item (n = 336), and those who reported no visits with the physician in the last 12 months (n = 559).
Regression models including dummy variables to dif- ferentiate modes were used to test mode differences in re- spondent characteristics, physician-level mean item and scale scores, and arm differences in physician-level mean scale scores. For the adjusted analysis, we included a fixed set of adjuster variables including age, education, race, gender, and disease count in the regression model. We then used these regression equations to obtain predicted values based on adjusted mean scores. Bonferroni adjustments were used to adjust p-values for multiple comparisons when comparing item-level and scale scores between modes and arms.
We also tested interactions between individual physi- cians and survey mode to understand whether results and ranking of physicians differed by mode. First, we investigated whether the ranking of physicians was preserved across the various survey modes. To do this, we used an analysis of variance (ANOVA) model to test the overall physician-mode interaction effect, controlling for respondent characteristics. Second, we analyzed whether differences in individual phy- sician item and composite mean scores between the different survey modes were comparable for all physicians. Dummy variables for each physician and survey mode, and interaction terms for these dummies were constructed. Equality of phy- sician scores (62 df) were then tested across modes using an F- test for each survey item and composite. All statistical analysis was conducted using STATA 7.0 (College Station, TX).14
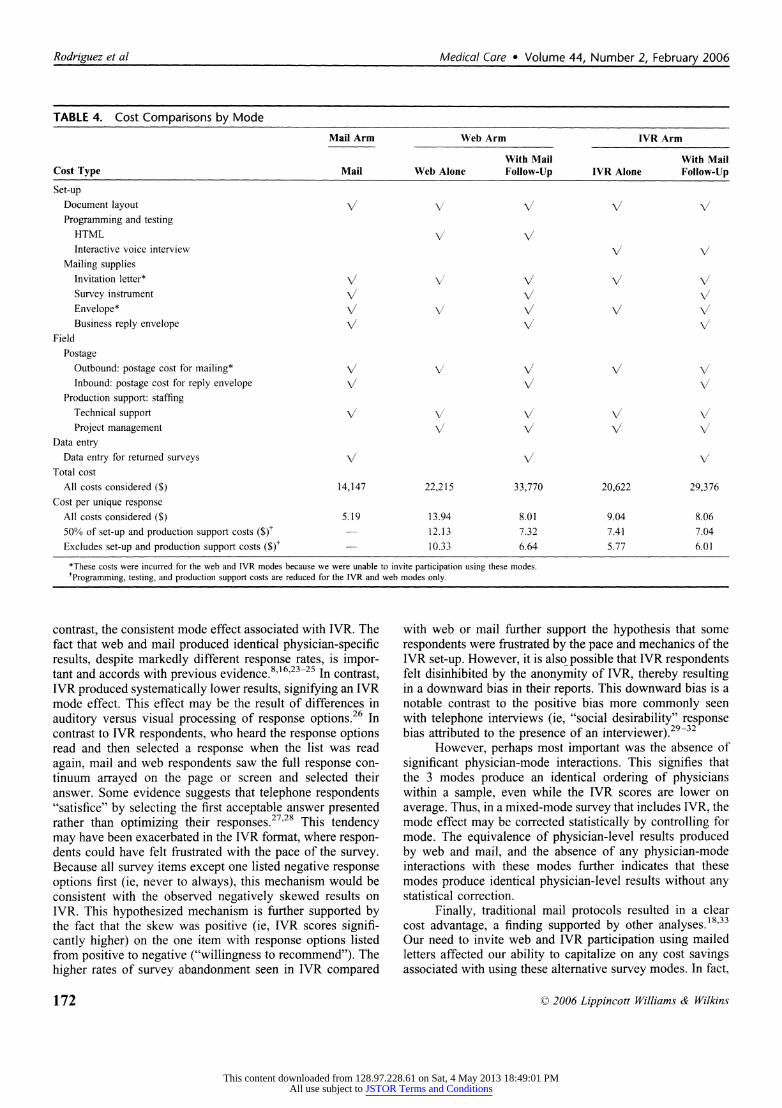
Cost data were obtained from the survey vendor, DataStat, and included actual costs from the project. Expenses consid- ered in cost calculations included set-up costs (document layout, programming and testing of the survey for each mode, and mailing supplies), field costs (outbound and inbound post- age, technical support and project management staff), and data entry costs. Unique responses included all returned surveys received, excluding duplicates. The cost per unique response for each mode was calculated by dividing the total costs for the mode by the number of unique responses for that mode.
RESULTS
Response Rates Response rates for both the "pure mode" and "mixed
mode" samples are summarized in Table 1. The mail arm of this trial achieved a 50.8% response rate. Among those assigned to the web, 18.4% responded by web and 30.2%
responded to the crossover mailing (48.6% total response rate). In the IVR sample, 34.7% of patients responded by IVR and 19.0% responded to the crossover mailing (53.7% total response rate). For both web and IVR, response rates varied considerably across the physician network organizations (data not shown). However, with the crossover mailings, overall response rates in the web and IVR arms consistently improved to become comparable to the mail arm for that network organization. For example, in 1 physician network organization, whereas only 10.5% of individuals assigned to web responded in that mode, the group's overall response rate was 49.3% after the crossover mailing.
Item Non-Response and Survey Abandonment Data completeness was high in all 3 modes but differed
by mode (data not shown). On average, IVR respondents completed fewer survey items than both mail respondents (94.7% vs. 98.1%, P < 0.001) and web respondents (94.7% vs. 98.8%, P < 0.001). IVR respondents showed higher rates of survey abandonment (5.0%) compared with mail (0.5%) or web (1.2%).
Respondent Characteristics Respondent characteristics in each arm and mode of the
study are detailed in Table 1. In general, respondents using the web were younger (54.1 vs. 56.9, P < 0.001), more educated (43.0% vs. 35.0% completed college, P < 0.001), had fewer medical conditions (1.3 vs. 1.5, P < 0.001), and reported better health status (62.3 vs. 59.3, P < 0.001) compared with mail respondents. In addition, Hispanics (13.8% vs. 17.0%, P = 0.01) were less likely to respond using the web compared with the mail mode. These differ- ences were largely eliminated after crossover mail surveys were administered to web nonrespondents.
Compared with mail arm respondents, IVR respondents were more likely to not have completed high school (11.6% vs. 9.5%, P = 0.021) and had more outpatient visits during the prior 12 months (4.0 vs. 3.8, P = 0.009). In addition, Asians (8.6% vs. 12.4%, P < 0.001) and subjects from other racial backgrounds (8.6% vs. 11.0%, P = 0.014) were less likely to respond to the IVR survey compared with respon- dents in the mail arm. These differences in respondent pro- files were partially attenuated after the crossover mailing was administered to IVR nonrespondents, although the overall profile of respondents in the IVR arm still included fewer Asians and less educated respondents.
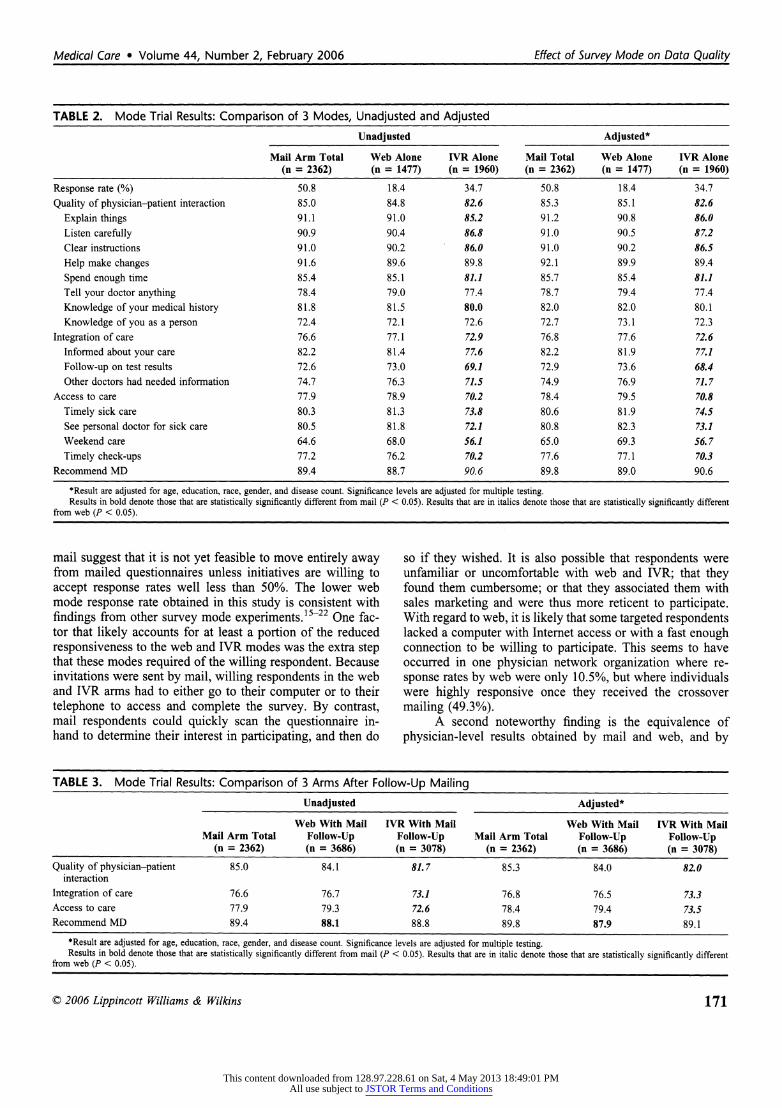
Data Quality: Pure Mode Comparisons Using the "pure mode" sample, Table 2 summarizes the
unadjusted and adjusted survey results by mode. Comparing web and mail reveals no significant differences in the item- level or composite-level results. This was true in both the unadjusted and adjusted analyses. By contrast, in IVR, most item-level and composite-level results were significantly lower than both mail and web. Even after adjusting for respondent characteristics, IVR results were significantly lower than mail and web for 11 of the 16 items and for all composites.
? 2006 Lippincott Williams & Wilkins
Effect of Survey Mode on Data Quality Medical Care ? Volume 44, Number 2, February 2006
169
This content downloaded from 128.97.228.61 on Sat, 4 May 2013 18:49:01 PMAll use subject to JSTOR Terms and Conditions

Rodriguez et al
TABLE 1. Respondent Characteristics
Mail Arm Web Arm IVR Arm
Web With Mail IVR With Mail Mail Arm Total Web Alone Follow-Up IVR Alone Follow-Up
n 2362 1477 3686 1960 3078 Response rate (%)? 50.8 18.4 48.6 34.7 53.7 Demographics
Age (mean) 56.9 54.1' 58.1t 57.4 56.6 Male (%) 47.2 45.4 43.5t 45.8 48.1 Hispanic (%) 17.0 13.8t 18.9 16.2 18.3 Race
White (%) 72.5 74.4 73.7 78.5+ 76.0* Black (%) 4.1 3.0 3.4 4.3 4.1 Asian (%) 12.4 12.1 11.4 8.6$ 10.1* Other (%) 11.0 10.5 11.6 8.6* 9.7
Education Less than high school (%) 9.5 4.3* 11.8t 11.6* 12.71 High school only (%) 20.7 15.2+ 21.5 19.4 19.6 Some college (%) 34.8 37.4 33.8 35.3 35.2
4-year college graduate or beyond (%) 35.0 43.01 32.9 33.7 32.5 Utilization
Visits (mean) 3.8 3.5' 3.7 4.0t 3.9 Health status
Self-rated physical health (mean) 59.3 62.3' 58.9 59.3 59.1 Disease count (mean)l' 1.5 1.3+ 1.4 1.5 1.4
*P < 0.05, tp < 0.01, tP < 0.001, compared to mail arm total. ~The denominators used in calculating the response rates exclude ineligibles (eg, death, bad address). 'Disease count includes the following conditions: hypertension/high blood pressure, angina/coronary artery disease, congestive heart failure, diabetes, asthma, emphysema, or
COPD, rheumatoid arthritis, osteoarthritis or DJD, any cancer (other than skin), depression, acid reflux or stomach ulcers, and migraine headaches.
Data Quality: Mixed Mode Comparisons Table 3 summarizes unadjusted and adjusted results by
mode using the mixed mode sample, reporting only compos- ite-level scores and the global "willingness to recommend" item. In these analyses, results in the mail and web arms of the trial remain equivalent for all composite measures, and results in the IVR arm remain significantly lower than both mail and web for all composite measures. In both unadjusted and adjusted analyses, respondents in the web arm were significantly less willing to recommend their physician to family and friends than respondents in the mail arm (87.9 vs. 89.8, P = 0.003).
Data Quality: Physician-Mode Interaction Effects
Tests of physician-mode interactions revealed no sig- nificant differences for any of the composite measures and no significant differences for 15 of the 16 survey items (P value range: 0.053-0.962). The findings signify that each mode produced identical results in both their ordering of individual physician performance and in the mean scores produced. The one exception was an item concerning scheduling of routine office visits, where a significant physician-mode interaction was observed (P < 0.05).
Survey Costs In both pure mode and mixed mode samples, mail was
less expensive than web or IVR (Table 4). Mail arm costs
were $5.19 per unique response. For web, costs were $13.94 per unique response in the "pure" mode sample, and $8.01 per unique response after crossover mailings. For IVR, costs were $9.04 and $8.04 per unique response for pure and mixed mode samples, respectively. Recognizing that efficiencies might be achieved over time with the use of a standardized survey instrument and protocol, and that these might consid- erably reduce programming, testing, and production support costs, we tested the sensitivity of our results by reducing (by 50%) and then removing these costs for the IVR and web modes. When these costs were reduced by 50% for the web and IVR modes, mail remained the least expensive mode ($5.19 per unique response compared with $7.32 and $7.04, for web and IVR respectively). When these costs were ex- cluded, mail remained the least expensive mode ($5.19 per unique response compared with $6.64 and $6.01, for web and IVR respectively).
DISCUSSION This randomized trial comparing mail, web and IVR
modes of survey administration yielded several findings rel- evant to emerging efforts to obtain physician-specific infor- mation from patients as part of overall health care quality assessment. First, differences in response rates achieved by the different modes are noteworthy. In particular, the higher response rate achieved using mail and the substantial boost to both web and IVR arm response rates after the "crossover" to
? 2006 Lippincott Williams & Wilkins
Medical Care ? Volume 44, Number 2, February 2006
170
This content downloaded from 128.97.228.61 on Sat, 4 May 2013 18:49:01 PMAll use subject to JSTOR Terms and Conditions
Medicl Cae * olum 44,Numbr 2,Febrary 206 Efectof SiveyModeon Dta Qalit
TABLE 2. Mode Trial Results: Comparison of 3 Modes, Unadjusted and Adjusted
Unadjusted Adjusted*
Mail Arm Total Web Alone IVR Alone Mail Total Web Alone IVR Alone (n = 2362) (n = 1477) (n = 1960) (n = 2362) (n = 1477) (n = 1960)
Response rate (%) 50.8 18.4 34.7 50.8 18.4 34.7
Quality of physician-patient interaction 85.0 84.8 82.6 85.3 85.1 82.6
Explain things 91.1 91.0 85.2 91.2 90.8 86.0 Listen carefully 90.9 90.4 86.8 91.0 90.5 87.2 Clear instructions 91.0 90.2 86.0 91.0 90.2 86.5
Help make changes 91.6 89.6 89.8 92.1 89.9 89.4
Spend enough time 85.4 85.1 81.1 85.7 85.4 81.1 Tell your doctor anything 78.4 79.0 77.4 78.7 79.4 77.4
Knowledge of your medical history 81.8 81.5 80.0 82.0 82.0 80.1
Knowledge of you as a person 72.4 72.1 72.6 72.7 73.1 72.3
Integration of care 76.6 77.1 72.9 76.8 77.6 72.6 Informed about your care 82.2 81.4 77.6 82.2 81.9 77.1
Follow-up on test results 72.6 73.0 69.1 72.9 73.6 68.4 Other doctors had needed information 74.7 76.3 71.5 74.9 76.9 71.7
Access to care 77.9 78.9 70.2 78.4 79.5 70.8
Timely sick care 80.3 81.3 73.8 80.6 81.9 74.5 See personal doctor for sick care 80.5 81.8 72.1 80.8 82.3 73.1 Weekend care 64.6 68.0 56.1 65.0 69.3 56.7
Timely check-ups 77.2 76.2 70.2 77.6 77.1 70.3 Recommend MD 89.4 88.7 90.6 89.8 89.0 90.6
*Result are adjusted for age, education, race, gender, and disease count. Significance levels are adjusted for multiple testing. Results in bold denote those that are statistically significantly different from mail (P < 0.05). Results that are in italics denote those that are statistically significantly different
from web (P < 0.05).
mail suggest that it is not yet feasible to move entirely away from mailed questionnaires unless initiatives are willing to accept response rates well less than 50%. The lower web mode response rate obtained in this study is consistent with findings from other survey mode experiments.15-22 One fac- tor that likely accounts for at least a portion of the reduced responsiveness to the web and IVR modes was the extra step that these modes required of the willing respondent. Because invitations were sent by mail, willing respondents in the web and IVR arms had to either go to their computer or to their telephone to access and complete the survey. By contrast, mail respondents could quickly scan the questionnaire in- hand to determine their interest in participating, and then do
so if they wished. It is also possible that respondents were unfamiliar or uncomfortable with web and IVR; that they found them cumbersome; or that they associated them with sales marketing and were thus more reticent to participate. With regard to web, it is likely that some targeted respondents lacked a computer with Internet access or with a fast enough connection to be willing to participate. This seems to have occurred in one physician network organization where re- sponse rates by web were only 10.5%, but where individuals were highly responsive once they received the crossover mailing (49.3%).
A second noteworthy finding is the equivalence of physician-level results obtained by mail and web, and by
TABLE 3. Mode Trial Results: Comparison of 3 Arms After Follow-Up Mailing
Unadjusted Adjusted*
Web With Mail IVR With Mail Web With Mail IVR With Mail Mail Arm Total Follow-Up Follow-Up Mail Arm Total Follow-Up Follow-Up
(n = 2362) (n = 3686) (n = 3078) (n = 2362) (n = 3686) (n = 3078)
Quality of physician-patient 85.0 84.1 81.7 85.3 84.0 82.0 interaction
Integration of care 76.6 76.7 73.1 76.8 76.5 73.3 Access to care 77.9 79.3 72.6 78.4 79.4 73.5 Recommend MD 89.4 88.1 88.8 89.8 87.9 89.1
*Result are adjusted for age, education, race, gender, and disease count. Significance levels are adjusted for multiple testing. Results in bold denote those that are statistically significantly different from mail (P < 0.05). Results that are in italic denote those that are statistically significantly different
from web (P < 0.05).
? 2006 Lippincott Williams & Wilkins
Effect of Survey Mode on Data Quality Medical Care ? Volume 44, Number 2, February 2006
171
This content downloaded from 128.97.228.61 on Sat, 4 May 2013 18:49:01 PMAll use subject to JSTOR Terms and Conditions
Rodriguez et al
TABLE 4. Cost Comparisons by Mode
Mail Arm Web Arm IVR Arm
With Mail With Mail Cost Type Mail Web Alone Follow-Up IVR Alone Follow-Up
Set-up Document layout V V V V Programming and testing
HTML V' Interactive voice interview V /
Mailing supplies Invitation letter* V/V V V V Survey instrument /
Envelope* V V V V V Business reply envelope/ v V/
Field
Postage Outbound: postage cost for mailing* V V V V Inbound: postage cost for reply envelope V V V
Production support: staffing Technical support V V V/ V v Project management V V V V
Data entry Data entry for returned surveys V V V
Total cost All costs considered ($) 14,147 22,215 33,770 20,622 29,376
Cost per unique response All costs considered ($) 5.19 13.94 8.01 9.04 8.06 50% of set-up and production support costs ($)t 12.13 7.32 7.41 7.04 Excludes set-up and production support costs ($)t 10.33 6.64 5.77 6.01
*These costs were incurred for the web and IVR modes because we were unable to invite participation using these modes. tProgramming, testing, and production support costs are reduced for the IVR and web modes only.
contrast, the consistent mode effect associated with IVR. The fact that web and mail produced identical physician-specific results, despite markedly different response rates, is impor- tant and accords with previous evidence.8'16'23-25 In contrast, IVR produced systematically lower results, signifying an IVR mode effect. This effect may be the result of differences in auditory versus visual processing of response options.26 In contrast to IVR respondents, who heard the response options read and then selected a response when the list was read again, mail and web respondents saw the full response con- tinuum arrayed on the page or screen and selected their answer. Some evidence suggests that telephone respondents "satisfice" by selecting the first acceptable answer presented rather than optimizing their responses.27'28 This tendency may have been exacerbated in the IVR format, where respon- dents could have felt frustrated with the pace of the survey. Because all survey items except one listed negative response options first (ie, never to always), this mechanism would be consistent with the observed negatively skewed results on IVR. This hypothesized mechanism is further supported by the fact that the skew was positive (ie, IVR scores signifi- cantly higher) on the one item with response options listed from positive to negative ("willingness to recommend"). The higher rates of survey abandonment seen in IVR compared
with web or mail further support the hypothesis that some respondents were frustrated by the pace and mechanics of the IVR set-up. However, it is also possible that IVR respondents felt disinhibited by the anonymity of IVR, thereby resulting in a downward bias in their reports. This downward bias is a notable contrast to the positive bias more commonly seen with telephone interviews (ie, "social desirability" response bias attributed to the presence of an interviewer).29-32
However, perhaps most important was the absence of significant physician-mode interactions. This signifies that the 3 modes produce an identical ordering of physicians within a sample, even while the IVR scores are lower on average. Thus, in a mixed-mode survey that includes IVR, the mode effect may be corrected statistically by controlling for mode. The equivalence of physician-level results produced by web and mail, and the absence of any physician-mode interactions with these modes further indicates that these modes produce identical physician-level results without any statistical correction.
Finally, traditional mail protocols resulted in a clear cost advantage, a finding supported by other analyses.18'33 Our need to invite web and IVR participation using mailed letters affected our ability to capitalize on any cost savings associated with using these alternative survey modes. In fact,
? 2006 Lippincott Williams & Wilkins
Medical Care * Volume 44, Number 2, February 2006
172
This content downloaded from 128.97.228.61 on Sat, 4 May 2013 18:49:01 PMAll use subject to JSTOR Terms and Conditions
Medical Cre * Volue 44, Nuber 2, Feruary 200 Effect f Survey ode on Daa Qualit
studies that find cost advantages associated with using Inter- net-based surveys all invite participation through e-mail.8-10,33 Although it could be argued that the high programming, testing, and production support costs incurred for the web and IVR modes significantly contribute to the higher costs ob- served here, and that organizations could achieve substantial efficiencies in these modes over time with a standardized instrument and protocol, our sensitivity analyses indicated that traditional mail protocols were still less expensive after accounting for these factors. This suggests that the cost advantage of traditional mail would remain so long as orga- nizations remain faced with the need to rely on mail for initial outreach and/or to boost overall response rates. The exception to this would be an initiative involving a substantially longer survey instrument. In this case, postage for the initial packets to mail respondents would be more expensive than postage for outreach to IVR and web sample, thereby creating a significant differential between the outbound mailing costs across the 3 modes. Of course, a longer survey could also differentially affect response rates, which could further alter the cost per unique respondent reported here.
There are several relevant study limitations. First, a mailed invitation letter was used for all targeted respondents, irrespective of mode. Response rates by web and IVR might have been higher if it had been possible to use e-mail and telephone, respectively, to invite participation, simplifying the response task in those modes. Second, the specific set-up and pacing of the IVR used in this study may have contrib- uted to the IVR mode effect and might not generalize to other IVR systems, particularly where the listing of response op- tions is handled differently. Third, the costs incurred for this experiment reflect the rates of one survey vendor and may not generalize to all vendors or organizations that administer their own surveys. Finally, web response rates are certainly influ- enced by household Internet access, which varies markedly by state and by market within state.34 However, although market differences in web access may affect the generaliz- ability of web-based response rates, these differences should not affect the generalizability of our finding regarding the equivalence of substantive results produced by mail and web surveys.
In conclusion, the findings offer a mixed view concern- ing the feasibility and merits of moving to incorporate web and IVR into initiatives seeking patients' experiences with individual physicians. The data quality obtained through these modes was high. Web and mail yielded substantively identical results for individual physicians; and IVR results could be made comparable with a simple statistical adjust- ment for mode. However, response rates obtained by web and IVR alone were probably unacceptably low for most stake- holders' purposes. Crossover mailings were required to boost response rates to more acceptable levels, and these mailings added costs to the overall data collection process for the web and IVR arms. Moreover, in this initiative, mailings were necessary as the initial form of outreach to web and IVR respondents, and this further dampened the potential cost saving of these modes. Thus, the notion of introducing web and IVR as a means to lower the cost of data collection and
thereby address a significant barrier to obtaining physician- specific information from patients is not yet a reality. To realize the potential cost savings of modes that represent alter- natives to mail, it will be necessary to address their current practical limitations, including developing capacity for low-cost outreach in these modes and boosting response rates to accept- able levels without crossover mailings. In the meantime, there may be some value to giving patients a choice of modes, as several large-scale initiatives are currently doing.3'5
REFERENCES 1. Institute of Medicine. Crossing the Quality Chasm: A New Health
System for the Twenty-first Century. Washington, DC: National Acad- emy Press; 2001.
2. Safran DG. An introduction to the CAHPS Ambulatory Care Surveys: CAHPS Clinician/Group Survey. Paper presented at: CAHPS Across the Health Care Continuum: 9th National User Group Meeting; December 2, 2004; Baltimore, MD.
3. Miller S. American Board of Medical Specialties; Implementing the CAHPS Ambulatory Care Survey: a panel discussion of current and planned activities. Paper presented at: CAHPS Across the Health Care Continuum: 9th National User Group Meeting; December 2, 2004; Baltimore, MD.
4. Scholle SH. National Committee for Quality Assurance; Implementing the CAHPS Ambulatory Care Survey: a panel discussion of current and planned activities. Paper presented at: CAHPS Across the Health Care Continuum: 9th National User Group Meeting; December 2, 2004; Baltimore, MD.
5. Karp M. Massachusetts Health Quality Partners; Implementing the CAHPS Ambulatory Care Survey: a panel discussion of current and planned activ- ities. Paper presented at: CAHPS Across the Health Care Continuum: 9th National User Group Meeting; December 2, 2004; Baltimore, MD.
6. Hays RD, Chong K, Brown J, et al. Patient reports and ratings of individual physicians: an evaluation of the doctorguide and consumer assessment of health plans study provider-level surveys. Am JMed Qual. 2003;18:190-196.
7. Safran DG, Karp M, Coltin K, et al. Measuring patients' experiences with individual primary care physicians: results of a statewide demon- stration project. J Gen Intern Med. 2006;21:13-21.
8. Mehta R, Sivadas E. Comparing response rates and response content in mail versus electronic mail surveys. J Market Res Soc. 1995;37:429- 439.
9. Braithwaite D, Emery J, De Lusignan S, et al. Using the Internet to conduct surveys of health professionals: a valid alternative? Fam Pract. 2003;20:545-551.
10. Couper MP, Blair J, Triplett T. A Comparison of mail and e-mail for a survey of employees in U.S. statistical agencies. J Official Stat. 1999; 15:39-56.
11. Janda LH, Janda M, Tedford E. IVR test & survey: a computer program to collect data via computerized telephonic applications. Behav Res Methods Instr Computers. 2001;33:513-516.
12. Baer L, Jacobs DG, Cukor P, et al. Automated telephone screening survey for depression. JAMA 1995;273:1943-1944.
13. Karp M, Safran DG, Coltin K. Final Report on the Massachusetts Ambulatory Care Experiences Survey Project. Waltham, MA, Mass. Health Quality Partners; 2004.
14. StataCorp. Stata Statistical Software Reference Manual: Release 7.0. College Station, TX: Stata Corporation; 2001.
15. Kittleson MJ. An assessment of the response rate via the postal service and e-mail. Health Values. 1995;19:27-29.
16. Harewood GC, Wiersema MJ, de Groen PC. Utility of Web-based assessment of patient satisfaction with endoscopy. Am J Gastroenterol. 2003;98:1016-1021.
17. Paolo AM, Bonaminio GA, Gibson C, et al. Response rate comparisons of e-mail- and mail-distributed student evaluations. Teaching Learning Med. 2000;12:81-84.
18. Leece P. Correction and republication: Internet versus mailed question- naires: a controlled [correction of "Randomized"] - Comparison (2) (vol 4, pg 6, 2004). J Med Internet Res. 2004;6:85-93.
? 2006 Lippincott Williams & Wilkins
Medical Care ? Volume 44, Number 2, February 2006 Effect of Survey Mode on Data Quality
173
This content downloaded from 128.97.228.61 on Sat, 4 May 2013 18:49:01 PMAll use subject to JSTOR Terms and Conditions
Rodriguez et al Medical Care * Volume 44, Number 2, February 2006
19. McMahon SR, Iwamoto M, Massoudi MS, et al. Comparison of e-mail, fax, and postal surveys of pediatricians. Pediatrics. 2003; 111:e299- e303.
20. Kim HL, Gerber GS, Patel RV, et al. Practice patterns in the treatment of female urinary incontinence: a postal and Internet survey. Urology. 2001;57:45-48.
21. Raziano DB, Jayadevappa R, Valenzula D, et al. E-mail versus conven- tional postal mail survey of geriatric chiefs. Gerontologist. 2001;41: 799-804.
22. Schonlau M, Asch BJ, Du C. Web surveys as part of a mixed-mode strategy for populations that cannot be contacted by e-mail. Social Science Computer Rev. 2003;21:218-222.
23. McCabe SE, Boyd CJ, Couper MP, et al. Mode effects for collecting alcohol and other drug use data: web and U.S. mail. J Stud Alcohol. 2002;63:755-761.
24. Ritter P, Lorig K, Laurent D, et al. Internet versus mailed questionnaires: a randomized comparison. J Med Internet Res. 2004;6:e29.
25. Tse ACB, Tse KC, Yin CH, et al. Comparing 2 methods of sending out questionnaires-e-mail versus mail. J Market Res Soc. 1995;37:441-446.
26. Dillman DA, Christian LM. Survey Mode as a Source of Instability in Responses across Surveys. Field Methods. 2005;17:30-52.
27. Brewer NT, Hallman WK, Fiedler N, et al. Why do people report better health by phone than by mail? Med Care. 2004;42:875-883.
28. Holbrook AL, Green MC, Krosnick JA. Telephone versus face-to-face interviewing of national probability samples with long questionnaires- Comparisons of respondent satisficing and social desirability response bias. Public Opinion Quarterly. 2003;67:79-125.
29. Hochstim JR. A critical comparison of three strategies of collecting data from households. J Am Stat Assoc. 1967;62:976-989.
30. Perkins JJ, Sanson-Fisher RW. An examination of self- and telephone- administered modes of administration for the Australian SF-36. J Clin Epidemiol. 1998;51:969-973.
31. Burroughs TE, Waterman BM, Cira JC, et al. Patient satisfaction measurement strategies: a comparison of phone and mail methods. Jt Comm J Qual Improv. 2001;27:349-361.
32. Fowler FJ Jr, Gallagher PM, Nederend S. Comparing telephone and mail responses to the CAHPS survey instrument. Consumer Assessment of Health Plans Study. Med Care. 1999;37(3 Suppl):MS41-MS49.
33. Schonlau M, Fricker R, Elliott M. Conducting Research Surveys Via E-Mail and the Web. Santa Monica, CA: RAND; 2002.
34. Presence of Computer and the Internet for Households, by State: September 2001. U.S. Census Bureau, Current Population Survey; 2004.
( 2006 Lippincott Williams & Wilkins
Rodriguez et al Medical Care * Volume 44, Number 2, February 2006
174
This content downloaded from 128.97.228.61 on Sat, 4 May 2013 18:49:01 PMAll use subject to JSTOR Terms and Conditions