evaluating multimodal driver displays under varying situational urgency
TRANSCRIPT

Evaluating Multimodal Driver Displays under Varying Situational Urgency
Ioannis Politis1, Stephen Brewster
2
Glasgow Interactive Systems Group
School of Computing Science
University of Glasgow
Glasgow, G12 8QQ, UK [email protected]
Frank Pollick
School of Psychology
University of Glasgow
Glasgow G12 8QB, UK
ABSTRACT
Previous studies have investigated audio, visual and tactile
driver warnings, indicating the importance of communi-
cating the appropriate level of urgency to the drivers. How-
ever, these modalities have never been combined exhaust-
ively and tested under conditions of varying situational ur-
gency to assess their effectiveness both in the presence and
absence of critical driving events. This paper describes an
experiment evaluating all multimodal combinations of such
warnings under two contexts of situational urgency: a lead
car braking and not braking. The results showed that partic-
ipants responded quicker to more urgent warnings, especial-
ly in the presence of a car braking. They also responded
faster to the multimodal as opposed to unimodal signals.
Driving behaviour improved in the presence of the warn-
ings and the absence of a car braking. These results high-
light the influence of urgency and number of modalities in
warning design and indicate the utility of non-visual warn-
ings in driving.
Author Keywords
Multimodal Interaction; Warnings; Audio; Visual; Tactile;
Situational Urgency; Response Time; Lateral Deviation;
Steering Angle; Simulator.
ACM Classification Keywords
H.5.2 [Information interfaces and presentation]: User Inter-
faces. -Auditory (non-speech) feedback; Haptic I/O.
INTRODUCTION
Multimodal displays are increasingly finding their way in-
side the car, making the driving experience more and more
multisensory [13]. While this offers potential for designing
a wealth of warnings for the driver, there is on-going re-
search into which warnings offer the best results. Several
combinations of audio, visual and tactile modalities have
been utilized to design driver alerts [7,11,24,27,31]. How-
ever, there has been no exhaustive research on how all uni-
modal and multimodal combinations of these modalities
perform when situational urgency is varied. Effective warn-
ings need to aid rather than hinder the driving task when
critical events arise, for example when a car in front brakes
rapidly. Therefore, it is essential to compare drivers’ per-
formance when exposed to warnings both in the presence
and the absence of such events to ensure their effectiveness
in different driving settings. This has not been addressed
before and is important so as to extend knowledge on mul-
timodal warning design.
This paper presents an experiment where all combinations
of audio, tactile and visual modalities were used to alert
drivers in a simulated driving task (see Figure 1). The sig-
nals were designed across three different urgency levels,
according to existing guidelines [9,10,24,28]. Situational
urgency was varied by manipulating the behaviour of a
simulated lead vehicle. The study aimed to reveal how par-
ticipants would respond to the presentation of differently
urgent signals in the presence or absence of a critical event
and how driving behaviour would be influenced by the par-
allel presentation of such an event.
Figure 1. The setup of the experiment. Headphones, tac-
tile belt and computer screen were used to deliver the
multimodal signals.
Permission to make digital or hard copies of all or part of this work for personal or
classroom use is granted without fee provided that copies are not made or distributed
for profit or commercial advantage and that copies bear this notice and the full cita-
tion on the first page. Copyrights for components of this work owned by others than
ACM must be honored. Abstracting with credit is permitted. To copy otherwise, or
republish, to post on servers or to redistribute to lists, requires prior specific permis-
sion and/or a fee. Request permissions from [email protected].
CHI 2014, April 26 - May 01 2014, Toronto, ON, Canada
Copyright 2014 ACM 978-1-4503-2473-1/14/04…$15.00.
http://dx.doi.org/10.1145/2556288.2556988
Session: Driving Interfaces and Evaluations CHI 2014, One of a CHInd, Toronto, ON, Canada
4067

In summary, the following guidelines can be derived from
this work:
Using bimodal and trimodal warnings rather than uni-
modal ones can cause faster reaction times to critical
events;
Using warnings of high designed urgency can speed up
reactions critical situations;
Using warnings of medium designed urgency can provide
an overall alertness, as well as improved lane keeping and
steering behavior when no critical event is present;
Non-visual signals are more effective in visually demand-
ing situations.
RELATED WORK
A number of studies indicate the usefulness of multimodal
displays for providing information related to the driving
task. Ablaßmeier et al. [1] used a head-up display (HUD) to
provide such information and observed fewer glances and
higher acceptance in comparison to a central information
display. Ho & Spence [12] showed that responses to a criti-
cal event were more rapid when naturalistic audio cues (car
horn sounds) come from the direction of the event (front or
back) and when participants’ attention was directed to the
appropriate direction through a verbal cue. Further, accord-
ing to Ho, Tan & Spence [14] vibrotactile cues presented
from the same direction as an approaching threat (front or
back) can decrease drivers’ reaction times during a simulat-
ed driving task, compared to cues presented from the oppo-
site direction.
Using bimodal signals, Ho, Reed & Spence [11] showed the
potential of audiotactile presentation in front-to-rear-end
collision warnings, using vibration on the torso and a car
horn sound. These bimodal warnings led to lower reaction
times in a simulated driving task compared to the unimodal
variants. Using audio, tactile as well as visual modalities for
alerting drivers, Scott & Gray [31] found that tactile warn-
ings on the abdomen, simulating seat belt warnings, can
induce quicker reactions in a critical driving situation com-
pared to sounds and visual warnings on the dashboard. The
signals used in their study were unimodal, so no modality
combinations were used. Murata, Kanbayashi & Hayami
[25] presented a study using some combinations of audio,
tactile and visual modalities to alert drivers of an approach-
ing hazard. The three modalities in isolation, as well as the
combinations of audio + tactile, audio + visual and visual +
tactile modalities were used (the trimodal combination was
not used). Results showed that tactile and audio + tactile
warnings produced the shortest reaction times to presented
hazards. Oskarsson, Eriksson & Carlander [26] investigated
the use of the trimodal combination when driving a simu-
lated combat vehicle. The cues used were abstract sound
and vibration patterns and a visual pointer to a virtual threat
in the simulator. When responding to the stimuli by turning
the vehicle as fast and as accurately as possible and firing at
the target, it was found that the use of trimodal combina-
tions of audio, visual and tactile cues improved perfor-
mance compared to the unimodal presentation of the warn-
ings. There was also no increase in mental workload when
the trimodal displays were used.
The studies described above have investigated some of the
unimodal and multimodal combinations of warnings. How-
ever, the urgency designed in the warnings was not varied.
Additionally, not all combinations of the audio, visual or
tactile modalities were used in warnings. In our study, all
combinations of modalities are used in warnings designed
to convey different urgency levels.
Warnings of Varying Urgency
In the aforementioned work, the signals were designed to
convey a single level of urgency, usually related to critical
events. However, in a real driving situation, alerts may not
always refer to situations that are equally urgent. Kaufmann
et al. [18] presented a set of guidelines for the use of audio,
tactile and visual warnings along three priority levels. The
authors defined high priority warnings as requiring imme-
diate action, while medium required no immediate reaction
and low priority ones bore no immediate relevance to the
driving task. Audio and tactile modalities were demonstrat-
ed as suitable for high priority messages, visual and tactile
for medium and audio and visual for low priority ones. The
suggestions were based on measures of speed and steering
performance of participants, while response times to the
signals were not measured and modality combinations were
not tested exhaustively.
Cao et al. [7] investigated the use of audio and tactile cues
conveying four different levels of urgency. Number of
pulses and inter-pulse-interval were manipulated for all
cues to signify urgency. Additionally, pitch was manipulat-
ed for the audio cues and intensity for the tactile ones. The
main task in this study was visual tracking with different
levels of auditory distractions (namely radio, conversation
and noise) but no driving task was simulated. A general
trend of higher urgency = faster response was found, indi-
cating that the designed urgency of the cues was successful-
ly perceived. Vibration cues were also identified more ac-
curately but sound cues more quickly. Finally, sound cues
were reported as easier to distinguish by the participants.
Serrano et al. [32] tested a set of speech messages indicat-
ing either a hazardous or a non-hazardous situation. They
presented these messages followed by pictures of either
hazardous or non-hazardous road scenes, asking drivers to
identify whether the scenes were hazardous or not by press-
ing a button. Reaction times of drivers to this identification
task were shorter and responses more accurate when the
speech messages were presented from the direction of the
hazard (informative) as opposed to a random direction
(non-informative). Reaction times were also shorter for
informative messages, when the direction of the threat (left
or right) was uttered in the message as opposed to not spec-
ified. In our study, all multimodal combinations of cues,
rather than only audio, were presented from the direction of
Session: Driving Interfaces and Evaluations CHI 2014, One of a CHInd, Toronto, ON, Canada
4068

the hazard along with a simulated driving task, rather than a
visual recognition task.
Lindgren et al. [21] investigated a set of integrated visual
and auditory warnings for events in the driving task varying
in criticality. Auditory warnings similar to commercially
available ones for collision avoidance, lane departure and
curve speed were provided with or without advisory warn-
ings in a driving simulator. The advisory warnings were
visual indicators, graphically showing the distance of the
car to a vehicle in front, behind or relative to a curve. It was
found that the presence of warnings did not influence the
driving speed or how often drivers moved their gaze off the
road. Additionally, participants drove with higher average
lateral deviation from the centre of the lane when no warn-
ings were present, indicating a lower level of vigilance.
However, these driving metrics were averaged per condi-
tion (i.e. no warnings, auditory warnings only, auditory +
advisory warnings) and not per warning used. In the present
study, we examine lateral deviation in greater accuracy and
present steering angle measurements for every multimodal
warning rather than for a whole condition.
Using audio, visual and tactile modalities, Lewis et al. [20]
observed quicker response times in bimodal cues compared
to unimodal ones and in high urgency warnings compared
to low urgency ones. Measures of response times were tak-
en with a primary simulated driving task and under two
conditions of memory load in a secondary memory task
(high load and low load). Performance was especially im-
proved in the low load task compared to the high one. In-
creasing the levels of urgency and the number of modalities
used, Politis, Brewster & Pollick [27] evaluated all unimod-
al, bimodal and trimodal combinations of audio, visual and
tactile warnings to alert drivers of events in three urgency
levels. These were impending collision (high urgency), low
fuel (medium urgency) and incoming message (low urgen-
cy). Participants were engaged in a simulated driving task
and were asked to rate the stimuli in terms of urgency and
annoyance, as well as recognise the level of urgency to
which each signal belonged. It was found that participants
recognised highly urgent signals most quickly, while in-
creasing the number of modalities used in warnings (one,
two or three) caused higher ratings of urgency and lower
response times. Ratings of annoyance were also higher as
more modalities were used, but the observed effect of an-
noyance was lower compared to urgency.
The above studies have investigated the effect of designed
urgency in warnings in the audio, visual and tactile modali-
ties. With the exception of [27], the warnings evaluated did
not involve all the combinations of these modalities in dif-
ferent levels of urgency. Additionally, in [27] the response
times were gathered during a cue recognition task involving
button pressing, with limited ecological validity. In the
study presented here, responses are gathered during a simu-
lated braking event with higher realism. The scope of [27]
is also extended by evaluating the multimodal warnings
used in different contexts of situational urgency.
Guidelines for Warning Urgency Design
There have been numerous studies investigating how signal
parameters of warnings relate to their perceived urgency.
Edworthy, Loxley & Dennis [9] showed that higher funda-
mental frequency, higher speed and larger pitch range can
increase the perceived urgency ratings of auditory warn-
ings. Edworthy et al. [8] observed significantly lower re-
sponse times for highly urgent warnings, compared to
warnings designed to be of medium and low urgency levels.
Marshall, Lee & Austria [24] demonstrated how parameters
like higher pulse duration and lower interpulse interval in-
creased ratings of urgency of audio alerts. Different sound
cues were investigated in three driving contexts of varying
urgency, namely impending collision, navigation and email
messages. Baldwin [3] reported how stimulus intensity in-
fluenced the ratings of perceived urgency and response
times in a simulated driving task.
Gonzalez et al. [10] found that fundamental frequency,
pulse rate and intensity of warning sounds positively influ-
enced the ratings of urgency and annoyance of participants.
However, pulse rate was suggested as the most suitable for
conveying events of varying urgency, since it did not elicit
such high ratings of annoyance compared to the ratings of
urgency. In this study no simulated driving task was pre-
sent. Pratt et al. [28] reported a similar observation for the
tactile modality, where pulse rate was found to positively
influence the ratings of perceived urgency and to have less
impact on the ratings of perceived annoyance. Extending
the investigation to audio, tactile and visual modalities
Baldwin et al. [2] and Lewis & Baldwin [19] initiated the
creation of a crossmodal urgency scale. Pulse rate (flash
rate for visual signals) was suggested as an effective pa-
rameter to vary urgency across these three modalities.
Sound intensity and frequency were effective for audio sig-
nals, with word choice and colours for visual ones. In [2],
Baldwin et al. mention that there is limited information
regarding the impact of presenting warnings of multiple
modalities to drivers in varying situational urgency con-
texts. This is addressed in our study by evaluating the cues
under different simulated events, namely the front vehicle
braking and not braking.
The Effect of Situational Urgency
As described earlier, there is interest in investigating how
the modality combinations perform in situations of different
urgency. This will provide insight into whether the response
to the cues will be affected by events that occur when driv-
ing. In all the studies discussed above, participants’ re-
sponses were acquired under situations of urgency that did
not vary. Whether they were critical events, such as an im-
pending collision or less critical, such as navigational in-
structions, all responses were measured only in the presence
of these events and not in their absence. It is important to
evaluate the cues under varying levels of situational urgen-
Session: Driving Interfaces and Evaluations CHI 2014, One of a CHInd, Toronto, ON, Canada
4069
cy to understand how this affects their performance. For
example, they may be effective in one setting but perform
poorly in another. Serrano et al. [32] have partly addressed
this by treating events like lane departure and increased
speed when entering curves as differently urgent. However,
they did not test all combinations of multimodal cues.
Lindgren et al. [21] also used different urgency levels but
their scenarios were only presented as pictures. They also
only tested audio warnings. Therefore, as also acknowl-
edged in [2], there remain many questions around the de-
sign of multimodal cues for creating messages of different
urgency levels and their evaluation in a driving simulator.
We address these questions in this paper.
SITUATIONAL URGENCY EXPERIMENT
A set of multimodal warnings was designed to represent
three different levels of urgency and tested in a driving
simulator. We tested them across three levels of situational
urgency: a lead car braking and a warning presented, a lead
car braking with no warning presented and just a warning
presented. The goal was to investigate the effect of the situ-
ation simulated on observed driver responses. As described
above, several studies have reported how designed urgency
and modality affected response times, for example
[8,11,27]. The influence of modalities used in warnings to
lateral deviation and steering angle has also been shown in
the past, for example in [21]. Therefore, it was hypothe-
sized that in our study response times and driving behaviour
would be influenced by the modalities used in the warnings,
the level of designed urgency of the warnings, as well as the
situational urgency of the simulated event.
Warning Design
The set of warnings used in this study were identical to
those in [27]. As in [27], three Levels of Designed Urgency
(LDU) were created to indicate conditions varying in im-
portance. LH (Level High) was designed to signify situa-
tions of high urgency, such as an impending collision, LM
(Level Medium) situations of medium urgency, such as low
fuel and LL (Level Low) situations of low urgency, such as
an incoming message. All unimodal and multimodal com-
binations of the audio, visual and tactile modalities were
used in the warnings: Audio (A), Visual (V), Tactile (T),
Audio + Visual (AV), Audio + Tactile (AT), Tactile + Vis-
ual (TV), Audio + Tactile + Visual (ATV). The result was
21 different signals: 7 signals with the above modalities × 3
levels of designed urgency.
Pure tones, colours or vibrations were used in the warnings
and were delivered repeatedly as pulses to the participants.
Depending on the level of urgency, pulse rate varied, in-
creasing as signals became more urgent, as in [2,19,27].
Independent of modality, warnings of the same urgency
level had the same pulse rate. 8 pulses with 0.1 sec single
pulse duration and 0.1 sec interpulse interval were used for
LH, 5 pulses with 0.17 sec single pulse duration and 0.17
sec interpulse interval for LM and 2 pulses with 0.5 sec
single pulse duration and 0.5 sec interpulse interval for LL.
All warnings lasted 1.5 sec each.
Auditory warnings were additionally varied in base fre-
quency, as suggested in [2,9,19,24] (1000 Hz for LH, 700
Hz for LM and 400 Hz for LL).Visual warnings were also
varied in colour, in line with [2,27] (Red for LH, Orange for
LM and Yellow for LL 1
). A C2 Tactor from Engineering
Acoustics2 was used for the tactile stimuli, a common de-
vice in studies of tactile feedback, e.g. [15,16]. Tactile
stimuli had a constant frequency of 250 Hz, the nominal
centre frequency of the C2 - the frequency at which the skin
is most sensitive. Stimulus intensity was kept constant in all
modalities, to avoid discomfort, a common practice in stud-
ies of both Earcons and Tactons [15,16]. Simultaneous de-
livery of unimodal signals was used for multimodal ones, to
create a synchronous effect of sound, vibration, visuals and
their combinations.
Driving Metrics
In addition to measuring the response times of drivers to
warnings, we also measured lateral deviation and variation
of steering angle to give a complete picture of performance.
Lower lateral deviation and variation of the steering angle
indicate lower driver distraction [21,23]. As in [6,30], the
Root Mean Square Error (RMSE) of the vehicle’s lateral
deviation and steering angle were used as metrics of driver
distraction. The effect of presenting multimodal warnings in
the presence and the absence of a critical event on these
driving metrics has not been investigated in the past.
Experiment Design
A 7×3×3 within subjects design was used for this experi-
ment, with Modality, LDU and Situational Urgency as the
Independent Variables. Response Time (RT), RMSE of
Lateral Deviation (LatDev) and RMSE of Steering Angle
(SteAng) were Dependent Variables. Modality had 7 levels:
A, T, V, AT, AV, TV, ATV. LDU had 3 levels: LH (High
Urgency), LM (Medium Urgency) and LL (Low Urgency).
Situational urgency had 3 levels: Car Braking + No Warn-
ing Presented, No Car Braking + Warning Presented and
Car Braking + Warning Presented. There were the follow-
ing hypotheses:
The observed values of RT will be affected by the Situa-
tional Urgency simulated (H1a), the LDU of the warnings
(H1b) and the Modality of the warnings (H1c).
The observed values of LatDev will be affected by the
Situational Urgency simulated (H2a), the LDU of the
warnings (H2b) and the Modality of the warnings (H2c).
1 Red was RGB(255,0,0), Orange was RGB(255,127,0) and
Yellow was RGB(255,255,0).
2 http://www.atactech.com/PR_tactors.html
Session: Driving Interfaces and Evaluations CHI 2014, One of a CHInd, Toronto, ON, Canada
4070
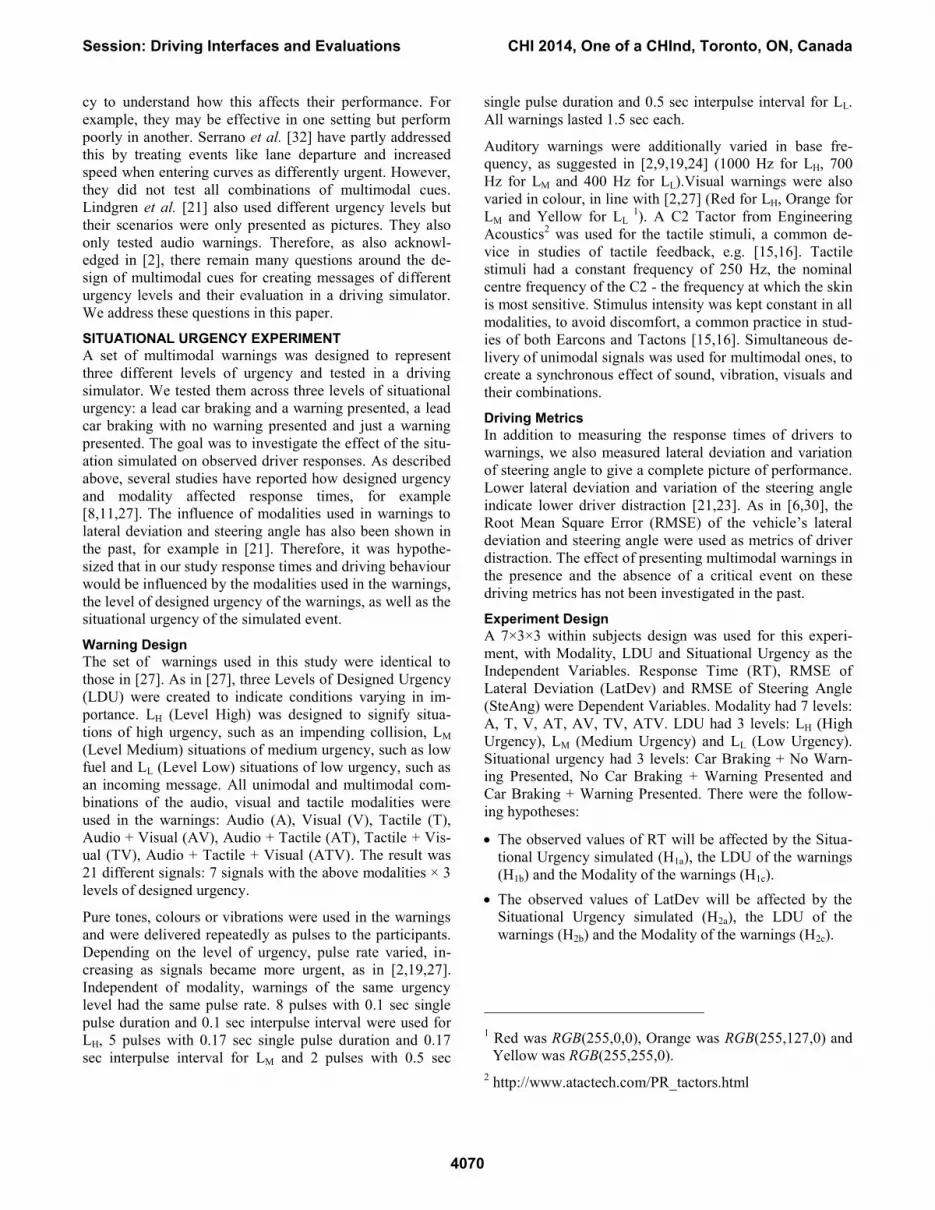
Figure 2. (a) A screen from the simulator software,
depicting the front car braking and a visual stimulus
of medium LDU presented. (b) The waist belt used to
provide tactile stimuli, Tactor is highlighted.
The observed values of SteAng will be affected by the
Situational Urgency simulated (H3a), the LDU of the
warnings (H3b) and the Modality of the warnings (H3c).
Participants
Fifteen participants (10 female) aged between 19 and 28
years (M = 22.67, SD = 2.66) took part. They all held a val-
id driving license and had between 1.5 and 8 years of driv-
ing experience (M = 4.5, SD = 2.02). There were 14 univer-
sity students and one journalist. They reported normal or
corrected to normal vision and hearing and no injuries
around the abdominal area where vibrations were delivered.
Equipment
The experiment took place in a usability lab, where partici-
pants sat on a chair in front of a desk with a 27-inch Dell
2709W monitor and a PC running the simulator software. In
the software a three lane road in a rural area with a lead car
was depicted, maintaining a steady speed (see Figure 2.a).
This simulator has been used in several previous research
studies, e.g. [6]. As in [6], safety cones were placed on ei-
ther side of the central lane, to reinforce lane keeping. Par-
ticipants used the Logitech G273 gaming wheel to steer the
simulated vehicle and brake. Participants’ inputs were
logged with a frequency of 50 Hz. Sound was delivered
through a set of Sennheiser HD 25-1 headphones. Tactile
3 http://gaming.logitech.com/en-gb/product/g27-racing-
wheel
cues were delivered through a C2 Tactor attached to an ad-
justable waist belt. The belt was placed by the participants
in the middle of the abdominal area and was designed to
simulate a vibrating seat belt, similar to [27,31]. Visual cues
were delivered through coloured circles that flashed in the
top central area of the screen, and were sized 400×400 pix-
els (12×12 cm). The circles did not obstruct the lead car and
were designed to simulate the feedback of a HUD. Figure 1
depicts the setup of the experiment, Figure 2.a a screen
from the simulator with the car braking and a visual signal
presented and Figure 2.b the waist belt and Tactor.
Procedure
Participants were welcomed and provided with a brief in-
troduction. To cover any noise from the Tactor, car sound
was heard through the headphones throughout the experi-
ment. The car sound was an extract from a recording of a
vehicle idling, retrieved from the Internet.
Before beginning the procedure, all 21 signals were played
once to the participants, always in the following order: A →
V → T → AV → AT → TV → ATV for LH, then the same
order for LM and then for LL. In two cases, sound and vibra-
tion were slightly adjusted to maintain comfortable intensi-
ties. No specific information about the levels of designed
urgency was given to the participants. The only information
provided was that the signals presented were not always
designed to convey the same level of urgency. Next, partic-
ipants were asked to drive with the simulator for 90 sec, to
get accustomed to the experimental setup.
In the main part of the experiment, participants were pre-
sented with a driving scene, where they drove a simulated
vehicle along a straight rural road and followed a car in
front. Participants were able to steer the vehicle and brake,
but did not use the accelerator pedal, since the controlled
vehicle maintained a constant speed of about 80 mph. This
speed was chosen so as to exceed the UK motorway speed
limit (70 mph) and create a hazardous driving situation re-
quiring the drivers’ attention. The participants encountered
three possible situations during one session. The first in-
volved the front car braking and a warning presented at the
same time (Car & Stimulus: CarStim). The second situation
involved only the Car braking (Car) and the third only the
warning presented (Stim). There were 21 trials for each of
the CarStim, Car and Stim conditions (one for each type of
multimodal warning). This resulted in 63 trials, which hap-
pened in a random order and were separated by a random
interval of any integral value of 8 – 20 sec. These values
were chosen to be similar to previous studies investigating a
repeated occurrence of critical events in the driving task,
such as [11,12,14,27] and gave the driver time to settle back
into driving before receiving another warning.
Participants were asked to maintain a central position in the
lane and press the brake whenever they saw the front car
braking, or felt a stimulus presented or both of the above.
Their RT was calculated from the onset of the stimulus and
/ or the start of the braking event of the lead car, until the
Session: Driving Interfaces and Evaluations CHI 2014, One of a CHInd, Toronto, ON, Canada
4071

participant first pressed the brake pedal. Their LatDev and
SteAng were logged from 4 seconds to 1 second before any
situation arose, forming their baseline value for driving
performance. They were logged again for 3 seconds imme-
diately after the event to assess the effects on driving. For
both LatDev and SteAng, the RMSE values were then com-
puted from the logged values. As a result, for each of the 63
trials of one condition, there was one value for each partici-
pant’s RT, two values for their LatDev (baseline value and
value after the situation arose) and two values for their
SteAng (baseline value and value after the situation arose).
Each participant repeated the above procedure twice during
the course of a week. After the second session the experi-
ment was concluded and participants were debriefed. The
experiment lasted about 120 minutes (60 min per session)
and participants received payment of £12.
RESULTS
Response Time
Data for response time were first analysed using a one-way
ANOVA with Situational Urgency as a factor. There was a
significant effect of situation on RT (F(2,1883) = 48.56, p <
0.001, ω = 0.20). Planned contrasts revealed that situation
CarStim induced significantly shorter RT compared to situ-
ations Car and Stim (t(1883) = 9.85, p < 0.001, r = 0.22),
while situations Car and Stim did not differ. As a result H1a
was accepted. See Figure 3.a for the mean response times
across situations.
Data for situations Stim and CarStim, where there was a
signal present, were analysed using a three-way repeated
measures ANOVA, with Situational Urgency, LDU and
Modality as factors. Mauchly’s test revealed that the as-
sumption of sphericity had been violated for Modality,
therefore degrees of freedom for Modality were corrected
using Greenhouse–Geisser estimates.
There was a significant main effect of Situational Urgency
(F(1,27) = 59.34, p < 0.001). Contrasts revealed, as ex-
pected, that situation CarStim induced quicker responses
compared to Stim (F(1,27) = 59.34, r = 0.83, p < 0.001).
There was a significant main effect of LDU (F(2,54) =
12.88, p < 0.001). Contrasts revealed that warnings of LH
induced significantly quicker reactions compared to LM
(F(1,27) = 10.36 , r = 0.53, p < 0.05), while the difference
between levels medium and low did not reach significance
(F(1,27) = 3.865 , p = 0.06). Thus H1b was accepted.
There was also a significant main effect of Modality
(F(4.12,111.16) = 23.39, p < 0.001). Contrasts revealed that
warnings of the AV, ATV, AT and TV modality all created
quicker responses compared to A, V and T warnings
(F(1,27) = 28.18 , r = 0.71, p < 0.001) (see Figure 3.b), as a
result H1c was accepted.
Figure 3. (a) The response times across situations. (b) The
response times across modalities, sorted by their mean
values. (c) The interaction between Situation and Modali-
ty with modalities sorted by their mean values. For all
graphs, error bars represent 95% Confidence Intervals.
Session: Driving Interfaces and Evaluations CHI 2014, One of a CHInd, Toronto, ON, Canada
4072

There was a significant interaction between Situation and
Modality (F(4.83,130.27) = 22.48, p < 0.001). Contrasts
revealed that while in situation Stim, ATV warnings created
significantly quicker responses than AT ones, this effect
was reversed for situation CarStim (F(1,27) = 9.04 , r =
0.50, p < 0.05). Further, AT warnings created significantly
slower responses compared to TV ones in situation Stim,
but this effect was again reversed in situation CarStim
(F(1,27) = 7.43 , r = 0.46, p < 0.05). Finally, A warnings
had significantly slower response times than V in situation
Stim, but this effect was reversed in situation CarStim
(F(1,27) = 32.03 , r = 0.74, p < 0.001), see Figure 3.c.
These results indicate that Situational Urgency, LDU and
Modality all influenced driver responses. They also show
that warnings including visuals did not create as quick re-
sponses in situation CarStim.
Lateral Deviation
Data for LatDev were first analysed using a two-way re-
peated measures ANOVA, with Situation and Time as fac-
tors. Situation had three levels: Stim, Car and CarStim.
Time had two levels: Before Situation (baseline data) and
After Situation (data after the situation arose). Mauchly’s
test revealed that the assumption of sphericity had been
violated for Situation, therefore degrees of freedom for Sit-
uation were corrected using Greenhouse–Geisser estimates.
There was a significant main effect of Situation
(F(1.93,1215.88) = 59.17, p < 0.001). Contrasts revealed
that situation CarStim induced higher values of LatDev
compared to Car (F(1,629) = 81.04, r = 0.34, p < 0.001),
while values of LatDev did not differ among situations Stim
and Car (F(1,629) = 0.56, p = 0.81). There was a significant
main effect of Time (F(1,629) = 258.22, p < 0.001). Con-
trasts revealed that LatDev was significantly lower after any
situation arose compared to before (F(1,629) = 258.22, r =
0.54, p < 0.001).
There was a significant interaction between Situation and
Time (F(1.97,1240.66) = 64.74, p < 0.001). Contrasts re-
vealed that while in situation Car values of LatDev were
lower after the event compared to before it, but there was
no such difference for situation CarStim (F(1,629) =
103.52, r = 0.38, p < 0.001). As a result H2a was accepted.
See Figure 4.a for the interaction between Situation and
Time for LatDev values. A separate four-way ANOVA test
for situations Stim and CarStim (where warnings were pre-
sent) with Situation, Time, LDU and Modality as factors
showed no significant results, so H2b and H2c were rejected.
Steering Angle
Data for SteAng were first analysed using a two-way re-
peated measures ANOVA, with Situation and Time as fac-
tors as above. Mauchly’s test revealed that the assumption
of sphericity had been violated for Situation, therefore de-
grees of freedom for Situation were corrected using Green-
house–Geisser estimates. There was a significant main ef-
fect of Situation (F(1.98,1244.49) = 196.07, p < 0.001).
Contrasts revealed that situation CarStim induced higher
values of SteAng compared to Car (F(1,629) = 297.35, r =
0.57, p < 0.001), while values of SteAng did not differ
among situations Stim and Car (F(1,629) = 0.68, p = 0.79).
There was a significant main effect of Time (F(1,629) =
601.05, p < 0.001). Contrasts revealed that SteAng was
lower after any situation arose compared to before
(F(1,629) = 601.05, r = 0.70, p < 0.001).
There was a significant interaction between Situation and
Time (F(1.93,1216.11) = 317.76, p < 0.001). Contrasts re-
vealed that while in situation Car values of SteAng were
lower after the event compared to before it, this effect was
reversed for situation CarStim (F(1,629) = 421.21, r = 0.63,
p < 0.001). As a result H3a was accepted. See Figure 4.b for
the interaction between Situation and Time for SteAng.
A separate four-way ANOVA for situations Stim and
CarStim (where warnings were present) with Situation,
Time, LDU and Modality as factors showed a significant
interaction between Situation and LDU (F(1.93,55.99) =
4.94, p < 0.05). Contrasts revealed that in situation CarStim
the SteAng was significantly higher for LL compared to LM,
which was not the case in situation S (F(1,29) = 8.99, r =
0.49, p < 0.05).
Figure 4. (a) The interaction between Situation and Time
for Lateral Deviation. (b) The interaction between Situa-
tion and Time for Steering Angle.
Session: Driving Interfaces and Evaluations CHI 2014, One of a CHInd, Toronto, ON, Canada
4073

No other significant findings related to LDU or Modality
were present. As a result H3b was accepted and H3c was
rejected.
Results for LatDev and SteAng both show a differential
effect of Situation and Time in the driving metrics. While in
situations Car and Stim the metrics improved after a situa-
tion arose, this was not the case for CarStim.
DISCUSSION
Response Times
The results for response times indicate a clear advantage of
using warnings in synergy with a critical event in the driv-
ing task (H1a was accepted). This result addresses the re-
search space highlighted by [2,27], providing clear evi-
dence that there is an effect of situational urgency in driver
warnings. While there were no differences in terms of RT
for the simple Car and Stim conditions, when these events
occurred together in CarStim, there was a pronounced ef-
fect in how quickly people reacted. This also extends the
results of Ho & Spence and Ho, Tan & Spence, where spa-
tially predictive audio [12] and vibrotactile cues [14],
meaning cues that correctly predicted the direction of an
approaching threat, resulted in better reaction times com-
pared to their non-predictive variants. A similar result was
also found when combining multimodal audio and visual
cues [22]. In the present study, it became clear that the ad-
vantages of providing combinations of audio, visual and
tactile cues hold not only when they predict the direction
but also the existence of a critical event.
In terms of the modalities used, there was an advantage of
multimodal warnings over unimodal ones in terms of RT,
since A, T and V warnings were all slower than AT, AV,
TV and ATV ones (H1c was accepted). This advantage of
using more than one modality to alert drivers has been dis-
cussed in several previous studies [11,20,26]. However,
never before has this effect been shown in all modality
combinations and with a braking task, rather than just a
button pressing task as in [27]. In the driving context, there
seems to be an additive effect of conveying the same infor-
mation across more than one sensory channel. Possible ex-
planations of this effect will be attempted in future work,
investigating the fit of human data to known models of mul-
tisensory perception, such as the Race Model [29]. As will
be discussed later, this advantage in RT does not necessari-
ly come with a similar advantage in other metrics, such as
LatDev and SteAng. Even so, the benefit of using multi-
modal signals in the driving task, especially when signify-
ing critical situations, is clear.
The level of designed urgency of warnings was another
factor that influenced responses (H1b was accepted). Warn-
ings of high designed urgency elicited significantly quicker
responses, even with no prior information related to the
type or content of the message given to participants. When
asked after each experimental session which properties of
the signals in their opinion affected the perceived urgency
of a stimulus, participants identified interpulse interval,
colour and frequency in almost all cases. This result extends
prior work like [2,20,27] by evaluating reaction time across
unimodal, bimodal and trimodal combinations of warnings
and in varying contexts of situational urgency. Guidelines
related to fundamental frequency of sounds, colour for vis-
uals and interpulse interval for all three modalities used
[9,19,24] seem to apply uniformly in the driving task. These
should be considered when designing driver displays, as the
resulting warnings elicit quicker responses when designed
to be highly urgent. This is an important conclusion espe-
cially as the cues used in this study provided no information
on the event they signified. Future work will explore the
influence of using richer multimodal cues than those used
here and evaluate whether these benefits will hold also in
that case. Previous studies such as [12,20] have looked at
the efficacy of informative driver displays, but there is need
to evaluate how such cues combine multimodally and what
type of information is best delivered in which modality.
Finally, there was a significant decrease in performance
when encountering warnings involving the visual modality
in situation CarStim. None of the advantages of ATV warn-
ings over AT ones, TV ones over AT ones and V warnings
over A ones were present in situation CarStim. This indi-
cates that the benefits of visual signals as driver displays
can be limited when there is high visual load in the task at
hand. The presentation of a car braking was visual and in
combination with visual signals it seemed to damage rather
than benefit the response times. A similar disadvantage of
the visual modality was found in [25]. In [22], there was
also an advantage of audio over visual displays when a vis-
ual indicator to a critical situation was provided. This result
extends [27], where multimodal signals involving visuals
created quicker responses, but in absence of any visually
demanding events in the driving task. Horrey & Wickens
[17] also found that response times to a critical event de-
graded when voice dialling was aided by a head-down dis-
play. Although we used no side task in our study, these re-
sults also suggest a cluttering of the visual modality during
a visual critical event. As a guideline, visual warnings
should be avoided in road events of high situational urgen-
cy, and signals involving audio or tactile modalities should
be preferred, as they reduce the visual load of driving.
Lateral Deviation and Steering Angle
The results of LatDev and SteAng showed a differential
effect of Situation on the driving metrics. Situations Stim
and Car both led to improved lane keeping behaviour and to
less variation in the steering angle (H2a and H3a were ac-
cepted). However, this effect was not present in situation
CarStim. In terms of SteAng, values were significantly
higher after situation CarStim arose. However, the disturb-
ance to the driving behaviour reflected in SteAng was not
high enough to also increase values of LatDev (see Figures
4.a and 4.b). In any case, for both LatDev and SteAng there
was no improvement in situation CarStim.
Session: Driving Interfaces and Evaluations CHI 2014, One of a CHInd, Toronto, ON, Canada
4074

This result can be accounted to the increased workload cre-
ated by situation CarStim. The simultaneous onset of warn-
ings and a critical event may have created a startle effect,
similar to the one observed in [4], where participants’ con-
trol over the simulated vehicle was poor when critical warn-
ings were delivered. This also comes in line with some par-
ticipants’ comments, mentioning that situation CarStim was
startling. Along with the observed increase of reaction
times to signals including the visual modality, this observa-
tion provides evidence for how the increased amount of
visual information can affect driving performance. Lind-
gren et al. [21] and Liu [23] also observed poorer lane
keeping and steering behaviours when using visual as op-
posed to audio displays to aid non-critical tasks (list selec-
tion [21] and navigation [23]). Although no differences in
terms of modalities were found in our study, the findings of
Lindgren et al. and Liu also add to the argument that visual
load is increased during driving. The addition of a critical
visual event as CarStim in the present study could only
have added to this load.
From the results of LatDev and SteAng several conclusions
can be derived. When there is no critical situation demand-
ing attention, multimodal warnings seem to improve driv-
ers’ alertness and lead to a better driving behaviour. The
benefit of this effect disappears when there is a visual task
demanding immediate action, such as situation CarStim.
Although response times improve when a multimodal sig-
nal is presented in situation CarStim, lane keeping behav-
iour is neither improved nor worsened by the cues. Quicker
reactions are essential in more critical situations, so the
benefits of multimodal cues are valuable in this context.
However, lane keeping performance is also essential when
there is no imminent critical event, so the benefit of multi-
modal cues in this case is still present.
Finally, there was a marginally better performance in terms
of SteAng for warnings at LM and in situation CarStim (H3b
was accepted). It appears that warnings of LM aided driving
behaviour in terms of SteAng more than the ones of LL or
LH. Combined with the result of intermediate response
times achieved by these warnings, they seem a good option
to facilitate overall alertness for drivers in situations that
require quick but not immediate responses. Interestingly,
these situations, for example low fuel, were the ones that
these warnings were designed to address.
CONCLUSIONS
This study investigated the effects of varying situational
urgency on the response times, lateral deviation and steer-
ing angle of participants in a simulated driving task. Three
situations were simulated: a car braking without warnings,
warnings without a car braking and both simultaneously.
The results showed a clear reduction in response times to
warnings when the critical event in the driving scene oc-
curred at the same time as a warning. Quicker responses
were observed when responding to bimodal and trimodal
warnings compared to unimodal ones and to warnings of
high urgency compared to medium and low urgency. Fur-
ther, the use of visual warnings slowed responses in the
critical situation, providing evidence of high load in the
visual modality. This effect was also observed in lateral
deviation and steering angle values, where the benefit in
driving metrics when there were either warnings or a criti-
cal event, was not present when the event arose together
with the warnings.
These results extend knowledge of in car warning design by
identifying the effect of situational urgency on participant
response times as well as driving metrics. They also verify
the benefit of using multimodal displays of varying de-
signed urgency to alert drivers in a context of varying situa-
tional urgency, a case not previously simulated. The evi-
dence of high visual load during a critical event highlights
the limitation of the visual modality when encountering
critical events in the driving scene. A unique feature of this
study is that it investigates the effect of multimodal displays
on driving metrics in detail, evaluating driver responses to
each combination of modality and situation. Assessing
these metrics in such detail showed the differential effect of
providing warnings to the lane keeping and steering behav-
iors. These results indicate the utility of multimodal driver
displays when requiring immediate responses and the po-
tential of non-visual warnings to decrease driving workload.
ACKNOWLEDGMENTS
The study was partly funded by Freescale Semiconductor
Inc., Automotive Microcontroller Product Group.
REFERENCES
1. Ablaßmeier, M., Poitschke, T., Wallhoff, F., Bengler,
K., and Rigoll, G. Eye gaze studies comparing head-up
and head-down displays in vehicles. IEEE International
Conference on Multimedia and Expo, IEEE (2007),
2250–2252.
2. Baldwin, C.L., Eisert, J.L., and Garcia, A. Multimodal
urgency coding: auditory, visual, and tactile parameters
and their impact on perceived urgency. Work 41, (2012),
3586–3591.
3. Baldwin, C.L. Verbal collision avoidance messages
during simulated driving: perceived urgency, alerting
effectiveness and annoyance. Ergonomics 54, 4 (2011),
328–337.
4. Bliss, J.P. and Acton, S.A. Alarm mistrust in
automobiles: how collision alarm reliability affects
driving. Applied ergonomics 34, 6 (2003), 499–509.
5. Brewster, S.A., Wright, P.C., and Edwards, A.D.N. An
evaluation of earcons for use in auditory human-
computer interfaces. Proceedings INTER CHI’93, ACM
Press (1993), 222–227.
6. Brumby, D.P., Davies, S.C.E., Janssen, C.P., and Grace,
J.J. Fast or Safe ? How Performance Objectives
Determine Modality Output Choices While Interacting
on the Move. CHI 2011, ACM (2011), 473–482.
Session: Driving Interfaces and Evaluations CHI 2014, One of a CHInd, Toronto, ON, Canada
4075

7. Cao, Y., van der Sluis, F., Theune, M., op den Akker,
R., and Nijholt, A. Evaluating informative auditory and
tactile cues for in-vehicle information systems.
AutomotiveUI ’10, AutomotiveUI (2010), 102 – 109.
8. Edworthy, J., Hellier, E., Walters, K., Weedon, B., and
Adams, A. The Relationship between Task
Performance, Reaction Time, and Perceived Urgency in
Nonverbal Auditory Warnings. HFES Annual Meeting
44, 22 (2000), 674–677.
9. Edworthy, J., Loxley, S., and Dennis, I. Improving
auditory warning design: Relationship between warning
sound parameters and perceived urgency. Human
Factors 33, 2 (1991), 205 –231.
10. Gonzalez, C., Lewis, B.A., Roberts, D.M., Pratt, S.M.,
and Baldwin, C.L. Perceived Urgency and Annoyance
of Auditory Alerts in a Driving Context. HFES Annual
Meeting 56, 1 (2012), 1684–1687.
11. Ho, C., Reed, N., and Spence, C. Multisensory In-Car
Warning Signals for Collision Avoidance. Human
Factors 49, 6 (2007), 1107–1114.
12. Ho, C. and Spence, C. Assessing the effectiveness of
various auditory cues in capturing a driver’s visual
attention. Journal of experimental psychology. Applied
11, 3 (2005), 157–74.
13. Ho, C. and Spence, C. Multisensory Driver. Ashgate,
2008.
14. Ho, C., Tan, H.Z., and Spence, C. Using spatial
vibrotactile cues to direct visual attention in driving
scenes. Traffic Psychology and Behaviour 8, 6 (2005),
397–412.
15. Hoggan, E., Raisamo, R., and Brewster, S.A. Mapping
information to audio and tactile icons. ICMI-MLMI ’09,
(2009), 327 – 334.
16. Hoggan, E.E. and Brewster, S.A. Crossmodal icons for
information display. CHI EA ’06, ACM Press (2006),
857 – 862.
17. Horrey, W.J. and Wickens, C.D. Driving and Side Task
Performance: The Effects of Display Clutter,
Separation, and Modality. Human Factors 46, 4 (2004),
611–624.
18. Kaufmann, C., Ohg, F., Risser, R., Geven, A., and
Sefelin, R. Effects of simultaneous multi-modal
warnings and traffic information on driver behaviour.
Human Centred Design for Intelligent Transport
Systems, (2008), 33–42.
19. Lewis, B.A. and Baldwin, C.L. Equating Perceived
Urgency Across Auditory, Visual, and Tactile Signals.
HFES Annual Meeting 56, 1 (2012), 1307–1311.
20. Lewis, B.A., Penaranda, B.N., Roberts, D.M., and
Baldwin, C.L. Effectiveness of Bimodal Versus
Unimodal Alerts for Distracted Drivers. Human Factors
in Driver Assessment, Training and Vehicle Design,
(2013), 376–382.
21. Lindgren, A., Angelelli, A., Mendoza, P.A., and Chen,
F. Driver behaviour when using an integrated advisory
warning display for advanced driver assistance systems.
IET Intelligent Transport Systems 3, 4 (2009), 390–399.
22. Liu, Y.-C. and Jhuang, J.-W. Effects of in-vehicle
warning information displays with or without spatial
compatibility on driving behaviors and response
performance. Applied ergonomics 43, 4 (2012), 679–86.
23. Liu, Y.C. Comparative study of the effects of auditory,
visual and multimodality displays on drivers’
performance in advanced traveller information systems.
Ergonomics 44, 4 (2001), 425–42.
24. Marshall, D.C., Lee, J.D., and Austria, P.A. Alerts for
In-Vehicle Information Systems: Annoyance, Urgency,
and Appropriateness. Human Factors 49, 1 (2007), 145–
157.
25. Murata, A., Kanbayashi, M., and Hayami, T.
Effectiveness of automotive warning system presented
with multiple sensory modalities. SICE Annual
Conference, IEEE Comput. Soc (2012), 920–925.
26. Oskarsson, P.A., Eriksson, L., and Carlander, O.
Enhanced Perception and Performance by Multimodal
Threat Cueing in Simulated Combat Vehicle. Human
Factors 54, 1 (2011), 122–137.
27. Politis, I., Brewster, S., and Pollick, F. Evaluating
Multimodal Driver Displays of Varying Urgency.
Automotive UI 2013, ACM Press (2013).
28. Pratt, S.M., Lewis, B.A., Penaranda, B.N., Roberts,
D.M., Gonzalez, C., and Baldwin, C.L. Perceived
Urgency Scaling in Tactile Alerts. HFES Annual
Meeting 56, 1 (2012), 1303–1306.
29. Raab, D.H. Statistical Facilitation of Simple Reaction
Times. Transactions of the New York Academy of
Sciences 24, 5 Series II (1962), 574 – 590.
30. Salvucci, D.D. Modeling driver behavior in a cognitive
architecture. Human factors 48, 2 (2006), 362–380.
31. Scott, J.J. and Gray, R. A Comparison of Tactile,
Visual, and Auditory Warnings for Rear-End Collision
Prevention in Simulated Driving. Human Factors 50, 2
(2008), 264–275.
32. Serrano, J., Di Stasi, L.L., Megías, A., and Catena, A.
Effect of directional speech warnings on road hazard
detection. Traffic injury prevention 12, 6 (2011), 630–
635.
Session: Driving Interfaces and Evaluations CHI 2014, One of a CHInd, Toronto, ON, Canada
4076