evaluating alternatives for augmented water quality
TRANSCRIPT
Old Dominion University Old Dominion University
ODU Digital Commons ODU Digital Commons
Civil & Environmental Engineering Theses & Dissertations Civil & Environmental Engineering
Spring 2013
Evaluating Alternatives for Augmented Water Quality Evaluating Alternatives for Augmented Water Quality
Improvement Utilizing Oyster Restoration as Best Management Improvement Utilizing Oyster Restoration as Best Management
Practice (BMP) Practice (BMP)
Stephanie Roberts Long Old Dominion University
Follow this and additional works at: https://digitalcommons.odu.edu/cee_etds
Part of the Environmental Engineering Commons, and the Water Resource Management Commons
Recommended Citation Recommended Citation Long, Stephanie R.. "Evaluating Alternatives for Augmented Water Quality Improvement Utilizing Oyster Restoration as Best Management Practice (BMP)" (2013). Master of Science (MS), Thesis, Civil & Environmental Engineering, Old Dominion University, DOI: 10.25777/mh94-wm09 https://digitalcommons.odu.edu/cee_etds/78
This Thesis is brought to you for free and open access by the Civil & Environmental Engineering at ODU Digital Commons. It has been accepted for inclusion in Civil & Environmental Engineering Theses & Dissertations by an authorized administrator of ODU Digital Commons. For more information, please contact [email protected].
EVALUATING ALTERNATIVES FOR AUGMENTED WATER
QUALITY IMPROVEMENT UTILIZING OYSTER
RESTORATION AS BEST MANAGEMENT PRACTICE (BMP)
by
Stephanie Roberts Long B.S. May 1973, University of Richmond, Virginia
A Thesis Submitted to the Faculty of ' Old Dominion University in Partial Fulfillment of the
Requirements for the Degree of
MASTER OF SCIENCE
ENVIRONMENTAL ENGINEERING
OLD DOMINION UNIVERSITY May 2013
Jaewan Yoon (Director)
Russell Burke (Member)
Sandeep Kumar (Member)
UMI Number: 1523385
All rights reserved
INFORMATION TO ALL USERS The quality of this reproduction is dependent upon the quality of the copy submitted.
In the unlikely event that the author did not send a complete manuscript and there are missing pages, these will be noted. Also, if material had to be removed,
a note will indicate the deletion.
UMIDissertation PiiblishMiQ
UMI 1523385Published by ProQuest LLC 2013. Copyright in the Dissertation held by the Author.
Microform Edition © ProQuest LLC.All rights reserved. This work is protected against
unauthorized copying under Title 17, United States Code.
ProQuest LLC 789 East Eisenhower Parkway
P.O. Box 1346 Ann Arbor, Ml 48106-1346
ABSTRACT
EVALUATING ALTERNATIVES FOR AUGMENTED WATER QUALITY IMPROVEMENT UTILIZING OYSTER RESTORATION AS BEST MANAGEMENT
PRACTICE (BMP)
Stephanie Roberts Long . Old Dominion University Director: Dr.Jaewan Yoon
Due to several anthropogenic influences, the Chesapeake Bay has experienced a
marked decrease in water quality since the colonists arrived at the Jamestown settlement
in Virginia during.the 1600s. Higher concentrations of nitrogen and phosphorus have
enriched the estuaries and coastal waters via point sources (sewage treatment plants and
industrial wastes), nonpoint sources (agricultural run-off and septic tank discharges) and
the atmosphere (Newell et al., 2005). Restoring oyster beds is considered a Best
Management Practice (BMP) to improve water quality as well as provide physical habitat
for aquatic species and a healthier estuarine system (USACE Native Oyster Restoration
Master Plan, 2012). Efforts to assist water quality improvement in conjunction with the
fisheries include declaring sanctuaries for brood-stocks, supplementing hard substrate on
the bottom and aiding natural populations with the addition of hatchery-reared and
disease-resistant stocks in most of the coastal states in United States (Coen &
Luckenbach, 2000). An economic assessment of oyster reefs suggests that restoring the
ecological functions will improve water quality, stabilize shorelines, reduce predation
(Grabowski, 2004) and establish a habitat for breeding grounds that outweighs the
importance of harvestable oyster production (Luckenbach et al., 2005). Statistical
models to investigate factorial multicolinearities between water quality and oyster
restoration activities were developed in this research to evaluate productivity levels of
oyster restoration on multiple substrates, as well as the physical, chemical, hydrological
and biological site characteristics, so that the greatest contributing factors were
systematically identified. Findings from the factorial models were then further utilized to
propose and develop a number of in situ water quality improvement design in forms of
Total Maximum Daily Loads (TMDLs) and Best Management Practices (BMPs). A
factorial model evaluates the relationship among the dependent variable, oyster biomass,
and treatment levels of temperature (which includes seasonal variability), as well as
salinity, TSS (total suspended solids), Escherichia coli/Enterococcus bacterial counts,
depth, dissolved oxygen levels (DO) and nutrients such as nitrogen, phosphorus and
chlorophyll a, and the block levels designated for the model such as alternative substrates
(oyster shells versus riprap, granite, cement, cinder blocks, limestone marl or
combinations). The different scenarios are analyzed utilizing the Factorial Model along
with a Multiple Means Comparison (MMC) to compare the production rates and evaluate
which combination of variables produces the highest biomass of oysters. Once the
variables of greatest impact are identified, BMPs and TMDLs will be identified to aid in
lowering the existing levels and develop future plans for maintaining them. In summary,
this model is being developed for maximizing the likelihood of successful oyster reef
restoration in an effort to establish a healthier ecosystem and to improve overall estuarine
water quality in the Chesapeake Bay estuaries.
KEY WORDS: Water quality, TMDL, BMP, Factorial model, Multi-colinearity, Oyster
restoration
Copyright, 2013, by Stephanie Roberts Long, All Rights Reserved
This thesis is dedicated to my family and Dr. Jaewan Yoon for all the patience and support that they
have shown me during my studies
ACKNOWLEDGEMENTS
There are many people who have contributed to the successful completion
of this thesis. I would like to thank all the committee members for their time and
patience in reviewing this manuscript I would also like to recognize Dr. Yoon
for all the time that he has spent with me on this project since its first conception. --
Also, Dr. Burke has been generous in allowing me to utilize his data from his own
oyster research in this statistical project and has spent hours answering all of my
questions. I feel truly blessed to have worked with these two men and I appreciate
all of their contributions to my education.
I also would like to recognize Kristi Britt at DEQ for her efforts in pulling
Database information on water quality parameters for this study several times. In
addition, I would like to thank Daniel Powell from DSS who also pulled data reports
on fecal coliform counts for me. Mac Sisson from VIMS contributed his database
information as well. Karen Forget with Lynnhaven River Now was a wealth of
information on existing projects occurring in the Lynnhaven as was Steve
McLaughlin with the City of Virginia Beach - Stormwater Management.
vii
TABLE OF CONTENTS
Page
LIST OF TABLES........................................................................................................viii
LIST OF FIGURES.......................................................................................................ix
Chapter
1.INTRODUCTION......................................................................................................11.1 BACKGROUND................. ......11.2 PROBLEM STATEMENT............................................................................. 21.3 OBJECTIVES..................... ;.............................. ::.........31.4 TMDL AND BEST MANAGEMENT PRACTICES (BMPs)..................... 3
2 .LITERATURE REVIEW................................................... ....................................... 92.1 TOTAL MAXIMUM DAILY LOADS (TMDLS)........................................92.2 TMDL DEVELOPMENT................................................................................152.3 BEST MANAGEMENT PRACTICES (BMPs)................................. ........... 162.4 STUDY SITES .... ............ ................................... ......... .......... ............ 17
3..0YSTER RESTORATION AS WATER QUALITY IMPROVEMENT ............. 203.1 DESIRED CONDITIONS FOR OYSTER RESTORATION.......................203.2 SUBSTRATES ....................................................... .............................. 26
4. METHODOLOGY.......... ................ ..........................................................................304.1 PROCEDURES/METHODOLOGY........................ ....................................... 304.2 STATISTICAL MODELS FOR EVALUATING FACTORIAL
MULTICOLINEARITIES............................................................................... 36
5.RESULTS AND DISCUSSION ....................................................................... 425.1 STATISTICAL EVALUATION................................. .................... 425.2 TMDL AND BEST MANAGEMENT PRACTICES IMPACT....................58
6.CONCLUSIONS AND RECOMMENDATIONS.............................. .....................616.1 BRIEF OVERVIEW .................................................................................616.2 STATISTICAL SUMMATION......................... ....................................... ......616.3 TMDL AND BMPS SUMMATION................................................. .,..63
REFERENCES.................................................................................... .......................... 65
APPENDICES......................................................................................... ......................71APPENDIX I - OBSERVED MEASUREMENTS FROM OYSTER
RESTORATION SITES (EXCEL DATA)................................. 72APPENDIX n - FACTORIAL MODEL (SAS SOURCE).................................. 127APPENDIX m - OUTPUT FROM FACTORIAL MODEL (SAS
LISTING)................................................................................... 136
VITA.............................................................................................................................. 234
LIST OF TABLES
Table Page
2-1. Lynnhaven, Broad & Linkhom Bay Bacterial Water QualityData Summary January 2001 to February 2003............... ............................. 12
2-2. Land Use in the Lynnhaven, Broad & Linkhom Bay Watershed ........ 14
2-3. Climate Data for Cape Henry City Virginia Beach, Virginia (441362)........ 14
2-4. Average Impervious Area in the Lynnhaven, Broad & Linkhom BayWatershed ............................................ 16
LIST OF FIGURES
Figure Page
2-1. Shellfish Condemnation Areas in the Lynnhaven River System............. 10
2-2. Locations of Reefs (Red), DEQ Stations (Yellow), and DSS Stations (Green) ................................................. 18
3-1. Measuring an Oyster ................................................................................... 25
1
CHAPTER 1
INTRODUCTION
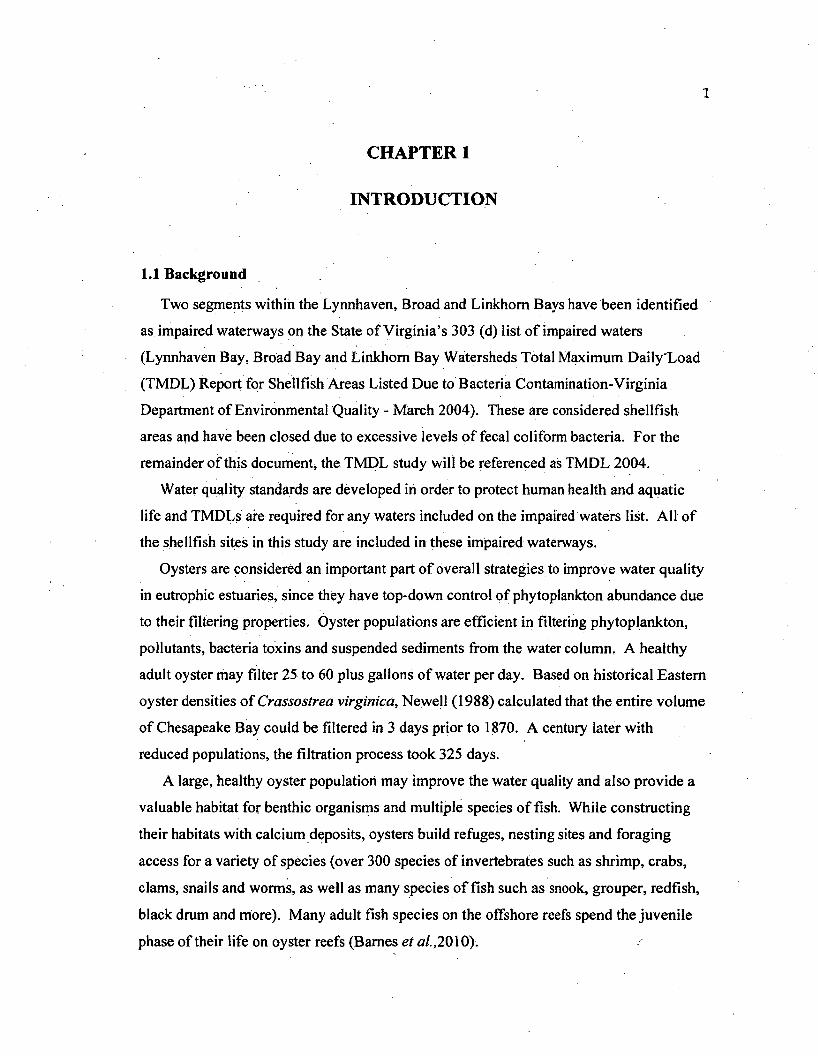
1.1 Background
Two segments within the Lynnhaven, Broad and Linkhom Bays have been identified
as impaired waterways on the State of Virginia’s 303 (d) list of impaired waters
(Lynnhaven Bay, Broad Bay and Linkhom Bay Watersheds Total Maximum Daily'Load
(TMDL) Report for Shellfish Areas Listed Due to Bacteria Contamination-Virginia
Department of Environmental Quality - March 2004). These are considered shellfish
areas and have been closed due to excessive levels of fecal coliform bacteria. For the
remainder of this document, the TMDL study will be referenced as TMDL 2004.
Water quality standards are developed in order to protect human health and aquatic
life and TMDLs are required for any waters included on the impaired waters list. All of
the shellfish sites in this study are included in these impaired waterways.
Oysters are considered an important part of overall strategies to improve water quality
in eutrophic estuaries, since they have top-down control of phytoplankton abundance due
to their filtering properties. Oyster populations are efficient in filtering phytoplankton,
pollutants, bacteria toxins and suspended sediments from the water column. A healthy
adult oyster may filter 25 to 60 plus gallons of water per day. Based on historical Eastern
oyster densities of Crassostrea virginica, Newell (1988) calculated that the entire volume
of Chesapeake Bay could be filtered in 3 days prior to 1870. A century later with
reduced populations, the filtration process took 325 days.
A large, healthy oyster population may improve the water quality and also provide a
valuable habitat for benthic organisms and multiple species of fish. While constructing
their habitats with calcium deposits, oysters build refuges, nesting sites and foraging
access for a variety of species (over 300 species of invertebrates such as shrimp, crabs,
clams, snails and worms, as well as many species of fish such as snook, grouper, redfish,
black drum and more). Many adult fish species on the offshore reefs spend the juvenile
phase of their life on oyster reefs (Barnes et ur/,,2010).
2
The structural relief of the oyster reef can dissipate wave energy, acting as a
breakwater, stabilizing bottom sediments and reducing erosion. Clearer water allows for
more sunlight penetration which can lead to expansion of seagrass beds (Orth et al,
2006). Moreover, oyster reefs also work as a carbon sink, improving the Bay’s capacity
to absorb excess carbon dioxide from the atmosphere (Henderson et a l, 2003). The
Chesapeake Bay has seen a radical decline in oyster populations due to years of poor
resource management of live oysters as well as shell: One main cause of mortality is
disease by the parasites, Dermo (Perkinsus marinus\ and MSX (Haplosporidium nelsoni)
(Andrews, 1996; Burreson, 2000). Other influential causes include increased
sedimentation of the water bodies (Newell et al., 2006).
Decades of poor water quality, overharvesting, habitat destruction, and disease have
reduced the population of oysters in the Chesapeake Bay to less than one percent of its
historic levels. These natural, renewing habitats are the focus of many restoration efforts
throughout the Bay in order to improve water quality and increase aquatic populations.
Today there are over 100 man-made oyster reefs in Virginia and more under construction.
The shortage of oyster shell has prompted examination of alternative substrates for reef
construction (Nestlerode et al, 2007).
1.2 Problem Statement
Recent studies of Virginia’s waterways identified multiple locations where water
quality standards were not being met. Due to the natural filtration assets of the oyster and
their efficiency in filtering phytoplankton, pollutants, bacteria toxins and suspended
sediments from the water column, restoration work of oyster beds at a higher pace
appeared to be a viable alternative to be included as a Best Management Practice.
Evaluating substrates for oyster restoration as well as site locations via water quality
parameter measurements in order to improve reproduction and survivability rates of
restored oyster beds is critical for assessing and establishing future plans for TMDLs.
Building statistical models to evaluate the environmental characteristics along with
several of the tested substrates was the next logical step to be taken. The Factorial Model
in this study will compare multiple variables that impact successful reproduction rates
and rank the success rates in order to come to a resolution of which combination gives the
3
highest probability of success with the ultimate goal of improving water quality in the
process of implementable, scalable BMPs and TMDL subsets.
1.3 Objectives
• Assess existing TMDL data and BMPs in conjunction with water quality issues
and oyster restoration in the Lynnhaven River System
• Collect ambient water quality data on oyster restoration sites
• State criteria for pre-site and site selection for restoration beds
• Define post-audit monitoring procedures to evaluate changes in water quality
• Develop statistical models relating oyster (Crassostrea virginica) biomass
production in the Lynnhaven River System to different block- and treatment-level
factor characteristics, and compare restoration effectiveness of natural reefs to
constructed reefs
• Review existing TMDLs and BMPs for additions to and revisions on water
quality management strategy based on results of model estimates and summarize
revised recommendations
1.4 TMDL and Best Management Practices (BMPs)
Based on the latest 2012 State of the River Report published by Lynnhaven River
Now, only 42% of the Lynnhaven River meets the shellfish standard. However, 90.4%
of the river meets the swimmable/fishable standard (Grade C+). The goal is that the river
meets 100% of the shellfish standard. In addition, the nitrogen and phosphorus levels
(Grade D) are too high for sea-grass beds to survive and the goal is to meet the necessary
requirements for the sea-grass beds to return. At this point, there are 7.9 impaired square
miles (approximately 90% of the river) in Lynnhaven River based on the latest DO
(dissolved oxygen) levels (Grade D). The goal is to have 0 impaired square miles.
Needless to say, the sediment and algae levels are also too high which is impacting the
water clarity as well (Grade F).
4
Some of the controls that have been put into place in the City of Virginia Beach to
improve the water quality have been the No Discharge Zone implemented in 2007,
sanitary sewer maintenance and improvement projects and stormwater improvement
projects. In addition, four living shoreline projects were completed in 2012 as well as an
additional 104 acres added to open space areas in order to increase the infiltration area for
rainwaters. Stormwater runoff after rain events is the main carrier of pollutants
through storm drains that dump directly into the river (Personal communication with
Karen Forget, Lynnhaven River Now and Steve McLaughlin, City of Virginia Beach -
Stormwater Management). --
The No Discharge Zone for boaters has been in effect in the Lynnhaven River System
for six years. In the summer of 2012, 2300 gallons were pumped out and this was a 62%
increase over 2011. Since the beginning of the program, 8800 gallons of waste has been
pumped out. Based on a study done by the Army Corps of Engineers, boat wastes
registered Biochemical Oxygen Demand (BOD(5)) levels of 3200 mg/L, Chemical
Oxygen Demand (COD) levels of 11,100 mg/L , 1660 mg/L of nitrogen and 117 mg/L of
phosphorus. Each tank pumped equates to 30 to 50 gallons of waste. Assuming a 30-
gallon tank was pumped out, this would equate to 188.5 grams of nitrogen and 13.3
grams of phosphorus removed each time. The City of Virginia Beach is pursuing the
avenue of getting credit towards their Watershed Implementation Plan (WIP) for the
annual removal of these boat wastes. The original Chesapeake Bay Watershed
Implementation Plan was issued in January 2012. Appendix Q in this watershed plan
details the requirements for each area (Personal communication with Steve McLaughlin,
City of Virginia Beach - Stormwater Management).
Virginia Beach has also been working on replacing as many septic tank systems as
possible, as well as expanding and improving sanitary sewer systems. Sixty projects
were completed in 2012 with a total cost of $6.9 million. There were four sanitary sewer
overflows during 2012 that equated to 4175 gallons (comparable to 2011). The next
steps to be implemented are to continue with upgrading and expanding sanitary sewer
systems and to insure that all pump stations have adequate back-up power (Personal
communication with Steve McLaughlin - City of Virginia Beach - Stormwater
Management).
5
By continually monitoring the bacterial levels in the Lynnhaven River System, it
became apparent that the bacterial levels started rising again once the oyster beds were
opened to harvest in 2007. This increase has continued and the action plan being put in
place is to close these oyster beds again effective April 12th (2013) by an Executive
Order. The criteria will be if 1 XA inches of rain fall within a 24-hour period in the
previous week, the area will be closed for the following 10 days and will re-open after
bacteria testing is completed and has met an acceptable level. During May or June, this
may be amended since the oyster harvesting season is at a peak level in this time frame
(Personal communication with Steve McLaughlin — City of Virginia Beach - Stormwater
Management).
Today in Virginia Beach, only 20% of stormwater is treated or retained before being
dumped into the river. Three million dollars is being allocated annually in order to
continue to do upgrades for stormwater treatment and retention ponds in this area. The
State and Federal stormwater requirements are becoming more stringent, which is
critical. Also, property owners may contribute to solving this problem by installing rain
barrels, rain gardens, riparian buffers along the edge of their properties, as well as living
shorelines. Educational programs have been implemented in the city in order to reach the
community and make them aware of these options (Personal communication with Karen
Forget - Lynnhaven River Now).
Since stormwater treatment is cost-prohibitive, a test site has been selected by the City
at Milldam Creek due to extreme bacterial counts running in the ten thousand range and
above. The goal is to reduce the nitrogen and phosphorus levels by placing a clarifier
that will utilize flocculating agents in the stream and collect the sediments in a
sedimentation chamber. The projected cost for this one site at an outfall is $700,000. It
is hoped that this might correct the huge bacterial problem in this area (Personal
communication with Steve McLaughlin - City of Virginia Beach - Stormwater
Management).
Another project underway is some renovation work at the outfall locations in Virginia
Beach. There is a total of 1050 outfalls in the Lynnhaven, 250 outfalls in Eastern Branch
and 100 in the Little Creek area for a grand total of 1400 in the Lynnhaven River
watershed. At this time, there is a substantial vertical drop from these outfalls in several
6
locations and the water lands directly on a sediment base and scours out high volumes of
sediments. This adds to the turbidity and TSS in the Lynnhaven River System and the
plans are to have a concrete bottom placed at the outfalls in order to eliminate this
problem. Since these areas are considered tidal waters that are under the jurisdiction of
the United States, permits will be required in order to do this work. The plan is to
continue and do this work in conjunction with developing goals for the WIP in this area.
Funding has also been allocated for 110 additional acres of sanctuary oyster reef
construction within the Lynnhaven River System at an approximate cost of $125,000
per acre (Lynnhaven River Now, US ACE Native Oyster Restoration Master Plan
March 2004). From past projects, 65 acres of sanctuary reef have already been placed in
the Lynnhaven River System and this Native Oyster Restoration plan states that it will be
necessary to continue to declare these areas as sanctuary reefs. It has been difficult to
find a large enough area in the Lynnhaven due to the number o f leases that have already
been issued to commercial oystermen and landowners. Some of these legalities and
permits may need to be researched in order to continue to expand these beds. There are
also several narrow channels throughout the Lynnhaven River System that have been
dredged by the Army Corps of Engineers and oyster restoration is prohibited in these
areas. Other viable alternatives in these areas are living shorelines or floating reefs on
homeowners’ docks with their permission.
In order to evaluate the impact of oyster restoration, the City of Virginia Beach is
working with the Army Corps of Engineers to coordinate a study that will determine how
much TSS per acre is removed per oyster reef. This will be needed in order to determine
the impact for inclusion in-the final WIP plans for this area. This past year in the Long
Creek area, Spartina grasses were planted and additional shell was added to build up an
existing oyster bed. Also, an oyster castle reef has been placed in this area and has
already experienced a high spat set (Lynnhaven River Now project). Oyster castles have
also been showing success on the Eastern Shore in the Tidewater area. These are hopeful
projects for inclusion in the plans for the final WIP.
Living shorelines appear to be one of the strongest possibilities to lower the high
phosphorus and nitrogen counts in the Lynnhaven River System. They aid in protecting
tidal shorelines from erosion by planting native wetland plants and grasses as well as
7
shrubs and trees along the tidal water line. Bio-engineered materials such as manmade
coconut-fiber rolls may be used to protect vegetation and soils. Where viable, oysters or
riprap may also be included. These living shorelines improve water quality by settling,
sediments and filtering pollutants and toxins. They also help in re-establishing the
natural shoreline around marsh areas that have been broken and separated by housing
development and bulkheads being placed. This also cuts down and/or eliminates high
dredging costs that are required in several of the narrow channels in the Lynnhaven River
System (Personal communication with Steve McLaughlin - City of Virginia Beach -
Stormwater Management).
Another natural innovation being tested by Virginia Tech as well as the Virginia
Beach area are floating wetlands. Constructed of post-consumer polymer fibers, these
floating wetlands are planted with native plants that act as a natural wetland to purify
water. They have been shown to aid in the removal of total nitrogen, ammonia,
phosphorus, BOD and TSS, all water quality parameters of concern. In the locations
tested at Virginia Beach, birds and muskrats infested the floating systems and the
muskrats destroyed the plants by consuming them. Additional sites are planned for trial
since other areas of the country have experienced success with these systems (Personal
communication with Steve McLaughlin - City Of Virginia Beach - Stormwater
. Management).
In other applications, these floating wetlands have been an enormous aid in locations
experiencing high populations of waterfowl. Waterfowl populations in the Broad Bay
area of the Lynnhaven are high and the sand sediments have reflected very high bacterial
counts from these waterfowl. The 2004 TMDL also reflected that the waterfowl
contributed 29% of the additional nutrients added to the Lynnhaven from the bacterial
source tracking studies. Since this city is on the Inter-coastal Waterway along migration
routes, it is not an option to taper down the waterfowl population. These floating
wetlands are an option since they have been shown to act as a nesting area and have aided
in biodegrading the waterfowl excrements before they enter the waterways.
Since some of the areas in the Lynnhaven River System have been experiencing
phosphorus concentration readings as high as 1 to 2 mg/L , the City is also planning on
implementing a fertilizer ban this year on any fertilizer containing phosphorus or any
8
derivatives. Another plan being implemented this year to aid in nutrient removal is
utilizing Phragmites australis, an invasive species to this area. It is a common large
perennial grass found in wetlands since it tolerates brackish water. It grows 15 feet tall
and has extremely deep roots as long as 15 to 20 feet deep which aid in combating soil
erosion. It also naturally removes nitrogen and phosphorus from the soil. Thirty-three
acres have been allocated to plant these grasses and it is anticipated to remove over
10,800 lbs of nitrogen (will decrease nitrogen input by approximately 10% - WIP goal is
to reach removal rate of 126,300 lbs by 2017)) and 800 lbs (will decrease phosphorus
input by 39% - WIP goal is to reach removal rate o f 2220 lbs by 2017) of phosphoras by
harvesting these grasses (Analysis of Harvested Wetlands Potential in Virginia Beach -
URS Company — December 2012). The Environmental Protection Agency has a model
that is run to determine the nitrogen and phosphorus load removal requirements for each
area and it is scheduled to be re-run in 2017.
WIPs are the next step in progressing toward a restored Lynnhaven River watershed.
These plans consider ecological restoration such as riparian buffers and living shorelines
as well as promoting accountability for improved performance and sustaining previously
attained levels of improvement. These WlPs are being developed in order to progress
towards goals that will be finalized in a Federal TMDL in 2017. This TMDL will require
annual reductions in nitrogen, phosphorus and sediment in each of the Bay’s tidal
segments, tributaries and embayments listed as impaired under 303(d) o f the Clean Water
Act.
9
CHAPTER 2
LITERATURE REVIEW
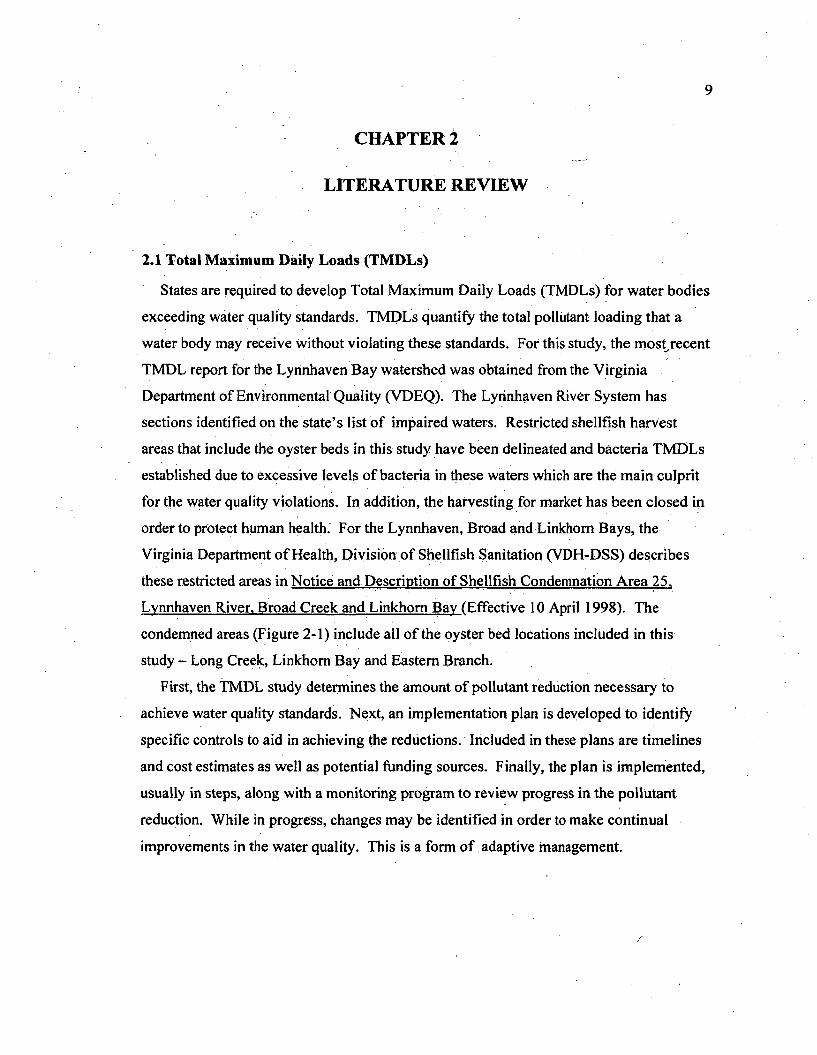
2.1 Total Maximum Daily Loads (TMDLs)
States are required to develop Total Maximum Daily Loads (TMDLs) for water bodies
exceeding water quality standards. TMDLs quantify the total pollutant loading that a
water body may receive Without violating these standards. For this study, the most.recent
TMDL report for the Lynnhaven Bay watershed was obtained from the Virginia
Department of Environmental Quality (VDEQ). The Lyrinhaven River System has
sections identified on the state’s list of impaired waters. Restricted shellfish harvest
areas that include the oyster beds in this study have been delineated and bacteria TMDLs
established due to excessive levels of bacteria in these waters which are the main culprit
for the water quality violations. In addition, the harvesting for market has been closed in
order to protect human health. For the Lynnhaven, Broad and Linkhom Bays, the
Virginia Department of Health, Division of Shellfish Sanitation (VDH-DSS) describes
these restricted areas in Notice and Description of Shellfish Condemnation Area 25.
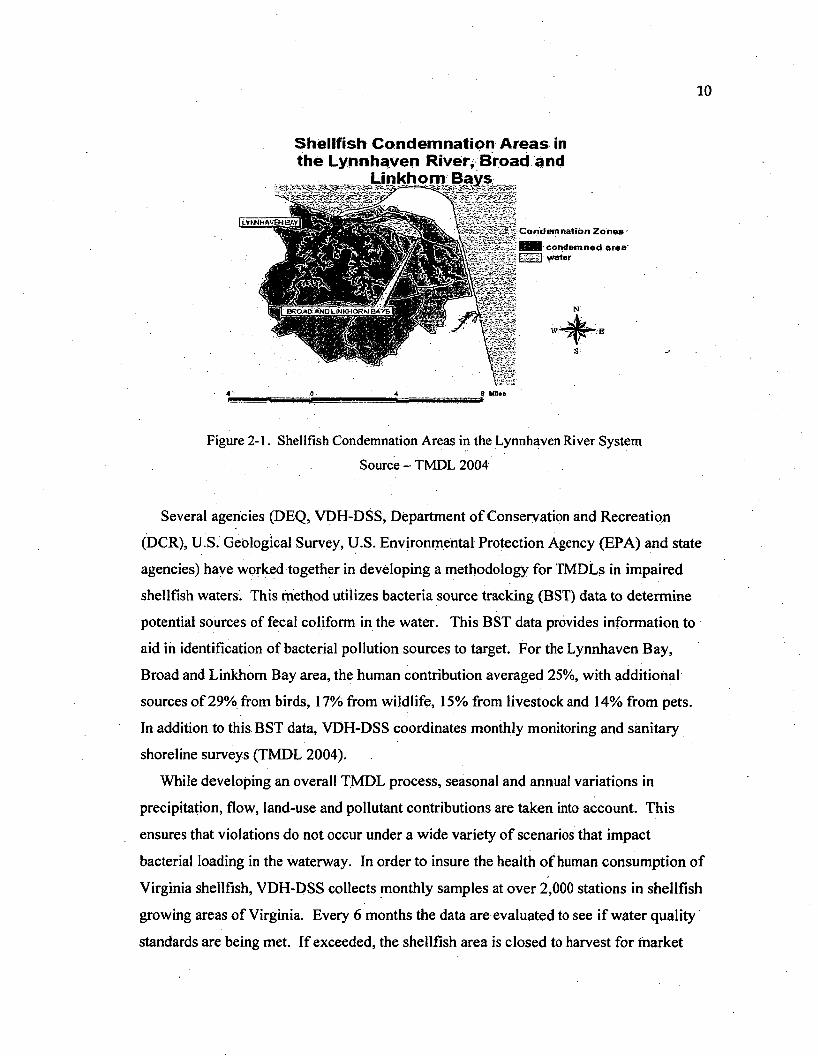
Lynnhaven River. Broad Creek and Linkhom Bay (Effective 10 April 1998). The
condemned areas (Figure 2-1) include all of the oyster bed locations included in this
study - Long Creek, Linkhom Bay and Eastern Branch.
First, the TMDL study determines the amount of pollutant reduction necessary to
achieve water quality standards. Next, an implementation plan is developed to identify
specific controls to aid in achieving the reductions. Included in these plans are timelines
and cost estimates as well as potential funding sources. Finally, the plan is implemented,
usually in steps, along with a monitoring program to review progress in the pollutant
reduction. While in progress, changes may be identified in order to make continual
improvements in the water quality. This is a form of adaptive management.
10
Shellfish Condemnation Areas in the Lynnhaven River, Broad and
Linkhom Bays
LY W N ftV E W BAY IC ondem nation Z o n e s ■H B condem ned a re s '
water
4 ' __________________ .0 -____________________ 4 _ _ a M » » b
Figure 2-1. Shellfish Condemnation Areas in the Lynnhaven River SystemSource - TMDL 2004
Several agencies (DEQ, VDH-DSS, Department o f Conservation and Recreation
(DCR), U.S. Geological Survey, U.S. Environmental Protection Agency (EPA) and state
agencies) have worked together in developing a methodology for TMDLs in impaired
shellfish waters. This method utilizes bacteria source tracking (BST) data to determine
potential sources of fecal coliform in the water. This BST data provides information to
aid in identification of bacterial pollution sources to target. For the Lynnhaven Bay,
Broad and Linkhom Bay area, the human contribution averaged 25%, with additional
sources of 29% from birds, 17% from wildlife, 15% from livestock and 14% from pets.
In addition to this BST data, VDH-DSS coordinates monthly monitoring and sanitary
shoreline surveys (TMDL 2004).
While developing an overall TMDL process, seasonal and annual variations in
precipitation, flow, land-use and pollutant contributions are taken into account. This
ensures that violations do not occur under a wide variety of scenarios that impact
bacterial loading in the waterway. In order to insure the health o f human consumption of
Virginia shellfish, VDH-DSS collects monthly samples at over 2,000 stations in shellfish
growing areas of Virginia. Every 6 months the data are evaluated to see if water quality
standards are being met. If exceeded, the shellfish area is closed to harvest for market
11
and a shoreline survey is completed by DSS. Fecal coliform concentrations in water
samples collected in the immediate vicinity of the shellfish beds aid in defining the
borders between approved and condemned waters.
The shoreline survey is accomplished via a property-by-property inspection of on-site
sanitary waste disposal facilities, un-sewered sections of the watershed, wastewater
treatment plants (WWTP), marinas, livestock operations, landfills, etc. A written report
is compiled and distributed to various state agencies that are responsible for correcting
the identified concerns. There were some deficiencies noted as possible pollution areas
in the Linkhom Bay and Eastern Branch areas as well as some locations noted near-Long
Creek where there were no facilities and there was direct access to Lynnhaven Bay. The
oyster bed locations in this study are close to these designated areas. The latest survey
conducted prior to the TMDL was in February 1997 and identified 26 sanitary sewage
deficiencies, 7 industrial waste, 1 solid waste dumpsite, 1 boating related sources, 2 sites
with a potential for pollution and 3 animal waste sources. The shoreline survey is the
primary source for indications of non-point sources of pollution in the watershed. Non
point source contributions to bacterial levels in Lynnhaven Bay from human sources
generally arise from failing septic systems and associated drain fields, moored or marina
vessel discharges, stormwater management facilities and pump station failures. The
largest concentration of septic systems and drain fields for water treatment in a suburban
home area in Lynnhaven Bay is at Little Neck Point (TMDL 2004).
In addition to the shoreline survey, DSS also collects water samples in the oyster bed
areas. The most recent 30 samples collected randomly with respect to weather are
utilized to assess each sampling location. In Virginia, there is a two-part standard for
fecal coliforms in water near direct shellfish harvest for market - (1) a geometric mean
no greater than 14 MPN (Most Probable Number) fecal coliforms/100 ml and (2) an
estimated 90th percentile no greater than 49 MPN/100 ml. Exceeding either requirement
requires closure in Virginia. Most of the high fecal coliform counts in this state are due
to runoff from development, agriculture and livestock operations, or from wildlife
(Lynnhaven Bay, Broad Bay and Linkhom Bay Watersheds Total Maximum Daily Load
(TMDL) Report for Shellfish Areas Listed Due to Bacteria Contamination, VDEQ March
2004). In the time frame of this study, the data reflected that the bacterial levels were
12
above the 90th percentile for all of the shellfish condemnation areas in the Lynnhaven
Bay watershed.
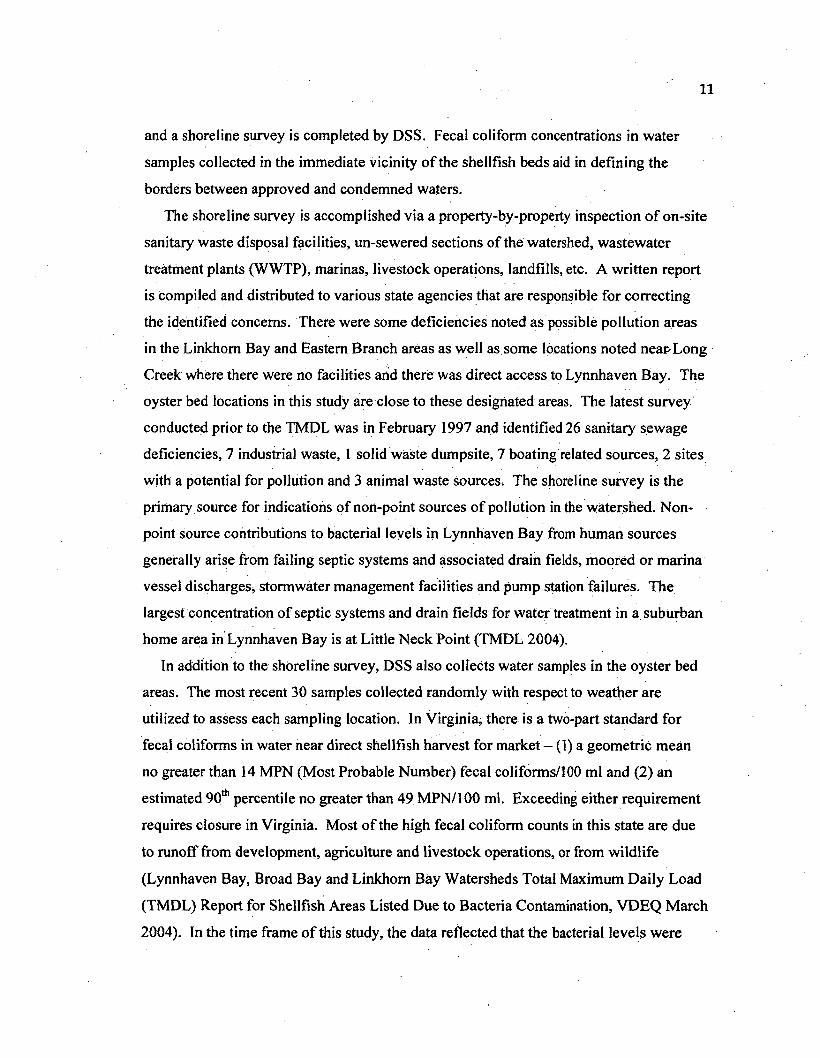
Most of the coastal areas along the Atlantic Ocean have experienced a high level of
development and the Lynnhaven Bay, Broad Bay and Linkhom Bay watersheds are no
exception. The TMDL 2004 sampling completed in these areas reflected bacterial levels
above the 90th percentile in all collection sites in the Lynnhaven and the majority of sites
in Broad Bay and Linkhom Bay. All of the bacterial readings exceeding the criteria are
reflected in bold print (Table 2-1).
Table 2-1. Lynnhaven, Broad & Linkhom Bay Bacterial Water Quality Data Summary January 2001 to February 2003
225A-1 68.4 49 No 11.4 . 14 Yes Yes
25A-2* 111.7 No 16.8 No Yes
25A-2Z 103.0 No 13.6 Yes Yes
225A-3* 259.0 ■ No 27.2 No Yes
25A4 190.1 No 24.7 No Yes
25A-4_3 258.0 No 31.6 No Yes
25A-4_9 164.1 No 14.7 Yes Yes
25A-5 1433 No 19.2 No Yes
25A-7* 209.7 No 21.0 No Yes
25A-8 332.7 No 27.1 No Yes
25A-9* 306.8 No 30.5 No Yes
25A-10* 368.0 No 30.2 No Yes
25A-11* 182.9 No 27.1 No Yes
25A-I2* 569.1 No 41.7 No Yes
25A-15 116.6 No 14.5 Yes Yes
25A-16* 195.1 No 18.7 No Yes
25A-17 • 230.0 No 20.4 No Yes
25A-18 265.7 No 20.2 No Yes
25A-24* 445.0 No 363 No Yes
25A-25* 760.7 No 52.6 No Yes
Average 264.0 25.0
*Bacterial Source Tracking Stations; Source - TMDL 2004
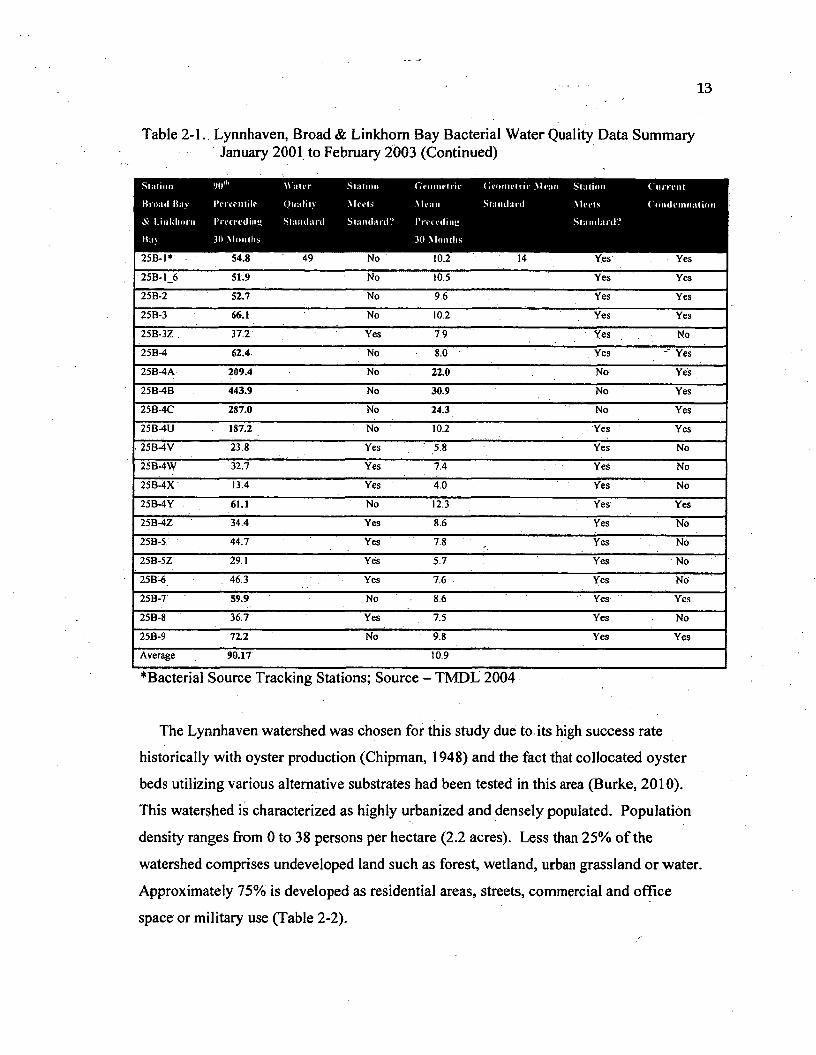
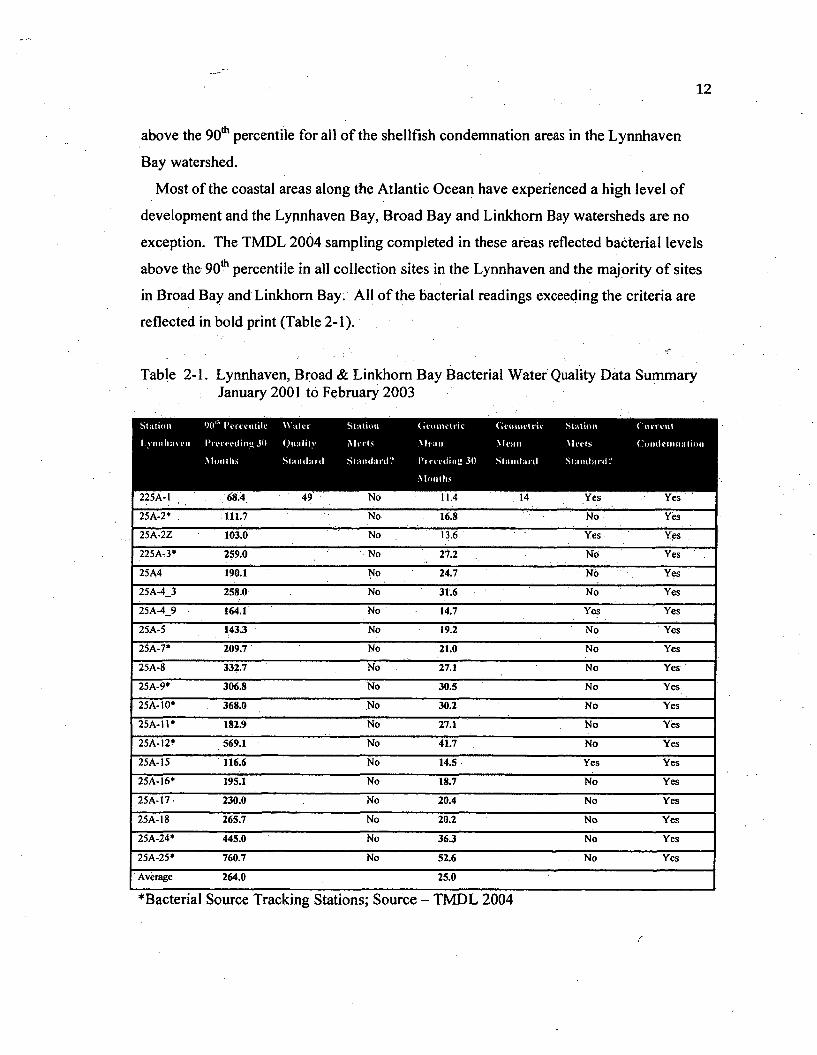
13
Table 2-1. Lynnhaven, Broad & Linkhom Bay Bacterial Water Quality Data Summary January 2001 to February 2003 (Continued)
25B-1* S4.8 49 . No 10.2 14 Yes Yes
25B-1_6 51.9 No 10.5 Yes Yes
25B-2 52.7 No 9.6 Yes Yes
25B-3 66.1 No 10.2 Yes Yes
25B.3Z 37.2 Yes 7.9 Yes No
25B-4 62.4 No 8.0 ' Yes Yes
25B-4A 209.4 No 22.0 No Yes
25B-4B 443.9 No 30.9 No Yes
25B-4C 287.0 No 24.3 No Yes
25B-4U 187.2 No 10.2 Yes Yes
25B-4V 23.8 Yes ' 5.8 Yes No
25B-4W 32.7 Yes 7.4 Yes No
25B-4X 13.4 Yes 4.0 Yes No
25B-4Y 61.1 No 12.3 Yes Yes
25B-4Z 34.4 Yes 8.6 Yes No
25B-5 44.7 Yes 7.8 r . Yes No
25B-5Z 29.1 Yes 5.7 Yes No
25B-6 , 46.3 Yes 7.6 Yes NO
25B-7 59.9 No 8.6 Yes Yes
25B-8 36.7 Yes 7.5 Yes No
25B-9 72.2 No 9.8 Yes Yes
Average 90.17 10.9
^Bacterial Source Tracking Stations; Source - TMDL 2004
The Lynnhaven watershed was chosen for this study due to its high success rate
historically with oyster production (Chipman, 1948) and the fact that collocated oyster
beds utilizing various alternative substrates had been tested in this area (Burke, 2010).
This watershed is characterized as highly urbanized and densely populated. Population
density ranges from 0 to 38 persons per hectare (2.2 acres). Less than 25% of the
watershed comprises undeveloped land such as forest, wetland, urban grassland or water.
Approximately 75% is developed as residential areas, streets, commercial and office
space or military use (Table 2-2).
14
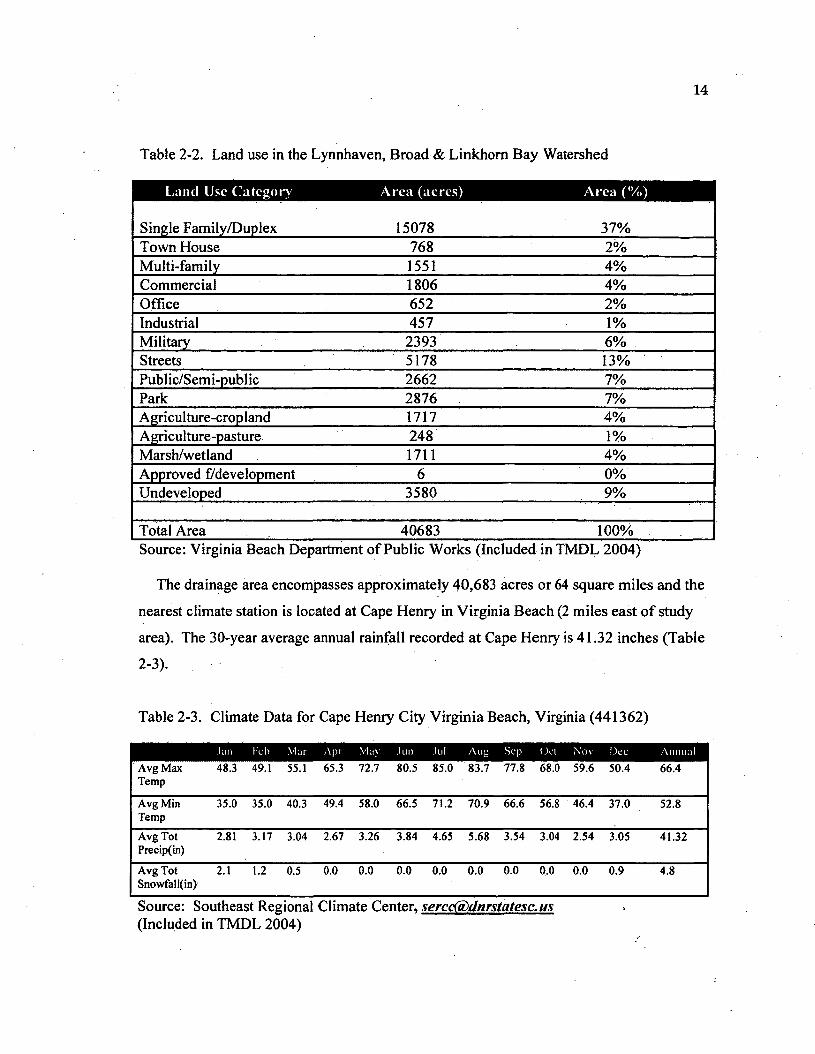
Table 2-2. Land use in the Lynnhaven, Broad & Linkhom Bay Watershed
Single Family/Duplex 15078 37%Town House 768 2%Multi-family 1551 4%Commercial 1806 4%Office 652 2%Industrial 457 1%Military 2393 6%Streets 5178 13%Public/Semi-public 2662 7%Park 2876 7%Agriculture-cropland 1717 4%Agriculture-pasture 248 1%Marsh/wetland 1711 4%Approved f/development 6 0%Undeveloped 3580 9%
Total Area 40683 100% ISource: Virginia Beach Department of Public Works (Included in TMDL 2004)
The drainage area encompasses approximately 40,683 acres or 64 square miles and the
nearest climate station is located at Cape Henry in Virginia Beach (2 miles east of study
area). The 30-year average annual rainfall recorded at Cape Henry is 41.32 inches (Table
2-3).
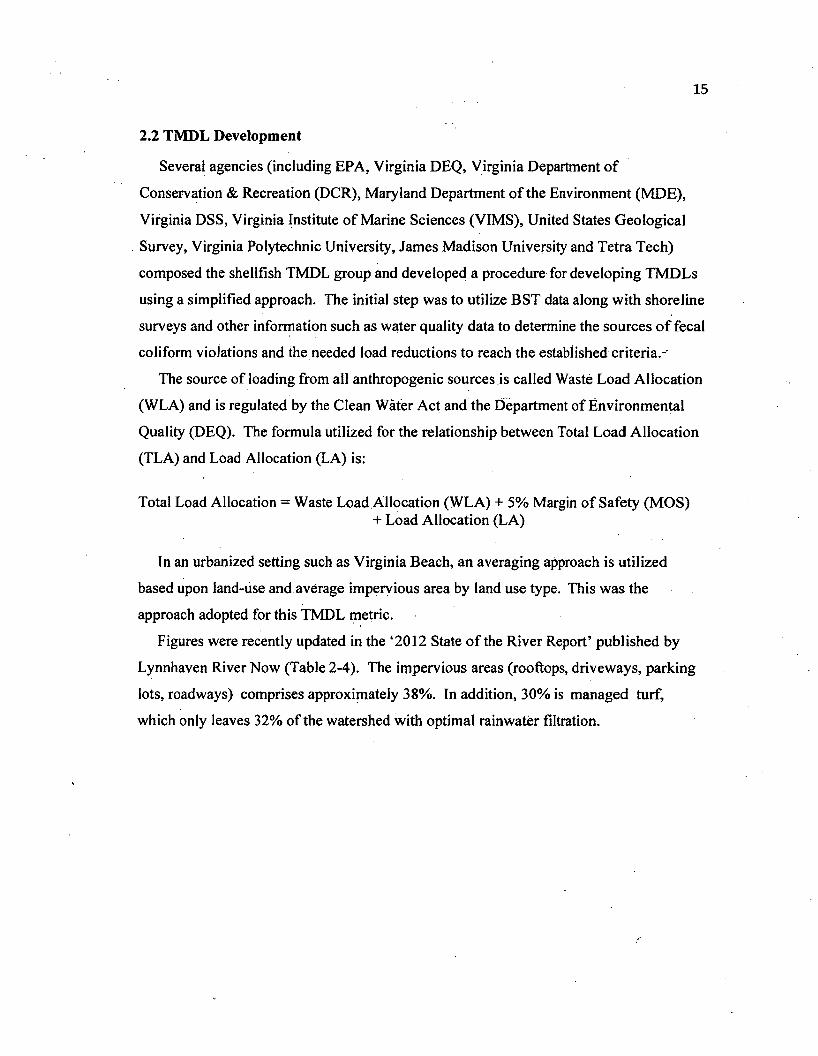
Table 2-3. Climate Data for Cape Henry City Virginia Beach, Virginia (441362)
m iAvg Max Temp
48.3 49.1 55.1 65.3 72.7 80.5 85.0 83.7 77.8 68.0 59.6 50.4 66.4
Avg Min Temp
35.0 35.0 40.3 49.4 58.0 66.5 71.2 70.9 66.6 56.8 46.4 37.0 52.8
Avg Tot Precip(in)
2.81 3.17 3.04 2.67 3.26 3.84 4.65 5.68 3.54 3.04 2.54 3.05 41.32
Avg Tot Snowfall(in)
2.1 1.2 0.5 0.0 0.0 0.0 0.0 0.0 0.0 0.0 0.0 0.9 4.8
Source: Southeast Regional Climate Center, sercc(a)dnrsiatesc.us (Included in TMDL 2004)
15
2.2 TMDL Development
Several agencies (including EPA, Virginia DEQ, Virginia Department of
Conservation & Recreation (DCR), Maryland Department of the Environment (MDE),
Virginia DSS, Virginia Institute of Marine Sciences (VIMS), United States Geological
Survey, Virginia Polytechnic University, James Madison University and Tetra Tech)
composed the shellfish TMDL group and developed a procedure for developing TMDLs
using a simplified approach. The initial step was to utilize BST data along with shoreline
surveys and other information such as water quality data to determine the sources o f fecal
coliform violations and the needed load reductions to reach the established criteria.-'
The source of loading from all anthropogenic sources is called Waste Load Allocation
(WLA) and is regulated by the Clean Water Act and the Department of Environmental
Quality (DEQ). The formula utilized for the relationship between Total Load Allocation
(TLA) and Load Allocation (LA) is:
Total Load Allocation = Waste Load Allocation (WLA) + 5% Margin of Safety (MOS)+ Load Allocation (LA)
In an urbanized setting such as Virginia Beach, an averaging approach is utilized
based upon land-use and average impervious area by land use type. This was the
approach adopted for this TMDL metric.
Figures were recently updated in the ‘2012 State of the River Report’ published by
Lynnhaven River Now (Table 2-4). The impervious areas (rooftops, driveways, parking
lots, roadways) comprises approximately 38%. In addition, 30% is managed turf,
which only leaves 32% of the watershed with optimal rainwater filtration.
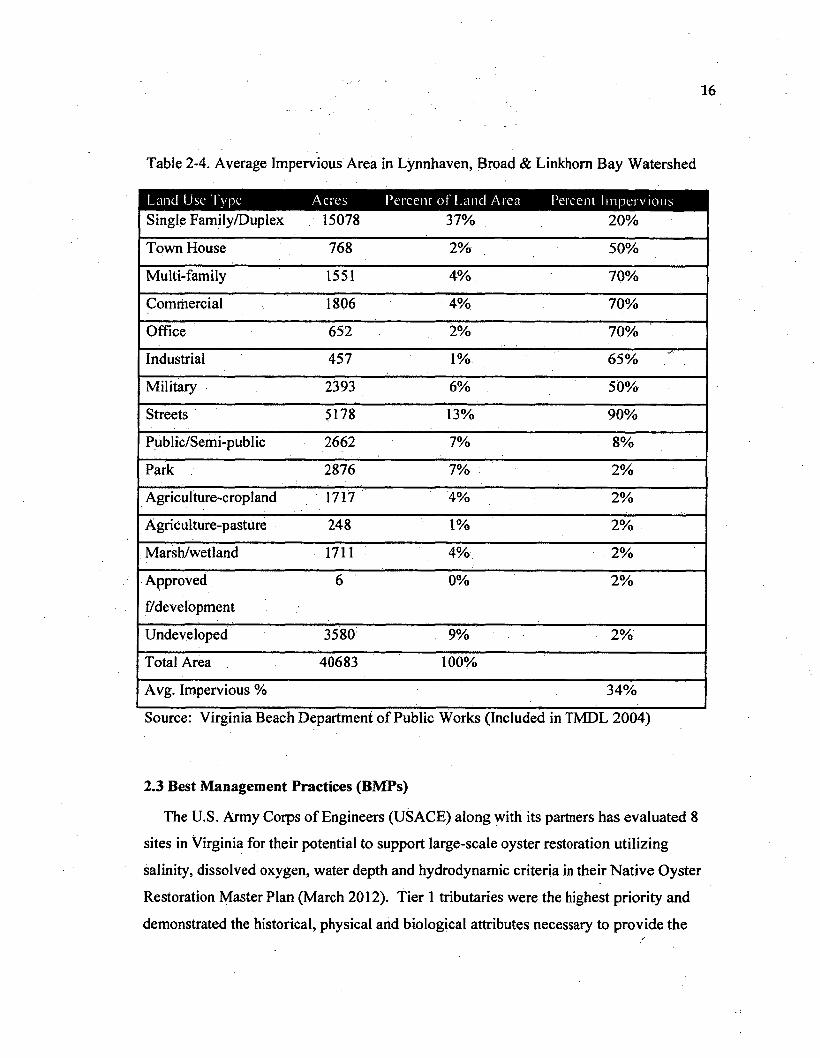
Table 2-4. Average Impervious Area in Lynrihaven, Broad & Linkhom Bay Watershed
Single Family/Duplex 15078 37% 20%
Town House 768 2% 50%
Multi-family 1551 4% 70%
Commercial 1806 4% 70%
Office 652 2% 70%
Industrial 457 1% 65% "
Military 2393 6% 50%
Streets 5178 13% 90%
Public/Semi-public 2662 7% 8%
Park 2876 7% 2%
Agriculture-cropland 1717 4% 2%
Agriculture-pasture 248 1% 2%
; Marsh/wetland 1711 4% 2%
Approved 6 0% 2%
^development
Undeveloped 3580 9% 2%
Total Area 40683 100%
Avg. Impervious % 34%
Source: Virginia Beach Department of Public Works (Included in TMDL 2004)
2.3 Best Management Practices (BMPs)
The U.S. Army Corps of Engineers (USACE) along with its partners has evaluated 8
sites in Virginia for their potential to support large-scale oyster restoration utilizing
salinity, dissolved oxygen, water depth and hydrodynamic criteria in their Native Oyster
Restoration Master Plan (March 2012). Tier 1 tributaries were the highest priority and
demonstrated the historical, physical and biological attributes necessary to provide the
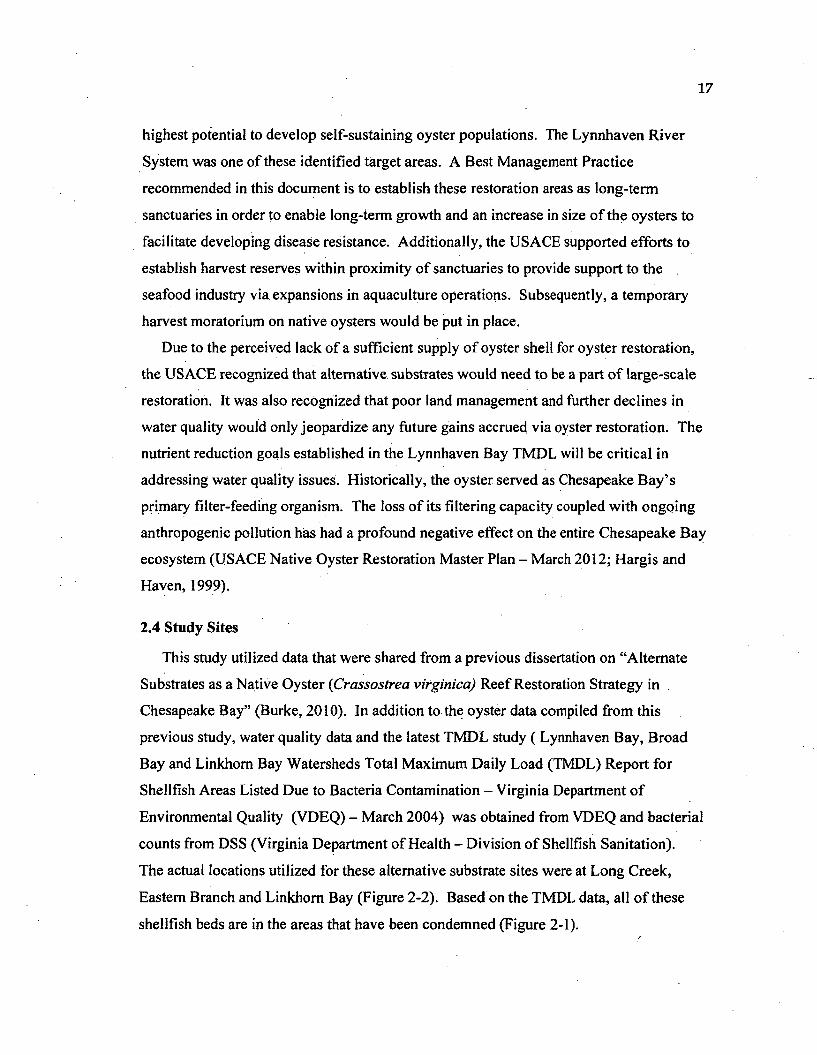
17
highest potential to develop self-sustaining oyster populations. The Lynnhaven River
System was one of these identified target areas. A Best Management Practice
recommended in this document is to establish these restoration areas as long-term
sanctuaries in order to enable long-term growth and an increase in size of the oysters to
facilitate developing disease resistance. Additionally, the USACE supported efforts to
establish harvest reserves within proximity of sanctuaries to provide support to the
seafood industry via expansions in aquaculture operations. Subsequently, a temporary
harvest moratorium on native oysters would be put in place.
Due to the perceived lack of a sufficient supply of oyster shell for oyster restoration,
the USACE recognized that alternative substrates would need to be a part of large-scale
restoration. It was also recognized that poor land management and further declines in
water quality would only jeopardize any future gains accrued via oyster restoration. The
nutrient reduction goals established in the Lynnhaven Bay TMDL will be critical in
addressing water quality issues. Historically, the oyster served as Chesapeake Bay’s
primary filter-feeding organism. The loss of its filtering capacity coupled with ongoing
anthropogenic pollution has had a profound negative effect on the entire Chesapeake Bay
ecosystem (USACE Native Oyster Restoration Master Plan - March 2012; Hargis and
Haven, 1999).
2.4 Study Sites
This study utilized data that were shared from a previous dissertation on “Alternate
Substrates as a Native Oyster (Crassostrea virginica) Reef Restoration Strategy in .
Chesapeake Bay” (Burke, 2010). In addition to the oyster data compiled from this
previous study, water quality data and the latest TMDL study ( Lynnhaven Bay, Broad
Bay and Linkhom Bay Watersheds Total Maximum Daily Load (TMDL) Report for
Shellfish Areas Listed Due to Bacteria Contamination - Virginia Department of
Environmental Quality (VDEQ) - March 2004) was obtained from VDEQ and bacterial
counts from DSS (Virginia Department of Health - Division of Shellfish Sanitation).
The actual locations utilized for these alternative substrate sites were at Long Creek,
Eastern Branch and Linkhom Bay (Figure 2-2). Based on the TMDL data, all of these
shellfish beds are in the areas that have been condemned (Figure 2-1).
18
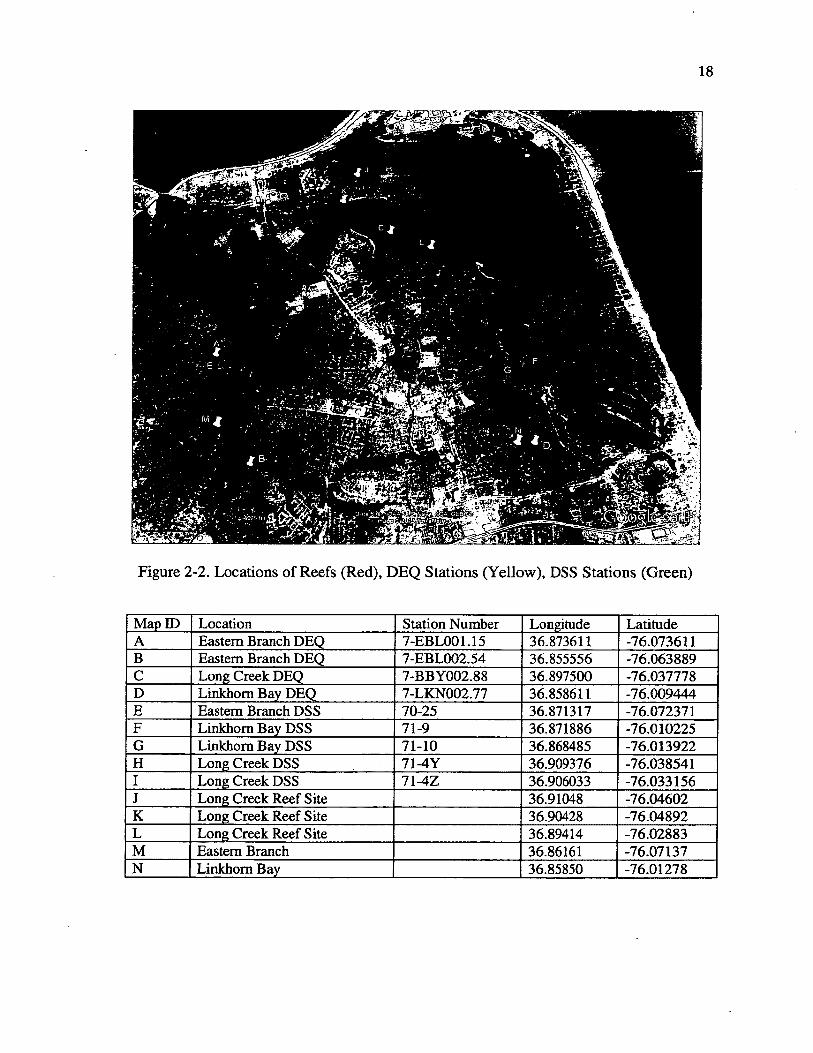
Figure 2-2. Locations of Reefs (Red), DEQ Stations (Yellow), DSS Stations (Green)
Map ID Location Station Number Longitude LatitudeA Eastern Branch DEQ 7-EBL001.15 36.873611 -76.073611B Eastern Branch DEQ 7-EBL002.54 36.855556 -76.063889C Long Creek DEQ 7-BBY002.88 36.897500 -76.037778D Linkhom Bay DEQ 7-LKN002.77 36.858611 -76.009444E Eastern Branch DSS 70-25 36.871317 -76.072371F Linkhom Bay DSS 71-9 36.871886 -76.010225G Linkhom Bay DSS 71-10 36.868485 -76.013922H Long Creek DSS 71-4Y 36.909376 -76.038541I Long Creek DSS 71-4Z 36.906033 -76.033156J Long Creek Reef Site 36.91048 -76.04602K Long Creek Reef Site 36.90428 -76.04892L Long Creek Reef Site 36.89414 -76.02883M Eastern Branch 36.86161 -76.07137N Linkhom Bay 36.85850 -76.01278
19
The Long Creek site included a natural marsh area, an existing oyster reef and two
riprap sites. At each of these locations , there were six substrate classes placed in
individual trays.
CVS = Small Pieces of Recycled Concrete
GL = Large Granite
GS = Small Granite
LML= Large Limestone Marl
LMS = Small Limestone Marl
OSU = Unconsolidated Loose Oyster Shell
Each location contained three replicates of each substrate: In order to evaluate the
impact of predation on each site, a caged and non-caged option was deployed for each of
the replicates for a total of six samples for each substrate.
The Living Shoreline sites were located at homeowners’ shorelines - one in Eastern
Branch and the other in Linkhom Bay. Nine reef structures were erected at each site in
July 2006. It included three oyster shell, three riprap and three concrete modules.
Instead of the caged option tested at Long Creek, these sites compared seeded and
unseeded alternatives. At Linkhom Bay, cinder blocks were later included as an
additional incidental substrate. Additionally, six reefballs were added late (September
2006) in the project at both Linkhom Bay and Eastern Branch. Unfortunately, the
reefballs had to be destructively sampled in order to count the live and dead shells and
this was only done at the end of the experiment. With only a single sampling period at
the end of the experiment, these data did not meet the modeling criteria and were
removed from the modeling component of this study.
20
CHAPTER 3
OYSTER RESTORATION AS WATER QUALITY IMPROVEMENT
3.1 Desired Conditions for Oyster Restoration
Oyster reef restoration is being initiated in order to replace or maintain critical
ecosystem functions and communities, and to improve water quality. Local, state and
federal government agencies as well as volunteer groups and universities have developed
restoration plans. In order to design a successful plan, biological (habitat), physical
(topography, sediment type, tides, turbidity), chemical (salinity and dissolved oxygen)
and hydrological (water flow) characteristics that influence the survivability o f the oyster
need to be monitored to ensure conditions are favorable for successful restoration. State
public health departments monitor potential shellfish growing waters in order to insure
safe consumption by the public. If high bacterial levels (Escherichia coli or Vibrio
vulnificus) or specific toxins are detected, then the waters are restricted from harvesting
(Coen and Luckenbach, 2000).
Considering the desired conditions, the Eastern oyster (Crassostrea virginica) initiates
spawning at temperatures between 20 to 25 degrees Celsius or salinity cues > 10 practical
salinity units (psu). This typically happens between June and October in lower
Chesapeake Bay. Reduced initial settlement of oysters may result from physical
processes such as turbulence and water flow (Kennedy et al., 1996). In addition, oyster
shell reefs with larger interstitial spaces may be more accessible to fish and crab
predators. However, the larger predators prey on smaller, intermediate predators o f the
oyster and actually create a safe haven in the reef for the young oysters. Decapods such
as blue crabs (Callinectes sapidus) and mud crabs (Panopeus herbstii, etc.) are major
predators of the oyster and can cause high levels of mortality in juvenile oyster
populations. Crabs usually chip the valve margins to gain access. Overall, the
complexity of the reef reduces the predator’s efficiency as well as the encounter rate
21
(Grabowski, 2005). Additionally, utilizing reefballs to surround existing oyster reefs
aids in reducing predator access especially to the older oyster population at the base of
the reef and also places roadblocks to poachers for access to the reef (Personal
communication Tommy Leggett - Chesapeake Bay Foundation). Some of the major
triggers for improving oyster survivability and water quality are detailed below.
3.1.1 Habitat
Oyster reefs are formed as individual oysters stack and form layers of multiple
generations that create a complex interstitial three-dimensional structure in intertidal or
subtidal zones, and fringing or patch reefs that vary in size from 10 to 1000 square
meters. The reef size continues to increase as multiple classes of oysters accumulate and
form micro-habitats for multiple species. Restoration has depended on the natural
development of biofilms which induces the settlement of the oyster larvae, however,
utilizing extracts or synthetic peptides may be an avenue for enhancing larval settlement
in future restoration projects (Coen and Luckenbach, 2000).
Additionally, the interaction among several species in the oyster reef environment is
also critical. Barnacles appear to improve the attachment rate of oysters by increasing the
surface roughness as well as excreting a chemical cue that attracts oysters to their
location. In addition, they have a fanlike mechanism for feeding that brings food
particles closer to the immobilized oyster. Yet, barnacles compete for food and surface
space on the oyster shell (Barnes et al., 2010). Oysters are a large part o f the blue crab’s
diet and the presence of blue crabs definitely increases the mortality rates on these reefs.
Also, mussels out-compete the oysters for substrate space. Blue crabs and mud crabs are
the natural predators for mollusks and juvenile oysters whose shells are still fragile (<15
mm shell height) (Nestlerode et al., 2007). It would be best to select a site with lower
quantities of blue crabs and mussels, if possible.
3.1.2 Temperature
Extreme exposure to high temperatures is likely to have profound effects on oysters,
particularly in regard to reproduction, disease susceptibility, and responses to
anthropogenic stressors. Elevated temperatures have been shown to increase oyster
22
susceptibility to the two major oyster diseases, Dermo and MSX (Andrews, 1996). Both
diseases infect oysters during their first year and cause high mortality rates. This
particularly occurs during drought or low flow years (Stroupe and Lynn, 1963).
Additionally, subtidal rather than intertidal (> 2m) oysters may be more adversely
affected by such extreme environmental fluctuations due to anoxic condition (Restoration
Monitoring of Oyster Reefs).
Finally, water filtration and other oyster physiological processes are highly dependent
on water temperature. Summer rates of filtration are substantially higher than the rest of
the year (Newell and Langdon, 1996). Temperature measurements between 20 to 2-5
degrees Celsius are usually the most favorable environment for oysters.
3.1.3 Salinity
Oyster reefs may be found in a wide salinity range (12 psu to 28 psu). Extreme
fluctuations may affect survival, growth and distribution of oysters as well as associated
macro-invertebrates. Dermo disease increases during periods of high salinity (>15
psupsu).
This usually happens in an estuary during the summer when severe storms are
frequent or during periods of low rainfall (Andrews, 1996. Simulations on environmental
impacts to the Eastern oyster, Crassostrea virginica, revealed that salinity is the primary
factor controlling the spatial degree of oyster distribution. Salinity plays an important
role during oyster spat development and needs to be closely monitored during restoration
activities (Restoration Monitoring of Oyster Reefs).
Also, the salinity may vary substantially from the mouth of the river to upstream
locations. It is anticipated that upstream flow rates would tend to be slower and the
salinity would increase towards the Bay.
3.1.4 Dissolved Oxygen (DO)
Dissolved oxygen is an important parameter in assessing water quality and a certain
level needs to be maintained for most aquatic organisms to survive. Oxygen is utilized
for respiration and for the cycling and recycling of organic carbon. The concentration of
DO is considered a key indicator of the health of an estuary. When DO concentrations
23
are too low, organisms become stressed and may be unable to grow, feed or reproduce
properly. DO concentrations above 5 mg/L are considered suitable to sustain healthy
communities. However, concentrations below 2.8 mg/L are considered hypoxic (low in
oxygen) and usually create stress on the oyster (Cerco et al., 2005).
3.1.5 Total Suspended Solids (TSS)
Due to the natural variability in physical characteristics, total suspended solids must
be determined for each differing body of water and is site-specific. The amount of
suspended material in the water column may indicate potential silt problems and/or- food
availability (phytoplankton). Though oysters filter water and improve its quality, an
increase in turbidity can negatively influence oyster reef growth and survival. Sediment
increase in the water column caused by high energy tides can smother oyster larvae as
well as disturb the filter feeding process of oysters. Sources that increase sediments and
turbidity are agriculture, forestry, mining, road construction and urban activities.
Additionally, oyster reef communities are negatively impacted by excess nutrients from
runoff, which promotes algae growth and again increases turbidity. Algal blooms deplete
oxygen and limit sunlight for other vegetative species near the oyster reefs (Restoration
Monitoring of Oyster Reefs).
3.1.6 Density
Oyster density (number of live oysters per unit area) is a common measurement
utilized to assess reef restoration success. Usually a sample of known dimensions is
excavated (10 to 15 cm) using a quadrat or a core. Then, all the live and/or dead oysters
are counted. Samples are collected from different reef elevations (reef crest, slope and
base). Size frequency distributions as well as survival and mortality rates may be derived
from these same density samples (Cerco et al., 2005). In studies of the native Eastern
oyster in the James River (Mann et al., 2009), the following equations were utilized for
survival and mortality in cohorts with more than two successive years.
Survivorship = #Live(t,me+ i/#Live(time)
Mortality = [#Live(time) - #Live(tjme + 1 )]/#Live(time)
24
A possible error inherent in this approach is classifying oysters in an incorrect year class
based on an age to length relationship. This would cascade through each year class.
3.1.7 Depth
Oyster restoration appears to be more successful in shallow regions with limited
circulation rather than areas of greater depth, larger water volume and greater spatial
extent. Reefs in shallow, semi-enclosed regions appear to reflect greater benefits. Most
of the planned restoration areas occur in water depths ranging from 3 to 5 feet in the
intertidal range (Oyster Reef Restoration). An exception recently has been the sub-tidal
reefs rejuvenated in the Great Wicomico River in Virginia. Juvenile recruitment was
higher and oyster density was four-fold greater on high-relief reefs. This re-established
meta-population was the largest of any native oyster world-wide and validates
continuing oyster restoration. With better site selection in a hydrodynamically restricted
area and construction methods utilizing significantly more shell substrate per unit area of
bottom, the higher relief reef (as high as 45 cm) allowed for enhanced recruitment,
reduced sedimentation and higher survival of recruits (Schulte et al., 2009).
3.1.8 Reef Size
Reef area is important for oyster production and its associated communities. The
perimeter of intertidal reefs may be measured by walking the edge of the reef with
surveying equipment. Sub-tidal reefs may be mapped by digital side-scan sonar, towed
video and diver sampled quadrats. Images may be processed to reflect the percent o f
coverage by oyster clusters and shells. Data may be integrated into a Geographical
Information System (GIS) and changes in reef size may be followed over time (Hargis
and Haven, 1999).
Originally, scientists assumed that the larger reef would provide higher production
levels. Now it appears that, with the dispersion capabilities of spat, high production
levels may be reached by grouping smaller reefs together allowing for high spat
production and dispersion to the surrounding reefs as well as the shoreline (USACE
Native Oyster Restoration Master Plan, 2012).
25
Additionally, reducing the reef height impacts water flow by decreasing speeds. Due
to this reduction, sedimentation increases and reduces the quality of suspended food for
oysters which impacts their health and mortality rates. Oyster reefs improve water
quality by filtering suspended solids and nutrients in addition to altering hydrology
patterns that also assist in removing particulate and organic material (Hargis and Haven,
1999). Lenihan and Peterson (1998) created sub-tidal reefs that varied in morphology,
water depth and location on the Neuse River in North Carolina. It demonstrated that the
oyster’s survival varied with reef height, position and depth in relation to flow velocity,
sedimentation rate and dissolved oxygen levels. This indicated that prior knowledge of
hydrographic conditions (sedimentation, current velocities, temperature and density
stratification, and oxygen levels) was a critical requirement.
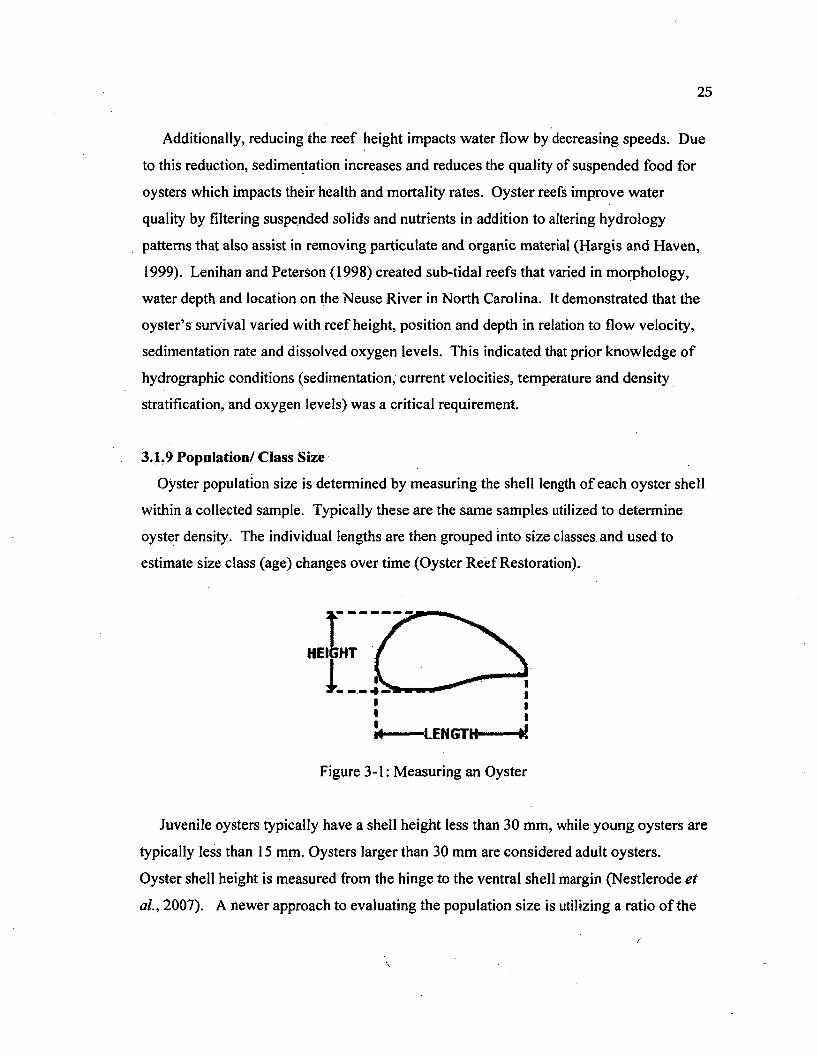
3.1.9 Population/ Class Size
Oyster population size is determined by measuring the shell length of each oyster shell
within a collected sample. Typically these are the same samples utilized to determine
oyster density. The individual lengths are then grouped into size classes, and used to
estimate size class (age) changes over time (Oyster Reef Restoration).
Juvenile oysters typically have a shell height less than 30 mm, while young oysters are
typically less than 15 mm. Oysters larger than 30 mm are considered adult oysters.
Oyster shell height is measured from the hinge to the ventral shell margin (Nestlerode et
al., 2007). A newer approach to evaluating the population size is utilizing a ratio of the
ri LENGTH if
Figure 3-1: Measuring an Oyster
26
shell length to shell width (Harding et al., 2008) which gives a truer indication of the
shell size and the oyster body dimensions.
Additionally, in previous studies (Coen & Luckenbach, 2000 and Walters & Coen,
2006), concurrent samples were collected from adjacent natural and experimental reefs
on various substrates in order to compute sample variance estimates between sites. This
design allowed an evaluation of convergence (or divergence) of the natural and
experimental reefs over time. Oyster densities taken over 3 years on experimental reefs
only reached 23% (averaged across replicate reefs) of the adjacent natural reefs.
Maximum shell heights reached 70 to 98 mm on experimental reefs versus 103 to 136
mm on the natural reefs.
3.1.10 E. coli
Specific guidelines have been issued in the state of Virginia for evaluating water
quality in shellfish bed areas. The most recent 30 samples, collected randomly by DSS
with respect to weather, are utilized to assess each sampling location. In Virginia, there
is a two-part standard for fecal coliforms in water near direct shellfish harvest for market
- (1) a geometric mean no greater than 14 MPN (Most Probable Number) fecal
coliforms/100 ml and (2) an estimated 90th percentile no greater than 49 MPN/100 ml.
Exceeding either requirement requires closure in Virginia. Most of the high fecal
coliform counts in this state are due to runoff from development, agriculture and
livestock operations, or from wildlife. Based on the BST studies conducted for
Lynnhaven Bay, Broad and Linkhom Bay area, the human contribution averaged 25%,
with additional sources of 29% from birds, 17% froni wildlife, 15% from livestock and
14% from pets. In 2007, new guidelines were issued for saline waters to utilize
Enterococci counts instead of Escherichia coli. For this study, both Escherichia coli and
Enterococci counts were included in the model.
3.2 Substrates
For this project, the alternative substrates being reviewed include concrete, granite,
limestone marl, cinder blocks and rip-rap in combination with oyster shell. The most
desirable material utilized in oyster reef construction in the past is empty Crassostrea
27
virginica shell obtained from local shucking operations, restaurants or historic deposits of
oyster shell reefs. When piled in mounds, these shells form an interstitial matrix o f voids
that provide a settlement habitat as well as a refuge from predation (Nestlerode et al.,
2007). Since the British Petroleum Gulf oil spill, shortages of oyster shell have prompted
examining suitable alternative substrates. The results are relevant to future design
strategies in oyster reef restoration. Through the oysters’ natural filtering processes and a
number of important coastal system ecological roles, the water body and the surrounding
habitat is rejuvenated.
Previously, one material commonly used as an alternative was Surf clamshell (Spisula
solidissima). The main disadvantage was that the shells easily fractured either from
deliberate crushing to compact the material or unintentionally through repeated handling.
These crushed pieces packed together tightly and offered limited surface area and
interstitial space. In Nestlerode’s study, a reef was constructed at Goodwin’s Island of
Surf clamshell and a second reef at Fisherman’s Island with oyster shell. Oysters were
consistently more abundant on the oyster shell than on the clamshell reef. In addition, the
oysters were smaller and few survived to sizes larger than 30 mm. Usually the base of an
oyster reef becomes encrusted with a continuous veneer of oysters which never formed
on the clamshell reef (Nestlerode et al., 2007).
Some successful alternative substrates utilized have been buoys and floating oyster
reefs used in an aquaculture environment as well as castles, reefballs and limestone marl
in sub-tidal and intertidal areas. By attaching netting, with oysters and spat, to a buoy,
the oysters reproduced and utilized the buoy as a substrate. This has been utilized in
Korea as well as the United States.
One of the best man-made substrates is oyster castles which are multi-surfaced
building blocks composed of a mixture of concrete, crushed shell and lime. In a project
on Eastern Shore in an intertidal zone, these castles are typically covered with oyster
shell within three years (Personal Communication with Barry Truitt - The Nature
Conservancy). An additional man-made structure, the reefballs, have been placed at
project locations in 59 countries and have planned projects in another 11 countries. High
reproductive rates have been experienced in Florida on reef-ball reefs (Reef Ball
Foundation). Recently, this past summer, an established oyster shell reef in the.
28
Piankatank River (Chesapeake Bay region) was partially encircled with 150 reef-balls
and will be completely encircled with 300 by the end of this summer. Another new reef
location is in the planning stages and will be placed in the Elizabeth River.
Reefballs are constructed hollow domes with holes that are installed on the ocean
bottom in order to create a reef habitat. These balls provide a hard surface for attachment
and decrease the amount of natural shell required to create the reef. Reefballs assist in
reducing oyster poaching, which is still an issue on oyster reefs designated as sanctuaries
(Reef Ball Foundation). Reef ball modules are constructed using a fiberglass mold and a
special concrete mix which reduces the concrete pH to that of natural seawater.
Approximately 180 kilograms (400 lbs) of biomass are produced annually on each
module. The textured surface of the ball and the pH modification enhances oyster larvae
and other marine life attachment. Reefballs can also be used together to create
submerged breakwaters in addition to re- establishing oyster reefs, coral reefs and
mangrove trees (Harris, 2009; Reef Ball Foundation).
The oyster farmer’s use of floating oyster reefs as a form of oyster aquaculture is
increasing and preferred over the standard substrate reefs located on the water body. The
method includes connecting mesh bags to flotation devices which remain just below the
water surface. The positioning in the water column created by the floats increases the
sunlight and algae surrounding the oysters. Additionally, suspending the oysters reduces
their susceptibility of contracting Dermo and MSX and decreases their predation by crabs
and other bottom dwellers. In terms of growing area, the floating reef significantly
decreases the amount of area required. Pacanowsky states that these floating reefs
increase production from the “Chesapeake Bay average of 12 14 oysters per acre to 1,000
oysters in only 30 square feet” (Pacanowsky, 2009). Although, research at Virginia
Tech is ongoing, it is anticipated that each float containing approximately 1500 three inch
oysters is able to filter approximately 1.77 pounds o f nitrogen and 1.43 pounds of
phosphorus (Pacanowsky, 2009). Currents and waves increase the flushing impact by
supporting dissolved oxygen and nutrient levels (Forrest et a l , 2009).
A new Best Management Practice is being considered in order to maintain natural
oyster reefs as declared sanctuaries. Oystermen may possibly be trained on aquaculture
29
and the floating reefs used as a food source rather than continuing to harvest from the
natural ones (USACE Native Oyster Restoration Plan, 2012).
Limestone marl, a combination of limestone and fractured pieces of shell, was utilized
to build mounds for oyster restoration at Ocracoke in 2005. The oyster recruitment was
so successful that the individual pieces of marl are no longer distinguishable. Due to this
success, a new project is underway at Belhaven, North Carolina. The $5 million federal
economic stimulus grant is being funded by the National Oceanic and Atmospheric
Administration (NOAA). The plans are to utilize the limestone marl along with shell
plantings to build as well as monitor approximately 47 acres of oyster reefs in Pamlico
Sound (Miller, 2009).
30
CHAPTER 4
METHODOLOGY
4.1 Procedures/Methodology
4.1.1 Pre-Site Survey
The Initial Step-Site Selection: Most project organizers have a general idea where
the reef will be placed. It is best to start the study with a mariner’s chart
(http://www.navquest.com-). In addition, Google Earth ™ provides satellite images of
various details anywhere on earth and the government has developed Geographical
Information System (GIS) databases that are helpful. Other critical information includes
currents, wave heights and tidal ranges. Tides play a significant role in delivering
nutrients as well as acting as a flushing system. Oyster reef survival is highest in areas
where bottom currents transport feces and bio-deposits away from the reef. Additionally,
tides promote oyster settlement and growth by transporting oyster larvae great distances
(Restoration Monitoring of Oyster Reefs). Questioning local people who spend time on
the water, such as fishermen and boat captains, may also reveal some of the variable,
seasonal and site specific data that might be an aid for the project. Were there oyster
beds in this area previously? If so, what caused their demise? Were there any previous
cases of diseases (such as Dermo or MSX) or any problems with water quality?
Historical data about the area would be invaluable. After completing this initial
evaluation, utilize a map and block out any areas that may be eliminated upfront (Reef
Ball Foundation).
Also, the Environmental Protection Agency (EPA) has compiled a list of additional
areas that need to be excluded:
1. Shipping lanes
2. Restricted military areas
3. Areas of poor water quality (low dissolved oxygen, dredged material disposal
sites, sewer outfalls, river drainage, and other point sources of pollution)
31
4. Traditional trawling grounds
5. Unstable bottoms
6. Areas with extreme currents or high wave energy
7. Existing right-of-ways (Oil and gas pipelines and telecommunication cables)
8. Sites with purposes incompatible with reef development (such as aquaculture)
Any marginal areas should also be eliminated. Local restrictions and designated
marine reserves need to be investigated since they may require special permits, which
could be difficult or impossible to obtain. In addition, it is best to avoid areas of existing
healthy reefs or sea grass beds, especially downstream from new aquaculture sites due to
the heavy excrement load (Hargis and Haven, 1999).
4.1.2 Site Survey
The next site survey step includes a visual survey from a boat along the shoreline in
order to verify the substrate quality (rip-rap, bulkheads, oyster shell, sand, marsh) for
possible oyster attachment. This would also be the time to survey the physical
characteristics and water quality in the area of the site. Preferably, surface water samples
and species samples (with nets or benthic grab samplers) would be taken at sporadic
locations along the coastline to be evaluated. A Dataflow might be utilized to collect
water parameter data. Readings will be taken on water temperature, salinity, dissolved
oxygen levels (DO), chlorophyll a and pH at ebb tide and at different depths. Surface
water samples for chlorophyll analysis will also be taken to duplicate the results seen
with the Dataflow equipment. Nitrogen, phosphorus and ammonium levels will be
tracked to see if there is a trend in conjunction with the health o f the phytoplankton
blooms and the benthic communities. Sediment cores may be taken at the water sample
sites and analyzed for metal and hydrocarbon contaminants known to be effluents from
point sources (such as refineries and sewage treatment plants, etc). These especially need
to be performed for locations near a known Superfund site or oil refinery. Finer
sediments tend to retain higher pollutant concentrations than coarse sediments. Oil
pollution increases oyster mortality, disrupts reproduction and reduces growth and
resistance to parasites (Lorio and Malone, 1994). It is an important step to assess the
sediments at a site being considered for restoration.
32
Turbidity is another critical factor since heavy sediment loads are not conducive to oyster
growth or water quality. Turbidity can be measured using a Secchi disk, a Secchi tube or
turbidity meter at the water sample locations. Listed below are the physical site criteria
previously discussed and some of their optimum conditions.
Physical Site Criteria for Oysters
1. Temperature (20 to 25 degrees Celsius) due to seasons (June to October)*
2. Salinity >10 psu* (Chesapeake Bay & tributaries - range of 12 to 28 psu)
3. DO > 5 mg/L & not less than 2.8 mg/L
4. Turbidity (Secchi disk, turbidity meter, secchi tube) converted to TSS based
on site
5. Composition of sediment - sandy composition or other? (shoreline & sea bed)
6. Depth
7. Sub tidal/intertidal- mudflats, salt marsh or sea grass area
8. Nitrogen/Phosphorus levels (water quality)
9. Chlorophyll a (algal blooms)
10. Species diversity/predators
*(VaIues are summarized for spawning of Crassostrea virginica in the Chesapeake Bay
by Nestlerode et al., 2007)
In oyster restoration site surveys previously made by Virginia Institute of Marine
Science (VIMS) and Chesapeake Bay Foundation (CBF), oyster strings (10 oysters strung
on a wire) have been located on docks and wharfs owned by residents along the coastline
for a minimum of 60 to 90 days in order to evaluate the attachment rates of the spat. In a
recent study, for the Elizabeth River, cages containing 50 oyster shells were tied to
wharfs along the coastline at 60 volunteer sites from early June to mid October. These
were collected and the number of spat counted on each shell to identify which sites were
more successful. Some cages contained blue crabs and toadfish and several o f the oyster
shells were covered with barnacles and mussels. This also gives clues about the nutrient
levels based on the size of the newly attached oysters to the shells and about species
33
diversity by the cages’ content (Chesapeake Bay Foundation — Unpublished Volunteer
Data).
For this study, the pre-site/site surveys had been conducted by the USACE along with
partners in prioritizing the watersheds into Tiers for large-scale oyster restoration. The
main criteria utilized in this study were salinity, dissolved oxygen levels, water depth and
hydrodynamic criteria (USACE Native Oyster Restoration Master Plan - March 2012).
4.1.3 Pre-Established Reef Surveys (First Year)
After the reefs new location has been established, bi-monthly surveys should be
conducted. Rotating sample sites may be selected on the top of the mound, midway and
sides, and at the bottom of the reef in order to minimize sampling identical locations.
Then the numbers of dead and live oysters on the shells as well as the attached spat are
counted. Any holes that may have been drilled by worms or caused by crabs are noted in
order to speculate the cause of mortality (Nestlerode etal., 2007). Usually, a certain
transect size is selected and then extrapolated based on the reef size in order to calculate
survival/mortality rates. If there are high mortality rates, the species and water samples
will help to differentiate whether it occurred due to predation or due to a lack of nutrients
or water quality. These were the main procedures followed in the oyster data collection
in the Burke study (Burke, 2010).
The oyster abundance and size are the main survey criteria for the first three quarters.
Oyster abundance will be evaluated by population density through transect sampling
from the top, middle, sides and bottom of the reef bi-monthly for the first year and
quarterly for the second year, and bi-annually for subsequent years (Luckenbach et al.,
2005) . Care will be taken not to disturb or damage the main structure of the reef.
Utilizing meter quadrats for designating an area to be counted or nets will minimize
damage to the reef. Tongs may be used when shell samples need to be physically
removed from the reef (e-mail communication with CBF Restoration Analyst, Jackie
Harmon).
At the end of the year, one would anticipate seeing an excreted biofilm forming with
attached oysters around the base of the reef. This is a positive sign that the reef
production is at a healthy level. Also, seeing a dense population of oysters that have
34
multiple shells attaching to the old shells, that built the reef, is reflective of high
reproduction and survival rates (Nestlerode et a l, 2007). Net samples of the benthic
community will establish whether diverse species are flourishing in this new
environment.
4.1.4 Post-Audit Surveys (Second Year)
Even in the most conducive environment, it usually takes at least six years for a reef to
become established. Post-audit surveys need to continue at least through the second year
on a quarterly basis and a biannual basis thereafter. However, typically funding is limited
on restoration projects and post audits are rarely conducted past the two year window,
unless radical changes are seen (such as high mortality rates or high reproduction rates).
When radical changes are noted, post audit surveys are warranted (e-mail communication
with Dr. Mark Luckenbach - VIMS). Listed below are the recommendations for these
surveys. Again due to funding restrictions, items #1 through #5 are usually the ones
conducted. The sampling requires equipment, ship time, labor and extensive lab work.
Post-Audit Surveys
1. Oyster abundance (transect samples top, middle, sides and bottom of reef)
2. Shell length/density/stacking
3. Oyster size (>35 mm marketable, desired >75 mm)
4. Excretion film around base of oyster reef (strong indicator)
5. Survival/mortality rates
6. Net samples or grabs for species diversity/predators
7. Water samples (Water quality measures - DO, Turbidity, Depth, nitrogen,
phosphorus, ammonia, chlorophyll A
Evaluation Methods
Oyster shell size is a strong indicator of the reefs survival. Oysters with a shell length
greater than 35 mm are considered marketable and greater than 75 mm are an outstanding
level (Kennedy et al, 1996). An additional positive indicator is the beginning of new
multiple oysters growing on the same shell and a multi-layer stack being formed. This
35
initiates a three-sided layering effect that forms the interstitial matrix of the reef that is
critical for the hiding and nesting places of oyster larvae and other species. In addition,
an excreted film begins to form around the base of a healthy oyster reef at the end o f the
first year or beginning of the second year. This is a definite indicator that the reef is
growing in a conducive environment (Nestlerode et a l, 2007). The biofilm is an organic-
inorganic hybrid material which differs from the shell and is not found in other shellfish.
The film contains an increased protein level as well as an alternate calcium carbonate
crystalline form (Burkettetal., 2010).
4.1.5 Cost/Restoration Benefits
Restoration costs need to be weighed against the restoration benefits. Rarely will the
restoration efforts be cost effective. They are long-term evaluations, require expensive
equipment and are labor intensive. Some of the labor cost may be minimized by utilizing
volunteers; however, it does not outweigh all of the initial costs required for the reef
placement and the maintenance and monitoring costs.
In comparison to other high marginal ecological benefit restorations (such as marsh or
sea grass restoration), oyster reefs have been shown to have a relatively low marginal
cost. The interest in oyster harvesting usually brings local stakeholders and sponsors to
assist. An analysis of constructed reefs in Maryland and Virginia showed a 5-year
recovery rate of costs versus a 14-year recovery rate of costs, respectively. The Virginia
reefs were constructed with oyster shell as a base at a cost o f $10,000 per acre. The
Maryland reefs had a similar construction; however, they were also seeded with
broodstock. Therefore, their initial construction ran approximately $20,000 per acre. It
was found that the addition of maintenance broodstock by Maryland increased
productivity to an average of 100 bushels/acre/year while Virginia’s reefs produced less
than 20 bushels /acre/year. It was also found that harvesting damages the reef and
prevents the aging of the oyster populations. The maintenance of the reefs and the lack
of disturbance increased the lifespan and created greater habitat diversity (Henderson et
a l, 2003).
36
For the Lynnhaven River System, funding has been allocated for 110 additional acres of
sanctuary oyster reef to be placed at an approximate cost of $125,000 per acre
(Lynnhaven River Now, USACE Native Oyster Restoration Plan - March 2012).
4.2 Statistical Models for Evaluating Factorial Multi-colinearities
Initially for this study, a Tree Diagram was built with all of the different data points
available from the Burke study (Burke, 2010). This schematic helped to evaluate which
variable was dependent on another and which variables inevitably led to the final biomass
production. Once a final diagram was completed, all of these variables were loaded into
a spreadsheet in Excel for future use to be downloaded into SAS for evaluation of a final
model reflecting the variables with the highest impact.
For this spreadsheet, oyster data was compiled from the Burke study (Burke, 2010)
and combined with water quality parameter data from DEQ and bacterial counts from
DSS. Due to Tropical Storm Gabrielle in September 2007, several of the collection
stations in the Lynnhaven area were down from September 2007 through March 2008.
This impacted the data package that was compiled since there were several missing data
points for certain collection periods. If there were multiple missing data points, that
sample was removed from the data. Also, any substrates that did not have at least two
years of data to be analyzed were eliminated from the study.
In this statistical analysis, a Factorial design was utilized. A Factorial design is based
on a statistical method known as ANOVA, or analysis of variance to compare central
tendency among different groups on a quantitative level. It evaluates a series of test of
hypotheses (THs) whether the different groups have equal mean scores. It is an
important method to determine the effects of multiple variables on a response.
Additionally, Factorial design can be used to find both main effects on the dependent
variable versus individual variables as well as any interaction effects or multicolinearity
among multiple independent variables.
Factorial design is especially valuable in environmental studies due to their ability to
evaluate the ‘synergy effect’ of multiple factors interacting. Another advantage is the
fact that it tests all possible combinations. This type of evaluation works well when there
are strong interactions between variables and every variable is assumed to contribute
37
significantly toward the dependent variable. That is the case in evaluating the different
substrates utilized in conjunction with oyster restoration and the impact of all o f the
environmental conditions affecting it.
Utilizing Multiple Mean Comparison (MMC) method along with the Factorial design
allows for comparing all the different combinations of pairs of treatments in order to give
a clear assessment of which have the largest or smallest impact on the dependent
variable. There are several MMC methods and in this study, Duncan’s Multiple Range
Test (MRT) (Duncan, 1955) was used since it is considered to be the most conservative
procedure compared to other MMC techniques such as Tukey (Tukey,1951), Scheffe
(Scheffe, 1959), Student Newman-Keuls (Keuls, 1952) and Dunnett's (Dunnett, 1955)
tests. Once the variables with the largest impact to the dependent variable are identified,
a Stepwise Selection Regression Method (Effoymson, 1960) may be utilized to narrow it
down to the most significant independent variables to be considered in the final statistical
model.
The main objective in this statistical analysis is to identify the major factors
influencing the reproduction of the oyster (Crassostrea virginica) in the Lynnhaven to the
greatest degree. In addition, this model is being constructed with the intent of evaluating
alternative substrates on an equivalent level and providing a comparison between the
natural reefs and the living shoreline. Both were constructed with alternative substrates
in order to evaluate if there is a convergence or divergence of the abundance of oysters in
these different scenarios. In previous studies (Coen and Luckenbach, 2000; Walters and
Coen, 2006), concurrent samples were collected from adjacent natural and experimental
reefs on various substrates in order to compute sample variance estimates between sites.
This design allowed an evaluation of convergence (or divergence) of the natural and
experimental reefs over time.
This statistical model when utilized will establish if a relationship is present between
the dependent variable, biomass production, and treatment levels of temperature (which
includes seasonal variability), salinity (includes water flow rate), TSS (total suspended
solids), depth, dissolved oxygen levels (DO) and nutrient levels for nitrogen, phosphorus,
and chlorophyll a as well as Escherichia coli/Enterococci counts. The block levels
chosen for this model were the alternative substrates - cement, granite, limestone marl,
38
oyster shell, cinder blocks, concrete modules and combinations. The bi-monthly data
values for all of the block and treatment levels were obtained from databases maintained
by DEQ and DSS. Sampling stations were chosen that were closest to the oyster bed
locations. The bacterial counts will also be critical in establishing recommendations for
TMDLs and/or Best Management Practices to impact water quality parameters based on
results from this study.
4.2.1 Assumptions
In order to evaluate the impact of predators in this experiment, data were accumulated
on various substrates utilizing caged and uncaged scenarios at the Long Creek site. The
openings in the cages were sized in order to keep out blue crabs and fish. This alternative
at Long Creek was evaluated on the marsh area, an established oyster reef and rip rap
areas. In addition, some concrete and granite sites were placed. Cages were not used at
the living shoreline sites in Eastern Branch and Linkhom Bay. At these locations, each
substrate was tested with seeded and non-seeded alternatives.
In establishing criteria for measuring the health of the oy ster reef, the survival rate
would be weighted heavier than the biomass for the first year since the spat are very
sensitive and are more susceptible to disease and predation. For the second year, the
evaluation criteria would change to the formation of multiple stacking arrangements,
area of the reef and biomass as the oyster matures.
The data included reef-balls as a substrate on the living shoreline; however, in order to
count the number of live and dead oysters, the reef-balls were destructively sampled at
the end of the experiment for a final count. Since there was only one final year o f data,
these counts were not included in the calculations. At least two years would be needed
for it to be considered statistically valid.
For the initial computer runs, one of the data points included in the spreadsheet was
AFDM (Ash-free dry tissue mass). This was used in the Burke study in the calculation
for the final biomass. The initial outputs were only showing a relationship between these
two criteria. Once the AFDM values were removed from the dataset, SAS was able to
construct a model.
39
Once a final model was run for Long Creek, Eastern Branch and Linkhom Bay living
shorelines and a composite, these models were re-input along with the same data file and
re-run.
4.2.2 Test of Hypothesis
The null hypothesis for this statistical analysis states that all of the independent
variables (Temperature, salinity, TSS, E. coli/Enterococcus, alternative substrates, depth,
DO, nitrogen, phosphorus and chlorophyll a) are equal in impact to the oyster’s biomass
production, the dependent variable. The alternate hypothesis states that at least one or a
combination of the independent variables does affect the biomass production. The
Factorial Model along with a Multiple Means Comparison (MMC) was utilized to
evaluate which combinations of blocks and treatments provided the most conducive
environment for total oyster biomass production. The Stepwise Selection Method was
used to narrow the field to the ones with the largest impact for the final model.
4.2.3 Factorial Model
Y (Reproduction Rate Dependent Variable)^ =
p (Population Mean) + Tj+pj +Tki (Treatment-Temperature) | ik2
(Treatment-Salinity) | T u (Treatment-TSS) | x m (Treatment-^, coli) | Xks (Depth)
| xk6 (DO) | xk7 (Nitrogen) | xk8 (Phosphorus) | xj# (Chlorophyll a) | pki
(Alternative Substrates - Cement, Granite, Limestone Marl, Oyster Shell, Cinder
blocks, Concrete Modules) + 8 (Random Error)ijk
Note: Bar| denotes all factorial combinations of treatments and blocks are evaluated, and
e~NID(0,<r2) under the Gaussian-Markov Theorem
Where:
Y = Oyster reproduction response to the independent variables (Temperature,
Salinity, TSS, E. Coli/Enterococcus, Alternative Substrates, Depth, DO,
Nitrogen, Phosphorus and Chlorophyll a)
jx = Population mean
40
x = Treatment effect from Temperature (Degree C), Salinity (psu), TSS (mg/L), E.
coli/Enterococcus (MPN/lOOml), Depth (m), DO (mg/L), Nitrogen
(mg/L), Phosphorus (mg/L) and Chlorophyll a(mg/L)
P = Block effects of Independent Variables Alternative Substrates (Cement,
Granite, Limestone Marl, Oyster Shell, Cinder blocks, Concrete Modules)
8 = Random error, e~NID(0,o2)
Test of Hypotheses
(a) Test of Treatment effects:
Ho : Ti = t 2 = T3 = t 4 = ts = 0 (Levels of Temperature, Salinity, TSS, Depth (m),
DO (mg/L), Nitrogen (mg/L), Phosphorus (mg/L), Chlorophyll a(mg/L) and E.
coli/Enterococcus) have equivalent impact on oyster biomass production)
Ha : At least one or more tj * 0 (At least one or more may have significant
impact on oyster biomass production)
(b) Test of Block effects:
Ho : pi = P2 = P3 = P4 = Ps = P6 = 0 (Alternative Substrates Cement, Granite,
Limestone Marl, Oyster Shell, Cinder blocks, Concrete Modules) have
equivalent impact on Oyster reproduction rate)
Ha: At least one or more pi * 0 (At least one or more may have significant
impact on Oyster biomass production)
For the Multiple Mean Comparison (MMC), Duncan’s Multiple Range Test (MRT) was
utilized after Stepwise Selection Regression analysis was used to identify any significant
effects to differentiate which levels of these variables had the largest and smallest effects.
In addition, the health of the oyster reef may be evaluated by the following equations:
41
Reef Age Less Than 1 Year
C.T. (survival rate) x 70% + C.T. (biomass) x 30%
Survival Rate = # Live Shell / # Total Live & Dead Shell x 100
Biomass = Reef Areas or Dried Weight (AFDM/square meter)
Reef Age Greater Than 1 Year
%(stacking) x 30% + %(biofilm) x 40% %(biomass) x 30%
Primary Criteria
Central Tendency (C.T. biomass) = AFDM/square meter
Central Tendency (C.T. survival rate) = # Live Shell / # Total Live & Dead Shell
x 100
Secondary Criteria
% (Bio) = layering/stacking
Escherichia coli/Enterococci bacterial counts
Environmental water quality indicators at each site
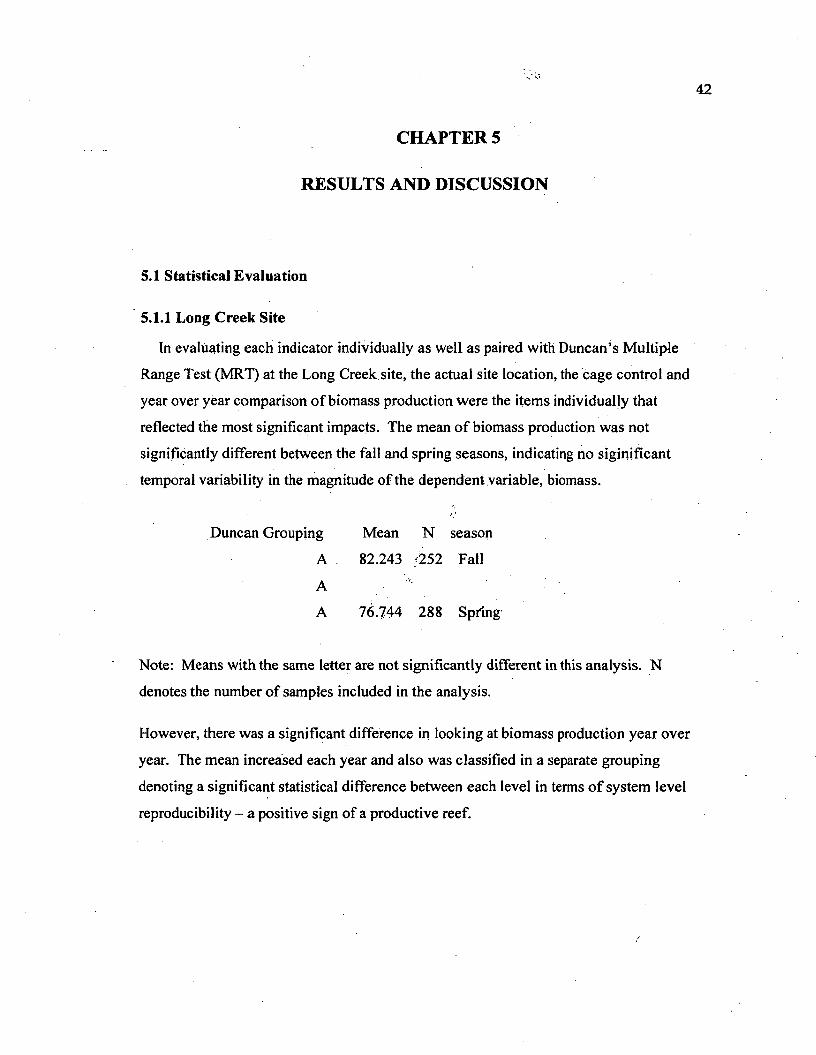
42
CHAPTER 5
RESULTS AND DISCUSSION
5.1 Statistical Evaluation
5.1.1 Long Creek Site
In evaluating each indicator individually as well as paired with Duncan’s Multiple
Range Test (MRT) at the Long Creek site, the actual site location, the cage control and
year over year comparison of biomass production were the items individually that
reflected the most significant impacts. The mean o f biomass production was not
significantly different between the fall and spring seasons, indicating no siginjficant
temporal variability in the magnitude of the dependent variable, biomass.
Duncan Grouping Mean N season
A 82.243 ‘252 Fall
A
A 76.744 288 Spring
Note: Means with the same letter are not significantly different in this analysis. N
denotes the number of samples included in the analysis.
However, there was a significant difference in looking at biomass production year over
year. The mean increased each year and also was classified in a separate grouping
denoting a significant statistical difference between each level in terms o f system level
reproducibility - a positive sign of a productive reef.
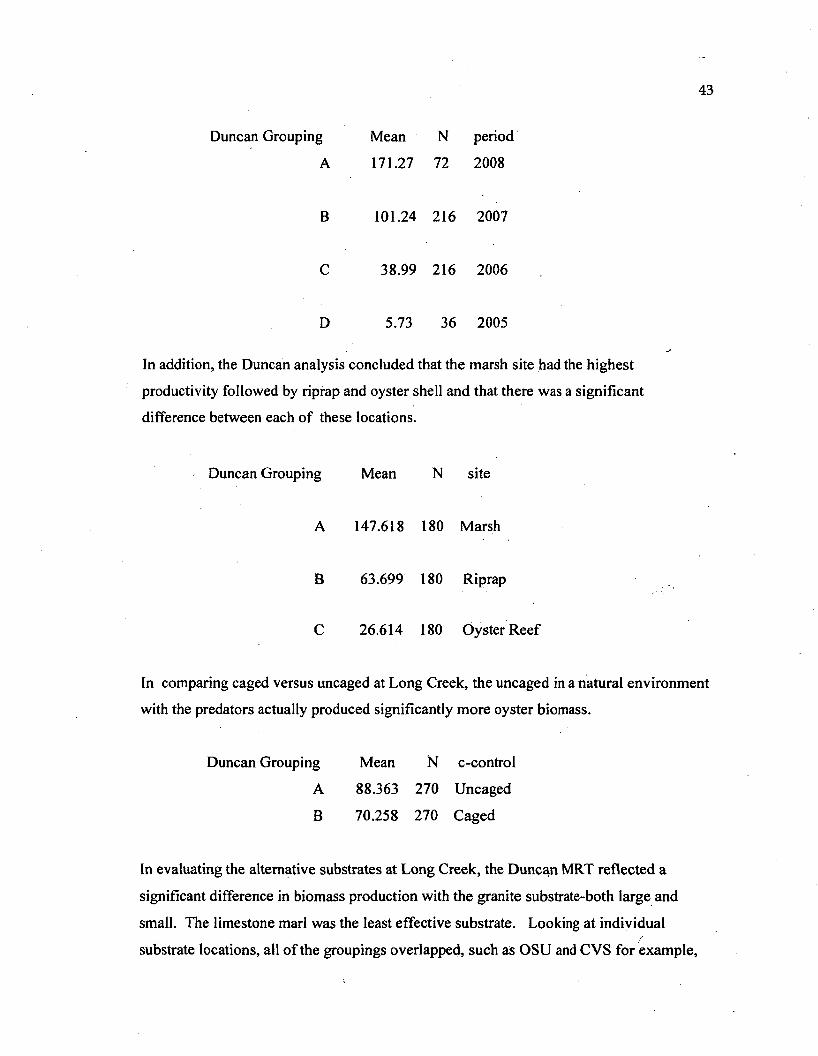
43
Duncan Grouping Mean N period
A 171.27 72 2008
B 101.24 216 2007
C 38.99 216 2006
D 5.73 36 2005
In addition, the Duncan analysis concluded that the marsh site had the highest
productivity followed by riprap and oyster shell and that there was a significant
difference between each of these locations.
Duncan Grouping Mean N site
A 147.618 180 Marsh
B 63.699 180 Riprap
C 26.614 180 Oyster Reef
In comparing caged versus uncaged at Long Creek, the uncaged in a natural environment
with the predators actually produced significantly more oyster biomass.
Duncan Grouping Mean N c-control
A 88.363 270 Uncaged
B 70.258 270 Caged
In evaluating the alternative substrates at Long Creek, the Duncan MRT reflected a
significant difference in biomass production with the granite substrate-both large and
small. The limestone marl was the least effective substrate. Looking at individual
substrate locations, all of the groupings overlapped, such as OSU and CVS for example,
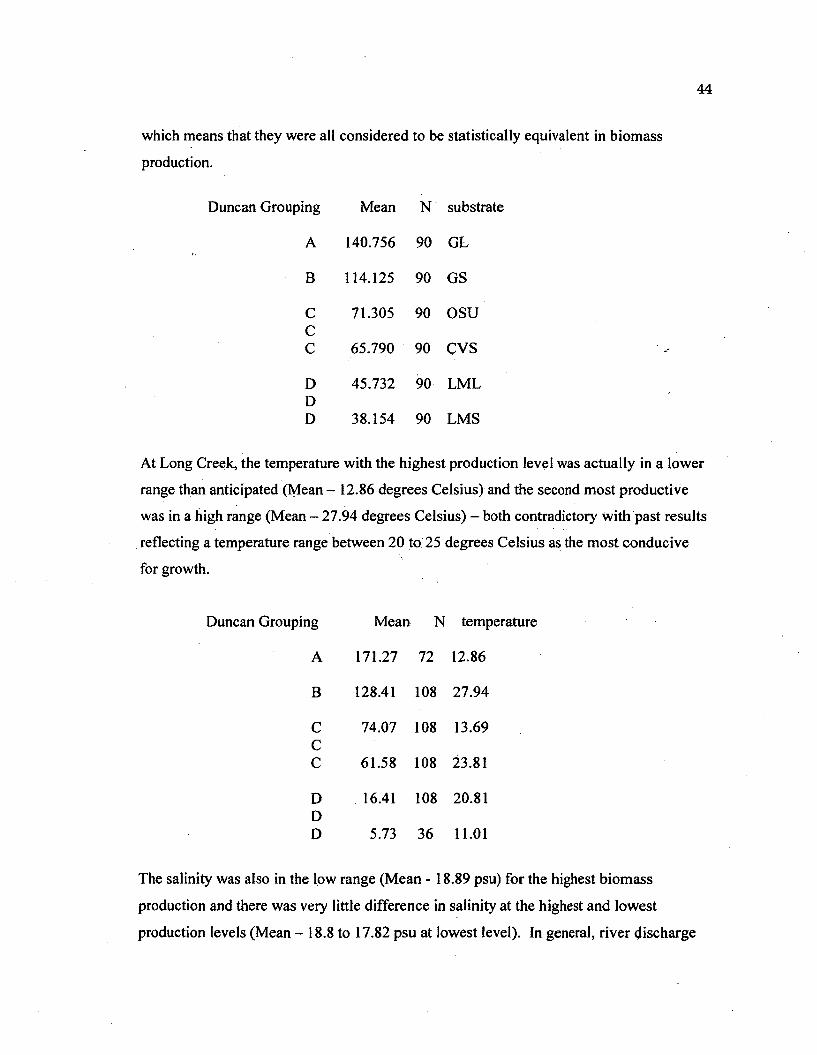
44
which means that they were all considered to be statistically equivalent in biomass
production.
Duncan Grouping Mean N substrate
A 140.756 90 GL
B 114.125 90 GS
C 71.305 90 OSUCC 65.790 90 CVS
D 45.732 90 LMLDD 38.154 90 LMS
At Long Creek, the temperature with the highest production level was actually in a lower
range than anticipated (Mean - 12.86 degrees Celsius) and the second most productive
was in a high range (Mean - 27.94 degrees Celsius) - both contradictory with past results
reflecting a temperature range between 20 to 25 degrees Celsius as the most conducive
for growth.
Duncan Grouping Mean N temperature
A 171.27 72 12.86
B 128.41 108 27.94
C 74.07 108 13.69CC 61.58 108 23.81
D 16.41 108 20.81DD 5.73 36 11.01
The salinity was also in the low range (Mean - 18.89 psu) for the highest biomass
production and there was very little difference in salinity at the highest and lowest
production levels (Mean - 18.8 to 17.82 psu at lowest level). In general, river discharge
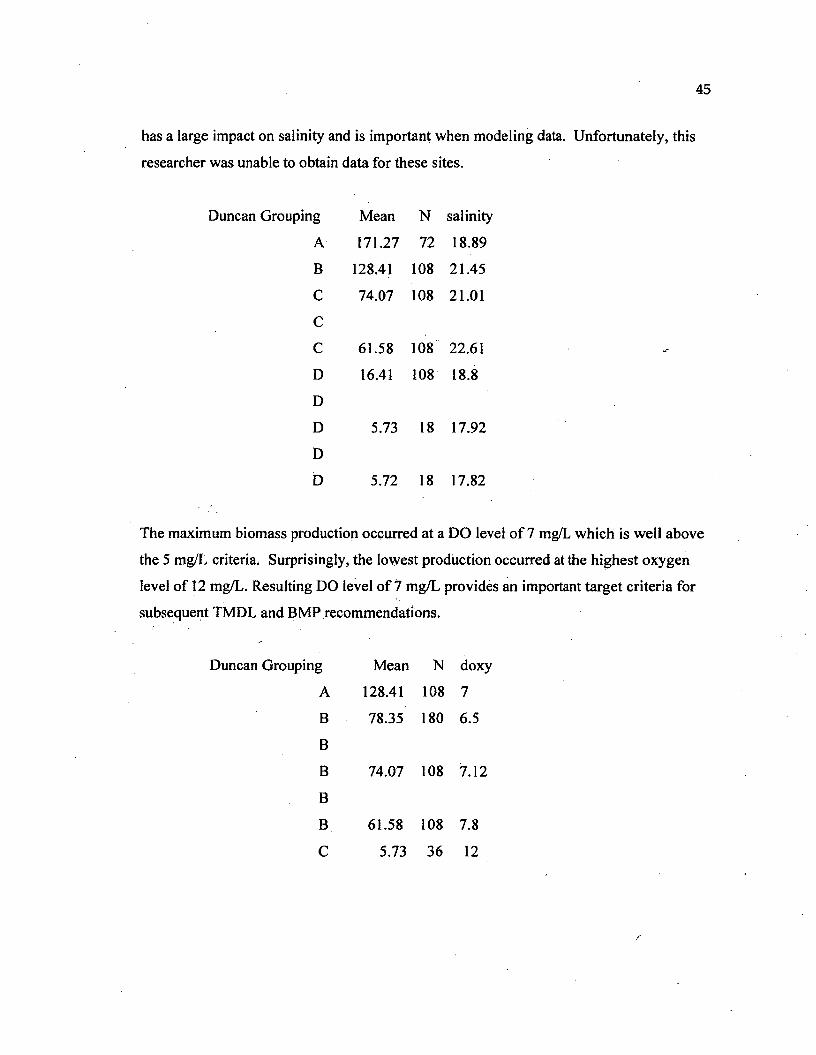
45
has a large impact on salinity and is important when modeling data. Unfortunately, this
researcher was unable to obtain data for these sites.
Duncan Grouping Mean N salinity
A 171.27 72 18.89
B 128.41 108 21.45
C 74.07 108 21.01
C
C 61.58 108 22.61
D 16.41 108 18.8
D
D 5.73 18 17.92
D
D 5.72 18 17.82
The maximum biomass production occurred at a DO level of 7 mg/L which is well above
the 5 mg/L criteria. Surprisingly, the lowest production occurred at the highest oxygen
level of 12 mg/L. Resulting DO level of 7 mg/L provides an important target criteria for
subsequent TMDL and BMP recommendations.
Duncan Grouping Mean N doxy
A 128.41 108 7
B 78.35 180 6.5
B
B 74.07 108 7.12
B
B 61.58 108 7.8
C 5.73 36 12
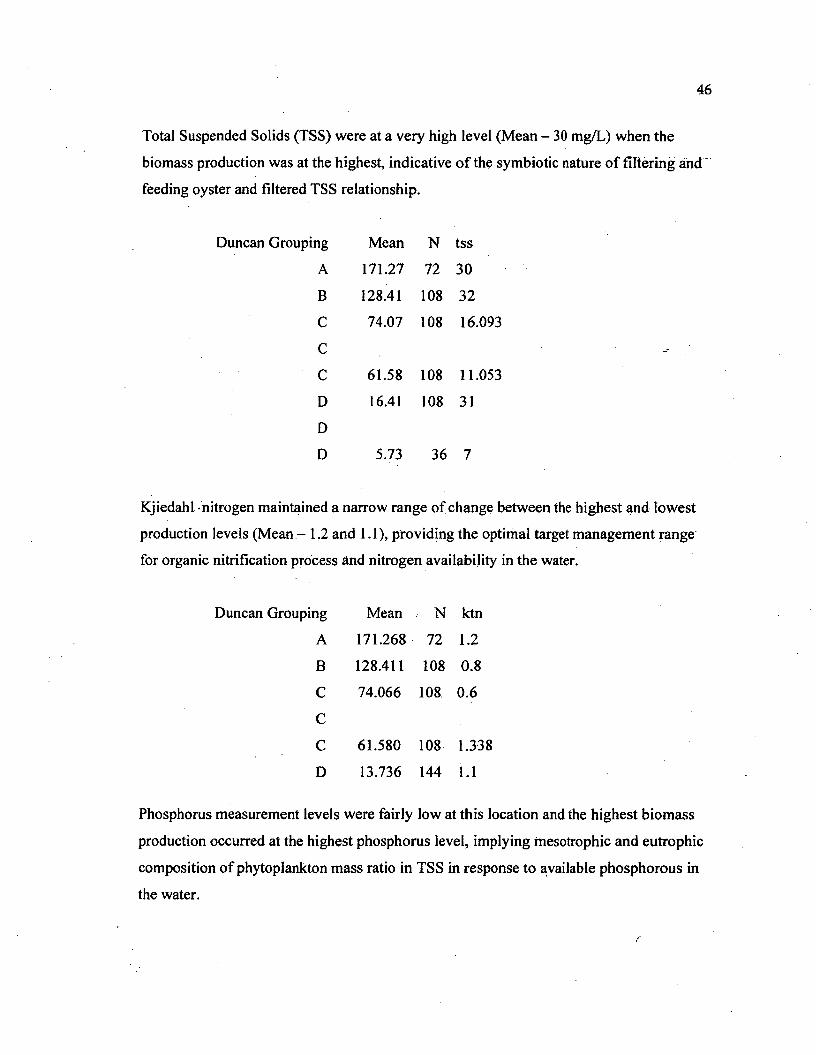
46
Total Suspended Solids (TSS) were at a very high level (Mean - 30 mg/L) when the
biomass production was at the highest, indicative o f the symbiotic nature of filtering and
feeding oyster and filtered TSS relationship.
Duncan Grouping Mean N tss
A 171.27 72 30
B 128.41 108 32
C 74.07 108 16.093
C
C 61.58 108 11.053
D 16.41 108 31
D
D 5.73 36 7
Kjiedahl nitrogen maintained a narrow range of change between the highest and lowest
production levels (Mean - 1,2 and 1.1), providing the optimal target management range
for organic nitrification process and nitrogen availability in the water.
Duncan Grouping Mean , N ktn
A 171.268 72 1.2
B 128.411 108 0.8
C 74.066 108 0.6
C
C 61.580 108 1.33
D 13.736 144 1.1
Phosphorus measurement levels were fairly low at this location and the highest biomass
production occurred at the highest phosphorus level, implying mesotrophic and eutrophic
composition of phytoplankton mass ratio in TSS in response to available phosphorous in
the water.
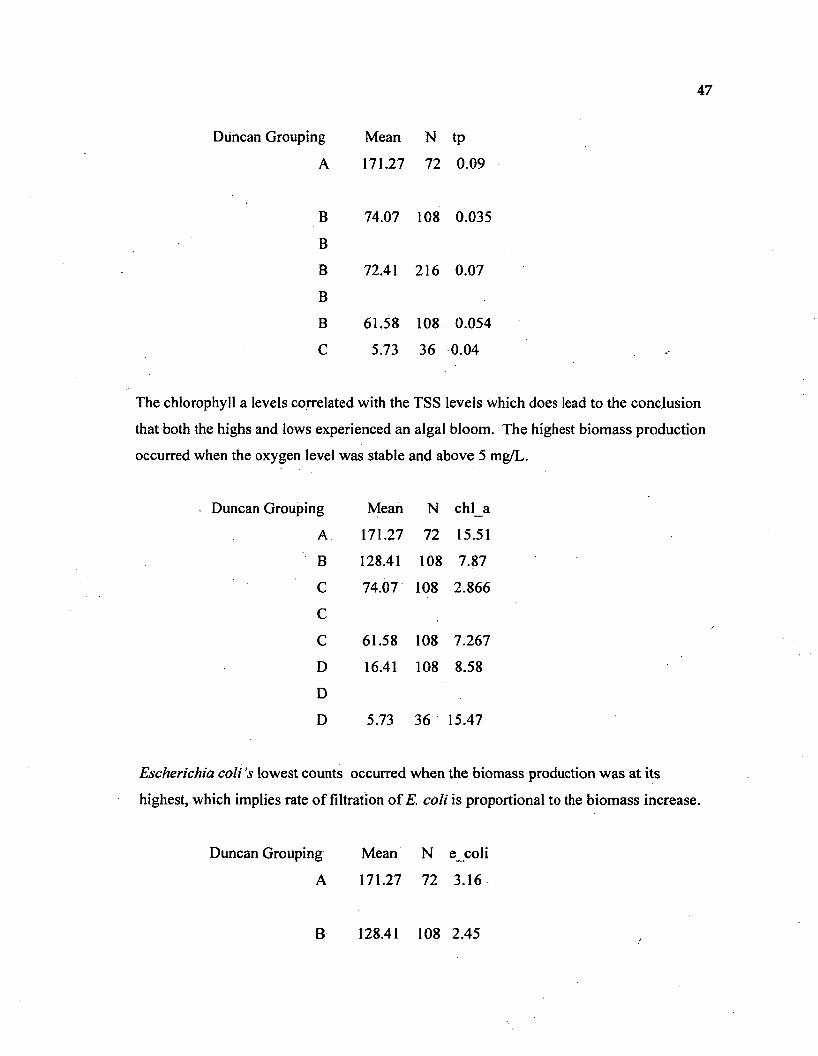
47
Duncan Grouping Mean N tp
A 171.27 72 0.09
B 74.07 108 0.035
B
B 72.41 216 0.07
B
B 61.58 108 0.054
C 5.73 36 0.04 .
The chlorophyll a levels correlated with the TSS levels which does lead to the conclusion
that both the highs and lows experienced an algal bloom. The highest biomass production
occurred when the oxygen level was stable and above 5 mg/L.
. Duncan Grouping Mean N chl_a
A 171.27 72 15.51
B 128.41 108 7.87
C 74.07 108 2.866
C
C 61.58 108 7.267
D 16.41 108 8.58
D
D 5.73 36 15.47
Escherichia coli’s lowest counts occurred when the biomass production was at its
highest, which implies rate of filtration of E. coli is proportional to the biomass increase.
Duncan Grouping Mean N e coli
A 171.27 72 3.16
B 128.41 108 2.45
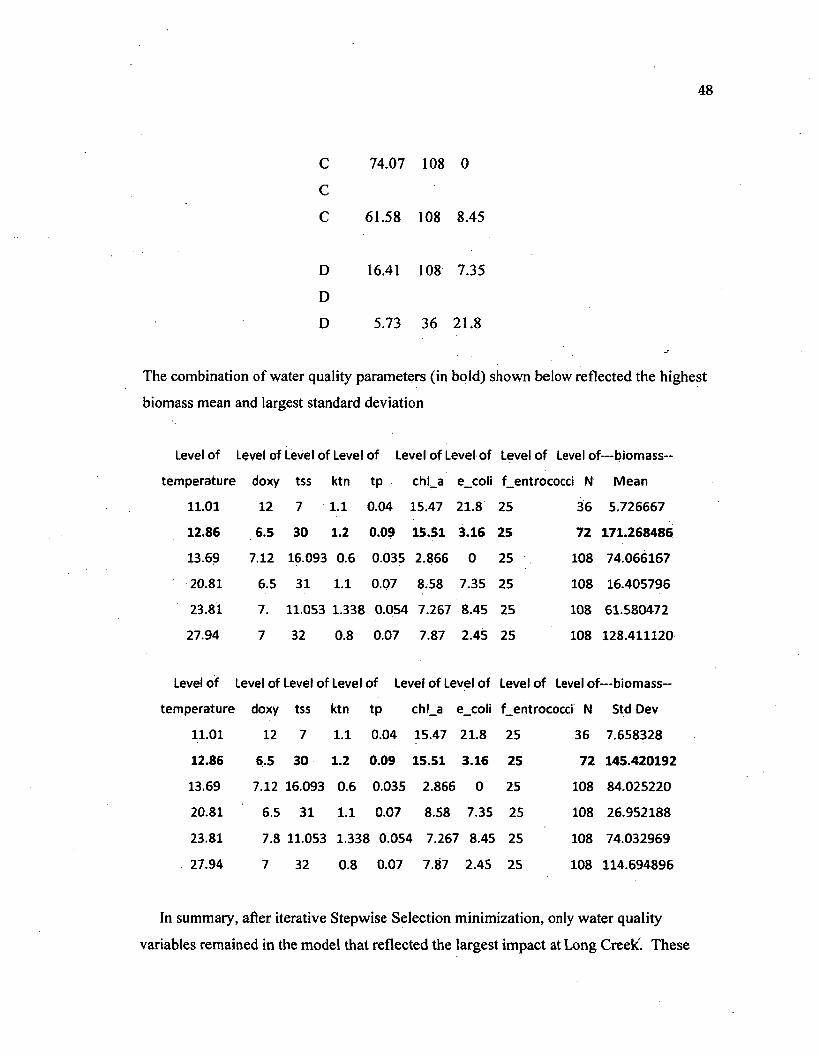
48
C 74.07 108 0
C
C 61.58 108 8.45
D 16.41 108 7.35
D
D 5.73 36 21.8
The combination of water quality parameters (in bold) shown below reflected the highest
biomass mean and largest standard deviation
Level of Level of Level of Level of Level of Level of Level of Level of—biomass-
temperature doxy tss ktn tp chLa e_coli f_entrococci N Mean
11.01 12 7 1.1 0.04 15.47 21.8 25 36 5.726667
12.86 6.5 30 1.2 0.09 15.51 3.16 25 72 171.268486
13.6? 7.12 16.093 0.6 0.035 2.866 0 25 108 74.066167
20.81 6.5 31 1.1 0.07 8.58 7.35 25 108 16.405796
23.81 7. 11.053 1.338 0.054 7.267 8.45 25 108 61.580472
27.94 7 32 0.8 0.07 7.87 2.45 25 108 128.411120
Level of Level of Level of Level of Level of Level of Level of Level of—biomass-
temperature doxy tss ktn tp chl_a e_coli f_entrococci N Std Dev
11.01 12 7 1.1 0.04 15.47 21.8 25 36 7.658328
12.86 6.5 30 1.2 0.09 15.51 3.16 25 72 145.420192
13.69 7.12 16.093 0.6 0.035 2.866 0 25 108 84.025220
20.81 6.5 31 1.1 0.07 8.58 7.35 25 108 26.952188
23.81 7.8 11.053 1.338 0.054 7.267 8.45 25 108 74.032969
27.94 7 32 0.8 0.07 7.87 2.45 25 108 114.694896
In summary, after iterative Stepwise Selection minimization, only water quality
variables remained in the model that reflected the largest impact at Long Creek'. These
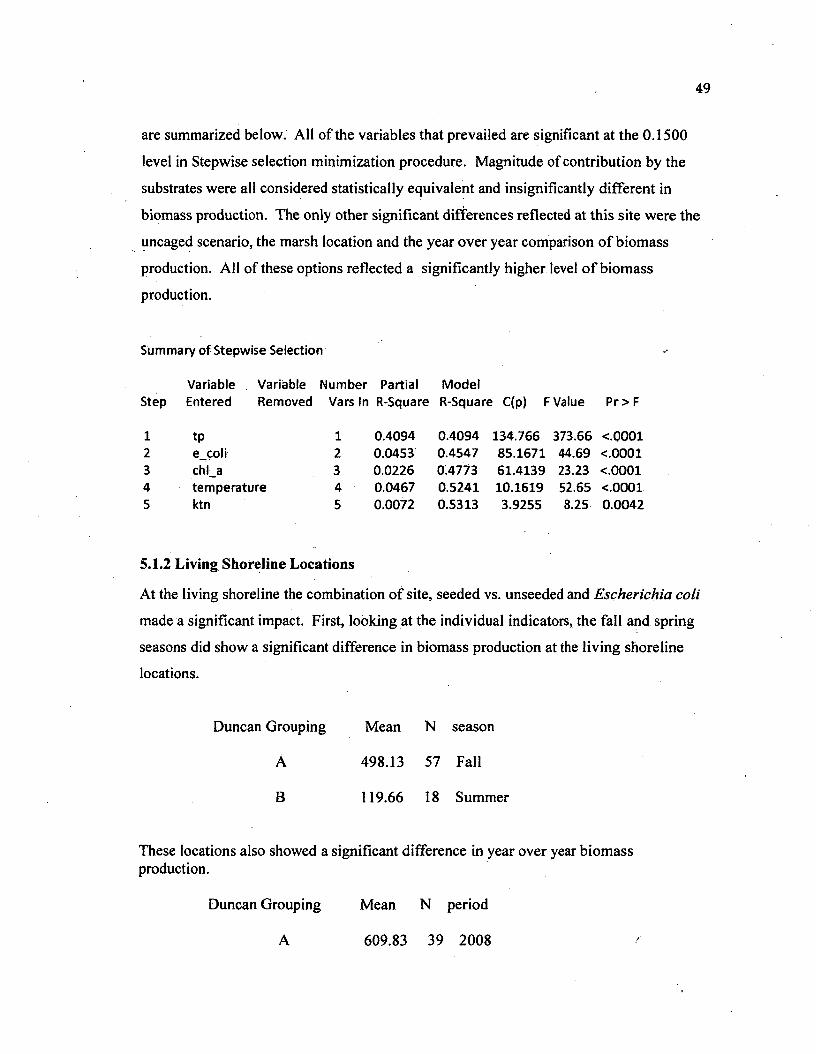
49
are summarized below. All of the variables that prevailed are significant at the 0.1500
level in Stepwise selection minimization procedure. Magnitude of contribution by the
substrates were all considered statistically equivalent and insignificantly different in
biomass production. The only other significant differences reflected at this site were the
uncaged scenario, the marsh location and the year over year comparison of biomass
production. All of these options reflected a significantly higher, level o f biomass
production.
Summary of Stepwise Selection
StepVariable Variable Entered Removed
Number Vars In
PartialR-Square
ModelR-Square C(p) FValue Pr > F
1 tp 1 0.4094 0.4094 134.766 373.66 <.00012 e_coli 2 0.0453 0.4547 85.1671 44.69 <.00013 chl_a 3 0.0226 0:4773 61.4139 23.23 <.00014 temperature 4 0.0467 0.5241 10.1619 52.65 <.00015 ktn 5 0.0072 0.5313 3.9255 8.25 0.0042
5.1.2 Living Shoreline Locations
At the living shoreline the combination of site, seeded vs. unseeded and Escherichia coli
made a significant impact. First, looking at the individual indicators, the fall and spring
seasons did show a significant difference in biomass production at the living shoreline
locations.
Duncan Grouping Mean N season
A 498.13 57 Fall
B 119.66 18 Summer
These locations also showed a significant difference in year over year biomass production.
Duncan Grouping Mean N period
A 609.83 39 2008
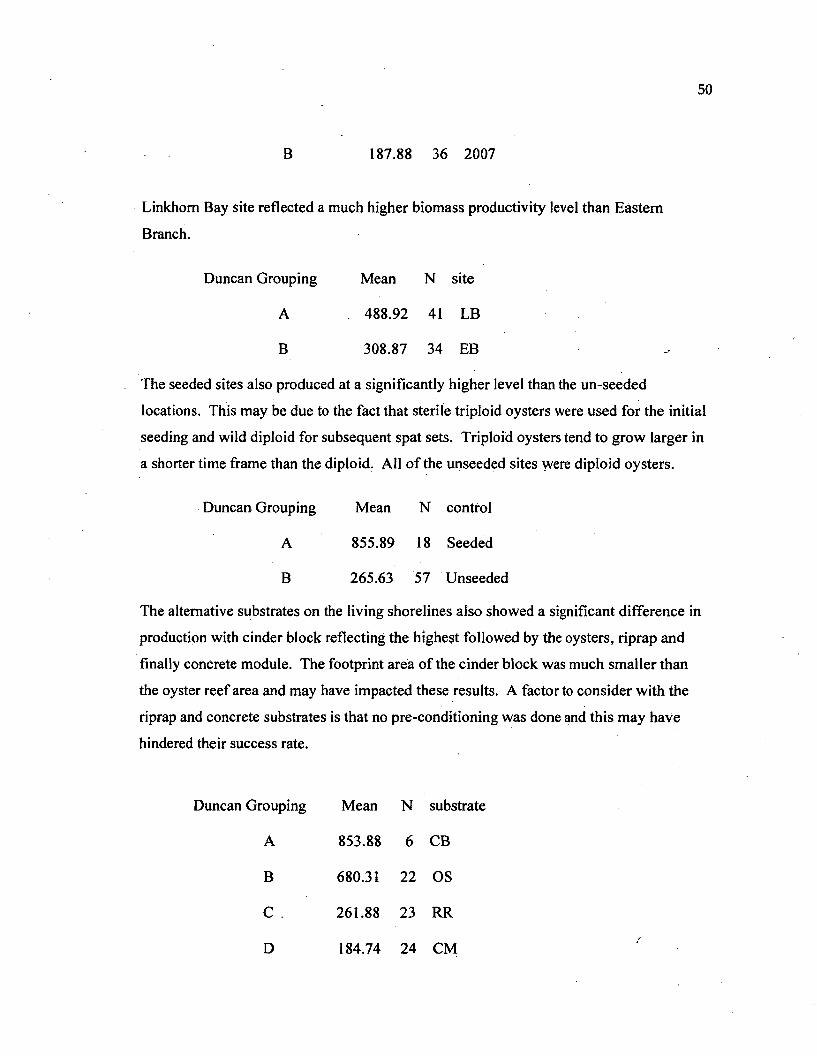
50
B 187.88 36 2007
Linkhom Bay site reflected a much higher biomass productivity level than Eastern
Branch.
Duncan Grouping Mean N site
A 488.92 41 LB
B 308.87 34 EB
The seeded sites also produced at a significantly higher level than the un-seeded
locations. This may be due to the fact that sterile triploid oysters were used for the initial
seeding and wild diploid for subsequent spat sets. Triploid oysters tend to grow larger in
a shorter time frame than the diploid. All of the unseeded sites were diploid oysters.
Duncan Grouping Mean N control
A 855.89 18 Seeded
B 265.63 57 Unseeded
The alternative substrates on the living shorelines also showed a significant difference in
production with cinder block reflecting the highest followed by the oysters, riprap and
finally concrete module. The footprint area of the cinder block was much smaller than
the oyster reef area and may have impacted these results. A factor to consider with the
riprap and concrete substrates is that no pre-conditioning was done and this may have
hindered their success rate.
Duncan Grouping Mean N substrate
A 853.88 6 CB
B 680.31 22 OS
C . 261.88 23 RR
D 184.74 24 CM
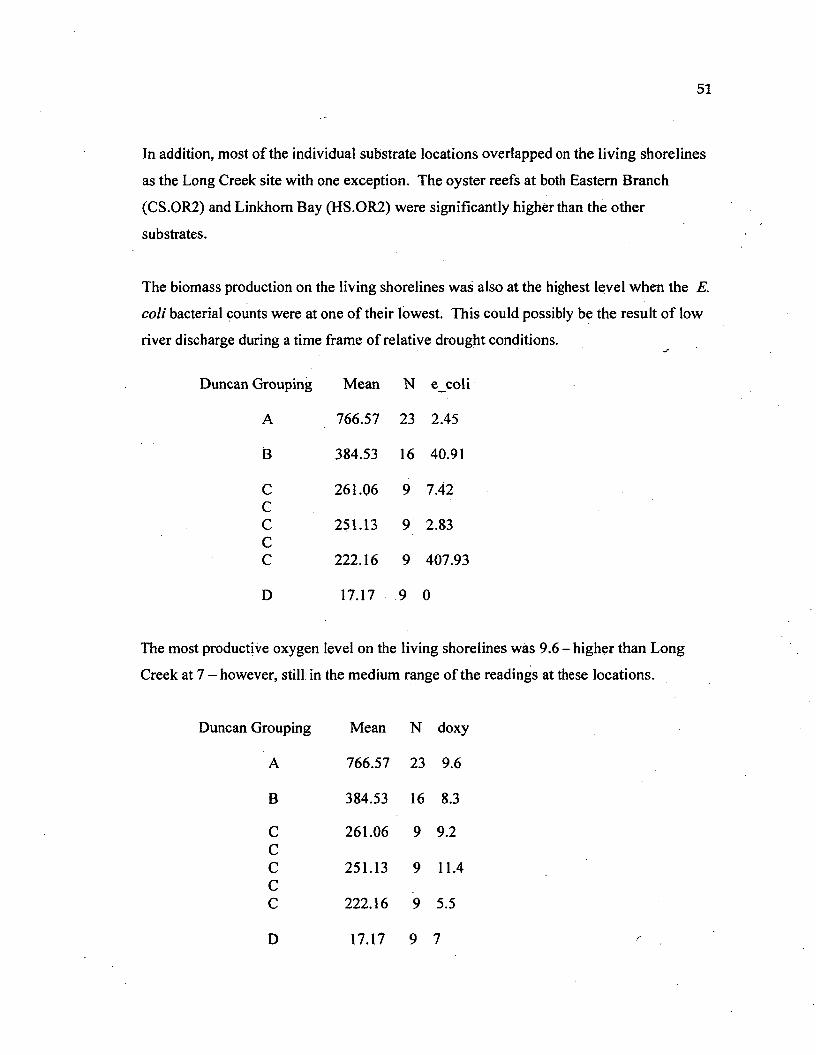
51
In addition, most of the individual substrate locations overlapped on the living shorelines
as the Long Creek site with one exception. The oyster reefs at both Eastern Branch
(CS.OR2) and Linkhom Bay (HS.OR2) were significantly higher than the other
substrates.
The biomass production on the living shorelines was also at the highest level when the E.
coli bacterial counts were at one of their lowest. This could possibly be the result of low
river discharge during a time frame of relative drought conditions.
Grouping Mean N e_coli
A 766.57 23 2.45
B 384.53 16 40.91
C 261.06 9 7.42CC 251.13 9 2.83CC 222.16 9 407.93
D 17.17 9 0
The most productive oxygen level on the living shorelines was 9.6 - higher than Long
Creek at 7 - however, still in the medium range of the readings at these locations.
Duncan Grouping Mean N doxy
A 766.57 23 9.6
B 384.53 16 8.3
C 261.06 9 9.2CC 251.13 9 11.4CC 222.16 9 5.5
D 17.17 9 7
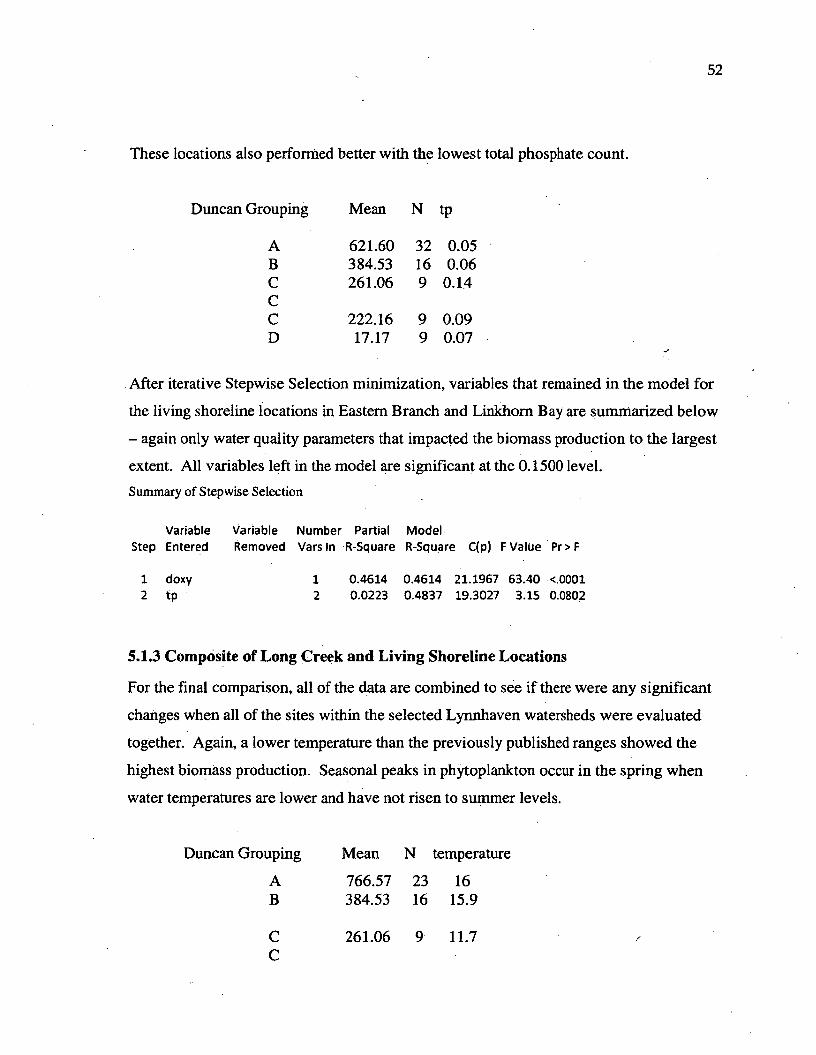
52
These locations also performed better with the lowest total phosphate count.
Duncan Grouping Mean N tP
A 621.60 32 0.05B 384.53 16 0.06C 261.06 9 0.14CC 222.16 9 0.09D 17.17 9 0.07
After iterative Stepwise Selection minimization, variables that remained in the model for
the living shoreline locations in Eastern Branch and Linkhom Bay are summarized below
- again only water quality parameters that impacted the biomass production to the largest
extent. All variables left in the model are significant at the 0.1500 level.Summary of Stepwise Selection
Variable Variable Number Partial ModelStep Entered Removed Vars In R-Square R-Square C(p) F Value Pr>F
1 doxy 1 0.4614 0.4614 21.1967 63.40 <.00012 tp 2 0.0223 0.4837 19.3027 3.15 0.0802
5.1.3 Composite of Long Creek and Living Shoreline Locations
For the final comparison, all of the data are combined to see if there were any significant
changes when all of the sites within the selected Lynnhaven watersheds were evaluated
together. Again, a lower temperature than the previously published ranges showed the
highest biomass production. Seasonal peaks in phytoplankton occur in the spring when
water temperatures are lower and have not risen to summer levels.
Duncan Grouping Mean N temperature
A 766.57 23 16B 384.53 16 15.9
CC
261.06 9 11.7
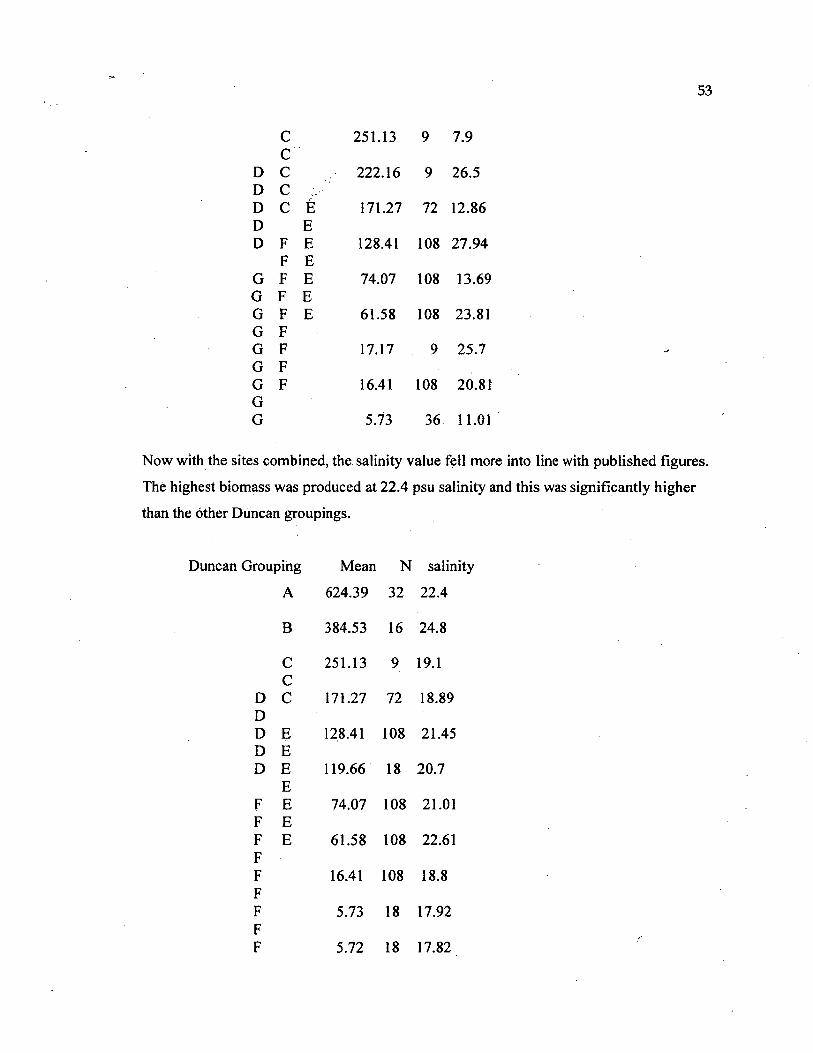
53
C 251.13 9 7.9C
D C 222.16 9 26.5D CD C E 171.27 72 12.86D ED F E 128.41 108 27.94
F EG F E 74.07 108 13.69G F EG F E 61.58 108 23.81G FG F 17.17 9 25.7G FG F 16.41 108 20.81GG 5.73 36 11.01
Now with the sites combined, the salinity value fell more into line with published figures.
The highest biomass was produced at 22.4 psu salinity and this was significantly higher
than the other Duncan groupings.
Duncan Grouping Mean N salinity
A 624.39 32 22.4
B 384.53 16 24.8
C 251.13 9 19.1C
D C 171.27 72 18.89DD E 128.41 108 21.45D ED E 119.66 18 20.7
EF E 74.07 108 21.01F EF E 61.58 108 22.61FF 16.41 108 18.8FF 5.73 18 17.92FF 5.72 18 17.82
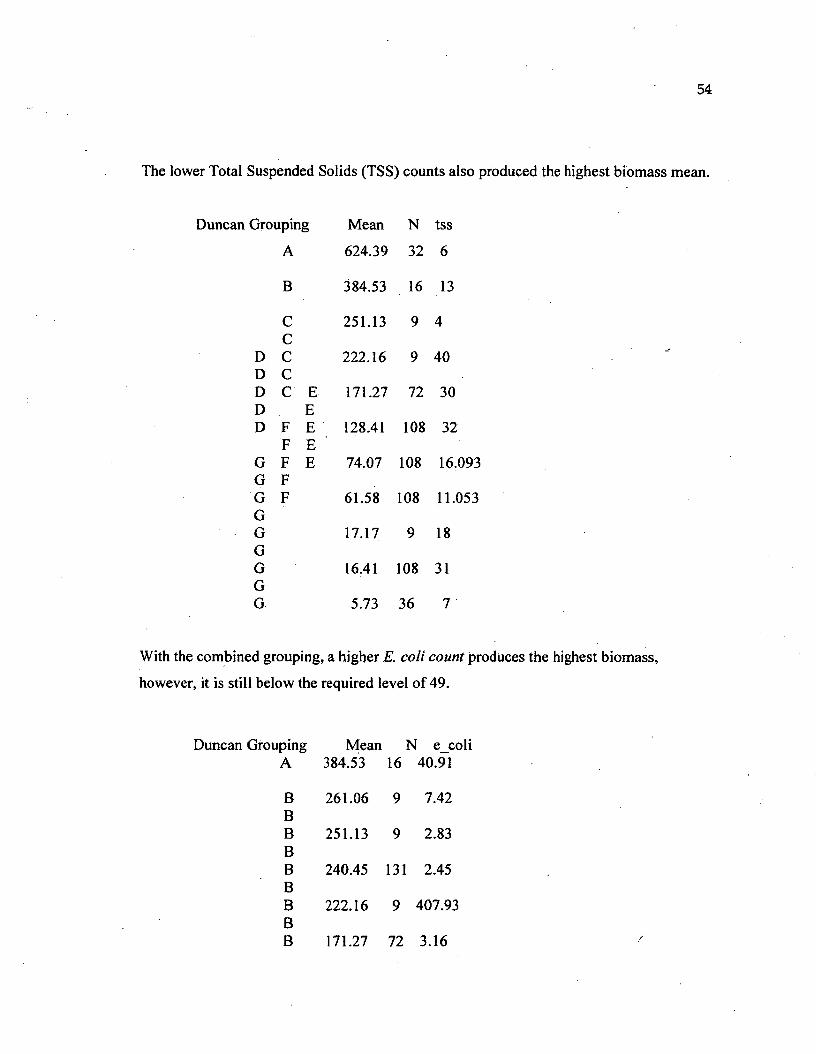
54
The lower Total Suspended Solids (TSS) counts also produced the highest biomass mean.
Duncan Grouping Mean N tss
A 624.39 32 6
B 384.53 16 13
C 251.13 9 4C
D C 222.16 9 40D CD C E 171.27 72 30D ED F E 128.41 108 32
F EG F E 74.07 108 16.093G FG F 61.58 108 11.053GG 17.17 9 18GG 16.41 108 31GG 5.73 36 7
With the combined grouping, a higher E. coli count produces the highest biomass,
however, it is still below the required level of 49.
Duncan Grouping Mean N e_coliA 384.53 16 40.91
B 261.06 9 7.42BB 251.13 9 2.83BB 240.45 131 2.45BB 222.16 9 407.93BB 171.27 72 3.16
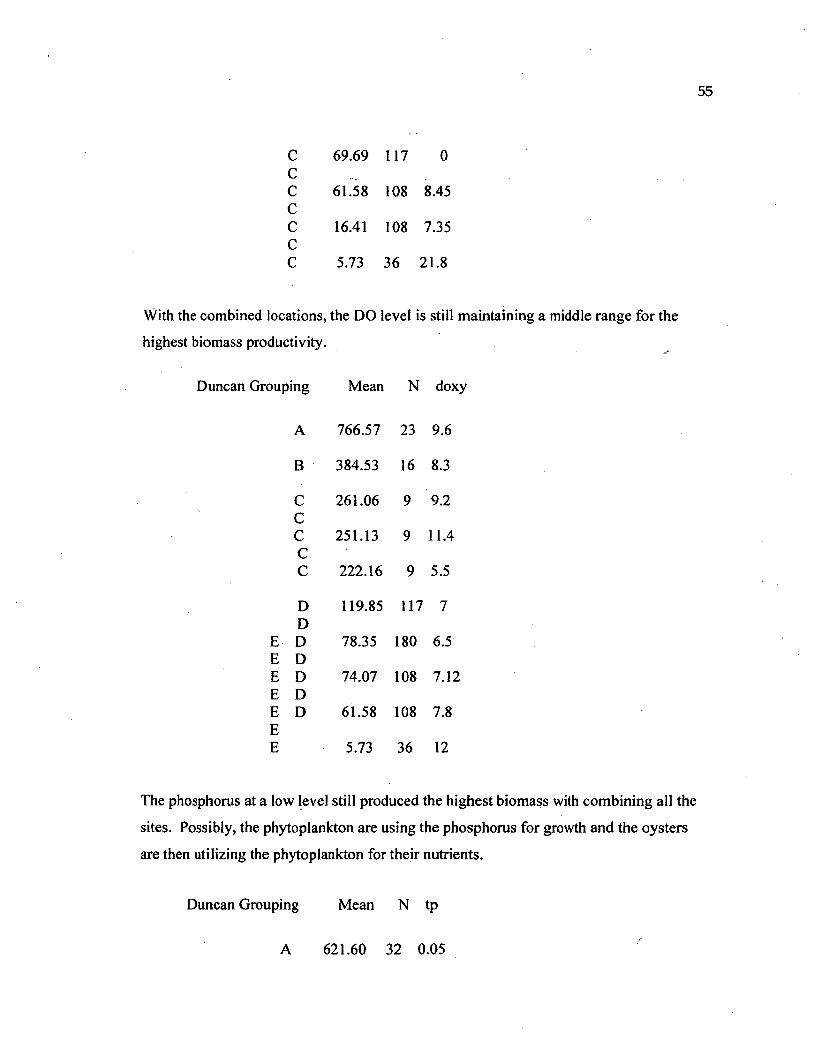
55
c 69.69 117 0cc 61.58 108 8.45cc 16.41 108 7.35cc 5.73 36 21.8
With the combined locations, the DO level is still maintaining a middle range for the
highest biomass productivity.
Duncan Grouping Mean N doxy
A 766.57 23 9.6
B 384.53 16 8.3
C 261.06 9 9.2CC 251.13 9 11.4cc 222.16 9 5.5
D 119.85 117 7D
E D 78.35 180 6.5E DE D 74.07 108 7.12E DE D 61.58 108 7.8EE 5.73 36 12
The phosphorus at a low level still produced the highest biomass with combining all the
sites. Possibly, the phytoplankton are using the phosphorus for growth and the oysters
are then utilizing the phytoplankton for their nutrients.
Duncan Grouping Mean N tp
A 621.60 32 0.05
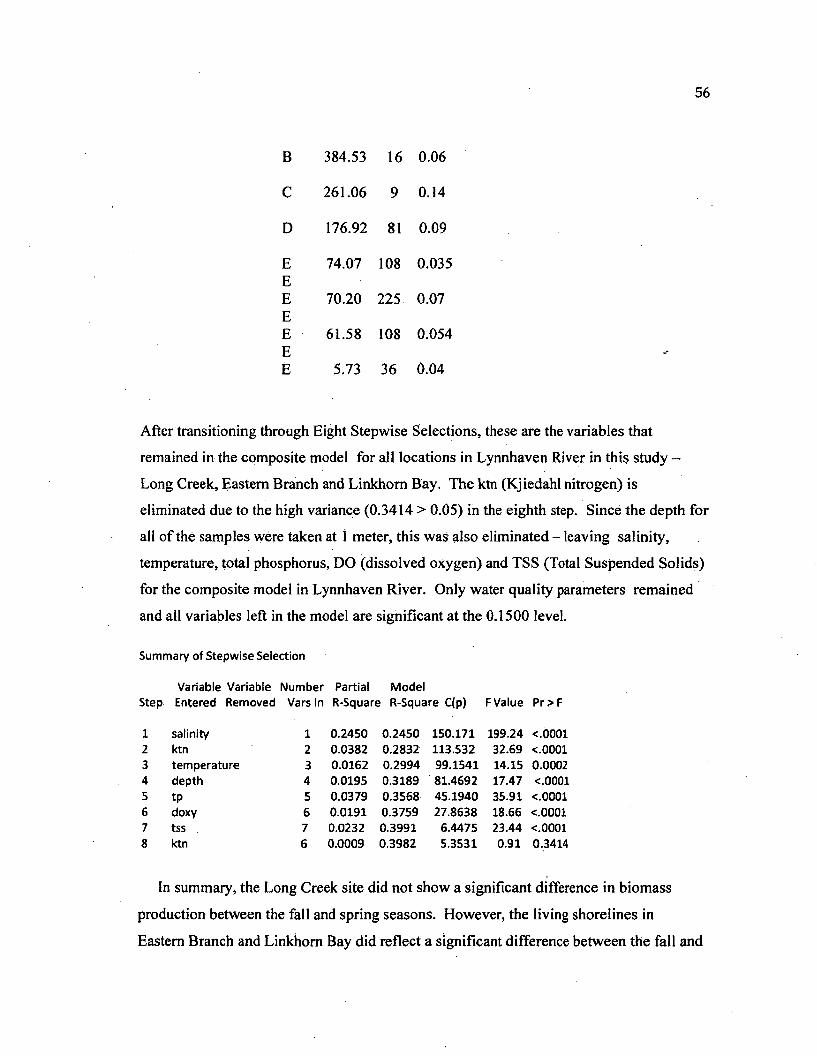
56
B 384.53 16 0.06
C 261.06 9 0.14
D 176.92 81 0.09
E 74.07 108 0.035EE 70.20 225 0.07EE 61.58 108 0.054EE 5.73 36 0.04
After transitioning through Eight Stepwise Selections, these are the variables that
remained in the composite model for all locations in Lynnhaven River in this study -
Long Creek, Eastern Branch and Linkhom Bay. The ktn (Kjiedahl nitrogen) is
eliminated due to the high variance (0.3414 > 0.05) in the eighth step. Since the depth for
all of the samples were taken at 1 meter, this was also eliminated - leaving salinity,
temperature, total phosphorus, DO (dissolved oxygen) and TSS (Total Suspended Solids)
for the composite model in Lynnhaven River. Only water quality parameters remained
and all variables left in the model are significant at the 0.1500 level.
Summary of Stepwise Selection
Variable Variable Number Partial ModelStep Entered Removed Vars In R-Square R-Square C(p) F Value Pr> F
1 salinity 1 0.2450 0.2450 150.171 199.24 <.00012 ktn 2 0.0382 0.2832 113.532 32.69 <.00013 temperature 3 0.0162 0.2994 99.1541 14.15 0.00024 depth 4 0.0195 0.3189 81.4692 17.47 <.00015 tp 5 0.0379 0.3568 45.1940 35.91 <.00016 doxy 6 0.0191 0.3759 27.8638 18.66 <.00017 tss , 7 0.0232 0.3991 6.4475 23.44 <.00018 ktn 6 0.0009 0.3982 5.3531 0.91 0.3414
In summary, the Long Creek site did not show a significant difference in biomass
production between the fall and spring seasons. However, the living shorelines in
Eastern Branch and Linkhom Bay did reflect a significant difference between the fall and
57
summer seasons. All of the locations reflected a significant difference in year over year
production and this is a positive sign of productive reefs.
At the Long Creek site, the Duncan analysis concluded that the marsh site had the
highest productivity level followed by riprap and oyster shell and there was a significant
difference between these locations. In comparing caged versus uncaged at this site, the
uncaged option actually produced significantly more. The seeded substrates at Linkhom
Bay and Eastern Branch also produced significantly higher biomass.
In evaluating substrates, the Duncan analysis reflected the highest biomass production
with the granite and the lowest with the limestone marl at Long Creek. Eastern Branch
and Linkhom Bay produced the highest biomass on cinder blocks with oyster shell
substrate running second. The area of the cinder block footprint was much smaller than
the oyster reef and this may have impacted the results. Also, the riprap and concrete
models produced at the lowest level and this may be due to the fact that no conditioning
of these substrates was done prior to deployment. Overall, the site at Linkhom Bay had
significantly higher biomass production than Eastern Branch.
Considering the water quality parameters at Long Creek, the highest biomass
production occurred at a low temperature (12.86 degrees Celsius), a medium range
salinity (18.89 psu), a medium range DO level(7 mg/L), a very high level TSS (30 mg/L),
low Kjiedahl nitrogen and low phosphorus levels (1.2 and 0,09 mg/L, respectively), a
high chlorophyll a count (15.51 mg/L) and one of the lowest E. coli counts (3.16
mg/MPN) in the study years. It would be expected to produce a higher biomass at a
lower temperature and salinity since the advent of disease would be less probable. Also,
a medium level for DO wouid also be a positive setting instead of lower levels below 2.8
mg/L at anoxic levels. In addition, a low E. coli count would only add to this positive
scenario. The high TSS and high chlorophyll a measurements reflect the possibility of an
algal bloom occurrence which would provide plenty of nutrients for the oysters.
Possibly, the high chlorophyll a count with low nutrient levels may also be reflecting the
fact that the phytoplankton are consuming the nutrients to grow. Overall, this appeared to
be a positive environment for biomass production to occur.
At Linkhom Bay and Eastern Branch, several of the datapoints were lost for nitrogen
levels and these were excluded from the study. Considering the remaining water quality
58
parameters, E. coli counts were at their lowest in the study when the highest biomass
level occurred. The DO level was at 9.6 mg/L, which again fell in the medium range.
Finally, total phosphorus was at its lowest level in the study years at .0.05 mg/L.
The composite run of all three sites revealed some of the same trends. The
temperature was in a low range ( 16 degrees Celsius), however, the salinity actually
registered a higher level and fell in the range of previous documentation (22.4 psu). For
the composite model with the highest overall biomass, the TSS values were very low (6
mg/L) and the E. coli count was higher (40.91 MPN/L). Both the DO levels and the total
phosphorus stayed in their ranges (9.6 mg/L and 0.05 mg/L, respectively).
All three of the statistical models that were calculated after the Regression analysis
along with the Stepwise Selection method reflected the fact that the water quality
parameters had the highest impact on the oyster biomass production. At Long Creek, the
parameters that had the strongest influence were temperature, Kjiedahl nitrogen, total
phosphorus, chlorophyll a and E. coli counts. For Linkhom Bay and Eastern Branch, the
DO levels and total phosphorus had the largest impact. After combining all of the sites’
data together to get an overall picture for the Lynnhaven River, the composite model
reflected influences of temperature, salinity, DO levels, TSS, total phosphorus and fecal
Enterococci counts. It is obvious that these impacts are site specific and that water
quality parameters are the driving force.
5.2 TMDL and Best Management Practices Impact
Based on the statistical analysis, the water quality variables in the final composite
model that will be impacted the most by the TMDLs and BMPs are total phosphorus, DO
(dissolved oxygen), TSS (Total Suspended Solids) and bacterial counts. Utilizing the
narrow ranges reflected in the model output for phosphorus, DO levels and other
treatments will be a first step in setting realistic TMDL goals. The next step is
developing the details for WIPs in order to restore the Lynnhaven watershed. The initial
WIP was issued in January 2012 and Appendix Q details the requirements for each area.
These plans consider ecological restoration such as riparian buffers and living shorelines
as well as promoting accountability for improved performance and sustaining previously
59
attained levels of improvement. These WIPs are being developed in order to progress
towards goals that will be finalized in a Federal TMDL in 2017. This TMDL will require
annual reductions in nitrogen, phosphorus and sediment in each of the Bay’s tidal
segments, tributaries and embayments listed as impaired under 303 (d) of the Clean
Water Act.
In summation, to meet the WIP annual goal of removal rates of 126,300 lbs of
nitrogen and 2220 lbs of phosphorus by 2017, there will need to be multiple avenues
pursued for the Lynnhaven. Listed below are the strongest candidates to be pursued in
this environmentalist’s estimation: --
• Allocate annual funding for septic tank eliminations as well as sewer and
stormwater enhancements.
• Set goals to increase No Discharge Zone pump-outs by at least 20 to 50% year
over year by educating the community on the negative impacts. Also, increase
the number of stations available.
• Continue to monitor bacteria levels and increase frequency in areas that are
known to have high counts historically. Implement the Executive Order to close
oyster bed harvesting without hesitation in that area if the counts are above the
standards.
• Educate the community on the advantages o f rain barrels, rain gardens, riparian
buffers and living shorelines. Include the public as volunteers in oyster gardening
and shell recovery.
• Allocate annual funding in the City of Virginia Beach for living shorelines and
floating wetlands as well as planting vegetation along streams and creeks and
continuing to increase open areas.
• Institute new program in City of Virginia Beach for bulkhead replacement with
riprap or living shoreline where applicable in order to rejoin marsh areas to
coastline.
• Pursue several facets of oyster restoration via re-building existing oyster beds,
placing oyster castles and reefballs or any other substrate with a high success
level.
60
• Implement plans to go forward with additional 110 acre expansion of oyster beds
in Lynnhaven.
• Obtain permits for outfall renovations and budget annual funds for decreasing
TSS via other innovative projects.
(Personal communication with Karen Forget - Lynnhaven River Now and Steve
McLaughlin - City of Virginia Beach - Stormwater Management)
61
CHAPTER 6
CONCLUSIONS AND RECOMMENDATIONS
6.1 Brief Overview
Today, the Lynnhaven River is still maintaining high levels of TSS, nitrogen and
phosphorus as well as high Escherichia coli counts in some areas. It is impacting the
water quality as well as the aquatic animal and plant survivability even with all of the
Best Management Practices and TMDLS that have been in place for years in the
Lynnhaven River watershed. There has been improvement in some areas, however,
continued vigilance will be required for the future in order to make an impact and save
our natural treasure - coastal estuaries.
Oyster restoration will need to play a part in this as well as innovative designs for
riparian buffers, living shorelines, floating wetlands, enlarged open spaces, renovated
outfalls and stormwater systems. Citizen participation will be required in utilizing boat
pumping stations, organic bio-degradable fertilizers, rain barrels and by placing riparian
buffers to aid in natural nutrient filtration after rainstorms. The community’s
participation will also be welcomed in shell conservation and oyster gardening.
6.2 Statistical Summation
Based on the statistical runs made in this study, the results reflected that the water
quality parameters were the driving force for a high level o f biomass production by the
oyster. It also indicated that the parameters fluctuated from location to location and were
site specific. It is apparent that time spent in evaluating future locations is imperative.
General guidelines for site evaluation have been addressed in this study and the Army
Corps of Engineers have done extensive work in Virginia and Maryland evaluating
hydrodynamics, salinity, DO levels and water depths in order to select their Tier 1
tributaries with the highest potential to develop self-sustaining oyster populations. The
Lynnhaven River was one of these identified target areas. In their Native Oyster
Restoration Plan of 2012, it is stated that oyster restoration is considered a Best'
62
Management Practice in lowering nitrogen, phosphorus and TSS levels in Chesapeake
Bay.
From the statistical analysis runs for the Long Creek site, it was determined that both
the fall and spring seasons reflected significant biomass production. In addition, the site
in the marsh area had the highest productivity level and the oyster reef the lowest. It was
also significant to find out that the uncaged option for the predator analysis showed the
highest biomass levels. After the model producing the highest biomass levels was
developed for this location, it was apparent that the temperature, Kjiedahl nitrogen, total
phosphorus, chlorophyll a and E. coli counts had the largest impact in this area.
The sites at Eastern Branch and Linkhom Bay revealed a different picture. The living
shorelines did reflect a significant difference in their biomass production between the fall
and summer seasons. These two locations, as well as Long Creek, showed significant
differences year over year and this is a positive sign of productive reefs. At the living
shoreline sites, seeded substrates were tested and they did reflect a significant increase in
biomass over the un-seeded substrates. This may be due to the fact that sterile triploid
oysters were used for the initial seeding and wild diploid for subsequent spat sets.
Triploid oysters tend to grow larger in a shorter time frame than the diploid. All of the
unseeded sites utilized diploid oysters.
Evaluating substrates, the Duncan analysis reflected the highest biomass with the
granite and the lowest with the limestone marl at Long Creek. Again, at different sites, a
different result occurred. The highest biomass levels at Eastern Branch and Linkhom
Bay were on the cinder blocks with the oyster shell substrate running second. The
footprint area of the cinder block was much smaller than the oyster reef area and may
have impacted these results. The riprap and concrete modules produced the lowest
amounts. A factor to consider with the riprap and concrete substrates is that no pre
conditioning was done and this may have hindered their success rate.
Overall, the Linkhom Bay site had a higher production level than Eastern Branch.
Again, this can be attributed to the water quality parameters. The model for Eastern
Branch and Linkhom Bay reflected that DO levels and total phosphorus levels had the
largest impact.
63
In order to produce a complete picture for the Lynnhaven River, all of the data from
the three sites were combined for a composite model. This composite view reflected
temperature, salinity, DO levels, TSS, total phosphorus and fecal Enterococci counts as
the largest impact areas. There is no doubt that the water quality parameters are the
driving force in the Lynnhaven River and need to be addressed through TMDLs and Best
Management Practices being implemented and tracked on success rates.
6.3 TMDL and BMPs Summation
The water quality parameters in the final composite model that will be impacted-the
most by TMDLs and BMPs are total phosphorus, DO (dissolved oxygen), TSS (Total
Suspended Solids) and bacterial counts. Some of the controls that have been put into
place in the City of Virginia Beach are the No Discharge Zone implemented in 2007 and
a new phosphorus fertilizer ban that is being implemented this year. Funds have also
been allocated on an annual basis to replace old septic tank systems, renovate sewer
systems and upgrade stormwater systems.
With the advent of a continual rise in bacterial counts in the Eastern Branch, an
Executive Order is going into effect on April 12th to close down oyster harvesting when
the bacterial counts are not meeting the criteria. If more than 1XA inches o f rain falls
within a 24 hour period in the previous week, the oyster beds will be closed to harvest for
the following 10 days and will re-open only after bacteria testing is completed and meets
the state criteria.
In order to impact TSS, another project is underway to upgrade outfall locations.
There is a total of 1050 outfalls in the Lynnhaven River System, 250 outfalls in the
Eastern Branch and 100 in Little Creek area for a grand total of 1400 in the Lynnhaven
River watershed for this area. These outfalls have a vast descent in several locations and
the water lands directly on a sediment base and scours out high amounts of sediments.
The plan is to place a concrete bottom at selected outfalls to eliminate the problem.
Funding has also been allocated for 110 additional acres o f sanctuary oyster reef to be
placed in Lynnhaven at an approximate cost of $125,000 per acre. It has been difficult to
find a large enough area in the Lynnhaven due to the number of permits that have already
been issued to commercial oystermen and landowners. The legalities may need to be
64
researched on some of these permits in order to continue expanding the oyster reefs in
this area. To evaluate the impact o f oyster restoration, the City of Virginia Beach is co
ordinating a study with the Army Corps of Engineers to determine how much TSS per
acre will be removed by an oyster reef. This is being done in order to include this as a
goal in the final WIP plans for this area.
Natural alternatives that are conducive to the Tidewater area are living shorelines,
floating wetlands and planting additional vegetation along creeks and streams.
This is a clean solution that will definitely aid in protecting tidal shorelines from erosion.
Where possible, oysters or riprap may also be included in the project. The living ~-
shorelines improve water quality by settling sediments and filtering toxins. They also
help to re-establish the natural shoreline around marsh areas that have been broken by
housing development and bulkheads being placed. The floating wetlands may be the
answer to the high waterfowl populations in this area and their high production of fecal
matter that impacts the water quality. In the TMDL 2004, the BST studies reflected a
29% contribution by the waterfowl to the Lynnhaven. This was higher than the human
fecal contribution of 25%. These wetlands aid in the removal of total nitrogen, ammonia,
phosphorus, BOD and TSS, all of the water parameters of concern.
Water quality is a major concern to all of us. Continued vigilance on establishing
goals for TMDLs and Best Management Practices and tracking results will ultimately
reflect positive impact in this arena. Public education on boating impacts and daily
routine items that affect water quality will also aid in making a difference and in saving
this valuable watershed for the future generations.
65
REFERENCES
Andrew, J.D., 1996. Epizootiology of the Disease Caused by the Oyster Pathogen,
Perkinsus marinus and Its Effect on the Oyster Industry, In: (eds.) W.S. Fisher, American
Fisheries Society Special Publication No. 18, Bethesda, Maryland.
Barnes, B.B., M.W. Luckenbach, and P.R. Kingsley-Smith, 2010. Oyster Reef
Community Interactions: The Effect of Resident Fauna on Oyster (Crassostrea spp.)
Larval Recruitment, Gloucester Point, Virginia.
Burke, R.P., 2010. Alternate substrates as a Native Oyster (Crassostrea virginica) Reef
Restoration Strategy in Chesapeake Bay, Virginia. Ph.D. Dissertation. Virginia Institute
of Marine Science, The College of William & Mary. 286 pp.
Burkett, J.R., L.M. Hight, P.K., J.J. Wilker, 2010. Oysters Produce an Organic-Inorganic
Adhesive for Intertidal Reef Construction, Journal of the American Chemical Society 132
(36): 12531-12533.
Burreson, E.M., N.A. Stokes and C.S. Friedman, 2000- Increased Virulence in an
Introduced Pathogen: Halosporidium nelsonii (MSX) in the Eastern Oyster Crassostrea
virginica, Journal of Aquatic Animal Health 12: 1-8.
Burrows, F., J.M. Harding, R. Mann, R. Dame and L. Coen, Science Based Restoration
Monitoring of Coastal Habitats: Volume 2 - Chapter 4, Restoration Monitoring of Oyster
Reefs, pp.72
Coen, L.D., and M.W. Luckenbach, 2000. Developing Success Criteria and Goals for
Evaluating Oyster Reef Restoration: Ecological function or Resource exploitation?
Ecological Engineering 15 (3-4): 323-343.
6 6
Cerco, C.F. and M.R. Noel, July 2005. Assessing a Ten-Fold Increase in the Chesapeake
Bay Native Oyster Population, A Report to the EPA Chesapeake Bay Program, US Army
Engineer Research and Development Center.
http://www.chesapeakebav.net/content/publications/cbp 13358.pdf
Cerco, C.F. and M.R. Noel, September 2005. Evaluating Ecosystem Effects of Oyster
Restoration in Chesapeake Bay, A Report to the Maryland Department of Natural
Resources, US Army Engineer Research and Development Center.
<(http://www.dnr.state.md.us/fisheries/ovsters/mtgs/l 11807/Cerco Noel final.pdf>
Cerco, C.F. and M.R. Noel, June 2006. Ecosystem Effects of Oyster Restoration in
Virginia Habitat and Lease Areas, Final Report to the Maryland Department of Natural
Resources, US Army Engineer Research and Development Center.
http://www.chesapeakebav.net/content/publications/cbp 13366.pdf
Chipman, Jr., W.A., 1948. Conditions Affecting Shellfish Production in Lynnhaven Bay,
Virginia, and the Possibilities of Improving Them by Increasing Tidal Flow, Special
Scientific Report No. 61, United States Dept, of the Interior, Washington, D.C.
Duncan, D.B., 1955. Multiple range and multiple F tests. Biometrics 11: 1-42.
Dunnett, C.W., 1955. A Multiple Comparison Procedure for Comparing Several
Treatments with a Control. Journal of American Statistical Association 50: 1096-1121.
Efroymson, M.A., 1960. Multiple Regression Analysis. In: (eds.) A. Ralston and H.S.
Wilf, Mathematical Methods for Digital Computers, Wiley.
Forrest, B.M., N.B. Keeley, G.A. Hopkins, S.C. Webb, D.M. Clement, (2009), Bivalve
Aquaculture in Estuaries: Review and Synthesis of Oyster Cultivation Effects,
Aquaculture, 298 ( 1/2): 1-15.
67
Grabowski, J.H., A.R. Hughes, D.L. Kimbro, and M.A. Dolan, 2005. How Habitat
Setting Influences Restored Oyster Reef Communities. Ecology 86 (7): 1926-1935.
Harding, J.M., R. Mann and M.J. Southworth, 2008. Shell Length At-Age Relationships
in James River, Virginia, Oysters (Crassostrea virginica) Collected Four Centuries
Apart. Journal of Shellfish Research 27 (5): 1109-1115.
Hargis, W.J. and D.S. Haven, 1999. Oyster Reef Habitat Restoration, Chapter 23 -
Chesapeake Oyster Reefs, Their Importance, Destruction and Guidelines for Restoring
Them, In: (eds.) M.W. Luckenbach, R. Mann and J.A. Wesson, Virginia Institute of
Marine Science Press, Gloucester Point, Virginia.
Harris, L.E., 2009. Artificial Reefs for Ecosystem Restoration and Coastal Erosion
Protection with Aquaculture and Recreational Amenities. Reef Journal 1(1): 235-246
Henderson, J. and J. O’Neil, 2003. Economic Values Associated with Construction of
Oyster Reefs by the Corps of Engineers, ERDS TN-EMRRP-ER-01: 1-10.
Kennedy, V S., R.I.E. Newell, A.F. Eble, 1996. The Eastern Oyster, Crassostrea
virginica, University of Maryland Sea Grant Press, College Park, Maryland, 734 pp.
Keuls, M., 1952. The Use of the ‘Studentized Range’ in connection With an Analysis of
Variance. Euphytic 1 (1952): 112-122.
Lenihan, S., and C.G. Peterson, 1998. How Habitat Degradation through Fishery
Disturbance Enhances Impacts of Hypoxia on Oyster Reefs. Ecological Applications 8:
128-140.
Lippson, A.J., 2000. Chesapeake Bay Program Oyster Restoration - Workshop
Proceedings and Agreement Statement (EPA 903-R-00-005: CBP/TRS 238-00).
68
Lorio, W.J., and S. Malone, 1994. The Cultivation of the American Oyster (Crassostrea
virginica). Southern Regional Aquaculture Center, SRAC Publication No. 432.
Luckenbach, M.W., L. D. Coen, P.G. Ross, Jr., and J.A. Stephen, 2005. Oyster Reef
Habitat Restoration: Relationships between Oyster Abundance and Community
Development Based on Two Studies in Virginia and South Carolina. Journal of Coastal
Research SI (40): 64-78.
Lynnhaven Bay, Broad Bay and Linkhom Bay Watersheds Total Maximum Daily Load
(TMDL) Report for Shellfish Areas Listed due to Bacteria Contamination, March 2004.
Virginia Department of Environmental Quality, pp. 109.
Lynnhaven River Now 2012 State o f the River Report - Winter 2013.
Mann, R., M. Southworth, J.M. Harding and J.A. Wesson, 2009. Population Studies of
the Native Eastern Oyster, (Crassostrea virginica), (Gmelin, 1791) in the James River,
Virginia, USA. Journal of Shellfish Research 28(2): 193-220.
»r '
Miller, C., 2009. Oyster Reef Stimulus Project Begins, North Carolina Sea Grant. Web.
23 Nov. 2010. < http://www.ncseagrant.org/home/about-ncsg/news-
e vents?id=639&tas k=sho wartic le>
Nestlerode, J.A., M.W. Luckenbach, and F.X. O’Beim, 2007. Settlement and Survival of
the Oyster Crassostrea virginica on Created Oyster Reef Habitats in Chesapeake Bay.
Restoration Ecology 15 (2): 273-283.
Newell, R.I.E., 1988. Ecological Changes in Chesapeake Bay: Are They the Result of
Overharvesting the Eastern Oyster (Crassostrea virginica)? In: Lynch, M.P., Krome
E.C. (eds) Understanding the Estuary. Advances in Chesapeake Bay research,
Chesapeake Research Consortium PubIicationl29, Gloucester Point, VA, p. 536-546.
<http://www.vims.edu/GrevLit/crcl29.Ddf
69
Newell, R.I.E., 1996. Mechanisms and Physiology of Larval and Adult Feeding. In:
Kennedy, V.S., Newell R.I.E., Eble, A. (eds) The Eastern Oyster, Crassostrea virginica.
Maryland Sea Grant Publication, College Park, Maryland, USA, p. 185-230.
Notice and Description of Shellfish Condemnation Area 25, Lynnhaven River, Broad
Creek and Linkhom Bay - Virginia Department of Health - Division of Shellfish
Sanitation (Effective 10 April 1998).
Orth, R.J., T.J.B. Carruthers, W.C. Dennison, C.M. Duarte, J.W. Fourqurean, K.L. Heck,
Jr., A.R. Huges, G.A. Kendrick, W.J. Kenworthy, S. Olyamik, F.T. Short, M. Waycott
and S.L. Williams, 2006. A Global Crisis for Seagrass Ecosystems, Bioscience 56 (12):
987-996.
Priest, W.I., J. Nestlerode, C.W, Frye, 1999. Use of Dredged Material for Oyster Habitat
Creation in Coastal Virginia^ In: (eds.) M.W. Luckenbach, R. Mann and J.A. Wesson,
Oyster Reef Habitat Restoration: A Synopsis and Synthesis o f Approaches, p. 283-293,
Virginia Institute of Marine Science Press, Gloucester Point, Virginia.
Schulte, D.M., R.P. Burke, R.N. Lipcius, 2009. Unprecedented Restoration of a Native
Oyster Metapopulation, Science 325: 1124-1128.
Pacanowsky, L., 2009. Save the Bay: Grow Oysters. National Wetlands Newsletter (31):
14-15.
Reef Ball Foundation Inc., 2011. http://www.reefbali.org
Scheffe, H., 1959. The Analysis of Variance. Wiley, New York (reprinted 1999).
70
Stroupe, E. and R. Lynn, 1963. Atlas of Salinity and Temperature Distribution in the
Chesapeake Bay 1952-1961 and Seasonal Averages 1949-1961. Graphical Summary
Report 2, Report 63-1, The Chesapeake Bay Institute, The Johns Hopkins University.
United States Army Corps of Engineers Native Oyster Restoration Master Plan, March
2012 - Maryland and Virginia, p. 1-272.
Walters, K. and L.D. Coen, 2006. A Comparison of Statistical Approaches to Analyzing
Community Convergence between Natural and Constructed Oyster Reefs, Jounral of
Experimental Marine biology and Ecology 330(1): 81-95.
APPENDICES
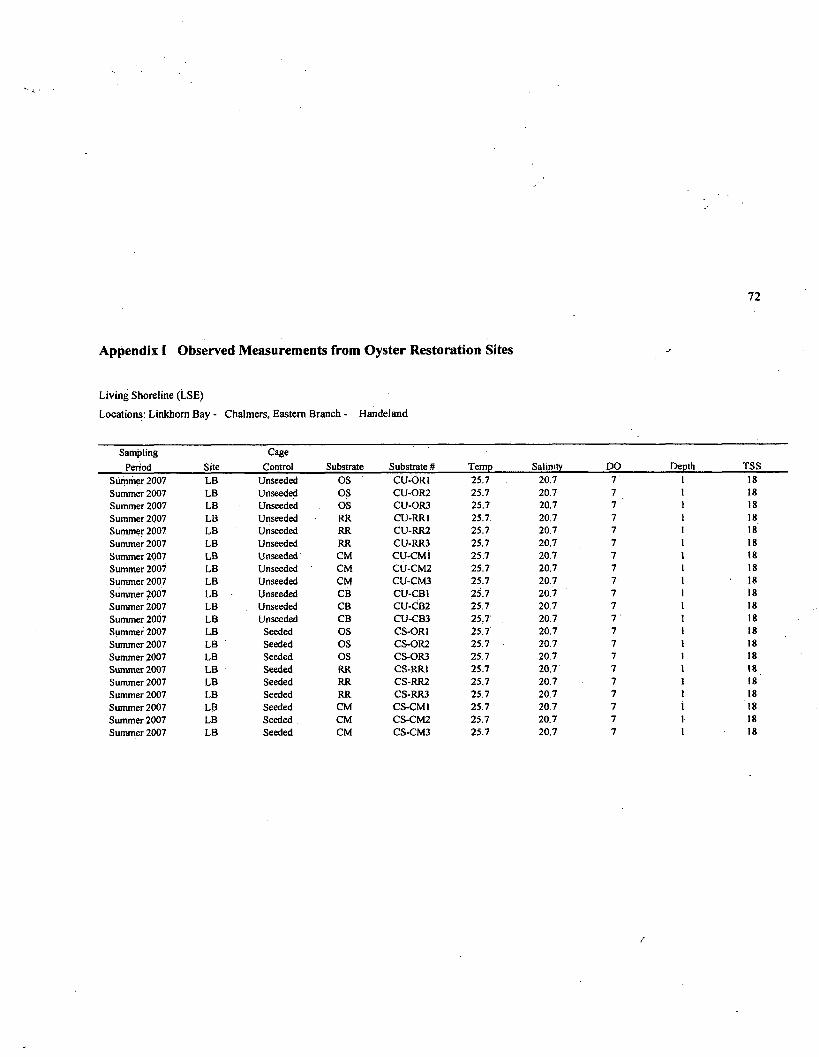
72
Appendix I Observed Measurements from Oyster Restoration Sites
Living Shoreline (LSE)
Locations: Linkhom Bay - Chalmers, Eastern Branch - Handeland
SamplingPeriod Site
CageControl Substrate Substrate # Temp Salinity DO Depth TSS
Summer 2007 LB Unseeded OS CU-OR1 25.7 20.7 7 1 18Summer 2007 LB Unseeded OS CU-OR2 25.7 20.7 7 1 18Summer 2007 LB Unseeded OS CU-OR3 25.7 20.7 7 1 18Summer 2007 LB Unseeded RR CU-RR1 25.7 20.7 7 1 18Summer 2007 LB Unseeded RR CU-RR2 25.7 20.7 7 1 18Summer 2007 LB Unseeded RR CU-RR3 25.7 20.7 7 1 18Summer 2007 LB Unseeded CM CU-CMi 25.7 20.7 7 1 18Summer 2007 LB Unseeded CM CU-CM2 25.7 20.7 7 1 18Summer 2007 LB Unseeded CM CU-CM3 25.7 20.7 7 1 18Summer 2007 LB Unseeded CB CU-CB1 25.7 20.7 7 1 18Summer 2007 LB Unseeded CB CU-CB2 25.7 20.7 7 I 18Summer 2007 LB Unseeded CB CU-CB3 25.7 20.7 1 18Summer 2007 LB Seeded OS CS-OR1 25.7 20.7 7 1 18Summer 2007 LB Seeded OS CS-OR2 25.7 20.7 7 1 18Summer 2007 LB Seeded OS CS-OR3 25.7 20.7 7 1 18Summer 2007 LB Seeded RR CS-RR1 25.7 20.7 7 1 18Summer 2007 LB Seeded RR CS-RR2 25.7 20.7 7 1 18Summer 2007 LB Seeded RR CS-RR3 25.7 20.7 7 1 18Summer 2007 LB Seeded CM CS-CM1 25.7 20.7 7 1 18Summer 2007 LB Seeded CM CS-CM2 25.7 20.7 7 1 18Summer 2007 LB Seeded CM CS-CM3 25.7 20.7 7 1 18
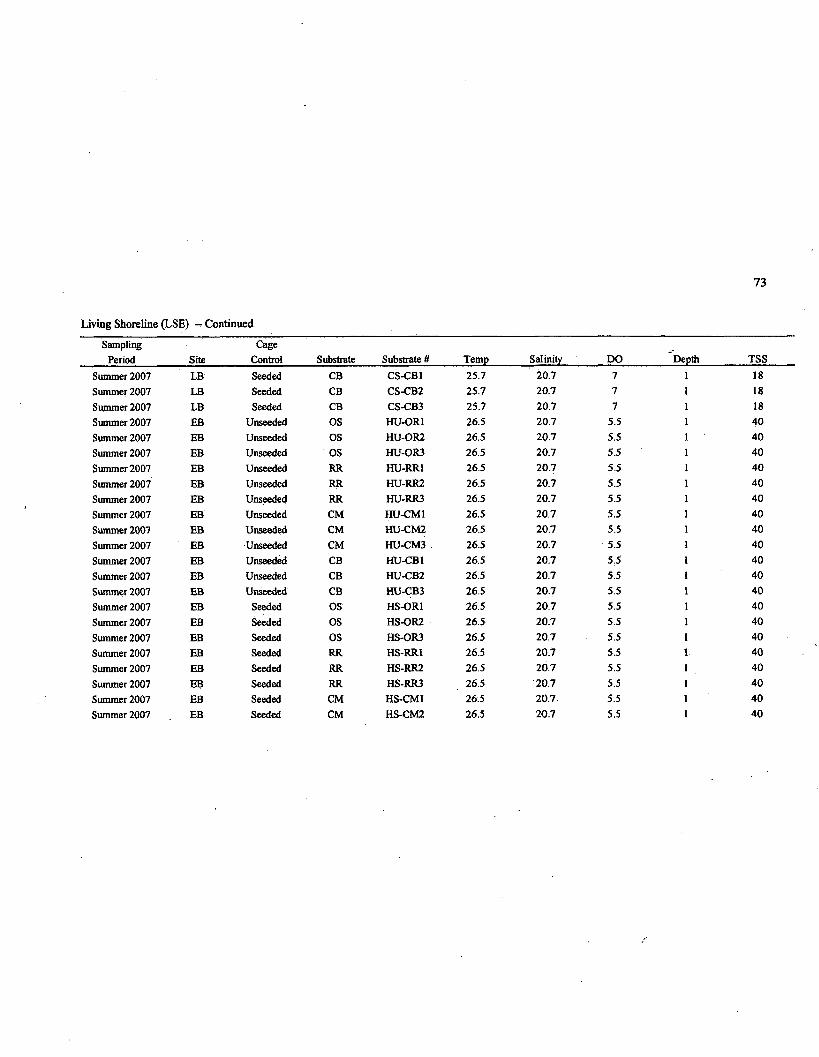
73
Living Shoreline (LSE) - Continued
SamplingPeriod Site
CageControl Substrate Substrate # Temp Salinity DO Depth TSS
Summer 2007 LB Seeded CB CS-CB1 25.7 20.7 7 1 18
Summer 2007 LB Seeded CB CS-CB2 25.7 20,7 7 1 18Summer 2007 LB Seeded CB CS-CB3 25.7 20.7 7 1 18Summer 2007 EB Unseeded OS HU-OR1 26.5 20.7 5.5 1 40Summer 2007 EB Unseeded OS HU-OR2 26.5 20.7 5.5 40Summer 2007 EB Unseeded OS HU-OR3 26.5 20.7 5.5 1 40Summer 2007 EB Unseeded RR HU-RR1 26.5 20.7 5.5 1 40Summer 2007 EB Unseeded RR HU-RR2 26.5 20.7 5.5 1 40Summer 2007 EB Unseeded RR HU-RR3 26.5 20.7 5.5 1 40Summer 2007 EB Unseeded CM HU-CM1 26.5 20.7 5.5 1 40Summer 2007 EB Unseeded CM HU-CM2 26.5 20.7 5.5 1 40Summer 2007 EB Unseeded CM HU-CM3 . 26.5 20.7 5.5 1 40Summer 2007 EB Unseeded CB HU-CB1 26.5 20.7 5.5 1 40Summer 2007 EB Unseeded CB HU-CB2 2 6 5 20.7 5.5 1 40Summer 2007 EB Unseeded CB HU-CB3 26.5 20.7 5.5 1 40Summer 2007 EB Seeded OS HS-OR1 26.5 20.7 5.5 1 40Summer 2007 EB Seeded OS HS-OR2 26.5 20.7 5.5 1 40Summer 2007 EB Seeded OS HS-OR3 26.5 20.7 5.5 1 40Summer 2007 EB Seeded RR HS-RR1 26.5 20.7 5.5 1 40
Summer 2007 EB Seeded RR HS-RR2 26.5 20.7 5.5 1 40Summer 2007 EB Seeded RR HS-RR3 26.5 20.7 5.5 1 40Summer 2007 EB Seeded CM HS-CM1 26:5 20.7 5.5 1 40Summer 2007 EB Seeded CM HS-CM2 26.5 20.7 5.5 1 40
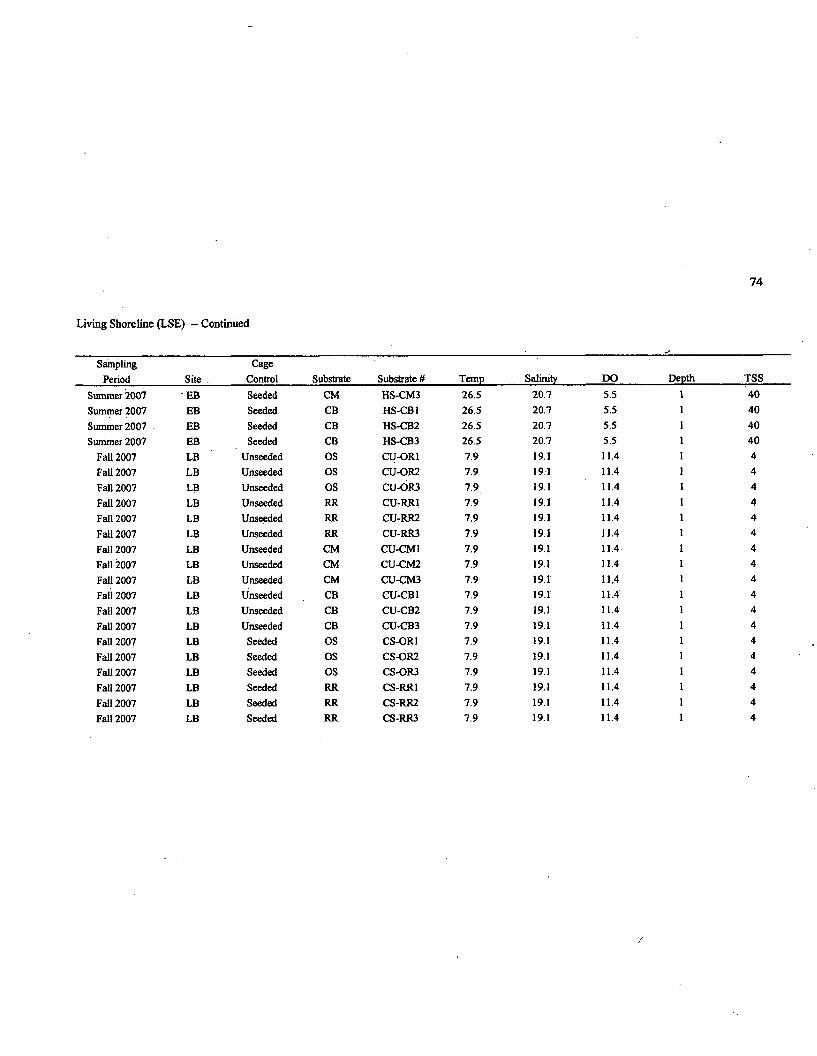
74
Living Shoreline (LSE) — Continued
SamplingPeriod Site .
CageControl Substrate Substrate# Temp Salinity DO Depth TSS
Summer 2007 EB Seeded CM HS-CM3 26.5 20.7 5.5 1 40
Summer 2007 EB Seeded CB HS-CB1 26.5 20.7 5.5 1 40Summer 2007 . EB Seeded CB HS-CB2 26.5 20.7 5.5 1 40Summer 2007 EB Seeded CB HS-CB3 26.5 20.7 5.5 1 40
Fall 2007 LB Unseeded OS CU-OR1 7.9 19.1 11.4 1 4
Fall 2007 LB Unseeded OS CU-OR2 7.9 19.1 11.4 1 4
Fall 2007 LB Unseeded OS CU-OR3 7.9 191 11.4 1 4
Fall 2007 LB Unseeded RR CU-RR1 7.9 19.1 11.4 1 4
Fall 2007 LB Unseeded RR CU-RR2 7.9 19.1 11.4 1 4
Fall 2007 LB Unseeded RR CU-RR3 7.9 19.1 11.4 1 4
Fall 2007 LB Unseeded CM CU-CM1 7.9 19.1 11.4 1 4
Fall 2007 LB Unseeded CM CU-CM2 7.9 19.1 11.4 1 4
Fall 2007 LB Unseeded CM CU-CM3 7.9 19.1 11.4 1 4
Fall 2007 LB Unseeded CB CU-CB1 7.9 19.1 11.4 1 4
Fall 2007 LB Unseeded CB CU-CB2 7.9 19.1 11.4 1 4
Fall 2007 LB Unseeded CB CU-CB3 7.9 19.1 11.4 1 4
Fall 2007 LB Seeded OS CS-OR1 7.9 19.1 11.4 1 4
Fall 2007 LB Seeded OS CS-OR2 7.9 19.1 11.4 1 4
Fall 2007 LB Seeded OS CS-OR3 7.9 19.1 11.4 1 4
Fall 2007 LB Seeded RR CS-RR1 7.9 19.1 11.4 1 4
Fall 2007 LB Seeded RR CS-RR2 7.9 19.1 11.4 1 4
Fall 2007 LB Seeded RR CS-RR3 7.9 19.1 11.4 1 4
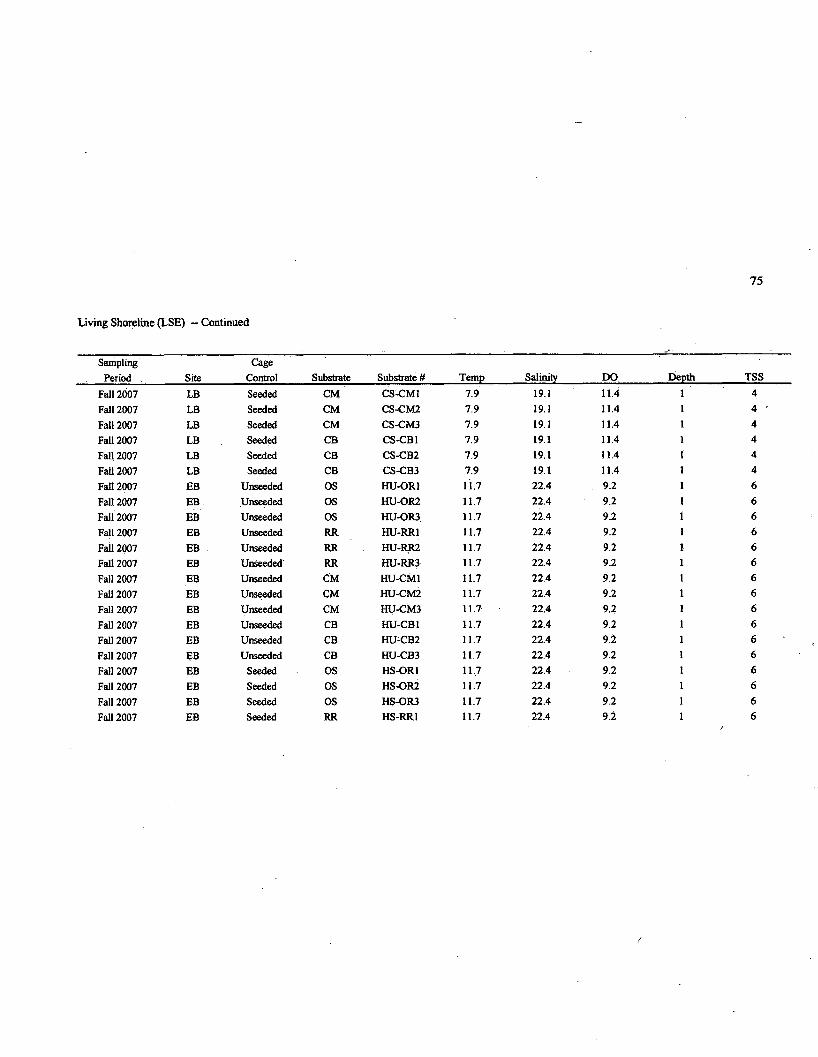
75
Living Shoreline (LSE) — Continued
SamplingPeriod Site
CageControl Substrate Substrate # Temp Salinity DO Depth TSS
Fall 2007 LB Seeded CM CS-CM1 7 9 19.1 11.4 1 4
Fall 2007 LB Seeded CM CS-CM2 7.9 19.1 11.4 1 4 '
Fall 2007 LB Seeded CM CS-CM3 7.9 19.1 11.4 1 4
Fall 2007 LB Seeded CB CS-CB1 7.9 19.1 11.4 1 4
Fall 2007 LB Seeded CB CS-CB2 7.9 19.1 11.4 1 4
Fall 2007 LB Seeded CB CS-CB3 7.9 19.1 11.4 1 4
Fall 2007 EB Unseeded OS HU-OR1 11.7 22.4 9.2 1 6Fall 2007 EB Unseeded OS HU-OR2 11.7 22.4 9.2 1 6Fall 2007 EB Unseeded OS HU-OR3 11.7 22.4 9.2 1 6Fall 2007 EB Unseeded RR HU-RR1 11.7 22.4 9.2 1 6
Fail 2007 EB Unseeded RR HU-RR2 11.7 22.4 9.2 1 6
Fall 2007 EB Unseeded RR HU-RR3 11.7 22.4 9.2 1 6
Fall 2007 EB Unseeded CM HU-CM1 11.7 22.4 9.2 1 6
Fall 2007 EB Unseeded CM HU-CM2 11.7 22.4 9.2 1 6
Fall 2007 EB Unseeded CM HU-CM3 11.7 22.4 9.2 1 6
Fall 2007 EB Unseeded CB HU-CB1 11.7 22.4 9.2 1 6
Fall 2007 EB Unseeded CB HU-CB2 11.7 22.4 9.2 1 6
Fall 2007 EB Unseeded CB HU-CB3 11.7 22.4 9.2 1 6
Fall 2007 EB Seeded OS HS-OR1 11,7 22.4 9.2 1 6
Fall 2007 EB Seeded OS HS-OR2 11.7 22.4 9.2 1 6
Fall 2007 EB Seeded OS HS-OR3 11.7 22.4 9.2 1 6
Fall 2007 EB Seeded RR HS-RR1 11.7 22.4 9.2 1 6
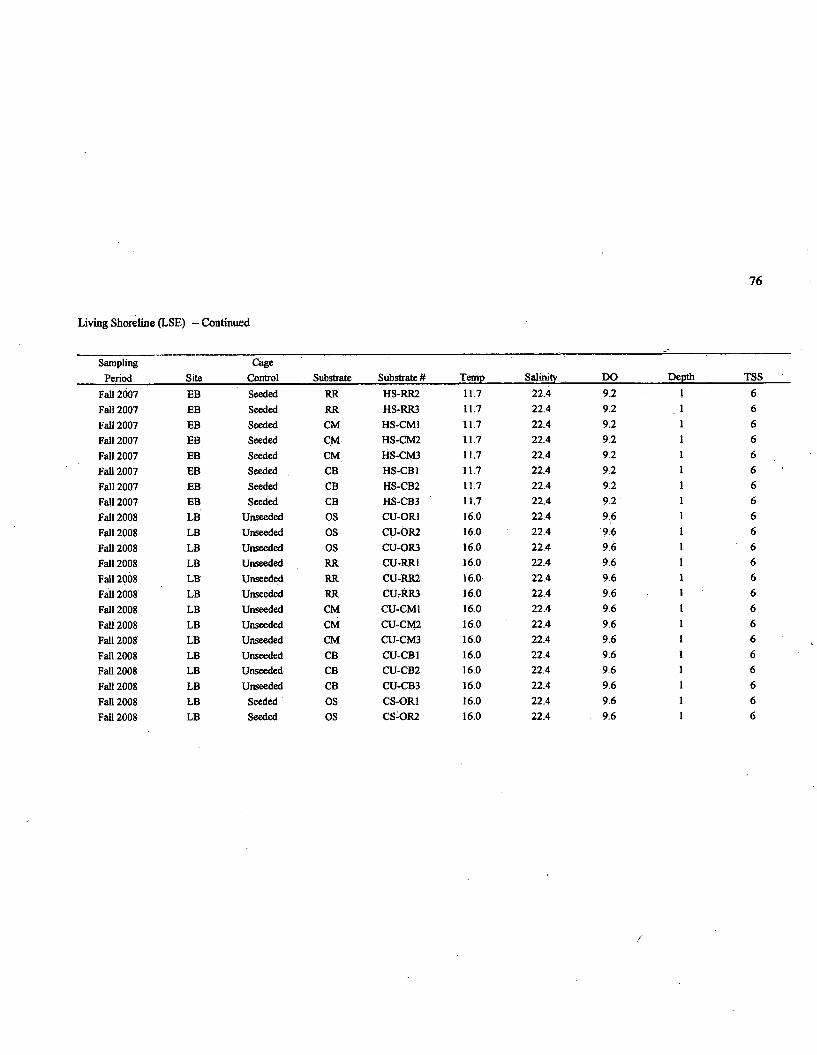
76
Living Shoreline (LSE) - Continued
SamplingPeriod Site
CageControl Substrate Substrate # Temp Salinity DO Depth TSS
Fall 2007 EB Seeded RR HS-RR2 11.7 22.4 9.2 6Fall 2007 EB Seeded RR HS-RR3 11.7 22.4 9.2 1 6
Fall 2007 EB Seeded CM HS-CM1 11.7 22.4 9.2 1 6
Fall 2007 EB Seeded CM HS-CM2 11.7 22.4 9.2 1 6
Fall 2007 EB Seeded CM HS-CM3 11.7 22.4 9.2 1 6
Fall 2007 EB Seeded CB HS-CB1 11.7 22.4 9.2 1 6
Fall 2007 EB Seeded CB HS-CB2 11.7 22.4 9.2 1 6
Fall 2007 EB Seeded CB HS-CB3 11.7 22.4 9.2 1 6
Fall 2008 LB Unseeded OS CU-ORl 16.0 22.4 9.6 1 6
Fall 2008 LB Unseeded OS CU-OR2 16.0 22.4 9.6 1 6
Fall 2008 LB Unseeded OS CU-OR3 16.0 22.4 9.6 1 6
Fall 2008 LB Unseeded RR CU-RR1 16.0 22.4 9.6 1 6
Fall 2008 LB Unseeded RR CU-RR2 16.0 22.4 9.6 1 6
Fall 2008 LB Unseeded RR CTHRR3 16.0 22.4 9.6 6
Fall 2008 LB Unseeded CM CU-CM1 16.0 22.4 9.6 1 6
Fall 2008 LB Unseeded CM CU-CM2 16.0 22.4 9.6 1 6
Fall 2008 LB Unseeded CM CU-CM3 16.0 22.4 9.6 1 6
Fall 2008 LB Unseeded CB CU-CB1 16.0 22.4 9.6 1 6
Fall 2008 LB Unseeded CB CU-CB2 16.0 22.4 9.6 1 6
Fall 2008 LB Unseeded CB CU-CB3 16.0 22.4 9.6 1 6
Fall 2008 LB Seeded OS CS-OR1 16.0 22.4 9.6 1 6
Fall 2008 LB Seeded OS CS-OR2 16.0 22.4 9.6 1 6
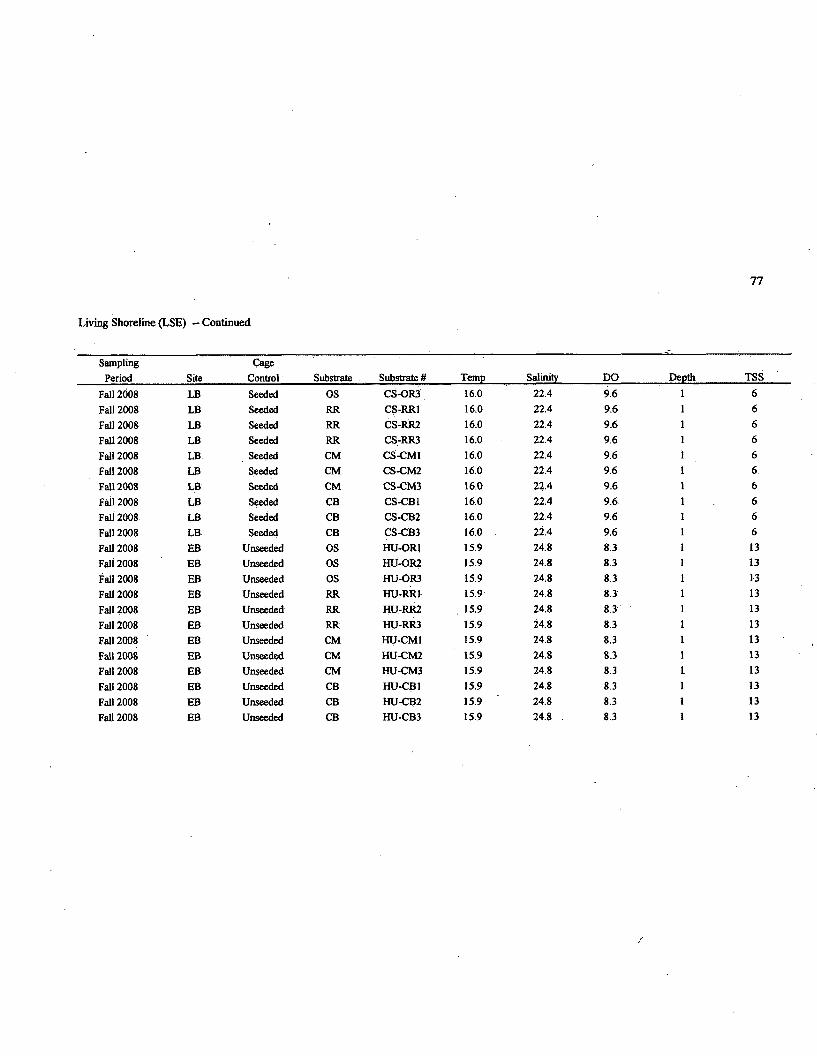
77
Living Shoreline (LSE) - Continued
SamplingPeriod Site
CageControl Substrate Substrate # Temp Salinity DO Depth TSS
Fall 2008 LB Seeded OS CS-OR3 16.0 22.4 9.6 1 6
Fall 2008 LB Seeded RR CS-RR1 16.0 22.4 9.6 1 6
Fall 2008 LB Seeded RR CS-RR2 16.0 22.4 9.6 1 6
Fall 2008 LB Seeded RR CS-RR3 16.0 22.4 9.6 1 6
Fall 2008 LB Seeded CM CS-CM1 16.0 22.4 9.6 1 6
Fall 2008 LB Seeded CM CS-CM2 16.0 22.4 9.6 1 6
Fall 2008 LB Seeded CM CS-CM3 16.0 22.4 9.6 1 6
Fall 2008 LB Seeded CB CS-CB1 16.0 22.4 9.6 6
Fall 2008 LB Seeded CB CS-CB2 16.0 22.4 9.6 1 6
Fall 2008 LB Seeded CB CS-CB3 16.0 22.4 9.6 1 6
Fall 2008 EB Unseeded OS HU-OR1 15.9 24.8 8.3 1 13
Fall 2008 EB Unseeded OS HU-OR2 15.9 24.8 8.3 1 13
Fall 2008 EB Unseeded OS HU-OR3 15.9 24.8 8.3 1 13
Fall 2008 EB Unseeded RR HU-RR1 15.9 24.8 8.3 1 13
Fall 2008 EB Unseeded RR HU-RR2 . 15.9 24.8 8.3 1 13
Fall 2008 EB Unseeded RR HU-RR3 15.9 24.8 8.3 1 13
Fall 2008 EB Unseeded CM HU-CM1 15.9 24.8 8.3 1 13
Fall 2008 EB Unseeded CM HU-CM2 15.9 24.8 8.3 1 13
Fall 2008 EB Unseeded CM HU-CM3 15.9 24.8 8.3 1 13
Fall 2008 EB Unseeded CB HU-CB1 15.9 24.8 8.3 1 13
Fall 2008 EB Unseeded CB HU-CB2 15.9 24.8 8.3 1 13
Fall 2008 EB Unseeded CB HU-CB3 15.9 24.8 . 8.3 1 13
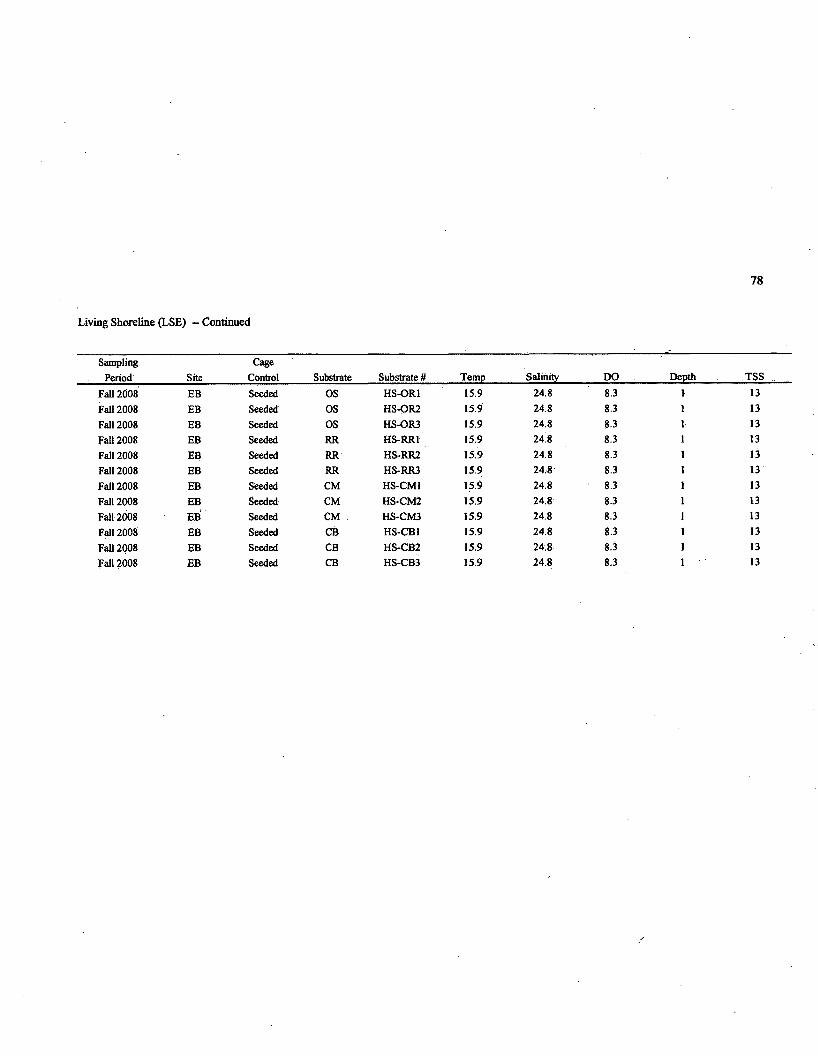
78
Living Shoreline (LSE) - Continued
SamplingPeriod Site
CageControl Substrate Substrate it Temp Salinity DO Depth TSS
Fall 2008 EB Seeded OS HS-OR1 15.9 24.8 8.3 1 13
Fall 2008 EB Seeded OS HS-OR2 15.9 24.8 8.3 1 13Fall 2008 EB Seeded OS HS-OR3 15.9 24.8 8.3 1 13Fall 2008 EB Seeded RR HS-RR1 15.9 248 8.3 1 13
Fall 2008 EB Seeded RR HS-RR2 15.9 24.8 8.3 1 13Fall 2008 EB Seeded RR HS-RR3 15.9 24.8 8.3 1 13
Fall 2008 EB Seeded CM HS-CM1 15.9 24.8 8.3 1 13
Fall 2008 EB Seeded CM HS-CM2 15.9 24.8 S.-3 1 13
Fall 2008 EB Seeded CM HS-CM3 15.9 24.8 8.3 1 13
Fall 2008 EB Seeded CB HS-CB1 15.9 24.8 8.3 1 13
Fall 2008 EB Seeded CB HS-CB2 15.9 24.8 8.3 1 13
Fall 2008 EB Seeded CB HS-CB3 15.9 24.8 8.3 13
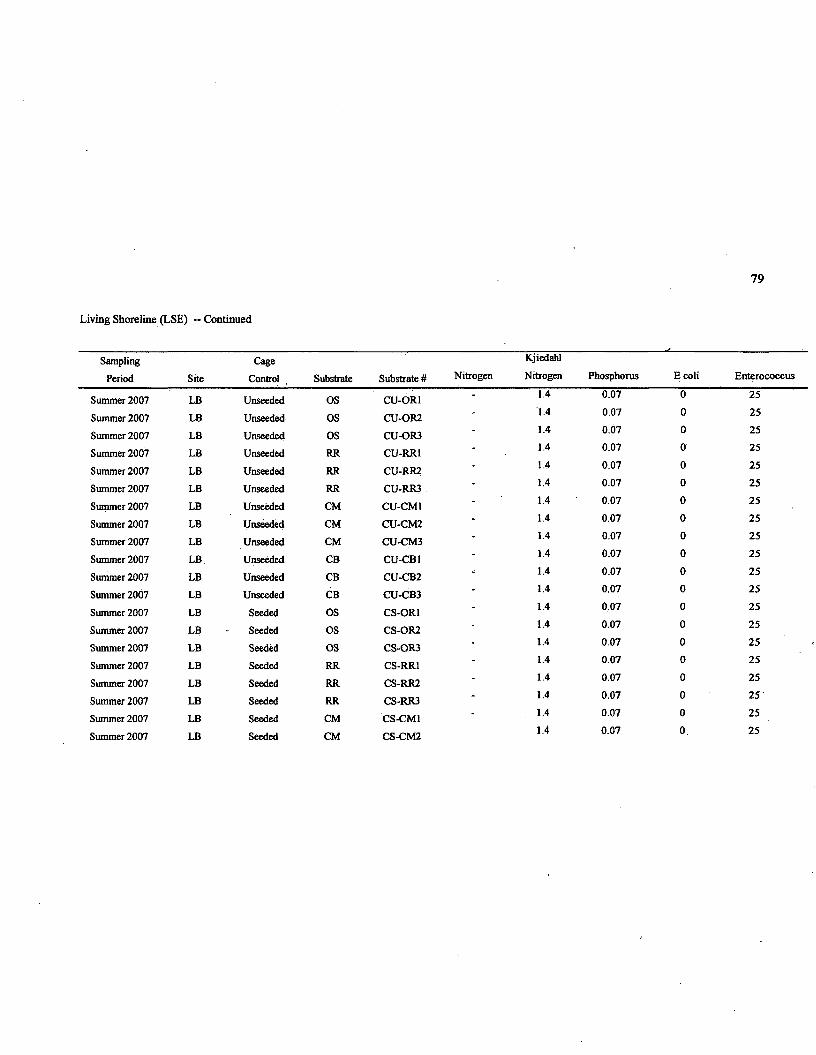
79
Living Shoreline (LSE) — Continued
Sampling
Period Site
Cage
Control Substrate Substrate U Nitrogen
Kjiedahl
Nitrogen Phosphorus E coli Enterococcus
Summer 2007 LB Unseeded OS CU-OR1 - 1.4 0.07 0 25
Summer 2007 LB Unseeded OS CU-OR2 1.4 0.07 0 25
Summer 2007 LB Unseeded OS CU-OR3 - 14 0.07 0 25
Summer 2007 LB Unseeded RR CU-RR1 - 1.4 0.07 0 25
Summer 2007 LB Unseeded RR CU-RR2 - 1.4 0.07 0 25
Summer 2007 LB Unseeded RR CU-RR3 * 1.4 0.07 0 25
Summer 2007 LB Unseeded CM CU-CM1 * 1.4 0.07 0 25
Summer 2007 LB Unseeded CM CU-CM2 ■ 1.4 0.07 0 25
Summer 2007 LB Unseeded CM CU-CM3 * 1.4 0.07 0 25
Summer 2007 LB Unseeded CB CU-CB1 - 1.4 0.07 0 25
Summer 2007 LB Unseeded CB CU-CB2 - 1.4 0.07 0 25
Summer 2007 LB Unseeded CB CU-CB3 - 1.4 0.07 0 25
Summer 2007 LB Seeded OS CS-OR1 - 1.4 0.07 0 25
Summer 2007 LB Seeded OS CS-OR2 ■ 1.4 0.07 0 25
Summer 2007 LB Seeded OS CS-OR3 ■ 1.4 0.07 0 25
Summer 2007 LB Seeded RR CS-RR1 - 1.4 0.07 0 25
Summer 2007 LB Seeded RR CS-RR2 - 1.4 0.07 0 25
Summer 2007 LB Seeded RR CS-RR3 - 1.4 0.07 0 25
Summer 2007 LB Seeded CM CS-CM1 ■ 1.4 0.07 0 25
Summer 2007 LB Seeded CM CS-CM2 1.4 0.07 0 . 25
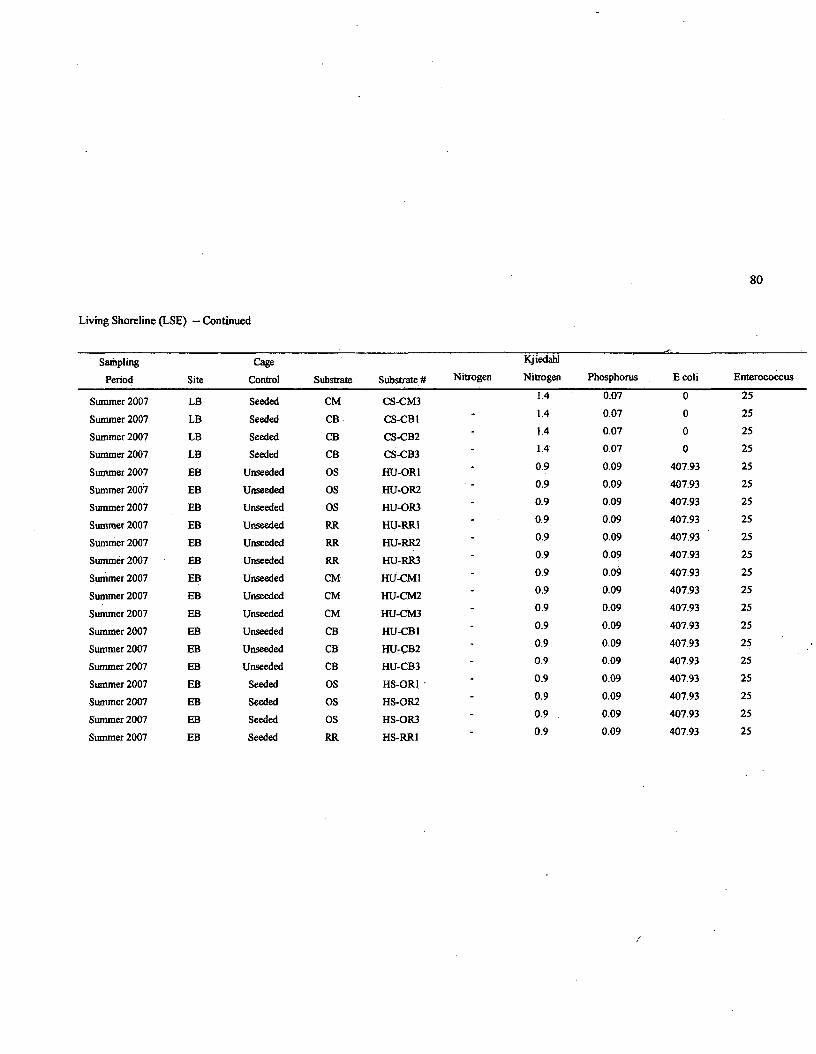
80
Living Shoreline (LSE) — Continued
Sampling
Period Site
Cage
Control Substrate Substrate H
Summer 2007 LB Seeded CM CS-CM3
Summer 2007 LB Seeded CB CS-CB1
Summer 2007 LB Seeded CB CS-CB2
Summer 2007 LB Seeded CB CS-CB3
Summer 2007 EB Unseeded OS HU-OR1
Summer 2007 EB Unseeded OS HU-OR2
Summer 2007 EB Unseeded OS HU-OR3
Summer 2007 EB Unseeded RR HU-RR1
Summer 2007 EB Unseeded RR HU-RR2
Summer 2007 EB Unseeded RR HU-RR3
Summer 2007 EB Unseeded CM HU-CM1
Summer 2007 EB Unseeded CM HU-CM2
Summer 2007 EB Unseeded CM HU-CM3
Summer 2007 EB Unseeded CB HU-CB1
Summer 2007 EB Unseeded CB HU-CB2
Summer 2007 EB Unseeded CB HU-CB3
Summer 2007 EB Seeded OS HS-OR1
Summer 2007 EB Seeded OS HS-OR2
Summer 2007 EB Seeded OS HS-OR3
Summer 2007 EB Seeded RR HS-RR1
Kjiedahl
Nitrogen Nitrogen Phosphorus E coli Enterococcus
1.4 0.07 0 25
- 1.4 0.07 0 25
- 1.4 0.07 0 25
- 1.4 0.07 0 25
- 0.9 0.09 407.93 25
0.9 0.09 407.93 25
- 0.9 0.09 407.93 25
- 0.9 0.09 407.93 25
- 0.9 0.09 407.93 25
- 0.9 0.09 407.93 25
- 0.9 0.09 407.93 25
- 0.9 0.09 407.93 25
- 0.9 0.09 407.93 25
- 0.9 0.09 407.93 25
- 0.9 0.09 407.93 25
- 0.9 0.09 407.93 25
- 0.9 0.09 407.93 25
- 0.9 0,09 407.93 25
- 0.9 0.09 407.93 25- 0 9 0.09 407.93 25
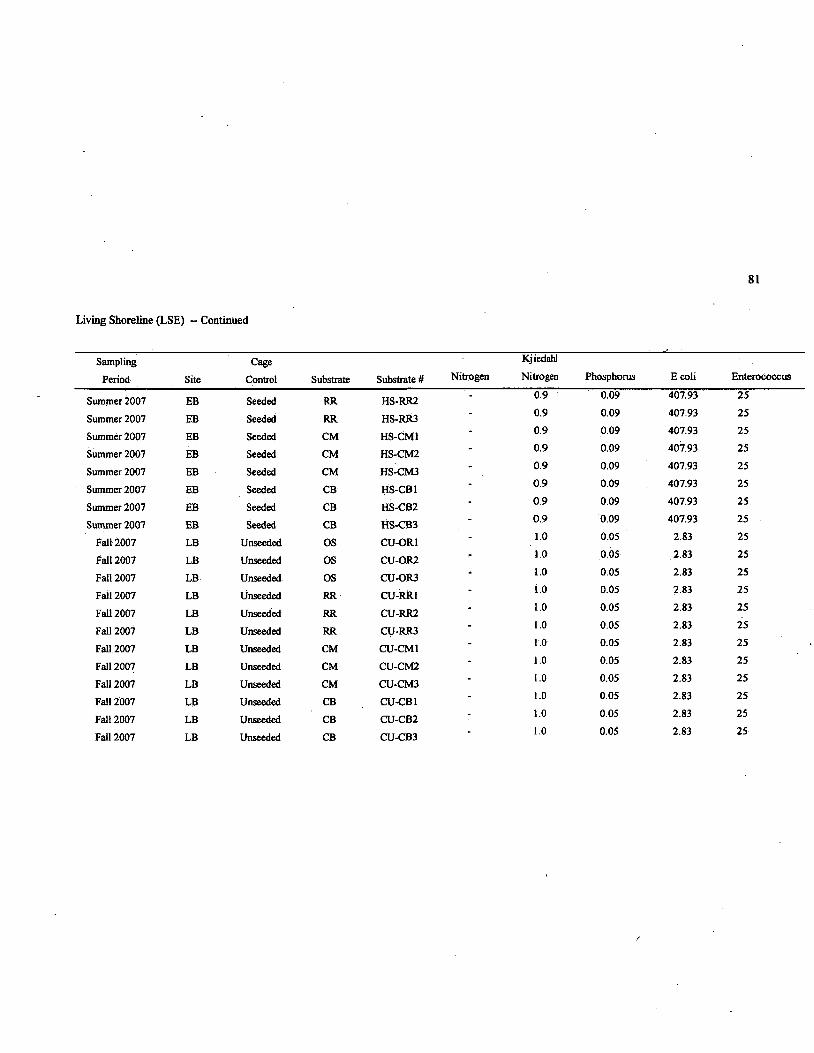
81
Living Shoreline (LSE) -- Continued
Sampling Cage Kjiedahl
Period Site Control Substrate Substrate# Nitrogen Nitrogen Phosphorus E coli Ente
Summer 2007 EB Seeded RR HS-RR2 - 0.9 0.09 407.93 25
Summer 2007 EB Seeded RR HS-RR3 - 0.9 0.09 407.93 25
Summer 2007 EB Seeded CM HS-CM1 - 0.9 0.09 407.93 25
Summer 2007 EB Seeded CM HS-CM2 - 0.9 0.09 407.93 25
Summer 2007 EB Seeded CM HS-CM3 - 0.9 0.09 407.93 25
Summer 2007 EB Seeded CB HS-CB1 - 0.9 0.09 407.93 25
Summer 2007 EB Seeded CB HS-CB2 - 0.9 0.09 407.93 25
Summer 2007 EB Seeded CB HS-CB3 - 0.9 0.09 407.93 25
Fall 2007 LB Unseeded OS CU-OR1 - 1.0 0.05 2.83 25
Fall 2007 LB Unseeded OS CU-OR2 - 1.0 0.05 2.83 25
Fall 2007 LB Unseeded OS CU-OR3 1.0 0.05 2.83 25_ 1.0 0.05 2.83 25Fall 2007 LB Linseeded RR CU-RRI
Fall 2007 LB Unseeded RR CU-RR2 - 1.0 0.05 2.83 25
Fall 2007 LB Unseeded RR CU-RR3 - 1.0 0.05 2.83 25
Fall 2007 LB Unseeded CM CU-CM1 - 1.0 0.05 2.83 25
Fall 2007 LB Unseeded CM CU-CM2 - 1.0 0.05 2.83 25
Fall 2007 LB Unseeded CM CU-CM3 - 1.0 0.05 2.83 25
Fall 2007 LB Unseeded CB CU-CB1 - 1.0 0.05 2.83 25
Fall 2007 LB Unseeded CB CU-CB2 - 1.0 0.05 2.83 25
Fall 2007 LB Unseeded CB CU-CB3 - 1.0 0.05 2.83 25
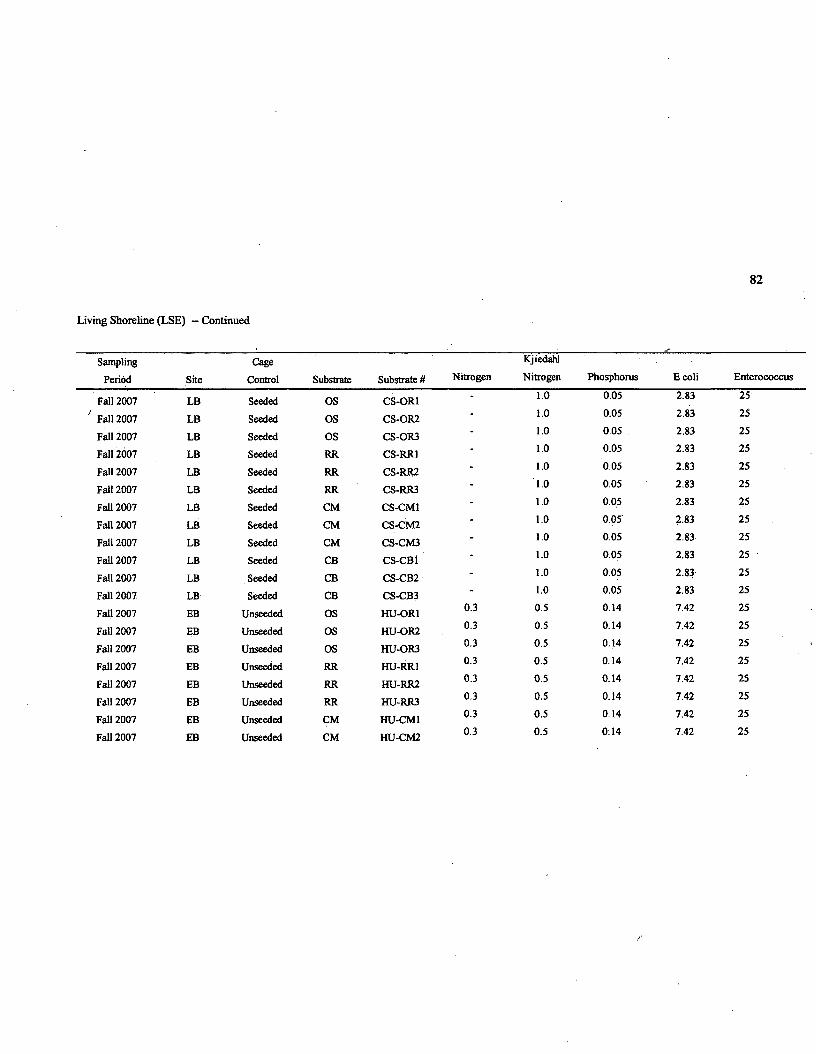
82
Living Shoreline (LSE) - Continued
Sampling
Period Site
Cage
Control Substrate Substrate U Nitrogen
Kjiedahl
Nitrogen Phosphorus Ecoli Ente
Fall 2007 LB Seeded OS CS-OR1 - 1.0 0.05 2.83 25
Fall 2007 LB Seeded OS CS-OR2 - 1.0 0.05 2.83 25
Fall 2007 LB Seeded OS CS-OR3 - 1.0 0.05 2.83 25
Fall 2007 LB Seeded RR CS-RR1 - 1.0 0.05 2.83 25
Fall 2007 LB Seeded RR CS-RR2 - 1.0 0.05 2.83 25
Fall 2007 LB Seeded RR CS-RR3 - 1.0 0.05 2.83 25
Fall 2007 LB Seeded CM CS-CM1 - 1.0 0.05 2.83 25
Fall 2007 LB Seeded CM CS-CM2 - 1.0 0.05 2.83 25
Fall 2007 LB Seeded CM CS-CM3 - 1.0 0.05 2.83 25
Fall 2007 LB Seeded CB CS-CB1 - 1.0 0.05 2.83 25
Fall 2007 LB Seeded CB CS-CB2 - 1.0 0.05 2.83- 25
Fall 2007 LB Seeded CB CS-CB3 - 1.0 0.05 2.83 25
Fall 2007 EB Unseeded OS HU-OR1 0.3 0.5 0.14 7.42 25
Fall 2007 EB Unseeded OS HU-OR2 0.3 0.5 0.14 7.42 25
Fall 2007 EB Unseeded OS HU-OR3 0.3 0.5 0.14 7.42 25
Fall 2007 EB Unseeded RR HU-RR1 0.3 0.5 0.14 7.42 25
Fall 2007 EB Unseeded RR HU-RR2 0.3 0.5 0.14 7.42 25
Fall 2007 EB Unseeded RR HU-RR3 0.3 0.5 0.14 7.42 25
Fall 2007 EB Unseeded CM HU-CM1 0.3 0.5 0.14 7.42 25
Fall 2007 EB Unseeded CM HU-CM2 0.3 0.5 0.14 7.42 25
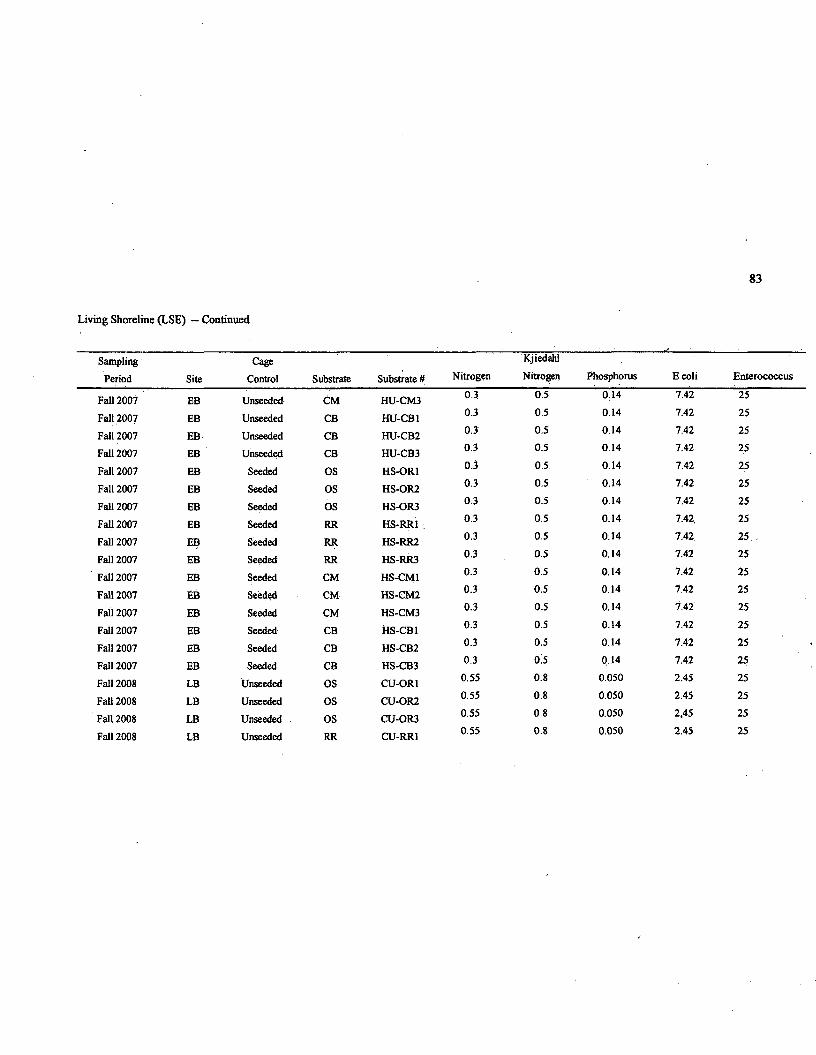
83
Living Shoreline (LSE) — Continued
Sampling
Period Site
Cage
Control Substrate Substrate # Nitrogen
Kjiedahl
Nitrogen Phosphorus Ecoli Ente
Fall 2007 EB Unseeded CM HU-CM3 0.3 0.5 0.14 7.42 25
Fall 2007 EB Unseeded CB HU-CB1 0.3 0.5 0.14 7.42 25
Fall 2007 EB Unseeded CB HU-CB2 0.3 0.5 0.14 7.42 25
Fall 2007 EB Unseeded CB HU-CB3 0.3 0.5 0.14 7.42 25
Fall 2007 EB Seeded OS HS-OR1 0.3 0.5 0.14 7.42 25
Fall 2007 EB Seeded OS HS-OR2 0.3 0.5 0.14 7.42 25
Fall 2007 EB Seeded OS HS-OR3 0.3 0.5 0.14 7.42 25
Fall 2007 EB Seeded RR HS-RR1 0.3 0.5 0.14 7.42, 25
Fall 2007 EB Seeded RR HS-RR2 0.3 0.5 0.14 7.42 25.
Fall 2007 EB Seeded RR HS-RR3 0.3 0.5 0.14 7.42 25
Fall 2007 EB Seeded CM HS-CM1 0.3 0.5 0.14 7.42 25
Fall 2007 EB Seeded CM HS-CM2 0.3 0.5 0.14 7.42 25
Fall 2007 EB Seeded CM HS-CM3 0.3 0.5 0.14 7.42 25
Fall 2007 EB Seeded CB HS-CB1 0.3 0.5 0.14 7.42 25
Fall 2007 EB Seeded CB HS-CB2 0.3 0.5 0.14 7.42 25
Fall 2007 EB Seeded CB HS-CB3 0.3 0^5 0.14 7.42 25
Fall 2008 LB Unseeded OS CU-OR1 0.55 0.8 0.050 2.45 25
Fall 2008 LB Unseeded OS CU-OR2 0.55 0.8 0.050 2.45 25
Fall 2008 LB Unseeded OS CU-OR3 0.55 0.8 0.050 2,45 25
Fall 2008 LB Unseeded RR CU-RR1 0.55 0.8 0.050 2.45 25
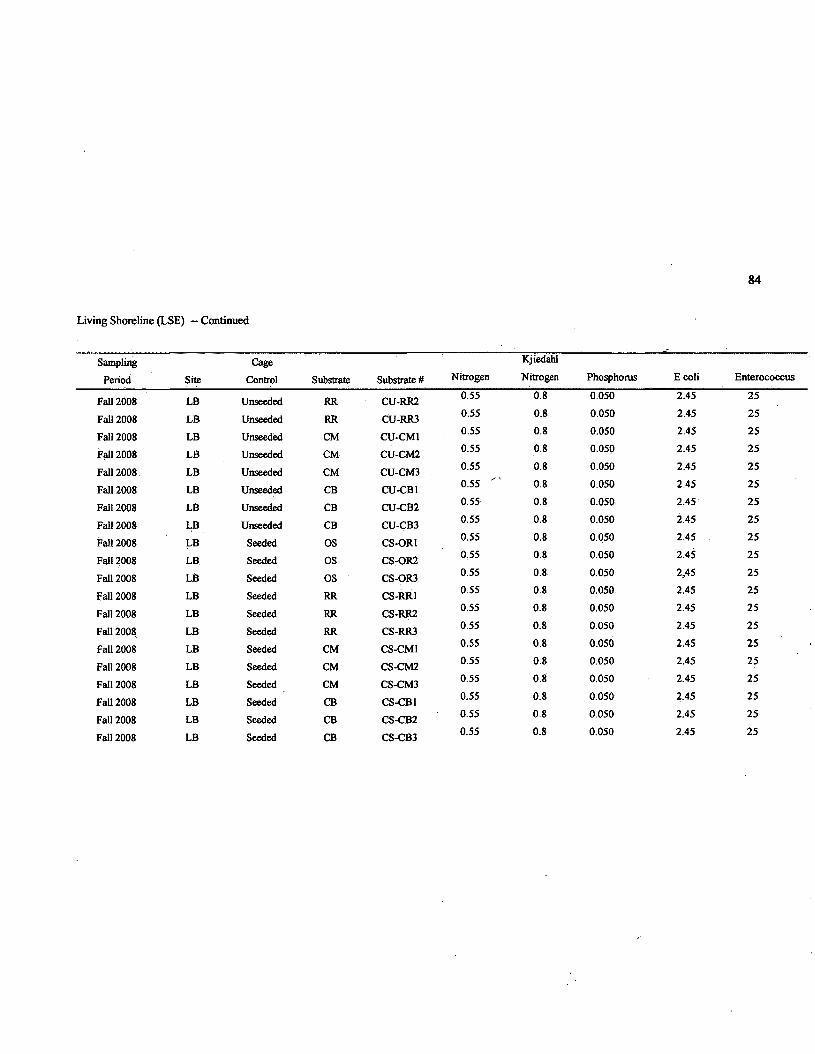
84
Living Shoreline (LSE) — Continued
Sampling
Period Site
Cage
Control Substrate Substrate # Nitrogen
Kjiedahl
Nitrogen Phosphorus E coli Entero
Fall 2008 LB Unseeded RR CU-RR2 0.55 0.8 0.050 2.45 25
Fall 2008 LB Unseeded RR CU-RR3 0.55 0.8 0.050 2.45 25
Fall 2008 LB Unseeded CM CU-CM1 0.55 0.8 0.050 2.45 25
Fall 2008 LB Unseeded CM CU-CM2 0.55 0.8 0.050 2.45 25
Fall 2008. LB Unseeded CM CU-CM3 0.55 0.8 0.050 2.45 25
Fall 2008 LB Unseeded CB CU-CB1 0.55 0.8 0.050 2.45 25
Fall 2008 LB Unseeded CB CU-CB2 0.55 0.8 0.050 2.45 25
Fall 2008 LB Unseeded CB CU-CB3 0.55 0.8 0.050 2.45 25
Fall 2008 LB Seeded OS CS-OR1 0.55 0.8 0.050 2.45 . 25
Fall 2008 LB Seeded OS CS-OR2 0.55 0.8 0.050 2.45 25
Fall 2008 LB Seeded OS CS-OR3 0.55 0.8 0.050 2,45 25
Fall 2008 LB Seeded RR CS-RR1 0.55 0.8 0.050 2.45 25
Fall 2008 LB Seeded RR CS-RR2 0.55 0.8 0.050 2.45 25
Fall 2008 LB Seeded RR CS-RR3 0.55 0.8 0.050 2.45 25
Fall 2008 LB Seeded CM CS-CM1 0.55 0.8 0.050 2.45 25
Fall 2008 LB Seeded CM CS-CM2 0.55 0.8 0.050 2.45 25
Fall 2008 LB Seeded CM CS-CM3 0.55 0.8 0.050 2.45 25
Fall 2008 LB Seeded CB CS-CB1 0.55 0.8 0.050 2.45 25
Fall 2008 LB Seeded CB CS-CB2 0.55 0.8 0.050 2.45 25
Fall 2008 LB Seeded CB CS-CB3 0.55 0.8 0.050 2.45 25
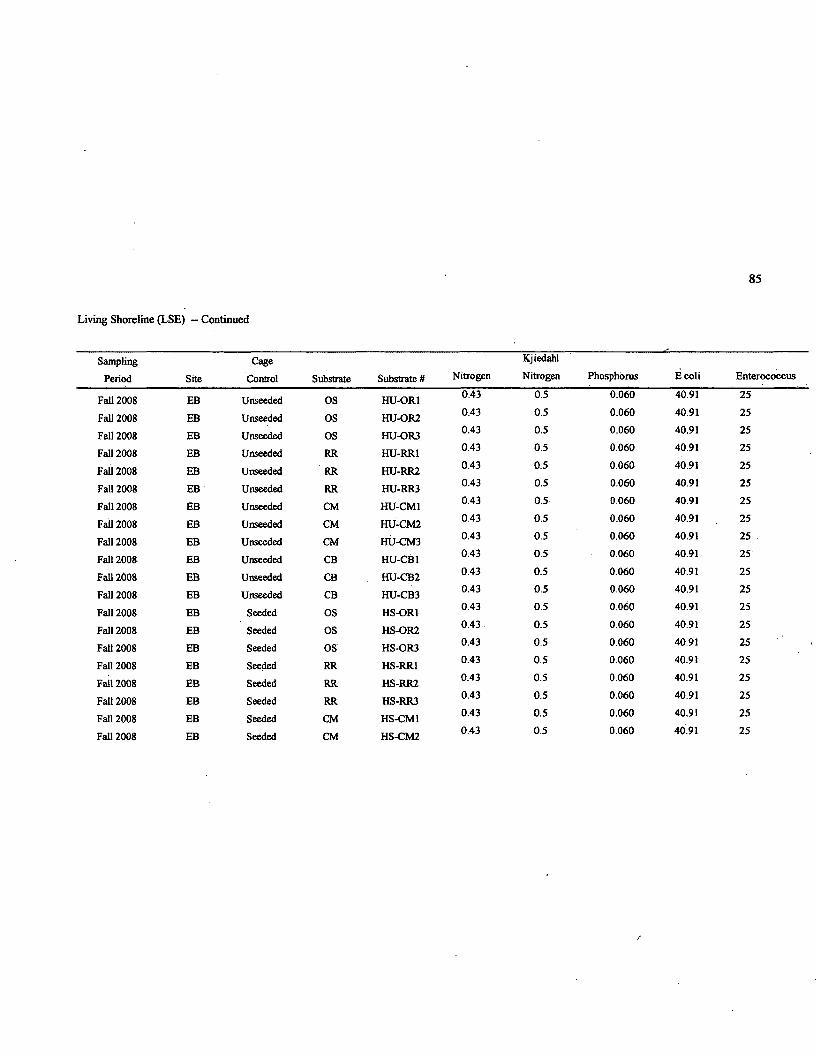
85
Living Shoreline (LSE) - Continued
Sampling
Period Site
Cage
Control Substrate Substrate # Nitrogen
Kjiedahl
Nitrogen Phosphorus E coli Enterococcus
Fall 2008 EB Unseeded OS HU-OR1 0.43 0.5 0.060 40.91 25
Fall 2008 EB Unseeded OS HU-OR2 0.43 0.5 0.060 40.91 25
Fall 2008 EB Unseeded OS HU-OR3 0.43 0.5 0.060 40.91 25
Fall 2008 EB Unseeded RR HU-RR1 0.43 0.5 0.060 40.91 25
Fall 2008 EB Unseeded RR HU-RR2 0.43 0.5 0.060 40.91 25
Fall 2008 EB Unseeded RR HU-RR3 0.43 0.5 0.060 40.91 25
Fall 2008 EB Unseeded CM HU-CM1 0.43 0.5 0.060 40.91 25
Fall 2008 EB Unseeded CM HU-CM2 0.43 0.5 0.060 40.91 25
Fall 2008 EB Unseeded CM HU-CM3 0.43 0.5 0.060 40.91 25
Fall 2008 EB Unseeded CB HU-CB1 0.43 0.5 0.060 40.91 25
Fall 2008 EB Unseeded CB HU-CB2 0.43 0.5 0.060 40.91 25
Fall 2008 EB Unseeded CB HU-CB3 0.43 0.5 0.060 40.91 25
Fall 2008 EB Seeded OS HS-OR1 0.43 0.5 0.060 40.91 25
Fall 2008 EB Seeded OS HS-OR2 0.43 0.5 0.060 40.91 25
Fall 2008 EB Seeded OS HS-OR3 0.43 0.5 0.060 40.91 25
Fall 2008 EB Seeded RR HS-RR1 0.43 0.5 0.060 40.91 25
Fall 2008 EB Seeded RR HS-RR2 0.43 0.5 0.060 40.91 25
Fall 2008 EB Seeded RR HS-RR3 0.43 0.5 0.060 40.91 25
Fall 2008 EB Seeded CM HS-CM1 0.43 0.5 0.060 40.91 25
Fall 2008 EB Seeded CM HS-CM2 0.43 0.5 0.060 40.91 25
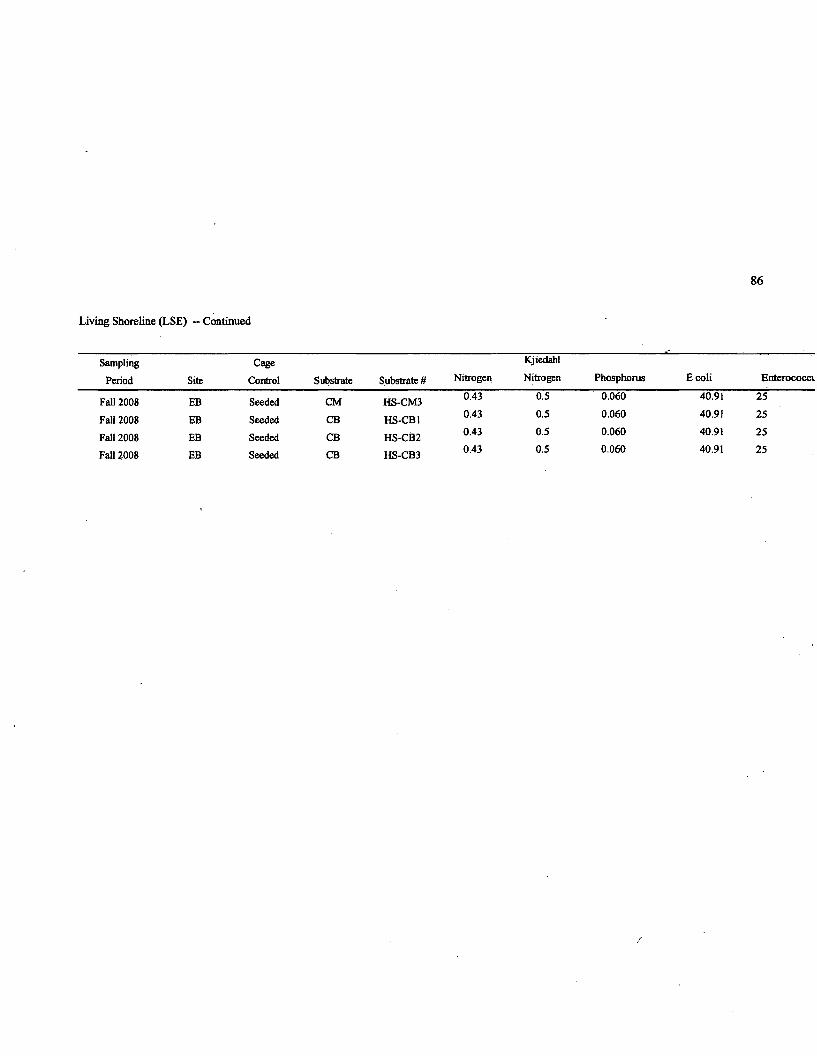
86
Living Shoreline (LSE) - Continued
Sampling
Period Site
Cage
Control Substrate Substrate # Nitrogen
Kjiedahl
Nitrogen Phosphorus E coli Er
Fall 2008 EB Seeded CM HS-CM3 0.43 0.5 0.060 40.91 25
Fall 2008 EB Seeded CB HS-CB1 0.43 0.5 0.060 40.91 25
Fall 2008 EB Seeded CB HS-CB2 0.43 0.5 0.060 40.91 25
Fall 2008 EB Seeded CB HS-CB3 0.43 0.5 0.060 40.91 25
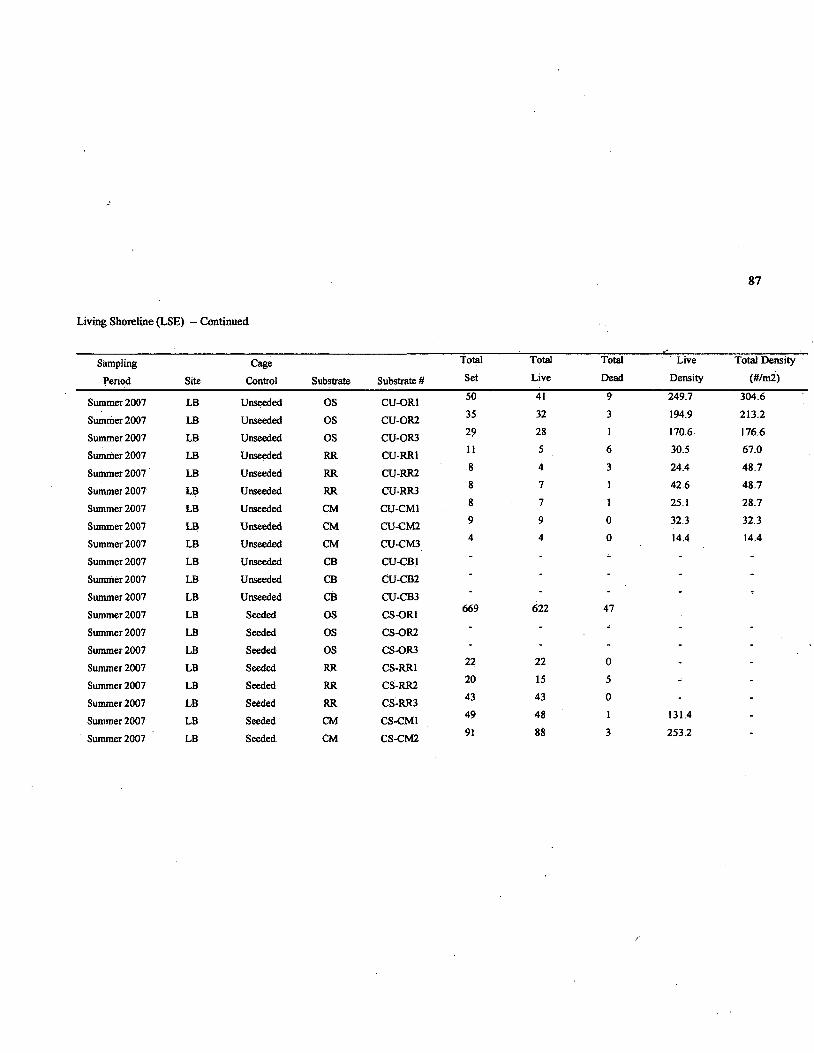
87
Living Shoreline (LSE) - Continued
Sampling
Period Site
Cage
Control Substrate Substrate U
Total
Set
Total
Live
Total
Dead
Live
Density
Total Density
(#/m2)
Summer 2007 LB Unseeded OS CU-OR1 50 41 9 249.7 304.6
Summer 2007 LB Unseeded OS CU-OR2 35 32 3 194.9 213.2
Summer 2007 LB Unseeded OS CU-OR3 29 28 1 170.6 176.6
Summer 2007 LB Unseeded RR CU-RR1 11 5 6 30.5 67.0
Summer 2007 LB Unseeded RR CU-RR2 8 4. 3 24.4 48.7
Summer 2007 LB Unseeded RR CU-RR3 8 7 1 42.6 48.7
Summer 2007 LB Unseeded CM CU-CM1 8 7 1 25.1 28.7
Summer 2007 LB Unseeded CM CU-CM2 9 9 0 32.3 32.3
Summer 2007 LB Unseeded CM CU-CM3 4 4 0 14.4 14.4
Summer 2007 LB Unseeded CB CU-CB1 * ”
Summer 2007 LB Unseeded CB CU-CB2 “ ~ ” * *
Summer 2007 LB Unseeded CB CU-CB3 ' ' ' - '
Summer 2007 LB Seeded OS CS-OR1 669 622 47
Summer 2007 LB Seeded OS CS-OR2 ' ' '' ■
Summer 2007 LB Seeded OS CS-OR3 ~ ” ■ - *22 22 0
Summer 2007 LB Seeded RR CS-RR1
Summer 2007 LB Seeded RR CS-RR2 20 15 5 -
Summer 2007 LB Seeded RR CS-RR3 43 43 0 - -
Summer 2007 LB Seeded CM CS-CM1 49 48 1 131.4 *
Summer 2007 LB Seeded CM CS-CM2 91 88 3 253.2 *
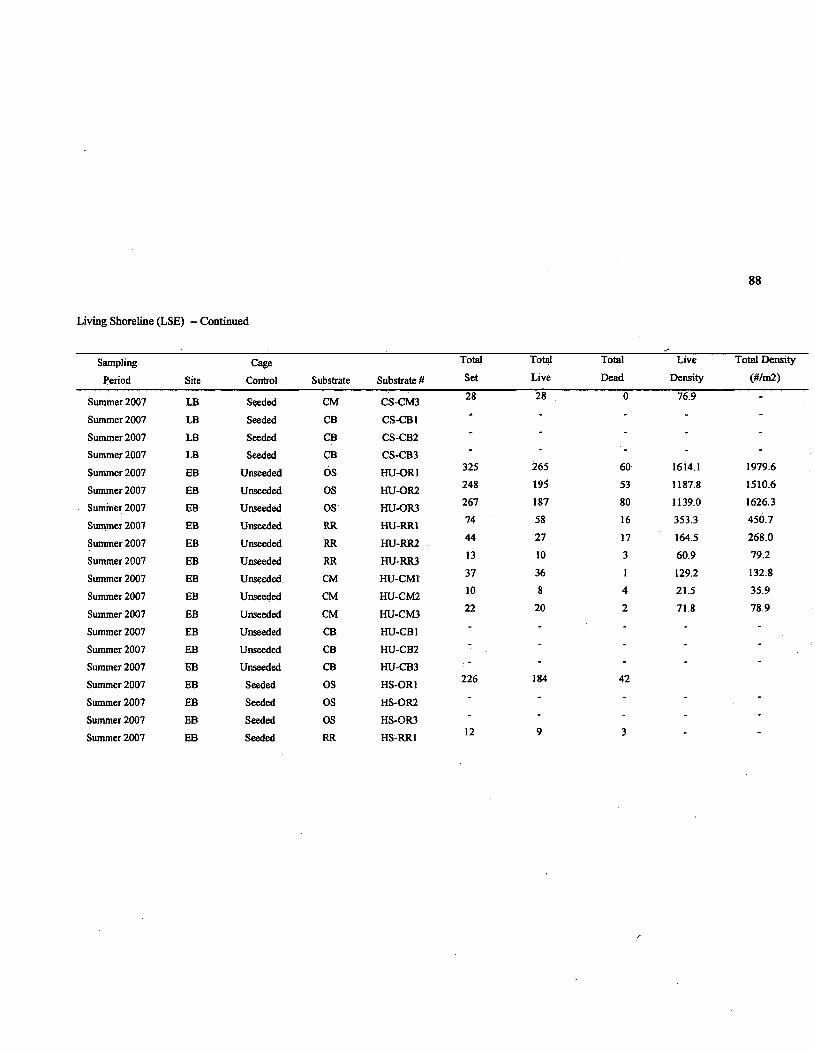
88
Living Shoreline (LSE) -Continued
Sampling
Period Site
Cage
Control Substrate Substrate #
Total
Set
Total
Live
Total
Dead
Live
Density
Total Den
(#/m2)
Summer 2007 LB Seeded CM CS-CM3 28 28 . 0 76.9 -
Summer 2007 LB Seeded CB CS-CB1 “ " ” •
Summer 2007 LB Seeded CB CS-CB2 * " " * ■
Summer 2007 LB Seeded CB CS-CB3 ~ “ -
Summer 2007 EB Unseeded OS HU-OR1 325 265 60 1614.1 1979.6
Summer 2007 EB Unseeded OS HU-OR2 248 195 S3 1187.8 1510.6
Summer 2007 EB Unseeded OS HU-OR3 267 187 80 1139.0 1626.3
Summer 2007 EB Unseeded RR HU-RR1 74 58 16 353.3 450.7
Summer 2007 EB Unseeded RR HU-RR2 44 27 17 164.5 268.0
Summer 2007 EB Unseeded RR HU-RR3 13 10 3 60.9 79.2
Summer 2007 EB Unseeded CM HU-CM1 37 36 1 129.2 132.8
Summer 2007 EB Unseeded CM HU-CM2 10 8 4 21.5 35.9
Summer 2007 EB Unseeded CM HU-CM3 22 20 2 71.8 78.9
Summer 2007 EB Unseeded CB HU-CB1 * ’
Summer 2007 EB Unseeded CB HU-CB2 “ ” “ *
Summer 2007 EB Unseeded CB HU-CB3 ; " * " * “
Summer 2007 EB Seeded OS HS-OR1 226 184 42
Summer 2007 EB Seeded OS HS-OR2 “ " “ ”
Summer 2007 EB Seeded OS HS-OR3 - _ - ”
Summer 2007 EB Seeded RR HS-RR1 12 9 3 * -
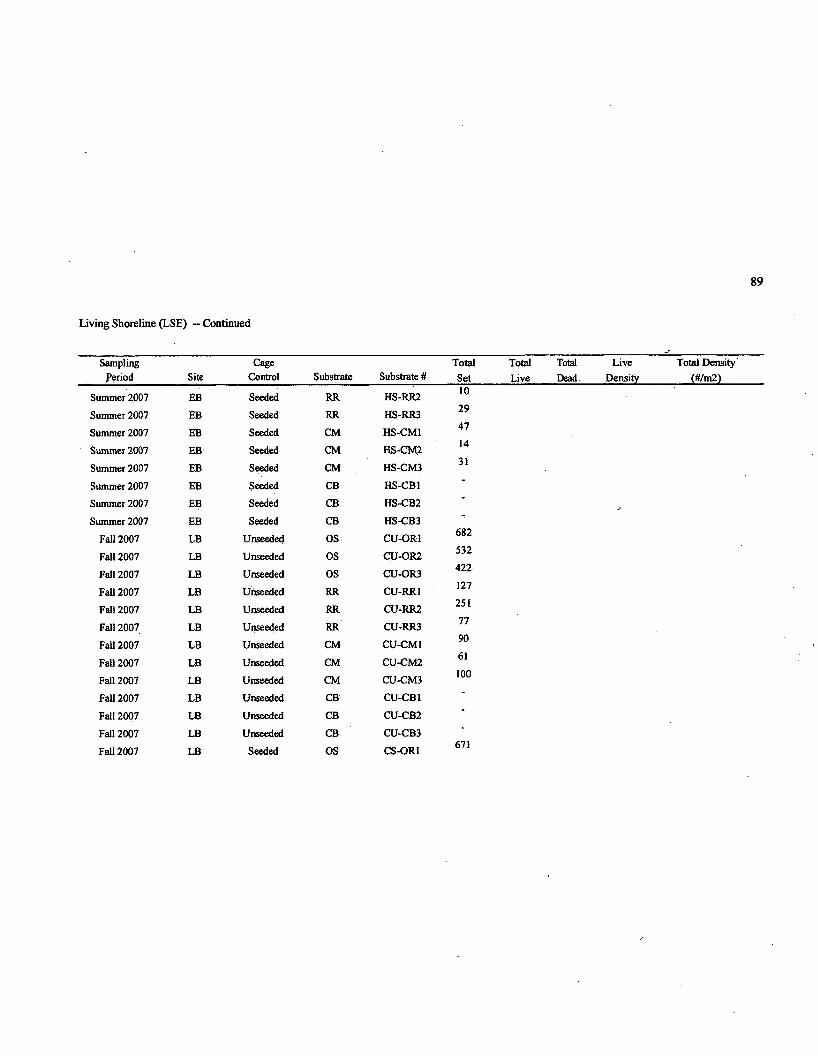
Living Shoreline (LSE) - Continued
Sampling Cage Total Total Total Live Total Density'Period__________ Site_________Control______ Substrate Substrate #______Set Live Dead Density__________ (U/m2)
Summer 2007 EB Seeded RR HS-RR2 10
Summer 2007 EB Seeded RR HS-RR3 29
Summer 2007 EB Seeded CM HS-CM1 47
Summer 2007 EB Seeded CM HS-CM2 14
Summer 2007 EB Seeded CM HS-CM3 31
Summer 2007 EB Seeded CB HS-CB1 '
Summer 2007 EB Seeded CB HS-CB2 *
Summer 2007 EB Seeded CB HS-CB3 '
Fall 2007 LB Unseeded OS CU-OR1 682
Fall 2007 LB Unseeded OS CU-OR2 532
Fall 2007 LB Unseeded OS CU-OR3 422
Fall 2007 LB Unseeded RR CU-RR1 127
Fall 2007 LB Unseeded RR CU-RR2 251
Fall 2007 LB Unseeded RR CU-RR3 77
Fall 2007 LB Unseeded CM CU-CM1 90
Fall 2007 LB Unseeded CM CU-CM2 61
Fall 2007 LB Unseeded CM CU-CM3 100
Fall 2007 LB Unseeded CB CU-CB1 '
Fall 2007 LB Unseeded CB CU-CB2 '
Fall 2007 LB Unseeded CB CU-CB3
Fall 2007 LB Seeded OS CS-OR1 671
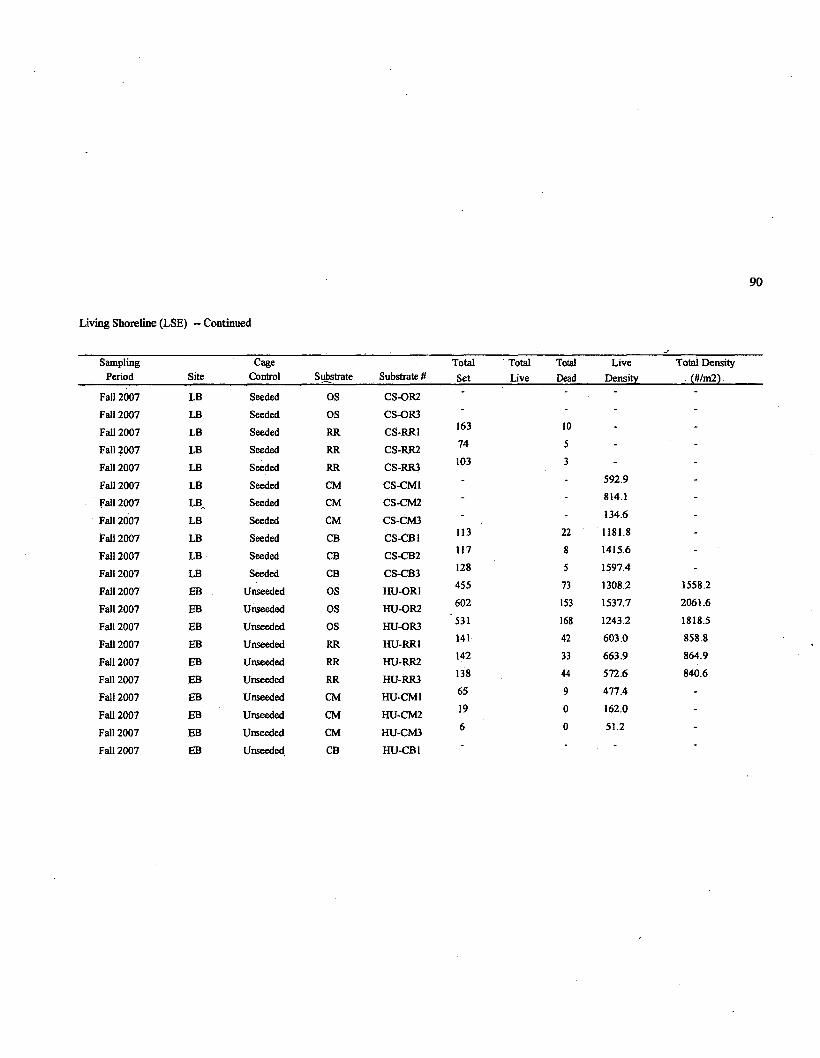
90
Living Shoreline (LSE) -Continued
Sampling Cage Total Total Total Live Total DePeriod Site Control Substrate Substrate U Set Live Dead Density (#/ml
Fall 2007 LB Seeded OS CS-OR2 - - - -
Fall 2007 LB Seeded OS CS-OR3 * *
Fall 2007 LB Seeded RR CS-RR1 163 10 - -
Fall 2007 LB Seeded RR CS-RR2 74 5 - *
Fall 2007 LB Seeded RR CS-RR3 103 3 - -
Fall 2007 LB Seeded CM CS-CM1 - - 592.9
Fall 2007 LB Seeded CM CS-CM2 - - 814.1
Fall 2007 LB Seeded CM CS-CM3 - - 134.6 -
Fall 2007 LB Seeded CB CS-CB1 113 22 1181.8 -
Fall 2007 LB Seeded CB CS-CB2 117 8 1415.6 -
Fall 2007 LB Seeded CB CS-CB3 128 5 1597.4 -
Fall 2007 EB Unseeded OS HU-OR1 455 73 1308.2 1558.2
Fall 2007 EB Unseeded OS HU-OR2 602 153 1537.7 2061.6
Fall 2007 EB Unseeded OS HU-OR3 531 168 1243.2 1818.5
Fall 2007 EB Unseeded RR HU-RR1 141 42 603.0 858.8
Fall 2007 EB Unseeded RR HU-RR2 142 33 663.9 864.9
Fall 2007 EB Unseeded RR HU-RR3 138 44 572.6 840.6
Fall 2007 EB Unseeded CM HU-CM1 65 9 477.4 -
Fall 2007 EB Unseeded CM HU-CM2 19 0 162.0 -
Fall 2007 EB Unseeded CM HU-CM3 6 0 51.2 -
Fall 2007 EB Unseeded CB HU-CB1 - * - *
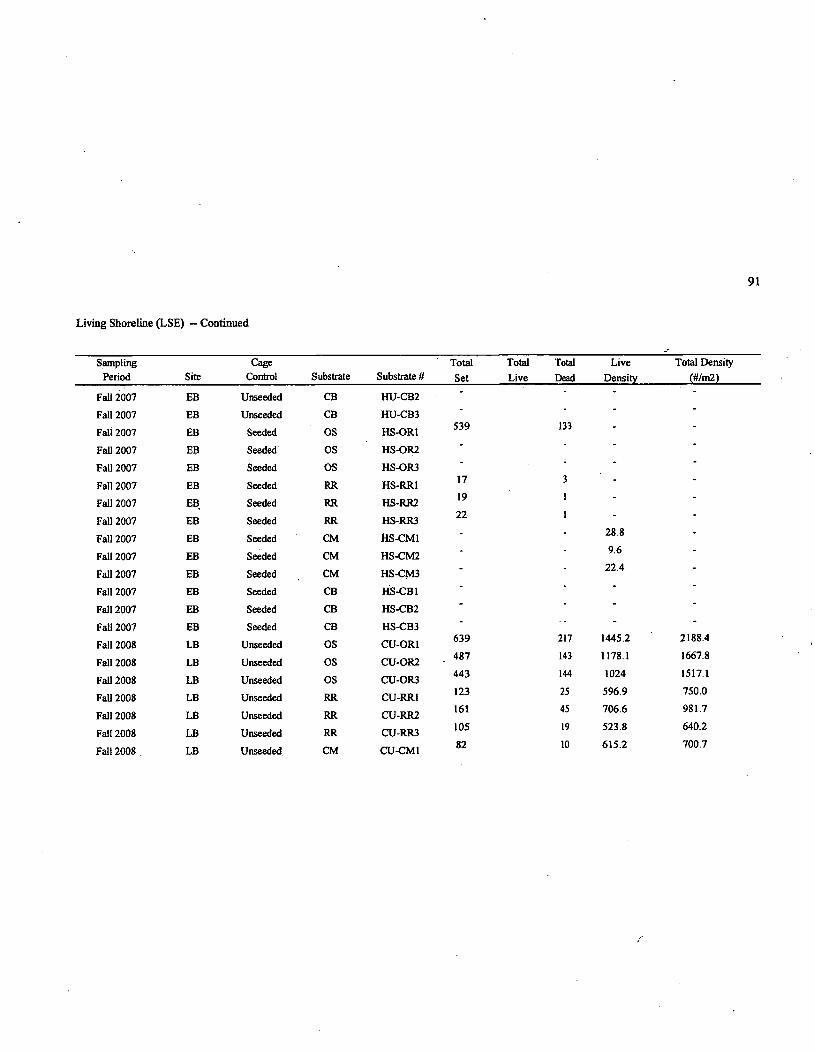
91
Living Shoreline (LSE) -- Continued
Sampling Cage Total Total Total Live Total DensityPeriod Site Control Substrate Substrate # Set Live Dead Density (#/m2)
Fall 2007 EB Unseeded CB HU-CB2 - - - -
Fall 2007 EB Unseeded CB HU-CB3 " “
Fall 2007 EB Seeded OS HS-OR1 539 133 - -
Fall 2007 EB Seeded OS HS-OR2 '
Fall 2007 EB Seeded OS HS-OR3 *
Fall 2007 EB Seeded RR HS-RR1 17 3 - -
Fall 2007 EB Seeded RR HS-RR2 19 1 - -
Fall 2007 EB Seeded RR HS-RR3 22 1 - -
Fall 2007 EB Seeded CM HS-CM1 - - 28.8 -
Fall 2007 EB Seeded CM HS-CM2 - - 9.6 -
Fall 2007 EB Seeded CM HS-CM3 - - 22.4
Fall 2007 EB Seeded CB HS-CB1 ' ‘
Fall 2007 EB Seeded CB HS-CB2 ' ' '
Fall 2007 EB Seeded CB HS-CB3 " ” *
Fall 2008 LB Unseeded OS CU-OR1 639 217 1445.2 2188.4
Fall 2008 LB Unseeded OS CU-OR2 487 143 1178.1 1667.8
Fall 2008 LB Unseeded OS CU-OR3 443 144 1024 1517.1
Fall 2008 LB Unseeded RR CU-RR1 123 25 596.9 750.0
Fall 2008 LB Unseeded RR CU-RR2 161 45 706.6 981.7
Fall 2008 LB Unseeded RR CU-RR3 105 19 523.8 640.2
Fall 2008 . LB Unseeded CM CU-CM1 82 10 615.2 700.7
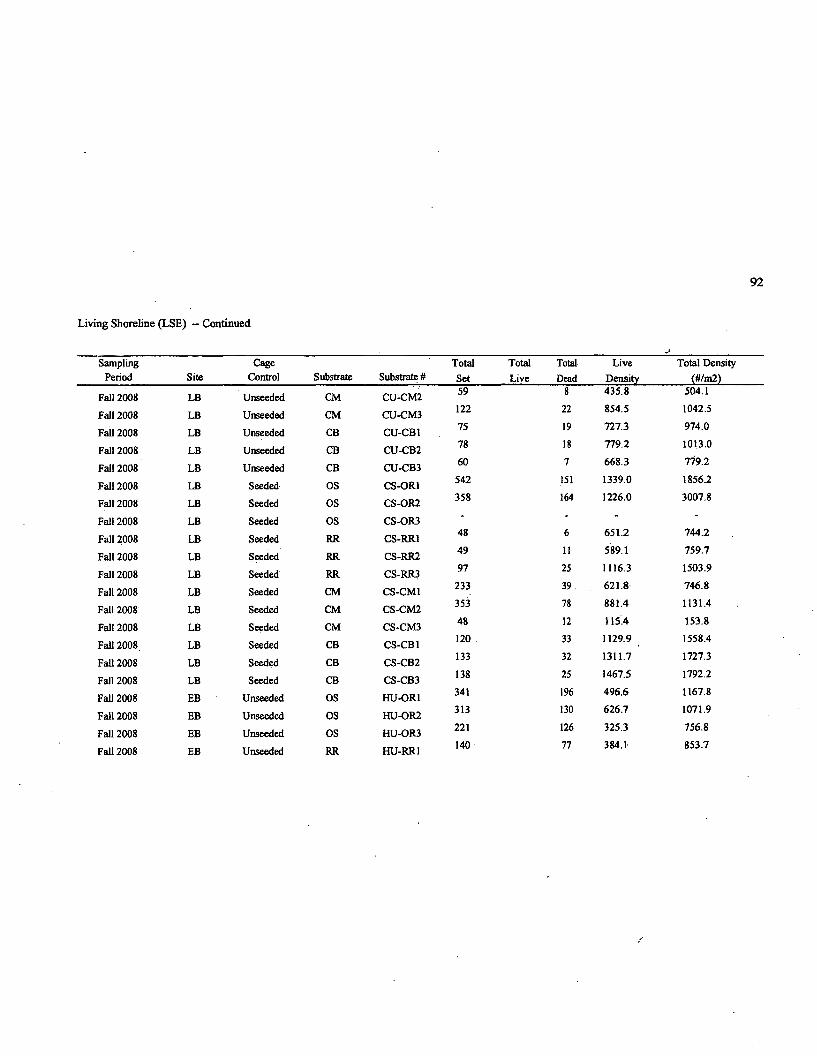
92
Living Shoreline (LSE) - Continued
Sampling Cage Total Total Total Live Total DensityPeriod Site Control Substrate Substrate# Set Live Dead Density (#/m2)
Fall 2008 LB Unseeded CM CU-CM2 59 8 435.8 504.1
Fall 2008 LB Unseeded CM CU-CM3 122 22 854.5 1042.5
Fall 2008 LB Unseeded CB CU-CB1 75 19 727.3 974.0
Fall 2008 LB Unseeded CB CU-CB2 78 18 779.2 1013.0
Fall 2008 LB Unseeded CB CU-CB3 60 7 668.3 779.2
Fall 2008 LB Seeded OS CS-OR1 542 151 1339.0 1856.2
Fall 2008 LB Seeded OS CS-OR2 358 164 1226.0 3007.8
Fall 2008 LB Seeded OS CS-OR3 * “ “
Fall 2008 LB Seeded RR CS-RR1 48 6 651.2 744.2
Fall 2008 LB Seeded RR CS-RR2 49 11 589.1 759.7
Fall 2008 LB Seeded RR CS-RR3 97 25 1116.3 1503.9
Fall 2008 LB Seeded CM CS-CM1 233 39 621.8 746.8
Fall 2008 LB Seeded CM CS-CM2 353 78 881.4 1131.4
Fall 2008 LB Seeded CM CS-CM3 48 12 115.4 153.8
Fall 2008 LB Seeded CB CS-CB1 120 33 1129.9 1558.4
Fall 2008 LB Seeded CB CS-CB2 133 32 1311.7 1727.3
Fall 2008 LB Seeded CB CS-CB3 138 25 1467.5 1792.2
Fall 2008 EB Unseeded OS HU-OR1 341 196 496.6 1167.8
Fall 2008 EB Unseeded OS HU-OR2 313 130 626.7 1071.9
Fall 2008 EB Unseeded OS HU-OR3 221 126 325.3 756.8
Fall 2008 EB Unseeded RR HU-RR1 140 77 384.1 853.7
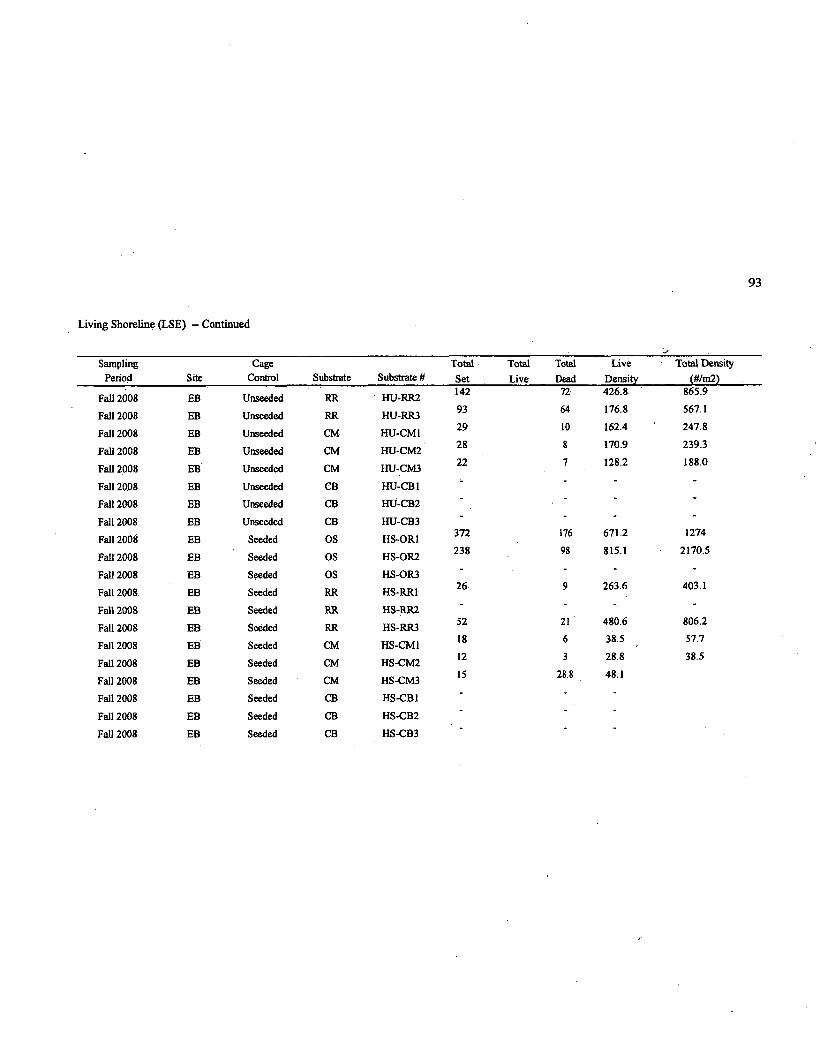
93
Living Shoreline (LSE) - Continued
Sampling Cage Total Total Total Live Total DePeriod Site Control Substrate Substrate # Set Live Dead Density (#/m2
Fall 2008 EB Unseeded RR HU-RR2 142 72 426.8 865.9
Fall 2008 EB Unseeded RR HU-RR3 93 64 176.8 567.1
Fall 2008 EB Unseeded CM HU-CM1 29 10 162.4 247.8
Fall 2008 EB Unseeded CM HU-CM2 28 8 170.9 239.3
Fall 2008 EB Unseeded CM HU-CM3 22 7 128.2 188.0
Fall 2008 EB Unseeded CB HU-CB1 ' ‘
Fall 2008 EB Unseeded CB HU-CB2
Fall 2008 EB Unseeded CB HU-CB3 “ " * “
Fall 2008 EB Seeded OS HS-OR1 372 176 671.2 1274
Fall 2008 EB Seeded OS HS-OR2 238 98 815.1 2170.5
Fall 2008 EB Seeded OS HS-OR3 - " * *
Fall 2008 EB Seeded RR HS-RR1 26 9 263.6 403.1
Fall 2008 EB Seeded RR HS-RR2 ■ " “ • “
Fall 2008 EB Seeded RR HS-RR3 52 21 480.6 806.2
Fall 2008 EB Seeded CM HS-CM1 18 6 38.5 57.7
Fall 2008 EB Seeded CM HS-CM2 12 3 28.8 38.5
Fall 2008 EB Seeded CM HS-CM3 15 28.8 48.1
Fall 2008 EB Seeded CB HS-CB1 ■ ‘
Fall 2008 EB Seeded CB HS-CB2 '
Fall 2008 EB Seeded CB HS-CB3 ■ * "
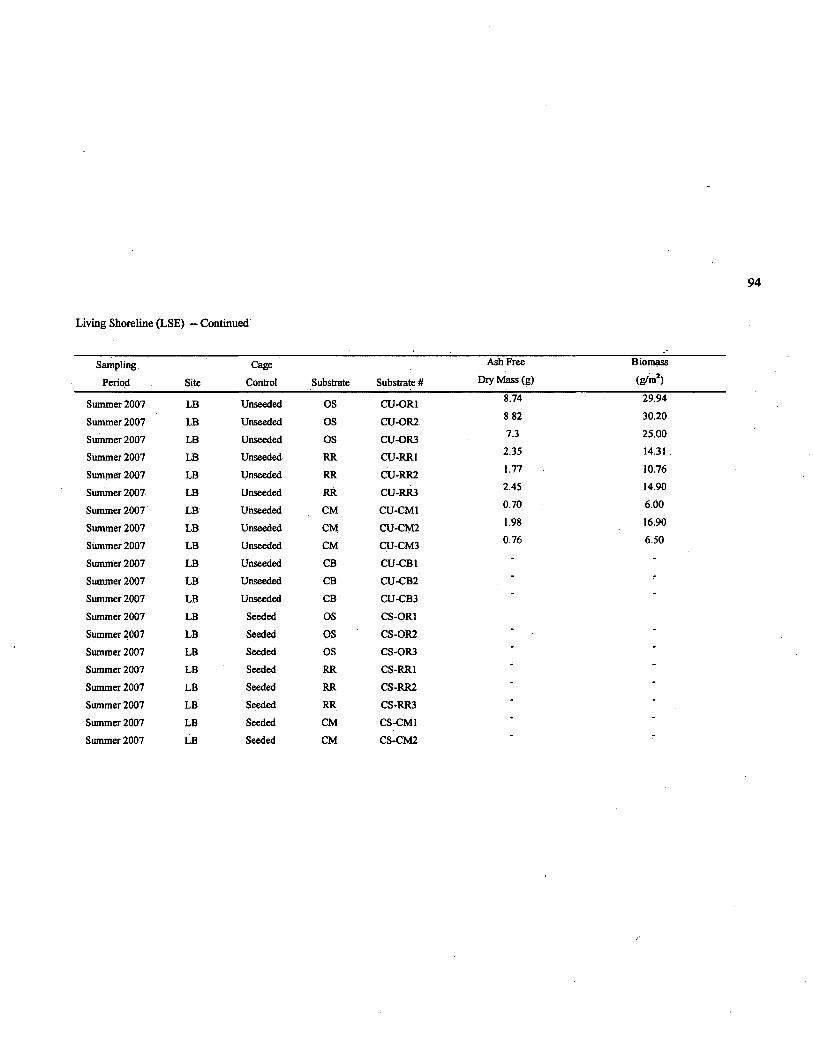
Living Shoreline (LSE) — Continued
Sampling
Period Site
Cage
Control Substrate Substrate #
Ash Free
Dry Mass (g)
Biomass
(g/m2)
Summer 2007 LB Unseeded OS CU-OR1 8.74 29.94
Summer 2007 LB Unseeded OS CU-OR2 8.82 30.20
Summer 2007 LB Unseeded OS CU-OR3 7.3 25.00
Summer 2007 LB Unseeded RR CU-RR1 2.35 14.31 .
Summer 2007 LB Unseeded RR CU-RR2 1.77 10.76
Summer 2007 LB Unseeded RR CU-RR3 2.4S 14.90
Summer 2007 LB Unseeded CM CU-CM1 0.70 6.00
Summer 2007 LB Unseeded CM CU-CM2 1.98 16.90
Summer 2007 LB Unseeded CM CU-CM3 0.76 6.50
Summer 2007 LB Unseeded CB CU-CB1 “ "
Summer 2007 LB Unseeded CB CU-CB2 “
Summer 2007 LB Unseeded CB CU-CB3 “ “
Summer 2007 LB Seeded OS CS-OR1
Summer 2007 LB Seeded OS CS-OR2 * “
Summer 2007 LB Seeded OS CS-OR3 " *
Summer 2007 LB Seeded RR CS-RR1 “
Summer 2007 LB Seeded RR CS-RR2 " “
Summer 2007 LB Seeded RR CS-RR3 •
Summer 2007 LB Seeded CM CS-CM1 "
Summer 2007 LB Seeded CM CS-CM2 "
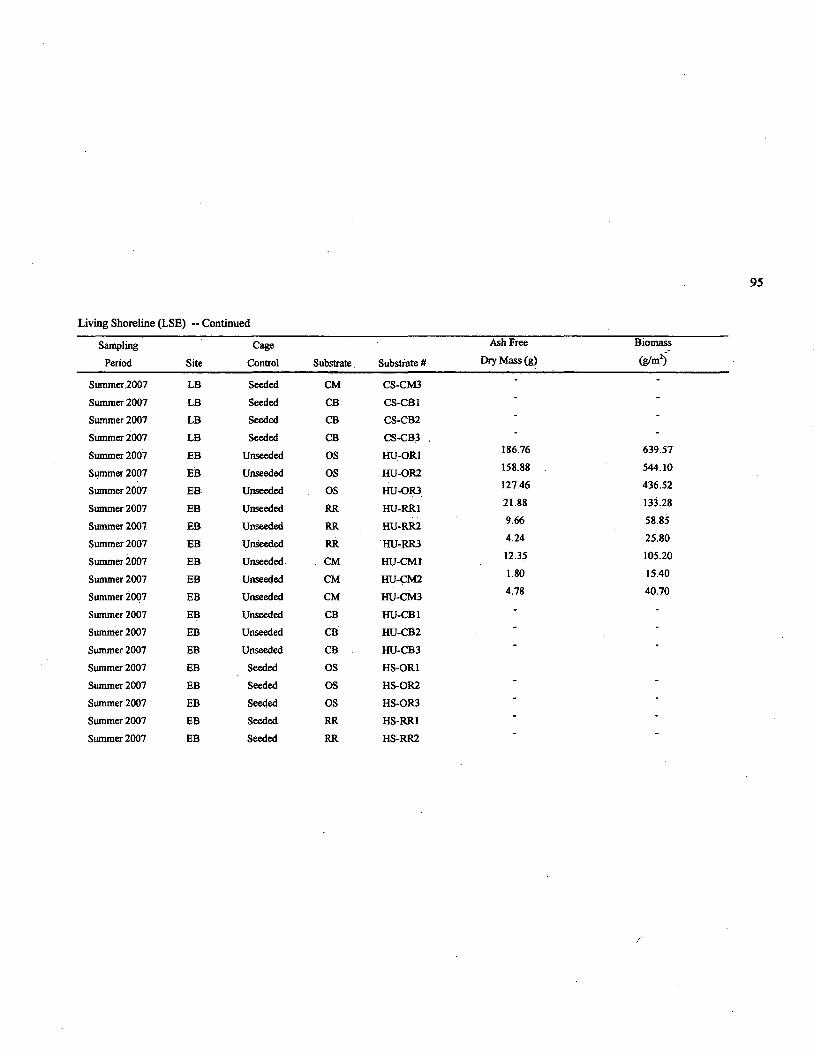
Living Shoreline (LSE) — Continued
Sampling
Period Site
Cage
Control Substrate Substrate ft
Ash Free
Dry Mass (g)
Biomass
(g/m2)
Summer .2007 LB Seeded CM CS-CM3
Summer 2007 LB Seeded CB CS-CB1 *
Summer 2007 LB Seeded CB CS-CB2 " *
Summer 2007 LB Seeded CB CS-CB3 , ■*
Summer 2007 EB Unseeded OS HU-OR1 186.76 639.57
Summer 2007 EB Unseeded OS HU-OR2 1S8.88 544.10
Summer 2007 EB Unseeded OS HU-OR3 127.46 436.52
Summer 2007 EB Unseeded RR HU-RR1 21.88 133.28
Summer 2007 EB Unseeded RR HU-RR2 9.66 58.85
Summer 2007 EB Unseeded RR HU-RR3 4.24 25.80
Summer 2007 EB Unseeded CM HU-CM1 12.35 105.20
Summer 2007 EB Unseeded CM HU-CM2 1.80 15.40
Summer 2007 EB Unseeded CM HU-CM3 4.78 40.70
Summer 2007 EB Unseeded CB HU-CB1 - “
Summer 2007 EB Unseeded CB HU-CB2 “ "
Summer 2007 EB Unseeded CB HU-CB3 “ "
Summer 2007 EB Seeded OS HS-OR1
Summer 2007 EB Seeded OS HS-OR2 “
Summer 2007 EB Seeded OS HS-OR3 “ "
Summer 2007 EB Seeded RR HS-RR1 ” "
Summer 2007 EB Seeded RR HS-RR2 “
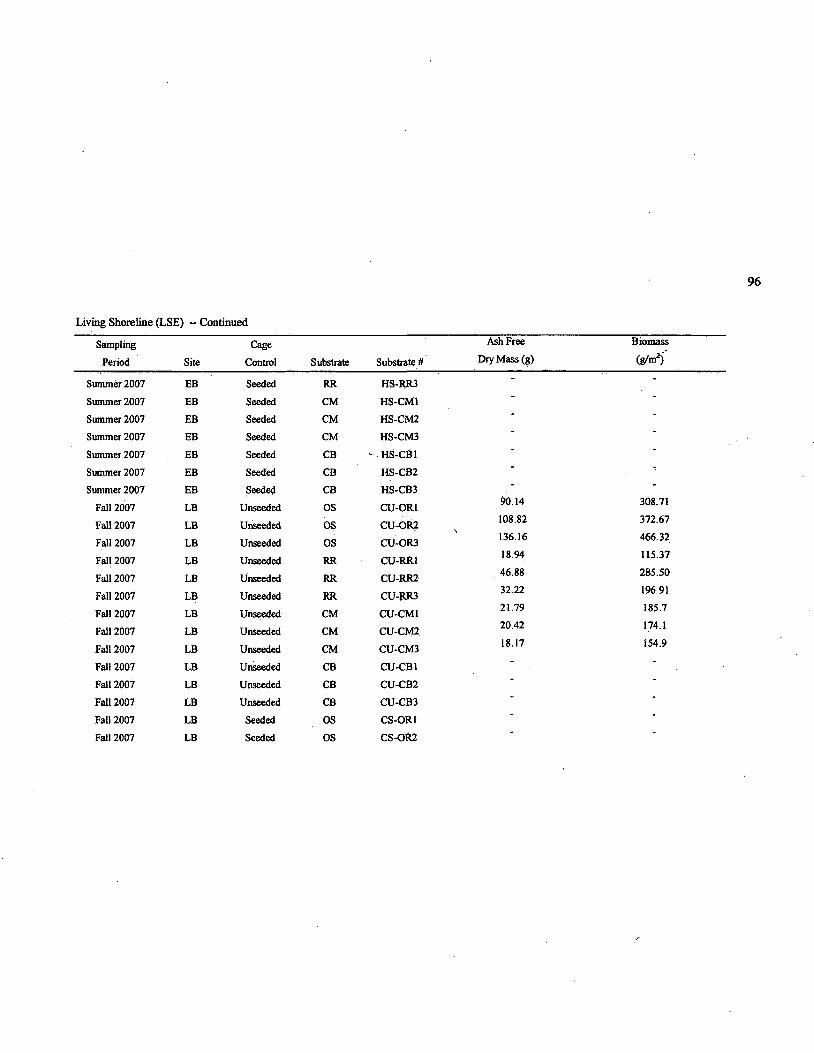
Living Shoreline (LSE) - Continued
Sampling
Period Site
Cage
Control Substrate Substrate#
Ash Free
Dry Mass (g)
Biomass
(g/m2>
Summer 2007 EB Seeded RR HS-RR3 - -
Summer 2007 EB Seeded CM HS-CM1 “ _
Summer 2007 EB Seeded CM HS-CM2 -
Summer 2007 EB Seeded CM HS-CM3 *
Summer 2007 EB Seeded CB - . HS-CB1 " ■
Summer 2007 EB Seeded CB HS-CB2 “ ■
Summer 2007 EB Seeded CB HS-CB3 ' *■
Fall 2007
Fall 2007
Fall 2007
LB
LB
LB
Unseeded
Unseeded
Unseeded
OS
OS
OS
CU-OR1
CU-OR2
CU-OR3\
90.14
108.S2
136.16
308.71
372.67
466.32
Fall 2007 LB Unseeded RR CU-RR1 18.94 115.37
Fall 2007 LB Unseeded RR CU-RR2 46.88 285.50
Fall 2007 LB Unseeded RR CU-RR3 32.22 196.91
Fall 2007 LB Unseeded CM CU-CM1 21.79 185.7
Fall 2007 LB Unseeded CM CU-CM2 20.42 174.1
Fall 2007 LB Unseeded CM CU-CM3 18.17 154.9
Fall 2007 LB Unseeded CB CU-CB1 " -
Fall 2007 LB Unseeded CB CU-CB2 " "
Fall 2007 LB Unseeded CB CU-CB3
Fall 2007 LB Seeded OS CS-OR1 ' "
Fall 2007 LB Seeded OS CS-OR2 “
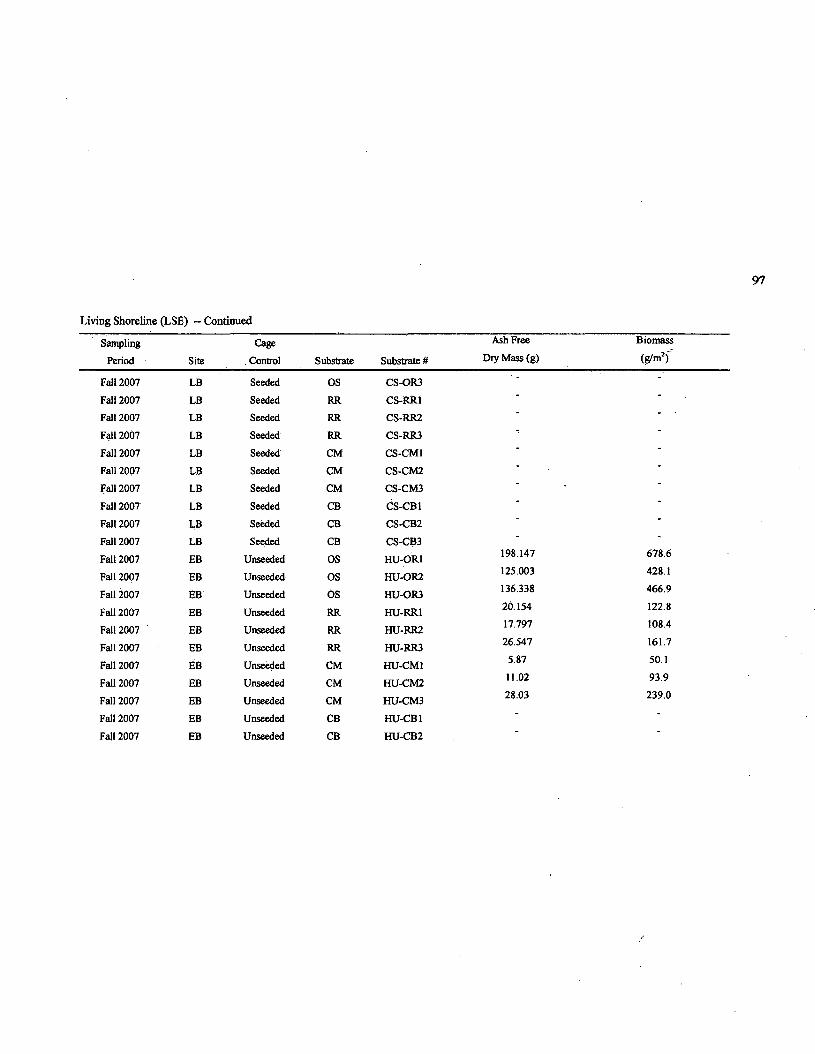
Living Shoreline (LSE) - Continued
Sampling
Period Site
Cage
, Control Substrate Substrate #
Ash Free
Dry Mass (g)
Biomass
(g/m2)"
Fall 2007 LB Seeded OS CS-OR3 -
Fall 2007 LB Seeded RR CS-RR1 “ "
Fall 2007 LB Seeded RR CS-RR2 " "
Fall 2007 LB Seeded RR CS-RR3 * “
Fall 2007 LB Seeded CM CS-CM1 “
Fall 2007 LB Seeded CM CS-CM2 "
Fall 2007 LB Seeded CM CS-CM3 * “
Fall 2007 LB Seeded CB CS-CB1 * “
Fall 2007 LB Seeded CB CS-CB2 “ "
Fall 2007 LB Seeded CB CS-CB3 -
Fall 2007 EB Unseeded OS HU-OR1 198.147 678.6
Fall 2007 EB Unseeded OS HU-OR2 125.003 428.1
Fall 2007 EB Unseeded OS HU-OR3 136.338 466.9
Fall 2007 EB Unseeded RR HU-RR1 20.154 122.8
Fall 2007 EB Unseeded RR HU-RR2 17.797 108.4
Fall 2007 EB Unseeded RR HU-RR3 26.547 161.7
Fall 2007 EB Unseeded CM HU-CM1 5.87 50.1
Fall 2007 EB Unseeded CM HU-CM2 11.02 93.9
Fall 2007 EB Unseeded CM HU-CM3 28.03 239.0
Fall 2007 EB Unseeded CB HU-CB1 "
Fall 2007 EB Unseeded CB HU-CB2
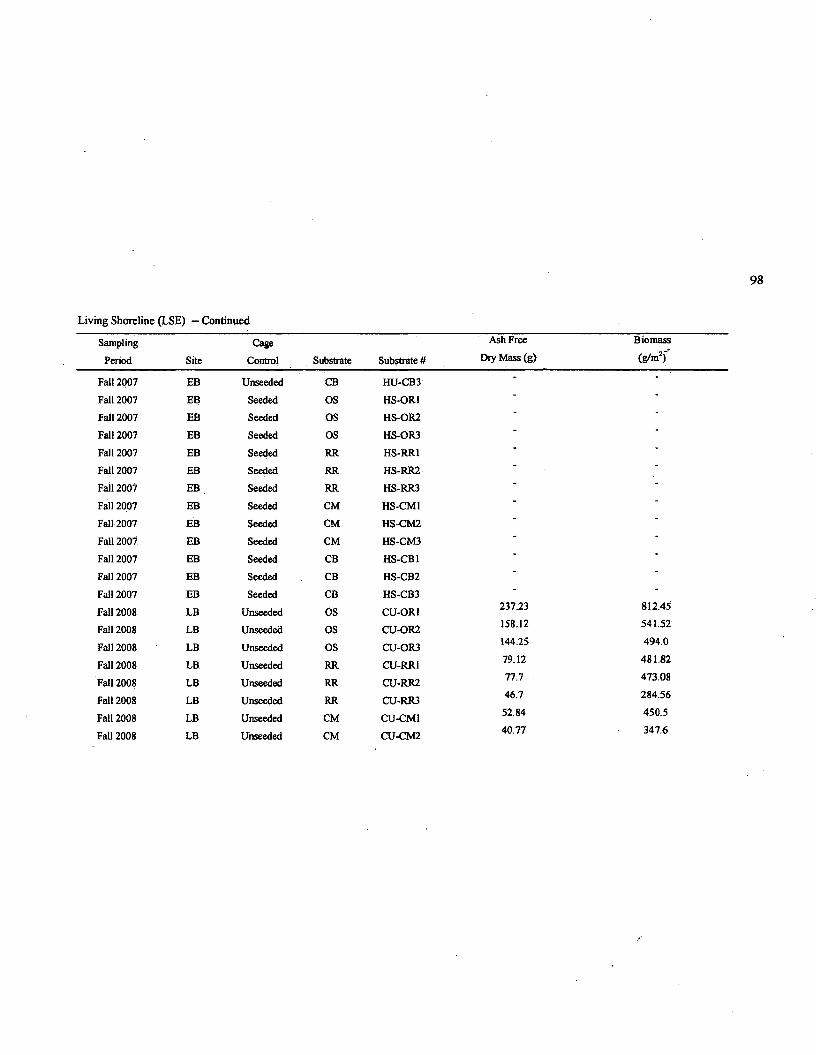
Living Shoreline (LSE) —Continued
Sampling
Period Site
Cage
Control Substrate Substrate #
Ash Free
Dry Mass (g)
Biomass
(g/m2)
Fall 2007 EB Unseeded CB HU-CB3 - *
Fall 2007 EB Seeded OS HS-OR1 " “
Fall 2007 EB Seeded OS HS-OR2 “
Fall 2007 EB Seeded OS HS-OR3 “ “
Fall 2007 EB Seeded RR HS-RR1 *
Fall 2007 EB Seeded RR HS-RR2 “ “
Fail 2007 EB Seeded RR HS-RR3 * “
Fall 2007 EB Seeded CM HS-CM1 " "
Fall 2007 EB Seeded CM HS-CM2 “ "
Fall 2007 EB Seeded CM HS-CM3 "
Fall 2007 EB Seeded CB HS-CB1 •
Fall 2007 EB Seeded CB HS-CB2 “ '
Fall 2007 EB Seeded CB HS-CB3 '
Fall 2008 LB Unseeded OS CU-OR1 237.23 812.45
Fall 2008 LB Unseeded OS CU-OR2 158.12 541.52
Fall 2008 LB Unseeded OS CU-OR3 144.25 494.0
Fall 2008 LB Unseeded RR CU-RR1 79.12 481.82
Fall 2008 LB Unseeded RR CU-RR2 77.7 473.08
Fall 2008 LB Unseeded RR CU-RR3 46.7 284.56
Fall 2008 LB Unseeded CM CU-CM1 52.84 450.5
Fall 2008 LB Unseeded CM CU-CM2 40.77 347.6
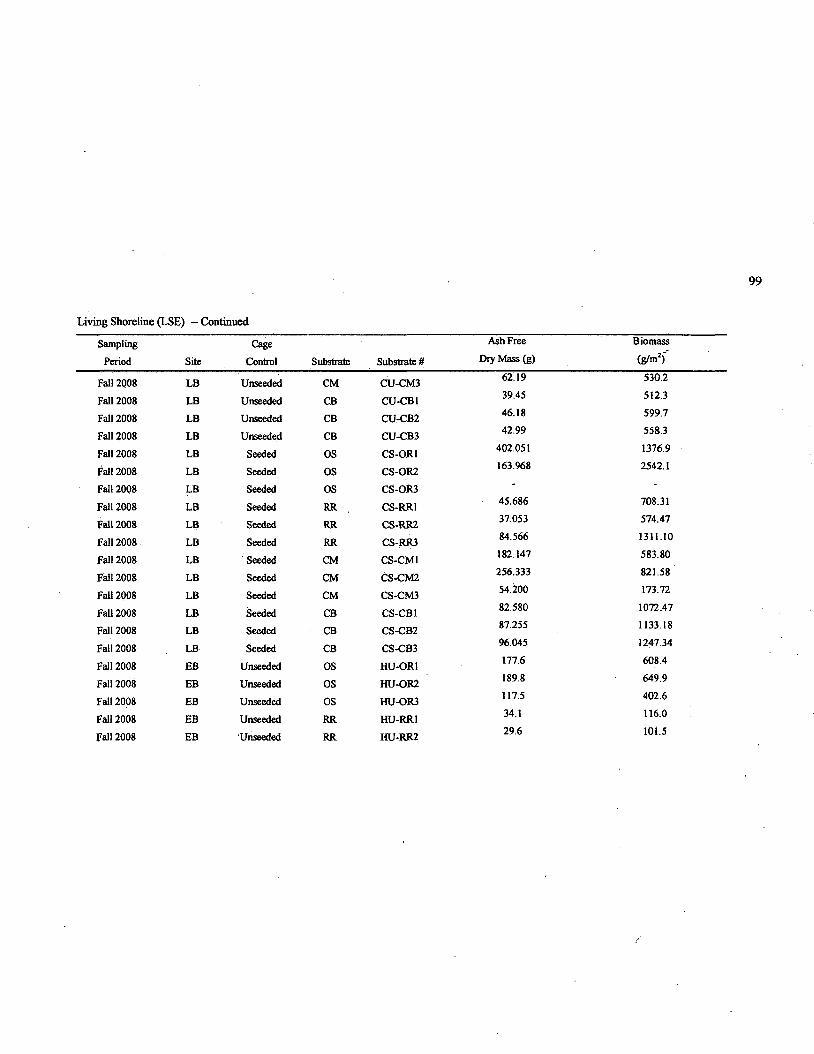
Living Shoreline (LSE) —Continued
Sampling
Period Site
Cage
Control Substrate Substrate#
Ash Free
Dry Mass (g)
Biomass
(grin2)'
Fall 2008 LB Unseeded CM CU-CM3 62.19 530.2
Fall 2008 LB Unseeded CB CU-CB1 39.45 512,3
Fall 2008 LB Unseeded CB CU-CB2 46.18 599.7
Fall 2008 LB Unseeded CB CU-CB3 42.99 558.3
Fall 2008 LB Seeded OS CS-OR1 402.051 1376.9
Fall 2008 LB Seeded OS CS-OR2 163.968 2542.1
Fall 2008 LB Seeded OS CS-OR3 ■ -
Fall 2008 LB Seeded RR CS-RR1 45.686 708.31
Fall 2008 LB Seeded RR CS-RR2 37.053 574.47
Fall 2008 LB Seeded RR CS-RR3 84.566 1311.10
Fall 2008 LB Seeded CM CS-CM1 182.147 583.80
Fall 2008 LB Seeded CM CS-CM2 256.333 821.58
Fall 2008 LB Seeded CM CS-CM3 54.200 173.72
Fall 2008 LB Seeded CB CS-CB1 82.580 1072.47
Fall 2008 LB Seeded CB CS-CB2 87.255 1133.18
Fall 2008 LB Seeded CB CS-CB3 96.045 1247.34
Fall 2008 EB Unseeded OS HU-OR1 177.6 608.4
Fall 2008 EB Unseeded OS HU-OR2 189.8 649.9
Fall 2008 EB Unseeded OS HU-OR3 117.5 402.6
Fall 2008 EB Unseeded RR HU-RR1 34.1 116.0
Fall 2008 EB 'Unseeded RR HU-RR2 29.6 101.5
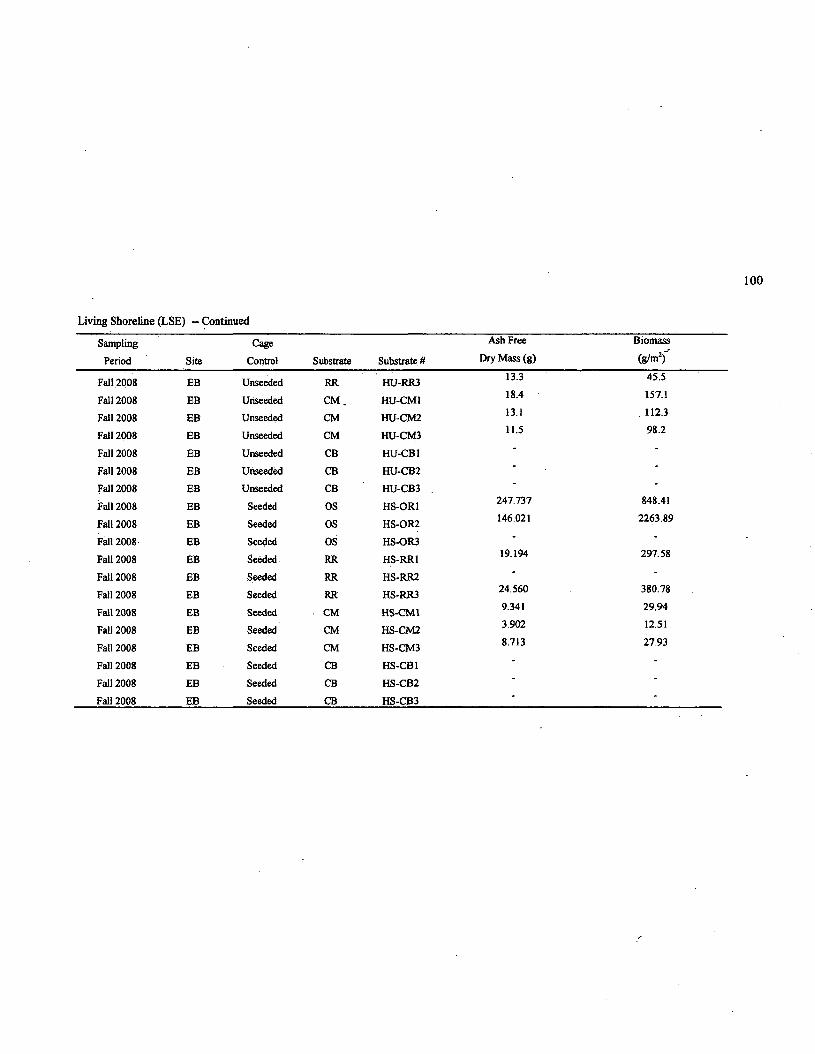
100
Living Shoreline (LSE) - Continued
Sampling
Period Site
Cage
Control Substrate Substrate#
Ash Free
Dry Mass (g)
Biomass
(g/m2)
Fall 2008 EB Unseeded RR HU-RR3 13.3 45.5
Fall 2008 EB Unseeded C M . HU-CM1 18.4 157.1
Fall 2008 EB Unseeded CM HU-CM2 13.1 . 112.3
Fall 2008 EB Unseeded CM HU-CM3 11.5 98.2
Fall 2008 EB Unseeded CB HU-CB1 ' "
Fall 2008 EB Unseeded CB HU-CB2 “
Fall 2008 EB Unseeded CB HU-CB3 “ *
Fall 2008 EB Seeded OS HS-OR1 247.737 848.41
Fall 2008 EB Seeded OS HS-OR2 146.021 2263.89
Fall 2008 EB Seeded OS HS-OR3 ■ ■
Fall 2008 EB Seeded RR HS-RRl19.194 297.58
Fall 2008 EB Seeded RR HS-RR2 ■ "
Fall 2008 EB Seeded RR HS-RR3 24.560 380.78
Fall 2008 EB Seeded • CM HS-CM1 9.341 29.94
Fall 2008 EB Seeded CM HS-CM2 3.902 12.51
Fall 2008 EB Seeded CM HS-CM3 8.713 27.93
Fall 2008 EB Seeded CB HS-CB1 “ “
Fall 2008 EB Seeded CB HS-CB2 •
Fall 2008 EB Seeded CB HS-CB3 “
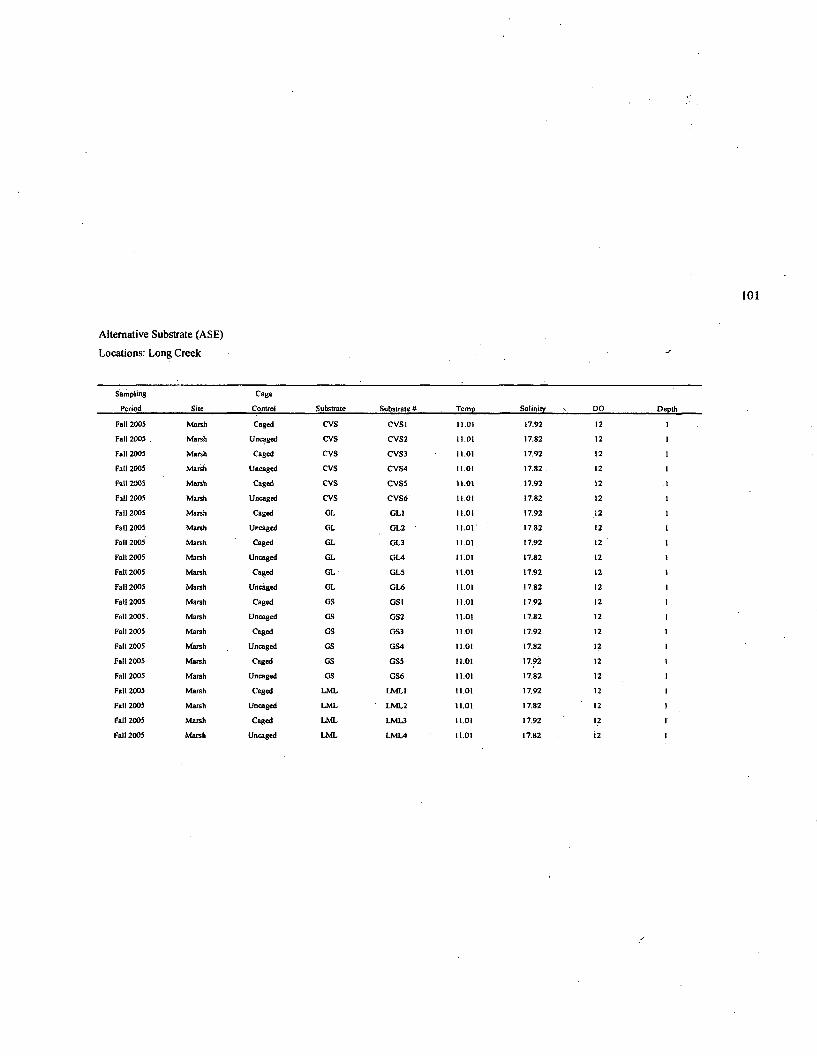
Alternative Substrate (ASE)
Locations: Long Creek
S a m p l i n g
P e r i o d S i t e
C a g e
C o n t r o l S u b s t r a t e S u b s t r a t e # T e m o S a l i n i t y ' D O D e o t h
F a l l 2 0 0 5 M a r s h C a g e d C V S C V S 1 1 1 .0 1 1 7 .9 2 1 2
F a l l 2 0 0 5 . M a r s h U n c a g e d C V S C V S 2 1 1 .0 1 1 7 .8 2 1 2
F a l l 2 0 0 5 M a r s h C a g e d C V S C V S 3 1 1 .0 1 1 7 .9 2 1 2
F a l l 2 0 0 5 M a r s h U n c a g e d C V S C V S 4 1 1 .0 1 1 7 .8 2 1 2
F a l l 2 0 0 5 M a r s h C a g e d C V S C V S 5 1 1 .0 1 1 7 .9 2 1 2 .1
F a l l 2 0 0 5 M a r s h U n c a g e d C V S C V S 6 1 1 .0 1 1 7 .8 2 1 2
F a l l 2 0 0 5 M a r s h C a g e d G L G L 1 1 1 .0 1 1 7 .9 2 1 2
F a l l 2 0 0 5 M a r s h U n c a g e d G L G L 2 1 1 .0 1 1 7 .8 2 1 2
F a l l 2 0 0 5 M a r s h C a g e d G L G L 3 1 1 .0 1 1 7 .9 2 1 2
F a l l 2 0 0 5 M a r s h U n c a g e d G L G L 4 1 1 .0 1 1 7 .8 2 1 2
F a l l 2 0 0 5 M a r s h C a g e d G L G L 5 11.01 1 7 . 9 2 1 2 1
F a l l 2 0 0 5 M a r s h U n c a g e d G L G L 6 1 1 .0 1 1 7 .8 2 1 2
F a l l 2 0 0 5 M a r s h C a g e d G S G S 1 11.01 1 7 .9 2 1 2
F a l l 2 0 0 5 . M a r s h U n c a g e d G S G S 2 11.01 1 7 . 8 2 . 1 2
F a l l 2 0 0 5 M a r s h C a g e d G S G S 3 1 1 .0 1 1 7 .9 2 1 2
F a l l 2 0 0 5 M a r s h U n c a g e d G S G S 4 1 1 .0 1 1 7 .8 2 1 ?
F a l l 2 0 0 5 M a r s h C a g e d G S G S 5 1 1 .0 1 1 7 .9 2 12 1
F a l l 2 0 0 5 M a r s h U n c a g e d G S G S 6 1 1 .0 1 1 7 .8 2 1 2
F a l l 2 0 0 5 M a r s h C a g e d L M L L M L 1 11.01 1 7 .9 2 12 1
F a l l 2 0 0 5 M a r s h U n c a g e d L M L L M L 2 1 1 .0 1 1 7 .8 2 1 2 1
F a l l 2 0 0 5 M a r s h C a g e d L M L L M L 3 11.01 1 7 .9 2 1 2 1
F a l l 2 0 0 5 M a r s h U n c a g e d L M L L M L 4 11.01 1 7 .8 2 1 2 1
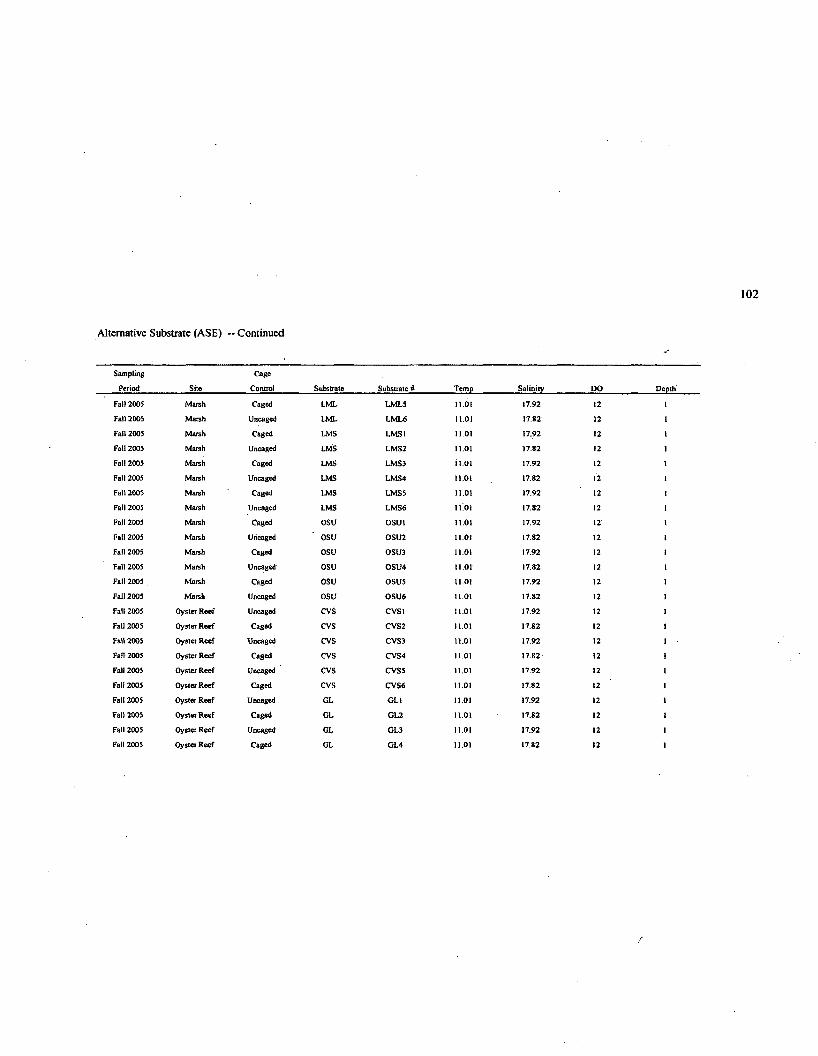
Alternative Substrate (ASE) -- Continued
S a m p l i n g
P e r io d S i t e
C a g e
C o n t r o l S u b s t r a t e S u b s t r a t e # T e m p S a l i n i t y D O D e p t h
F a l l 2 0 0 5 M a r s h C a g e d L M L L M L 5 1 1 .0 1 1 7 .9 2 12
F a i l 2 0 0 5 M a r s h U n c a g e d L M L L M L 6 1 1 .0 1 1 7 .8 2 1 2
F a l l 2 0 0 5 M a r s h C a g e d L M S L M S ! 1 1 .0 1 1 7 .9 2 1 2
F a l l 2 0 0 5 M a r s h U n c a g e d L M S L M S 2 1 1 .0 1 1 7 .8 2 1 2
F a l l 2 0 0 5 M a r s h C a g e d L M S L M S 3 1 1 .0 1 1 7 .9 2 1 2 1
F a l l 2 0 0 5 M a r s h U n c a g e d L M S L M S 4 1 1 .0 1 1 7 .8 2 1 2
F a l l 2 0 0 5 M a r s h C a g e d L M S L M S 5 1 1 .0 1 1 7 .9 2 1 2
F a l l 2 0 0 5 M a r s h U n c a g e d L M S L M S 6 1 L 0 1 1 7 .8 2 1 2
F a l l 2 0 0 5 M a r s h C a g e d O S U O S U 1 1 1 .0 1 1 7 .9 2 1 2 I
F a l l 2 0 0 5 M a r s h U n c a g e d O S U O S U 2 1 1 .0 1 1 7 .8 2 1 2
F a l l 2 0 0 5 M a r s h C a g e d O S U O S U 3 1 1 .0 1 1 7 .9 2 1 2
F a l l 2 0 0 5 M a r s h U n c a g e d O S U O S U 4 1 1 .0 1 1 7 .8 2 1 2
F a l l 2 0 0 5 M a r s h C a g e d O S U O S U 5 1 1 .0 1 1 7 .9 2 1 2
F a l l 2 0 0 5 M a r s h U n c a g e d O S U O S U 6 1 1 .0 1 1 7 .8 2 1 2
F a l l 2 0 0 5 O y s t e r R e e f U n c a g e d C V S C V S 1 1 1 .0 1 1 7 .9 2 1 2
F a l l 2 0 0 5 O y s t e r R e e f C a g e d C V S C V S 2 11.01 1 7 .8 2 1 2 1
F a l l 2 0 0 5 O y s t e r R e e f U n c a g e d C V S C V S 3 1 1 .0 1 1 7 .9 2 1 2
F a l l 2 0 0 5 O y s t e r R e e f C a g e d C V S C V S 4 11.01 1 7 .8 2 1 2 1
F a l l 2 0 0 5 O y s t e r R e e f U n c a g e d C V S C V S 5 1 1 .0 1 1 7 .9 2 1 2 1
F a l l 2 0 0 5 O y s t e r R e e f C a g e d C V S C V S 6 1 1 .0 1 1 7 .8 2 1 2 1
F a l l 2 0 0 5 O y s t e r R e e f U n c a g e d G L G L 1 1 1 .0 1 1 7 .9 2 1 2 1
F a l l 2 0 0 5 O y s t e r R e e f C a g e d G L G L 2 11.01 1 7 .8 2 1 2 1
F a l l 2 0 0 5 O y s t e r R e e f U n c a g e d G L G L 3 11.01 1 7 .9 2 1 2 1
F a l l 2 0 0 5 O y s t e r R e e f C a g e d G L G L 4 1 1 .0 1 1 7 .8 2 1 2 1
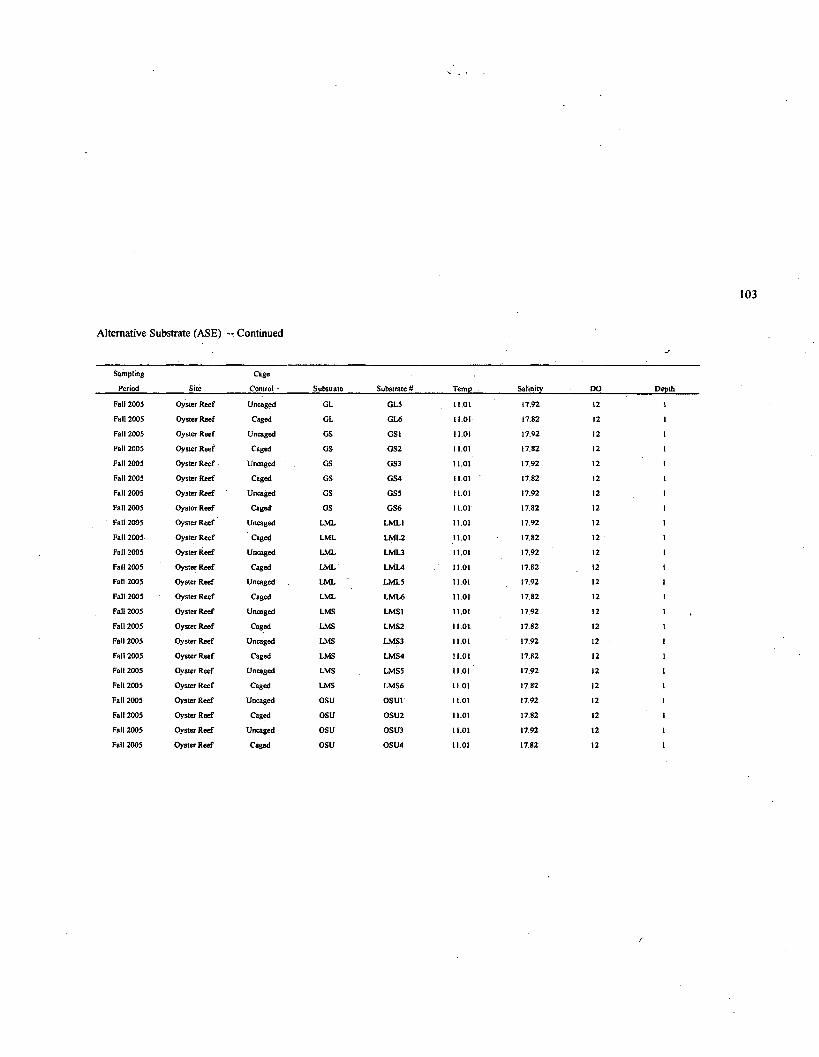
Alternative Substrate (ASE) — Continued
S a m p l i n g
P e r io d S i t e
C a g e
C o n t r o l • S u b s t r a t e S u b s t r a t e # T e m p S a l i n i t y D O D e p t h
F a l l 2 0 0 5 O y s t e r R e e f U n c a g e d G L G L 5 1 1 .0 1 1 7 .9 2 1 2 1
F a l l 2 0 0 5 O y s t e r R e e f C a g e d G L G L 6 1 1 .0 1 1 7 .8 2 12
F a l l 2 0 0 5 O y s t e r R e e f U n c a g e d G S G S t 1 1 .0 1 1 7 .9 2 1 2
F a l l 2 0 0 5 O y s t e r R e e f C a g e d G S G S 2 1 1 .0 1 1 7 .8 2 1 2
F a l l 2 0 0 5 O y s t e r R e e f U n c a g e d G S G S 3 1 1 .0 1 1 7 .9 2 1 2
F a l l 2 0 0 5 O y s t e r R e e f C a g e d G S G S 4 1 1 .0 1 1 7 .8 2 1 2 1
F a l l 2 0 0 5 O y s t e r R e e f U n c a g e d G S G S 5 1 1 .0 1 1 7 .9 2 1 2
F a l l 2 0 0 5 O y s t e r R e e f C a g e d G S G S 6 1 1 .0 1 1 7 .8 2 1 2
F a l l 2 0 0 5 O y s t e r R e e f U n c a g e d L M L L M L 1 1 1 .0 1 1 7 .9 2 1 2
F a l l 2 0 0 5 O y s t e r R e e f C a g e d L M L L M L 2 1 1 .0 1 1 7 .8 2 1 2 1
F a l l 2 0 0 5 O y s t e r R e e f U n c a g e d L M L L M L 3 1 1 .0 1 1 7 .9 2 1 2
F a i l 2 0 0 5 O y s t e r R e e f C a g e d L M L L M L 4 1 1 .0 1 1 7 .8 2 1 2
F a l l 2 0 0 5 O y s t e r R e e f U n c a g e d L M L ' L M L 5 1 1 .0 1 1 7 ,9 2 1 2
F a l l 2 0 0 5 O y s t e r R e e f C 8 g e d L M L L M L 6 1 1 .0 1 1 7 .8 2 1 2
F a l l 2 0 0 5 O y s t e r R e e f U n c a g e d L M S L M S l 1 1 .0 1 1 7 .9 2 1 2
F a l l 2 0 0 5 O y s t e r R e e f C a g e d L M S L M S 2 1 1 .0 1 1 7 .8 2 1 2
F a l l 2 0 0 5 O y s t e r R e e f U n c a g e d L M S L M S 3 1 1 .0 1 1 7 .9 2 1 2 I
F a l l 2 0 0 5 O y s t e r R e e f C a g e d L M S L M S 4 1 1 .0 1 1 7 .8 2 1 2
F a i l 2 0 0 5 O y s t e r R e e f U n c a g e d L M S L M S 5 1 1 .0 1 1 7 .9 2 1 2 I
F a l l 2 0 0 5 O y s t e r R e e f C a g e d L M S L M S 6 1 1 .0 1 1 7 .8 2 1 2 1
F a l l 2 0 0 5 O y s t e r R e e f U n c a g e d O S U O S U 1 1 1 .0 1 1 7 .9 2 1 2 1
F a l l 2 0 0 5 O y s t e r R e e f C a g e d O S U O S U 2 1 1 .0 1 1 7 .8 2 1 2 I
F a l l 2 0 0 5 O y s t e r R e e f U n c a g e d O S U 0 S U 3 1 1 .0 1 1 7 ,9 2 1 2 1
F a l l 2 0 0 5 O y s t e r R e e f C a g e d O S U O S U 4 1 1 .0 1 1 7 .8 2 1 2 1
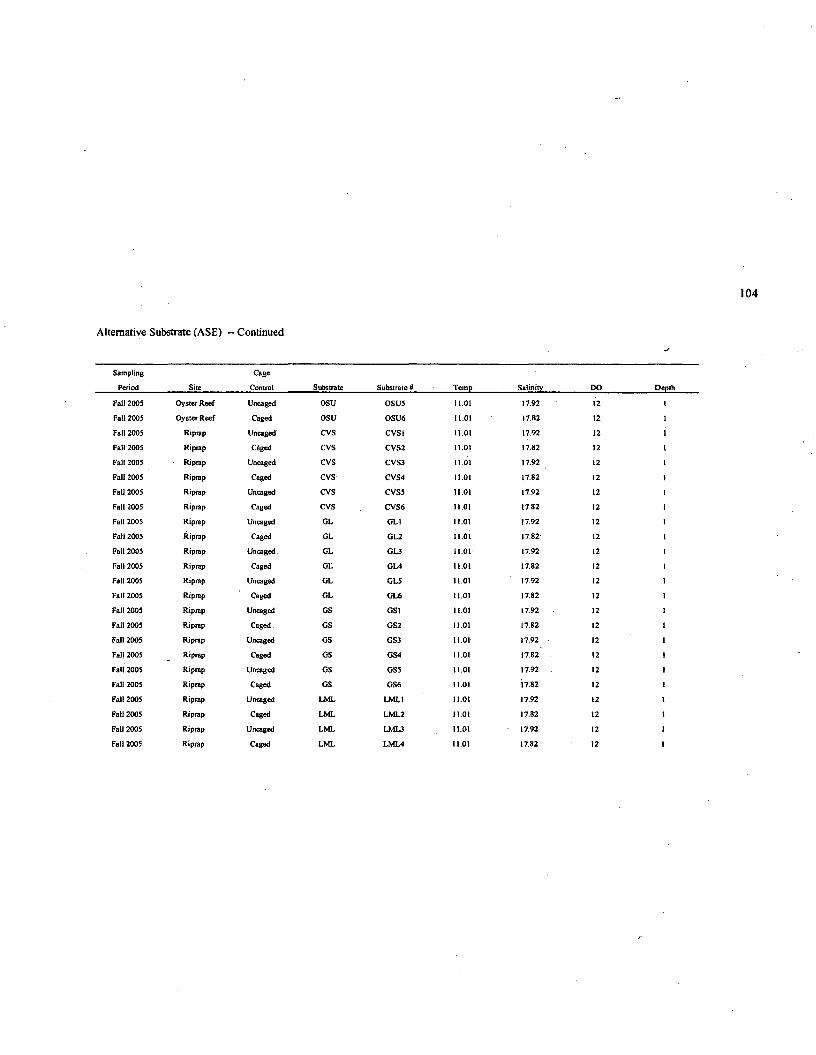
Alternative Substrate (ASE) - Continued
S a m p l i n g
P e r io d S i te
C a g e
C o n t r o l S u b s t r a t e S u b s t r a t e # T e m p S a l i n i t y DO D e p t h
F a l l 2 0 0 5 O y s t e r R e e f U n c a g e d O S U O S U 5 11.01 1 7 .9 2 1 2 I
F a l l 2 0 0 5 O y s t e r R e e f C a g e d O S U O S U 6 11.01 1 7 .8 2 1 2 1
F a l l 2 0 0 5 R i p r a p U n c a g e d C V S C V S I 11.01 1 7 .9 2 1 2
F a l l 2 0 0 5 R i p r a p C a g e d C V S C V S 2 1 1 .0 1 1 7 .8 2 1 2 1
F a l l 2 0 0 5 R i p r a p U n c a g e d C V S C V S 3 1 1 .0 1 1 7 .9 2 1 2
F a l l 2 0 0 5 R i p r a p C a g e d C V S C V S 4 1 1 .0 1 1 7 .8 2 12
F a l l 2 0 0 5 R i p r a p U n c a g e d C V S C V S 5 1 1 .0 1 1 7 .9 2 12
F a l l 2 0 0 5 R i p r a p C a g e d C V S C V S 6 1 1 .0 1 1 7 .8 2 1 2
F a l l 2 0 0 5 R i p r a p U n c a g e d G L G L 1 1 1 .0 1 1 7 .9 2 1 2
F a l l 2 0 0 5 R i p r a p C a g e d G L G L 2 i i .o i 1 7 .8 2 12
F a l l 2 0 0 5 R i p r a p U n c a g e d G L G L 3 1 1 .0 1 1 7 .9 2 12
F a l l 2 0 0 5 R i p r a p C a g e d G L G L 4 1 1 .0 1 1 7 .8 2 1 2
F a t ! 2 0 0 5 R i p r a p U n c a g e d G L G L 5 1 1 .0 1 1 7 .9 2 1 2
F a l l 2 0 0 5 R i p r a p C a g e d G L G L 6 1 1 .0 1 1 7 .8 2 1 2
F a i t 2 0 0 5 R i p r a p U n c a g e d G S G S 1 1 1 .0 1 1 7 .9 2 1 2 1
F a l l 2 0 0 5 R i p r a p C a g e d . G S G S 2 11.01 1 7 .8 2 1 2 1
F a l l 2 0 0 5 R i p r a p U n c a g e d G S G S 3 1 1 .0 1 1 7 .9 2 1 2 1
F a l l 2 0 0 5 R i p r a p C a g e d G S G S 4 11.01 1 7 .8 2 . 1 2 1
F a l l 2 0 0 5 R i p r a p U n c a g e d G S G S 5 1 1 .0 1 1 7 .9 2 1 2
F a l l 2 0 0 5 R i p r a p C a g e d G S G S 6 11.01 1 7 .8 2 12 I
F a l l 2 0 0 5 R i p r a p U n c a g e d L M L L M L 1 11.01 1 7 .9 2 1 2 1
F a l l 2 0 0 5 R i p r a p C a g e d L M L L M L 2 1 1 .0 1 1 7 .8 2 1 2 1
F a l l 2 0 0 5 R i p r a p U n c a g e d L M L L M L 3 1 1 .0 1 1 7 .9 2 1 2 1
F a l l 2 0 0 5 R i p r a p C a g e d L M L L M L 4 1 1 .0 1 1 7 .8 2 1 2 1
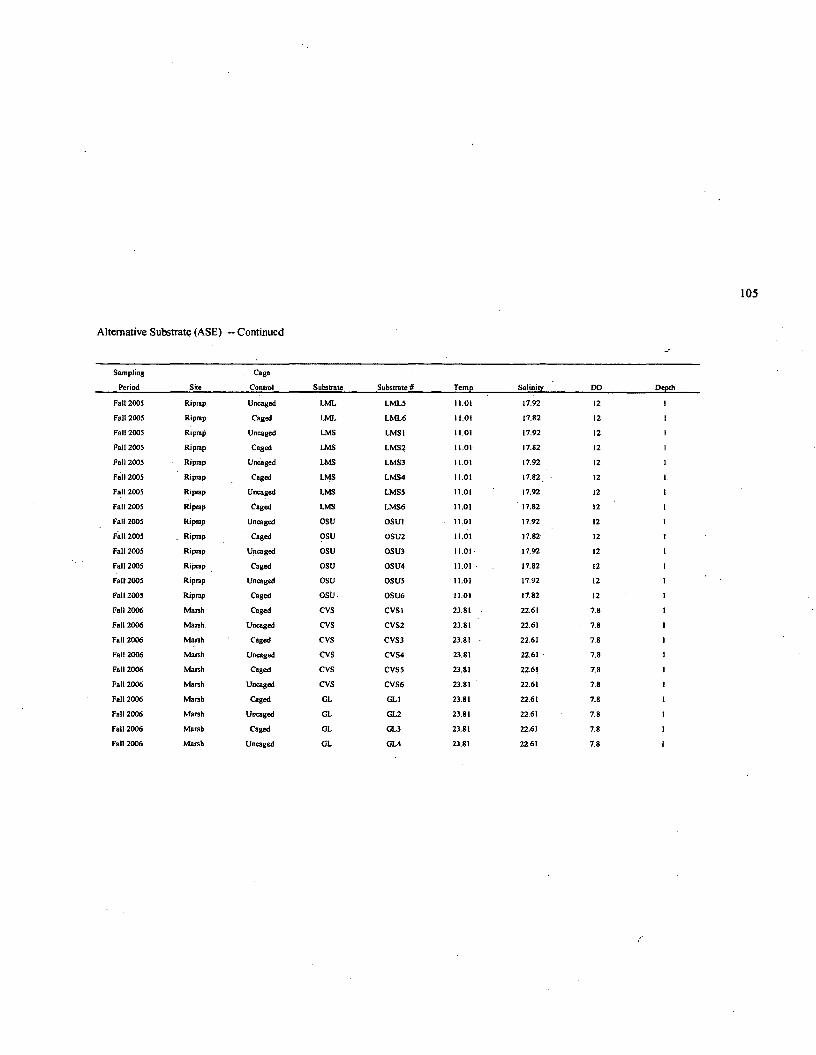
Alternative Substrate (ASE) — Continued
S a m p l i n g
P e r i o d S i te
C a g e
C o n t r o l S u b s t r a t e S u b s t r a t e # T e m p S a l i n i t y D O D e p t h
F a i l 2 0 0 5 ' R i p r a p U n c a g e d L M L L M L 5 1 1 .0 1 1 7 .9 2 12
F a l l 2 0 0 5 R i p r a p C a g e d L M L L M L 6 1 1 .0 1 1 7 .8 2 1 2
F a l l 2 0 0 5 R i p r a p U n c a g e d L M S L M S 1 1 1 .0 1 1 7 .9 2 1 2
F a l l 2 0 0 5 R i p r a p C a g e d L M S L M S 2 1 1 .0 1 1 7 .8 2 12
F a l l 2 0 0 5 R i p r a p U n c a g e d L M S L M S 3 1 1 .0 1 1 7 .9 2 12
F a l l 2 0 0 5 R i p r a p C a g e d L M S L M S 4 1 1 .0 1 1 7 .8 2 12 1
F a l l 2 0 0 5 R i p r a p U n c a g e d L M S L M S 5 1 1 .0 1 1 7 .9 2 12 t
F a l l 2 0 0 5 R i p r a p C a g e d L M S L M S 6 1 1 .0 1 1 7 .8 2 12
F a l l 2 0 0 5 R i p r a p U n c a g e d O S U O S U 1 1 1 .0 1 1 7 .9 2 12
F a l l 2 0 0 5 _ R i p r a p C a g e d O S U O S U 2 1 1 .0 1 1 7 .8 2 1 2
F a l l 2 0 0 5 R i p r a p U n c a g e d O S U O S U 3 1 1 .0 1 1 7 .9 2 12
F a l l 2 0 0 5 R i p r a p C a g e d O S U O S U 4 1 1 .0 1 1 7 .8 2 12 1
F a l l 2 0 0 5 R i p r a p U n c a g e d O S U O S U 5 1 1 .0 1 1 7 .9 2 12 1
F a l l 2 0 0 5 R i p r a p C a g e d O S U O S U 6 1 1 .0 1 1 7 .8 2 12 1
F a l l 2 0 0 6 M a r s h C a g e d C V S C V S I 2 3 .8 1 ■ 2 2 . 6 ! 7 .8 1
F a l l 2 0 0 6 M a r s h . U n c a g e d C V S C V S 2 2 3 .8 1 2 2 .6 1 7 .8 1
F a l l 2 0 0 6 M a r s h C a g e d C V S C V S 3 2 3 .8 1 ■ 2 2 .6 1 7 .8 1
F a l l 2 0 0 6 M a r s h U n c a g e d C V S C V S 4 2 3 .8 1 2 2 .6 1 7 .8 1
F a l l 2 0 0 6 M a r s h C a g e d C V S C V S 5 2 3 .8 1 2 2 .6 1 7 .8 1
F a l l 2 0 0 6 M a r s h U n c a g e d C V S C V S 6 2 3 .8 1 2 2 .6 1 7 .8 1
F a l l 2 0 0 6 M a r s h C a g e d G L G L 1 2 3 .8 1 2 2 .6 1 7 .8 1
F a l l 2 0 0 6 M a r s h U n c a g e d G L G L 2 2 3 .8 1 2 2 .6 1 7 .8 1
F a i l 2 0 0 6 M a r s h C a g e d G L G L 3 2 3 .8 1 2 2 .6 1 7 .8 1
F a l l 2 0 0 6 M a r s h U n c a g e d G L G L 4 2 3 .8 1 2 2 .6 1 7 .8 I
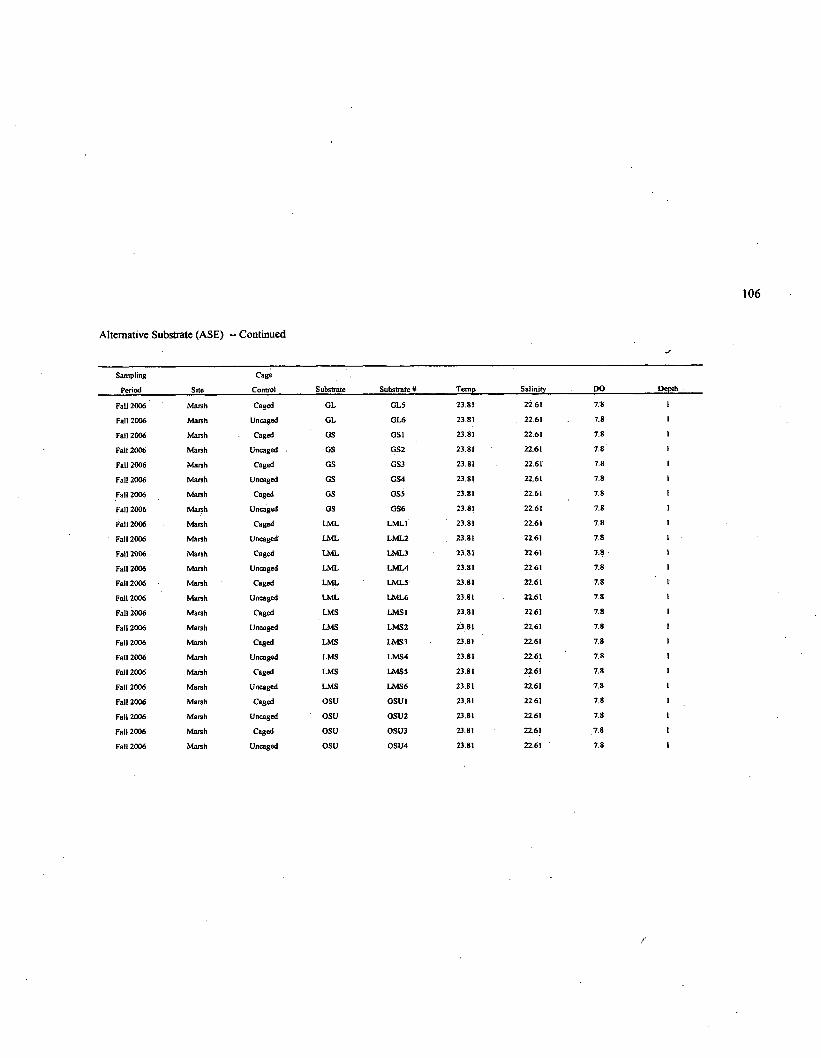
Alternative Substrate (ASE) -- Continued
S a m p l i n g
P e r io d S i t e
C a g e
C o n t r o l S u b s t r a t e S u b s t r a t e # T e m p S a l i n i t y DO D e p t h
F a l l 2 0 0 6 M a r s h C a g e d G L G L 5 2 3 .8 1 2 2 .6 1 7 .8
F a l l 2 0 0 6 M a r s h U n c a g e d G L G L 6 2 3 .8 1 2 2 .6 1 7 .8
F a l l 2 0 0 6 M a r s h C a g e d G S G S 1 2 3 .8 1 2 2 .6 1 7 .8
F a l l 2 0 0 6 M a r s h U n c a g e d • G S G S 2 2 3 .8 1 2 2 .6 1 7 .8
F a l l 2 0 0 6 M a r s h C a g e d G S G S 3 2 3 .8 1 2 2 .6 1 7 .8 1
F a l l 2 0 0 6 M a r s h U n c a g e d G S G S 4 2 3 .8 1 2 2 .6 1 7 .8 1
F a l l 2 0 0 6 M a r s h C a g e d G S G S 5 2 3 .8 1 2 2 .6 1 7 .8
F a l l 2 0 0 6 M a r s h U n c a g e d G S G S 6 2 3 .8 1 2 2 .6 1 7 .8 1
F a l l 2 0 0 6 M a r s h C a g e d L M L L M L 1 2 3 .8 1 2 2 .6 1 7 .8 I
F a l l 2 0 0 6 M a r s h U n c a g e d L M L L M L 2 2 3 .8 1 2 2 .6 1 7 .8
F a l l 2 0 0 6 M a r s h C a g e d L M L L M L 3 2 3 .8 1 2 2 .6 1 7 . 8 1
F a l l 2 0 0 6 M a r s h U n c a g e d L M L L M L 4 2 3 .8 1 2 2 .6 1 7 . 8
F a l l 2 0 0 6 M a r s h C a g e d L M L L M L 5 2 3 .8 1 2 2 .6 1 7 .8 1
F a l l 2 0 0 6 M a r s h U n c a g e d L M L L M L 6 2 3 .8 1 2 2 .6 1 7 . 8
F a l l 2 0 0 6 M a r s h C a g e d L M S L M S 1 2 3 .8 1 2 2 .6 1 7 .8
F a l l 2 0 0 6 M a r s h U n c a g e d L M S L M S 2 2 3 .8 1 2 2 .6 1 7 . 8
F a l l 2 0 0 6 M a r s h C a g e d L M S L M S 3 2 3 .8 1 2 2 .6 1 7 .8
F a l l 2 0 0 6 M a r s h U n c a g e d L M S L M S 4 2 3 .8 1 2 2 .6 1 7 .8
F a l l 2 0 0 6 M a r s h C a g e d L M S L M S 5 2 3 .8 1 2 2 .6 1 7 .8 1
F a l l 2 0 0 6 M a r s h U n c a g e d L M S L M S 6 2 3 .8 1 2 2 .6 1 7 . 8
F a l l 2 0 0 6 M a r s h C a g e d O S U O S U 1 2 3 .8 1 2 2 .6 1 7 . 8
F a l l 2 0 0 6 M a r s h U n c a g e d O S U O S U 2 2 3 .8 1 2 2 .6 1 7 .8 1
F a l l 2 0 0 6 M a r s h C a g e d O S U 0 S U 3 2 3 .8 1 2 2 ,6 1 7 . 8 1
F a l l 2 0 0 6 M a r s h U n c a g e d O S U O S U 4 2 3 .8 1 2 2 .6 1 7 .8
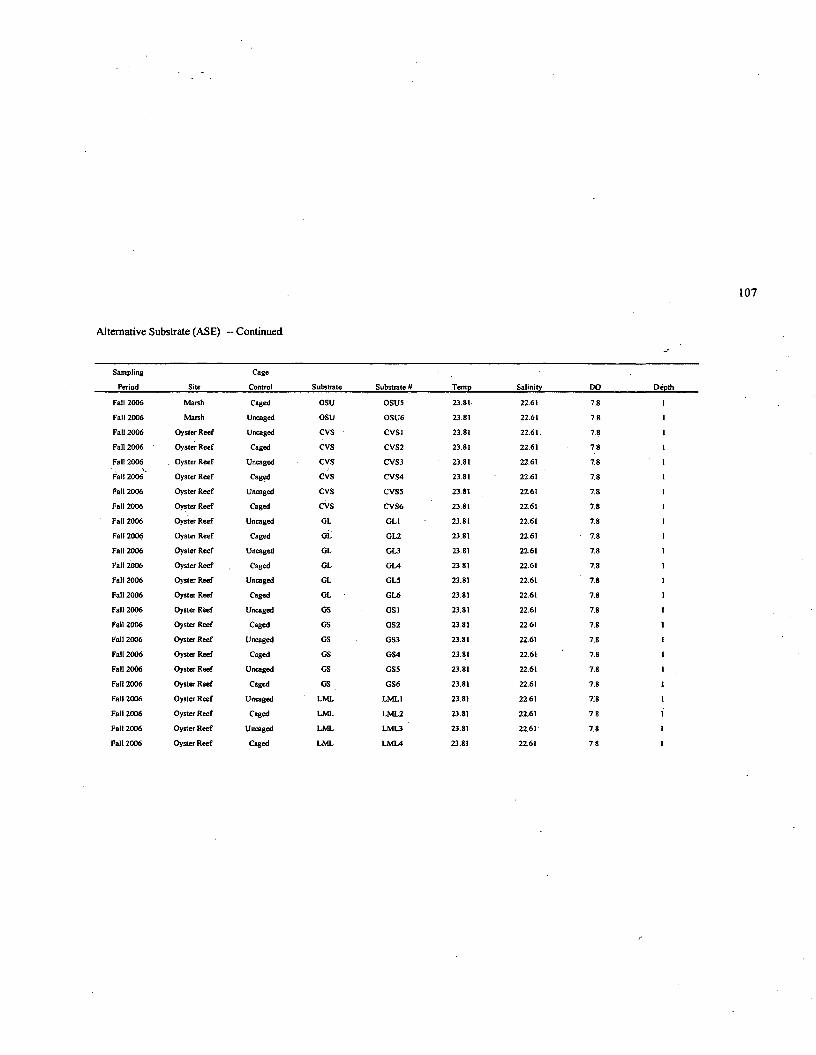
Alternative Substrate (ASE) — Continued
S a m p l i n g
P e r i o d S i t e
C a g e
C o n t r o l S u b s t r a t e S u b s t r a t e # T e m p S a l i n i t y D O D e p t h
F a i l 2 0 0 6 M a r s h C a g e d O S U O S U 5 2 3 .8 1 2 2 .6 1 7 .8
F a l l 2 0 0 6 M a r s h U n c a g e d O S U O S U 6 2 3 .8 1 2 2 .6 1 7 .8
F a l l 2 0 0 6 O y s t e r R e e f U n c a g e d C V S C V S 1 2 3 .8 1 2 2 .6 1 . 7 .8
F a l l 2 0 0 6 O y s t e r R e e f C a g e d C V S C V S 2 2 3 .8 1 2 2 .6 1 7 .8
F a l l 2 0 0 6 . O y s t e r R e e f U n c a g e d C V S C V S 3 2 3 .8 1 2 2 .6 1 7 .8
F a l l 2 0 0 6 * O y s t e r R e e f C a g e d C V S C V S 4 2 3 .8 1 2 2 .6 1 7 .8
F a l l 2 0 0 6 O y s t e r R e e f U n c a g e d C V S C V S 5 2 3 .8 1 2 2 .6 1 7 .8
F a l l 2 0 0 6 O y s t e r R e e f C a g e d C V S C V S 6 2 3 .8 1 2 2 .6 1 7 .8
F a l l 2 0 0 6 O y s t e r R e e f U n c a g e d G L G L 1 2 3 .8 1 2 2 .6 1 7 .8
F a l l 2 0 0 6 O y s t e r R e e f C a g e d G L G L 2 2 3 .8 1 2 2 .6 1 ■ 7 .8
F a l l 2 0 0 6 O y s t e r R e e f U n c a g e d G L G L 3 2 3 .8 1 2 2 .6 1 7 .8
F a l l 2 0 0 6 O y s t e r R e e f C a g e d G L G L 4 2 3 .8 1 2 2 .6 1 7 .8 1
F a l l 2 0 0 6 O y s t e r R e e f U n c a g e d G L G L 5 2 3 .8 1 2 2 .6 1 7 .8 1
F a l l 2 0 0 6 O y s te r R e e f C a g e d G L G L 6 2 3 .8 1 2 2 ,6 1 7 .8
F a l l 2 0 0 6 O y s te r R e e f U n c a g e d O S G S 1 2 3 .8 1 2 2 . 6 ! 7 .8 1
F a l l 2 0 0 6 O y s t e r R e e f C a g e d G S G S 2 2 3 .8 1 2 2 6 1 7 .8 1
F a l l 2 0 0 6 O y s t e r R e e f U n c a g e d G S G S 3 2 3 8 1 2 2 .6 1 7 .8 1
F a l l 2 0 0 6 O y s t e r R e e f C a g e d G S G S 4 2 3 .8 1 2 2 .6 1 7 .8 1
F a l l 2 0 0 6 O y s t e r R e e f U n c a g e d G S G S 5 2 3 .8 1 2 2 .6 1 7 .8 1
F a l l 2 0 0 6 O y s t e r R e e f C a g e d G S G S 6 2 3 .8 1 2 2 .6 1 7 .8 1
F a l l 2 0 0 6 O y s t e r R e e f U n c a g e d L M L L M L 1 2 3 .8 1 2 2 .6 1 T 8 1
F a l l 2 0 0 6 O y s t e r R e e f C a g e d L M L L M L 2 2 3 .8 1 2 2 .6 1 7 .8 1
F a l l 2 0 0 6 O y s t e r R e e f U n c a g e d L M L L M L 3 2 3 .8 1 2 2 .6 1 7 .8 1
F a l l 2 0 0 6 O y s t e r R e e f C a g e d L M L L M L 4 2 3 .8 1 2 2 .6 1 7 .8 1
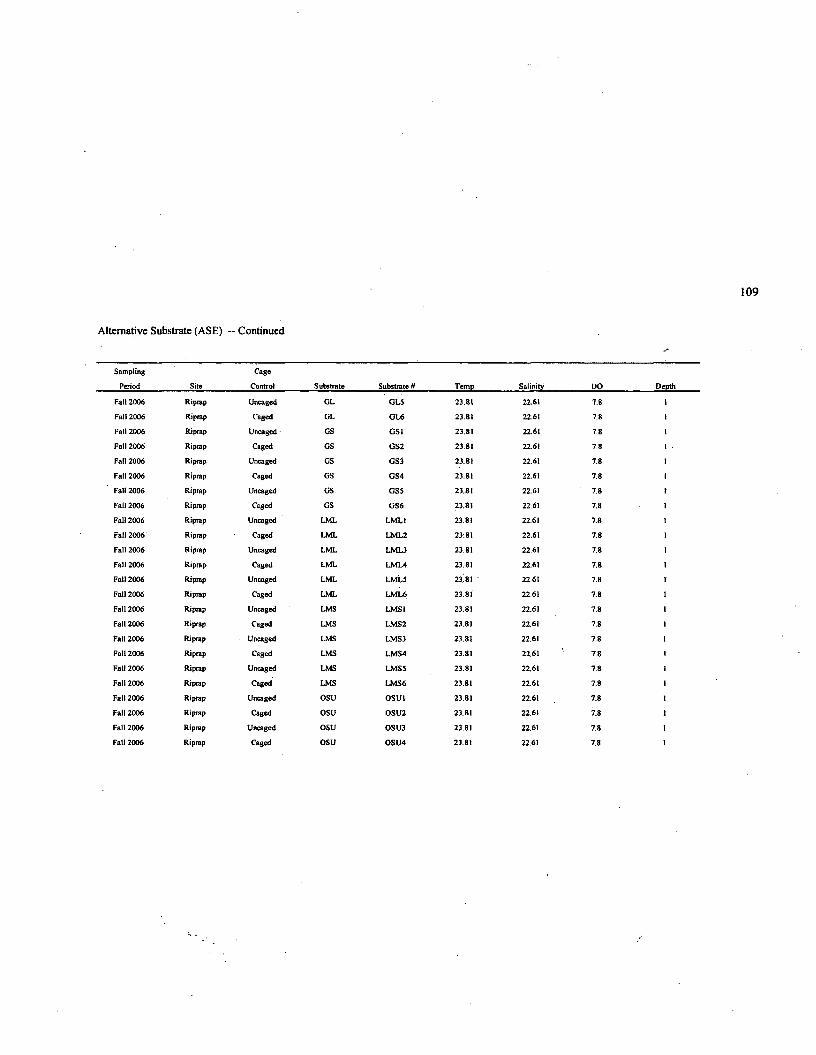
Alternative Substrate (ASE) — Continued
S a m p l i n g
P e r i o d S i t e
C a g e
C o n t r o l S u b s t r a t e S u b s t r a t e # T e m p S a l i n i t y D O D e p t h
F a l l 2 0 0 6 R i p r a p U n c a g e d G L G L 5 2 3 .8 1 2 2 .6 1 7 .8
F a l l 2 0 0 6 R i p r a p C a g e d G L G L 6 2 3 .8 1 2 2 ,6 1 7 .8
F a l l 2 0 0 6 R i p r a p U n c a g e d G S G S 1 2 3 .8 1 2 2 .6 1 7 .8
F a l l 2 0 0 6 R i p r a p C a g e d G S G S 2 2 3 .8 1 2 2 .6 1 7 .8
F a l l 2 0 0 6 R i p r a p U n c a g e d G S G S 3 2 3 .8 1 2 2 .6 1 7 .8
F a l l 2 0 0 6 R i p r a p C a g e d G S G S 4 2 3 .8 1 2 2 .6 1 7 .8
F a l l 2 0 0 6 R i p r a p U n c a g e d G S G S 5 2 3 .8 1 2 2 .6 1 7 .8 1
F a l l 2 0 0 6 R i p r a p C a g e d G S G S 6 2 3 .8 1 2 2 .6 1 7 .8
F a l l 2 0 0 6 R i p r a p U n c a g e d L M L L M L ! 2 3 .8 1 2 2 .6 1 7 .8
F a l l 2 0 0 6 R i p r a p C a g e d L M L L M L 2 2 3 .8 1 2 2 .6 1 7 .8
F a l l 2 0 0 6 R i p r a p U n c a g e d L M L L M L 3 2 3 .8 1 2 2 .6 1 7 .8
F a l l 2 0 0 6 R i p r a p C a g e d L M L L M L 4 2 3 .8 1 2 2 .6 1 7 .8
F a l l 2 0 0 6 R i p r a p U n c a g e d L M L L M L 5 2 3 - 8 1 ' 2 2 .6 1 7 .8 1
F a l l 2 0 0 6 R i p r a p C a g e d L M L L M L 6 2 3 .8 1 2 2 .6 1 7 .8
F a l l 2 0 0 6 R i p r a p U n c a g e d L M S L M S ! 2 3 .8 1 2 2 .6 1 7 .8
F a l l 2 0 0 6 R i p r a p C a g e d L M S L M S 2 2 3 .8 1 2 2 .6 1 7 .8 1
F a l l 2 0 0 6 R i p r a p U n c a g e d L M S L M S 3 2 3 .8 1 2 2 .6 1 7 .8 1
F a l l 2 0 0 6 R i p r a p C a g e d L M S L M S 4 2 3 .8 1 2 2 .6 1 7 .8 I
F a l l 2 0 0 6 R i p r a p U n c a g e d L M S L M S 5 2 3 .8 1 2 2 .6 1 7 .8 1
F a l l 2 0 0 6 R i p r a p C a g e d L M S L M S 6 2 3 .8 1 2 2 .6 1 7 .8 1
F a l l 2 0 0 6 R i p r a p U n c a g e d O S U O S U 1 2 3 .8 1 2 2 .6 1 7 .8 1
F a l l 2 0 0 6 R i p r a p C a g e d O S U O S U 2 2 3 .8 1 2 2 .6 1 7 .8 1
F a l l 2 0 0 6 R i p r a p U n c a g e d O S U O S U 3 2 3 .8 1 2 2 .6 1 7 .8
F a l l 2 0 0 6 R i p r a p C a g e d O S U O S U 4 2 3 .8 1 2 2 .6 1 7 .8 1
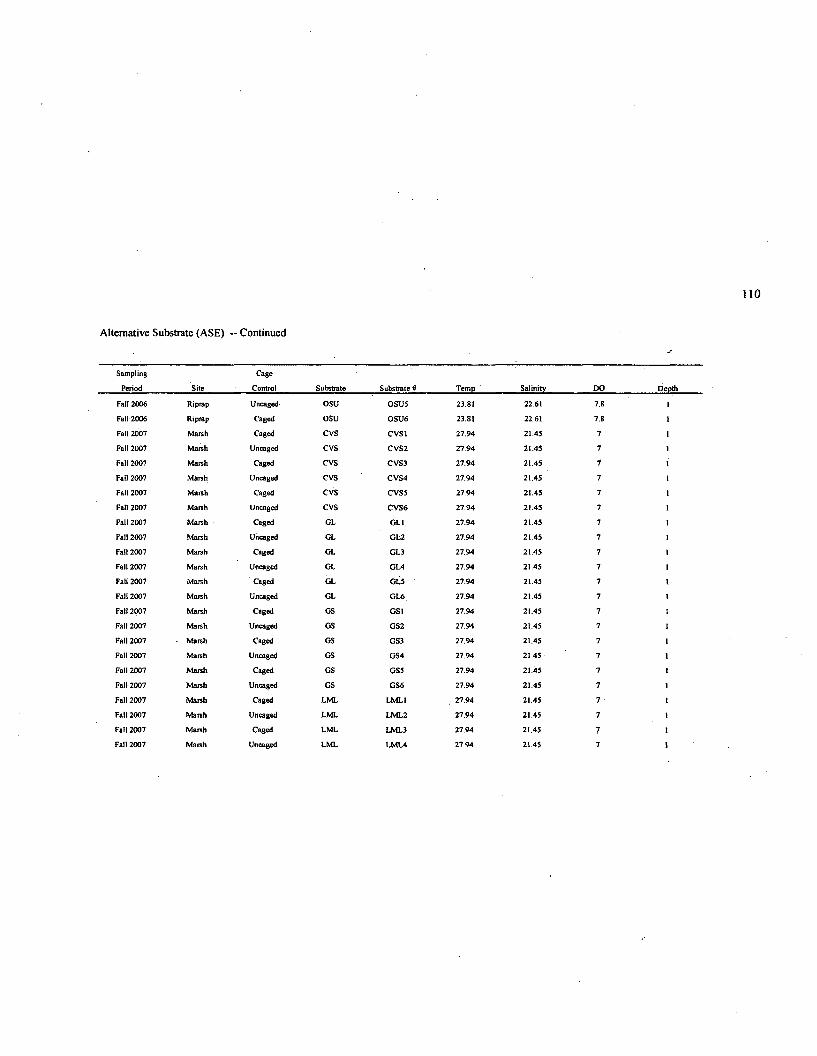
Alternative Substrate (ASE) — Continued
S a m p l i n g
P e r io d S i t e
C a g e
C o n t r o l S u b s t r a t e S u b s t r a t e # T e m p S a l i n i t y D O D e p t h
F a l l 2 0 0 6 R i p r a p U n c a g e d O S U osus 2 3 .8 1 2 2 .6 1 7 .8
F a l l 2 0 0 6 R i p r a p C a g e d O S U O S U 6 2 3 .8 1 2 2 .6 1 7 .8 1
F a l l 2 0 0 7 M a r s h C a g e d C V S C V S 1 2 7 . 9 4 2 1 .4 5 7 I
F a l l 2 0 0 7 M a r s h U n c a g e d C V S C V S 2 2 7 . 9 4 2 1 .4 5 7 I
F a l l 2 0 0 7 M a r s h C a g e d C V S C V S 3 2 7 . 9 4 2 1 .4 5 7 1
F a i l 2 0 0 7 M a r s h U n c a g e d C V S C V S 4 2 7 . 9 4 2 1 .4 5 7
F a l l 2 0 0 7 M a r s h C a g e d C V S C V S 5 2 7 .9 4 2 1 .4 5 7 1
F a l l 2 0 0 7 M a r s h U n c a g e d C V S C V S 6 2 7 . 9 4 2 1 . 4 5
F a l l 2 0 0 7 M a r s h - C a g e d G L G L 1 2 7 . 9 4 2 1 . 4 5 7
F a l l 2 0 0 7 M a r s h U n c a g e d G L G L 2 2 7 . 9 4 2 1 .4 5 7 1
F a l l 2 0 0 7 M a r s h C a g e d G L G L 3 2 7 . 9 4 2 1 .4 5 7 1
F a l l 2 0 0 7 M a r s h U n c a g e d G L G L 4 2 7 . 9 4 2 1 .4 5 7 1
F a l l 2 0 0 7 M a r s h C a g e d G L G L S 2 7 . 9 4 2 1 .4 5 7 1F a l l 2 0 0 7 M a r s h U n c a g e d G L G L 6 2 7 . 9 4 2 1 .4 5 7 1
F a l l 2 0 0 7 M a r s h C a g e d G S G S 1 2 7 .9 4 2 1 .4 5 7 IF a l l 2 0 0 7 M a r s h U n c a g e d G S G S 2 2 7 .9 4 2 1 .4 5 7 1
F a l l 2 0 0 7 M a r s h C a g e d G S G S 3 2 7 .9 4 2 1 .4 5 7 1
F a l l 2 0 0 7 M a r s h U n c a g e d G S G S 4 2 7 .9 4 2 1 .4 5 7 1
F a l l 2 0 0 7 M a r s h C a g e d G S G S 5 2 7 .9 4 2 1 .4 5 7 1
F a l l 2 0 0 7 M a r s h U n c a g e d G S G S 6 2 7 ,9 4 2 1 .4 5 7 1
F a l l 2 0 0 7 M a r s h C a g e d L M L L M L 1 . 2 7 . 9 4 2 1 .4 5 1
F a l l 2 0 0 7 M a r s h U n c a g e d L M L L M L 2 2 7 . 9 4 2 1 .4 5 7 1
F a l l 2 0 0 7 M a r s h C a g e d L M L L M L 3 2 7 .9 4 2 1 .4 5 7 1
F a l l 2 0 0 7 M a r s h U n c a g e d L M L L M L 4 2 7 . 9 4 2 1 . 4 5 7
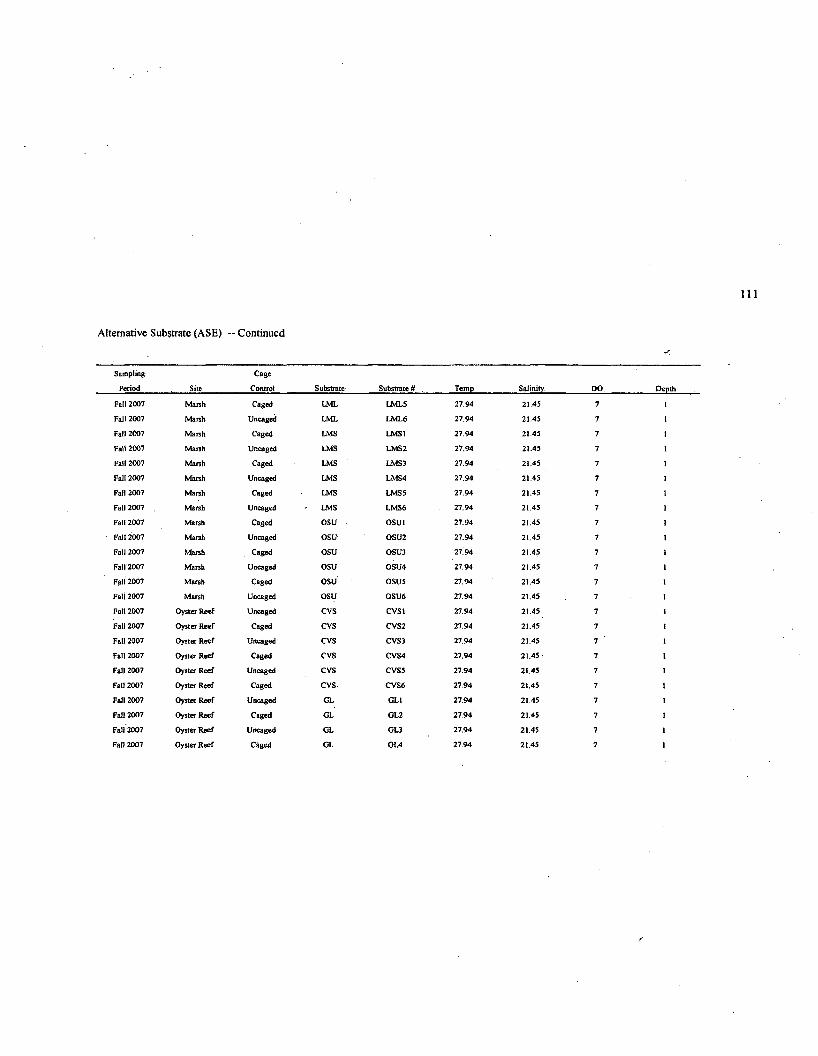
Alternative Substrate (ASE) — Continued
S a m p l i n g
P e r io d S i te
C a g e
C o n t r o l S u b s t r a t e S u b s t r a t e # . T e m p S a l i n i t y D O . D e p t h
F a l l 2 0 0 7 M a r s h C a g e d L M L L M L 5 2 7 . 9 4 2 1 .4 5 7 1
F a l l 2 0 0 7 M a r s h U n c a g e d L M L L M L 6 2 7 . 9 4 2 1 .4 5 7 1
F a l l 2 0 0 7 M a r s h C a g e d L M S L M S 1 2 7 . 9 4 2 1 .4 5 7 1
F a l l 2 0 0 7 M a r s h U n c a g e d L M S L M S 2 2 7 . 9 4 2 1 .4 5 7 1
F a l l 2 0 0 7 M a r s h C a g e d L M S L M S 3 2 7 . 9 4 2 1 .4 5 7 1
F a l l 2 0 0 7 M a r s h U n c a g e d L M S L M S 4 2 7 . 9 4 2 1 .4 5 7 1
F a l l 2 0 0 7 M a r s h C a g e d L M S L M S 5 2 7 . 9 4 2 1 .4 5 7 1
F a l l 2 0 0 7 , M a r s h U n c a g e d L M S L M S 6 2 7 .9 4 2 1 .4 5 7 I
F a l l 2 0 0 7 M a r s h C a g e d O S U O S U 1 2 7 .9 4 2 1 .4 5 7 1
F a l l 2 0 0 7 M a r s h U n c a g e d O S U O S U 2 2 7 .9 4 2 1 .4 5 7 1
F a l l 2 0 0 7 M a r s h C a g e d O S U O S U 3 2 7 9 4 2 1 .4 5 7 1
F a l l 2 0 0 7 M a r s h U n c a g e d O S U O S U 4 2 7 .9 4 2 1 .4 5 7 1
F a l l 2 0 0 7 M a r s h C a g e d O S U O S U 5 2 7 .9 4 2 1 .4 5 7 1
F a l l 2 0 0 7 M a r s h U n c a g e d O S U O S U 6 2 7 .9 4 2 1 .4 5 7 1
F a l l 2 0 0 7 O y s t e r R e e f U n c a g e d C V S C V S 1 2 7 .9 4 2 1 .4 5 7 1
F a l l 2 0 0 7 O y s t e r R e e f C a g e d C V S C V S 2 2 7 .9 4 2 1 .4 5 7 I
F a l l 2 0 0 7 O y s t e r R e e f U n c a g e d C V S C V S 3 2 7 .9 4 2 1 .4 5 7 1
F a l l 2 0 0 7 O y s t e r R e e f C a g e d C V S C V S 4 2 7 .9 4 2 1 . 4 5 - 7 I
F a l l 2 0 0 7 O y s t e r R e e f U n c a g e d C V S C V S 5 2 7 .9 4 2 1 .4 5 7 1
F a l l 2 0 0 7 O y s t e r R e e f C a g e d C V S - C V S 6 2 7 .9 4 2 1 .4 5 7 I
F a l l 2 0 0 7 O y s t e r R e e f U n c a g e d G L G L I 2 7 .9 4 2 1 .4 5 7 1
F a l l 2 0 0 7 O y s t e r R e e f C a g e d G L G L 2 2 7 . 9 4 2 1 .4 5 7 1
F a l l 2 0 0 7 O y s te r R e e f U n c a g e d G L G L 3 2 7 . 9 4 2 1 .4 5 7 1
F a l l 2 0 0 7 O y s t e r R e e f C a g e d G L G L 4 2 7 .9 4 2 1 .4 5 7 1
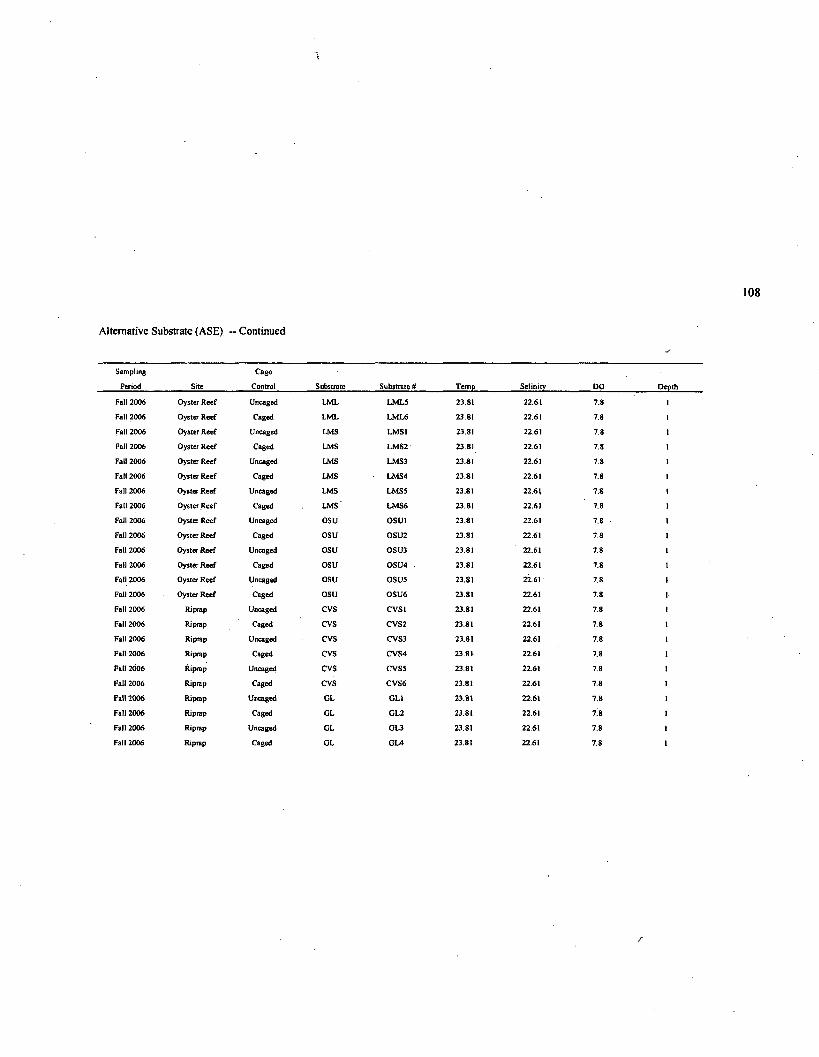
Alternative Substrate (ASE) — Continued
S a m p l i n g
P e r i o d S i t e
C a g e
C o n t r o l S u b s t r a t e S u b s t r a t e # T e m p S a l i n i t y D O
F a l l 2 0 0 6 O y s t e r R e e f U n c a g e d L M L L M L 5 2 3 .8 1 2 2 .6 1 7 .8
F a l l 2 0 0 6 O y s t e r R e e f C a g e d L M L L M L 6 2 3 .8 1 2 2 .6 1 7 .8
F a l l 2 0 0 6 O y s t e r R e e f U n c a g e d L M S L M S I 2 3 .8 1 2 2 .6 1 7 .8
F a l l 2 0 0 6 O y s t e r R e e f C a g e d L M S L M S 2 2 3 .8 1 2 2 .6 1 7 .8
F a i l 2 0 0 6 O y s te r R e e f U n c a g e d L M S L M S 3 2 3 .8 1 2 2 .6 1 7 .8
F a l l 2 0 0 6 O y s t e r R e e f C a g e d L M S L M S 4 2 3 .8 1 2 2 .6 1 7 .8
F a l l 2 0 0 6 O y s t e r R e e f U n c a g e d L M S L M S 5 2 3 .8 1 2 2 .6 1 7 *
F a l l 2 0 0 6 O y s t e r R e e f C a g e d L M S L M S 6 2 3 .8 1 2 2 .6 1 7 .8
F a l l 2 0 0 6 O y s t e r R e e f U n c a g e d O S U O S U 1 2 3 .8 1 2 2 .6 1 7 .8
F a l l 2 0 0 6 O y s t e r R e e f C a g e d O S U O S U 2 2 3 .8 1 2 2 .6 1 7 .8
F a l l 2 0 0 6 O y s t e r R e e f U n c a g e d O S U O S U 3 2 3 .8 1 2 2 .6 1 7 .8
F a l l 2 0 0 6 O y s te r R e e f C a g e d O S U O S U 4 2 3 .8 1 2 2 .6 1 7 .8
F a i l 2 0 0 6 O y s t e r R e e f U n c a g e d O S U O S U 5 2 3 .8 1 2 2 . 6 L 7 .8
F a l l 2 0 0 6 O y s t e r R e e f C a g e d O S U O S U 6 2 3 .8 1 2 2 .6 1 7 .8
F a l l 2 0 0 6 R i p r a p U n c a g e d C V S C V S 1 2 3 .8 1 2 2 .6 1 7 .8
F a l l 2 0 0 6 R i p r a p C a g e d C V S C V S 2 2 3 .8 1 2 2 .6 1 7 .8
F a l l 2 0 0 6 R i p r a p U n c a g e d C V S C V S 3 2 3 .8 1 2 2 .6 1 7 .8
F a l l 2 0 0 6 R i p r a p C a g e d C V S C V S 4 2 3 .8 1 2 2 .6 1 7 .8
F a l l 2 0 0 6 R i p r a p U n c a g e d cvs C V S 5 2 3 .8 1 2 2 .6 1 7 .8
F a l l 2 0 0 6 R i p r a p C a g e d C V S C V S 6 2 3 .8 1 2 2 .6 1 7 . 8
F a l l 2 0 0 6 R i p r a p U n c a g e d G L G L ! 2 3 .8 1 2 2 .6 1 7 . 8
F a l l 2 0 0 6 R i p r a p C a g e d G L G L 2 2 3 .8 1 2 2 .6 1 X 8
F a l l 2 0 0 6 R i p r a p U n c a g e d G L G L 3 2 3 .8 1 2 2 .6 1 7 .8
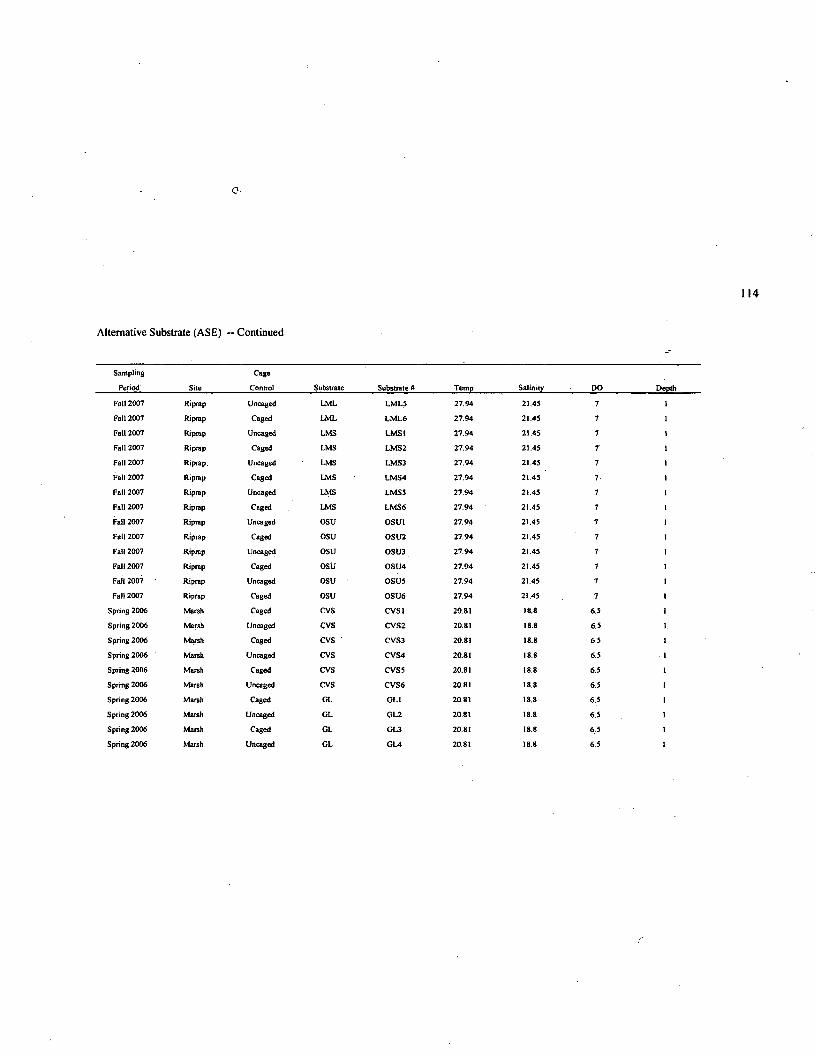
o-
114
Alternative Substrate (ASE) -- Continued
S a m p l i n g
P e r i o d S i t e
C a g e
C o n t r o l S u b s t r a t e S u b s t r a t e # T e m p S a l i n i t y D O D e p t h
F a l l 2 0 0 7 R i p r a p U n c a g e d L M L L M L 5 2 7 . 9 4 2 1 .4 5 7
F a l l 2 0 0 7 R i p r a p C a g e d L M L L M L 6 2 7 . 9 4 2 1 .4 5 7
F a l l 2 0 0 7 R i p r a p U n c a g e d L M S L M S 1 2 7 . 9 4 2 1 . 4 5 7
F a l l 2 0 0 7 R i p r a p C a g e d L M S L M S 2 2 7 . 9 4 2 1 .4 5 7 1
F a l l 2 0 0 7 R i p r a p . U n c a g e d L M S L M S 3 2 7 . 9 4 2 1 .4 5 7
F a l l 2 0 0 7 R i p r a p C a g e d L M S L M S 4 2 7 . 9 4 2 1 .4 5 7
F a l l 2 0 0 7 R i p r a p U n c a g e d L M S L M S S 2 7 . 9 4 2 1 .4 5 7
F a l l 2 0 0 7 R i p r a p C a g e d L M S L M S 6 2 7 . 9 4 2 1 . 4 5 7
F a l l 2 0 0 7 R i p r a p U n c a g e d O S U O S U 1 2 7 . 9 4 2 1 .4 5 7
F a l l 2 0 0 7 R i p r a p C a g e d O S U O S U 2 2 7 . 9 4 2 1 .4 5 7
F a l l 2 0 0 7 R i p r a p U n c a g e d O S U O S U 3 2 7 . 9 4 2 1 .4 5 7
F a l l 2 0 0 7 R i p r a p C a g e d O S U O S U 4 2 7 . 9 4 2 1 .4 5 7 1
F a i l 2 0 0 7 ' R i p r a p U n c a g e d O S U O S U 5 2 7 . 9 4 2 1 .4 5 7 1
F a l l 2 0 0 7 R i p r a p C a g e d O S U O S U 6 2 7 . 9 4 2 1 .4 5 7 1
S p r i n g 2 0 0 6 M a r s h C a g e d C V S C V S 1 2 0 .8 1 1 8 .8 6 .5 1
S p r i n g 2 0 0 6 M a r s h U n c a g e d C V S C V S 2 2 0 .8 1 1 8 .8 6 .5 1
S p r i n g 2 0 0 6 M a r s h C a g e d C V S C V S 3 2 0 .8 1 1 8 .8 6 .5 1
S p r i n g 2 0 0 6 M a r s h U n c a g e d C V S C V S 4 2 0 .8 1 1 8 .8 6 .5
S p r i n g 2 0 0 6 M a r s h C a g e d C V S C V S 5 2 0 .8 1 1 8 .8 6 .5 1
S p r i n g 2 0 0 6 M a r s h U n c a g e d C V S C V S 6 2 0 .8 1 1 8 .8 6 .5 1
S p r i n g 2 0 0 6 M a r s h C a g e d G L G L 1 2 0 .8 1 1 8 .8 6 .5 I
S p r i n g 2 0 0 6 M a r s h U n c a g e d G L G L 2 2 0 .8 1 1 8 .8 6 5 1
S p r i n g 2 0 0 6 M a r s h C a g e d G L G L 3 2 0 .8 1 1 8 .8 6 .5 I
S p r i n g 2 0 0 6 M a r s h U n c a g e d G L G L 4 2 0 .8 1 1 8 .8 6 .5 1
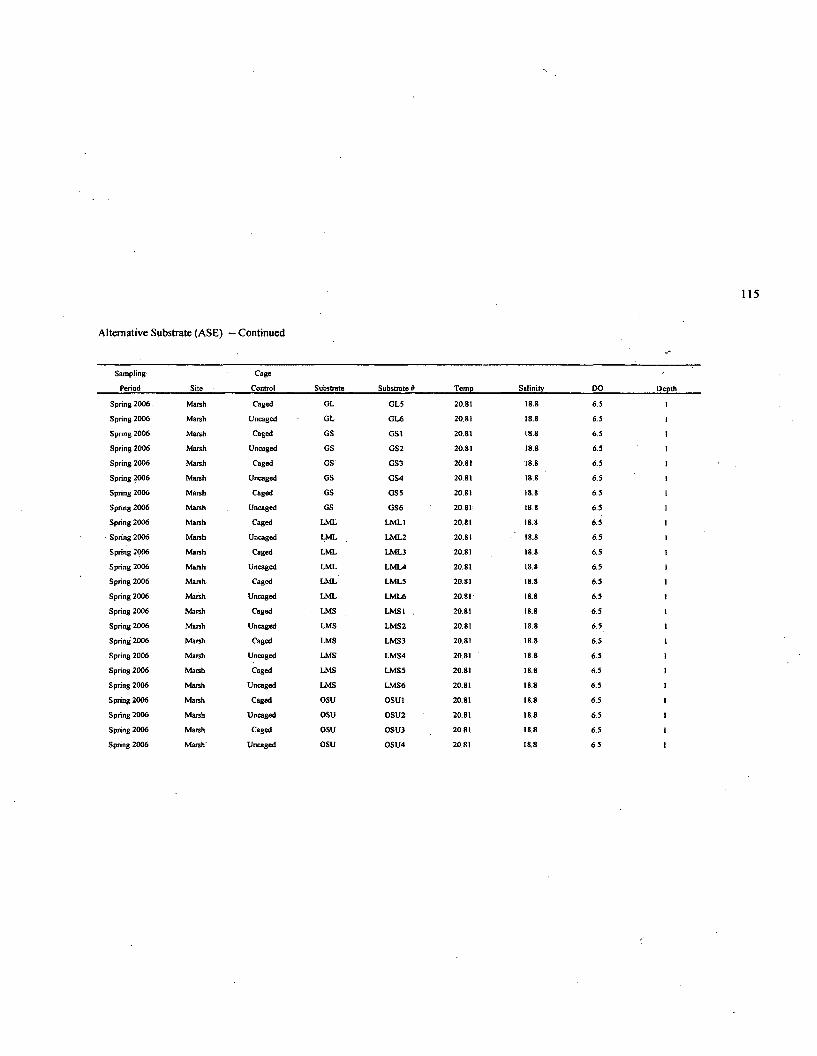
Alternative Substrate (ASE) — Continued
S a m p l i n g
P e r io d S i t e
C a g e
C o n t r o l S u b s t r a t e S u b s t r a t e # T e m p S a l i n i t y D O D e p t h
S p r i n g 2 0 0 6 M a r s h C a g e d G L G L 5 2 0 .8 1 1 8 .8 6 .5
S p r i n g 2 0 0 6 M a r s h U n c a g e d G L G L 6 2 0 .8 1 1 8 .8 6 .5
S p r i n g 2 0 0 6 M a r s h C a g e d G S G S l 2 0 .8 1 1 8 .8 6 .5
S p r i n g 2 0 0 6 M a r s h U n c a g e d G S G S 2 2 0 .8 1 1 8 .8 6 .5
S p r i n g 2 0 0 6 M a r s h C a g e d G S G S 3 2 0 .8 1 1 8 .8 6 .5
S p r i n g 2 0 0 6 M a r s h U n c a g e d G S G S 4 2 0 .8 1 1 8 .8 6 .5
S p r i n g 2 0 0 6 M a r s h C a g e d G S G S 5 2 0 .8 1 1 8 .8 6 .5
S p r i n g 2 0 0 6 M a r s h U n c a g e d G S G S 6 2 0 .8 1 ( 8 .8 6 .5
S p r i n g 2 0 0 6 M a r s h C a g e d L M L L M L 1 2 0 .8 1 1 8 .8 6 .5
- S p r i n g 2 0 0 6 M a r s h U n c a g e d L M L L M L 2 2 0 .8 1 1 8 .8 6 .5
S p r i n g 2 0 0 6 M a r s h C a g e d L M L L M L 3 2 0 .8 1 1 8 .8 6 .5
S p r i n g 2 0 0 6 M a r s h U n c a g e d L M L L M L 4 2 0 .8 1 1 8 .8 6 .5
S p r i n g 2 0 0 6 M a r s h C a g e d L M L L M L 5 2 0 .8 1 1 8 .8 6 .5 1
S p r i n g 2 0 0 6 M a r s h U n c a g e d L M L L M L 6 2 0 .8 1 1 8 .8 6 .5 1
S p r i n g 2 0 0 6 M a r s h C a g e d L M S L M S 1 . 2 0 .8 1 1 8 .8 6 . 5 1
S p r i n g 2 0 0 6 M a r s h U n c a g e d L M S L M S 2 2 0 .8 1 1 8 .8 6 .5 1
S p r i n g 2 0 0 6 M a r s h C a g e d L M S L M S 3 2 0 .8 1 1 8 .8 6 .5 1
S p r i n g 2 0 0 6 M a r s h U n c a g e d L M S L M S 4 2 0 .8 1 1 8 .8 6 .5 1
S p r i n g 2 0 0 6 M a r s h C a g e d L M S L M S 5 2 0 .8 1 1 8 .8 6 .5 1
S p r i n g 2 0 0 6 M a r s h U n c a g e d L M S L M S 6 2 0 .8 1 1 8 .8 6 .5 1
S p r i n g 2 0 0 6 M a r s h C a g e d O S U O S U 1 2 0 .8 1 1 8 .8 6 .5 1
S p r i n g 2 0 0 6 M a r s h U n c a g e d O S U O S U 2 2 0 .8 1 1 8 .8 6 .5 1
S p r i n g 2 0 0 6 M a r s h C a g e d O S U O S U 3 2 0 .8 1 1 8 .8 6 .5 I
S p r i n g 2 0 0 6 M a r s h ' U n c a g e d O S U O S U 4 2 0 .8 1 1 8 .8 6 .5 1
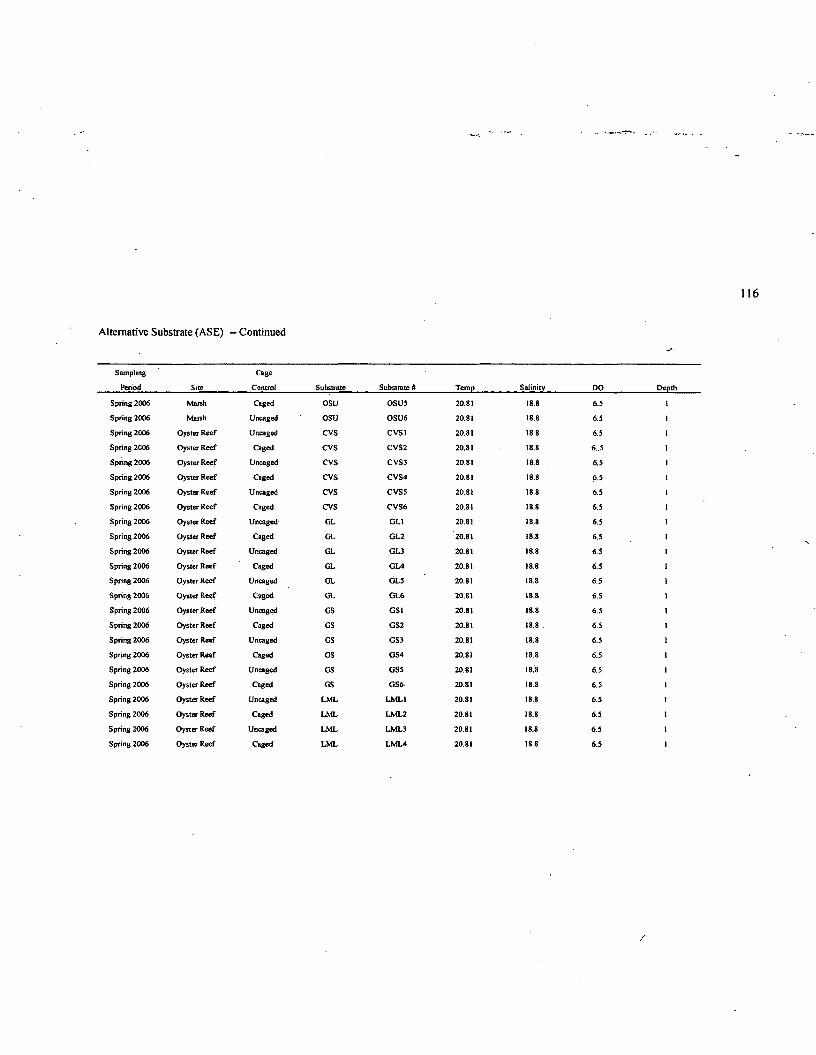
Alternative Substrate (ASE) -- Continued
S a m p l i n g C a g e
P e r io d S i te C o n t r o l S u b s t r a t e S u b s t r a t e # T e m p S a l i n i t y D O D e p t h
S p r i n g 2 0 0 6 M a r s h C a g e d O S U O S U 5 2 0 .8 1 1 8 .8 6 .5 1
S p r i n g 2 0 0 6 M a r s h U n c a g e d O S U O S U 6 2 0 .8 1 1 8 .8 6 .5
S p r i n g 2 0 0 6 O y s t e r R e e f U n c a g e d C V S C V S I 2 0 .8 1 1 8 .8 6 .5
S p r i n g 2 0 0 6 O y s t e r R e e f C a g e d C V S C V S 2 2 0 .8 1 1 8 .8 6 . 5
S p r i n g 2 0 0 6 O y s t e r R e e f U n c a g e d C V S C V S 3 2 0 .8 1 1 8 .8 6 .5 1
S p r i n g 2 0 0 6 O y s t e r R e e f C a g e d C V S C V S 4 2 0 .8 1 1 8 .8 6 .5 1
S p r i n g 2 0 0 6 O y s t e r R e e f U n c a g e d C V S C V S 5 2 0 .8 1 1 8 .8 6 .5
S p r i n g 2 0 0 6 O y s t e r R e e f C a g e d C V S C V S 6 2 0 .8 1 1 8 .8 6 .5
S p r i n g 2 0 0 6 O y s t e r R e e f U n c a g e d G L G L 1 2 0 .8 1 1 8 .8 6 .5
S p r i n g 2 0 0 6 O y s t e r R e e f C a g e d G L G L 2 2 0 .8 1 1 8 .8 6 .5
S p r i n g 2 0 0 6 O y s t e r R e e f U n c a g e d G L G L 3 2 0 .8 1 1 8 .8 6 .5
S p r i n g 2 0 0 6 O y s t e r R e e f C a g e d G L G L 4 2 0 .8 1 1 8 .8 6 .5
S p r i n g 2 0 0 6 O y s t e r R e e f U n c a g e d G L G L 5 2 0 ,8 1 1 8 .8 6 .5
S p r i n g 2 0 0 6 O y s t e r R e e f C a g e d G L G L 6 2 0 .8 1 1 8 .8 6 .5 1
S p r i n g 2 0 0 6 O y s t e r R e e f U n c a g e d G S G S 1 2 0 .8 1 1 8 .8 6 .5
S p r i n g 2 0 0 6 O y s t e r R e e f C a g e d G S G S 2 2 0 .8 1 1 8 .8 . 6 . 5
S p r i n g 2 0 0 6 O y s t e r R e e f U n c a g e d O S G S 3 2 0 .8 1 1 8 .8 6 .5 1
S p r i n g 2 0 0 6 O y s t e r R e e f C a g e d G S G S 4 2 0 .8 1 1 8 .8 6 .5
S p r i n g 2 0 0 6 O y s t e r R e e f U n c a g e d G S G S 5 2 0 .8 1 1 8 .8 6 .5
S p r i n g 2 0 0 6 O y s t e r R e e f C a g e d G S G S 6 2 0 .8 1 1 8 .8 6 .5
S p r i n g 2 0 0 6 O y s t e r R e e f U n c a g e d L M L L M L 1 2 0 .8 1 1 8 .8 6 .5 1
S p r i n g 2 0 0 6 O y s t e r R e e f C a g e d L M L L M L 2 2 0 .8 1 1 8 .8 6 .5 1
S p r i n g 2 0 0 6 O y s t e r R e e f U n c a g e d L M L L M L 3 2 0 .8 1 1 8 .8 6 .5 1
S p r i n g 2 0 0 6 O y s t e r R e e f C a g e d L M L L M L 4 2 0 .8 1 1 8 .8 6 .5 1
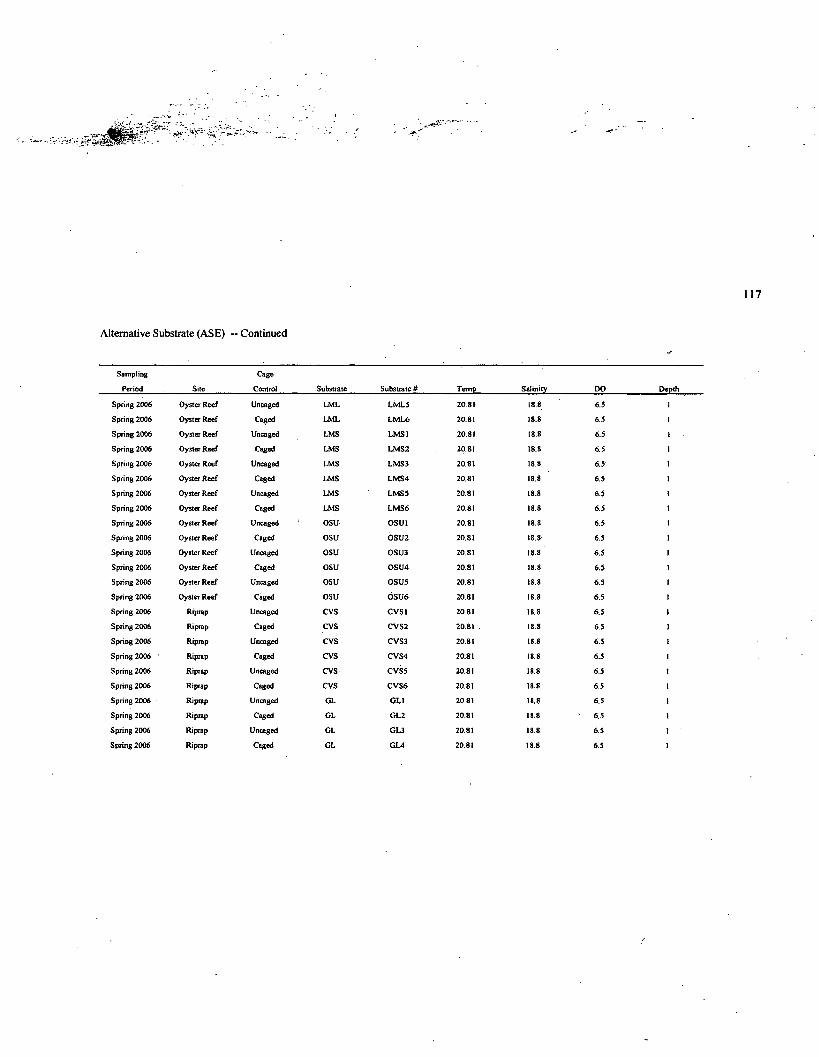
Alternative Substrate (ASE) -- Continued
S a m p l i n g
P e r i o d S i t e
C a g e
C o n t r o l S u b s t r a t e S u b s t r a t e # T e m p S a l i n i t y D O D e p t h
S p r i n g 2 0 0 6 O y s t e r R e e f U n c a g e d L M L L M L 5 2 0 .8 1 1 8 .8 6 .5
S p r i n g 2 0 0 6 O y s t e r R e e f C a g e d L M L L M L 6 2 0 .8 1 1 8 .8 6 .5
S p r i n g 2 0 0 6 O y s t e r R e e f U n c a g e d L M S L M S 1 2 0 .8 1 1 8 .8 6 .5
S p r i n g 2 0 0 6 O y s t e r R e e f C a g e d L M S L M S 2 2 0 .8 1 1 8 .8 6 .5
S p r i n g 2 0 0 6 O y s t e r R e e f U n c a g e d L M S L M S 3 2 0 .8 1 1 8 .8 6 .5
S p r i n g 2 0 0 6 O y s t e r R e e f C a g e d L M S L M S 4 2 0 .8 1 1 8 .8 6 .5
S p r i n g 2 0 0 6 O y s t e r R e e f U n c a g e d L M S L M S 5 2 0 .8 1 1 8 .8 6 .5
S p r i n g 2 0 0 6 O y s te r R e e f C a g e d L M S L M S 6 2 0 .8 1 1 8 .8 6 .5
S p r i n g 2 0 0 6 O y s t e r R e e f U n c a g e d O S U O S U 1 2 0 .8 1 1 8 .8 6 .5
S p r i n g 2 0 0 6 O y s t e r R e e f C a g e d O S U O S U 2 2 0 .8 1 1 8 .8 6 .5 1
S p r i n g 2 0 0 6 O y s t e r R e e f U n c a g e d O S U O S U 3 2 0 .8 1 1 8 .8 6 .5 1
S p r i n g 2 0 0 6 O y s t e r R e e f C a g e d O S U O S U 4 2 0 .8 1 1 8 .8 6 .5 1
S p r i n g 2 0 0 6 O y s t e r R e e f U n c a g e d O S U O S U 5 2 0 .8 1 1 8 .8 6 .5 1
S p r i n g 2 0 0 6 O y s t e r R e e f C a g e d O S U O S U 6 2 0 .8 1 1 8 .8 6 .5 1
S p r i n g 2 0 0 6 R i p r a p U n c a g e d C V S C V S ! 2 0 .8 1 1 8 .8 6 .5 1
S p r i n g 2 0 0 6 R i p r a p C a g e d C V S C V S 2 2 0 .8 1 . 1 8 .8 6 .5 1
S p r i n g 2 0 0 6 R i p r a p U n c a g e d C V S C V S 3 2 0 .8 1 1 8 .8 6 .5 1
S p r i n g 2 0 0 6 ‘ R i p r a p C a g e d C V S C V S 4 2 0 .8 1 1 8 .8 6 .5 1
S p r i n g 2 0 0 6 R i p r a p U n c a g e d C V S C V S 5 2 0 .8 1 1 8 .8 6 .5 1
S p r i n g 2 0 0 6 R i p r a p C a g e d C V S C V S 6 2 0 .8 1 1 8 .8 6 .5 I
S p r i n g 2 0 0 6 - R i p r a p U n c a g e d G L G L 1 2 0 .8 1 1 8 .8 6 .5 1
S p r i n g 2 0 0 6 R i p r a p C a g e d G L G L 2 2 0 .8 1 1 8 .8 6 .5 1
S p r i n g 2 0 0 6 R i p r a p U n c a g e d G L G L 3 2 0 .8 1 1 8 .8 6 .5
S p r i n g 2 0 0 6 R i p r a p C a g e d G L G L 4 2 0 .8 1 1 8 .8 6 .5 1
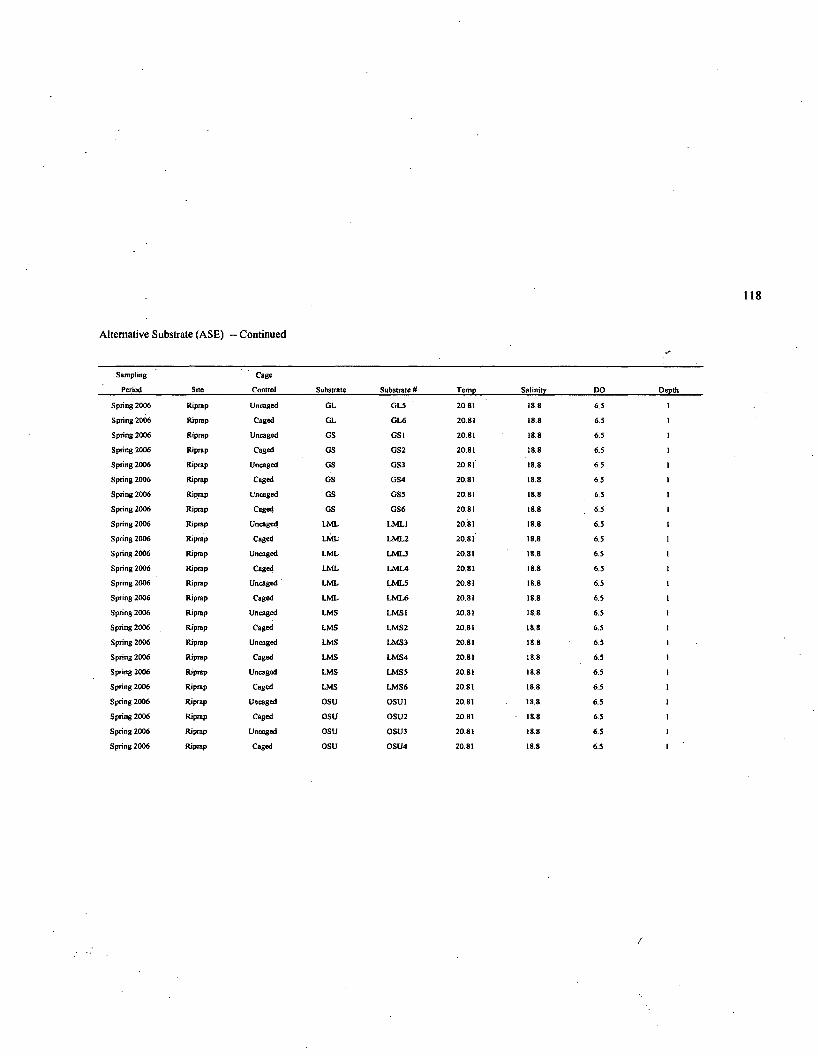
Alternative Substrate (ASE) -- Continued
S a m p l i n g
P e r io d S i te
C a g e
C o n t r o l S u b s t r a t e S u b s t r a t e # T e m p S a l i n i t y D O D e p t h
S p r i n g 2 0 0 6 R i p r a p U n c a g e d G L G L 5 2 0 .8 1 1 8 .8 6 .5
S p r i n g 2 0 0 6 R i p r a p C a g e d G L G L 6 2 0 .8 1 1 8 .8 6 .5
S p r i n g 2 0 0 6 R i p r a p U n c a g e d G S G S 1 2 0 .8 1 1 8 .8 6 .5
S p r i n g 2 0 0 6 R i p r a p C a g e d G S G S 2 2 0 .8 1 1 8 .8 6 .5 1
S p r i n g 2 0 0 6 R i p r a p U n c a g e d G S G S 3 2 0 .8 1 18 8 6 .5 I
S p r i n g 2 0 0 6 R i p r a p C a g e d G S G S 4 2 0 .8 1 1 8 .8 6 .5
S p r i n g 2 0 0 6 R i p r a p U n c a g e d G S G S 5 2 0 .8 1 1 8 .8 6 .5 1
S p r i n g 2 0 0 6 R i p r a p C a g e d G S G S 6 2 0 .8 1 1 8 .8 6 .5
S p r i n g 2 0 0 6 R i p r a p U n c a g e d L M L L M L 1 2 0 .8 1 1 8 .8 6 .5
S p r i n g 2 0 0 6 R i p r a p C a g e d L M L L M L 2 2 0 .8 1 1 8 .8 6 .5
S p r i n g 2 0 0 6 R i p r a p U n c a g e d L M L L M L 3 2 0 .8 1 1 8 .8 6 .5
S p r i n g 2 0 0 6 R i p r a p C a g e d L M L L M L 4 2 0 .8 1 1 8 .8 6 .5 1
S p r i n g 2 0 0 6 R i p r a p U n c a g e d L M L L M L 5 2 0 .8 1 1 8 .8 6 .5
S p r i n g 2 0 0 6 R i p r a p C a g e d L M L L M L 6 2 0 .8 1 1 8 .8 6 .5
S p r i n g 2 0 0 6 R i p r a p U n c a g e d L M S L M S 1 2 0 .8 1 1 8 .8 6 .5 I
S p r i n g 2 0 0 6 R i p r a p C a g e d L M S L M S 2 2 0 .8 1 1 8 .8 6 .5 I
S p r i n g 2 0 0 6 R i p r a p U n c a g e d L M S L M S 3 2 0 .8 1 1 8 .8 6 .5
S p r i n g 2 0 0 6 R i p r a p C a g e d L M S L M S 4 2 0 .8 1 1 8 .8 6 .5 1
S p r i n g 2 0 0 6 R i p r a p U n c a g e d L M S L M S 5 2 0 .8 1 1 8 .8 6 .5 1
S p r i n g 2 0 0 6 R i p r a p C a g e d L M S L M S 6 2 0 .8 1 1 8 .8 6 .5 1
S p r i n g 2 0 0 6 R i p r a p U n c a g e d O S U O S U 1 2 0 .8 1 1 8 .8 6 .5 1
S p r i n g 2 0 0 6 R i p r a p C a g e d O S U O S U 2 2 0 .8 1 1 8 .8 6 .5 1
S p r i n g 2 0 0 6 R i p r a p U n c a g e d O S U O S U 3 2 0 .8 1 1 8 .8 6 .5 1
S p r i n g 2 0 0 6 R i p r a p C a g e d O S U O S U 4 2 0 .8 1 1 8 .8 6 .5 1
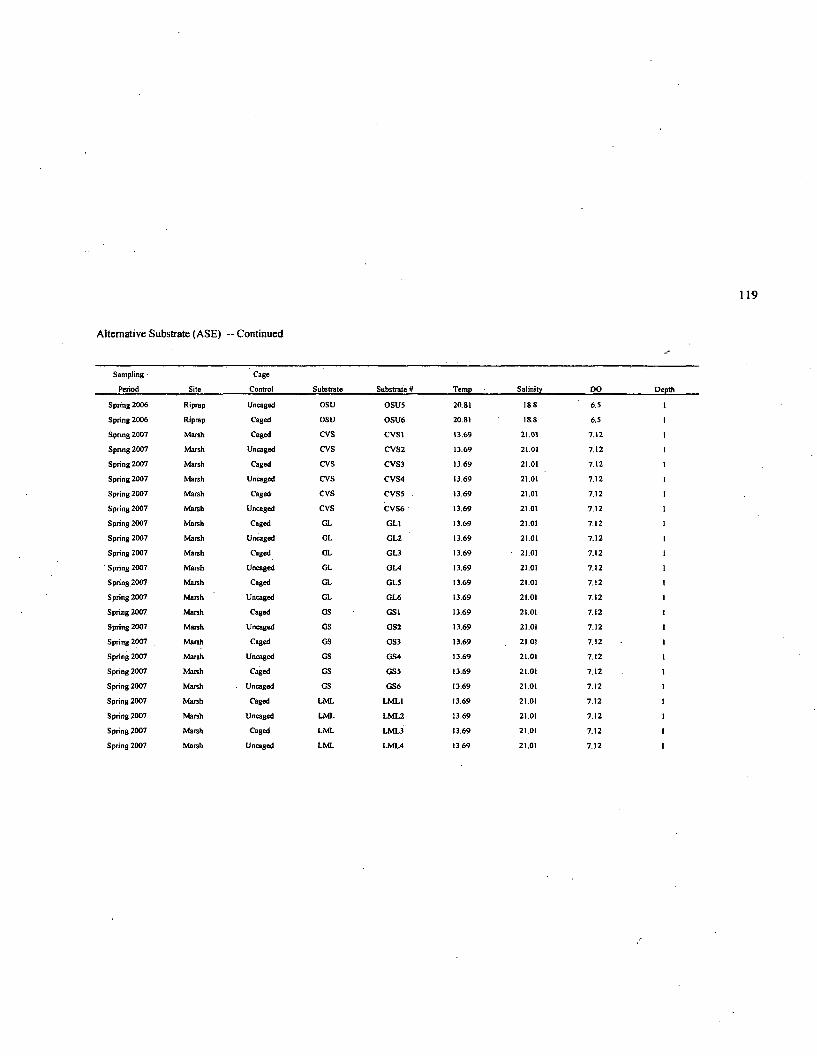
Alternative Substrate (ASE) -- Continued
S a m p l i n g - C a g e
P e r io d S i t e C o n t r o l S u b s t r a t e S u b s t r a t e # T e m p S a l i n i t y D O D e p t h
S p r i n g 2 0 0 6 R i p r a p U n c a g e d O S U O S U 5 2 0 .8 1 1 8 .8 6 .5
S p r i n g 2 0 0 6 R i p r a p C a g e d O S U O S U 6 2 0 .8 1 1 8 .8 6 .5
S p r i n g 2 0 0 7 M a r s h C a g e d C V S C V S 1 1 3 .6 9 2 1 .0 1 7 . 1 2
S p r i n g 2 0 0 7 M a r s h U n c a g e d C V S C V S 2 1 3 .6 9 2 1 .0 1 7 . 1 2
S p r i n g 2 0 0 7 M a r s h C a g e d C V S C V S 3 1 3 .6 9 2 1 .0 1 7 .1 2 1
S p r i n g 2 0 0 7 M a r s h U n c a g e d C V S C V S 4 1 3 .6 9 2 1 .0 1 7 . 1 2
S p r i n g 2 0 0 7 M a r s h C a g e d C V S C V S 5 . 1 3 .6 9 2 1 .0 1 7 .1 2 1
S p r i n g 2 0 0 7 M a r s h U n c a g e d C V S C V S 6 1 3 .6 9 2 1 .0 1 7 .1 2 I
S p r i n g 2 0 0 7 M a r s h C a g e d G L G L I 1 3 .6 9 2 1 .0 1 7 .1 2 1
S p r i n g 2 0 0 7 M a r s h U n c a g e d G L G L 2 1 3 .6 9 2 1 .0 1 7 . 1 2 I
S p r i n g 2 0 0 7 M a r s h C a g e d G L G L 3 1 3 .6 9 2 1 .0 1 7 .1 2 1
' S p r i n g 2 0 0 7 M a r s h U n c a g e d G L G L 4 1 3 .6 9 2 1 .0 1 7 . 1 2 1
S p r i n g 2 0 0 7 M a r s h C a g e d G L G L 5 1 3 .6 9 2 1 .0 1 7 . 1 2 1
S p r i n g 2 0 0 7 M a r s h U n c a g e d G L G L 6 1 3 .6 9 2 1 .0 1 7 . 1 2 1
S p r i n g 2 0 0 7 M a r s h C a g e d G S G S 1 1 3 .6 9 2 1 .0 1 7 . 1 2 1
S p r i n g 2 0 0 7 M a r s h U n c a g e d G S G S 2 1 3 .6 9 2 1 .0 1 7 .1 2 1
S p r i n g 2 0 0 7 M a r s h C a g e d . G S G S 3 1 3 .6 9 2 1 0 1 7 . 1 2 1
S p r i n g 2 0 0 7 M a r s h U n c a g e d G S G S 4 1 3 .6 9 2 1 .0 1 7 . 1 2 1
S p r i n g 2 0 0 7 M a r s h C a g e d G S G S 5 1 3 .6 9 2 1 .0 1 7 . 1 2 1
S p r i n g 2 0 0 7 M a r s h U n c a g e d G S G S 6 1 3 .6 9 2 1 .0 1 7 . 1 2 1
S p r i n g 2 0 0 7 M a r s h C a g e d L M L L M L 1 1 3 .6 9 2 1 .0 1 7 . 1 2 1
S p r i n g 2 0 0 7 M a r s h U n c a g e d L M L L M L 2 1 3 .6 9 2 1 .0 1 7 . 1 2 1
S p r i n g 2 0 0 7 M a r s h C a g e d L M L L M L 3 1 3 .6 9 2 1 .0 1 7 .1 2 1
S p r i n g 2 0 0 7 M a r s h U n c a g e d L M L L M L 4 1 3 .6 9 2 1 .0 1 7 . 1 2 1
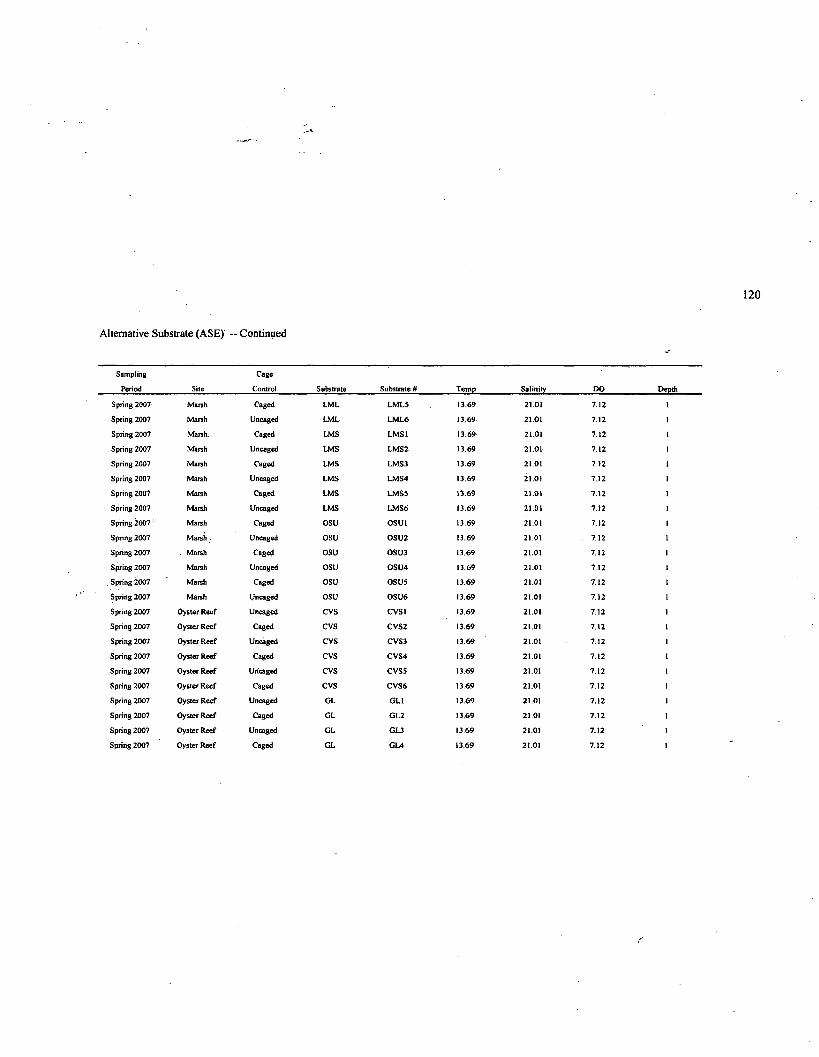
Alternative Substrate (ASE) -- Continued
S a m p l i n g
P e r io d S i te
C a g e
C o n t r o l S u b s t r a t e S u b s t r a t e # T e m p S a l i n i t y D O D e p t h
S p r i n g 2 0 0 7 - M a r s h C a g e d L M L L M L 5 1 3 .6 9 2 1 .0 1 7 .1 2 1
S p r i n g 2 0 0 7 M a r s h U n c a g e d L M L L M L 6 1 3 .6 9 2 1 .0 1 7 .1 2 1
S p r i n g 2 0 0 7 M a r s h . C a g e d L M S L M S 1 1 3 .6 9 2 1 .0 1 7 .1 2
S p r i n g 2 0 0 7 M a r s h U n c a g e d L M S L M S 2 1 3 .6 9 2 1 .0 1 7 .1 2 1
S p r i n g 2 0 0 7 M a r s h C a g e d L M S L M S 3 1 3 .6 9 2 1 .0 1 7 .1 2 1
S p r i n g 2 0 0 7 M a r s h U n c a g e d L M S L M S 4 1 3 .6 9 2 1 .0 1 7 .1 2 1
S p r i n g 2 0 0 7 M a r s h C a g e d L M S L M S S 1 3 . 6 9 2 1 .0 1 7 . 1 2 1
S p r i n g 2 0 0 7 M a r s h U n c a g e d L M S L M S 6 1 3 .6 9 2 1 . 0 ) 7 .1 2 1
S p r i n g 2 0 0 7 ; M a r s h C a g e d O S U O S U 1 1 3 .6 9 2 1 .0 1 7 .1 2 I
S p r i n g 2 0 0 7 M a r s h ■ U n c a g e d O S U O S U 2 1 3 .6 9 2 1 .0 1 . 7 . 1 2 1
S p r i n g 2 0 0 7 . M a r s h C a g e d O S U O S U 3 1 3 .6 9 2 1 .0 1 7 .1 2 1
S p r i n g 2 0 0 7 M a r s h U n c a g e d O S U O S U 4 1 3 .6 9 2 1 .0 1 7 .1 2 1
. S p r i n g 2 0 0 7 M a r s h C a g e d O S U O S U 5 1 3 . 6 9 2 1 .0 1 7 .1 2 1
S p r i n g 2 0 0 7 M a r s h U n c a g e d O S U O S U 6 1 3 .6 9 2 1 .0 1 7 .1 2 1
S p r i n g 2 0 0 7 O y s t e r R e e f U n c a g e d C V S C V S 1 1 3 .6 9 2 1 .0 1 7 .1 2 1
S p r i n g 2 0 0 7 O y s t e r R e e f C a g e d C V S C V S 2 1 3 .6 9 2 1 .0 1 7 .1 2 I
S p r i n g 2 0 0 7 O y s t e r R e e f U n c a g e d C V S C V S 3 1 3 .6 9 2 1 .0 1 7 . 1 2 I
S p r i n g 2 0 0 7 O y s t e r R e e f C a g e d C V S C V S 4 1 3 .6 9 2 1 .0 1 7 . 1 2 1
S p r i n g 2 0 0 7 O y s t e r R e e f U n c a g e d C V S C V S 5 1 3 .6 9 2 1 .0 1 7 . 1 2 1
S p r i n g 2 0 0 7 O y s t e r R e e f C a g e d cvs C V S 6 1 3 .6 9 2 1 .0 1 7 . 1 2 1
S p r i n g 2 0 0 7 O y s t e r R e e f U n c a g e d G L G L I 1 3 .6 9 2 1 .0 1 7 . 1 2 1
S p r i n g 2 0 0 7 O y s t e r R e e f C a g e d G L G L 2 1 3 .6 9 2 1 .0 1 7 . 1 2 1
S p r i n g 2 0 0 7 O y s t e r R e e f U n c a g e d G L G L 3 1 3 .6 9 2 1 .0 1 7 . 1 2 1
S p r i n g 2 0 0 7 O y s t e r R e e f C a g e d G L G L 4 1 3 .6 9 2 1 .0 1 7 . 1 2 1
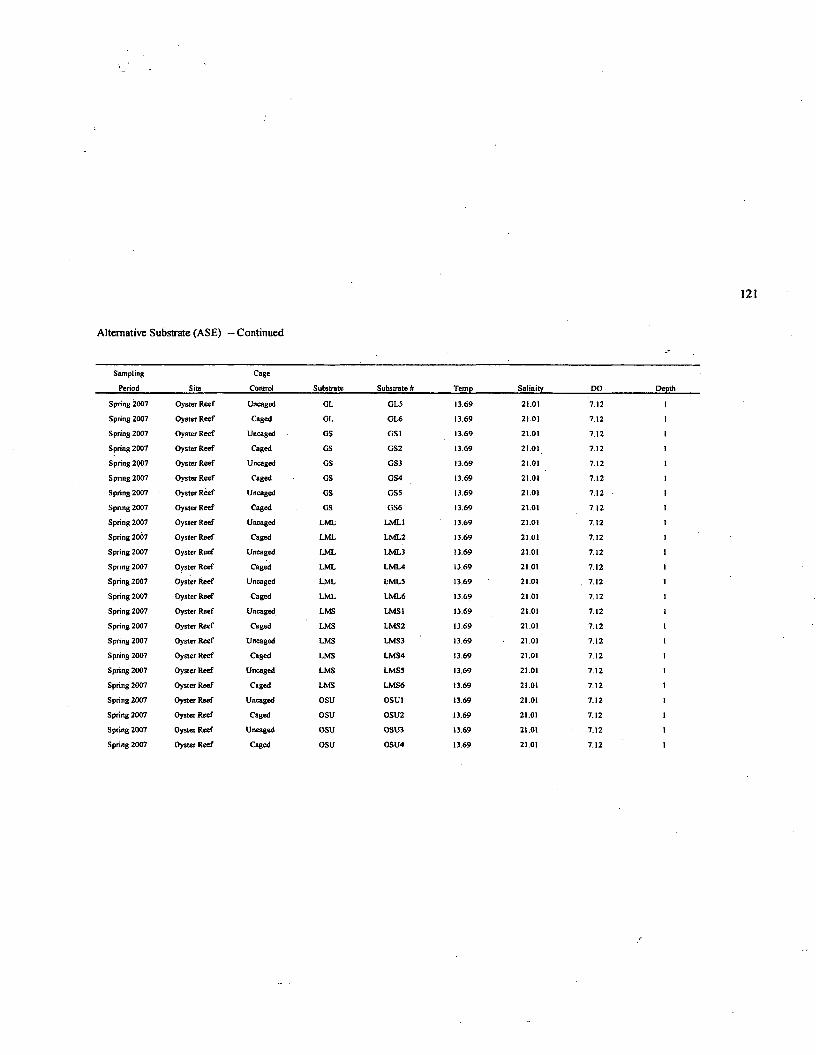
Alternative Substrate (ASE) — Continued
S a m p l i n g
P e r io d S i te
C a g e
C o n t r o l S u b s t r a t e S u b s t r a t e # T e m p S a l i n i t y D O D e p t h
S p r i n g 2 0 0 7 O y s t e r R e e f U n c a g e d G L G L 5 1 3 .6 9 2 1 .0 1 7 .1 2
S p r i n g 2 0 0 7 O y s t e r R e e f C a g e d G L G L 6 1 3 .6 9 2 1 .0 1 7 .1 2
S p r i n g 2 0 0 7 O y s t e r R e e f U n c a g e d G S G S 1 1 3 .6 9 2 1 .0 1 7 .1 2
S p r i n g 2 0 0 7 O y s t e r R e e f C a g e d G S G S 2 1 3 .6 9 2 1 .0 1 7 .1 2 1
S p r i n g 2 0 0 7 O y s t e r R e e f U n c a g e d G S G S 3 1 3 .6 9 2 1 .0 1 7 .1 2
S p r i n g 2 0 0 7 O y s t e r R e e f C a g e d G S G S 4 1 3 .6 9 2 1 .0 1 7 .1 2
S p r i n g 2 0 0 7 O y s t e r R e e f U n c a g e d G S G S 5 1 3 .6 9 2 1 .0 1 7 .1 2
S p r i n g 2 0 0 7 O y s t e r R e e f C a g e d G S G S 6 1 3 .6 9 2 1 .0 1 7 . 1 2 1
S p r i n g 2 0 0 7 O y s t e r R e e f U n c a g e d L M L L M L 1 1 3 .6 9 2 1 .0 1 7 . 1 2 1
S p r i n g 2 0 0 7 O y s t e r R e e f C a g e d L M L L M L 2 1 3 .6 9 2 1 .0 1 7 .1 2 1
S p r i n g 2 0 0 7 O y s t e r R e e f U n c a g e d L M L L M L 3 1 3 .6 9 2 1 .0 1 7 .1 2 1
S p r i n g 2 0 0 7 O y s t e r R e e f C a g e d L M L L M L 4 1 3 .6 9 2 1 .0 1 7 . 1 2 1
S p r i n g 2 0 0 7 O y s t e r R e e f U n c a g e d L M L L M L 5 1 3 .6 9 2 1 .0 1 . 7 . 1 2 1
S p r i n g 2 0 0 7 O y s t e r R e e f C a g e d L M L L M L 6 1 3 .6 9 2 1 .0 1 7 .1 2 1
S p r i n g 2 0 0 7 O y s t e r R e e f U n c a g e d L M S L M S 1 1 3 .6 9 2 1 .0 1 7 . 1 2 1
S p r i n g 2 0 0 7 O y s t e r R e e f C a g e d L M S L M S 2 1 3 .6 9 2 1 .0 1 7 . 1 2 I
S p r i n g 2 0 0 7 O y s t e r R e e f U n c a g e d L M S L M S 3 1 3 .6 9 2 1 .0 1 7 . 1 2 1
S p r i n g 2 0 0 7 O y s t e r R e e f C a g e d L M S L M S 4 1 3 .6 9 2 1 .0 1 7 . 1 2 1
S p r i n g 2 0 0 7 O y s t e r R e e f U n c a g e d L M S L M S 5 1 3 .6 9 2 1 .0 1 7 . 1 2 1
S p r i n g 2 0 0 7 O y s t e r R e e f C a g e d L M S L M S 6 1 3 .6 9 2 1 .0 1 7 . 1 2 1
S p r i n g 2 0 0 7 O y s t e r R e e f U n c a g e d O S U O S U 1 1 3 .6 9 2 1 .0 1 7 . 1 2 1
S p r i n g 2 0 0 7 O y s t e r R e e f C a g e d O S U O S U 2 1 3 .6 9 2 1 .0 1 7 . 1 2 1
S p r i n g 2 0 0 7 O y s te r R e e f U n c a g e d O S U O S U 3 1 3 .6 9 2 1 .0 1 7 . 1 2 1
S p r i n g 2 0 0 7 O y s t e r R e e f C a g e d O S U 0 S U 4 1 3 .6 9 2 1 .0 1 7 . 1 2 I
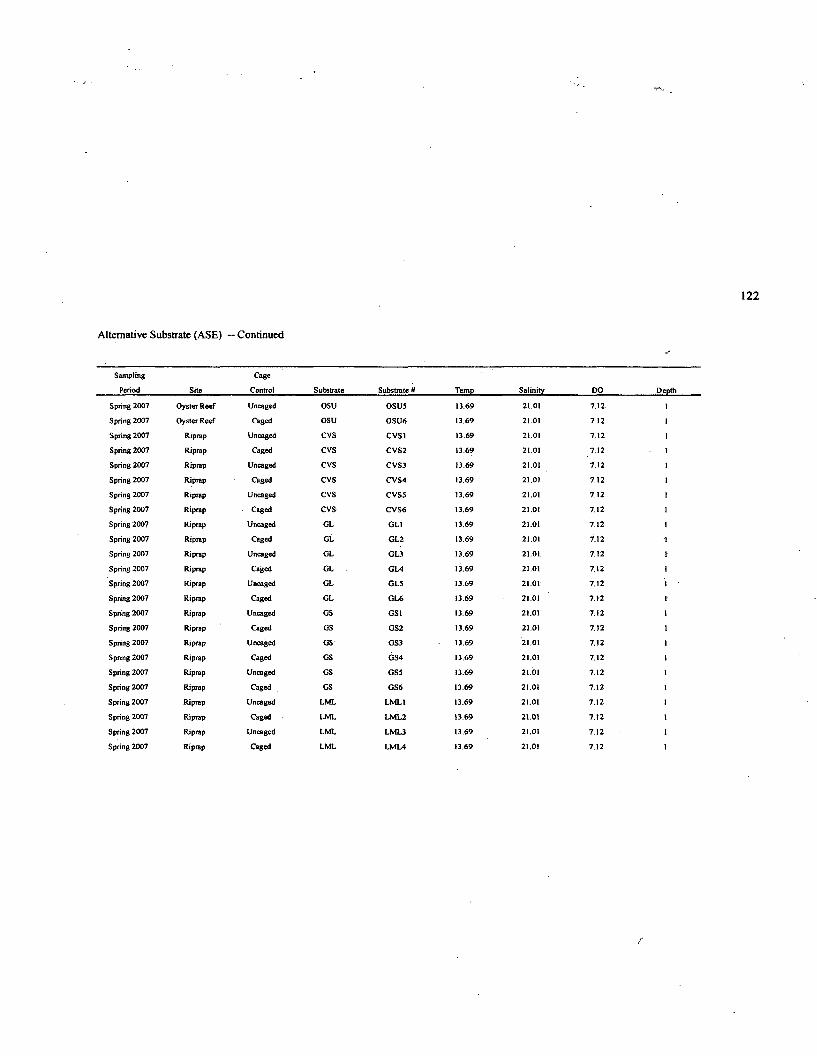
Alternative Substrate (ASE) -- Continued
S a m p l i n g
P e r io d S i t e
C a g e
C o n t r o l S u b s t r a t e S u b s t r a t e # T e m p S a l i n i t y D O D e p t h
S p r i n g 2 0 0 7 O y s t e r R e e f U n c a g e d O S U O S U 5 1 3 .6 9 2 1 .0 1 7 .1 2
S p r i n g 2 0 0 7 O y s t e r R e e f C a g e d O S U O S U 6 1 3 .6 9 2 1 .0 1 7 .1 2
S p r i n g 2 0 0 7 R i p r a p U n c a g e d C V S C V S 1 1 3 .6 9 2 1 .0 1 7 . 1 2
S p r i n g 2 0 0 7 R i p r a p C a g e d C V S C V S 2 1 3 .6 9 2 1 .0 1 7 .1 2
S p r i n g 2 0 0 7 R i p r a p U n c a g e d C V S C V S 3 1 3 .6 9 2 1 .0 1 7 .1 2
S p r i n g 2 0 0 7 R i p r a p C a g e d C V S C V S 4 1 3 .6 9 2 1 .0 1 7 ,1 2 1
S p r i n g 2 0 0 7 R i p r a p U n c a g e d C V S C V S 5 1 3 .6 9 2 1 .0 1 7 .1 2 1
S p r i n g 2 0 0 7 R i p r a p C a g e d C V S C V S 6 1 3 .6 9 2 1 .0 1 7 .1 2 1
S p r i n g 2 0 0 7 R i p r a p U n c a g e d G L G L I 1 3 .6 9 2 1 .0 1 7 . 1 2 1
S p r i n g 2 0 0 7 R i p r a p C a g e d G L G L 2 1 3 .6 9 2 1 .0 1 7 . 1 2 1
S p r i n g 2 0 0 7 R i p r a p U n c a g e d G L G L 3 1 3 .6 9 2 1 .0 1 7 . 1 2 1
S p r i n g 2 0 0 7 R i p r a p C a g e d G L G L 4 1 3 .6 9 2 1 .0 1 7 . 1 2 1
S p r i n g 2 0 0 7 R i p r a p U n c a g e d G L G L 5 1 3 .6 9 2 1 .0 1 7 . 1 2
S p r i n g 2 0 0 7 R i p r a p C a g e d G L G L 6 1 3 .6 9 2 1 .0 1 7 .1 2 1
S p r i n g 2 0 0 7 R i p r a p U n c a g e d G S G S 1 1 3 .6 9 2 1 .0 1 7 . 1 2 1
S p r i n g 2 0 0 7 R i p r a p C a g e d G S G S 2 1 3 .6 9 2 1 .0 1 7 . 1 2 1
S p r i n g 2 0 0 7 R i p r a p U n c a g e d G S ' G S 3 1 3 .6 9 2 1 .0 1 7 .1 2 1
S p r i n g 2 0 0 7 R i p r a p C a g e d G S G S 4 1 3 .6 9 2 1 .0 1 7 .1 2 1
S p r i n g 2 0 0 7 R i p r a p U n c a g e d G S G S 5 1 3 .6 9 2 1 .0 1 7 .1 2 1
S p r i n g 2 0 0 7 R i p r a p C a g e d G S G S 6 1 3 .6 9 2 1 .0 1 7 . 1 2 1
S p r i n g 2 0 0 7 R i p r a p U n c a g e d L M L L M L I 1 3 .6 9 2 1 .0 1 7 . 1 2 1
S p r i n g 2 0 0 7 R i p r a p C a g e d L M L L M L 2 1 3 .6 9 2 1 .0 1 7 . 1 2 1
S p r i n g 2 0 0 7 R i p r a p U n c a g e d L M L L M L 3 1 3 .6 9 2 1 .0 1 7 . 1 2 1
S p r i n g 2 0 0 7 R i p r a p C a g e d L M L L M L 4 1 3 .6 9 2 1 .0 1 7 . 1 2 1
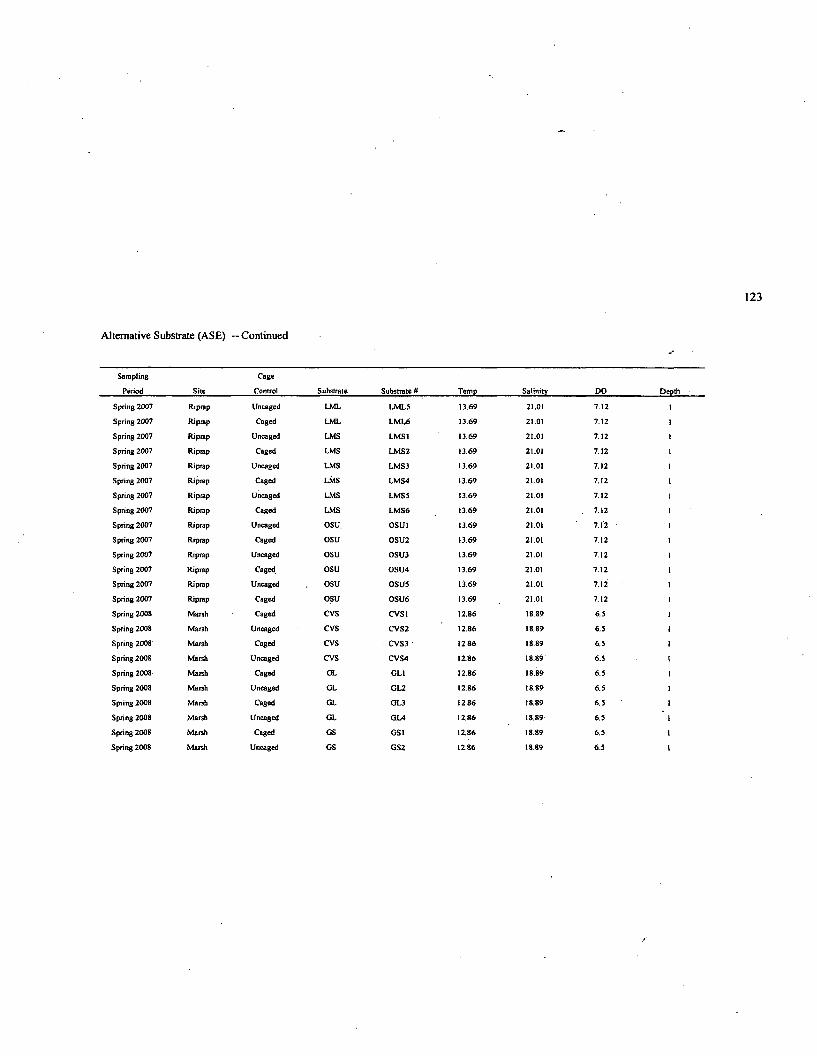
Alternative Substrate (ASE) — Continued
S a m p l i n g
P e r io d S i t e
C a g e
C o n t r o l S u b s t r a t e S u b s t r a t e # T e m p S a l i n i t y D O D e o t h
S p r i n g 2 0 0 7 R i p r a p U n c a g e d L M L L M L 5 1 3 .6 9 2 1 .0 1 7 . 1 2
S p r i n g 2 0 0 7 R i p r a p C a g e d L M L L M L 6 1 3 .6 9 2 1 .0 1 7 .1 2
S p r i n g 2 0 0 7 R i p r a p U n c a g e d L M S L M S 1 1 3 .6 9 2 1 .0 1 7 .1 2
S p r i n g 2 0 0 7 R i p r a p C a g e d L M S L M S 2 1 3 .6 9 2 1 .0 1 7 .1 2 1
S p r i n g 2 0 0 7 R i p r a p U n c a g e d L M S L M S 3 1 3 .6 9 2 1 .0 1 7 .1 2 1
S p r i n g 2 0 0 7 R i p r a p C a g e d L M S L M S 4 1 3 .6 9 2 1 .0 1 7 .1 2 1
S p r i n g 2 0 0 7 R i p r a p U n c a g e d L M S L M S 5 1 3 .6 9 2 1 .0 1 7 . 1 2 1
S p r i n g 2 0 0 7 R i p r a p C a g e d L M S L M S 6 1 3 .6 9 2 1 .0 1 . 7 . 1 2
S p r i n g 2 0 0 7 R i p r a p U n c a g e d O S U . O S U 1 1 3 .6 9 2 1 .0 1 7 .1 2 1
S p r i n g 2 0 0 7 R i p r a p C a g e d O S U O S U 2 1 3 .6 9 2 1 .0 1 7 .1 2 1
S p r i n g 2 0 0 7 R i p r a p U n c a g e d O S U O S U 3 1 3 .6 9 2 1 .0 1 7 .1 2 1
S p r i n g 2 0 0 7 R i p r a p C a g e d , O S U O S U 4 1 3 .6 9 2 1 .0 1 7 . 1 2 I
S p r i n g 2 0 0 7 R i p r a p U n c a g e d O S U O S U 5 1 3 .6 9 2 1 .0 1 7 .1 2 1
S p r i n g 2 0 0 ? R i p r a p C a g e d O S U O S U 6 1 3 .6 9 2 1 .0 1 7 .1 2 1
S p r i n g 2 0 0 8 M a r s h C a g e d C V S C V S 1 1 2 .8 6 1 8 .8 9 6 .5 1
S p r i n g 2 0 0 8 M a r s h U n c a g e d C V S C V S 2 1 2 .8 6 1 8 .8 9 6 .5 I
S p r i n g 2 0 0 8 M a r s h C a g e d C V S C V S 3 1 2 .8 6 1 8 .8 9 6 .5 1
S p r i n g 2 0 0 8 M a r s h U n c a g e d C V S C V S 4 1 2 .8 6 1 8 .8 9 6 .5
S p r i n g 2 0 0 8 M a r s h C a g e d G L G L 1 1 2 .8 6 1 8 .8 9 6 .5 1
S p r i n g 2 0 0 8 M a r s h U n c a g e d G L G L 2 1 2 .8 6 1 8 .8 9 6 .5 1
S p r i n g 2 0 0 8 M a r s h C a g e d G L G L 3 1 2 .8 6 1 8 .8 9 6 . 5 1
S p r i n g 2 0 0 8 M a r s h U n c a g e d G L G L 4 1 2 .8 6 1 8 .8 9 6 . 5 1
S p r i n g 2 0 0 8 M a r s h C a g e d G S G S 1 1 2 .8 6 1 8 .8 9 6 .5 1
S p r i n g 2 0 0 8 M a r s h U n c a g e d G S G S 2 1 2 .8 6 1 8 .8 9 6 . 5 I
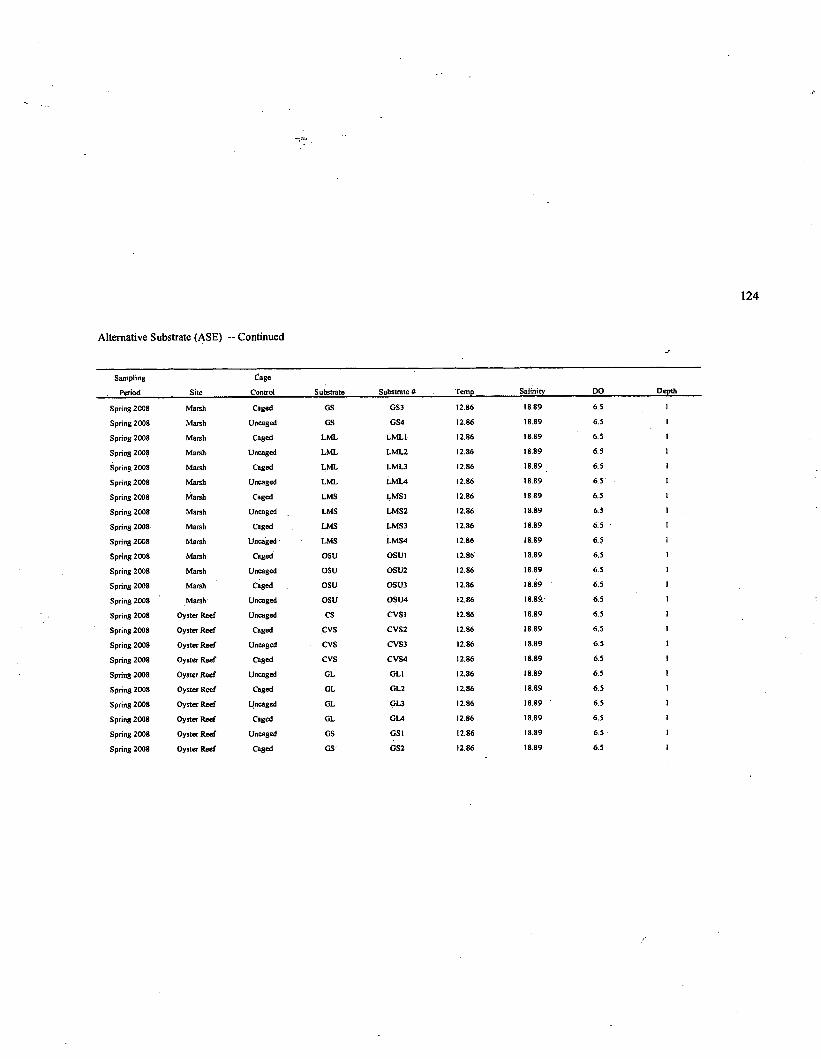
Alternative Substrate (ASE) — Continued
S a m p l i n g
P e r i o d S i t e
C a g e
C o n t r o l S u b s t r a t e S u b s t r a t e # T e m p S a l i n i t y D O D e p t h
S p r i n g 2 0 0 8 M a r s h C a g e d G S G S 3 1 2 .8 6 1 8 .8 9 6 .5
S p r i n g 2 0 0 8 M a r s h U n c a g e d G S G S 4 1 2 .8 6 1 8 .8 9 6 .5
S p r i n g 2 0 0 8 M a r s h C a g e d L M L L M L 1 1 2 .8 6 1 8 .8 9 6 .5
S p r i n g 2 0 0 8 M a r s h U n c a g e d L M L L M L 2 1 2 .8 6 1 8 .8 9 6 .5
S p r i n g 2 0 0 8 M a r s h C a g e d L M L L M L 3 1 2 .8 6 1 8 .8 9 6 . 5
S p r i n g 2 0 0 8 M a r s h U n c a g e d L M L L M L 4 1 2 .8 6 1 8 .8 9 6 .5
S p r i n g 2 0 0 8 M a r s h C a g e d L M S L M S 1 1 2 .8 6 1 8 .8 9 6 .5
S p r i n g 2 0 0 8 M a r s h U n c a g e d L M S L M S 2 1 2 .8 6 1 8 .8 9 6 .5
S p r i n g 2 0 0 8 M a r s h C a g e d L M S L M S 3 1 2 .8 6 1 8 .8 9 6 . 5 1
S p r i n g 2 0 0 8 M a r s h U n c a g e d - L M S L M S 4 1 2 .8 6 1 8 .8 9 6 .5
S p r i n g 2 0 0 8 M a r s h C a g e d O S U O S U ! 1 2 .8 6 1 8 .8 9 6 .5
S p r i n g 2 0 0 8 M a r s h U n c a g e d O S U O S U ? 1 2 .8 6 1 8 .8 9 6 .5
S p r i n g 2 0 0 8 M a r s h C a g e d O S U O S U 3 1 2 .8 6 1 8 .8 9 6 .5 1
S p r i n g 2 0 0 8 M a r s h ' U n c a g e d O S U O S U 4 1 2 .8 6 1 8 .8 9 . 6 .5
S p r i n g 2 0 0 8 O y s t e r R e e f U n c a g e d cs C V S 1 1 2 .8 6 1 8 .8 9 6 .5
S p r i n g 2 0 0 8 O y s t e r R e e f C a g e d C V S C V S 2 1 2 .8 6 1 8 .8 9 6 .5
S p r i n g 2 0 0 8 O y s t e r R e e f U n c a g e d C V S C V S 3 1 2 .8 6 1 8 .8 9 6 . 5 1
S p r i n g 2 0 0 8 O y s t e r R e e f C a g e d C V S C V S 4 1 2 .8 6 1 8 .8 9 6 . 5 IS p r i n g 2 0 0 8 O y s t e r R e e f U n c a g e d G L G L 1 1 2 .8 6 1 8 .8 9 6 .5
S p r i n g 2 0 0 8 O y s t e r R e e f C a g e d G L G L 2 1 2 .8 6 1 8 .8 9 6 . 5 1S p r i n g 2 0 0 8 O y s t e r R e e f U n c a g e d G L G L 3 1 2 .8 6 1 8 .8 9 6 .5
S p r i n g 2 0 0 8 O y s t e r R e e f C a g e d G L G L 4 1 2 .8 6 1 8 .8 9 6 . 5
S p r i n g 2 0 0 8 O y s t e r R e e f U n c a g e d G S G S 1 1 2 .8 6 1 8 .8 9 6 .5 1
S p r i n g 2 0 0 8 O y s t e r R e e f C a g e d G S G S 2 1 2 .8 6 1 8 .8 9 6 .5
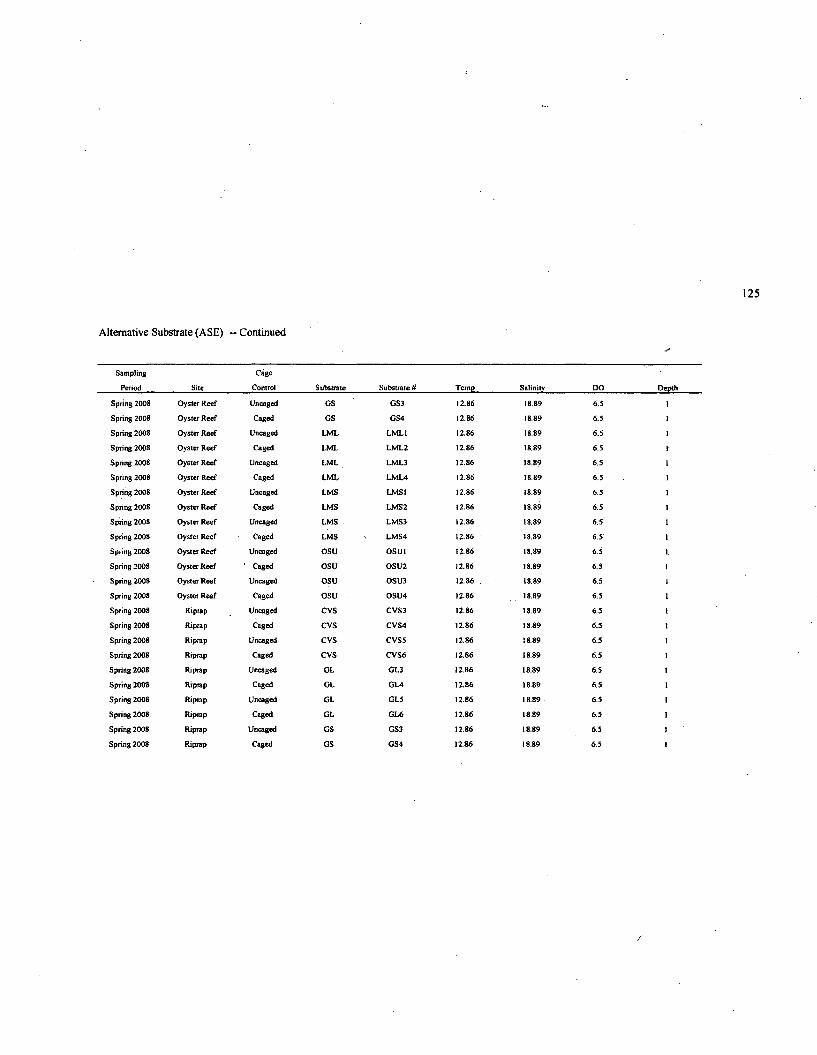
Alternative Substrate (ASE) -- Continued
S a m p l i n g
P e r io d S i t e
C a g e
C o n t r o l S u b s t r a t e S u b s t r a t e if T e m p S a l i n i t y D O D e p t h
S p r i n g 2 0 0 8 O y s t e r R e e f U n c a g e d G S G S 3 1 2 .8 6 1 8 .8 9 6 .5 I
S p r i n g 2 0 0 8 O y s t e r R e e f C a g e d G S G S 4 1 2 .8 6 1 8 .8 9 6 .5
S p r i n g 2 0 0 8 O y s t e r R e e f U n c a g e d L M L L M L 1 1 2 .8 6 1 8 .8 9 6 .5
S p r i n g 2008 O y s t e r R e e f C a g e d . L M L L M L 2 1 2 .8 6 1 8 .8 9 6 .5
S p r i n g 2 0 0 8 O y s t e r R e e f U n c a g e d L M L L M L 3 1 2 .8 6 1 8 .8 9 6 .5
S p r i n g 2 0 0 8 O y s t e r R e e f C a g e d L M L L M L 4 1 2 .8 6 1 8 .8 9 6 .5
S p r i n g 2 0 0 8 O y s t e r R e e f U n c a g e d L M S L M S ! 1 2 .8 6 1 8 .8 9 6 .5 1
S p r i n g 2 0 0 8 O y s t e r R e e f C a g e d L M S L M S 2 1 2 .8 6 1 8 .8 9 6 .5 1
S p r i n g 2 0 0 8 O y s t e r R e e f U n c a g e d L M S L M S 3 1 2 .8 6 1 8 .8 9 6 .5
S p r i n g 2 0 0 8 O y s t e r R e e f C a g e d L M S L M S 4 1 2 - 8 6 1 8 .8 9 6 .5
S p r i n g 2 0 0 8 O y s t e r R e e f U n c a g e d O S U O S U 1 1 2 .8 6 1 8 .8 9 6 .5 1
S p r i n g 2 0 0 8 O y s t e r R e e f C a g e d O S U O S U 2 1 2 .8 6 1 8 .8 9 6 .5
S p r i n g 2 0 0 8 O y s t e r R e e f U n c a g e d O S U O S U 3 1 2 .8 6 . 1 8 .8 9 6 .5
S p r i n g 2 0 0 8 O y s t e r R e e f C a g e d O S U O S U 4 1 2 .8 6 1 8 .8 9 6 .5
S p r i n g 2 0 0 8 R i p r a p U n c a g e d C V S C V S 3 1 2 .8 6 1 8 .8 9 6 .5 I
S p r i n g 2 0 0 8 R i p r a p C a g e d C V S C V S 4 1 2 .8 6 1 8 .8 9 6 . 5 1
S p r i n g 2 0 0 8 R i p r a p U n c a g e d C V S C V S 5 1 2 .8 6 1 8 .8 9 6 .5 I
S p r i n g 2 0 0 8 R i p r a p C a g e d C V S C V S 6 1 2 .8 6 1 8 .8 9 6 . 5 1
S p r i n g 2 0 0 8 R i p r a p U n c a g e d G L G L 3 1 2 .8 6 1 8 .8 9 6 .5 1
S p r i n g 2 0 0 8 R i p r a p C a g e d G L G L 4 1 2 . 8 6 1 8 .8 9 6 . 5 1
S p r i n g 2 0 0 8 R i p r a p U n c a g e d G L G L 5 1 2 .8 6 1 8 .8 9 6 .5 I
S p r i n g 2 0 0 8 R i p r a p C a g e d G L G L 6 1 2 .8 6 1 8 .8 9 6 .5 1
S p r i n g 2 0 0 8 R i p r a p U n c a g e d G S G S 3 1 2 .8 6 1 8 .8 9 6 .5
S p r i n g 2 0 0 8 R i p r a p C a g e d G S G S 4 1 2 .8 6 1 8 .8 9 6 .5 1
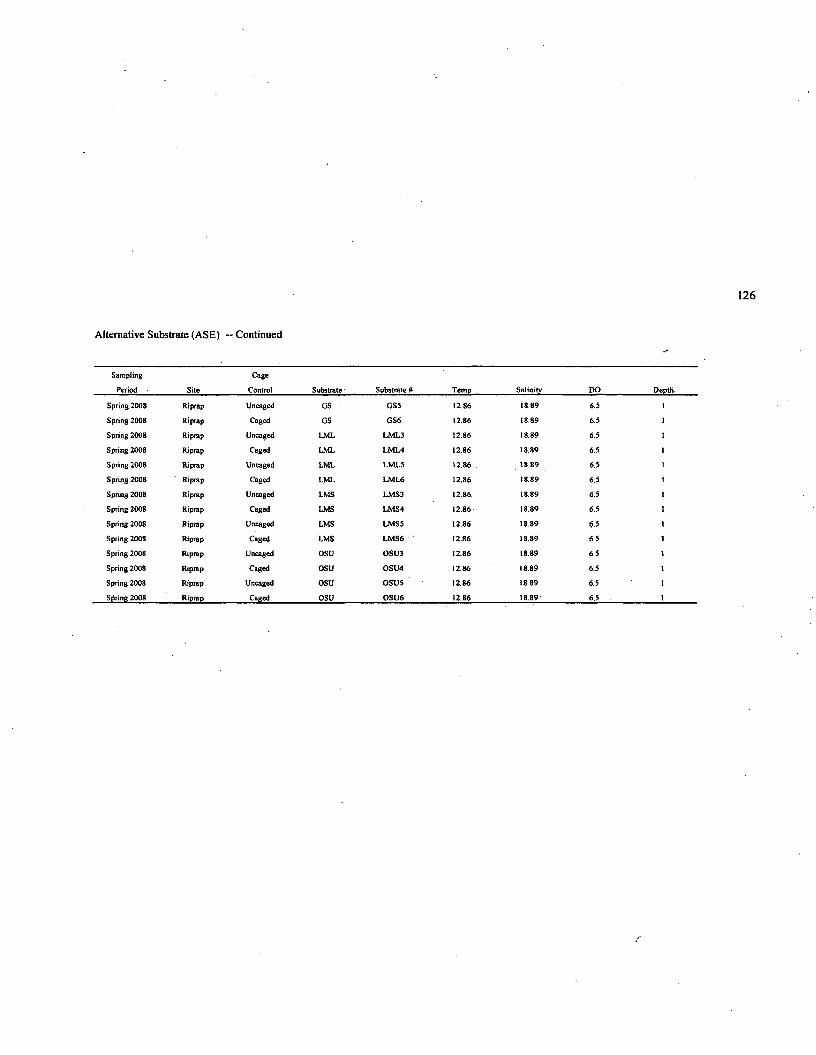
Alternative Substrate (ASE) — Continued
S a m p l i n g
P e r io d S i t e
C a g e
C o n t r o l S u b s t r a t e S u b s t r a t e # T e m p S a l i n i t v D O D e p t h
S p r i n g 2 0 0 8 R i p r a p U n c a g e d G S G S S 1 2 .8 6 1 8 .8 9 6 .5
S p r i n g 2 0 0 8 R i p r a p C a g e d G S G S 6 1 2 .8 6 1 8 .8 9 6 .5 1
S p r i n g 2 0 0 8 R i p r a p U n c a g e d L M L L M L 3 1 2 .8 6 1 8 .8 9 6 .5
S p r i n g 2 0 0 8 R i p r a p C a g e d L M L L M L 4 1 2 .8 6 1 8 .8 9 6 .5
S p r i n g 2 0 0 8 R i p r a p U n c a g e d L M L L M L 5 1 2 .8 6 1 8 . 8 9 6 .5 1
S p r i n g 2 0 0 8 R i p r a p C a g e d L M L L M L 6 1 2 .8 6 1 8 .8 9 6 .5
S p r i n g 2 0 0 8 R i p r a p U n c a g e d L M S L M S 3 1 2 .8 6 1 8 .8 9 6 .5
S p r i n g 2 0 0 8 R i p r a p C a g e d L M S L M S 4 1 2 .8 6 1 8 .8 9 6 .5
S p r i n g 2 0 0 8 R i p r a p U n c a g e d L M S L M S 5 1 2 .8 6 1 8 .8 9 6 5 1
S p r i n g 2 0 0 8 R i p r a p C a g e d L M S L M S 6 1 2 .8 6 1 8 .8 9 6 .5 1
S p r i n g 2 0 0 8 R i p r a p U n c a g e d O S U O S U 3 1 2 .8 6 1 8 .8 9 6 .5 1
S p r i n g 2 0 0 8 R i p r a p C a g e d O S U O S U 4 1 2 .8 6 1 8 .8 9 6 .5 1
S p r i n g 2 0 0 8 R i p r a p U n c a g e d O S U O S U 5 1 2 .8 6 1 8 .8 9 6 .5
S p r i n g 2 0 0 8 R i p r a p C a g e d O S U O S U 6 1 2 .8 6 1 8 .8 9 6 .5 1
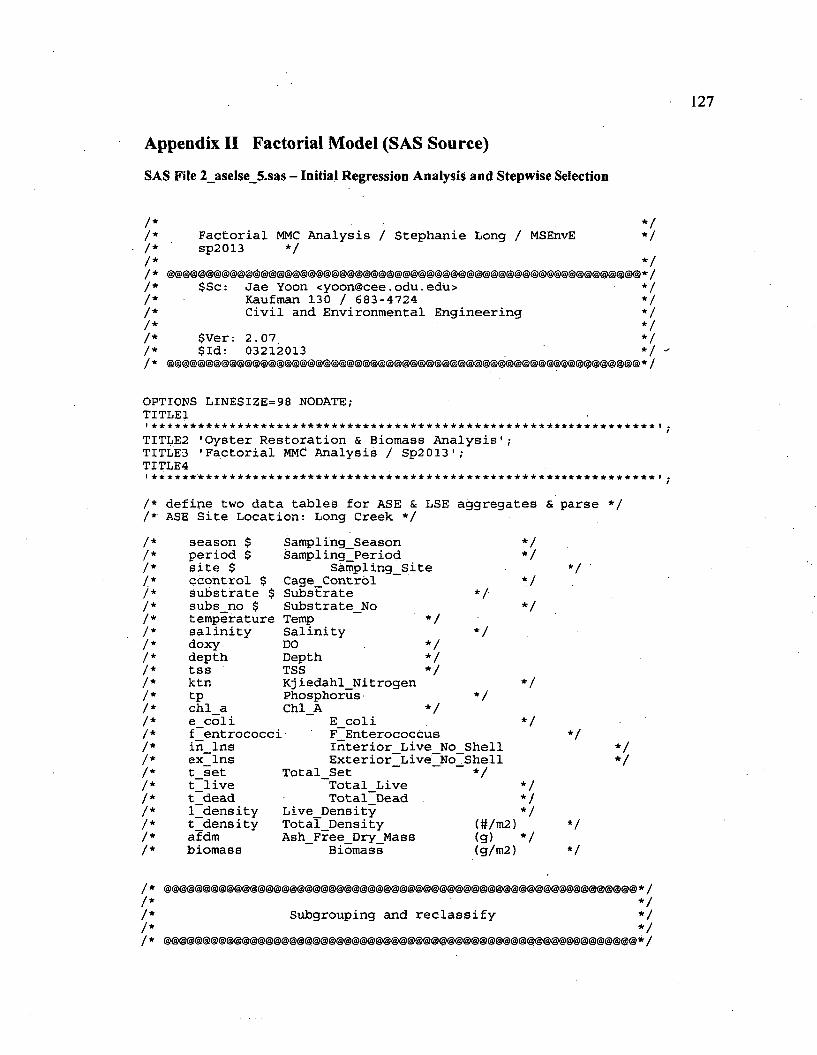
127
Appendix II Factorial Model (SAS Source)
SAS File 2_aselse_5.sas - Initial Regression Analysis and Stepwise Selection
/ */ */ */ */ */ */ */ */ */ */ */ *
F a c t o r i a l MMC A n a l y s i s / S t e p h a n i e L o n g / MSEnvE s p 2 0 1 3 * /
$ S c : J a e Y oon <y o o n @ c e e . o d u . e d u >K a u f m a n 1 3 0 / 6 8 3 - 4 7 2 4C i v i l a n d E n v i r o n m e n t a l E n g i n e e r i n g
$ V e r : 2 . 0 7 $ I d : 0 3 2 1 2 0 1 3
* /* /
*/* /* /* /* /* /* /* /* /
OPTIONS L IN E S IZ E = 9 8 NODATE;TITLE1I * * * * * * * * * * * * * * * * * * * * * * * * * * * * * * * * * * * * * * * * * * * * * * * * * * * * * * * * * * * * * * * * 1
TITLE2 ' O y s t e r R e s t o r a t i o n & B i o m a s s A n a l y s i s ' ;T ITLES ' F a c t o r i a l MMC A n a l y s i s / S p 2 0 1 3 ' ;T ITLE41 * * * * * * ' * * * * * * * * * * * * * * * * * * * * * * * * * * * * * * * * * * * * * * * * * * * * * * * * * * * * * * * * * * I
/ * d e f i n e tw o d a t a t a b l e s f o r ASE & LSE a g g r e g a t e s & p a r s e * / / * ASE S i t e L o c a t i o n : L o n g C r e e k * /
/ * s e a s o n $ S a m p l i n g _ S e a s o n * // * p e r i o d $ S a m p l i n g _ P e r i o d * // * s i t e $ S a m p l i n g _ S i t e/ * c c o n t r o l $ C a g e _ C o n t r o l * // * s u b s t r a t e $ S u b s t r a t e * // * s u b s _ n o $ S u b s t r a t e _ N o * // * t e m p e r a t u r e Temp * // * s a l i n i t y S a l i n i t y * // * d o x y DO * // * d e p t h D e p t h * // * t s s TSS * // * k t n Kj i e d a h l _ N i t r o g e n * // * t p P h o s p h o r u s * // * c h l _ a C h l_ A * // * e c o l i E c o l i * // * f e n t r o c o c c i F E n t e r o c o c C u s/ * i n _ l n s I n t e r i o r _ L i v e _ N o _ S h e l l/ * e x _ l n s E x t e r i o r _ L i v e _ N o _ S h e l l/ * t _ s e t T o t a l _ S e t " * // * t _ l i v e T o t a l _ L i v e * // * t _ d e a d T o t a l _ D e a d * // * l _ d e n s i t y L i v e _ D e n s i t y * // * t _ d e n s i t y T o t a l _ D e n s i t y (# /m 2 )/ * a f d m A s h _ F r e e _ D r y _ M a s s (g) * // * b i o m a s s B i o m a s s (g /m 2 )
* /* /
* /
* /
/ */ */ */ */ *
S u b g r o u p i n g a n d r e c l a s s i f y
* /* /* /*/
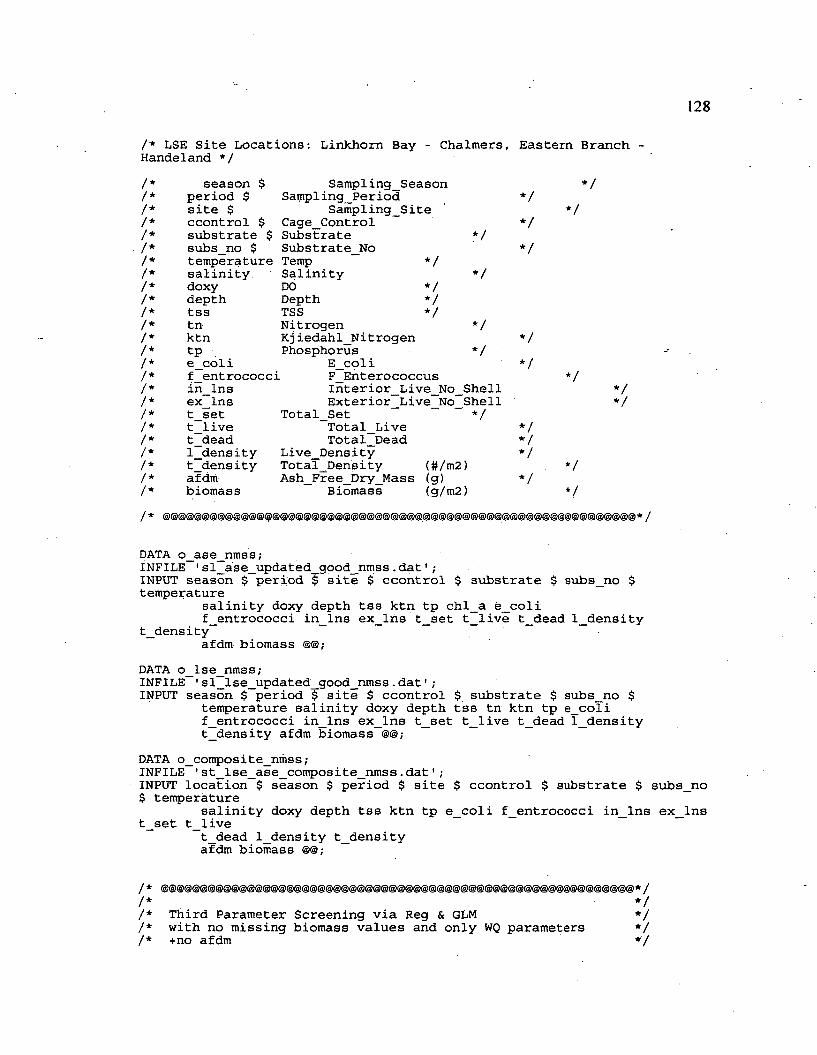
128
/ * LSE S i t e L o c a t i o n s : L i n k h o r n B a y - C h a l m e r s , E a s t e r n B r a n c h - H a n d e l a n d * /
/ * s e a s o n $ S a m p l i n g _ S e a s o n * // * p e r i o d $ S a m p l i n g _ P e r i o d * // * s i t e $ S a m p l i n g _ S i t e * // * c c o n t r o l $ C a g e _ C o n t r o l * // * s u b s t r a t e $ S u b s t r a t e * // * s u b s _ n o $ S u b s t r a t e _ N o * // * t e m p e r a t u r e Temp * // * s a l i n i t y . S a l i n i t y * // * d o x y DO * // * d e p t h D e p t h * // * t s s TSS * // * t n N i t r o g e n * // * k t n Kj i e d a h l _ N i t r o g e n * // * t p , P h o s p h o r u s * // * e c o l i E c o l i * // * f e n t r o c o c c i F E n t e r o c o c c u s * // * i n _ l n s I n t e r i o r _ L i v e _ N o _ S h e l l * // * e x _ l n s E x t e r i o r . L i v e No S h e l l * // * t _ s e t T o t a l _ S e t * // * t _ l i v e T o t a l _ L i v e * // * t _ d e a d T o t a l _ D e a d * // * l _ d e n s i t y L i v e _ D e n s i t y * // * t _ d e n s i t y T o t a l ^ D e n s i t y ( # /m 2 ) * // * a f d m A s h _ F r e e _ D r y _ M a s s (g) * // * b i o m a s s B i o m a s s ( g /m 2 ) * /
/ * @@@@@@@@@@@@@@@@@@@@@@@@@@@@@@@@@@@@@@@@@@@@@@@@@@@@@@@@@@@@
DATA o _ a s e _ n m s s ;IN F IL E ' s l _ a s e _ u p d a t e d _ g o o d _ _ n m s s . d a t 1 ;INPUT s e a s o n $ p e r i o d $ s i t e $ c c o n t r o l $ s u b s t r a t e $ s u b s _ n o $ t e m p e r a t u r e
s a l i n i t y d o x y d e p t h t s s k t n t p c h l _ a e _ c o l i f _ e n t r o c o c c i i n _ l n s e x _ l n s t _ s e t t _ l i v e t _ d e a d l _ d e n s i t y
t _ d e n s i t ya f d m b i o m a s s @@;
DATA o _ l s e _ n m s s ;IN F IL E ' s l _ l s e _ u p d a t e d _ g o o d _ n m s s . d a t ' ;INPUT s e a s o n $ p e r i o d $ s i t e $ c c o n t r o l $ s u b s t r a t e $ s u b s _ n o $
t e m p e r a t u r e s a l i n i t y d o x y d e p t h t s s t n k t n t p e _ c o l i f _ e n t r o c o c c i i n _ l n s e x _ l n s t _ s e t t _ l i v e t _ d e a d l _ d e n s i t y t _ d e n s i t y a f d m b i o m a s s @@;
DATA o _ c o m p o s i t e _ n m s s ;IN F IL E ' s t _ l s e _ a s e _ c o m p o s i t e _ n m s s . d a t ' ;INPUT l o c a t i o n $ s e a s o n $ p e r i o d $ s i t e $ c c o n t r o l $ s u b s t r a t e $ s u b s _ n o $ t e m p e r a t u r e
s a l i n i t y d o x y d e p t h t s s k t n t p e _ c o l i f _ e n t r o c o c c i i n _ l n s e x _ l n s t _ s e t t _ l i v e
t _ d e a d l _ d e n s i t y t _ d e n s i t y a f d m b i o m a s s @@;
/ * @@@@@@@@@@@@@@@@@@@@@@@@@@@@@@@@@@@@@@@@@@@@@@@@@@@@@@@@@@@@ * / / * * / / * T h i r d P a r a m e t e r S c r e e n i n g v i a R e g & GLM * // * w i t h n o m i s s i n g b i o m a s s v a l u e s a n d o n l y WQ p a r a m e t e r s * // * + n o a f d m * /
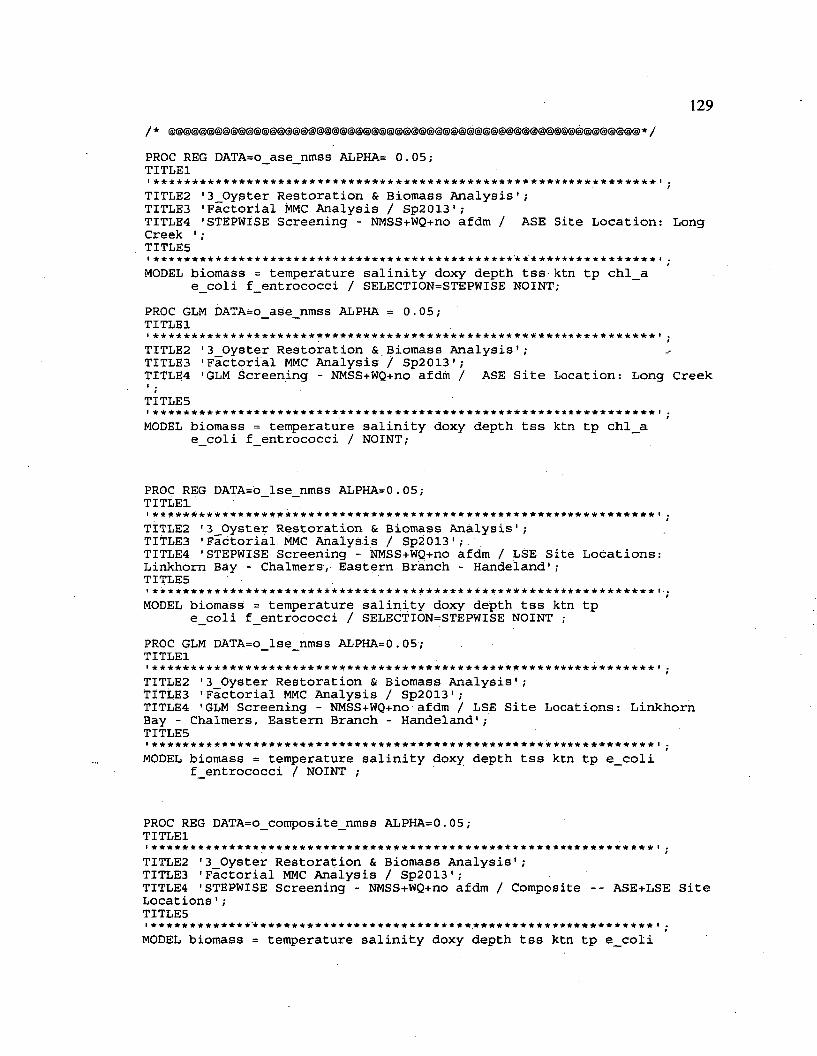
129/ * @@@@@@@@@@@@@@@@@@@@@@@@@@@@@@@@@@@@@@@@@@@@@@@@@@@@@@@@@@@@*/
PROC REG D A T A = o _ ase_ n m ss ALPHA= 0 . 0 5 ;T IT L E 1I * * * * * * * * * * * * * * * * * * * * * * * * * * * * * * * * * * * * * * * * * * * * * * * * * * * * * * * * * * * * * * * * I .
IT IT L E 2 '3 _ _ O y s t e r R e s t o r a t i o n & B i o m a s s A n a l y s i s ' ;T IT L E 3 ' F a c t o r i a l MMC A n a l y s i s / S p 2 0 1 3 ' , -T IT L E 4 'STEPW ISE S c r e e n i n g - NMSS+WQ+no a f d m / ASE S i t e L o c a t i o n : L o n g C r e e k ' ;T ITLE5t * * * * * * * * * * * * * * * * * * * * * * * * * * * * * * * * * * * * * * * * * * * * * * * * * * * * * * * * * * * * * * * * * .IMODEL b i o m a s s = t e m p e r a t u r e s a l i n i t y d o x y d e p t h t s s k t n t p c h l _ a
e _ c o l i f _ e n t r o c o c c i / SELECTION=STEPWISE NOINT;
PROC GLM DATA=0_ a s e _ n m s S ALPHA = 0 . 0 5 ;T IT L E 1• * * * * * * * * * * * * * * * * * * * * * * * * * * * * * * * * * * * * * * * * * * * * * * * * * * * * * * * * * * * * * * * * 1 .
t
T IT L E 2 ' 3 _ O y s t e r R e s t o r a t i o n & B i o m a s s A n a l y s i s ' ;T ITLES ' F a c t o r i a l MMC A n a l y s i s / S p 2 0 1 3 ' ;T IT L E 4 'GLM S c r e e n i n g - NMSS+WQ+no a f d m / ASE S i t e L o c a t i o n : L o n g C r e e kI .
T IT L E 51 * * * * * * * * * * * * * * * * * * * * * * * * * * * * * * * * * * * * * * * * * * * * * * * * * * * * * * * * * * * * * * * * I
/
MODEL b i o m a s s = t e m p e r a t u r e s a l i n i t y d o x y d e p t h t s s k t n t p c h l _ a e _ c o l i f _ e n t r o c o c c i / NOINT;
PROC REG D A T A = o _ ls e _ n m s s A L P H A = 0 .0 5 ;TIT L E 1
/
TIT L E 2 ' 3 _ O y s t e r R e s t o r a t i o n & B i o m a s s A n a l y s i s ' ;T IT L E 3 ' F a c t o r i a l . MMC A n a l y s i s / S p 2 0 1 3 ' ;T IT L E 4 'STEPW ISE S c r e e n i n g - NMSS+WQ+no a f d m / LSE S i t e L o c a t i o n s : L i n k h o r n B a y - C h a l m e r s , E a s t e r n B r a n c h - H a n d e l a n d ' ;T IT L E 5
fMODEL b i o m a s s = t e m p e r a t u r e s a l i n i t y d o x y d e p t h t s s k t n t p
e _ c o l i f _ e n t r o c o c c i / SELECTION=STEPWISE NOINT ;
PROC GLM DATA=0_ l s e _ n m s s A L P H A = 0 .0 5 ;T ITLE1
/T IT L E 2 ' 3 _ O y s t e r R e s t o r a t i o n & B i o m a s s A n a l y s i s ' ;T IT L E 3 ' F a c t o r i a l MMC A n a l y s i s / S p 2 0 1 3 ' ;T IT L E 4 'GLM S c r e e n i n g - NMSS+WQ+no a f d m / LSE S i t e L o c a t i o n s : L i n k h o r n B ay - C h a l m e r s , E a s t e r n B r a n c h - H a n d e l a n d ' ;T ITLE5I **************************************************************** I .
/
MODEL b i o m a s s = t e m p e r a t u r e s a l i n i t y d o x y d e p t h t s s k t n t p e _ c o l i f _ e n t r o c o c c i / NOINT ;
PROC REG D A T A = o _ c o m p o s i t e _ n m s s A L P H A = 0 .0 5 ;TITLE1
f
T ITLE2 ' 3 _ O y s t e r R e s t o r a t i o n & B i o m a s s A n a l y s i s ' ;T IT L E 3 ' F a c t o r i a l MMC A n a l y s i s / S p 2 0 1 3 ' ;T IT L E 4 'STEPW ISE S c r e e n i n g - NMSS+WQ+no a f d m / C o m p o s i t e - - ASE+LSE S i t e L o c a t i o n s ' ;T IT L E 5
I * * * * * * * * * * * * ★ " * * * * * * * * * * * * * * * * * * * * * * * * * * * * * * * * * * * * * * * * * * * * * * * * * * * t .f
MODEL b i o m a s s = t e m p e r a t u r e s a l i n i t y d o x y d e p t h t s s k t n t p e _ c o l i
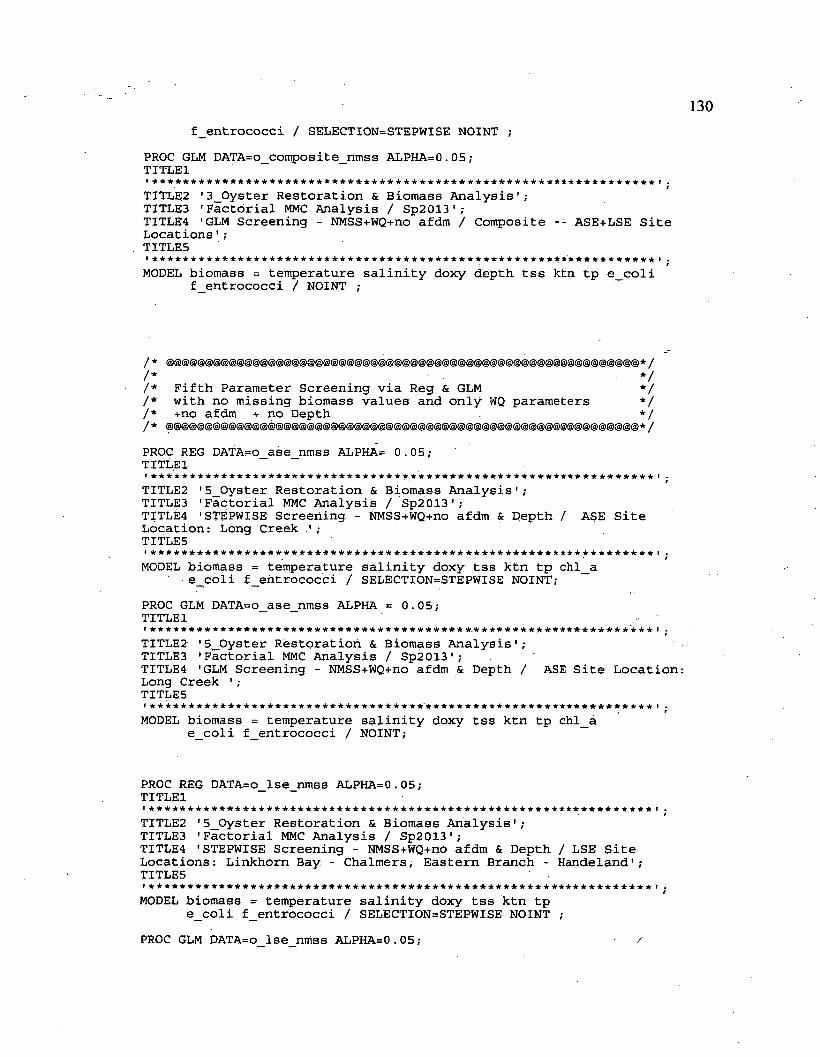
f _ e n t r o c o c c i / SELECTION=STEPWISE NOINT ;
PROC GLM D A T A = o _ c o m p o s i t e _ n m s s A L P H A = 0 .0 5 ;T IT L E 1i **************************************************************** i .T IT L E 2 ' 3 _ O y s t e r R e s t o r a t i o n & B i o m a s s A n a l y s i s ' ;T IT L E 3 ' F a c t o r i a l MMC A n a l y s i s / S p 2 0 1 3 ' ;T IT L E 4 'GLM S c r e e n i n g - NMSS+WQ+no a f d m / C o m p o s i t e - - ASE+LSE S i t e L o c a t i o n s ' ;T IT L E 5I **************************************************************** I .
/
MODEL b i o m a s s = t e m p e r a t u r e s a l i n i t y d o x y d e p t h t s s k t n t p e _ c o l i f _ e n t r o c o c c i / NOINT ;
/ * @@@@@@@@@@@@@@@@@@@@@@@@@@@@@@@@@@@@@@@@@@@@@@@@@@@@@@@@@@@@* // * * // * F i f t h P a r a m e t e r S c r e e n i n g v i a R e g & GLM * // * w i t h n o m i s s i n g b i o m a s s v a l u e s a n d o n l y WQ p a r a m e t e r s * // * + no a f d m + n o D e p t h * // * @@@@@@@@@@@@@@@@@@@@@@@@@@@@@@@@@@@@@@@@@@@@@@@@@@@@@@@@@@@@* /
PROC REG DATA=0_ a s e _ n m s s ALPHA= 0 . 0 5 ;T IT L E 1
. t
TITLE2 ' 5 _ O y s t e r R e s t o r a t i o n & B i p m a s s A n a l y s i s ' ;T ITLE3 ' F a c t o r i a l MMC A n a l y s i s / S p 2 0 1 3 ' ;T IT L E 4 'STEPW ISE S c r e e n i n g - NMSS+WQ+no a f d m & D e p t h / ASE S i t e L o c a t i o n : L o n g C r e e k ' ;T ITLE5I ★★★★★★★★★★♦★★★★★★★♦★★★★★★★★★★♦★★★★★★★★★★★★★★★★★★★★★★★★★★★★★★★it** I .
■ t
MODEL b i o m a s s = t e m p e r a t u r e s a l i n i t y d o x y t s s k t n t p c h l _ a e _ c o l i f _ e n t r o c o c c i / SELECTION=STEPWISE NOINT;
PROC GLM DATA=0_ a s e _ n m s s ALPHA = 0 . 0 5 ;T IT L E 1I * . ★ I .
t
T IT L E 2 ' 5 _ O y s t e r R e s t o r a t i o n & B i o m a s s A n a l y s i s ' ;T IT L E 3 ' F a c t o r i a l MMC A n a l y s i s / S p 2 0 1 3 ' ;T IT L E 4 'GLM S c r e e n i n g - NMSS+WQ+no a f d m & D e p t h / ASE S i t e L o c a t i o n L o n g C r e e k ' ;T ITLE5I ************* * * ******************* * * **************************** I .
f
MODEL b i o m a s s = t e m p e r a t u r e s a l i n i t y d o x y t s s k t n t p c h l _ a e _ c o l i f _ e n t r o c o c c i / NOINT;
PROC REG D A T A = 0 _ lse _ n m s9 A L P H A = 0 .0 5 ;TIT L E 1i * * * * * * * * * * * * * * * * * * * * * * * * * * * * * * * * * * * * * * * * * * * * * * * * * * * * * * * * * * * * * * * * i .
/
TIT L E 2 ' 5 _ 0 y s t e r R e s t o r a t i o n & B i o m a s s A n a l y s i s ' ;T IT L E 3 ' F a c t o r i a l MMC A n a l y s i s / S p 2 0 1 3 ' ;T IT L E 4 ' STEPWISE S c r e e n i n g - NMSS+WQ+no a f d m & D e p t h / LSE S i t e L o c a t i o n s : L i n k h o r n B a y - C h a l m e r s , E a s t e r n B r a n c h - H a n d e l a n d ' ; T ITLE5• * * * * * * * * * * * * * * * * * * * * * * * * * * * * * * * * * * * * * * * * * * * * * * * * * * * * * * * * * * * * * * * * I .
/
MODEL b i o m a s s = t e m p e r a t u r e s a l i n i t y d o x y t s s k t n t pe _ c o l i f _ e n t r o c o c c i / SELECTION=STEPWISE NOINT ;
PROC GLM D A T A = o _ ls e _ n m s s A L P H A = 0 .0 5 ;
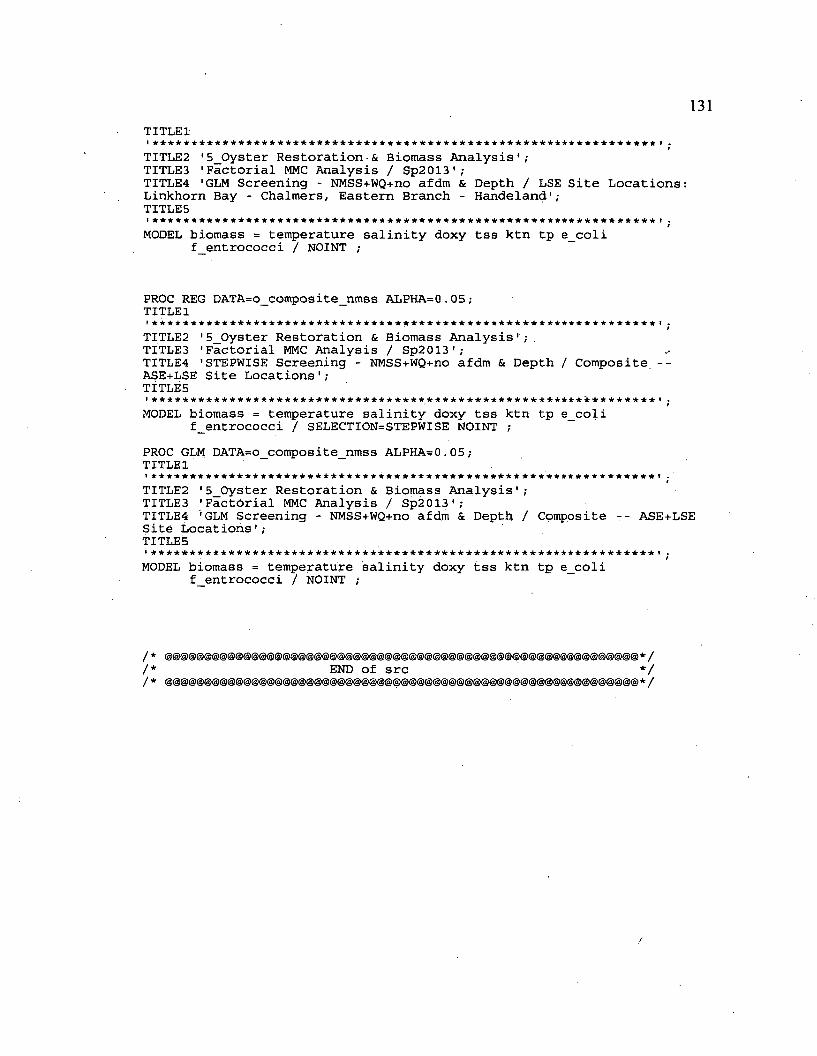
131T IT L E !i * * * * * * * * * * * * * * * * * * * * * * * * * * * * * * * * * * * * * * * * * * * * * * * * * * * * * * * * * * * * * * * * i .,
T IT L E 2 ' 5 _ 0 y s t e r R e s t o r a t i o n •& B i o m a s s A n a l y s i s ' ;T IT L E 3 ' F a c t o r i a l MMC A n a l y s i s / S p 2 0 1 3 ' ;T IT L E 4 'GLM S c r e e n i n g - NMSS+WQ+no a f d m & D e p t h / LSE S i t e L o c a t i o n s : L i n k h o r n B a y - C h a l m e r s , E a s t e r n B r a n c h - H a n d e l a n d ' ;T IT L E 5
IMODEL b i o m a s s = t e m p e r a t u r e s a l i n i t y d o x y t s s k t n t p e _ c o l i
f e n t r o c o c c i / NOINT ;
PROC REG D A T A = o _ c o m p o s i t e _ n m s s A L P H A = 0 .0 5 ;T IT L E 1
I * * * * * * * * * * * * * * * * * * * * * * * * * * * * * * * * * * * * * * * * * * * * * * * * * * * * * * * * * * * * * * * * I .
TIT L E 2 ’ 5 _ 0 y s t e r R e s t o r a t i o n & B i o m a s s A n a l y s i s ' ; .T IT L E 3 ' F a c t o r i a l MMC A n a l y s i s / S p 2 0 1 3 ' ;T IT L E 4 'STEPW ISE S c r e e n i n g - NMSS+WQ+no a f d m & D e p t h / C o m p o s i t e . - - ASE+LSE S i t e L o c a t i o n s ' ;T ITLES
#
MODEL b i o m a s s = t e m p e r a t u r e s a l i n i t y d o x y t s s k t n t p e _ c o l i f _ e n t r o c o c c i / SELECTION=STEPWISE NOINT ;
PROC GLM D A T A = o _ c o m p o s i t e _ n m s s A L P H A = 0 .0 5 ;T IT L E 1» ★★★★★★★★★★★★★★★★★★★★★★★★★★★★★★★★★★★★★★★★★★★★★★★★★★★★★★★★★♦★★★★♦Hr I .
f
T IT L E 2 ' 5 _ 0 y s t e r R e s t o r a t i o n & B i o m a s s A n a l y s i s ' ;T IT L E 3 ' F a c t o r i a l MMC A n a l y s i s / S p 2 0 1 3 ' ;T IT L E 4 'GLM S c r e e n i n g - NMSS+WQ+no a f d m & D e p t h / C o m p o s i t e - - ASE+LSE S i t e L o c a t i o n s ' ;T IT L E 5
i i .tMODEL b i o m a s s = t e m p e r a t u r e s a l i n i t y d o x y t s s k t n t p e _ c o l i
f _ e n t r o c o c c i / NOINT ;
/ * @@@@@@@@@@@@@@@@@@@@@@@@@@@@@@@@@@@@@@@@@@@@@@@@@@@@@@@@@@@@* / / * END o f s r c * // * @@@@@@@@@@@@@@@@@@@@@@@@@@@@@@@@@@@@@@@@@@@@@@@@@@@@@@@@@@@@* /
Appendix II Factorial Model (SAS Source) - (Continued)
SAS File 2_aselse_21.sas - Models From Regression Analysis For All Sites/*/*/ */ */*/*/*/*/ */*/*/■*/*
F a c t o r i a l MMC A n a l y s i s / S t e p h a n i e L o n g / MSEnvE s p 2 0 1 3 * /ASE 2 0 0 8 O y s t e r - R e e f CS - - > CVS
$ S c : J a e Y o o n <y o o n @ c e e . o d u . e d u >K a u f m a n 1 3 0 / 6 8 3 - 4 7 2 4C i v i l a n d E n v i r o n m e n t a l E n g i n e e r i n g
$ V e r : 2 . 0 7 $ I d : 0 3 2 1 2 0 1 3
*/*/*/
*/ /
*/ */ */ */ */ */
/
OPTIONS L IN E S IZ E = 9 8 NODATE;T IT L E 1
T IT L E 2 ' O y s t e r R e s t o r a t i o n & B i o m a s s A n a l y s i s ' ; T IT L E 3 ' F a c t o r i a l MMC A n a l y s i s / S p 2 0 1 3 ' ;T ITLE4
/ * d e f i n e tw o d a t a t a b l e s f o r ASE & LSE a g g r e g a t e s & p a r s e * / / * ASE S i t e L o c a t i o n : L o n g C r e e k * /
/ * s e a s o n $/ * p e r i o d $/ * s i t e $/ * c c o n t r o l $/ * s u b s t r a t e $/ * s u b s _ n o $/ * t e m p e r a t u r e/ * s a l i n i t y/ * d o x y/ * d e p t h/ * t s s/ * k t n/ * t p/ * c h l _ a/ * e _ c o l i/ * f _ e n t r o c o c c i/ * i n _ l n s/ * e x _ l n s/ * t _ s e t/ * t _ l i v e/ * t _ d e a d/ * l _ d e n s i t y/ * t _ d e n s i t y/ * a f d m j
/ * b i o m a s s
S am p1 i n g _ S e a s o n S a m p l i n g _ P e r i o d .
S a m p l i n g _ S i t e C a g e _ C o n t r o l S x x b s t r a t e S u b s t r a t e No
*/' />/' /
' /
S a l i n i t y DOD e p t h TSSK j i e d a h l _ N i t r o g e n P h o s p h o r u s C h l_ A
E _ c o l iF _ E n t e r o c o c c u s I n t e r i o r _ L iv e _ N o _ E x t e r i o r _ L iv e _ N o _
T o t a l _ S e tT o t a l _ L i v e T o t a l _ D e a d
L i v e _ D e n s i t y T o t a l _ D e n s i t y A s h _ F r e e _ D r y _ M a s s
B i o m a s s
* /
* /
* /*/
* /
* /
* /
* /
S h e l lS h e l l
* /
* /* /
* /* /* /
( # / m 2 ) * /(g) * /(g /m 2 ) * /
/ * @@@@@@@@@@@@@@@@@@@@@@@@@@@@@@@@@@@@@@@@@@@@@@@@@@@@@@@@@@@@* /
/ * * / / * S u b g r o u p i n g a n d r e c l a s s i f y t /
133
/ * * // * @@@@@@@@@@@@@@@@@@@@@@@@@@@@@@@@@@@@@@@@@@@@@@@@@@@@@@@@@@@@* /
/ * LSE S i t e L o c a t i o n s : L i n k h o r n B a y - C h a l m e r s , E a s t e r n B r a n c h - H a n d e l a n d * /
/ * s e a s o n $ S a m p l i n g S e a s o n * // * p e r i o d $ S a m p l i n g P e r i o d * // * s i t e $ S a m p l i n g S i t e * // * c c o n t r o l $ C a g e _ C o n t r o l * // * s u b s t r a t e $ S u b s t r a t e * // * s u b s _ n o $ S u b s t r a t e _ N o * // * t e m p e r a t u r e Temp * // * s a l i n i t y S a l i n i t y * // * d o x y DO * // * d e p t h D e p t h * // * t s s TSS * // * t n N i t r o g e n * // * k t n Kj i e d a h l _ N i t r o g e n * // * t p P h o s p h o r u s * // * e c o l i E c o l i * // * f e n t r o c o c c i F E n t e r o c o c c u s * // * i n _ l n s I n t e r i o r _ L i v e _ N o _ S h e l l/ * e x _ l n s E x t e r i o r L i v e No S h e l l/ * t _ s e t T o t a l _ S e t * // * t _ l i v e T o t a l _ L i v e * // * t _ d e a d T o t a l _ D e a d * / .
/ * l _ d e n s i t y L i v e _ D e n s i t y * // * t _ d e n s i t y T o t a l _ D e n s i t y ( # / m 2 ) * // * a f d m A s h _ F r e e _ D r y _ M a s s (g) * // * b i o m a s s B i o m a s s ( g / m 2 ) * /
/ * @@@@@@@@@@@@@@@@@@@@@@@@@@@@@@@@@@@@@@@@@@@@@@@@@@@@@@@@@@@@* /
DATA o _ a s e _ n m s s , -IN F IL E ' s l _ a s e _ u p d a t e d _ g o o d _ n m s s . d a t ' ;INPUT s e a s o n $ p e r i o d $ s i t e $ c c o n t r o l $ s u b s t r a t e $ s u b s _ n o $ t e m p e r a t u r e
s a l i n i t y d o x y d e p t h t s s k t n t p c h l _ a e _ c o l i f _ e n t r o c o c c i i n _ l n s e x _ l n s t _ s e t t _ l i v e t _ d e a d l _ d e n s i t y
t _ d e n s i t ya f d m b i o m a s s
DATA o _ l s e _ n m s s ;IN F IL E ' s l _ l s e _ u p d a t e d _ g o o d _ n m s s . d a t ' ;INPUT s e a s o n $ p e r i o d $ s i t e $ c c o n t r o l $ s u b s t r a t e $ s u b s _ n o $
t e m p e r a t u r e s a l i n i t y d o x y d e p t h t s s t n k t n t p e _ c o l i f _ e n t r o c o c c i i n _ l n s e x _ l n s t _ s e t t _ l i v e t _ d e a d l _ d e n s i t y t _ d e n s i t y a f d m b i o m a s s @@;
DATA o _ c o m p o s i t e _ n m s s ;IN F IL E ' s t _ l s e _ a s e _ c o m p o s i t e _ n m s s . d a t ' ;INPUT l o c a t i o n $ s e a s o n $ p e r i o d $ s i t e $ c c o n t r o l $ s u b s t r a t e $ s u b s _ n o $ t e m p e r a t u r e
s a l i n i t y d o x y d e p t h t s s k t n t p e _ c o l i f _ e n t r o c o c c i i n _ l n s e x _ l n s t _ s e t t _ l i v e
t _ d e a d l _ d e n s i t y t _ d e n s i t y a f d m b i o m a s s @@;
/ * @@@@@@@@@@@@@@@@@@@@@@@@@@@@@@@@@@@@@@@@@@@@@@@@@@@@@@@@@@@@* /
/ * * /
134/ * S e v e n t h GLM w i t h F a c t o r i a l & MMC * // * w i t h n o m i s s i n g b i o m a s s v a l u e s a n d o n l y WQ p a r a m e t e r s * // * + no a f d m + n o D e p t h * // * w i t h f a c t o r e d t e r m s * // * @@@@@@@@@@@@@@@@@@@@@@@@@@@@@@@@@@@@@@@@@@@@@@@@@@@@@@@@@@@@* /
PROC GLM D A T A = o _ a s e _ n m ss ALPHA = 0 . 0 5 ;T IT L E 1
I ★ ★ ★ ★ ★ ★ ★ ★ ★ ★ ★ ★ ★ ★ ★ ★ ♦ ★ ★ ★ ★ ★ ★ ★ ★ ★ ★ ★ ★ ★ ★ ★ ★ ★ ★ ♦ ★ ★ ★ ★ ★ ★ ★ ★ ★ ★ ★ ★ ★ ★ ★ ★ ★ ★ ♦ ★ ★ ★ ★ ★ ★ ★ ★ a t .r
T IT L E 2 17 _ O y s t e r R e s t o r a t i o n & B i o m a s s A n a l y s i s ' ;T IT L E 3 ' F a c t o r i a l MMC A n a l y s i s / S p 2 0 1 3 ' ;T IT L E 4 'GLM S c r e e n i n g - NMSS+WQ+no a f d m & D e p t h / ASE S i t e L o c a t i o n : L o n g C r e e k ' ;T ITLESI * * * * * * * * * * * * * * * * * * * * * * * * * * * * * * * * * * * * * * * * * * * * * * * * * * * * * * * * * * * * * * * * * t •
t
CLASS s e a s o n p e r i o d s i t e c c o n t r o l s u b s t r a t e s u b s _ n o t e m p e r a t u r e s a l i n i t y d o x y t s s k t n t p c h l _ a e _ c o l i f _ e n t r o c o c c i ;
MODEL b i o m a s s = s e a s o n p e r i o d s u b s _ n o s i t e c c o n t r o l s u b s t r a t e k t n e _ c o l i t e m p e r a t u r e | t p | c h l _ a / NOINT;
MEANS s e a s o n p e r i o d s u b s _ n o s i t e c c o n t r o l s u b s t r a t e k t n e _ c o l i t e m p e r a t u r e | t p |C h l _ a / DUNCAN;
PROC GLM DATA=0_ l s e _ n m s s A L P H A = 0 .0 5 ;TIT L E 1
t
T IT L E 2 ’ 6 _ O y s t e r R e s t o r a t i o n & B i o m a s s A n a l y s i s ' ;T ITLE3 ' F a c t o r i a l MMC A n a l y s i s / S p 2 0 1 3 ' ;T IT L E 4 'GLM S c r e e n i n g - NMSS+WQ+no a f d m & D e p t h / LSE S i t e L o c a t i o n s : L i n k h o r n B a y - C h a l m e r s , E a s t e r n B r a n c h r H a n d e l a n d 1 ;TITLES
/
CLASS s e a s o n p e r i o d s i t e c c o n t r o l s u b s t r a t e s u b s _ n o t e m p e r a t u r e s a l i n i t y d o x y
t s s k t n t p e _ c o l i ;
MODEL b i o m a s s = s e a s o n p e r i o d s i t e c c o n t r o l s u b s t r a t e s u b s _ n o e _ c o l i | d o x y | t p / NOINT;
MEANS s e a s o n p e r i o d s i t e c c o n t r o l s u b s t r a t e s u b s _ n o e _ c o l i | d o x y | t p / DUNCAN;
PROC GLM D A T A = o _ c o m p o s i t e _ n m s s A L P H A = 0 .0 5 ;T IT L E 1
/
T IT L E 2 ' 6 _ O y s t e r R e s t o r a t i o n & B i o m a s s A n a l y s i s ' ;T IT L E 3 ' F a c t o r i a l MMC A n a l y s i s / S p 2 0 1 3 ' ;T IT L E 4 'GLM S c r e e n i n g - NMSS+WQ+no a f d m & D e p t h / C o m p o s i t e - - ASE+LSE S i t e L o c a t i o n s ' ;T IT L E 5
ICLASS s e a s o n p e r i o d s i t e c c o n t r o l s u b s t r a t e s u b s _ n o t e m p e r a t u r e s a l i n i t y d o x y
t s s k t n t p e _ c o l i f _ e n t r o c o c c i ;
MODEL b i o m a s s = t e m p e r a t u r e s a l i n i t y t s s | / NOINT ;
MEANS t e m p e r a t u r e s a l i n i t y t s s | e _ c o l i |
e _ c o l i | d o x y | t p
d o x y I t p / DUNCAN;
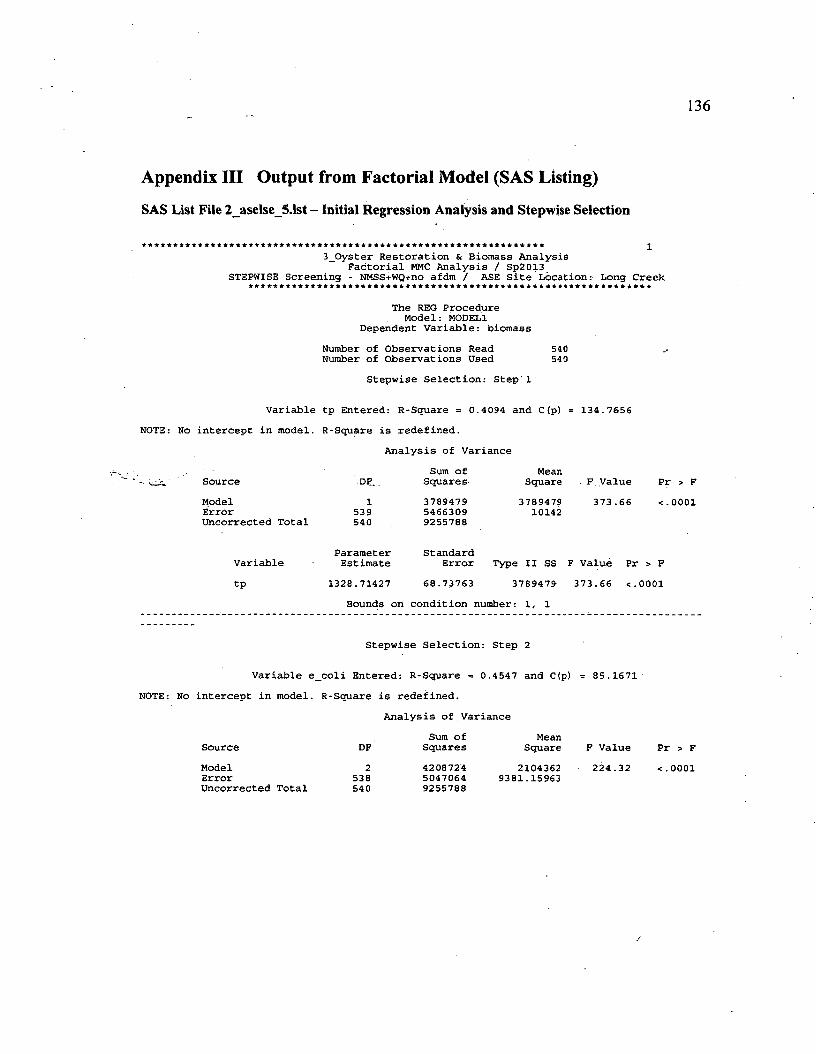
136
Appendix III Output from Factorial Model (SAS Listing)
SAS List File 2_aselse_5.1st - Initial Regression Analysis and Stepwise Selection
3_Oyster Restoration & Biomass Analysis Factorial MMC Analysis / Sp2013
STEPWISE Screening - NMSS+WQ+no afdm / ASE Site Location: Long Creek
The REG Procedure Model: MODEL1
Dependent Variable: biomassNumber of Observations Read 540Number of Observations Used 540
Stepwise Selection: Step 1
Variable tp Entered: R-Square = 0.4094 and C(p) = 134.7656 NOTE: No intercept in model. R-Square is redefined.
Analysis of VarianceSum of Mean
-• oi' Source Dp... Squares Square F Value Pr > FModel 1 3789479 3789479 373.66 <.0001Error 539 5466309 10142Uncorrected Total 540 9255788
Parameter Standard Variable Estimate Error Type II SS F Value Pr > Ftp 1328.71427 68.73763 3789479 373.66 <.0001
Bounds on condit ion number: 1, 1
Stepwise Selection: Step 2
Variable e_coli Entered: R-Square = 0.4547 and C(p) = 85.1671 NOTE: No intercept in model. R-Square is redefined.
Analysis of VarianceSum of Mean
Source DF Squares Square F Value Pr > FModelErrorUncorrected Total
2538 54 0
420872450470649255788
21043629381.15963
224.32 <■0001
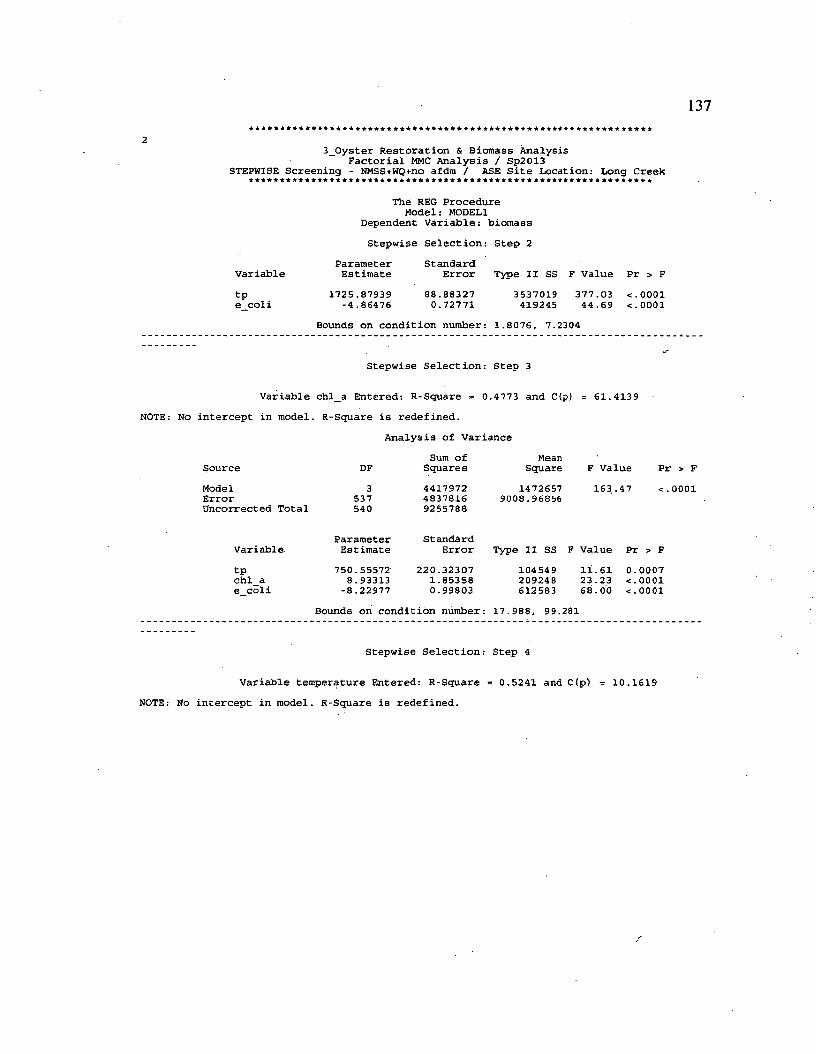
137
3_0yster Restoration & Biomass Analysis Factorial MMC Analysis / Sp2013
STEPWISE Screening - NMSS+WQ+no afdm / ASE Site Location: Long Creek
The REG Procedure Model: M0DEL1
Dependent Variable: biomass
Variabletpe coli
Stepwise Selection: Step 2ParameterEstimate
1725.87939 -4 .86476
StandardError
88.883270.72771
Type II SS F Value Pr > F3537019419245
377.03 44 .69
< ■ 0 0 0 1< • 0 0 0 1
Bounds on condition number: 1.8076, 7.2304
Stepwise Selection: Step 3
Variable chl_a Entered: R-Square = 0.4773 and C(p) NOTE: No intercept in model. R-Square is redefined.
Analysis of Variance
SourceModelErrorUncorrected Total
DF3
537540
Sum of Squares441797248378169255788
MeanSquare
14726579008.96856
61.4139
F Value Pr > F163.47 <.0001
VariableParameterEstimate
StandardError Type II SS F value Pr > F
tpchl_a e coli
750.55572 8.93313
-8 .22977220.32307
1.853580.99803
104549209248612583
11.6123.2368.00
0.0007<-0001< ■ 0 0 0 1
Bounds on condition number: 17.988, 99.281
Stepwise Selection: Step 4
Variable temperature Entered: R-Square = 0.5241 and C (p) = 10.1619 NOTE: No intercept in model. R-Square is redefined.
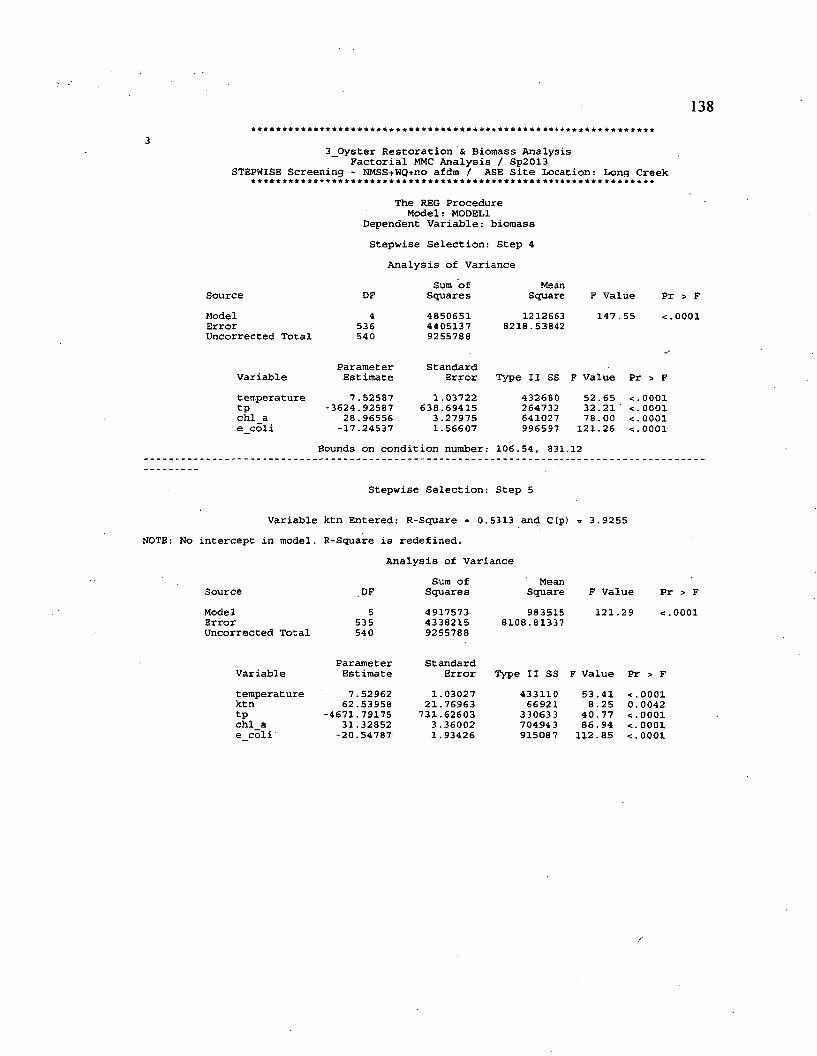
138
33_0yster Restoration & Biomass Analysis
Factorial MMC Analysis / Sp2013 STEPWISE Screening - NMSS+WQ+no afdm / ASE Site Location: Long Creek
SourceModelErrorUncorrected Total
The REG Procedure Model: MODEL1
Dependent Variable: biomassStepwise Selection: Step 4
Analysis of Variance
DF4
536540
Sum of Squares485065144051379255788
M e a nSquare
12126638218.53842
F Value 147.55
Pr > F <.0001
Variabletemperaturetpchl_a e coli
ParameterEstimate7.52587
-3624.92587 28.96556 -17.24537
StandardError
1.03722638.69415
3.279751.56607
Type II SS F Value Pr > F432680264732641027996597
52.65 <.000132.2178.00
121.26Bounds on condition number: 106.54, 831.12
< . 0 0 0 1< • 0 0 0 1< . 0 0 0 1
Stepwise Selection: Step 5
Variable ktn Entered: R-Square = 0.5313 and C(p) NOTE: No intercept in model. R-Square is redefined.
Analysis of Variance
SourceModelErrorUncorrected Total
DF5
535540
Sum of Squares491757343382159255788
MeanSquare983515
8108.81337
3.9255
F Value 121.29
Pr > F < . 0 0 0 1
Variabletemperaturektntpchl_a e coli
ParameterEstimate7.52962
62.53958 -4671.79175
31.32852 -20.54787
StandardError
1.03027 21.76963
731.62603 3 .36002 1.93426
Type II SS F Value Pr > F43311066921
330633704943
53 .41 8 .25
40.77 86.94
915087 112.85
< ■0 0 0 10.0042< ■ 0 0 0 1<■ 0 0 0 1< . 0 0 0 1
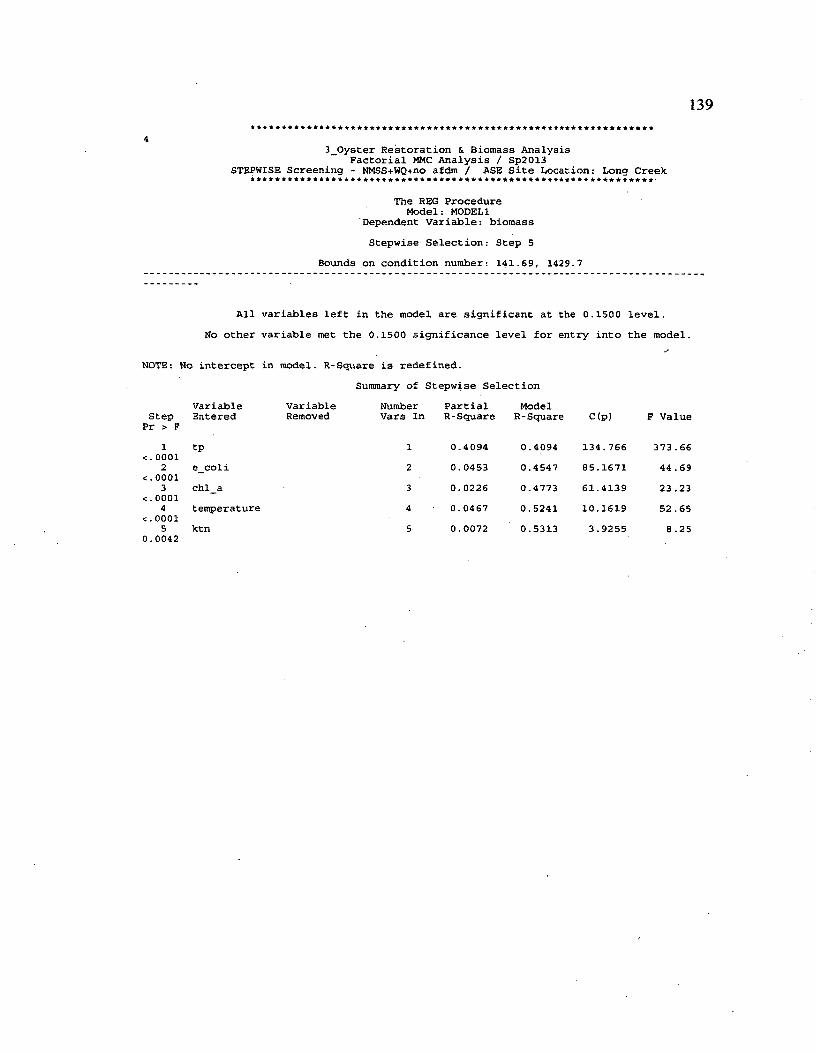
139
43_Oyster Restoration & Biomass Analysis
Factorial MMC Analysis / Sp2013 STEPWISE Screening - NMSS+WQ+no afdm / ASE Site Location: Long Creek
The REG Procedure Model: MODEL1
Dependent Variable: biomassStepwise Selection: Step 5
Bounds on condition number: 141.69, 1429.7
All variables left in the model are significant at the 0.1500 level.No other variable met the 0.1500 significance level for entry into the model.
NOTE: No intercept in model. R-Square is redefined.Summary of Stepwise Selection
Step ' > F
VariableEntered
VariableRemoved
Number Vars In
PartialR-Square
ModelR-Square C(p) F Value
1 tp 1 0.4094 0.4094 134.766 373.6600012 e_coli 2 0.0453 0.4547 85.1671 44.69
00013 chi a 3 0.0226 0.4773 61.4139 23 .23
00014 temperature 4 0.0467 0.5241 10.1619 52 .6500015 ktn 5 0.0072 0.5313 3.9255 8.25
0.0042
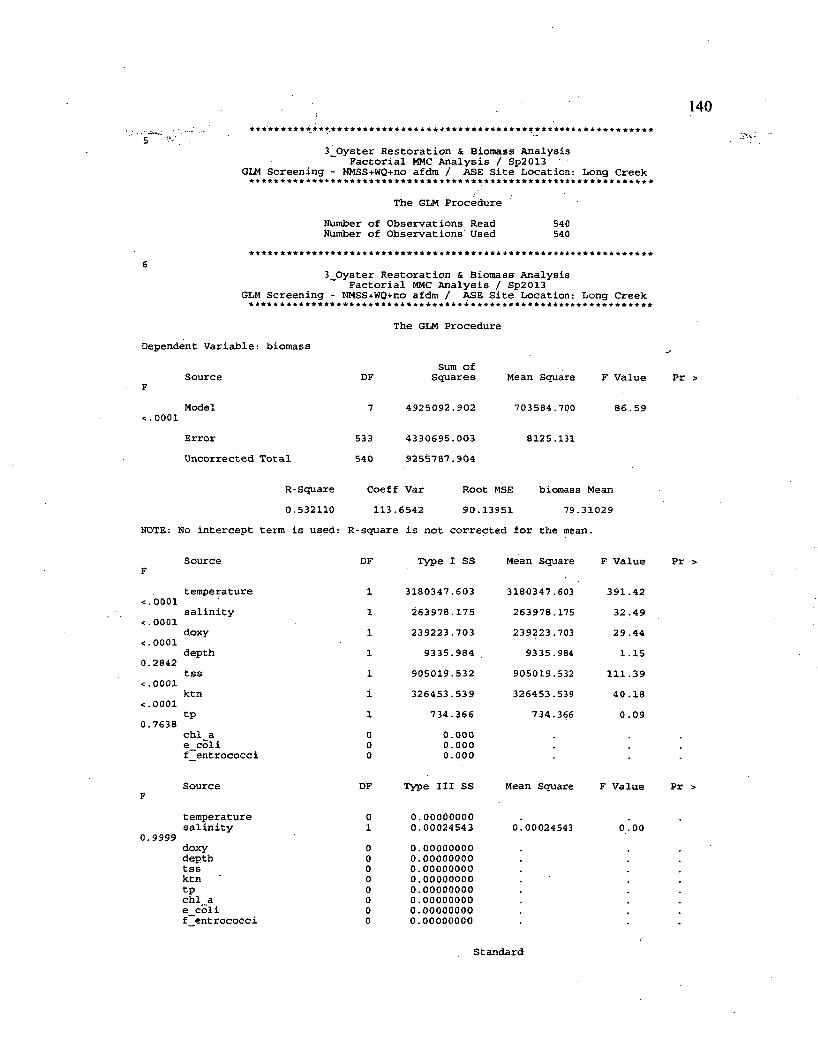
140
3_Oyster Restoration & Biomass Analysis Factorial MMC Analysis / Sp2013
GLM Screening - NMSS+WQ+no afdm / ASE Site Location: Long Creek
The GLM ProcedureNumber of Observations Read 540Number of Observations' Used 540
3_Oyster Restoration & Biomass Analysis Factorial MMC Analysis / Sp2013
GLM Screening - NMSS+WQ+no afdm / ASE Site Location: Long Creek
Dependent Variable: biomass
SourceF
Model<.0001ErrorUncorrected Total
The GLM Procedure
Sum ofDF Squares
7 4925092.902
533 4330695.003540 9255787.904
Mean Square F Value
703584.700 86.59
8125.131
R-Square Coeff Var Root MSE biomass Mean0.532110 113.6542 90.13951 79.31029
NOTE: No intercept term is used: R-square is not corrected for the mean.
FSource DF Type 1 SS Mean Square F Value
<■0001temperature 1 3180347.603 3180347.603 391.42
<■0001salinity 1 263978.175 263978.175 32 .49
<■0001doxy 1 239223.703 239223.703 29 .44
0.2842depth 1 9335.984 9335.984 1.15tss 1 905019.532 905019.532 111.39
<■0001ktn i 326453.539 326453.539 40 .18
<•0001tp l 734.366 734.366 0 .09
0.7638chl_a 0 0.000e_coli 0 0.000f_entrococci 0 0.000
FSource DF Type III SS Mean Square F Value
temperature 0 0.000000000.9999
salinity 1 0.00024543 0.00024543 0 .00doxy 0 0.00000000depth 0 0.00000000tss 0 0.00000000ktn 0 0.00000000tp 0 0.00000000chl_a 0 0.00000000e_coli 0 0.00000000f_entrococci 0 0.00000000
Pr >
Pr >
Pr >
Standard
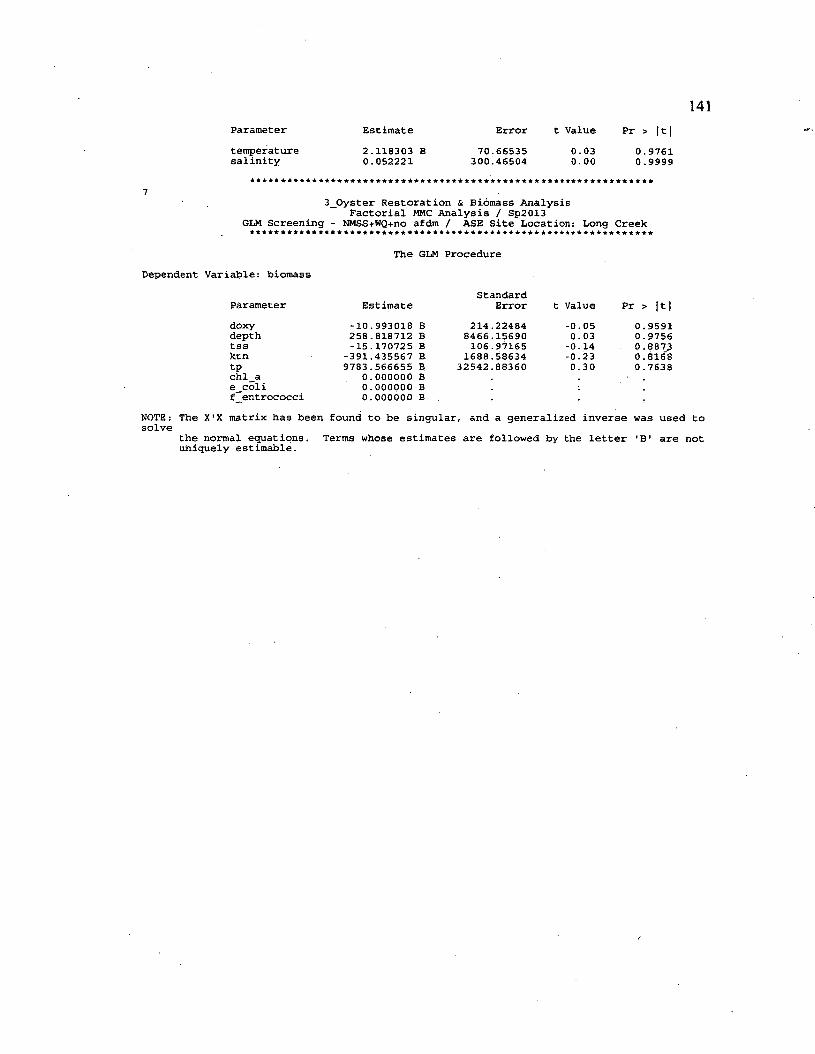
141Parameter Estimate Error t Value Pr > |t|temperature 2.118303 B 70.66535 0.03 0.9761salinity 0.052221 300.46504 0.00 0.9999
73_Oyster Restoration & Biomass Analysis
Factorial MMC Analysis / Sp2013 GLM Screening - NMSS+WQ+no afdm / ASE Site Location: Long Creek
The GLM ProcedureDependent Variable: biomass
StandardParameter Estimate Error t Value Pr > |t|doxy -10.993018 B 214.22484 -0. 05 0.9591depth 258.818712 B 8466.15690 0.03 0.9756tss -15.170725 B 106.97165 -0.14 0.8873ktn -391.435567 B. 1688.58634 -0.23 0.816"8tp 9783.566655 B 32542.88360 0.30 0.7638chl_a 0.000000 Be__coli 0.000000 Bf entrococci 0.000000 B
NOTE: The X'X matrix has been found to be singular, and a generalized inverse was used to solve
the normal equations. Terms whose estimates are followed by the letter 'B' are not uniquely estimable.
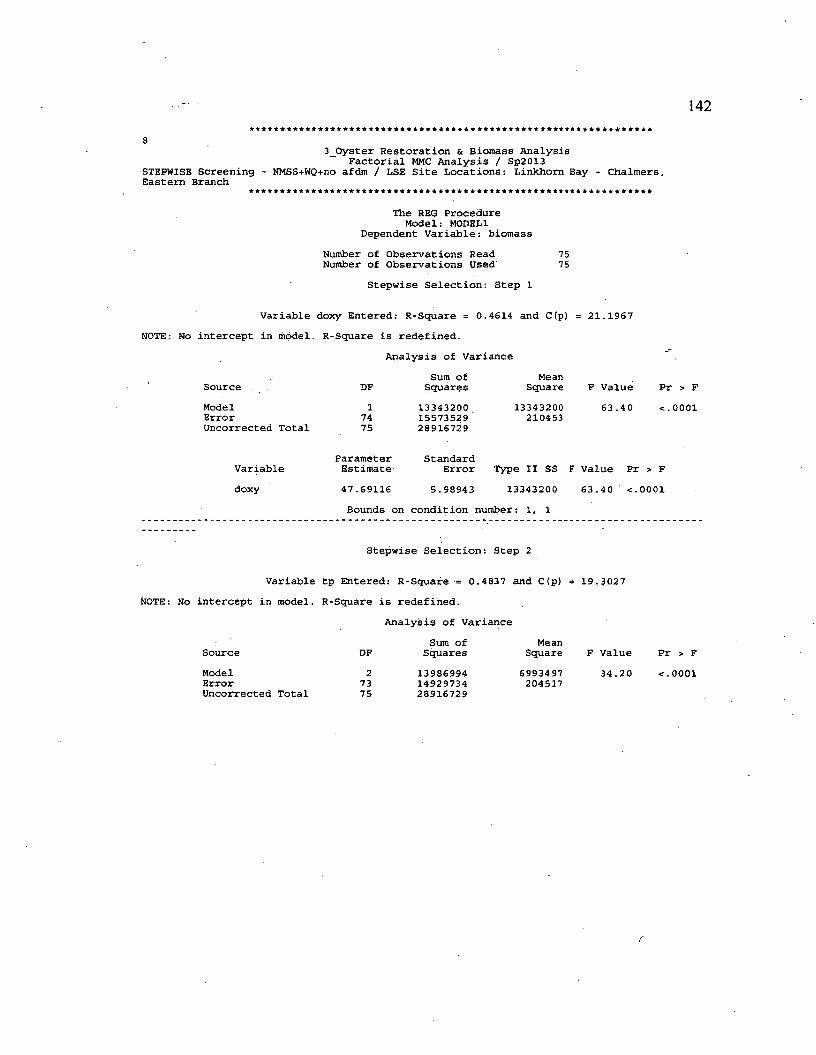
142
83_0yster Restoration & Biomass Analysis
Factorial MMC Analysis / Sp2013 STEPWISE Screening - NMSS+WQ+no afdm / LSE Site Locations: Linkhorn Bay - Chalmers, Eastern Branch
The REG Procedure Model: M0DEL1
Dependent Variable: biomassNumber of Observations Read Number of Observations Used
Stepwise Selection: Step 1
7575
Variable doxy Entered: R-Square = 0.4614 and C(p) = 21.1967 NOTE: No intercept in model. R-Square is redefined.
Analysis of Variance
SourceModelErrorUncorrected Total
DF1
7475
Sum of Squares
133432001557352928916729
MeanSquare
13343200210453
F Value 63.40
Pr > F < ■ 0 0 0 1
Variabledoxy
ParameterEstimate
StandardError Type II SS F Value Pr > F
47.69116 5.98943 13343200 63.40 <.0001Bounds on condit ion number: 1, 1
Stepwise Selection: Step 2
Variable tp Entered: R-Square = 0.4837 and C(p) = 19.3027 NOTE: No intercept in model. R-Square is redefined.
Analysis of Variance
SourceModelErrorUncorrected Total
DF2
7375
Sum of Squares139869941492973428916729
MeanSquare
6993497204517
F Value 34 .20
Pr > F < . 0 0 0 1
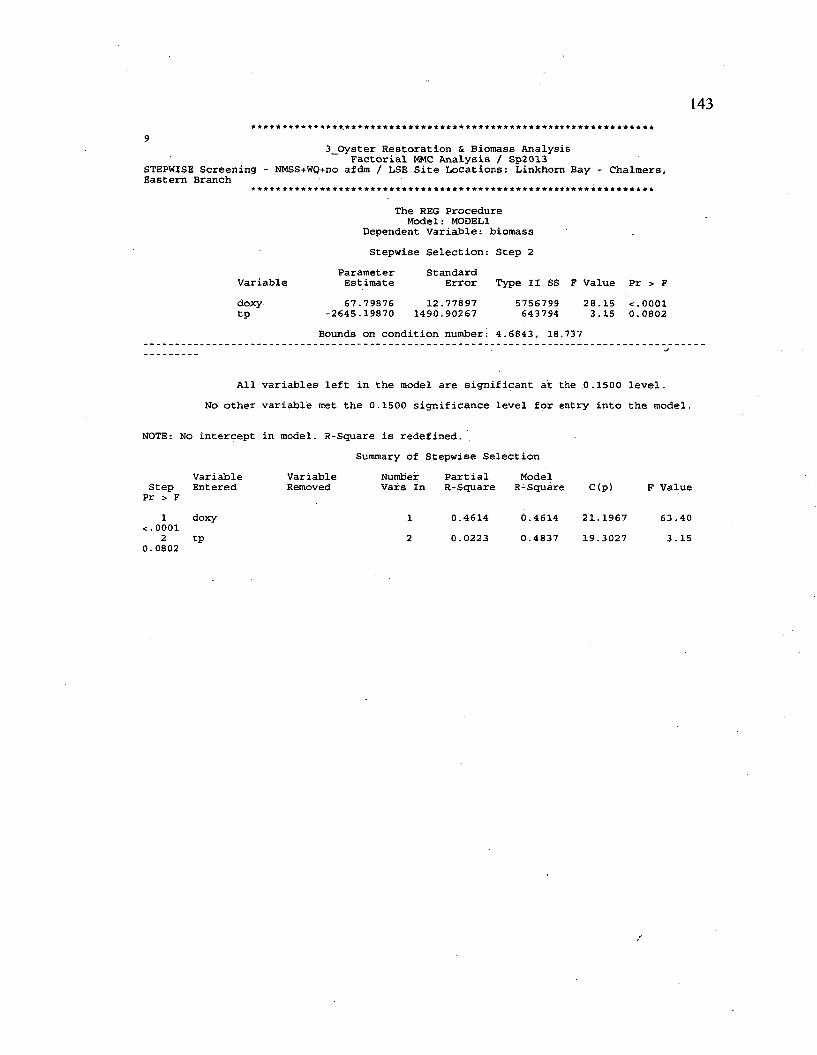
143
3_Oyster Restoration & Biomass Analysis Factorial MMC Analysis / Sp2013
STEPWISE Screening - NMSS+WQ+no afdm / LSE Site Locations: Linkhom Bay - Chalmers, Eastern Branch
The REG Procedure Model: MODEL1
Dependent variable: biomassStepwise Selection: Step 2
Variabledoxytp
ParameterEstimate
StandardError Type II SS F Value Pr > F
67.79876 12.77897-2645.19870 1490.90267
5756799643794
28.15 <.00013.15 0.0802
Bounds on condition number: 4.6843, 18.737
All variables left in the model are significant at the 0.1500 level.No other variable met the 0.1500 significance level for entry into the model.
NOTE: No intercept in model. R-Square is redefined.Summary of Stepwise Selection
Step Pr > F
1< . 0 0 0 1
20.0802
V a r ia b leEntered
doxytp
VariableRemoved
Number Vars In
PartialR-Square
0.46140.0223
ModelR-Square
0.46140.4837
C(p)
21.196719.3027
F Value
63.403.15
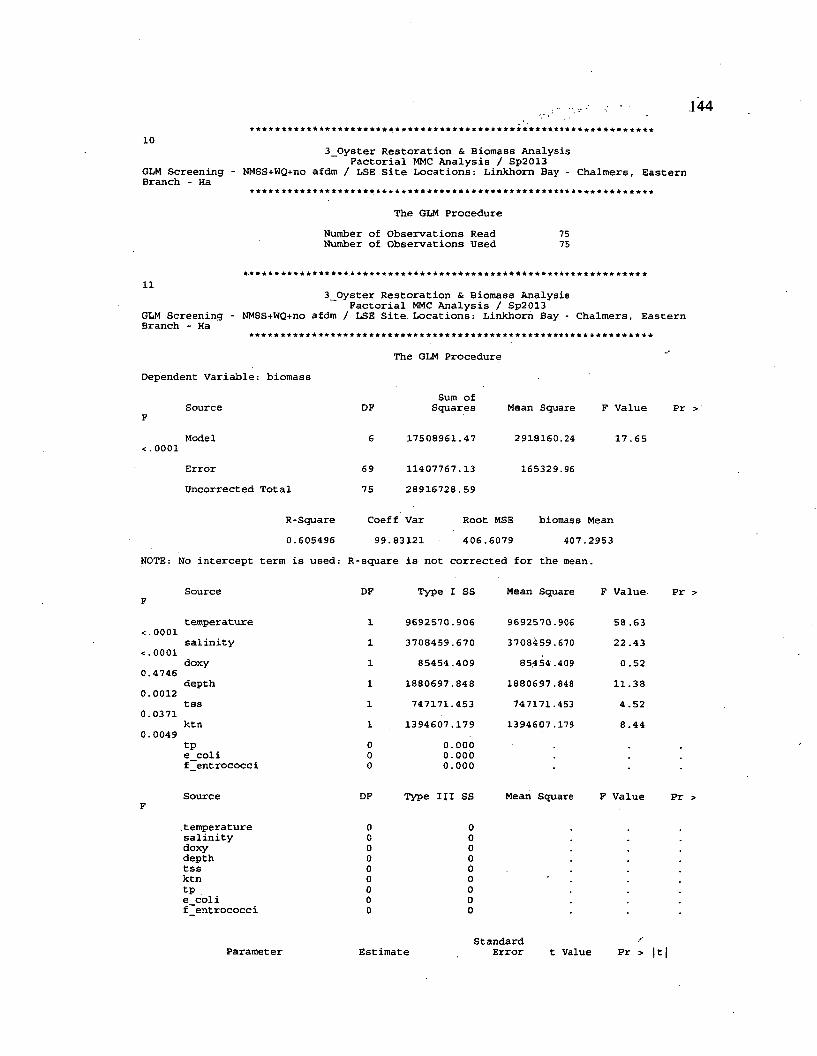
103_Oyster Restoration & Biomass Analysis
Factorial MMC Analysis / Sp2013GLM Screening - NMSS+WQ+no afdm / LSE Site Locations: Linkhom Bay - Chalmers, EasternBranch - Ha
The GLM ProcedureNumber of Observations Read 75Number of Observations Used 75
113 Oyster Restoration & Biomass Analysis
Factorial MMC Analysis / Sp2013GLM Screening - NMSS+WQ+no afdm / LSE Site Locations: Linkhom Bay - Chalmers, EasternBranch - Ha
The GLM Procedure --
Dependent Variable: biomassSum of
SourceF
DF Squares Mean Square F Value Pr
Model 6 17508961.47 2918160.24 17.65<.0001
Error 69 11407767.13 165329.96Uncorrected Total 75 28916728.59
R-Square Coeff Var Root MSE biomass Mean0.605496 99.83121 406.6079 407.2953
NOTE: No intercept term is used: R-square is not corrected for the mean.
SourceF
DF Type I SS Mean Square F Value Pr
temperature 1 9692570.906 9692570.906 58.63<.0001
salinity 1 3708459.670 3708459.670 22.43<•0001
doxy 1 85454.409 85454.409 0.520.4746
depth 1 1880697.848 1880697.848 11.380.0012
tss 1 747171.453 747171.453 4.520.0371
ktn 1 1394607.179 1394607.179 8.440.0049
tp 0 0.000 ,e_coli 0 0.000 .f_entrococci 0 0.000
SourceF
DF Type III SS Mean Square F Value Pr
.temperature 0 0salinity 0 0doxy 0 0depth 0 0tss 0 0ktn 0 0tp . 0 0e_coli 0 0f entrococci 0 0
Parameter EstimateStandard '
Error t Value Pr > |t|
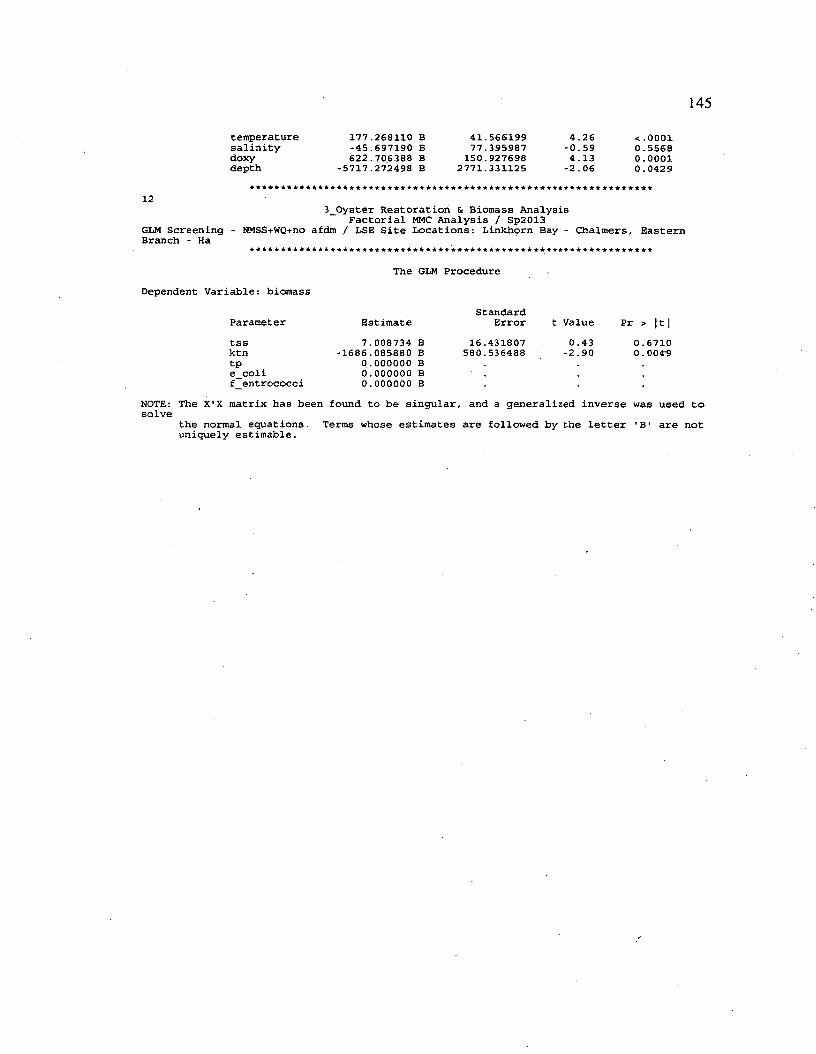
145
temperature 177.268110 B 41.566199 4.26 <.0001salinity -45.697190 B 77.395987 -0.59 0.5568doxy 622.706388 B 150.927698 4.13 0.0001depth -5717.272498 B 2771.331125 -2.06 0.0429
123_Oyster Restoration & Biomass Analysis
Factorial MMC Analysis / Sp2013 GLM Screening - NMSS+WQ+no afdm / LSE Site Locations: Linkhom Bay - Chalmers, Eastern Branch - Ha
The GLM ProcedureDependent Variable: biomass
StandardParameter Estimate Error t Value Pr > 111tss 7.008734 B 16.431807 0.43 0.6710ktn -1686.085880 B 580.536488 -2.90 0.0049tp 0.000000 Be_coli 0.000000 Bf entrococci 0.000000 B
NOTE: The X'X matrix has been found to be singular, and a generalized inverse was used to solve
the normal equations. Terms whose estimates are followed by the letter 'B' are not uniquely estimable.
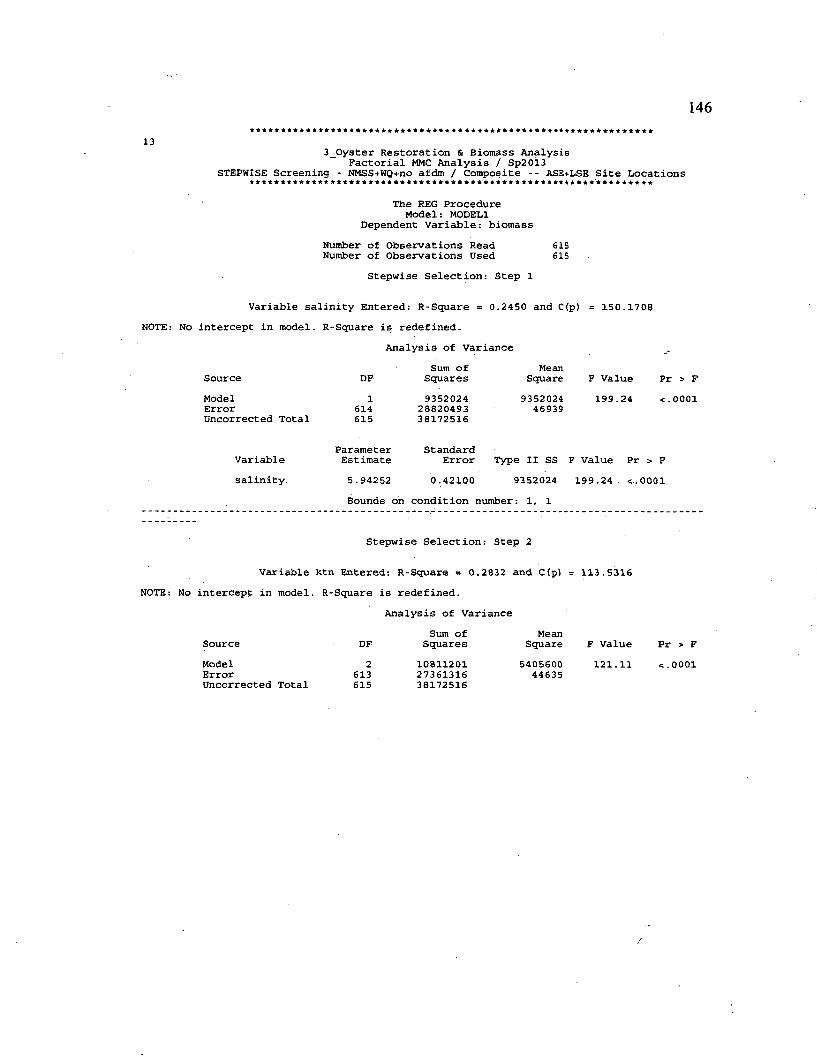
146
133_0yster Restoration & Biomass Analysis
Factorial MMC Analysis / Sp2013 STEPWISE Screening - NMSS+WQ+no afdm / Composite -- ASE+LSE Site Locations
The REG Procedure Model: MODEL1
Dependent Variable: biomassNumber of Observations Read Number of Observations used
Stepwise Selection: Step 1
615615
Variable salinity Entered: R-Square = 0.2450 and C(p) = 150.1708 NOTE: No intercept in model. R-Square is redefined.
Analysis of variance
SourceModelErrorUncorrected Total
DF1
614615
Sum of Squares9352024
2882049338172516
MeanSquare
935202446939
F Value Pr > F199.24 <.0001
Variablesalinity.
ParameterEstimate
StandardError Type II SS F Value Pr > F
5.94252 0.42100 9352024 199.24. <.0001Bounds oh condition number: 1, 1
Stepwise Selection: Step 2
Variable ktn Entered: R-Square = 0.2832 and C(p) = 113.5316 NOTE: No intercept in model. R-Square is redefined.
Analysis of Variance
SourceModelErrorUncorrected Total
DF2
613615
Sum of Squares
108112012736131638172516
MeanSquare
540560044635
F Value 121.11
Pr > F < .0 0 0 1
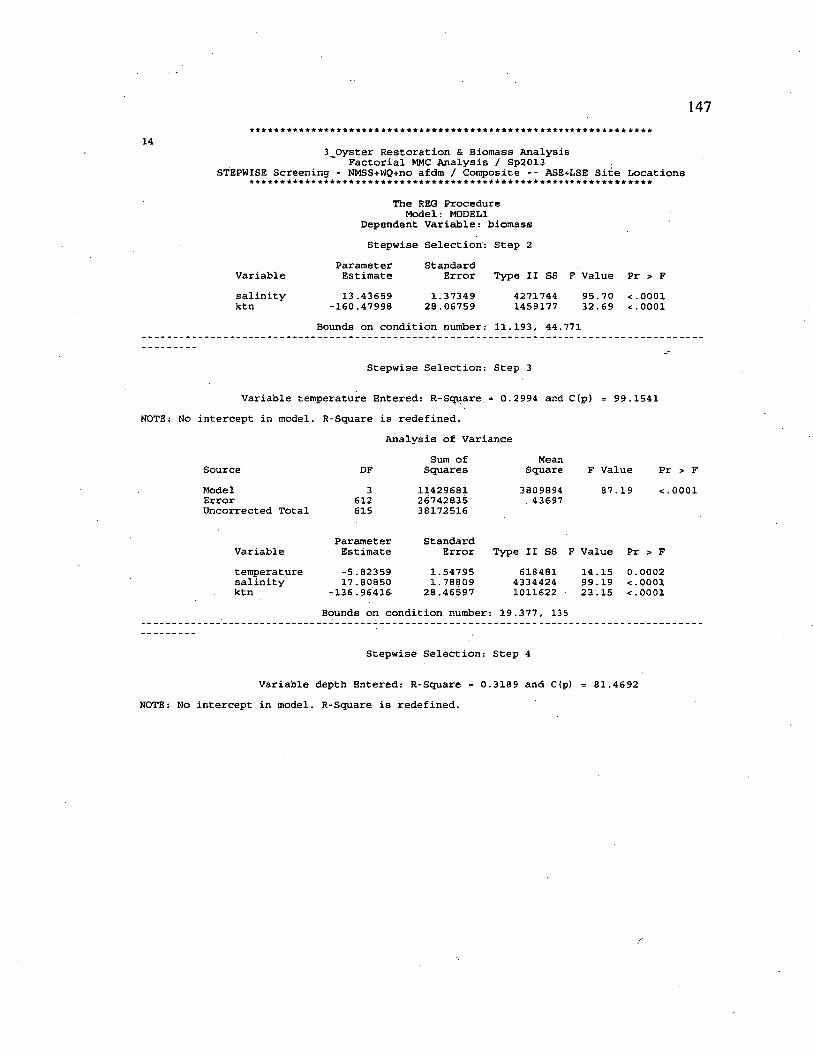
147
143_0yster Restoration & Biomass Analysis
Factorial MMC Analysis / Sp2013 STEPWISE Screening - NMSS+WQ+no afdm / Composite -- ASE+LSE Site Locations
The REG Procedure Model: MODEL1
Dependent Variable: biomassStepwise Selection: Step 2
Variablesalinityktn
ParameterEstimate13.43659
-160.47998
StandardError Type II SS F Value Pr > F
1.3734928.06759
42717441459177
95.70 <.000132.69 <.0001
Bounds on condition number: 11.193, 44.771
Stepwise Selection: Step 3
Variable temperature Entered: R-Square = 0.2994 and C(p) = 99.1541 NOTE: No intercept in model. R-Square is redefined.
Analysis of VarianceSum of Mean
Source DF Squares Square F Value Pr > FModel 3 11429681 3809894 87. 19 <.0001Error 612 26742835 . 43697Oncorrected Total 615 38172516
Parameter StandardVariable Estimate Error Type II SS F Value Pr > Ftemperature -5.82359 1.54795 618481 14.15 0.0002salinity 17.80850 1.78809 4334424 99.19 <•0001ktn -136 .96416. 28.46597 1011622 23 .15 <.0001
Bounds on condition number;; 19.377, 135
Stepwise Selection: Step 4
Variable depth Entered: R-Square = 0.3189 and C(p) = 81.4692 NOTE: No intercept in model. R-Square is redefined.
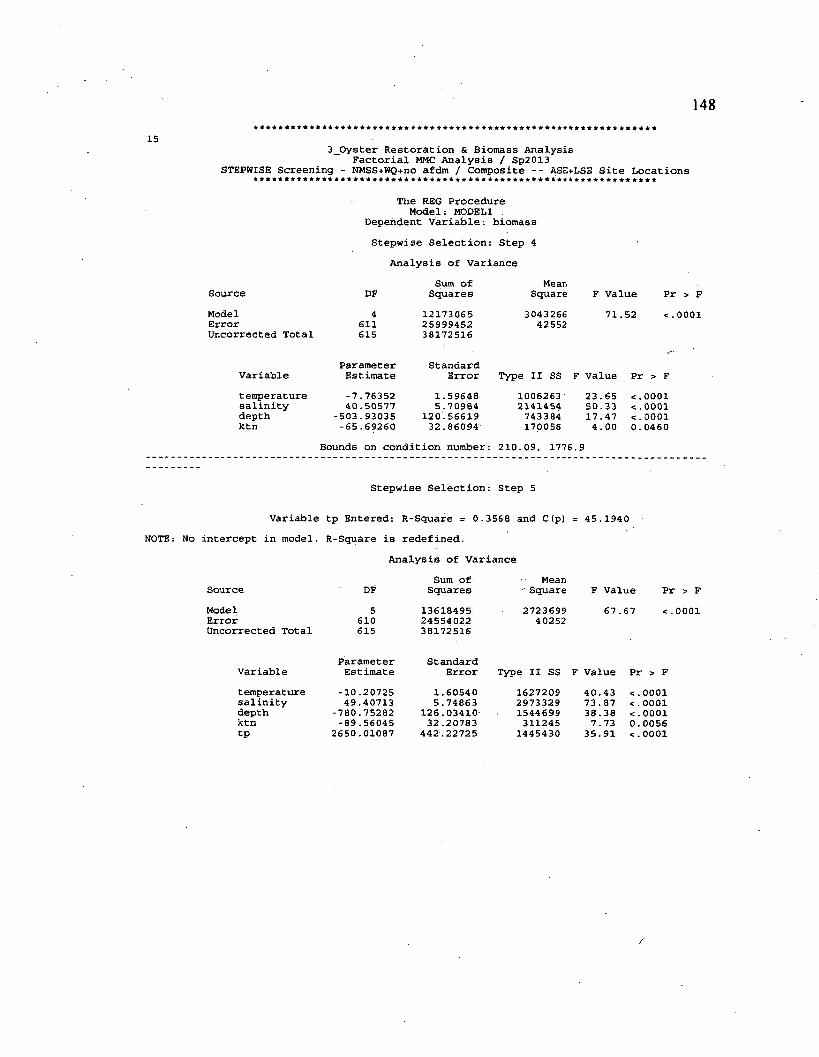
148
153_0yster Restoration & Biomass Analysis
Factorial MMC Analysis / Sp2013 STEPWISE Screening - NMSS+WQ+no afdm / Composite -- ASE+LSE Site Locations
The REG Procedure Model: MODEL1
Dependent Variable: biomassStepwise Selection: Step 4
Analysis of VarianceSum of Mean
Source DF Squares Square F Value Pr > FModel 4 12173065 3043266 71..52 <.0001Error 611 25999452 42552Uncorrected Total 615 38172516
Parameter StandardVariable Estimate Error Type II SS F Value Pr > Ftemperature -7.76352 1.59648 1006263 23.65 <.0001salinity 40.50577 5.70984 2141454 50.33 <.0001depth -503.93035 120.56619 7433 84 17.47 <.0001ktn -65.69260 32.86094 170058 4.00 0.0460
Bounds on condition number: 210.09, 1776 .9
Stepwise Selection: Step 5
Variable tp Entered: R-Square = 0.3568 and C(p) = 45.1940 NOTE: No intercept in model. R-Sguare is redefined.
Analysis of VarianceSum of Mean
Source DF Squares ■' Square F Value PiModel 5 13618495 2723699 67..67 <.Error 610 24554022 40252Uncorrected Total 615 38172516
Parameter StandardVariable Estimate Error Type II SS F Value Pr > Ftemperature -10.20725 1.60540 1627209 40.43 <.0001salinity 49.40713 5.74863 2973329 73.87 <■0001depth -780.75282 126.03410 1544699 38.38 <■0001ktn -89.56045 32.20783 311245 7.73 0.0056tp 2650.01087 442.22725 1445430 35. 91 <■0001
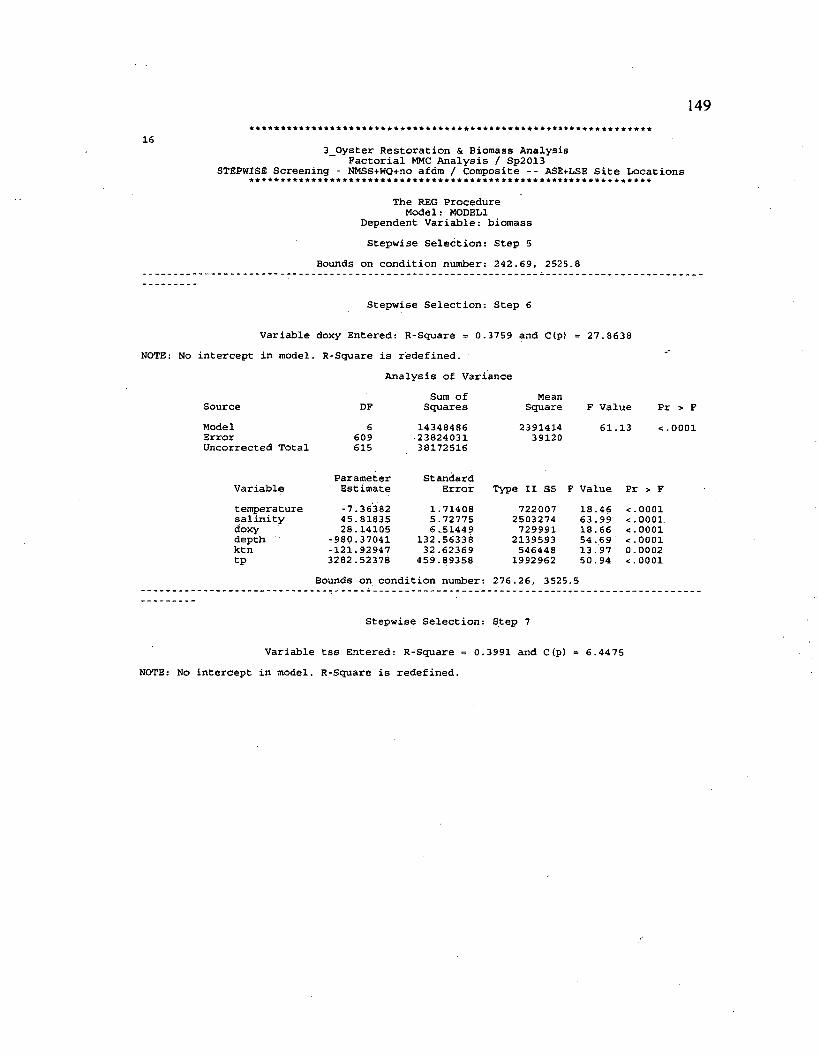
149
163_Oyster Restoration & Biomass Analysis
Factorial MMC Analysis / Sp2013 STEPWISE Screening - NMSS+WQ+no afdm / Composite -- ASE+LSE Site Locations
The REG Procedure Model: MODEL1
Dependent Variable: biomassStepwise Selection: Step 5
Bounds on condition number: 242.69, 2525.8
Stepwise Selection: Step 6
Variable doxy Entered: R-Square = 0.3759 and C(p) NOTE: No intercept in model. R-Square is redefined.
Analysis of Variance
27.8638
Sum of MeanSource DF Squares Square F Value P]Model 6 14348486 2391414 61..13 <.Error 609 23824031 39120Uncorrected Total 615 38172516
Parameter StandardVariable Estimate Error Type XI SS F Value Pr > Ftemperature -7.36382 1.71408 722007 18.46 <.0001salinity 45.81835 5.72775 2503274 63.99 <.0001doxy 28.14105 6..51449 729991 18.66 <.0001depth -980.37041 132.56338 2139593 54.69 <.0001ktn -121.92947 32 .62369 546448 13.97 0.0002tp 3282.52378 459.89358 1992962 50.94 <.0001
Bounds on condition number: 276.26, 3525.5
Stepwise Selection: Step 7
Variable tss Entered: R-Square = 0.3991 and C(p) = 6.4475 NOTE: No intercept in model. R-Square is redefined.
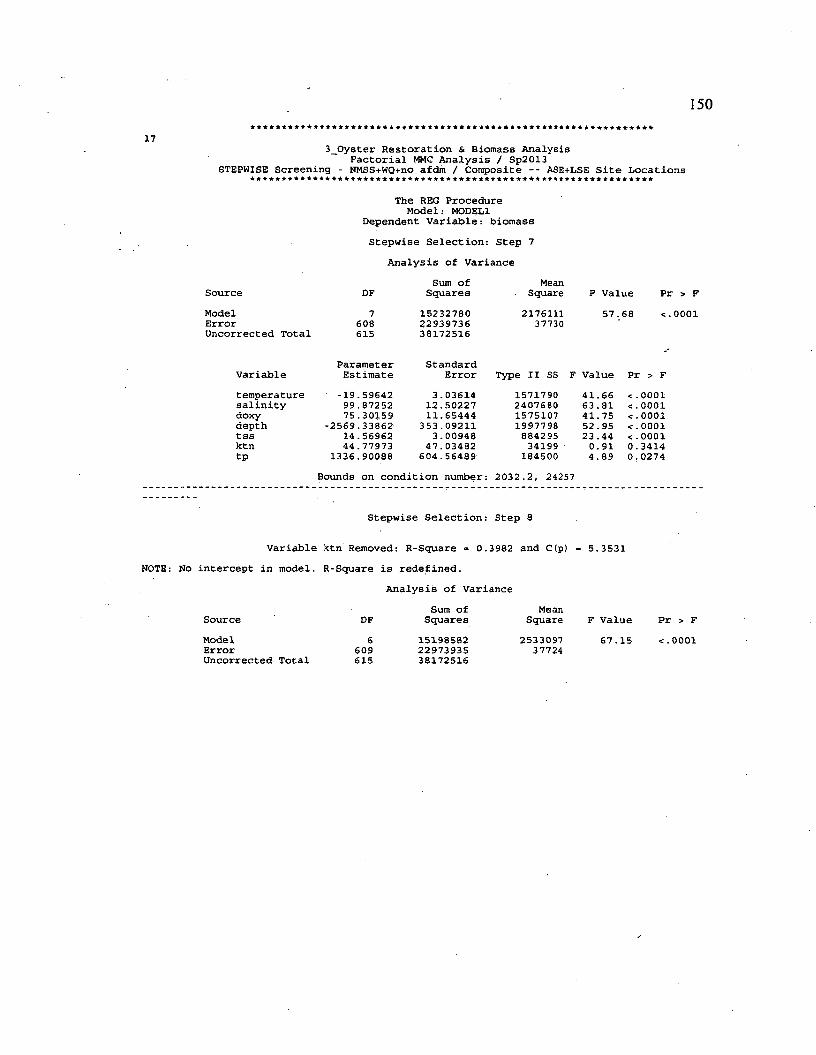
150
173_Oyster Restoration & Biomass Analysis
Factorial MMC Analysis / Sp2013 STEPWISE Screening - NMSS+WQ+no afdm / Composite -- ASE+LSE Site Locations
The REG Procedure Model: MODEL1
Dependent Variable: biomassStepwise Selection: Step 7
Analysis of Variance
Source DFSum of
SquaresMean
Square F Value Pr > FModelErrorUncorrected Total
7608615
152327802293973638172516
217611137730
57.68 <.0001
VariableParameterEstimate
StandardError Type II SS F Value Pr > F
temperaturesalinitydoxydepthtssktntp
-19.59642 99.87252 75.30159
-2569.33862 14.56962 44.77973
1336.90088
3.03614 12.50227 11.65444
353.09211 3.00948
47.03482 604.56489
1571790 2407680 1575107 1997798 884295 34199 '
184500
41.66 <.0001 63.81 <.0001 41.75 <.0001 52.95 <.0001 23.44 <.0001 0.91 0.3414 4.89 0.0274
Bounds on condition number:: 2032.2, 24257
Stepwise Selection: Step 8
Variable ktn Removed:: R-Square = 0. 3982 and C(p) == 5.3531Intercept in model. R-Square is rede f ined.
Analysis of Variance
Source DFSum of
SquaresMean
Square F Value Pr > FModelErrorUncorrected Total
6609615
151985822297393538172516
253309737724
67.15 <.0001
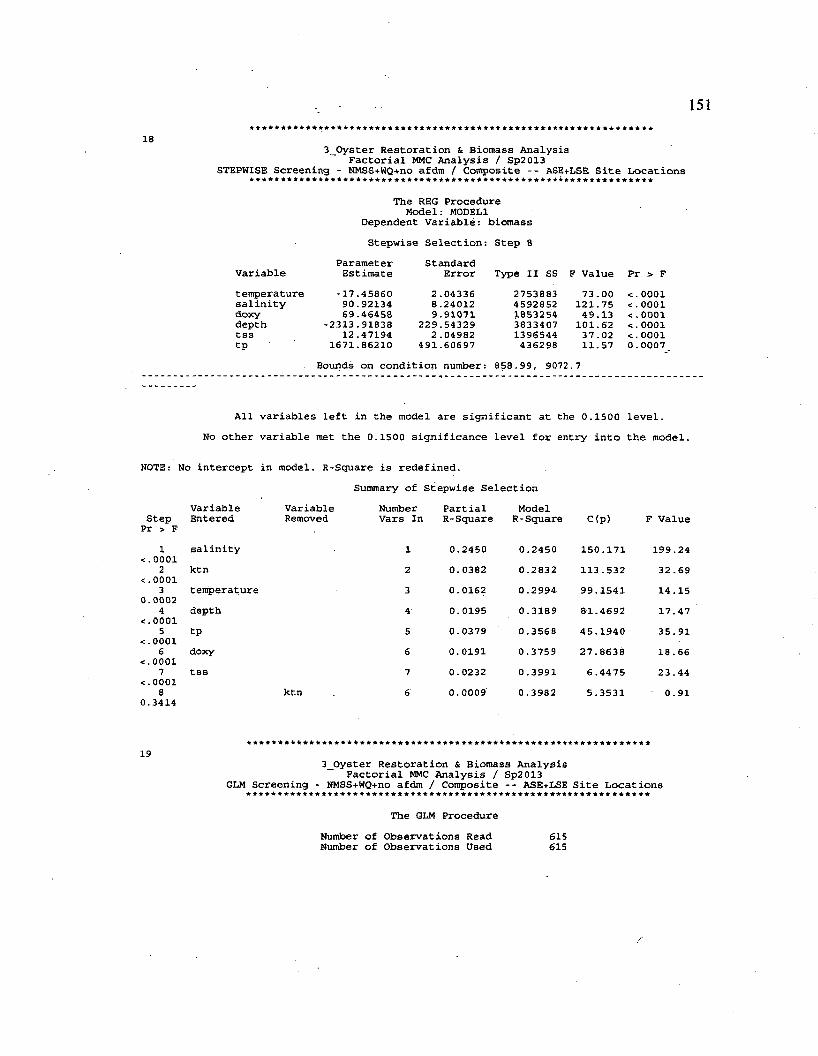
151
183_Oyster Restoration & Biomass Analysis
Factorial MMC Analysis / Sp2013 STEPWISE Screening - NMSS+WQ+no afdm / Composite -- ASE+LSE Site Locations
The REG Procedure Model: M0DEL1
Dependent Variable: biomassStepwise Selection: Step 8
Parameter StandardVariable Estimate Error Type II SS F Value Pr > Ftemperature -17.45860 2 .04336 2753883 73.00 c.0001salinity 90.92134 8.24012 4592852 121.75 c .0001doxy 69.46458 9.91071 1853254 49.13 <.0001depth -2313.91838 229.54329 3833407 101.62 <.0001tss 12.47194 2 .04982 1396544 3 7 .02 c .0001tp 1671.86210 491.60697 436298 11.57 0.0007
Bounds on condition number: 858.99, 9072 . 7
All variables left in the model are significant at the 0.1500 level.No other variable met the 0.1500 significance level for entry into the model.
NOTE: No intercept in model. R-Square is redefined.Summary of Stepwise Selection
StepVariableEntered
VariableRemoved
Number Vars In
PartialR-Square
ModelR-Square C(p) F Value
Pr > F 1 salinity 1 0.2450 0.2450 150.171 199.24
<■00012 ktn 2 0.0382 0.2832 113.532 32 .69
<•00013 temperature 3 0.0162 0.2 994 99.1541 14.15
0.00024 depth 4 0.0195 0.3189 81.4692 17.47
<•00015 tp 5 0.0379 0.3568 45.1940 35. 91
<■00016 doxy 6 0.0191 0.3759 27.8638 18.66
<■00017 tss 7 0.0232 0.3991 6.4475 23 .44
<•00018 ktn 6 0.0009 0.3982 5.3531 0.91
0.3414
193_Oyster Restoration & Biomass Analysis
Factorial MMC Analysis / Sp2013 GLM Screening - NMSS+WQ+no afdm / Composite -- ASE+LSE Site Locations
The GLM ProcedureNumber of Observations Read 615Number of Observations Used 615
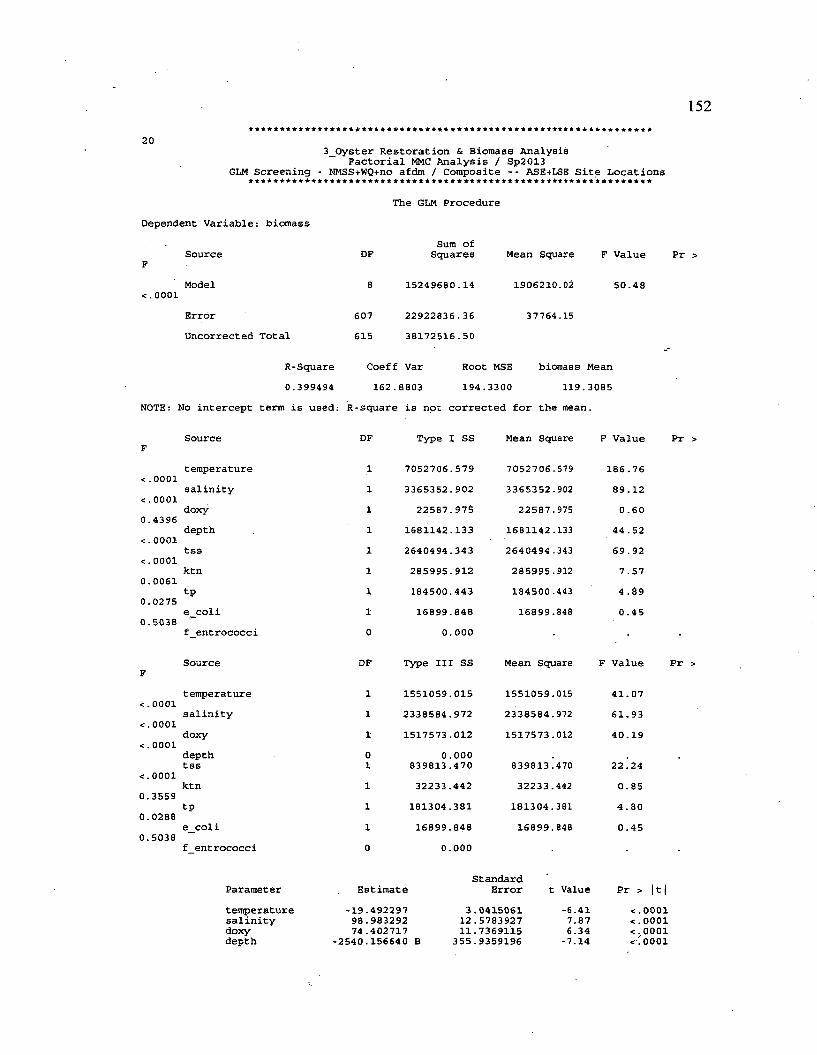
203_Oyster Restoration & Biomass Analysis
Factorial MMC Analysis / Sp2013 GLM Screening - NMSS+WQ+no afdm / Composite -- ASE+LSE Site Locations
The GLM ProcedureDependent Variable: biomass
SourceF
Model<.0001
ErrorUncorrected Total
DF
8
607615
Sum of Squares
15249680.14
22922836.3638172516.50
Mean Square F Value Pr
1906210.02 50.48
37764.15
R-Square0.399494
NOTE: No intercept term is used:
Coeff Var Root MSE biomass Mean162.8803 194.3300 119.3085
R-square is not corrected for the mean.
< . 0 0 0 1
< • 0 0 0 1
Source
temperaturesalinity
DF
0.4396< . 0 0 0 1
doxydepthtss
< . 0 0 0 1ktn
0.00610.0275 tP
e coli0.5038
f entrococci
Type I SS
7052706.579 3365352.902
22587.975 1681142.133 26404 94.343 285995.912 184500.443 16899.848
0 . 0 0 0
Mean Square
7052706.579 3365352 .902
22587.975 1681142 .133 2640494 .343 285995.912 184500 .443 16899.848
F Value
186.76 89.12 0.60
44.52 69.92 7 .57 4 .89 0 .45
Pr
< ■0001
< . 0 0 0 1
Source
temperaturesalinity
< . 0 0 0 1
< . 0 0 0 1
doxydepthtssktn
0.35590.0288
tpe coli
0.5038
DF
1
f entrococci
Type III SS
1551059.0152338584.9721517573.012
0 . 0 0 0 839813.47032233.442
181304.38116899.848
0.000
Mean Square
1551059.0152338584.9721517573.012
839813.470 32233.442
181304.381 16899.848
F Value
41.0761.9340.19
22.240.854.800.45
Pr
Parametertemperaturesalinitydoxydepth
Estimate-19.492297 98.983292 74.402717
-2540.156640 B
StandardError
3.0415061 12.5783927 11.7369115
355.9359196
t Value Pr > 111-6.417.876.34-7.14
< . 0 0 0 1 < . 0 0 0 1 < . 0 0 0 1 < + 0 0 0 1
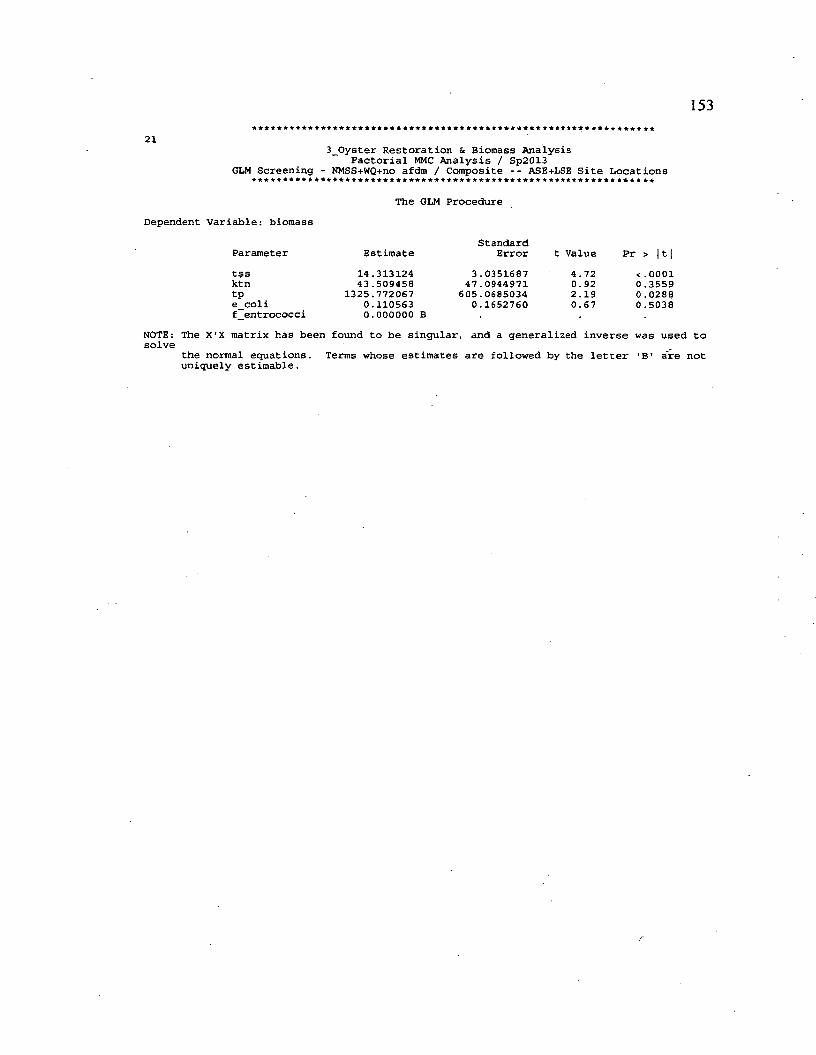
153
213_0yster Restoration & Biomass Analysis
Factorial MMC Analysis / Sp2013 GLM Screening - NMSS+WQ+no afdm / Composite -- ASE+LSE Site Locations
The GLM ProcedureDependent Variable: biomass
Parameter EstimateStandard
Error t Value Pr >tssktntpe_colif entrococci
14.313124 43.509458
1325.772067 0.110563 0.000000 B
3.035168747.0944971
605.06850340.1652760
4.72 0.92 2 .19 0.67
<.0001 0.3559 0 .0288 0.5038
NOTE: The X'X matrix has been found to be singular, and a generalized inverse was used to solve
the normal equations. Terms whose estimates are followed by the letter 'B' are not uniquely estimable.
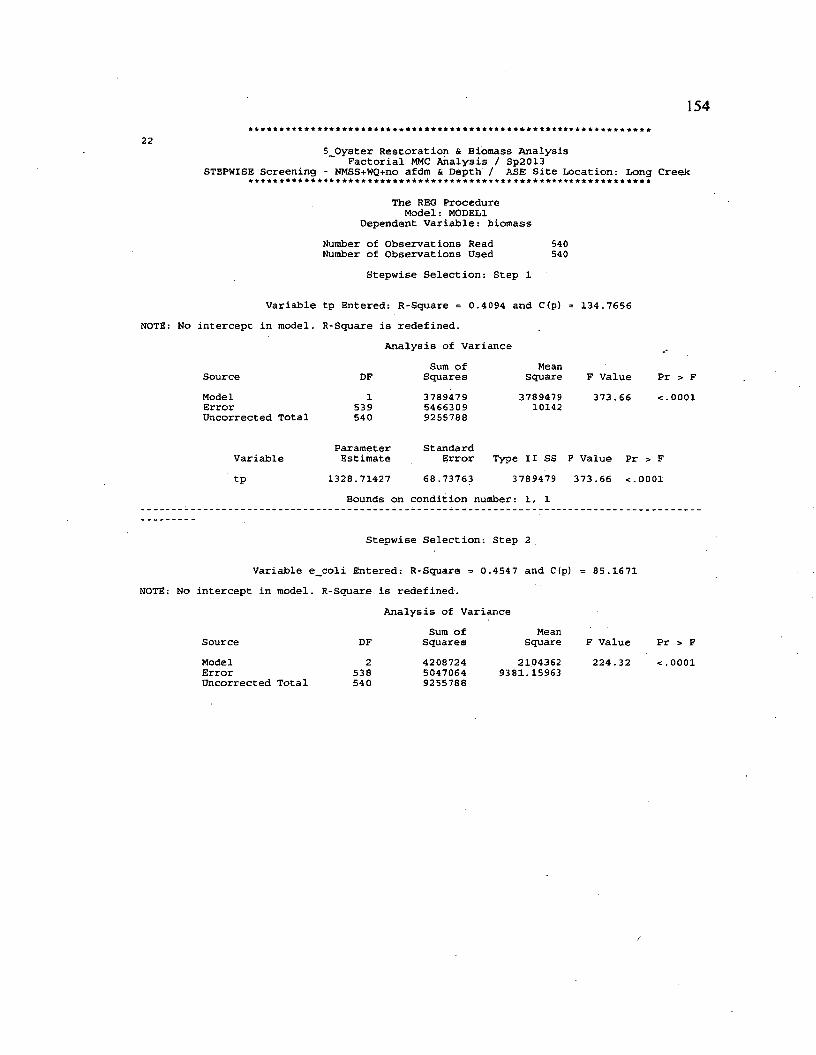
154
225_0yster Restoration & Biomass Analysis
Factorial MMC Analysis / Sp2013 STEPWISE Screening - NMSS+WQ+no afdm & Depth / ASE Site Location: Long Creek
The REG Procedure Model: M0DEL1
Dependent Variable: biomassNumber of Observations Read Number of Observations Used
Stepwise Selection: Step 1
540540
Variable tp Entered: R-Square = 0.4094 and C(p) = 134.7656 NOTE: No intercept in model. R-Square is redefined.
Analysis of Variance
SourceModelErrorUncorrected Total
DF1
539540
Sum of Squares378947954663099255788
MeanSquare
378947910142
F Value 373.66
Pr > F <.0001
VariabletP
ParameterEstimate
1328.71427
StandardError
68.73763Type II SS F Value Pr > F
3789479 373.66 <.0001Bounds on condition number: 1, 1
Stepwise Selection: Step 2
Variable e_coli Entered: R-Square = 0.4547 and C(p) = 85.1671 NOTE: No intercept in model. R-Square is redefined.
Analysis of VarianceSum of Mean
Source DF Squares Square F Value Pr > FModelErrorUncorrected Total
2538540
420872450470649255788
2104362 9381.15963
224.32 <•0001
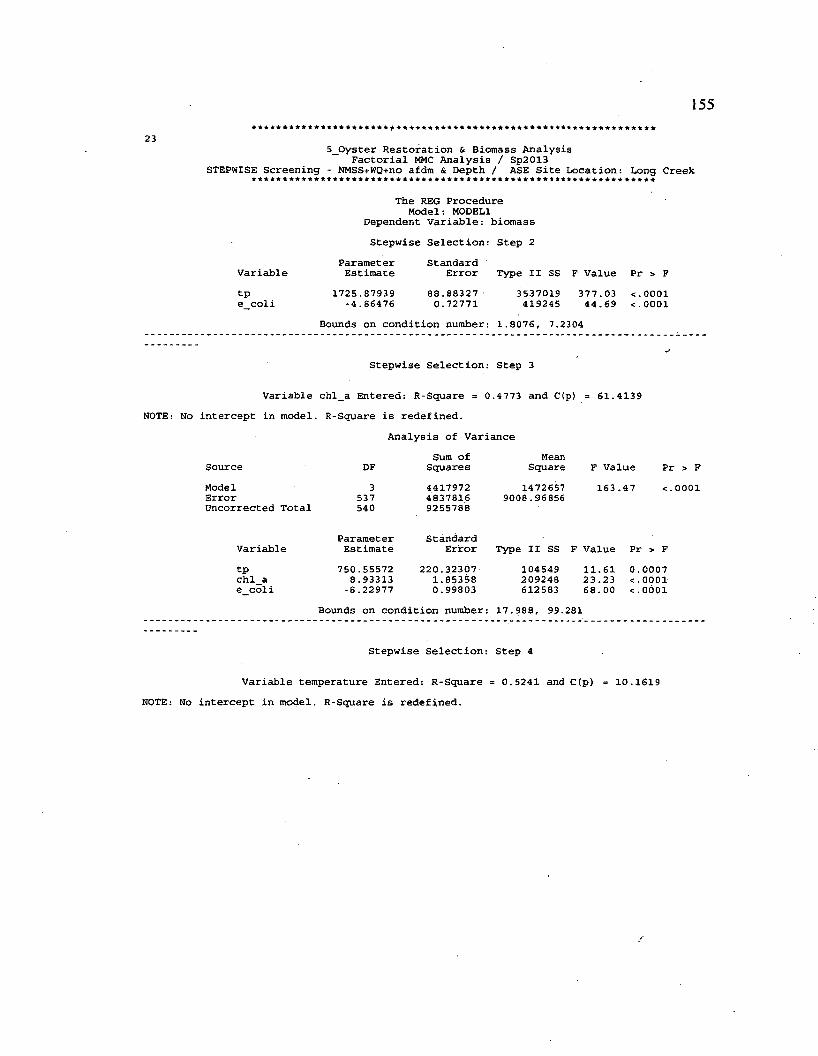
155
23 5_Oyster Restoration & Biomass Analysis Factorial MMC Analysis / Sp2013
STEPWISE Screening - NMSS+WQ+no afdm & Depth / ASE Site Location: Long Creek
The REG Procedure Model: MODEL1
Dependent Variable: biomassStepwise Selection: Step 2
VariableParameterEstimate
StandardError Type II SS F Value Pr > F
tpe coli
1725.87939-4.86476
88.883270.72771
3537019419245
377.03 <.000144.69 <.0001
Bounds on condition number: 1.8076, 7.2304
Stepwise Selection: Step 3
Variable chl_a Entered: R-Square = 0.4773 and C(p) = 61.4139 NOTE: No intercept in model. R-Square is redefined.
Analysis of Variance
SourceMode 1 ErrorUncorrected Total
DF3
537540
Sum of Squares441797248378169255788
MeanSquare
1472657 9008.96856
F Value Pr > F163.47 <.0001
Variabletpchl_a e coli
ParameterEstimate
750.55572 8.93313
-8.22977
StandardError
220.323071.853580.99803
Type II SS F Value Pr > F104 549 209248 612583
11.61 23 .23 6 8 . 00
0.0007< • 0 0 0 1< • 0 0 0 1
Bounds on condition number: 17.988, 99.281
Stepwise Selection: Step 4
Variable temperature Entered: R-Square = 0.5241 and C(p) = 10.1619 NOTE: No intercept in model. R-Square is redefined.
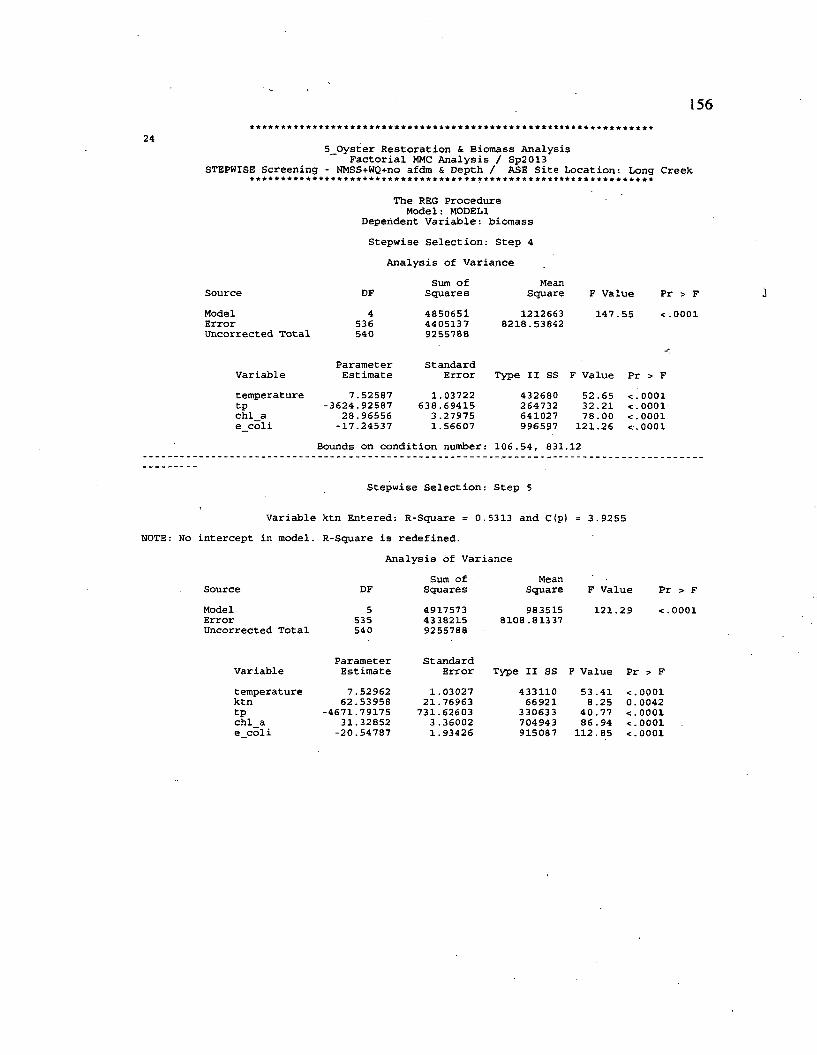
156
245_0yster Restoration & Biomass Analysis
Factorial MMC Analysis / Sp2013 STEPWISE Screening - NMSS+WQ+no afdm & Depth / ASE Site Location: Long Creek
The REG Procedure Model: MODEL1
Dependent Variable: biomassStepwise Selection: Step 4
Analysis of VarianceSum of Mean
Source DF Squares Square F Value PrModel 4 4850651 1212663 147 .,55 <.lError 536 4405137 8218.53842Uncorrected Total 540 9255788
Parameter StandardVariable Estimate Error Type II SS F Value Pr > Ftemperature 7.52587 1.03722 432680 52 .65 <■0001tp -3624.92587 638.69415 264732 32.21 €.0001chl_a 28.96556 3 .27975 641027 78.00 <.0001e_coli -17.24537 1.56607 996597 121.26 <-0001
Bounds on condition number: 106.54, 831.,12
Stepwise Selection: Step 5
Variable ktn Entered: R-Square = 0.5313 and C(p) = 3.9255 NOTE: No intercept in model. R-Square is redefined.
Analysis of Variance
SourceModelErrorUncorrected Total
DF5
535540
Sum of Squares491757343382159255788
MeanSquare983515
8108.81337
F Value 121.29
Pr > F <.0001
Variabletemperaturektntpchl_a e coli
ParameterEstimate7.52962
62.53958 -4671.79175
31.32852 -20.54787
StandardError
1.03027 21.76963
731.62603 3.36002 1.93426
Type II SS F Value Pr > F433110 66 921
330633 704943 915087
53.41 8 .25
40.77 86.94
112.85
<•0001 0.0042 <-0001 c.0001 <.0001
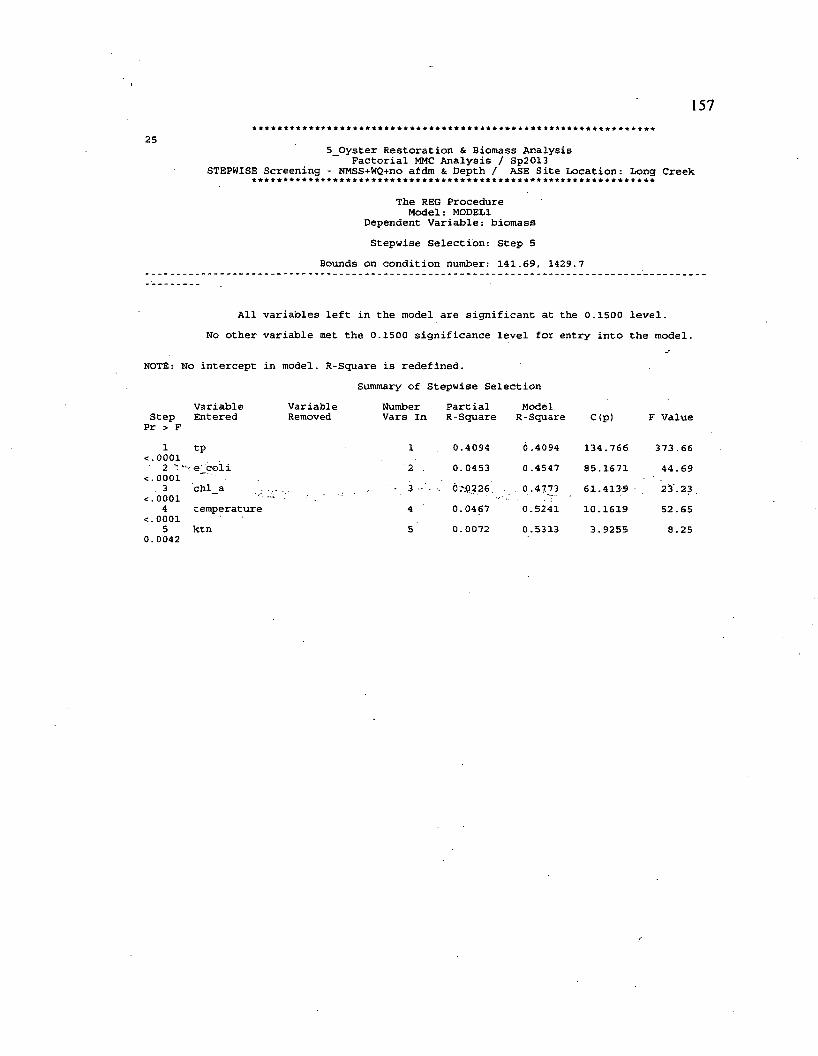
157
5_0yster Restoration & Biomass Analysis Factorial MMC Analysis / Sp2013
STEPWISE Screening - NMSS+WQ+no afdm & Depth / ASE Site Location: Long Creek
The REG Procedure Model: MODEL1
Dependent Variable: biomassStepwise Selection: Step 5
Bounds on condition number: 141.69, 1429.7
All variables left in the model are significant at the 0.1500 level.No other variable met the 0.1500 significance level for entry into the model.
NOTE: No intercept in model. R-Square is redefined.Summary of Stepwise Selection
StepVariableEntered
VariableRemoved
Number Vars In
PartialR-Square
ModelR-Square C(p) F Value
: > F 1 tp 1 0.4094 0 .4094 134.766 373.66
00012 e_coii 2 . 0.0453 0 .4547 85.1671 44.69
0001 , 3 chl_a . . . - 3 . 0 .'.0226 0.4773 61.4139 23.2300014 temperature 4 0.0467 0.5241 10.1619 52.65
00015 ktn 5 ' 0.0072 0.5313 3.9255 8.25
0.0042
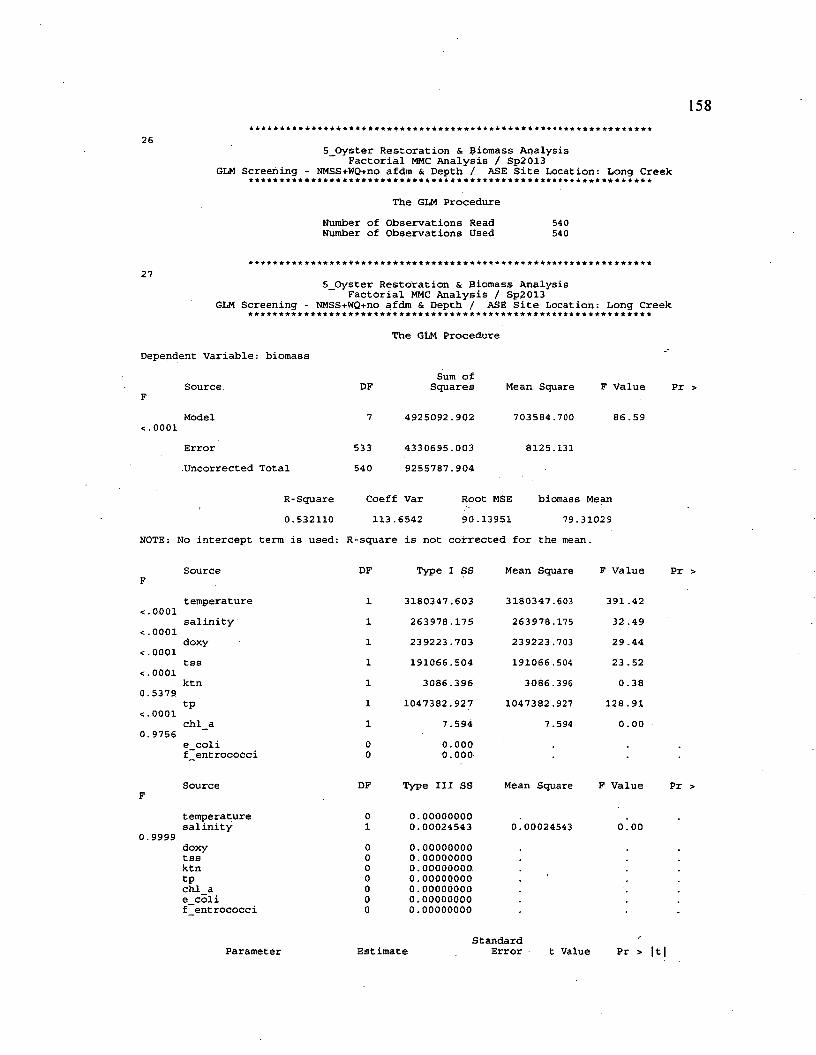
26
GLM Screening5_0yster Restoration & Biomass Analysis
Factorial MMC Analysis / Sp2013 NMSS+WQ+no afdm & Depth / ASE Site Location: Long Creek
The GLM ProcedureNumber of Observations Read Number of Observations Used
540540
275_Oyster Restoration & Biomass Analysis
Factorial MMC Analysis / Sp2013 GLM Screening - NMSS+WQ+no afdm & Depth / ASE Site Location: Long Creek
Dependent variable: biomass
< . 0 0 0 1
The GLM Procedure
Sum of
<■0001 <-0001 <.0001 <.0001 0.5379 <•0001 0.9756
0.9999
Source. DF Squares Mean Square F Value
Model
ErrorDncorrected Total
7
533540
4925092.902
4330695.0039255787.904
703584.700
8125.131
86 .59
R-Square Coeff Var Root MSE biomass Mean0.532110 113. 6542 90.13951 79. 31029
No intercept term is used: R-square is not corrected for the mean.
Source DF Type I SS Mean Square F Value
temperature 1 3180347.603 3180347.603 391.42salinity 1 263978.175 263978.175 32 .49doxy 1 239223.703 239223.703 29 .44tss 1 191066.504 191066 .504 23 .52ktn 1 3086.396 3086.396 0.38tp 1 1047382.927 1047382.927 128.91chl_a 1 7.594 7.594 0.00e_coli 0 0.000f_entrococci 0 0.000
Source DF Type III SS Mean Square F Value
temperature 0 0.00000000salinity 1 0.00024543 0.00024543 0. 00doxy 0 0.00000000tss 0 0.00000000ktn 0 0.00000000tp 0 0.00000000 '
chl_a 0 0.00000000e_coli 0 0.00000000f entrococci 0 0.00000000
Pr
Pr
Pr
Parameter EstimateStandard
Error t Value Pr > 111
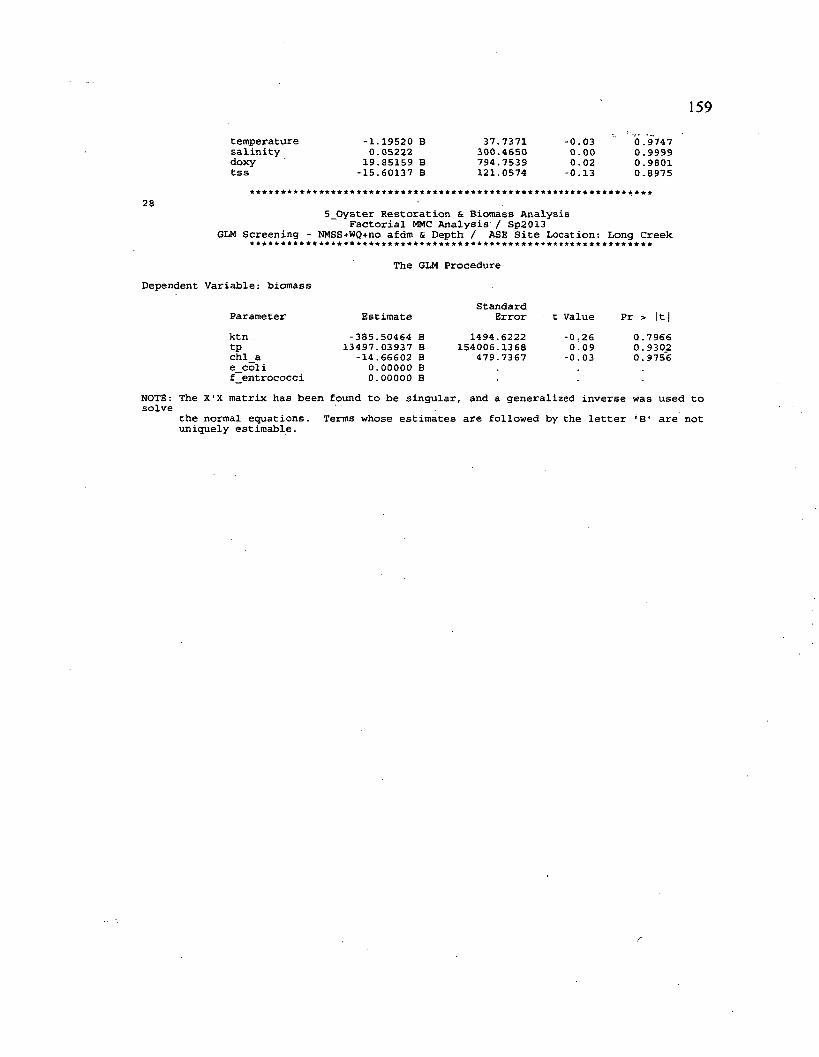
159
temperature -1.19520 B 37.7371 -0.03 0.9747salinity 0.05222 300.4650 0.00 0.9999doxy 19.85159 B 794.7539 0.02 0.9801tss -15.60137 B 121.0574 -0.13 0.8975
285_Oyster Restoration & Biomass Analysis
Factorial MMC Analysis / Sp2013 GLM Screening - NMSS+WQ+no afdm & Depth / ASE Site Location: Long Creek
Dependent Variable: biomassThe GLM Procedure
Parameter EstimateStandard
Error t Value Pr >ktntpchl_ae_colif entrococci
-385.50464 B 13497.03937 B
-14.66602 B 0.00000 B 0.00000 B
1494.6222154006.1368
479.7367-0.260.09-0.03
0.7966 0.9302 0.9756
NOTE: The X'X matrix has been found to be singular, and a generalized inverse was used to solve
the normal equations. Terms whose estimates are followed by the letter 'B' are notuniquely estimable.

160
295_Oyster Restoration & Biomass Analysis
Factorial MMC Analysis / Sp2013 STEPWISE Screening - NMSS+WQ+no afdm & Depth / LSE Site Locations: Linkhom Bay - Chalmers, Easter
The REG Procedure Model: MODEL1
Dependent Variable: biomassNumber of Observations Read 75Number of Observations Used 75
Stepwise Selection: Step 1
Variable doxy Entered: R-Square = 0.4614 and C(p) = 21.1967 NOTE: No intercept in model. R-Square is redefined.
Analysis of Variance
Source DFSum of
SquaresMean.
Square F Value Pr > FModelErrorUncorrected Total
17475
133432001557352928916729
13343200210453
63 .40 < .0001
VariableParameterEstimate
StandardError Type II SS F Value Pr > F
doxy 47.69116 5.98943 13343200 63.40 <. 0001Bounds on condition number: 1, 1
Stepwise Selection: Step 2
Variable tp.'Entered: R-Square = 0.4837 and C(p) = 19.3027 NOTE: No intercept in model. R-Square is redefined.
Analysis of Variance
Source DFSum of
SquaresMean
Square F Value Pr > FModel 2 13986994 6993497 34.20 <.0001Error 73 14929734 204517Uncorrected Total 75 28916729
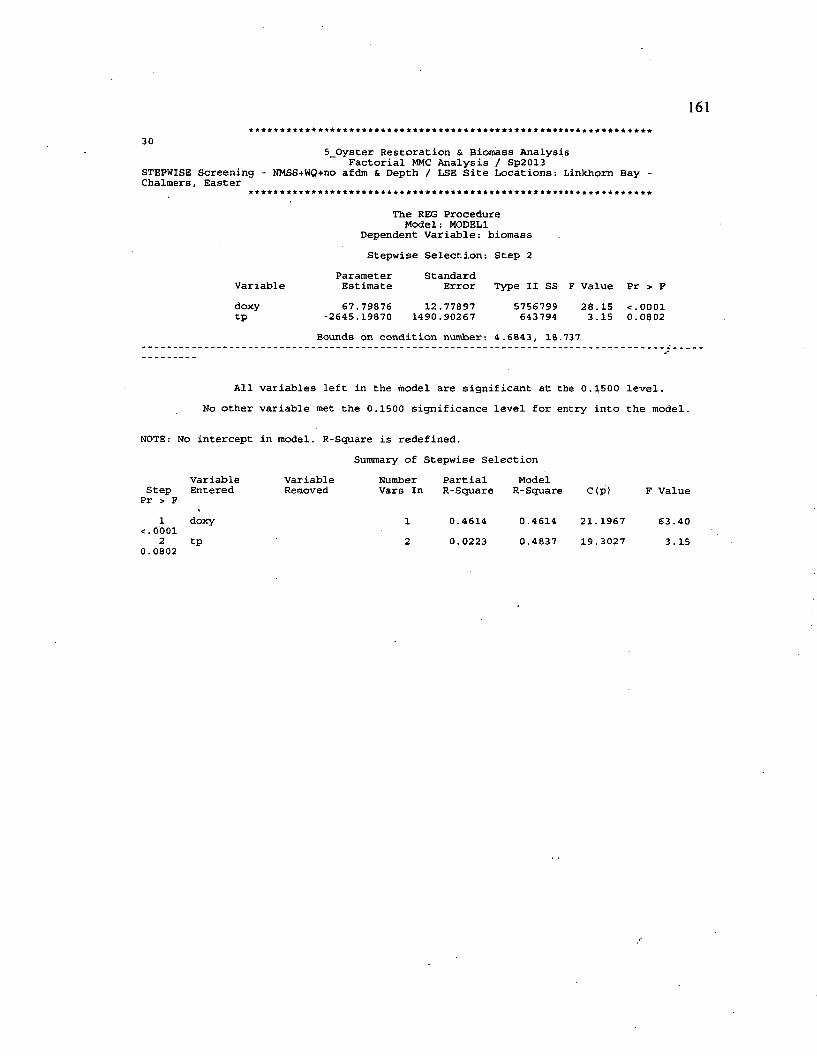
161
305_Oyster Restoration & Biomass Analysis
Factorial MMC Analysis / Sp2013 STEPWISE Screening - NMSS+WQ+no afdm & Depth / LSE Site Locations: Linkhom Bay Chalmers, Easter
The REG Procedure Model: MODEL1
Dependent Variable: biomassStepwise Selection: Step 2
Variabledoxytp
ParameterEstimate
StandardError Type II SS F Value Pr > F
67.79876 12.77897-2645.19870 1490.90267
5756799643794
28.15 <.00013.15 0.0802
Bounds on condition number: 4.6843, 18.737
All variables left in the model are significant at the 0.1500 level.No other variable met the 0.1500 significance level for entry into the model.
NOTE: No intercept in model. R-Square is redefined.Summary of Stepwise Selection
Step Pr > F
1< . 0 0 0 1
20 . 0 8 0 2
VariableEntered
doxytp
VariableRemoved
Number Vars In
PartialR-Square
0.46140.0223
ModelR-Square
0.46140.4837
C(p)
21.1967 19.3027
F Value
63.403.15
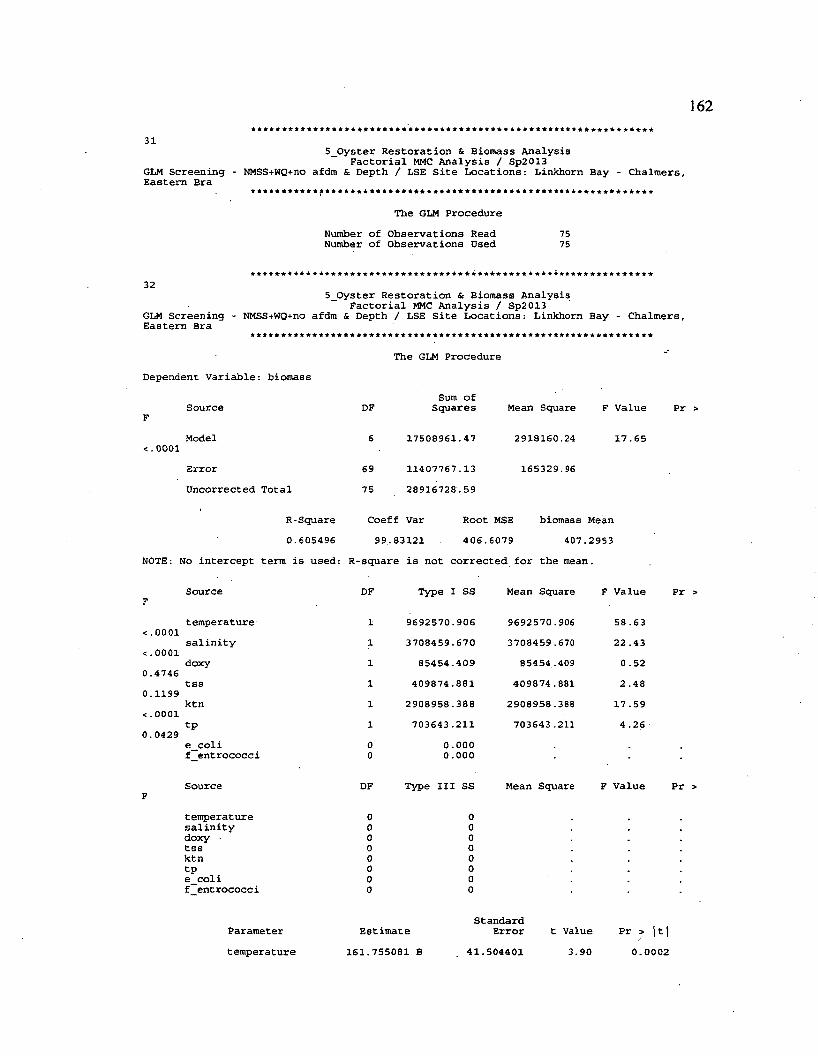
315_Oyster Restoration & Biomass Analysis
Factorial MMC Analysis / Sp2013 GLM Screening - NMSS+WQ+no afdm & Depth / LSE Site Locations: Linkhorn Bay - Chalmers, Eastern Bra
The GLM ProcedureNumber of Observations Read Number of Observations Used
7575
325_Oyster Restoration & Biomass Analysis
Factorial MMC Analysis / Sp2013 GLM Screening - NMSS+WQ+no afdm & Depth / LSE Site Locations: Linkhorn Bay - Chalmers, Eastern Bra
Dependent Variable: biomassThe GLM Procedure
Sum ofSource DF Squares Mean Square F Value Pr
FModel 6 17508961.47 2918160.24 17.65
<.0001Error 69 11407767.13 165329.96Uncorrected Total 75 28916728.59
R-Square Coeff Var Root MSE biomass Mean0.605496 99.83121 406. 6079 407. 2953
NOTE: No intercept term is used: R-square is not corrected for the mean.
FSource DF Type I SS Mean Square F Value Pr
temperature 1 9692570.906 9692570.906 58 .63<.0001
salinity 1 3708459.670 3708459 .670 22 .43<.0001
doxy 1 85454.409 85454 .409 0.520.4746
tss 1 409874.881 409874.881 2 .480.1199
ktn 1 2908958.388 2908958.388 17 .59<.0001
tp 1 703643.211 703643.211 4.260.0429
e_coli 0 0.000f_entrococci 0 0.000 -
Source DF Type III SS Mean Square F Value PrF
temperature 0 0salinity 0 0doxy - 0 0tss 0 0ktn 0 0tp 0 0e_coli 0 0f entrococci 0 0
Parametertemperature
Estimate 161.755081 B
StandardError
41.504401t Value
3.90Pr » |t|
0 . 0 0 0 2
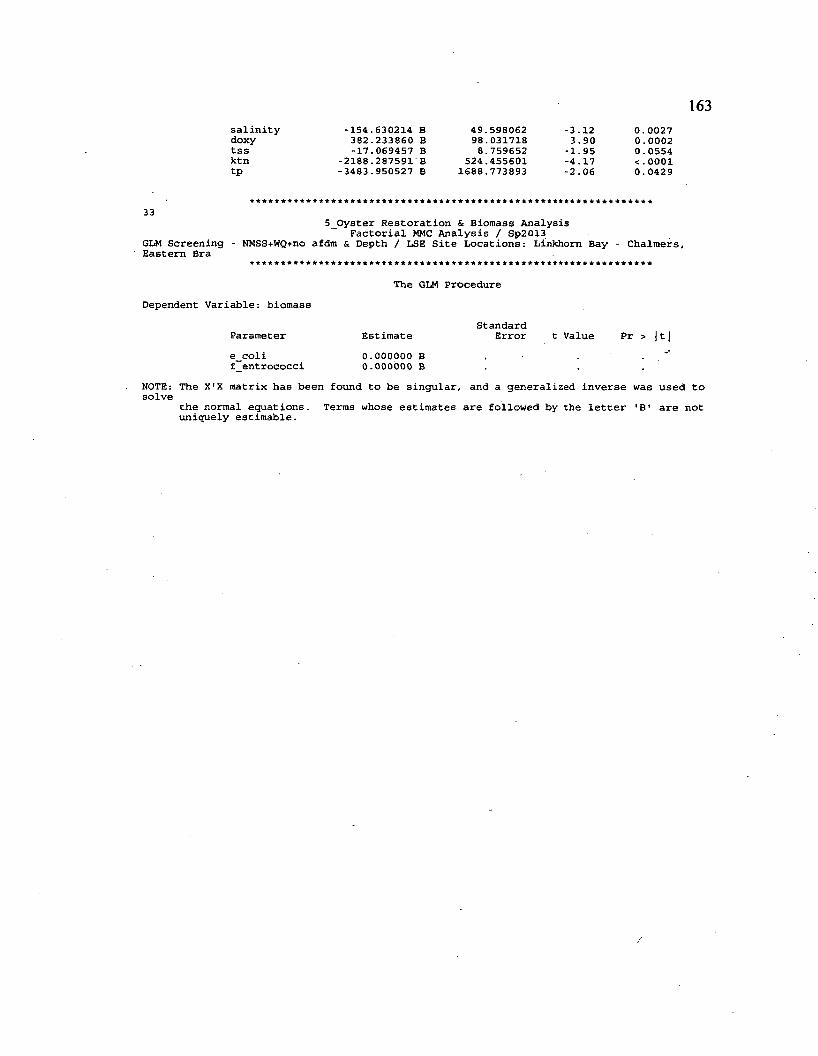
163salinity -154.630214 B 49.598062 -3.12 0.0027doxy 382.233860 B 98.031718 3.90 0.0002tss -17.069457 B 8.759652 -1.95 0.0554ktn -2188.287591 B 524.455601 -4.17 <-0001tp -3483.950527 B 1688.773893 -2.06 0.0429
335_0yster Restoration & Biomass Analysis
Factorial MMC Analysis / Sp2 013 GLM Screening - NMSS+WQ+no afdm & Depth / LSE Site Locations: Linkhorn Bay - Chalmers, Eastern Bra
Dependent Variable: biomassThe GLM Procedure
Parametere_colif entrococci
Estimate0.000000 B 0.000000 B
StandardError t Value Pr > j 11
NOTE: The X'X matrix has been found to be singular, and a generalized inverse was used to solve
the normal equations. Terms whose estimates are followed by the letter 'B' are notuniquely estimable.
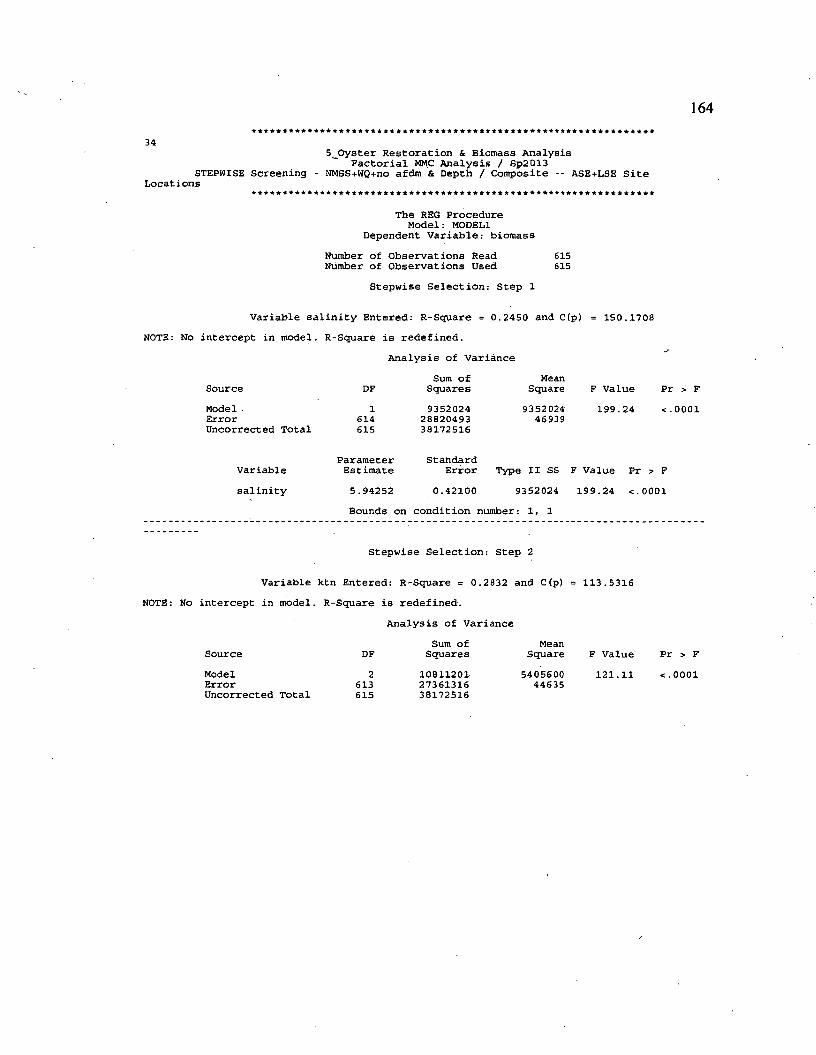
164
345_Oyster Restoration & Biomass Analysis
Factorial MMC Analysis / Sp2013 STEPWISE Screening - NMSS+WQ+no afdm & Depth / Composite -- ASE+LSE Site
Locations
The REG Procedure Model: MODEL1
Dependent Variable: biomassNumber of Observations Read Number of Observations Used
Stepwise Selection: Step 1
615615
Variable salinity Entered: R-Square = 0.2450 and C(p) = 150.1708 NOTE: No intercept in model. R-Square is redefined.
Analysis of Variance
SourceModelErrorUncorrected Total
DF1
614615
Sum of Squares9352024
2882049338172516
MeanSquare
935202446939
PrF Value 199.24 <.
Variablesalinity
ParameterEstimate5.94252
StandardError
0.42100Type II SS F value Pr > F
9352024 199.24 <.0001Bounds on condition number: 1, 1
Stepwise Selection: Step 2
Variable ktn Entered: R-Square = 0.2832 and C(p) = 113.5316NOTE: No intercept in model. R-Square is redefined.
Analysis of VarianceSum of Mean
Source DF Squares Square F Value Pr
> F 0 0 0 1
ModelErrorUncorrected Total
2613615
108112012736131638172516
5405600 121.11 <.000144635
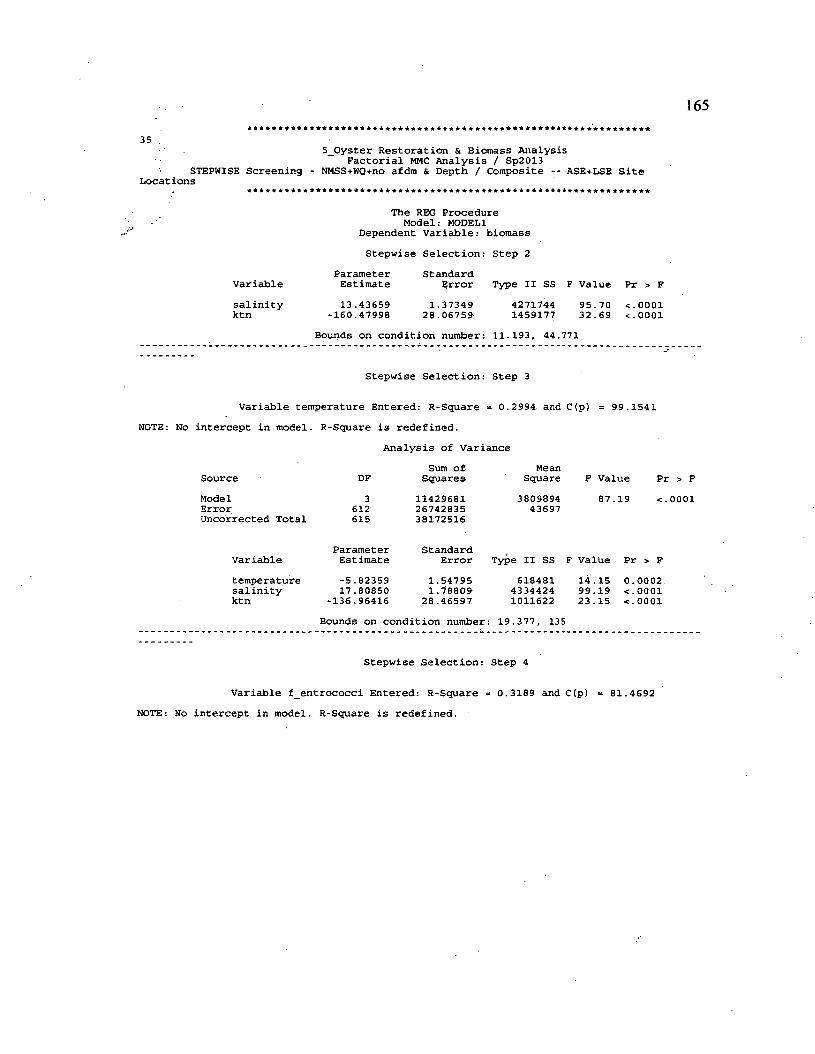
165
355_Oyster Restoration & Biomass Analysis
Factorial MMC Analysis / Sp2013 STEPWISE Screening - NMSS+WQ+no afdm & Depth / Composite -- ASE+LSE Site
Locations
The REG Procedure Model: MODEL1
Dependent Variable: biomassStepwise Selection: Step 2
Variablesalinityktn
ParameterEstimate13.43659
-160.47998
StandardError
1.3734928.06759
Type II SS F Value Pr > F42717441459177
95.7032.69
< . 0 0 0 1< ■ 0 0 0 1
Bounds on condition number: 11.193, 44.771
Stepwise Selection: Step 3
Variable temperature Entered: R-Square = 0.2994 and C(p) = 99.1541 NOTE: No intercept in model. R-Square is redefined.
Analysis of Variance
SourceModelErrorUncorrected Total
DF3
612615
Sum of Squares
114296812674283538172516
MeanSquare
380989443697
F Value Pr > F87.19 <.0001
Variabletemperaturesalinityktn
ParameterEstimate-5.8235917.80850
-136.96416
StandardError
1.54795 1.78809
28.46597
Type II SS F Value Pr > F618481
43344241011622
14.15 99.1923.15
0.0002 < ■ 0 0 0 1 < . 0 0 0 1
Bounds on condition number: 19.377, 135
Stepwise Selection: Step 4
Variable f_entrococci Entered: R-Square = 0.3189 and C(p) = 81.4692 NOTE: No intercept in model. R-Square is redefined.
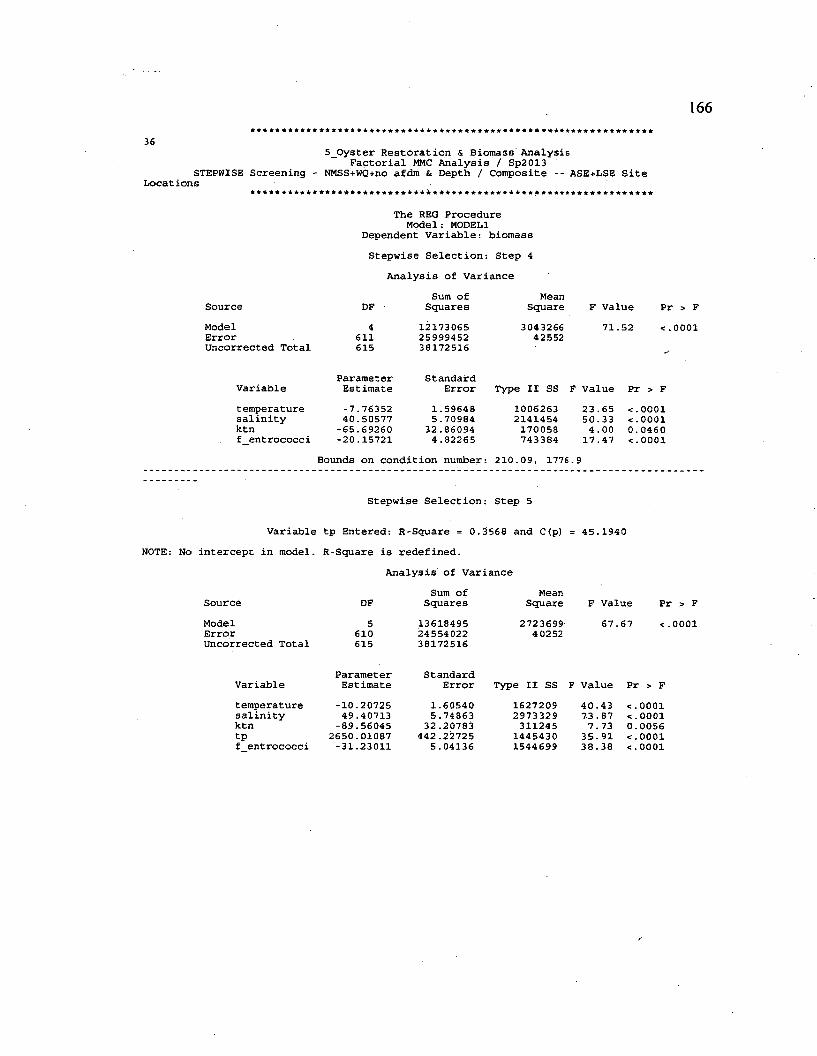
166
36
STEPWISE Screening Locations
5_Oyster Restoration & Biomass Analysis Factorial MMC Analysis / Sp2013
NMSS+WQ+no afdm & Depth / Composite -- ASE+LSE Site
The REG Procedure Model: M0DEL1
Dependent Variable: biomassStepwise Selection: Step 4
Analysis of VarianceSum Of Mean
Source DF Squares Square F Value Pr > FModel 4 12173065 3043266 71..52 <.0001Error 611 25999452 42552Uncorrected Total 615 38172516
Parameter StandardVariable Estimate Error Type II SS F Value Pr > Ftemperature -7.76352 1.59648 1006263 23.65 < .0001salinity 40.50577 5.70984 2141454 50.33 <.0001ktn -65.69260 32.86094 170058 4.00 0.0460f_entrococci -20.15721 4.82265 743384 17.47 <.0001
Bounds on condition number: 210.09, 1776.9
Stepwise Selection: Step 5
Variable tp Entered: R-Square = 0.3568 and C(p) = 45.1940 NOTE: No intercept in model. R-Square is redefined.
Analysis of VarianceSum of Mean
Source DF Squares Square F Value P2
Model 5 13618495 2723699 67..67 <.Error 610 24554022 40252Uncorrected Total 615 38172516
Parameter StandardVariable Estimate Error Type II SS F Value Pr > Ftemperature -10.20725 1.60540 1627209 40.43 <•0001salinity 49.40713 5.74863 2973329 73 . 87 <.0001ktn -89.56045 32 .20783 311245 7. 73 0.0056tp 2650.01087 442 .22725 1445430 35.91 <■0001f entrococci -31.23011 5.04136 1544699 38.38 <•0001
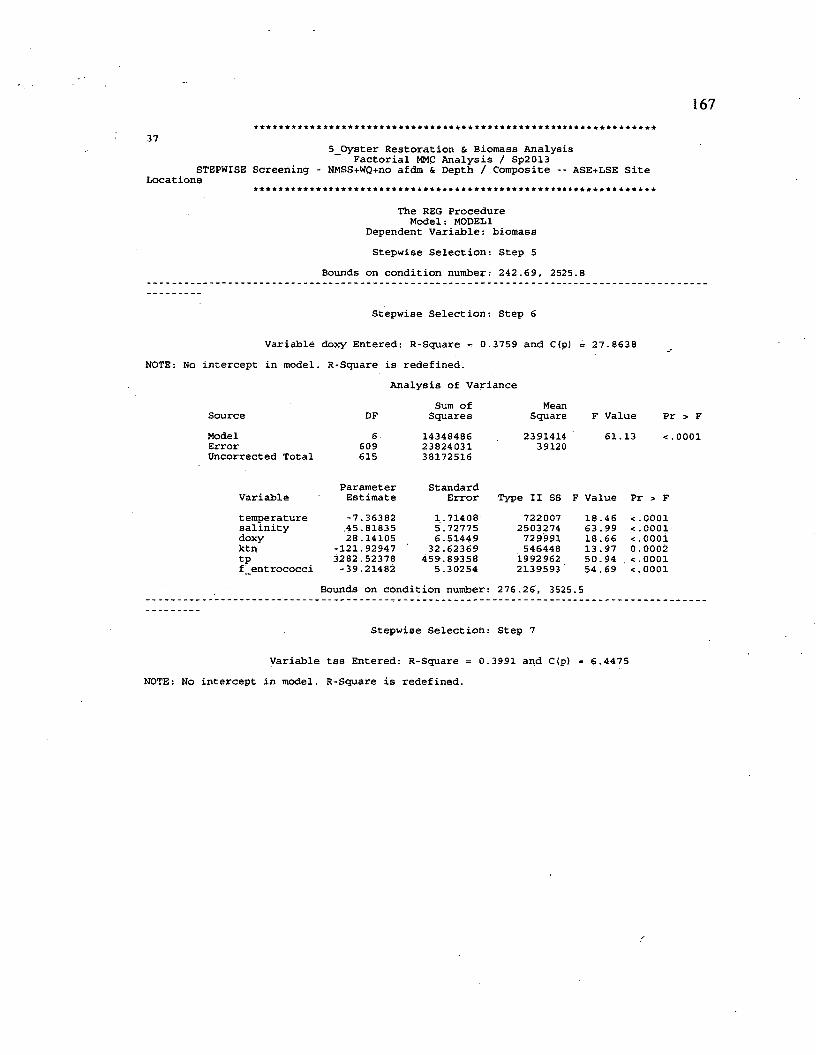
167
375_Oyster Restoration & Biomass Analysis
Factorial MMC Analysis / Sp2013 STEPWISE Screening - NMSS+WQ+no afdm & Depth / Composite -- ASE+LSE Site
Locations
The REG Procedure Model: MODEL1
Dependent Variable: biomassStepwise Selection: Step 5
Bounds on condition number: 242.69, 2525.8
Stepwise Selection: Step 6
Variable doxy Entered: R-Square = 0.3759 and C(p) NOTE: No intercept in model. R-Square is redefined.
Analysis of Variance
27.8638
Source DFSum of
SquaresMean
Square F Value Pr > FModelErrorUncorrected Total
6609615
143484862382403138172516
239141439120
61..13 <.0001
VariableParameterEstimate
StandardError Type II SS F Value Pr > F
temperaturesalinitydoxyktntpf_entrococci
-7.36382.45.8183528.14105
-121.929473282.52378-39.21482
1.71408 5.72775 6.51449
32.62369 459.89358
5.30254
722007 2503274 729991 546448
1992962 2139593'
18.46 63.99 18.66 13 . 97 50. 94 54.69
<.0001<■0001<•00010.0002<■0001<•0001
Bounds on condition number:: 276.26, 3525 .5
Stepwise Selection:: Step 7
Variable tss Entered: R-Square = 0. 3991 and C(p) = 6.4475intercept in model. R-Square is redefined.
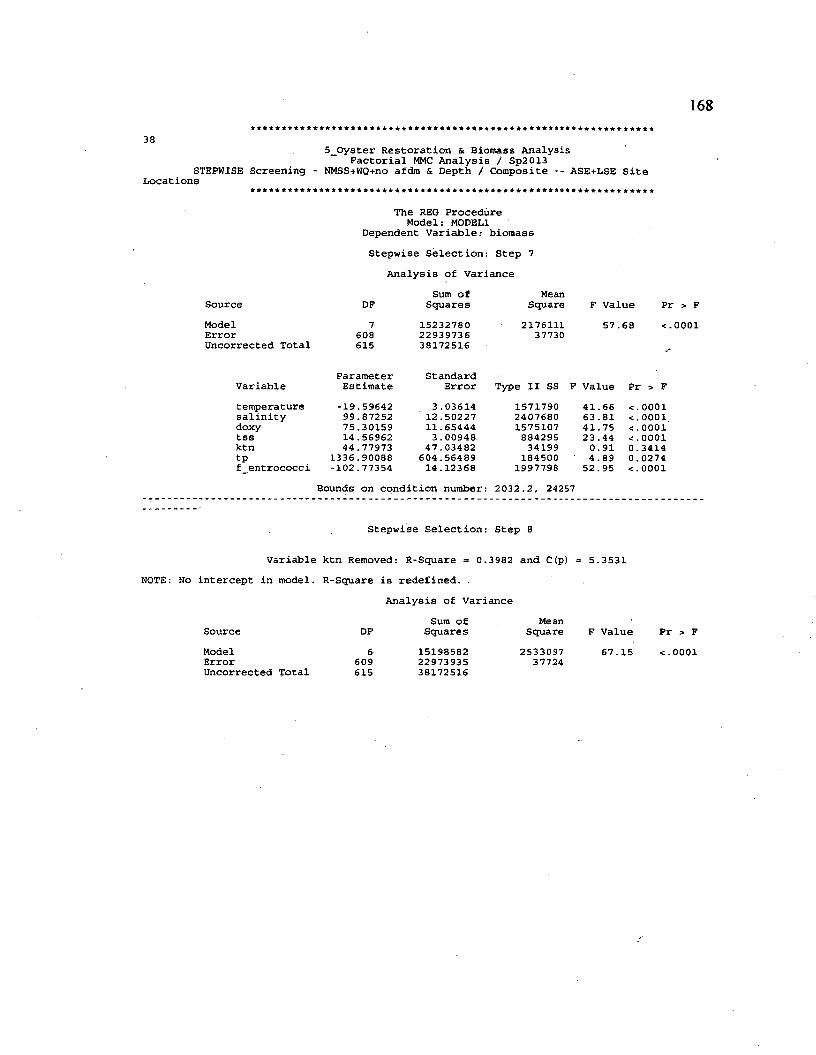
168
385_0yster Restoration & Biomass Analysis
Factorial MMC Analysis / Sp2013 STEPWISE Screening - NMSS+WQ+no afdm & Depth / Composite -- ASE+LSE site
Locations
The REG Procedure Model: MODEL1
Dependent Variable: biomassStepwise Selection: Step 7
Analysis of Variance
SourceModelErrorUncorrected Total
DF7
608615
Sum of Squares
152327802293973638172516
MeanSquare
217611137730
F Value 57 .68
Pr > F < . 0 0 0 1
Parameter StandardVariable Estimate Error Type II SS F Value Pr > Ftemperature -19.59642 3 .03614 1571790 41.66 <■0001salinity 99.87252 12.50227 2407680 63.81 <.0001doxy 75.30159 11.65444 1575107 41.75 <.0001tss 14.56962 3.00948 884295 23 .44 <•0001ktn 44.77973 47.03482 34199 0.91 0.3414tp 1336.90088 604.56489 184500 4.89 0.0274f entrococci -102.77354 14.12368 1997798 52.95 <.0001
Bounds on condition number: 2032.2, 24257
Stepwise Selection: Step 8
Variable ktn Removed: R-Square = 0.3982 and C(p) = 5.3531 NOTE: No intercept in model. R-Square is redefined. .
Analysis of VarianceSum of Mean
Source DF Squares Square F Value Pr > FModel 6 15198582 2533097 67. 15 <.0001Error 609 22973935 37724Uncorrected Total 615 38172516
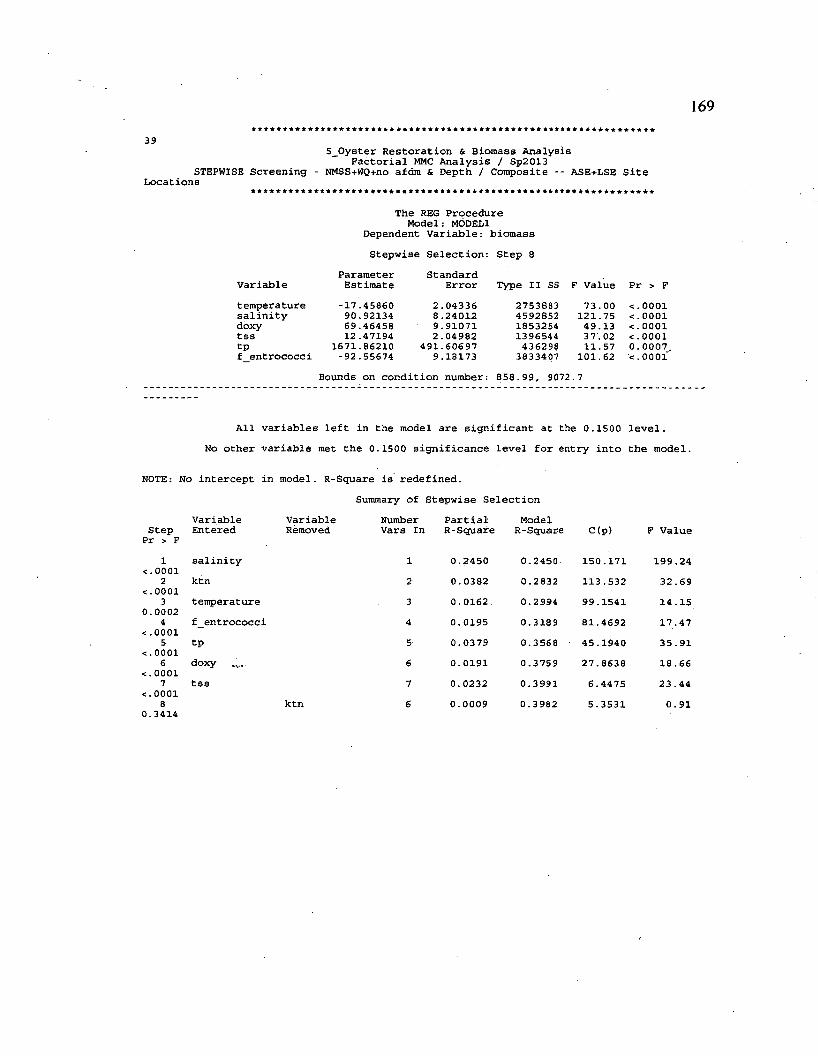
169
395_0yster Restoration & Biomass Analysis
Factorial MMC Analysis / Sp2013 STEPWISE Screening - NMSS+WQ+no afdm & Depth / Composite -- ASE+LSE Site
Locations
Variabletemperaturesalinitydoxytsstpf entrococci
The REG Procedure Model: MODELl
Dependent Variable: biomass
ParameterEstimate
Stepwise Selection: Step 8
Type II SS-17.45860 90.92134 69.46458 12.47194
1671.86210 -92.55674
StandardError
2.04336 8.24012 9.91071 2.04982
491.60697 9.18173
F Value Pr > F2753883459285218532541396544436298
3833407
73.00 121.75 49.13 37 . 02 11.57
101.62
. 0 0 0 1
. 0 0 0 1
. 0 0 0 1
. 0 0 0 1
.0007.
. 0 0 0 1
Bounds on condition number: 858.99, 9072.7
All variables left in the model are significant at the 0.1500 level.No other variable met the 0.1500 significance level for entry into the model.
NOTE: No intercept in model. R-Square is redefined.Summary of Stepwise Selection
>tep : > F
VariableEntered
VariableRemoved
Number Vars In
PartialR-Square
ModelR-Square C(p) F Value
1 salinity 1 0.2450 0.2450 150.171 199.2400012 ktn 2 0.0382 0.2832 113.532 32.69
00013 temperature 3 0.0162 0.2994 99.1541 14 .15
00024 f entrococci 4 0.0195 0.3189 81.4692 17.47
00015 tp 5 0.0379 0.3568 45.1940 35.91
00016 doxy 6 0.0191 0.3759 27.8638 18.66
00017 tss 7 0.0232 0.3991 6.4475 23 .44
00018 ktn 6 0.0009 0.3982 5.3531 0.91
0.3414
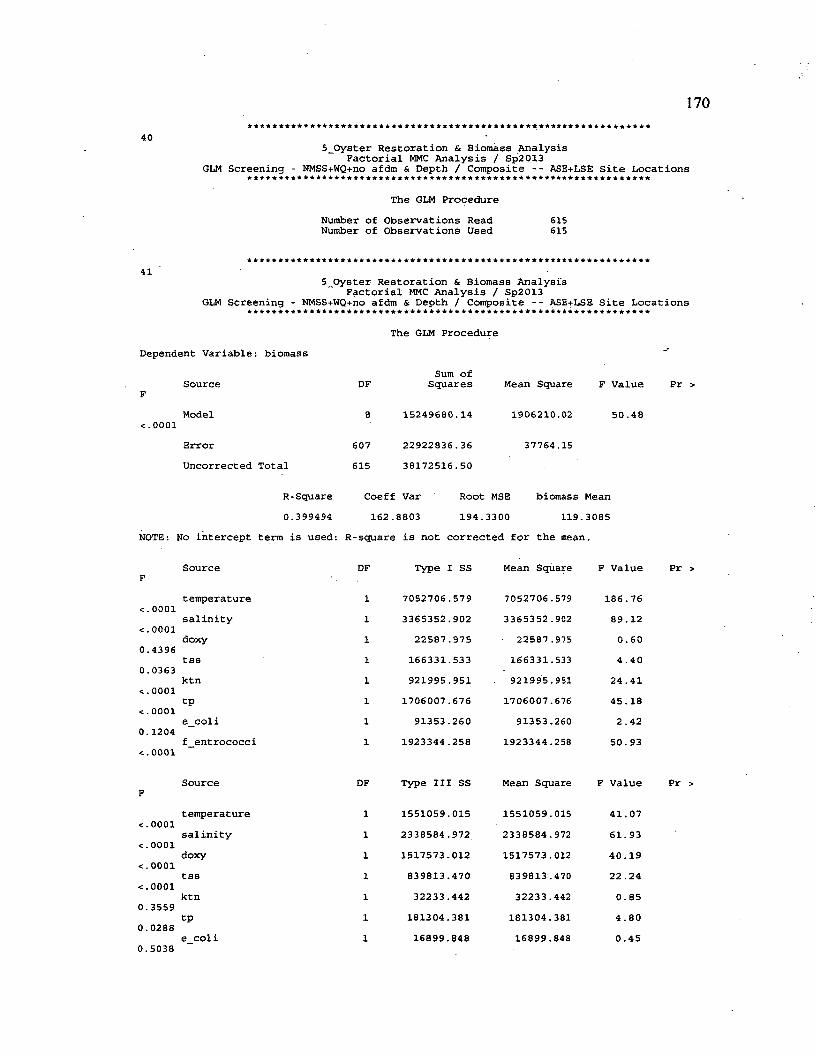
170
40
GLM Screening5_Oyster Restoration & Biomass Analysis
Factorial MMC Analysis / Sp2013 NMSS+WQ+no afdm & Depth / Composite -- ASE+LSE Site Locations
The GLM ProcedureNumber of Observations Read Number of Observations Used
615615
415_Oyster Restoration & Biomass Analysis
Factorial MMC Analysis / Sp2013 GLM Screening - NMSS+WQ+no afdm & Depth / Composite -- ASE+LSE Site Locations
The GLM ProcedureDependent Variable: biomass
< . 0 0 0 1
<.0001 <.0001 0.4396 0.0363 <•0001 <■0001 0.1204 <■0001
<■0001
< • 0 0 0 1
< - 0 0 0 1
< ■0001
0.35590.02880.5038
Source DFSum of
Squares Mean Square F Value
Model 8 15249680.14 1906210.02 50 .48
ErrorUncorrected Total
607615
22922836.3638172516.50
37 764.15
R-Square. Coeff Var Root MSE biomass Mean0.399494 162 .8803 194. 3300 119 3085
No intercept term is used: R-square is not corrected for the mean.
Source DF Type I SS Mean Square F Value
temperature 1 7052706.579 7052706.579 186.76salinity 1 3365352.902 3365352 .902 89.12doxy 1 22587.975 22587.975 0.60tss 1 166331.533 166331.533 4.40ktn 1 921995.951 921995.951 24.41tp 1 1706007.676 1706007.676 45.18e_coli 1 91353.260 91353.260 2 .42f_entrococci 1 1923344.258 1923344.258 50.93
Source DF Type III SS Mean Square F Value
temperature 1 1551059.015 1551059.015 41.07salinity 1 2338584.972 2338584.972 61.93doxy 1 1517573.012 1517573.012 40.19tss 1 839813.470 839813.470 22.24ktn 1 32233.442 32233.442 0.85tp 1 181304.381 181304.381 4.80e_coli 1 16899.848 16899.848 0.45
Pr >
Pr >
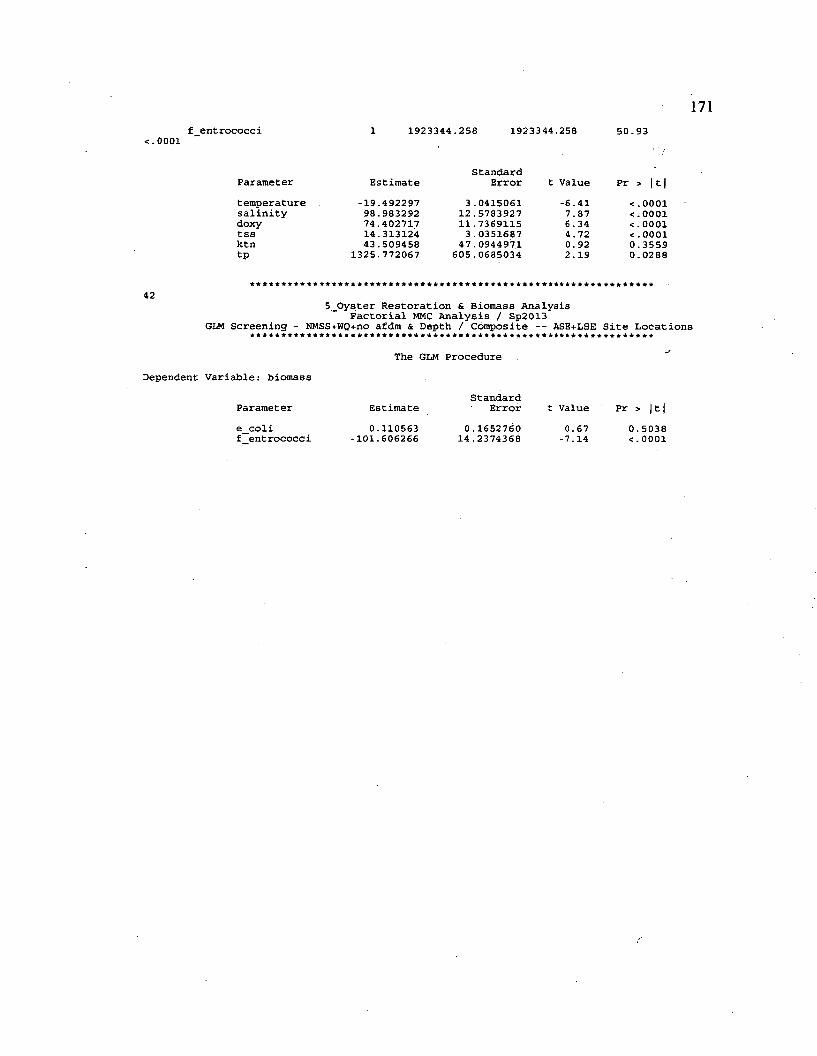
171f entrococci
<.00011923344.258 1923344.258 50.93
Parametertemperaturesalinitydoxytssktntp
Estimate-19.49229798.98329274.40271714.31312443.509458
1325.772067
StandardError
3.0415061 12.5783927 11.7369115 3.0351687
47.0944971 605.0685034
t Value-6.417.876.344.720.922.19
Pr |t|< • 0 0 0 1< - 0 0 0 1< ■ 0 0 0 1< - 0 0 0 10.35590.0288
425_Oyster Restoration & Biomass Analysis
Factorial MMC Analysis / Sp2013 GLM Screening - NMSS+WQ+no afdm & Depth / Composite -- ASE+LSE Site Locations
The GLM ProcedureDependent Variable: biomass
Parameter EstimateStandard
Error t Value Pre_colif entrococci
0.110563-101.606266
0.1652760 14.2374368
0.67 -7.14
0.5038 <.0001
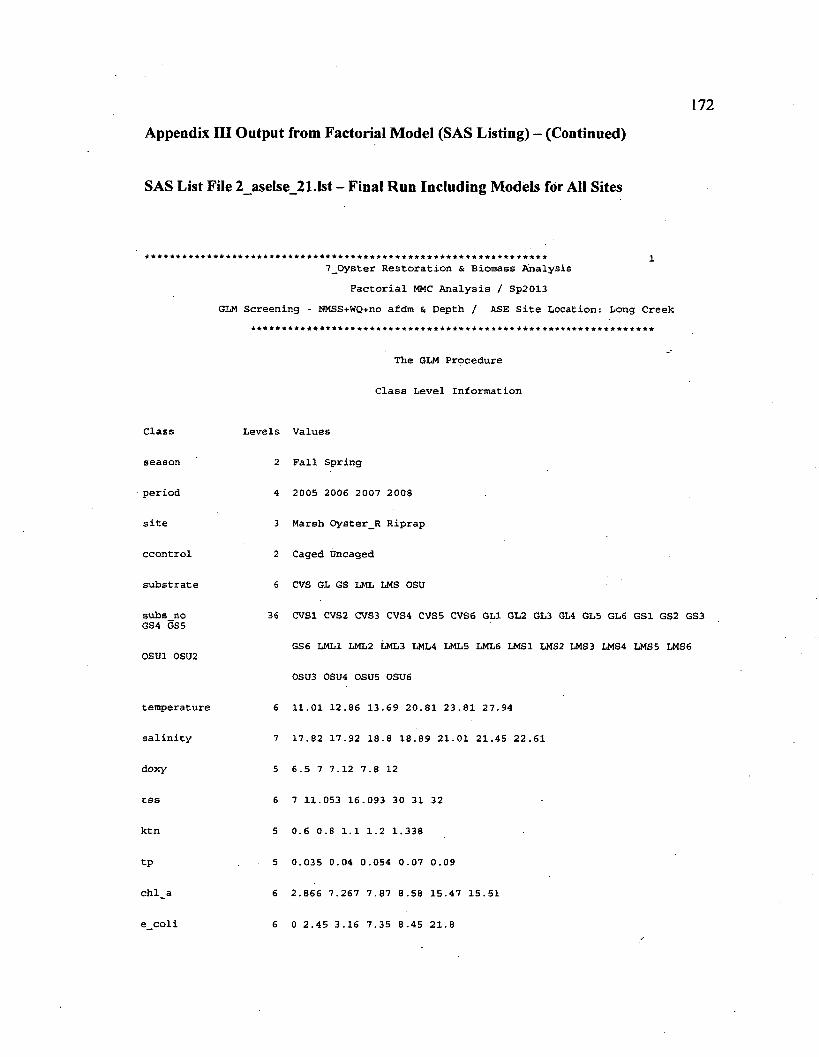
172
Appendix III Output from Factorial Model (SAS Listing) - (Continued)
SAS List File 2_aselse_21.Ist - Final Run Including Models for All Sites
7_Oyster Restoration & Biomass Analysis Factorial MMC Analysis / Sp2013
GLM Screening - NMSS+WQ+no afdm & Depth / ASE Site Location: Long Creek
The GLM Procedure
Class Level Information
Class
season
period
site
ccontrol
substrate
subs_no GS4 GS5
0SU1 0SU2
temperature
salinity
doxy
tss
ktn
tp
chl_a
e coli
Levels Values
2 Fall Spring
4 2005 2006 2007 2008
3 Marsh Oyster_R Riprap
2 Caged Uncaged
6 CVS GL GS LML LMS OSU
36 CVS1 CVS2 CVS3 CVS4 CVS5 CVS6 GL1 GL2 GL3 GL4 GL5 GL6 GS1 GS2 GS3
GS6 LML1 LML2 LML3 LML4 LML5 LML6 LMS1 LMS2 LMS3 LMS4 LMS5 LMS6
0SU3 0SU4 OSU5 OSU6
6 11.01 12.86 13.69 20.81 23.81 27.94
7 17.82 17.92 18.8 18.89 21.01 21.45 22.61
5 6.5 7 7.12 7.8 12
6 7 11.053 16.093 30 31 32
5 0.6 0.8 1.1 1.2 1.338
5 0.035 0.04 0.054 0.07 0.09
6 2.866 7.267 7.87 8.58 15.47 15.51
6 0 2.45 3.16 7.35 8.45 21.8
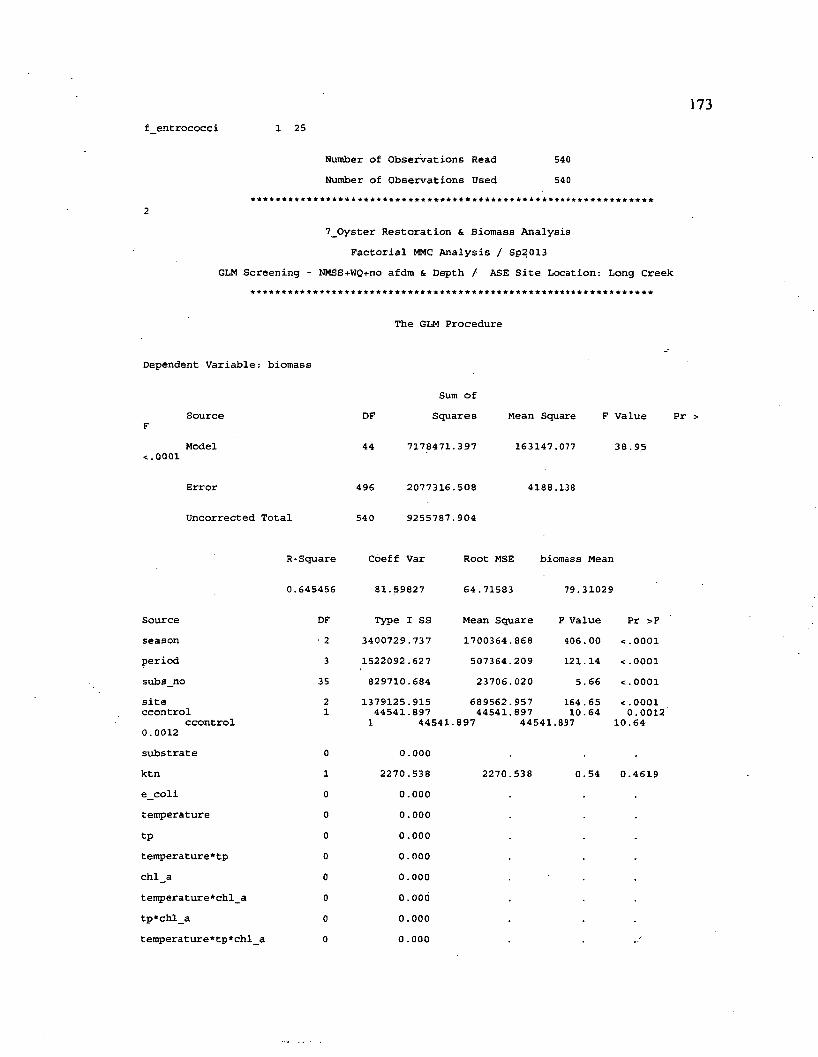
f entrococci X 25
Number of Observations Read 540Number of Observations Used 540
7_Oyster Restoration & Biomass Analysis Factorial MMC Analysis / Sp2013
GLM Screening - NMSS+WQ+no afdm & Depth / ASE Site Location: Long Creek
The GLM Procedure
Dependent Variable: biomass
SourceF
Model< . 0 0 0 1
Error
Uncorrected Total
DF
44
496
54 0
Sum ofSquares Mean Square F Value Pr
7178471.397
2077316.508
9255787.904
163147.077
4188.138
38.95
R-Square Coeff Var Root MSB biomass Mean
0.645456 81.59827 64.71583 79.31029
Source DF Type I SS Mean Square F Value Pr >Fseason • 2 3400729.737 1700364.868 406.00 <.0001period 3 1522092.627 507364.209 121.14 <.0001subs_no 35 829710.684 23706.020 5.66 <.0001site 2 1379125.915 689562.957 164.65 <.0001ccontrol 1 44541.897 44541.897 10.64 0.0012
ccontrol0.0012
1 44541 897 44541.897 10.64
substrate 0 0.000ktn 1 2270.538 2270.538 0.54 0.4619e_coli 0 0.000temperature 0 0.000tp 0 0 .000temperature*tp 0 0.000chl_a 0 0.000temperature * chl_a 0 0.000tp*chl_a 0 0.000 •temperature*tp*chl_a 0 0 .000
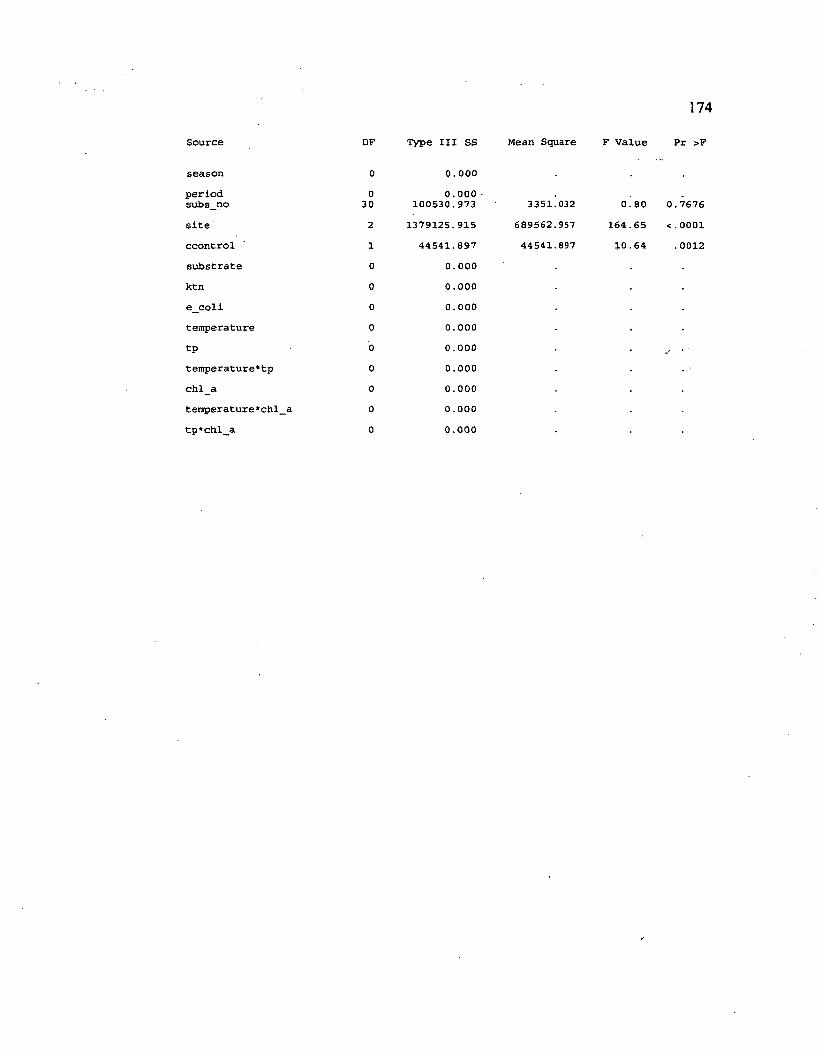
174
Source DF Type III SS Mean Square F Value Pr >F
season 0 0.000period 0 0.000subs_no 30 100530.973 3351.032 0.80 0.7676site 2 1379125.915 689562.957 164.65 <.0001ccontrol 1 44541.897 44541.897 10.64 .0012substrate 0 0.000ktn 0 0.000e_coli 0 0.000temperature 0 0.000tp 0 0. 000temperature*tp 0 0.000chl_a 0 0.000temperature*chl_a 0 0.000tp*chl_a 0 0.000
7_Oyster Restoration & Biomass Analysis Factorial MMC Analysis / Sp2013
GLM Screening - NMSS+WQ+no afdm s Depth / ASE Site Location: Long Creek
The GLM Procedure
Dependent Variable: biomassSource DF Type III SS Mean Square F Value Pr
temperature*tp*chl_a 0 0 . 0 0 0
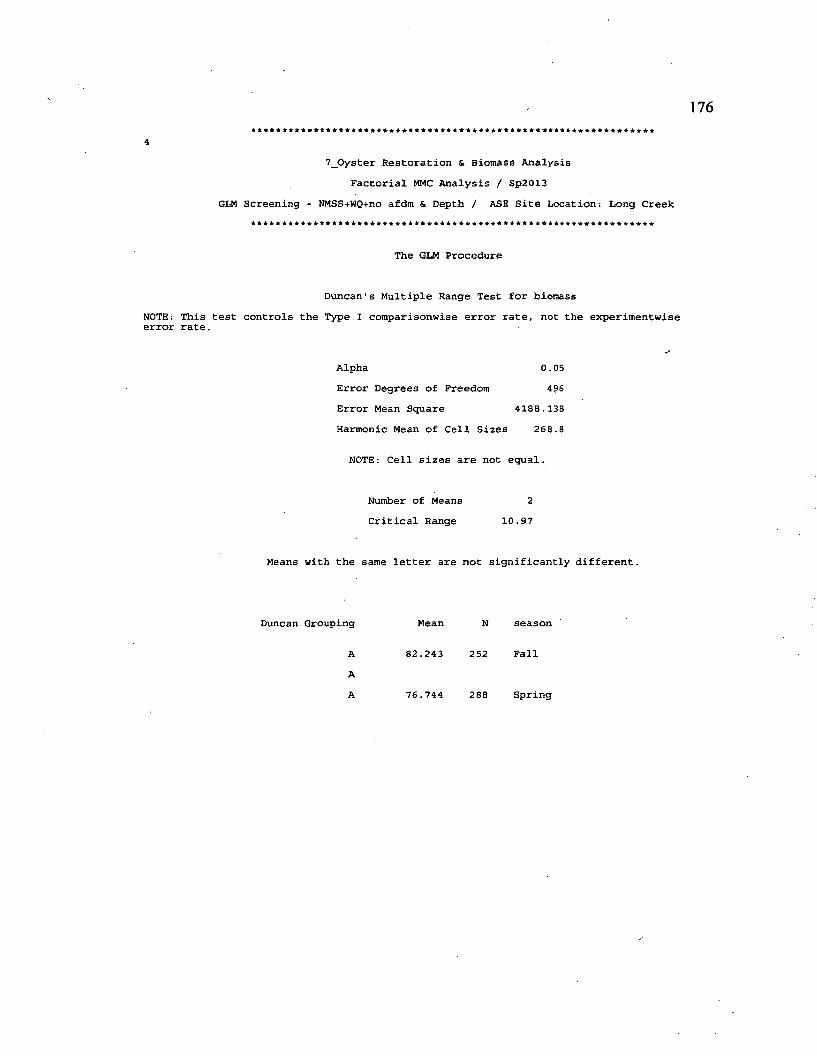
176
47_Oyster Restoration & Biomass Analysis
Factorial MMC Analysis / Sp2013 GLM Screening - NMSS+WQ+no afdm & Depth / ASE Site Location: Long Creek
The GLM Procedure
Duncan's Multiple Range Test for biomassNOTE: This test controls the Type I comparisonwise error rate, not the experimentwise error rate.
Alpha 0.05Error Degrees of Freedom 496Error Mean Square 4188.138Harmonic Mean of Cell Sizes 268.8
NOTE: Cell sizes are not equal.
Number of Means 2Critical Range 10.97
Means with the same letter are not significantly different.
Duncan Grouping Mean
A 82.243 252 FallAA 76.744 288 Spring
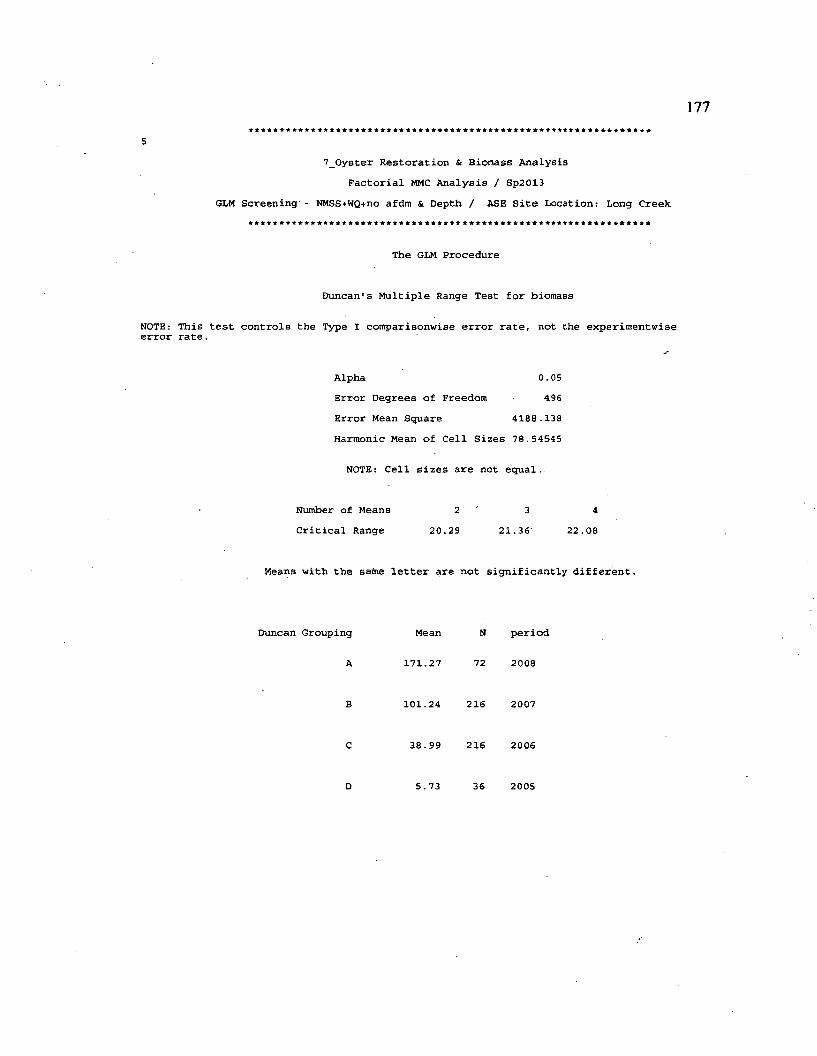
177
57_Oyster Restoration & Biomass Analysis
Factorial MMC Analysis / Sp2013 GLM Screening' - NMSS+WQ+no afdm & Depth / ASE Site Location: Long Creek
The GLM Procedure
Duncan's Multiple Range Test for biomass
NOTE: This test controls the Type I comparisonwise error rate, not the experimentwise error rate.
Alpha 0.05Error Degrees of Freedom 496Error Mean Square 4188.138Harmonic Mean of Cell Sizes 78.54545
NOTE: Cell sizes are not equal.
Number of Means 2 3 4Critical Range 20.29 21.36 22.08
Means with the same letter are not significantly different.
Duncan Grouping Mean N period
171.27 72 2008
101.24 216 2007
38.99 216 2006
5.73 36 2005
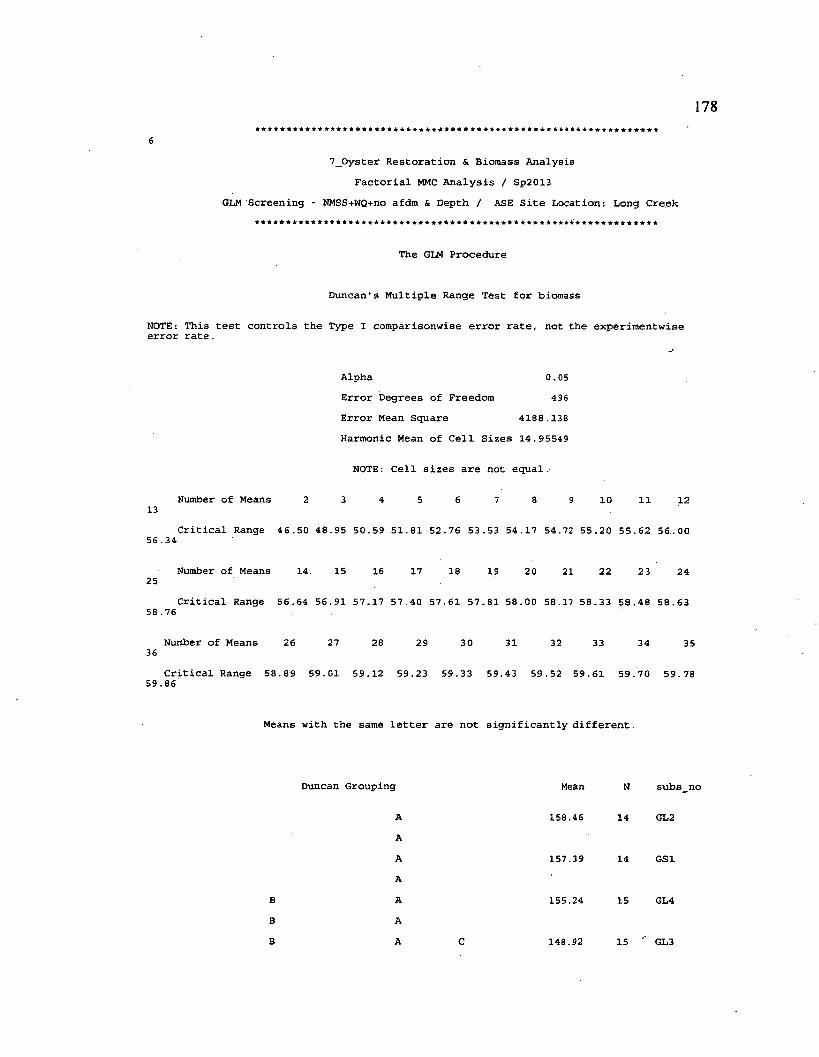
178
7_0yster Restoration & Biomass Analysis Factorial MMC Analysis / Sp2013
GLM Screening - NMSS+WQ+no afdm & Depth / ASE Site Location: Long Creek
The GLM Procedure
Duncan's Multiple Range Test for biomass
NOTE: This test controls the Type I comparisonwise error rate, not the experimentwise error rate.
Number of Means13
Alpha 0.05Error Degrees of Freedom 496Error Mean Square 4188.138Harmonic Mean of Cell Sizes 14.95549
NOTE: Cell sizes are not equal.
3 4 5 6 7 8 9 10 11 12
56 .34Critical Range 46.50 48.95 50.59 51.81 52.76 53.53 54.17 54.72 55.20 55.62 56.00
25Number of Means 14. 15 16 17 18 19 20 21 22 23 24
Critical Range 56.64 56.91 57.17 57.40 57.61 57.81 58.00 58.17 58.33 58.48 58.6358 .76
Number of Means 2636
27 28 29 30 31 32 33 34 35
Critical Range 58.89 59.01 59.12 59.23 59.33 59.43 59.52 59.61 59.70 59.7859.86
Means with the same letter are not significantly different.
Duncan Grouping
AAAAAAA
Mean N subs_no
158.46 14 GL2
157.39 14 GS1
155.24 15 GL4
148.92 15 '' GL3
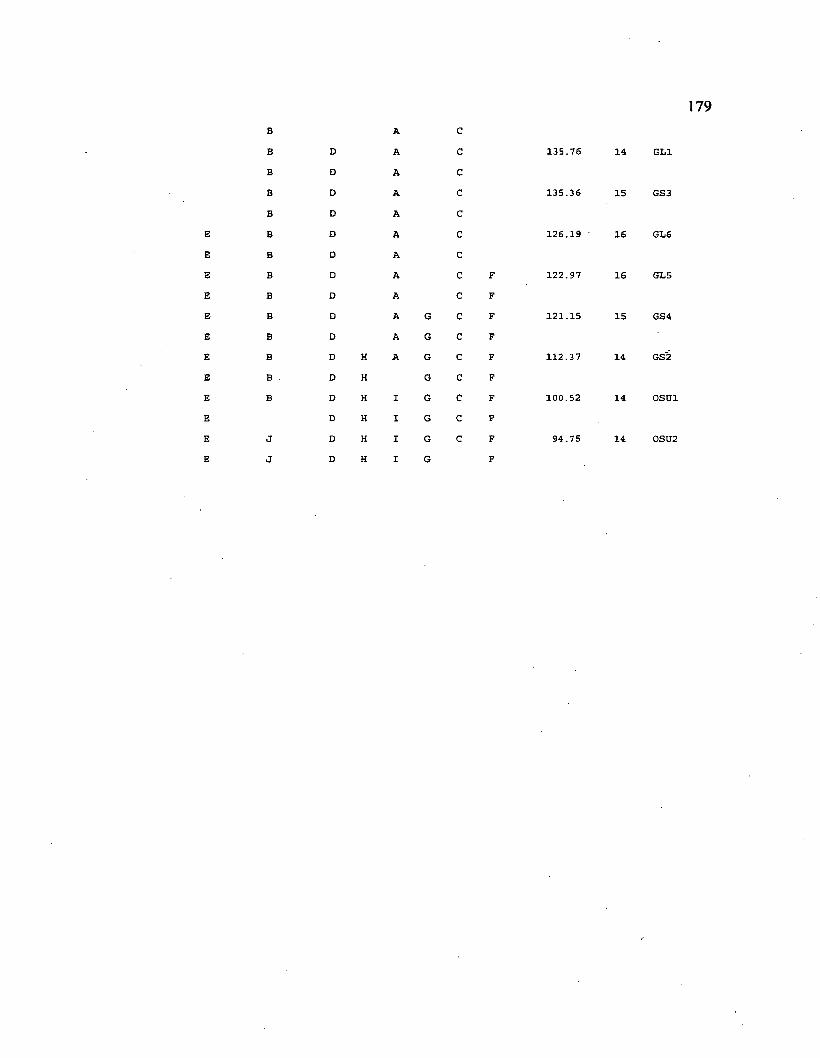
179B A CB D A C 135.76 14 GL1B D A CB D A C 135.36 15 GS3B D A C
E B D A C 126.19 16 GL6E B D A CE B D A c F 122.97 16 GL5E B D A c FE B D A G c F 121.15 15 GS4E B D A G c FE B D H A G c F 112.37 14 GS~2
E B . D H G c FE B D H I G c F 100.52 14 OSU1E D H I G c FE J D H I G c F 94.75 14 OSU2E J D H I G F
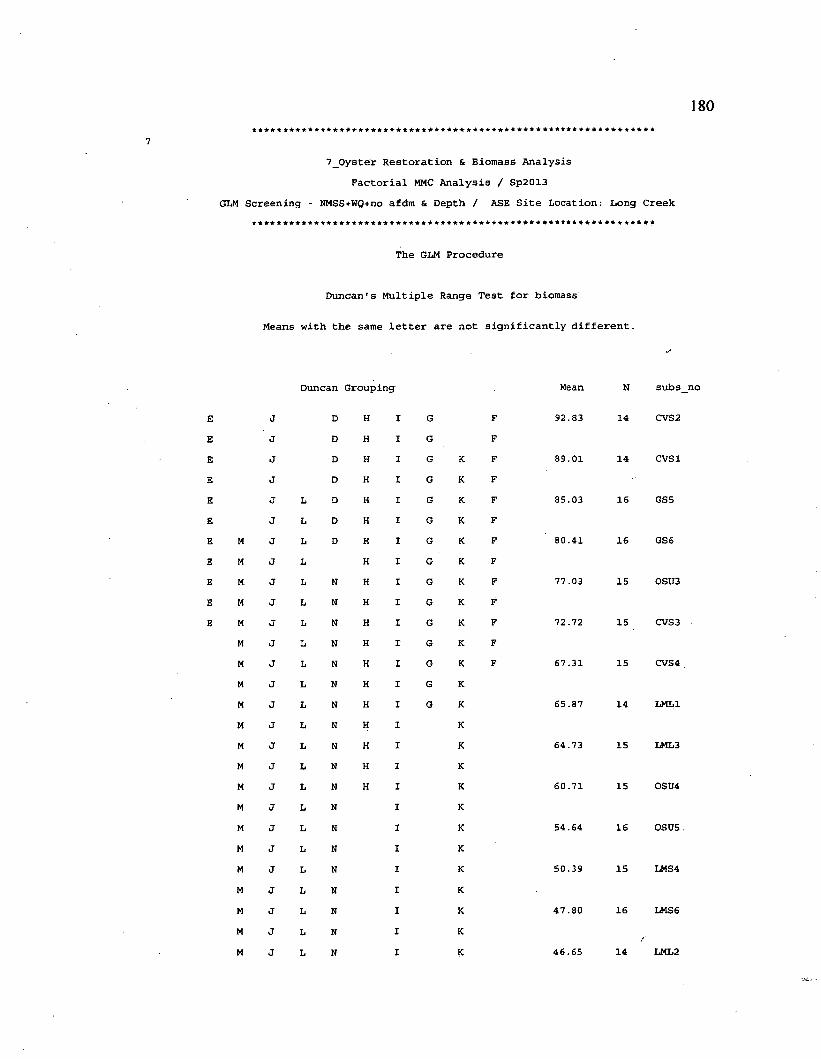
180
7_Oyster Restoration & Biomass Analysis Factorial MMC Analysis / Sp2013
GLM Screening - NMSS+WQ+no afdm & Depth / ASE Site Location: Long Creek
The GLM Procedure
Duncan's Multiple Range Test for biomass
Means with the same letter are not significantly different.
Duncan Grouping Mean N subs no
E J D H I G F 92.83 14 CVS2E J D H I G FE J D H I G K F 89.01 14 CVS1E J D H I G K FE J L D H I G K F 85.03 16 GS5E J L D H I G K FE M J L D H I G K F 80.41 16 GS6E M J L H X G K FE M J L N H I G K F 77.03 15 0SU3E M J L N H I G K FE M J L N H I G K F 72.72 15 CVS3
M J L N H I G K FM J L N H I G K F 67.31 15 CVS 4M J L N H I G KM J L N H I G K 65.87 14 LML1M J L N H I KM J L N H K 64.73 15 LML3M J L N H I KM J L N H K 60.71 15 OSU4M J L N I KM J L N I K 54.64 16 OSU5M J L N I KM J L N I K 50.39 15 LMS4M J L N I KM J L N I K 47.80 16 LMS 6M J L N I KM J L N I K 46.65 14 LML2
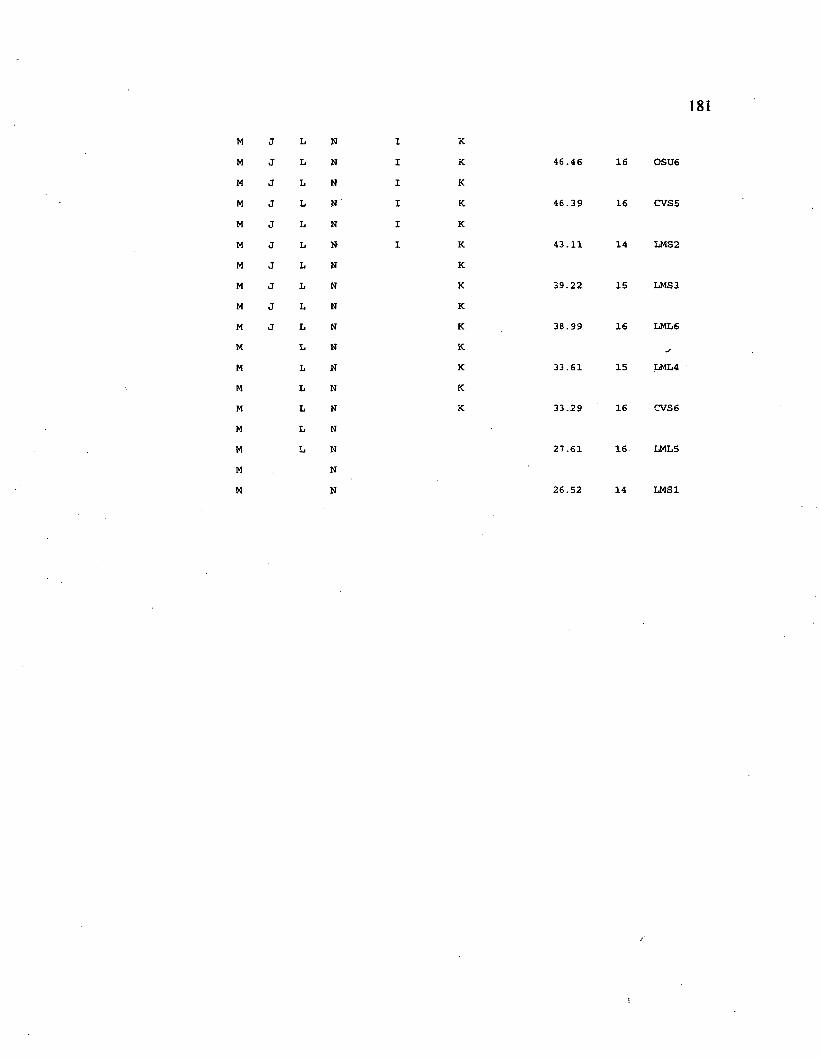
181
M J L N I KM J L N I K 46.46 16 OSU6M J L N I KM J L N ' I K 46.39 16 CVS5M J L N I KM J L N I K 43.11 14 IMS 2M J L N KM J L N K 39.22 15 LMS3M J h N KM J L N K 38.99 16 LML6M L N KM L N K 33.61 15 LML4M L N KM L N K 33.29 16 CVS6M L NM L N 27.61 16 LML5M NM N 26.52 14 LMS1
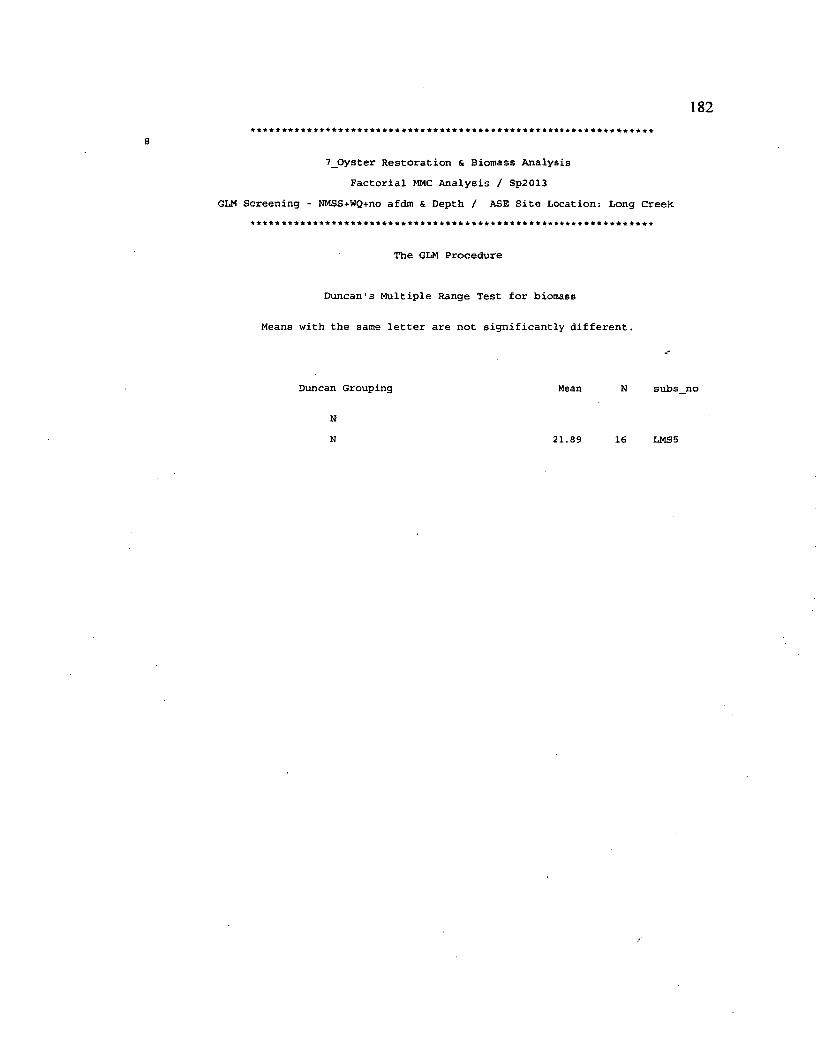
182
7_Oyster Restoration & Biomass Analysis Factorial MMC Analysis / Sp2013
GLM Screening - NMSS+WQ+no afdm & Depth / ASE Site Location: Long Creek
The GLM Procedure
Duncan's Multiple Range Test for biomass
Means with the same letter are not significantly different.
Duncan Grouping Mean N subs_no
N21.89 16 LMS 5
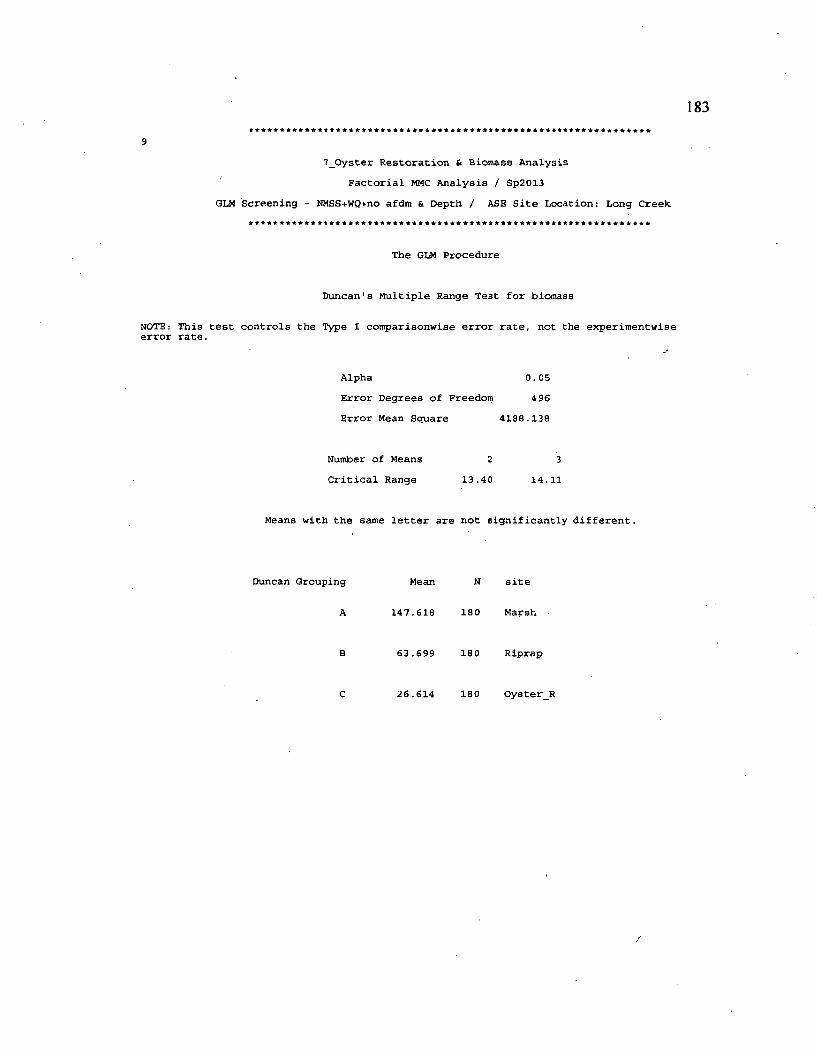
183
97_Oyster Restoration & Biomass Analysis
Factorial MMC Analysis / Sp2013 GLM Screening - NMSS+WQ+no afdm & Depth / ASE Site Location: Long Creek
The GLM Procedure
Duncan's Multiple Range Test for biomass
NOTE: This test controls the Type I comparisonwise error rate, not the experimentwise error rate.
Alpha 0.05Error Degrees of Freedom 4 96Error Mean Square 4188.138
Number of Means 2 3Critical Range 13.40 14.11
Means with the same letter are not significantly different.
Duncan Grouping Mean N site
A 147.618 180 Marsh
B 63.699 18 0 Riprap
26.614 180 Oyster_R
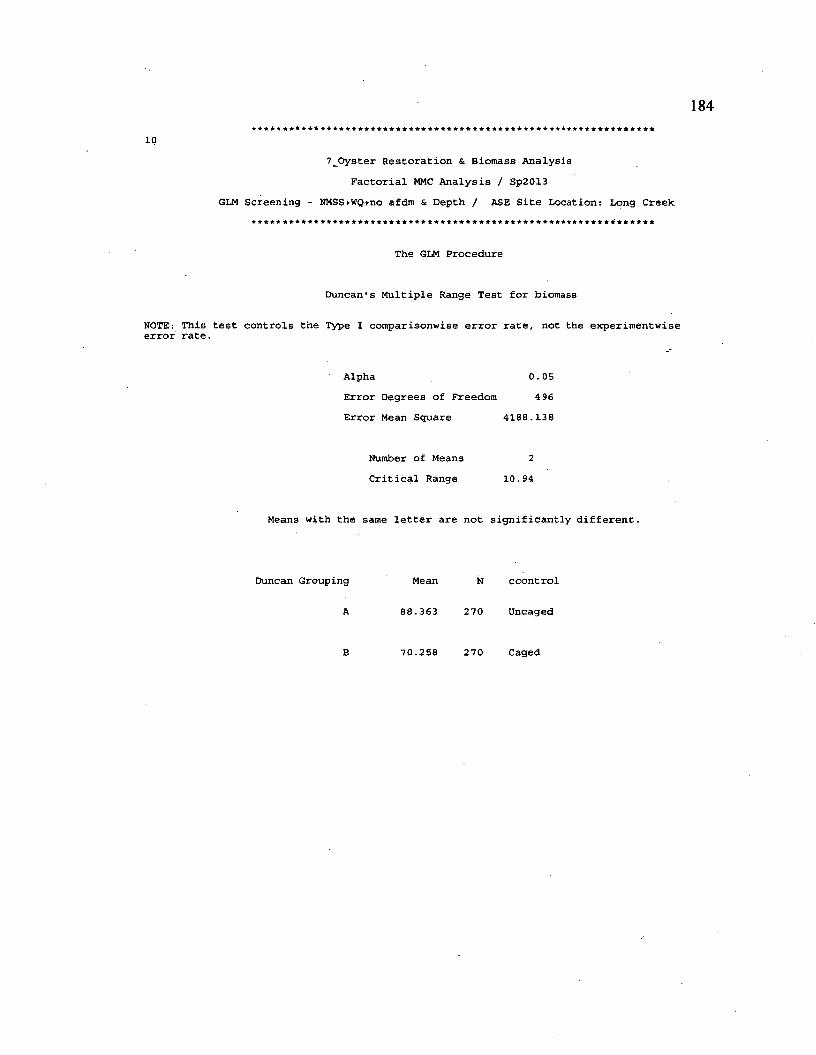
184
7_Oyster Restoration & Biomass Analysis Factorial MMC Analysis / Sp2013
GLM Screening - NMSS+WQ+no afdm & Depth / ASE Site Location: Long Creek:
The GLM Procedure
Duncan's Multiple Range Test for biomass
NOTE: This test controls the Type I comparisonwise error rate, not the experimentwise error rate.
Alpha 0.05Error Degrees of Freedom 4 96Error Mean Square 4188.138
2
10.94
Means with the same letter are not significantly different.
Duncan Grouping Mean N ccontrol
A 88.363 270 Uncaged
B 70.258 270 Caged
Number of Means Critical Range
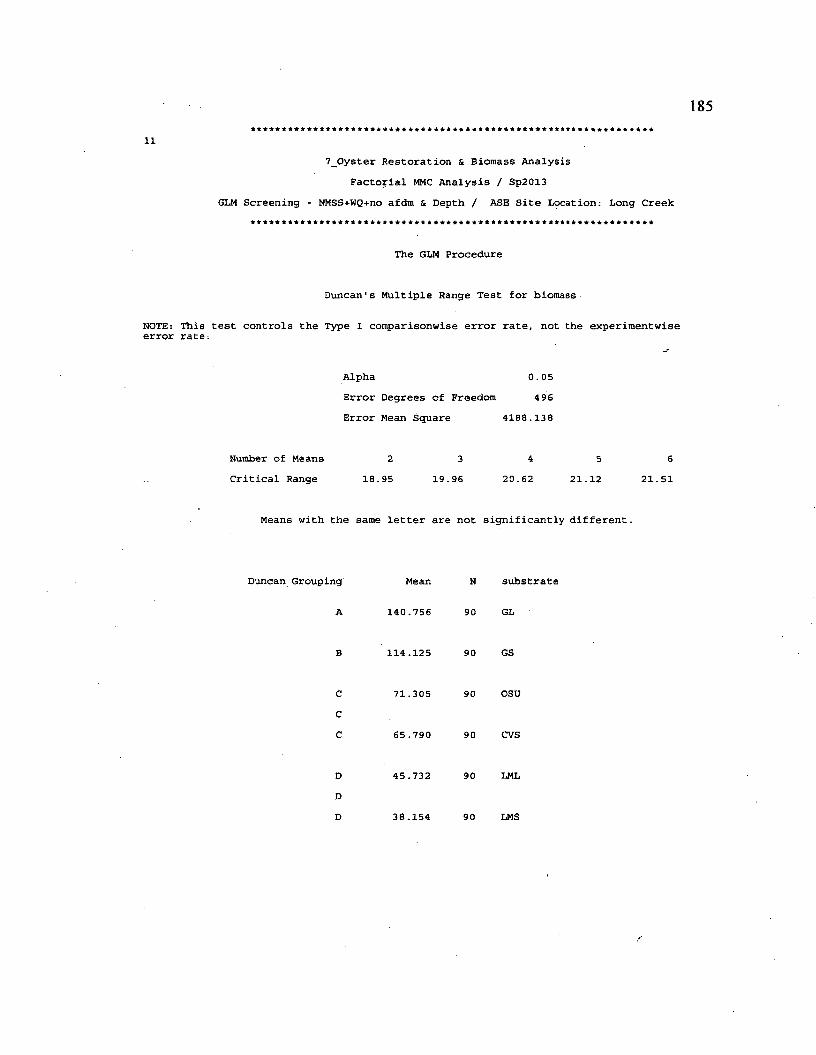
185
7_Oyster Restoration & Biomass Analysis Factorial MMC Analysis / Sp2013
GLM Screening - NMSS+WQ+no afdm & Depth / ASE Site Location: Long Creek
The GLM Procedure
Duncan's Multiple Range Test for biomass
NOTE: This test controls the Type I comparisonwise error rate, not the experimentwise error rate:
Alpha 0.05Error Degrees of Freedom 4 96Error Mean Square 4188.138
Number of Means 2 3 4 5 6Critical Range 18.95 19.96 20.62 21.12 21.51
Means with the same letter are not significantly different.
Duncan Grouping Mean N substrate
A 140.756 90 GL
B 114.125 90 GS
C 71.305 90 OSDCC 65.790 90 CVS
D 45.732 90 LMLDD 38.154 90 LMS
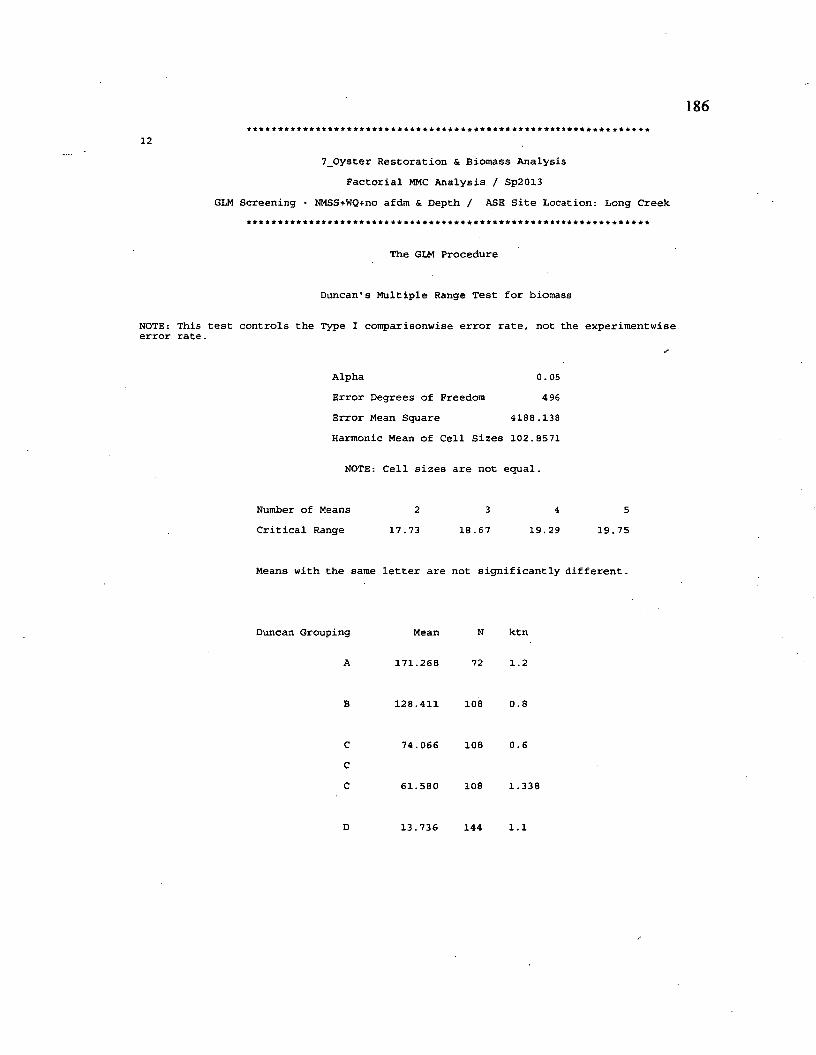
186
12
7_0yster Restoration & Biomass Analysis Factorial MMC Analysis / Sp2013
GLM Screening - NMSS+WQ+no afdm & Depth / ASE Site Location: Long Creek
The GLM Procedure
Duncan's Multiple Range Test for biomass
NOTE: This test controls the Type I comparisonwise error rate, not the experimentwise. error rate.
Alpha 0.05Error Degrees of Freedom 496Error Mean Square 4188.138Harmonic Mean of Cell Sizes 102.8571
NOTE: Cell sizes are not equal.
Number of Means 2 3 4 5Critical Range 17.73 18.67 19.29 19.75
Means with the same letter are not significantly different.
Duncan Grouping Mean N ktn
A 171.268 72 1.2
B 128.411 108 0.8
C 74.066 108 0.6CC 61.580 108 1.338
D 13.736 144 1.1
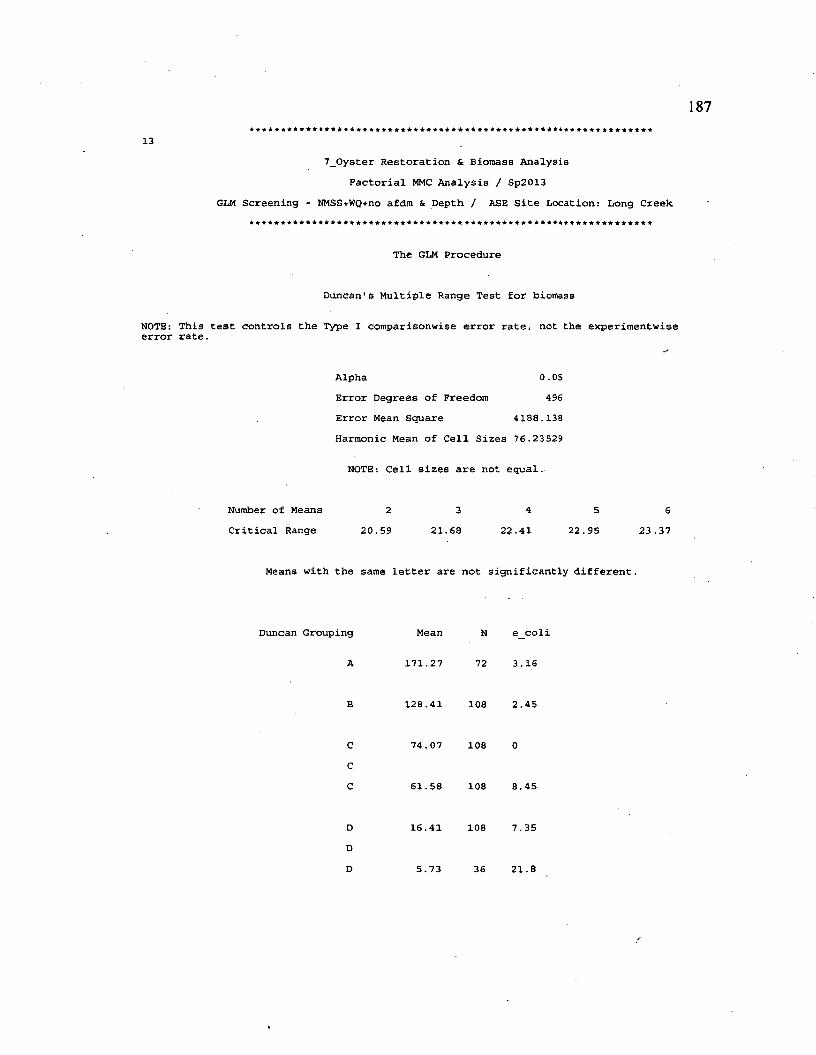
187
137_0yster Restoration & Biomass Analysis
Factorial MMC Analysis / Sp2013 GLM Screening - NMSS+WQ+no afdm & Depth / ASE Site Location: Long Creek
The GLM Procedure
Duncan's Multiple Range Test for biomass
NOTE: This test controls the Type I comparisonwise error rate, not the experimentwise error rate.
Alpha 0.05Error Degrees of Freedom 496Error Mean Square 4188.138Harmonic Mean of Cell Sizes 76.23529
NOTE: Cell sizes are not equal.
Number of Means 2 3 4 5 6Critical Range 20.59 21.68 22.41 22.95 23.37
Means with the same letter are not significantly different.
Duncan Grouping Mean N e_coli
A 171.27 72 3.16
B 128.41 108 2.45
C 74.07 108 0CC 61.58 108 8.45
D 16.41 108 7.35DD 5.73 36 21.8
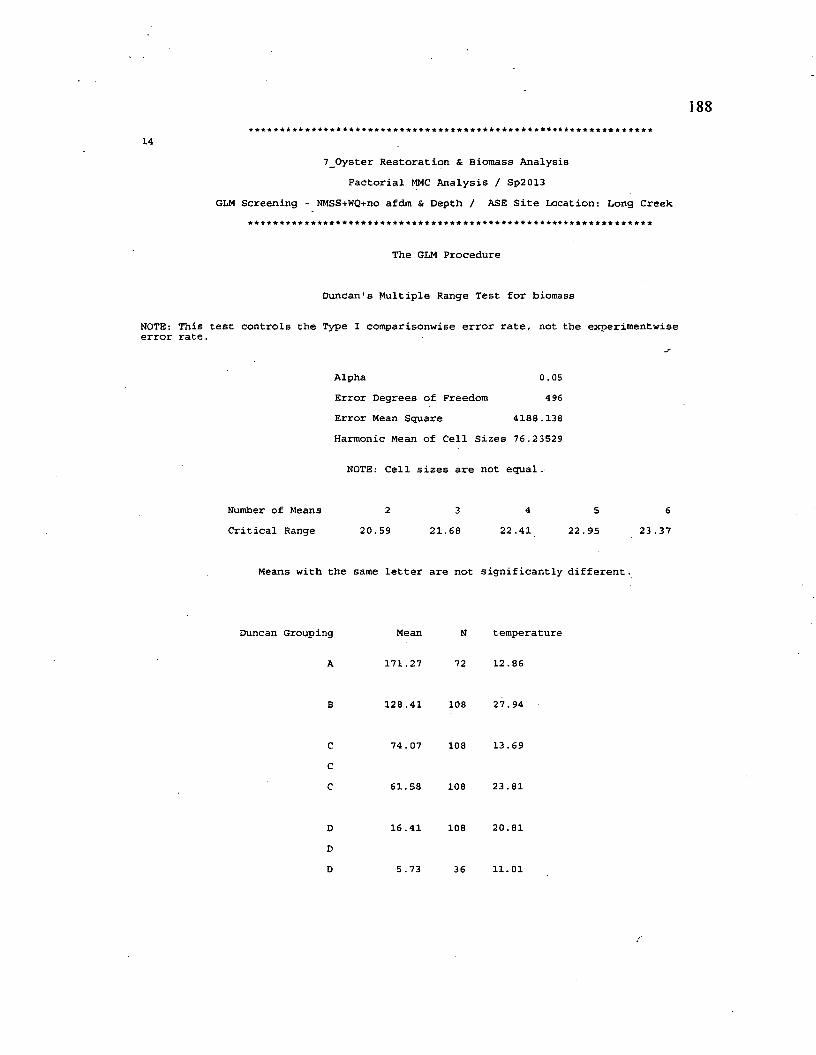
188
147_Oyster Restoration & Biomass Analysis
Factorial MMC Analysis / Sp2013 GLM Screening - NMSS+WQ+no afdm & Depth / ASE Site Location: Long Creek
The GLM Procedure
Duncan's Multiple Range Test for biomass
NOTE: This test controls the Type I comparisonwise error rate, not the experimentwise error rate.
Alpha 0.05Error Degrees of Freedom 496Error Mean Square 4188.138Harmonic Mean of Cell Sizes 76.2 3529
NOTE: Cell sizes are not equal.
Number of Means 2 3 4 5 6Critical Range 20.59 21.68 22.41 22.95 23.37
Means with the same letter are not significantly different.
Duncan Grouping Mean N temperature
A 171.27 72 12.86
B 128.41 108 27.94
C 74.07 108 13.69CC 61.58 108 23.81
D 16.41 108 20.81DD 5.73 36 11.01
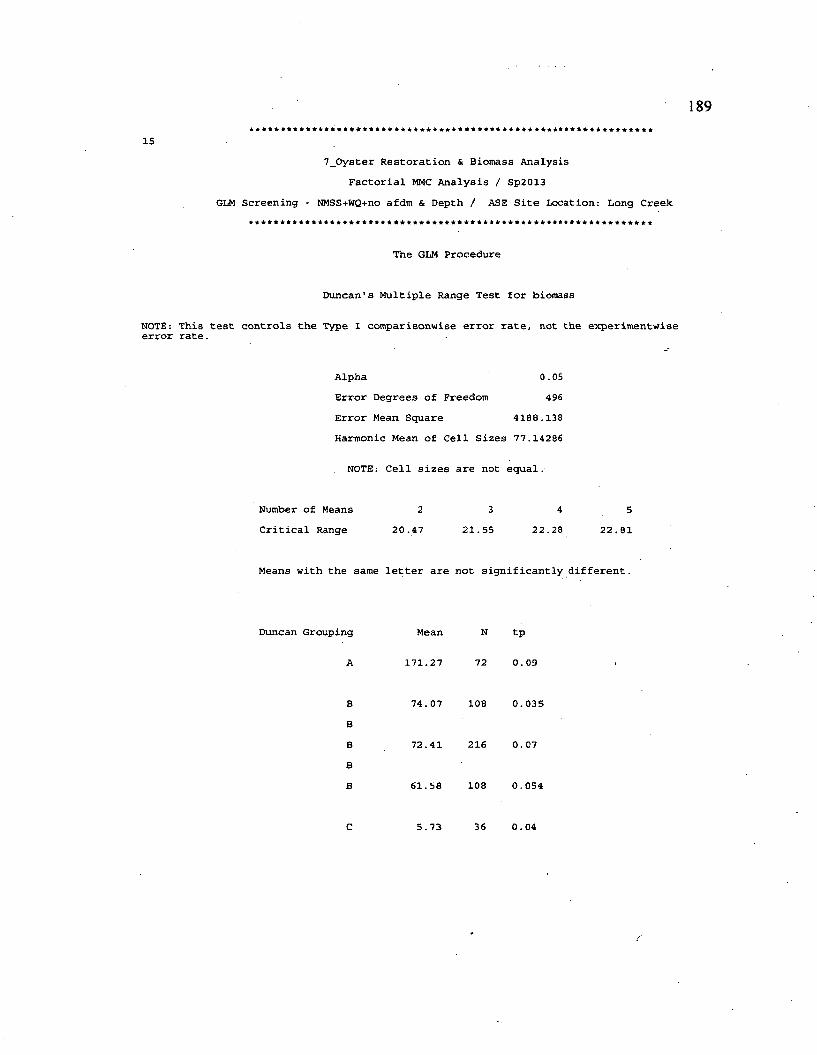
189
157_0yster Restoration & Biomass Analysis
Factorial MMC Analysis / Sp2013 GLM Screening - NMSS+WQ+no afdm & Depth / ASE Site Location: Long Creek
The GLM Procedure
Duncan's Multiple Range Test for biomass
NOTE: This test controls the Type I comparisonwise error rate, not the experimentwise error rate.
Alpha 0.05Error Degrees of Freedom 496Error Mean Square 4188.138Harmonic Mean of Cell Sizes 77.14286
NOTE: Cell sizes are not equal.
Number of Means 2 3 4 5Critical Range 20.47 21.55 22.28 22.81
Means with the same letter are not significantly different.
Duncan Grouping Mean N tp
A 171.27 72 0.09
B 74.07 108 0.035BB 72.41 216 0.07BB 61.58 108 0.054
C 5.73 36 0.04
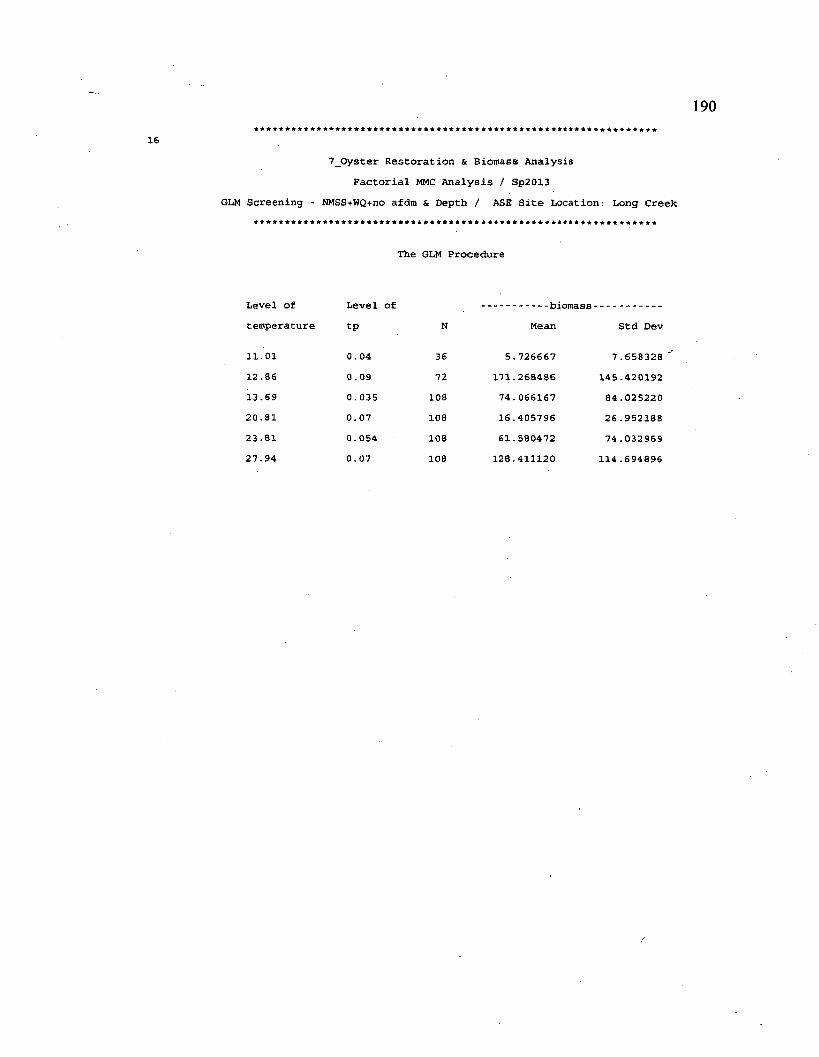
190
167_Oyster Restoration & Biomass Analysis
Factorial MMC Analysis / Sp2013 GUI Screening - NMSS+WQ+no afdm & Depth / ASE Site Location: Long Creek
The GLM Procedure
Level of temperature
11.01
12 . 86
13.6920.8123.8127.94
Level of tp
0.04 0.09 0. 035 0. 07 0.054 0. 07
N
3672
108108108108
biomass-Mean
5.726667171.26848674.06616716.40579661.580472128.411120
Std Dev
7.658328145.42019284.02522026.95218874.032969
114.694896
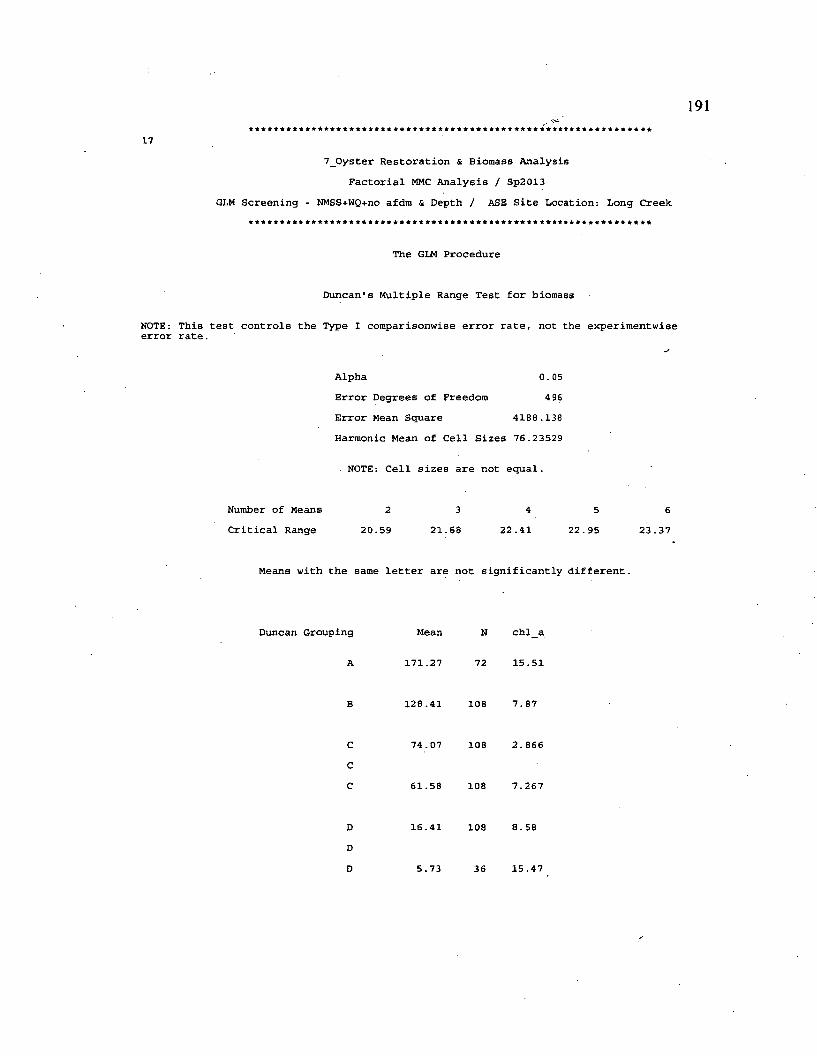
191
177_0yster Restoration & Biomass Analysis
Factorial MMC Analysis / Sp2013 GLM Screening - NMSS+WQ+no afdm & Depth / ASE Site Location: Long Creek
The GLM Procedure
Duncan's Multiple Range Test for biomass
NOTE: This test controls the Type I comparisonwise error rate, not the experimentwise error rate.
Alpha 0.05Error Degrees of Freedom 4 96Error Mean Square 4188.138Harmonic Mean of Cell Sizes 76.23529
NOTE: Cell sizes are not equal.
Number of Means 2 3 4 5 6Critical Range 20.59 21.68 22.41 22.95 23.37
Means with the same letter are not significantly different.
Duncan Grouping Mean N chl_a
A 171.27 72 15.51
B 128.41 108 7.87
C 74.07 108 2.866CC 61.58 108 7.267
DDD
16.41 108 8.58
5.73 36 15.47
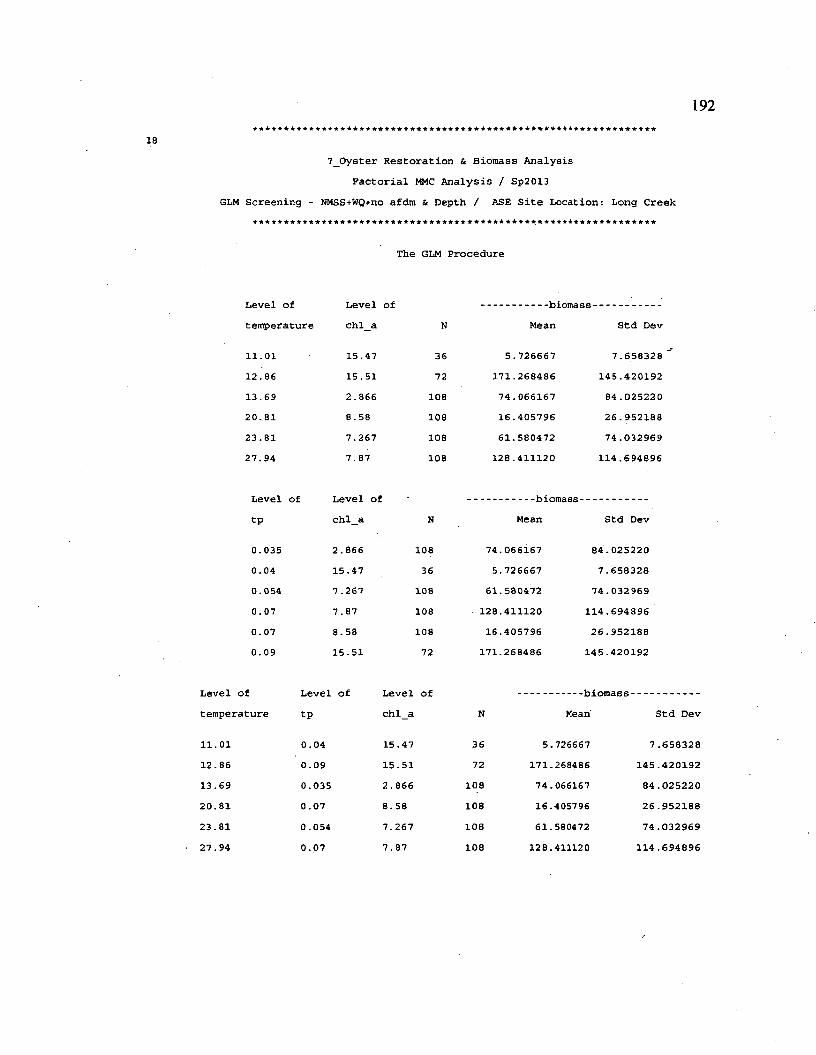
192
187_0yster Restoration & Biomass Analysis
Factorial MMC Analysis / Sp2 013 GLM Screening - NMSS+WQ+no afdm & Depth / ASE Site Location: Long Creek
The GLM Procedure
Level of temperature
11 .01
1 2 . 8 6
13.6920.8123.8127.94
Level of chl_a
15.47 15.51 2 . 8 6 6
8.58 7.267 7. 87
N
3672
108108108108
biomass-Mean
5. 726667171.26848674.06616716.40579661.580472
128.411120
Std Dev
7.658328 '145.42019284.02522026.95218874.032969
114.694896
Level of tp
0.035 .0. 040.0540.070.070.09
Level of chl_a
2 . 8 6 6
15.477.2677.878.5815.51
N
10836
10810810872
biomass-Mean
74.0661675.726667
61.580472128.41112016.405796
171.268486
Std Dev
84.025220 7.658328
74.032969 114.694896 26.952188
145.420192
Level of temperature
11 . 01 1 2 . 8 6
13 .69 20.81 23.81 27.94
Level of tp
0.040.090.0350 .070.0540.07
Level of chl_a
15.47 15.51 2 . 8 6 6
8. 58 7.267 7.87
N
3672
108108108108
biomass -Mean
5.726667 171.268486 74.066167 16.405796 61. 580472
128.411120
Std Dev
7.658328 145.420192 84.025220 26.952188 74 .032969
114.694896
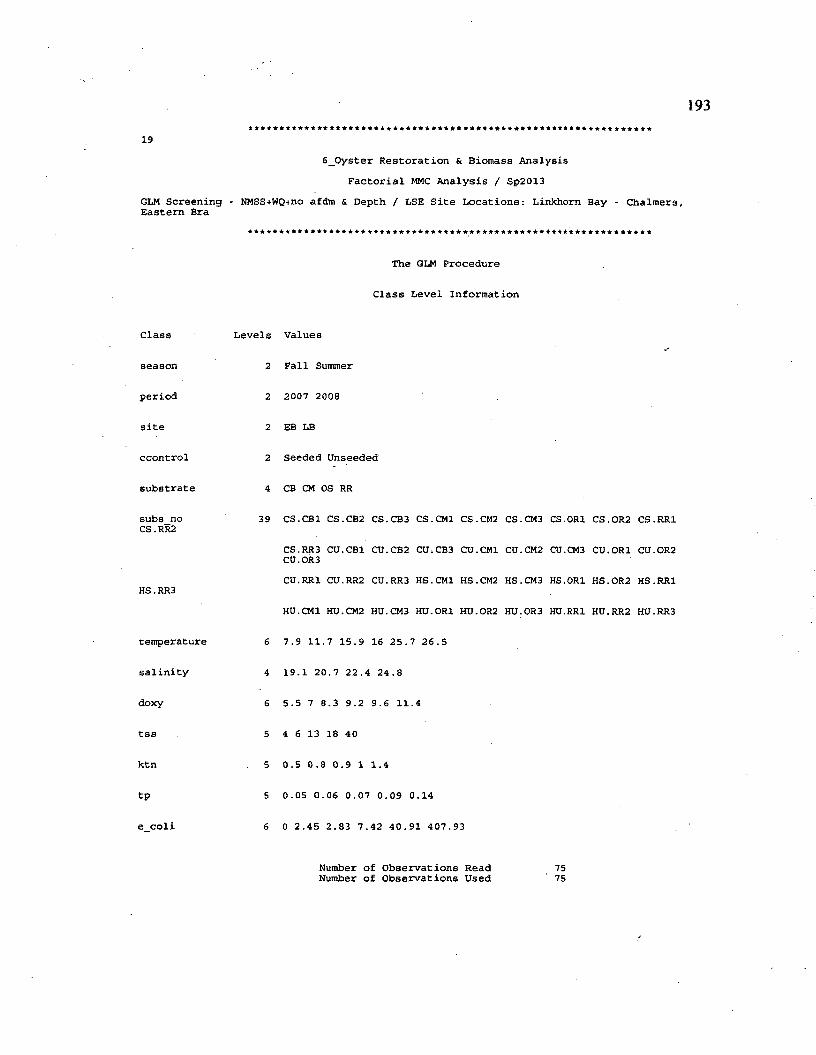
193
19
GLM Screening Eastern Bra
Class
season
period
site
ccontrol
substrate
subs_noCS.RR2
H S . RR3
temperature
salinity
doxy
tss
ktn
tp
e coli
6_0yster Restoration & Biomass Analysis Factorial MMC Analysis / Sp2013
NMSS+WQ+no afdm & Depth / LSE Site Locations: Linkhom Bay - Chalmers,
The GLM Procedure
Class Level Information
Levels Values
2 Fall Summer
2 2007 2008
2 EB LB
2 Seeded Unseeded
4 CB CM OS RR
39 CS.CB1 CS.CB2 CS.CB3 CS.CM1 CS.CM2 CS.CM3 CS.0R1 CS.OR2 CS.RR1
CS.RR3 CU.CB1 CU.CB2 CU.CB3 CU.CM1 CU.CM2 CO.CM3 CU.OR1 CU.OR2CU.OR3CU.RR1 CU.RR2 CU.RR3 HS.CM1 H S .CM2 H S .CM3 HS.0R1 HS.OR2 HS.RR1
HU.CM1 HU.CM2 HU.CM3 HU.OR1 HU.OR2 HU.OR3 HU.RR1 HU.RR2 HO.RR3
6 7.9 11.7 15.9 16 25.7 26.5
4 19.1 20.7 22.4 24.8
6 5.5 7 8.3 9.2 9.6 11.4
5 4 6 13 18 40
5 0.5 0.8 0.9 1 1.4
5 0.05 0.06 0.07 0.09 0.14
6 0 2.45 2.83 7.42 40.91 407.93
Number of Observations Read 75Number of Observations Used 75
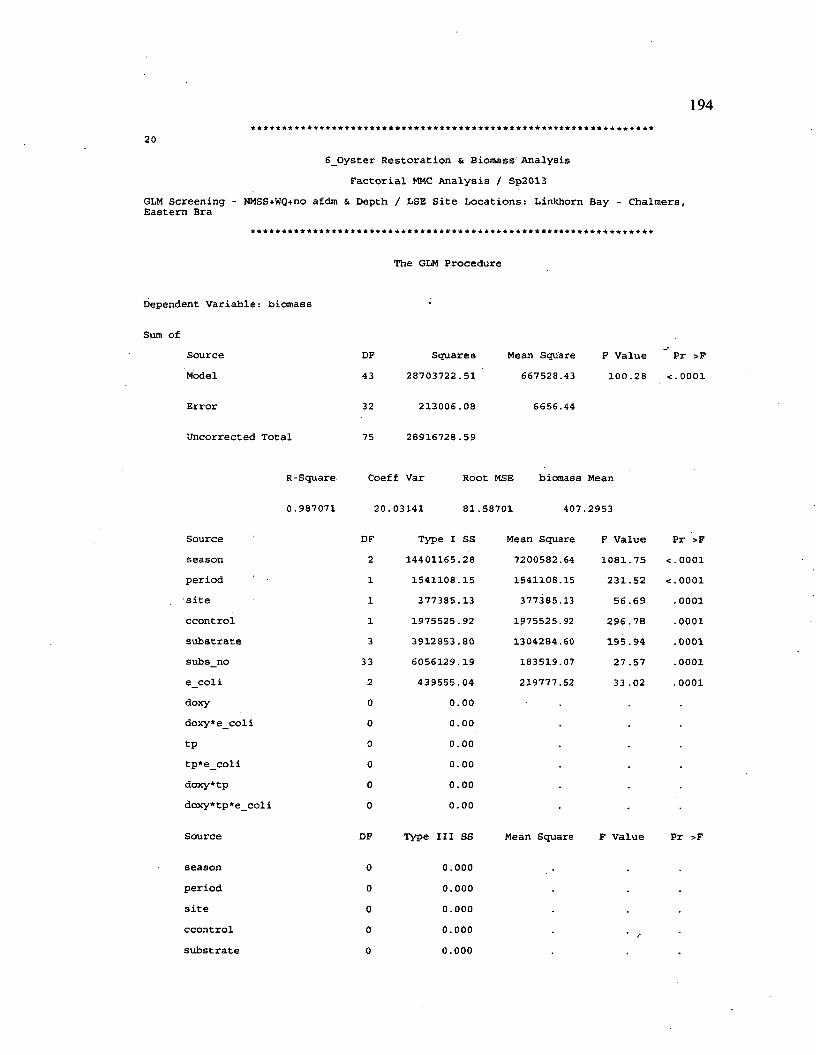
194
20
6_Oyster Restoration & Biomass AnalysisFactorial MMC Analysis / Sp2013
GLM Screening - NMSS+WQ+no afdm & Depth / LSE Site Locations: Linkhorn Bay - Chalmers, Eastern Bra
The GLM Procedure
Sum of
ent Variable: biomass
Source DF Squares Mean Square F Value Pr >FModel 43 28703722.51 667528.43 100.28 <.0001
Error
Uncorrected Total
R-Square
32 213006.08
75 28916728.59
Coeff Var Root
6656.44
MSE biomass Mean
0.987071 20 03141 81.58701 407 2953
Source DF Type I SS Mean Square F Value Pr >Fseason 2 14401165.28 7200582.64 1081.75 <.0001period 1 1541108.15 1541108.15 231.52 <•0001site 1 377385.13 377385.13 56.69 . 0001ccontrol 1 1975525.92 1975525.92 296.78 .0001substrate 3 3912853.80 1304284.60 195.94 . 0001subs_no 33 6056129.19 183519.07 27.57 .0001e_coli 2 439555.04 219777.52 33 .02 .0001doxy 0 0.00doxy*e_coli 0 0.00tp 0 0.00 •tp*e_coli 0 0.00 •doxy*tp 0 0.00 -doxy* tp * e_coli 0 0.00 •
Source DF Type III SS Mean Square F Value Pr >F
season 0 0.000 . .period 0 0.000site 0 0.000ccontrol 0 0.000substrate 0 0.000
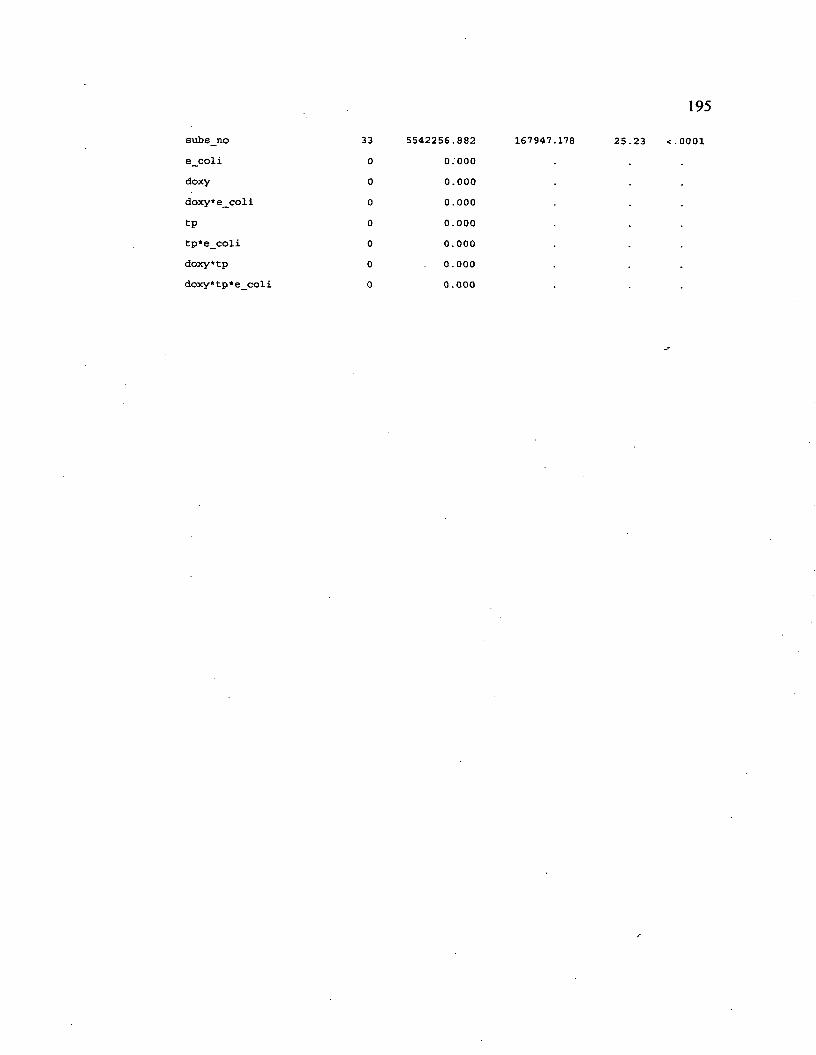
195
subs_noe_colidoxydoxy*e_coli
tptp*e_colidoxy*tpdoxy*tp*e_coli
33000
0000
5542256.8820 . 0 0 0
0.0000.0000.0000.0000.0000 . 0 0 0
167947.178 25.23 <.0001

196
21
6_Oyster Restoration & Biomass AnalysisFactorial MMC Analysis / Sp2 013
GLM Screening - NMSS+WQ+no afdm & Depth / LSE Site Locations: Linkhorn Bay - Chalmers, Eastern Bra
The GLM Procedure
Duncan's Multiple Range Test for biomass
NOTE: This test controls the Type I comparisonwise error rate, not the experimentwise error rate.
Alpha 0.05Error Degrees of Freedom 32Error Mean Square 6656.44Harmonic Mean of Cell Sizes 27.36
NOTE: Cell sizes are not equal.
Number of Means 2Critical Range 44.93
Means with the same letter are not significantly different.
Duncan Grouping Mean N season
A 498.13 57 Fall
B 119.66 18 Summer
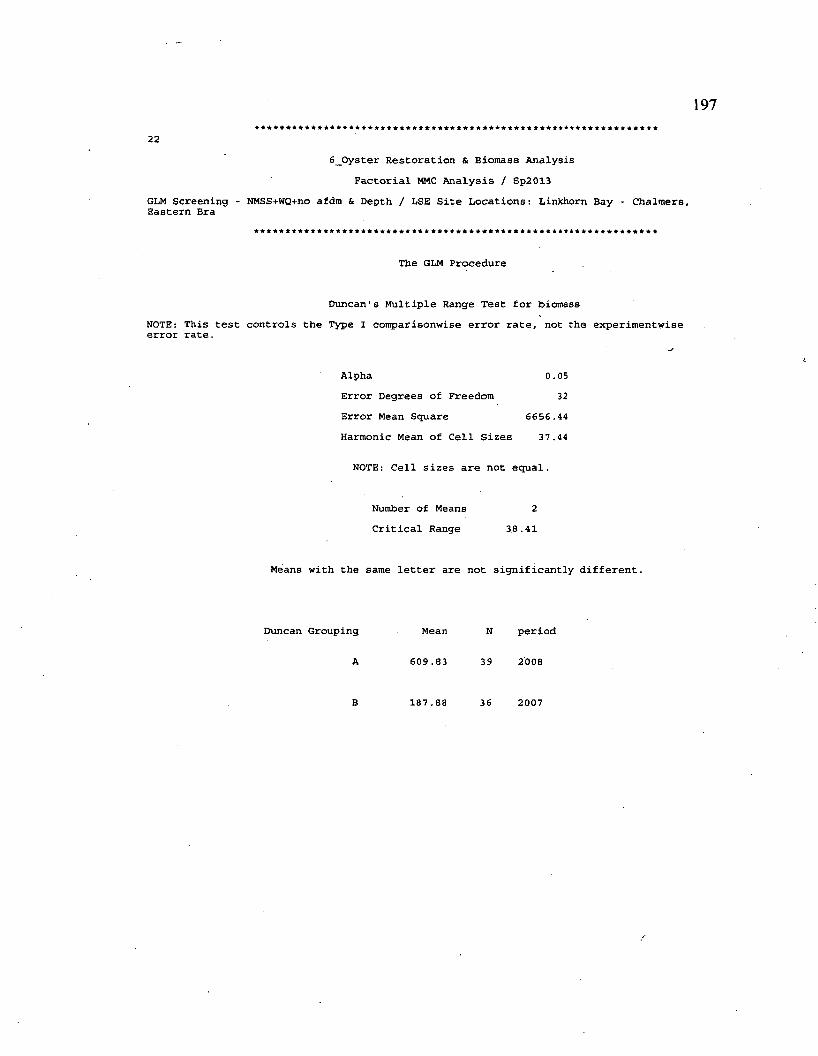
197
22
6_0yster Restoration & Biomass AnalysisFactorial MMC Analysis / Sp2013
GLM Screening - NMSS+WQ+no afdm & Depth / LSE Site Locations: Linkhorn Bay - Chalmers, Eastern Bra
The GLM Procedure
Duncan's Multiple Range Test for biomassNOTE: This test controls the Type I comparisonwise error rate, not the experimentwise error rate.
Alpha 0.05Error Degrees of Freedom 32Error Mean Square 6656.44Harmonic Mean of Cell Sizes 37.44
NOTE: Cell sizes are not equal.
Number of Means 2Critical Range 3.8.41
Means with the same letter are not significantly different.
Duncan Grouping Mean N period
A 609.83 39 2008
B 187.88 36 2007
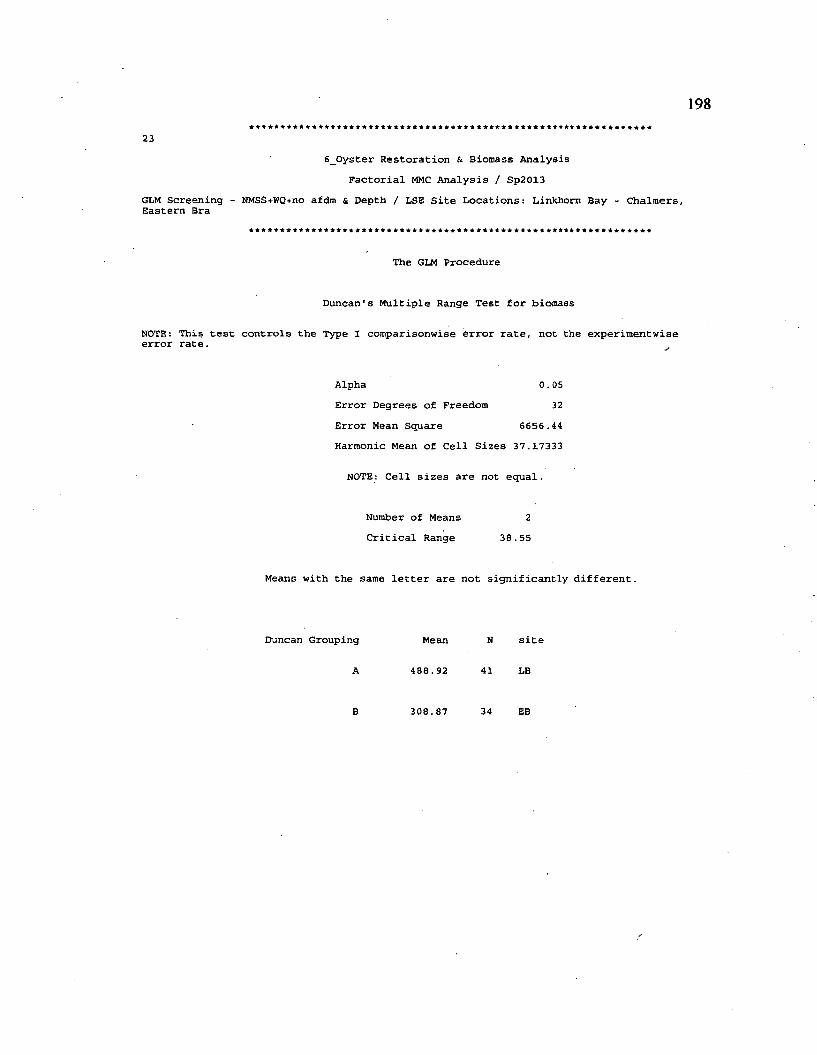
198
236_0yster Restoration & Biomass Analysis
Factorial MMC Analysis / Sp2013GLM Screening - NMSS+WQ+no afdm & Depth / LSE Site Locations: Linkhorn Bay - Chalmers, Eastern Bra
The GLM Procedure
Duncan's Multiple Range Test for biomass
NOTE: This test controls the Type I comparisonwise error rate, not the experimentwise error rate.
Alpha 0.05Error Degrees of Freedom 32Error Mean Square 6656.44Harmonic Mean of Cell Sizes 37.17333
NOTE: Cell sizes are not equal.
Number of Means 2Critical Range 38.55
Means with the same letter are not significantly different.
Duncan Grouping Mean N site
A 488.92 41 LB
B 308.87 34 EB
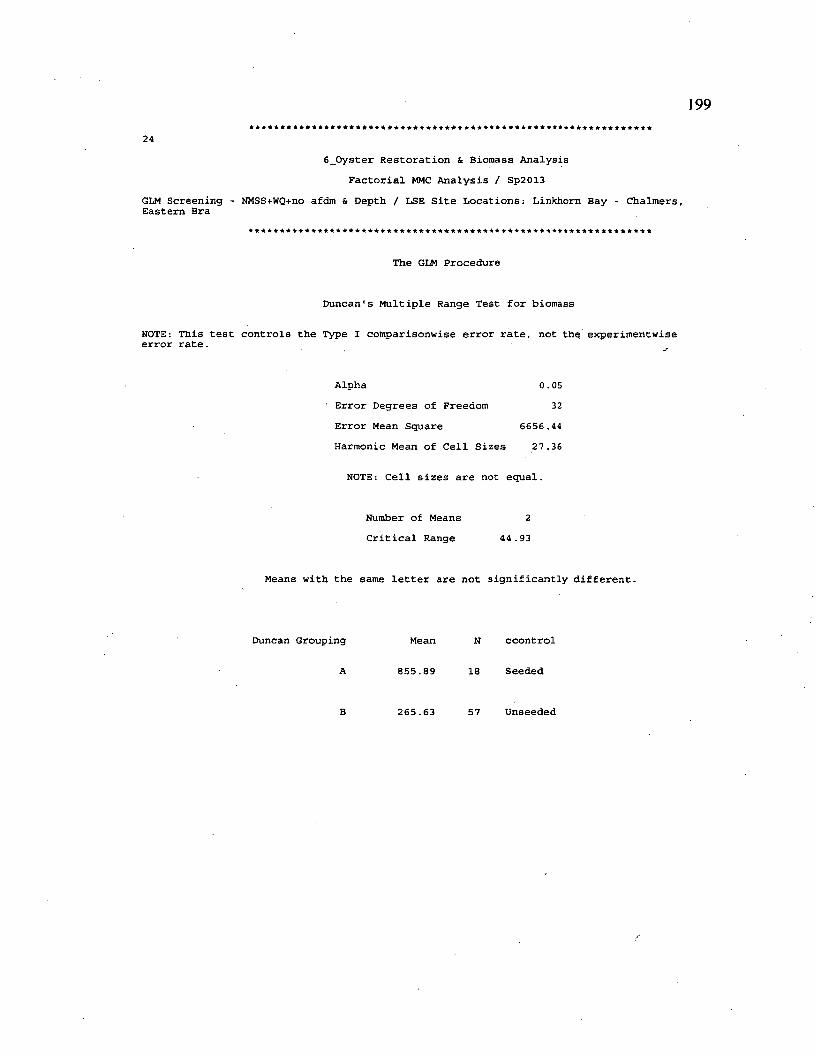
199
246_0yster Restoration & Biomass Analysis
Factorial MMC Analysis / Sp2013GLM Screening - NMSS+WQ+no afdm & Depth / LSE Site Locations: Linkhorn Bay - Chalmers, Eastern Bra
The GLM Procedure
Duncan's Multiple Range Test for biomass
NOTE: This test controls the Type I comparisonwise error rate, not the experimentwise error rate.
Alpha 0.05■ Error Degrees of Freedom 32Error Mean Square 6656.44Harmonic Mean of Cell Sizes 27.36
NOTE: Cell sizes are not equal.
Number of Means 2Critical Range 44.93
Means with the same letter are not significantly different.
Duncan Grouping Mean N ccontrol
A 855.89 18 Seeded
265.63 57 Unseeded
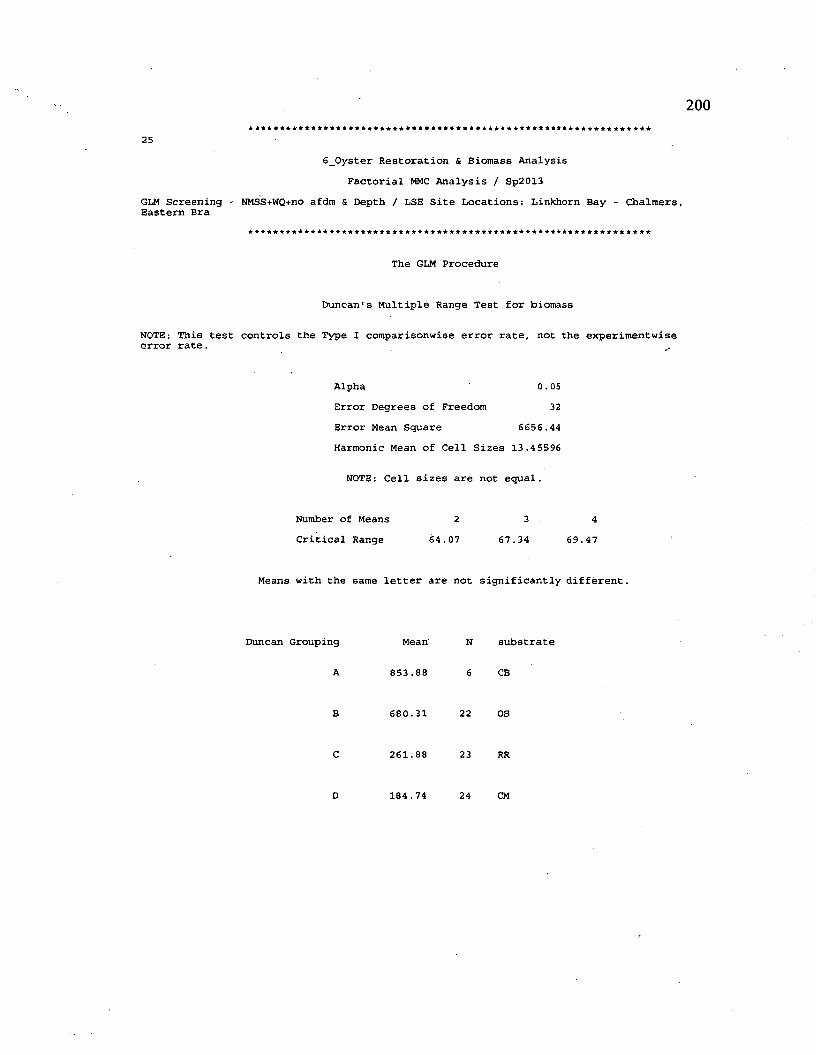
200
256_Oyster Restoration & Biomass Analysis
Factorial MMC Analysis / Sp2013GLM Screening - NMSS+WQ+no afdm & Depth / LSE Site Locations: Linkhorn Bay - Chalmers, Eastern Bra
The GLM Procedure
Duncan's Multiple Range Test for biomass
NOTE: This test controls the Type I comparisonwise error rate, not the experimentwise error rate.
Alpha 0.05Error Degrees of Freedom 32Error Mean Square 6656.44Harmonic Mean of Cell Sizes 13.45596
NOTE: Cell sizes are not equal.
Number of Means 2 3 . 4Critical Range 64.07 67.34 69.47
Means with the same letter are not significantly different.
Duncan Grouping Mean N substrate
A 853.88 6 CB
B 680.31 22 OS
C 261.88 23 RR
D 184.74 24 CM
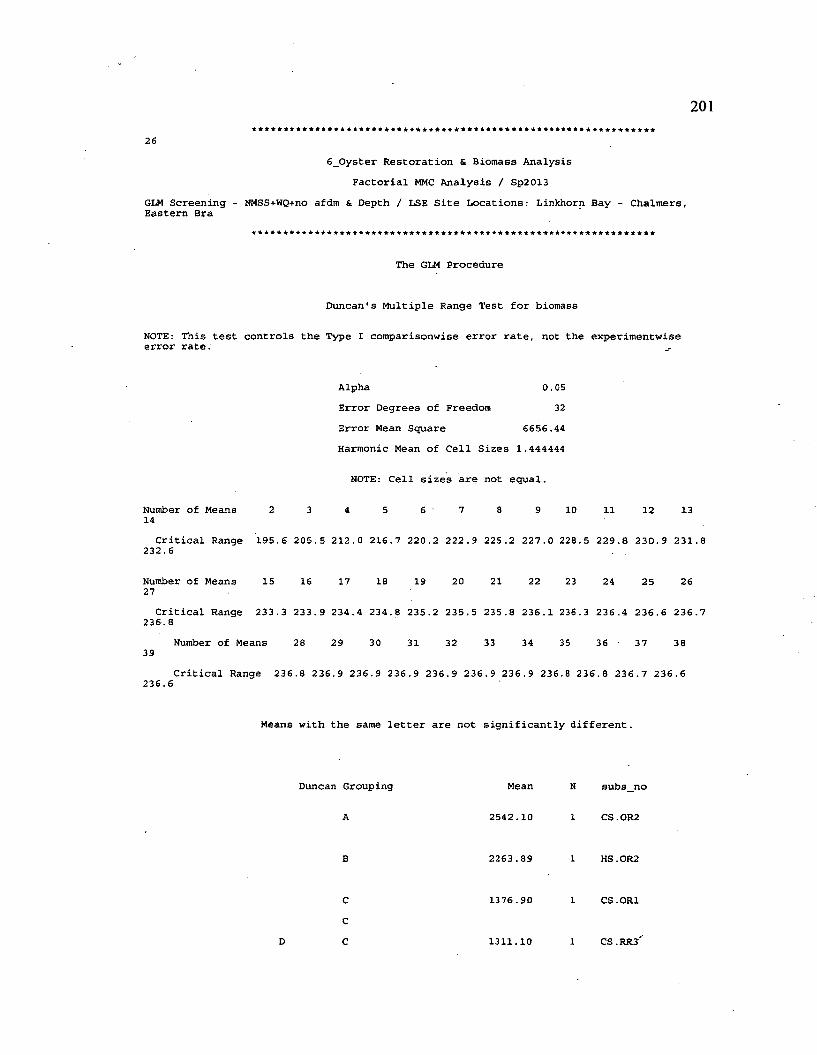
201
266_Oyster Restoration & Biomass Analysis
Factorial MMC Analysis / Sp2013GLM Screening - NMSS+WQ+no afdm & Depth / LSE Site Locations: Linkhorn Bay - Chalmers, Eastern Bra
The GLM Procedure
Duncan's Multiple Range Test for biomass
NOTE: This test controls the Type I comparisonwise error rate, not the experimentwise error rate.
Alpha 0.05Error Degrees of Freedom 32Error Mean Square 6656.44Harmonic Mean of Cell Sizes 1.444444
NOTE: Cell sizes are not equal.
4 5 6 7 8 9 10 11 12 13Number of Means 14
Critical Range 195.6 205.5 212.0 216.7 220.2 222.9 225.2 227.0 228.5 229.8 230.9 231.8232.6
Number of Means 15 16 17 18 19 2027
21 22 23 24 25 26
Critical Range 233.3 233.9 234.4 234.8 235.2 235.5 235.8 236.1 236.3 236.4 236.6 236.7 236.8
Number of Means 28 29 30 31 32 33 34 35 36 ■ 37 3839
236.6Critical Range 236.8 236.9 236.9 236.9 236.9 236.9 236.9 236.8 236.8 236.7 236.6
Means with the same letter are not significantly different.
Duncan Grouping Mean N subs_no
2542.10 1 CS.OR2
2263.89 1 HS.OR2
1376.90 1 CS.OR1
1311.10 1 CS.RR3
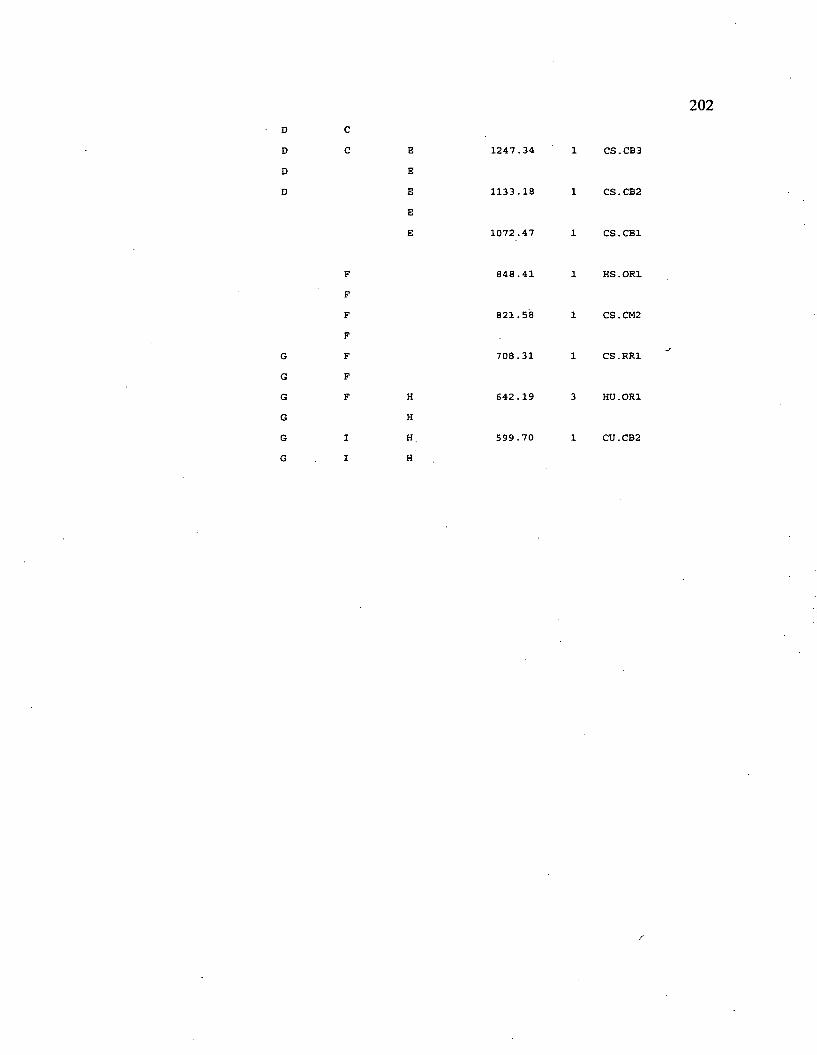
202DDDD
CC 1247.34 1 CS.CB3
1133.18 1 CS.CB2
1072.47 1 CS.CB1
GGGGGG
HHH.H
848.41 1 HS.OR1
821.58 1 CS.CM2
708.31 1 CS.RR1
642.19 3 HU.OR1
599.70 1 CU.CB2
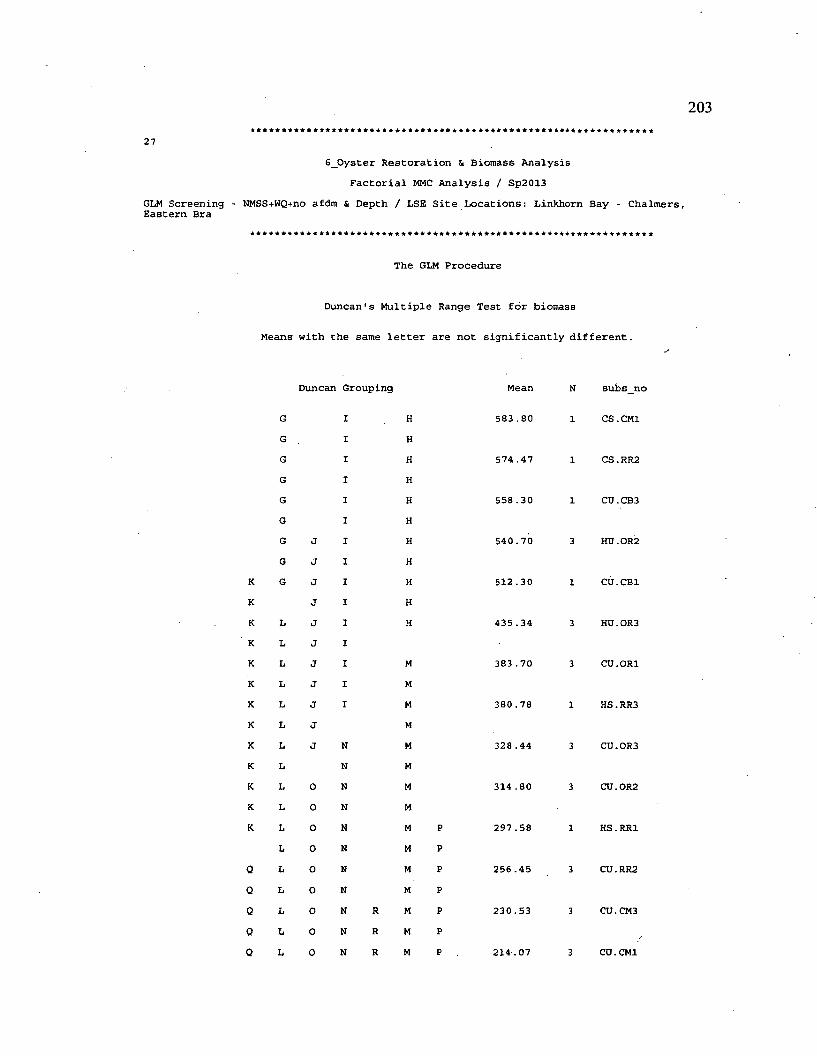
203
276 _ O y s t e r R e s t o r a t i o n & B i o m a s s A n a l y s i s
F a c t o r i a l MMC A n a l y s i s / S p 2 0 1 3
GL M S c r e e n i n g - N M S S + W Q + n o a f d m & D e p t h / L S E S i t e L o c a t i o n s : L i n k h o r n B a y - C h a l m e r s , E a s t e r n B r a
T h e GL M P r o c e d u r e
D u n c a n ' s M u l t i p l e R a n g e T e s t f o r b i o m a s s
M e a n s w i t h t h e s a m e l e t t e r a r e n o t s i g n i f i c a n t l y d i f f e r e n t .
D u n c a n G r o u p i n g M e a n N s u b s _ n <
G I H 5 8 3 . 8 0 1 C S . C M 1
G I H
G I H 5 7 4 . 4 7 1 C S . R R 2
G I H
G I H 5 5 8 . 3 0 1 C U . C B 3
G I H
G J I H 5 4 0 . 7 0 3 H U . O R 2
G J X H
K G J I H 5 1 2 . 3 0 1 C U . C B 1
K J I H
K L J I H 4 3 5 . 3 4 3 H U . O R 3
K L J I
K L J I M 3 8 3 . 7 0 3 C U . O R 1
K L J I M
K L J I M 3 8 0 . 7 8 1 H S . R R 3
K L J M
K L J N M 3 2 8 . 4 4 3 C U . O R 3
K L N M
K L 0 N M 3 1 4 . 8 0 3 C U . O R 2
K L O N M
K L 0 N M P 2 9 7 . 5 8 1 H S . R R 1
L 0 N M P
Q L o N M P 2 5 6 . 4 5 3 C U . R R 2
Q L o N M P
Q L o N R M P 2 3 0 . 5 3 3 C U . C M 3
Q L o N R M P
Q L 0 N R M P 2 1 4 . 0 7 3 C O . C M 1
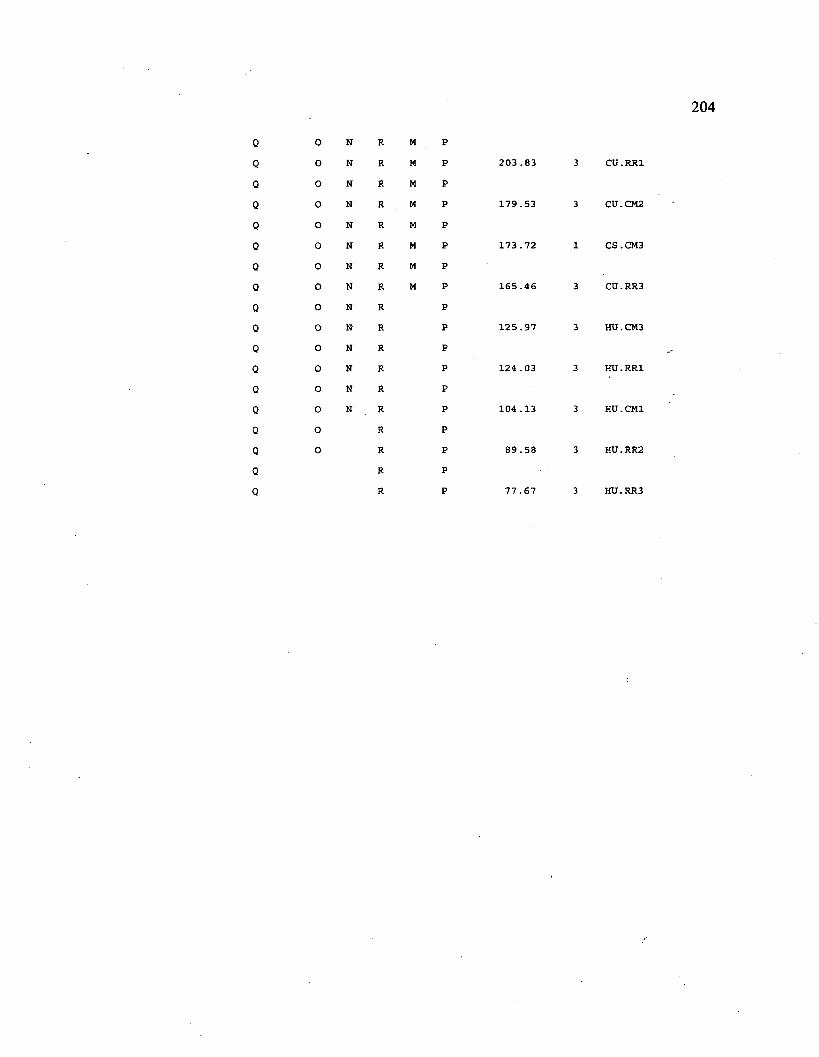
204
Q O N R M P
Q O N R M P 2 0 3 . 8 3 3 C U
Q O N R M P
Q O N R M P 1 7 9 . 5 3 3 C U
Q O N R M P
Q 0 N R M P 1 7 3 . 7 2 1 C S
Q o N R M P
Q o N R M P 1 6 5 . 4 6 3 C U
Q o N R P
Q o N R P 1 2 5 . 9 7 3 H U
Q o N R P
Q o N R P 1 2 4 . 0 3 3 HU
Q 0 N R P
Q 0 N R P 1 0 4 . 1 3 3 H U
Q o R P
Q o R P 8 9 . 5 8 3 HU
Q R P
Q R P 7 7 . 6 7 3 H U
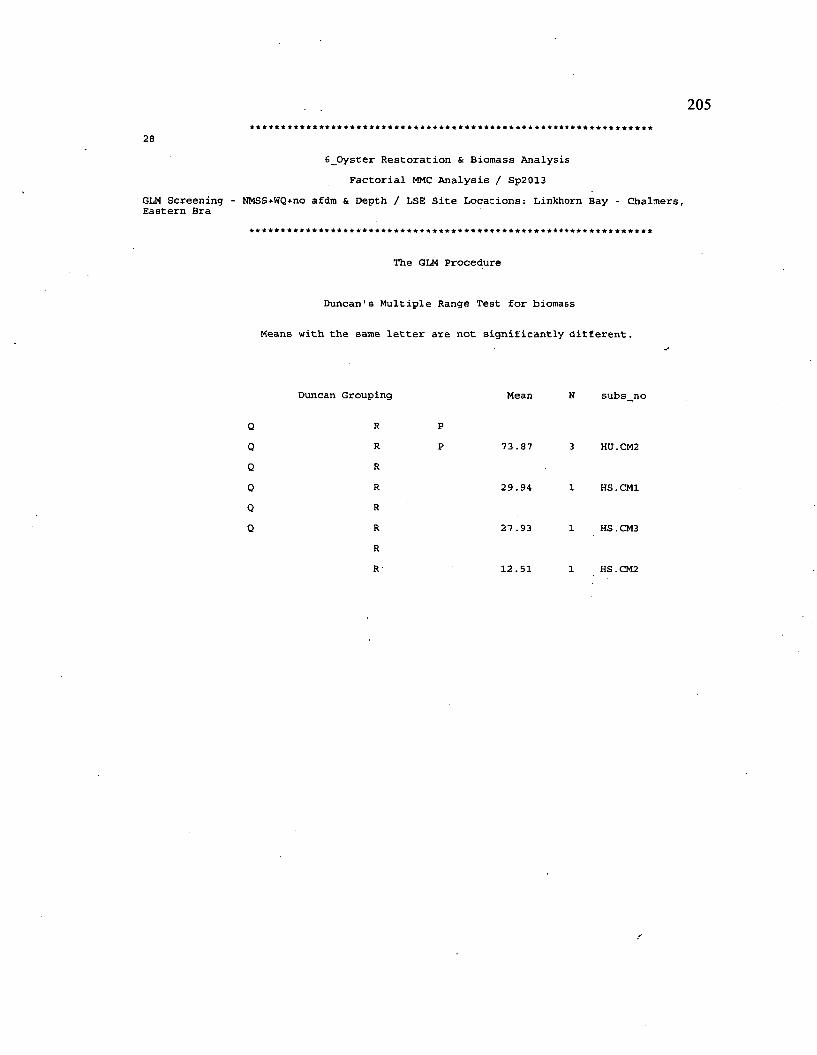
205
2 8
6 _ O y s t e r R e s t o r a t i o n & B i o m a s s A n a l y s i s
F a c t o r i a l MMC A n a l y s i s / S p 2 0 1 3
GLM S c r e e n i n g - N M S S + W Q + n o a f d m & D e p t h / L S E S i t e L o c a t i o n s : L i n k h o r n B a y - C h a l m e r s , E a s t e r n B r a
T h e G U I P r o c e d u r e
D u n c a n ' s M u l t i p l e R a n g e T e s t f o r b i o m a s s
M e a n s w i t h t h e s a m e l e t t e r a r e n o t s i g n i f i c a n t l y d i f f e r e n t .
D u n c a n G r o u p i n g M e a n N s u b s _ n o
Q R P
Q R P 7 3 . 8 7 3 H U . C M 2
Q R
Q R 2 9 . 9 4 1 H S . C M 1
Q R
Q R 2 7 . 9 3 1 H S . C M 3
R
R 1 2 . 5 1 1 H S . C M 2
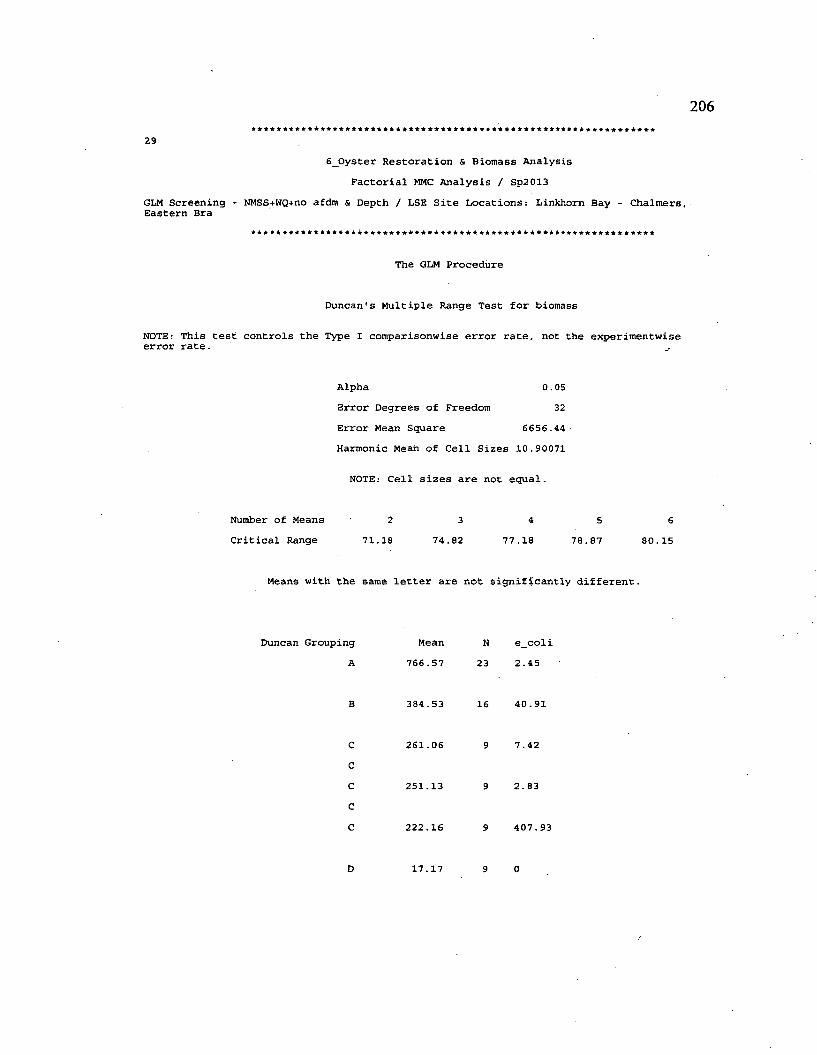
206
2 9
6 _ O y s t e r R e s t o r a t i o n & B i o m a s s A n a l y s i s
F a c t o r i a l MMC A n a l y s i s / S p 2 0 1 3
G L M S c r e e n i n g - N M S S + W Q + n o a f d m & D e p t h / L S E S i t e L o c a t i o n s : L i n k h o r n B a y - C h a l m e r s , E a s t e r n B r a
T h e G L M P r o c e d u r e
D u n c a n ' s M u l t i p l e R a n g e T e s t f o r b i o m a s s
N O T E : T h i s t e s t c o n t r o l s t h e T y p e X c o m p a r i s o n w i s e e r r o r r a t e , n o t t h e e x p e r i m e n t w i s e e r r o r r a t e .
A l p h a 0 . 0 5
E r r o r D e g r e e s o f F r e e d o m 3 2
E r r o r M e a n S q u a r e 6 6 5 6 . 4 4
H a r m o n i c M e a n o f C e l l S i z e s 1 0 . 9 0 0 7 1
N O T E : C e l l s i z e s a r e n o t e q u a l .
N u m b e r o f M e a n s 2 3 4 5 6
C r i t i c a l R a n g e 7 1 . 1 8 7 4 . 8 2 7 7 . 1 8 7 8 . 8 7 8 0 . 1 5
M e a n s w i t h t h e s a m e l e t t e r a r e n o t s i g n i f i c a n t l y d i f f e r e n t .
D u n c a n G r o u p i n g M e a n N e _ c o l i
A 7 6 6 . 5 7 2 3 2 . 4 5
B 3 8 4 . 5 3 1 6 4 0 . 9 1
C 2 6 1 . 0 6 9 7 . 4 2
C
C 2 5 1 . 1 3 9 2 . 8 3
C
C 2 2 2 . 1 6 9 4 0 7 . 9 3
D 1 7 . 1 7 9 0
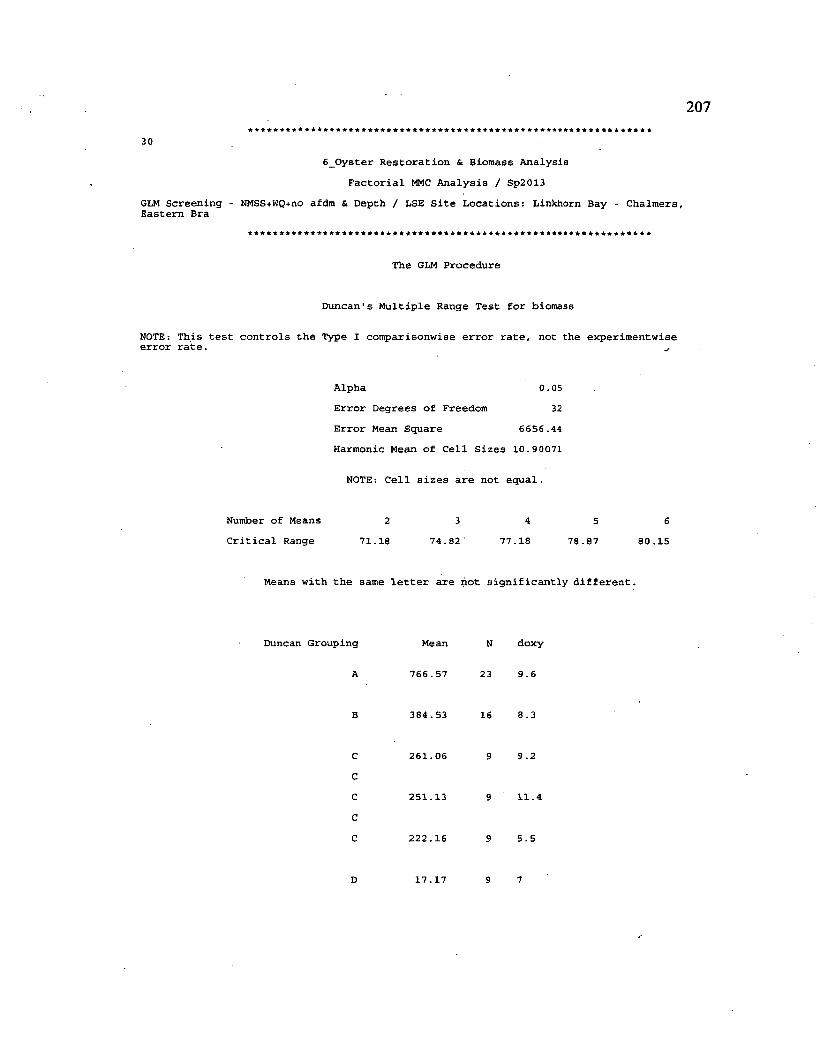
207
3 0
6 _ O y s t e r R e s t o r a t i o n & B i o m a s s A n a l y s i s
F a c t o r i a l MMC A n a l y s i s / S p 2 0 1 3
G L M S c r e e n i n g - N M S S + W Q + n o a f d m & D e p t h / L S E S i t e L o c a t i o n s : L i n k h o r n B a y - C h a l m e r s , E a s t e r n B r a
T h e G L M P r o c e d u r e
D u n c a n ' s M u l t i p l e R a n g e T e s t f o r b i o m a s s
N O T E : T h i s t e s t c o n t r o l s t h e T y p e I c o m p a r i s o n w i s e e r r o r r a t e , n o t t h e e x p e r i m e n t w i s e e r r o r r a t e .
A l p h a 0 . 0 5
E r r o r D e g r e e s o f F r e e d o m 3 2
E r r o r M e a n S q u a r e 6 6 5 6 . 4 4
H a r m o n i c M e a n o f C e l l S i z e s 1 0 . 9 0 0 7 1
N O T E : C e l l s i z e s a r e n o t e q u a l .
N u m b e r o f M e a n s 2 3 4 5 6
C r i t i c a l R a n g e 7 1 . 1 8 7 4 . 8 2 ' 7 7 . 1 8 7 8 . 8 7 8 0 . 1 5
M e a n s w i t h t h e s a m e l e t t e r a r e n o t s i g n i f i c a n t l y d i f f e r e n t .
D u n c a n G r o u p i n g M e a n N d o x y
A 7 6 6 . 5 7 2 3 9 . 6
B 3 8 4 . 5 3 1 6 8 . 3
C 2 6 1 . 0 6 9 9 . 2
C
C 2 5 1 . 1 3 9 1 1 . 4
C
C 2 2 2 . 1 6 9 5 . 5
D 1 7 . 1 7 9 7
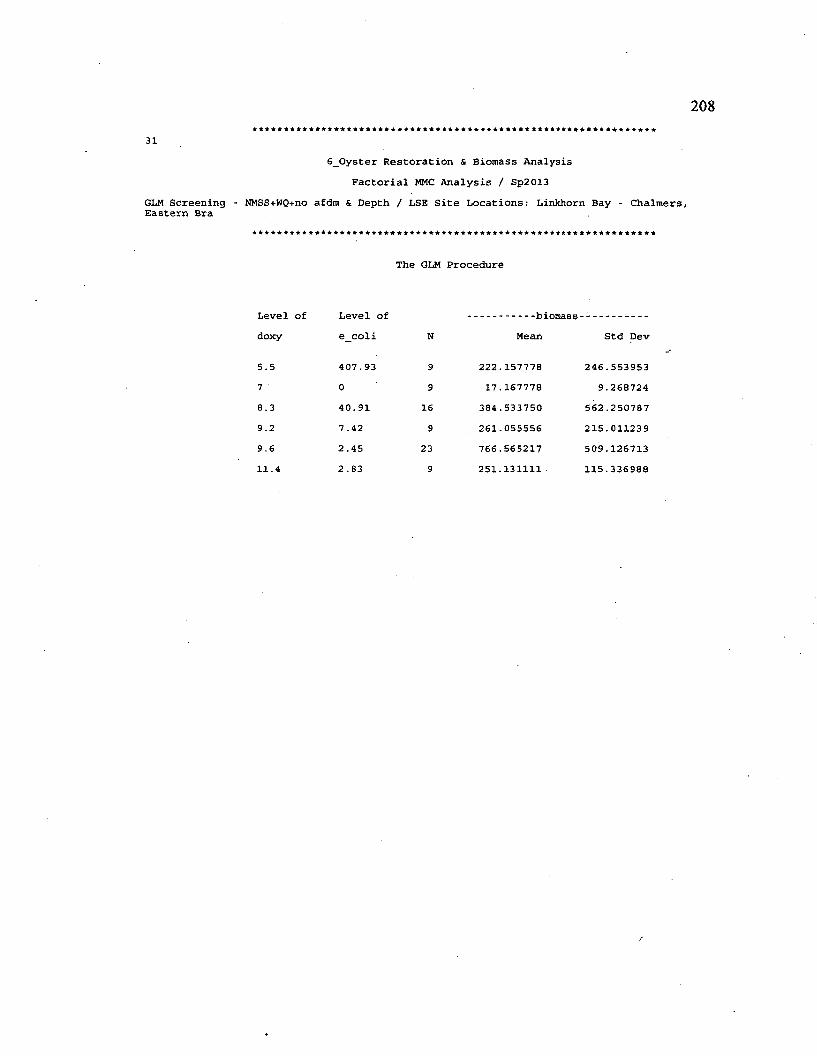
208
3 1
6 _ O y s t e r R e s t o r a t i o n & B i o m a s s A n a l y s i s
F a c t o r i a l MMC A n a l y s i s / S p 2 0 1 3
GL M S c r e e n i n g - N M S S + W Q + n o a f d m & D e p t h / L S E S i t e L o c a t i o n s : L i n k h o r n B a y - C h a l m e r s , E a s t e r n B r a
T h e G L M P r o c e d u r e
L e v e l o f L e v e l o f b i o m a s s - - ------------------------
d o x y e _ c o l i N M e a n S t d D e v
5 . 5 4 0 7 . 9 3 9 2 2 2 . 1 5 7 7 7 8 2 4 6 . 5 5 3 9 5 3
7 0 9 1 7 . 1 6 7 7 7 8 9 . 2 6 8 7 2 4
8 . 3 4 0 . 9 1 1 6 3 8 4 . 5 3 3 7 5 0 5 6 2 . 2 5 0 7 8 7
9 . 2 7 . 4 2 9 2 6 1 . 0 5 5 5 5 6 2 1 5 . 0 1 1 2 3 9
9 . 6 2 . 4 5 2 3 7 6 6 . 5 6 5 2 1 7 5 0 9 . 1 2 6 7 1 3
1 1 . 4 2 . 8 3 9 2 5 1 . 1 3 1 1 1 1 1 1 5 . 3 3 6 9 8 8
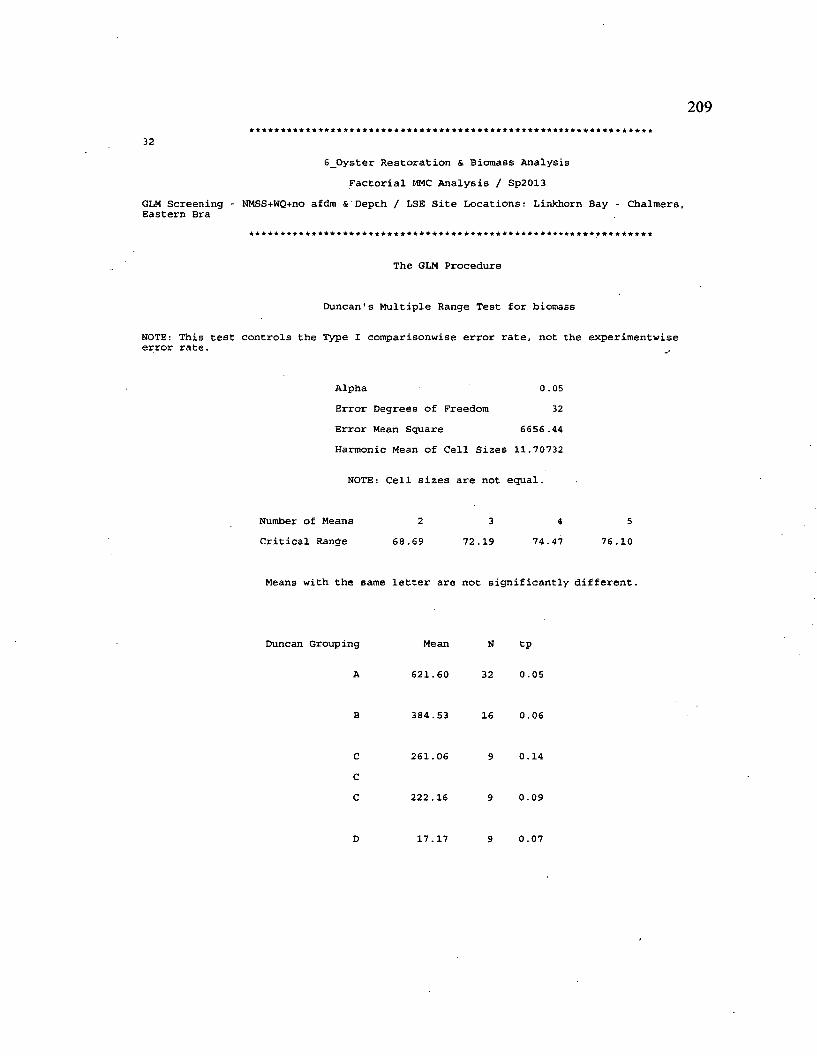
209
3 2
6 _ O y s t e r R e s t o r a t i o n & B i o m a s s A n a l y s i s
F a c t o r i a l MMC A n a l y s i s / S p 2 0 1 3
GL M S c r e e n i n g - N M S S + W Q + n o a f d m & ' D e p t h / L S E S i t e L o c a t i o n s : L i n k h o r n B a y - C h a l m e r s , E a s t e r n B r a
T h e G L M P r o c e d u r e
D u n c a n ’ s M u l t i p l e R a n g e T e s t f o r b i o m a s s
N O T E : T h i s t e s t c o n t r o l s t h e T y p e I c o m p a r i s o n w i s e e r r o r r a t e , n o t t h e e x p e r i m e n t w i s e e r r o r r a t e .
A l p h a 0 . 0 5
E r r o r D e g r e e s o f F r e e d o m 3 2
E r r o r M e a n S q u a r e 6 6 5 6 . 4 4
H a r m o n i c M e a n o f C e l l S i z e s 1 1 . 7 0 7 3 2
N O T E : C e l l s i z e s a r e n o t e q u a l .
N u m b e r o f M e a n s 2 3 4 5
C r i t i c a l R a n g e 6 8 . 6 9 7 2 . 1 9 7 4 . 4 7 7 6 . 1 0
M e a n s w i t h t h e s a m e l e t t e r a r e n o t s i g n i f i c a n t l y d i f f e r e n t .
D u n c a n G r o u p i n g M e a n N t p
A 6 2 1 . 6 0 3 2 0 . 0 5
B 3 8 4 . 5 3 1 6 0 . 0 6
C 2 6 1 . 0 6 9 0 . 1 4
C
C 2 2 2 . 1 6 9 0 . 0 9
D 1 7 . 1 7 9 0 . 0 7
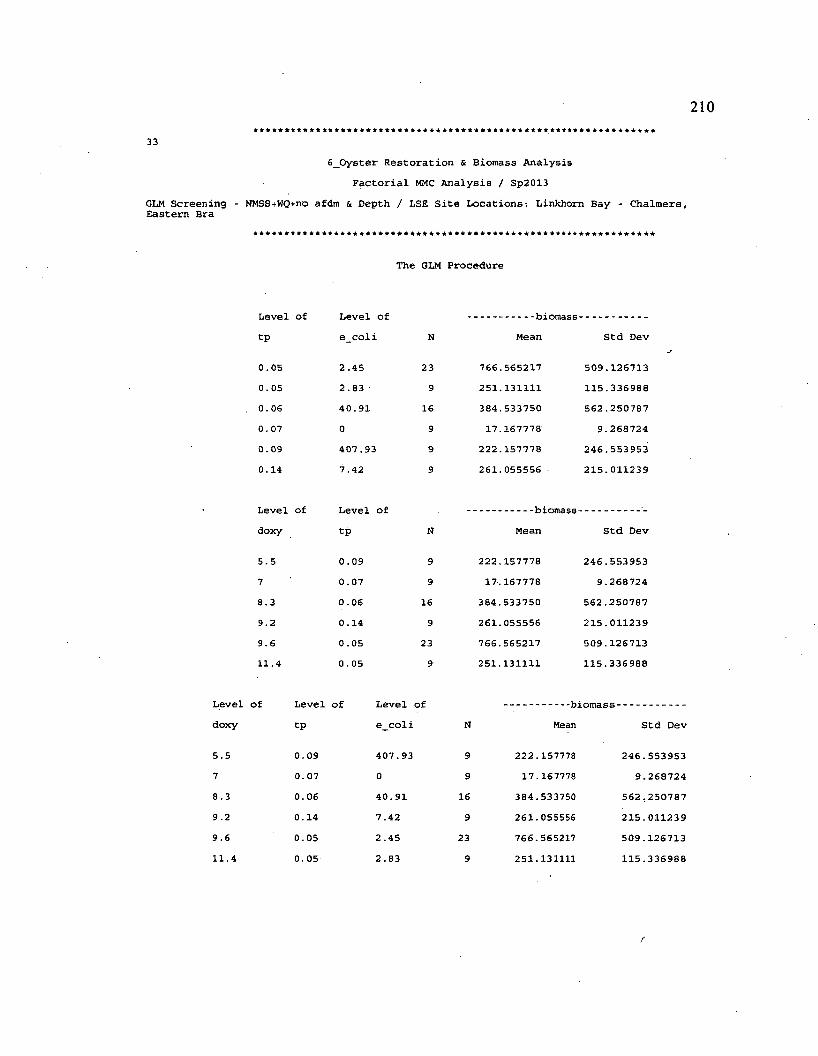
210
3 3
6 _ O y s t e r R e s t o r a t i o n & B i o m a s s A n a l y s i s
F a c t o r i a l MMC A n a l y s i s / S p 2 0 1 3
GL M S c r e e n i n g - N M S S + W Q + n o a f d m & D e p t h / L S E S i t e L o c a t i o n s : L i n k h o r n B a y - C h a l m e r s , E a s t e r n B r a
T h e G L M P r o c e d u r e
L e v e l o f
t p
L e v e l o f
e c o l i
b iom ass-
M e a n S t d D e v
0 . 0 5
0 . 0 5
0 . 0 6
0 . 0 7
0 . 0 9
0 . 1 4
2 . 4 5
2 . 8 3
4 0 . 9 1
0
4 0 7 . 9 3
7 . 4 2
2 3
9
1 6
9
9
9
7 6 6 . 5 6 5 2 1 7
2 5 1 . 1 3 1 1 1 1
3 8 4 . 5 3 3 7 5 0
1 7 . 1 6 7 7 7 8
2 2 2 . 1 5 7 7 7 8
2 6 1 . 0 5 5 5 5 6
5 0 9 . 1 2 6 7 1 3
1 1 5 . 3 3 6 9 8 8
5 6 2 . 2 5 0 7 8 7
9 . 2 6 8 7 2 4
2 4 6 . 5 5 3 9 5 3
2 1 5 . 0 1 1 2 3 9
L e v e l o f
d o x y
L e v e l o f
t p
b iom ass-
M e a n S t d D e v
5 . 5
7
8 . 3
9 . 2
9 . 6
1 1 . 4
0 . 0 9
0 . 0 7
0 . 0 6
0 . 1 4
0 . 0 5
0 . 0 5
9
9
1 6
9
2 3
9
2 2 2 . 1 5 7 7 7 8
1 7 . 1 6 7 7 7 8
3 8 4 . 5 3 3 7 5 0
2 6 1 . 0 5 5 5 5 6
7 6 6 . 5 6 5 2 1 7
2 5 1 . 1 3 1 1 1 1
2 4 6 . 5 5 3 9 5 3
9 . 2 6 8 7 2 4
5 6 2 . 2 5 0 7 8 7
2 1 5 . 0 1 1 2 3 9
5 0 9 . 1 2 6 7 1 3
1 1 5 . 3 3 6 9 8 8
L e v e l o f L e v e l o f L e v e l o f - b i o m a s s -
d o x y t p e _ c o l i N M e a n S t d D e v
5 . 5 0 . 0 9 4 0 7 . 9 3 9 2 2 2 . 1 5 7 7 7 8 2 4 6 . 5 5 3 9 5 3
7 0 . 0 7 0 9 1 7 . 1 6 7 7 7 8 9 . 2 6 8 7 2 4
8 . 3 0 . 0 6 4 0 . 9 1 1 6 3 8 4 . 5 3 3 7 5 0 5 6 2 , 2 5 0 7 8 7
9 . 2 0 . 1 4 7 . 4 2 9 2 6 1 . 0 5 5 5 5 6 2 1 5 . 0 1 1 2 3 9
9 . 6 0 . 0 5 2 . 4 5 2 3 7 6 6 . 5 6 5 2 1 7 5 0 9 . 1 2 6 7 1 3
1 1 . 4 0 . 0 5 2 . 8 3 9 2 5 1 . 1 3 1 1 1 1 1 1 5 . 3 3 6 9 8 8
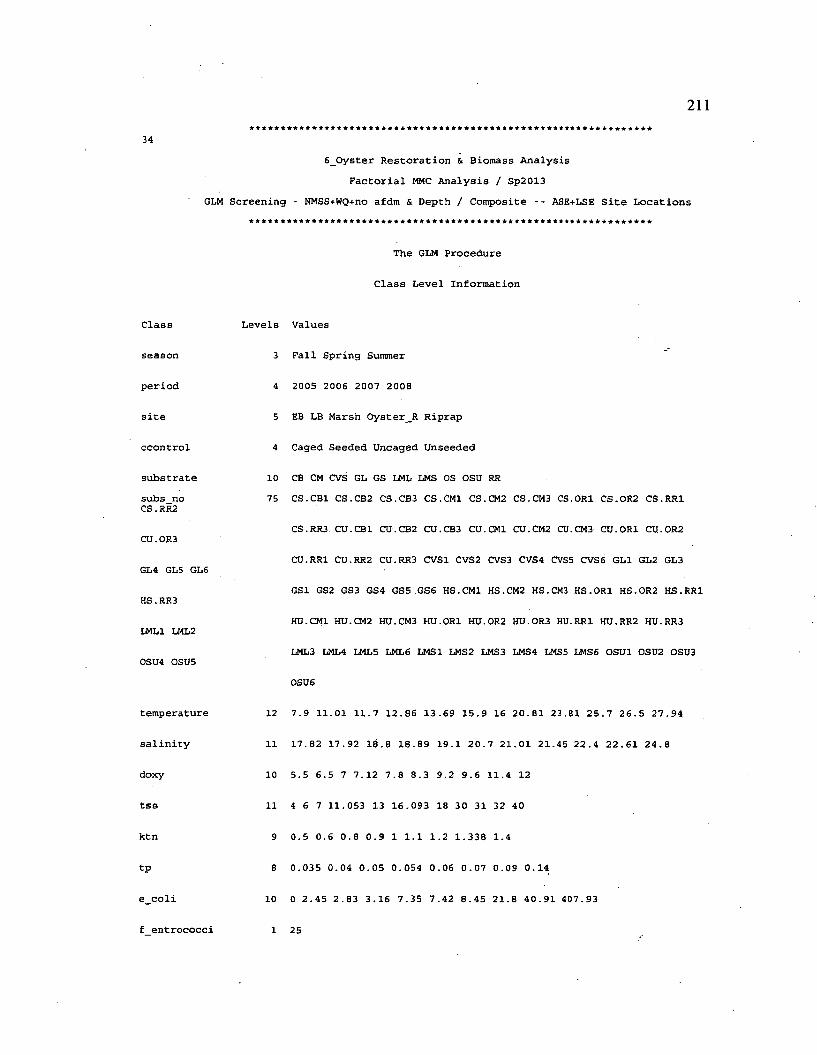
211
34
6 _ O y s t e r R e s t o r a t i o n & B i o m a s s A n a l y s i s
F a c t o r i a l MMC A n a l y s i s / S p 2 0 1 3
GL M S c r e e n i n g - N M S S + W Q + n o a f d m & D e p t h / C o m p o s i t e - - A S E + L S E S i t e L o c a t i o n s
T h e G L M P r o c e d u r e
C l a s s L e v e l I n f o r m a t i o n
C l a s s
p e r i o d
s i t e
c c o n t r o l
s u b s t r a t e
s u b s _ n o C S . R R 2
C U . 0 R 3
G L 4 G L 5 G L 6
H S . R R 3
L M L 1 L M L 2
0 S U 4 0 S U 5
t e m p e r a t u r e
s a l i n i t y
d o x y
t s s
k t n
t p
e _ c o l i
f e n t r o c o c c i
L e v e l s V a l u e s
3 F a l l S p r i n g S u m m e r
4 2 0 0 5 2 0 0 6 2 0 0 7 2 0 0 8
5 E B L B M a r s h O y s t e r _ R R i p r a p
4 C a g e d S e e d e d U n c a g e d U n s e e d e d
1 0 CB CM C V S G L G S L M L L M S O S O S U R R
7 5 C S . C B 1 C S . C B 2 C S . C B 3 C S . C M 1 C S . C M 2 C S . C M 3 C S . O R 1 C S . O R 2 C S . R R 1
C S . R R 3 C U . C B 1 C U . C B 2 C U . C B 3 C U . C M 1 C U . C M 2 C U . C M 3 C U . O R 1 C U . O R 2
C U . R R 1 C U . R R 2 C U . R R 3 C V S 1 C V S 2 C V S 3 C V S 4 C V S 5 C V S 6 G L 1 G L 2 G L 3
G S 1 G S 2 G S 3 G S 4 G S 5 G S 6 H S . C M 1 H S . C M 2 H S . C M 3 H S . O R 1 H S . O R 2 H S . R R 1
H U . C M 1 H U . C M 2 H U . C M 3 H U . O R 1 H U . 0 R 2 H U . O R 3 H U . R R 1 H U . R R 2 H U . R R 3
L M L 3 L M L 4 L M L 5 L M L 6 L M S 1 L M S 2 L M S 3 L M S 4 L M S 5 L M S 6 O S U 1 O S U 2 O S U 3
O S U 6
1 2 7 . 9 1 1 . 0 1 1 1 . 7 1 2 . 8 6 1 3 . 6 9 1 5 . 9 1 6 2 0 . 8 1 2 3 . 8 1 2 5 . 7 2 6 . 5 2 7 . 9 4
1 1 1 7 . 8 2 1 7 . 9 2 1 8 . 8 1 8 . 8 9 1 9 . 1 2 0 . 7 2 1 . 0 1 2 1 . 4 5 2 2 . 4 2 2 . 6 1 2 4 . 8
1 0 5 . 5 6 . 5 7 7 . 1 2 7 . 8 8 . 3 9 . 2 9 . 6 1 1 . 4 1 2
1 1 4 6 7 1 1 . 0 5 3 1 3 1 6 . 0 9 3 1 8 3 0 3 1 3 2 4 0
9 0 . 5 0 . 6 0 . 8 0 . 9 1 1 . 1 1 . 2 1 . 3 3 8 1 . 4
8 0 . 0 3 5 0 . 0 4 0 . 0 5 0 . 0 5 4 0 . 0 6 0 . 0 7 0 . 0 9 0 . 1 4
10 0 2 . 4 5 2 . 8 3 3 . 1 6 7 . 3 5 7 . 4 2 8 . 4 5 2 1 . 8 4 0 . 9 1 4 0 7 . 9 3
1 25
212
N u m b e r o f O b s e r v a t i o n s R e a d 6 1 5
N u m b e r o f O b s e r v a t i o n s U s e d 6 1 5
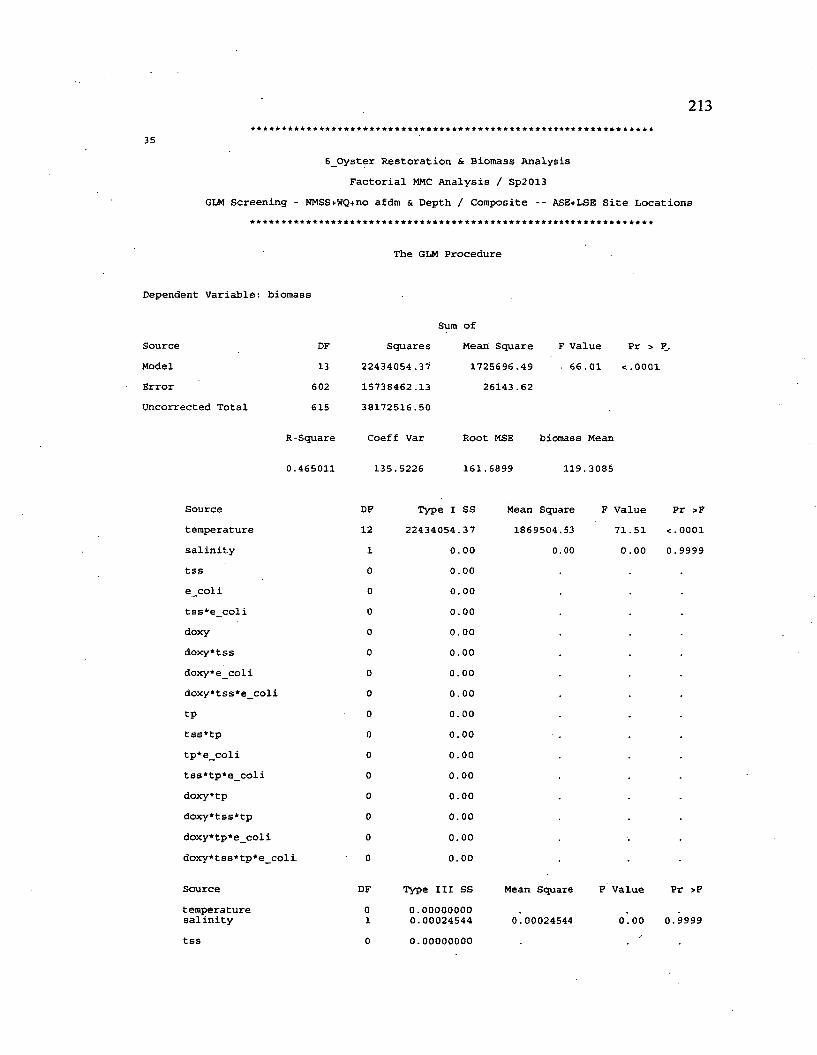
213
3 5
6 _ 0 y s t e r R e s t o r a t i o n & B i o m a s s A n a l y s i s
F a c t o r i a l MMC A n a l y s i s / S p 2 0 1 3
G L M S c r e e n i n g - N M S S + W Q + n o a f d m & D e p t h / C o m p o s i t e - - A S E + L S E S i t e L o c a t i o n s
T h e G L M P r o c e d u r e
D e p e n d e n t V a r i a b l e : b i o m a s s
S o u r c e D F
M o d e l 1 3
E r r o r 6 0 2
U n c o r r e c t e d T o t a l 6 1 5
R - S q u a r e
S u m o f
S q u a r e s M e a n S q u a r e
2 2 4 3 4 0 5 4 . 3 7 1 7 2 5 6 9 6 . 4 9
1 5 7 3 8 4 6 2 . 1 3 2 6 1 4 3 . 6 2
3 8 1 7 2 5 1 6 . 5 0
0 . 4 6 5 0 1 1
C o e f f V a r
1 3 5 . 5 2 2 6
F V a l u e P r > F .
. 6 6 . 0 1 < . 0 0 0 1
R o o t M S E
1 6 1 . 6 8 9 9
b i o m a s s M e a n
1 1 9 . 3 0 8 5
S o u r c e
t e m p e r a t u r e
s a l i n i t y
t s s
e _ c o l i
t s s * e _ c o l i
d o x y
d o x y * t s s
d o x y * e _ c o l i
d o x y * t s s * e _ c o l i
t p
t s s * t p
t p * e _ c o l i
t s s * t p * e _ c o l i
d o x y * t p
d o x y * t s s * t p
d o x y * t p * e _ c o l i
d o x y * t s s * t p * e _ c o l i
S o u r c e
t e m p e r a t u r es a l i n i t y
D F
12
1
0
0
0
0
0
0
0
0
0
0
0
0
0
0
0
D F
01
T y p e I S S
2 2 4 3 4 0 5 4 . 3 7
0 . 0 0
0.00 0.00 0.00 0 . 0 0
0.00 0 . 0 0
0.00 0 . 00
0.00 0 . 0 0
0.00 0 . 0 0
0 . 0 0
0.00 0 . 0 0
T y p e I I I S S
0 . 0 0 0 0 0 0 0 0
0 . 0 0 0 2 4 5 4 4
M e a n S q u a r e
1 8 6 9 5 0 4 . 5 3
00
F V a l u e
7 1 . 5 1
00
P r > F
< . 0 0 0 1
0 . 9 9 9 9
M e a n S q u a r e F V a l u e P r > F
0 . 0 0 0 2 4 5 4 4 0 . 0 0 0 . 9 9 9 9
t s s 0.00000000
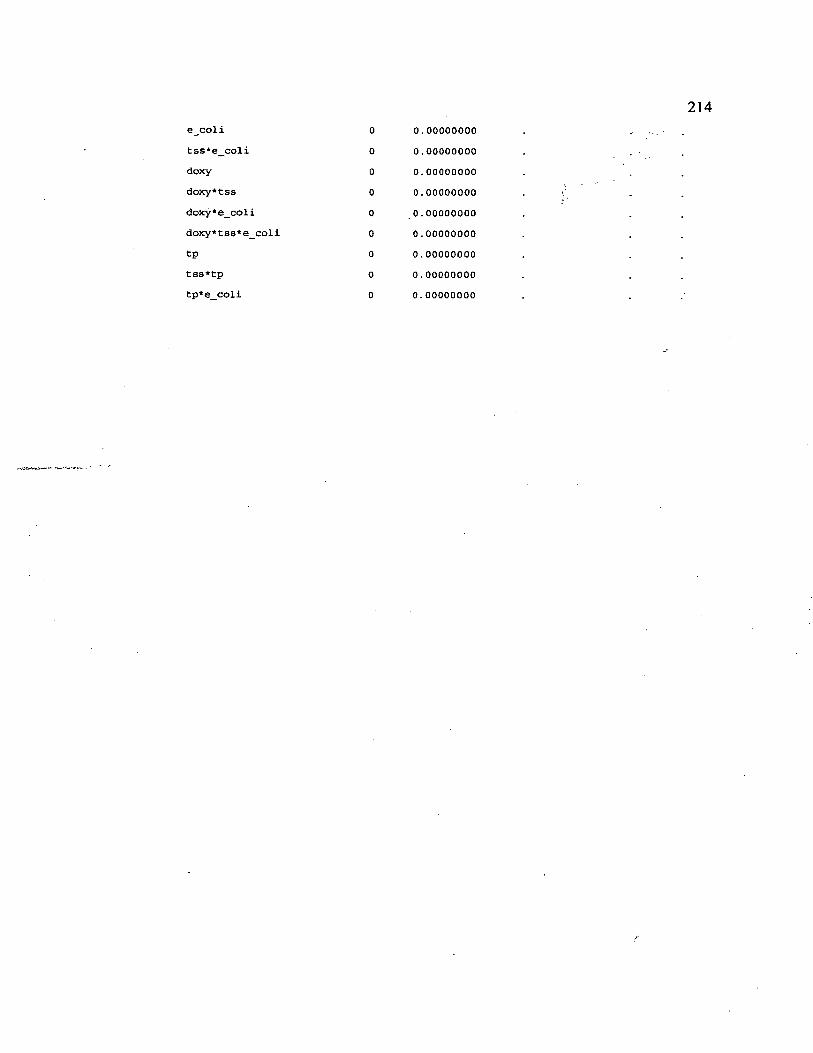
e _ c o li
t s s * e _ c o l i
d o x y
d o x y * t s s
d o x y * e _ c o l i
d o x y * t s s * e _ c o l i
t p
t s s * t p
t p * e _ c o l i
0 0.000000000 0.000000000 0.000000000 0 . 0 0 0 0 0 0 0 0
0 0 . 0 0 0 0 0 0 0 0
0 0 . 0 0 0 0 0 0 0 0
0 0 . 0 0 0 0 0 0 0 0
0 0 . 0 0 0 0 0 0 0 0
0 0 . 0 0 0 0 0 0 0 0
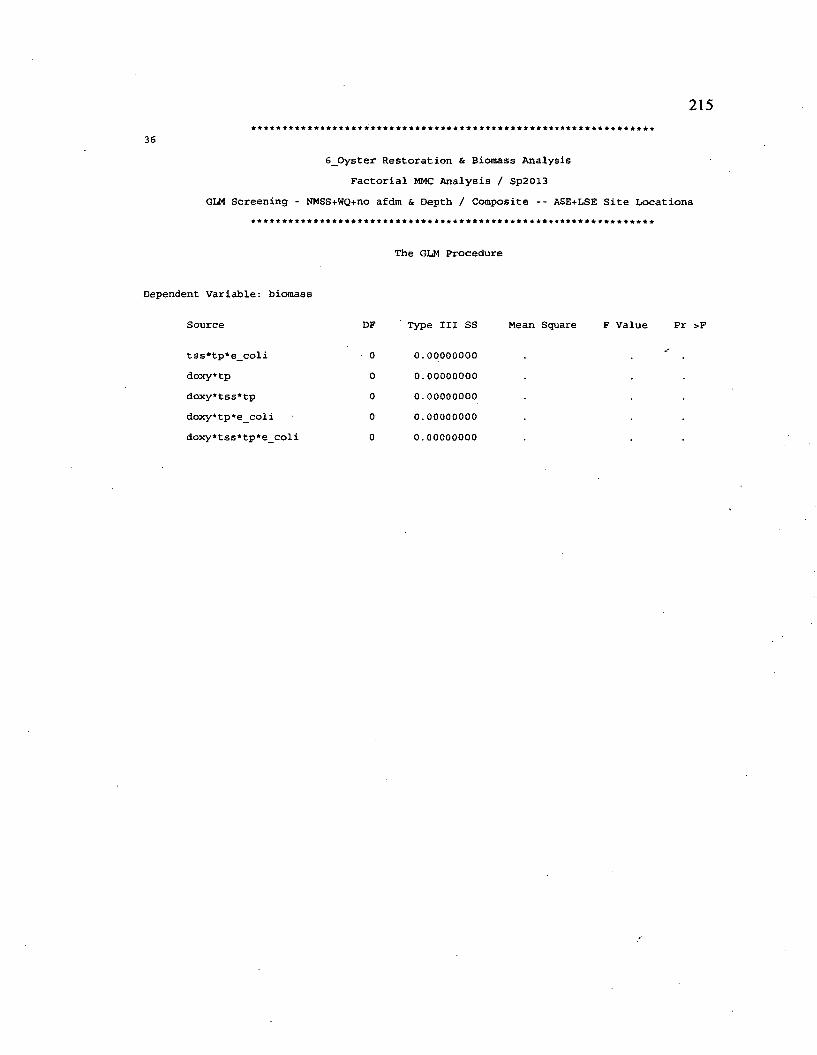
215
3 6
6 _ O y s t e r R e s t o r a t i o n & B i o m a s s A n a l y s i s
F a c t o r i a l MMC A n a l y s i s / S p 2 0 1 3
GL M S c r e e n i n g - N M S S + W Q + n o a f d m & D e p t h / C o m p o s i t e - - A S E + L S E S i t e L o c a t i o n s
D e p e n d e n t V a r i a b l e : b i o m a s s
T h e G L M P r o c e d u r e
S o u r c e D F T y p e I I I S S M e a n S q u a r e F V a l u e P r > F
t s s * t p * e _ c o l i
d o x y + t p
d o x y * t s s * t p
d o x y * t p * e _ c o l i
d o x y * t s s * t p * e _ c o l i
0 . 0 0 0 0 0 0 0 0
0 . 0 0 0 0 0 0 0 0
0 . 0 0 0 0 0 0 0 0
0 . 0 0 0 0 0 0 0 0
0 . 0 0 0 0 0 0 0 0
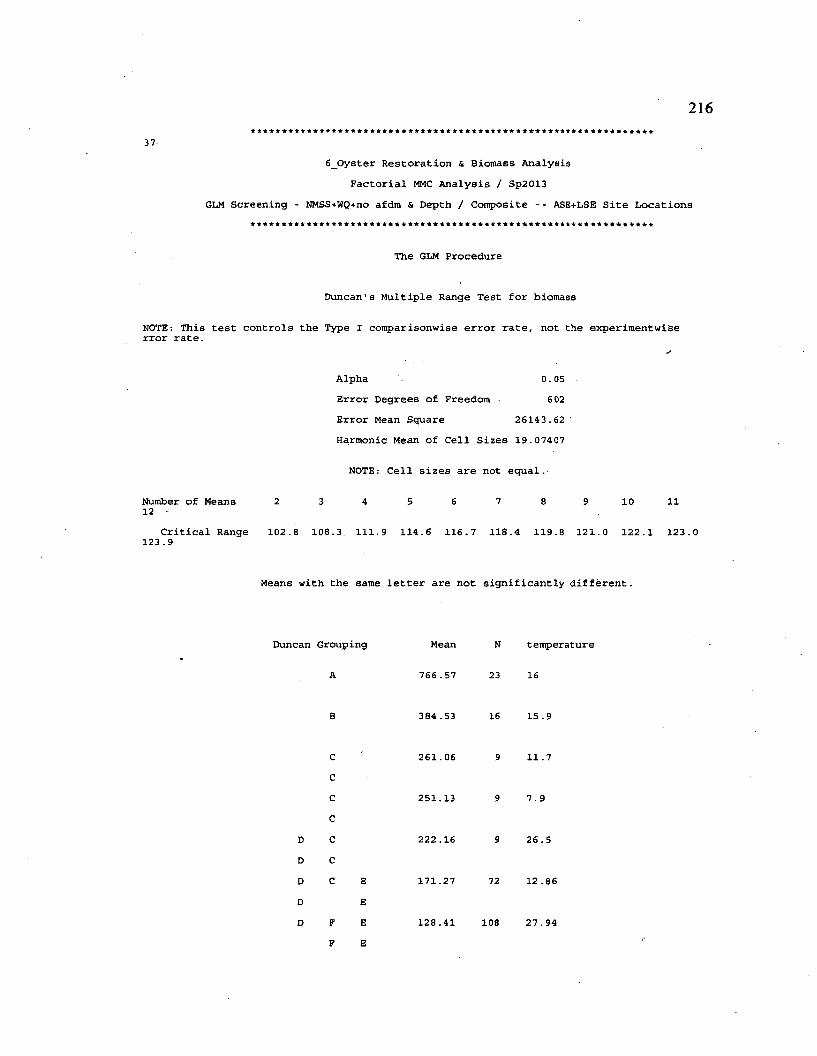
216
37
6 _ O y s t e r R e s t o r a t i o n & B i o m a s s A n a l y s i s
F a c t o r i a l MMC A n a l y s i s / S p 2 0 1 3
GLM S c r e e n i n g - N M S S + W Q + n o a f d m & D e p t h / C o m p o s i t e - - A S E + L S E S i t e L o c a t i o n s
T h e GL M P r o c e d u r e
D u n c a n ' s M u l t i p l e R a n g e T e s t f o r b i o m a s s
N O T E : T h i s t e s t c o n t r o l s t h e T y p e I c o m p a r i s o n w i s e e r r o r r a t e , n o t t h e e x p e r i m e n t w i s e r r o r r a t e .
A l p h a 0 . 0 5
E r r o r D e g r e e s o f F r e e d o m 6 0 2
E r r o r M e a n S q u a r e 2 6 1 4 3 . 6 2
H a r m o n i c M e a n o f C e l l S i z e s 1 9 . 0 7 4 0 7
N O T E : C e l l s i z e s a r e n o t e q u a l .
4 5 6 7N u m b e r o f M e a n s 12 -
8 10 11
C r i t i c a l R a n g e 1 0 2 . 8 1 0 8 . 3 . 1 1 1 . 9 1 1 4 . 6 1 1 6 . 7 1 1 8 . 4 1 1 9 . 8 1 2 1 . 0 1 2 2 . 1 1 2 3 . 01 2 3 . 9
M e a n s w i t h t h e s a m e l e t t e r a r e n o t s i g n i f i c a n t l y d i f f e r e n t .
D u n c a n G r o u p i n g M e a n N t e m p e r a t u r e
7 6 6 . 5 7 2 3 1 6
3 8 4 . 5 3 1 6 1 5 . 9
D
D
D
D
D
2 6 1 . 0 6 9 1 1 . 7
2 5 1 . 1 3 9 7 . 9
2 2 2 . 1 6 9 2 6 . 5
1 7 1 . 2 7 7 2 1 2 . 8 6
1 2 8 . 4 1 108 2 7 . 9 4
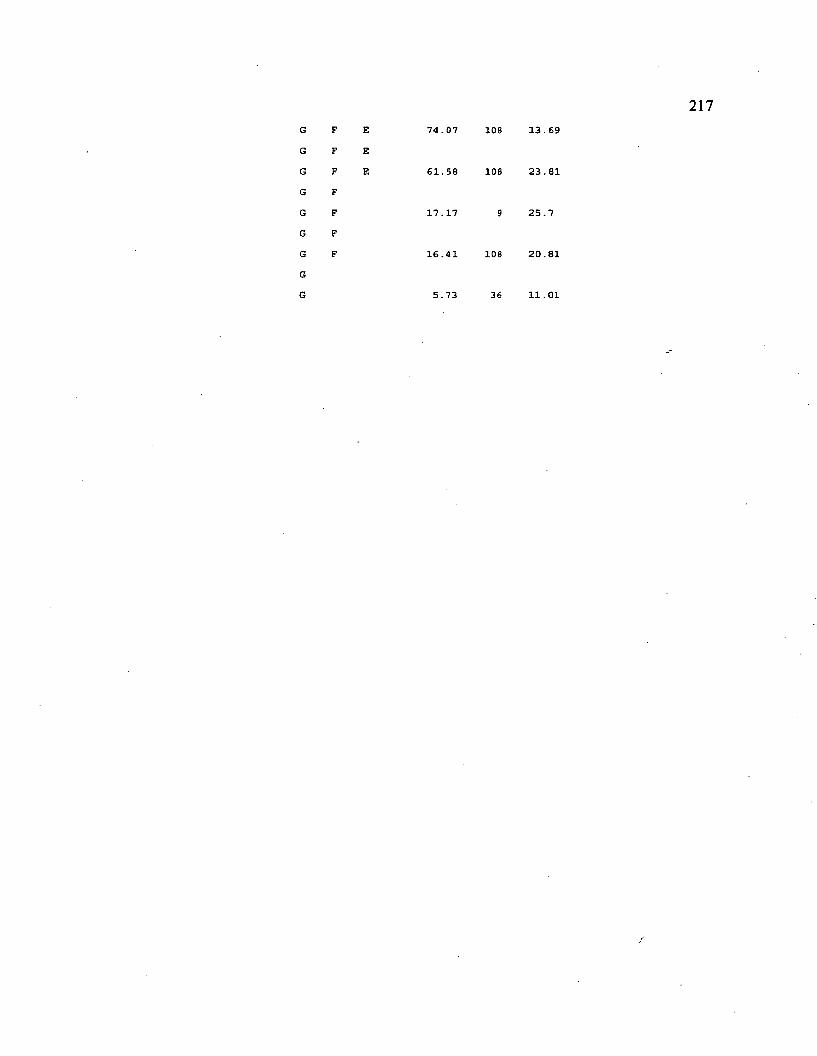
217G F E 7 4 . 0 7 1 0 8 1 3
G F E
G F E 6 1 . 5 8 1 0 8 2 3
G F
G F 1 7 . 1 7 9 2 5
G F
G F 1 6 . 4 1 1 0 8 2 0
G
G 5 . 7 3 3 6 1 1
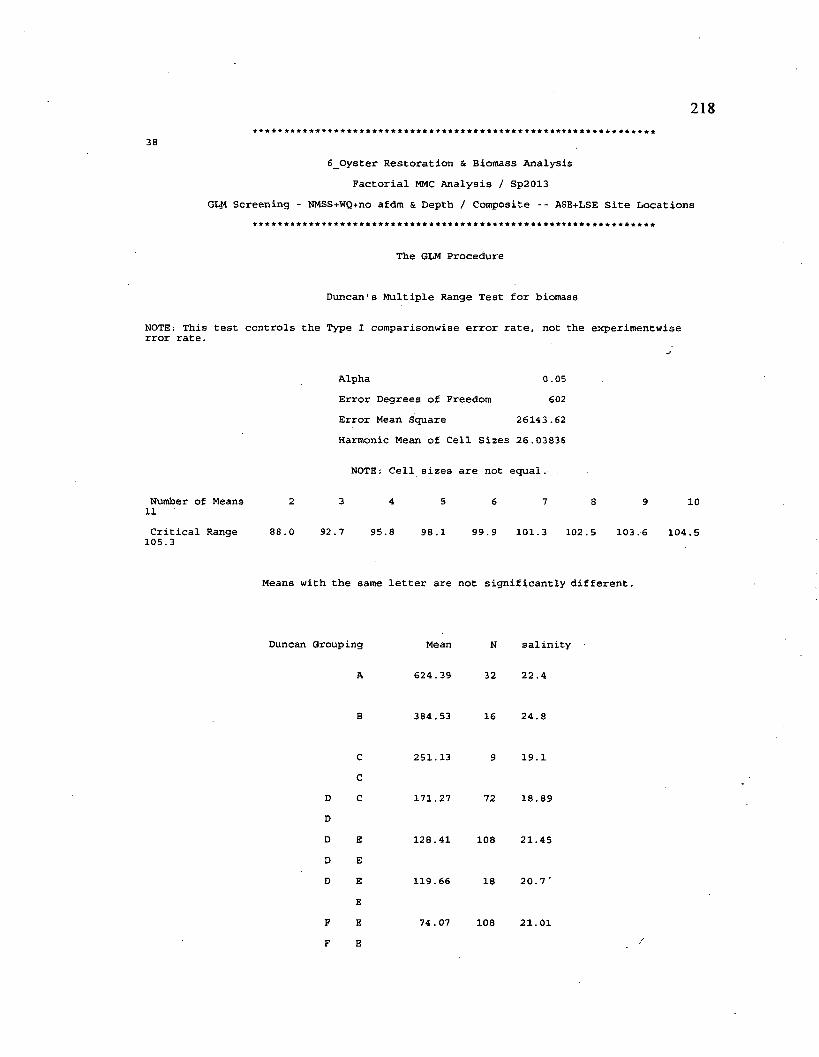
218
386 _ O y s t e r R e s t o r a t i o n & B i o m a s s A n a l y s i s
F a c t o r i a l MMC A n a l y s i s / S p 2 0 1 3
G U I S c r e e n i n g - N M S S + W Q + n o a f d m & D e p t h / C o m p o s i t e - - A S E + L S E S i t e L o c a t i o n s
T h e G L M P r o c e d u r e
D u n c a n ' s M u l t i p l e R a n g e T e s t f o r b i o m a s s
N O T E : T h i s t e s t c o n t r o l s t h e T y p e I c o m p a r i s o n w i s e e r r o r r a t e , n o t t h e e x p e r i m e n t w i s e r r o r r a t e .
A l p h a 0 . 0 S
E r r o r D e g r e e s o f F r e e d o m 6 0 2
E r r o r M e a n S q u a r e 2 6 1 4 3 . 6 2
H a r m o n i c M e a n o f C e l l S i z e s 2 6 . 0 3 8 3 6
N O T E : C e l l s i z e s a r e n o t e q u a l .
N u m b e r o f M e a n s 2 3 4 5 6 7 8 9 1 011
C r i t i c a l R a n g e 8 8 . 0 9 2 . 7 9 5 . 8 9 8 . 1 9 9 . 9 1 0 1 . 3 1 0 2 . 5 1 0 3 . 6 1 0 4 . 51 0 5 . 3
M e a n s w i t h t h e s a m e l e t t e r a r e n o t s i g n i f i c a n t l y d i f f e r e n t .
D u n c a n G r o u p i n g
A
B
C
C
D C
D
D E
D E
D E
E
F E
F E
M e a n N s a l i n i t y
6 2 4 . 3 9 3 2 2 2 . 4
3 8 4 . 5 3 1 6 2 4 . 8
2 5 1 . 1 3 9 1 9 . 1
1 7 1 . 2 7 7 2 1 8 . 8 9
1 2 8 . 4 1 1 0 8 2 1 . 4 5
1 1 9 . 6 6 1 8 2 0 . 7 '
7 4 . 0 7 1 0 8 2 1 . 0 1
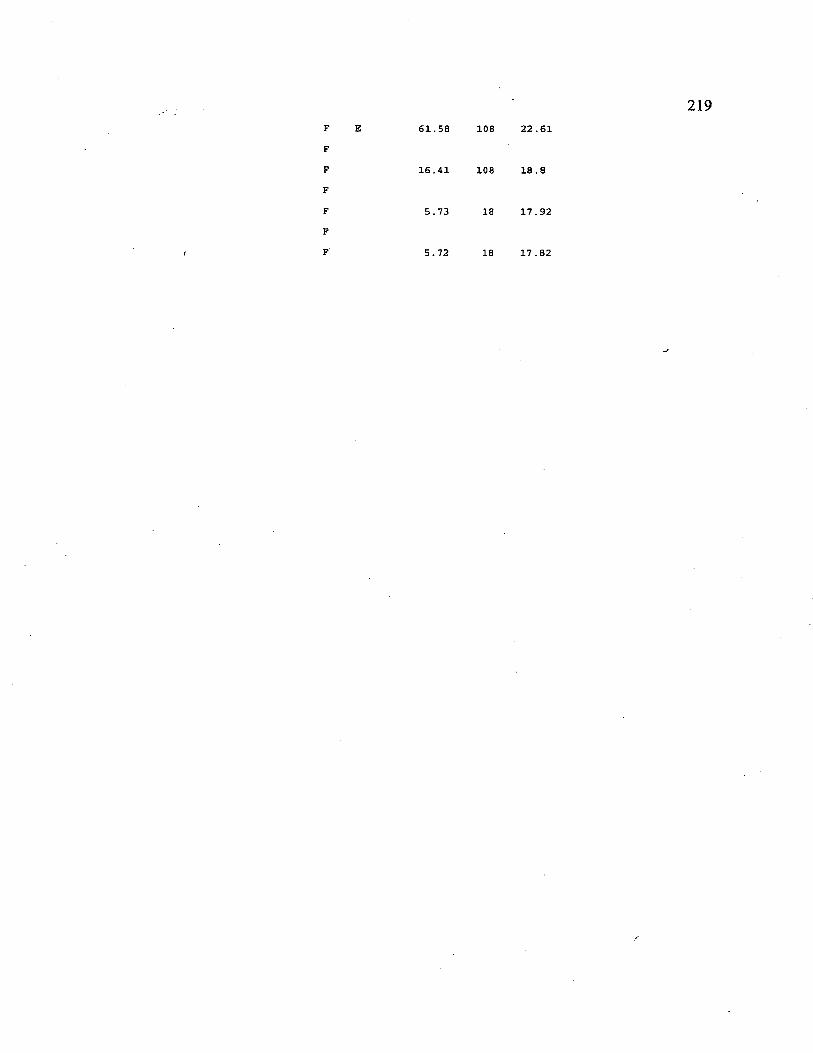
219F E 6 1 . 5 8 1 0 8 2 2 . 6 1
F
F 1 6 . 4 1 1 0 8 1 8 . 8
F
F 5 . 7 3 1 8 1 7 . 9 2
F
F 5 . 7 2 1 8 1 7 . 8 2
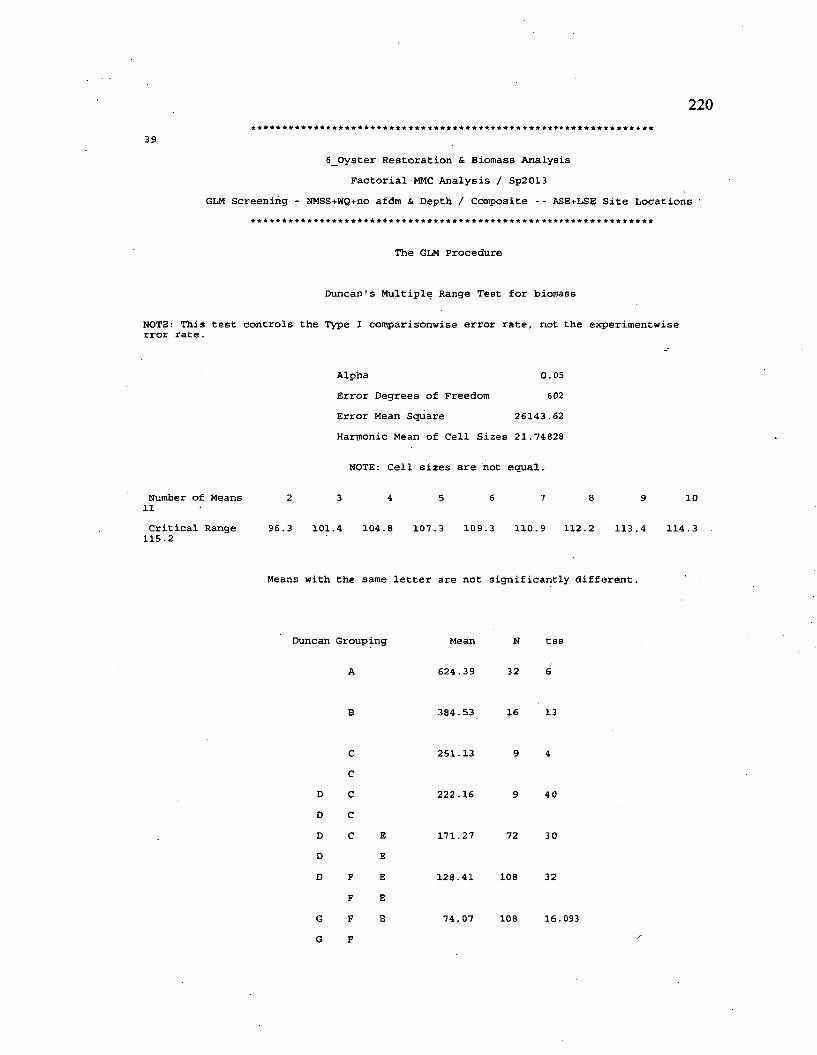
220
39
6 _ O y s t e r R e s t o r a t i o n & B i o m a s s A n a l y s i s
F a c t o r i a l MMC A n a l y s i s / S p 2 0 1 3
G L M S c r e e n i n g - N M S S + W Q + n o a f d m & D e p t h / C o m p o s i t e - - A S E + L S E S i t e L o c a t i o n s
T h e G L M P r o c e d u r e
D u n c a n ’ s M u l t i p l e R a n g e T e s t f o r b i o m a s s
N O T E : T h i s t e s t c o n t r o l s t h e T y p e X c o m p a r i s o n w i s e e r r o r r a t e , n o t t h e e x p e r i m e n t w i s e r r o r r a t e .
A l p h a 0 . 0 5
E r r o r D e g r e e s o f F r e e d o m 6 0 2
E r r o r M e a n S q u a r e 2 6 1 4 3 . 6 2
H a r m o n i c M e a n o f C e l l S i z e s 2 1 . 7 4 8 2 8
N O T E : C e l l s i z e s a r e h o t e q u a l .
N u m b e r o f M e a n s 11
C r i t i c a l R a n g e 1 1 5 . 2
10
9 6 . 3 1 0 1 . 4 1 0 4 . 8 1 0 7 . 3 1 0 9 . 3 1 1 0 . 9 1 1 2 . 2 1 1 3 . 4 1 1 4 . 3
M e a n s w i t h t h e s a m e l e t t e r a r e n o t s i g n i f i c a n t l y d i f f e r e n t .
D u n c a n G r o u p i n g M e a n N t s s
6 2 4 . 3 9 3 2 6
3 8 4 . 5 3 1 6 1 3
D
D
D
D
D
G
G
C
C
C
C
C
F
F
F
F
2 5 1 . 1 3 9 4
2 2 2 . 1 6 9 4 0
1 7 1 . 2 7 7 2 3 0
1 2 8 . 4 1 1 0 8 3 2
7 4 . 0 7 108 1 6 . 0 9 3
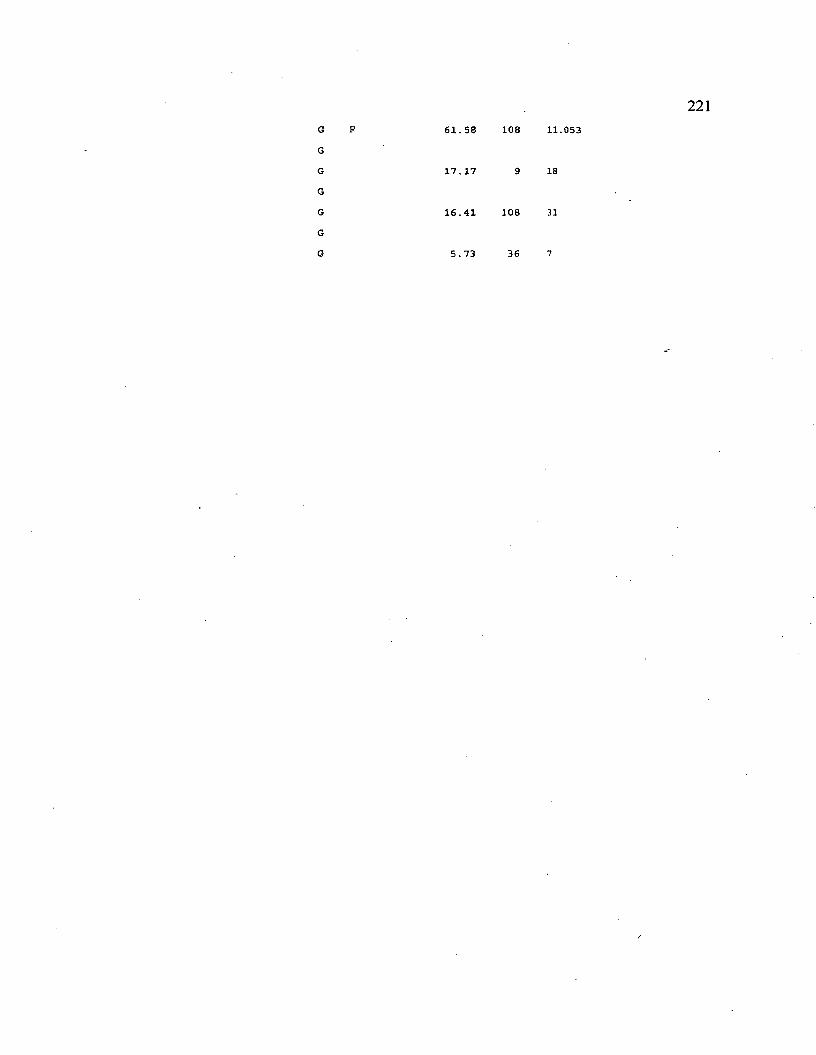
221G P
G
G
G
G
G
G
6 1 . 5 8 1 0 8 1 1 . 0 5 3
1 7 . 1 7 9 1 8
1 6 . 4 1 1 0 8 3 1
5 . 7 3 3 6 7
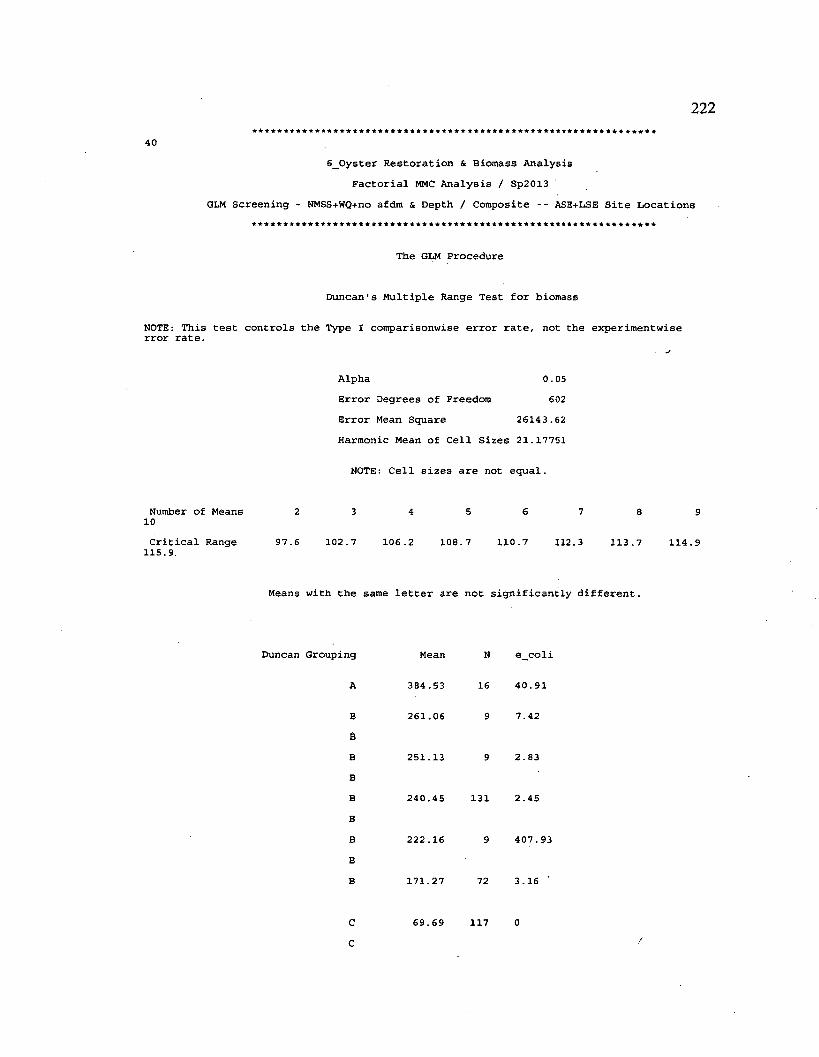
222
4 0
6 _ O y s t e r R e s t o r a t i o n & B i o m a s s A n a l y s i s
F a c t o r i a l MMC A n a l y s i s / S p 2 0 1 3
G L M S c r e e n i n g - N M S S + W Q + n o a f d m & D e p t h / C o m p o s i t e - - A S E + L S E S i t e L o c a t i o n s
T h e G L M P r o c e d u r e
D u n c a n ' s M u l t i p l e R a n g e T e s t f o r b i o m a s s
N O T E : T h i s t e s t c o n t r o l s t h e T y p e I c o m p a r i s o n w i s e e r r o r r a t e , n o t t h e e x p e r i m e n t w i s e r r o r r a t e .
A l p h a 0 . 0 5
E r r o r D e g r e e s o f F r e e d o m 6 0 2
E r r o r M e a n S q u a r e 2 6 1 4 3 . 6 2
H a r m o n i c M e a n o f C e l l S i z e s 2 1 . 1 7 7 5 1
N O T E : C e l l s i z e s a r e n o t e q u a l .
N u m b e r o f M e a n s 2 3 4 5 6 7 8 910
C r i t i c a l R a n g e 9 7 . 6 1 0 2 . 7 1 0 6 . 2 1 0 8 . 7 1 1 0 . 7 1 1 2 . 3 1 1 3 . 7 1 1 4 . 91 1 5 . 9 .
M e a n s w i t h t h e s a m e l e t t e r a r e n o t s i g n i f i c a n t l y d i f f e r e n t .
D u n c a n G r o u p i n g
A
B
B
B
B
B
B
B
B
B
C
C
M e a n N e _ c o l i
3 8 4 . 5 3 1 6 4 0 . 9 1
2 6 1 . 0 6 9 7 . 4 2
2 5 1 . 1 3 9 2 . 8 3
2 4 0 . 4 5 1 3 1 2 . 4 5
2 2 2 . 1 6 9 4 0 7 . 9 3
1 7 1 . 2 7 7 2 3 . 1 6 '
6 9 . 6 9 1 1 7 0
223. 6 1 . 5 8 1 0 8 8 . 4 5
C 1 6 . 4 1 1 0 8 7 . 3 5
C
C 5 . 7 3 3 6 2 1 . 8
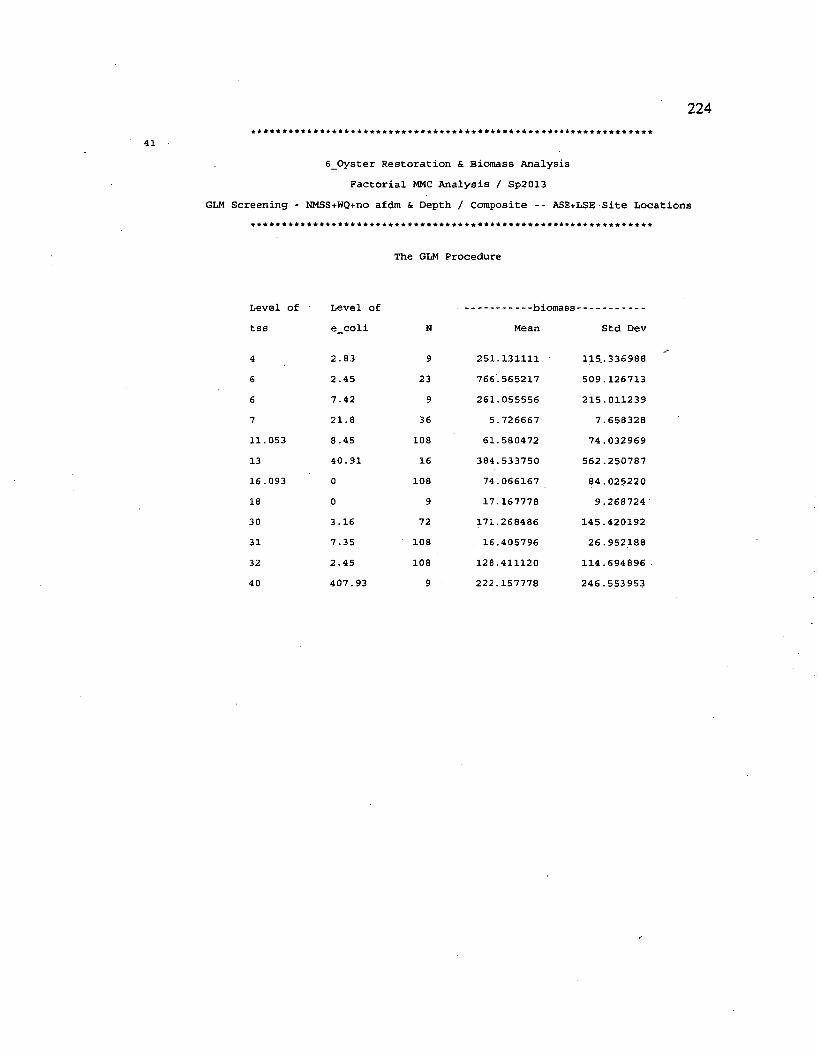
224
41
6 _ O y s t e r R e s t o r a t i o n & B i o m a s s A n a l y s i s
F a c t o r i a l MMC A n a l y s i s / S p 2 0 1 3
GL M S c r e e n i n g - N M S S + W Q + n o a f d m & D e p t h / C o m p o s i t e - - A S E + L S E - S i t e L o c a t i o n s
T h e G L M P r o c e d u r e
L e v e l o f
t s s
L e v e l o f
e c o l i N
b i o m a s s -
M e a n S t d D e v
4
6
6
7
1 1 . 0 5 3
1 3
1 6 . 0 9 3
1 8
3 0
3 1
3 2
4 0
2 . 8 3
2 . 4 5
7 . 4 2
2 1 . 8
8 . 4 5
4 0 . 9 1
0
0
3 . 1 6
7 . 3 5
2 . 4 5
4 0 7 . 9 3
9
2 3
9
3 6
1 0 8
1 6
1 0 8
9
7 2
1 0 8
1 0 8
9
2 5 1 . 1 3 1 1 1 1
7 6 6 . 5 6 5 2 1 7
2 6 1 . 0 5 5 5 5 6
5 . 7 2 6 6 6 7
6 1 . 5 8 0 4 7 2
3 8 4 . 5 3 3 7 5 0
7 4 . 0 6 6 1 6 7
1 7 . 1 6 7 7 7 8
1 7 1 . 2 6 8 4 8 6
1 6 . 4 0 5 7 9 6
1 2 8 . 4 1 1 1 2 0
2 2 2 . 1 5 7 7 7 8
1 1 5 . . 3 3 6 9 8 8
5 0 9 . 1 2 6 7 1 3
2 1 5 . 0 1 1 2 3 9
7 . 6 5 8 3 2 8
7 4 . 0 3 2 9 6 9
5 6 2 . 2 5 0 7 8 7
8 4 . 0 2 5 2 2 0
9 . 2 6 8 7 2 4
1 4 5 . 4 2 0 1 9 2
2 6 . 9 5 2 1 8 8
1 1 4 . 6 9 4 8 9 6
2 4 6 . 5 5 3 9 5 3
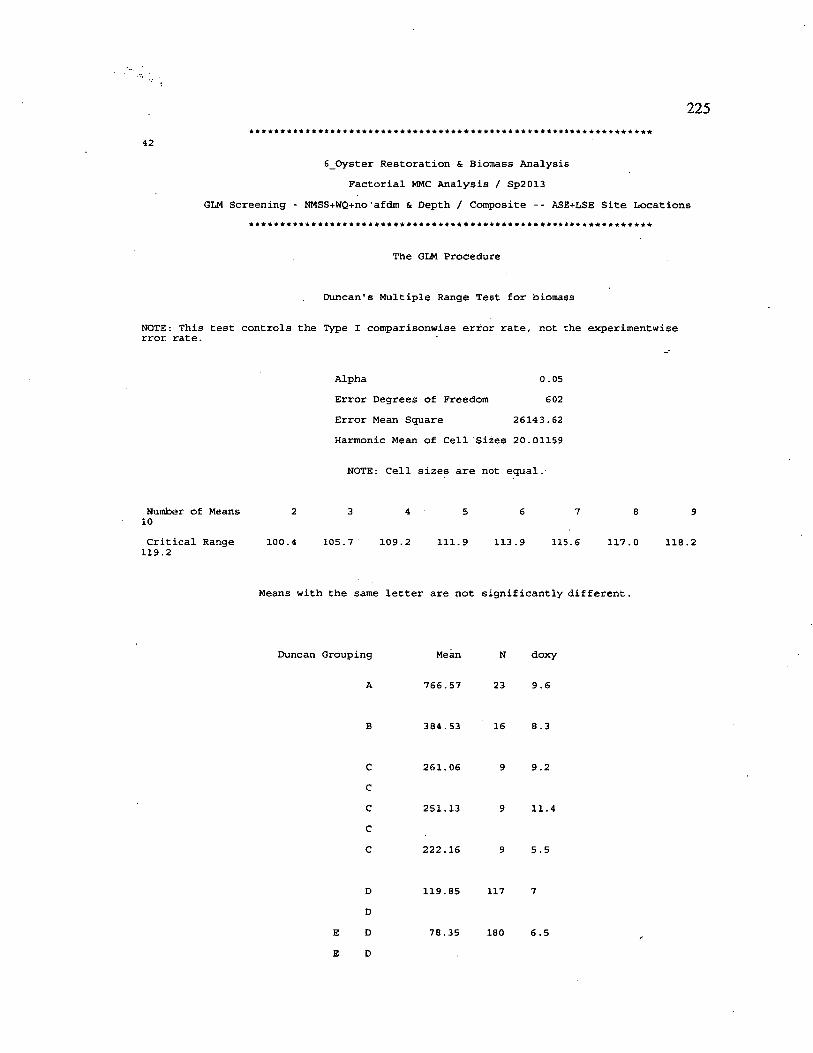
225
42
6 _ O y s t e r R e s t o r a t i o n & B i o m a s s A n a l y s i s
F a c t o r i a l MMC A n a l y s i s / S p 2 0 1 3
GLM S c r e e n i n g - N M S S + W Q + n o a f d m & D e p t h / C o m p o s i t e - - A S E + L S E S i t e L o c a t i o n s
T h e G L M P r o c e d u r e
D u n c a n ' s M u l t i p l e R a n g e T e s t f o r b i o m a s s
N O T E : T h i s t e s t c o n t r o l s t h e T y p e I c o m p a r i s o n w i s e e r r o r r a t e , n o t t h e e x p e r i m e n t w i s e r r o r r a t e .
N u m b e r o f M e a n s 10
A l p h a 0 . 0 5
E r r o r D e g r e e s o f F r e e d o m 6 0 2
E r r o r M e a n S q u a r e 2 6 1 4 3 . 6 2
H a r m o n i c M e a n o f C e l l S i z e s 2 0 . 0 1 1 5 9
N O T E : C e l l s i z e s a r e n o t e q u a l . -
C r i t i c a l R a n g e 1 0 0 . 4 1 0 5 . 7 1 0 9 . 2 1 1 1 . 9 1 1 3 . 9 1 1 5 . 6 1 1 7 . 0 1 1 8 . 21 1 9 . 2
M e a n s w i t h t h e s a m e l e t t e r a r e n o t s i g n i f i c a n t l y d i f f e r e n t .
D u n c a n G r o u p i n g M e a n N d o x y
7 6 6 . 5 7 2 3 9 . 6
3 8 4 . 5 3 1 6 8 . 3
2 6 1 . 0 6 9 9 . 2
2 5 1 . 1 3 9 1 1 . 4
2 2 2 . 1 6 9 5 . 5
D
D
D
D
1 1 9 . 8 5 1 1 7 7
7 8 . 3 5 180 6 . 5
226
E D 7 4 . 0 7 1 0 0 7 . 1 2
E D
E D 6 1 . 5 8 1 0 8 7 . 8
E
E 5 . 7 3 3 6 1 2
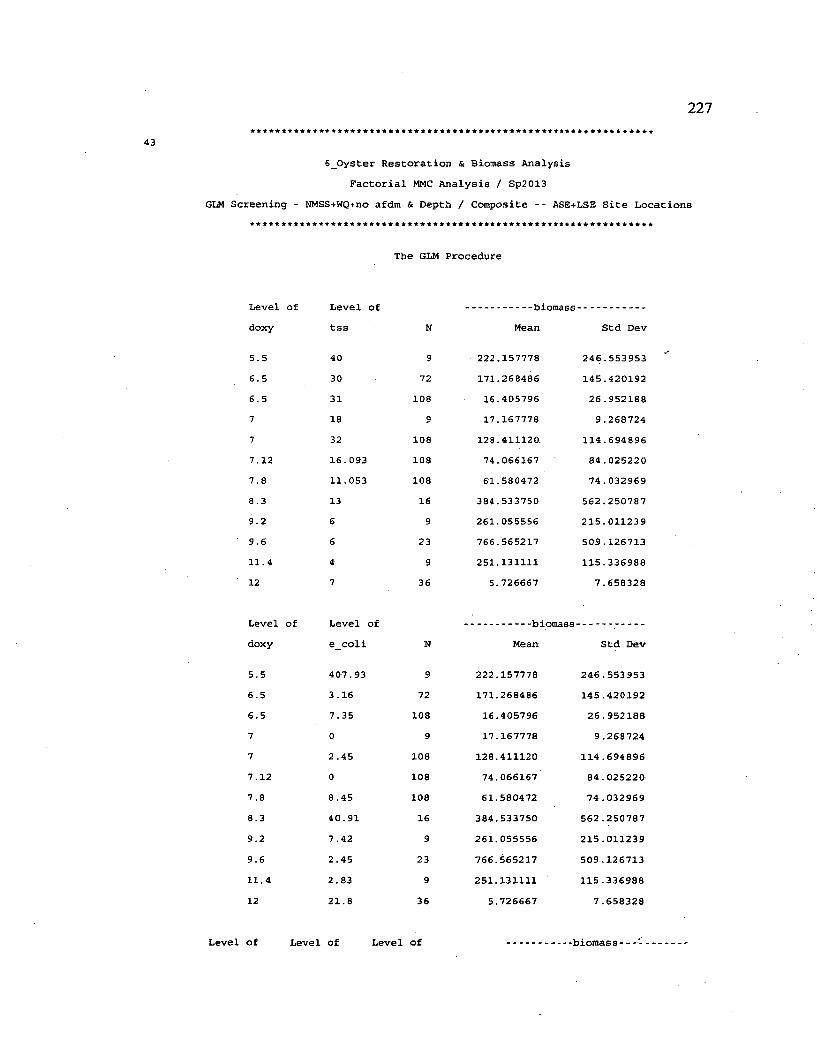
227
4 3
6 _ O y s t e r R e s t o r a t i o n & B i o m a s s A n a l y s i s
F a c t o r i a l MMC A n a l y s i s / S p 2 0 1 3
GLM S c r e e n i n g - N M S S + W Q + n o a f d m & D e p t h / C o m p o s i t e - - A S E + L S E S i t e L o c a t i o n s
T h e G L M P r o c e d u r e
L e v e l o f L e v e l o f --------------------------- b i o m a s s
d o x y t s s N M e a n S t d D e v
5 . 5 4 0 9 2 2 2 . 1 5 7 7 7 8 2 4 6 . 5 5 3 9 5 3
6 . 5 3 0 7 2 1 7 1 . 2 6 8 4 8 6 1 4 5 . 4 2 0 1 9 2
6 . 5 3 1 1 0 8 1 6 . 4 0 5 7 9 6 2 6 . 9 5 2 1 8 8
7 1 8 9 1 7 . 1 6 7 7 7 8 9 . 2 6 8 7 2 4
7 3 2 1 0 8 1 2 8 . 4 1 1 1 2 0 . 1 1 4 . 6 9 4 8 9 6
7 . 1 2 1 6 . 0 9 3 1 0 8 7 4 . 0 6 6 1 6 7 8 4 . 0 2 5 2 2 0
7 . 8 1 1 . 0 5 3 1 0 8 6 1 . 5 8 0 4 7 2 7 4 . 0 3 2 9 6 9
8 . 3 1 3 1 6 3 8 4 . 5 3 3 7 5 0 5 6 2 . 2 5 0 7 8 7
9 . 2 6 9 2 6 1 . 0 5 5 5 5 6 2 1 5 . 0 1 1 2 3 9
9 . 6 6 2 3 7 6 6 . 5 6 5 2 1 7 5 0 9 . 1 2 6 7 1 3
1 1 . 4 4 9 2 5 1 . 1 3 1 1 1 1 1 1 5 . 3 3 6 9 8 8
1 2 7 3 6 5 . 7 2 6 6 6 7 7 . 6 5 8 3 2 8
L e v e l o f L e v e l o f --------------------------- b i o m a s s -
d o x y e _ c o l i N M e a n S t d D e v
5 . 5 4 0 7 . 9 3 9 2 2 2 . 1 5 7 7 7 8 2 4 6 . 5 5 3 9 5 3
6 . 5 3 . 1 6 7 2 1 7 1 . 2 6 8 4 8 6 1 4 5 . 4 2 0 1 9 2
6 . 5 7 . 3 5 1 0 8 1 6 . 4 0 5 7 9 6 2 6 . 9 5 2 1 8 8
7 0 9 1 7 . 1 6 7 7 7 8 9 . 2 6 8 7 2 4
7 2 . 4 5 1 0 8 1 2 8 . 4 1 1 1 2 0 1 1 4 . 6 9 4 8 9 6
7 . 1 2 0 1 0 8 7 4 . 0 6 6 1 6 7 8 4 . 0 2 5 2 2 0
7 . 8 8 . 4 5 1 0 8 6 1 . 5 8 0 4 7 2 7 4 . 0 3 2 9 6 9
8 . 3 4 0 . 9 1 1 6 3 8 4 . 5 3 3 7 5 0 5 6 2 . 2 5 0 7 8 7
9 . 2 7 . 4 2 9 2 6 1 . 0 5 5 5 5 6 2 1 5 . 0 1 1 2 3 9
9 . 6 2 . 4 5 2 3 7 6 6 . 5 6 5 2 1 7 5 0 9 . 1 2 6 7 1 3
1 1 . 4 2 . 8 3 9 2 5 1 . 1 3 1 1 1 1 1 1 5 . 3 3 6 9 8 8
1 2 2 1 . 8 3 6 5 . 7 2 6 6 6 7 7 . 6 5 8 3 2 8
L e v e l o f L e v e l o f L e v e l o f b i o m a s s
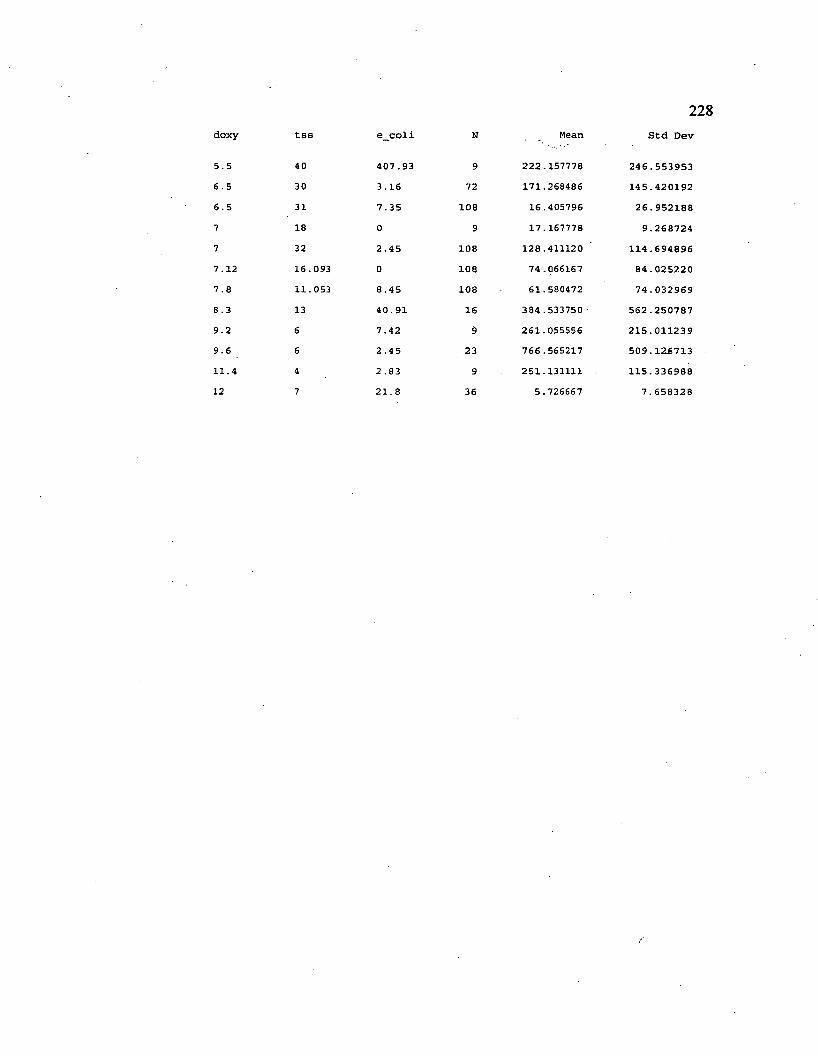
228d o x y t s s e c o l i N M e a n S t d D e v
5 . 5
6 . 5
6 . 5
7
7
7 . 1 2
7 . 8
8 . 3
9 . 2
9 . 6
1 1 . 4
12
4 0
3 0
3 1
1 8
3 2
1 6 . 0 9 3
1 1 . 0 5 3
1 3
6
6
4
7
4 0 7 . 9 3
3 . 1 6
7 . 3 5
0
2 . 4 5
0
8 . 4 5
4 0 . 9 1
7 . 4 2
2 . 4 5
2 . 8 3
21.8
9
7 2
1 0 8
9
1 0 8
1 0 8
1 0 8
1 6
9
2 3
9
3 6
2 2 2 . 1 5 7 7 7 8
1 7 1 . 2 6 8 4 8 6
1 6 . 4 0 5 7 9 6
1 7 . 1 6 7 7 7 8
1 2 8 . 4 1 1 1 2 0
7 4 . 0 6 6 1 6 7
6 1 . 5 8 0 4 7 2
3 8 4 . 5 3 3 7 5 0
2 6 1 . 0 5 5 5 5 6
7 6 6 . 5 6 5 2 1 7
2 5 1 . 1 3 1 1 1 1
5 . 7 2 6 6 6 7
2 4 6 .
1 4 5 .
2 6 .
9 .
1 1 4 .
8 4 .
7 4 .
5 6 2 .
2 1 5 .
5 0 9 .
1 1 5 .
7 .
5 5 3 9 5 3
4 2 0 1 9 2
9 5 2 1 8 8
2 6 8 7 2 4
6 9 4 8 9 6
0 2 5 2 2 0
0 3 2 9 6 9
2 5 0 7 8 7
0 1 1 2 3 9
1 2 6 7 1 3
3 3 6 9 8 8
6 5 8 3 2 8
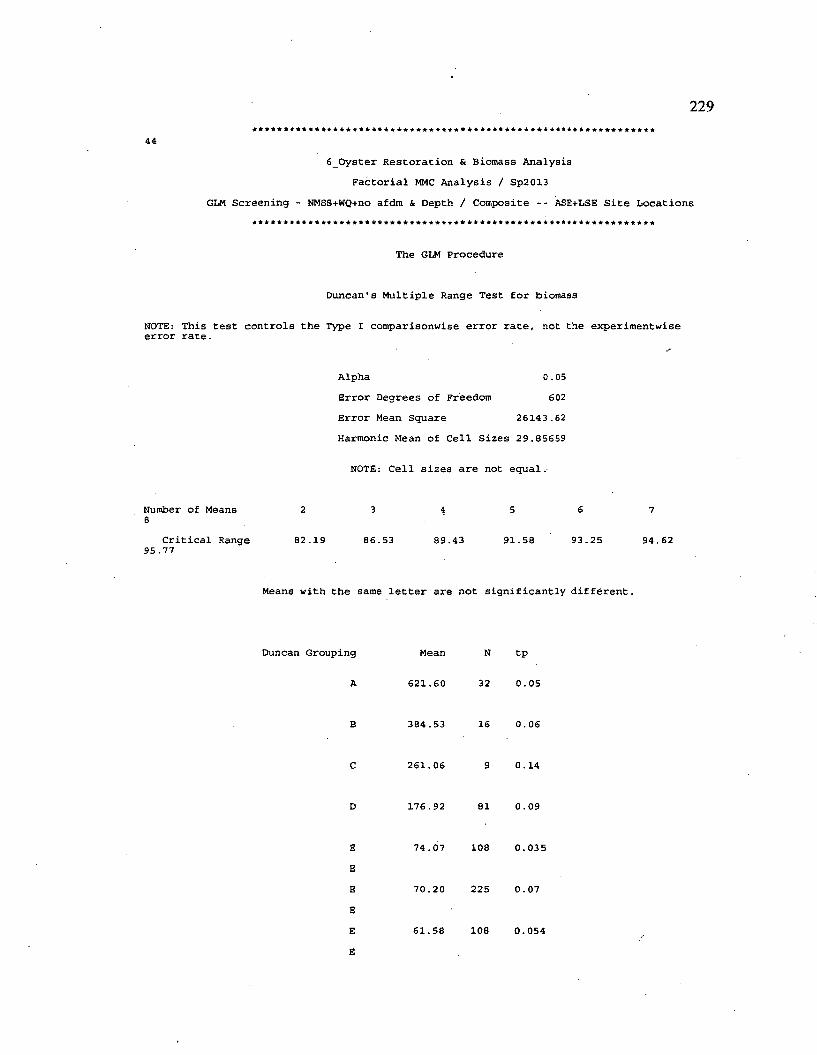
229
44
6 _ O y s t e r R e s t o r a t i o n & B i o m a s s A n a l y s i s
F a c t o r i a l MMC A n a l y s i s / S p 2 0 1 3
GL M S c r e e n i n g - N M S S + W Q + n o a f d m & D e p t h / C o m p o s i t e - - A S E + L S E S i t e L o c a t i o n s
T h e G L M P r o c e d u r e
D u n c a n ' s M u l t i p l e R a n g e T e s t f o r b i o m a s s
N O T E : T h i s t e s t c o n t r o l s t h e T y p e I c o m p a r i s o n w i s e e r r o r r a t e , n o t t h e e x p e r i m e n t w i s e e r r o r r a t e .
A l p h a 0 . 0 5
E r r o r D e g r e e s o f F r e e d o m 6 0 2
E r r o r M e a n S q u a r e 2 6 1 4 3 . 6 2
H a r m o n i c M e a n o f C e l l S i z e s 2 9 . 8 5 6 5 9
N O T E : C e l l s i z e s a r e n o t e q u a l .
N u m b e r o f M e a n s a
C r i t i c a l R a n g e 9 5 . 7 7
8 2 . 1 9 8 6 . 5 3 8 9 . 4 3
5
9 1 . 5 8 9 3 . 2 5 9 4 . 6 2
M e a n s w i t h t h e s a m e l e t t e r a r e n o t s i g n i f i c a n t l y d i f f e r e n t .
D u n c a n G r o u p i n g M e a n N t p
6 2 1 . 6 0 3 2 0 . 0 5
3 8 4 . 5 3 1 6 0 . 0 6
2 6 1 . 0 6 9 0 . 1 4
1 7 6 . 9 2 8 1 0 . 0 9
E
E
E
E
E
E
7 4 . 0 7 1 0 8 0 . 0 3 5
7 0 . 2 0 2 2 5 0 . 0 7
6 1 . 5 8 1 0 8 0 . 0 5 4
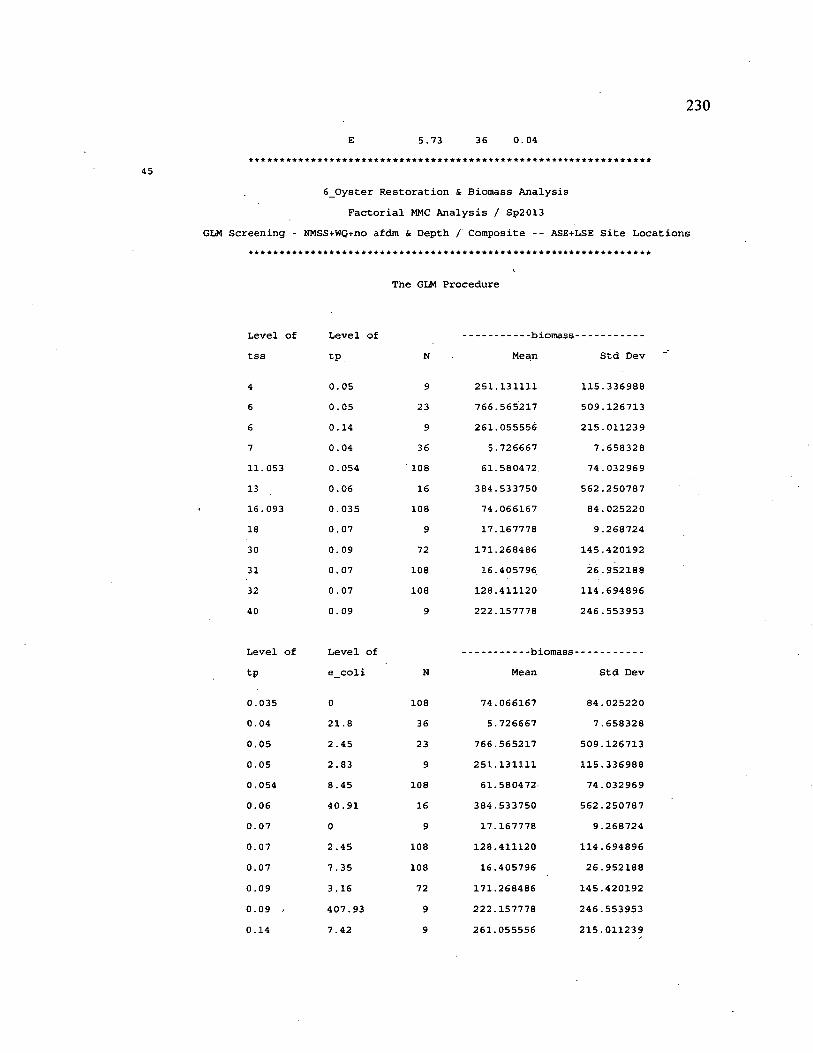
230
E 5 . 7 3 3 6 0 . 0 4
45
6 _ O y s t e r R e s t o r a t i o n & B i o m a s s A n a l y s i s
F a c t o r i a l MMC A n a l y s i s / S p 2 0 1 3
GL M S c r e e n i n g - N M S S + W Q + n o a f d m & D e p t h / C o m p o s i t e - - A S E + L S E S i t e L o c a t i o n s
T h e G L M P r o c e d u r e
L e v e l o f L e v e l o f ----------------------------b i o m a s s
t s s t p N M e a n S t d D e v
4 0 . 0 5 9 2 5 1 . 1 3 1 1 1 1 1 1 5 . 3 3 6 9 8 8
6 0 . 0 5 2 3 7 6 6 . 5 6 5 2 1 7 5 0 9 . 1 2 6 7 1 3
6 0 . 1 4 9 2 6 1 . 0 5 5 5 5 6 2 1 5 . 0 1 1 2 3 9
7 0 . 0 4 3 6 5 . 7 2 6 6 6 7 7 . 6 5 8 3 2 8
1 1 . 0 5 3 0 . 0 5 4 1 0 8 6 1 . 5 8 0 4 7 2 . 7 4 . 0 3 2 9 6 9
1 3 0 . 0 6 1 6 3 8 4 . 5 3 3 7 5 0 5 6 2 . 2 5 0 7 8 7
1 6 . 0 9 3 0 . 0 3 5 1 0 8 7 4 . 0 6 6 1 6 7 8 4 . 0 2 5 2 2 0
1 8 0 . 0 7 9 1 7 . 1 6 7 7 7 8 9 . 2 6 8 7 2 4
3 0 0 . 0 9 7 2 1 7 1 . 2 6 8 4 8 6 1 4 5 . 4 2 0 1 9 2
3 1 0 . 0 7 1 0 8 1 6 . 4 0 5 7 9 6 2 6 . 9 5 2 1 8 8
3 2 0 . 0 7 1 0 8 1 2 8 . 4 1 1 1 2 0 1 1 4 . 6 9 4 8 9 6
4 0 0 . 0 9 9 2 2 2 . 1 5 7 7 7 8 2 4 6 . 5 5 3 9 5 3
L e v e l o f
t p
L e v e l o f
e _ c o l i N
----------------------------b i o m a s s -
M e a n S t d D e v
0 . 0 3 5 0 1 0 8 7 4 . 0 6 6 1 6 7 8 4 . 0 2 5 2 2 0
0 . 0 4 2 1 . 8 3 6 5 . 7 2 6 6 6 7 7 . 6 5 8 3 2 8
0 . 0 5 2 . 4 5 2 3 7 6 6 . 5 6 5 2 1 7 5 0 9 . 1 2 6 7 1 3
0 . 0 5 2 . 8 3 9 2 5 1 . 1 3 1 1 1 1 1 1 5 . 3 3 6 9 8 8
0 . 0 5 4 8 . 4 5 1 0 8 6 1 . 5 8 0 4 7 2 7 4 . 0 3 2 9 6 9
0 . 0 6 4 0 . 9 1 1 6 3 8 4 . 5 3 3 7 5 0 5 6 2 . 2 5 0 7 8 7
0 . 0 7 0 9 1 7 . 1 6 7 7 7 8 9 . 2 6 8 7 2 4
0 . 0 7 2 . 4 5 1 0 8 1 2 8 . 4 1 1 1 2 0 1 1 4 . 6 9 4 8 9 6
0 . 0 7 7 . 3 5 1 0 8 1 6 . 4 0 5 7 9 6 2 6 . 9 5 2 1 8 8
0 . 0 9 3 , 1 6 7 2 1 7 1 . 2 6 8 4 8 6 1 4 5 . 4 2 0 1 9 2
0 . 0 9 - 4 0 7 . 9 3 9 2 2 2 . 1 5 7 7 7 8 2 4 6 . 5 5 3 9 5 3
0 . 1 4 7 . 4 2 9 2 6 1 . 0 5 5 5 5 6 2 1 5 . 0 1 1 2 3 9
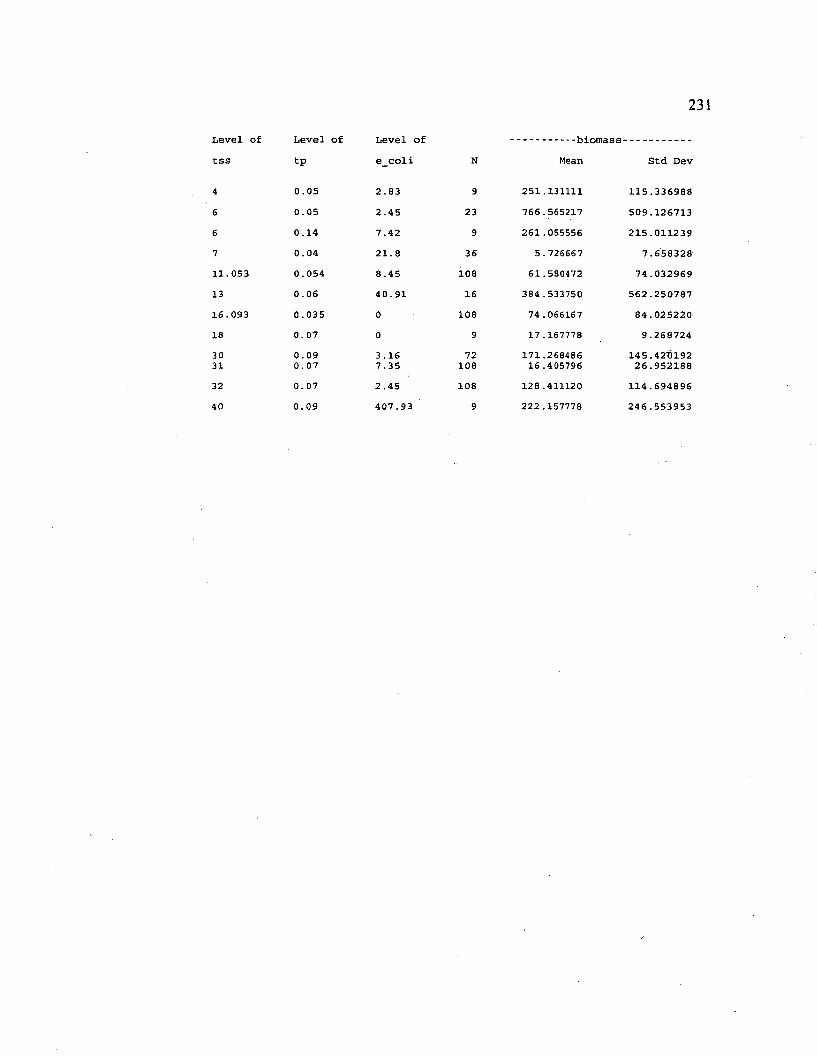
231
L e v e l o f
t s s
L e v e l o f
t p
L e v e l o f
e c o l i
b i o m a s s -
M e a n S t d D e v
4 0 . 0 5 2 . 8 3 9 2 5 1 . 1 3 1 1 1 1 1 1 5 . 3 3 6 9 8 8
e 0 . 0 5 2 . 4 5 2 3 7 6 6 . 5 6 5 2 1 7 5 0 9 . 1 2 6 7 1 3
6 0 . 1 4 7 . 4 2 9 2 6 1 . 0 5 5 5 5 6 2 1 5 . 0 1 1 2 3 9
7 0 . 0 4 2 1 . 8 3 6 5 . 7 2 6 6 6 7 7 . 6 5 8 3 2 8
1 1 . 0 5 3 0 . 0 5 4 8 . 4 5 1 0 8 6 1 . 5 8 0 4 7 2 7 4 . 0 3 2 9 6 9
1 3 0 . 0 6 4 0 . 9 1 1 6 3 8 4 . 5 3 3 7 5 0 5 6 2 . 2 5 0 7 8 7
1 6 . 0 9 3 0 . 0 3 5 0 1 0 8 7 4 . 0 6 6 1 6 7 8 4 . 0 2 5 2 2 0
1 8 O'. 0 7 0 9 1 7 . 1 6 7 7 7 8 9 1 2 6 8 7 2 4
3 0 0 . 0 9 3 . 1 6 7 2 1 7 1 . 2 6 8 4 8 6 1 4 5 . 4 2 - 0 1 9 23 1 0 . 0 7 7 . 3 5 1 0 8 1 6 . 4 0 5 7 9 6 2 6 . 9 5 2 1 8 8
3 2 0 . 0 7 2 . 4 5 1 0 8 1 2 8 . 4 1 1 1 2 0 1 1 4 . 6 9 4 8 9 6
4 0 0 . 0 9 4 0 7 . 9 3 9 2 2 2 . 1 5 7 7 7 8 2 4 6 . 5 5 3 9 5 3
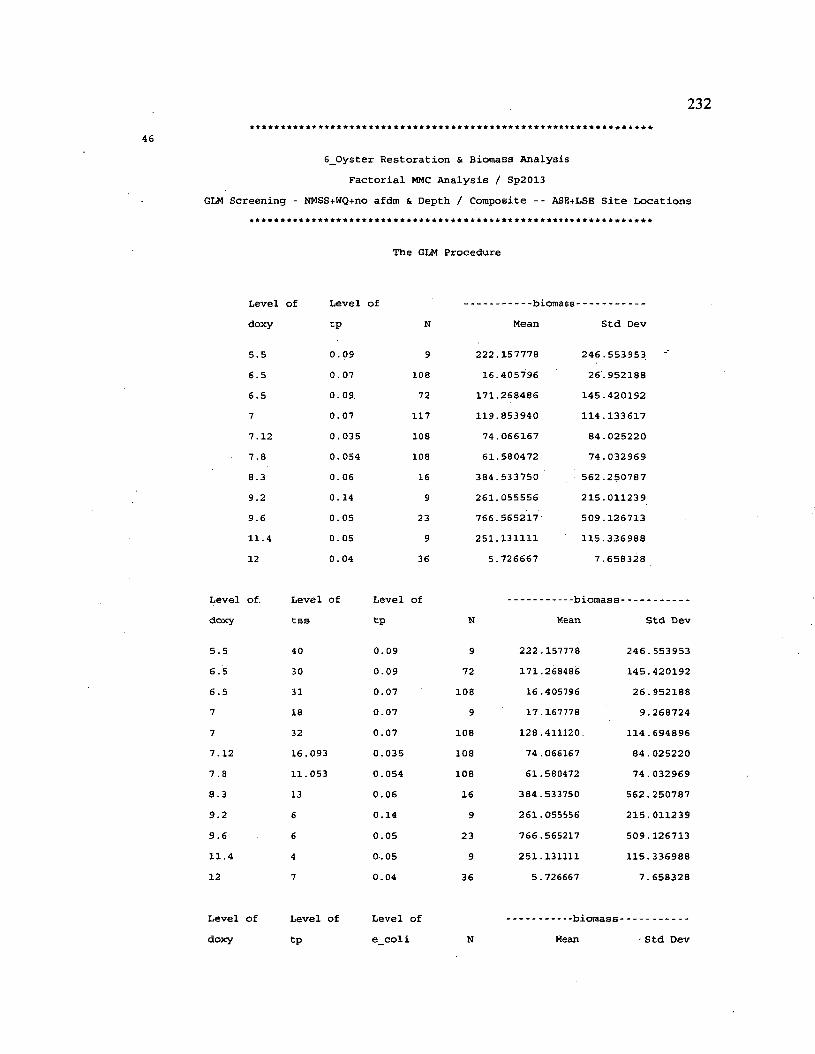
232
6 _ O y s t e r R e s t o r a t i o n & B i o m a s s A n a l y s i s
F a c t o r i a l MMC A n a l y s i s / S p 2 0 1 3
G L M S c r e e n i n g - N M S S + W Q + n o a f d m & D e p t h / C o m p o s i t e - - A S E + L S E S i t e L o c a t i o n s
T h e GL M P r o c e d u r e
L e v e l o f L e v e l o f ----------------------------b i o m a s s
d o x y t p N M e a n S t d D e v
5 . 5 0 . 0 9 9 2 2 2 . 1 5 7 7 7 8 2 4 6 . 5 5 3 9 5 3
6 . 5 0 . 0 7 1 0 8 1 6 . 4 0 5 7 9 6 2 6 . 9 5 2 1 8 8
6 . 5 0 . 0 9 7 2 1 7 1 . 2 6 8 4 8 6 1 4 5 . 4 2 0 1 9 2
7 0 . 0 7 1 1 7 1 1 9 . 8 5 3 9 4 0 1 1 4 . 1 3 3 6 1 7
7 . 1 2 0 . 0 3 5 1 0 8 7 4 . 0 6 6 1 6 7 8 4 . 0 2 5 2 2 0
7 . 8 0 . 0 5 4 1 0 8 6 1 . 5 8 0 4 7 2 7 4 . 0 3 2 9 6 9
8 . 3 0 . 0 6 1 6 3 8 4 . 5 3 3 7 5 0 5 6 2 . 2 5 0 7 8 7
9 . 2 0 . 1 4 9 2 6 1 . 0 5 5 5 5 6 2 1 5 . 0 1 1 2 3 9
9 . 6 0 . 0 5 2 3 7 6 6 . 5 6 5 2 1 7 5 0 9 . 1 2 6 7 1 3
1 1 . 4 0 . 0 5 9 2 5 1 . 1 3 1 1 1 1 1 1 5 . 3 3 6 9 8 8
1 2 0 . 0 4 3 6 5 . 7 2 6 6 6 7 7 . 6 5 8 3 2 8
o f . L e v e l o f L e v e l o f ---------------------------b i o m a s s -------------
d o x y t s s t p N M e a n S t d D e v
5 . 5 4 0 0 . 0 9 9 2 2 2 . 1 5 7 7 7 8 2 4 6 . 5 5 3 9 5 3
6 . 5 3 0 0 . 0 9 7 2 1 7 1 . 2 6 8 4 8 6 1 4 5 . 4 2 0 1 9 2
6 . 5 3 1 0 . 0 7 1 0 8 1 6 . 4 0 5 7 9 6 2 6 . 9 5 2 1 8 8
7 1 8 0 . 0 7 9 1 7 . 1 6 7 7 7 8 9 . 2 6 8 7 2 4
7 3 2 0 . 0 7 1 0 8 1 2 8 . 4 1 1 1 2 0 . 1 1 4 . 6 9 4 8 9 6
7 . 1 2 1 6 . 0 9 3 0 . 0 3 5 1 0 8 7 4 . 0 6 6 1 6 7 8 4 . 0 2 5 2 2 0
7 . 8 1 1 . 0 5 3 0 . 0 5 4 1 0 8 6 1 . 5 8 0 4 7 2 7 4 . 0 3 2 9 6 9
8 . 3 1 3 0 . 0 6 1 6 3 8 4 . 5 3 3 7 5 0 5 6 2 . 2 5 0 7 8 7
9 . 2 6 0 . 1 4 9 2 6 1 . 0 5 5 5 5 6 2 1 5 . 0 1 1 2 3 9
9 . 6 6 0 . 0 5 2 3 7 6 6 . 5 6 5 2 1 7 5 0 9 . 1 2 6 7 1 3
1 1 . 4 4 0 . 0 5 9 2 5 1 . 1 3 1 1 1 1 1 1 5 . 3 3 6 9 8 8
1 2 7 0 . 0 4 3 6 5 . 7 2 6 6 6 7 7 . 6 5 8 3 2 8
L e v e l o f
d o x y
L e v e l o f
t p
L e v e l o f
e _ c o l i N
---------------------------b i o m a s s -
M e a n ' S t d D e v
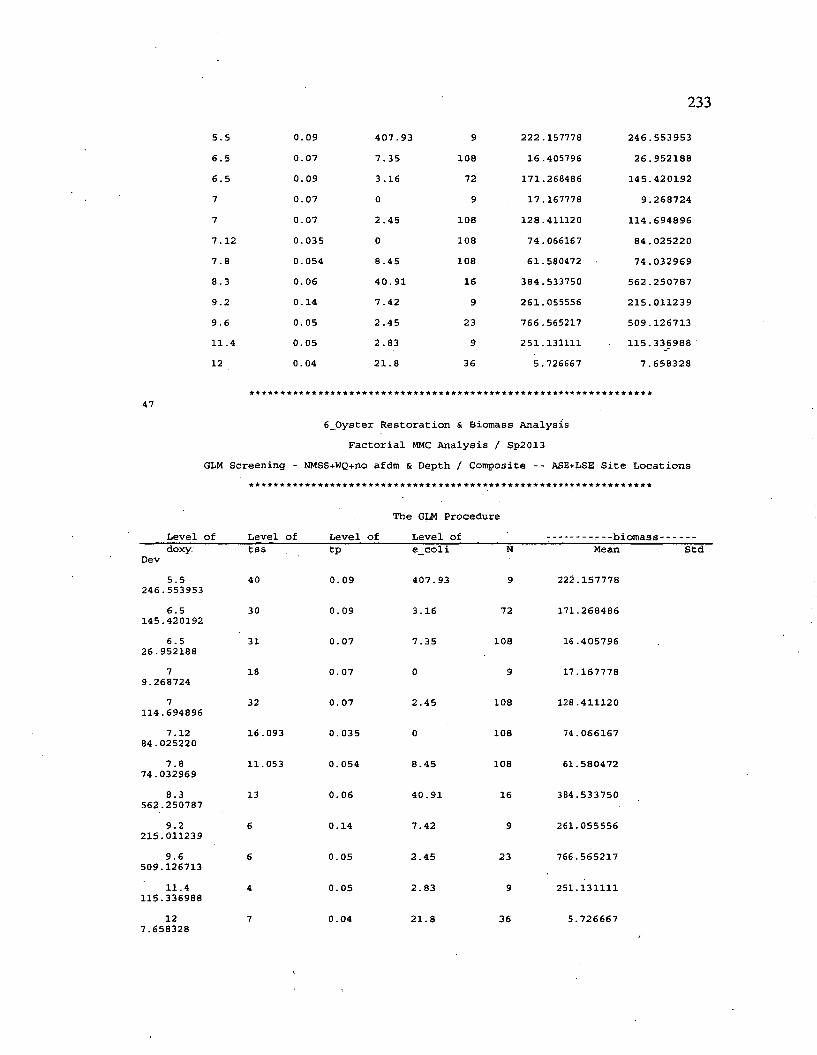
233
5 . 5 0 . 0 9 4 0 7 . 9 3 9 2 2 2 . 1 5 7 7 7 8 2 4 6 . 5 5 3 9 5 3
6 . 5 0 . 0 7 7 . 3 5 1 0 8 1 6 . 4 0 5 7 9 6 2 6 . 9 5 2 1 8 8
6 . 5 0 . 0 9 3 . 1 6 7 2 1 7 1 . 2 6 8 4 8 6 1 4 5 . 4 2 0 1 9 2
7 0 . 0 7 0 9 1 7 . 1 6 7 7 7 8 9 . 2 6 8 7 2 4
7 0 . 0 7 2 . 4 5 1 0 8 1 2 8 . 4 1 1 1 2 0 1 1 4 . 6 9 4 8 9 6
7 . 1 2 0 . 0 3 5 0 1 0 8 7 4 . 0 6 6 1 6 7 8 4 . 0 2 5 2 2 0
7 . 8 0 . 0 5 4 8 . 4 5 1 0 8 6 1 . 5 8 0 4 7 2 7 4 . 0 3 2 9 6 9
8 . 3 0 . 0 6 4 0 . 9 1 1 6 3 8 4 . 5 3 3 7 5 0 5 6 2 . 2 5 0 7 8 7
9 . 2 0 . 1 4 7 . 4 2 9 2 6 1 . 0 5 5 5 5 6 2 1 5 . 0 1 1 2 3 9
9 . 6 0 . 0 5 2 . 4 5 2 3 7 6 6 . 5 6 5 2 1 7 5 0 9 . 1 2 6 7 1 3
1 1 . 4 0 . 0 5 2 . 8 3 9 2 5 1 . 1 3 1 1 1 1 1 1 5 . 3 3 6 9 8 8
1 2 0 . 0 4 2 1 . 8 3 6 5 . 7 2 6 6 6 7 7 . 6 5 8 3 2 8
476 _ 0 y s t e r R e s t o r a t i o n & B i o m a s s A n a l y s i s
F a c t o r i a l MMC A n a l y s i s / S p 2 0 1 3
GLM S c r e e n i n g - N M S S + W Q + n o a f d m & D e p t h / C o m p o s i t e - - A S E + L S E S i t e L o c a t i o n s
T h e GL M P r o c e d u r e
L e v e l o f ________ L e v e l o f ________ L e v e l o f _________L e v e l o f -------------------'--------------- b i o m a s s ---------------
d o x y . t s s t p e _ c o l i N M e a n S t dD e v
5 . 5 4 0 0 . 0 9 4 0 7 . 9 3 9 2 2 2 . 1 5 7 7 7 82 4 6 . 5 5 3 9 5 3
6 . 5 3 0 0 . 0 9 3 . 1 6 7 2 1 7 1 . 2 6 8 4 8 61 4 5 . 4 2 0 1 9 2
6 . 5 3 1 0 . 0 7 7 . 3 5 1 0 8 1 6 . 4 0 5 7 9 62 6 . 9 5 2 1 8 8
7 1 8 0 . 0 7 0 9 1 7 . 1 6 7 7 7 89 . 2 6 8 7 2 4
7 3 2 0 . 0 7 2 . 4 5 1 0 8 1 2 8 . 4 1 1 1 2 01 1 4 . 6 9 4 8 9 6
7 . 1 2 1 6 . 0 9 3 0 . 0 3 5 0 1 0 8 7 4 . 0 6 6 1 6 78 4 . 0 2 5 2 2 0
7 . 8 1 1 . 0 5 3 0 . 0 5 4 8 . 4 5 1 0 8 6 1 . 5 8 0 4 7 27 4 . 0 3 2 9 6 9
8 . 3 1 3 0 . 0 6 4 0 . 9 1 1 6 3 8 4 . 5 3 3 7 5 05 6 2 . 2 5 0 7 8 7
9 . 2 6 0 . 1 4 7 . 4 2 9 2 6 1 . 0 5 5 5 5 62 1 5 . 0 1 1 2 3 9
9 . 6 6 0 . 0 5 2 . 4 5 2 3 7 6 6 . 5 6 5 2 1 75 0 9 . 1 2 6 7 1 3
1 1 . 4 4 0 . 0 5 2 . 8 3 9 2 5 1 . 1 3 1 1 1 11 1 5 . 3 3 6 9 8 8
1 2 7 0 . 0 4 2 1 . 8 3 6 5 . 7 2 6 6 6 77 . 6 5 8 3 2 8
VITA
STEPHANIE ROBERTS LONG
Stephanie was bom in Richmond, Virginia on
September 5, 1951. She was raised in Richmond and graduated
from Thomas Jefferson High School in 1969. Stephanie studied
biology and math as an undergraduate at Westhampton College,
University of Richmond and graduated with a B.S. in Biology and
Math in May, 1973. Stephanie began a graduate program in
Biological Oceanography at Old Dominion University in the 80’s.
Her job relocated her to Richmond and she moved back to the
Tidewater area in 2004 and began taking some classes at VIMS
in 2006. She transferred back to ODU in the fall of 2009 to the
Environmental Engineering program.