european credit transfer and accumulation system: an alternative way to calculate the ects grades
TRANSCRIPT
This article was downloaded by:[Thomas, Grosges]On: 12 February 2008Access Details: [subscription number 790555238]Publisher: RoutledgeInforma Ltd Registered in England and Wales Registered Number: 1072954Registered office: Mortimer House, 37-41 Mortimer Street, London W1T 3JH, UK
Higher Education in EuropePublication details, including instructions for authors and subscription information:http://www.informaworld.com/smpp/title~content=t713423578
European Credit Transfer and Accumulation System: AnAlternative Way to Calculate the ECTS GradesThomas Grosges; Dominique Barchiesi
Online Publication Date: 01 October 2007To cite this Article: Grosges, Thomas and Barchiesi, Dominique (2007) 'EuropeanCredit Transfer and Accumulation System: An Alternative Way to Calculate theECTS Grades ', Higher Education in Europe, 32:2, 213 - 227To link to this article: DOI: 10.1080/03797720701840807URL: http://dx.doi.org/10.1080/03797720701840807
PLEASE SCROLL DOWN FOR ARTICLE
Full terms and conditions of use: http://www.informaworld.com/terms-and-conditions-of-access.pdf
This article maybe used for research, teaching and private study purposes. Any substantial or systematic reproduction,re-distribution, re-selling, loan or sub-licensing, systematic supply or distribution in any form to anyone is expresslyforbidden.
The publisher does not give any warranty express or implied or make any representation that the contents will becomplete or accurate or up to date. The accuracy of any instructions, formulae and drug doses should beindependently verified with primary sources. The publisher shall not be liable for any loss, actions, claims, proceedings,demand or costs or damages whatsoever or howsoever caused arising directly or indirectly in connection with orarising out of the use of this material.
Dow
nloa
ded
By:
[Tho
mas
, Gro
sges
] At:
11:3
3 12
Feb
ruar
y 20
08
European Credit Transfer and Accumulation System:
An Alternative Way to Calculate the ECTS Grades1
THOMAS GROSGES and DOMINIQUE BARCHIESI
The European Credit Transfer and Accumulation System (ECTS) has been developed andinstituted to facilitate student mobility and academic recognition. This paper presents, discuss,and illustrates the pertinence and the limitation of the current statistical distribution of theECTS grades, and we propose an alternative way to calculate the ECTS grades attribution inorder to improve the ECTS system.
Introduction
Europe is currently immersed in potent sociocultural changes that will have futureimpact on important areas such as education, organization, and cultural integration.
This process of integration, or convergence, must take into account the diverse andcomplex cultural realities of the different European countries, especially in the field ofeducation mobility and recognition. Therefore, the challenge has been to develop an
adapted credit system for higher education. The Bologna Declaration (19 June 1999),signed by education ministers, stated their willingness to coordinate policies in order to
achieve the following objectives:
- Adoption of a system of easily readable and comparable degrees;
- Adoption of a system based on two main cycles: undergraduates and graduates;
- Establishment of a system of credits promoting student mobility;
- Promotion of European cooperation in higher education, integrated programs ofstudy, training, and research (Bologna Declaration, 1999).
Despite some criticisms and questions concerning the possible emergence of a new
centralized European Higher Education bureaucracy and the commodification ofhigher education (Amaral and Magalhaes, 2004), the adoption of a system of credits
promoting student mobility became a reality. This credit system provides a systematicway of organising a credit transfer associated to each component of an educationalprogram. Thus, the European Credit Transfer and Accumulation System (ECTS) was
introduced in 1989, within the framework of Erasmus, now part of the Socratesprogram (European Commission, 2006).
An evaluative analysis (European Commission, 2006) is presented in the followingparagraph. The ECTS system is a ‘‘system based on the student workload required to
achieve the objectives of a program, objectives preferably specified in terms of thelearning outcomes and the competences to be acquired’’; i.e., the evaluation is achieved
at the end of a learning period for which outcomes and competences are defined
1 The authors extend their gratitude to C. Buret for the English language assistance and the Department ofEducational Pedagogy for its financial support.
Higher Education in Europe, Vol. 32, No. 2/3, July–October 2007
ISSN 0379-7724 print/ISSN 1469-8358 online/07/02/30213-15 # 2007 UNESCO
DOI: 10.1080/03797720701840807
Dow
nloa
ded
By:
[Tho
mas
, Gro
sges
] At:
11:3
3 12
Feb
ruar
y 20
08
beforehand. In addition, the student is assessed independently of the student group(study program, university, country) so that their results can be transferred to othereducational systems or countries (Bryan and Clegg, 2006). Finally, such an evaluationsystem must be independent of the evaluation itself (its efficiency can change from oneyear to the next). However, the ECTS grade attribution must be accompanied by:
- the Regular Information Package/Course Catalog, which contains the informationfor potential students, for example Erasmus students;
- the Learning Agreement, containing the list of courses to be taken, with the ECTScredits for each course;
- the Transcript of Records, documenting the performance of a student by showingthe list of courses taken, the ECTS credits gained, local or national credits, if any,local grades and, possibly, ECTS grades awarded.
Transparent and consistent credit transfer procedures are essential if EU universitiesare to successfully build the European Higher Education area and thrive in the emergingglobal knowledge economy. Currently, the European Credit Transfer System is the mostwidely used mechanism to enable credit transfer between universities in different EUnations. The alignment of ECTS grades varies within nation states and, despite the factthat ECTS grading is a norm-referenced system, while national systems are usuallycriterion-referenced, the ECTS conversion tables provided by universities indicatestraight line transference from institutional to ECTS grades (Karran, 2004, 2005).
Currently, ECTS is ‘‘the only credit system which has been successfully tested andused across Europe and was set up initially for credit transfer. The system facilitatedthe recognition of periods of study abroad and thus enhanced the quality and volumeof student mobility in Europe’’ (European Commission, 2006). This system is the onlyone to be tested and developed on a large scale and it seems to be efficient thanks to itssimple ab initio rules. The ECTS makes study programs easy to read and compare forall students, local and foreign. It facilitates mobility and academic recognition, helpsuniversities to organize and revise their study programs, and can be used across avariety of programs and modes of delivery. Moreover ECTS makes European highereducation more attractive for students from abroad. Indeed, the performance of thestudent is documented by a local/national grade and it is good practice to add an ECTSgrade, particularly in the case of credit transfer. This ECTS grading scale ranks thestudents on a statistical basis. Therefore, statistical data on student performance are aprerequisite for applying the ECTS grading system. In order to have pertinentstatistical data on students, a large number of students is required (typically at leastforty or more) as well as an evaluation scheme based on objective criteria.Consequently, it seems obvious that ECTS is not adapted to evaluate personalprojects at the end of a student’s university career, each pre-professional situationbeing different. In addition, no objective criteria of evaluation have been established. Amore complete discussion on the statistical basis of the current ECTS gradedistribution will be discussed in the next section. From this statistical basis, gradesare assigned among students with pass mark as follows:
- A best ten percent, relative frequency(A)50.10
- B next twenty-five percent, relative frequency(B)50.25
- C next thirty percent, relative frequency(C)50.30
- D next twenty-five percent, relative frequency(D)50.25
- E next ten percent, relative frequency(E)50.10
214 T. GROSGES AND D. BARCHIESI
Dow
nloa
ded
By:
[Tho
mas
, Gro
sges
] At:
11:3
3 12
Feb
ruar
y 20
08
This study uses the term relative frequency for the ratio in per cent in the testedpopulations. The grades FX and F are assigned to students who fail the evaluation.According to this scheme, only students with a pass grade (E to A) are included in thestatistical data.
This study shows that this statistical restriction causes a first problem, the secondone being the fixed relative populations in each band (E to A). This induces anevaluation scheme which is not criterion-referenced but based on a student’s levelwithin a given group. The evaluation of the student would only take into account theevolution of the student’s competences during their education (e.g., by comparing theirresults for the resolution of a typical problem at the beginning and at the end of theirstudies). It should be emphasised that the ECTS grade is delivered at the end of a degreeand it measures if the objectives of a program have been achieved and the requiredcompetences acquired. Consequently, it cannot be used as formative examinations orcontinual assessment (for which the examination is also a tool to improve theperformance of the students) (Merieux, 2003; Demangel, 2003; Bryan and Clegg, 2006).
In the first section of this paper, the pertinence and the influence of the rule of thecurrent ECTS grade distribution will be discussed. It consists in fixing a priori therelative populations for each pass grade (E–A). The second section will consider theresults of the evaluation of a given course and will suggest an improved way ofcalculating the ECTS grades which reproduces realistic experimental evaluations.
Hypothesis of the Current ECTS grade Distribution
In the current ECTS grade, the attribution of pass grades to students who have passedthe planned summative evaluations (Wikstrom, 2005) consists in fixing a ratio ofstudents for each letter (A to E grades). Why such a ratio? It is interesting to remark thatpassing evaluations depends on many factors, such as productive understanding of thecourse, knowledge management, efficiency and regularity of work, efficiency of teaching,efficiency of the examination and its correction (Hadji, 1989). Besides, student evaluationis supposed to have a statistical meaning with a distribution of results around the meanvalue m of the student group and a standard deviation s. This distribution can typicallybe described as a Gaussian or normal distribution. Under this hypothesis, more studentresults are located around the mean value than around the minimum or maximumvalues. Consequently, an adapted evaluation must be characterized by:
- a large number of students around the highest mean value m,
- a large standard deviation s: discriminating evaluation.
Another condition, related to the last point, is to permit the localization and thecharacterization of the student group: only a small number of students can have themaximum and the minimum marks.
A comment can be made about the Gaussian distribution of results, which leads tothe hypothesis for the current statistical ECTS grade distribution (i.e., fixing thepopulation ratio for each grade). In mathematics and statistics, a probabilitydistribution, more properly called a probability density f, assigns a probability P toevery interval of the real numbers in its support [a, b], so that the probability axiomsare satisfied and this probability is defined by (Grinstead and Snell, 1997):
P avXvb½ �~ðb
a
f ðxÞdx
EUROPEAN CREDIT TRANSFER AND ACCUMULATION SYSTEM 215
Dow
nloa
ded
By:
[Tho
mas
, Gro
sges
] At:
11:3
3 12
Feb
ruar
y 20
08
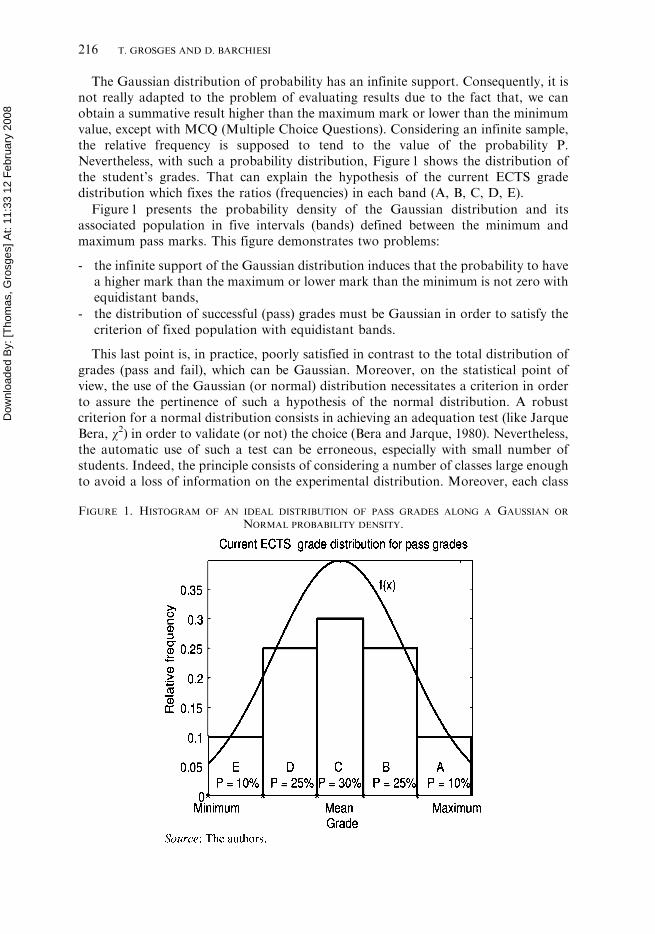
The Gaussian distribution of probability has an infinite support. Consequently, it isnot really adapted to the problem of evaluating results due to the fact that, we canobtain a summative result higher than the maximum mark or lower than the minimumvalue, except with MCQ (Multiple Choice Questions). Considering an infinite sample,the relative frequency is supposed to tend to the value of the probability P.Nevertheless, with such a probability distribution, Figure 1 shows the distribution ofthe student’s grades. That can explain the hypothesis of the current ECTS gradedistribution which fixes the ratios (frequencies) in each band (A, B, C, D, E).
Figure 1 presents the probability density of the Gaussian distribution and itsassociated population in five intervals (bands) defined between the minimum andmaximum pass marks. This figure demonstrates two problems:
- the infinite support of the Gaussian distribution induces that the probability to havea higher mark than the maximum or lower mark than the minimum is not zero withequidistant bands,
- the distribution of successful (pass) grades must be Gaussian in order to satisfy thecriterion of fixed population with equidistant bands.
This last point is, in practice, poorly satisfied in contrast to the total distribution ofgrades (pass and fail), which can be Gaussian. Moreover, on the statistical point ofview, the use of the Gaussian (or normal) distribution necessitates a criterion in orderto assure the pertinence of such a hypothesis of the normal distribution. A robustcriterion for a normal distribution consists in achieving an adequation test (like JarqueBera, x2) in order to validate (or not) the choice (Bera and Jarque, 1980). Nevertheless,the automatic use of such a test can be erroneous, especially with small number ofstudents. Indeed, the principle consists of considering a number of classes large enoughto avoid a loss of information on the experimental distribution. Moreover, each class
FIGURE 1. HISTOGRAM OF AN IDEAL DISTRIBUTION OF PASS GRADES ALONG A GAUSSIAN OR
NORMAL PROBABILITY DENSITY.
216 T. GROSGES AND D. BARCHIESI
Dow
nloa
ded
By:
[Tho
mas
, Gro
sges
] At:
11:3
3 12
Feb
ruar
y 20
08
must contain a large number of data. Theoretically, this number would be infinite but
the Cochran’s criterion suggests that eighty percent of the classes must contain fiveelements and the others cannot be empty (Cochran, 1954). For the normal distribution
with five classes (such as the current ECTS distribution hypothesis), that implies anumber of students larger than forty (corresponding to the population distribution of4, 10, 12, 10, 4 in the grades E, D, C, B, and A).
Realistic Experimental Evaluations
In this section, the pertinence of the current ECTS grade distribution on the gradeattribution will be detailed and discussed, based on experimental data. The data come
from evaluations achieved in France; the scale 0–20 is the most common in highereducation in France and Belgium. Despite that fact, and that other scales are in use inEurope (e.g., 0–10 in Germany, 0–12 in Italy) the following discussion still is general.
Some evaluation results obtained by students during the first six-month period ofthe academic years 2004–2005 and 2005–2006, for a course module ‘‘Physical
Measurements and Instrumentation’’, are considered here. The course can be describedas ‘‘techniques and methodology’’ and it is on the first-year syllabus at university. Thefirst part of the course is mainly devoted to acquiring some knowledge of elementary
statistical methods and their application to data treatments. The educational approachof such a course is applicative or ‘‘engineer-orientated’’ and consists in deducing the
method from a lecture on a summary of the usual norm instead of traditionaltheoretical teaching. It then consists in applying techniques without any thoroughknowledge of probability and statistics. A secondary objective of the course is to
encourage a pertinent use of books, scientific documents, and research. A completeevaluation of the knowledge and methods acquired is carried out all throughthe semester with three examinations and three practical projects. The examination
ratios (or frequencies) are respectively: twenty percent for practical projects,twenty percent for each intermediate examination, and forty percent for the final
examination.
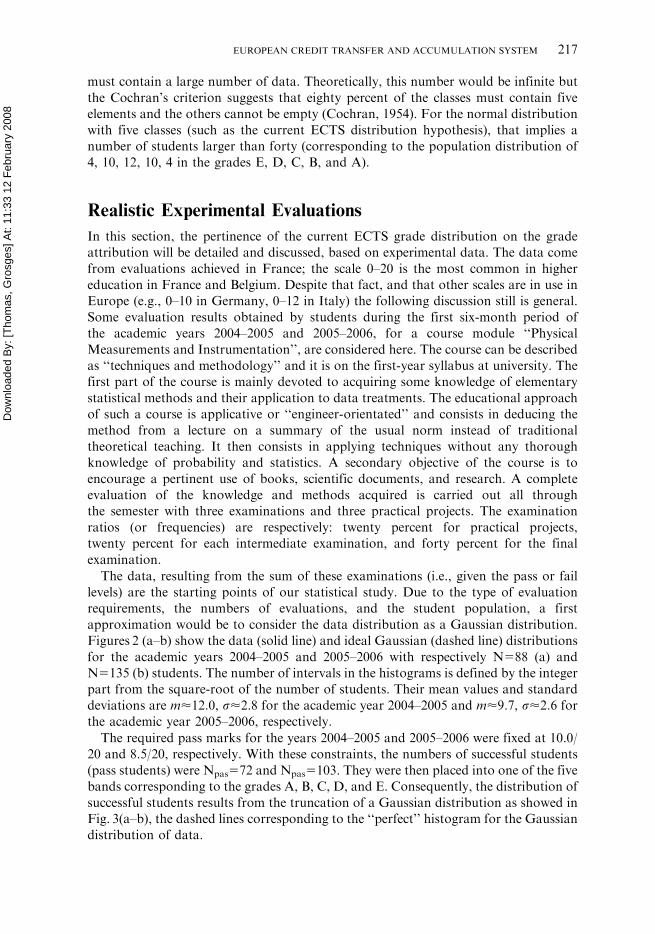
The data, resulting from the sum of these examinations (i.e., given the pass or faillevels) are the starting points of our statistical study. Due to the type of evaluationrequirements, the numbers of evaluations, and the student population, a first
approximation would be to consider the data distribution as a Gaussian distribution.Figures 2 (a–b) show the data (solid line) and ideal Gaussian (dashed line) distributions
for the academic years 2004–2005 and 2005–2006 with respectively N588 (a) andN5135 (b) students. The number of intervals in the histograms is defined by the integerpart from the square-root of the number of students. Their mean values and standard
deviations are m<12.0, s<2.8 for the academic year 2004–2005 and m<9.7, s<2.6 forthe academic year 2005–2006, respectively.
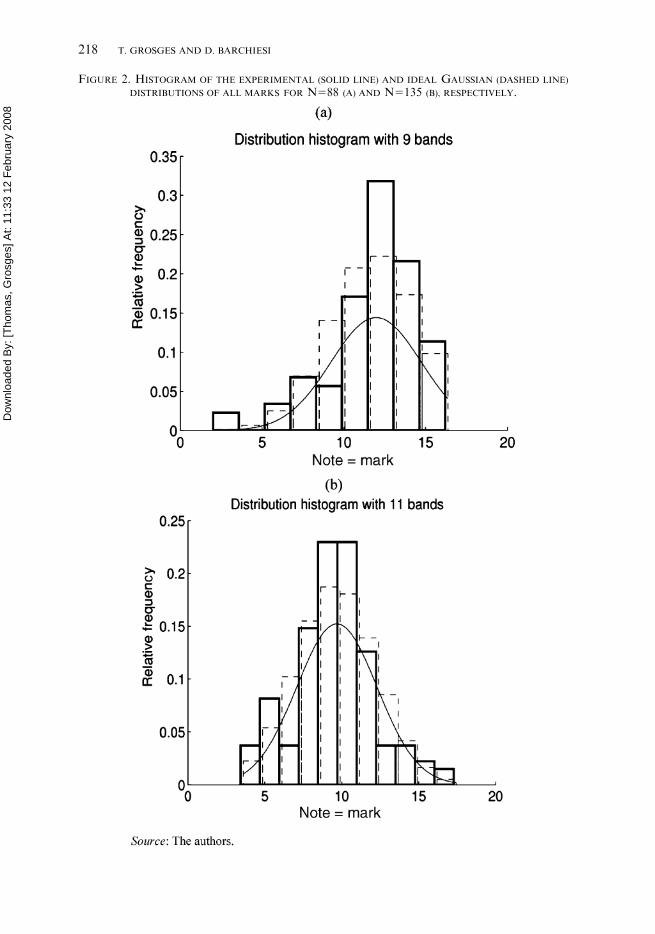
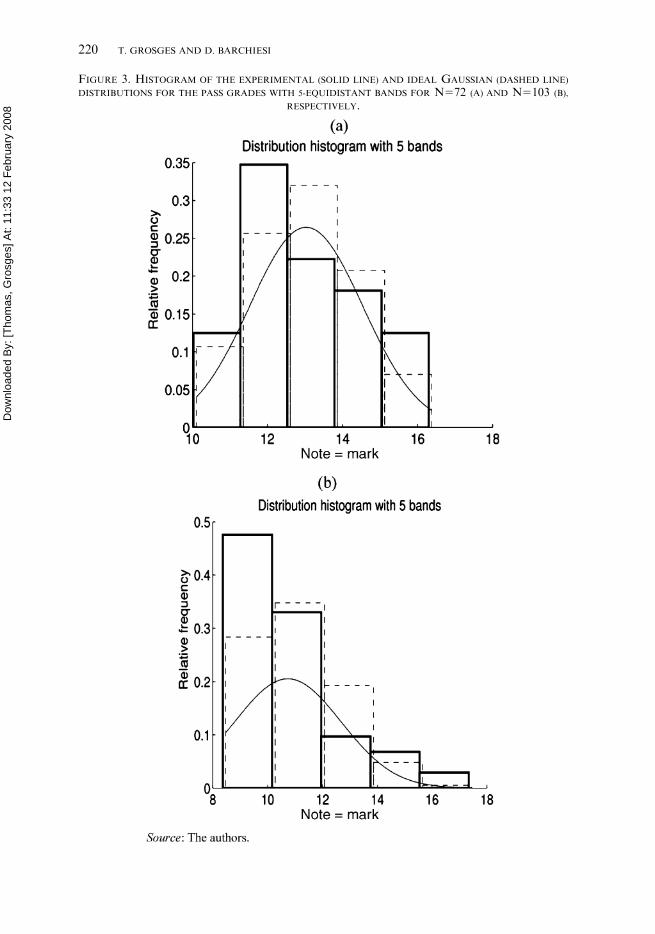
The required pass marks for the years 2004–2005 and 2005–2006 were fixed at 10.0/20 and 8.5/20, respectively. With these constraints, the numbers of successful students
(pass students) were Npas572 and Npas5103. They were then placed into one of the fivebands corresponding to the grades A, B, C, D, and E. Consequently, the distribution of
successful students results from the truncation of a Gaussian distribution as showed inFig. 3(a–b), the dashed lines corresponding to the ‘‘perfect’’ histogram for the Gaussiandistribution of data.
EUROPEAN CREDIT TRANSFER AND ACCUMULATION SYSTEM 217
Dow
nloa
ded
By:
[Tho
mas
, Gro
sges
] At:
11:3
3 12
Feb
ruar
y 20
08
FIGURE 2. HISTOGRAM OF THE EXPERIMENTAL (SOLID LINE) AND IDEAL GAUSSIAN (DASHED LINE)
DISTRIBUTIONS OF ALL MARKS FOR N588 (A) AND N5135 (B), RESPECTIVELY.
218 T. GROSGES AND D. BARCHIESI
Dow
nloa
ded
By:
[Tho
mas
, Gro
sges
] At:
11:3
3 12
Feb
ruar
y 20
08
From the results on Figure 3, it clearly appears that the current hypothesis (i.e.,Gaussian distribution or fixed population ratios for each band) for the pass studentdistributions is not verified. What is more, the experimental histograms sharply differfrom the ECTS histogram of Figure 1. Therefore, the attribution of a grade, based onthe statistic hypothesis (which would be useless with a small number of students), iserroneous. Moreover, the evaluation of the program achievement fails due to thetruncation of the Gaussian distribution.
Current ECTS grade Distribution
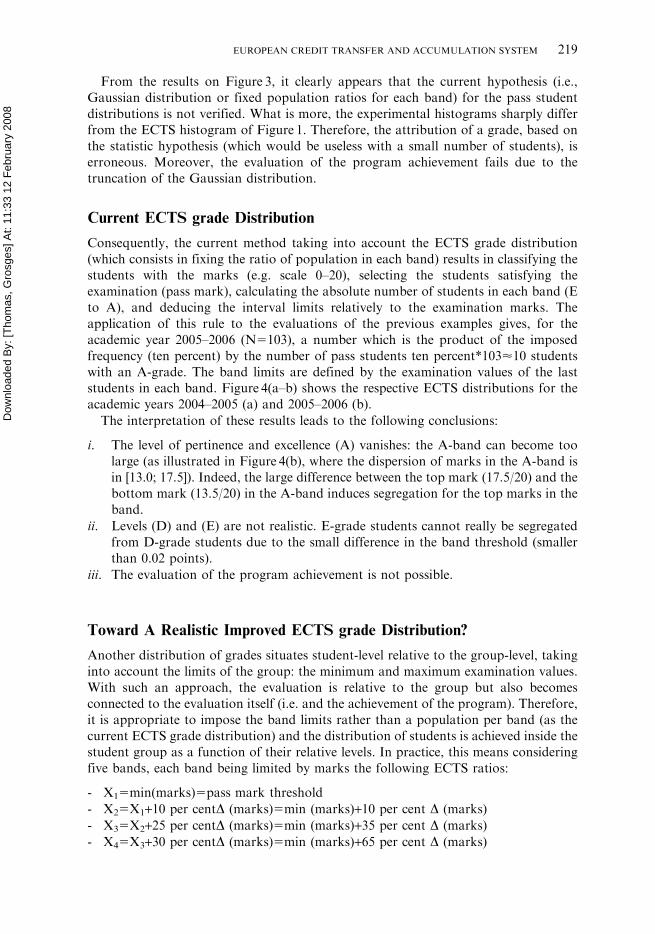
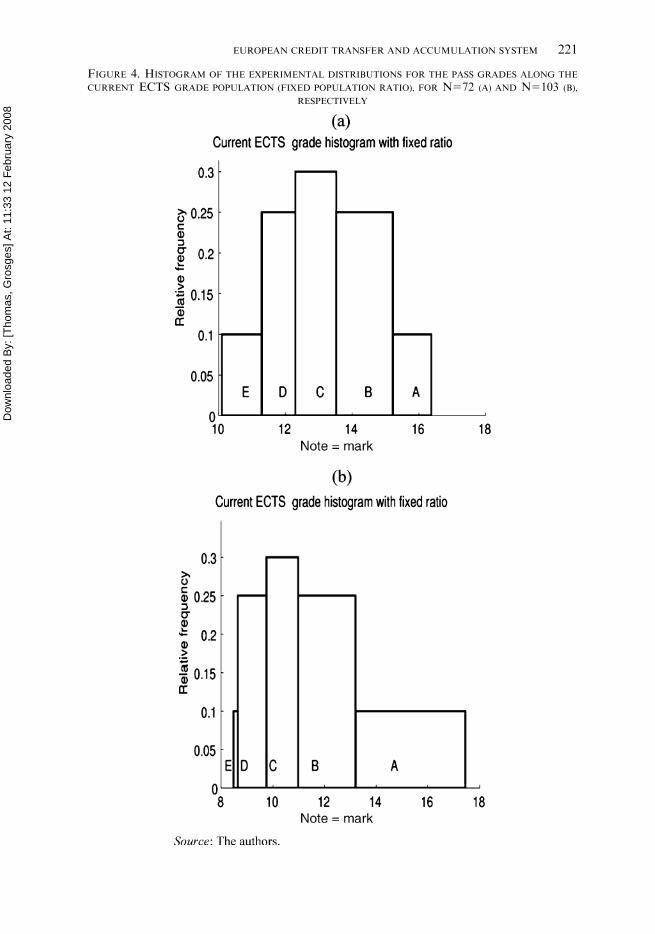
Consequently, the current method taking into account the ECTS grade distribution(which consists in fixing the ratio of population in each band) results in classifying thestudents with the marks (e.g. scale 0–20), selecting the students satisfying theexamination (pass mark), calculating the absolute number of students in each band (Eto A), and deducing the interval limits relatively to the examination marks. Theapplication of this rule to the evaluations of the previous examples gives, for theacademic year 2005–2006 (N5103), a number which is the product of the imposedfrequency (ten percent) by the number of pass students ten percent*103<10 studentswith an A-grade. The band limits are defined by the examination values of the laststudents in each band. Figure 4(a–b) shows the respective ECTS distributions for theacademic years 2004–2005 (a) and 2005–2006 (b).
The interpretation of these results leads to the following conclusions:
i. The level of pertinence and excellence (A) vanishes: the A-band can become toolarge (as illustrated in Figure 4(b), where the dispersion of marks in the A-band isin [13.0; 17.5]). Indeed, the large difference between the top mark (17.5/20) and thebottom mark (13.5/20) in the A-band induces segregation for the top marks in theband.
ii. Levels (D) and (E) are not realistic. E-grade students cannot really be segregatedfrom D-grade students due to the small difference in the band threshold (smallerthan 0.02 points).
iii. The evaluation of the program achievement is not possible.
Toward A Realistic Improved ECTS grade Distribution?
Another distribution of grades situates student-level relative to the group-level, takinginto account the limits of the group: the minimum and maximum examination values.With such an approach, the evaluation is relative to the group but also becomesconnected to the evaluation itself (i.e. and the achievement of the program). Therefore,it is appropriate to impose the band limits rather than a population per band (as thecurrent ECTS grade distribution) and the distribution of students is achieved inside thestudent group as a function of their relative levels. In practice, this means consideringfive bands, each band being limited by marks the following ECTS ratios:
- X15min(marks)5pass mark threshold
- X25X1+10 per centD (marks)5min (marks)+10 per cent D (marks)
- X35X2+25 per centD (marks)5min (marks)+35 per cent D (marks)
- X45X3+30 per centD (marks)5min (marks)+65 per cent D (marks)
EUROPEAN CREDIT TRANSFER AND ACCUMULATION SYSTEM 219
Dow
nloa
ded
By:
[Tho
mas
, Gro
sges
] At:
11:3
3 12
Feb
ruar
y 20
08
FIGURE 3. HISTOGRAM OF THE EXPERIMENTAL (SOLID LINE) AND IDEAL GAUSSIAN (DASHED LINE)
DISTRIBUTIONS FOR THE PASS GRADES WITH 5-EQUIDISTANT BANDS FOR N572 (A) AND N5103 (B),
RESPECTIVELY.
220 T. GROSGES AND D. BARCHIESI
Dow
nloa
ded
By:
[Tho
mas
, Gro
sges
] At:
11:3
3 12
Feb
ruar
y 20
08
FIGURE 4. HISTOGRAM OF THE EXPERIMENTAL DISTRIBUTIONS FOR THE PASS GRADES ALONG THE
CURRENT ECTS GRADE POPULATION (FIXED POPULATION RATIO), FOR N572 (A) AND N5103 (B),
RESPECTIVELY
EUROPEAN CREDIT TRANSFER AND ACCUMULATION SYSTEM 221
Dow
nloa
ded
By:
[Tho
mas
, Gro
sges
] At:
11:3
3 12
Feb
ruar
y 20
08
- X55X4+25 per centD (marks)5min (marks)+90 per cent D (marks)
- X65X5+10 per centD (marks)5max (marks)
where D (marks)5(max(marks)–min(marks)) is the range of the total pass mark of thestudent group. Thus, E-, D-, C-, B- and A-grades will be assigned to student marksincluded in the intervals [X1;X2[, [X2;X3[, [X3;X4[, [X4;X5[ and [X5;X6], respectively.
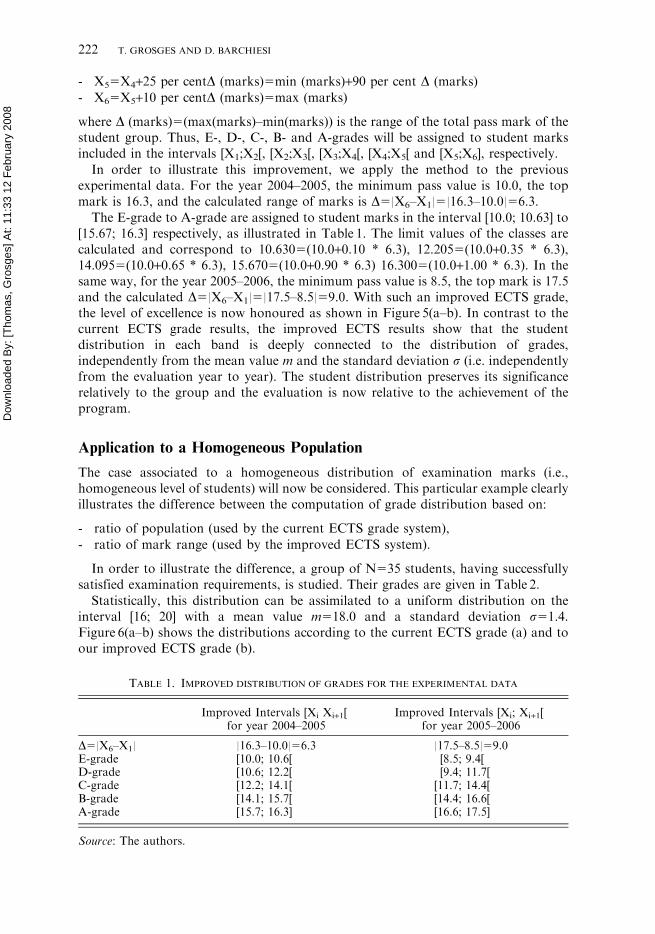
In order to illustrate this improvement, we apply the method to the previousexperimental data. For the year 2004–2005, the minimum pass value is 10.0, the topmark is 16.3, and the calculated range of marks is D5|X6–X1|5|16.3–10.0|56.3.
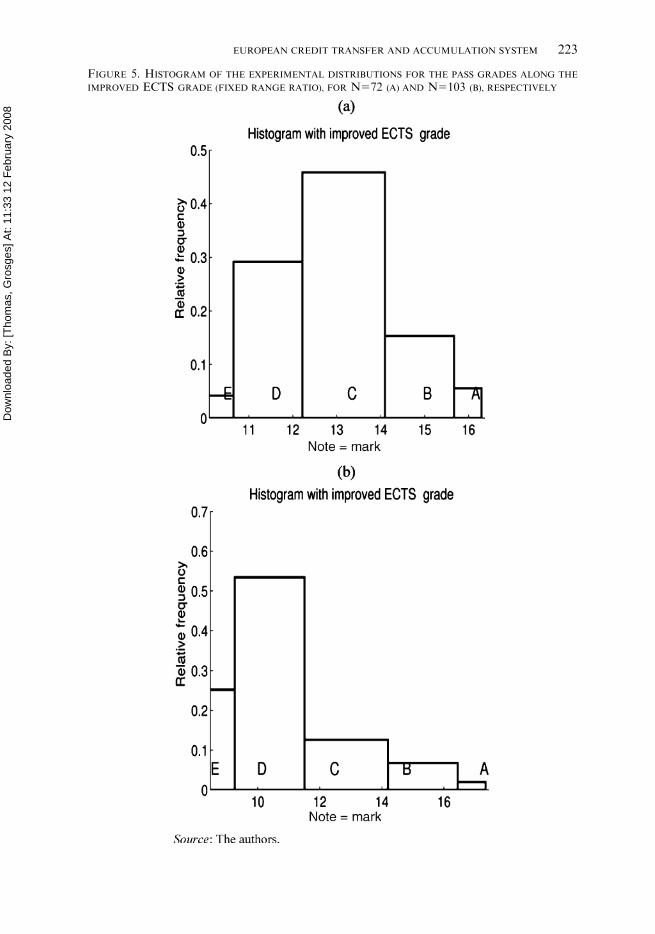
The E-grade to A-grade are assigned to student marks in the interval [10.0; 10.63] to[15.67; 16.3] respectively, as illustrated in Table 1. The limit values of the classes arecalculated and correspond to 10.6305(10.0+0.10 * 6.3), 12.2055(10.0+0.35 * 6.3),14.0955(10.0+0.65 * 6.3), 15.6705(10.0+0.90 * 6.3) 16.3005(10.0+1.00 * 6.3). In thesame way, for the year 2005–2006, the minimum pass value is 8.5, the top mark is 17.5and the calculated D5|X6–X1|5|17.5–8.5|59.0. With such an improved ECTS grade,the level of excellence is now honoured as shown in Figure 5(a–b). In contrast to thecurrent ECTS grade results, the improved ECTS results show that the studentdistribution in each band is deeply connected to the distribution of grades,independently from the mean value m and the standard deviation s (i.e. independentlyfrom the evaluation year to year). The student distribution preserves its significancerelatively to the group and the evaluation is now relative to the achievement of theprogram.
Application to a Homogeneous Population
The case associated to a homogeneous distribution of examination marks (i.e.,homogeneous level of students) will now be considered. This particular example clearlyillustrates the difference between the computation of grade distribution based on:
- ratio of population (used by the current ECTS grade system),
- ratio of mark range (used by the improved ECTS system).
In order to illustrate the difference, a group of N535 students, having successfullysatisfied examination requirements, is studied. Their grades are given in Table 2.
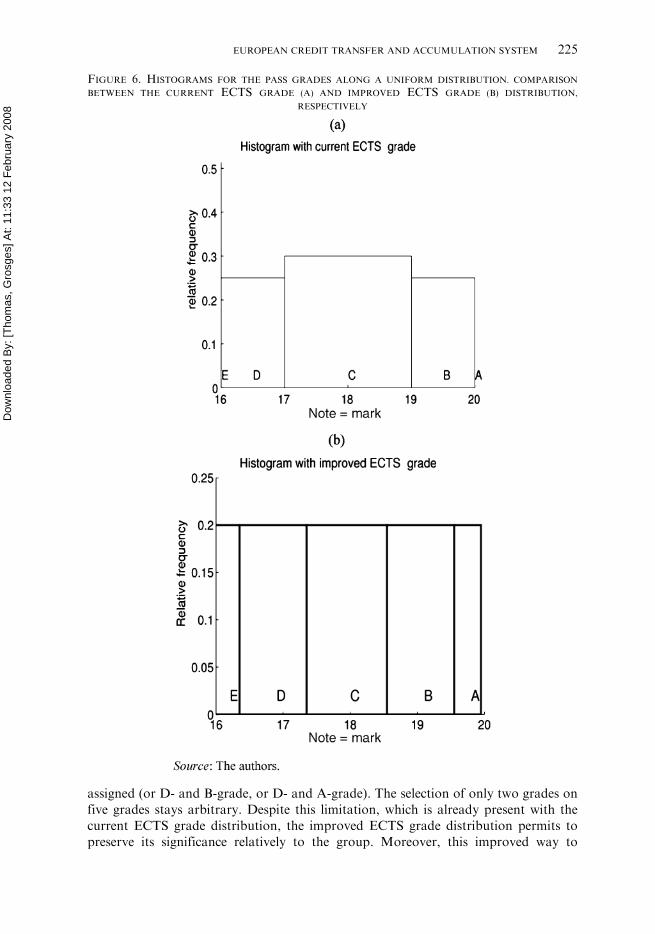
Statistically, this distribution can be assimilated to a uniform distribution on theinterval [16; 20] with a mean value m518.0 and a standard deviation s51.4.Figure 6(a–b) shows the distributions according to the current ECTS grade (a) and toour improved ECTS grade (b).
TABLE 1. IMPROVED DISTRIBUTION OF GRADES FOR THE EXPERIMENTAL DATA
Improved Intervals [Xi Xi+1[for year 2004–2005
Improved Intervals [Xi; Xi+1[for year 2005–2006
D5|X6–X1| |16.3–10.0|56.3 |17.5–8.5|59.0E-grade [10.0; 10.6[ [8.5; 9.4[D-grade [10.6; 12.2[ [9.4; 11.7[C-grade [12.2; 14.1[ [11.7; 14.4[B-grade [14.1; 15.7[ [14.4; 16.6[A-grade [15.7; 16.3] [16.6; 17.5]
Source: The authors.
222 T. GROSGES AND D. BARCHIESI
Dow
nloa
ded
By:
[Tho
mas
, Gro
sges
] At:
11:3
3 12
Feb
ruar
y 20
08
FIGURE 5. HISTOGRAM OF THE EXPERIMENTAL DISTRIBUTIONS FOR THE PASS GRADES ALONG THE
IMPROVED ECTS GRADE (FIXED RANGE RATIO), FOR N572 (A) AND N5103 (B), RESPECTIVELY
EUROPEAN CREDIT TRANSFER AND ACCUMULATION SYSTEM 223
Dow
nloa
ded
By:
[Tho
mas
, Gro
sges
] At:
11:3
3 12
Feb
ruar
y 20
08
In order to satisfy the current ECTS grade distribution (fixed population ratio), theA-band (or E-band), corresponding to students with the maximum mark 20/20 (orminimum mark 16/20), must be empty. Indeed, the number of maximum (or minimum)is higher (i.e., twenty percent) than the population ratio ten percent fixed by the currentECTS grade. Another possibility is to attribute the A-grades (E-grades) randomly tothe students with the maximum (minimum) mark and B-grade (D-grade) when thepopulation ratio is satisfied: this does not make any sense. In contrast to the currentECTS grade, the improved ECTS grade reproduces the evaluation of the uniformdistribution correctly (see Figure 6(b)) and assigns the same ratio to each band (E toA). The student distribution preserves its significance relatively to the group. Inaddition, the evaluation relatively to the achievement of the program is also satisfiedand pertinent.
Application to a Heterogeneous Population
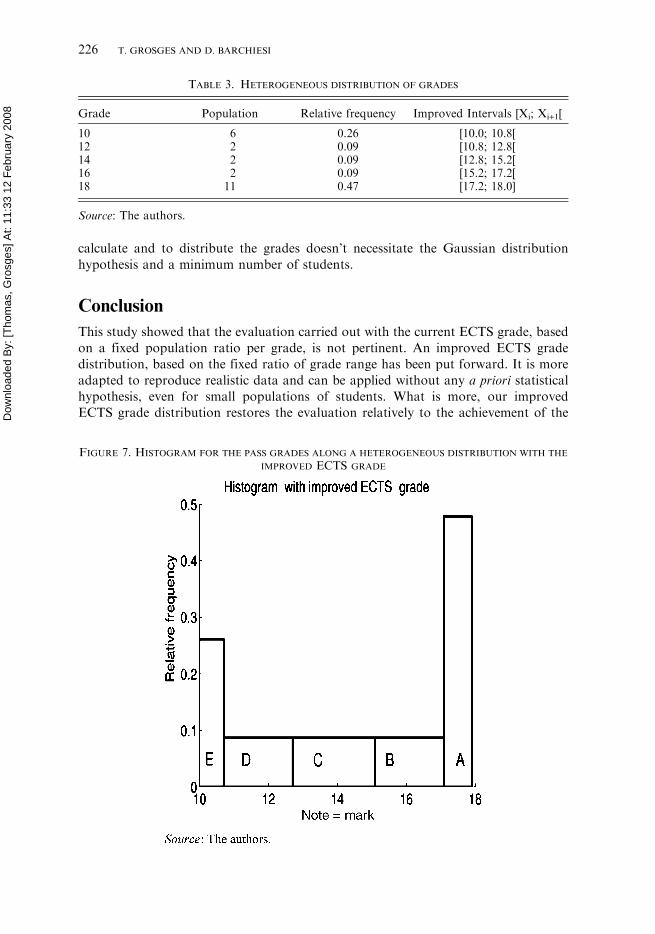
Finally, the case associated to a heterogeneous distribution of examination marks (i.e.heterogeneous level of students) is now scrutinized. In order to illustrate the differencesbetween the current ECTS grade system (fixed population ratio) and the improvedECTS grade system (fixed ratio of mark range), a group of N523 students havingpassed the examination will be considered. Their marks (see Table 3) are distributedaround a mean value m514.9 with a standard deviation s53.5
Statistically, this distribution cannot be assimilated to a Gaussian distribution on theinterval [10; 18]. Figure 7 shows the distribution with the improved ECTS grade.
As in the homogeneous population case, in order to satisfy the current ECTS gradedistribution (fixed population ratio), the A-band (E-band), corresponding to studentswith the best marks 18/20 (or the worst mark, 10/20), must be empty. Indeed, thenumber of maximum (or minimum) is higher (i.e., forty-eight percent or twenty-sixpercent) than the population ratio ten percent fixed by the current ECTS gradedistribution. The possibility of attributing random A-grades (E-grades) to the studentswith the maximum (minimum) mark and B-grade (D-grade) must be avoided. Incontrast to the current ECTS grade distribution, the improved ECTS grade stillreproduces the evaluation correctly (see Figure 7) and permits to inflate the populationwith E-grade (or A-grade). The student distribution preserves its significance relativelyto the group. Besides, the evaluation relatively to the achievement of the program isrestored. The only restriction of the improved ECTS grade distribution will occur forevaluation marks distributed in one or two bloc (e.g., only a group with 10.0 and onewith 18.0 in the heterogeneous distribution). In this case, only E and A-grade can be
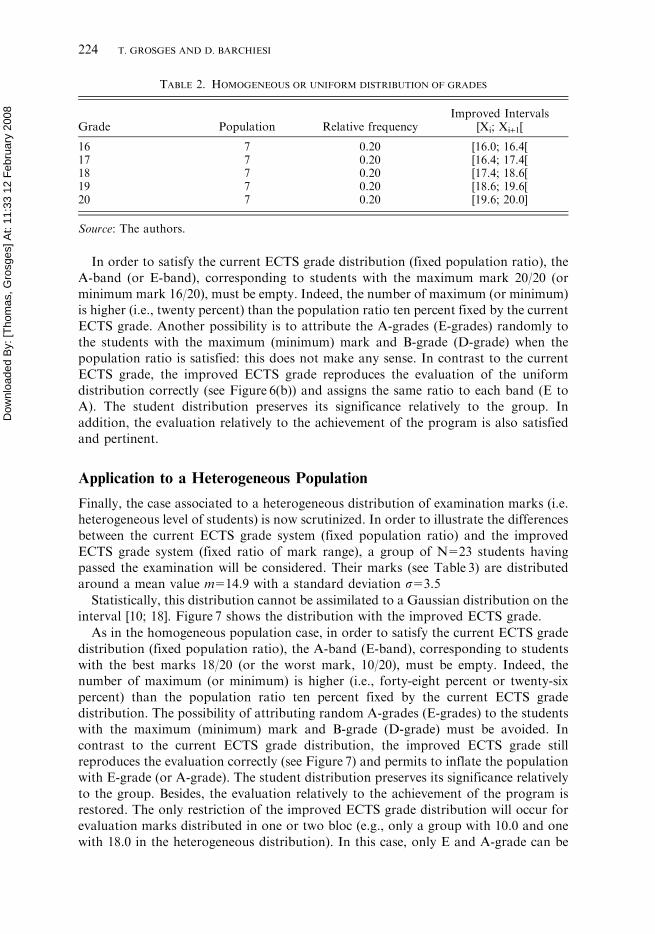
TABLE 2. HOMOGENEOUS OR UNIFORM DISTRIBUTION OF GRADES
Grade Population Relative frequencyImproved Intervals
[Xi; Xi+1[
16 7 0.20 [16.0; 16.4[17 7 0.20 [16.4; 17.4[18 7 0.20 [17.4; 18.6[19 7 0.20 [18.6; 19.6[20 7 0.20 [19.6; 20.0]
Source: The authors.
224 T. GROSGES AND D. BARCHIESI
Dow
nloa
ded
By:
[Tho
mas
, Gro
sges
] At:
11:3
3 12
Feb
ruar
y 20
08
assigned (or D- and B-grade, or D- and A-grade). The selection of only two grades onfive grades stays arbitrary. Despite this limitation, which is already present with thecurrent ECTS grade distribution, the improved ECTS grade distribution permits topreserve its significance relatively to the group. Moreover, this improved way to
FIGURE 6. HISTOGRAMS FOR THE PASS GRADES ALONG A UNIFORM DISTRIBUTION. COMPARISON
BETWEEN THE CURRENT ECTS GRADE (A) AND IMPROVED ECTS GRADE (B) DISTRIBUTION,
RESPECTIVELY
EUROPEAN CREDIT TRANSFER AND ACCUMULATION SYSTEM 225
Dow
nloa
ded
By:
[Tho
mas
, Gro
sges
] At:
11:3
3 12
Feb
ruar
y 20
08
calculate and to distribute the grades doesn’t necessitate the Gaussian distribution
hypothesis and a minimum number of students.
Conclusion
This study showed that the evaluation carried out with the current ECTS grade, based
on a fixed population ratio per grade, is not pertinent. An improved ECTS gradedistribution, based on the fixed ratio of grade range has been put forward. It is more
adapted to reproduce realistic data and can be applied without any a priori statisticalhypothesis, even for small populations of students. What is more, our improvedECTS grade distribution restores the evaluation relatively to the achievement of the
TABLE 3. HETEROGENEOUS DISTRIBUTION OF GRADES
Grade Population Relative frequency Improved Intervals [Xi; Xi+1[
10 6 0.26 [10.0; 10.8[12 2 0.09 [10.8; 12.8[14 2 0.09 [12.8; 15.2[16 2 0.09 [15.2; 17.2[18 11 0.47 [17.2; 18.0]
Source: The authors.
FIGURE 7. HISTOGRAM FOR THE PASS GRADES ALONG A HETEROGENEOUS DISTRIBUTION WITH THE
IMPROVED ECTS GRADE
226 T. GROSGES AND D. BARCHIESI
Dow
nloa
ded
By:
[Tho
mas
, Gro
sges
] At:
11:3
3 12
Feb
ruar
y 20
08
program and the student distribution preserves its significance relatively to the group,independently from the group or population level (homogeneous or heterogeneouspopulation).
References
AMARAL, A. and MAGALHAES, A. ‘‘Epidemiology and the Bologna Saga’’, Higher Education 48(1) (2004): 79–100.
BERA, A.K. and JARQUE, C.M. ‘‘Efficient Tests for Normality, Homoscedasticity and Serial
Independence of Regression Residuals’’, Economics Letters 6 (3) (1980): 255–259.BRYAN, C., and CLEGG, K. (Eds.). Innovative Assessment in Higher Education. London:Routledge, 2006.
COCHRAN, W.G. ‘‘Some methods for strengthening the common x2 test’’, Biometrics 10 (1954):
417–451.DEMANGEL, Y. ‘‘De l’evaluation a l’orientation [From Evaluation to Orientation]’’, Educationtechnologique 22 (2003), 17–26.
EUROPEAN COMMISSION. EUROPEAN CREDIT TRANSFER AND ACCUMULATION SYSTEM (ECTS).Retrieved 1 August 2006, from <http://ec.europa.eu/education/programmes/socrates/ects/index_en.html>.
GRINSTEAD, C.M. and SNELL, J.L. Introduction to Probability. Second Revised Edition.Providence: American Mathematical Society, 1997.
HADJI, C.H. ‘‘L’evaluation, regles du jeu’’ [Evaluation, Game Rules], in, MEIRIEU, Philippe
(Ed.). Pedagogie recherche. Paris: ESF Editeur, 1989.KARRAN, T. ‘‘Pan-European Grading Scales: Lessons from National Systems and the ECTS’’,Higher Education in Europe 30 (1) (2005): 5–22.
KARRAN, T. (2004). ‘‘Is ECTS Failing to Make the Grade?’’, Higher Education in Europe 29 (3)
(2004): 411–421.MERIEUX, C. ‘‘L’evaluation: histoire et mise en oeuvre [Evaluation: History andImplementation]’’, Education technologique 22 (2003): 41–55.
WIKSTROM, C. ‘‘Grade Stability in Criterion-referenced Grading System’’, Assessment inEducation: Principles, Policy and Practice 12 (2) (2005): 125–144.
EUROPEAN CREDIT TRANSFER AND ACCUMULATION SYSTEM 227