eureka media aksara
TRANSCRIPT

i
ALTERNATIVE BUSINESS MODEL
FOR ENERGY SERVICE COMPANY IN INDONESIA
Eka Sudarmaji
PENERBIT CV.EUREKA MEDIA AKSARA
ii
ALTERNATIVE BUSINESS MODEL FOR ENERGY SERVICE COMPANY IN INDONESIA
Penulis : Eka Sudarmaji
Desain Sampul : Eri Setiawan
Tata Letak : Tukaryanto, S.Pd., Gr.
ISBN : 978-623-5382-23-4
No. HKI : EC00202229307
Diterbitkan oleh : EUREKA MEDIA AKSARA, MARET 2022
ANGGOTA IKAPI JAWA TENGAH
NO. 225/JTE/2021
Redaksi:
Jalan Banjaran, Desa Banjaran RT 20 RW 10 Kecamatan Bojongsari
Kabupaten Purbalingga Telp. 0858-5343-1992
Surel : [email protected]
Cetakan Pertama : 2022
All right reserved
Hak Cipta dilindungi undang-undang
Dilarang memperbanyak atau memindahkan sebagian atau
seluruh isi buku ini dalam bentuk apapun dan dengan cara
apapun, termasuk memfotokopi, merekam, atau dengan teknik
perekaman lainnya tanpa seizin tertulis dari penerbit.
iii
FOREWORD
All praise and gratitude, I pray to Allah SWT, who has given
me abundance of grace, health, and opportunities for a better life
so that I can complete this book. This Monograph Book can be
completed thanks to various parties' help, guidance,
encouragement, and attention. I am extraordinary grateful to my
beloved wife, Dr. Ismi Nasip, and our three dear daughters,
Ananda Tika Sudarmaji, Ananda Mia Sudarmaji, and Ananda
Zuraenee Sudarmaji. Thank you so much for the never-ending
support, and you have given me endless prayers, and love.
The author realizes that the Monograph Book still needs
improvement; hence suggestions and constructive criticism from
all parties are expected for the subsequent refinement and
advancement. Furthermore, I hope that this Monograph Book can
provide meaning and benefit to many parties
.
Jakarta, April 2022

iv
TABLE OF CONTENT FOREWORD ...................................................................................... iii
TABLE OF CONTENT ...................................................................... iv
LIST OF TABLES............................................................................... vi
LIST OF FIGURES ........................................................................... vii
LIST OF ABBREVIATIONS .......................................................... viii
PART 1 INTRODUCTION .............................................................. 1
A. Background ....................................................................... 5 B. Problem ............................................................................. 9 C. Does the New Business Model of ESCO can tap a vast
potential in the energy efficiency business? ..................... 14 D. Could a new financial scheme help ESCO to tap
opportunities on building energy efficiency industry in
Indonesia? ....................................................................... 17 E. Are government energy efficiency policies effective? ...... 19
PART 2 EMPERICAL STUDY ...................................................... 21
A. General Case Study Information ...................................... 21 B. Purpose of the Study ........................................................ 25 C. Research Benefits ............................................................ 26 D. Scope of the Study ........................................................... 27 E. Research Framework ....................................................... 27 F. Framework of Thinking ................................................... 29
PART 3 CASE STUDY ALTERNATIVE PRODUCT SYSTEM
SERVICE BUSINESS MODEL OF ENERGY
SERVICE SYSTEM .......................................................... 31
A. Introduction ..................................................................... 31 B. Method ............................................................................ 34 C. Finding and Discussion .................................................... 42 D. Concluding Remarks ....................................................... 76
PART 4 CASE STUDY ENERGY-SAVING BACKED
FINANCE: CREDIT WORTHINESS PREDICTION
USING MACHINE LEARNING .................................... 80
A. Introduction ..................................................................... 80 B. Method ............................................................................ 83 C. Finding & Discussion ...................................................... 91 D. Concluding Remarks ....................................................... 96

v
PART 5 CASE STUDY NATIONAL POLICY ON BUILDING
ENERGY EFFICIENCY ................................................... 99
A. Introduction..................................................................... 99 B. Method.......................................................................... 103 C. Finding and Discussion ................................................. 109 D. Concluding Remarks ..................................................... 138
PART 6 CONCLUSION ............................................................... 140
A. Policy Implication ......................................................... 140 B. Managerial Implication ................................................. 141 C. Management Science Implication .................................. 142 D. Limitation of Research .................................................. 143 E. Future Study.................................................................. 144
SYNOPSIS ....................................................................................... 145
REFERENCES .................................................................................. 148
BIO NOTE ........................................................................................ 161

vi
LIST OF TABLES Table 1. 1. Potential Energy Saving for Sectors ................................. 3
Table 2. 1. Classification of PSS business model in energy
efficiency .......................................................................... 23
Table 3. 1. Data collection, data analysis, and output – SSM
steps .................................................................................. 35
Table 3. 2. Validity and reliability of case study ............................. 38
Table 3. 3. Sentiment and Emotion Analysis ................................... 43
Table 3. 4. Keywords on text analysis .............................................. 45
Table 3. 5. Key topics ......................................................................... 46
Table 3. 6. Three Root Definition ...................................................... 54
Table 3. 7. Gassman’s magic triangle framework ........................... 57
Table 3. 8. PSS business characteristic .............................................. 58
Table 3. 9. Recommendation for Possible Action ............................ 61
Table 3. 10. Morphology of BMC – matrix ....................................... 71
Table 3. 11. Bussiness Model Pattern ............................................... 72
Table 4. 1. comparative measurement between LED and TLD...... 80
Table 4. 2. Sensitive analysis for utility cost saving ........................ 89
Table 4. 3. Variable, membership function dan range .................... 91
Table 4. 4. Data processing of creditworthiness .............................. 94
Table 4. 5. Individual regression results of the creditworthiness .. 95
Table 5. 1. Comparative regulatory support - the UK, Spain,
China, Australia, and Brazil ......................................... 104
Table 5. 2. Main barriers to building energy efficiency in
Indonesia ........................................................................ 106
Table 5. 3. Opinion mining hierarchy............................................. 120
Table 5. 4. Entity sentiment scores and emotion analysis ............ 121
Table 5. 5. Keywords relevance, sentiment scores, and emotion
analysis ........................................................................... 122
Table 5. 6. Actors and foreign institution ....................................... 129
Table 5. 7. Key laws, policies, and regulations for energy
efficiency and conservation .......................................... 130
Table 5. 8. Additional policies and regulations ............................. 132
Table 5. 9. Key policies and regulations ......................................... 134
vii
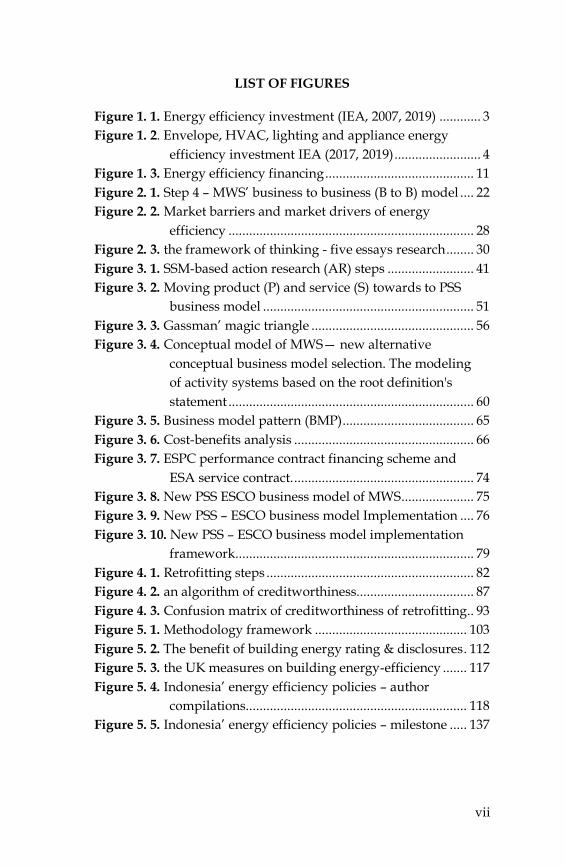
LIST OF FIGURES
Figure 1. 1. Energy efficiency investment (IEA, 2007, 2019) ............ 3
Figure 1. 2. Envelope, HVAC, lighting and appliance energy
efficiency investment IEA (2017, 2019) ......................... 4
Figure 1. 3. Energy efficiency financing ........................................... 11
Figure 2. 1. Step 4 – MWS’ business to business (B to B) model .... 22
Figure 2. 2. Market barriers and market drivers of energy
efficiency ....................................................................... 28
Figure 2. 3. the framework of thinking - five essays research ........ 30
Figure 3. 1. SSM-based action research (AR) steps ......................... 41
Figure 3. 2. Moving product (P) and service (S) towards to PSS
business model ............................................................. 51
Figure 3. 3. Gassman’ magic triangle ............................................... 56
Figure 3. 4. Conceptual model of MWS— new alternative
conceptual business model selection. The modeling
of activity systems based on the root definition's
statement ....................................................................... 60
Figure 3. 5. Business model pattern (BMP) ...................................... 65
Figure 3. 6. Cost-benefits analysis .................................................... 66
Figure 3. 7. ESPC performance contract financing scheme and
ESA service contract. .................................................... 74
Figure 3. 8. New PSS ESCO business model of MWS ..................... 75
Figure 3. 9. New PSS – ESCO business model Implementation .... 76
Figure 3. 10. New PSS – ESCO business model implementation
framework ..................................................................... 79
Figure 4. 1. Retrofitting steps ............................................................ 82
Figure 4. 2. an algorithm of creditworthiness.................................. 87
Figure 4. 3. Confusion matrix of creditworthiness of retrofitting.. 93
Figure 5. 1. Methodology framework ............................................ 103
Figure 5. 2. The benefit of building energy rating & disclosures . 112
Figure 5. 3. the UK measures on building energy-efficiency ....... 117
Figure 5. 4. Indonesia’ energy efficiency policies – author
compilations................................................................ 118
Figure 5. 5. Indonesia’ energy efficiency policies – milestone ..... 137

viii
LIST OF ABBREVIATIONS
ADB Asian Development Bank
AFD Agence française de développement
AHP Analytic Hierarchy Process
AI Artificial Intelligence
ANP Analytic Network Process
ARDL Auto Regressive Distributed Lag
Bapenas Badan Perencanaan Nasional
BAU Business-As-Usual
BMC Business Model Canvas
CFL-i Compact Fluorescent Lamps
DANIDA Danish International Development Agency
DSM Demand Side Management
ESA Energy Saving Agreement
ESCO Energy Service Conservatism Company (Energy Saving
Company)
ESPC Energy Saving Performance Contracts
FGD Forum Group Discussion
FSA Financial Services Authority
GHG Greenhouse Gas
GIZ Gesellschaft für Internationale Zusammenarbeit
IFC International Finance Corporation
JCM Joint Commission Meeting
KEN Kebijakan Energi Nasional
LED Light-Emitting Diode
LCCA Life Cycle Cost Analysis
MA Morphological Analysis
MEMR Minister of Energy and Mineral Resources
ML Machine Learning
MOEF Minister of Economic and Finance
MOF Minister of Finance
MOL Minister of Labor
MtCO2 Million Tons of CO2
NLP Natural Language Programming
PB Pembangunan Berkelanjutan

ix
PSS Product, Service and System
RK Rendah Karbon
RUEN Rencana Umum Energi Nasional
SSM Soft System Modelling
TOE Ton of Oil Equivalent
UNIDO The United Nations Industrial Development
Organization
x
ALTERNATIVE BUSINESS MODEL
FOR ENERGY SERVICE COMPANY IN INDONESIA
Eka Sudarmaji

1
PART
1
Companies will likely continue to diversify their product
offerings to stay ahead of the competition in the LED industry. To
that end, companies will typically provide products beyond their
core offerings to complement their portfolios. The LED industry is
in an oligopoly market, where most companies determine the
selling price of their products based on competitive conditions and
customer demand, which in turn affects the level of profit. The
LED companies are also aware of their competitive environment,
mainly when competing firms operate in the same sales area. Since
the product structure of each company in the LED industry tends
to be similar, companies compete based on price. So these LED
companies tend to cut prices and ultimately lead to price
competition. This severe competition forced them to create their
brands, provide services, discounts or coupons, and product
differentiation.
LED companies to compete by offering more extensive,
better, faster, cleaner, and newer products– especially one that is
different from the competition. Therefore, many LED companies
realize that price competition is not practical. They generally rely
on non-price competition methods. A more common method of
non-price competition is through ‘product differentiation. The key
for a company is to attract buyers and increase market share while
holding the price line. Every company strives to differentiate its
products and give customers a reason (besides price differences) to
choose its products over competitors.
INTRODUCTION

21
PART
2
A. General Case Study Information
Based on general information obtained in data mining on
documents collected, MWS focused on B-to-B segments as the
manufacturer divided the distributors based on the target
market. PT. MWS part of Sriwijaya Group. MSW's complete
portfolio includes: 1) Philips Consumer Lighting Solutions, 2)
Philips Professional Lighting Solutions, 3) Color Kinetics High
Performance LED Solutions, 4) Dynalite and Interact Connected
Lighting Systems, and 5) Philips OEM Customization Solutions,
PT. Mantra Wira Sriwijaya was committed to providing the best
possible solution to all lighting needs. MWS's service included
financial provision assistance through LED retrofitting
solutions.
EMPERICAL STUDY
31
PART
3
A. Introduction
It was found that the lack of economic and financial
incentives and limited financing options might be the most
prominent problem of the promotion of energy efficiency at the
current stage in Indonesia. With energy efficiency, Indonesia
will gain many benefits such as increasing competitiveness,
opening jobs, improving energy security, and reducing energy
demand. It can reduce the need for coal-fired power plant
construction and help facilitate electricity access targets for
people who were not yet electrified. The government has issued
incentives and disincentives policies to spur energy efficiency
among the industry sectors. Unfortunately, under the
Government of the Republic of Indonesia (2009) regulation, the
incentives and disincentives were given only to companies that
use 6000 TOE (a ton of oil equivalent). Those organizations
were qualified for incentives in types of tax facilities, customs
duties, and low-loan costs from banking institutions.
Organizations that did not actualize the conservation would get
disincentives as alerts, media publications, fines, and decreased
energy supply. Therefore, there was room to improve energy
efficiency by strengthening compliance through the
establishment of an ESCO.
The government needs to help new ESCO enter the
energy-efficiency sector. The incentives policies were especially
useful in overcoming the energy gap and increasing growth in
prospect companies and ESCO enter the program. On the other
CASE STUDY ALTERNATIVE PRODUCT
SYSTEM SERVICE BUSINESS MODEL OF ENERGY
SERVICE SYSTEM
80
PART
4
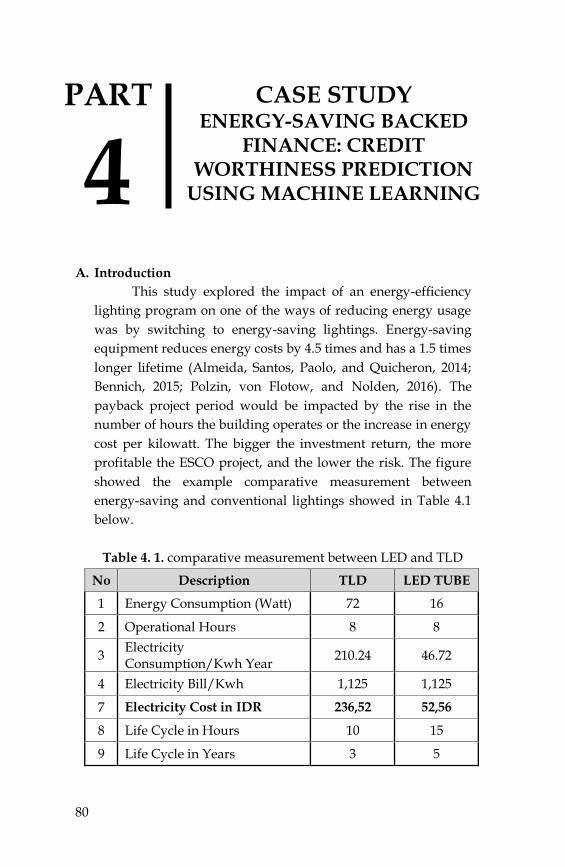
A. Introduction
This study explored the impact of an energy-efficiency
lighting program on one of the ways of reducing energy usage
was by switching to energy-saving lightings. Energy-saving
equipment reduces energy costs by 4.5 times and has a 1.5 times
longer lifetime (Almeida, Santos, Paolo, and Quicheron, 2014;
Bennich, 2015; Polzin, von Flotow, and Nolden, 2016). The
payback project period would be impacted by the rise in the
number of hours the building operates or the increase in energy
cost per kilowatt. The bigger the investment return, the more
profitable the ESCO project, and the lower the risk. The figure
showed the example comparative measurement between
energy-saving and conventional lightings showed in Table 4.1
below.
Table 4. 1. comparative measurement between LED and TLD
No Description TLD LED TUBE
1 Energy Consumption (Watt) 72 16
2 Operational Hours 8 8
3 Electricity Consumption/Kwh Year
210.24 46.72
4 Electricity Bill/Kwh 1,125 1,125
7 Electricity Cost in IDR 236,52 52,56
8 Life Cycle in Hours 10 15
9 Life Cycle in Years 3 5
CASE STUDY ENERGY-SAVING BACKED
FINANCE: CREDIT WORTHINESS PREDICTION
USING MACHINE LEARNING

99
PART
5
A. Introduction
The main policy failures in building energy efficiency
include limited or ineffective use of available instruments, a
poor understanding of consumer and investor decisions
drivers, poor assessments of instrument cost-effectiveness, and
poor instrument assignment across public sector agencies. As a
result, government transparency regulations and building
rating policies must be implemented to stimulate energy
efficiency and energy savings demand (Burr et al. 2016). By
valuing energy performance in the building sector, the market
will unlock significant potential for energy efficiency via market
pricing signals, and the energy-efficient homes are worth more.
Furthermore, It increased access to financing for individuals
looking to buy a more energy-efficient house (energy-efficient
homes enhance borrowers' cash flow since they are less
expensive to run) (Adams 2012; Hill & Dunsky 2013).
The signalling component of energy efficiency gains in
buildings works through minimizing information asymmetry.
According to market signalling theory, an energy performance
certificate makes the owners' products more attractive. It may
be a vital component of a firm's "nonmarket" strategy in a
competitive real estate marketplace. Moreover, knowledge
asymmetry about building quality made the underinvestment
in building energy efficiency business since builders, owners,
and occupiers do not exchange information about energy
performance. In contradiction, some of this information must be
CASE STUDY NATIONAL POLICY ON
BUILDING ENERGY EFFICIENCY

140
PART
6
Implementing energy efficiency practices, the new PSS
business model for ESCO, and retrofitting financing as new
alternative financing in the building industry has become
important, given the relationship between energy consumption
and economic growth. The literature on energy efficiency
development provides insight into improving the implementation
of energy efficiency mentioned above. There are vital aspects to
promoting energy efficiency policies more effectively, looking into
enhancing the rate of implementation of energy-efficient
technology. Several strategies could encourage innovation in
ESCO, i.e., incentive programs, building rating programs, and
financing opportunities. The potential benefits are crystal clear to
the companies, government, and environment.
This study gained a deeper understanding of the obstacles in
promoting energy efficiency practices in Indonesia's Building
Energy Efficiency and ESCO. Therefore, the results of this study
have implications for management science, management practices
in the company and commercial building industry in Indonesia,
and the government as a regulator.
A. Policy Implication
Retrofitting business development in the building energy
efficiency industry can create business opportunities for many
companies in Indonesia. The Indonesian government can make
meaningful adjustments to support retrofitting businesses in
the industrial building sectors. These correct policies will be
CONCLUSION

148
REFERENCES
Abdullah, M A, A Öhrwall Rönnbäck, and G Ölundh Sandström.
2010. “Building Networks for Delivering Integrated
Product-Service Offerings ( IPSOs ).” In The 2nd CIRP
IPS2 Conference, Linköping, Sweden, 499–506.
Abrahamse, Wokje, Linda Steg, Charles Vlek, and Talib
Rothengatter. 2005. “A Review of Intervention Studies
Aimed at Household Energy Conservation.” Journal of
Environmental Psycology 25: 273–91.
Adams, Cynthia. 2012. “Valuing Energy Efficiency in the Real
Estate Community.” : 13–24.
Adiwoso, Naning. 2010. “Towards Indonesia’s Sustainable Future
Through Sustainable Building and Construction.” In
SB10SE,.
Almeida, Aníbal De, Bruno Santos, Bertoldi Paolo, and Michel
Quicheron. 2014. “Solid State Lighting Review – Potential
and Challenges in Europe.” Renewable and Sustainable
Energy Reviews 34: 30–48.
Amit, Raphael, and Christoph Zott. 2001. “Value Creation in E-
Business.” Strategic Management Journal 22: 493–520.
Anastasia, Njo. 2013. “The Way to Encourage Green Building in
Indonesia.” In , 1–14.
Ang, Gcj G.C.J., T. Baines, H Lightfoot, and H. Lighfoot. 2010. “A
Methodology for Adopting Product Service Systems as a
Competitive Strategy for Manufacturer.” CIRP IPS2
Conference 2010: 489–96.
http://www.ep.liu.se/ecp/077/063/ecp10077063.pdf.
Azar, Elie, and Carol C. Menassa. 2012. “A Comprehensive
Analysis of the Impact of Occupancy Parameters in
Energy Simulation of Office Buildings.” Energy and
Buildings 55: 841–53.
http://dx.doi.org/10.1016/j.enbuild.2012.10.002.

160
Building Upgrade Manual.
Vandermerwe, Sandra, and Juan Rada. 1988. “Servitization of
Business: Adding Value by Adding Services.” European
Management Journal 6(4): 314–27.
Wang, Qunwei et al. 2015. “Measurement and Decomposition of
Energy-Saving and Emissions Reduction Performance in
Chinese Cities.” Applied Energy 151: 85–92.
Wang, Wenwen, Xiao Liu, Ming Zhang, and Xuefeng Song. 2014.
“Using a New Generalized LMDI (Logarithmic Mean
Divisia Index) Method to Analyze China’s Energy
Consumption.” Energy 67: 617–22.
http://dx.doi.org/10.1016/j.energy.2013.12.064.
Weill, Peter, and Michael Vitale. 2001. Information Technology
Infrastructure for E-Business.
Willmott Dixon. 2015. “Building Research Establishment
Environmental Ssessment Method (BREEAM).” 16(July).
WSGR. 2012. “Innovations and Opportunities in Energy Efficiency
Finance.” (May): 12.
Xu, Shi Chun, Zheng Xia He, and Ru Yin Long. 2014. “Factors That
Influence Carbon Emissions Due to Energy Consumption
in China: Decomposition Analysis Using LMDI.” Applied
Energy 127(2014): 182–93.
http://dx.doi.org/10.1016/j.apenergy.2014.03.093.

161
BIO NOTE
Dr. Eka Sudarmaji SE.,MM., MCom CBV completed his
undergraduate studies at the Faculty of Economics & Business at
the University of Pancasila, graduating in 1991. The author
received his Master of Management degree from UPI "YAI" in
1995. In 1999, the author was approved to study for a Master of
Commerce with a focus on advanced finance at the University of
Melbourne in Australia.
The author is an independent entrepreneur and an educator,
learning economics and business based on practice, established
new business models: e-Stock and e-Health. The author also shares
his knowledge by lecturing in introductory business courses, e-
business (eCommerce), and entrepreneurship, following his
passions tailored to his expertise, drawn from personal experience
as an entrepreneur and his educational background. The author
has always wanted to contribute to the community, especially to
education, through his experience in establishing and managing
SMEs based on creativity and innovation. He started with the
Chairman of the Incubator Center and currently holds the role of
Chair of Accounting and Taxation Science Studies in the faculty of
business and economics at the University of Pancasila. The author
hopes that his students and his guidance can become
entrepreneurs by utilizing Indonesia's competitive advantages
compared to their neighboring countries.
The author is also active in producing several articles
published in several national and international journals. During
his doctoral program at Sekolah Bisnis - IPB University, the author,
with the help of his supervisor, has published multiple journal
articles and indexing at Sinta 2, Scopus Q1, and Scopus Q4.
Moreover, the author holds the CBV (Certificate Business
Valuation) certification from the Association of Certified Chartered
Accountants (ACCA) International. He has proficiency in
investment, capital market regulation & banking, accounting, and
management and has taken a recent interest in technology, IT, and
162
computer science. Currently, the author holds the responsibility of
a Director at PT. SIPS (Social Impacts) Edutech Indonesia – PMA
company doing business in Digital Health based in Makassar. In
addition, the author still holds his own business in the field of
Property in PT. Agung Sinar Abadi (ASA) and Furniture &
Accessories Manufacturing at CV. Elang Jaya.

163