ethnicity, linguistics, and genetic diversity in native mexicans
TRANSCRIPT
Ethnicity,Linguistics,andGeneticDiversity
inNativeMexicans:Reconstructingthe
PopulationHistoryofMesoamerica
KarlaSandovalMendoza
DOCTORAL THESIS UPF / 2010
THESIS DIRECTOR
Dr.DavidComasMartínez
DepartmentofExperimentalandHealthSciences
ii
Front Cover Artwork: Designed by Paula Laverde© 2010
iii
Papá, Máma Lucha, Cris y Rocío Vargas
In Memoriam

v
“Los indígenas no representan solo muestras
biológicas, son los portadores
esenciales de la historia de la humanidad”
Andrés Aubry 1927 – 2007
“Indigenous populations don't just represent
samples; they are essential contributors to the
understanding of human history”

vii
Agradecimientos
Estetrabajonosoloreflejaungranesfuerzoprofesional,detrásdeel,estaelgran
apoyodemuchaspersonasquemehanacompañadoalolargodeestosañosfuera
deMéxico,aquíenBarcelonaydesdeladistanciaenmipaís.
Principalmente, mi profundo agradecimiento a las comunidades indígenas de
México,enparticularalaTriqui,porenseñarmequelomásvaliosoeslasencillezy
queapesardeluchardiariamentecontralamarginaciónydiscriminaciónsepuede
vivircondignidad.
Gracias Mamá por seguirme siempre tan cerca, cuidarme con tanto amor y
enseñarme a ser libre, sin estas tres cosas no hubiera alcanzado estameta. A ti
Manuelporacompañarnosdurantetodosestosaños.Amigranfamiliaporsermi
punto de referencia, identidad y darme arraigo en losmomentos difíciles por la
distancia, cada uno de ustedes ha estado siempre presente a través de tantas
vivenciasyrecuerdoscompartidos.AmitíaCucaporescucharmeycreertantoen
mi. Ami otra familia por conocerme, entenderme y apoyarme, gracias Arturo y
Cristina por traerme un trocito de México con sus visitas. Y por supuesto a mi
nuevafamiliadeaquí,Loliporsermamáysuegraalavezyorientarmesiempre,
MartayUri,graciasa lostresporhacermesentirpartedesufamilia.A latíaFer
porcoincidiryquedarteenmivida,graciasporlacomplicidad.
Paty,Perla,Edith,Arturo,JuanLuis,JorgeyGabriel,graciasporestarsinimportar
ladistancia.Afortunadamenteestos añosdedoctoradohanestadoacompañados
demomentosmuyricos,quemehanpermitidoconocerentrañablesamigos;Citlali
(vecina) y Eidi, gracias por esos momentos del “radical team”, llenos de risas,
políticaysentimientos.Andrés(vecino)graciasporlasricascomidasfamiliaresy
Jonas(T1)portubondadytransparencia.ABeneporexplicarmeBarcelona.María,
VíctoryTao,siemprehanrepresentadounrefugiollenodecalidez,acompañadode
interminables debates y ricas comidas. A Francisco y Blanca por animarme a
viii
estudiareldoctoradoyapoyarmeeneliniciodeBarcelona.ADamiyAguequeme
adoptarondesdeelinicio.
Gracias David por tener la paciencia de enseñarme el mundo de la genética de
poblaciones y haberte animado a recibir a una antropóloga. A Jaume por la
oportunidaddevenir.AFrancescporsusvaliosasasesoríasyElenaporpercibirme
yescucharme.ACarlesysugenialhumor.AlaLic.Araceli,porserbonitaporfuera
ypordentro.Agradezcoalaspersonasqueseinvolucraronenmitrabajo,alservei
de sequenciacio de la UPF, en particular a Stephi, por estar siempre en la
disposicióndeayudarmeyexplicarme.AMonix,poresforzarseenquemesintiera
partedelgrupo,graciasportugrancorazón.MuchasgraciasJu,porsacarmetodos
los días una sonrisa. Por supuesto a todas las “nenas” a las primeras y las
siguientes, por compartir las risas, preocupaciones, plantas, meriendas y
cotidianidad.AMichellepornuestrasmúltiplescharlasycomplicidades.AKristin
porrecibirmecontantacalidez.AmipequeñolegadolingüísticoIxilú,porsertan
cercanaenestaúltimaetapa.AChiaraporelentendimientotannaturalyprofundo
quesiemprehemostenido,unagranamiga.Yalrestodepersonasquehanpasado
porBioEvodejandoexcelentesrecuerdosenmicabeza,especialmentelasitalianas.
A la Dra. Leonor Buentello, Rosenda Peñaloza, Ricardo Cerda, Gloria Vilchis y
Héctor Rangel, gracias por brindarme su confianza profesional y personal. A
Andrés Ruíz‐Linares y su grupo por hacerme sentir parte de ellos durante mi
estancia en Londres a través de las charlas científicas y personales. Gracias por
compartir tu gran experiencia y abrir todo unmundo de futuras colabraciones.
Graciasa“miAlemana”BarbaraconsuacentoColombiano.
Finalmente,atiAndrés,portomarmedelamanoycorreramiladoenestacarrera,
sintuinmensoapoyohabríasidomuydifícil.Graciasporconfiartantoenmí,por
serungranestímuloycontagiarmetodalatenacidad,energíaypasiónquetienes
porlavida.Lamaneraenquemecuidas,escuchasymeamas,mellenamuchola
vida.Barcelonasiempreseránuestro iniciopersonalyprofesional,dondehemos
aprendido y guardado muchos sueños que seguro llegarán (rf). Gracias por
coincidirdesdehace6años.
ix
Este trabajo se llevó a cabo gracias a la beca que recibí durante el periodo de
Octubre 2004 a Diciembre 2009 por parte del Consejo Nacional de Ciencia y
Tecnología de México (CONACyT) (beca:187621). Así como también a las
siguientes ayudas otorgadas: Ayuda de movilidad (referencia: DCB2005‐0758)
otorgadapor elMinisteriodeEducaciónyCiencia (España);Ayudapara realizar
estancias en el extranjero (23 de abril 2009), otorgada por el Centro de
Investigación Biomédica en Red de Epidemiología y Salud Pública (CIBERESP) y
finalmente a las ayudas otorgadas por la Universidad Pompeu Fabra (Cataluña)
paralapresentaciónydifusióndeestetrabajoendiversoscongresos.
Barcelona,febrero2010

xi
Abstract
Mesoamerica is one of the main centers of New World civilization. It represents today a
large geographical area exhibiting one of the highest genetic, cultural, and archeological
diversity in the Americas. Moreover, its geographic position has been a key factor for
acting as a natural corridor between North and Central-South America, thus becoming a
direct witness not only of the initial and subsequent human migration waves but also of
the many civilizations that flourished later on. Therefore, Mesoamerica deserves special
attention in the study of American history. Following a molecular anthropological
approach, this thesis evaluates the genetic diversity of a representative sample of the
extant Native American gene pool within Mexico, and by constructing continental
datasets, it also intends to contribute to the reconstruction of Mesoamerican history and
the peopling of the Americas. For that purpose, this work focuses on the study of
uniparental markers located in the human mitochondrial DNA and Y-chromosome,
which constitutes the main part of the analyses. Additionally, autosomal STR variation,
linguistic diversity, and ethnographic data were also investigated. Our results, based on
both mtDNA and Y-chromosome, show a clear differentiation of the Native Mexican
groups that belong to Mesoamerica, suggesting that population dynamcs occurring
within this cultural area were unique during the America’s colonization process and
thus uniquely shaped the native Mexican genome.

xiii
Resumen
Mesoamerica merece especial atención dentro del estudio de la historia del Nuevo
Mundo debido a que es una de las principales áreas geográficas con mayor diversidad
genética, cultural y arqueológica en América. Un factor clave es su posición geográfica,
ya que ha actuado como un corredor natural de unión entre Norte y Centro-Suramérica,
convirtiéndose en testigo directo no solo de las primeras y subsecuentes oleadas
migratorias, sino también del posterior florecimiento de grandes civilizaciones
mesoamericanas. Siguiendo un enfoque antropomolecular, la presente tesis doctoral
evalúa la diversidad genética de una muestra representativa del pool genético actual de
las poblaciones nativas de México. Asi mismo, por medio de la construcción de bases
de datos a nivel continental, pretende contribuir a la reconstrucción de la historia
Mesoamericana y del Poblamiento de América. Con este objetivo, se analizaron
marcadores uniparentales localizados en el ADN mitocondrial y el cromosoma Y, lo
cual constituye el principal componente del trabajo. Complementarianente, también se
analizó la variabilidad observada a nivel de STRs autosómicos, clasificacion lingüística
y caracterisitcas etnográficas, lo cual aporta un enfoque multidisciplinario a la
investigación. Nuestros resultados, basados tanto en ADNmt como en cromosoma Y,
muestran una clara diferenciacion de los grupos nativos pertenecientes a Mesoamerica
en comparacion con el resto, sugieriendo la presencia de una dinámica poblacional
única y enfatizando la relevancia de esta área cultural en el proceso de colonización de
América.

xv
Index
INTRODUCTION ................................................................................................ 1
1 ThePeoplingoftheAmericas ....................................................................... 3
1.1 FossilandArcheologicalEvidence ......................................................... 5
1.2 MorphologicalEvidence.......................................................................... 6
1.3 LinguisticEvidence:TheGreenbergtheoryandbeyond........................ 8
1.4 GeneticEvidence:MolecularAnthropology.......................................... 11
2 GeneticStudiesintheAmericasbasedonuniparentalMarkers................. 16
2.1 MitochondrialDNAandmainfeatures .................................................. 16
2.1.1 mtDNAPhylogenyandPhylogeography........................................ 18
2.1.2 MitochondrialDNAdiversityinAmerica ......................................... 23
2.1.3 RoutestoAmerica:mtDNAlineages.............................................. 28
2.1.3.1 Asingleandearlymigrationand“OutofBeringia”.................. 28
2.1.3.2 Twoindependentmigrations ................................................... 30
2.1.3.3 Multiplemigrations................................................................... 30
2.1.3.4 BIM:BeringianIncubationModel............................................. 30
2.1.3.5 PacificCoastalModel .............................................................. 32
2.1.3.6 Three-StageModel.................................................................. 32
2.2 Ychromosomeandmainfeatures........................................................ 35
2.2.1 Y-chromosomePhylogenyandPhylogeography ........................... 37
2.2.2 Y-chromosomediversityinAmerica............................................... 40
2.2.3 RoutestoAmerica:Y-chromosome ............................................... 46
2.2.3.1 PlaceoforiginanddataentrytotheAmericas........................ 47
2.2.3.2 Singlefoundinghaplotypeandsinglewave ............................ 49
2.2.3.3 Twofoundinghaplotypesandtwowaves................................ 50
2.2.3.4 Othermodels ........................................................................... 52
xvi
2.2.4 LocalDiversity:Y-chromosomestudiesinMexicanpopulations ... 54
3 Mesoamerica............................................................................................... 57
3.1 Generalbackground ............................................................................. 57
3.2 Archeologicalrecord ............................................................................. 59
3.3 Linguisticclassification ......................................................................... 61
4 NativeMexicanPopulations ........................................................................ 63
4.1 Culturaltraits......................................................................................... 64
4.2 LinguisticDiversity ................................................................................ 65
4.3 GeneticDiversity................................................................................... 65
OBJECTIVES.................................................................................................... 67
RESULTS ......................................................................................................... 71
Chapter1:Nutritionalstatusofthepoor,marginalizedadultsoftheTriquiethnicgroupinOaxaca,Mexico. ................................................................... 73
Chapter2:LinguisticandmaternalgeneticdiversityarenotcorrelatedinNativeMexicans ............................................................................................ 83
Chapter3:PaternallineagesinNativeMexicansshowasex-biasedadmixtureandlackofgeneticstructureinMesoamerica .............................. 97
Chapter4:OriginandGeneticDifferentiationofThreeMexicanNativeGroups(Purépechas,TriquisandMayas):ContributionofCODIS-STRstotheHistoryofHumanPopulationsofMesoamerica ...................................................... 139
DISCUSSION.................................................................................................. 191
ConcludingRemarks ................................................................................... 197
BIBLIOGRAPHY ............................................................................................. 199
APPENDIX...................................................................................................... 219
Appendix1:Geneticorigin,admixture,andasymmetryinmaternalandpaternalhumanlineagesinCuba................................................................ 221
xvii
Abreviations
mtDNA: Mitochondrial DNA RFLPs: Restriction fragment length polymorphisms SNP: Single nucleotide polymorphism STR: Short tandem repeat Ybp: years before present Kb: Kilo bases Kya: Thousand years ago Mb: Megabases Kyr: Thousand years Mya: Million years ago AD: Anno Domini BC: before Christ LGM: Last Glacial Maximum
DHPLC: Denaturing high-performance liquid chromatography
YCC: Y-chromosome consortium
TMRCA: Time of the most recent common ancestor
NRY: Non-recombining region of Y-chromosome
MSY: Male-specific region of Y-chromosome
HVRI/II: Hypervariable Region I and II
PCR: Polymerase chain reaction
CRS: Cambridge Reference Sequence
Fig: Figure e.g.: for example
i.e.: that is
km: kilometer(s)

1
INTRODUCTION

INTRODUCTION
3
1 ThePeoplingoftheAmericas
The peopling of the Americas is one of the most fascinating questions to be solved in
human history, and despite it has been largely studied by different disciplines and
research approaches, it remains one of the most controversial issues in modern
anthropology. Researchers have focused much of their attention in solving particular
questions such as:
• When did humans first enter the Americas and where did they come from?
• How many migrations were there and which geographic routes were taken into
the Americas by migrant peoples?
• What was the size of the founding populations?
• To which extent the record of the original colonization is retained in Native
American genetic variation?
• What is the resulting genetic structure of extant Native American populations?
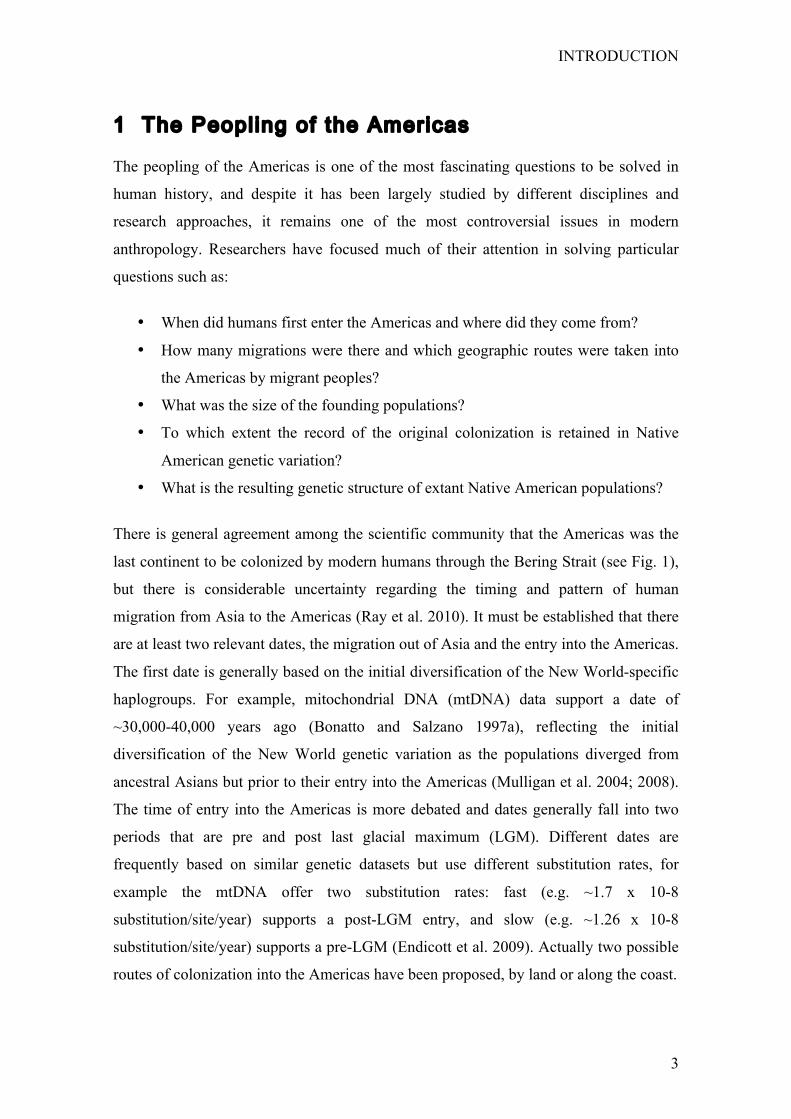
There is general agreement among the scientific community that the Americas was the
last continent to be colonized by modern humans through the Bering Strait (see Fig. 1),
but there is considerable uncertainty regarding the timing and pattern of human
migration from Asia to the Americas (Ray et al. 2010). It must be established that there
are at least two relevant dates, the migration out of Asia and the entry into the Americas.
The first date is generally based on the initial diversification of the New World-specific
haplogroups. For example, mitochondrial DNA (mtDNA) data support a date of
~30,000-40,000 years ago (Bonatto and Salzano 1997a), reflecting the initial
diversification of the New World genetic variation as the populations diverged from
ancestral Asians but prior to their entry into the Americas (Mulligan et al. 2004; 2008).
The time of entry into the Americas is more debated and dates generally fall into two
periods that are pre and post last glacial maximum (LGM). Different dates are
frequently based on similar genetic datasets but use different substitution rates, for
example the mtDNA offer two substitution rates: fast (e.g. ~1.7 x 10⁻⁸
substitution/site/year) supports a post-LGM entry, and slow (e.g. ~1.26 x 10⁻⁸
substitution/site/year) supports a pre-LGM (Endicott et al. 2009). Actually two possible
routes of colonization into the Americas have been proposed, by land or along the coast.
INTRODUCTION
4
Since the last three decades until recent days there has been a remarkable increase on
the interest to propose complex theories based not only on genetic data but also organic
remains, morphological, and archaeological data. The addressed questions may remain
the same as the first classical studies, but as new technologies have been available,
some approaches have changed. Here, I start by briefly reviewing the main sources of
evidence to tackle the long-standing and interesting question about how the American
continent was colonized by modern humans.
Figure 1: Colonization of the Americas: possible routes followed by founder populations (red
arrows) and main archeological sites (black dots) (from Stringer and Andrews 2005)
INTRODUCTION
5
1.1 FossilandArcheologicalEvidence
Human fossils provide a strong evidence for the presence of modern humans in the
Americas. This data associated with other sources could give accurate information about
the timing of entry and morphological traits of the first colonizers. The number of early
fossils is small, here I mention some of the most remarkable specimens (Jobling et al.
2004). “Luzia” skull and some additional bones were found in 1975 in the Lapa
Vermelha rock shelter in Minas Gerais, Brazil, dated 13.5 cal Kya (Neves 2000; van
Vark et al. 2003). “Buhl Woman” was found in a quarry near to Bulh, Idaho in 1989
with artifacts including an obsidian biface and bone needle, suggesting an intentional
burial, dating of bone collagen gave ~12.9 cal Kya (Green et al. 1998) . “Prince of
Wales Island Man” discovered in 1996 is presented by a lower jaw, vertebra and pelvis
found with a stone point in a cave near to the coast of Prince of Wales, Island, Alaska;
The jaw was date to ~11 cal Kya, providing support to the coastal migration route
(Jobling et al. 2004). “Spirit Cave Man” is represented by a burial of a short man aged
40-45 years with sings of dental abscess and several injuries, partially mummified by
the dry conditions, providing unusual insights into ancient fossils; was found in 1940 in
Nevada, dated ~10.6 cal Kya (Jantz and Owsley 2001). “Kennewick Man” was
discovered 1996 eroding from the banks of Colombian River in Washington State, is
represented by almost complete skeleton of 40-45 man; The radiocarbon date was ~8.4
Kya, corresponding to 9.3-9.5 cal Kya (van Vark et al. 2003). A controversy was
generated focused on his European skeletal morphology, was he truly ancestral to
modern Native Americans? (Dalton 2005), many attempts to amplify DNA by several
labs have been unsuccessful (http://www.nps.gov/history/aad/Kennewick/#dna).
The Clovis culture was the first archeological evidence of modern humans in the
Americas, dated around 13.5 Kya. There have been many claims for the Pre-Clovis
remains, now widely accepted. The Clovis cultural complex was named after the town
of Clovis in New Mexico located near to the Blackwater Draw (the first site) was
studied. It is characterized by Clovis Points, fluted (grooved) projectile points
constructed from a variety of stone types. The earliest Clovis remains dated from
around ~13.5 Kya, and the culture appear to have spread over munch of the
nonglaciated part of North America within a few hundred years, but was soon replaced
by other styles of points, The Folson (~12.9-12,000 ybp), distinguished by their small
INTRODUCTION
6
size and longer flutes. The Clovis people (called Paleoindians) were big game hunters,
their points are found associated with bones of large animals like mammoths (Waters
and Stafford 2007). Clovis points are not found outside North America, but
Paleoindians remains are also know from many sites in South America. Some
contemporaneous of Clovis or Folsom, are those from the Caverna da Pedra Pintada
near to Monte Alegre in Amazonian Brazil (Roosevelt et al. 1996).
The discovery of archaeological sites predating Clovis (Adovasio and Pedler 1997;
Dillehay 2000; Dillehay et al. 2008) has been particularly influential in stirring debates
around the antiquity of the initial settlement of America. Also, the analyses of genetic
data have generally been found to be consistent with a pre-Clovis settlement (Bortolini
et al. 2003; Bourgeois et al. 2009; Fagundes et al. 2008; Fuselli et al. 2003; Tamm et al.
2007; Wang et al. 2007; Zegura et al. 2004). Archeological evidence has a range of 11-
33,000 ybp for the first settlements in Beringia and the New World (Hoffecker et al.
1993) and (Szathmary 1993). Some current studies have new consensual ideas:
archaeological data shows evidence of human presence in the Yana RHS site in Siberia
before LGM (Pitulko et al. 2004), and the first colonizers enter through Bering around
16,000 ybp, leaving footprints of their presence in southern sites like Monte Verde
14,600 ybp (Dillehay 2000; Dillehay et al. 2008); Monte Verde II 14,200 and 13,800
ybp in Chile and Pedra Pintada 12,000 ybp in Brazil (Dillehay 2000; Dixon 1999).
1.2 MorphologicalEvidence
The studies of craniometrical variation in American human remains have shown
morphological differences between the earliest settlers of the continent and some of the
later Amerindian populations and the causes of this variation among human populations
have been subject of controversy (Perez et al. 2009; Perez and Monteiro 2009). Since
the beginning of the 90’s the anthropologists Neves and Pucciarelli started to study the
morphological affinities and differences, supporting a multiwave colonization of the
Americas by the comparison of cranial traits of early South American remains with
worldwide human remains from the Late Pleistocene and Holocene concluded that the
Americas were occupied by undifferentiated premongoloid colonizers, and suggested
that their results called for more detailed investigations about human micro-evolution in
INTRODUCTION
7
the Americas (Neves and Pucciarelli 1991). Some years after Neves and Hubbe (Neves
and Hubbe 2005) compared the largest sample of early American skulls ever studied
with worldwide data sets representing global morphological variation in humans,
through three different multivariable analyses. Their results show a close morphological
affinity between South American Paleoindians and the extant Australo-Melanesianas
groups, supporting the hypothesis that two distinct biological populations could have
colonized the Americas in the Pleistocene/Holocen transition (Neves and Hubbe 2005).
Some studies have been based on the comparison between Cranial and DNA data. Perez
et al. (2009) comparing craniometric and mtDNA data of diachronic samples from East
Central Argentina dated from 8,000 to 400 ybp, showed that even when the oldest
individuals display traits attributable to Paleoamerican crania, they present the same
mtDNA haplogroups as later populations with Amerindian morphology. A possible
explanation for these results could be that the craniofacial differentiation was a local
phenomenon resulting from random (i.e. genetic drift) and non-random factors (e.g.
selection and plasticity). Local processes of morphological differentiation in America
are a probable scenario if rapid peopling and the great ecological diversity of America
continent is taking in consideration (Perez et al. 2009). Similar studies not only based
on cranial data but also in dental morphometric data have been recently done by Bernal
and (Bernal et al. 2009a; 2009b), in order to investigate the possible factors for dental
variation among human populations from South America, the results shown that the
ecological factors as the dominant factor on dental size diversification in this region,
while evolutionary relationships account for variation in dental shape (Bernal et al.
2009a).
Other studies have been based on geometric morphology analysis of late
Plesitocene/early Holocene remains and modern skulls. González-José et al. (2008)
proposed an interdisciplinary view of the settlement dived in four arbitrary periods
indicate evolutionary changes across time, suggesting that recent contact among Asian
and American circum-Arctic populations took place during the Holocene. The
geometric morphology studies made in particular areas like Mesoamerica, allows
making inferences about the cultural transitions in particular times, like replacement at
the Classic-Postclassic transition in Mexico (Gonzalez-Jose et al. 2008). The Spanish-
Amerindian contact can be considered a good scenario to explain the morphological
INTRODUCTION
8
outcome in human cranial samples shown by Martínez-Abadías et al. (2006), their
results were in accordance with the previous molecular and historical interpretations,
providing evidence that admixture is a main microevolutionary agent influencing
modern Mexican gene pool (Martinez-Abadias et al. 2006).
1.3 LinguisticEvidence:TheGreenbergtheoryandbeyond
In (1986) Greenberg, Turner, and Zegura, proposed one of the first interdisciplinary
models based on linguistic, morphological and genetic data. They postulated that the
ancestors of the present day Native American populations came from Asia via the
Bering Strait in three different migratory waves and times. According to this theory, the
first migration wave occurred approximately 11,000 ybp. The modern descendants of
this migration speak languages that belong to the Amerind family, which has
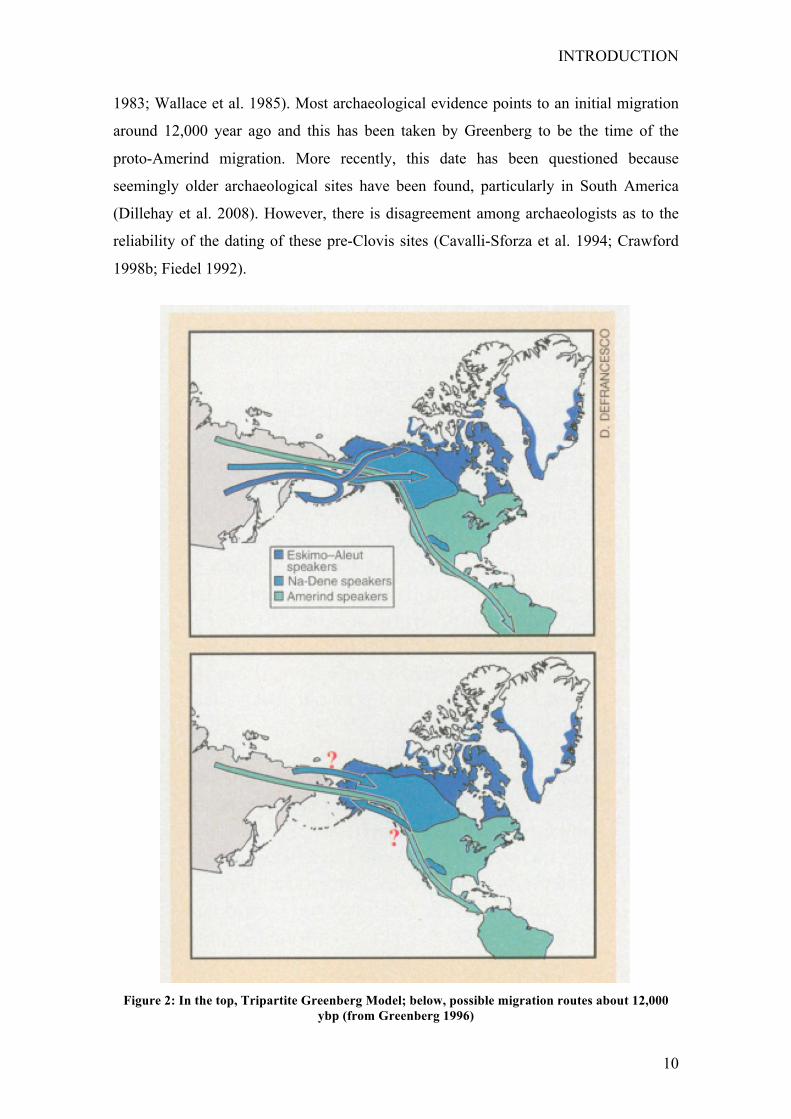
representatives widely dispersed throughout North and South America (Fig. 2). The
second wave occurred about 9,000 ybp; its modern descendants include speakers of Na-
Dene languages. Na-Dene speaking populations are concentrated in Alaska and
northwest Canada. Na-Dene speaking populations are also found sporadically
throughout the Pacific Northwest, and include the large Apache and Navajo populations
in the Southwest. The last proposed migration into the Americas was more recent, about
4,000 ybp. Its modern descendants include speakers of Eskimo-Aleut languages who
live in the arctic and are distributed from Alaska to Greenland. The three-migration
theory provided a provocative hook to frame a flood of molecular genetic studies that
began in the 1990s (Torroni et al. 1992).
The three-migration theory has important mistakes, the support from three distinct lines
of evidence: linguistics, dental morphology, and classical genetic markers (Greenberg et
al. 1986) nowadays is refutable. Researchers recognized that not only the genetics were
the weakest support for the theory but also the linguistic classification (Bolnick et al.
2004). The major weakness was that very few genetic data existed, and the power of
these data to resolve competing hypotheses was weak. The principal genetic line of
supporting evidence was drawn from the Gm locus, which showed that allele frequency
differences among populations paralleled membership in the three language families
INTRODUCTION
9
(Williams et al. 1985). However, these differences among populations were also
compatible with a single migration followed by geographic isolation and allele
frequency change by genetic drift (Szathmary 1993). The majority of linguistics
provided the best evidence favoring the three-migration theory, but the issue was still
debated. Although most linguists in the mid-1980s would have agreed with Boas (Boas
1973 (1933)) original assessment that the Americas had not been settled long enough
for the vast linguistic diversity to evolve in situ, they did not all endorse Greenberg’s
language classification or model for the peopling of the Americas (Campbell 1997). It is
difficult to place precise times on the origin and divergence of languages because the
modes and rates of change in language are not well understood. Recently, the perceived
need for substantial time to generate linguistic diversity was challenged. A new
hypothesis suggests that diversity in a linguistic stock explodes as small colonizing
groups fill new niches, but this linguistic diversity collapses as population density
increases and isolated groups reconnect (Nettle 1999). The interpretation of dental
morphology was open at the outset. Laughlin (Greenberg et al. 1986) commented that
“The dental evidence carries no hint of a triple division but rather is eloquent evidence
of a single migration”. Meltzer (1993) noted that Aleuts are more similar dentally to Na-
Dene than to Eskimos, contradicting the linguistic affinities. Nonetheless, the three-
migration theory gained steam and remains one of the main tenets against which
questions are formulated and data are interpreted today. In summary, many populations
throughout the Americas share a limited set of Y-chromosome and mtDNA
haplogroups. These haplogroups are also found in Asian populations, but rarely. The
scarcity of the lineages in Asia makes it improbable that different migrating populations
would draw the same set independently. Therefore, the genetic data lend no particular
support to the three-migration hypothesis. Instead, a single migration to the Americas
that carried all founding lineages simultaneously is a more parsimonious and preferable
explanation (Mulligan et al. 2004).
One of the main contributions of the tripartite model was to provide a new vision
(interdisciplinary) to the researches, in which Greenberg and colleagues tried to
integrated different evidences to reconstruct the peopling of the Americas. Many other
studies, based on linguistic, genetic data and archeological data, have not supported the
tripartite model (Bolnick et al. 2004; Campbell 1977; Campbell 1997; Chakraborty and
Weiss 1991; Karafet et al. 1999; Laughlin 1988; Spencer et al. 1977b; Szathmary et al.
INTRODUCTION
10
1983; Wallace et al. 1985). Most archaeological evidence points to an initial migration
around 12,000 year ago and this has been taken by Greenberg to be the time of the
proto-Amerind migration. More recently, this date has been questioned because
seemingly older archaeological sites have been found, particularly in South America
(Dillehay et al. 2008). However, there is disagreement among archaeologists as to the
reliability of the dating of these pre-Clovis sites (Cavalli-Sforza et al. 1994; Crawford
1998b; Fiedel 1992).
Figure 2: In the top, Tripartite Greenberg Model; below, possible migration routes about 12,000
ybp (from Greenberg 1996)
INTRODUCTION
11
1.4 GeneticEvidence:MolecularAnthropology
Molecular anthropology is the field of anthropology that makes inferences on human
evolution analyzing biological variation within and among species at the molecular
level. The term “molecular anthropology” was first introduced by Emile Zuckerkandl in
1962 at the Burg Wartenstein Symposium “Classification and human evolution”
(Goodman et al. 1976), where he stated that molecules can offer us as much information
on phylogeny as fossil data, and possibly even more (Dietrich 1998).
However, the research in this area began much earlier than its baptism. In fact, it was
between 1900 and 1902 that Landsteiner discovered the blood group system (Lewontin
1982). The studies on immunological reactions, due to the interaction between different
types of blood, were the first ones to highlight the existence of a molecular variation
among individuals, following a Mendelian way of inheritance. The first ABO
population study was published in 1919 by Hirszfeld and Hirszfeld (Mourant 1961).
The subsequent identification of other blood Group protein markers, such as MNS and
Rh, expanded the range of polymorphisms that could be analyzed by the use of
antibodies. Immunological methods remained the only technique used to detect genetic
variation until 1949, when Pauling and introduced electrophoresis to separate different
variants of hemoglobin (Pauling et al. 1949). This innovation paved the way to the
analysis of electrophoretical variation in several blood proteins. Thanks to these studies,
allelic frequencies started to be considered and description of populations in terms of
these variables began. In 1954 the first book on allele frequencies in human populations
was published (Mourant 1954).
In the 1960s other important innovations in the field of evolutionary biology occurred.
It was in these years when Cavalli-Sforza and Edwards formulated the concept of
genetic distance. These authors started to quantify the differences between populations
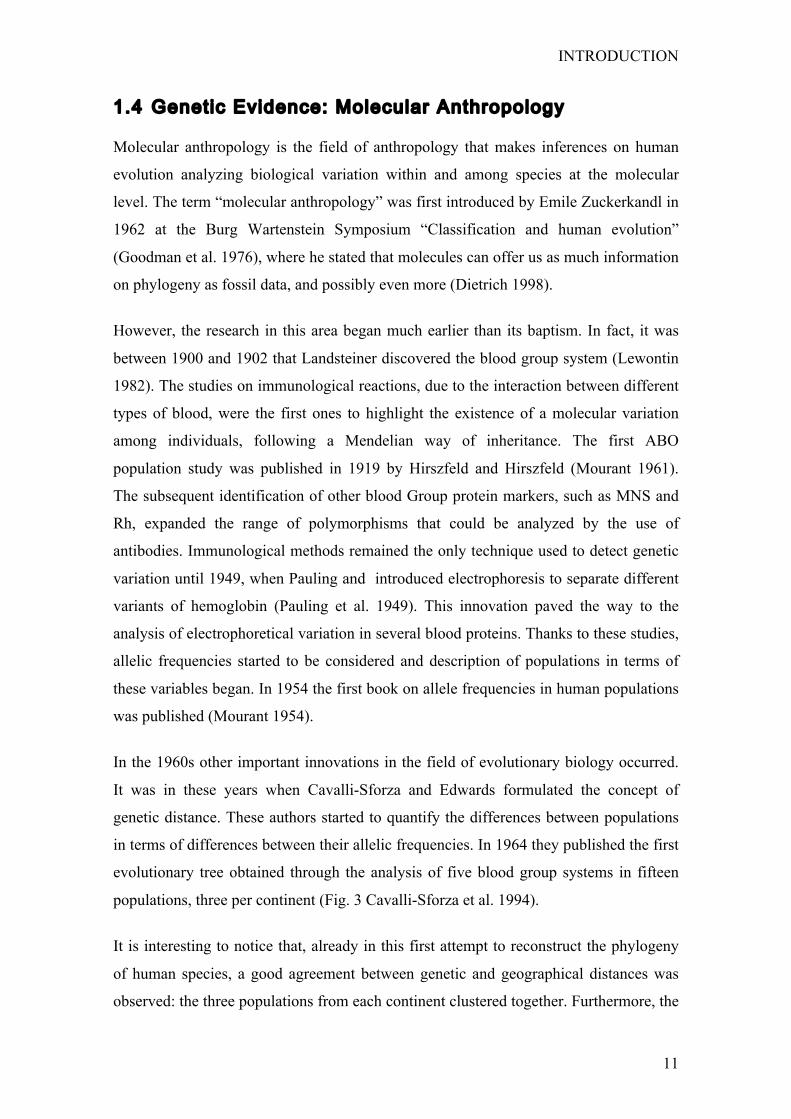
in terms of differences between their allelic frequencies. In 1964 they published the first
evolutionary tree obtained through the analysis of five blood group systems in fifteen
populations, three per continent (Fig. 3 Cavalli-Sforza et al. 1994).
It is interesting to notice that, already in this first attempt to reconstruct the phylogeny
of human species, a good agreement between genetic and geographical distances was
observed: the three populations from each continent clustered together. Furthermore, the
INTRODUCTION
12
presence in the same branch of American Indians and Asiatic populations confirmed the
hypothesis of the Mongolic origin of the former and that they passed through Bering
strait to reach the American continent (Cavalli-Sforza et al. 1994).
Figure 3: Evolutionary tree of 15 human populations reconstructed on the basis of 20 alleles from
five blood groups systems (from Cavalli-Sforza et al., 1994)
Zuckerkandl and Pauling, on one hand, and Margoliash, on the other, had independently
introduced a few years before the concept of molecular clock: “if the elapsed time is the
principal variable that determines the number of accumulated substitutions, it should be
possible to estimate approximately in which period two lineages that led to two different
species diverged” (Dietrich 1998). In this definition, the neutrality of the region under
consideration was assumed; in fact, if this is not the case, we could not consider the
evolutionary rate to be constant in time and among species or populations.
Consequently, we could not use aminoacidic substitutions to estimate the divergence
time between species. It was time to understand that the analysis of neutral polymorphic
genomic regions was necessary for the study of evolution.
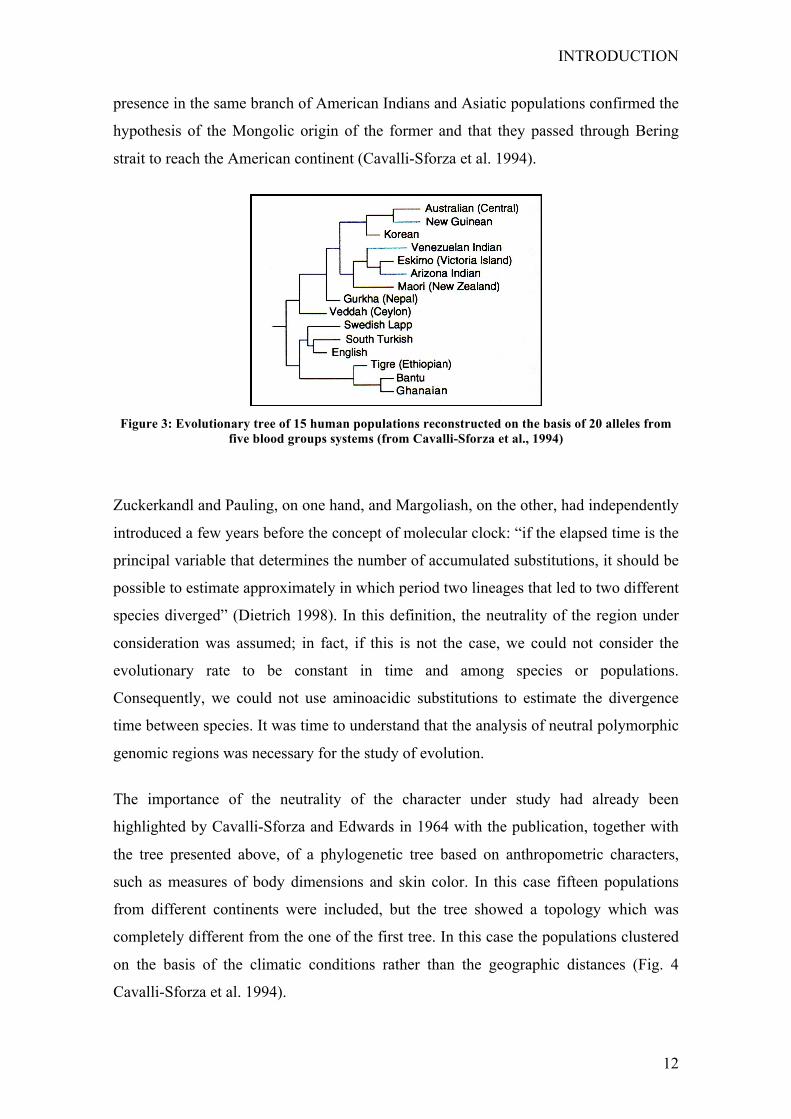
The importance of the neutrality of the character under study had already been
highlighted by Cavalli-Sforza and Edwards in 1964 with the publication, together with
the tree presented above, of a phylogenetic tree based on anthropometric characters,
such as measures of body dimensions and skin color. In this case fifteen populations
from different continents were included, but the tree showed a topology which was
completely different from the one of the first tree. In this case the populations clustered
on the basis of the climatic conditions rather than the geographic distances (Fig. 4
Cavalli-Sforza et al. 1994).
INTRODUCTION
13
Figure 4: Evolutionary tree of 15 human populations reconstructed on the basis of anthropometric
characters (from Cavalli-Sforza et al., 1994)
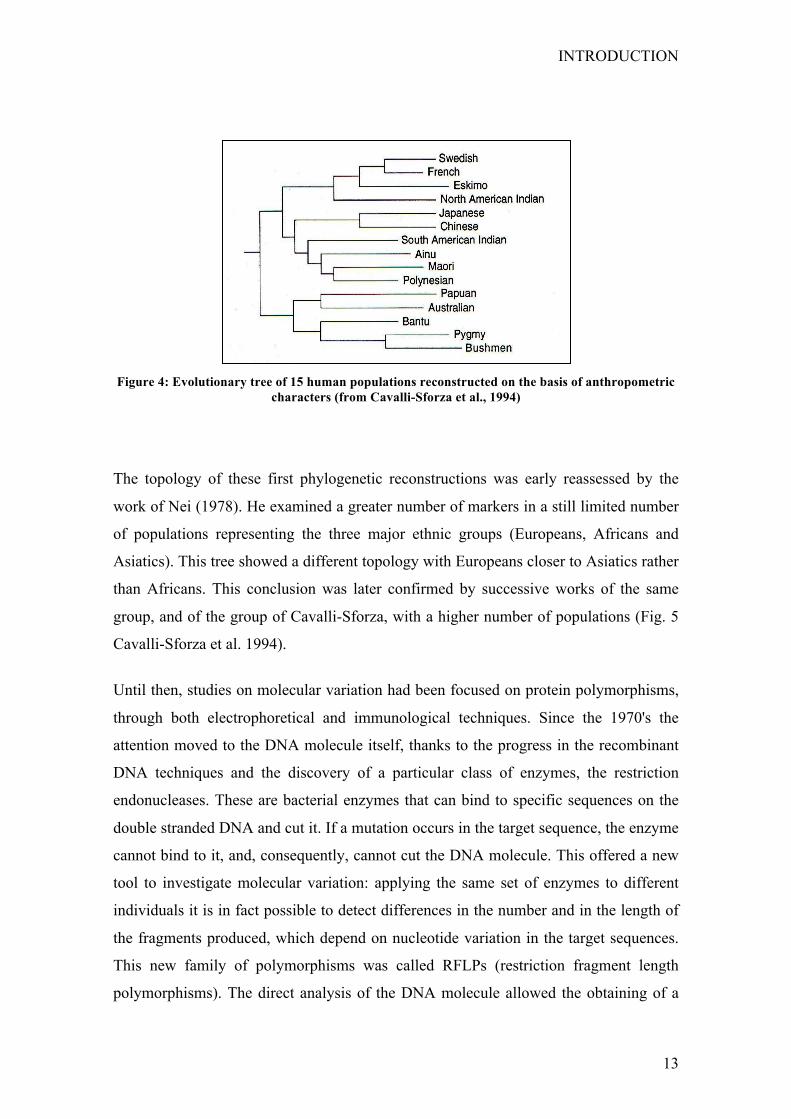
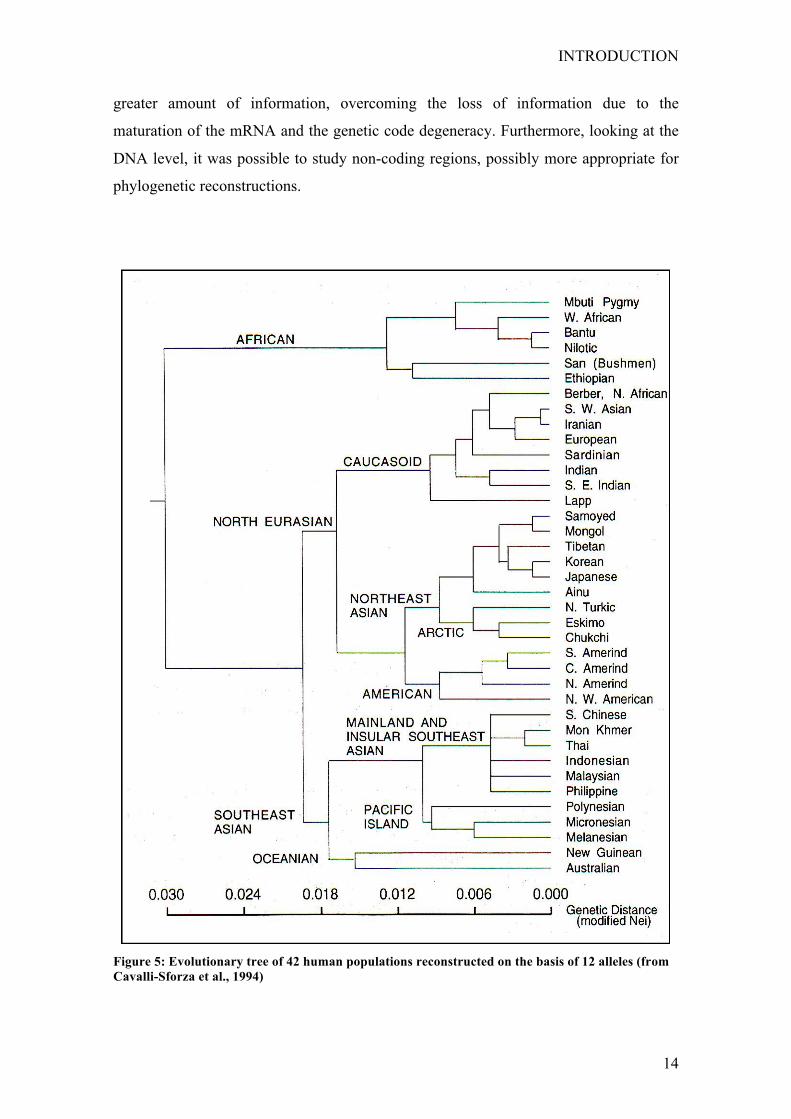
The topology of these first phylogenetic reconstructions was early reassessed by the
work of Nei (1978). He examined a greater number of markers in a still limited number
of populations representing the three major ethnic groups (Europeans, Africans and
Asiatics). This tree showed a different topology with Europeans closer to Asiatics rather
than Africans. This conclusion was later confirmed by successive works of the same
group, and of the group of Cavalli-Sforza, with a higher number of populations (Fig. 5
Cavalli-Sforza et al. 1994).
Until then, studies on molecular variation had been focused on protein polymorphisms,
through both electrophoretical and immunological techniques. Since the 1970's the
attention moved to the DNA molecule itself, thanks to the progress in the recombinant
DNA techniques and the discovery of a particular class of enzymes, the restriction
endonucleases. These are bacterial enzymes that can bind to specific sequences on the
double stranded DNA and cut it. If a mutation occurs in the target sequence, the enzyme
cannot bind to it, and, consequently, cannot cut the DNA molecule. This offered a new
tool to investigate molecular variation: applying the same set of enzymes to different
individuals it is in fact possible to detect differences in the number and in the length of
the fragments produced, which depend on nucleotide variation in the target sequences.
This new family of polymorphisms was called RFLPs (restriction fragment length
polymorphisms). The direct analysis of the DNA molecule allowed the obtaining of a
INTRODUCTION
14
greater amount of information, overcoming the loss of information due to the
maturation of the mRNA and the genetic code degeneracy. Furthermore, looking at the
DNA level, it was possible to study non-coding regions, possibly more appropriate for
phylogenetic reconstructions.
Figure 5: Evolutionary tree of 42 human populations reconstructed on the basis of 12 alleles (from Cavalli-Sforza et al., 1994)
INTRODUCTION
15
However, the effective turning point for the molecular analysis of DNA came in 1987
when Kary Mullis developed the Polymerase Chain Reaction (PCR) (Mullis and
Faloona 1987). This is an in vitro technique to isolate and amplify a specific fragment
of DNA, faster and cheaper than the recombinant DNA techniques. Furthermore, its
introduction had important consequences on the sequencing techniques previously
developed, like the Sanger method (Sanger et al. 1977), which found an easier
application.
The advances in molecular biology increased considerably the number of studies in the
field of molecular anthropology, and the increased level of resolution of the molecular
analyses allowed for a more detailed investigation. The first genomic region to be taken
into account was the mitochondrial DNA (mtDNA), due to some key advantages: it is
small, present in numerous copies in the cell, does not recombine, and has a region of
approximately 1000 base pairs without functional constraints. The role of this molecule
in molecular anthropology will be explained in section 2.1, and subsequent sections will
review some of the mtDNA studies that have shed light to the understanding of the
genetic diversity in the Americas. Likewise, since the mid 1990s a second region of the
genome attracted considerable interest, the Y-chromosome, which is the natural
counterpart of the mitochondrial DNA. It contains a non-recombining region and a
lower mutation rate than mtDNA, making it a potentially more reliable system for
phylogenetic reconstructions. The role of Y-chromosome in the study of human genetic
variation will be discussed in section 2.2, and will be extended in subsequent sections
with an emphasis on the implications for the study of the population history of the
Americas.
INTRODUCTION
16
2 GeneticStudiesintheAmericasbasedonuniparentalMarkers
2.1 MitochondrialDNAandmainfeatures
The human mitochondrial DNA (mtDNA) is a circular double-stranded molecule,
consisting of 16,569 base pairs (Anderson et al. 1981). It is located inside the
mitochondria and it is present in numerous copies in the cell. In fact, each
mitochondrion contains between 2 to 10 copies of mtDNA and each cell contains as
much as 1000 mitochondria. Its two strands are biased in their base content, with the
purine-rich and the pyrimidine-rich strands named “heavy” and “light”, respectively
(Chinnery 2006).
The mtDNA is a haploid genome and codes for 13 subunits of the oxidative
phosphorylation system, 2 ribosomal RNAs (rRNAs) and 22 transfer RNAs (tRNAs). A
fragment of approximately 1kb is the only non-coding region, and it is involved in the
regulation of transcription and replication of the molecule. It is therefore named control
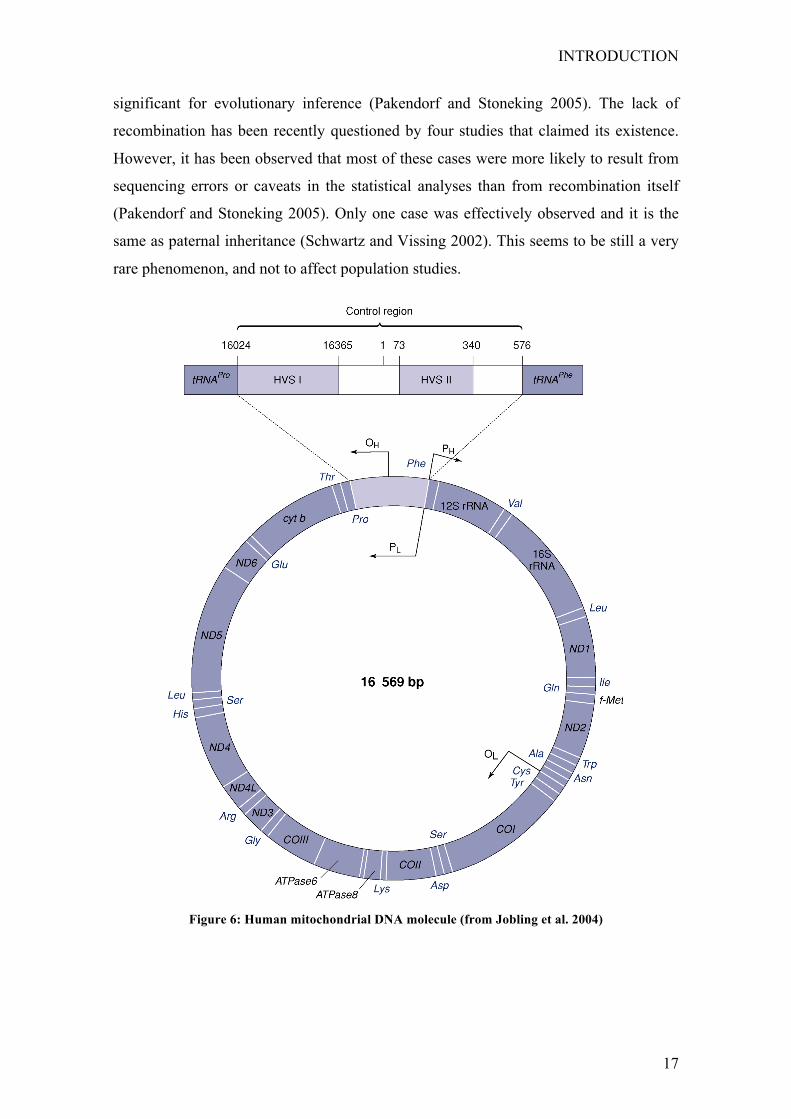
region (Chinnery 2006; Pakendorf and Stoneking 2005) (see Fig. 6).
The entire sequence of a human mtDNA was published at the beginning of the 1980s by
Anderson and (1981), and from then on it has been known as the Cambridge Reference
Sequence (CRS). This has been more recently revised by Andrews and (1999). Given
its unique proprieties, mtDNA is one of the suitable genetic markers for the study of
human population history and evolution. It is present in high copy number in human
cells; this property makes it easier to obtain mtDNA for genetic analyses. It is a haploid
system with apparent lack of recombination, high mutation rate, only inherited
maternally, which allows tracing back female lineages. The high number of copies of
mtDNA in each cell makes this genomic region particularly easy to extract and analyze,
this property is especially important when studying DNA extracted from fossils or
degraded samples.
Although one case of paternal inheritance was observed in man (Schwartz and Vissing
2002), exceptions to maternal inheritance are assumed to be extraordinary and non-
INTRODUCTION
17
significant for evolutionary inference (Pakendorf and Stoneking 2005). The lack of
recombination has been recently questioned by four studies that claimed its existence.
However, it has been observed that most of these cases were more likely to result from
sequencing errors or caveats in the statistical analyses than from recombination itself
(Pakendorf and Stoneking 2005). Only one case was effectively observed and it is the
same as paternal inheritance (Schwartz and Vissing 2002). This seems to be still a very
rare phenomenon, and not to affect population studies.
Figure 6: Human mitochondrial DNA molecule (from Jobling et al. 2004)
INTRODUCTION
18
Concerning the mutation rate, this is several orders of magnitude higher than that of
nuclear genes, with an estimated rate of 0.017 x 10⁻⁶ substitutions per site per year,
without considering the control region (Ingman et al. 2000). In the control region the
rate is even higher, even if the exact rate is still a matter of controversy. In fact,
phylogenetic estimates yielded a rate of 0.075-0.165 x 10⁻⁶ substitutions per site per
year, while pedigree estimates yielded an average rate of 0.47 x 10⁻⁶ substitutions per
site per year, significantly higher than the first ones. However, at present, the
phylogenetic estimates are preferred for population studies (Howell et al. 2003). A
recent study offered a new mutation rates for the whole mtDNA molecule (Soares et al.
2009).
2.1.1 mtDNAPhylogenyandPhylogeography
Pioneer studies on mtDNA as a molecular marker started in the late 1970s by digestion
of the molecule with a single restriction enzyme in a large number of samples (Denaro
et al. 1981), or with several enzymes in fewer samples (Brown 1980). Subsequent
studies were based on a greater number of enzymes (5 or 6) (Johnson et al. 1983;
Santachiara Benerecetti et al. 1988; Scozzari et al. 1988). The resulting phylogeny was
starlike, with a single central haplotype, shared among populations worldwide, and
originating several lineages, some of which population specific. This gave support to
the “multiregional” hypothesis for the origin of modern humans, since it seemed that all
populations could have shared a common evolutionary history for a long time (Richards
and Macaulay 2001).
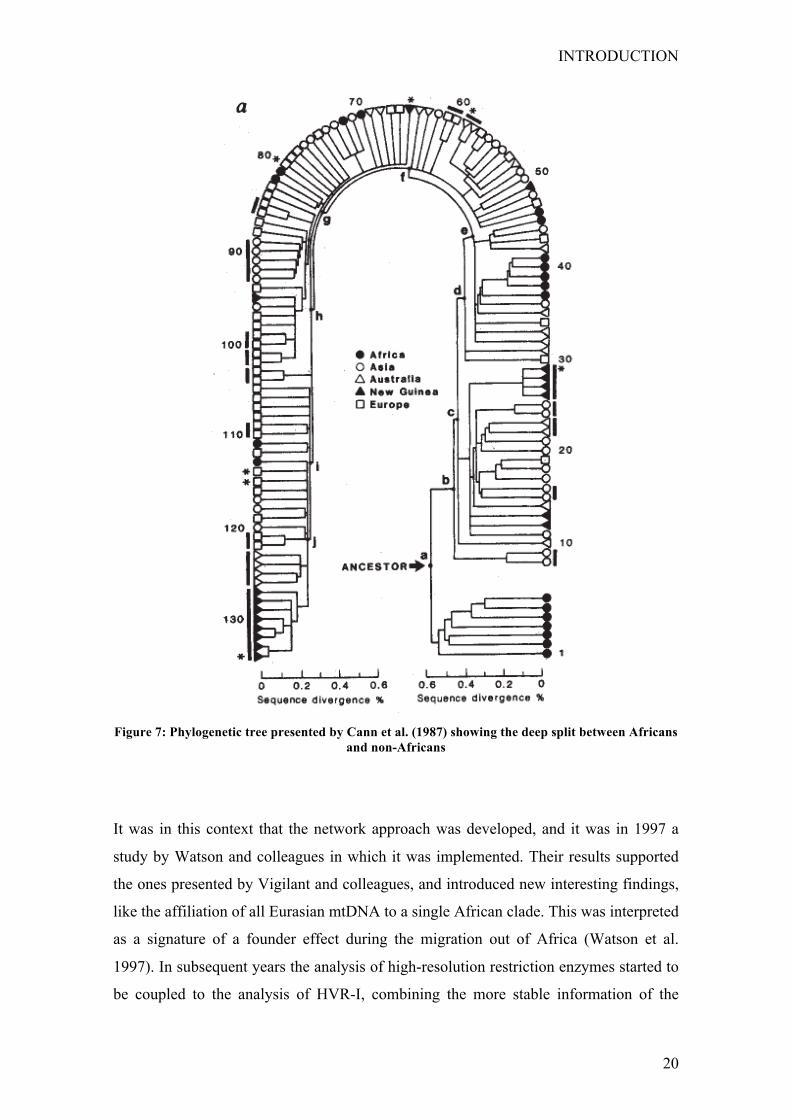
Subsequently, the resolution of the analyses was increased to 12 restriction enzymes and
the first study published was the famous work by Cann and in 1987. In this paper the
authors obtained a more detailed phylogeny than the one seen previously. It was no
longer starlike and it showed a deep split between Africans and non-Africans, with the
deepest branches leading exclusively to African haplotypes (Fig. 7). Such a result was
interpreted as an evidence for the Out of Africa model for the origin of modern humans,
and gave rise to the popularized concept that the “mitochondrial Eve” was African
(Cann et al. 1987).
INTRODUCTION
19
At the beginning of the 1990s, when sequencing techniques became available for
population studies, a work by Vigilant and was published. This study focused on the
variation of hypervariable regions I and II (HVR-I, II) in the control region of mtDNA
(Vigilant et al. 1991). In the phylogeny presented, the authors observed that the first 21
branches led to African haplotypes, while in the rest of the tree both African and non-
African haplotypes were found. They interpreted this result as evidence favoring the
OOA model (Out of Africa). However, since the region under study was more variable
than the coding one analyzed before, the number of possible parsimonious tree
topologies was very high, and several of them did not show an African root. This gave
rise on one hand to several criticisms to the conclusions reached by Vigilant and, while
on the other it stimulated the development of new tools for reconstructing phylogenies
(Bandelt et al. 1995; Templeton 1992).
INTRODUCTION
20
Figure 7: Phylogenetic tree presented by Cann et al. (1987) showing the deep split between Africans
and non-Africans
It was in this context that the network approach was developed, and it was in 1997 a
study by Watson and colleagues in which it was implemented. Their results supported
the ones presented by Vigilant and colleagues, and introduced new interesting findings,
like the affiliation of all Eurasian mtDNA to a single African clade. This was interpreted
as a signature of a founder effect during the migration out of Africa (Watson et al.
1997). In subsequent years the analysis of high-resolution restriction enzymes started to
be coupled to the analysis of HVR-I, combining the more stable information of the
INTRODUCTION
21
coding region with the variation observed at the control region. This led to a great
amount of information accumulated and increased the reliability of inferences, both at
regional and worldwide level. The phylogeographic approach started to be applied to
the study of human evolution, dispersal and colonizations. The topology of the
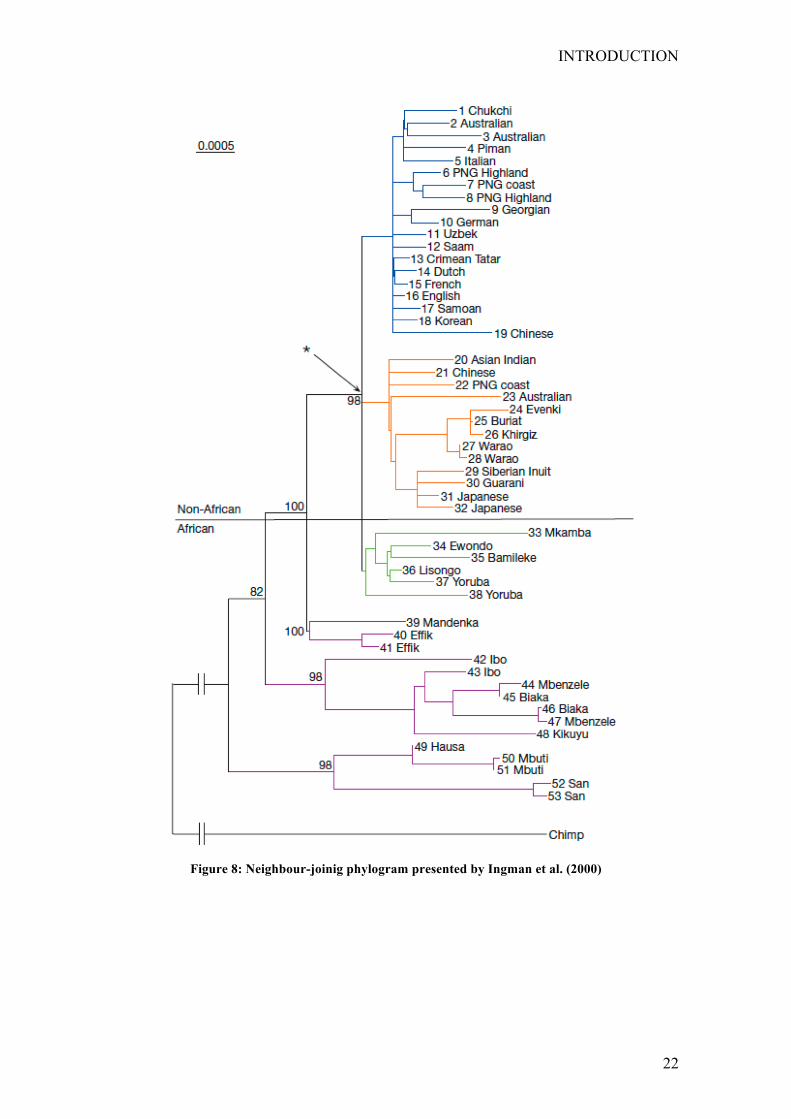
phylogeny presented by Watson and was subsequently confirmed by a work by
Quintana-Murci and , published in (1999) and by the first study on complete
mitochondrial genome variation in a Worldwide sample (Ingman et al. 2000). In both
papers, the deepest branches of the phylogeny led to African haplotypes, while two
different clades seemed to have survived the out of Africa event (Fig. 8). The results of
these studies became useful tools for the interpretation of the pattern of human
spreading across the world (Horai et al. 1995; Ingman et al. 2000; Kivisild et al. 1999;
Macaulay et al. 2005; Mishmar et al. 2003; Plaza et al. 2003; Plaza et al. 2004;
Quintana-Murci et al. 2004; Salas et al. 2002; Schurr et al. 1990; Torroni et al. 1993a).
In more recent years, the role of selection acting on mtDNA has been considered. Some
authors claimed climate may be a selective pressure on human mtDNA (Mishmar et al.
2003; Ruiz-Pesini et al. 2004). They found a positive correlation between the ratio of
non-synonymous versus synonymous substitutions in specific lineages and their
geographical distribution. However, these first studies were subsequently criticized
since it has been observed that the excess of non-synonymous mutations is significant in
the external versus internal branches of the global mtDNA tree, more than on
geographical basis. This, together with the application of inappropriate statistical tests,
could have biased the conclusions by Mishmar and colleagues (2003) and Ruiz-Pesini
and (2004) (Elson et al. 2004; Kivisild et al. 2004). Moreover, the phylogeny of the
human mtDNA has been exhaustively defined and a detailed phylogeography has been
constructed using complete mtDNA sequences (Herrnstadt et al. 2002; Ingman et al.
2000), establishing the correlation of ethnic origin and geographical location (Fig. 9).
INTRODUCTION
22
Figure 8: Neighbour-joinig phylogram presented by Ingman et al. (2000)
INTRODUCTION
23
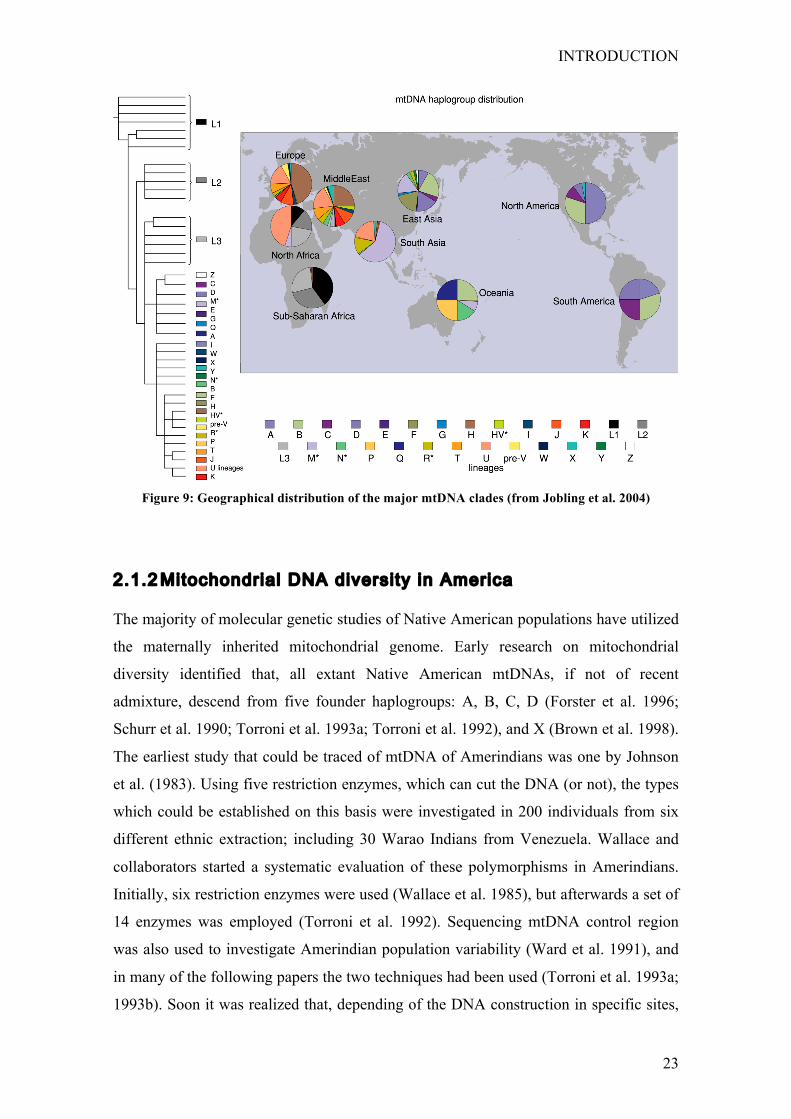
Figure 9: Geographical distribution of the major mtDNA clades (from Jobling et al. 2004)
2.1.2 MitochondrialDNAdiversityinAmerica
The majority of molecular genetic studies of Native American populations have utilized
the maternally inherited mitochondrial genome. Early research on mitochondrial
diversity identified that, all extant Native American mtDNAs, if not of recent
admixture, descend from five founder haplogroups: A, B, C, D (Forster et al. 1996;
Schurr et al. 1990; Torroni et al. 1993a; Torroni et al. 1992), and X (Brown et al. 1998).
The earliest study that could be traced of mtDNA of Amerindians was one by Johnson
et al. (1983). Using five restriction enzymes, which can cut the DNA (or not), the types
which could be established on this basis were investigated in 200 individuals from six
different ethnic extraction; including 30 Warao Indians from Venezuela. Wallace and
collaborators started a systematic evaluation of these polymorphisms in Amerindians.
Initially, six restriction enzymes were used (Wallace et al. 1985), but afterwards a set of
14 enzymes was employed (Torroni et al. 1992). Sequencing mtDNA control region
was also used to investigate Amerindian population variability (Ward et al. 1991), and
in many of the following papers the two techniques had been used (Torroni et al. 1993a;
1993b). Soon it was realized that, depending of the DNA construction in specific sites,
INTRODUCTION
24
the haplotypes and sequences could be grouped in four main sets (A, B, C, and D
haplogroups), that would have been present in the earlier colonizers of the Americas
(Salzano 2002).
Each of these maternal lineages is distinguished by a unique combination of restriction
fragment length polymorphisms (RFLPs), a 9-base deletion, and direct sequencing of
the first hypervariable segment of the non-coding D-loop (HVSI) (Brown et al. 1998;
Forster et al. 1996; Torroni et al. 1993a), together, they encompass 96%–100% of the
mitochondrial haplotypes in modern indigenous populations of the New World (Schurr
and Wallace 2002). Recently, there has been an increasing emphasis on the analysis of
entire mitochondrial genomes (Achilli et al. 2008; Fagundes et al. 2007; Kitchen et al.
2008; Perego et al. 2009), facilitating the identification of numerous sub-lineages.
Similar diversity values have been found for all haplogroups, with a number of
exclusively American polymorphisms indicative of a signature of recent population
expansion (Fagundes et al. 2008).
At a continental level, the five founding haplogroups are differentially distributed in the
New World. Among Amerindians, haplogroup A decreases in frequency from north to
south, whereas haplogroups C and D generally increase in the same direction. However,
haplogroup B shows no similar clinal distribution, other than being virtually absent in
northern North America (Lorenz and Smith 1996; Schurr et al. 1990; Torroni et al.
1994a; Torroni et al. 1994c; Torroni et al. 1993a; Torroni et al. 1992). Haplogroup B
does appear at high frequencies in both the Southwest United States and the Andean
region, probably because of recent population expansions (Malhi et al. 2001;
Merriwether et al. 1994, 1995). By contrast, haplogroup X is found nearly exclusively
in North America (Lorenz and Smith 1994, 1996; Schurr et al. 1990; Torroni et al.
1994a; Torroni et al. 1994c; Torroni et al. 1993a; Torroni et al. 1992), with only trace
frequencies of this mtDNA lineage possibly being seen elsewhere (Ribetio-dos-Santos
et al. 1996). These distributions probably reflect the original pattern of settlement of the
Americas, as well as the subsequent genetic differentiation of populations within certain
geographic regions (Fig. 10 Schurr 2004).
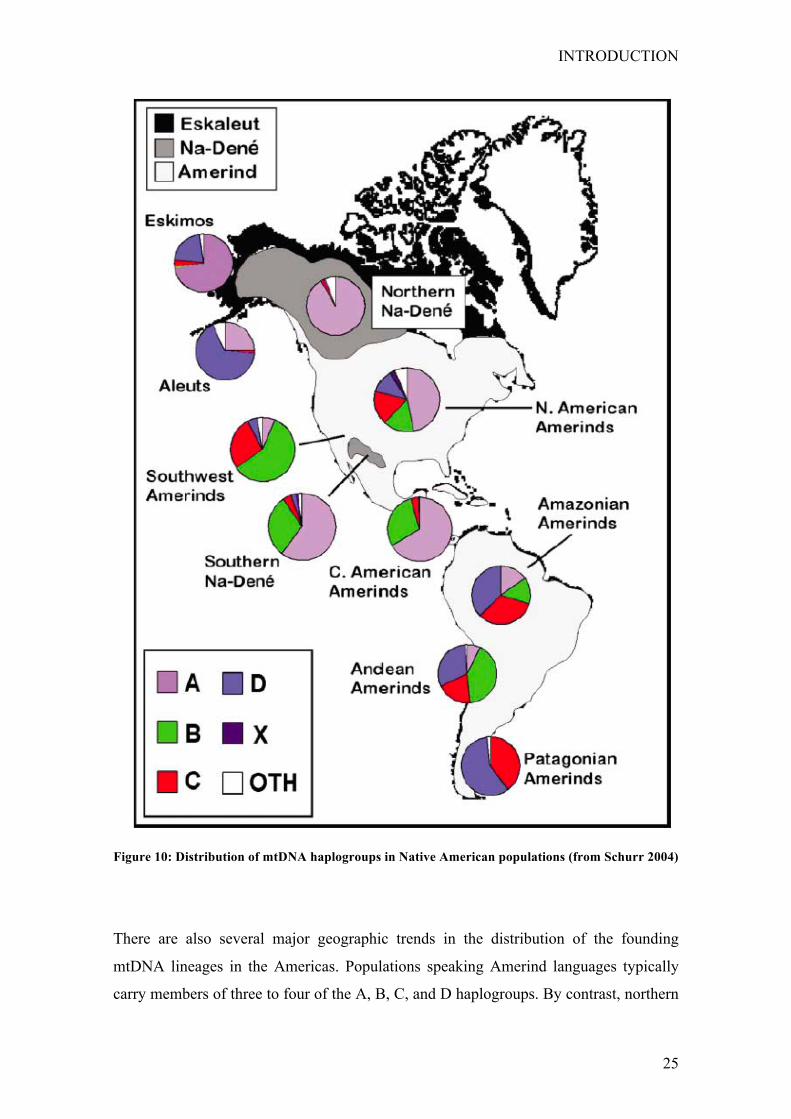
INTRODUCTION
25
Figure 10: Distribution of mtDNA haplogroups in Native American populations (from Schurr 2004)
There are also several major geographic trends in the distribution of the founding
mtDNA lineages in the Americas. Populations speaking Amerind languages typically
carry members of three to four of the A, B, C, and D haplogroups. By contrast, northern
INTRODUCTION
26
Na-Dene speakers carry only haplogroup A. Na-Dene-speaking populations in the
southwest United States possess haplogroups B and C, as well as haplogroup A,
although the presence of haplogroups B and C is likely a result of genetic exchange with
Amerind-speaking neighbors. Haplogroups B and C reach their highest frequencies in
Amerind-speaking populations of the Southwest, where the southern Na-Dene live.
Mitochondrial DNA haplotypes in Eskimo-Aleut speakers belong predominantly to
haplogroup A (Rubicz et al. 2003; Saillard et al. 2000; Shields et al. 1993;
Starikovskaya et al. 1998; Torroni et al. 1993a; Torroni et al. 1992; Ward et al. 1993).
The mtDNA haplogroups that are shared by all indigenous American populations are
rare outside of the Americas (Kolman et al. 1996; Merriwether and Ferrell 1996). They
are found in many Asian populations, but the four principal lineages usually do not
occur together in the same population (Mulligan et al. 2004). Some interesting
exceptions are Siberian populations, who harbor A, C, and D together at relatively high
frequencies (Torroni et al. 1993b), and Mongolian, Tibetan, and central Chinese
populations, who harbor all four (Ballinger et al. 1992; Kolman et al. 1996; Torroni et
al. 1994b). Various studies have also revealed a high frequency of “private haplotypes”
in individual populations or groups of related Amerindian tribes (e.g. Lorenz and Smith
1997; Malhi et al. 2001; Torroni et al. 1993a). These patterns reflect the role that genetic
drift and founder effects have played in the stochastic extinction and fixation of mtDNA
haplotypes in Native American populations. By the mid-1990s, researchers proposed
that a single migration could parsimoniously explain the distribution of the four
principal mtDNA haplogroups and should be the favored scenario for the peopling of
the Americas (Bonatto and Salzano 1997b; Kolman et al. 1996; Merriwether et al. 1994,
1995; Stone and Stoneking 1998).
A number of haplotypes not clearly belonging to these five maternal lineages have been
also detected in different Native American groups (Bailliet et al. 1994; Easton et al.
1996; Lorenz and Smith 1996, 1997; Merriwether et al. 1994, 1995; Ribetio-dos-Santos
et al. 1996; Rickards et al. 1999; Santos et al. 1996a; Torroni et al. 1993a; Ward et al.
1991). These “other” mtDNAs have often been considered additional founding
haplotypes or haplogroups in New World populations. However, most have since been
shown to be derivatives of haplogroups A–D that have lost diagnostic mutations (Schurr
2004; Schurr et al. 1999; Schurr and Wallace 2002). The remainder appears to have
been contributed to indigenous groups through nonnative admixture. In addition, the
INTRODUCTION
27
“other” mtDNAs detected in archeological samples (e.g., Ribetio-dos-Santos et al.
1996) may have resulted from contamination with modern mtDNAs, or were
insufficiently analyzed to make a determination of their haplogroup status (Schurr
2004). Nonetheless, the number of haplogroups found in Native America is but a subset
of those commonly found in central and northeast Asia, clearly reflecting a reduction in
mtDNA diversity in the Americas.
The fifth founding mtDNA haplogroup, designated Haplogroup X in Native Americans
was originally attributed to recent European admixture because several non-A, -B, -C,
and -D haplogroups co-occur in the Native American population where X was first
identified (Torroni et al. 1993a). The suggestion that haplogroup X was introduced by
an ancient migration from Europe caused a stir (Brown et al. 1998). This interpretation
was supported by the presence of distantly related members of haplogroup X in
Europeans, but Asian populations had not been studied for the X-defining variant
(Brown et al. 1998). The need for a European migration has since been abandoned
owing to the observation of haplogroup X in the Siberian Altai (Derenko et al. 2003).
Haplogroup X now appears to be an old and complex lineage. Two major branches, X1
and X2, each with worldwide distribution, were recently identified in a parsimony
analysis of complete DNA sequences (Reidla et al. 2003). Members of haplogroup X in
Native Americans belong to a distinct clade (X2a) that has no close relatives in the Old
World. All members of haplogroup X in the Siberian Altai coalesced about 6700 years
ago (Reidla et al. 2003) which substantially postdates the peopling of the Americas, and
argues against a close relationship between the Altai and modern Native Americans.
Based on mtDNA diversity, Bortolini and Salzano (1996) performed an extensive
analysis of the mtDNA variability of Amerindians, comparing it with those of other
groups, and reached the following conclusions: (a) Total diversity, either considering
characteristic haplogroups or a given set of haplotypes defined by 14 restriction
enzymes, is of the same order of magnitude as those observed in other ethnic groups.
Moreover, Amerindians present a degree of interpopulation variability that is higher
than those found elsewhere; (b) Distinctive features were the low variability of the Na-
Dene, and the high interpopulation diversity observed in Central Amerindians; and (c)
The total diversity found in A, B, C, and D haplogroups is about one-third of that
observed for the African L1 and L2 haplogroups, and the share of this variability that is
INTRODUCTION
28
due to the interhaplogroup diversity is much more important (2x higher) in Amerindians
than in Africans (Bortolini and Salzano 1996).
2.1.3 RoutestoAmerica:mtDNAlineages
Greenberg’s theory (see section 1.3) gave rise to many discussions about the importance
of the interpretation of different evidences for the settlement of the New World and
possible colonization routes. This fact boosted genetic studies in Native American
populations based mainly on the mtDNA uniparental marker. During the 90s some
authors supported Greenberg’s theory in some aspects and others refuted it. Schurr
(1990) was one of the first authors proposing that the genetic variability in the Americas
could be traced through four founding lineages (A, B, C and D). Throughout this decade
there were some shared arguments between the different peopling hypotheses like the
existence of an ancestral population or populations leaving from northeast Asia during
the Last Maximum Glaciation (LMG, defined as an interval centered on 21,000 ybp)
(Clark and Mix, 2002), and crossing through the Bering Strait bearing the five founding
lineages. It is likely that they remained isolated enough time to generate more genetic
diversity within the founding lineages. There is also remarkable consensus in the
necessity of studying native populations from Siberia, Alaska and Pacific in order to
have a better accuracy in the historical reconstruction of the peopling of the Americas.
2.1.3.1 Asingleandearlymigrationand“OutofBeringia”
During the 90’s decade, simultaneously to the description of the native genetic diversity
in the Americas, different theories about the possible colonization routes started to
arose. When the first four founding haplogroups (A-D) were identified in the three
linguistic families-groups-waves described by Greenberg et al. (1986), the investigators
interpreted these findings as indicating that all four mtDNA lineages were present in the
original migration(s) to the New World (Forster et al. 1996; Kolman et al. 1996;
Merriwether et al. 1994, 1995; Stone and Stoneking 1998). This mtDNA evidence has
resulted in the conjecture that all Native American populations trace to a single
ancestral founder population that lived in the region of Mongolia/North China (Kolman
INTRODUCTION
29
et al. 1995; Merriwether et al. 1995). A monophyletic colonization from Asia was
accepted, supported the hypothesis of only a single and early migration entered into the
New Word crossing Bering carried out with multiple variants of each of the four
founding lineages, peopling the rest of the continent.
Using measures of mtDNA diversity and other population genetic parameters Bonatto
and Salzano (1997a, b) proposed the called ‘‘out of Beringia’’ model of the continent’s
colonization. The picture suggested is that some time after Beringia had been peopled
(60,000-11,000 ybp) the population expanded and crossed the Alberta ice-free corridor
that connected this region to the south of North America or, alternatively, followed a
coastal route. The collapse of ice sheets 14,000-20,000 ybp isolated Beringia from the
rest of the continent during some time (2,000-6,000 years) generated more and genetic
variability, and it was there that the Na-Dene and Eskimo diverged biologically.
Amerind differentiation occurred as the groups that were in North America migrated
south. Therefore, there would have been just one major migration wave, which would
have started 30,000-40,000 ybp.
Beringia is assumed to be the place where Native American ancestors differentiated
before migrating into the New World with a founding time of 22-55,000 ybp (Bonatto
and Salzano 1997b). Out of Asia Siberia is considered to be the geographic region of
Native American populations, and Beringia is give the role of a corridor, with a
founding time of 20-25,000 ybp (Forster et al. 1996). Both hypotheses coincided in
suggesting that, after an early colonization event the Bering corridor was destroyed by
the coalescence of the ice glaciers (18-12,000 ybp) producing isolation of the migrants
and producing genetic and linguistic differentiation. The scarcity of the lineages in Asia
makes it improbable that different migrating populations would draw the same set
independently. Therefore, the genetic data lend no particular support to the three-
migration hypothesis. Instead, a single migration to the Americas that carried all
founding lineages simultaneously is a more parsimonious and preferable explanation
(Mulligan et al. 2004).
INTRODUCTION
30
2.1.3.2 Twoindependentmigrations
Based on mtDNA restriction polymorphism (RFLPs) genetic diversity from Amerinds
and Na-Dene speakers, Torroni and (1992; 1993b) suggested that genetic differences
between these groups indicate that populations derivate from two independent
migrations at different times, supporting the three migration Greenberg’s theory.
However some linguistic and genetic data that does not support the hypothesis of the
three migratory waves (Campbell and Mithum 1979; Chakraborty and Weiss 1991;
Laughlin 1988; Spencer et al. 1977a; Szathmary et al. 1983; Wallace et al. 1985).
Amerinds derived from an ancestral Asiatic population, performed a several sample size
and variability reduction during the Americas migration, they carried out five founder
haplotypes around 21,000-42,000 ybp. Later the Na-Dene populations derived from two
or three founder haplotypes ~5,250-16,000 ybp. In summary, the Americas was
colonized in a period of time around 13,000-14,000 ybp by two independent migration
waves (Torroni et al. 1992).
2.1.3.3 Multiplemigrations
Horai el al., (1993) suggested the “multiple migration hypothesis” in which the four
founding lineages derived from four independent and separated migration waves at
different times between 14,000-21,000 ybp. The ancestral populations did not
experiment a bottleneck and rapid expansion in the sample size. The Amerinds were the
fist migration, Na-Dene and Aleut-Eskimo arrived in posterior migrations. The
polymorphisms shared within the three populations supported genetic proximity;
indicating that the major mtDNA lineages have contributed to the peopling of the
Americas. The mtDNA results have been interpreted to support a range of models with
as many as four major migrational waves (Horai et al. 1993; Lorenz and Smith 1994;
Shields et al. 1993; Szathmary 1993; Torroni et al. 1994a; 1993a; 1992).
2.1.3.4 BIM:BeringianIncubationModel
Tamm and colleagues (2007) analyzed a total of 623 complete mtDNA sequences from
Asia and the Americas. Their results described more genetic diversity within the fonder
population that previously was reported. The Native Americans derive from a small
INTRODUCTION
31
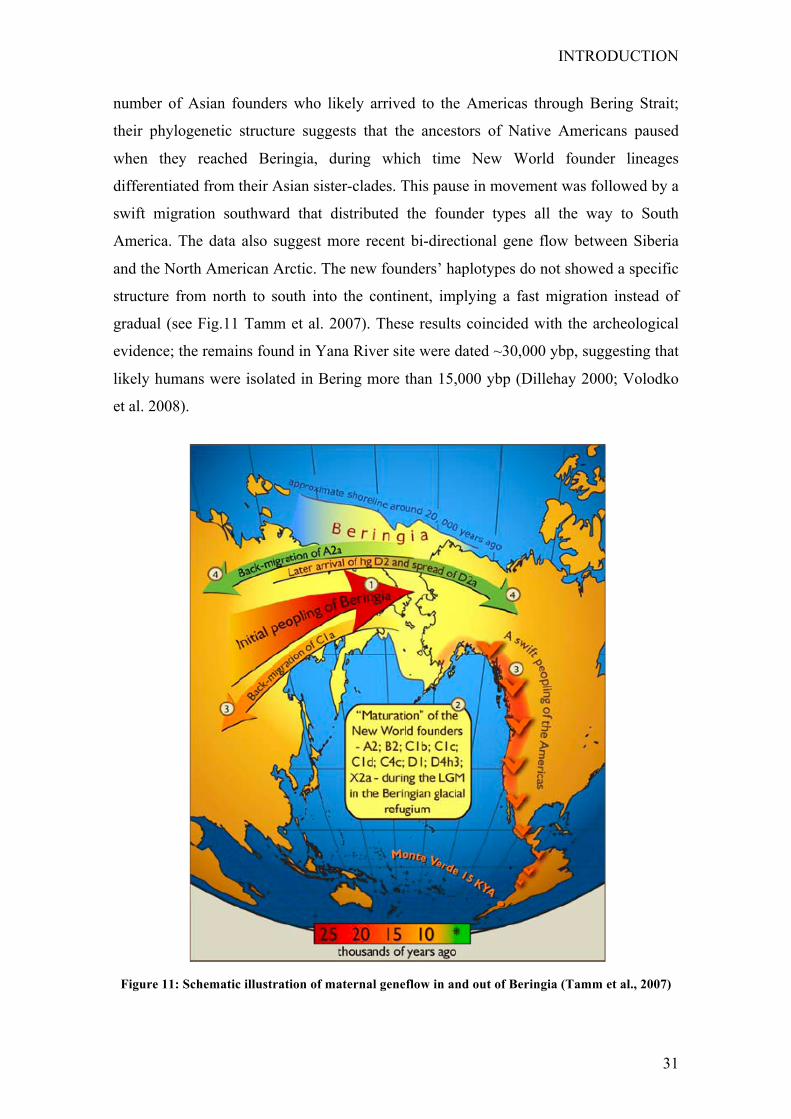
number of Asian founders who likely arrived to the Americas through Bering Strait;
their phylogenetic structure suggests that the ancestors of Native Americans paused
when they reached Beringia, during which time New World founder lineages
differentiated from their Asian sister-clades. This pause in movement was followed by a
swift migration southward that distributed the founder types all the way to South
America. The data also suggest more recent bi-directional gene flow between Siberia
and the North American Arctic. The new founders’ haplotypes do not showed a specific
structure from north to south into the continent, implying a fast migration instead of
gradual (see Fig.11 Tamm et al. 2007). These results coincided with the archeological
evidence; the remains found in Yana River site were dated ~30,000 ybp, suggesting that
likely humans were isolated in Bering more than 15,000 ybp (Dillehay 2000; Volodko
et al. 2008).
Figure 11: Schematic illustration of maternal geneflow in and out of Beringia (Tamm et al., 2007)
INTRODUCTION
32
2.1.3.5 PacificCoastalModel
A detailed demographic history of the mtDNA sequences (86 complete mitochondrial
genomes, analyzed) estimated with a Bayesian coalescent method indicates a complex
model for the peopling of the Americas (Fagundes et al. 2008). The authors support the
existences of a Pre-Clovis occupation of the Americas, followed by rapid settlement, of
the continent along a Pacific coastal route. Native American populations exhibit almost
exclusively five mtDNA haplogroups (A–D and X). Haplogroups A–D are also frequent
in Asia, suggesting a northeastern Asian origin of these lineages. However, the
differential pattern of distribution and frequency of haplogroup X led some to suggest
that it may represent an independent migration to the Americas. In their study it was
show that all Native American haplogroups, including haplogroup X, were part of a
single founding population, thereby refuting multiple-migration models. The initial
differentiation from Asian populations ended with a moderate bottleneck in Beringia
during the last glacial maximum (LGM), around ~23,000 to ~19,000 years ago. Toward
the end of the LGM, a strong population expansion started ~18,000 and finished
~15,000 years ago, suffering an important reduction sample size (Fagundes et al. 2008).
This theory supports that the existence of sites localized along the coast like Monte
Verde (14,500 ybp) were older than others from the interior. Probably when humans
colonized the entire continent from north to south, the sea levels rose producing a
reduction of the natural resources; therefore, they migrated to the inlands changing
technologies and life style (Fagundes et al. 2008).
2.1.3.6 Three-StageModel
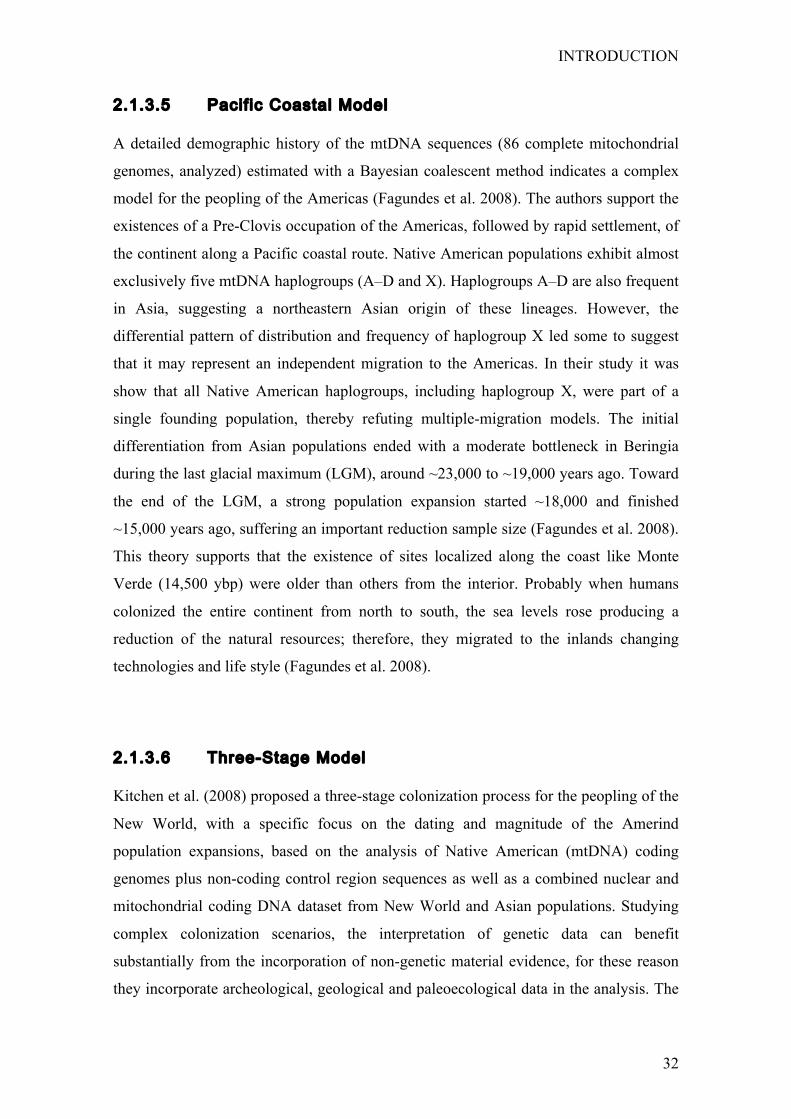
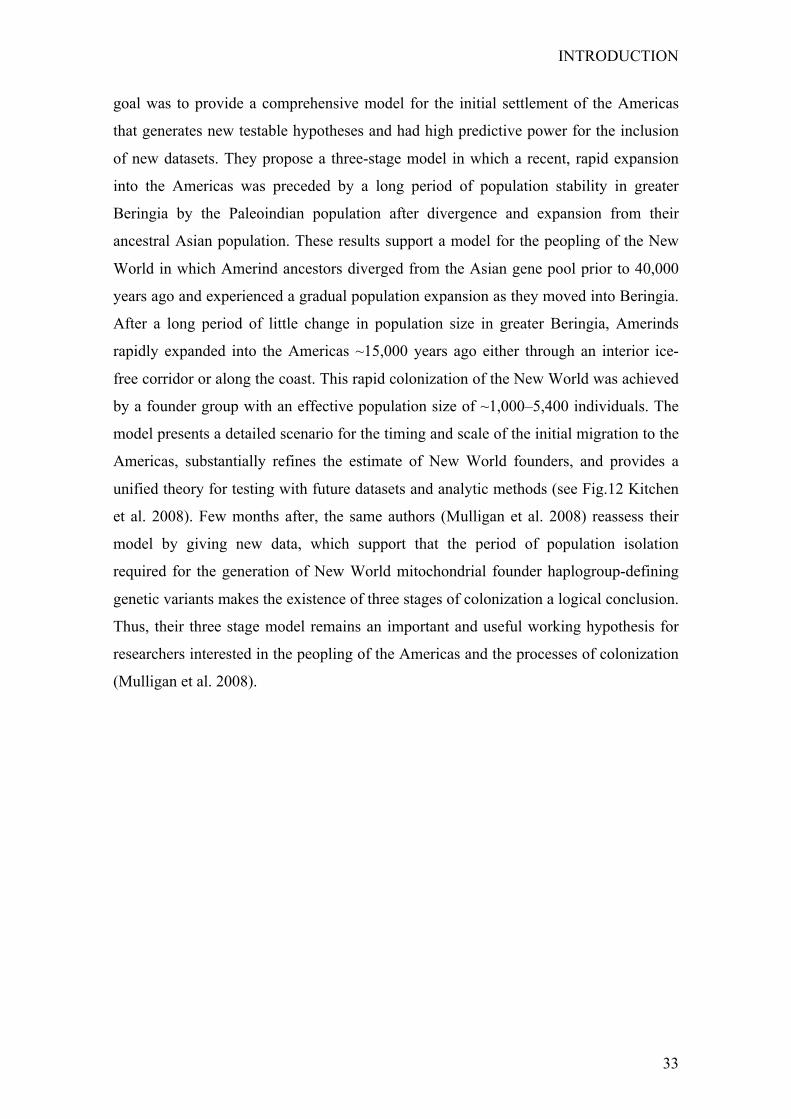
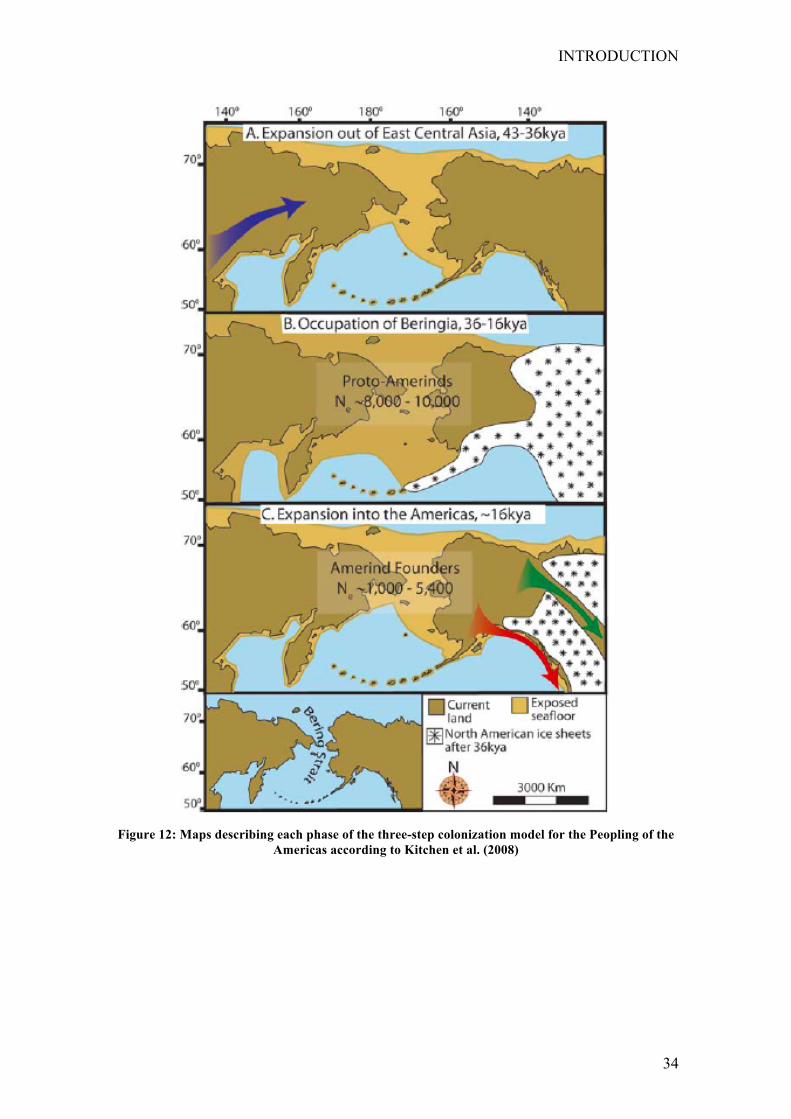
Kitchen et al. (2008) proposed a three-stage colonization process for the peopling of the
New World, with a specific focus on the dating and magnitude of the Amerind
population expansions, based on the analysis of Native American (mtDNA) coding
genomes plus non-coding control region sequences as well as a combined nuclear and
mitochondrial coding DNA dataset from New World and Asian populations. Studying
complex colonization scenarios, the interpretation of genetic data can benefit
substantially from the incorporation of non-genetic material evidence, for these reason
they incorporate archeological, geological and paleoecological data in the analysis. The
INTRODUCTION
33
goal was to provide a comprehensive model for the initial settlement of the Americas
that generates new testable hypotheses and had high predictive power for the inclusion
of new datasets. They propose a three-stage model in which a recent, rapid expansion
into the Americas was preceded by a long period of population stability in greater
Beringia by the Paleoindian population after divergence and expansion from their
ancestral Asian population. These results support a model for the peopling of the New
World in which Amerind ancestors diverged from the Asian gene pool prior to 40,000
years ago and experienced a gradual population expansion as they moved into Beringia.
After a long period of little change in population size in greater Beringia, Amerinds
rapidly expanded into the Americas ~15,000 years ago either through an interior ice-
free corridor or along the coast. This rapid colonization of the New World was achieved
by a founder group with an effective population size of ~1,000–5,400 individuals. The
model presents a detailed scenario for the timing and scale of the initial migration to the
Americas, substantially refines the estimate of New World founders, and provides a
unified theory for testing with future datasets and analytic methods (see Fig.12 Kitchen
et al. 2008). Few months after, the same authors (Mulligan et al. 2008) reassess their
model by giving new data, which support that the period of population isolation
required for the generation of New World mitochondrial founder haplogroup-defining
genetic variants makes the existence of three stages of colonization a logical conclusion.
Thus, their three stage model remains an important and useful working hypothesis for
researchers interested in the peopling of the Americas and the processes of colonization
(Mulligan et al. 2008).
INTRODUCTION
34
Figure 12: Maps describing each phase of the three-step colonization model for the Peopling of the
Americas according to Kitchen et al. (2008)
INTRODUCTION
35
2.2 Ychromosomeandmainfeatures
The Y-chromosome is the second smallest human chromosome, after chromosome 21,
with an average size of 60 megabases (Mb). It is located in the nucleus and it contains
the SRY (Sex-determining Region Y) gene, which encodes for the testis determining
factor. The male specific segment of the Y-chromosome in mammals has no
homologous counterpart and thus does not recombine; it has all its genes in linkage
disequilibrium, and is paternally transmitted. The mutation rate is much lower than
mtDNA (Bianchi et al. 1998).
It is constituted by two pseudo-autosomal regions at the extremities, which recombine
with its homologous regions in the X chromosome, and by a large non-recombining
region (NRY), that accounts for up to 95% of its length. The NRY has been recently
renamed MSY, or male-specific region, due to the observation of multiple Y-Y gene
conversion events per generation (Skaletsky et al. 2003). The MSY includes a
heterochromatic region of variable size that consists of long homogeneous tandem
arrays of non-functional DNA, and a euchromatic region of approximately 23 Mb, that
is a mosaic of complex and interrelated sequences. The second contains 27 distinct
protein-coding genes or gene families, 12 of which are expressed ubiquitously
throughout the body, whereas 11 are expressed exclusively or predominantly in testes
(Skaletsky et al. 2003).
The euchromatic sequences fall into three classes:
• the X-transported, comprising 10-15% of the MSY and resulting from a massive
X to Y transposition that occurred about 3-4 million years ago; these sequences
still present 99% homology to their counterparts in X chromosome;
• the X-degenerate, comprising 20 % of the MSY and consisting of a class of
sequences that are less closely related to the X chromosome, being remnants of
ancient autosomes from which modern X and Y-chromosome derive;
• the remainder comprises the amplicon class, which includes large regions where
sequences exhibit marked similarity to other sequences in the MSY; these
sequences are located in seven segments scattered across the long and proximal
short arms.
INTRODUCTION
36
Curiously, all 12 ubiquitously expressed MSY genes reside in X-degenerate regions,
while all 11 MSY genes expressed exclusively in the testis reside in the amplicon class,
except for SRY which is in an X-degenerate region (Skaletsky et al. 2003). The Y-
chromosome attracted special attention for human population genetic studies due to
some important features, which include haploidy, paternal inheritance, apparent lack of
recombination and low mutation rate (Bosch et al. 1999; Jobling and Tyler-Smith 1995,
2003).
Haploidy allows avoiding for the confounding effect of heterozygosity. Paternal
inheritance, together with the lack of recombination, makes the Y-chromosome
particularly suitable for evolutionary studies, as a natural counterpart for the studies
based on mtDNA. The two markers together can give a reasonable idea of the
evolutionary history of human populations, even if the processes shaping their diversity
can be differently influenced by demographic and cultural factors (Bolnick et al. 2006;
Carvajal-Carmona et al. 2000; Destro-Bisol et al. 2004; Mesa et al. 2000).
The lack of recombination has been only recently questioned by the observation of Y-Y
gene conversion (Skaletsky et al. 2003), but this is still not taken into account when
analyzing phylogenetic relationships. The low mutation rate is both an advantage and
disadvantage: on one hand, the use of stable Single Nucleotide Polymorphisms (SNPs)
to reconstruct the phylogeny of Y-chromosome makes the tree more reliable, on the
other; it decreases the level of variation observable at intra-specific level. But the
presence of Short Tandem Repeats (STRs) polymorphisms in the Y-chromosome,
characterized by a higher mutation rate than SNPs, allows intra and inter-
population/lineage diversity to be observed and estimated.
The non-recombining portion of the human Y-chromosome has been of great interest in
reconstructing human phylogeny, it’s also evolving through the accumulation of
mutations. Y-specific polymorphisms have been successfully used like markers which
allow constructing informative current haplotypes that are specific to geographic
regions and provide insights on male migration and admixture, allowing make
inferences about the possible historic worldwide population movements; these markers
are probably the best genetic tool to study early human migrations (Su et al. 1999).
INTRODUCTION
37
2.2.1 Y-chromosomePhylogenyandPhylogeography
The complete sequence of the euchromatic region of MSY has been published only
recently (Skaletsky et al. 2003), but the analysis of the Y-chromosome polymorphisms
for population genetic purposes started well before. The discovery of the first
polymorphic marker in 1985 (Casanova et al. 1985) was followed by a period in which
the search with molecular probes for conventional Restriction Fragment Length
Polymorphism (RFLPs) failed to find significant variation in the Y-chromosome
(Jakubiczka et al. 1989; Malaspina et al. 1990). The first single nucleotide
polymorphism to be identified on the Y chromosome was described only in (1994) by
Seielstad and colleagues. Later, Hammer (1995) and Whitfield and colleagues (1995)
studied with more accurate techniques the detection of more Y-chromosome
polymorphism. The researchers recognized the power of Y-chromosome markers in
resolving the migratory patterns of modern humans (Jobling and Tyler-Smith 1995).
The first global survey of human Y-chromosome haplotype variation was done in
(1995) by Jobling and Tyler-Smith also presents new compound haplotype data, a better
refine study was done in (2003, see Fig. 13). Hammer (1995) performed a sequencing
survey of 16 geographically diverse humans for a 2.6-kb region (referred to as the
"YAP" region) on the long arm of the human Y-chromosome and constructed a tree with
five Y-chromosome haplotypes.
The introduction of denaturing high-performance liquid chromatography (DHPLC)
increased considerably the number of Y-chromosome markers known (Underhill et al.
1997), since that moment the global Y-chromosome tree started to be reconstructed with
a fine resolution. Simultaneously the diversity of microsatellites started not only to test
the statistical significance of the observed excess of Y-chromosome microsatellites
diversity in African populations regarding Europeans and Asians (Jorde et al. 1997) but
also to examine the ability of them to discriminate between the predictions of theories
about modern human origins (Seielstad et al. 1999). In fact the DHPLC method was
used to discover more than 200 SNPs and small indels on the MSY (Hammer et al.
2001; Shen et al. 2000; Underhill et al. 2000). Whit this results the association of two or
more markers defined haplotypes correlated with ethnic origin of the populations to
describe the genetic diversity found and establish a worldwide phylogeography. A clear
picture of the geographic distribution of Y-chromosomal variation has yet to emerge
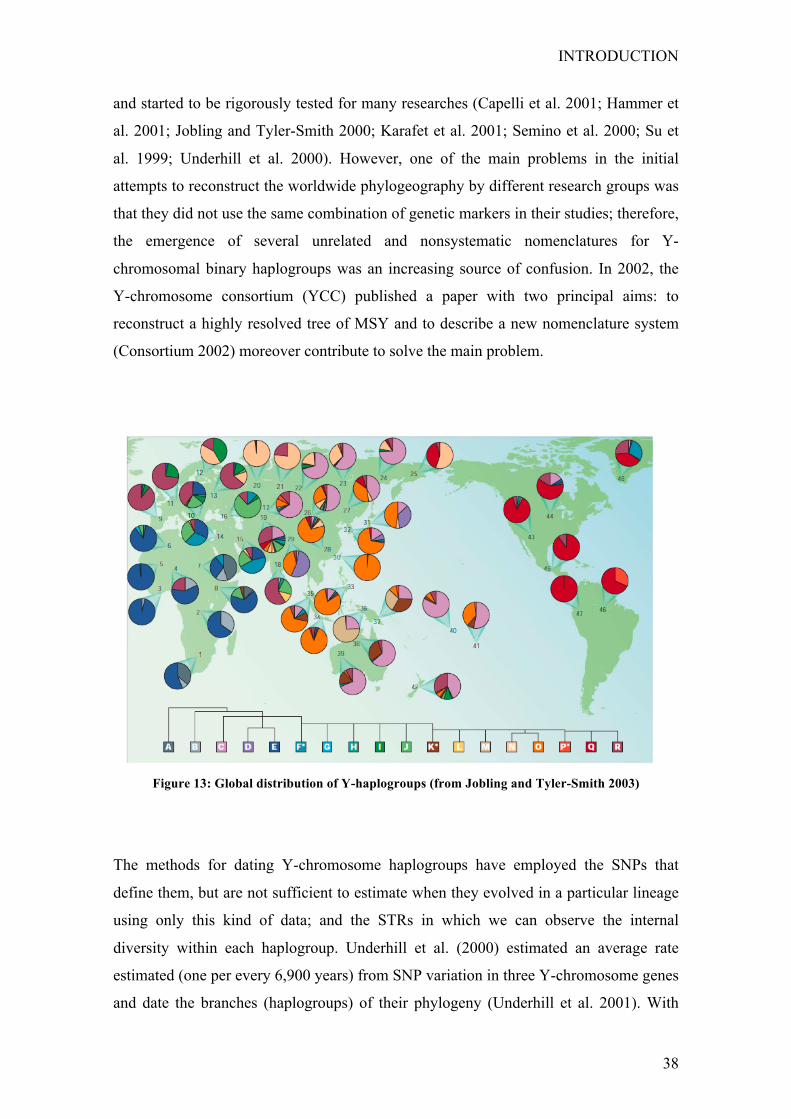
INTRODUCTION
38
and started to be rigorously tested for many researches (Capelli et al. 2001; Hammer et
al. 2001; Jobling and Tyler-Smith 2000; Karafet et al. 2001; Semino et al. 2000; Su et
al. 1999; Underhill et al. 2000). However, one of the main problems in the initial
attempts to reconstruct the worldwide phylogeography by different research groups was
that they did not use the same combination of genetic markers in their studies; therefore,
the emergence of several unrelated and nonsystematic nomenclatures for Y-
chromosomal binary haplogroups was an increasing source of confusion. In 2002, the
Y-chromosome consortium (YCC) published a paper with two principal aims: to
reconstruct a highly resolved tree of MSY and to describe a new nomenclature system
(Consortium 2002) moreover contribute to solve the main problem.
Figure 13: Global distribution of Y-haplogroups (from Jobling and Tyler-Smith 2003)
The methods for dating Y-chromosome haplogroups have employed the SNPs that
define them, but are not sufficient to estimate when they evolved in a particular lineage
using only this kind of data; and the STRs in which we can observe the internal
diversity within each haplogroup. Underhill et al. (2000) estimated an average rate
estimated (one per every 6,900 years) from SNP variation in three Y-chromosome genes
and date the branches (haplogroups) of their phylogeny (Underhill et al. 2001). With
INTRODUCTION
39
this mutation rate, was possible to give a date of the origins of the major branches of the
phylogeny, as well as other points of SNP haplotype diversification. Other method to
date the ages of Y-chromosome haplogroups is to analyze variation in the faster
evolving STRs loci that occur on each SNP haplotype.
The contribution of the global Y-chromosome tree to the debate on the origin of modern
humans soon became clear. In fact, like the mtDNA, the Y-chromosome tree rooted in
Africa, with haplogroups A and B restricted to sub-Saharan Africa (Underhill et al.
2001). The haplogroups that are found in the rest of the world all derive from the B
sister-clade. This suggested an African origin for modern human populations, and
supported the Out of Africa hypothesis. However, the estimates of the Time of the Most
Recent Common Ancestor (TMRCA) were particularly recent, being 46 (16-126) kya
when using eight STRs (Pritchard et al. 1999) and 59 (40-140) kya when using SNPs
(Thomson et al. 2000). Both these estimates result particularly recent when compared to
the ones by mtDNA 177 kya, (Ingman et al. 2000). These two loci are in fact supposed
to present the same effective population size, the main factor influencing the TMRCA
estimates under neutrality. However, the effective population size of Y-chromosome
has been hypothesized to be lower than mtDNA due to different possible factors: a
higher variance in male reproductive success, natural selection, higher variance in
mtDNA mutation rates, stochasticity in the evolutionary process, or questionable
assumptions on generation time (Garrigan and Hammer 2006; Jobling and Tyler-Smith
2003).
Concerning natural selection, there have been several attempts to apply neutrality tests
based on nucleotide diversity to the Y-chromosome variation, but it was very difficult to
distinguish between signals of population expansion and selection (Jobling and Tyler-
Smith 2000, 2003). Although a few examples of consistent natural selection have been
observed, the pattern of Y-chromosome haplogroup distribution, compared to other
markers, does not seem to have been influenced by selection. For this reason the
topology of the tree is still considered reliable (Jobling and Tyler-Smith 2003).
INTRODUCTION
40
2.2.2 Y-chromosomediversityinAmerica
In 1997 Hammer and colleagues have observed greater Y-haplotypic diversity in Africa
for five biallelic polymorphisms and greater Asian diversity in some Y-chromosome
lineages (Hammer et al. 1998; 1997). The genetic diversity observed in Asian
populations stimulated the researchers to development this kind of studies in human
populations distributing in worldwide geographical areas. The identification of founder
haplotypes is a key element in the use of genetic data to explore the peopling of the
New World. Properties of the distributions of these haplotypes should help evaluate the
number of migratory waves and their time of occurrence, and could locate the places in
Asia where the migrant populations might have originated. In recent years, most
molecular-genetic studies of Native Americans have focused on the clarification of
aspects of their Asian origins, by comparing the genetic structure of the two continental
groups (Tarazona-Santos et al. 2001). Although genetic approaches to reconstruct the
population history of Native Americans have mostly used either autosomal or mtDNA
markers, a number of recent analyses have begun to exploit Y-chromosome-specific
variation (Ruiz-Linares et al. 1999).
Intensive efforts to clarify the earliest origin of Native Americans, have been produce
molecular-genetic studies at more local geographic scales, such as those examining
North, Central, or South America, continue been scanty (Tarazona-Santos et al. 2001).
The efforts began with the search for useful markers whom where present only in
Siberian, Asian and Native American populations, many studies started to appear
describing the Y-chromosome genetic diversity in the Americas. Initial studies found
high frequencies of ‘‘allele’’ 18 [a complex restriction fragment length polymorphism
(RFLP)] pattern defined at locus DYS1 by probe 49-ayf in populations from North and
South America (Torroni et al. 1994a). Subsequently a single predominant Y haplotype
was detected in North and South Amerinds by combining heteroduplex analysis of
sequence variants in repetitive alphoid subunits (called; ah ‘‘allele’’ II) and the
tetranucleotide repeat locus DYS394 (allele 186) (Pena et al. 1995; Santos et al. 1996b),
these showed the existence of a major northern-Asian founder haplotype, likely
migrated from central Siberia (Karafet et al. 1999; Santos et al. 1999). This conclusion
was later verified by the discovery of two Y-chromosome SNPs known as “M3” and
“M45”, a C-T transition at the DYS199 locus now referred to as “marker M3”
INTRODUCTION
41
(Underhill et al. 1996; 2000). Extant Native American Y-chromosomes in Siberia and
Asia have revealed that M3 lineage was found only on the Chukotka peninsula of far
northeastern Siberia, among the Chukchi and the Siberian Eskimos (Karafet et al. 1997;
Lell et al. 1997). The most recent ancestors of the M3 lineage have been traced to
central southern Siberia (Karafet et al. 1999; Santos et al. 1999). The M3-DYS199
polymorphism occurred after the first populations entered to the Americas (Seielstad et
al. 2003), these various polymorphisms have been shown to be associated (Bianchi et al.
1997); thus alleles DYS1 18, ah II, DYS394 186, and DYS199 T could define a major,
perhaps single, founder haplotype for all Native American populations (Karafet et al.
1997).
DYS199 know as M3 has been shown to delineate a major Native American founder
haplotype (Bianchi et al. 1997; 1998; Lell et al. 1997), in addition to M3 Y-
chromosomes revealing a second founding haplotype. The microsatellite variation
observed in 11 Y-chromosome-specific polymorphic markers of five Native Colombian
and non-Amerindian populations showed that most DYS199-C chromosomes seen in
Native Colombians were autochthonous, suggesting that at least two founder haplotypes
existed among the initial Native American settlers. These data indicate that the
DYS199-T lineage was about 9,000–11,000 years old. The age of the DYS199-C
lineage was more difficult to establish but probably fell in the range of 5,000–18,000
years (Ruiz-Linares et al. 1999).
A third Native American haplotype, defined by the RPS4Y/C-T (SNP), was identified
in northern Amerind and Na-Dene–speaking populations (Bergen et al. 1999). This
haplotype has not been detected in South American natives, with the exception of two
Wayus from Colombia (Karafet et al. 1999). The Siberian RPS4Y-T haplogroup has
been located in the Lake Baikal region, east of M3 and its progenitors. This has been
interpreted as indicating that these Y-chromosome lineages came to the Americas in
distinct migrations (Karafet et al. 1999). Finally, Y-chromosomes harboring the Tat
polymorphism (haplogroup Tat-C) were found dispersed between native populations of
central Asia and northern Europe (Santos et al. 1999), supporting a relatively recent link
between these populations (Zerjal et al. 1997). This pattern of limited haplotype
diversity has been also observed in mtDNA (Torroni et al. 1994a).
INTRODUCTION
42
Seielstad et al. (2003), found a novel Y-chromosome SNP that could be reliably dated
and occurred before, but sufficiently close in time to the initial human radiation into the
Americas, so as to provide a meaningful upper bound on the time of entry. The
polymorphism, was call “M242”, this mutation arose after the M45 and M74 mutations
but before M3, occurred before the first migration into the Americas. M242-T haplotype
entered to the Americas very soon after it arose, which indicates a rather more recent
entry into the Americas ~15-18,000 ybp, suggested by previous genetic studies, placed
the DNA evidence more in line with archeological data, which is characterized by a
clear scarcity of credibly sites dated beyond 14,000 ybp. These results do not contradict
earlier studies of mtDNA (Torroni et al. 1994a) and the autosomes (Cavalli-Sforza et al.
1994). All findings described above, were a useful markers for the identification of Y-
haplotypes originating after the first migration to the Americas or Beringia, however
more informative ancient-markers are needed to trace the origin of these Y-
chromosomes within Asia and the Americas (Santos et al. 1999).
To continue with the refinement of Native American phylogeny, the ages of others
several Y-chromosome lineages present in Siberia and the Americas have also been
estimated. F-89 is the oldest SNP in the Eurasian branch of the Y-chromosome
phylogeny dates to ~62,000 ybp (Schurr and Sherry 2004) and predates the occurrence
of the K-M9 lineage, since it appears in all haplotypes bearing the latter mutation. F-89
is an important SNP because it marks the initial diversification and spread of non-
African Y-chromosome lineages into the rest of the world. One of the older lineages in
Siberia, K-M9, has been dated at >50,000 ybp (Karafet et al. 2002; Underhill et al.
2000). The antiquity of this lineage is consistent with the presence of this SNP in a
considerable majority of Siberian Y-chromosomes (Karafet et al. 1999; Lell et al. 2002).
Native American Y-chromosome haplotypes mostly derived from a subsamples of
haplogroups present in Siberia like; Q-M3, R1a1-M17, P-M45, F-M89, and C-M130
(Fig. 14 Schurr 2004). Two of them, Q-M3 and P-M45, represent the majority of Native
American Y-chromosomes. (Bianchi et al. 1997; Bianchi et al. 1998; Lell et al. 1997;
Lell et al. 2002; Santos et al. 1999; Underhill et al. 1996).
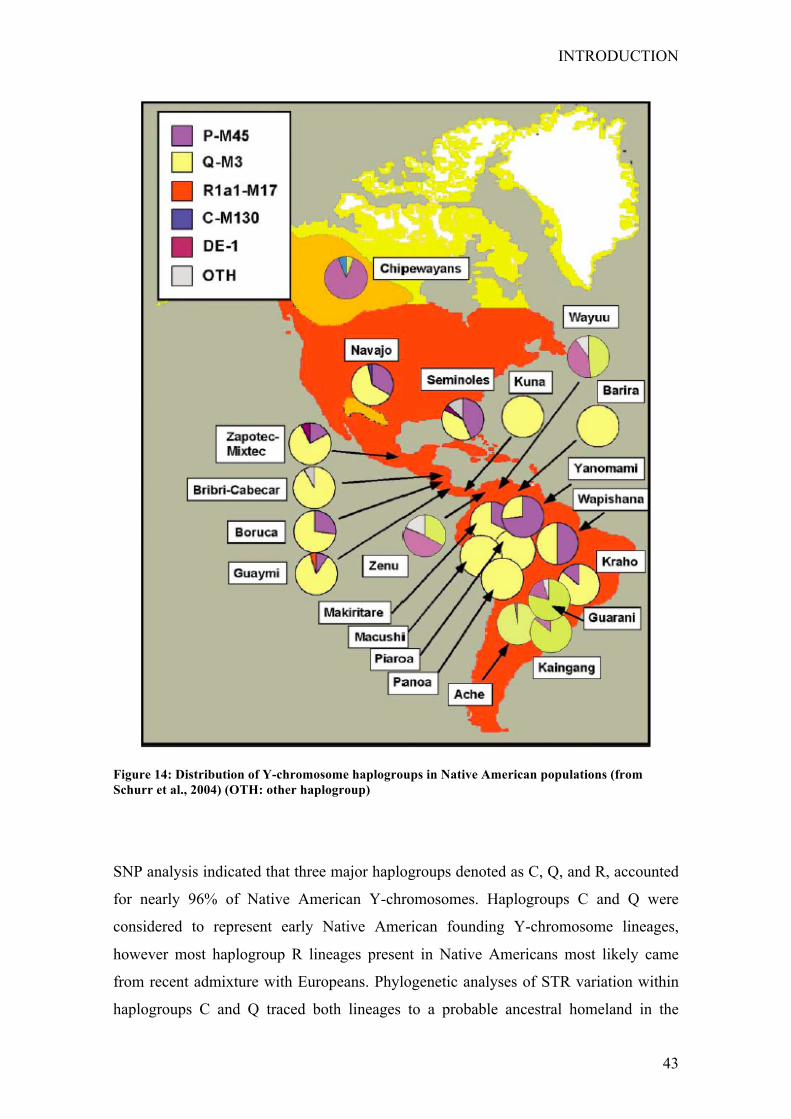
INTRODUCTION
43
Figure 14: Distribution of Y-chromosome haplogroups in Native American populations (from Schurr et al., 2004) (OTH: other haplogroup)
SNP analysis indicated that three major haplogroups denoted as C, Q, and R, accounted
for nearly 96% of Native American Y-chromosomes. Haplogroups C and Q were
considered to represent early Native American founding Y-chromosome lineages,
however most haplogroup R lineages present in Native Americans most likely came
from recent admixture with Europeans. Phylogenetic analyses of STR variation within
haplogroups C and Q traced both lineages to a probable ancestral homeland in the
INTRODUCTION
44
vicinity territory of the Altai Mountains in Southwest Siberia. Divergence dates
between the Altai plus North Asians versus the Native American population system
ranged from 10,100 to 17,200 years for all lineages, excluding a very early entry into
the Americas (Zegura et al. 2004).
The P-M45 lineage is considerably older than the Q-M3 lineage, which derives from it.
According with Underhill et al. (2000) SNP mutation rate, P-M45 haplotypes is
estimated to be at least 30,000 years old. This degree of antiquity is also reflected by
their widespread distribution in Siberia and Eurasia (Lell et al. 2002; Underhill et al.
2000). In addition, phylogenetic analysis showed that this lineage has been present in
Siberia long enough to diversify, supported by the presence of two different types of Y-
chromosome haplotypes has revealed two distinct sets of P-M45 haplotypes in Native
American populations. The first of these (M45a) is more broadly distributed in
populations from North, Central and South America, whereas the second (M45b)
appears only in North and Central American groups (Bortolini et al. 2003; Lell et al.
2002). Haplogroup P-M45 is also widely distributed among Native American
populations and represents 30% of their Y chromosome haplotypes (Bortolini et al.
2002; 2003; Lell et al. 2002; Ruiz-Linares et al. 1999).
Q-M3 haplotypes appear at high frequencies in most Native American populations and
are distributed in an increasing north-to-south cline within the continent. In addition the
STR data from Q-M3 haplotypes also reveal significant differences in haplotype
distributions between North-Central and South American populations, suggesting
different population histories in the two major continental regions (Bianchi et al. 1997;
Bianchi et al. 1998; Lell et al. 1997; Lell et al. 2002; Santos et al. 1999; Underhill et al.
1996). A pattern also seen in the gamma globulin (GM), major histocompatibility locus
antigen (HLA), and nuclear genetic data from Native American groups (Erlich et al.
1997; Rothhammer et al. 1997; Schanfield 1992). Many efforts have been made to
estimate the age of Q-M3 haplogroup, given that it appears to signal the initial entry of
ancestral populations into the New World. According with the SNP rate mutation
proposed by Underhill and colleagues (2000) the age for this haplogroup was ~13,800
ybp (Schurr and Sherry 2004). The estimates made with STR mutation rates have
ranged from 30,000–7,600 ybp (Bianchi et al. 1997; Hammer et al. 1998; Karafet et al.
1999; Underhill et al. 1996). Examples of some proposals dating; 30,000-2,100 ybp
INTRODUCTION
45
(Underhill et al. 1996); 11,000–9,000 ybp (Ruiz-Linares et al. 1999); 7,650+5,000 ybp
(Karafet et al. 1999); and Bianchi et al. (1998) whom estimated an average age of
22,770 ybp. The mutational age of Q-P36*, the marker which define the entire Q
lineage, is 17,700+4,820 ybp (Hammer and Zegura 2002).
Haplogroup Q is present in about 76% of Native Americans (Zegura et al. 2004),
similar to the situation with mitochondrial haplogroups, the Y-chromosome
haplogroups (C and Q) common in the Americas are uncommon elsewhere, with the
exception of northern Asia, where they reach frequencies of 28% and 18%, respectively
(Mulligan et al. 2004). Since the identification of the SNP (Q-M242), the efforts to fine
newly Native American haplogroups and date them were continued increased. The Q-
M242 marker occurred within haplogroup P-M45 in Central Asia prior to the
emergence of the Q-M3 SNP and the expansion of its haplotypes into the Americas. Q-
M242 marker may better define the initial entry into the Americas than Q-M3. Base on
STR mutation rates, the age of M242 haplotypes in the Americas was calculated at
~18,000–15,000 ybp (Bortolini et al. 2003; Seielstad et al. 1999). Whit the increase of
genetic studies focus in particular areas of the Americas, now is possible to identify the
microsatellite diversity and distribution of a Y-lineage specific, such is the case of Q-
M19 identified only in South America, indicates that certain Native American
populations have been isolated since the initial colonization of the region, suggesting an
early onset for tribalization of this populations (Bortolini et al. 2003; Ruiz-Linares et al.
1999).
Most of the remaining Y-chromosome haplotypes belong to one of several different
haplogroups, and comprise only 5% of Native American Y-chromosomes. In general,
these haplotypes have limited distributions in the Americas. C-M130 haplotypes have
only been detected in the Na-Dene-speaking Tanana, Navajo, and Chipewyan, and the
Amerindian Cheyenne (Bergen et al. 1999; Bortolini et al. 2002; Bortolini et al. 2003;
Karafet et al. 1999). C-M130 lineage is younger than the F-M89 or K-M9 lineages,
having been dated at ~30,000–25,000 ybp (Karafet et al. 1999; Underhill et al. 2000).
Its age is generally consistent with its broad distribution in East and Southeast Asia, in
which it appears to have originated, and its haplotypic diversity in eastern Siberian and
Asian populations (Lell et al. 2002). Age estimates for the entire C lineage and the
INTRODUCTION
46
Native American-specific C-P39 are 27,500+10,100 and 2,550+1910 ybp respectively
(Hammer and Zegura 2002; Karafet et al. 2002).
R1a1-M17 haplotypes have only been observed in the Guaymi (Ngöbe) a tribe from
Costa Rica (Lell et al. 2002) neither of these haplogroups has been detected in South
Native American populations. These haplotypes constitute a distinct branch within R1a,
and are not especially common in Siberian populations, although occurring across a
broad geographic area (Lell et al. 2002). The estimated age of R1a1-M17 haplogroup is
rather intriguing, using the Underhill et al. (2000) SNP evolution rate, an age of 13,800
ybp was obtained to this lineage, falling into the very end of the Last Glacial Maximum
(Schurr and Sherry 2004). The data suggest that R1a1-M17 haplotypes did not emerge
in Siberia until after the Americas had already been colonized and were brought to the
Americas through a secondary expansion of ancient Asian populations, along with C-
M130 and P-M45b haplotypes (Lell et al. 2002). The limited distribution of these minor
haplogroups suggests that they were brought to the New World as part of a secondary
expansion of ancient Asian populations (Schurr 2004).
Some studies about the phylogeny, phylogeography of Native American populations,
which have provided important insights to the reconstruction of the Peopling of the
Americas include: (Bianchi et al. 1997; 1998; Bortolini et al. 2002; 2003; Bravi et al.
1997; Hammer 1995; 1997; Karafet et al. 1997; 2002; 1999; Lell et al. 1997; 2002;
Mesa et al. 2000; Pena et al. 1995; Rothhammer and Moraga 2001; Ruiz-Linares et al.
1999; 1996a; Santos 1995; 1999; 1996b; Scozzari et al. 1997; Seielstad et al. 2003; Su
et al. 1999; Tarazona-Santos and Santos 2002; Underhill et al. 1997; 1996; 2001; Vieira
et al. 2002; Wang et al. 2007; Zegura et al. 2004).
2.2.3 RoutestoAmerica:Y-chromosome
To characterize NRY variation in Native Americans, researchers have employed a
number of different SNPs and STRs loci to define the paternal lineages present within
them (Bianchi et al. 1997; 1998; Hammer et al. 1997; Karafet et al. 1997; 1999; Lell et
al. 1997; 2002; Pena et al. 1995; Underhill et al. 1997; 1996; 2001; 2000). However,
these research groups have not consistently used the same combination of genetic
markers in their studies, which lead to alternative and sometimes confusing
INTRODUCTION
47
nomenclatures for NRY haplotypes and haplogroups. The synthesis of these data has
resulted in a consensus nomenclature based on known SNPs Y Chromosome
Consortium (YCC) (2002).
From the recompilation of the aforementioned studies they have focused on the Y-
chromosome as an independent source of genetic information about the peopling of the
Americas (Mulligan et al. 2004). To ascertain the genetic structure of the Asian and
Native American populations have been necessary to make inferences about; 1) the
population size of the first colonists (Pena et al. 1995; Schurr et al. 1990; Ward et al.
1991); 2) place(s) of origin; and 3) number of migration “waves” (Karafet et al. 1999;
Merriwether et al. 1995; Santos et al. 1999; Torroni et al. 1993a), are issues debated by
geneticists, archaeologists, biological anthropologists, and historical linguists.
Moreover, they have attempted to date the Most Recent Common Ancestors of Asian-
Amerindian molecular lineages (Forster et al. 1996; Torroni et al. 1993b) and the
migration waves by dating of the Native American–specific lineages (Underhill et al.
1996) or of the population expansion following the colonization of the new continent
(Bonatto and Salzano 1997b). However, these inferences concerning the
aforementioned genetic or demographic events are often not consistent among
themselves or with available linguistic, archeological, and paleoanthropological data
(Crawford 1998a; Powell and Neves 1999).
The first studies based on Y-chromosome diversity have shown a consistent pattern of
scarce haplotypic diversity in Native American populations (Ruiz-Linares et al. 1999),
also the first findings which suggested almost no or very restricted variability were
contradicted by more recent studies which documented more variation, although it is
generally less marked than those found in the mtDNA or autosome regions (Salzano
2002).
2.2.3.1 PlaceoforiginanddataentrytotheAmericas
A variety of genetic dating techniques, including mutational ages, mismatch distribution
expansion dates, coalescence ages, and population divergence dates, have been
employed to estimate the date of colonization. Cavalli-Sforza et al. (1994) used
autosomal data as a basis for their estimate of 32,000 ybp for the divergence of the
INTRODUCTION
48
Native American population system. Stone and Stoneking (1998) discussed a number of
studies based on mtDNA that favored colonization dates before 20,000 ybp and
presented their own evidence for a 23,000–37,000 population expansion. Although
mtDNA haplogroup lineages A, C, and D have generally yielded dates earlier than
20,000 ybp, Schurr (2000) gave a restriction fragment length polymorphism (RFLP)
derived date of 17,700–13,500 years ago for haplogroup B, an estimate consistent with
the earlier claims of Torroni et al. (1994a) and Wallace (1997) that haplogroup B in the
Americas was considerably younger than the other three lineages. A possible dispersal
from Eurasia to the Americas has also been dated based on haplogroup X. Brown et al.
(1998) proposed that this range expansion took place either between 36,000 and 23,000
ybp or 17,000 and 12,000 ybp. Earlier dating attempts using Y chromosome data have
lacked precision (Zegura et al. 2004).
One of the first attempts to reconstruct ancient migration patterns within Asia region
was carried out by Su and collaborators (1999); their results based on a set of Y-
chromosome biallelic and microsatellite markers shown that southern populations in
eastern Asia were much more polymorphic than northern populations, which have only
a subset of the southern haplotypes. This pattern indicates that the first settlement of
modern humans in eastern Asia occurred in mainland Southeast Asia during the last Ice
Age, coinciding with the absence of human fossils in eastern Asia, 50,000–100,000 ybp.
After the initial peopling, a great northward migration extended into northern China and
Siberia (Su et al. 1999).
Santos and colleagues (1999) studied in 306 worldwide men sample Y-chromosomal
polymorphisms to give more insights about Pleistocene male migrations to the
Americas. With the obtaining of 32 haplotypes constructed thought the variation found
in 30 distinct polymorphic sites, was possible to traced back the major Y haplotype
present in most Native American in recent ancestors common with Siberians, namely,
the Kets and Altaians from the Yenissey River Basin and Altai Mountains, respectively.
The next common ancestor gave rise also to Caucasoid Y chromosomes, probably from
the central Eurasian region. These authors suggests a predominantly central Siberian
origin for Native American paternal lineages for those who could have migrated to the
Americas during the Upper Pleistocene (Santos et al. 1999). This study traces the major
Native American Y-chromosome haplotype to the immediate ancestor shared with
INTRODUCTION
49
present-day Siberians and to an older common ancestor shared with Caucasoids
(Europeans and Indians).
The Americas was the last continent to be settled by humans, but many details of the
earliest occupation remain poorly understood. Proposals for the date of first entry fall
into two ranges, one suggesting a very early occupation ∼30,000–40,000 ybp, and the
other favoring dates ∼13,000 ybp, when the polar climate was again hospitable.
Seielstad et al. (2003) present Y-chromosomal data that support strongly the latter dates,
probably closer to 15,000-18,000 ybp, which was congruent with the paucity of sites
and skeletal material credibly dated to 114,000 ybp has been a consistent puzzle for
those who would posit an extremely ancient history of human occupation in the
Americas (Dillehay 2000).
2.2.3.2 Singlefoundinghaplotypeandsinglewave
Studies based on the nonrecombining portion of the Y-chromosome have revealed a
single major paternal haplotype at relatively high frequencies in Native American
populations from Alaska to Argentina (Bianchi et al. 1997; Karafet et al. 1997; Lell et
al. 1997; Santos et al. 1996a; Santos et al. 1999; Tarazona-Santos and Santos 2002;
Underhill et al. 1996). These findings generally have been interpreted to support a
single origin for the three major New World linguistic groups (Karafet et al. 1997;
Underhill et al. 1996). Bianchi et al. (1998) made one of the first proposals suggested
that the old Native populations derived from an ancestral founder haplotype dated at
22,770 ybp been in good agreement with mtDNA estimates. On the other hand Karafet
and (1997) suggested that because of the paucity of Y-chromosome polymorphisms
sampled in Native American and Asian populations, it was premature to infer a single
paternal founder lineage and to conclude that this haploid system unequivocally
supports a single-origin model for Native Americans. The first available data was
interpreted as indicating that the colonizers of the New World carried a single founder
haplotype, however these early studies have been based on a few, mostly complex
polymorphisms of insufficient resolution to determine whether observed diversity stems
from admixture or diversity among the colonizers (Carvalho-Silva et al. 1999).
INTRODUCTION
50
Zegura et al. (2004) provide a more fine-grained paternal genetics perspective in order
to resolve important questions about the American peopling. These authors used a larger
Y-chromosome database including more microsatellite and SNPs markers to refine their
previous analyses (Karafet et al. 1997; 1999) of founder versus admixture-derived
lineages in the Americas, to give insights about the most probable area of the postulated
Asian geographic source of Native American Y-chromosomes; estimate the time of
divergence between the Native American population system(s) and various Asian
population systems; and address the most likely number of migrations detected so far by
Y chromosome data from Native Americans. Their conclusions were similar to recent
mtDNA studies; finding Y-chromosome support for a single-migration model, with a
potential common source for all major Native American Y-chromosome and mtDNA
founding lineages in the Altai Mountains of Southwest Siberia. Because none of their
population divergence date estimates exceed 17, 200 ybp, they favored a late entry
model (i.e., 20,000 ybp) that postdates the Last Glacial Maximum (LGM). Finally, it
has primarily been the interaction of genetic drift and gene flow both on Beringia and in
the Americas that has produced the suite of contemporary Native American Y-
chromosome haplogroup frequencies found in their survey (Zegura et al. 2004).
2.2.3.3 Twofoundinghaplotypesandtwowaves
The suggestion of a single founding haplotype for the Americas (see, among others;
Bianchi et al. 1997) has been substituted by the notion that at least two Y-chromosome
lineages contributed to the early peopling of the Americas (Salzano 2002). Some
authors support this new approach; (Bortolini et al. 2003; Karafet et al. 1999; Lell et al.
2002; Rodriguez-Delfin et al. 1997; Ruiz-Linares et al. 1999).
Ruiz-Linares and collaborators (1999) suggested that the available data indicated that
most of the constituent alleles of the putative single Y founder haplotype (DYS199)
were either absent or seen at very low frequencies in Asia. Their results based on 11 Y-
chromosome-specific polymorphic markers in five Native Colombian populations, and
the comparisons with non-Amerind Y-chromosomes showed that most DYS199-C
chromosomes seen in Native Colombians were autochthonous, suggesting at least two
founder haplotype existed among the initial Native American settlers, indicating that the
INTRODUCTION
51
DYS199-T lineage was about 9,000–11,000 years old. The age of the DYS199-C
lineage was more difficult to establish but probably lies in the range of 5,000–18,000
years, the polymorphisms M19-A was detected only in two South American
populations, considerable haplotypic diversity associated with this marker was
observed, suggesting a wider population distribution in the South region (Ruiz-Linares
et al. 1999).
The expansion of Karafet et al. (1999) database lead them to a different conclusion,
postulated that there was at least two major New World paternal founder haplotypes
arriving to the New World via separate migratory processes, for this reason more than
single migration could happen. The observed contrasting distribution patterns of the two
major candidate founder haplotypes in Asia and the New World, as well as the results of
a nested cladistic analysis, suggested the possibility of more than one paternal migration
from the general region of Lake Baikal to the Americas (Karafet et al. 1999). These new
results favored a two-migration scenario, a proposal later supported by Lell et al. (2002)
whom surveyed Y-chromosome SNP and microsatellite variation in a large sample of
native populations of Siberia and the Americas geographically dispersed. In this
analysis was accepted that two major male migrations peopled the Americas: one
starting from southern Middle Siberia, giving rise to haplogroups M3 and M45a in
North, Central, and South America, and a second migration from eastern Siberia, which
brought Y-chromosome lineages RPS4Y-T and M45b to the Na-Dene and Amerinds of
North and Central America. These results were correlate well with previous conclusions
about the maternal migrations that brought mtDNA haplogroups A, B, C, and D to the
Americas, suggesting that both males and females came to the New World in at least
two coherent waves of migration, the first arising in southern Middle Siberia and the
second arising later from southeastern Siberia (Lell et al. 2002).
With the development of the “two migratory waves” approach others authors give more
support to the “single migration wave”, like Tarazona-Santos and Santos (2002) argued
that the claim of a second major migration was not well grounded and was not
necessary to explain the distribution of the haplogroups S4Y and M45b in Native
American populations like previously proposed by Lell et al. (2002), otherwise the first
wave coincides with their previous findings (Santos et al. 1999) and that of Karafet et
al. (1999). These authors thought that Lell et al. (2002) have not provided any solid
INTRODUCTION
52
evidence about the existence of a second “major migration” and think that the simplest
way to reconcile the current available molecular genetic data, which was mainly derived
from Y-chromosomes and mtDNA (Bonatto and Salzano 1997a, b), was to assume a
single major migration from Siberia, contributing to the gene pool of Native American
populations (Tarazona-Santos and Santos 2002).
In the study performed by Bortolini and (2003), based on the Y-chromosome diversity
of eight SNPs and six STRs of Native American and Mongolian populations; The
distribution, relatedness, and diversity of Y lineages in Native Americans indicate a
differentiated male ancestry for populations from North and South America, strongly
supporting a diverse demographic history for populations from these areas. These data
was consistent with the occurrence of two major male migrations from southern-central
Siberia to the Americas (with the second migration being restricted to North America)
and a shared ancestry in central Asia for some of the initial migrants to Europe and the
Americas. The age estimates based on this genetic diversity placed the initial settlement
of the American continent at ~14,000 ybp, in relative agreement with the age of well-
established archaeological evidence (Bortolini et al. 2003).
2.2.3.4 Othermodels
Coastal route: Recent genomic studies have produced detailed genome wide
descriptions of genetic diversity and population structure for a wide variety of human
populations, both at the global level (Prugnolle et al. 2005; Rosenberg et al. 2002;
Shriver et al. 2005; Witherspoon et al. 2006) and for individual geographic regions,
including East Asia (Kim et al. 2005), Europe (Belle et al. 2006; Seldin et al. 2006), and
India (Rosenberg et al. 2006). The first such analysis of indigenous populations from
the American continent landmass, using 678 microsatellites genotyped in 530
individuals from 29 Native American populations sampled from North, Central, and
South America and analyzed them jointly with similar data available in 54 other
indigenous populations worldwide was carried out by Wang and collaborators (2007).
In this study the researches reported evidence of: (1) a higher level of diversity and
lower level of population structure in western South America compared to eastern South
America, (2) a relative lack of differentiation between Mesoamerican and Andean
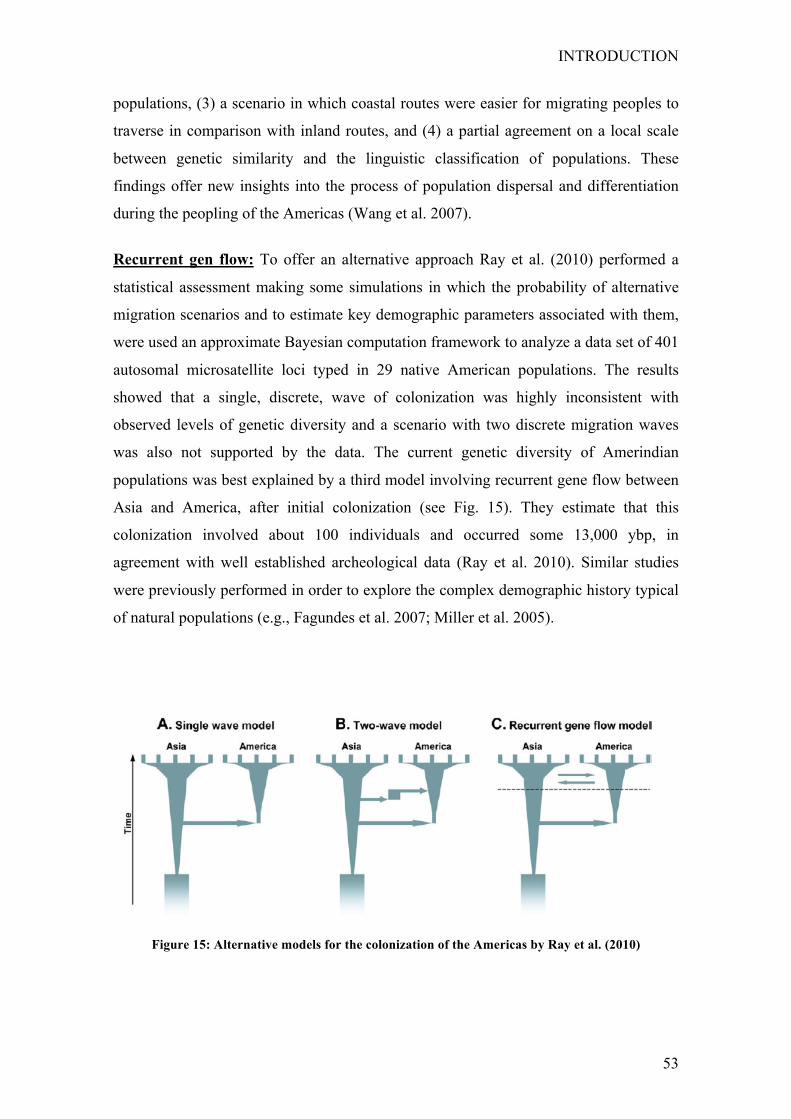
INTRODUCTION
53
populations, (3) a scenario in which coastal routes were easier for migrating peoples to
traverse in comparison with inland routes, and (4) a partial agreement on a local scale
between genetic similarity and the linguistic classification of populations. These
findings offer new insights into the process of population dispersal and differentiation
during the peopling of the Americas (Wang et al. 2007).
Recurrent gen flow: To offer an alternative approach Ray et al. (2010) performed a
statistical assessment making some simulations in which the probability of alternative
migration scenarios and to estimate key demographic parameters associated with them,
were used an approximate Bayesian computation framework to analyze a data set of 401
autosomal microsatellite loci typed in 29 native American populations. The results
showed that a single, discrete, wave of colonization was highly inconsistent with
observed levels of genetic diversity and a scenario with two discrete migration waves
was also not supported by the data. The current genetic diversity of Amerindian
populations was best explained by a third model involving recurrent gene flow between
Asia and America, after initial colonization (see Fig. 15). They estimate that this
colonization involved about 100 individuals and occurred some 13,000 ybp, in
agreement with well established archeological data (Ray et al. 2010). Similar studies
were previously performed in order to explore the complex demographic history typical
of natural populations (e.g., Fagundes et al. 2007; Miller et al. 2005).
Figure 15: Alternative models for the colonization of the Americas by Ray et al. (2010)
INTRODUCTION
54
2.2.4 LocalDiversity:Y-chromosomestudiesinMexicanpopulations
The Y-chromosome genetic diversity has been studied at a local level, to see if the
distribution patters are similar or correspond to different demographic and historical
movements of the old Native American populations. Like Tarazona-Santos et al. (2001)
described a different pattern of the genetic variability in southern populations; their
results showed that; 1) the Andean populations exhibit significantly higher levels of
within-population variability than do the eastern populations of South America; (2) the
spatial-autocorrelation analysis suggests a significant geographic structure of Y-
chromosome genetic variability in South America, although a typical evolutionary
pattern could not be categorically identified; and (3) genetic-distance analyses and the
analysis of molecular variance suggested greater homogeneity between Andean
populations than between non-Andean ones. They proposed a model for the evolution of
the male lineages of South Amerindians that involves differential patterns of genetic
drift and gene flow. In the western part of the continent (Andean area), populations have
relatively large effective sizes and gene-flow levels among them, which has created a
trend toward homogenization of the gene pool. On the other hand, eastern populations
(settled in the Amazonian region, the central Brazilian plateau, and the Chaco region)
have exhibited higher rates of genetic drift and lower levels of gene flow, with a
resulting trend toward genetic differentiation. This model was consistent with the
linguistic and cultural diversity of South Amerindians, the environmental heterogeneity
of the continent, and the available paleoecological data (Tarazona-Santos et al. 2001).
The study of genetic significant points which contribute on the understanding of the
local diversity, to facilitate the historical reconstruction of the Americas has been
development in populations of the three main areas of the continent: North (Barrot et al.
2007; Budowle et al. 2005; Malhi et al. 2008; Zlojutro et al. 2009), Central (Ascunce et
al. 2008; Ruiz-Narvaez et al. 2005) and South (Altuna et al. 2006; Bailliet et al. 2009;
Bravi et al. 1997; Crossetti et al. 2008; Demarchi and Mitchell 2004; Dos Santos et al.
2009; Goncalves et al. 2008; Gonzalez-Andrade et al. 2009; 2007; 2008; Hunemeier et
al. 2007; Leite et al. 2008; Marrero et al. 2007a; 2007b). Local studies not only describe
the current genetic diversity of an specific place, but also represents a excellent tool to
corroborate some historical or migration hypothesis, like the study carried out by Malhi
and collaborators (2008) in which was analyzed the geographic distribution of Y-
INTRODUCTION
55
chromosomes among Native North Americans to test the Southern Athapaskan
migration hypothesis. They found consistent with studies of other genetic systems
(mtDNA), identifying close relationships among Y chromosomes in Athapaskans from
the Subarctic and the Southwest, suggesting that a small number of proto-Apachean
migrants from the Subarctic founded the Southwest Athapaskan populations. Their
results suggest that the Y-chromosome population structure of Native North America
was significantly altered by European admixture, resulted in a decreasing gradient of
haplogroup R from Northeastern to Southwestern North America (Malhi et al. 2008).
To analyze the origins and dispersion of modern humans from Africa to the rest of the
new continents, the knowledge of genetic structure of the current native populations has
been one of the main sources of information. However, there are large areas of the
world for which such genetic information is unavailable. One of the most striking cases
is that of cultural area called Mesoamerica (for definition, see section 3). There have
been few molecular studies specifically addressing Mesoamerican groups in terms of
populations. Most have centered on autosomal markers (Bonilla et al. 2005; Buentello-
Malo et al. 2003; Ibarra-Rivera et al. 2008; Rangel-Villalobos et al. 2000) and
mitochondrial DNA (Green et al. 2000; Peñaloza-Espinosa et al. 2007; Sandoval et al.
2009; Torroni et al. 1994a), although some studies have recently been published on the
Y-chromosome (Gorostiza et al. 2007; Paez-Riberos et al. 2006; Rangel-Villalobos et
al. 2008).
The studies of Y-chromosome diversity in Mexican populations have been
predominated by studies on Mestizo populations. Over the last 500 years, admixture
among (mainly) Natives, Europeans, and Africans, has come to shape the present-day
gene pool of Mexicans, particularly Mestizos (Cerda-Flores et al. 2002b; Felix-Lopez et
al. 2006; Gorostiza et al. 2007; Gutierrez-Alarcon et al. 2007; Hernandez-Gutierrez et
al. 2005; Licea-Cadena et al. 2006; Luna-Vazquez et al. 2008; 2005; 2003; Rangel-
Villalobos et al. 2001a; 2001b; 2000; Rubi-Castellanos et al. 2009a; 2009b; Salazar-
Flores et al. 2009; Torres-Rodriguez et al. 2006), who represent about 93% of the total
Mexican population (Rubi-Castellanos et al. 2009b). The National Institute of
Anthropology defines a Mestizo as a person born in Mexico, who has a Spanish derived
last name, and has a family with Mexican ancestors who can be traced back to the third
generation (Sanchéz-Serrano 1996). In 1570, the Mestizos constituted <0.5%, but in
INTRODUCTION
56
1810 they comprised nearly 40% of the total Mexican population (Aguirre-Beltrán
1989) and currently make up about 93% of the total population, in addition to Mexican
ethnic groups (INEGI). One of the most accepted models for describing the current
genetic diversity of Mexican Mestizos is the trihybrid model of admixture, which
presents different admixture components depending on the geographical area (Lisker et
al. 1996); this model is represented in a tripolar-diagram in which the edges are very
narrow, indicating that the number of individuals who are ‘‘genetically pure’’ for any of
the three racial components is insignificant (Gorodezky et al. 2001).
Fortunately the above landscape began to change, since 1980’s some researches started
to make some inferences about the genetic diversity within the Native Americans
(Barrot et al. 2005; 2007; Felix-Lopez et al. 2006; Gonzalez-Andrade et al. 2008; Licea-
Cadena et al. 2006; Paez-Riberos et al. 2006; Rangel-Villalobos et al. 2000), due to the
difficulty to carry out samplings with indigenous populations, the majority of first
studies were focus on Mestizos. One of the main proposes was to describe the current
genetic variation in Mexican populations, in order to answer questions about
demographic history and migration process. Cerda-Flores and started to work with
classical genetic markers in Mestizo populations from the northern part of Mexico
(Cerda-Flores and Garza-Chapa 1989; Cerda-Flores et al. 1987). Subsequently the used
of Y-chromosome markers like STRs were incorporated to the genetic studies, to
describe the maximum likelihood estimate admixture in Mexican Mestizo populations
(Cerda-Flores et al. 2002a) and the genetic admixture in the same populations (Cerda-
Flores et al. 2002b). Other studies based on STRs Y-chromosome markers, have been
done in Mexican Mestizo only with forensic interests, mainly in the metropolis (Luna-
Vazquez et al. 2008; Luna-Vazquez et al. 2005; Luna-Vazquez et al. 2003), and other
cities (Barrot et al. 2005; Barrot et al. 2007; Gutierrez-Alarcon et al. 2007; Licea-
Cadena et al. 2006; Martinez-Gonzalez et al. 2005).
INTRODUCTION
57
3 Mesoamerica
The term Mesoamerica refers to a geographical area occupied by a variety of ancient
cultures that shared religious beliefs, art, architecture, and technology that made them
unique in the Americas for three thousand years–from about 1500 B.C. to 1519 A.D.–
the time of European contact (Kirchhoff 1943; López-Austin and López- Luján 2001).
The region spans from the current central-south Mexico to some areas of Central
America. The prehistory of the region inferred from human and archeological remains
supports the existence in time and space of a continuous human presence for at least
11,000 years. Mesoamerica is one of our planet's six cradles of early civilization. Many
aspects of the ancient cultures of Central-South Mexico, Guatemala, Belize, Honduras,
El Salvador, Nicaragua and Costa Rica continue to the present and several of these
cultural inventions and traits have spread throughout the world (Kirchhoff 1943).
3.1 Generalbackground
Paul Kirchhoff was the first who introduced the term “Mesoamerica,” he described it as
a cultural zone where the indigenous inhabitants spoke as many as sixty different
languages, but were united by a common history and shared a specific set of cultural
traits that made their civilization unique in the world. Among the most significant was
the development of both pictographic and hieroglyphic writing as well as the production
of books constructed from animal hide or amate paper. A divinatory calendar of 20 x 13
days (tonalpohualli), calculated together with a solar calendar of 365 days, is widely
regarded as being more accurate than those of many other ancient civilizations
throughout the world. Mesoamerican architecture was also unique and distinguished by
preferences for stepped pyramids, stucco floors, and ballcourts. Finally, and perhaps
most importantly for development in the Americas, was the cultivation of specialized
foods including maize, beans, and squash, together with cacao (chocolate) and
fermented beverages made from maguey. Many of these foods became the staples of a
world-wide diet we continue to thrive on today (Carmack et al. 1996; Kirchhoff 1943).
Mesoamerica once boasted a population of over 50 million people living throughout an
area roughly contiguous with the modern nations of México, Guatemala, Honduras,
INTRODUCTION
58
Belize, and El Salvador. The principal factors that contributed to the origins of
Mesoamerica’s civilizations are debated by scholars working throughout the region
today but most believe that the inequalities between rulers and ruled, a condition of all
early civilizations, developed with the consolidation of social power by chiefs who
coordinated agricultural labor and supervised the storage and redistribution of crop
surpluses that ensured group survival against drought and other natural calamities. Once
foods had been domesticated as staples, they would have been available to any
population interested in shifting from foraging to agriculture and sedentary life.
Agriculture can support large populations but it demands ever more intensive forms of
cultivation. Mesoamerican people met the challenge by developing a wide variety of
agricultural techniques, from terracing mountain sides to digging canals or even creating
artificial wetlands. Mesoamericans domesticated dogs and turkeys, but wild animals
like deer were naturally drawn to gardens where they could be easily captured and
tethered. The cultivation of fruit trees attracted a wide variety of tropical birds whose
colorful plumage was coveted for displaying wealth and prestige (Palerm 1972).
The successful development of agricultural intensification allowed Mesoamerican
civilizations to build surpluses that not only insured themselves against catastrophes like
drought but also led to social specialization and ultimately to the creation of specialized
classes of merchants, warriors, artisans, and aristocracies of kings. Mesoamerican
peoples were sufficiently impressed with their accomplishments as agricultural
engineers that they even commemorated foods, like squash for example, in artistic
masterpieces of precious greenstone. As “big men” were called upon to sponsor tribal
feasts, they enlarged their own quarters and expanded the open yards surrounding their
dwellings to accommodate more of their clients. Eventually prestige came to be marked
by house size, and chiefs used their dwellings to display their elevated status by literally
raising their homes on artificial platforms and restricting surrounding space to
specialized ritual activities. From these humble beginnings came the magnificent
palaces, temples, and plazas that continue to awe us today. Click on Image for more
detail (López-Austin and López- Luján 2001; Palerm 1972).
INTRODUCTION
59
3.2 Archeologicalrecord
Mesoamerican chronology divides the history of pre-Columbian Mesoamerica into a
number of named successive eras or periods, from the earliest evidence of human
habitation through to the early Colonial period, which followed the Spanish
colonization of the Americas. These are known, with slight variation depending on
region, as the Paleo-Indian, the Archaic, the Preclassic (or Formative), the Classic, and
the Postclassic periods. The last three periods, representing the core of Mesoamerican
cultural fluorescence, are further divided into two or three sub-phases. Most of the time
following the arrival of the Spanish in the 16th century is grouped into the Colonial
period (Weaver Muriel 1993).
The differentiation of early periods (i.e., up through the end of the Late Preclassic)
generally reflects different configurations of socio-cultural organization that are
characterized by increasing socio-political complexity, the adoption of new and
different subsistence strategies, and changes in economic organization (including
increased interregional interaction). The Classic period through the Postclassic are
differentiated by the cyclical crystallization and fragmentation of the various political
entities throughout Mesoamerica. Each period showed a particular architecture,
nowadays is capture in the cultural records preserved in diverse Mesoamerican
archeological sites (see Table 1).
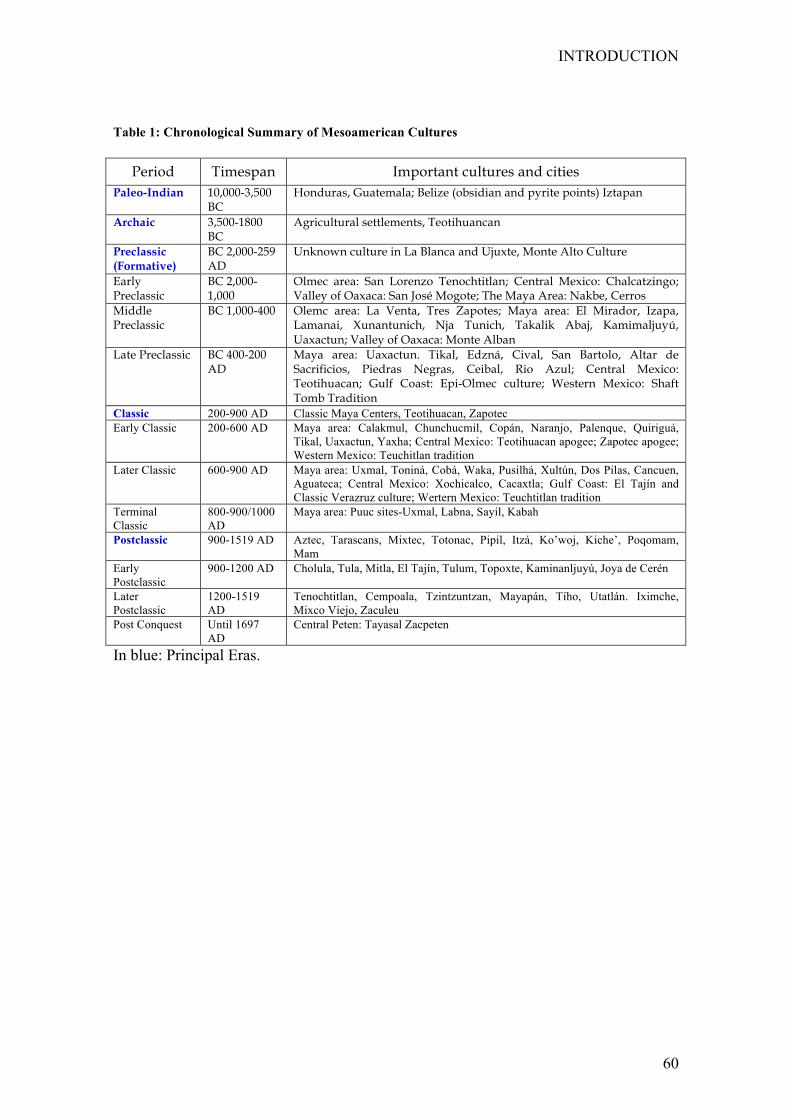
INTRODUCTION
60
Table 1: Chronological Summary of Mesoamerican Cultures
Period Timespan Important cultures and cities Paleo-Indian 10,000-3,500
BC Honduras, Guatemala; Belize (obsidian and pyrite points) Iztapan
Archaic 3,500-1800 BC
Agricultural settlements, Teotihuancan
Preclassic (Formative)
BC 2,000-259 AD
Unknown culture in La Blanca and Ujuxte, Monte Alto Culture
Early Preclassic
BC 2,000-1,000
Olmec area: San Lorenzo Tenochtitlan; Central Mexico: Chalcatzingo; Valley of Oaxaca: San José Mogote; The Maya Area: Nakbe, Cerros
Middle Preclassic
BC 1,000-400 Olemc area: La Venta, Tres Zapotes; Maya area: El Mirador, Izapa, Lamanai, Xunantunich, Nja Tunich, Takalik Abaj, Kamimaljuyú, Uaxactun; Valley of Oaxaca: Monte Alban
Late Preclassic BC 400-200 AD
Maya area: Uaxactun. Tikal, Edzná, Cival, San Bartolo, Altar de Sacrificios, Piedras Negras, Ceibal, Rio Azul; Central Mexico: Teotihuacan; Gulf Coast: Epi-Olmec culture; Western Mexico: Shaft Tomb Tradition
Classic 200-900 AD Classic Maya Centers, Teotihuacan, Zapotec Early Classic 200-600 AD Maya area: Calakmul, Chunchucmil, Copán, Naranjo, Palenque, Quiriguá,
Tikal, Uaxactun, Yaxha; Central Mexico: Teotihuacan apogee; Zapotec apogee; Western Mexico: Teuchitlan tradition
Later Classic 600-900 AD Maya area: Uxmal, Toniná, Cobá, Waka, Pusilhá, Xultún, Dos Pilas, Cancuen, Aguateca; Central Mexico: Xochicalco, Cacaxtla; Gulf Coast: El Tajín and Classic Verazruz culture; Wertern Mexico: Teuchtitlan tradition
Terminal Classic
800-900/1000 AD
Maya area: Puuc sites-Uxmal, Labna, Sayil, Kabah
Postclassic 900-1519 AD Aztec, Tarascans, Mixtec, Totonac, Pipil, Itzá, Ko’woj, Kiche’, Poqomam, Mam
Early Postclassic
900-1200 AD Cholula, Tula, Mitla, El Tajín, Tulum, Topoxte, Kaminanljuyú, Joya de Cerén
Later Postclassic
1200-1519 AD
Tenochtitlan, Cempoala, Tzintzuntzan, Mayapán, Tího, Utatlán. Iximche, Mixco Viejo, Zaculeu
Post Conquest Until 1697 AD
Central Peten: Tayasal Zacpeten
In blue: Principal Eras.
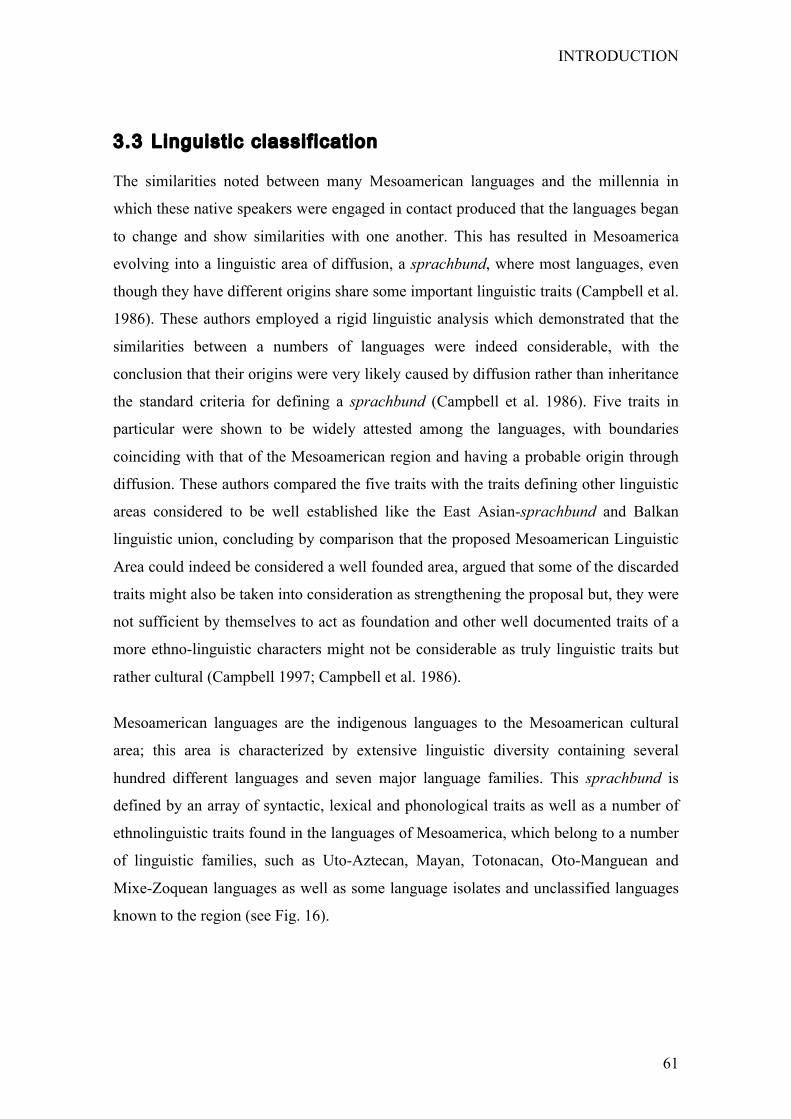
INTRODUCTION
61
3.3 Linguisticclassif ication
The similarities noted between many Mesoamerican languages and the millennia in
which these native speakers were engaged in contact produced that the languages began
to change and show similarities with one another. This has resulted in Mesoamerica
evolving into a linguistic area of diffusion, a sprachbund, where most languages, even
though they have different origins share some important linguistic traits (Campbell et al.
1986). These authors employed a rigid linguistic analysis which demonstrated that the
similarities between a numbers of languages were indeed considerable, with the
conclusion that their origins were very likely caused by diffusion rather than inheritance
the standard criteria for defining a sprachbund (Campbell et al. 1986). Five traits in
particular were shown to be widely attested among the languages, with boundaries
coinciding with that of the Mesoamerican region and having a probable origin through
diffusion. These authors compared the five traits with the traits defining other linguistic
areas considered to be well established like the East Asian-sprachbund and Balkan
linguistic union, concluding by comparison that the proposed Mesoamerican Linguistic
Area could indeed be considered a well founded area, argued that some of the discarded
traits might also be taken into consideration as strengthening the proposal but, they were
not sufficient by themselves to act as foundation and other well documented traits of a
more ethno-linguistic characters might not be considerable as truly linguistic traits but
rather cultural (Campbell 1997; Campbell et al. 1986).
Mesoamerican languages are the indigenous languages to the Mesoamerican cultural
area; this area is characterized by extensive linguistic diversity containing several
hundred different languages and seven major language families. This sprachbund is
defined by an array of syntactic, lexical and phonological traits as well as a number of
ethnolinguistic traits found in the languages of Mesoamerica, which belong to a number
of linguistic families, such as Uto-Aztecan, Mayan, Totonacan, Oto-Manguean and
Mixe-Zoquean languages as well as some language isolates and unclassified languages
known to the region (see Fig. 16).
INTRODUCTION
62
Figure 16: Linguistic Map based on the previous linguistic maps compiled in The Handbook of
Middle American Indians (McQuown 1968).
Mesoamerican languages were also among the first to evolve independent traditions of
writing. The oldest texts date to approximately 1,000 B.C. while most texts in the
indigenous scripts (such as Maya) date to ~600-900 A.D. Following the arrival of the
Spanish in the 16th century, and continuing up until the 19th century, most
Mesoamerican languages were written in Latin script. Many Mesoamerican languages
today are either endangered or already extinct, but others, including the Mayan
languages, Nahuatl, Mixtec and Zapotec, have several hundred thousand speakers and
remain viable (Suárez 1983).
INTRODUCTION
63
4 NativeMexicanPopulations
Ancient Mexico is classified into three major regions based on the history of native
populations and cultural evidence; these regions are called cultural regions and have
been dived in: Arid America (Northeast Mexico and Baja California peninsula); Oasis
America (Northwest Mexico) and Mesoamerica (Central-South Mexico, Guatemala,
Belize, Honduras, El Salvador, Nicaragua and Costa Rica) (López-Austin and López-
Luján 2001). Actually Mexico is defined as a "pluricultural" nation in recognition of the
diverse ethnic groups that constitute it, and in which the indigenous peoples are the
original founders. According to the National Commission for the Development of the
Indigenous Peoples there are ~12 million indigenous people in Mexico, of many
different ethnic groups, which constitute about 11-13% of the population in the country,
the number of Mexican indigenous is estimated to be somewhere between 14% and
30% of the overall Mexican population (estimated approximately in 111 million people)
(http://www.cdi.gob.mx/index.php?id_seccion=3). The Mexican census does not report
racial-ethnicity but only the political-ethnicity of indigenous communities who hold
political autonomy and preserve their indigenous languages, traditions, beliefs, and
cultures.
Law of Linguistic Rights of the Indigenous Languages recognizes 62 indigenous
languages as "national languages" which have the same validity as Spanish in all
territories in which they are spoken. According to the National Institute of Statistics,
Geography and Data Processing (INEGI 2007), approximately 6.7% of the population
speaks an indigenous language, that is, approximately half of those identified as
indigenous. The National Commission for the Development of the Indigenous Peoples
identifies 62 indigenous language groups in Mexico although certain languages have
multiple dialects each of which is unique and may be mutually unintelligible. The
majority of the indigenous population is concentrated in the central and southern states:
Yucatán, 59%; Oaxaca, 48%; Quintana Roo, 39%; Chiapas, 28%; Campeche, 27%;
Hidalgo, 24%; Puebla, 19%; Guerrero, 17%; San Luis Potosí, 15% and Veracruz, 15%
(Lizcano Fernández 2005).
INTRODUCTION
64
4.1 Culturaltraits
The pre-Columbian civilizations of what now is known as Mexico are usually divided in
two regions: Mesoamerica, in reference to the cultural area in which several complex
civilizations developed before the arrival of the Spanish in the sixteenth century, and
Aridoamerica (or the North) in reference to the arid region north of the Tropic of Cancer
in which few civilizations developed and was mostly inhabited by nomadic or semi-
nomadic groups (López-Austin and López- Luján 2001). Mesoamerica was densely
populated by diverse indigenous ethnic groups which, although sharing common
cultural characteristics, spoke different languages and developed unique civilizations
(Aguilar-Moreno 2004). One of the most influential civilizations that developed in
Mesoamerica was the Olmec civilization, sometimes referred to as the "Mother Culture
of Mesoamerica". The later civilization in Teotihuacán reached its peak around 600 AD,
when the city became the sixth largest city in the world, which’s cultural and
theological systems influenced the Toltec and Aztec civilizations in later centuries.
Evidence has been found on the existence of multiracial communities or neighborhoods
in Teotihuacan (and other large urban areas like Tenochtitlan). The Maya civilization,
though also influenced by other Mesoamerican civilizations, developed a vast cultural
region in south-east Mexico and northern Central America, while the Zapotec and
Mixtec culture dominated the valley of Oaxaca, and the Purépecha in western Mexico
(Hamnett 1999).
By the time of the arrival of the Spanish in Mesoamerica, many of the diverse ethnic
civilizations (with the notable exception of the Tlaxcaltecs and the Tarascan Kingdom
of Michoacán) were loosely joined under the Aztec empire, the last Nahua civilization
to flourish in Central Mexico. The capital of the empire, Tenochtitlan, became one of
the largest urban centers in the world, with an estimated population of 350,000
inhabitants (Hamnett 1999). During the conquest of the Aztec Empire, the
conquistadores, only a handful compared to the millions of indigenous peoples, used the
ethnic diversity of the country and exploited the discontentment of the subjugated
groups, making important alliances with rivals of the Aztecs (Aguilar-Moreno 2004).
While the alliances were decisive to their victory, the indigenous peoples were soon
subjugated by an equally impressive empire. Wars and forced labor were accompanied
by the spread of European diseases previously unknown in the New World. Pandemics
INTRODUCTION
65
wrought havoc, killing between 90% and 95% of the pre-contact population according
to some estimates (Hamnett 1999). At first, the colonial system imposed a system of
castes, in which the indigenous peoples were marginalized. Nevertheless, a cultural
symbiosis took place: the indigenous peoples adopted and syncretized Roman
Catholicism, and a new ethnic group was born: the Mestizo, of mixed European and
indigenous ancestry (López Guerra and Flores Chávez 2004).
4.2 LinguisticDiversity
The vast Amerindian linguistic family is present in most of the continent, covering part
of North America and all Central and South America, Mexico being a target of special
interest due to its particular geographic position in the colonization of the continent,
between North and Central America, and because it harbors one of the greatest ethnic
and linguistic diversity. Nowadays, there are more than 68 living native indigenous
populations and 298 languages have been described, of which 291 are living and 7 are
extinct (Campbell 1977). The indigenous languages of Mexico are classified into three
linguistic stocks (Hokan, Otomaguean and Uto-Aztecan), beside six linguistics families
that are not related to other languages, and, therefore, not grouped into the three
linguistic stocks (Algonquian, Huevan, Mayan, Mixe-zoquean, Tarascan and
Totonacan). There are currently 120 ethnic groups in Mexico that are grouped into 12
large linguistic families (Manrique Castañeda 1987). These peculiarities, among others,
make the region one of the most anthropologically diverse and interesting of the
continent.
4.3 GeneticDiversity
In terms of the currently available genetic data there is a lack of an exhaustive
evaluation of the genetic landscape of diversity in Mexico. Some genetic studies based
on uniparental markers (Bonilla et al. 2005; Cerda-Flores et al. 2002a; Cerda-Flores et
al. 2002b; Cerda-Flores et al. 2002c; Green et al. 2000) showed a relative genetic
homogeneity of Mexican Indians. Other studies are based on mixed urban samples
(Mestizos) and showed that these groups are basically the result of admixture between
INTRODUCTION
66
Native Americans, Europeans and, to a lesser extent, West Africans, but give a poor
idea about the genetic structure and diversity of indigenous populations (Silva-Zolezzi
et al. 2009). Moreover, studies focused on ancient mitochondrial DNA (mtDNA) have
shown the presence of A, B and C mtDNA lineages in pre-Columbians. Focusing on
highly informative genetic markers, such as those on the mtDNA and the Y-
chromosome, in native populations will give insights, not only on the genetic diversity
of Mexicans, but also on the understanding of the colonization of the Americas (Bonilla
et al. 2005).

67
OBJECTIVES

OBJECTIVES
69
As humans colonized the world, populations diverged and thus differentiated
genetically. Hence the dispersal of modern humans can be inferred from extant diversity
observed in different parts of our genome (e.g., autosomes, mtDNA or the Y
chromosome). Indeed, the history of human expansions into the New World is
genetically supported by patterns of allele frequency variation (Cavalli-Sforza et al.
1994). The spread, time, and effective population size of the first settlers into the
Americas are complex topics that still need to be elucidated. The extant cultural,
linguistic, archeological, and autochthonous genetic variability harbored by present
indigenous groups are valuable sources to find new answers to past questions.
Within this framework, Mesoamerica deserves special attention: it is one of the main
cultural areas in the Americas where more genetic, cultural and archeological record
exists. In addition, its geographic position is a key factor, because acting as a natural
geographic corridor between North and Central-South America; it has been a direct
witness not only of the initial and subsequent migration waves but also of the many
human civilizations that flourished later on.
Following a molecular anthropological approach, this thesis evaluates the genetic
diversity of a representative sample of the extant Native American gene pool within
Mexico, and by constructing continental datasets it also intends to contribute to the
history reconstruction of Mesoamerica and the peopling of the Americas. For that
purpose, the study of uniparental markers (i.e. mitochondrial DNA and Y-chromosome)
constitutes the main part of the work, but also autosomal STR variation, linguistic
diversity, and ethnographic data were complementary investigated.
The particular aims of the present thesis are as follows:
⇒ To characterize mtDNA and Y-chromosome variation in Native Mexican
populations by means of DNA sequencing, SNP typing and STR amplification,
followed by haplogroup determination and statistical analyses.
⇒ To gain a better understanding of current genetic structure of Native Mexican groups
in order to search for the presence of founding diversity pre-dating the Mestizaje
process.
OBJECTIVES
70
⇒ To use the genetic data generated herein and collect comparable publicly available
data from the literature in order to construct continent-wide datasets and trace both
maternal and paternal lineages throughout the Americas with the ultimate goal of
contributing to the understanding of the tempo and mode of the settlement of the New
World and the reconstruction of the historical events during the evolution of Native
American populations.

71
RESULTS

RESULTS
73
Chapter 1: Nutrit ional status of the poor, marginalizedadultsoftheTriquiethnicgroupinOaxaca,Mexico.
Rosa María Ramos Rodríguez and Karla Sandoval Mendoza
Revista Panamericana de Salud Pública. 2007. 22(4):260–267

RESULTS
83
Chapter 2: Linguistic and maternal genetic diversity arenotcorrelatedinNativeMexicans
Karla Sandoval, Leonor Buentello-Malo, Rosenda Peñaloza-Espinosa, Heriberto
Avelino, Antonio Salas, Francesc Calafell and David Comas.
Human Genetics. 2009 Oct;126(4):521-31.


RESULTS
97
Chapter 3: Paternal l ineages in Native Mexicans show asex-biased admixture and lack of genetic structure inMesoamerica
Karla Sandoval, Leonor Buentello-Malo, Rosenda Peñaloza-Espinosa, Heriberto
Avelino, Andres Ruíz-Linares, Francesc Calafell and David Comas
(Manuscript in preparation)

RESULTS
99
Paternal lineages in Native Mexicans show a sex-biased admixture and
lack of genetic structure in Mesoamerica
Karla Sandoval1, Leonor Buentello-Malo2, Rosenda Peñaloza-Espinosa3, Heriberto
Avelino4, María López1, Andres Ruíz-Linares5, Francesc Calafell1,6, David Comas1,6
1Institute of Evolutionary Biology (UPF-CSIC), CEXS-UPF-PRBB, Barcelona,
Catalonia, Spain.
2Instituto de Investigaciones Antropológicas, Universidad Nacional Autónoma de
México, Mexico City, Mexico.
3Unidad de Investigación Médica en Genética Humana, Centro Medico Nacional, Siglo
XXI, IMSS, 06703 Mexico City, Mexico.
4Department of Linguistics, Max Planck Institute for Evolutionary Anthropology,
Leipzig, Germany.
5The Galton Laboratory, Department of Genetics, Evolution and Environment,
University College London, London, United Kingdom
6 CIBER de Epidemiología y Salud Pública, Spain.
Corresponding author: David Comas
Tel. +34 93 316 0843
Fax. +34 93 316 0901
E-mail: [email protected]
Key words: Y-chromosome STRs, SNPs, Native Mexican populations, Mesoamerica,
genetic diversity, male lineages, continental genetic landscape
Running headline: Y-chromosome diversity of Native Mexican Populations
RESULTS
100
Abstract
The genetic characterization of Native Mexicans is of great interest to
understand the population dynamics of past and present Mexican populations, often of
admixed origin, as well as to aid in the reconstruction of the history of Mesoamerica
and the peopling of the Americas. Here, we describe the Y-chromosome genetic
diversity and haplogroup composition of 197 Native Mexican individuals from eleven
populations, and intersected our results with publicly available data from 911
individuals from 36 additional Native populations from throughout the Americas. We
found extensive heterogeneity among Native Mexican populations but lack of
continental structure, and lack of correlation between linguistic classification and
genetic diversity within Mexico. Populations falling outside Mesoamerica (i.e., Pima
and Tarahumara), the northernmost sampled populations, show the greatest genetic
differentiation. Most of these observations are in agreement with the results found for
the mtDNA on the same population samples. However, contrary to what was observed
in the female lineages, we found a remarkable frequency of European (and to a lesser
extent African) Y-chromosome haplotypes, suggesting a strong female Native
American and male European (and African) sex-biased contribution to the Native
Mexican genomes. We also found differences in the Y-chromosome admixture
proportions among populations, revealing different demographic histories within
Mexico. Our results point towards a complex genetic makeup of Native Mexicans
whose population history has been differently recorded in different regions of the
genome.
RESULTS
101
Introduction
During the last two decades the peopling of the Americas has been subject to
intensive research by geneticists, refining previous knowledge reported by
archeologists, linguists, historians and anthropologists. Despite the controversy of the
colonization of the New World by humans, genetic studies have agreed on two major
issues: a single migration originated in East Asia crossed the Bering land before
entering to the new continent; and this process produced a strong population bottleneck,
such that modern Native Americans show significant reductions in their genetic
variation, as a consequence of substantial genetic drift (Kitchen et al. 2008). However
some questions are still waiting to be solved, like the timing of migration (leaving Asia
and entering into the Americas); the size of founding populations; the nature of the
migration from Asia (was it continuous, slow or fast) and, the migration route(s) taken
within the Americas.
Despite the abundant genetic data on different Native American populations
across the continent, there are specific areas for which such genetic information
continues to be scanty, such as the cultural area known as Mesoamerica. In terms of
human population history, only a few molecular studies have specifically addressed this
region. Most of these studies have been focused on the analysis of Mestizo samples
using autosomal markers (Cerda-Flores et al. 2002a; 1989; 1987; 2002b; Felix-Lopez et
al. 2006; Rangel-Villalobos et al. 1999) and Y-chromosome markers (Gorostiza et al.
2007; Gutierrez-Alarcon et al. 2007; Hernandez-Gutierrez et al. 2005; Licea-Cadena et
al. 2006; Luna-Vazquez et al. 2008; Luna-Vazquez et al. 2005; Luna-Vazquez et al.
2003; Rangel-Villalobos et al. 2001a; Rangel-Villalobos et al. 2001b; Rangel-Villalobos
et al. 2008; Rangel-Villalobos et al. 2000; Rubi-Castellanos et al. 2009a; Rubi-
Castellanos et al. 2009b; Salazar-Flores et al. 2009; Torres-Rodriguez et al. 2006).
RESULTS
102
These studies in Mestizos in Mesoamerica have shown that the Native American
contribution to extant populations is relevant, especially in the maternal side (González-
Oliver et al. 2001; Green et al. 2000; Peñaloza-Espinosa et al. 2007; Sandoval et al.
2009; Torroni et al. 1994). In order to describe the Native component in Mesoamerica, a
few studies have recently been published on Native Mexican groups, mainly in maternal
lineages (Barrot et al. 2005; Felix-Lopez et al. 2006; Paez-Riberos et al. 2006; Rangel-
Villalobos et al. 2000). However, the genetic characterization of paternal lineages on
Native Mexican populations is very scanty and it is needed to give more insights into
both inter and intra variability among Mesoamerican groups, providing another piece to
complete the Peopling of the Americas’ puzzle.
Overall, studies based on Y-chromosome diversity have shown a consistent
pattern of scarce haplotypic diversity in Native American populations (Ruiz-Linares et
al. 1999), also these findings which suggested almost no or very restricted variability
were contradicted by posterior studies which documented more variation, although it is
generally less marked than those found in the mtDNA or autosomal regions (Salzano
2002). Concerning Y-chromosome variation, haplogroup Q is present in about 76% of
Native Americans (Zegura et al. 2004b), and jointly with haplogroup C, these are the
common paternal lineages in the Americas and rare elsewhere, with the exception of
northern Asia, where they reach frequencies of 28% and 18%, respectively (Mulligan et
al. 2004). Since the identification of the Q-M242 SNP (Seielstad et al.2003), the efforts
to find newly Native American haplogroups and date them have continuously increased.
Based on STR mutation rates, the age of M242 haplotypes in the Americas was
calculated at ~18,000–15,000 ybp (Bortolini et al. 2003; Seielstad et al. 1999). Most of
the remaining Y-chromosome haplotypes belong to one of several different
haplogroups, and comprise only 5% of Native American Y-chromosomes, having
RESULTS
103
limited distributions throughout the continent. C-M130 haplotypes have only been
detected among the Na-Dene-speaking Tanana, Navajo, and Chipewyan, and the
Amerindian Cheyenne (Bergen et al. 1999; Bortolini et al. 2002; Bortolini et al. 2003;
Karafet et al. 1999). This have been dated at ~30,000–25,000 ybp (Karafet et al. 1999;
Underhill et al. 2000), generally consistent with its broad distribution in East and
Southeast Asia, where it appears to have originated, and its haplotypic diversity in
eastern Siberian and Asian populations (Lell et al. 2002). Age estimates for the entire C
lineage and the Native American-specific C-P39 are 27,500+10,100 and 2,550+1910
ybp, respectively (Hammer and Zegura 2002; Karafet et al. 2002).
In this study, we present Y-chromosome STR and SNP data for 197 unrelated
individuals from eleven native populations from Mexico belonging to two independent
cultural and geographical areas: Tarahumara and Pima in northern Mexico; and Triqui,
Mixtec, Otomí, Nahua Xochimilco, Nahua Zitlala, Nahua Atocpan, Nahua Ocotitlán,
Purépecha, and Maya, in Mesoamerica. The aim of the present study is to analyze the
diversity of the Y chromosome in these native samples in order to determine the genetic
structure of the paternal lineages and its correlation to geographical, cultural, and
linguistic factors. In addition, we report the male counterpart of the maternal lineages
previously investigated by means of mtDNA analysis on the same Native Mexican
populations (Sandoval et al. 2009) in order to establish the possible admixture sex bias
in Mesoamerican samples.
Materials and Methods
Populations studied
A total of 197 Native Mexican male individuals were analyzed: 22 Triqui, 18
Tarahumara, 2 Mixtec, 7 Otomí, 22 Nahuas from Xochimilco, 22 Nahuas from Zitlala,
RESULTS
104
9 Nahuas from San Pedro Atocpan, 17 Nahuas from Santo Domingo Ocotitlán, 8
Purépecha, 19 Maya, 51 Pima. An additional sample of 11 Quechuas from Peru were
also analyzed and used for inter population comparisons. DNAs from Pima, Maya and
Quechua were provided from the laboratory of Judith R. Kidd and Kenneth K. Kidd
(Yale University, New Haven, Conn., USA) where lymphoblastoid cell lines are
maintained. All samples were collected with the appropriate informed consent and all
individuals were native speakers with local ancestors; their geographic location is
shown in Figure 1.
Y chromosome genotyping
DNA concentration of all samples was normalized to 1ng/µl using the
Quantifiler™ Human DNA Quantification Kit (Applied Biosystems). Three SNPs
(M45, which defines the major haplogroup P; M242, which defines haplogroup Q; and
M207, which defines haplogroup R) were genotyped in all individuals in 5µl reactions
containing 1µl of DNA template, 0.25µl of 20x SNP Genotyping Assay, 1.25µl of
sterile-filtered water and 2.5µl of TaqMan® Universal PCR Master Mix amplified with
a standard conditions each individual by TaqMan® probes (Applied Biosystems). For
those individuals whose lineage was not assigned within the major haplogroup P,
marker M130 (which defines haplogroup C) was genotyped using the same PCR
conditions described above. After the PCR amplification, allelic discrimination was
done with SDS Software TM v2.3 (Applied Biosystems) in order to determine the
haplogroups defined by the SNPs previously described.
A total of 17 Y-STRs loci (DYS19, DYS385a/b, DYS389I, DYS389II,
DYS389II, DYS390, DYS391, DYS392, DYS393, DYS437, DYS438, DYS439,
DYS448, DYS456, DYS458, DYS635, GATA-H4) were amplified with the
AmpFlSTR® Yfiler™ PCR Amplification Kit (Applied Biosystems). PCR products
RESULTS
105
were discriminated in an ABI 3130xl genetic analyzer and the allele sizes were
determined with GeneMapper v3.2.software. The haplogroup assignation defined by the
SNPs was confirmed using the profile based on STRs, with the haplogroup predictor
with the Batch Processing Program (http://www.hprg.com/hapest5/page5.html).
Statistical Analysis
STR-haplotype data was used to estimate intra population genetic diversity
parameters such as: gene diversity, mean pairwise differences and theta values using
Arlequin program v3.11 (Schneider et al. 2005). To compare the Mexican results with
other Native American populations, haplotype information of seven Y-STRs (DYS19,
DYS389I, DYS389II, DYS390, DYS391, DYS392 and DYS393) from 36 Native
American populations were collected from the literature (Supplementary Table S1).
Individuals belonging to non-Native American haplogroups (Bortolini et al. 2003) were
excluded for all estimations except for the Correspondence Analysis (see below). For
some analyses, population samples were grouped into major subcontinental areas: North
(586 individuals of 23 populations from Alaska to Mexico), Central (79 individuals of
four populations from Guatemala to Panama) and South America (246 individuals of
nine populations from Colombia southwards) (see Table S1).
Population genetic structure was tested in Mexican and Native American
populations through the analysis of molecular variance (AMOVA) (Excoffier et al.
1992) using the Arlequin program v3.11 (Excoffier et al. 2005). Genetic relationships
among Mexican and continental populations were analyzed by two approaches. The first
approach was based on genetic distances (FST and RST) calculated with Arlequin
program v3.11 (Excoffier et al. 2005) and represented in a Multidimensional Scaling
plot (MDS). The second approach was based on haplogroup absolute frequencies in
RESULTS
106
order to construct a Correspondence Analysis (CoA) plot. Both analyses were
performed with STATISTICA 7 package (http://www.statsoft.com).
Median joining networks were constructed using Network 4.5.1.0 package
(Bandelt et al. 1999) for the Native American haplogroup Q (Bortolini et al. 2003). The
time to the most recent common ancestor (TMRCA) has been estimated for the Q
lineage. Y-STRs weights were determined according with Hurles et al. (2002). The
mutation rate considered was one transition per 571 years; these have been calibrated on
the evolutionary rate of each locus reported in Y-chromosome haplotype reference
database (http://www.yhrd.org/).
Results
Paternal lineage composition in Native Mexicans
Few SNPs are needed to define the major haplogroups found in the Americas
since only two major haplogroups are associated with native American populations:
haplogroup Q, and at lower frequency, haplogroup C (Zegura et al. 2004a). After
genotyping four Y-chromosome SNPs (see Table 1), the 197 Native Mexican
individuals were classified into major haplogroups (Table 1), and subsequently
confirmed and refined using the 17-STR profile with the Batch Processing Program
(http://www.hprg.com/hapest5/page5.html). The most frequent haplogroup in Native
Mexican populations was haplogroup Q (80.92%) which agrees with what was
previously reported by Zegura et al (2004a) being the major lineage among Native
Americans. The other native haplogroup C was not found in native Mexicans. Other
haplogroups with European and African origin were found in our sample set, such as R,
which is the most common haplogroup in European populations (Karafet et al. 1998),
and was the second more frequent haplogroup in Mexican samples (12.26%), followed
RESULTS
107
at lower frequencies by haplogroups J, E, I, G, and T (see Table 1). The presence of
these no-native lineages in Native Mexicans might be the result of recent admixture. In
almost all Mexican populations the proportion of the admixture was similar except for
the Nahuas Xochimilco, where significant differences were observed when compared to
Triqui (exact test of differentiation, p=0.003) and Pima (p=0.0007) samples. These two
populations showed a high percentage of Q native haplogroup (100%) and (96.08%).
A total of 106 different haplotypes (Supplementary Table S2) were observed in
165 Native Mexican individuals who belong to Q haplogroup. Table 2 summarizes the
results for the 17 STRs analyzed on native Mexican samples and the eight native
samples from Quechuas used for comparison. Interestingly, Pimas and Tarahumara, the
northernmost samples, exhibit the lowest diversity values (average genetic diversity and
pairwise differences).
An analysis of molecular variance (AMOVA) based on Fst and Rst genetic
distances was performed in order to define the population structure of Mexican
populations according to sample size, geographic and linguistic criteria (Table 3). In
order to avoid biases due to admixture of different non-native haplogroups, AMOVA
estimations were performed only with native haplotypes, i.e. those belonging to
haplogroup Q. To determine whether the four Nahua groups had to be considered as a
single group, an AMOVA was performed among the Nahua samples. Certain
heterogeneity (p<0.05) among Nahuas was found (3.19%, for Fst values; and 10.18%,
for Rst values). To corroborate this result, an exact test of population differentiation was
performed (p<0.05). Since both results showed a clear differentiation within the Nahua
populations, for most of the analyses they were considered as four separated groups,
except for those analyses in which sample size was relevant. Particularly, Xochimilco
and San Pedro Nahuas were treated as a single group, because they share the same
RESULTS
108
linguistic family, are close geographically, and no statistical differences were observed
when an AMOVA was performed between these two populations (4.51%, p=0.1 for Fst
values; and 3.58%, p=0.2 for Rst values).
The AMOVA showed that, when all Mexican populations were considered as a
single group (11 populations), 14.09% (FST values) and 16.30% (RST values) (p<0.05)
of the genetic variance was found between populations, showing a relevant genetic
heterogeneity among native Mexican populations. When two groups (northern samples
versus Mesoamerican samples) were compared, the AMOVA showed significant
differences between the two groups 8.94% (FST values) and 11.03% (RST values)
(p<0.05). Four major linguistic families described in Mexico were represented in our
population samples: Oto-Manguean (Mixtec, Triqui and Otomí), Uto-Aztecan (the four
Nahua populations, Tarahumara and Pima), Tarascan (Purépecha), and Mayan (Maya)
(Mithun 1999). Non-significant proportions of the variance (-3.34% for the FST p=0.9
and -2.17% for the RST p=0.7) were explained by the fact of belonging to these
linguistic groups, which suggest a lack of correlation between Y-chromosome STR
haplotype diversity and linguistic classification. When only populations with at least 10
individuals were considered (Mixtecs, Purépechas and Otomíes were discarded due to
their low sample size, and Nahuas from Xochimilco and San Pedro Nahuas were
consider together as a single group), 12.86% (FST) and 16.80% (RST) (p<0.05) of the
genetic variance was found between all populations, showing again relevant genetic
heterogeneity among native Mexican populations. When cultural groups (northern
versus Mesoamericans) were considered, significant values were found (7.11%, p<0.05
and 11.38%, p<0.05 for FST and RST, respectively). When the linguistic classification
(three families represented) was considered, again non-significant values were found (-
3.63%, p=0.7 and -3.09%, p=0.8 for FST and RST, respectively).
RESULTS
109
For the Correspondence Analysis (CoA) performed with Mexican populations,
only samples with more than ten individuals were considered (Mixtecs, Otomíes and
Purépechas were excluded). The CoA plot accounts for 74.82% of the total variation,
where 48.47% is explained by the first dimension. Santo Domingo Nahuas, Zitlala
Nahuas, Pimas and Triquis were grouped together, although no particular clustering of
populations can be clearly detected (Supplementary Figure S1). In the MDS calculated
with Mexican populations based on FST and RST genetic distances, Tarahumara and
Pima are located apart from the rest in the first or second dimensions, whereas the rest
of the populations do not show a clear clustering (Figure S2).
Mexican populations within the American genetic landscape
To compare the genetic diversity found in Mexico with the rest of Native
American populations at a continental scale, a Correspondence Analysis (CoA) based
on absolute frequencies of 12 haplogroups predicted by Y-chromosome 7 STRs was
performed with all samples in the American dataset (see Table S1). No particular
clustering of Mexican samples is shown in the two-dimension plot (Figure S3A), which
accounts for 43.76% of the total variation (23.59% is explained by the first dimension
and 20.17% by the second dimension). It is noteworthy that the four Central American
samples were grouped together. When the CoA was performed only with the two Native
American haplogroups (Q and C) (74.42% of the total variation: 44.14% and 30.28% in
the first and second dimensions, respectively), the same pattern was observed: no
clustering of Mexican samples and clustering of the four Central American samples
(Figure S3B).
A different pattern is exhibited when a MDS analyses are performed at a
continental scale including the genetic distances based on 7 STRs from the 36
RESULTS
110
populations. In the MDS based on FST (stress value = 0.194) and RST (stress value =
0.112) no clear clusters are observed, with the exception of the two Yanomami groups,
and some northern populations: Dogrib and Tanana, both belonging to same linguistic
family (Na-Dene-Atapaskan), Aleuts (Alaska Peninsula), Minnesota Chippewa
(Northeast USA), and Sisseton Wahpeton-Sioux (Northeast USA).
In order to formally test if there is a clustering among Native American samples,
an AMOVA considering the American database was performed (Table 3). When
samples were considered as a single group, a high degree of genetic heterogeneity
between populations 16.96% (FST) and 20.50% (RST) was found (p<0.05). In order to
ascertain whether this heterogeneity was caused by geographical factors, three
continental groups (North, Central and South) were considered. The AMOVA showed
that a non-significant 1.15% (FST, p>0.05) and 1.51% (RST, p>0.1) of the genetic
variance was due to differences between these three sub-continental groups, whereas the
genetic variance within the three groups remained highly significant (16.26% for FST,
and 19.55% for RST; p<0.05), suggesting an important genetic heterogeneity within the
sub-continental areas and a lack of continental structure. When Mexican samples were
considered as a separate category from North, Central and South groups, a non-
significant 0.67% (FST, p>0.01) of the genetic variance was attributed to differences
among groups, similar non-significant results were obtained when the RST values were
considered (0.88 %, p>0.02), whereas the genetic heterogeneity within groups remained
highly significant (16.69% (FST) and 20.11%, (RST); p<0.05). These results suggest that
Mexican populations do not constitute a separate category with respect to the North,
Central and South American populations and emphasize the lack of continental
structure.
RESULTS
111
In order to test the correlation between paternal lineages and linguistic groups,
an additional AMOVA was performed classifying the 36 Native American populations
into 19 different linguistic families (see Table S1). It is noteworthy that significant
differences between linguistic groups were found: 6.83% (FST) and 11.60 % (RST)
(p<0.05), suggesting a genetic differentiation of linguistic groups in the Americas.
Analysis of the haplogroup Q
In order to establish the genetic relationships between the Y-STRs haplotypes observed
in our sample set, a median joining network was constructed for haplogroup Q, in which
only native Mexican haplotypes with 17 STRs were included. A star-like pattern
without population clustering is observed, with the exception of one cluster mainly
formed by Pima individuals (Figure 2). This cluster comprises 10 different haplotypes,
from which nine are found in Pimas (29 individuals) and one in Tarahumaras (4
individuals). It is noteworthy that these two populations are the northernmost samples in
the analysis and they do not belong to what is strictly defined as Mesoamerica. This
cluster is characterized by one haplotype shared between 12 Pimas (13, 13, 17, 12, 16,
28, 23, 10, 14, 13, 14, 11, 12, 19, 17, 15, 22, 11, same STR order as the one described in
Y chromosome genotyping section). The estimated age for the haplogroup Q in native
Mexicans is 6,436 (+913) ybp.
Discussion
Due to the presence of a substantial proportion of non-native American male
lineages in our samples, the Y-chromosome haplogroup composition of native Mexican
populations shows a remarkable contrast with previous results from the mtDNA
counterpart for the same populations, in which almost only native female lineages
RESULTS
112
(haplogroups A2, B2, C1, D1, and D4h3) were found (Sandoval et al. 2009). We have
found a remarkable frequency of European (and to a lesser extent African, represented
by haplogroups E1b1b and E1a1b) Y-chromosome lineages in native Mexicans (almost
20%), whereas the non-native mtDNA lineages in native Mexicans is negligible (less
than 0.5%, Sandoval et al. 2009), suggesting a sexual bias in the introgression of non-
native American lineages in native populations, fact consistent with previous studies
performed in different Amerindian populations (Carvajal-Carmona et al. 2003; Dipierri
et al. 1998; Gonzalez-Andrade et al. 2007; Mendizabal et al. 2008; Sans et al. 2002).
Although the general observation is consistent with a model of sex-biased
admixture characterized by a predominance of European males and Native American
females in the ancestral genetic pool of native Mexicans, it is noteworthy the variation
in the Y-chromosome admixture proportions among native Mexican populations. This
can be observed in the significant differences in haplogroup composition between
Xochimilco Nahuas and Triqui or Pima. While the former showed the highest
proportion of European haplotypes (32%), the other two populations exhibit the highest
proportion of native American haplotypes (100% and 96%, respectively), explaining the
resulting significant values of the exact test of differentiation. This is consistent with the
demographic history of these populations since Xochimilco Nahuas represent an urban
sample within Mexico City, which have been largely exposed to possible admixture
events, whereas Triqui and Pima are two indigenous groups well known to be
characterized by their geographic and cultural isolation. In addition, the finding of
African Y-chromosome haplotypes in our samples (haplogroups E1b1b and E1a1b),
although not as frequent as haplotypes of European origin, is not negligible, and
indicates that the involuntary migration of Africans through slave trade appears to have
left a trace in Native Mexican populations proximal to coastal routes (e.g. Purépecha).
RESULTS
113
Interestingly, Pimas and Tarahumara, the northernmost samples, exhibit the
lowest diversity values (average genetic diversity and pairwise differences), which is in
total agreement with our previous observations based on mtDNA diversity of the same
set of samples, where we found a clear differentiation of these two populations from the
rest of Native Mexicans (Sandoval et al. 2009). In addition, they present significant
differences in Y-chromosome lineages to the Mesoamerican samples as shown in the
AMOVAs, and some of their lineages cluster differentially in the network of the
haplogroup Q. Pima and Tarahumara are the only sampled populations outside the
cultural geographic region of Mesoamerica, whose differentiation could be indicative of
a remarkable transition of genetic patterns between North America and Mesoamerica,
where probably due to geographic and weather conditions a major part of the
continental diversity is likely to have accumulated over millennia.
We found extensive heterogeneity among Native Mexican populations but a lack
of genetic structure at the continental scale, which may be the result of extensive genetic
drift occurring in most Native American populations. Likewise, we did not find a
correlation between linguistic classification and Y-chromosome diversity, which is also
consistent with previous observations of mtDNA diversity in Native Mexicans
(Sandoval et al. 2009). However, certain correlation between linguistic and genetic
diversity is found for the paternal lineages at a continental scale, despite the lack of
correlation with geography. This fact is remarkable since most of the genetic and
linguistic correlations found in human populations have been attributed to their
correlation with geography; i.e. genes and languages are correlated as a result of
geography (Comas et al. 2008). In the analysis of male lineages in Native Americans,
there is no correlation between geography and genetic differentiation, but certain
correlation between male lineages and linguistic families is observed, suggesting a
RESULTS
114
genetic link between linguistically close populations regardless their geographical
location.
Finally, we conducted a phylogenetic analysis on the native haplotypes in order
to perform some historical inferences in Mexican populations. Haplogroup Q (defined
by M242 mutation) is one of the two main branches of the major Y-chromosome
lineage P, which originated approximately 26,600 to 41,400 ybp (Karafet et al. 2008).
The bearers of M242 mutation migrated eastward across Siberia until they reached the
north-eastern point of Asia trough the Bering ice corridor about 15,000 to 20,000 years
ago. Haplogroup Q represents a recent paternal founder for the Native American
populations into the peopling of the Americas (Bortolini et al. 2003; Seielstad et al.
2003). This haplogroup is distributed widely in North Eurasia and found at high
frequencies in some Siberian groups and at low frequencies in Europe, East Asia and
the Middle East (Karafet et al. 2002). The diversity of haplogroup Q in native Mexicans
is around 6,436 (+913) ybp, that is, well within the aforementioned ranges, pointing to a
recent origin of these haplotypes. It is noteworthy the common and recent origin of a
cluster in Pima and Tarahumara, which could be related to a common expansion in the
area located northern of the Mesoamerica border.
Overall, our results offer a detailed picture of the male-specific genetic
composition of a dense panel of Native Mexican populations and show the importance
of complementing different approaches for comprehensively reconstructing the
demographic history of human populations, especially from the Americas where the
genetic make up of native populations can be additionally complex due to recent
admixture. Further studies at larger, genome-wide, scales are necessary in order to
extend such characterization to other regions of the Native Mexican genome.
RESULTS
115
References
Bandelt HJ, Forster P, Rohl A (1999) Median-joining networks for inferring intraspecific phylogenies. 16: 37-48
Barrot C, Sánchez C, Ortega M, Gonzalez-Martin A, Brand-Casadevall C, Gorostiza A, Huguet E, Corbella J, Gene M (2005) Characterisation of three Amerindian populations from Hidalgo State (Mexico) by 15 STR-PCR polymorphisms. Int J Legal Med 119: 111-5
Bergen AW, Wang CY, Tsai J, Jefferson K, Dey C, Smith KD, Park SC, Tsai SJ, Goldman D (1999) An Asian-Native American paternal lineage identified by RPS4Y resequencing and by microsatellite haplotyping. Ann Hum Genet 63: 63-80
Bortolini MC, Salzano FM, Bau CH, Layrisse Z, Petzl-Erler ML, Tsuneto LT, Hill K, Hurtado AM, Castro-De-Guerra D, Bedoya G, Ruiz-Linares A (2002) Y-chromosome biallelic polymorphisms and Native American population structure. Ann Hum Genet 66: 255-9
Bortolini MC, Salzano FM, Thomas MG, Stuart S, Nasanen SP, Bau CH, Hutz MH, Layrisse Z, Petzl-Erler ML, Tsuneto LT, Hill K, Hurtado AM, Castro-de-Guerra D, Torres MM, Groot H, Michalski R, Nymadawa P, Bedoya G, Bradman N, Labuda D, Ruiz-Linares A (2003) Y-chromosome evidence for differing ancient demographic histories in the Americas. Am J Hum Genet 73: 524-39
Carvajal-Carmona LG, Ophoff R, Service S, Hartiala J, Molina J, Leon P, Ospina J, Bedoya G, Freimer N, Ruiz-Linares A (2003) Genetic demography of Antioquia (Colombia) and the Central Valley of Costa Rica. Hum Genet 112: 534-41
Cerda-Flores RM, Budowle B, Jin L, Barton SA, Deka R, Chakraborty R (2002a) Maximum likelihood estimates of admixture in Northeastern Mexico using 13 short tandem repeat loci. Am J Hum Biol 14: 429-39
Cerda-Flores RM, Garza-Chapa R (1989) Variation in the gene frequencies of three generations of humans from Monterrey, Nuevo Leon, Mexico. Hum Biol 61: 249-61
Cerda-Flores RM, Ramirez-Fernandez E, Garza-Chapa R (1987) Genetic admixture and distances between populations from Monterrey, Nuevo Leon, Mexico, and their putative ancestral populations. Hum Biol 59: 31-49
Cerda-Flores RM, Villalobos-Torres MC, Barrera-Saldana HA, Cortes-Prieto LM, Barajas LO, Rivas F, Carracedo Á, Zhong Y, Barton SA, Chakraborty R (2002b) Genetic admixture in three Mexican Mestizo populations based on D1S80 and HLA-DQA1 loci. Am J Hum Biol 14: 257-63
Comas D, Bosch E, Calafell F (2008) Human Genetics and Languages. ENCYCLOPEDIA OF LIFE SCIENCES. John Wiley & Sons, Ltd: Chichester http://www.els.net/ [DOI: 10.1002/9780470015902.a0020810]
Dipierri JE, Alfaro E, Martinez-Marignac VL, Bailliet G, Bravi CM, Cejas S, Bianchi NO (1998) Paternal directional mating in two Amerindian subpopulations located at different altitudes in northwestern Argentina. Hum Biol 70: 1001-10
Excoffier L, Laval G, Schneider S (2005) Arlequin (version 3.0): An integrated software package for population genetics data analysis. Evol Bioinform Online 1: 47-50
RESULTS
116
Excoffier L, Smouse PE, Quattro JM (1992) Analysis of molecular variance inferred from metric distances among DNA haplotypes: application to human mitochondrial DNA restriction data. Genetics 131: 479-91
Felix-Lopez XA, Arguello-Garcia R, Cerda-Flores RM, Penaloza-Espinoza RI, Buentello-Malo L, Estrada-Mena FJ, Ramos-Kuri M, Gomez FS, Arenas-Aranda DJ (2006) FMR1 CGG repeat distribution and linked microsatellite-SNP haplotypes in normal Mexican Mestizo and indigenous populations. Hum Biol 78: 579-98
Gonzalez-Andrade F, Sanchez D, Gonzalez-Solorzano J, Gascon S, Martinez-Jarreta B (2007) Sex-specific genetic admixture of Mestizos, Amerindian Kichwas, and Afro-Ecuadorans from Ecuador. Hum Biol 79: 51-77
González-Oliver A, Márquez-Morfin L, Jimenez JC, Torre-Blanco A (2001) Founding Amerindian mitochondrial DNA lineages in ancient Maya from Xcaret, Quintana Roo. Am J Phys Anthropol 116: 230-5
Gorostiza A, Gonzalez-Martin A, Ramirez CL, Sanchez C, Barrot C, Ortega M, Huguet E, Corbella J, Gene M (2007) Allele frequencies of the 15 AmpF/Str Identifiler loci in the population of Metztitlan (Estado de Hidalgo), Mexico. Forensic Sci Int 166: 230-2
Green LD, Derr JN, Knight A (2000) mtDNA affinities of the peoples of North-Central Mexico. Am J Hum Genet 66: 989-98
Gutierrez-Alarcon AB, Moguel-Torres M, Leon-Jimenez AK, Cuellar-Nevarez GE, Rangel-Villalobos H (2007) Allele and haplotype distribution for 16 Y-STRs (AmpFlSTR Y-filer kit) in the state of Chihuahua at North Center of Mexico. Leg Med (Tokyo) 9: 154-7
Hammer MF, Zegura SL (2002) THE HUMAN Y CHROMOSOME HAPLOGROUP TREE: Nomenclature and Phylogeography of Its Major Divisions. Annual Review of Anthropology 31: 303-321
Hernandez-Gutierrez S, Hernandez-Franco P, Martinez-Tripp S, Ramos-Kuri M, Rangel-Villalobos H (2005) STR data for 15 loci in a population sample from the central region of Mexico. Forensic Sci Int 151: 97-100
Hurles ME, Nicholson J, Bosch E, Renfrew C, Sykes BC, Jobling MA (2002) Y chromosomal evidence for the origins of oceanic-speaking peoples. Genetics 160: 289-303
Karafet T, de Knijff P, Wood E, Ragland J, Clark A, Hammer MF (1998) Different patterns of variation at the X- and Y-chromosome-linked microsatellite loci DXYS156X and DXYS156Y in human populations. Hum Biol 70: 979-92
Karafet TM, Mendez FL, Meilerman MB, Underhill PA, Zegura SL, Hammer MF (2008) New binary polymorphisms reshape and increase resolution of the human Y chromosomal haplogroup tree. Genome Res 18: 830-8
Karafet TM, Osipova LP, Gubina MA, Posukh OL, Zegura SL, Hammer MF (2002) High levels of Y-chromosome differentiation among native Siberian populations and the genetic signature of a boreal hunter-gatherer way of life. Hum Biol 74: 761-89
Karafet TM, Zegura SL, Posukh O, Osipova L, Bergen A, Long J, Goldman D, Klitz W, Harihara S, de Knijff P, Wiebe V, Griffiths RC, Templeton AR, Hammer MF (1999) Ancestral Asian source(s) of new world Y-chromosome founder haplotypes. Am J Hum Genet 64: 817-31
Kitchen A, Miyamoto MM, Mulligan CJ (2008) A three-stage colonization model for the peopling of the Americas. PLoS One 3: e1596
RESULTS
117
Lell JT, Sukernik RI, Starikovskaya YB, Su B, Jin L, Schurr TG, Underhill PA, Wallace DC (2002) The dual origin and Siberian affinities of Native American Y chromosomes. Am J Hum Genet 70: 192-206
Licea-Cadena RA, Rizzo-Juarez RA, Muniz-Lozano E, Paez-Riberos LA, Rangel-Villalobos H (2006) Population data of nine STRs of Mexican-mestizos from Veracruz (Central South-Eastern, Mexico). Leg Med (Tokyo) 8: 251-2
Luna-Vazquez A, Vilchis-Dorantes G, Aguilar-Ruiz MO, Bautista-Rivas A, Perez-Garcia A, Orea-Ochoa R, Villanueva-Hernandez D, Munoz-Valle JF, Rangel-Villalobos H (2008) Haplotype frequencies of the PowerPlex Y system in a Mexican-Mestizo population sample from Mexico City. Forensic Sci Int Genet 2: e11-3
Luna-Vazquez A, Vilchis-Dorantes G, Aguilar-Ruiz MO, Bautista-Rivas A, Rojo-Nava AL, Rios-Barrios E, Rangel-Villalobos H (2005) Population data for 15 loci (Identifiler Kit) in a sample from the Valley of Mexico. Leg Med (Tokyo) 7: 331-3
Luna-Vazquez A, Vilchis-Dorantes G, Paez-Riberos LA, Munoz-Valle F, Gonzalez-Martin A, Rangel-Villalobos H (2003) Population data of nine STRs of Mexican-Mestizos from Mexico City. Forensic Sci Int 136: 96-8
Mendizabal I, Sandoval K, Berniell-Lee G, Calafell F, Salas A, Martinez-Fuentes A, Comas D (2008) Genetic origin, admixture, and asymmetry in maternal and paternal human lineages in Cuba. BMC Evol Biol 8: 213
Mithun M (1999) The Languages of Native North America. Cambridge University Press, Cambridge, UK.
Mulligan CJ, Hunley K, Cole S, Long JC (2004) Population genetics, history, and health patterns in native americans. Annu Rev Genomics Hum Genet 5: 295-315
Paez-Riberos LA, Munoz-Valle JF, Figuera LE, Nuno-Arana I, Sandoval-Ramirez L, Gonzalez-Martin A, Ibarra B, Rangel-Villalobos H (2006) Y-linked haplotypes in Amerindian chromosomes from Mexican populations: genetic evidence to the dual origin of the Huichol tribe. Leg Med (Tokyo) 8: 220-5
Peñaloza-Espinosa RI, Arenas-Aranda D, Cerda-Flores RM, Buentello-Malo L, Gonzalez-Valencia G, Torres J, Alvarez B, Mendoza I, Flores M, Sandoval L, Loeza F, Ramos I, Munoz L, Salamanca F (2007) Characterization of mtDNA haplogroups in 14 Mexican indigenous populations. Hum Biol 79: 313-20
Rangel-Villalobos H, Jaloma-Cruz AR, Cerda-Aguilar L, Rios-Angulo CD, Mendoza-Carrera F, Patino-Garcia B, Sandoval-Ramirez L, Figuera-Villanueva LE (2001a) [The genetic DNA trace in men: chromosome Y haplotypes in a Mexican population, analyzing 5 STRs]. Rev Invest Clin 53: 401-6
Rangel-Villalobos H, Jaloma-Cruz AR, Sandoval-Ramírez L, Velarde-Felix JS, Gallegos-Arreola MP, Figuera LE (2001b) Y-chromosome haplotypes for six short tandem repeats (STRs) in a Mexican population. Arch Med Res 32: 232-7
Rangel-Villalobos H, Munoz-Valle JF, Gonzalez-Martin A, Gorostiza A, Magana MT, Paez-Riberos LA (2008) Genetic admixture, relatedness, and structure patterns among Mexican populations revealed by the Y-chromosome. Am J Phys Anthropol 135: 448-61
Rangel-Villalobos H, Rivas F, Sandoval L, Ibarra B, Garcia-Carvajal ZY, Cantu JM, Figuera LE (2000) Genetic variation among four Mexican populations (Huichol, Purepecha, Tarahumara, and Mestizo) revealed by two VNTRs and four STRs. Hum Biol 72: 983-95
Rangel-Villalobos H, Rivas F, Torres-Rodriguez M, Jaloma-Cruz AR, Gallegos-Arreola MP, López-Satow J, Cantu JM, Figuera LE (1999) Allele frequency
RESULTS
118
distributions of six Amp-FLPS (D1S80, APO-B, VWA, TH01, CSF1PO and HPRTB) in a Mexican population. Forensic Sci Int 105: 125-9
Rubi-Castellanos R, Anaya-Palafox M, Mena-Rojas E, Bautista-Espana D, Munoz-Valle JF, Rangel-Villalobos H (2009a) Genetic data of 15 autosomal STRs (Identifiler kit) of three Mexican Mestizo population samples from the States of Jalisco (West), Puebla (Center), and Yucatan (Southeast). Forensic Sci Int Genet 3: e71-6
Rubi-Castellanos R, Martinez-Cortes G, Munoz-Valle JF, Gonzalez-Martin A, Cerda-Flores RM, Anaya-Palafox M, Rangel-Villalobos H (2009b) Pre-Hispanic Mesoamerican demography approximates the present-day ancestry of Mestizos throughout the territory of Mexico. Am J Phys Anthropol 139: 284-94
Ruiz-Linares A, Ortiz-Barrientos D, Figueroa M, Mesa N, Munera JG, Bedoya G, Velez ID, Garcia LF, Perez-Lezaun A, Bertranpetit J, Feldman MW, Goldstein DB (1999) Microsatellites provide evidence for Y chromosome diversity among the founders of the New World. Proc Natl Acad Sci U S A 96: 6312-7
Salazar-Flores J, Dondiego-Aldape R, Rubi-Castellanos R, Anaya-Palafox M, Nuno-Arana I, Canseco-Avila LM, Flores-Flores G, Morales-Vallejo ME, Barojas-Perez N, Munoz-Valle JF, Campos-Gutierrez R, Rangel-Villalobos H (2009) Population structure and paternal admixture landscape on present-day Mexican-Mestizos revealed by Y-STR haplotypes. Am J Hum Biol
Salzano FM (2002) Molecular variability in Amerindians: widespread but uneven information. An Acad Bras Cienc 74: 223-63
Sandoval K, Buentello-Malo L, Penaloza-Espinosa R, Avelino H, Salas A, Calafell F, Comas D (2009) Linguistic and maternal genetic diversity are not correlated in Native Mexicans. Hum Genet
Sans M, Weimer TA, Franco MH, Salzano FM, Bentancor N, Alvarez I, Bianchi NO, Chakraborty R (2002) Unequal contributions of male and female gene pools from parental populations in the African descendants of the city of Melo, Uruguay. Am J Phys Anthropol 118: 33-44
Schneider S, Excoffier L, Laval G (2005) Arlequin ver. 3.0: An integrated software package for population genetics data analysis. Evolutionary Bioinformatics Online 1:47-50.
Seielstad M, Bekele E, Ibrahim M, Toure A, Traore M (1999) A view of modern human origins from Y chromosome microsatellite variation. Genome Res 9: 558-67
Seielstad M, Yuldasheva N, Singh N, Underhill P, Oefner P, Shen P, Wells RS (2003) A novel Y-chromosome variant puts an upper limit on the timing of first entry into the Americas. Am J Hum Genet 73: 700-5
Torres-Rodriguez M, Martinez-Cortes G, Paez-Riberos LA, Sandoval L, Munoz-Valle JF, Ceballos-Quintal JM, Pinto-Escalante D, Rangel-Villalobos H (2006) Forensic potential of the STR DXYS156 in Mexican populations: inference of X-linked allele null. Leg Med (Tokyo) 8: 52-4
Torroni A, Chen YS, Semino O, Santachiara-Beneceretti AS, Scott CR, Lott MT, Winter M, Wallace DC (1994) mtDNA and Y-chromosome polymorphisms in four Native American populations from southern Mexico. Am J Hum Genet 54: 303-18
Underhill PA, Shen P, Lin AA, Jin L, Passarino G, Yang WH, Kauffman E, Bonne-Tamir B, Bertranpetit J, Francalacci P, Ibrahim M, Jenkins T, Kidd JR, Mehdi SQ, Seielstad MT, Wells RS, Piazza A, Davis RW, Feldman MW, Cavalli-Sforza LL, Oefner PJ (2000) Y chromosome sequence variation and the history of human populations. Nat Genet 26: 358-61
RESULTS
119
Zegura SL, Karafet TM, Zhivotovsky LA, Hammer MF (2004a) High-resolution SNPs and microsatellite haplotypes point to a single, recent entry of Native American Y chromosomes into the Americas. Mol Biol Evol, vol 21, pp 164-75
Zegura SL, Karafet TM, Zhivotovsky LA, Hammer MF (2004b) High-resolution SNPs and microsatellite haplotypes point to a single, recent entry of Native American Y chromosomes into the Americas. Mol Biol Evol 21: 164-75
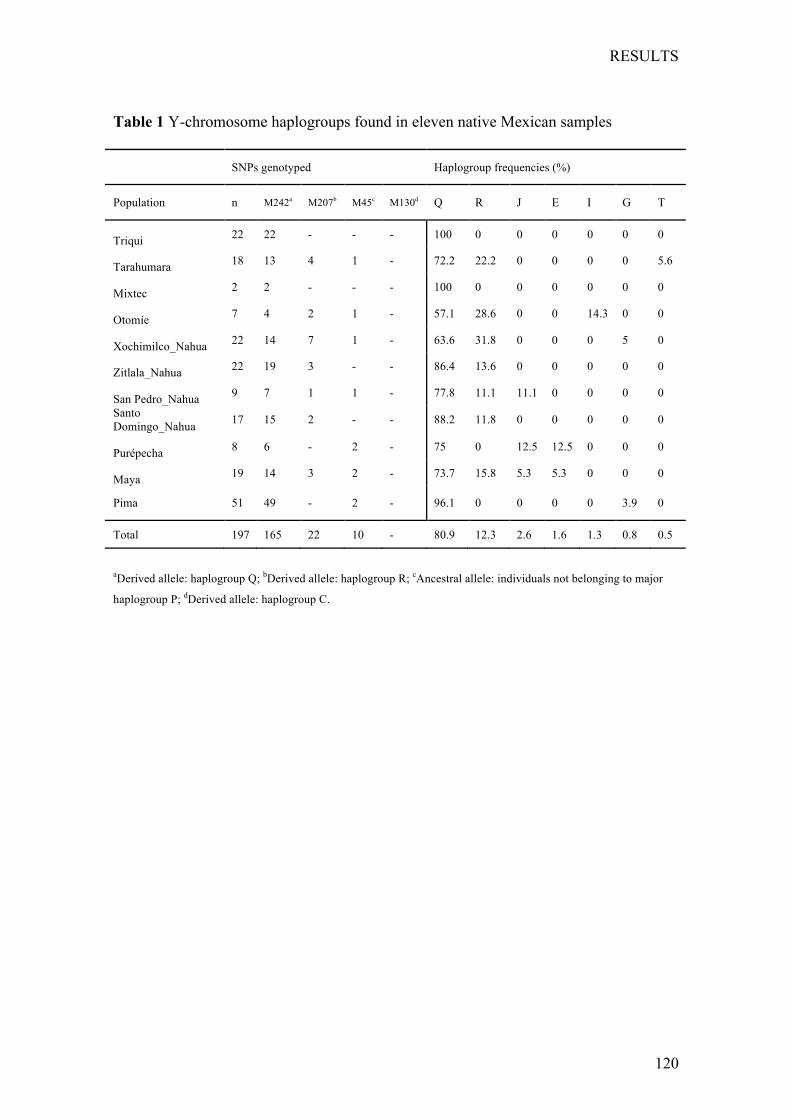
RESULTS
120
Table 1 Y-chromosome haplogroups found in eleven native Mexican samples SNPs genotyped Haplogroup frequencies (%)
Population n M242a M207b M45c M130d Q R J E I G T
Triqui 22 22 - - - 100 0 0 0 0 0 0
Tarahumara 18 13 4 1 - 72.2 22.2 0 0 0 0 5.6
Mixtec 2 2 - - - 100 0 0 0 0 0 0
Otomíe 7 4 2 1 - 57.1 28.6 0 0 14.3 0 0
Xochimilco_Nahua 22 14 7 1 - 63.6 31.8 0 0 0 5 0
Zitlala_Nahua 22 19 3 - - 86.4 13.6 0 0 0 0 0
San Pedro_Nahua 9 7 1 1 - 77.8 11.1 11.1 0 0 0 0
Santo Domingo_Nahua 17 15 2 - - 88.2 11.8 0 0 0 0 0
Purépecha 8 6 - 2 - 75 0 12.5 12.5 0 0 0
Maya 19 14 3 2 - 73.7 15.8 5.3 5.3 0 0 0
Pima 51 49 - 2 - 96.1 0 0 0 0 3.9 0
Total 197 165 22 10 - 80.9 12.3 2.6 1.6 1.3 0.8 0.5
aDerived allele: haplogroup Q; bDerived allele: haplogroup R; cAncestral allele: individuals not belonging to major
haplogroup P; dDerived allele: haplogroup C.
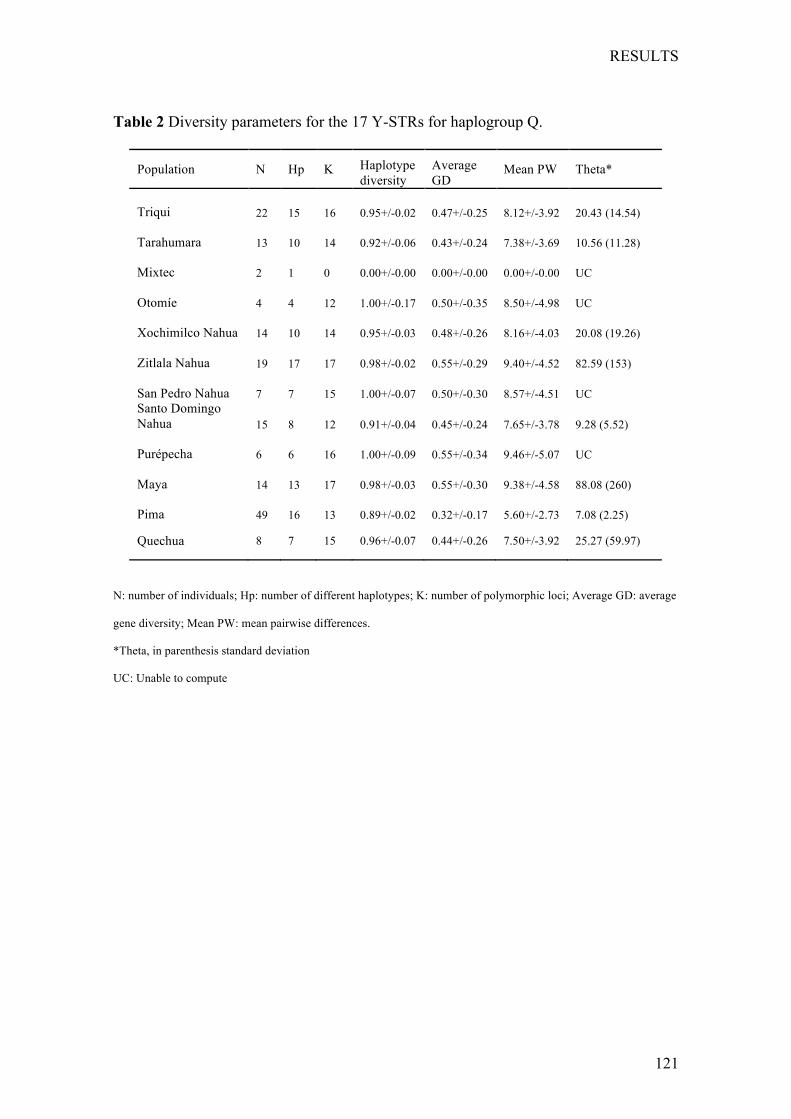
RESULTS
121
Table 2 Diversity parameters for the 17 Y-STRs for haplogroup Q.
Population N Hp K Haplotype diversity
Average GD
Mean PW Theta*
Triqui 22 15 16 0.95+/-0.02 0.47+/-0.25 8.12+/-3.92 20.43 (14.54)
Tarahumara 13 10 14 0.92+/-0.06 0.43+/-0.24 7.38+/-3.69 10.56 (11.28)
Mixtec 2 1 0 0.00+/-0.00 0.00+/-0.00 0.00+/-0.00 UC
Otomíe 4 4 12 1.00+/-0.17 0.50+/-0.35 8.50+/-4.98 UC
Xochimilco Nahua 14 10 14 0.95+/-0.03 0.48+/-0.26 8.16+/-4.03 20.08 (19.26)
Zitlala Nahua 19 17 17 0.98+/-0.02 0.55+/-0.29 9.40+/-4.52 82.59 (153)
San Pedro Nahua 7 7 15 1.00+/-0.07 0.50+/-0.30 8.57+/-4.51 UC Santo Domingo Nahua 15 8 12 0.91+/-0.04 0.45+/-0.24 7.65+/-3.78 9.28 (5.52)
Purépecha 6 6 16 1.00+/-0.09 0.55+/-0.34 9.46+/-5.07 UC
Maya 14 13 17 0.98+/-0.03 0.55+/-0.30 9.38+/-4.58 88.08 (260)
Pima 49 16 13 0.89+/-0.02 0.32+/-0.17 5.60+/-2.73 7.08 (2.25)
Quechua 8 7 15 0.96+/-0.07 0.44+/-0.26 7.50+/-3.92 25.27 (59.97)
N: number of individuals; Hp: number of different haplotypes; K: number of polymorphic loci; Average GD: average
gene diversity; Mean PW: mean pairwise differences.
*Theta, in parenthesis standard deviation
UC: Unable to compute
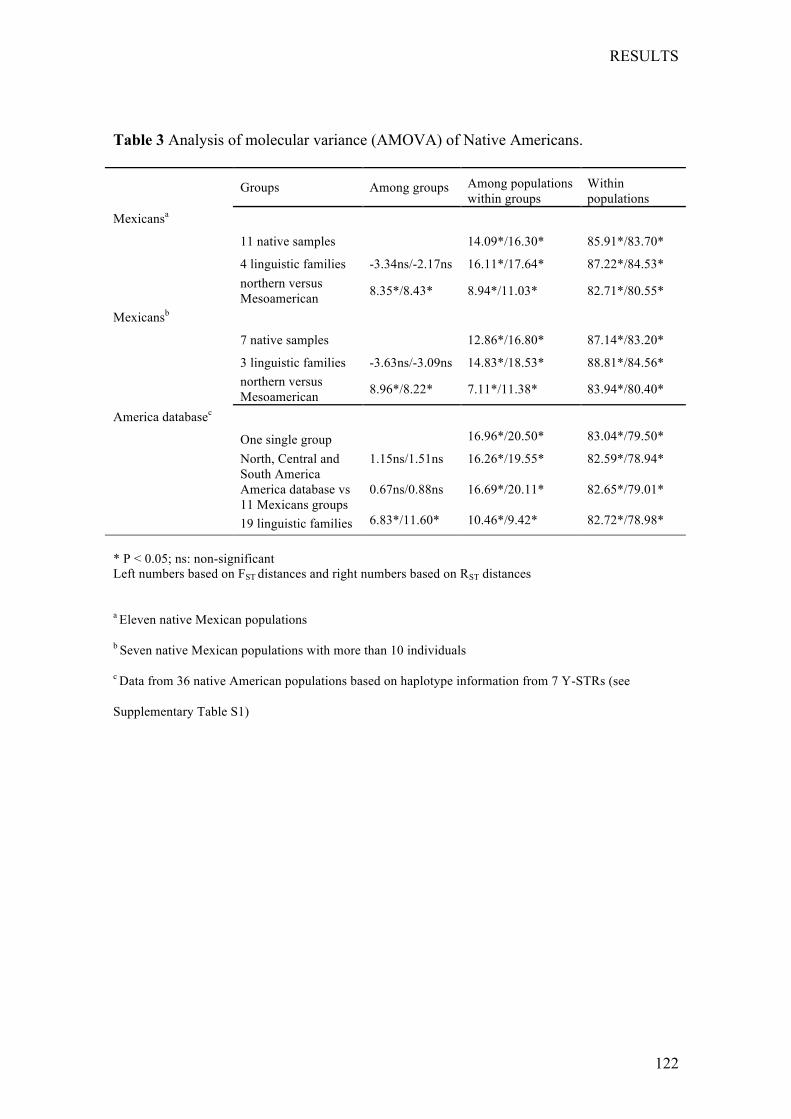
RESULTS
122
Table 3 Analysis of molecular variance (AMOVA) of Native Americans.
Groups Among groups Among populations within groups
Within populations
Mexicansa
11 native samples 14.09*/16.30* 85.91*/83.70*
4 linguistic families -3.34ns/-2.17ns 16.11*/17.64* 87.22*/84.53*
northern versus Mesoamerican 8.35*/8.43* 8.94*/11.03* 82.71*/80.55*
Mexicansb
7 native samples 12.86*/16.80* 87.14*/83.20*
3 linguistic families -3.63ns/-3.09ns 14.83*/18.53* 88.81*/84.56*
northern versus Mesoamerican 8.96*/8.22* 7.11*/11.38* 83.94*/80.40*
America databasec
One single group 16.96*/20.50* 83.04*/79.50*
North, Central and South America
1.15ns/1.51ns 16.26*/19.55* 82.59*/78.94*
America database vs 11 Mexicans groups
0.67ns/0.88ns 16.69*/20.11* 82.65*/79.01*
19 linguistic families 6.83*/11.60* 10.46*/9.42* 82.72*/78.98*
* P < 0.05; ns: non-significant Left numbers based on FST distances and right numbers based on RST distances
a Eleven native Mexican populations
b Seven native Mexican populations with more than 10 individuals
c Data from 36 native American populations based on haplotype information from 7 Y-STRs (see
Supplementary Table S1)
RESULTS
123
Figure Legends
Figure 1. Geographical location of native Mexican populations sampled within the
continental framework. Names of the populations as shown in Supplementary Table 1.
Figure 2. Network of haplogroup Q in native Mexican samples for 17 Y-STRs. Color
code: Triquis (in red), Tarahumaras (yellow), Mixtecs (black), Otomíes (aqua), Four
Nahuas (blue), Purépechas (pink), Mayas (orange), and Pimas (in green).
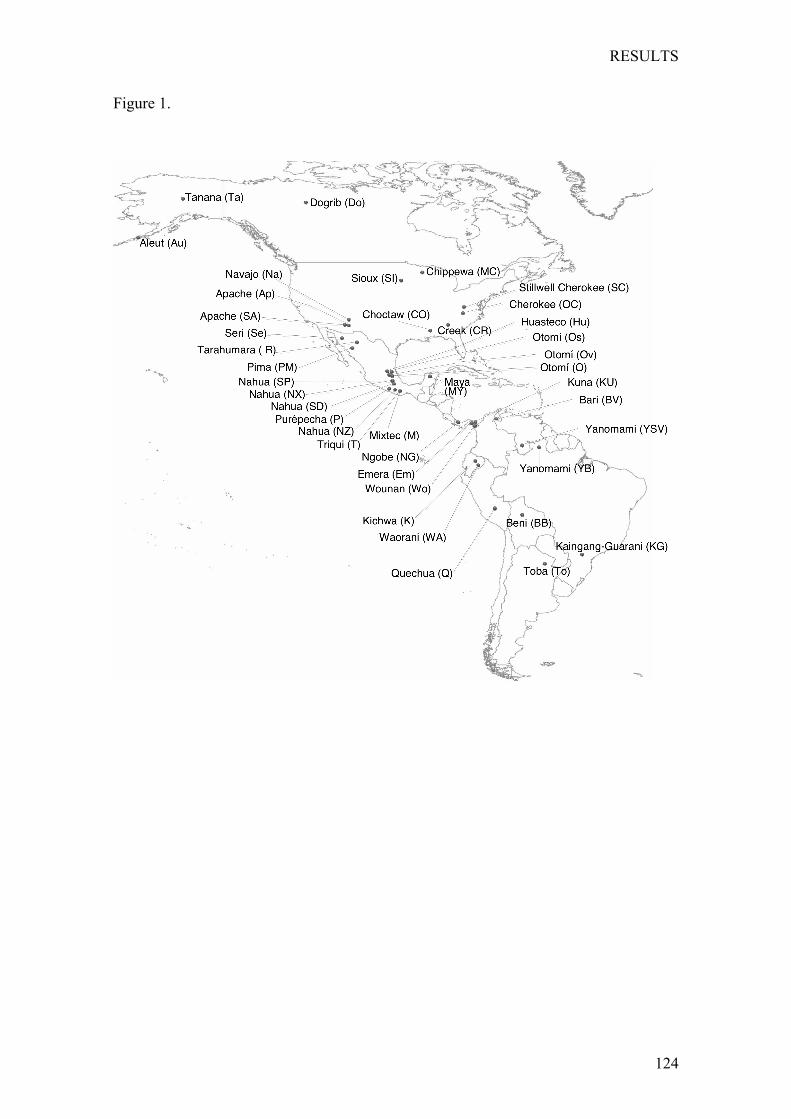
RESULTS
124
Figure 1.
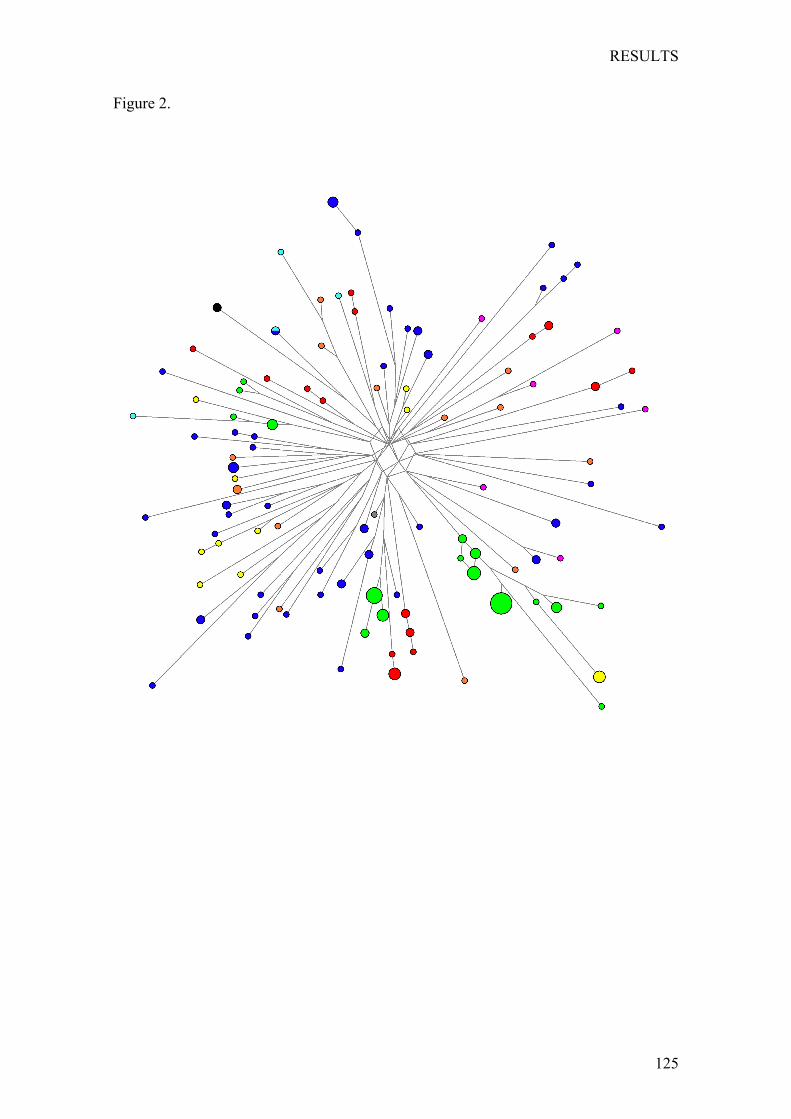
RESULTS
125
Figure 2.
RESULTS
126
Supplementary Material
Supplementary Table S1, References and general information of the 36 Native
American populations conformed the America Data Base used it for comparison to the
Mexican sequences analyzed.
Supplementary Table S2 Haplotypes based on 17 Y-chromosome STRs of the
AmpFlSTR® Yfiler™ kit for Mexican populations reported in this study: Triqui,
Tarahumara, Purépecha, Otomí, Mixtec, Nahua from Xochimilco, Nahua from Zitlala,
Nahua from Ixhuatlancillo, Nahua from Necoxtla, Maya, Pima, and Quechua
populations.
Supplementary Figure S1
Two-dimension Correspondence Analysis (CoA) plot of Native Mexican samples with
more than 10 individuals, based on absolute frequencies of seven haplogroups found. In
blue populations than belong to Uto-Aztecan linguistic family, in red Otomanguean, in
black Mayan, and in grey and underlined the haplogroups.
Supplementary Figure S2
A) Two-dimensional MDS plot of Native Mexicans samples based on FST genetic
distances. Populations in blue Uto-Aztecan, in green Otomanguena, and in black
Mayan linguistic families.
B) Two-dimensional MDS plot of Native Mexican samples based on RST genetic
distances. Populations in blue Uto-Aztecan, in green Otomanguena, and in black
Mayan linguistic families.
RESULTS
127
Supplementary Figure S3
A) Two-dimension Correspondence Analysis (CoA) plot of Native American
populations based on absolute frequencies of twelve haplogroups found.
North populations in blue, Central in green, South in black, Mexicans in red
and haplogroups in grey and underlined.
B) Two-dimension Correspondence Analysis (CoA) plot of Native American
populations based on absolute frequencies of the two (C and Q) native
haplogroups found. North populations in blue, Central in green, South in
black, Mexicans in red and Haplogroups in grey and underlined.
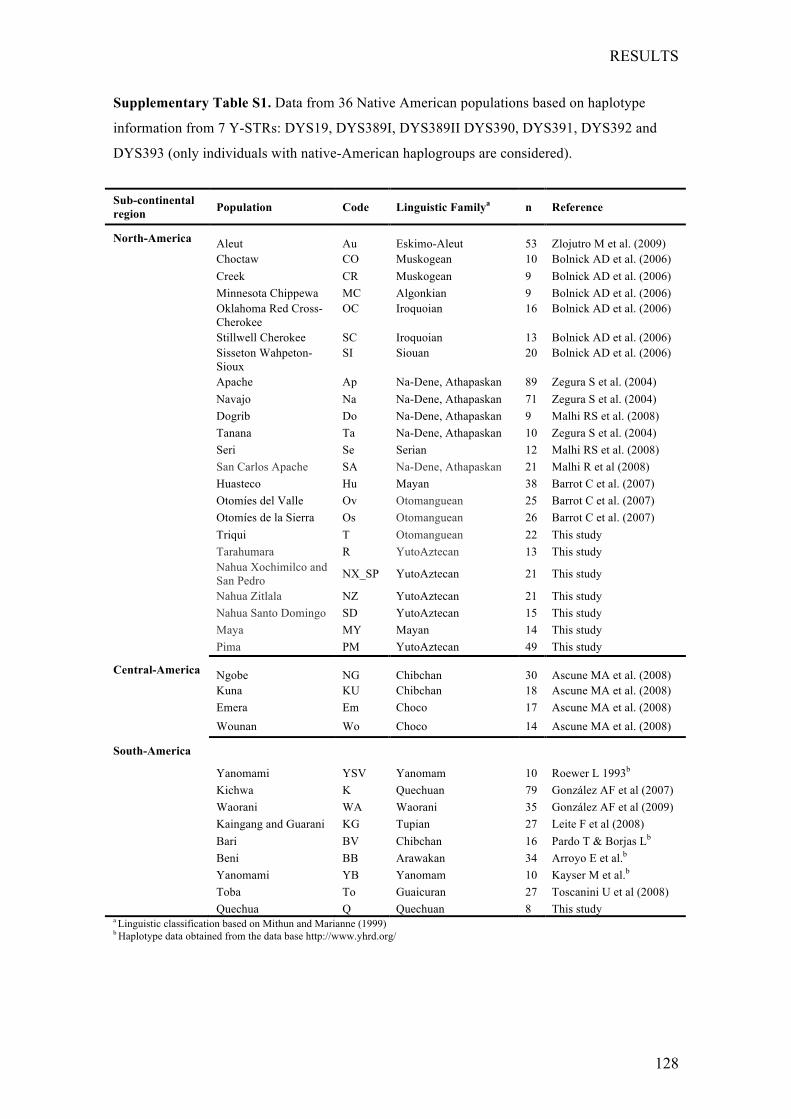
RESULTS
128
Supplementary Table S1. Data from 36 Native American populations based on haplotype
information from 7 Y-STRs: DYS19, DYS389I, DYS389II DYS390, DYS391, DYS392 and
DYS393 (only individuals with native-American haplogroups are considered).
Sub-continental region Population Code Linguistic Familya n Reference
North-America Aleut Au Eskimo-Aleut 53 Zlojutro M et al. (2009) Choctaw CO Muskogean 10 Bolnick AD et al. (2006) Creek CR Muskogean 9 Bolnick AD et al. (2006) Minnesota Chippewa MC Algonkian 9 Bolnick AD et al. (2006)
Oklahoma Red Cross-Cherokee
OC
Iroquoian
16
Bolnick AD et al. (2006)
Stillwell Cherokee SC Iroquoian 13 Bolnick AD et al. (2006)
Sisseton Wahpeton-Sioux
SI
Siouan
20
Bolnick AD et al. (2006)
Apache Ap Na-Dene, Athapaskan 89 Zegura S et al. (2004) Navajo Na Na-Dene, Athapaskan 71 Zegura S et al. (2004) Dogrib Do Na-Dene, Athapaskan 9 Malhi RS et al. (2008) Tanana Ta Na-Dene, Athapaskan 10 Zegura S et al. (2004) Seri Se Serian 12 Malhi RS et al. (2008) San Carlos Apache SA Na-Dene, Athapaskan 21 Malhi R et al (2008) Huasteco Hu Mayan 38 Barrot C et al. (2007) Otomíes del Valle Ov Otomanguean 25 Barrot C et al. (2007) Otomíes de la Sierra Os Otomanguean 26 Barrot C et al. (2007) Triqui T Otomanguean 22 This study Tarahumara R YutoAztecan 13 This study
Nahua Xochimilco and San Pedro NX_SP YutoAztecan 21 This study
Nahua Zitlala NZ YutoAztecan 21 This study Nahua Santo Domingo SD YutoAztecan 15 This study Maya MY Mayan 14 This study Pima PM YutoAztecan 49 This study
Central-America Ngobe NG Chibchan 30 Ascune MA et al. (2008) Kuna KU Chibchan 18 Ascune MA et al. (2008) Emera Em Choco 17 Ascune MA et al. (2008) Wounan Wo Choco 14 Ascune MA et al. (2008)
South-America Yanomami YSV Yanomam 10 Roewer L 1993b
Kichwa K Quechuan 79 González AF et al (2007) Waorani WA Waorani 35 González AF et al (2009) Kaingang and Guarani KG Tupian 27 Leite F et al (2008) Bari BV Chibchan 16 Pardo T & Borjas Lb
Beni BB Arawakan 34 Arroyo E et al.b Yanomami YB Yanomam 10 Kayser M et al.b Toba To Guaicuran 27 Toscanini U et al (2008) Quechua Q Quechuan 8 This study a Linguistic classification based on Mithun and Marianne (1999) b Haplotype data obtained from the data base http://www.yhrd.org/
RESULTS
129
References cited in Table S1. Ascunce MS, Gonzalez-Oliver A, Mulligan CJ (2008) Y-chromosome variability in
four Native American populations from Panama. Hum Biol 80: 287-302 Barrot C, Simili C, Sanchez C, Brandt-Casadevall C, Gonzalez-Martin A, Xifro A,
Ortega M, Huguet E, Corbella J, Gene M (2007) Haplotype frequencies of eight Y-chromosome short tandem repeats loci in four Amerindian populations (state of Hidalgo, Mexico). J Forensic Sci 52: 504-6
Bolnick DA, Bolnick DI, Smith DG (2006) Asymmetric male and female genetic histories among Native Americans from Eastern North America. Mol Biol Evol 23: 2161-74
Gonzalez-Andrade F, Roewer L, Willuweit S, Sanchez D, Martinez-Jarreta B (2009) Y-STR variation among ethnic groups from Ecuador: Mestizos, Kichwas, Afro-Ecuadorians and Waoranis. Forensic Sci Int Genet 3: e83-91
Gonzalez-Andrade F, Sanchez D, Gonzalez-Solorzano J, Gascon S, Martinez-Jarreta B (2007) Sex-specific genetic admixture of Mestizos, Amerindian Kichwas, and Afro-Ecuadorans from Ecuador. Hum Biol 79: 51-77
Leite FP, Callegari-Jacques SM, Carvalho BA, Kommers T, Matte CH, Raimann PE, Schwengber SP, Sortica VA, Tsuneto LT, Petzl-Erler ML, Salzano FM, Hutz MH (2008) Y-STR analysis in Brazilian and South Amerindian populations. Am J Hum Biol 20: 359-63
Malhi RS, Gonzalez-Oliver A, Schroeder KB, Kemp BM, Greenberg JA, Dobrowski SZ, Smith DG, Resendez A, Karafet T, Hammer M, Zegura S, Brovko T (2008) Distribution of Y chromosomes among native North Americans: a study of Athapaskan population history. Am J Phys Anthropol 137: 412-24
Mithun M (1999) The Languages of Native North America. Cambridge University Press, Cambridge, UK.
Toscanini U, Gusmao L, Berardi G, Amorim A, Carracedo A, Salas A, Raimondi E (2008) Y chromosome microsatellite genetic variation in two Native American populations from Argentina: population stratification and mutation data. Forensic Sci Int Genet 2: 274-80
Zegura SL, Karafet TM, Zhivotovsky LA, Hammer MF (2004) High-resolution SNPs and microsatellite haplotypes point to a single, recent entry of Native American Y chromosomes into the Americas. Mol Biol Evol, vol 21, pp 164-75
Zlojutro M, Rubicz R, Crawford MH (2009) Mitochondrial DNA and Y-chromosome variation in five eastern Aleut communities: evidence for genetic substructure in the Aleut population. Ann Hum Biol 36: 511-26
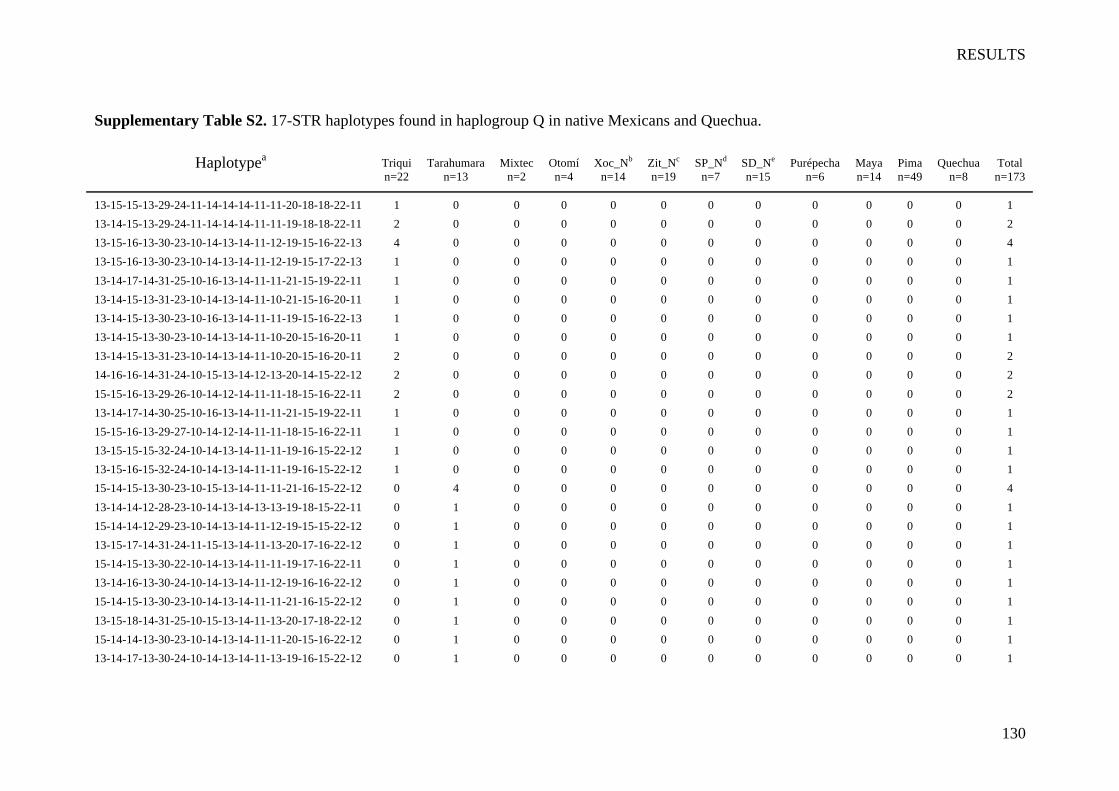
RESULTS
130
Supplementary Table S2. 17-STR haplotypes found in haplogroup Q in native Mexicans and Quechua.
Haplotypea
Triqui
n=22
Tarahumara
n=13
Mixtec
n=2
Otomí
n=4
Xoc_Nb
n=14
Zit_Nc
n=19
SP_Nd
n=7
SD_Ne
n=15
Purépecha
n=6
Maya
n=14
Pima
n=49
Quechua
n=8
Total
n=173
13-15-15-13-29-24-11-14-14-14-11-11-20-18-18-22-11 1 0 0 0 0 0 0 0 0 0 0 0 1
13-14-15-13-29-24-11-14-14-14-11-11-19-18-18-22-11 2 0 0 0 0 0 0 0 0 0 0 0 2
13-15-16-13-30-23-10-14-13-14-11-12-19-15-16-22-13 4 0 0 0 0 0 0 0 0 0 0 0 4
13-15-16-13-30-23-10-14-13-14-11-12-19-15-17-22-13 1 0 0 0 0 0 0 0 0 0 0 0 1
13-14-17-14-31-25-10-16-13-14-11-11-21-15-19-22-11 1 0 0 0 0 0 0 0 0 0 0 0 1
13-14-15-13-31-23-10-14-13-14-11-10-21-15-16-20-11 1 0 0 0 0 0 0 0 0 0 0 0 1
13-14-15-13-30-23-10-16-13-14-11-11-19-15-16-22-13 1 0 0 0 0 0 0 0 0 0 0 0 1
13-14-15-13-30-23-10-14-13-14-11-10-20-15-16-20-11 1 0 0 0 0 0 0 0 0 0 0 0 1
13-14-15-13-31-23-10-14-13-14-11-10-20-15-16-20-11 2 0 0 0 0 0 0 0 0 0 0 0 2
14-16-16-14-31-24-10-15-13-14-12-13-20-14-15-22-12 2 0 0 0 0 0 0 0 0 0 0 0 2
15-15-16-13-29-26-10-14-12-14-11-11-18-15-16-22-11 2 0 0 0 0 0 0 0 0 0 0 0 2
13-14-17-14-30-25-10-16-13-14-11-11-21-15-19-22-11 1 0 0 0 0 0 0 0 0 0 0 0 1
15-15-16-13-29-27-10-14-12-14-11-11-18-15-16-22-11 1 0 0 0 0 0 0 0 0 0 0 0 1
13-15-15-15-32-24-10-14-13-14-11-11-19-16-15-22-12 1 0 0 0 0 0 0 0 0 0 0 0 1
13-15-16-15-32-24-10-14-13-14-11-11-19-16-15-22-12 1 0 0 0 0 0 0 0 0 0 0 0 1
15-14-15-13-30-23-10-15-13-14-11-11-21-16-15-22-12 0 4 0 0 0 0 0 0 0 0 0 0 4
13-14-14-12-28-23-10-14-13-14-13-13-19-18-15-22-11 0 1 0 0 0 0 0 0 0 0 0 0 1
15-14-14-12-29-23-10-14-13-14-11-12-19-15-15-22-12 0 1 0 0 0 0 0 0 0 0 0 0 1
13-15-17-14-31-24-11-15-13-14-11-13-20-17-16-22-12 0 1 0 0 0 0 0 0 0 0 0 0 1
15-14-15-13-30-22-10-14-13-14-11-11-19-17-16-22-11 0 1 0 0 0 0 0 0 0 0 0 0 1
13-14-16-13-30-24-10-14-13-14-11-12-19-16-16-22-12 0 1 0 0 0 0 0 0 0 0 0 0 1
15-14-15-13-30-23-10-14-13-14-11-11-21-16-15-22-12 0 1 0 0 0 0 0 0 0 0 0 0 1
13-15-18-14-31-25-10-15-13-14-11-13-20-17-18-22-12 0 1 0 0 0 0 0 0 0 0 0 0 1
15-14-14-13-30-23-10-14-13-14-11-11-20-15-16-22-12 0 1 0 0 0 0 0 0 0 0 0 0 1
13-14-17-13-30-24-10-14-13-14-11-13-19-16-15-22-12 0 1 0 0 0 0 0 0 0 0 0 0 1
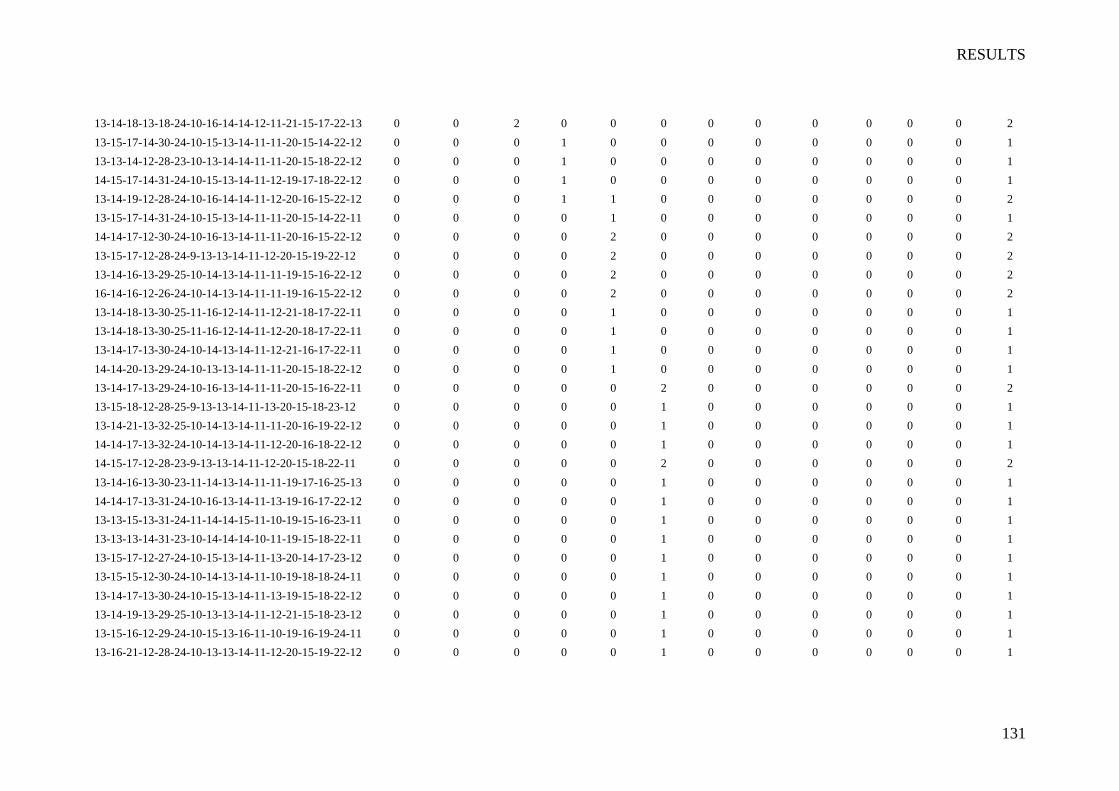
RESULTS
131
13-14-18-13-18-24-10-16-14-14-12-11-21-15-17-22-13 0 0 2 0 0 0 0 0 0 0 0 0 2
13-15-17-14-30-24-10-15-13-14-11-11-20-15-14-22-12 0 0 0 1 0 0 0 0 0 0 0 0 1
13-13-14-12-28-23-10-13-14-14-11-11-20-15-18-22-12 0 0 0 1 0 0 0 0 0 0 0 0 1
14-15-17-14-31-24-10-15-13-14-11-12-19-17-18-22-12 0 0 0 1 0 0 0 0 0 0 0 0 1
13-14-19-12-28-24-10-16-14-14-11-12-20-16-15-22-12 0 0 0 1 1 0 0 0 0 0 0 0 2
13-15-17-14-31-24-10-15-13-14-11-11-20-15-14-22-11 0 0 0 0 1 0 0 0 0 0 0 0 1
14-14-17-12-30-24-10-16-13-14-11-11-20-16-15-22-12 0 0 0 0 2 0 0 0 0 0 0 0 2
13-15-17-12-28-24-9-13-13-14-11-12-20-15-19-22-12 0 0 0 0 2 0 0 0 0 0 0 0 2
13-14-16-13-29-25-10-14-13-14-11-11-19-15-16-22-12 0 0 0 0 2 0 0 0 0 0 0 0 2
16-14-16-12-26-24-10-14-13-14-11-11-19-16-15-22-12 0 0 0 0 2 0 0 0 0 0 0 0 2
13-14-18-13-30-25-11-16-12-14-11-12-21-18-17-22-11 0 0 0 0 1 0 0 0 0 0 0 0 1
13-14-18-13-30-25-11-16-12-14-11-12-20-18-17-22-11 0 0 0 0 1 0 0 0 0 0 0 0 1
13-14-17-13-30-24-10-14-13-14-11-12-21-16-17-22-11 0 0 0 0 1 0 0 0 0 0 0 0 1
14-14-20-13-29-24-10-13-13-14-11-11-20-15-18-22-12 0 0 0 0 1 0 0 0 0 0 0 0 1
13-14-17-13-29-24-10-16-13-14-11-11-20-15-16-22-11 0 0 0 0 0 2 0 0 0 0 0 0 2
13-15-18-12-28-25-9-13-13-14-11-13-20-15-18-23-12 0 0 0 0 0 1 0 0 0 0 0 0 1
13-14-21-13-32-25-10-14-13-14-11-11-20-16-19-22-12 0 0 0 0 0 1 0 0 0 0 0 0 1
14-14-17-13-32-24-10-14-13-14-11-12-20-16-18-22-12 0 0 0 0 0 1 0 0 0 0 0 0 1
14-15-17-12-28-23-9-13-13-14-11-12-20-15-18-22-11 0 0 0 0 0 2 0 0 0 0 0 0 2
13-14-16-13-30-23-11-14-13-14-11-11-19-17-16-25-13 0 0 0 0 0 1 0 0 0 0 0 0 1
14-14-17-13-31-24-10-16-13-14-11-13-19-16-17-22-12 0 0 0 0 0 1 0 0 0 0 0 0 1
13-13-15-13-31-24-11-14-14-15-11-10-19-15-16-23-11 0 0 0 0 0 1 0 0 0 0 0 0 1
13-13-13-14-31-23-10-14-14-14-10-11-19-15-18-22-11 0 0 0 0 0 1 0 0 0 0 0 0 1
13-15-17-12-27-24-10-15-13-14-11-13-20-14-17-23-12 0 0 0 0 0 1 0 0 0 0 0 0 1
13-15-15-12-30-24-10-14-13-14-11-10-19-18-18-24-11 0 0 0 0 0 1 0 0 0 0 0 0 1
13-14-17-13-30-24-10-15-13-14-11-13-19-15-18-22-12 0 0 0 0 0 1 0 0 0 0 0 0 1
13-14-19-13-29-25-10-13-13-14-11-12-21-15-18-23-12 0 0 0 0 0 1 0 0 0 0 0 0 1
13-15-16-12-29-24-10-15-13-16-11-10-19-16-19-24-11 0 0 0 0 0 1 0 0 0 0 0 0 1
13-16-21-12-28-24-10-13-13-14-11-12-20-15-19-22-12 0 0 0 0 0 1 0 0 0 0 0 0 1
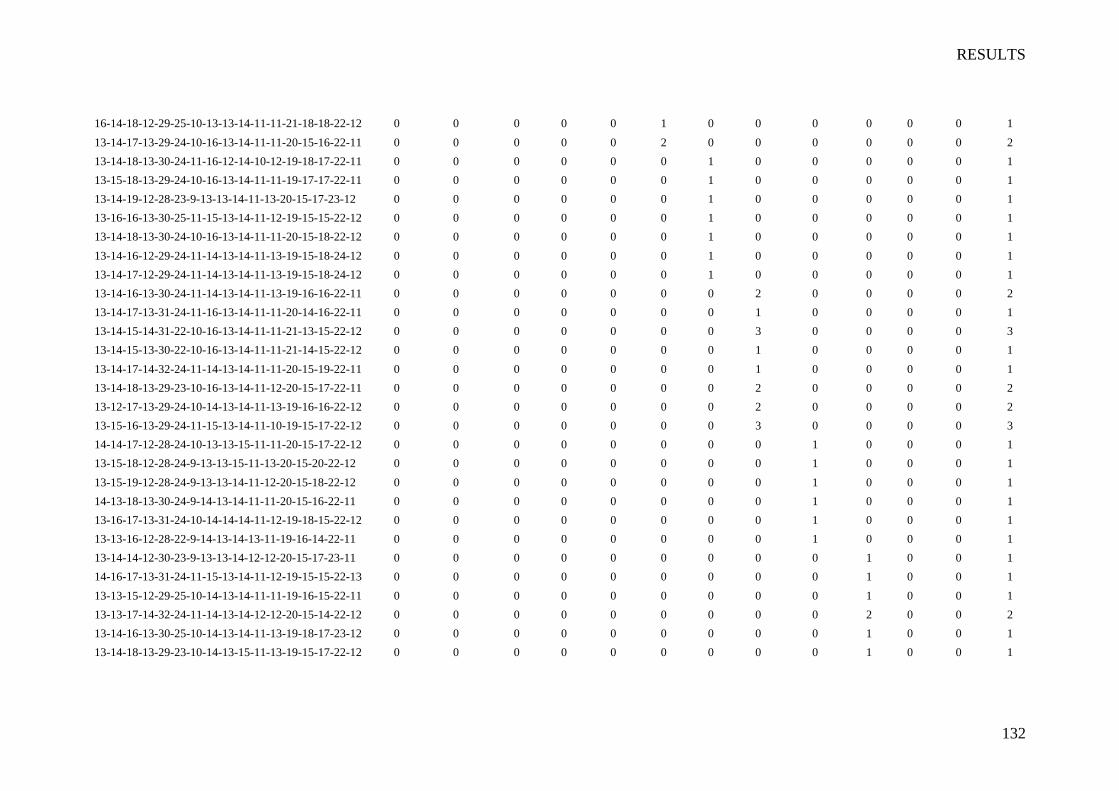
RESULTS
132
16-14-18-12-29-25-10-13-13-14-11-11-21-18-18-22-12 0 0 0 0 0 1 0 0 0 0 0 0 1
13-14-17-13-29-24-10-16-13-14-11-11-20-15-16-22-11 0 0 0 0 0 2 0 0 0 0 0 0 2
13-14-18-13-30-24-11-16-12-14-10-12-19-18-17-22-11 0 0 0 0 0 0 1 0 0 0 0 0 1
13-15-18-13-29-24-10-16-13-14-11-11-19-17-17-22-11 0 0 0 0 0 0 1 0 0 0 0 0 1
13-14-19-12-28-23-9-13-13-14-11-13-20-15-17-23-12 0 0 0 0 0 0 1 0 0 0 0 0 1
13-16-16-13-30-25-11-15-13-14-11-12-19-15-15-22-12 0 0 0 0 0 0 1 0 0 0 0 0 1
13-14-18-13-30-24-10-16-13-14-11-11-20-15-18-22-12 0 0 0 0 0 0 1 0 0 0 0 0 1
13-14-16-12-29-24-11-14-13-14-11-13-19-15-18-24-12 0 0 0 0 0 0 1 0 0 0 0 0 1
13-14-17-12-29-24-11-14-13-14-11-13-19-15-18-24-12 0 0 0 0 0 0 1 0 0 0 0 0 1
13-14-16-13-30-24-11-14-13-14-11-13-19-16-16-22-11 0 0 0 0 0 0 0 2 0 0 0 0 2
13-14-17-13-31-24-11-16-13-14-11-11-20-14-16-22-11 0 0 0 0 0 0 0 1 0 0 0 0 1
13-14-15-14-31-22-10-16-13-14-11-11-21-13-15-22-12 0 0 0 0 0 0 0 3 0 0 0 0 3
13-14-15-13-30-22-10-16-13-14-11-11-21-14-15-22-12 0 0 0 0 0 0 0 1 0 0 0 0 1
13-14-17-14-32-24-11-14-13-14-11-11-20-15-19-22-11 0 0 0 0 0 0 0 1 0 0 0 0 1
13-14-18-13-29-23-10-16-13-14-11-12-20-15-17-22-11 0 0 0 0 0 0 0 2 0 0 0 0 2
13-12-17-13-29-24-10-14-13-14-11-13-19-16-16-22-12 0 0 0 0 0 0 0 2 0 0 0 0 2
13-15-16-13-29-24-11-15-13-14-11-10-19-15-17-22-12 0 0 0 0 0 0 0 3 0 0 0 0 3
14-14-17-12-28-24-10-13-13-15-11-11-20-15-17-22-12 0 0 0 0 0 0 0 0 1 0 0 0 1
13-15-18-12-28-24-9-13-13-15-11-13-20-15-20-22-12 0 0 0 0 0 0 0 0 1 0 0 0 1
13-15-19-12-28-24-9-13-13-14-11-12-20-15-18-22-12 0 0 0 0 0 0 0 0 1 0 0 0 1
14-13-18-13-30-24-9-14-13-14-11-11-20-15-16-22-11 0 0 0 0 0 0 0 0 1 0 0 0 1
13-16-17-13-31-24-10-14-14-14-11-12-19-18-15-22-12 0 0 0 0 0 0 0 0 1 0 0 0 1
13-13-16-12-28-22-9-14-13-14-13-11-19-16-14-22-11 0 0 0 0 0 0 0 0 1 0 0 0 1
13-14-14-12-30-23-9-13-13-14-12-12-20-15-17-23-11 0 0 0 0 0 0 0 0 0 1 0 0 1
14-16-17-13-31-24-11-15-13-14-11-12-19-15-15-22-13 0 0 0 0 0 0 0 0 0 1 0 0 1
13-13-15-12-29-25-10-14-13-14-11-11-19-16-15-22-11 0 0 0 0 0 0 0 0 0 1 0 0 1
13-13-17-14-32-24-11-14-13-14-12-12-20-15-14-22-12 0 0 0 0 0 0 0 0 0 2 0 0 2
13-14-16-13-30-25-10-14-13-14-11-13-19-18-17-23-12 0 0 0 0 0 0 0 0 0 1 0 0 1
13-14-18-13-29-23-10-14-13-15-11-13-19-15-17-22-12 0 0 0 0 0 0 0 0 0 1 0 0 1
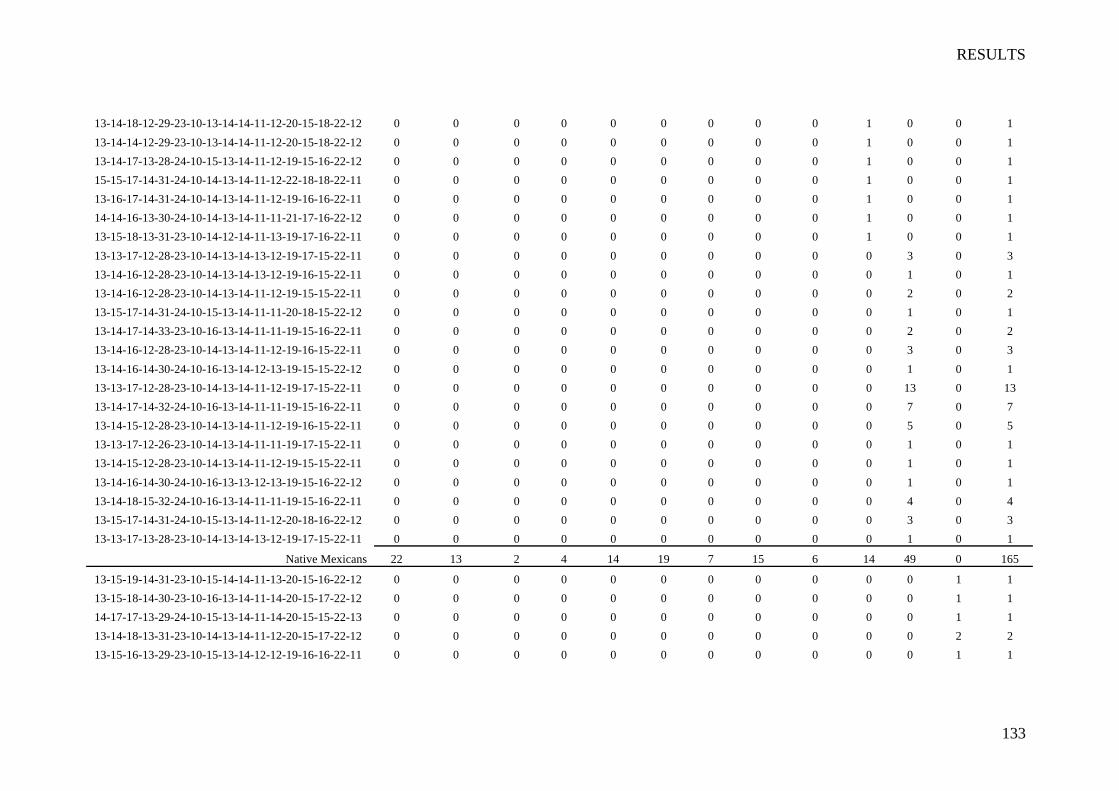
RESULTS
133
13-14-18-12-29-23-10-13-14-14-11-12-20-15-18-22-12 0 0 0 0 0 0 0 0 0 1 0 0 1
13-14-14-12-29-23-10-13-14-14-11-12-20-15-18-22-12 0 0 0 0 0 0 0 0 0 1 0 0 1
13-14-17-13-28-24-10-15-13-14-11-12-19-15-16-22-12 0 0 0 0 0 0 0 0 0 1 0 0 1
15-15-17-14-31-24-10-14-13-14-11-12-22-18-18-22-11 0 0 0 0 0 0 0 0 0 1 0 0 1
13-16-17-14-31-24-10-14-13-14-11-12-19-16-16-22-11 0 0 0 0 0 0 0 0 0 1 0 0 1
14-14-16-13-30-24-10-14-13-14-11-11-21-17-16-22-12 0 0 0 0 0 0 0 0 0 1 0 0 1
13-15-18-13-31-23-10-14-12-14-11-13-19-17-16-22-11 0 0 0 0 0 0 0 0 0 1 0 0 1
13-13-17-12-28-23-10-14-13-14-13-12-19-17-15-22-11 0 0 0 0 0 0 0 0 0 0 3 0 3
13-14-16-12-28-23-10-14-13-14-13-12-19-16-15-22-11 0 0 0 0 0 0 0 0 0 0 1 0 1
13-14-16-12-28-23-10-14-13-14-11-12-19-15-15-22-11 0 0 0 0 0 0 0 0 0 0 2 0 2
13-15-17-14-31-24-10-15-13-14-11-11-20-18-15-22-12 0 0 0 0 0 0 0 0 0 0 1 0 1
13-14-17-14-33-23-10-16-13-14-11-11-19-15-16-22-11 0 0 0 0 0 0 0 0 0 0 2 0 2
13-14-16-12-28-23-10-14-13-14-11-12-19-16-15-22-11 0 0 0 0 0 0 0 0 0 0 3 0 3
13-14-16-14-30-24-10-16-13-14-12-13-19-15-15-22-12 0 0 0 0 0 0 0 0 0 0 1 0 1
13-13-17-12-28-23-10-14-13-14-11-12-19-17-15-22-11 0 0 0 0 0 0 0 0 0 0 13 0 13
13-14-17-14-32-24-10-16-13-14-11-11-19-15-16-22-11 0 0 0 0 0 0 0 0 0 0 7 0 7
13-14-15-12-28-23-10-14-13-14-11-12-19-16-15-22-11 0 0 0 0 0 0 0 0 0 0 5 0 5
13-13-17-12-26-23-10-14-13-14-11-11-19-17-15-22-11 0 0 0 0 0 0 0 0 0 0 1 0 1
13-14-15-12-28-23-10-14-13-14-11-12-19-15-15-22-11 0 0 0 0 0 0 0 0 0 0 1 0 1
13-14-16-14-30-24-10-16-13-13-12-13-19-15-16-22-12 0 0 0 0 0 0 0 0 0 0 1 0 1
13-14-18-15-32-24-10-16-13-14-11-11-19-15-16-22-11 0 0 0 0 0 0 0 0 0 0 4 0 4
13-15-17-14-31-24-10-15-13-14-11-12-20-18-16-22-12 0 0 0 0 0 0 0 0 0 0 3 0 3
13-13-17-13-28-23-10-14-13-14-13-12-19-17-15-22-11 0 0 0 0 0 0 0 0 0 0 1 0 1
Native Mexicans 22 13 2 4 14 19 7 15 6 14 49 0 165
13-15-19-14-31-23-10-15-14-14-11-13-20-15-16-22-12 0 0 0 0 0 0 0 0 0 0 0 1 1
13-15-18-14-30-23-10-16-13-14-11-14-20-15-17-22-12 0 0 0 0 0 0 0 0 0 0 0 1 1
14-17-17-13-29-24-10-15-13-14-11-14-20-15-15-22-13 0 0 0 0 0 0 0 0 0 0 0 1 1
13-14-18-13-31-23-10-14-13-14-11-12-20-15-17-22-12 0 0 0 0 0 0 0 0 0 0 0 2 2
13-15-16-13-29-23-10-15-13-14-12-12-19-16-16-22-11 0 0 0 0 0 0 0 0 0 0 0 1 1
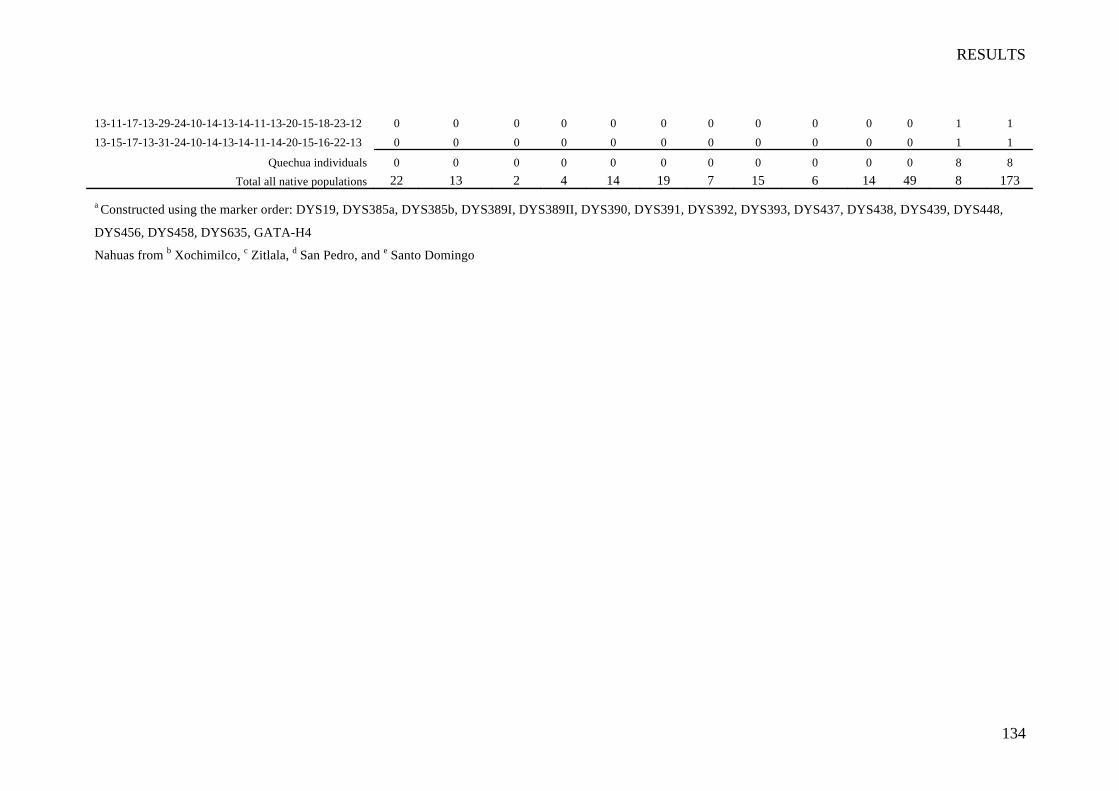
RESULTS
134
13-11-17-13-29-24-10-14-13-14-11-13-20-15-18-23-12 0 0 0 0 0 0 0 0 0 0 0 1 1
13-15-17-13-31-24-10-14-13-14-11-14-20-15-16-22-13 0 0 0 0 0 0 0 0 0 0 0 1 1
Quechua individuals 0 0 0 0 0 0 0 0 0 0 0 8 8
Total all native populations 22 13 2 4 14 19 7 15 6 14 49 8 173 a Constructed using the marker order: DYS19, DYS385a, DYS385b, DYS389I, DYS389II, DYS390, DYS391, DYS392, DYS393, DYS437, DYS438, DYS439, DYS448,
DYS456, DYS458, DYS635, GATA-H4
Nahuas from b Xochimilco,
c Zitlala,
d San Pedro, and
e Santo Domingo
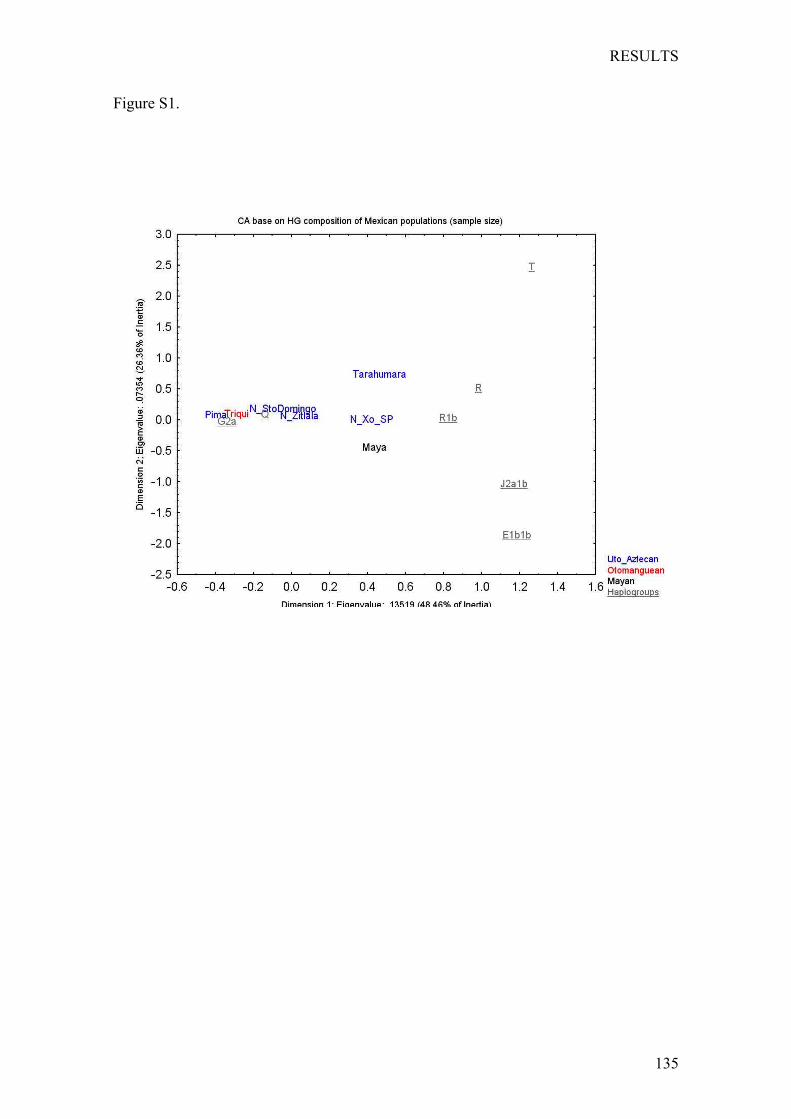
RESULTS
135
Figure S1.
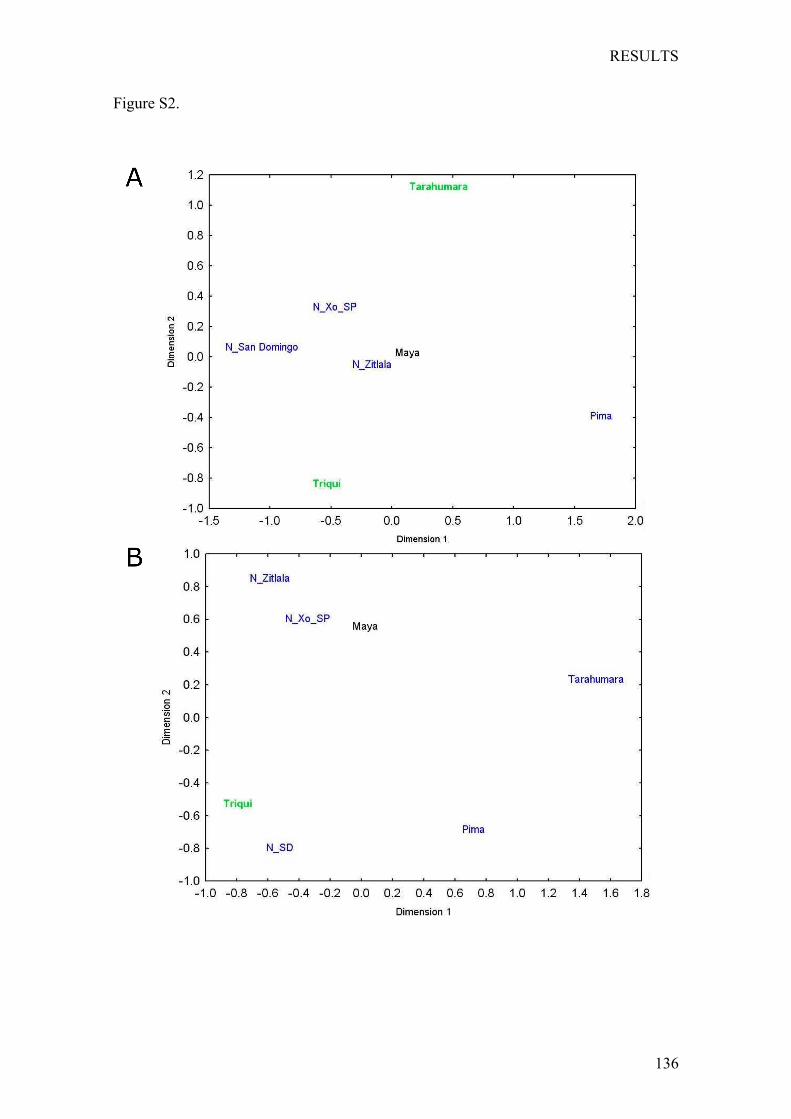
RESULTS
136
Figure S2.
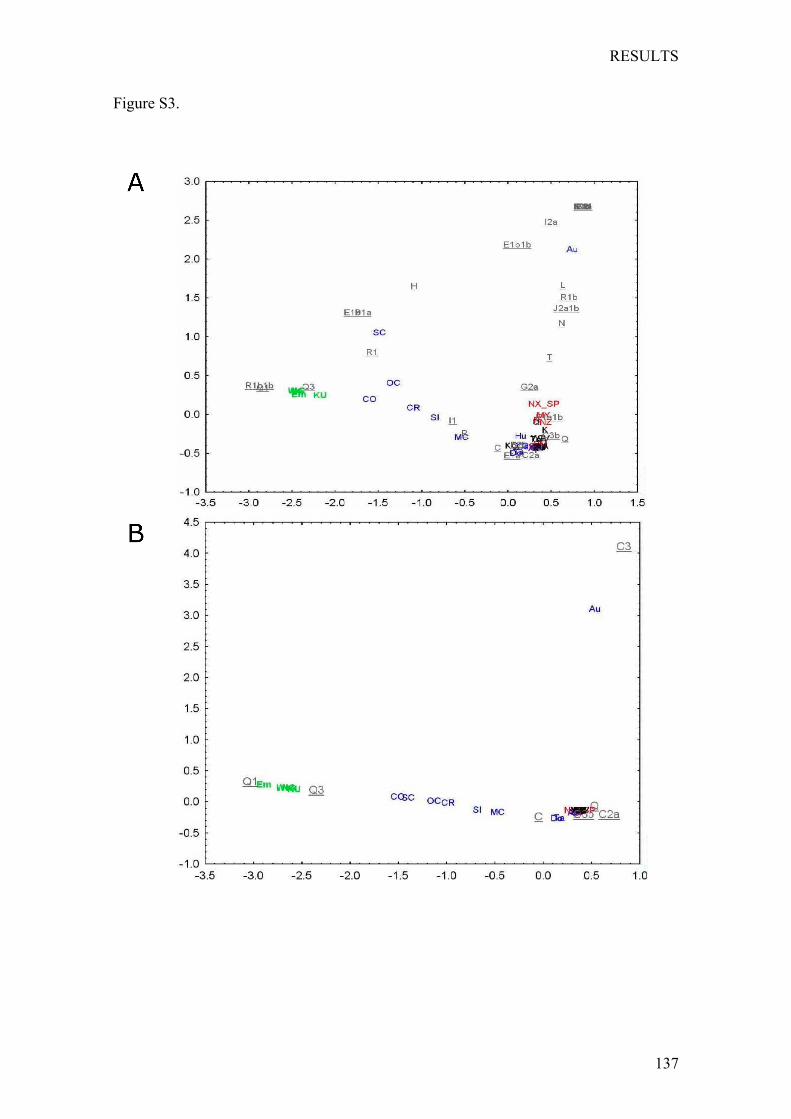
RESULTS
137
Figure S3.

RESULTS
139
Chapter 4: Origin and Genetic Differentiation of ThreeMexicanNativeGroups (Purépechas,TriquisandMayas):Contribution of CODIS-STRs to the History of HumanPopulationsofMesoamerica
Martínez-Cortés G, Nuño-Arana I, Rubi-Castellanos R, Vilchis-Dorantes G, Luna-
Vázquez A, Coral-Vázquez RM, Canto-Cetina T, Salazar-Flores J, Romero-Rentería O,
Muñoz-Valle JF, Sandoval-Mendoza K, Gamero-Lucas JJ and Rangel-Villalobos H
Accepted in Annals of Human Biology

RESULTS
141
Origin and Genetic Differentiation of Three Native Mexican Groups
(Purépechas, Triquis, and Mayas): Contribution of CODIS-STRs to the
History of Human Populations of Mesoamerica
Martínez-Cortés G1, Nuño-Arana I1, Rubi-Castellanos R1, Vilchis-Dorantes G2, Luna-
Vázquez A2, Coral-Vázquez RM3, Canto-Cetina T4, Salazar-Flores J1, Muñoz-Valle JF5,
Sandoval-Mendoza K6, López Z1, Gamero-Lucas JJ7, Rangel-Villalobos H1*.
1Instituto de Investigación en Genética Molecular, Departamento de Ciencias Médicas y de
la Vida, Centro Universitario de la Ciénega, Universidad de Guadalajara (CUCiénega-
UdeG), Ocotlán, Jalisco, México.
2Laboratorio de Genética Forense (PGR), Dirección de la Coordinación General de
Servicios Periciales de la Procuraduría General de la República, México D.F., México.
3Unidad de Investigación Médica en Genética Humana, Centro Médico Nacional Siglo
XXI-IMSS, México D.F. México.
4Laboratorio de Biología de la Reproducción, Departamento de Genética y Salud
Reproductiva, Centro de Investigaciones Hydeyo Noguchi, Merida, Yucatán, México.
5Instituto de Enfermedades Reumáticas y del Sistema Músculo-Esquelético, Centro
Universitario de Ciencias de la Salud (CUCS-UdeG), Universidad de Guadalajara,
Jalisco, México.
6Instutute of Evolutionary Biology (UPF-CSIC) CEXS-UPF-PRBB, 08003 Barcelona,
Spain. 7Departamento de Medicina Legal y Forense, Facultad de Medicina, Universidad de
Cádiz, Cádiz, España
RESULTS
142
* Corresponding author: Instituto de Investigación en Genética Molecular, Universidad
de Guadalajara, CP 47810 Ocotlán, Jalisco, México. TEL/FAX: (+52) (392) 9257112.
e-mail: [email protected]
27 text pages (19 plus 8 pages of references), 5 figures, 9 tables (4 plus 5 supplementary)
Grant Sponsorship: CONACyT 48710 to H.R-V.
Running headline: Origin and genetic differentiation of three Native groups from Mexico
Keywords: STRs; CODIS; Mexico; Native groups, Mesoamerica.
RESULTS
143
Abstract
Background: CODIS-STRs in Native Mexican groups have been rarely analyzed for both
human identification and anthropological purposes. Aim: To analyze the genetic
relationships and population structure among three Native Mexican groups from
Mesoamerica. Subjects and methods: 531 unrelated Native individuals from Mexico were
PCR-typed for 15 and 9 autosomal STRs (Identifiler™ and Profiler™ kits, respectively),
including five population samples: Purépechas (Mountain, Valley, and Lake), Triquis, and
Yucatec Mayas. Previously published STR data were included to the analyses. Results:
Allele frequencies and statistical parameters of forensic importance were estimated by
population. The majority of Native groups were not differentiated pairwise, excepting
Triquis and Purépechas, which was attributable to their relative geographic and cultural
isolation. Although Mayas, Triquis and Purépechas-Mountain presented the highest number
of private alleles, suggesting recurrent gene flow, the elevated differentiation of Triquis
indicates a different origin of this gene flow. Interestingly, Huastecos and Mayas were not
differentiated, which is in agreement with the archeological hypothesis that Huastecos
represent an ancestral Maya group. Interpopulation variability was larger in Natives than in
Mestizos, both significant. Conclusion: Although results suggest European admixture has
increased the similarity between Native Mexican groups, the differentiation and
inconsistent clustering by language or geography stresses the importance of serial founder
effect and/or genetic drift to depict their present genetic relationships.
RESULTS
144
Introduction
Patterns of the current population structure provide an important source of data for
inferences regarding recent demographic history. Genetic variation among human
populations has shown that groups living on the same continent are relatively homogeneous
(Bamshad et al., 2004). However, Native American populations exhibit considerable
interpopulation variability indicating differences between populations from North and
South America (Bortoloni et al., 2003; Mao et al., 2007; Wang et al., 2007). The pre-
Columbian civilizations of most of Mexico and Central America, together comprising
Mesoamerica, participated in the same system of beliefs and rites; they shared a certain
lifestyle –sedentary–, as well as social and political organization. A relative cultural
homogeneity based on archaeological and anthropological data has been described
(Duverger, 2007). However, also observed is a linguistic and genetic heterogeneity in
Mesoamerica, shaped by both demographic and biological factors (Wang et al., 2008). In
Mexico, the present indigenous population numbers 10.2 million, representing 9.6% of the
total Mexican population. There is a spread of 156,557 native settlements in 803 localities,
in which >30% of the population speak an indigenous language. Using language as a
criterion selection, it is possible to estimate that in Mexico there are >68 native groups >85
languages and variant dialects described until now (Cisneros, 2004; National Institute of
Statistics, Geography, and Informatics-Mexico [INEGI], 2005); nearly 80% of this
population is concentrated in eight Mexican States as follows: Chiapas; Oaxaca; Guerrero;
Hidalgo; Yucatán; Campeche; Veracruz, and San Luis Potosí.
Among the Native Mexican groups analyzed in this work, Purépechas –also known as
Tarascos– constituted one of the most important Mesoamerican cultures at the time of
RESULTS
145
Spanish contact, coming to control a vast area of western Mexico (70,000 km2) including
the State of Michoacán and part of the states of Guanajuato, Guerrero, Jalisco, Colima,
Querétaro, and Mexico. In point of fact, the Purépechas were one of the few groups that
resisted the Aztec expansion prior to the Spanish Conquest (Michelet, 2001). They derived
from admixture of different Chichimecas groups, a term referring to nomad hunters from
Aridoamerica. According to the Relation and Chronicles of Michoacán, the Chichimecas
migrated with Aztecs and other Native groups from the mythic site, Chicomoztoc; they
separated to the East and arrived at Michoacán, where they admixed with local Nahuas
already settled in Michoacán territory, giving rise to the Native group known as pre-
Tarascos (Kirchhof, 1956). Other sources claim they formed a social organization
structured in small groups that arrived first at Zacápu and Naranxán in the state of
Michoacán ca. 4,000 ybp; they eventually migrated and congregated at Pátzcuaro and
contiguous Lakes (Jiménez-Moreno, 1948; Schöndube, 1996; Michelet, 1996, 2001). The
second Native group analyzed in this study comprised the Triquis, who presumably
originated in the Central Valley of Oaxaca State –probably Monte Alban–, and were
eventually banished by the Zapotecans. Subsequently, they arrived at their current location
in the western Oaxaca mountain region at nearly 2,000 ybp. At the beginning of the XV
century, the Triquis were subjugated by the Aztecs and were forced to paid tribute (Lewin-
Fisher and Sandoval-Cruz, 2007). At the time of the Spanish contact, the Triquis already
constituted a cultural and linguistic island in the High Mixteca region of Oaxaca. At
present, the Triquis comprise two principal regions with cultural and linguistic differences:
San Juan Copala (Low), and Chicahuaxtla (High); access to their territory is difficult due to
its location at the confluence of the Sierra Madre Oriental with the Sierra Madre
Occidental, comprising an extension of 500 km2 (Huerta-Ríos, 1995; Lewin-Fisher and
RESULTS
146
Sandoval-Cruz, 2007). Finally, we analyzed the Yucatec Mayas, who constituted one of the
most important Mesoamerican cultures because of their ancient cultural and scientific
legacy. The Maya civilization inhabited a large area of southeastern Mexico and Central
America, with a history of ca. 3,000 ybp. During this time, hundreds of dialects were
spoken in these regions, generating nearly 44 different contemporary Mayan languages.
Records and archeological data indicate that pre-Columbian Mayas of the Yucatán
Peninsula achieved two large migrations during the Late Classic and Early Post-Classic
ages, including one from the Central Uplands of Mexico across the coastal plain of the Gulf
of Mexico, and another, yet more ancient, from the Petén area in the Maya Uplands at the
South of Yucatan Peninsula (Nalda, 2005; Schmidt, 2007). The identity of these culture
remains in force to the present day with the concurrence of at least three factors: the
everyday use of the Mayan language; the permanence of religious rituals and customs, and
a social organization of autonomous communities. Their social and political conditions
were markedly inferior during the three centuries following the Spanish Conquest (Ruz,
2006).
To unravel the differentiation processes that generated the population’s genetic
heterogeneity, microsatellites –or Short tandem repeats (STRs)– constitute ideal
polymorphic markers, whose relatively high mutation rate allows assessment of the
biological diversity and elucidation of the history of human populations (Bosch et al., 2000;
Zhivotovsky et al., 2003; Sahoo and Kashyap, 2005; Liu et al., 2006). In this context, we
highlight the autosomal STRs included in the Combined DNA Index System (CODIS),
which are widely used for human identification purposes. The correct interpretation of
CODIS-STR-generated DNA profiles in forensic casework requires knowledge of the allele
distribution and some statistical parameters in the population in which the system will be
RESULTS
147
applied; thus, worldwide-population STR datasets have been generated for this purpose. In
Mexico, despite the large number of Native groups, only a few molecular studies have been
conducted with autosomal STR loci in these populations (Rangel-Villalobos et al., 2000;
Sánchez et al., 2005; Barrot et al., 2005; Ibarra-Rivera et al., 2008; González-Martín et al.,
2008).
In this work, we obtained CODIS-STR population data in order to estimate statistical
parameters of forensic importance of five population samples from the following three
Native Mexican groups: Purépechas; Triquis, and Mayas. In addition, we analyzed the
genetic relationships and population structure (AMOVA) in these native groups (clustered
by geographic and linguistic criteria), including previously reported ancestral populations
(African and European), Mestizos, and Natives from Mexico. Anthropological discussion
addressed both pre-Columbian records and the possible present-day effects of gene flow
among these Native populations.
Methods
Population Sample
A total of 531 unrelated individuals from five indigenous communities were studied. Prior
to the inclusion in our study, all volunteers signed an informed consent letter, according to
the ethical guidelines of the Helsinki Declaration; they were classified into three Native
Mexican groups: (i) 333 Purépechas from three areas of the western state of Michoacán,
including the localities of Zipiajo (n = 168), Angahuan (n = 103), and Puácuaro (n = 62)
from the Mountain, Valley, and Lacustrine Regions, respectively; these three population
samples were analyzed individually; (ii) 108 Triquis from the District of San Juan Copala
in the Mixteca region of the eastern state of Oaxaca, and (iii) 90 Mayas from different
RESULTS
148
localities around Mérida, the largest city of the Yucatán peninsula, in Mexico’s
southeastern region. DNA was extracted from fresh blood samples by the salting-out
method (Miller et al., 1988) and from buccal swabs by Chelex® 100 method (Walsh et al.,
1991). For interpopulational analyses, we included previously published Native Mexican
and Mestizo populations (Table I); their geographic location throughout the Mexican
Republic is presented in Figure 1. In addition, considering the origin of European
conquerors and African slaves who came to Mexico since the European contact with the
New World (Rubi-Castellanos et al., 2009), population samples from Spain and Central-
Western Africa were included for this purpose. The European population sample consisted
of a gene pool obtained from different autochthonous communities of Spain; similarly, the
African sample included a gene pool of Fangs and Equatorial Guinea populations located in
Western Africa (Table I). For Native groups, their linguistic classification is indicated in
Figure 2 (Gordon, 2005; National Institute of Indigenous Languages-Mexico [INALI],
2008).
PCR amplification and genotyping
We used the Profiler Plus™ kit in Mayas and Triquis, and Identifiler™ kit in Purépechas,
both kits for human identification from Applied Biosystems (Foster City, CA, USA), which
are designed for co-amplification of the following autosomal STR loci: D8S1179; D21S11;
D7S820; vWA; D18S51; D3S1358; D13S317; D5S818, and FGA (Profiler Plus™ PCR
kit). Additionally, CSF1PO, D19S433, TPOX, TH01, D16S539, and D2S1338 were
analyzed in Purépechas (Identifiler™ PCR kit). The amplified products were separated by
capillary electrophoresis using the ABI Prism™ 310 Genetic Analyzer following
RESULTS
149
manufacturer recommendations. The allelic ladder provided with the kit and GeneMapper
ID software version 3.2 were utilized for genotyping.
Data analyses
Allele distribution and statistical parameters of forensic importance were computed with
the PowerStats program (Tereba, 1999). For each population sample, Hardy-Weinberg
expectations and two-loci equilibrium were verified by exact tests with a 95% confidence
interval (95% CI) with the Genetic Data Analysis (GDA) program version 1.1 (Lewis and
Zaykin, 2001). Bonferroni correction was applied to evaluate these p-values according to
the loci-number of Profiler and Identifiler kits (p < 0.0055 and p < 0.0033, respectively).
Gene flow among Native groups was assessed as the number of migrants per generation
(Nm) according to the equation of Wright (Wright, 1951). In addition, we estimated the
following parameters of genetic diversity in each Native group: (i) mean allele number, (ii)
average expected heterozigosity, and (iii) number of alleles exclusively observed in one
population or “private alleles”. To evaluate private alleles we applied the computer
program ADZE (Allelic Diversity AnalyZEr) that uses a rarefaction approach to trim
unequal samples to the same standardized sample size (g), and to assess the sample size-
corrected private allelic richness to any set of populations (Szpiech et al. 2008). For
interpopulational analysis, we included STR data from previously published populations
described in Table I. For consistent comparison, data of only 9 STR loci included in the
Profiler™ kit analyzed in all these populations were employed for this purpose. Genetic
differentiation was evaluated by normalized FST distances and pairwise FST p-values,
computed with the Arlequin 3.1 software (Excoffier et al., 2005). Bonferroni correction was
implemented to evaluate multiple FST p-values by population. FST distance was selected
RESULTS
150
because represent genetic differentiation patterns by drift, corresponding with both genetic
and archeological records of human populations (Pérez-Lezaún et al. 1997). Genetic
distances were displayed on a multidimensional scaling (MDS) plot to explore the genetic
relationships among populations with the SPSS for Windows program version 10.0.
Analysis of molecular variance (AMOVA) was carried out placing Mestizos and Natives
populations in different clusters based on geography and linguistic classification, as
properly described in the text. Additionally, we utilized spatial analysis of molecular
variance (SAMOVA), which is similar to the traditional AMOVA, but allow clustering
populations in groups geographically are genetically homogeneous (Dupanloup et al.,
2002). To establish whether decrease of homozygosity (or increase of heterozygosity)
reflects European admixture in Native groups, we reviewed correlation of the decrease of
homozygosity with the genetic distance between each group and the southwestern Spanish
population. For each Native group, this European admixture marker (a decrease in
homozygosity) was correlated with its geographic distance and altitude to the nearest
Mexican-Mestizo population. Thus, the final purpose was to verify whether geographic
distance and altitude influence European admixture in these Native groups. In order to
investigate whether isolation-by-distance (IBD) could explain genetic differentiation among
Native populations, we revised the correlation between genetic and geographic distances
among these groups (Ramachandran et al., 2005). The statistical significance of these
correlations was evaluated by the Mantel test. Distances in km between populations were
computed employing geographic coordinates with the Great Circle Calculator program
(http://www.gb3pi.org.uk/great.html). Concurrently, we examined possible landscapes of
genetic and geographic differentiation processes by means of AIDA program software
(Bertorelle and Barbujani, 1995).
RESULTS
151
Results
Statistical Parameters of Forensic Importance and Genetic Diversity
Allele distribution and statistical parameters of forensic importance of the Native Mexican
groups Purépechas (West), Triquis (South), and Mayas (South-East) were estimated and
provided as electronic supplementary material (ESM) (Tables S1-S5). In general, for all
five Native population samples, genotype distribution by locus and two loci combination
were in agreement with Hardy-Weinberg and linkage equilibrium, respectively. Only two
loci displayed significant p-values for HWE test after applying the Bonferroni correction:
D3S1358 in Purépechas-Lake, and D7S580 in Triquis; these p-values were close to the
Bonferroni limit and represented unique events by population. Therefore, they do not
support significant immigration or endogamy processes in these Native groups; thus, we
did not consider they deserve further discussion. The combined Power of discrimination
(PD) and Power of exclusion (PE) for both STR systems were ≥0.9999 and ≥0.99752,
respectively.
The genetic diversity parameters of these groups are presented in Table II. Purépechas-
Mountain had the largest number of private alleles with six, followed by the Purépecha-
Valley and Mayas, with three private alleles each Native group. For the mean allele
number, again Purépechas-Mountain had the maximum value, followed by Mayas and
Choles. Finally, the average of expected heterozigosity pointed out Otomi-Sierra, Choles
and Purépechas-Mountain, respectively, as the Native groups with larger genetic diversity,
whereas the smallest value was observed in Triquis. Conversely, the ADZE program
revealed that the mean number of private alleles in standardized sample sizes (g) was
higher in Mayas, Triquis, Purépechas-Mountain, respectively (Figure 3).
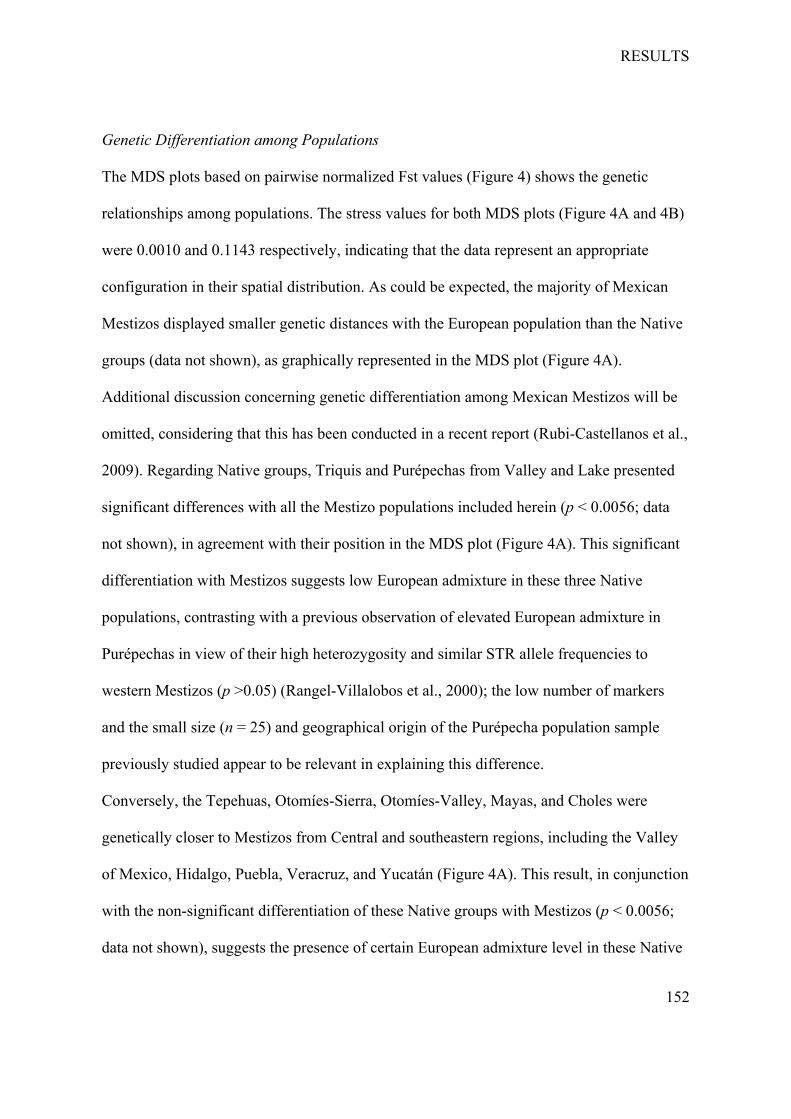
RESULTS
152
Genetic Differentiation among Populations
The MDS plots based on pairwise normalized Fst values (Figure 4) shows the genetic
relationships among populations. The stress values for both MDS plots (Figure 4A and 4B)
were 0.0010 and 0.1143 respectively, indicating that the data represent an appropriate
configuration in their spatial distribution. As could be expected, the majority of Mexican
Mestizos displayed smaller genetic distances with the European population than the Native
groups (data not shown), as graphically represented in the MDS plot (Figure 4A).
Additional discussion concerning genetic differentiation among Mexican Mestizos will be
omitted, considering that this has been conducted in a recent report (Rubi-Castellanos et al.,
2009). Regarding Native groups, Triquis and Purépechas from Valley and Lake presented
significant differences with all the Mestizo populations included herein (p < 0.0056; data
not shown), in agreement with their position in the MDS plot (Figure 4A). This significant
differentiation with Mestizos suggests low European admixture in these three Native
populations, contrasting with a previous observation of elevated European admixture in
Purépechas in view of their high heterozygosity and similar STR allele frequencies to
western Mestizos (p >0.05) (Rangel-Villalobos et al., 2000); the low number of markers
and the small size (n = 25) and geographical origin of the Purépecha population sample
previously studied appear to be relevant in explaining this difference.
Conversely, the Tepehuas, Otomíes-Sierra, Otomíes-Valley, Mayas, and Choles were
genetically closer to Mestizos from Central and southeastern regions, including the Valley
of Mexico, Hidalgo, Puebla, Veracruz, and Yucatán (Figure 4A). This result, in conjunction
with the non-significant differentiation of these Native groups with Mestizos (p < 0.0056;
data not shown), suggests the presence of certain European admixture level in these Native
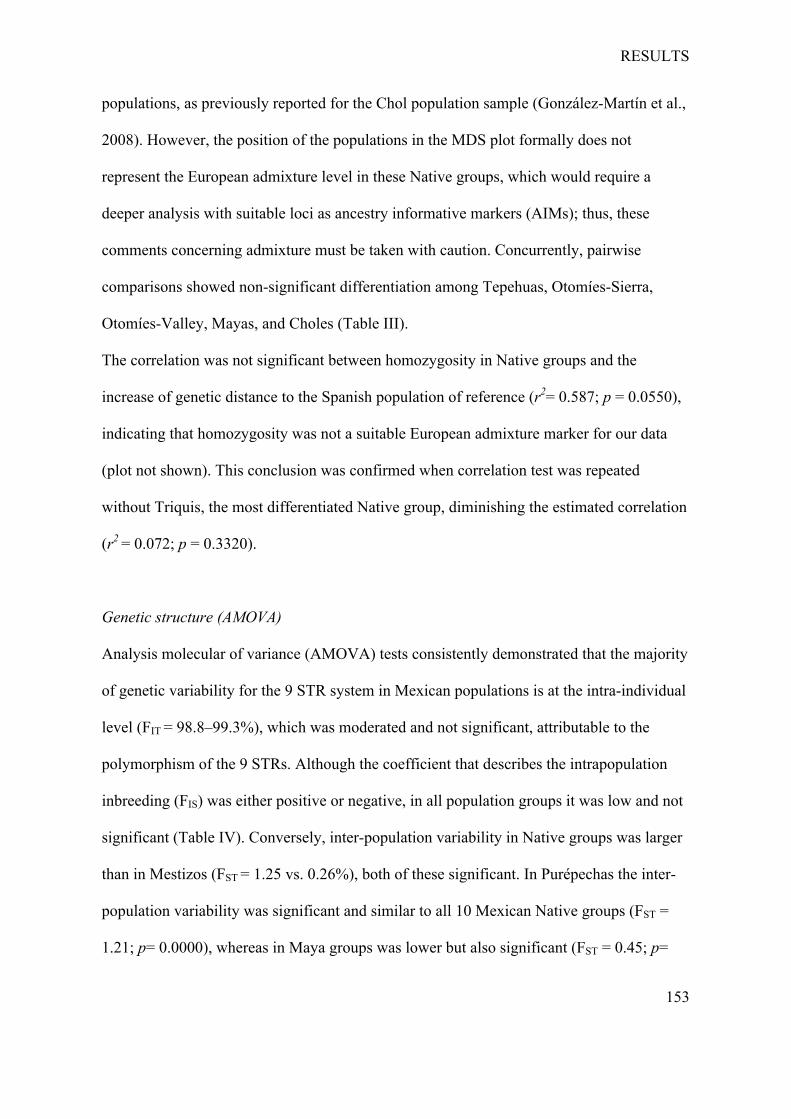
RESULTS
153
populations, as previously reported for the Chol population sample (González-Martín et al.,
2008). However, the position of the populations in the MDS plot formally does not
represent the European admixture level in these Native groups, which would require a
deeper analysis with suitable loci as ancestry informative markers (AIMs); thus, these
comments concerning admixture must be taken with caution. Concurrently, pairwise
comparisons showed non-significant differentiation among Tepehuas, Otomíes-Sierra,
Otomíes-Valley, Mayas, and Choles (Table III).
The correlation was not significant between homozygosity in Native groups and the
increase of genetic distance to the Spanish population of reference (r2= 0.587; p = 0.0550),
indicating that homozygosity was not a suitable European admixture marker for our data
(plot not shown). This conclusion was confirmed when correlation test was repeated
without Triquis, the most differentiated Native group, diminishing the estimated correlation
(r2 = 0.072; p = 0.3320).
Genetic structure (AMOVA)
Analysis molecular of variance (AMOVA) tests consistently demonstrated that the majority
of genetic variability for the 9 STR system in Mexican populations is at the intra-individual
level (FIT = 98.8–99.3%), which was moderated and not significant, attributable to the
polymorphism of the 9 STRs. Although the coefficient that describes the intrapopulation
inbreeding (FIS) was either positive or negative, in all population groups it was low and not
significant (Table IV). Conversely, inter-population variability in Native groups was larger
than in Mestizos (FST = 1.25 vs. 0.26%), both of these significant. In Purépechas the inter-
population variability was significant and similar to all 10 Mexican Native groups (FST =
1.21; p= 0.0000), whereas in Maya groups was lower but also significant (FST = 0.45; p=
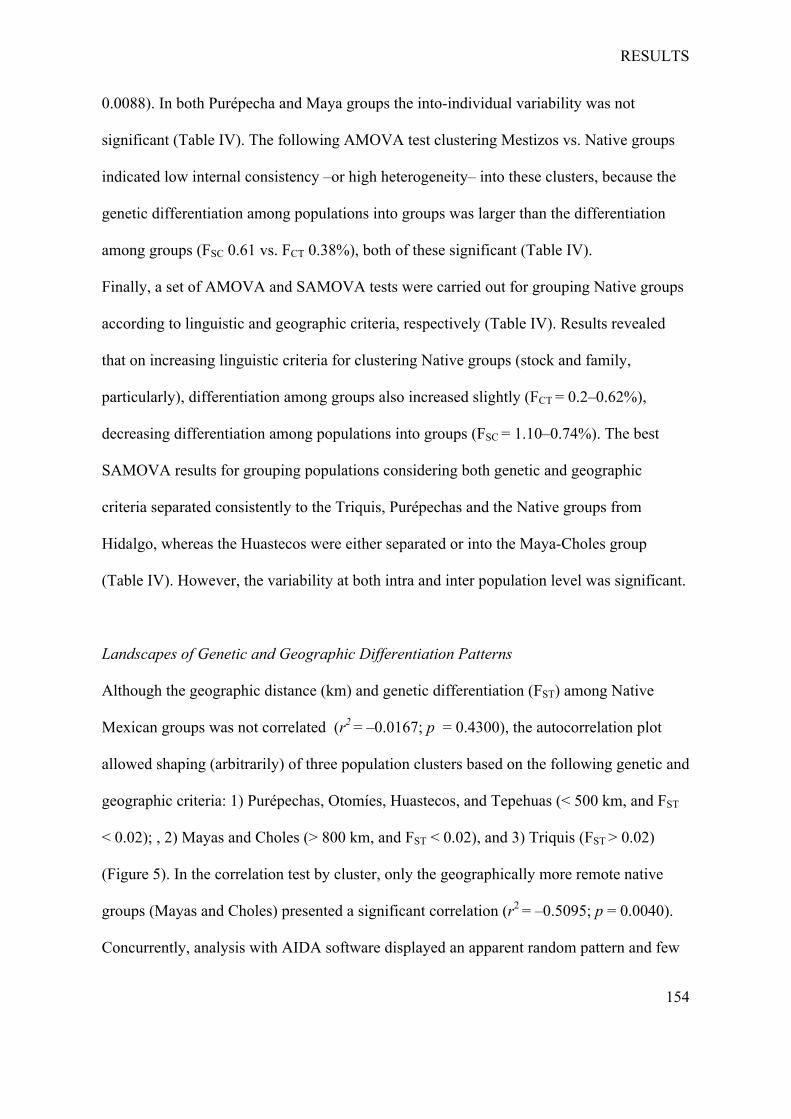
RESULTS
154
0.0088). In both Purépecha and Maya groups the into-individual variability was not
significant (Table IV). The following AMOVA test clustering Mestizos vs. Native groups
indicated low internal consistency –or high heterogeneity– into these clusters, because the
genetic differentiation among populations into groups was larger than the differentiation
among groups (FSC 0.61 vs. FCT 0.38%), both of these significant (Table IV).
Finally, a set of AMOVA and SAMOVA tests were carried out for grouping Native groups
according to linguistic and geographic criteria, respectively (Table IV). Results revealed
that on increasing linguistic criteria for clustering Native groups (stock and family,
particularly), differentiation among groups also increased slightly (FCT = 0.2–0.62%),
decreasing differentiation among populations into groups (FSC = 1.10–0.74%). The best
SAMOVA results for grouping populations considering both genetic and geographic
criteria separated consistently to the Triquis, Purépechas and the Native groups from
Hidalgo, whereas the Huastecos were either separated or into the Maya-Choles group
(Table IV). However, the variability at both intra and inter population level was significant.
Landscapes of Genetic and Geographic Differentiation Patterns
Although the geographic distance (km) and genetic differentiation (FST) among Native
Mexican groups was not correlated (r2 = –0.0167; p = 0.4300), the autocorrelation plot
allowed shaping (arbitrarily) of three population clusters based on the following genetic and
geographic criteria: 1) Purépechas, Otomíes, Huastecos, and Tepehuas (< 500 km, and FST
< 0.02); , 2) Mayas and Choles (> 800 km, and FST < 0.02), and 3) Triquis (FST > 0.02)
(Figure 5). In the correlation test by cluster, only the geographically more remote native
groups (Mayas and Choles) presented a significant correlation (r2 = –0.5095; p = 0.0040).
Concurrently, analysis with AIDA software displayed an apparent random pattern and few
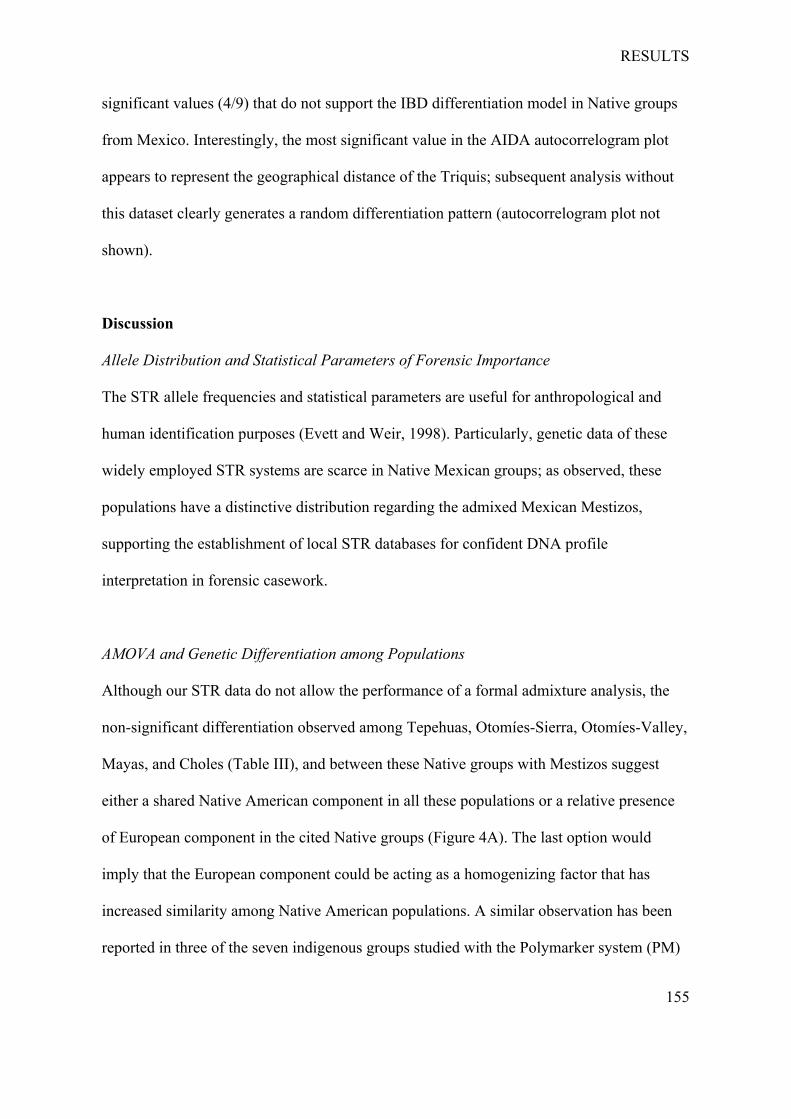
RESULTS
155
significant values (4/9) that do not support the IBD differentiation model in Native groups
from Mexico. Interestingly, the most significant value in the AIDA autocorrelogram plot
appears to represent the geographical distance of the Triquis; subsequent analysis without
this dataset clearly generates a random differentiation pattern (autocorrelogram plot not
shown).
Discussion
Allele Distribution and Statistical Parameters of Forensic Importance
The STR allele frequencies and statistical parameters are useful for anthropological and
human identification purposes (Evett and Weir, 1998). Particularly, genetic data of these
widely employed STR systems are scarce in Native Mexican groups; as observed, these
populations have a distinctive distribution regarding the admixed Mexican Mestizos,
supporting the establishment of local STR databases for confident DNA profile
interpretation in forensic casework.
AMOVA and Genetic Differentiation among Populations
Although our STR data do not allow the performance of a formal admixture analysis, the
non-significant differentiation observed among Tepehuas, Otomíes-Sierra, Otomíes-Valley,
Mayas, and Choles (Table III), and between these Native groups with Mestizos suggest
either a shared Native American component in all these populations or a relative presence
of European component in the cited Native groups (Figure 4A). The last option would
imply that the European component could be acting as a homogenizing factor that has
increased similarity among Native American populations. A similar observation has been
reported in three of the seven indigenous groups studied with the Polymarker system (PM)
RESULTS
156
including Mixteca Alta, Mixteca Baja, and Nahuas of Xochimilco (Buentello-Malo et al.,
2003). This is in agreement with the AMOVA results indicating the lowest variability is
apportioned “among groups”, when Mexican Mestizos and Native groups were clustered
and compared (FCT= 0.38%; Table IV); consequently, admixture occurring after European
contact with New World populations came to diminish Native population genetic
differentiation, previously generated by processes such as serial founder effect and random
genetic drift as described for human populations (Ramachandran et al., 2005; Zhang and
Dolan, 2008). Unfortunately, we could not use homozygosity as European admixture
marker in these Native American populations. Probably the homozygosity usefulness
diminished by a similar –although probably low– admixture level in the mentioned
Mesoamerican Native groups. Finally, to estimate correctly the presence of European
and/or African admixture in these groups, a deeper analysis with further loci would be
needed (i.e., with Ancestry informative markers [AIMS]).
The larger genetic differentiation among populations in groups than among groups (Table
IV), is consistent with the proposal of heterogeneity as a major characteristic of Mexican
populations (Bonilla et al., 2005; Wang et al., 2008), although in contrast to a previous
report claiming genetic homogeneity for seven Native Mexican groups based on five PM-
system loci (Buentello-Malo et al., 2003); unfortunately, the authors did not apply a
significance test to evaluate FST. The greater resolution power of the 9 STRs to disclose
population genetic structure –with respect to the PM system– could explain the contrasting
conclusions of these studies in Mexican populations.
The poor quality of both linguistic and geographic (SAMOVA test) criteria for clustering
Native groups was particularly noteworthy because in all cases, differentiation among
populations into groups was significant (p = 0.0000). Taken together, these results
RESULTS
157
emphasize the importance of the differentiation processes that acted upon Native American
populations (Wang et al., 2007). Results of AIDA software and correlation tests indicated
that, at the geographical level of these Native groups it is not possible to invoke a simple
population pattern of genetic differentiation. However, it should be considered that genetic
similarity at short distance (e.g., IBD) is likely to produce decreasing autocorrelation
indices (Bertorelle and Barbujani, 1995). Therefore, the data available did not allow ruling
out the possibility that significant patterns of geographic structure, rather than random
variation, could exist in Mesoamerica when more Native American populations are studied.
In addition, more complex evolutionary landscapes could fit better to explain the genetic
differentiation presently observed among Native groups from Mesoamerica, such as
Isolation by Migration (IM) models (Hey, 2005; Kitchen et al., 2008).
With respect to the genetic relationships among Native groups, we omitted discussing
Otomíes from the Valley and Sierra, Tepehuas, and Huastecos (central region) because this
has been previously addressed (González-Martín et al., 2004, 2008). Particularly, caution
must be taken with respect to the lack of differentiation of the Tepehuas from the majority
of Native groups (Table III), because this population sample had many STR data lost and
was relatively small (n= 47); consequently, discussion about the Tepehuas genetic
relationships will be avoided.
Therefore, we present a particular discussion of the results concerning the population
samples studied herein:
Purépechas
The pairwise normalized FST genetic distances (Table III), graphically represented in the
MDS plot (Figure 4B), depicted the Triquis and Purépechas from the Lake and Valley as
RESULTS
158
the most differentiated Native groups, respectively; these were probably influenced by
cultural and geographic isolation, and the small effective population size of these groups,
promoting differentiation processes as random genetic drift. In agreement with this
differentiation, the Purépecha language has been described as an isolated dialect that is not
related with any other linguistic family from Mexico (INALI, 2008) (Figure 2). In addition,
some authors have suggested that the Purépechas received one or several migrations from
Peru that landed on the Pacific Coast in the Mexican state of Michoacán; because they
possess a distinctive archeology, anthropology, culture, and language (Ruiz, 1891; Peñaloza
et al., 2001). However, this assertion is difficult to confirm, bearing in mind that the
Purépechas rarely touched or lived on the coast; in addition, historical, archeological and
anthropological records are not sufficient for supporting this theory (Michelet, 2001;
Márquez-Joaquín, 2007). Conversely, Purépechas from the Mountain represented the
population with the third most quantity of private alleles (Figure 3), behind Mayas and
Triquis, respectively, without a significant increment in genetic diversity (Table II).
Although for STRs we could not apply a neutrality test to evaluate the excess of private
alleles with respect to the mutation-drift equilibrium expectation, it has been demonstrated
that the excess of private alleles is a consequence of population amalgamation (Chakraborty
et al., 1988), and particularly this effect has been observed in Native American populations
by means of mitochondrial DNA (mtDNA), implying recurrent and high levels of gene
flow (Fuselli, 2003). Concurrently, AMOVA test demonstrated significant differences
among Purépecha populations, suggesting genetic heterogeneity (Table IV). In addition,
preliminary studies of Native American paternal lineages defined by the mutation M3
(Páez-Riberos et al., 2006), allowed the proposal that the even distribution of Purépecha Y-
STR haplotypes throughout the network joining tree including different Native Mexican
RESULTS
159
groups is a consequence of the pre-Columbian multiethnic origin of this Native group
rather than of European admixture (via Mestizos). Similarly, mtDNA-haplogroups have
revealed that Purépechas present an intermediate position between two clusters in a
principal components plot (Peñaloza-Espinoza et al., 2007). In brief, these results are in
agreement with the hypothesis that Purépechas is an ancient and cystic group in their own
territory that, once it was shaped by admixture between Chichimecas and local Nahuas
previously living in western Mesoamerica, most of the Purépecha group –in general–
remained in the same place and had low admixture with other Mesoamerican groups
(Jiménez-Moreno, 1948; Schöndube, 1996; Michelet, 1996, 2001). However, important
differences in pre-Hispanic gene flow could exist between geographical regions, as
observed in the Purépechas-Mountain population sample with respect to those of the Valley
and Lake (Table II; Figure 3). Finally, to explain the present genetic background of this
group, the recent Purépecha gene flow should not be disregarded, considering that census
data (2000–2005) recorded a total of 1,498 Purépecha speakers living in Michoacán state
migrated mainly to the states of Jalisco, Baja California, and Mexico, and to the U.S.A.
(INEGI, 2007).
Mayas
In agreement with their same linguistic affiliation within the Maya-Totonaco group,
Mayanse stock, and Maya family, the small and non-significant FST values indicate that
Yucatec Mayas were not genetically differentiated from Huastecos and Choles (Figure 2;
Table III). However, Huastecos showed significant differences from Choles, inducing the
significant differentiation among the three Maya groups (Table IV), probably attributable to
the higher genetic differentiation of Huastecos, and to recent gene flow that Choles have
received from other ethnic groups (probably Highlands central groups), and/or from
RESULTS
160
Mexican Mestizos (Alejos-García and Martínez-Sánchez, 2007). This non-differentiation
between Huastecos and Yucatec Mayas is important because is in agreement with the
hypothesis that Huastecos could represent an ancestral Maya group that separated and
remained in the Huasteca zone during migrations occurring 3,000 ybp (Ekholm, 1944).
Concurrently, the non-differentiation between the Maya groups (from Yucatán and Choles
from Campeche) from Otomíes could be indicative of gene flow among these central and
southeastern Native groups, as a consequence of multiple human movements and
arrangements throughout Mesoamerica since the fall of Teotihuacan up to the Early Post-
Classic age (1,200–700 ybp), especially in the central highlands and Maya region (Nalda,
2005). This controversial theory of Toltec migration to Yucatán is supported by historical,
archeological, pictography, social, and political organization, as well as the religion and
militarism present in peninsular Mayas (Morley, 1946). In this context, based on 9 STR
data, we can infer the cited Toltec migration to Yucatán could have increased the gene
diversity in Mayas, in agreement with the largest number of private alleles estimated for
Mayas (Figure 3), and with the elevated migration rate estimated in this work for these
Native groups from central and southeastern regions of Mexico (Nm = 38.8). Similarly, Y-
linked markers have displayed an elevated migration rate throughout these regions (Nm =
24.76), that could explain the relative homogeneity observed among Native groups from
Mesoamerica (Rangel-Villalobos et al., 2008). Additionally, the influence of gene flow on
Native groups from southeastern Mexico is supported by archeological references
concerning pre-Columbian Mayas, who carried out several migration stages especially
during the Late Classic and Early Post-Classic age (Nalda, 2005). In fact, multiple dates
have catalogued this age as a “dynamic era” of Maya history (Soustelle, 1993; Nalda, 2005;
Schmidt, 2007; Ibarra-Rivera et al., 2008).
RESULTS
161
Triquis
Triquis had the lowest average of genetic diversity (h = 0.6953), and the most distant
MDS-plot position, presenting significant FST values with the majority of Native Mexican
groups, suggesting that additional and/or more profound genetic differentiation processes
have occurred in this population (i.e., inbreeding, founder effect, etc.). However, Triquis
had the largest number of private alleles, only after that of the Mayas, suggesting they also
could have received gene flow from Native groups, but different to that received by Mayas
and Purépechas. Demographic data indicate that the total Triqui population throughout the
Mexican territory is relatively small (∼25,000 inhabitants), and recently a certain fraction
has migrated to the States of Morelos, Veracruz, and Sonora, and to Mexico City, in
addition to the U.S.A (Lewin-Fisher and Sandoval-Cruz, 2007). Particularly, the Triqui
territory of the Lower Region (that belongs to the San Juan Copala, the origin of the
population sample) is a small town with limited communication with Mexican Mestizos or
nearby native groups (i.e. Mixtecos), aided by their rugged geographic location in an steep,
difficult-to-access mountainous region. In addition, they have a cultural commitment to
maintain their language and traditions, and limited confidence in persons from the outside
(Huerta-Ríos, 1995; Lewin-Fisher and Sandoval-Cruz, 2007). Therefore, both geographic
and cultural aspects have operated simultaneously, probably since pre-Columbian times, to
shape the current differentiation of this Native group.
Conclusion
The CODIS-STR data here obtained validate the use of these markers for human
identification purposes in these Native Mexican groups. A significant differentiation of
Triquis and Purépechas from Valley and Lake was demonstrated, attributable to their
RESULTS
162
relative geographic and cultural isolation. Although a relative homogeneity was detected
among Mesoamerican groups, particularly those inferred with higher European admixture,
the large interpopulational variability rendered it impossible to shape consistent population
clusters, stressing the importance of serial founder effect and genetic drift to depict their
genetic relationships. Also, geographic and/or linguistic elements constituted a limited tool
for explaining their current genetic relationships, presumably due to the complex historic
and demographic events of the human populations from Mesoamerica, both prior to and
after the Spanish Contact.
Acknowledgments
We thank to all the volunteers who apportioned blood samples for this study, to the
anonymous reviewers for valuable comments to the manuscript, and to the Consejo
Nacional de Ciencia y Tecnología (CONACyT) for fellowship to G. M-C, and for the
research grant N° 48710 to H. R-V.
Literature cited
Alejos-García J, Martínez-Sánchez NE. 2007. Choles. México: CDI, Inc. 47p.
Alves C, Gusmão L, López-Parra AM, Soledad Mesa M, Amorim A, Arroyo-Pardo E.
2005. STR allelic frequencies for an African population sample (Equatorial Guinea)
using AmpFlSTR Identifiler and Powerplex 16 kits. Forensic Sci Int 148:239-42.
Bamshad M, Wooding S, Salisbury BA, Stephens JC. 2004. Deconstructing the relationship
between genetics and race. Nat Rev Genet 5:598-609.
Barrot C, Sánchez C, Ortega M, González-Martín A, Brand-Casadevall C, Gorostiza A,
Huguet E, Corbella J, Gené M. 2005. Characterization of three Amerindian populations
RESULTS
163
from Hidalgo State (Mexico) by 15 STR-PCR polymorphisms. Int J Legal Med
119:111-5.
Bertorelle G, Barbujani G. 1995. Analysis of DNA diversity by spatial autocorrelation.
Genetics 140:811-19.
Bonilla C, Gutierrez G, Parra EJ, Kline C, Shriver MD. 2005. Admixture analysis of a rural
population of the state of Guerrero, Mexico. Am J Phys Anthropol 128:861-69.
Bortolini MC, Salzano FM, Thomas MG, Stuart S, Nasanen SP, Bau CH, Hutz MH,
Layrisse Z, Petzl-Erler ML, Tsuneto LT, Hill K, Hurtado AM, Castro-de-Guerra D,
Torres MM, Groot H, Michalski R, Nymadawa P, Bedoya G, Bradman N, Labuda D,
Ruiz-Linares A. 2003. Y-chromosome evidence for differing ancient demographic
histories in the Americas. Am J Hum Genet 73:524-39.
Bosch E, Calafell F, Pérez-Lezaun A, Clarimón J, Comas D, Mateu E, Martínez-Arias R,
Morera B, Brakez Z, Akhayat O, Sefiani A, Hariti G, Cambon-Thomsen A, Bertranpetit
J. 2000. Genetic structure of north-west Africa revealed by STR analysis. Eur J Hum
Genet 8:360-66.
Buentello-Malo L, Peñaloza-Espinosa RI, Loeza F, Salamanca-Gómez F, Cerda-Flores
RM. 2003. Genetic structure of seven Mexican indigenous populations based on five
polymarker loci. Am J Hum Biol 5:23-8.
Calzada P, Suárez I, García S, Barrot C, Sánchez C, Ortega M, Mas J, Huguet E, Corbella
J, Gené M. 2005. The Fang population of Equatorial Guinea characterized by 15 STR-
PCR polymorphisms. Int J Legal Med 119(2):107-110.
Camacho M.V., Benito C., Figueiras A.M. 2007. Allelic frequencies of the 15 STR loci
included in the AmpFlSTR Identifiler PCR Amplification Kit in an autochthonous
sample from Spain, Forensic Sci Int 173:241–5.
RESULTS
164
Cerda-Flores RM, Budowle B, Jin L, Barton SA, Deka R, Chakraborty R. 2002. Maximum
likelihood estimates of admixture in Northeastern Mexico using 13 short tandem repeat
loci. Am J Hum Biol 14:429-39.
Chakraborty R, Smouse PE, Neel JV. 1988. Population amalgamation and genetic
variation: observations on artificially agglomerated tribal populations of Central and
South America. Am J Hum Genet 43:709–25.
Cisneros IH. 2004. Situación de los pueblos indígenas en México. En: Derechos humanos
de los pueblos indígenas en México. México: CDHDF. 9p.
Dupanloup I, Schneider S, Excoffier L. 2002. A simulated annealing approach to define the
genetic structure of populations. Mol Ecol 11:2571-81.
Duverger C. 2007. El primer mestizaje, la clave para entender el pasado mesoamericano.
México: Santillana, Inc. 740p.
Evett IW, Weir BS. 1998. Interpreting DNA evidence; statistical genetics for forensic
scientists. Sinauer Associates, Inc., Sunderland, MA. 79p.
Ekholm GF. 1944. Excavations at Tampico and Panuco in the Huasteca, México. Nueva
York: Anthropological Papers of the American Museum of Natural History. v. 38. 5p.
Excoffier L, Laval G, Schneider S. 2005. Arlequin ver. 3.0: An integrated software package
for population genetics data analysis. Evol Bioinform Online 1:47-50.
Fuselli S, Tarazona-Santos E, Dupanloup I, Soto A, Luiselli D, Pettener D. 2003.
Mitochondrial DNA Diversity in South America and the Genetic History of Andean
Highlanders. Mol Biol Evol 20:1682-91.
Gamero JJ, Romero JL, González JL, Arufe MI, Cuesta MI, Corte-Real F, Carvalho M,
Anjos MJ, Vieira DN, Vide MC. 2000. A study on ten short tandem repeat systems:
African immigrant and Spanish population data. Forensic Sci Int 110:167-77.
RESULTS
165
González-Martín A, Barrot C, Ortega M, Brant-Casadevall C, Moreno P, Rangel-Villalobos
H, Gorostiza A, Huguet E, Corbella J, Gene M. 2004. Variabilidad genética y mestizaje
en una comunidad indígena Otomí, México. Actas XIII Congreso de la Sociedad
Española de Antropología Biológica: 553-62.
González-Martín A, Gorostiza A, Rangel-Villalobos H, Acunha V, Barrot C, Sánchez C,
Ortega M, Gené M, Calderón R. 2008. Analyzing the genetic structure of the Tepehua
in relation to other neighbouring Mesoamerican populations. A study based on allele
frequencies of STR markers. Am J Hum Biol 20:605-13.
Gordon RG. 2005. Ethnologue: Languages of the World, Fifteenth edition. Dallas, Tex.:
SIL International. Online version: http://www.ethnologue.com/.
Gorostiza A, González-Martín A, Ramírez CL, Sánchez C, Barrot C, Ortega M, Huguet E,
Corbella J, Gené M. 2007. Allele frequencies of the 15 AmpF/STR Identifiler loci in
the population of Meztitlán (Estado de Hidalgo), México. Forensic Sci Int 166:230-32.
Hey J. 2005. On the number of New World founders: a population genetic portrait of the
peopling of the Americas. PLoS Biol 3:e193.
Huerta Ríos C. 1995. Los triquis. En: Etnografía contemporánea de los pueblos indígenas
de México, región Pacífico Sur. México: INI. 24p.
Ibarra-Rivera L, Mirabal S, Regueiro MM, Herrera RJ. 2008. Delineating genetic
relationships among the Maya. Am J Phys Anthropol 135:329-47.
INEGI. 2005. Instituto Nacional de Estadística Geografía e Informática. México
http://www.inegi.gob.mx
INEGI. 2007. Instituto Nacional de Estadística, Geografía e Informática. “Estadística a
propósito del día internacional de las poblaciones indígenas”. Datos de hablantes de la
lengua Purépecha.
RESULTS
166
http://www.inegi.gob.mx/inegi/contenidos/espanol/prensa/Contenidos/estadisticas/2007
/purepecha07.pdf
INALI. 2008. Instituto Nacional de Lenguas Indígenas. México http://www.inali.gob.mx
Jiménez-Moreno W. 1948. Historia antigua de la zona tarasca. México: Sociedad Mexicana
de Antropología, México. p. 146-55.
Kitchen A, Miyamoto MM, Mulligan CJ. 2008. A three-stage colonization model for the
peopling of the Americas. PLoS ONE 3:e1596.
Kirchhoff P. 1956. “Relación de Michoacán como fuente para la historia de la sociedad y
cultura tarascas”. En: reproducción facsímil del Ms C IV 5 de El Escorial con
transcripción, introducción y notas por José Tudela, Madrid, Aguilar. 3p.
Lewin-Fisher P, Sandoval Cruz F. 2007. Triquis de Oaxaca. México: CDI, Inc. 47p.
Lewis PO, Zaykin D. 2001. Genetic Data Analysis (GDA): Computer program for the
analysis of allelic data. Version 1.0 (d16c). Programa disponible por los autores en
internet, http://lewis.eeb.uconn.edu/lewishome/software.html.
Licea-Cadena RA, Rizzo-Juárez RA, Muñiz-Lozano E, Páez-Riberos LA, Rangel-
Villalobos H. 2006. Population data of nine STRs of Mexican-Mestizos from Veracruz
(Central South-Eastern, Mexico). Leg Med 8:251-2.
Luna-Vazquez A, Vilchis-Dorantes G, Aguilar-Ruiz MO, Bautista-Rivas A, Rojo-Nava
AL, Rios-Barrios E, Rangel-Villalobos H. 2005. Population data for 15 loci (Identifiler
Kit) in a sample from the Valley of Mexico. Leg Med 7:331-3.
Liu H, Prugnolle F, Manica A, Balloux F. 2006. A geographically explicit genetic model of
worldwide human-settlement history. Am J Hum Genet 79:230-7.
Mao X, Bigham AW, Mei R, Gutierrez G, Weiss KM, Brutsaert TD, Leon-Velarde F,
Moore LG, Vargas E, McKeigue PM, Shriver MD, Parra EJ. 2007. Genome-wide
RESULTS
167
admixture mapping panel for Hispanic/Latino Populations. Am J Hum Genet 80:1171-
8.
Márquez-Joaquín P. 2007. ¿Tarascos o Purhépechas? Voces sobre antiguas y nuevas
discusiones en torno al gentilicio michoacano. Universidad Michoacana de San Nicolás
de Hidalgo/Universidad Intercultural indígena de Michoacán/El Colegio de Michoacán.
Fondo Editorial Morevallado.
Martínez-González LJ, Martínez-Espin E, Fernández-Rosado F, Moguel MA, Entrala C,
Álvarez JC, Lorente JA, Budowle B. 2005. Mexican population data on fifteen STR
loci (Identifiler kit) in a Chihuahua (North Central Mexico) sample. J Forensic Sci
50:236-8.
Michelet D. 1996. El origen del reino tarasco protohistórico: la cuenca de Zacapu.
Arqueología Mexicana 4:24-7.
Michelet D. 2001. La zona occidental en el posclásico. En: editorial Porrua. Historia
Antigua de México. México. México: INAH e IIA (UNAM). 38p.
Miller SA, Dykes DD, Polesky HF. 1988. A simple salting out procedure for extracting
DNA from human nucleated cell. Nucleic Acids Res 16:1215-6.
Morley SG. 1946. The Ancient Maya. Stanford University Press, Stanford.
Nalda E. 2005. Clásico Terminal (750-1050 D.C.) y Posclásico en el área México maya:
Colapso y reacomodos. Arqueología mexicana 13: 30-9.
Páez-Riberos LA, Muñoz-Valle JF, Figuera LE, Nuño-Arana I, Sandoval-Ramírez L,
González-Martín A, Ibarra B, Rangel-Villalobos H. 2006. Y-linked haplotypes in
Amerindian chromosomes from Mexican populations: genetic evidence to the dual
origin of the Huichol tribe. Leg Med 8:220-5.
RESULTS
168
Peñaloza-Espinoza RI, Delgado P, Arenas-Aranda D, Barrientos C, Buentello-Malo L,
Loeza F, Salamanca F. 2001. (AC)n dinucleotide repeat polymorphism in 5' β-globin
gene in Native and Mestizo Mexican populations. Hum Biol. 73:885-90.
Peñaloza-Espinosa RI, Arenas-Aranda D, Cerda-Flores RM, Buentello-Malo L, González-
Valencia G, Torres J, Álvarez B, Mendoza I, Flores M, Sandoval L, Loeza F, Ramos I,
Muñoz L, Salamanca F. 2007. Characterization of mtDNA haplogroups in 14 Mexican
indigenous populations. Hum Biol 79:313-20.
Pérez-Lezaun A, Calafell F, Mateu E, Comas D, Ruiz-Pacheco R, Bertranpetit J. 1997..
Microsatellite variation and the differentiation of modern humans. Hum Genet 99:1-7.
Ramachandran S, Deshpande O, Roseman CC, Rosenberg NA, Feldman MW, Cavalli-
Sforza LL. 2005. Support from the relationship of genetic and geographic distance in
human populations for a serial founder effect originating in Africa. PNAS 102:15942-7.
Rangel-Villalobos H, Rivas F, Sandoval L, Ibarra B, Garcìa-Carvajal ZY, Cantú JM,
Figuera LE. 2000. Genetic variation among four Mexican Populations (Huichol,
Purépecha, Tarahumara, and Mestizo) revealed by two VNTRs and four STR’s. Hum
Biol 72:983-95.
Rangel-Villalobos H, Muñoz-Valle JF, González-Martín A, Gorostiza A, Magaña MT,
Páez-Riberos LA. 2008. Genetic admixture, relatedness, and structure patterns among
Mexican populations revealed by the Y-chromosome. Am J Phys Anthropol 135:448-
61.
Rubi-Castellanos R, Anaya-Palafox M, Mena-Rojas E, Bautista-España D, Muñoz-Valle
JF, Rangel-Villalobos H. 2008. Genetic data of 15 autosomal STRs (Identifiler kit) of
three Mexican Mestizo population samples from the states of Jalisco (West), Puebla
(Center), and Yucatan (Southeast). FSI:Genetics 3(3):e71-6
RESULTS
169
Rubi-Castellanos R, Martínez-Cortés G, Muñoz-Valle JF, González-Martín A, Cerda-
Flores R, Anaya-Palafox M, Rangel-Villalobos H. 2009. Pre-Hispanic Mesoamerican
demography approximates the present-day ancestry of Mestizos throughout the territory
of Mexico. Am J Phys Anthropol 135(4):448-61.
Ruz MH. 2006. Mayas, primera parte. México: CDI, Inc. 91p.
Ruiz E. 1891. Michoacán. Paisajes, tradiciones y leyendas. Oficina Tipográfica de la
Secretaria de Fomento, México.
Sahoo S, Kashyap VK. 2005. Influence of language and ancestry on genetic structure of
contiguous populations: a microsatellite based study on populations of Orissa. BMC
Genet 6:4.
Schmidt Peter J. 2007. Los toltecas de Chichén Itzá, Yucatán. Arqueología mexicana
15:64-8.
Sánchez C, Barrot C, Ortega M, González-Martin A, Gorostiza A, Corbella J, Huguet E,
Gené M. 2005. Genetic diversity of 15 STRs in Choles from Northeast of Chiapas
(Mexico). J Forensic Sci 50:1-3.
Schöndube OB. 1996. Los tarascos. Arqueología Mexicana 4:14-21.
Soustelle J. 1993. La familia otomí-pame del México central. México: CEMCA/FCE. 40p.
Szpiech ZA, Jakobsson M, RosenbergNA. 2008. ADZE: a rarefaction approach for
counting alleles private to combinations of populations. Bioinformatics 24:2498-2504.
Tereba A. 1999. Tools for analysis of population statistics. Profiles in DNA. Promega
Corp. The evaluation of forensic evidence.
Walsh PS, Metzger DA, Higuchi R, 1991. Chelex 100 as a medium for simple extraction of
DNA for PCR-based typing forensic material. Biotechniques10:506-13.
RESULTS
170
Wang S, Lewis CM, Jakobsson M, Ramachandran S, Ray N, Bedoya G, Rojas W, Parra
MV, Molina JA, Gallo C, Mazzotti G, Poletti G, Hill K, Hurtado AM, Labuda D, Klitz
W, Barrantes R, Bortolini MC, Salzano FM, Petzl-Erler ML, Tsuneto LT, Llop E,
Rothhammer F, Excoffier L, Feldman MW, Rosenberg NA, Ruiz-Linares A. 2007.
Genetic variation and population structure in Native Americans. PLoS Genet 3:e185.
Wang S, Ray N, Rojas W, Parra MV, Bedoya G, Gallo C, Poletti G, Mazzotti G, Hill K,
Hurtado AM, Camrena B, Nicolini H, Klitz W, Barrantes R, Molina JA, Freimer NB,
Bortolini MC, Salzano FM, Petzl-Erler ML, Tsuneto LT, Dipierri JE, Alfaro EL,
Bailliet G, Bianchi NO, Llop E, Rothhammer F, Excoffier L, Ruiz-Linares A. 2008.
Geographic patterns of genome admixture in Latin American Mestizos. PLoS Genet
4:e1000037.
Wright S. 1951. The genetical structure of populations. Ann Eugen 15:323-54.
Zhang W, Dolan ME. 2008. Exploring the Evolutionary History of the Differentially
Expressed Genes between Human Populations: Action of Recent Positive Selection.
Evol Bioinform Online 15:171-9.
Zhivotovsky LA, Rosenberg NA, Feldman MW. 2003. Features of Evolution and
Expansion of Modern Human, Inferred from Genome-wide Microsatellites Markers.
Am J Hum Genet 72:1171-86.
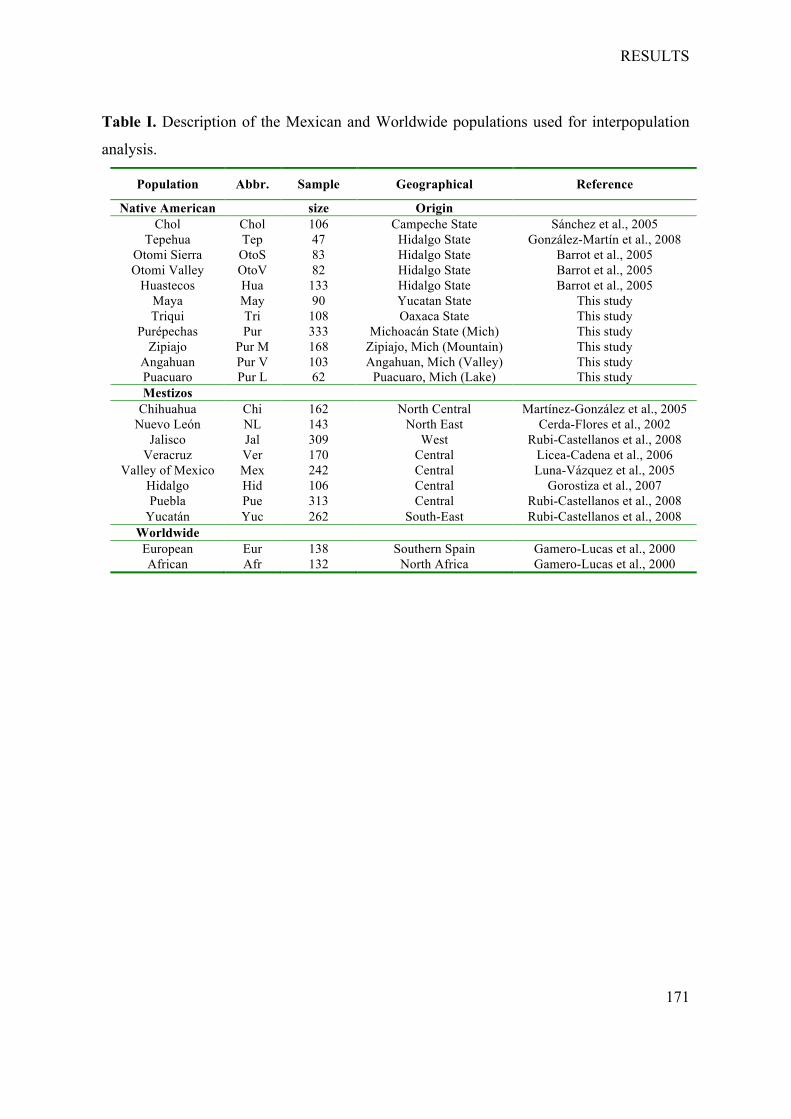
RESULTS
171
Table I. Description of the Mexican and Worldwide populations used for interpopulation
analysis.
Population Abbr. Sample Geographical Reference
Native American size Origin Chol Chol 106 Campeche State Sánchez et al., 2005
Tepehua Tep 47 Hidalgo State González-Martín et al., 2008 Otomi Sierra Otomi Valley
OtoS OtoV
83 82
Hidalgo State Hidalgo State
Barrot et al., 2005 Barrot et al., 2005
Huastecos Hua 133 Hidalgo State Barrot et al., 2005 Maya May 90 Yucatan State This study Triqui Tri 108 Oaxaca State This study
Purépechas Zipiajo
Angahuan
Pur Pur M Pur V
333 168 103
Michoacán State (Mich) Zipiajo, Mich (Mountain) Angahuan, Mich (Valley)
Puacuaro Pur L 62 Puacuaro, Mich (Lake)
This study This study This study This study
Mestizos Chihuahua Chi 162 North Central Martínez-González et al., 2005
Nuevo León NL 143 North East Cerda-Flores et al., 2002 Jalisco Jal 309 West Rubi-Castellanos et al., 2008
Veracruz Ver 170 Central Licea-Cadena et al., 2006 Valley of Mexico Mex 242 Central Luna-Vázquez et al., 2005
Hidalgo Hid 106 Central Gorostiza et al., 2007 Puebla Pue 313 Central Rubi-Castellanos et al., 2008
Yucatán Yuc 262 South-East Rubi-Castellanos et al., 2008 Worldwide European Eur 138 Southern Spain Gamero-Lucas et al., 2000 African Afr 132 North Africa Gamero-Lucas et al., 2000
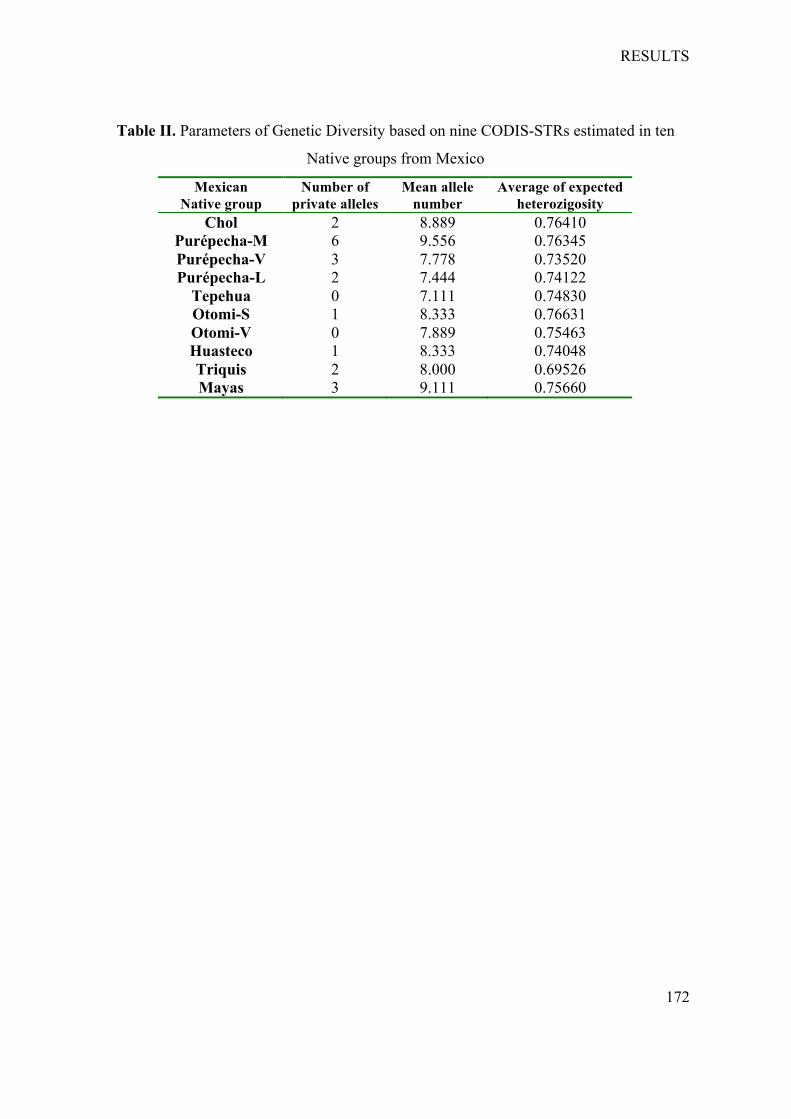
RESULTS
172
Table II. Parameters of Genetic Diversity based on nine CODIS-STRs estimated in ten
Native groups from Mexico
Mexican Native group
Number of private alleles
Mean allele number
Average of expected heterozigosity
Chol 2 8.889 0.76410 Purépecha-M 6 9.556 0.76345 Purépecha-V 3 7.778 0.73520 Purépecha-L 2 7.444 0.74122
Tepehua 0 7.111 0.74830 Otomi-S 1 8.333 0.76631 Otomi-V 0 7.889 0.75463 Huasteco 1 8.333 0.74048 Triquis 2 8.000 0.69526 Mayas 3 9.111 0.75660
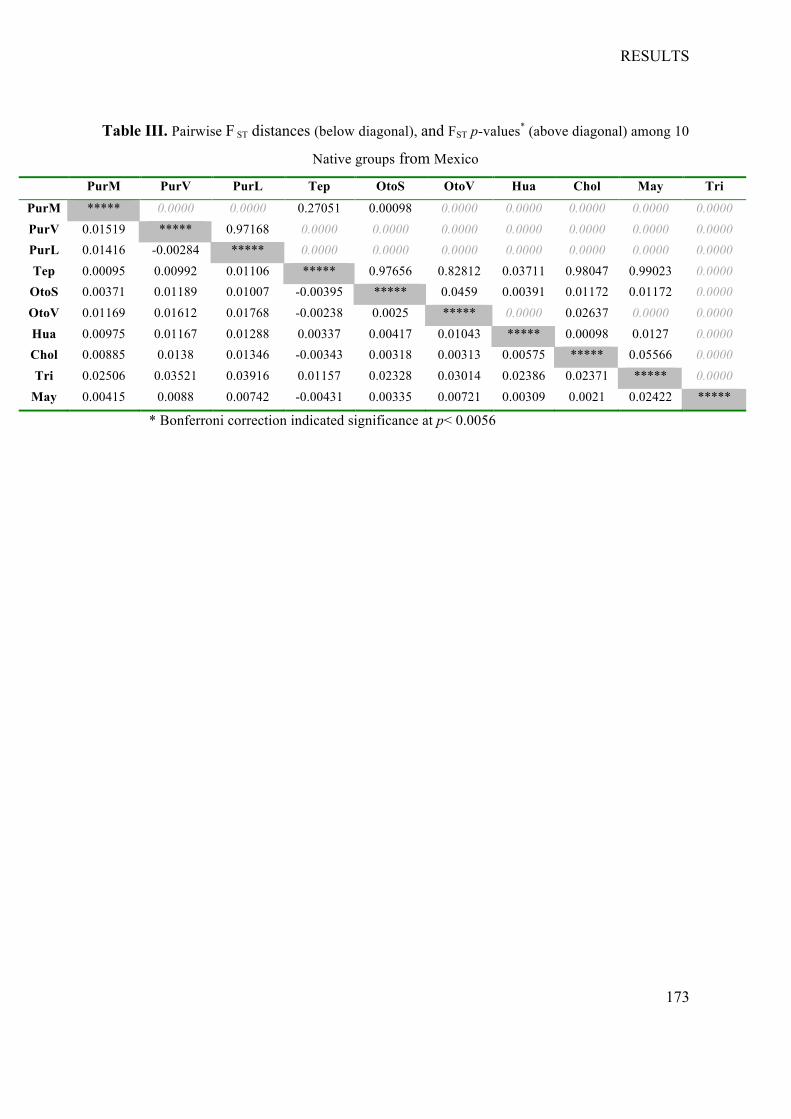
RESULTS
173
Table III. Pairwise F ST distances (below diagonal), and FST p-values* (above diagonal) among 10
Native groups from Mexico
PurM PurV PurL Tep OtoS OtoV Hua Chol May Tri
PurM ***** 0.0000 0.0000 0.27051 0.00098 0.0000 0.0000 0.0000 0.0000 0.0000 PurV 0.01519 ***** 0.97168 0.0000 0.0000 0.0000 0.0000 0.0000 0.0000 0.0000 PurL 0.01416 -0.00284 ***** 0.0000 0.0000 0.0000 0.0000 0.0000 0.0000 0.0000 Tep 0.00095 0.00992 0.01106 ***** 0.97656 0.82812 0.03711 0.98047 0.99023 0.0000
OtoS 0.00371 0.01189 0.01007 -0.00395 ***** 0.0459 0.00391 0.01172 0.01172 0.0000 OtoV 0.01169 0.01612 0.01768 -0.00238 0.0025 ***** 0.0000 0.02637 0.0000 0.0000 Hua 0.00975 0.01167 0.01288 0.00337 0.00417 0.01043 ***** 0.00098 0.0127 0.0000 Chol 0.00885 0.0138 0.01346 -0.00343 0.00318 0.00313 0.00575 ***** 0.05566 0.0000 Tri 0.02506 0.03521 0.03916 0.01157 0.02328 0.03014 0.02386 0.02371 ***** 0.0000
May 0.00415 0.0088 0.00742 -0.00431 0.00335 0.00721 0.00309 0.0021 0.02422 *****
* Bonferroni correction indicated significance at p< 0.0056
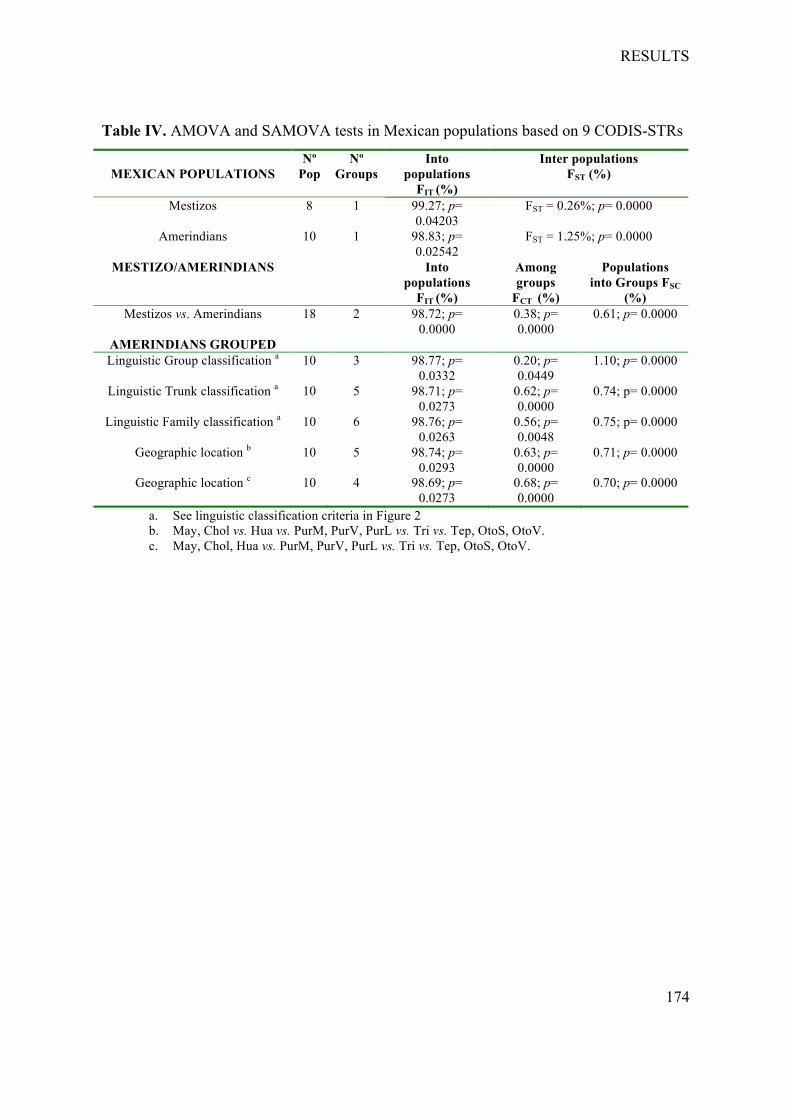
RESULTS
174
Table IV. AMOVA and SAMOVA tests in Mexican populations based on 9 CODIS-STRs
MEXICAN POPULATIONS
Nº Pop
Nº Groups
Into populations
FIT (%)
Inter populations FST (%)
Mestizos 8 1 99.27; p= 0.04203
FST = 0.26%; p= 0.0000
Amerindians 10 1 98.83; p= 0.02542
FST = 1.25%; p= 0.0000
MESTIZO/AMERINDIANS Into populations
FIT (%)
Among groups
FCT (%)
Populations into Groups FSC
(%) Mestizos vs. Amerindians 18 2 98.72; p=
0.0000 0.38; p= 0.0000
0.61; p= 0.0000
AMERINDIANS GROUPED Linguistic Group classification a 10 3 98.77; p=
0.0332 0.20; p= 0.0449
1.10; p= 0.0000
Linguistic Trunk classification a 10 5 98.71; p= 0.0273
0.62; p= 0.0000
0.74; p= 0.0000
Linguistic Family classification a 10 6 98.76; p= 0.0263
0.56; p= 0.0048
0.75; p= 0.0000
Geographic location b 10 5 98.74; p= 0.0293
0.63; p= 0.0000
0.71; p= 0.0000
Geographic location c 10 4 98.69; p= 0.0273
0.68; p= 0.0000
0.70; p= 0.0000
a. See linguistic classification criteria in Figure 2 b. May, Chol vs. Hua vs. PurM, PurV, PurL vs. Tri vs. Tep, OtoS, OtoV. c. May, Chol, Hua vs. PurM, PurV, PurL vs. Tri vs. Tep, OtoS, OtoV.
RESULTS
175
FIGURE LEGENDS Figure 1. Geographical locations of Mexican populations studied herein, and those used
for comparison purposes. The previously published populations are indicated by black
stars (Mestizos) and black points (Native American groups). Black triangles indicate
populations reported in this study.
Figure 2. Linguistic classification of Native Mexican populations used for
interpopulational analyses (Gordon, 2005; INALI, 2008). Underlined groups are
reported on in this study.
Figure 3. Mean number of private alleles with standardized sample sizes (g) in Native
Mexican populations obtained with the program ADZE.
Figure 4. Multidimensional scaling (MDS) plot based on normalized FST distances
between (A) Mestizos, Native American, and Ancestral populations (European and
African); (B) only Native American groups. See Table I for description of
abbreviations.
Figure 5. Overlapped plots representing correlation between geographical and genetic
distances (black lines) and the AIDA autocorrelogram (grey lines). Correlation plot
displays the following three groups: Purépechas, Otomíes, Huastecos, and Tepehuas
(black circles); Triquis (black squares), and Mayas and Choles (black triangles). In the
autocorrelogram, filled diamonds indicate significant p-values (p <0.05).
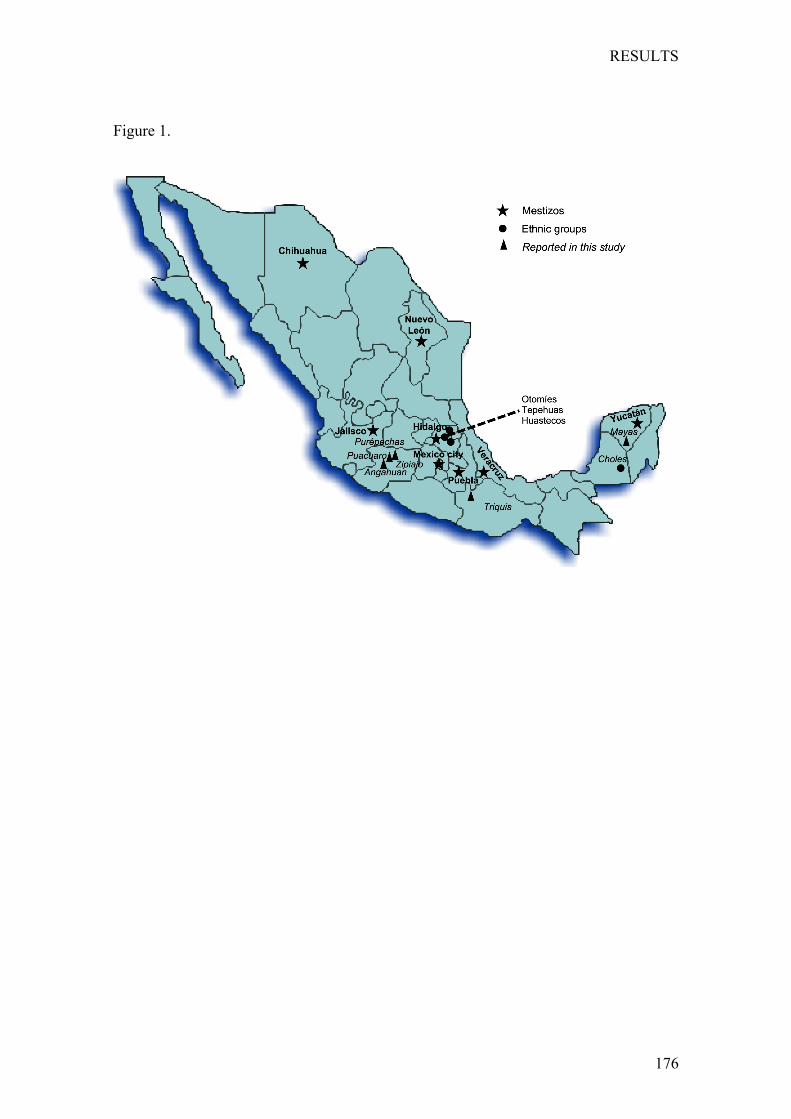
RESULTS
176
Figure 1.
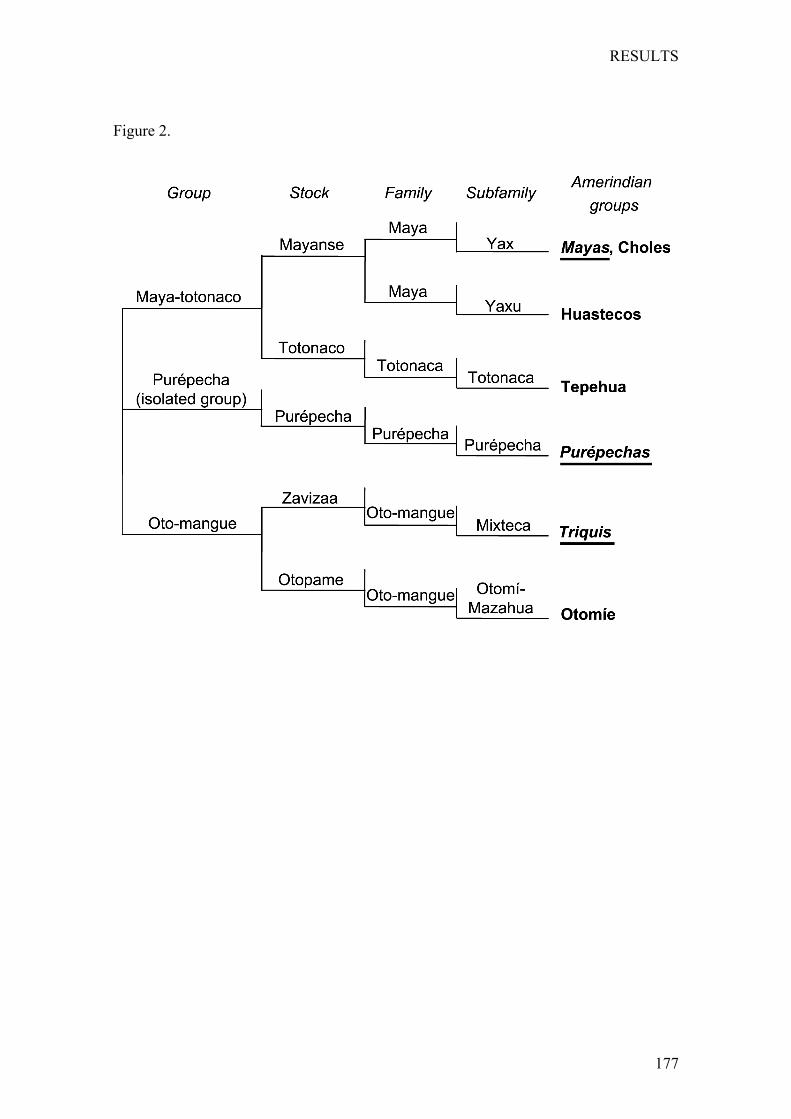
RESULTS
177
Figure 2.
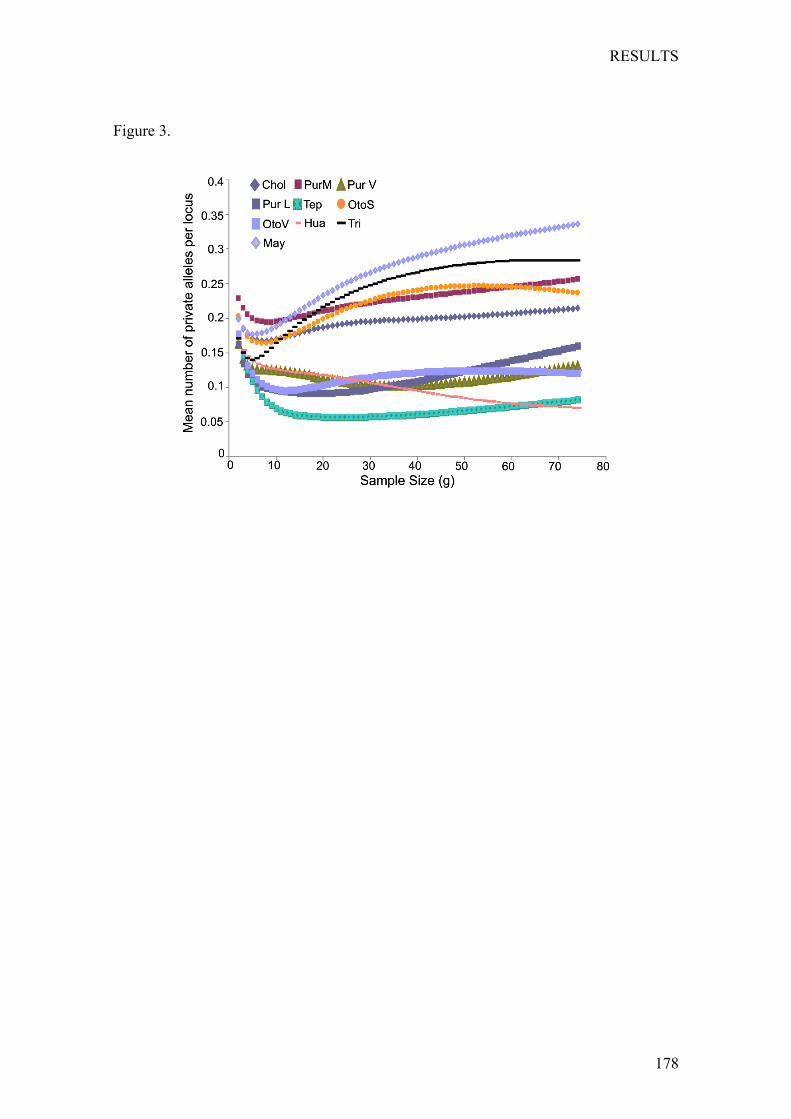
RESULTS
178
Figure 3.
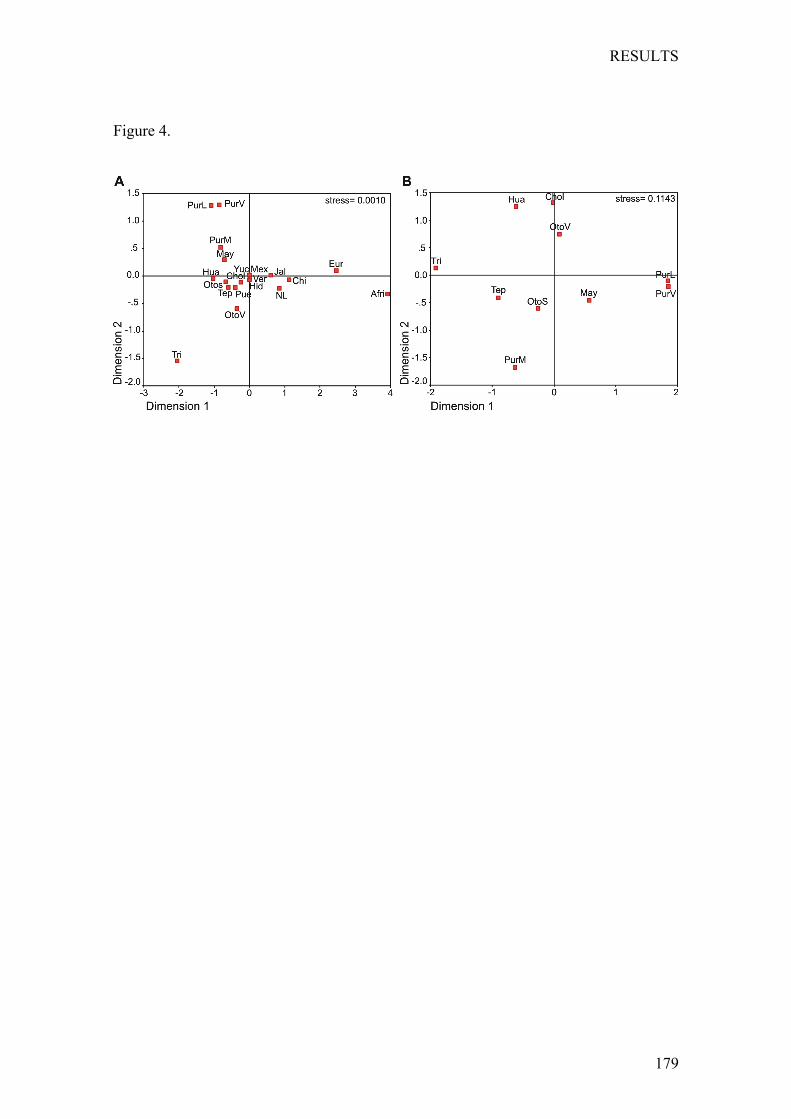
RESULTS
179
Figure 4.
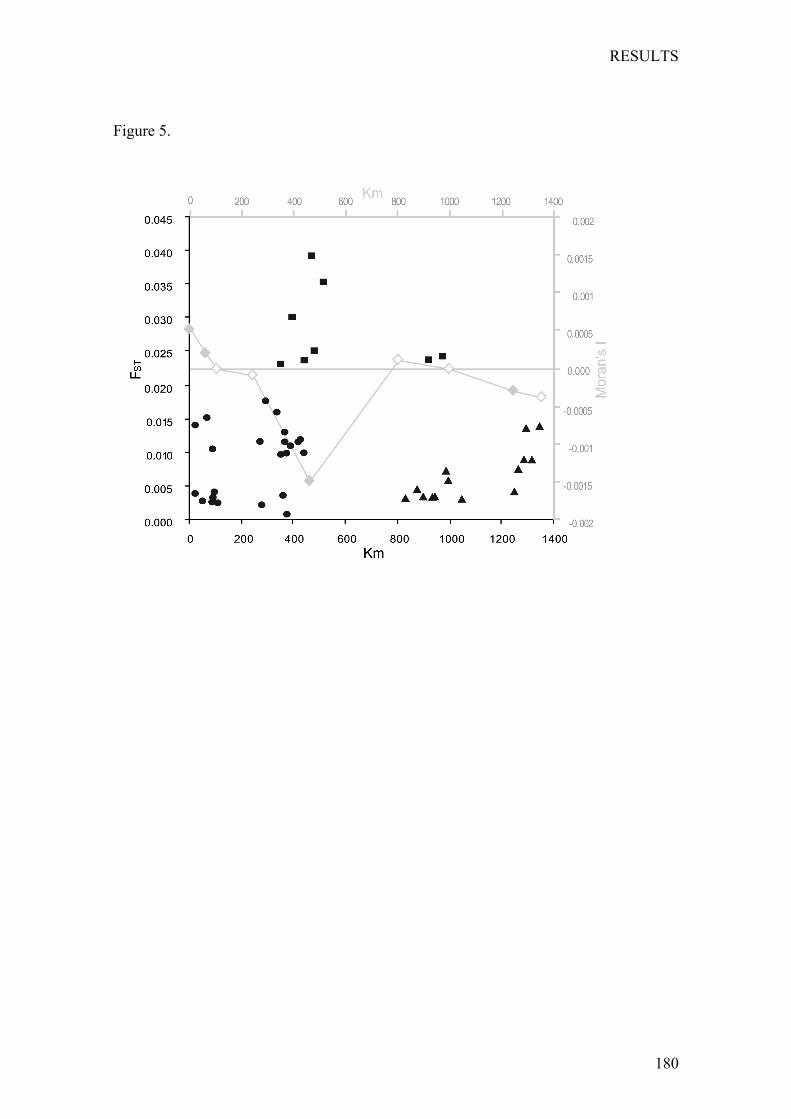
RESULTS
180
Figure 5.
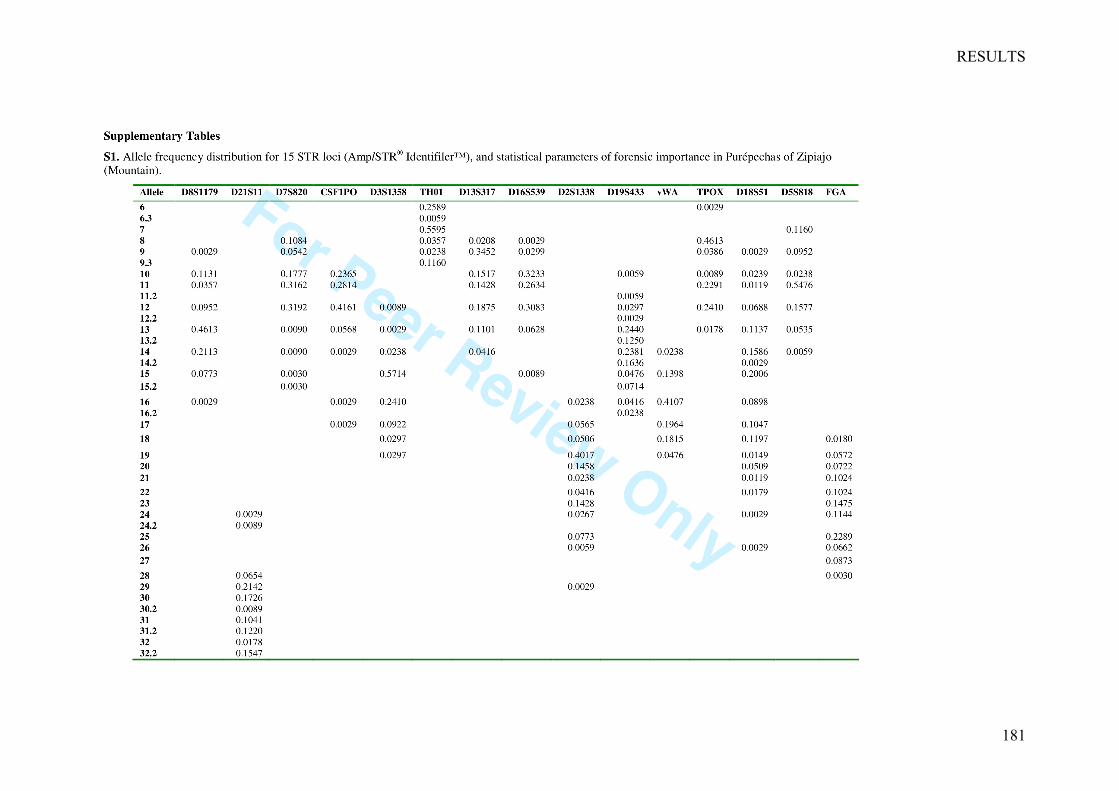
RESULTS
181
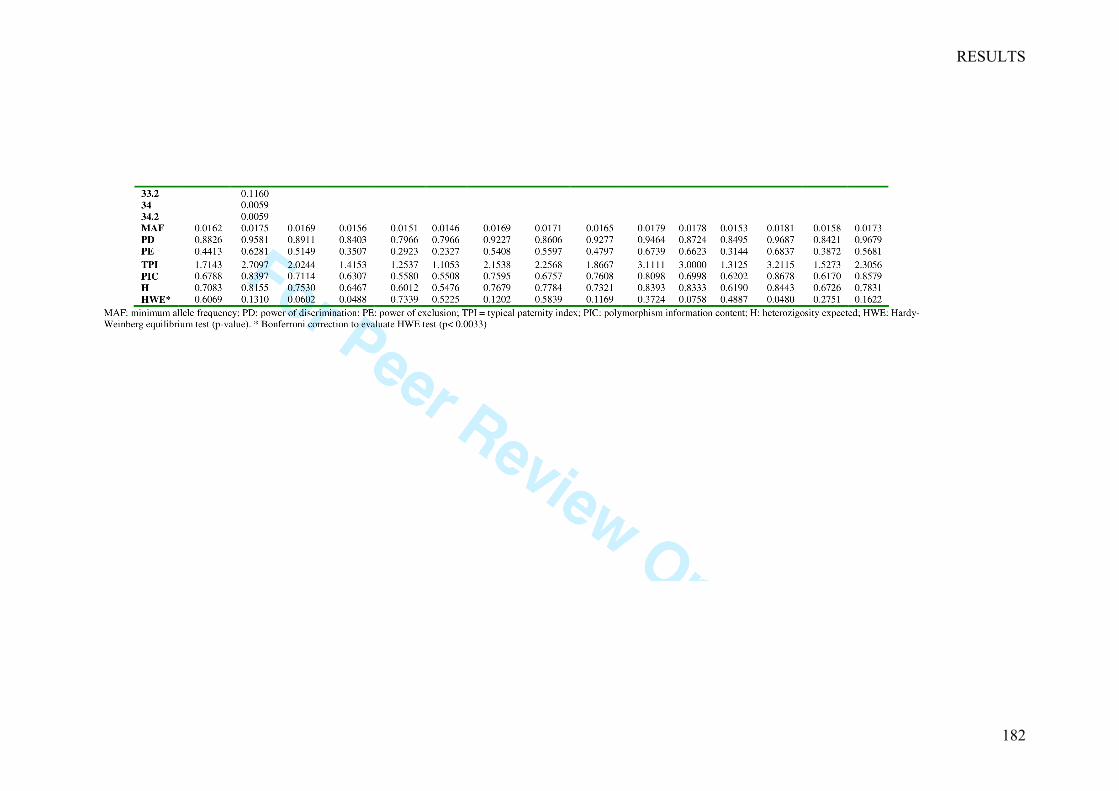
RESULTS
182
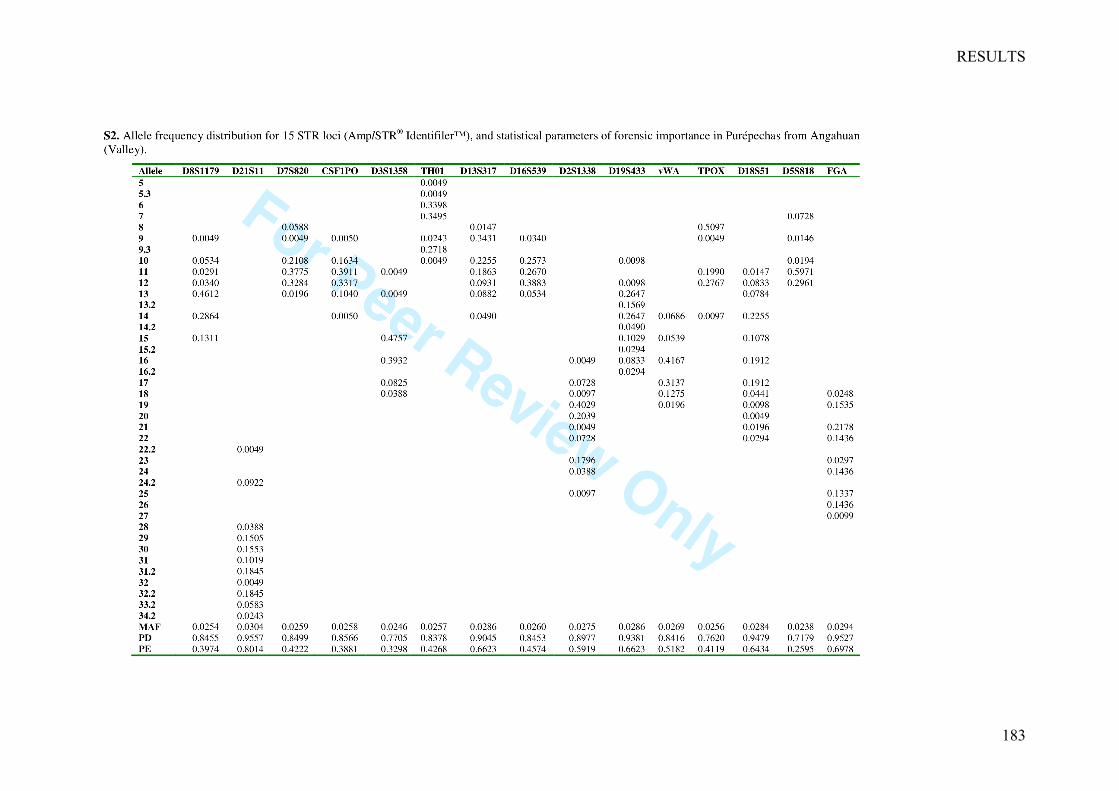
RESULTS
183
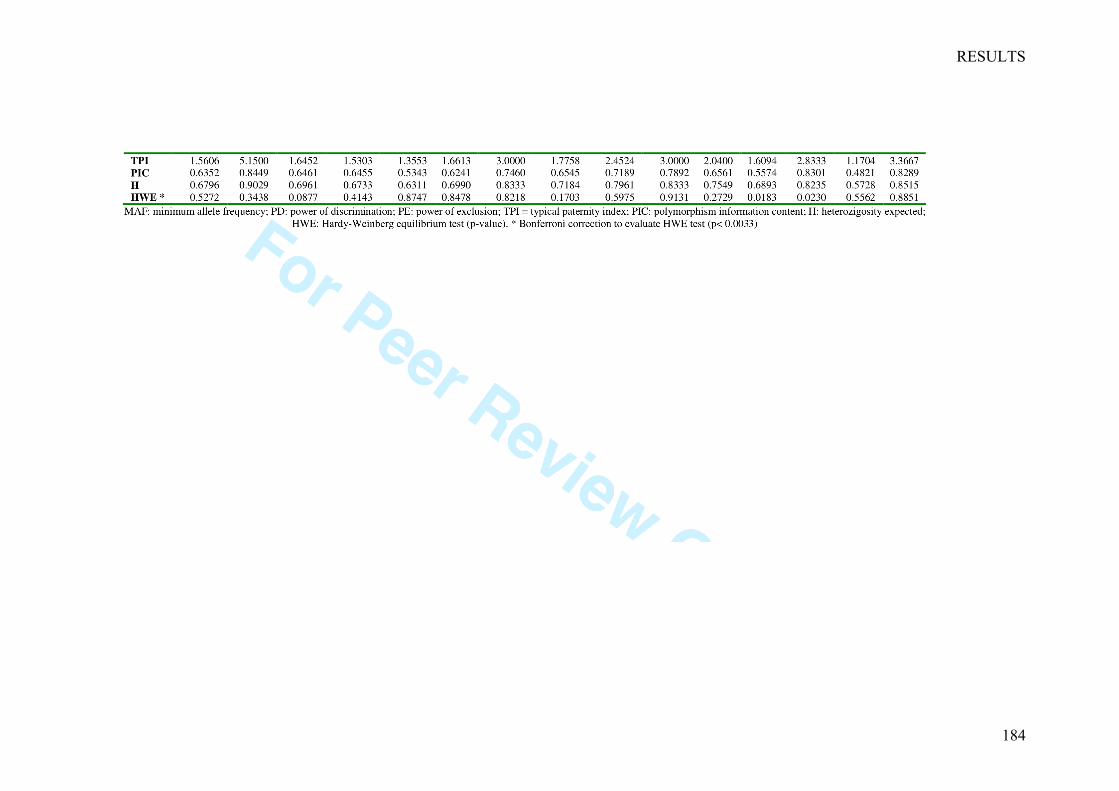
RESULTS
184
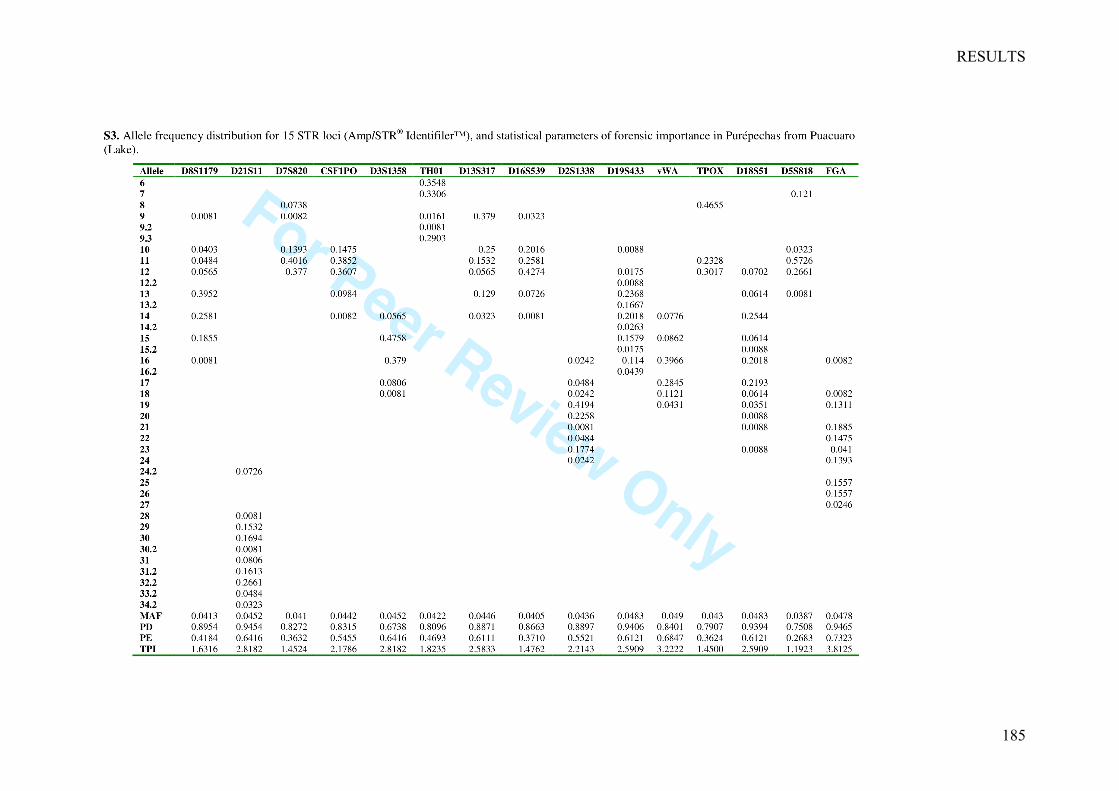
RESULTS
185
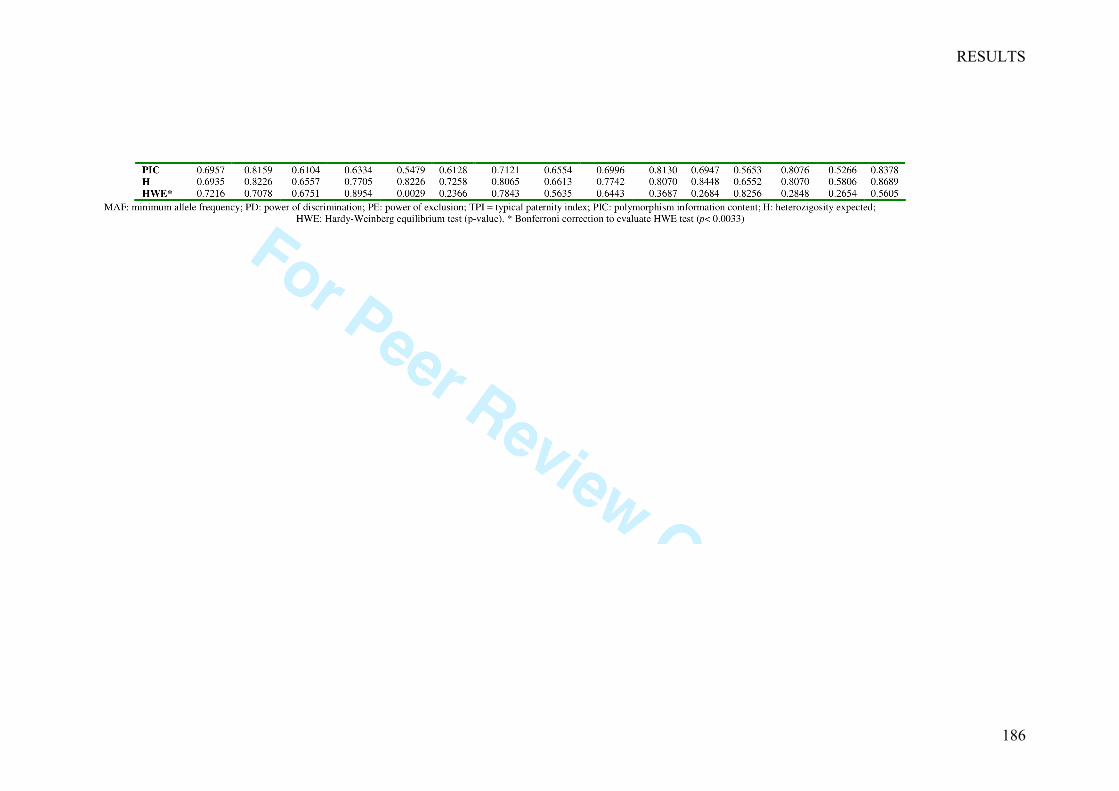
RESULTS
186
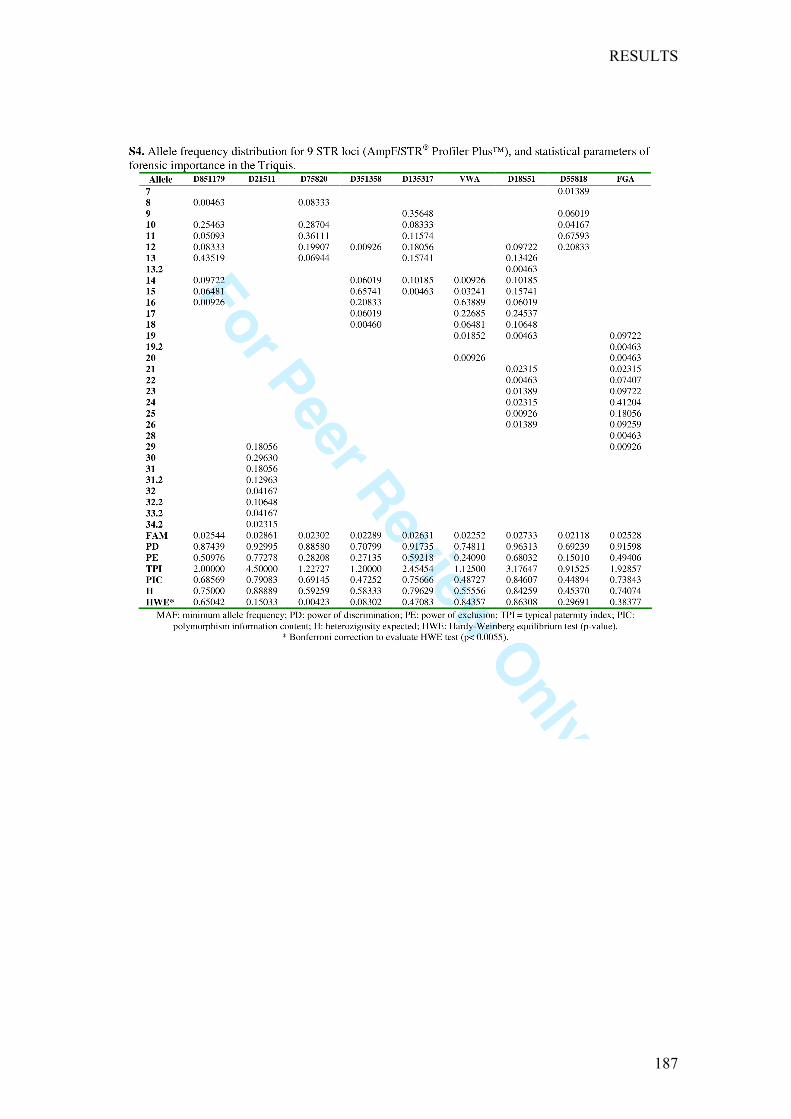
RESULTS
187
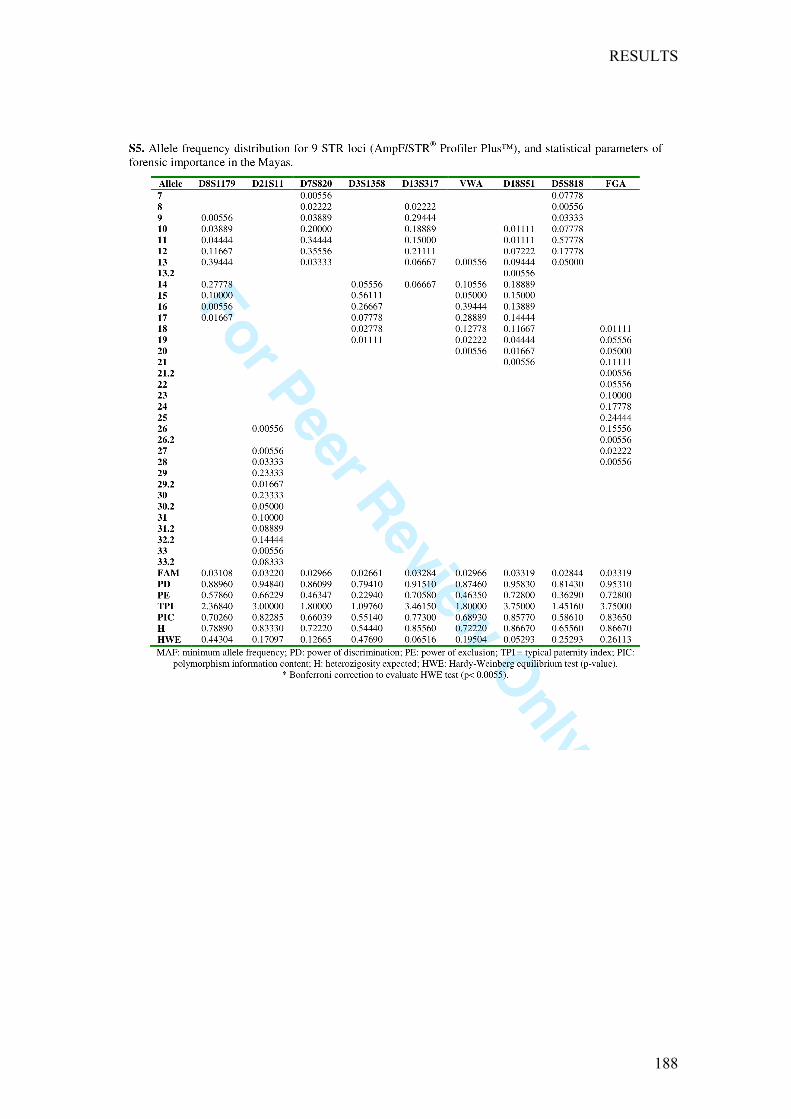
RESULTS
188

RESULTS
189


191
DISCUSSION

DISCUSSION
193
In the present thesis I have comprehensively studied several Native Mexican
populations from a molecular anthropological point of view: from carrying out field
work, collecting ethnographic data, to analyzing genetic markers such as mtDNA, Y-
chromosome and autosomal STRs. The results encompass three different but closely
related studies that share the main goal of carrying out an interdisciplinary research,
within the Molecular Anthropology theoretical framework, to better understand
Mexican indigenous and Native American genetic diversity. The main findings will be
shortly discussed below.
Insideanindigenouscommunity:Ethnographyandfieldwork
Mexico is a country characterized by its high cultural and linguistic diversity as a result
of the presence of numerous native or indigenous groups. Nowadays Mexico is mainly
inhabited by two distinct population groups: the so-called Mestizo and the Native
Indigenous Mexican groups defined by having specific languages, cultural traits,
ethnicity, oral history, and customs as part of their cultural complexity. Despite the fact
that the proportion of the Mestizo population represents nearly 95% of the Mexican
population (INEGI 2007), the Native component is present in the daily life of each of
the 32 states conforming the Mexican territory, which covers 1,972,550 km2 (the 15th
largest country in the world and the 5th largest country in the Americas).
Motivated by such high cultural and ethnic diversity, one of my main purposes was to
understand indigenous diversity from a closer point of view: field work. Initially, I
carried out different seasons of field work during the years 2000 to 2002, particularly
with the Triqui indigenous group in southern Mexico (San Juan Copala, Oaxaca). The
understanding of how an indigenous community works is a valuable tool, not only
because of their cultural, folkloric, and demographic information, but also because it
offers a window to the understanding of their beliefs, cosmovision, and how they
understand their own origin and past history. Some of the ethnographic techniques
consisted in; 1) extensive bibliographic research, 2) direct and indirect observation, 3)
personal and community interviews, 4) surveys, 5) informative talks (about my work
within the group), 6) anthropometric measures, and finally 7) population sampling.
DISCUSSION
194
The anthropometric results that we obtained were associated with the current nutritional
status of the Triqui population, which gave us interesting insights into their growth
process in relation to their socioeconomic status (see Results section: chapter 1).
Thanks to the special and particular interest that the Triqui group had on knowing more
about their own history and “the record that was in their blood” (literal expression
cited by them), my anthropological interest went beyond the ethnographic work, leading
me to the fascinating field of population genetics.
OnthegeneticdiversityofMexicanPopulations
The case of the Triqui population may be an example that shares sociological
similarities with other indigenous communities throughout the country, but Mexican
indigenous populations are also characterized by large geographical and demographic
differences. Some populations, such as the Triqui indigenous group, are extremely
isolated. Others groups may show extensive admixture in some cases, especially those
located in urban areas, while some others exhibit remarkably different demographic
histories so that they are more or less likely to have contributed to the genetic pool of
the admixed population of present day Mexico. Thus, the relationship between the past
and present history is reflected in the actual genetic composition. Molecular genetic
markers are extremely useful to investigate not only the genetic composition across the
indigenous and Mestizo populations, but also to trace maternal and paternal lineages
back in time, allowing us to answer pivotal questions about human history.
OnthemtDNADiversity
In chapter 2 of the Results section, I present the results from a genetic study performed
with 11 native populations from throughout Mexico. We showed how the sampled
populations are mostly composed by Native American haplotypes. The main findings
are the followings.
1) The majority of the mtDNAs of autochthonous Mexicans individuals can be
allocated to one of the four most common Native American haplogroups (A2, B2, C1
and D1) (Achilli et al. 2008); 2) The absence of X2 in our samples supports the idea that
DISCUSSION
195
Mesoamerica played an important role during the colonization of the continent,
restricting this haplogroup to the northernmost lands and shaping the diversity of the
other founder haplogroups on their way down to Central and South America; 3) These
results show a common origin of Native American populations, including our Mexican
groups, with an extensive isolation and genetic drift, which might have produced an
extreme heterogeneity in their haplogroup patterns; 4) A correlation between linguistic
classification and their mtDNA gene pool was not found; 5) The northernmost groups
Tarahumara and Pima show a certain degree of genetic differentiation from the rest,
these populations are outside of the Mesoamerican area; and finally 6) Despite the
mtDNA represents just a small fraction of the human genome, it has demonstrated once
more to be a useful marker to trace back demographic events in human population
history.
OntheYchromosomeDiversity
In chapter 3 (Results section) I present the male counterpart of the female-based
analyses of mtDNA in the same panel of population samples. The main findings are the
followings.
1) A substantial presence of non-Native American male lineages in our sample set was
observed. The Y-chromosome haplogroup composition of Native Mexican populations
shows a remarkable contrast with our previous findings from the mtDNA results for the
same populations, in which almost only Native female lineages were found (Sandoval et
al. 2009); 2) We found an excess of European (and to a lesser extent African) Y-
chromosome haplotypes and a higher proportion of mitochondrial haplotypes of Native
American origin, suggesting a strong female Native American and male European and
African sex bias contribution, consistent with previous studies performed in different
Amerindian populations. 3) These results are congruent with the demographic history of
the studied populations, in which Nahuas Xochimilco showed the highest proportion of
European haplotypes. This population represents an urban sample within Mexico City,
which is likely to have been largely exposed to multiple admixture events, whereas
Triqui and Pima are two indigenous groups well known to be characterized by their
geographic and cultural isolation; 4) The finding of African Y-chromosome haplotypes
in our samples, although not as frequent as haplotypes of other origin, is not neglectable
DISCUSSION
196
since it indicates that the involuntary migration of Africans through slave trade appears
to have left a clear trace in Native Mexican populations proximal to coastal routes (e.g.
Purepecha); 5) Pimas and Tarahumara, the northernmost samples, exhibit the lowest
diversity values, which is in total agreement with our previous observations based on
mtDNA diversity of the same set of samples (Sandoval et al. 2009), these groups are the
only sampled populations outside the cultural geographic region of Mesoamerica, 6) A
extensive heterogeneity, lack of genetic structure at a continental scale and a lack of
correlation between linguistic classification and Y-chromosome diversity were
observed, and 7) Being our estimated age of Q haplogroups around 6,436 (+913) ybp,
we can confirm that all the Q haplogroups found in our sample set belong to the main
Native American Q-M3 lineage.
Similar results, in which no concordance based on maternally inherited genetic systems
and those based on paternally inherited genetic systems, were observed in a previous
study that we performed in extant Mestizo Cuban populations (see Appendix 1). In that
study we documented clear evidence for significant differences in the geographic
patterning of mtDNA diversity versus Y-chromosome diversity, differences that may be
related to different male and female demographic histories (Bamshad et al. 1998;
Hammer et al. 1998; Seielstad et al. 1998).
OnSTRvariation
In chapter 4 of the Results section, I present the results of CODIS-STRs system, which
is normally used with forensic purposes. These markers have been scarcely analyzed in
Native Mexican groups, both for human identification or anthropological purposes. The
main objective was to analyze the genetic relationships and population structure among
three Native Mexican groups from Mesoamerica; Purepechas from Valley and Lake,
Triquis and Mayas. Our results showed that the majority of Native groups were not
differentiated, except for Triquis and Purepechas (Valley and Lake), attributable to their
relative geographic and cultural isolation. Conversely, Purepechas-Mountain presented
an elevated number of rare alleles, suggesting recurrent gene flow into this group. It was
interesting that Huastecos and Yucatec Mayas were not differentiated, which is in
agreement with the archeological hypothesis that Huastecos represent an ancestral Maya
group. We suggest that European admixture has increased the similarity among Native
DISCUSSION
197
Mexican groups, and again like aforementioned studies (Chapters 2 and 3) a geographic
and linguistic clustering was not found within the Native groups, which stresses the
importance of serial founder effect and/or genetic drift to depict their present genetic
relationships.
With this kind of studies is possible to establish an interrelation between the past and
present of the genetic and demographic histories of each native population. In fact we
can make some inferences about the population density, the original genetic inputs that
clearly shape the current genetic populations not only of indigenous groups but also the
Mestizos. Some insights obtained from this works, have been show that the major
concentration of the native Mexican groups were from the central to south of the
country, according with the historical records (pictography, codices and oral), where the
main pre-Columbian empires were established mainly from the central-south part of
Mexico, delineating the Mesoamerica cultural area.
ConcludingRemarks
Although the mtDNA and the Y-chromosome represent only a small part of the whole
human genome, they are still highly informative and both have the capacity to be
reliable tools for molecular anthropology studies.
Our results both support previous general observations and offer a more detailed view
of the genetic composition of Native Mexican populations, particularly with respect to
their uniparental lineage histories.
This work stresses the importance of conducting complementary studies in order to
contrast the information offered by analyzing mtDNA (allowing to trace maternal
lineages), and that offered by genotyping markers on its natural counterpart, the Y-
chromosome (which allows to trace back paternal lineages).
The present thesis has the main goal of offering an interdisciplinary view, and to
contribute not only to the comprehension of Mexican diversity but also to the historical
reconstruction of important cultural areas like Mesoamerica, in order to provide insights
into the Peopling of the Americas.
DISCUSSION
198
In this respect, one of the main findings obtained from the mtDNA analysis is the
absence of X2 haplogroup in Mexican native populations, which can define a
geographical frontier in its distribution, confirming that Mesoamerica played an
important role during the colonization. The presence of the other four native
haplogroups in the Mexican native groups, allows us to make some inferences about the
possible migratory routes of the first settles of the continent.
Further analysis of Y-lineages and mtDNA-lineages present in the Americas will
require more microsatellites as well as additional slowly evolving biallelic markers for
the former and complete mtDNA sequences of Native American, Siberian and East Asia
populations. This will be extremely useful to capture the entire genetic variability
spectrum in order to trace back the actual DNA tracks bearing particular founding
diversity. All this will lead scientists and the general community to have a better
understanding about the Native American origins and contribute to the reconstruction of
the human history of the American continent.

199
BIBLIOGRAPHY

BIBLIOGRAPHY
201
References Achilli A, Perego UA, Bravi CM, Coble MD, Kong QP, Woodward SR, Salas A,
Torroni A, Bandelt HJ (2008) The phylogeny of the four pan-American MtDNA haplogroups: implications for evolutionary and disease studies. PLoS ONE 3: e1764
Adovasio J, Pedler D (1997) Monte Verde and the antiquity of humankind in the Americas. Antiquity 71: 573-578
Aguilar-Moreno M (2004) A Handbook to Life in the Aztec World. Inc, USA Aguirre-Beltrán G (1989) La población negra de México, estudio etnohistórico. Fondo
de Cultura Económica, México. Altuna ME, Modesti NM, Demarchi DA (2006) Y-chromosomal evidence for a founder
effect in Mbya-guarani Amerindians from northeast Argentina. Hum Biol 78: 635-9
Anderson S, Bankier AT, Barrell BG, de Bruijn MH, Coulson AR, Drouin J, Eperon IC, Nierlich DP, Roe BA, Sanger F, Schreier PH, Smith AJ, Staden R, Young IG (1981) Sequence and organization of the human mitochondrial genome. Nature 290: 457-65
Andrews RM, Kubacka I, Chinnery PF, Lightowlers RN, Turnbull DM, Howell N (1999) Reanalysis and revision of the Cambridge reference sequence for human mitochondrial DNA. Nat Genet 23: 147
Ascunce MS, Gonzalez-Oliver A, Mulligan CJ (2008) Y-chromosome variability in four Native American populations from Panama. Hum Biol 80: 287-302
Bailliet G, Ramallo V, Muzzio M, Garcia A, Santos MR, Alfaro EL, Dipierri JE, Salceda S, Carnese FR, Bravi CM, Bianchi NO, Demarchi DA (2009) Brief communication: Restricted geographic distribution for Y-Q* paragroup in South America. Am J Phys Anthropol 140: 578-82
Bailliet G, Rothhammer F, Carnese FR, Bravi CM, Bianchi NO (1994) Founder mitochondrial haplotypes in Amerindian populations. Am J Hum Genet 55: 27-33
Ballinger SW, Schurr TG, Torroni A, Gan YY, Hodge JA, Hassan K, Chen KH, Wallace DC (1992) Southeast Asian mitochondrial DNA analysis reveals genetic continuity of ancient mongoloid migrations. Genetics 130: 139-52
Bamshad MJ, Watkins WS, Dixon ME, Jorde LB, Rao BB, Naidu JM, Prasad BV, Rasanayagam A, Hammer MF (1998) Female gene flow stratifies Hindu castes. Nature 395: 651-2
Bandelt HJ, Forster P, Sykes BC, Richards MB (1995) Mitochondrial portraits of human populations using median networks. Genetics 141: 743-53
Barrot C, Sanchez C, Ortega M, Gonzalez-Martin A, Brand-Casadevall C, Gorostiza A, Huguet E, Corbella J, Gene M (2005) Characterisation of three Amerindian populations from Hidalgo State (Mexico) by 15 STR-PCR polymorphisms. Int J Legal Med 119: 111-5
Barrot C, Simili C, Sanchez C, Brandt-Casadevall C, Gonzalez-Martin A, Xifro A, Ortega M, Huguet E, Corbella J, Gene M (2007) Haplotype frequencies of eight Y-chromosome short tandem repeats loci in four Amerindian populations (state of Hidalgo, Mexico). J Forensic Sci 52: 504-6
Belle EM, Landry PA, Barbujani G (2006) Origins and evolution of the Europeans' genome: evidence from multiple microsatellite loci. Proc Biol Sci 273: 1595-602
BIBLIOGRAPHY
202
Bergen AW, Wang CY, Tsai J, Jefferson K, Dey C, Smith KD, Park SC, Tsai SJ, Goldman D (1999) An Asian-Native American paternal lineage identified by RPS4Y resequencing and by microsatellite haplotyping. Ann Hum Genet 63: 63-80
Bernal V, Perez SI, Gonzalez PN, Diniz-Filho JA (2009a) Ecological and evolutionary factors in dental morphological diversification among modern human populations from southern South America. Proc Biol Sci
Bernal V, Perez SI, Gonzalez PN, Sardi ML, Pucciarelli HM (2009b) Spatial patterns and evolutionary processes in southern South America: A study of dental morphometric variation. Am J Phys Anthropol
Bianchi NO, Bailliet G, Bravi CM, Carnese RF, Rothhammer F, Martinez-Marignac VL, Pena SD (1997) Origin of Amerindian Y-chromosomes as inferred by the analysis of six polymorphic markers. Am J Phys Anthropol 102: 79-89
Bianchi NO, Catanesi CI, Bailliet G, Martinez-Marignac VL, Bravi CM, Vidal-Rioja LB, Herrera RJ, Lopez-Camelo JS (1998) Characterization of ancestral and derived Y-chromosome haplotypes of New World native populations. Am J Hum Genet 63: 1862-71
Boas F (1973 (1933)) Relations between north-west America and north-east Asia. In: D J (ed) The American Aborigines: Their Origin and Antiquity. Cooper Square Publ., New York, pp 357-370
Bolnick DA, Bolnick DI, Smith DG (2006) Asymmetric male and female genetic histories among Native Americans from Eastern North America. Mol Biol Evol 23: 2161-74
Bolnick DA, Shook BA, Campbell L, Goddard I (2004) Problematic use of Greenberg's linguistic classification of the Americas in studies of Native American genetic variation. Am J Hum Genet 75: 519-22
Bonatto SL, Salzano FM (1997a) Diversity and age of the four major mtDNA haplogroups, and their implications for the peopling of the New World. Am J Hum Genet 61: 1413-23
Bonatto SL, Salzano FM (1997b) A single and early migration for the peopling of the Americas supported by mitochondrial DNA sequence data. Proc Natl Acad Sci U S A 94: 1866-71
Bonilla C, Gutierrez G, Parra EJ, Kline C, Shriver MD (2005) Admixture analysis of a rural population of the state of Guerrero, Mexico. Am J Phys Anthropol 128: 861-9
Bortolini M, Salzano F (1996) mtDNA diversity analysis in Amerindians and other human populations -how different are they? Braz J Genet 19: 527-534
Bortolini MC, Salzano FM, Bau CH, Layrisse Z, Petzl-Erler ML, Tsuneto LT, Hill K, Hurtado AM, Castro-De-Guerra D, Bedoya G, Ruiz-Linares A (2002) Y-chromosome biallelic polymorphisms and Native American population structure. Ann Hum Genet 66: 255-9
Bortolini MC, Salzano FM, Thomas MG, Stuart S, Nasanen SP, Bau CH, Hutz MH, Layrisse Z, Petzl-Erler ML, Tsuneto LT, Hill K, Hurtado AM, Castro-de-Guerra D, Torres MM, Groot H, Michalski R, Nymadawa P, Bedoya G, Bradman N, Labuda D, Ruiz-Linares A (2003) Y-chromosome evidence for differing ancient demographic histories in the Americas. Am J Hum Genet 73: 524-39
Bosch E, Calafell F, Santos FR, Perez-Lezaun A, Comas D, Benchemsi N, Tyler-Smith C, Bertranpetit J (1999) Variation in short tandem repeats is deeply structured by genetic background on the human Y chromosome. Am J Hum Genet 65: 1623-38
BIBLIOGRAPHY
203
Bourgeois S, Yotova V, Wang S, Bourtoumieu S, Moreau C, Michalski R, Moisan JP, Hill K, Hurtado AM, Ruiz-Linares A, Labuda D (2009) X-chromosome lineages and the settlement of the Americas. Am J Phys Anthropol 140: 417-28
Bravi CM, Sans M, Bailliet G, Martinez-Marignac VL, Portas M, Barreto I, Bonilla C, Bianchi NO (1997) Characterization of mitochondrial DNA and Y-chromosome haplotypes in a Uruguayan population of African ancestry. Hum Biol 69: 641-52
Brown MD, Hosseini SH, Torroni A, Bandelt HJ, Allen JC, Schurr TG, Scozzari R, Cruciani F, Wallace DC (1998) mtDNA haplogroup X: An ancient link between Europe/Western Asia and North America? Am J Hum Genet 63: 1852-61
Brown WM (1980) Polymorphism in mitochondrial DNA of humans as revealed by restriction endonuclease analysis. Proc Natl Acad Sci U S A 77: 3605-9
Budowle B, Adamowicz M, Aranda XG, Barna C, Chakraborty R, Cheswick D, Dafoe B, Eisenberg A, Frappier R, Gross AM, Ladd C, Lee HS, Milne SC, Meyers C, Prinz M, Richard ML, Saldanha G, Tierney AA, Viculis L, Krenke BE (2005) Twelve short tandem repeat loci Y chromosome haplotypes: genetic analysis on populations residing in North America. Forensic Sci Int 150: 1-15
Buentello-Malo L, Penaloza-Espinosa RI, Loeza F, Salamanca-Gomez F, Cerda-Flores RM (2003) Genetic structure of seven Mexican indigenous populations based on five polymarker loci. Am J Hum Biol 15: 23-8
Campbell L (1977) American Indian languages: the historical linguistics of native America, New York
Campbell L (1997) American Indian Languages. Oxford Univ. Press, Oxford Campbell L, Kaufman T, Smith-Stark T (1986) Meso-America as a linguistic area.
Language 62: 530-558 Campbell L, Mithum M (1979) The Languages of Native America, Austin Cann RL, Stoneking M, Wilson AC (1987) Mitochondrial DNA and human evolution.
Nature 325: 31-6 Capelli C, Wilson JF, Richards M, Stumpf MP, Gratrix F, Oppenheimer S, Underhill P,
Pascali VL, Ko TM, Goldstein DB (2001) A predominantly indigenous paternal heritage for the Austronesian-speaking peoples of insular Southeast Asia and Oceania. Am J Hum Genet 68: 432-43
Carmack RM, Janine L G, Gary H G (1996) Legacy of Mesoamerica: The History and Culture of a Native American Civilization. Prentice Hall, New Jersey
Carvajal-Carmona LG, Soto ID, Pineda N, Ortiz-Barrientos D, Duque C, Ospina-Duque J, McCarthy M, Montoya P, Alvarez VM, Bedoya G, Ruiz-Linares A (2000) Strong Amerind/white sex bias and a possible Sephardic contribution among the founders of a population in northwest Colombia. Am J Hum Genet 67: 1287-95
Carvalho-Silva DR, Santos FR, Hutz MH, Salzano FM, Pena SD (1999) Divergent human Y-chromosome microsatellite evolution rates. J Mol Evol 49: 204-14
Casanova M, Leroy P, Boucekkine C, Weissenbach J, Bishop C, Fellous M, Purrello M, Fiori G, Siniscalco M (1985) A human Y-linked DNA polymorphism and its potential for estimating genetic and evolutionary distance. Science 230: 1403-6
Cavalli-Sforza L, Menozzi P, Piazza A (1994) The History and Geography of Human Genes. Princeton University Press, Princeton
Cerda-Flores RM, Budowle B, Jin L, Barton SA, Deka R, Chakraborty R (2002a) Maximum likelihood estimates of admixture in Northeastern Mexico using 13 short tandem repeat loci. Am J Hum Biol 14: 429-39
Cerda-Flores RM, Garza-Chapa R (1989) Variation in the gene frequencies of three generations of humans from Monterrey, Nuevo Leon, Mexico. Hum Biol 61: 249-61
BIBLIOGRAPHY
204
Cerda-Flores RM, Ramirez-Fernandez E, Garza-Chapa R (1987) Genetic admixture and distances between populations from Monterrey, Nuevo Leon, Mexico, and their putative ancestral populations. Hum Biol 59: 31-49
Cerda-Flores RM, Villalobos-Torres MC, Barrera-Saldana HA, Cortes-Prieto LM, Barajas LO, Rivas F, Carracedo A, Zhong Y, Barton SA, Chakraborty R (2002b) Genetic admixture in three Mexican Mestizo populations based on D1S80 and HLA-DQA1 loci. Am J Hum Biol 14: 257-63
Cerda-Flores RM, Villalobos-Torres MC, Barrera-Saldana HA, Cortes-Prieto LM, Barajas LO, Rivas F, Carracedo Á, Zhong Y, Barton SA, Chakraborty R (2002c) Genetic admixture in three Mexican Mestizo populations based on D1S80 and HLA-DQA1 loci. Am J Hum Biol 14: 257-63
Consortium YC (2002) A nomenclature system for the tree of human Y-chromosomal binary haplogroups. Genome Res 12: 339-48
Crawford M (1998a) The origin of Native Americans: evidence from archeological genetics. In: Press CU (ed), Cambridge
Crawford MH (1998b) The Origins of Native Americans. Cambridge Univ. Press, Cambridge, U.K.
Crossetti SG, Demarchi DA, Raimann PE, Salzano FM, Hutz MH, Callegari-Jacques SM (2008) Autosomal STR genetic variability in the Gran Chaco native population: Homogeneity or heterogeneity? Am J Hum Biol 20: 704-11
Chakraborty R, Weiss KM (1991) Genetic variation of the mitochondrial DNA genome in American Indians is at mutation-drift equilibrium. Am J Phys Anthropol 86: 497-506
Chinnery PF (2006) Mitochondrial DNA in Homo sapiens. In: Bandelt HJ, Macaulay V, Richards M (eds) Human mitochondrial DNA and the evolution of Homo sapiens. Springer, Berlin, pp 3-15.
Dalton R (2005) Scientists finally get their hands on Kennewick man. Nature 436: 10 Demarchi DA, Mitchell RJ (2004) Genetic structure and gene flow in Gran Chaco
populations of Argentina: evidence from Y-chromosome markers. Hum Biol 76: 413-29
Denaro M, Blanc H, Johnson MJ, Chen KH, Wilmsen E, Cavalli-Sforza LL, Wallace DC (1981) Ethnic variation in Hpa 1 endonuclease cleavage patterns of human mitochondrial DNA. Proc Natl Acad Sci U S A 78: 5768-72
Derenko MV, Grzybowski T, Malyarchuk BA, Dambueva IK, Denisova GA, Czarny J, Dorzhu CM, Kakpakov VT, Miscicka-Sliwka D, Wozniak M, Zakharov IA (2003) Diversity of mitochondrial DNA lineages in South Siberia. Ann Hum Genet 67: 391-411
Destro-Bisol G, Donati F, Coia V, Boschi I, Verginelli F, Caglia A, Tofanelli S, Spedini G, Capelli C (2004) Variation of female and male lineages in sub-Saharan populations: the importance of sociocultural factors. Mol Biol Evol 21: 1673-82
Dietrich MR (1998) Paradox and persuasion: negotiating the place of molecular evolution within evolutionary biology. J Hist Biol 31: 85-111
Dillehay TD (2000) The settlement of the Americas: a new prehistory. Perseus Books Group, New York
Dillehay TD, Ramirez C, Pino M, Collins MB, Rossen J, Pino-Navarro JD (2008) Monte Verde: seaweed, food, medicine, and the peopling of South America. Science 320: 784-6
Dixon JE (1999) Bones, Boats and Bison: Archeology and the first colonization of western North America, Albuquerque
BIBLIOGRAPHY
205
Dos Santos SE, Ribeiro-Rodrigues EM, Ribeiro-Dos-Santos AK, Hutz MH, Tovo-Rodrigues L, Salzano FM, Callegari-Jacques SM (2009) Autosomal STR analyses in native Amazonian tribes suggest a population structure driven by isolation by distance. Hum Biol 81: 71-88
Easton RD, Merriwether DA, Crews DE, Ferrell RE (1996) mtDNA variation in the Yanomami: evidence for additional New World founding lineages. Am J Hum Genet 59: 213-25
Elson JL, Turnbull DM, Howell N (2004) Comparative genomics and the evolution of human mitochondrial DNA: assessing the effects of selection. Am J Hum Genet 74: 229-38
Endicott P, Ho SY, Metspalu M, Stringer C (2009) Evaluating the mitochondrial timescale of human evolution. Trends Ecol Evol 24: 515-21
Erlich HA, Mack SJ, Bergstrom T, Gyllensten UB (1997) HLA class II alleles in Amerindian populations: implications for the evolution of HLA polymorphism and the colonization of the Americas. Hereditas 127: 19-24
Fagundes NJ, Kanitz R, Eckert R, Valls AC, Bogo MR, Salzano FM, Smith DG, Silva WA, Jr., Zago MA, Ribeiro-dos-Santos AK, Santos SE, Petzl-Erler ML, Bonatto SL (2008) Mitochondrial population genomics supports a single pre-Clovis origin with a coastal route for the peopling of the Americas. Am J Hum Genet 82: 583-92
Fagundes NJ, Ray N, Beaumont M, Neuenschwander S, Salzano FM, Bonatto SL, Excoffier L (2007) Statistical evaluation of alternative models of human evolution. Proc Natl Acad Sci U S A 104: 17614-9
Felix-Lopez XA, Arguello-Garcia R, Cerda-Flores RM, Penaloza-Espinoza RI, Buentello-Malo L, Estrada-Mena FJ, Ramos-Kuri M, Gomez FS, Arenas-Aranda DJ (2006) FMR1 CGG repeat distribution and linked microsatellite-SNP haplotypes in normal Mexican Mestizo and indigenous populations. Hum Biol 78: 579-98
Fiedel SJ (1992) Prehistory of the Americas, 2nd edn. Cambridge Univ. Press, Cambridge, U.K.
Forster P, Harding R, Torroni A, Bandelt HJ (1996) Origin and evolution of Native American mtDNA variation: a reappraisal. Am J Hum Genet 59: 935-45
Fuselli S, Tarazona-Santos E, Dupanloup I, Soto A, Luiselli D, Pettener D (2003) Mitochondrial DNA diversity in South America and the genetic history of Andean highlanders. Mol Biol Evol 20: 1682-91
Garrigan D, Hammer MF (2006) Reconstructing human origins in the genomic era. Nat Rev Genet 7: 669-80
Goncalves VF, Carvalho CM, Bortolini MC, Bydlowski SP, Pena SD (2008) The phylogeography of African Brazilians. Hum Hered 65: 23-32
Gonzalez-Andrade F, Roewer L, Willuweit S, Sanchez D, Martinez-Jarreta B (2009) Y-STR variation among ethnic groups from Ecuador: Mestizos, Kichwas, Afro-Ecuadorians and Waoranis. Forensic Sci Int Genet 3: e83-91
Gonzalez-Andrade F, Sanchez D, Gonzalez-Solorzano J, Gascon S, Martinez-Jarreta B (2007) Sex-specific genetic admixture of Mestizos, Amerindian Kichwas, and Afro-Ecuadorans from Ecuador. Hum Biol 79: 51-77
Gonzalez-Andrade F, Sanchez D, Martinez-Jarreta B, Budowle B (2008) Y-chromosome STR haplotypes in three different population groups from Ecuador (South America). J Forensic Sci 53: 512-4
BIBLIOGRAPHY
206
Gonzalez-Jose R, Bortolini MC, Santos FR, Bonatto SL (2008) The peopling of America: craniofacial shape variation on a continental scale and its interpretation from an interdisciplinary view. Am J Phys Anthropol 137: 175-87
Goodman M, Tashian RE, Tashian JH (1976) Progress in Molecular Anthropology. Current Anthropology 17: 491
Gorodezky C, Alaez C, Vazquez-Garcia MN, de la Rosa G, Infante E, Balladares S, Toribio R, Perez-Luque E, Munoz L (2001) The genetic structure of Mexican Mestizos of different locations: tracking back their origins through MHC genes, blood group systems, and microsatellites. Hum Immunol 62: 979-91
Gorostiza A, Gonzalez-Martin A, Ramirez CL, Sanchez C, Barrot C, Ortega M, Huguet E, Corbella J, Gene M (2007) Allele frequencies of the 15 AmpF/Str Identifiler loci in the population of Metztitlan (Estado de Hidalgo), Mexico. Forensic Sci Int 166: 230-2
Green LD, Derr JN, Knight A (2000) mtDNA affinities of the peoples of North-Central Mexico. Am J Hum Genet 66: 989-98
Green T, Cochran B, Fenton T, Woods J, Titmus G, Tieszen L, Davies MA, Miller S (1998) The Buhl Burial: A Paleo Indian Woman From Southern Idaho. American Antiquity 63: 437-456
Greenberg JH (1996) The "Greenberg" hypothesis. Science 274: 1447; author reply 1448
Greenberg JH, Ii CGT, Zegura SL, Campbell L, Fox JA, Laughlin WS, Szathmary EkJE, Weiss KM, Woolford E (1986) The Settlement of the Americas: A Comparison of the Linguistic, Dental, and Genetic Evidence [and Comments and Reply]. Current Anthropology 27: 477-497
Gutierrez-Alarcon AB, Moguel-Torres M, Leon-Jimenez AK, Cuellar-Nevarez GE, Rangel-Villalobos H (2007) Allele and haplotype distribution for 16 Y-STRs (AmpFlSTR Y-filer kit) in the state of Chihuahua at North Center of Mexico. Leg Med (Tokyo) 9: 154-7
Hammer MF (1995) A recent common ancestry for human Y chromosomes. Nature 378: 376-8
Hammer MF, Karafet T, Rasanayagam A, Wood ET, Altheide TK, Jenkins T, Griffiths RC, Templeton AR, Zegura SL (1998) Out of Africa and back again: nested cladistic analysis of human Y chromosome variation. Mol Biol Evol 15: 427-41
Hammer MF, Karafet TM, Redd AJ, Jarjanazi H, Santachiara-Benerecetti S, Soodyall H, Zegura SL (2001) Hierarchical patterns of global human Y-chromosome diversity. Mol Biol Evol 18: 1189-203
Hammer MF, Spurdle AB, Karafet T, Bonner MR, Wood ET, Novelletto A, Malaspina P, Mitchell RJ, Horai S, Jenkins T, Zegura SL (1997) The geographic distribution of human Y chromosome variation. Genetics 145: 787-805
Hammer MF, Zegura SL (2002) THE HUMAN Y CHROMOSOME HAPLOGROUP TREE: Nomenclature and Phylogeography of Its Major Divisions. Annual Review of Anthropology 31: 303-321
Hamnett B (1999) A Concise History of MEXICO. Cambridge University Press, Cambridge, UK
Hernandez-Gutierrez S, Hernandez-Franco P, Martinez-Tripp S, Ramos-Kuri M, Rangel-Villalobos H (2005) STR data for 15 loci in a population sample from the central region of Mexico. Forensic Sci Int 151: 97-100
Herrnstadt C, Elson JL, Fahy E, Preston G, Turnbull DM, Anderson C, Ghosh SS, Olefsky JM, Beal MF, Davis RE, Howell N (2002) Reduced-median-network
BIBLIOGRAPHY
207
analysis of complete mitochondrial DNA coding-region sequences for the major African, Asian, and European haplogroups. Am J Hum Genet 70: 1152-71
Hoffecker JF, Powers WR, Goebel T (1993) The Colonization of Beringia and the Peopling of the New World. Science 259: 46-53
Horai S, Hayasaka K, Kondo R, Tsugane K, Takahata N (1995) Recent African origin of modern humans revealed by complete sequences of hominoid mitochondrial DNAs. Proc Natl Acad Sci U S A 92: 532-6
Horai S, Kondo R, Nakagawa-Hattori Y, Hayashi S, Sonoda S, Tajima K (1993) Peopling of the Americas, founded by four major lineages of mitochondrial DNA. Mol Biol Evol 10: 23-47
Howell N, Smejkal CB, Mackey DA, Chinnery PF, Turnbull DM, Herrnstadt C (2003) The pedigree rate of sequence divergence in the human mitochondrial genome: there is a difference between phylogenetic and pedigree rates. Am J Hum Genet 72: 659-70
Hunemeier T, Carvalho C, Marrero AR, Salzano FM, Junho Pena SD, Bortolini MC (2007) Niger-Congo speaking populations and the formation of the Brazilian gene pool: mtDNA and Y-chromosome data. Am J Phys Anthropol 133: 854-67
Ibarra-Rivera L, Mirabal S, Regueiro MM, Herrera RJ (2008) Delineating genetic relationships among the Maya. Am J Phys Anthropol 135: 329-47
INEGI Instituto Nacional de Estadística Geografía e Informática. II Conteo de población y vivienda, 2005. http://www.inegi.org.mx/inegi/default.aspx, México.
INEGI (2007) XII Censo General de Población y Vivienda 2000. Instituto Nacional de Estadística y Geografía, México
Ingman M, Kaessmann H, Paabo S, Gyllensten U (2000) Mitochondrial genome variation and the origin of modern humans. Nature 408: 708-13
Jakubiczka S, Arnemann J, Cooke HJ, Krawczak M, Schmidtke J (1989) A search for restriction fragment length polymorphism on the human Y chromosome. Hum Genet 84: 86-8
Jantz RL, Owsley DW (2001) Variation among early North American crania. Am J Phys Anthropol 114: 146-55
Jobling MA, Hurles ME, Tyler-Smith C (2004) Human Evolutionary Genetics: Origins, Peoples & Disease. Garland Science; Taylor & Francis Group, United Kingdom
Jobling MA, Tyler-Smith C (1995) Fathers and sons: the Y chromosome and human evolution. Trends Genet 11: 449-56
Jobling MA, Tyler-Smith C (2000) New uses for new haplotypes the human Y chromosome, disease and selection. Trends Genet 16: 356-62
Jobling MA, Tyler-Smith C (2003) The human Y chromosome: an evolutionary marker comes of age. Nat Rev Genet 4: 598-612
Johnson MJ, Wallace DC, Ferris SD, Rattazzi MC, Cavalli-Sforza LL (1983) Radiation of human mitochondria DNA types analyzed by restriction endonuclease cleavage patterns. J Mol Evol 19: 255-71
Jorde LB, Rogers AR, Bamshad M, Watkins WS, Krakowiak P, Sung S, Kere J, Harpending HC (1997) Microsatellite diversity and the demographic history of modern humans. Proc Natl Acad Sci U S A 94: 3100-3
Karafet T, Xu L, Du R, Wang W, Feng S, Wells RS, Redd AJ, Zegura SL, Hammer MF (2001) Paternal population history of East Asia: sources, patterns, and microevolutionary processes. Am J Hum Genet 69: 615-28
Karafet T, Zegura SL, Vuturo-Brady J, Posukh O, Osipova L, Wiebe V, Romero F, Long JC, Harihara S, Jin F, Dashnyam B, Gerelsaikhan T, Omoto K, Hammer
BIBLIOGRAPHY
208
MF (1997) Y chromosome markers and Trans-Bering Strait dispersals. Am J Phys Anthropol 102: 301-14
Karafet TM, Osipova LP, Gubina MA, Posukh OL, Zegura SL, Hammer MF (2002) High levels of Y-chromosome differentiation among native Siberian populations and the genetic signature of a boreal hunter-gatherer way of life. Hum Biol 74: 761-89
Karafet TM, Zegura SL, Posukh O, Osipova L, Bergen A, Long J, Goldman D, Klitz W, Harihara S, de Knijff P, Wiebe V, Griffiths RC, Templeton AR, Hammer MF (1999) Ancestral Asian source(s) of new world Y-chromosome founder haplotypes. Am J Hum Genet 64: 817-31
Kim JJ, Verdu P, Pakstis AJ, Speed WC, Kidd JR, Kidd KK (2005) Use of autosomal loci for clustering individuals and populations of East Asian origin. Hum Genet 117: 511-9
Kirchhoff P (1943) Mesoamérica: sus límites geográficos, composición étnica y caracteres culturales. (Acta Americana) Inter-American Society of Anthropology and Geography 1: 92-107
Kitchen A, Miyamoto MM, Mulligan CJ (2008) A three-stage colonization model for the peopling of the Americas. PLoS One 3: e1596
Kivisild T, Bamshad MJ, Kaldma K, Metspalu M, Metspalu E, Reidla M, Laos S, Parik J, Watkins WS, Dixon ME, Papiha SS, Mastana SS, Mir MR, Ferak V, Villems R (1999) Deep common ancestry of indian and western-Eurasian mitochondrial DNA lineages. Curr Biol 9: 1331-4
Kivisild T, Reidla M, Metspalu E, Rosa A, Brehm A, Pennarun E, Parik J, Geberhiwot T, Usanga E, Villems R (2004) Ethiopian mitochondrial DNA heritage: tracking gene flow across and around the gate of tears. Am J Hum Genet 75: 752-70
Kolman CJ, Bermingham E, Cooke R, Ward RH, Arias TD, Guionneau-Sinclair F (1995) Reduced mtDNA diversity in the Ngobe Amerinds of Panama. Genetics 140: 275-83
Kolman CJ, Sambuughin N, Bermingham E (1996) Mitochondrial DNA analysis of Mongolian populations and implications for the origin of New World founders. Genetics 142: 1321-34
Laughlin WS (1988) From Ammassalik to Attu: 10, 000 years of divergent evolution. Objets et Mondes 25: 141-148
Leite FP, Callegari-Jacques SM, Carvalho BA, Kommers T, Matte CH, Raimann PE, Schwengber SP, Sortica VA, Tsuneto LT, Petzl-Erler ML, Salzano FM, Hutz MH (2008) Y-STR analysis in Brazilian and South Amerindian populations. Am J Hum Biol 20: 359-63
Lell JT, Brown MD, Schurr TG, Sukernik RI, Starikovskaya YB, Torroni A, Moore LG, Troup GM, Wallace DC (1997) Y chromosome polymorphisms in native American and Siberian populations: identification of native American Y chromosome haplotypes. Hum Genet 100: 536-43
Lell JT, Sukernik RI, Starikovskaya YB, Su B, Jin L, Schurr TG, Underhill PA, Wallace DC (2002) The dual origin and Siberian affinities of Native American Y chromosomes. Am J Hum Genet 70: 192-206
Lewontin R (1982) Human Diversity. W.H. Freeman and Company, New York Licea-Cadena RA, Rizzo-Juarez RA, Muniz-Lozano E, Paez-Riberos LA, Rangel-
Villalobos H (2006) Population data of nine STRs of Mexican-mestizos from Veracruz (Central South-Eastern, Mexico). Leg Med (Tokyo) 8: 251-2
Lisker R, Ramirez E, Babinsky V (1996) Genetic structure of autochthonous populations of Meso-America: Mexico. Hum Biol 68: 395-404
BIBLIOGRAPHY
209
Lizcano Fernández F (2005) Composición Étnica de las Tres Áreas Culturales del Continente Americano al Comienzo del Siglo XXI. Convergencia 12: 185-232
López-Austin A, López- Luján L (2001) El pasado indígena. Fondo de Cultura Económica y El Colegio de México, México D.F.
López Guerra S, Flores Chávez M (2004) Colonialismo y modernidad: la enseñanza del español en la Nueva España Odiseo, revista electrónica de pedagogía, vol 2
Lorenz JG, Smith DG (1994) Distribution of the 9-bp mitochondrial DNA region V deletion among North American Indians. Hum Biol 66: 777-88
Lorenz JG, Smith DG (1996) Distribution of four founding mtDNA haplogroups among Native North Americans. Am J Phys Anthropol 101: 307-23
Lorenz JG, Smith DG (1997) Distribution of sequence variation in the mtDNA control region of Native North Americans. Hum Biol 69: 749-76
Luna-Vazquez A, Vilchis-Dorantes G, Aguilar-Ruiz MO, Bautista-Rivas A, Perez-Garcia A, Orea-Ochoa R, Villanueva-Hernandez D, Munoz-Valle JF, Rangel-Villalobos H (2008) Haplotype frequencies of the PowerPlex Y system in a Mexican-Mestizo population sample from Mexico City. Forensic Sci Int Genet 2: e11-3
Luna-Vazquez A, Vilchis-Dorantes G, Aguilar-Ruiz MO, Bautista-Rivas A, Rojo-Nava AL, Rios-Barrios E, Rangel-Villalobos H (2005) Population data for 15 loci (Identifiler Kit) in a sample from the Valley of Mexico. Leg Med (Tokyo) 7: 331-3
Luna-Vazquez A, Vilchis-Dorantes G, Paez-Riberos LA, Munoz-Valle F, Gonzalez-Martin A, Rangel-Villalobos H (2003) Population data of nine STRs of Mexican-Mestizos from Mexico City. Forensic Sci Int 136: 96-8
Macaulay V, Hill C, Achilli A, Rengo C, Clarke D, Meehan W, Blackburn J, Semino O, Scozzari R, Cruciani F, Taha A, Shaari NK, Raja JM, Ismail P, Zainuddin Z, Goodwin W, Bulbeck D, Bandelt HJ, Oppenheimer S, Torroni A, Richards M (2005) Single, rapid coastal settlement of Asia revealed by analysis of complete mitochondrial genomes. Science 308: 1034-6
Malaspina P, Persichetti F, Novelletto A, Iodice C, Terrenato L, Wolfe J, Ferraro M, Prantera G (1990) The human Y chromosome shows a low level of DNA polymorphism. Ann Hum Genet 54: 297-305
Malhi RS, Gonzalez-Oliver A, Schroeder KB, Kemp BM, Greenberg JA, Dobrowski SZ, Smith DG, Resendez A, Karafet T, Hammer M, Zegura S, Brovko T (2008) Distribution of Y chromosomes among native North Americans: a study of Athapaskan population history. Am J Phys Anthropol 137: 412-24
Malhi RS, Schultz BA, Smith DG (2001) Distribution of mitochondrial DNA lineages among Native American tribes of Northeastern North America. Hum Biol 73: 17-55
Manrique Castañeda L (1987) Atlas cultural de México: Lingüística, 1 edn. Secretaría de Educación Pública, Instituto Nacional de Antropología e Historia : Grupo Editorial Planeta, México, D.F.
Marrero AR, Bravi C, Stuart S, Long JC, Pereira das Neves Leite F, Kommers T, Carvalho CM, Pena SD, Ruiz-Linares A, Salzano FM, Catira Bortolini M (2007a) Pre- and post-Columbian gene and cultural continuity: the case of the Gaucho from southern Brazil. Hum Hered 64: 160-71
Marrero AR, Silva-Junior WA, Bravi CM, Hutz MH, Petzl-Erler ML, Ruiz-Linares A, Salzano FM, Bortolini MC (2007b) Demographic and evolutionary trajectories of the Guarani and Kaingang natives of Brazil. Am J Phys Anthropol 132: 301-10
BIBLIOGRAPHY
210
Martinez-Abadias N, Gonzalez-Jose R, Gonzalez-Martin A, Van der Molen S, Talavera A, Hernandez P, Hernandez M (2006) Phenotypic evolution of human craniofacial morphology after admixture: a geometric morphometrics approach. Am J Phys Anthropol 129: 387-98
Martinez-Gonzalez LJ, Martinez-Espin E, Fernandez-Rosado F, Moguel MA, Entrala C, Alvarez JC, Lorente JA, Budowle B (2005) Mexican population data on fifteen STR loci (Identifiler kit) in a Chihuahua (North Central Mexico) sample. J Forensic Sci 50: 236-8
McQuown N (1968) Handbook of Middle American Indians: Vol. 5 Linguistics. University of Texas Press, USA
Meltzer D (1993) Search for the First Americans. Smithsonian Books, Washington, DC Merriwether DA, Ferrell RE (1996) The four founding lineage hypothesis for the New
World: a critical reevaluation. Mol Phylogenet Evol 5: 241-6 Merriwether DA, Rothhammer F, Ferrell RE (1994) Genetic variation in the New
World: ancient teeth, bone, and tissue as sources of DNA. Experientia 50: 592-601
Merriwether DA, Rothhammer F, Ferrell RE (1995) Distribution of the four founding lineage haplotypes in Native Americans suggests a single wave of migration for the New World. Am J Phys Anthropol 98: 411-30
Mesa NR, Mondragon MC, Soto ID, Parra MV, Duque C, Ortiz-Barrientos D, Garcia LF, Velez ID, Bravo ML, Munera JG, Bedoya G, Bortolini MC, Ruiz-Linares A (2000) Autosomal, mtDNA, and Y-chromosome diversity in Amerinds: pre- and post-Columbian patterns of gene flow in South America. Am J Hum Genet 67: 1277-86
Miller N, Estoup A, Toepfer S, Bourguet D, Lapchin L, Derridj S, Kim KS, Reynaud P, Furlan L, Guillemaud T (2005) Multiple transatlantic introductions of the western corn rootworm. Science 310: 992
Mishmar D, Ruiz-Pesini E, Golik P, Macaulay V, Clark AG, Hosseini S, Brandon M, Easley K, Chen E, Brown MD, Sukernik RI, Olckers A, Wallace DC (2003) Natural selection shaped regional mtDNA variation in humans. Proc Natl Acad Sci U S A 100: 171-6
Mourant AE (1954) The distribution of the human blood groups. Blackwell Scientific Publications, Oxford
Mourant AE (1961) Evolution, Genetics and Anthropology. The Journal of the Royal Anthropological Institute of Great Britain and Ireland 91: 151-165
Mulligan CJ, Hunley K, Cole S, Long JC (2004) Population genetics, history, and health patterns in native americans. Annu Rev Genomics Hum Genet 5: 295-315
Mulligan CJ, Kitchen A, Miyamoto MM (2008) Updated three-stage model for the peopling of the Americas. PLoS One 3: e3199
Mullis KB, Faloona FA (1987) Specific synthesis of DNA in vitro via a polymerase-catalyzed chain reaction. Methods Enzymol 155: 335-50
Nei M (1978) The theory of genetic distance and evolution of human races. Jinrui Idengaku Zasshi 23: 341-69
Nettle D (1999) Linguistic diversity of the Americas can be reconciled with a recent colonization. Proc Natl Acad Sci U S A 96: 3325-9
Neves W (2000) Luzia is not alone. Science 287: 974-5 Neves WA, Hubbe M (2005) Cranial morphology of early Americans from Lagoa
Santa, Brazil: implications for the settlement of the New World. Proc Natl Acad Sci U S A 102: 18309-14
BIBLIOGRAPHY
211
Neves WA, Pucciarelli HM (1991) Morphological affinities of the first Americans: an exploratory analysis based on early South American human remains. Journal of Human Evolution 21: 261-273
Paez-Riberos LA, Munoz-Valle JF, Figuera LE, Nuno-Arana I, Sandoval-Ramirez L, Gonzalez-Martin A, Ibarra B, Rangel-Villalobos H (2006) Y-linked haplotypes in Amerindian chromosomes from Mexican populations: genetic evidence to the dual origin of the Huichol tribe. Leg Med (Tokyo) 8: 220-5
Pakendorf B, Stoneking M (2005) Mitochondrial DNA and human evolution. Annu Rev Genomics Hum Genet 6: 165-83
Palerm Á (1972) Agricultura y civilización en Mesoamérica. (SEP) Secretaría de Educación Pública, Mexico
Pauling L, Itano HA, et al. (1949) Sickle cell anemia a molecular disease. Science 110: 543-8
Pena SD, Santos FR, Bianchi NO, Bravi CM, Carnese FR, Rothhammer F, Gerelsaikhan T, Munkhtuja B, Oyunsuren T (1995) A major founder Y-chromosome haplotype in Amerindians. Nat Genet 11: 15-6
Peñaloza-Espinosa RI, Arenas-Aranda D, Cerda-Flores RM, Buentello-Malo L, Gonzalez-Valencia G, Torres J, Alvarez B, Mendoza I, Flores M, Sandoval L, Loeza F, Ramos I, Munoz L, Salamanca F (2007) Characterization of mtDNA haplogroups in 14 Mexican indigenous populations. Hum Biol 79: 313-20
Perego UA, Achilli A, Angerhofer N, Accetturo M, Pala M, Olivieri A, Kashani BH, Ritchie KH, Scozzari R, Kong QP, Myres NM, Salas A, Semino O, Bandelt HJ, Woodward SR, Torroni A (2009) Distinctive Paleo-Indian migration routes from Beringia marked by two rare mtDNA haplogroups. Curr Biol 19: 1-8
Perez SI, Bernal V, Gonzalez PN, Sardi M, Politis GG (2009) Discrepancy between cranial and DNA data of early Americans: implications for American peopling. PLoS One 4: e5746
Perez SI, Monteiro LR (2009) Nonrandom factors in modern human morphological diversification: a study of craniofacial variation in southern South american populations. Evolution 63: 978-93
Pitulko VV, Nikolsky PA, Girya EY, Basilyan AE, Tumskoy VE, Koulakov SA, Astakhov SN, Pavlova EY, Anisimov MA (2004) The Yana RHS site: humans in the Arctic before the last glacial maximum. Science 303: 52-6
Plaza S, Calafell F, Helal A, Bouzerna N, Lefranc G, Bertranpetit J, Comas D (2003) Joining the pillars of Hercules: mtDNA sequences show multidirectional gene flow in the western Mediterranean. Ann Hum Genet 67: 312-28
Plaza S, Salas A, Calafell F, Corte-Real F, Bertranpetit J, Carracedo A, Comas D (2004) Insights into the western Bantu dispersal: mtDNA lineage analysis in Angola. Hum Genet 115: 439-47
Powell JF, Neves WA (1999) Craniofacial morphology of the first Americans: Pattern and process in the peopling of the New World. Am J Phys Anthropol Suppl 29: 153-88
Pritchard JK, Seielstad MT, Perez-Lezaun A, Feldman MW (1999) Population growth of human Y chromosomes: a study of Y chromosome microsatellites. Mol Biol Evol 16: 1791-8
Prugnolle F, Manica A, Balloux F (2005) Geography predicts neutral genetic diversity of human populations. Curr Biol 15: R159-60
Quintana-Murci L, Chaix R, Wells RS, Behar DM, Sayar H, Scozzari R, Rengo C, Al-Zahery N, Semino O, Santachiara-Benerecetti AS, Coppa A, Ayub Q, Mohyuddin A, Tyler-Smith C, Qasim Mehdi S, Torroni A, McElreavey K
BIBLIOGRAPHY
212
(2004) Where west meets east: the complex mtDNA landscape of the southwest and Central Asian corridor. Am J Hum Genet 74: 827-45
Quintana-Murci L, Semino O, Bandelt HJ, Passarino G, McElreavey K, Santachiara-Benerecetti AS (1999) Genetic evidence of an early exit of Homo sapiens sapiens from Africa through eastern Africa. Nat Genet 23: 437-41
Rangel-Villalobos H, Jaloma-Cruz AR, Cerda-Aguilar L, Rios-Angulo CD, Mendoza-Carrera F, Patino-Garcia B, Sandoval-Ramirez L, Figuera-Villanueva LE (2001a) [The genetic DNA trace in men: chromosome Y haplotypes in a Mexican population, analyzing 5 STRs]. Rev Invest Clin 53: 401-6
Rangel-Villalobos H, Jaloma-Cruz AR, Sandoval-Ramirez L, Velarde-Felix JS, Gallegos-Arreola MP, Figuera LE (2001b) Y-chromosome haplotypes for six short tandem repeats (STRs) in a Mexican population. Arch Med Res 32: 232-7
Rangel-Villalobos H, Munoz-Valle JF, Gonzalez-Martin A, Gorostiza A, Magana MT, Paez-Riberos LA (2008) Genetic admixture, relatedness, and structure patterns among Mexican populations revealed by the Y-chromosome. Am J Phys Anthropol 135: 448-61
Rangel-Villalobos H, Rivas F, Sandoval L, Ibarra B, Garcia-Carvajal ZY, Cantu JM, Figuera LE (2000) Genetic variation among four Mexican populations (Huichol, Purepecha, Tarahumara, and Mestizo) revealed by two VNTRs and four STRs. Hum Biol 72: 983-95
Ray N, Wegmann D, Fagundes NJ, Wang S, Ruiz-Linares A, Excoffier L (2010) A statistical evaluation of models for the initial settlement of the american continent emphasizes the importance of gene flow with Asia. Mol Biol Evol 27: 337-45
Reidla M, Kivisild T, Metspalu E, Kaldma K, Tambets K, Tolk HV, Parik J, Loogvoli EL, Derenko M, Malyarchuk B, Bermisheva M, Zhadanov S, Pennarun E, Gubina M, Golubenko M, Damba L, Fedorova S, Gusar V, Grechanina E, Mikerezi I, Moisan JP, Chaventre A, Khusnutdinova E, Osipova L, Stepanov V, Voevoda M, Achilli A, Rengo C, Rickards O, De Stefano GF, Papiha S, Beckman L, Janicijevic B, Rudan P, Anagnou N, Michalodimitrakis E, Koziel S, Usanga E, Geberhiwot T, Herrnstadt C, Howell N, Torroni A, Villems R (2003) Origin and diffusion of mtDNA haplogroup X. Am J Hum Genet 73: 1178-90
Ribetio-dos-Santos AK, Santos SE, Machado AL, Guapindaia V, Zago MA (1996) Heterogeneity of mitochondrial DNA haplotypes in Pre-Columbian Natives of the Amazon region. Am J Phys Anthropol 101: 29-37
Rickards O, Martinez-Labarga C, Lum JK, De Stefano GF, Cann RL (1999) mtDNA history of the Cayapa Amerinds of Ecuador: detection of additional founding lineages for the Native American populations. Am J Hum Genet 65: 519-30
Richards M, Macaulay V (2001) The mitochondrial gene tree comes of age. Am J Hum Genet 68: 1315-20
Rodriguez-Delfin L, Santos SE, Zago MA (1997) Diversity of the human Y chromosome of South American Amerindians: a comparison with blacks, whites, and Japanese from Brazil. Ann Hum Genet 61: 439-48
Roosevelt A, Lima da Costa M, Lopes Machado C, Michab M, Mercier N, Valladas H, Feathers J, Barnett W, Imazio da Silveira M, Henderson A, Sliva J, Chernoff B, Reese D, Holman J, Toth N, K S (1996) Paleoindian Cave Dwellers in the Amazon: The Peopling of the Americas. Science 19: 373-384
Rosenberg NA, Mahajan S, Gonzalez-Quevedo C, Blum MG, Nino-Rosales L, Ninis V, Das P, Hegde M, Molinari L, Zapata G, Weber JL, Belmont JW, Patel PI (2006)
BIBLIOGRAPHY
213
Low levels of genetic divergence across geographically and linguistically diverse populations from India. PLoS Genet 2: e215
Rosenberg NA, Pritchard JK, Weber JL, Cann HM, Kidd KK, Zhivotovsky LA, Feldman MW (2002) Genetic structure of human populations. Science 298: 2381-5
Rothhammer F, Moraga M (2001) Patterns of Y-chromosome variation in South Amerindians. Am J Hum Genet 69: 904-6
Rothhammer F, Silva C, Callegari-Jacques SM, Llop E, Salzano FM (1997) Gradients of HLA diversity in South American Indians. Ann Hum Biol 24: 197-208
Rubi-Castellanos R, Anaya-Palafox M, Mena-Rojas E, Bautista-Espana D, Munoz-Valle JF, Rangel-Villalobos H (2009a) Genetic data of 15 autosomal STRs (Identifiler kit) of three Mexican Mestizo population samples from the States of Jalisco (West), Puebla (Center), and Yucatan (Southeast). Forensic Sci Int Genet 3: e71-6
Rubi-Castellanos R, Martinez-Cortes G, Munoz-Valle JF, Gonzalez-Martin A, Cerda-Flores RM, Anaya-Palafox M, Rangel-Villalobos H (2009b) Pre-Hispanic Mesoamerican demography approximates the present-day ancestry of Mestizos throughout the territory of Mexico. Am J Phys Anthropol 139: 284-94
Rubicz R, Schurr TG, Babb PL, Crawford MH (2003) Mitochondrial DNA variation and the origins of the Aleuts. Hum Biol 75: 809-35
Ruiz-Linares A, Ortiz-Barrientos D, Figueroa M, Mesa N, Munera JG, Bedoya G, Velez ID, Garcia LF, Perez-Lezaun A, Bertranpetit J, Feldman MW, Goldstein DB (1999) Microsatellites provide evidence for Y chromosome diversity among the founders of the New World. Proc Natl Acad Sci U S A 96: 6312-7
Ruiz-Narvaez EA, Santos FR, Carvalho-Silva DR, Azofeifa J, Barrantes R, Pena SD (2005) Genetic variation of the Y chromosome in Chibcha-speaking Amerindians of Costa Rica and Panama. Hum Biol 77: 71-91
Ruiz-Pesini E, Mishmar D, Brandon M, Procaccio V, Wallace DC (2004) Effects of purifying and adaptive selection on regional variation in human mtDNA. Science 303: 223-6
Saillard J, Forster P, Lynnerup N, Bandelt HJ, Norby S (2000) mtDNA variation among Greenland Eskimos: the edge of the Beringian expansion. Am J Hum Genet 67: 718-26
Salas A, Richards M, De la Fe T, Lareu MV, Sobrino B, Sanchez-Diz P, Macaulay V, Carracedo A (2002) The making of the African mtDNA landscape. Am J Hum Genet 71: 1082-111
Salazar-Flores J, Dondiego-Aldape R, Rubi-Castellanos R, Anaya-Palafox M, Nuno-Arana I, Canseco-Avila LM, Flores-Flores G, Morales-Vallejo ME, Barojas-Perez N, Munoz-Valle JF, Campos-Gutierrez R, Rangel-Villalobos H (2009) Population structure and paternal admixture landscape on present-day Mexican-Mestizos revealed by Y-STR haplotypes. Am J Hum Biol
Salzano FM (2002) Molecular variability in Amerindians: widespread but uneven information. An Acad Bras Cienc 74: 223-63
Sanchéz-Serrano C (1996) Mestizaje e historia de la población en México. In: Martín Municio A, García Barreno P (eds) Polimorfismo Génico HLA en Poblaciones Hispanoamericanas. Real Académia de Ciencias Exactas Físicas y Naturales., Madrid, pp 173-193
Sandoval K, Buentello-Malo L, Penaloza-Espinosa R, Avelino H, Salas A, Calafell F, Comas D (2009) Linguistic and maternal genetic diversity are not correlated in Native Mexicans. Hum Genet
BIBLIOGRAPHY
214
Sanger F, Nicklen S, Coulson AR (1977) DNA sequencing with chain-terminating inhibitors. Proc Natl Acad Sci U S A 74: 5463-7
Santachiara Benerecetti AS, Scozzari R, Semino O, Torroni A, Brega A, Wallace DC (1988) Mitochondrial DNA polymorphisms in Italy. II. Molecular analysis of new and rare morphs from Sardinia and Rome. Ann Hum Genet 52: 39-56
Santos FR, Bianchi NO, Pena SD (1996a) Worldwide distribution of human Y-chromosome haplotypes. Genome Res 6: 601-11
Santos FR, M. Hutz, C. E. A. Coimbra, R. V. Santos, F. M. Salzano, and S. D. J. Pena. (1995) Further evidence for the existence of a major founder Y chromosome haplotype in Amerindians. Brazilian Journal of Genetics 18: 669-672
Santos FR, Pandya A, Tyler-Smith C, Pena SD, Schanfield M, Leonard WR, Osipova L, Crawford MH, Mitchell RJ (1999) The central Siberian origin for native American Y chromosomes. Am J Hum Genet 64: 619-28
Santos FR, Rodriguez-Delfin L, Pena SD, Moore J, Weiss KM (1996b) North and South Amerindians may have the same major founder Y chromosome haplotype. Am J Hum Genet 58: 1369-70
Scozzari R, Cruciani F, Santolamazza P, Sellitto D, Cole DE, Rubin LA, Labuda D, Marini E, Succa V, Vona G, Torroni A (1997) mtDNA and Y chromosome-specific polymorphisms in modern Ojibwa: implications about the origin of their gene pool. Am J Hum Genet 60: 241-4
Scozzari R, Torroni A, Semino O, Sirugo G, Brega A, Santachiara-Benerecetti AS (1988) Genetic studies on the Senegal population. I. Mitochondrial DNA polymorphisms. Am J Hum Genet 43: 534-44
Schanfield MS (1992) Immunoglobulin allotypes (GM and KM) indicate multiple founding populations of Native Americans: evidence of at least four migrations to the New World. Hum Biol 64: 381-402
Schurr T (2000) Mitochondrial DNA and the Peopling of the New World. American Scientist 88: 264-253
Schurr TG (2004) THE PEOPLING OF THE NEW WORLD: Perspectives from Molecular Anthropology. Annual Review of Anthropology 33: 551-583
Schurr TG, Ballinger SW, Gan YY, Hodge JA, Merriwether DA, Lawrence DN, Knowler WC, Weiss KM, Wallace DC (1990) Amerindian mitochondrial DNAs have rare Asian mutations at high frequencies, suggesting they derived from four primary maternal lineages. Am J Hum Genet 46: 613-23
Schurr TG, Sherry ST (2004) Mitochondrial DNA and Y chromosome diversity and the peopling of the Americas: evolutionary and demographic evidence. Am J Hum Biol 16: 420-39
Schurr TG, Sukernik RI, Starikovskaya YB, Wallace DC (1999) Mitochondrial DNA variation in Koryaks and Itel'men: population replacement in the Okhotsk Sea-Bering Sea region during the Neolithic. Am J Phys Anthropol 108: 1-39
Schurr TG, Wallace DC (2002) Mitochondrial DNA diversity in Southeast Asian populations. Hum Biol 74: 431-52
Schwartz M, Vissing J (2002) Paternal inheritance of mitochondrial DNA. N Engl J Med 347: 576-80
Seielstad M, Bekele E, Ibrahim M, Toure A, Traore M (1999) A view of modern human origins from Y chromosome microsatellite variation. Genome Res 9: 558-67
Seielstad M, Yuldasheva N, Singh N, Underhill P, Oefner P, Shen P, Wells RS (2003) A novel Y-chromosome variant puts an upper limit on the timing of first entry into the Americas. Am J Hum Genet 73: 700-5
BIBLIOGRAPHY
215
Seielstad MT, Hebert JM, Lin AA, Underhill PA, Ibrahim M, Vollrath D, Cavalli-Sforza LL (1994) Construction of human Y-chromosomal haplotypes using a new polymorphic A to G transition. Hum Mol Genet 3: 2159-61
Seielstad MT, Minch E, Cavalli-Sforza LL (1998) Genetic evidence for a higher female migration rate in humans. Nat Genet 20: 278-80
Seldin MF, Shigeta R, Villoslada P, Selmi C, Tuomilehto J, Silva G, Belmont JW, Klareskog L, Gregersen PK (2006) European population substructure: clustering of northern and southern populations. PLoS Genet 2: e143
Semino O, Passarino G, Oefner PJ, Lin AA, Arbuzova S, Beckman LE, De Benedictis G, Francalacci P, Kouvatsi A, Limborska S, Marcikiae M, Mika A, Mika B, Primorac D, Santachiara-Benerecetti AS, Cavalli-Sforza LL, Underhill PA (2000) The genetic legacy of Paleolithic Homo sapiens sapiens in extant Europeans: a Y chromosome perspective. Science 290: 1155-9
Shen P, Wang F, Underhill PA, Franco C, Yang WH, Roxas A, Sung R, Lin AA, Hyman RW, Vollrath D, Davis RW, Cavalli-Sforza LL, Oefner PJ (2000) Population genetic implications from sequence variation in four Y chromosome genes. Proc Natl Acad Sci U S A 97: 7354-9
Shields GF, Schmiechen AM, Frazier BL, Redd A, Voevoda MI, Reed JK, Ward RH (1993) mtDNA sequences suggest a recent evolutionary divergence for Beringian and northern North American populations. Am J Hum Genet 53: 549-62
Shriver MD, Mei R, Parra EJ, Sonpar V, Halder I, Tishkoff SA, Schurr TG, Zhadanov SI, Osipova LP, Brutsaert TD, Friedlaender J, Jorde LB, Watkins WS, Bamshad MJ, Gutierrez G, Loi H, Matsuzaki H, Kittles RA, Argyropoulos G, Fernandez JR, Akey JM, Jones KW (2005) Large-scale SNP analysis reveals clustered and continuous patterns of human genetic variation. Hum Genomics 2: 81-9
Silva-Zolezzi I, Hidalgo-Miranda A, Estrada-Gil J, Fernandez-Lopez JC, Uribe-Figueroa L, Contreras A, Balam-Ortiz E, del Bosque-Plata L, Velazquez-Fernandez D, Lara C, Goya R, Hernandez-Lemus E, Davila C, Barrientos E, March S, Jimenez-Sanchez G (2009) Analysis of genomic diversity in Mexican Mestizo populations to develop genomic medicine in Mexico. Proc Natl Acad Sci U S A 106: 8611-6
Skaletsky H, Kuroda-Kawaguchi T, Minx PJ, Cordum HS, Hillier L, Brown LG, Repping S, Pyntikova T, Ali J, Bieri T, Chinwalla A, Delehaunty A, Delehaunty K, Du H, Fewell G, Fulton L, Fulton R, Graves T, Hou SF, Latrielle P, Leonard S, Mardis E, Maupin R, McPherson J, Miner T, Nash W, Nguyen C, Ozersky P, Pepin K, Rock S, Rohlfing T, Scott K, Schultz B, Strong C, Tin-Wollam A, Yang SP, Waterston RH, Wilson RK, Rozen S, Page DC (2003) The male-specific region of the human Y chromosome is a mosaic of discrete sequence classes. Nature 423: 825-37
Soares P, Ermini L, Thomson N, Mormina M, Rito T, Röhl A, Salas A, Oppenheimer S, Macaulay V, Richards M (2009) Correcting for purifying selection: an improved human mitochondrial molecular clock. Am J Hum Genet (in press)
Spencer RF, Jennings JD, Johnson E, King AR, Stern T, Stewart KM, Wallace WJ (1977a) The Native Americans, New York
Spencer RF, Jennings JD, Johnson E, King AR, Stern T, Stewart KM, Wallace WJ (1977b) The Native Americans: Ethnology and Backgrounds of the North American Indians, Second edn. Harper and Row, New York
Starikovskaya YB, Sukernik RI, Schurr TG, Kogelnik AM, Wallace DC (1998) mtDNA diversity in Chukchi and Siberian Eskimos: implications for the genetic history
BIBLIOGRAPHY
216
of Ancient Beringia and the peopling of the New World. Am J Hum Genet 63: 1473-91
Stone AC, Stoneking M (1998) mtDNA analysis of a prehistoric Oneota population: implications for the peopling of the New World. Am J Hum Genet 62: 1153-70
Su B, Xiao J, Underhill P, Deka R, Zhang W, Akey J, Huang W, Shen D, Lu D, Luo J, Chu J, Tan J, Shen P, Davis R, Cavalli-Sforza L, Chakraborty R, Xiong M, Du R, Oefner P, Chen Z, Jin L (1999) Y-Chromosome evidence for a northward migration of modern humans into Eastern Asia during the last Ice Age. Am J Hum Genet 65: 1718-24
Suárez JA (1983) The Mesoamerican Indian Languages (Cambridge Language Surveys). Cambridge University Press, New York
Szathmary EJ (1993) mtDNA and the peopling of the Americas. Am J Hum Genet 53: 793-9
Szathmary EJ, Ferrell RE, Gershowitz H (1983) Genetic differentiation in Dogrib Indians: serum protein and erythrocyte enzyme variation. Am J Phys Anthropol 62: 249-54
Tamm E, Kivisild T, Reidla M, Metspalu M, Smith DG, Mulligan CJ, Bravi CM, Rickards O, Martinez-Labarga C, Khusnutdinova EK, Fedorova SA, Golubenko MV, Stepanov VA, Gubina MA, Zhadanov SI, Ossipova LP, Damba L, Voevoda MI, Dipierri JE, Villems R, Malhi RS (2007) Beringian standstill and spread of Native American founders. PLoS ONE 2: e829
Tarazona-Santos E, Carvalho-Silva DR, Pettener D, Luiselli D, De Stefano GF, Labarga CM, Rickards O, Tyler-Smith C, Pena SD, Santos FR (2001) Genetic differentiation in South Amerindians is related to environmental and cultural diversity: evidence from the Y chromosome. Am J Hum Genet 68: 1485-96
Tarazona-Santos E, Santos FR (2002) The peopling of the Americas: a second major migration? Am J Hum Genet 70: 1377-80; author reply 1380-1
Templeton AR (1992) Human origins and analysis of mitochondrial DNA sequences. Science 255: 737
Thomson R, Pritchard JK, Shen P, Oefner PJ, Feldman MW (2000) Recent common ancestry of human Y chromosomes: evidence from DNA sequence data. Proc Natl Acad Sci U S A 97: 7360-5
Torres-Rodriguez M, Martinez-Cortes G, Paez-Riberos LA, Sandoval L, Munoz-Valle JF, Ceballos-Quintal JM, Pinto-Escalante D, Rangel-Villalobos H (2006) Forensic potential of the STR DXYS156 in Mexican populations: inference of X-linked allele null. Leg Med (Tokyo) 8: 52-4
Torroni A, Chen YS, Semino O, Santachiara-Beneceretti AS, Scott CR, Lott MT, Winter M, Wallace DC (1994a) mtDNA and Y-chromosome polymorphisms in four Native American populations from southern Mexico. Am J Hum Genet 54: 303-18
Torroni A, Miller JA, Moore LG, Zamudio S, Zhuang J, Droma T, Wallace DC (1994b) Mitochondrial DNA analysis in Tibet: implications for the origin of the Tibetan population and its adaptation to high altitude. Am J Phys Anthropol 93: 189-99
Torroni A, Neel JV, Barrantes R, Schurr TG, Wallace DC (1994c) Mitochondrial DNA "clock" for the Amerinds and its implications for timing their entry into North America. Proc Natl Acad Sci U S A 91: 1158-62
Torroni A, Schurr TG, Cabell MF, Brown MD, Neel JV, Larsen M, Smith DG, Vullo CM, Wallace DC (1993a) Asian affinities and continental radiation of the four founding Native American mtDNAs. Am J Hum Genet 53: 563-90
BIBLIOGRAPHY
217
Torroni A, Schurr TG, Yang CC, Szathmary EJ, Williams RC, Schanfield MS, Troup GA, Knowler WC, Lawrence DN, Weiss KM, et al. (1992) Native American mitochondrial DNA analysis indicates that the Amerind and the Nadene populations were founded by two independent migrations. Genetics 130: 153-62
Torroni A, Sukernik RI, Schurr TG, Starikorskaya YB, Cabell MF, Crawford MH, Comuzzie AG, Wallace DC (1993b) mtDNA variation of aboriginal Siberians reveals distinct genetic affinities with Native Americans. Am J Hum Genet 53: 591-608
Underhill PA, Jin L, Lin AA, Mehdi SQ, Jenkins T, Vollrath D, Davis RW, Cavalli-Sforza LL, Oefner PJ (1997) Detection of numerous Y chromosome biallelic polymorphisms by denaturing high-performance liquid chromatography. Genome Res 7: 996-1005
Underhill PA, Jin L, Zemans R, Oefner PJ, Cavalli-Sforza LL (1996) A pre-Columbian Y chromosome-specific transition and its implications for human evolutionary history. Proc Natl Acad Sci U S A 93: 196-200
Underhill PA, Passarino G, Lin AA, Shen P, Mirazon Lahr M, Foley RA, Oefner PJ, Cavalli-Sforza LL (2001) The phylogeography of Y chromosome binary haplotypes and the origins of modern human populations. Ann Hum Genet 65: 43-62
Underhill PA, Shen P, Lin AA, Jin L, Passarino G, Yang WH, Kauffman E, Bonne-Tamir B, Bertranpetit J, Francalacci P, Ibrahim M, Jenkins T, Kidd JR, Mehdi SQ, Seielstad MT, Wells RS, Piazza A, Davis RW, Feldman MW, Cavalli-Sforza LL, Oefner PJ (2000) Y chromosome sequence variation and the history of human populations. Nat Genet 26: 358-61
van Vark GN, Kuizenga D, Williams FL (2003) Kennewick and Luzia: lessons from the European Upper Paleolithic. Am J Phys Anthropol 121: 181-4; discussion 185-8
Vieira AR, Karras JC, Orioli IM, Castilla EE, Murray JC (2002) Genetic origins in a South American clefting population. Clin Genet 62: 458-63
Vigilant L, Stoneking M, Harpending H, Hawkes K, Wilson AC (1991) African populations and the evolution of human mitochondrial DNA. Science 253: 1503-7
Volodko NV, Starikovskaya EB, Mazunin IO, Eltsov NP, Naidenko PV, Wallace DC, Sukernik RI (2008) Mitochondrial genome diversity in arctic Siberians, with particular reference to the evolutionary history of Beringia and Pleistocenic peopling of the Americas. Am J Hum Genet 82: 1084-100
Wallace DC, Garrison K, Knowler WC (1985) Dramatic founder effects in Amerindian mitochondrial DNAs. Am J Phys Anthropol 68: 149-55
Wallace DC, Stugard C, Murdock D, Schurr T, Brown MD (1997) Ancient mtDNA sequences in the human nuclear genome: a potential source of errors in identifying pathogenic mutations. Proc Natl Acad Sci U S A 94: 14900-5
Wang S, Lewis CM, Jakobsson M, Ramachandran S, Ray N, Bedoya G, Rojas W, Parra MV, Molina JA, Gallo C, Mazzotti G, Poletti G, Hill K, Hurtado AM, Labuda D, Klitz W, Barrantes R, Bortolini MC, Salzano FM, Petzl-Erler ML, Tsuneto LT, Llop E, Rothhammer F, Excoffier L, Feldman MW, Rosenberg NA, Ruiz-Linares A (2007) Genetic variation and population structure in native Americans. PLoS Genet 3: e185
Ward RH, Frazier BL, Dew-Jager K, Paabo S (1991) Extensive mitochondrial diversity within a single Amerindian tribe. Proc Natl Acad Sci U S A 88: 8720-4
Ward RH, Redd A, Valencia D, Frazier B, Paabo S (1993) Genetic and linguistic differentiation in the Americas. Proc Natl Acad Sci U S A 90: 10663-7
BIBLIOGRAPHY
218
Waters MR, Stafford TW, Jr. (2007) Redefining the age of Clovis: implications for the peopling of the Americas. Science 315: 1122-6
Watson E, Forster P, Richards M, Bandelt HJ (1997) Mitochondrial footprints of human expansions in Africa. Am J Hum Genet 61: 691-704
Weaver Muriel P (1993) The Aztecs, Maya, and Their Predecessors: Archaeology of Mesoamerica, 3 edn. Academic Press, San Diego
Whitfield LS, Sulston JE, Goodfellow PN (1995) Sequence variation of the human Y chromosome. Nature 378: 379-80
Williams RC, Steinberg AG, Gershowitz H, Bennett PH, Knowler WC, Pettitt DJ, Butler W, Baird R, Dowda-Rea L, Burch TA, et al. (1985) GM allotypes in Native Americans: evidence for three distinct migrations across the Bering land bridge. Am J Phys Anthropol 66: 1-19
Witherspoon DJ, Marchani EE, Watkins WS, Ostler CT, Wooding SP, Anders BA, Fowlkes JD, Boissinot S, Furano AV, Ray DA, Rogers AR, Batzer MA, Jorde LB (2006) Human population genetic structure and diversity inferred from polymorphic L1(LINE-1) and Alu insertions. Hum Hered 62: 30-46
Zegura SL, Karafet TM, Zhivotovsky LA, Hammer MF (2004) High-resolution SNPs and microsatellite haplotypes point to a single, recent entry of Native American Y chromosomes into the Americas. Mol Biol Evol 21: 164-75
Zerjal T, Dashnyam B, Pandya A, Kayser M, Roewer L, Santos FR, Schiefenhovel W, Fretwell N, Jobling MA, Harihara S, Shimizu K, Semjidmaa D, Sajantila A, Salo P, Crawford MH, Ginter EK, Evgrafov OV, Tyler-Smith C (1997) Genetic relationships of Asians and Northern Europeans, revealed by Y-chromosomal DNA analysis. Am J Hum Genet 60: 1174-83
Zlojutro M, Rubicz R, Crawford MH (2009) Mitochondrial DNA and Y-chromosome variation in five eastern Aleut communities: evidence for genetic substructure in the Aleut population. Ann Hum Biol 36: 511-26
219
APPENDIX

APPENDIX
221
Appendix 1: Genetic origin, admixture, and asymmetry inmaternalandpaternalhumanl ineagesinCuba
Isabel Mendizabal, Karla Sandoval, Gemma Berniell-Lee, Francesc Calafell1, Antonio
Salas, Antonio Martínez-Fuentes, and David Comas
BMC Evolutionary Biology 2008, 8:213


233